UNITED STATES
SECURITIES AND EXCHANGE COMMISSION
Washington, D.C. 20549
FORM 10-K
(Mark One)
| | |
☒ | | ANNUAL REPORT PURSUANT TO SECTION 13 OR 15(d) OF THE SECURITIES EXCHANGE ACT OF 1934 |
For the fiscal year ended December 31, 2024
OR
| | |
☐ | | TRANSITION REPORT PURSUANT TO SECTION 13 OR 15(d) OF THE SECURITIES EXCHANGE ACT OF 1934 FOR THE TRANSITION PERIOD FROM TO |
Commission File Number 001-37851
AIRGAIN, INC.
(Exact name of Registrant as specified in its Charter)
| |
Delaware | 95-4523882 |
(State or other jurisdiction of incorporation or organization) | (I.R.S. Employer Identification No.) |
|
|
3611 Valley Centre Drive, Suite 150 San Diego, CA | 92130 |
(Address of principal executive offices) | (Zip Code) |
(760) 579-0200 (Registrant’s telephone number, including area code)
Securities registered pursuant to Section 12(b) of the Act:
| | |
Title of each class
| Trading Symbol(s)
| Name of each exchange on which registered
|
Common Stock, par value $0.0001 per share | AIRG | The Nasdaq Capital Market |
Securities registered pursuant to Section 12(g) of the Act: None
Indicate by check mark if the Registrant is a well-known seasoned issuer, as defined in Rule 405 of the Securities Act. Yes ☐ No ☒
Indicate by check mark if the Registrant is not required to file reports pursuant to Section 13 or 15(d) of the Act. Yes ☐ No ☒
Indicate by check mark whether the Registrant: (1) has filed all reports required to be filed by Section 13 or 15(d) of the Securities Exchange Act of 1934 during the preceding 12 months (or for such shorter period that the Registrant was required to file such reports), and (2) has been subject to such filing requirements for the past 90 days. Yes ☒ No ☐
Indicate by check mark whether the Registrant has submitted electronically every Interactive Data File required to be submitted pursuant to Rule 405 of Regulation S-T (§232.405 of this chapter) during the preceding 12 months (or for such shorter period that the Registrant was required to submit such files). Yes ☒ No ☐
Indicate by check mark whether the Registrant is a large accelerated filer, an accelerated filer, a non-accelerated filer, smaller reporting company, or an emerging growth company. See the definitions of “large accelerated filer,” “accelerated filer,” “smaller reporting company,” and “emerging growth company” in Rule 12b-2 of the Exchange Act.
| | | |
Large accelerated filer | ☐ | Accelerated filer | ☐ |
Non-accelerated filer | ☒ | Smaller reporting company | ☒ |
Emerging growth company | ☐ |
|
|
If an emerging growth company, indicate by check mark if the Registrant has elected not to use the extended transition period for complying with any new or revised financial accounting standards provided pursuant to Section 13(a) of the Exchange Act. ☐
Indicate by check mark whether the Registrant has filed a report on and attestation to its management’s assessment of the effectiveness of its internal control over financial reporting under Section 404(b) of the Sarbanes-Oxley Act (15 U.S.C. 7262(b)) by the registered public accounting firm that prepared or issued its audit report. ☐
If securities are registered pursuant to Section 12(b) of the Act, indicate by check mark whether the financial statements of the registrant included in the filing reflect the correction of an error to previously issued financial statements. ☐
Indicate by check mark whether any of those error corrections are restatements that required a recovery analysis of incentive-based compensation received by any of the registrant’s executive officers during the relevant recovery period pursuant to §240.10D-1(b). ☐
Indicate by check mark whether the Registrant is a shell company (as defined in Rule 12b-2 of the Exchange Act). Yes ☐ No ☒
As of June 30, 2024 (the last business day of the Registrant’s most recently completed second fiscal quarter), the aggregate market value of the Registrant’s common stock held by non-affiliates of the Registrant was approximately $67.4 million, based on the closing price of the Registrant’s common stock on The Nasdaq Capital Market of $6.04 per share.
The number of shares of Registrant’s common stock ($0.0001 par value) outstanding as of February 20, 2025, was 11,558,901.
DOCUMENTS INCORPORATED BY REFERENCE
Certain sections of the Registrant’s definitive proxy statement for the 2023 annual meeting of stockholders to be filed with the Securities and Exchange Commission pursuant to Regulation 14A not later than 120 days after end of the fiscal year covered by this Form 10-K are incorporated by reference into Part III of this Form 10-K.
AIRGAIN, INC.
TABLE OF CONTENTS
FORM 10-K
For the Year Ended December 31, 2024
PART I
FORWARD-LOOKING STATEMENTS AND MARKET DATA
This annual report on Form 10-K contains forward-looking statements within the meaning of Section 21E of the Securities Exchange Act of 1934, as amended (Exchange Act). All statements other than statements of historical fact contained in this annual report, including statements regarding our future operating results, financial position and cash flows, our business strategy and plans, and our objectives for future operations, are forward-looking statements. These statements involve known and unknown risks, uncertainties and other important factors that may cause our actual results, performance or achievements to be materially different from any future results, performance or achievements expressed or implied by the forward-looking statements. This annual report on Form 10-K also contains estimates and other statistical data made by independent parties and by us relating to market size and growth and other data about our industry. This data involves a number of assumptions and limitations, and you are cautioned not to give undue weight to such estimates. In addition, projections, assumptions and estimates of our future performance and the future performance of the markets in which we operate are necessarily subject to a high degree of uncertainty and risk. In some cases, you can identify forward-looking statements by terms such as “may,” “will,” “would,” “could,” “should,” “expect,” “plan,” “anticipate,” “intend,” “target,” “project,” “contemplate,” “believe,” “estimate,” “predict,” “potential” or “continue” or the negative of these terms or other similar expressions. The forward-looking statements in this annual report are only predictions. We have based these forward-looking statements largely on our current expectations and projections about future events and financial trends that we believe may affect our financial condition, operating results, business strategy, short-term and long-term business operations and objectives. These forward-looking statements speak only as of the date of this annual report and are subject to a number of risks, uncertainties and assumptions, including those described in Part I, Item 1A, “Risk Factors.” The events and circumstances reflected in our forward-looking statements may not be achieved or occur and actual results could differ materially from those projected in the forward-looking statements. Moreover, we operate in a very competitive and rapidly changing environment. New risk factors and uncertainties may emerge from time to time, and it is not possible for management to predict all risk factors and uncertainties. Except as required by applicable law, we do not plan to publicly update or revise any forward-looking statements contained herein, whether as a result of any new information, future events, changed circumstances or otherwise. All forward-looking statements are qualified in their entirety by this cautionary statement, which is made under the safe harbor provisions of the Private Securities Litigation Reform Act of 1995.
Airgain, the Airgain logo, and other trademarks or service marks of Airgain appearing in this annual report are the property of Airgain, Inc. This annual report also includes trademarks, tradenames and service marks that are the property of other organizations. Solely for convenience, trademarks and tradenames referred to in this annual report appear without the ® and ™ symbols, but those references are not intended to indicate, in any way, that we will not assert, to the fullest extent under applicable law, our rights, or that the applicable owner will not assert its rights, to these trademarks and tradenames.
References to “Airgain, Inc.,” “Airgain,” the “Company,” “we,” “our” and “us” include Airgain, Inc. and our wholly-owned subsidiary.
ITEM 1. BUSINESS
Overview
Headquartered in San Diego, California, Airgain, Inc. (NASDAQ: AIRG) is a leading provider of advanced wireless connectivity solutions that drive cutting-edge innovation in 5G technology. We are committed to delivering high-performance, cost-effective, and energy-efficient wireless solutions that enable rapid market deployment. Our mission is to connect the world through integrated, innovative, and optimized wireless solutions. Our diverse product portfolio serves three primary markets: enterprise, automotive, and consumer.
Our enterprise products include Smart Network Controlled Cellular Repeaters (Smart NCRs), fixed wireless access (FWA) devices, asset tracking solutions, embedded cellular modems, and antennas for access points and Internet of Things (IoT) applications. Our automotive products include our second generation AirgainConnect® Fleet system solution – a low profile, roof-mounted, all-in-one 5G vehicle gateway and aftermarket antennas. Our consumer products are comprised of embedded antennas for consumer access points, wireless gateways, smart home devices and FWA devices.
We have a rich history of providing radio frequency (RF) expertise, services, and solutions to mobile operators and major original equipment manufacturers (OEMs). We expanded our current portfolio of embedded cellular modems, asset tracking solutions and custom IoT systems with advanced 5G connectivity solutions, including our AirgainConnect Fleet vehicle gateway, Smart Network Controlled Cellular Repeaters, and FWA devices. We are leveraging our RF and systems experience, and our Mobile Network Operator (MNO) and Multiple Service Operator (MSO) relationships to deliver complex and differentiated system solutions
We use an outsource manufacturing model for our products while maintaining oversight for quality, test, and delivery timeline. Additionally, we uphold an intellectual property strategy that includes patent and trademark filings in multiple jurisdictions.
Products and Solutions
Enterprise
The enterprise market demands reliable wireless access across diverse settings, including smart cities, utilities, factories, buildings, campuses, transportation hubs, stadiums, and suburban developments.
Our Lighthouse 5G Smart Network Control Repeater (NCR) delivers a scalable, high-performance solution designed to rapidly deploy and enhance network coverage and offload network capacity for the underserved areas. The Lighthouse family of products includes:
•a low-power Micro repeater, optimized for small offices or residence seeking targeted indoor coverage expansion; and.
•a high-power network repeater, for both In Building Solutions (IBS) and outdoors for MNOs and system integrators to extend coverage and improve network performance in large areas.
In 2024, we successfully tested the performance of our Lighthouse product on several domestic and international operator networks, achieving strong performance and enhanced network coverage. In December 2024, we achieved our first commercial deployment, marking a significant milestone in scaling for this product.
In the second quarter of 2024, we launched our Fixed Wireless Access (FWA) product line, engineered to overcome 5G connectivity challenges, and enhance end-user experience. Our Lantern™ 5G FWA outdoor device integrates high-performance directional antennas, a 5G NR Sub-6 modem, and is powered via 2.5 gigabit ethernet with Power over Ethernet (PoE), ensuring seamless, high-speed connectivity in demanding environments. Built for rugged outdoor deployment, Lantern features remote management capabilities using TR-069 and a Wi-Fi-enabled installation web interface, simplifying maintenance and Deployment.
In May 2024, Lantern achieved certification from AT&T and T-Mobile and secured regulatory approvals from key industry bodies, including the Federal Communications Commission (FCC), PCS Type Certification Review Board (PTCRB), and Industry Canada (IC). Over the course of 2024, we successfully conducted several customer trials across the U.S. and international markets, supporting Lantern’s performance and market readiness. In the second quarter of 2024, we completed the first commercial deployment of Lantern.
Our asset tracking solutions are deployed across transportation, supply chain, and other specialized applications. In November 2024 we expanded our product line with AT-Flight, an asset tracker with integrated artificial intelligence that is in-flight certified to allow for full journey tracking. AT-Flight targets the healthcare and life sciences markets and uses artificial intelligence to automatically detect a flight event and activate airplane mode to comply with FAA regulations – thus eliminating the need for manual intervention. In addition to hardware, our asset tracking solution includes a recurring revenue component, our subscription-based NLink cloud-based device enablement platform, which allows for deployment and integration with enterprise systems via open application programming interfaces (API).
Our NimbeLink embedded modems serve numerous enterprise IoT sectors requiring cellular connectivity, such as packaging, logistics, EV charging, smart cities, smart buildings, agriculture, asset tracking, and self-service innovations. These NimbeLink cellular modems, which are both patented, and end-device certified, minimize the need for additional OEM end-customer carrier certifications. Our custom products feature joint engineering collaboration with strategic customers to develop industrial IoT products (IIoT) for specific applications while helping them reduce their time to market.
Our enterprise IoT and machine-to-machine (M2M) antennas are extensively deployed in diverse systems, products, and applications, including access points, gateways, FWA devices and utility meters.
Automotive
In the automotive market, our products are deployed in a wide range of vehicles in the fleet and aftermarket applications, supporting a variety of technologies that include 5G, LTE, Wi-Fi, LPWAN, GNSS, and Bluetooth. Fleet and aftermarket products in the automotive market typically consist of applications where vehicular wireless routers are paired with external antenna systems to provide connectivity to mobile assets.
In the third quarter of 2024, we completed the first commercial deployment of our second generation AirgainConnect® Fleet (AC-Fleet) system solution – a low profile, roof-mounted, all-in-one 5G vehicle gateway that provides 4G/5G cellular connectivity with built-in multi-profile eSIM, GPS, Wi-Fi, and gigabit ethernet router functionalities. The AC-Fleet solution is one of the first roof-mounted 5G vehicle gateways on the market, combining the latest 5G NR (New Radio) modem and a Wi-Fi 6 router, all in one covert form factor. At only two inches tall, AC-Fleet provides flexibility across multiple markets including public safety, transportation, transit, public and private fleets, and passenger and heavy vehicles.
In October 2024 AC-Fleet obtained T-Mobile and AT&T certifications, along with industry accreditation from the FCC, IC, PCS, and industry accreditation from the PTCRB. Our AC-Fleet platform includes hardware and a recurring revenue component including an optional annual subscription for remote access, AC-Cloud management, technical support, software updates, and extended warranty. We expect AC-Fleet to receive additional MNO certifications throughout 2025.
We offer a full line of external fleet antennas that are designed to be rugged, reliable, and flexible to meet almost any need. We design our products for performance, quality, and long product life, and our antennas connect to almost any vehicular router or modem. These antennas include high-performance and low-profile versions that mount on the roof, trunk, windshield, or dashboard and are optimized for 5G, 4G, Wi-Fi, and GNSS.
Consumer
The consumer market represents a vast audience utilizing wireless-enabled devices. Our embedded antennas are deployed in various consumer applications including access points, wireless gateways, FWA devices, Wi-Fi routers and extenders, smart TVs, smart home devices, and set-top boxes. These consumer products support a variety of technologies, products and services, including 4G/LTE, 5G, Wi-Fi, Bluetooth, LPWAN and Global Navigation Satellite System (GNSS).
In March 2024, we were awarded a multi-million-dollar deal with a tier one MSO for Wi-Fi 7 antenna solutions. Additionally, in May 2024, we announced that we secured a production purchase order for a long-term opportunity with another Tier 1 MSO for Wi-Fi 7 solutions. These wins continue Airgain’s position as a leader in Wi-Fi 7 and 5G for both FWA devices and wired broadband devices. We continue to grow our relationships with MSOs and MNOs as the market evolves with both wired and wireless broadband internet offerings.
.
Growth Strategy
Airgain is a leader in wireless connectivity solutions, dedicated to addressing critical connectivity challenges across various markets. We are evolving from a component manufacturer to a comprehensive wireless systems solutions provider, focusing on higher integration and complexity. Our growth strategy centers on two primary objectives:
Strengthening Our Core Businesses: Our embedded antennas in the consumer market, embedded modems, custom IoT solutions, and IoT antennas in the enterprise market, together with our aftermarket antennas in the automotive market, provide our foundational business. Our reputation and relationships throughout the Distribution, Value-Added-Reseller (VAR), MSO, MNO, OEM, and Original Design Manufacturer (ODM) supply chain enables us to aggregate key voice-of-the-customer product needs and challenges which is critical for innovation. Our RF design and test capabilities enable our products to be differentiated on performance and to improve the end-customer experience – specifically in Wi-Fi, LTE, 5G, and GNSS integrated systems.
Our foundational offerings include embedded antennas in the consumer market, embedded modems, custom IoT solutions, and IoT antennas in the enterprise market, and aftermarket antennas in the automotive sector. Our strong reputation and established relationships with distributors, value-added resellers (VARs), multiple system operators (MSOs), mobile network operators (MNOs), original equipment manufacturers (OEMs), and original design manufacturers (ODMs) enable us to gather critical customer insights that are essential for driving innovation. Our expertise in radio frequency (RF) design and testing allows us to differentiate our products in terms of performance, enhancing the end-customer experience, particularly in Wi-Fi, LTE, 5G, and GNSS integrated systems.
Expanding And Innovating In Connectivity: We are transitioning from being a component manufacturer to a wireless systems solution provider. This transition started with the acquisition of NimbeLink in 2021 which brought expertise in embedded modem solutions, asset tracker solutions and augmented our historical RF expertise with digital systems design, firmware, and cloud capabilities.
In the second quarter of 2024, we completed the first commercial deployment of our new line of FWA products designed to address 5G connectivity challenges, reduce deployment costs and enhance customer experiences. Our outdoor 5G LanternTM FWA device has integrated high-performance directional antennas, a 5G NR Sub-6 modem and it is powered through a 2.5 gigabit ethernet PoE connection. The Lantern 5G FWA has been ruggedized for outdoor use, includes remote management capabilities, and a Wi-Fi based easy installation web interface to help simplify the user experience.
In the third quarter of 2024, we completed the first commercial deployment of our second generation AirgainConnect® Fleet (AC-Fleet) system solution, a low profile, roof-mounted, carrier agnostic all-in-one 5G vehicle gateway that provides 5G cellular connectivity with built-in GPS, Wi-Fi, and gigabit ethernet router functionalities. The AC-Fleet solution is one of the first roof-mounted 5G vehicle gateways, combining the latest 5G NR (New Radio) modem and a Wi-Fi 6 router, all in one covert form factor. At only two inches tall, AC-Fleet provides flexibility across multiple markets including public safety, transportation, transit, public and private fleets, and vehicles.
In December 2024, we completed the first commercial deployment of our Lighthouse Smart NCRs platform. Lighthouse includes both a low-power small office and home office (SOHO) device targeting customers that need additional coverage in small areas, as well as a high-power outdoor network repeater for MNOs and systems integrators. Lighthouse smart repeaters include advanced carrier aggregation (CA), low latency, software upgradeability to support network-controlled repeater (NCR) standards, optional smart antenna technology to assist with installation and maintenance, and an optional remote management system. The smart network repeater also integrates advanced automatic gain control and echo cancellation, enabling single-pole installation.
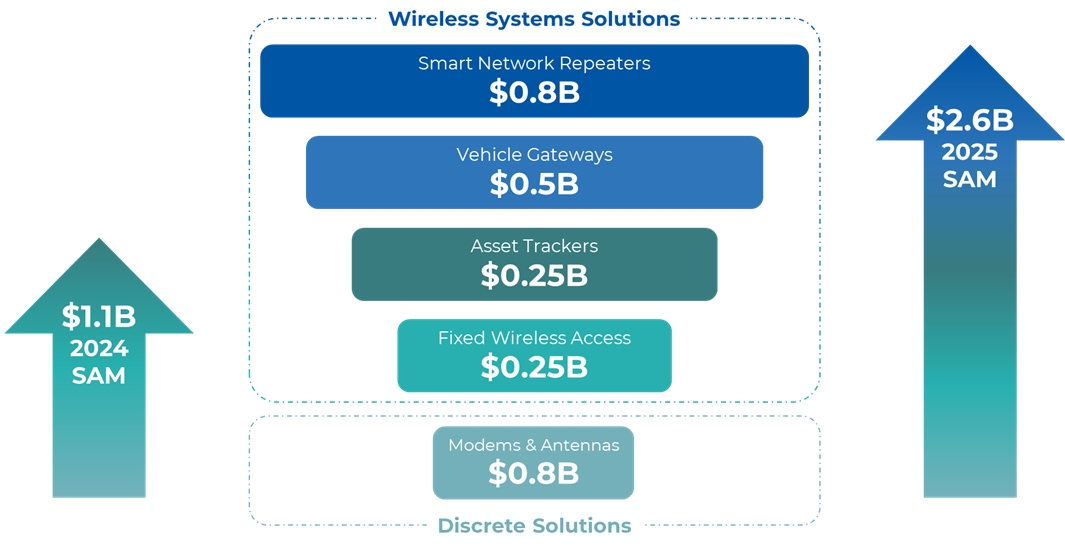
Our focus is on driving these innovative connectivity solutions to market and increasing our serviceable available market (SAM).
The following graphic provides a summary of our estimated SAM. Based on publicly available market research and internal estimates, we project the SAM will grow from $1.1 billion in 2024 to $2.6 billion in 2025, largely driven by the launch of our AC-Fleet vehicle gateway and our Lighthouse smart repeaters.
Airgain Estimated SAM ($B)
Sales and Marketing
Our sales and marketing organizations work together closely to improve market awareness, build a strong sales pipeline, and cultivate ongoing customer relationships to drive sales growth.
Sales
Our global sales efforts consist of direct and indirect sales teams, and indirect channel partners. Our direct sales team consists of sales personnel based in the United States, Greater China, South Korea, and Europe, while our indirect channel partners consist of distributors, engineering design companies and outside sales representatives across North America, Asia, Europe, Australia, the Middle East, and Latin America.
Our direct sales team is engaged in pre-sales, account management, and creating partnership opportunities with third parties such as service providers and OEMs. The sales process includes meeting and qualifying potential customers, and actively managing the planning stage of devices they project to bring to market. Our field application engineers (FAEs) assist these programs by providing technical support to new and existing customers.
Our indirect channel partners provide lead generation, pre-sales support, product fulfillment and, in certain circumstances, post-sales customer service and support. This channel partner network often co-sells with our direct sales team. Our channel partners provide us with additional sales leverage by sourcing new prospects, providing technical support to existing customers, upselling additional use cases, and maintaining repeat business with existing customers. These channels partners provide added coverage to customers and prospects we cannot reach directly.
Marketing
Our marketing strategy is focused on building a competitive advantage for our brands and products in the marketplace. We target two types of customers. For embedded products such as our NimbeLink modems and consumer antennas, we target design teams within OEMs and ODMs. For our integrated products, such as our asset trackers, FWA Lantern, and AirgainConnect AC-Fleet, we target distributors and the enterprise market. We use both direct and indirect promotional methods to engage our audiences. Direct methods include advertising, web properties, marketing collateral, email campaigns, paid and organic social media, search engine marketing, media relations, content marketing, direct mail, tradeshows and events, and general lead generation tactics.
Indirect methods include co-marketing efforts together with resellers, distributors, system integrators, hardware and software partners, and carriers both domestically and internationally.
Manufacturing and Operations
We are fabless and our products are manufactured by contract manufacturers (CMs) in the United States, China, Taiwan, Vietnam, and Mexico. We generally have long-term relationships with our CMs, and we work together to control global product compliance, raw materials supply and cost, production part approval processes, assembly instructions, control plans, final testing, and on-time shipment to our customers. We provide the control, test and measurement plans to the CMs to help ensure that each product conforms to the Airgain specifications, and we monitor the quality performance of our CMs through quality reports and periodic audits.
We maintain a close direct relationship with our CMs to help ensure that supply and quality meet our requirements. The contract manufacturing services required to manufacture our products can be satisfied by one or more of our CMs, however it may be time consuming and costly to qualify and implement new CM relationships. If one of our CMs suffers an interruption in their business, or experiences delays, disruptions, or quality control problems in their manufacturing operations, our ability to ship products to our customers could be delayed, and our business could be adversely affected. Our qualified CMs manufacture products according to our design specification, materials specification, quality standards, and delivery requirements. We have control and authority over the selection of materials, manufacturing, and inspection processes. Since our products manufactured in China are predominantly shipped to ODMs and CMs within Asia, we have not experienced a negative impact from tariffs imposed on exports from China to the United States
Research and Development
We invest considerable time and financial resources in research and development to engineer and deliver our products and solutions to market, while also enhancing our design and system integration capabilities and conducting quality assurance testing to improve our technology. As of December 31, 2024, we had a total of 59 employees engaged in research and development. Our engineering teams are located at research, design, and test centers in California, Arizona, Texas, Minnesota, and Florida, as well as the United Kingdom and China. Our engineering team actively participates in research and development activities to expand our capabilities and target applications for the enterprise, automotive and consumer markets. We strive to continually expand our product offerings and technology solutions over time and expect to continue to invest significantly in ongoing research and development efforts.
Additionally, for the development of certain company products, we engage with ODM partners to augment our internal engineering capability. Our ODM partners, primarily in Taiwan, enable us to scale our product development capacity quickly - especially for integrated connectivity products such as Lantern, AC-Fleet, and Lighthouse. For all such ODM-partner product developments, we maintain direct oversight and engagement to help assure projects are delivered in accordance with our quality and time-to-market expectations.
Competition
Because of our broad product line across several categories in the value chain, our competitive landscape is diverse and rapidly evolving.
Solution Providers
This category represents companies that manufacture a wide variety of products across the value chain including end-device hardware, software, components, services, and more. These companies include Digi International, Laird Connectivity, Multi-Tech Systems Inc., Lantronix, Inseego Inc., in-Hand, Peplink, Ericsson/Cradlepoint, Cisco Systems Inc., Nextivity Inc., Pulse Electronics, Samsara, Semtech, TE Connectivity, Wilson Electronics, Digital Matter, and Surecall among others. With our shift in business model towards solutions, many of these companies are direct competitors. While some partnership opportunities do exist, most of these companies strive to solve similar problems as us with their broad portfolios and consultative sales approaches.
End-Device Manufacturers
This category represents companies that manufacture and supply off-the-shelf products that are market ready, such as routers, gateways, cellular adapters, 5G repeaters, fixed wireless access devices, asset trackers, and more. These manufacturers can act as customers, partners, or competitors to us, depending on the application and
relationship. An end-customer may choose to bypass the design process entirely and purchase an off-the-shelf product to deliver device connectivity rather than embedding our modems and antennas. Our integrated products, such as the AC-Fleet, Lighthouse 5G Smart Network Repeater, Lantern FWA and asset trackers, may compete directly with these off-the-shelf products or enhance their functionality. In addition, our external antennas are designed to enhance the signal and coverage of many of these devices.
Component Manufacturers
This category represents companies that manufacture a broad array of components that compete both directly and indirectly with our products. These companies include Adant Technologies Inc., Asian Creation Communications Factory, Kyocera AVX, Baylin Technologies Inc., Blues Wireless, Fibocom, Fractus S.A., Honglin Technology Group Ltd., MobileMark, Nordic Semiconductor, Panorama Antennas, Parsec Technologies, Inc, Particle Industries Inc., PCTEL, Inc., Pinyon Technologies, Inc., Qualcomm, Quectel, Semtech, Sunwave Communications Co., Ltd., Telit, Ublox, Taoglas Limited, Wanshih Electronic Co. Ltd., WHA YU Industrial Co., Ltd, and 2J Antennas Group, among others. While we may choose to partner with some of these manufacturers to deliver products that shorten time to market, customers may also choose to complete the more intricate design work on their own using products manufactured by these companies. These component manufacturers may also expand their capabilities to be a solution provider, or end-device manufacturer, or both. As these component manufacturers evolve over time, the specific competitive situation would evolve accordingly.
In-house Design and Engineering Teams
Several of our existing customers, including OEMs and ODMs which design and build complete wireless devices, also have internal resources to design, engineer, and produce antenna, modem, router and/or repeater solutions. In such cases, we compete against the captive resource of that ODM. Several ODMs, including Arcadyan Technology Corporation, Foxconn Electronics Inc., Gemtek, Zyxel Communications, Inc. (MitraStar Technology), and Wistron Corporation, design, manufacture, and sell complete wireless devices, in direct competition with us.
The principal competitive factors in our markets include: price and total cost of ownership as a result of reliability and performance issues; brand awareness and reputation; component performance, such as reliability, range and throughput; ability to integrate with other technology infrastructures; offerings across breadth of wireless products; design and testing capabilities; lead-time and flexibility to rapidly customize solutions to individual customer requirements; relationships with semiconductor/chipset vendors; intellectual property protection; sales and marketing strength in different regions; and the ability to solve many complex RF problems across the entire spectrum of broadband connectivity.
Intellectual Property
We rely on patent, trademark, copyright and trade secret laws, confidentiality procedures, and contractual provisions to protect our technology.
As of December 31, 2024, our intellectual property portfolio is comprised of 287 granted patents and pending applications in the United States, Europe, and Asia. The scope of these patents encompasses our product offerings and technological advancements, with their terms of validity extending from the year 2025 until 2041. This patent collection encapsulates a diverse array of innovations pioneering wireless systems, including FWA, smart network controlled repeaters, vehicle gateway, antenna designs and structures, as well as the assembly and fabrication processes.
In line with our strategic evolution from a component supplier to a provider of comprehensive wireless system solutions, we have systematically grown our patent repository, escalating our filings to include broader wireless system functionalities and infrastructures.
Taken together, these patents with priority dates as far back as April 2005 form both a barrier to competition and a licensable asset for customers in the MIMO and antenna assembly categories.
Despite our efforts to protect our proprietary rights, unauthorized parties may attempt to copy aspects of our products or obtain and use information that we regard as proprietary. We generally enter into confidentiality agreements with our employees, consultants, vendors, and customers, and generally limit access to and distribution of our proprietary information. However, we cannot ensure that the steps taken by us will prevent misappropriation of our technology. In addition, the laws of some foreign countries do not protect our proprietary rights to as great an extent as the laws of the United States, and many foreign countries do not enforce these laws as diligently as government agencies and private parties in the United States.
Our industry is characterized by the existence of many patents and frequent claims and related litigation regarding patent and other intellectual property rights. Leading companies in the technology industry have extensive patent portfolios. Third parties, including certain of these leading companies, may in the future assert patent, copyright, trademark and other intellectual property rights against us, our channel partners, or our customers, or we may need to engage in litigation to enforce patents issued or licensed to us, to protect our trade secrets or know-how, or to defend against claims of infringement of the rights of others. See the section titled “Risk factors—Risks Relating to Intellectual Property” for a more comprehensive description of risks related to our intellectual property.
Human Capital
As of December 31, 2024, we had a total of 121 employees and dedicated representatives, including 84 in the United States and 37 outside the United States. Among the total 121 employees and dedicated representatives, 59 were primarily engaged in research and development, 39 were primarily engaged in sales and marketing, 19 were primarily engaged in general and administration functions and 4 were primarily engaged in manufacturing operations. None of our employees are covered by a collective bargaining agreement or represented by a labor union. We consider our relationship with our employees to be good.
Our human capital resources objectives include, as applicable, identifying, recruiting, retaining, and incentivizing our management team and our employees and consultants. The principal purposes of our equity and cash incentive plans are to attract, retain, and motivate personnel through the granting of stock-based and cash-based compensation awards to align our interests and the interests of our stockholders with those of our employees and consultants.
Available Information
We file electronically with the Securities and Exchange Commission, or SEC, our annual reports on Form 10-K, quarterly reports on Form 10-Q and current reports on Form 8-K pursuant to Section 13(a) or 15(d) of the Securities Exchange Act of 1934, as amended. We make available on our investor relations website at investors.airgain.com, free of charge, copies of these reports, as soon as reasonably practicable after we electronically file such material with, or furnish it to, the SEC. The SEC maintains a website that contains reports, proxy and information statements, and other information regarding issuers that file electronically with the SEC. The address of that website is www.sec.gov.
We use our investor relations website as a means of disclosing material non-public, information and for complying with our disclosure obligations under Regulation FD. Investors should monitor such website, in addition to following our press releases, SEC filings and public conference calls and webcasts. Information relating to our corporate governance is also included on our investor relations website. The information in or accessible through the SEC and our website are not incorporated into, and are not considered part of, this filing. Further, our references to the URLs for these websites are intended to be inactive textual references only.
ITEM 1A. RISK FACTORS
You should carefully consider the following risk factors, together with the other information contained in this annual report on Form 10-K, including our financial statements and the related notes and “Management’s Discussion and Analysis of Financial Condition and Results of Operations,” before deciding to purchase or sell shares of our common stock. We cannot assure you that any of the events discussed in the risk factors below will not occur. These risks could have a material and adverse impact on our business, results of operations, financial condition and growth prospects. If that were to happen, the trading price of our common stock could decline. Additional risks and uncertainties not presently known to us or that we currently deem immaterial also may impair our business operations or financial condition.
Summary of Risks Related to our Business
Our business is subject to numerous risks and uncertainties, including those described below. The principal risks and uncertainties affecting our business include, but are not limited to the following:
•The markets for our antenna and wireless systems solutions are developing and may not develop as we expect;
•Our operating results may fluctuate significantly, which makes our future operating results difficult to predict and could cause our operating results to fall below expectations or our guidance;
•If we are unable to manage our growth and expand our operations successfully, our business and operating results will be harmed, and our reputation may be damaged;
•Our wireless connectivity solutions and components are subject to intense competition, including competition from our suppliers and the customers to whom we sell;
•Our future success depends on our ability to develop new products and successfully introduce new and enhanced products and services for the wireless market that meet the needs of our customers;
•Any delays in our sales cycles could result in customers canceling purchases of our products;
•We have a history of losses, including an accumulated deficit of $87.2 million at December 31, 2024, and we may not be profitable in the future;
•We sell to customers who are price conscious, and to a limited number of customers, who represent a significant portion of our sales. If we were to lose any of these customers or devices, our sales could decrease significantly;
•We rely on a limited number of CMs and ODMs to produce and ship our products, and the failure to manage our relationships with these parties successfully could adversely affect our ability to market and sell our products;
•Our CMs purchase some components, subassemblies and products from a single or limited number of suppliers. The loss of any of these suppliers may substantially disrupt our ability to obtain orders and fulfill sales as we design in and qualify new components.
•We are developing a number of our new products and wireless connectivity solutions in partnership with other companies. If any of these companies were to fail to perform, or our partnerships were to be unsuccessful, we may not be able to bring our solutions to market successfully or on a timely basis;
•If we are unable to protect our intellectual property rights, our competitive position could be harmed, or we could be required to incur significant expenses to enforce our rights;
•Our international sales and operations subject us to additional risks that can adversely affect our operating results and financial condition;
•We are subject to governmental export and import controls and supply chain-related regulations that could impair our ability to compete in international markets due to licensing requirements, result in the disruption of our supply chains and/or subject us to liability and reputational harm if we are not in compliance with applicable laws; and
•Changes to United States tax, tariffs, Department of Defense’s Section 1260H List, and import/export regulations may have a negative effect on global economic conditions, financial markets and our business. China’s 2024 export ban on critical minerals such as gallium, germanium, and antimony has disrupted and may continue to disrupt global supply chains, driving up costs for semiconductors, sensors, and LEDs.
Risks Related to Our Business and Industry
The markets for our wireless systems solutions and components are developing and may not develop as we expect.
The wireless industry is characterized by rapidly evolving technologies, and the markets for our wireless connectivity solutions, embedded and external antennas, and IoT products may not develop as we expect. It is difficult to predict customer demand for our wireless system solutions and components, customer adoption rates, the size and growth rate of our target markets, the entry of competitive solutions and products, or the success of existing competitive solutions and products. We have historically driven revenue growth primarily through our embedded antennas, external antennas, embedded modems, and custom IoT products, largely in the consumer market. Moving forward, our goal is to drive growth in complex system solutions in the enterprise and automotive markets, including AC-Fleet, Lighthouse, Lantern, and asset tracking solutions. These markets may develop at varying growth rates, and our success in penetrating these markets will depend on various competitive factors across a number of developing industries.
Any expansion in our markets depends on several factors. For example, any growth in demand will depend on, among other things, the cost, performance, and perceived value associated with our components and the ability for our components to meet increased performance demands, refresh cycles, and device form factors. Further, as we continue to transition to a wireless systems solution provider, increased growth in the enterprise and automotive markets will depend on, among other things, acceptance of our solutions by our customers and performance of the networks on which our products operate. For example, AC-Fleet, Lighthouse, Lantern, and asset tracking solutions are dependent on the carriers’ networks that they operate on and require widespread commitments across multiple customer markets and budgets. The growth potential for these solutions may be limited, and we will need to introduce new products in the AirgainConnect, Lighthouse, Lantern, and asset tracking platforms in order to continue to grow.
As we expand our product portfolio to include more advanced system solutions, we face increased risks related to supply chain complexity, procurement of specialized components, and reliance on third-party manufacturers. Any disruption in the availability or cost of key system components, including semiconductors, modems, or RF modules, could adversely impact production and our ability to meet customer demand.
If our wireless solutions do not achieve widespread adoption, if there is a slower rollout than we expect in certain markets, or if there is a reduction in demand for our wireless connectivity solutions or components including AC-Fleet, Lighthouse, Lantern, and asset trackers, caused by a lack of customer acceptance, technological challenges, competing technologies and products, decreases in corporate spending, weakening economic conditions, or otherwise, it could result in reduced customer orders and decreased sales, which would adversely affect our business, operating results, and financial condition.
Our operating results may fluctuate significantly, which makes our future operating results difficult to predict and could cause our operating results to fall below expectations or our guidance.
Our quarterly and annual operating results have fluctuated in the past and may fluctuate significantly in the future, which makes it difficult for us to predict our future operating results. The timing and size of sales of our wireless system solutions and components are variable and difficult to predict and can result in fluctuations in our net sales from period to period. In addition, our budgeted expense levels depend in part on our expectations of future sales. Because any substantial adjustment to expenses to account for lower levels of sales is difficult and takes time, we may not be able to reduce our costs sufficiently to compensate for an unexpected shortfall in net sales, and even a small shortfall in net sales could disproportionately and adversely affect our operating margin and operating results for a given quarter. Our net loss decreased from $12.4 million in the year ended December 31, 2023 to $8.7 million in the year ended December 31, 2024, and the net loss or income will fluctuate in the future. Prior to 2024, our net
losses were $12.2 million, $8.7 million and $10.1 million for the years ended December 31, 2023, 2022 and 2021, respectively.
Our operating results may also fluctuate due to a variety of other factors, many of which are outside of our control, including any change or volatility in U.S., European, Asian and global economic environments, and any of which may cause our stock price to fluctuate. Besides the other risks in this “Risk Factors” section, factors that may affect our operating results include:
•fluctuations in demand for our products and services;
•excess inventory held by customer;
•the inherent complexity, length and associated unpredictability of product development windows and product lifecycles;
•the timing and extent of investment in our targeted growth markets and the timing and amount of sales in such markets;
•our ability to develop, introduce and ship in a timely manner new products and product enhancements and anticipate future market demands that meet our customers’ requirements, and provide adequate customer support for those products;
•changes in customers’ budgets for technology purchases and delays in their purchasing cycles;
•global supply shortage including, but not limited to chips and modules, supply constraints relating to other materials and potential increasing shipping costs and related limitations on our ability to acquire mission critical components and our CM’s abilities to obtain sufficient human resources to meet our global demand;
•inflation and other increases in the cost of components, consumables, labor and other manufacturing costs;
•changing market and economic conditions and, financial institution instability.
•any significant changes in the competitive dynamics of our markets, including new entrants, or further consolidation, and the timing of product releases or upgrades by us or by our competitors;
•uncertainty surrounding the type, scope, and implementation of tariffs, trade policies, and other governmental action by the United States and other countries and the effect therefrom on international relations, sanctions, tariffs, and supply chains;
•govenment approval delays
•terrorism, political instability or war, and the imposition of sanctions or countermeasures by the United States and other countries in relation to such conflicts;
•public health crises regionally and globally, including pandemics and epidemics; and
•facility shutdowns related to local holidays in China and southeast Asia, affecting how customers make purchasing decisions.
The cumulative effects of the factors above could result in large fluctuations and unpredictability in our quarterly and annual operating earnings. Additionally, this may result in higher prices from suppliers which could negatively affect gross margins and increase operating expenses. You should not rely on our past results as an indication of future performance.
In addition, the financial markets and the global economy may be adversely affected by the current or anticipated impact of military conflicts in other countries, political unrest, tensions, and global and regional, terrorism or other geopolitical events. Sanctions imposed by the United States and other countries in response to such conflicts, may also adversely impact the financial markets and the global economy, and any economic countermeasures by affected countries and others could exacerbate market and economic instability. In addition, concerns or adverse developments regarding liquidity risk related to financial institutions or the broader financial services industry could lead to market-wide liquidity shortages, impair the ability of us or other companies to access near-term working capital needs, and create additional market and economic uncertainty. There can be no assurance that future credit and financial market instability and a deterioration in confidence in economic conditions will not occur. Our general business strategy and operating results may be adversely affected by any such economic downturn, liquidity shortages, volatile business environment, or continued unpredictable and unstable market conditions. In addition,
there is a risk that one or more of our current service providers, financial institutions, manufacturers, suppliers or customers may be adversely affected by the foregoing risks, which could adversely affect our business and operating results be adversely affected by the foregoing risks.
If we are unable to manage our growth and expand our operations successfully, our business and operating results will be harmed, and our reputation may be damaged.
We have expanded our operations in the last several years and anticipate that further significant expansion will be required to achieve our business objectives. The growth and expansion of our business and product offerings places a continuous and significant strain on our management, operational and financial resources. As we transition to a wireless system solutions provider, we expect these challenges to increase. Any such future growth would also add complexity to and require effective coordination throughout our organization. We use the services of third parties to perform tasks including design services and sales and marketing. Our growth strategy may entail expanding our group of contractors or consultants to implement additional functions going forward. Because we rely on consultants, effectively outsourcing key functions of our business, we will need to be able to manage these consultants to ensure that they successfully carry out their contractual obligations and meet expected deadlines. However, if we are unable to effectively manage our outsourced activities or if the quality of the services provided by consultants is compromised for any reason, our ability to provide quality products in a timely manner could be harmed, which may have a material adverse effect on our business operating results and financial condition.
To manage any future growth effectively, we must continue to improve and expand our information technology and financial infrastructure, our operating and administrative systems and controls, and our ability to manage headcount, capital and processes in an efficient manner. We may not be able to successfully implement improvements to these systems and processes in a timely or efficient manner, which could result in additional operating inefficiencies and could cause our costs to increase more than planned. If we do increase our operating expenses in anticipation of the growth of our business and this growth does not meet our expectations, our operating results may be negatively impacted. If we are unable to manage future expansion, our ability to provide high quality products and services could be harmed, which could damage our reputation and brand and may have a material adverse effect on our business, operating results and financial condition.
Our wireless connectivity solutions and components are subject to intense competition, including competition from our suppliers and the customers to whom we sell.
Antenna solutions are an established technical field with low intellectual property and technological barriers to entry. Antenna competition exists globally for all areas of our business and product lines. The markets in which we compete are rapidly evolving and intensely competitive, and we expect competition to increase in the future from established competitors and new market entrants. The markets are influenced by, among others, brand awareness and reputation, price, strength and scale of sales and marketing efforts, professional services and customer support, product features, reliability and performance, scalability of products, and breadth of product offerings. Due to the proprietary nature of some of our products, competition occurs primarily at the design stage. As a result, a design win by our competitors or by us typically limits further competition regarding that design. This competition could result in increased pricing pressure, reduced profit margins, increased sales and marketing expenses and failure to increase, or the loss of, market share, any of which would likely seriously harm our business, operating results or financial condition.
Additionally, our transition into more system-based solutions may bring more competitors into our markets than we have traditionally faced. As our solutions begin to contain more system components and commensurate higher average selling prices, the resulting product categories may attract additional competitors, or our customers may be more likely to begin to develop competing products. We face new competition from established telematics, networking, and IoT platform providers, which may create barriers to our market entry and limit our ability to grow in these sectors.
New entrants and the introduction of other distribution models in our markets may harm our competitive position.
The markets for development, distribution, and sale of our products are rapidly evolving. New entrants seeking to gain market share by introducing new technology and new products may make it more difficult for us to sell our products, and could create increased pricing pressure, reduced profit margins, increased sales and marketing
expenses, or the loss of market share or expected market share, any of which may significantly harm our business, operating results and financial condition.
Our future success depends on our ability to develop new products and successfully introduce new and enhanced products and services for the wireless market that meet the needs of our customers.
Our sales depend on our ability to anticipate our existing and prospective customers’ needs and develop products and systems solutions that address those needs. Our future success will be contingent on our ability to introduce new solutions for wireless applications, anticipate improvements and enhancements in wireless technology and wireless standards, and to develop solutions that are competitive in the rapidly evolving wireless industry. In furtherance of these efforts, we will continue to invest significantly in ongoing research and development. However, such investments may not translate into material enhancements to our wireless solutions, which are important for us to compete effectively. As we complete our transition into a wireless systems solutions provider, our investment in research and development will grow to stay on the leading edge of next generation development and to align ourselves with the rapidly evolving technology needs of the industry. Moreover, the introduction of newly integrated wireless platforms and product and system enhancements will require coordination of our engineering efforts with those of our customers, carriers, suppliers, and manufacturers to efficiently achieve our growth objectives. As our business transitions to more complex system-based solutions, we must provide enhanced post-sales support, ongoing firmware/software updates, and higher levels of technical assistance. If we are unable to effectively support our customers in deploying and maintaining these solutions, we may experience reputational harm, reduced customer adoption, or an increase in warranty and service costs. If we fail to coordinate these efforts, develop product enhancements or introduce new solutions that meet the needs of our customers as scheduled, our operating results will be materially and adversely impacted, and our business and prospects will be harmed. We cannot assure that our new wireless solutions will meet customer expectations or that our wireless solutions will be competitive in the market.
The introduction of the next generation AirgainConnect, Lighthouse, Lantern and asset tracking platforms, and the transition to a more expansive level of advanced solutions, requires coordination of efforts and increased time and resources. If we fail to develop competitive solutions for customers with outstanding quality within the identified market window, our operating results may be materially and adversely impacted. As we rollout follow-on products and accessories for the AC-Fleet, Lighthouse, Lantern and asset tracker solutions, we may not be able to successfully develop to conform to carrier PTCRB certifications, and specific country and regulatory certifications and approvals of such products. Furthermore, our transition to full wireless system solutions introduces additional regulatory compliance challenges for new classes of devices such as Lighthouse. Our products must meet stringent equipment authorization and carrier certification requirements (such as PTCRB, FCC, and industry-specific and regional standards). Failure to secure timely authorizations or certifications or unexpected changes in regulatory requirements could delay product launches, increase costs, or impact on our ability to sell our solutions in key markets.
The successful deployment of our wireless system solutions depends on the reliability and security of our embedded software and firmware. Software bugs, cybersecurity vulnerabilities, or delays in providing necessary updates could result in product malfunctions, compromise the confidentiality, integrity, and availability of our customers’ own IT systems and/or our customers’ proprietary or other sensitive information, customer dissatisfaction, or reputational harm. Any failure to maintain robust software and cybersecurity protocols may negatively impact our business and financial performance. Furthermore, the stringent customer demands for these advanced solutions requires substantial ongoing effort and investment for solution maintenance, support, and evolution. If we are unable to continually provide such effort and investment to customers, our customers’ business could be adversely impacted, or customers could switch to competitor solutions, which would have an adverse impact on our operating results.
Furthermore, given the rapidly evolving nature of the wireless market, there can be no assurance our products and technology will not be rendered obsolete by alternative or competing technologies. The markets in which we operate are characterized by changing technology and evolving industry standards, which includes the introduction and implementation of Wi-Fi 7 and emerging 5G cellular standards. Despite years of experience in meeting customer design requirements with the latest in technological solutions, we may not be successful in identifying, developing and marketing products or systems that respond to rapid technological change, evolving technical standards and systems developed by others. Our competitors may develop technology that better meets the needs of our customers. If we do not continue to develop, manufacture and market innovative technologies or applications that meet customers’ requirements, sales may suffer, and our business may not continue to grow in line with historical rates or at all.
Any delays in our sales cycles could result in customers canceling purchases of our products.
Sales cycles for some of our products can be lengthy, often lasting several months to a year or longer. In addition, it can take additional time before a customer commences volume production of equipment that incorporates our products. Sales cycles can be lengthy for several reasons, including:
•our OEM customers and carriers usually complete a lengthy technical evaluation of our products, over which we have no control, before placing a purchase order;
•the commercial introduction of our products by OEM customers and carriers is typically limited during the initial release to evaluate product performance;
•the development and commercial introduction of products incorporating new technologies frequently are delayed; and
•certain customers of advanced antenna systems and integrated wireless solutions require successful field trials before committing to purchase our solutions, which could delay the customer decision making process.
A significant portion of our operating expense is relatively fixed and is based in large part on our forecasts of volume and timing of orders. The lengthy sales cycles make forecasting the volume and timing of product orders difficult. In addition, the delays inherent in lengthy sales cycles raise additional risks of customer decisions to cancel or change product phases. If customer cancellations or product changes were to occur, this could result in the loss of anticipated sales without sufficient time for us to reduce our operating expenses. We currently maintain significant inventories to meet forecasted future demand due to the supply chain shortages. If the forecasted demand does not materialize into purchase orders for these products, we may be required to write off our inventory balances or reduce the value of our inventory, based on a reduced sales price. A write off of the inventory, or a reduction in the inventory value due to a sales price reduction, could have an adverse effect on our financial condition and operating results.
We have a history of losses, and we may not be profitable in the future.
Before 2013 we had incurred net losses in each year since our inception. As a result, we had an accumulated deficit of $87.2 million on December 31, 2024. Airgain is transitioning to a wireless systems solutions company. Because the market for wireless systems solutions is rapidly evolving, it is difficult for us to predict our operating results. We expect our operating expenses to increase over the next several years as we hire additional personnel, particularly in engineering, sales support, customer service and experience, and marketing, and continue to develop new wireless ecosystems to address new and evolving markets. In addition, as a public company we will continue to incur significant legal, accounting, and other expenses. If our sales do not increase to offset these increases in our operating expenses, we may not be profitable in future periods. Our historical sales growth has been inconsistent and should not be considered indicative of our future performance. Any failure to sustain or increase our profitability consistently could cause the value of our common stock to materially decline.
A limited number of customers and devices represent a significant portion of our sales. If we were to lose any of these customers or devices, our sales could decrease significantly.
Customers that accounted for 10% or more of our total revenue provided approximately 54% of sales in the aggregate for the year ended December 31, 2024. Although our top customers that pay for our products have historically been ODMs and distributors, it is primarily the OEMs, carrier customers and retail-focused end-customers that drove the use of our antenna solutions and the purchase by the ODMs and distributors of our antenna solutions. In addition, a few end-customer devices which incorporate our antenna products comprise a significant amount of our sales, and the discontinuation or modification of such devices may materially and adversely affect our sales and results of operations. Moving forward, as we transition to a wireless systems solutions provider, we expect a shift toward external wireless solutions and antenna technologies in the automotive and enterprise markets that may result in a corresponding shift in the customer mix. Any significant loss of, or a significant reduction in purchases by, these other significant customers or customers that drive the use of our antenna solutions or a modification or discontinuation of a device which constitutes a significant portion of sales could have an adverse effect on our financial condition and operating results.
We sell to customers who are price conscious.
Our customers compete in segments of the electronics market. The electronics market is characterized by intense competition as companies strive to come to market with innovative designs that attract customers based upon
design, performance, cost, ease of use, and convenience. Product lifecycles can be extremely short as companies try to gain advantage over their competitors. Because of the high design and engineering costs, companies that are customers or prospects for antenna solutions are cost conscious. As a result, our customers and prospects demand price cuts in established products and negotiate aggressively for lower pricing on new products. Because of the intense competition in the antenna solution market, we encounter situations that lead to difficult price negotiations potentially resulting in lower margins than forecast. Our products generally cost more than our competitors’ products. To address these pricing constraints and remain competitive, we must consistently design high quality antenna solutions that are deemed a better value than competing solutions, while also decreasing costs.
We rely on a limited number of CMs and ODMS to produce and ship our products, and the failure to manage our relationships with these parties successfully could adversely affect our ability to market and sell our products.
We outsource the manufacturing, assembly and some of the testing of our products to CMs, and also engage with ODMs to substantially contribute to the development of certain of our products in addition to production and shipping. We have over the past two years engaged additional CMs and ODMs outside of China, including Vietnam, Taiwan and Mexico, to expand our capacity, and to diversify the global regions in which our products are manufactured. These CMs and ODMs are relied upon to develop, manufacture, control quality of, and ship our products. We do not have long-term contracts that commit CMs to manufacture products for us. Furthermore, political unrest or political instability, military conflict in any country in which our CMs and ODMs are located could experience political unrest, tensions and uncertainty. Global and regional, terrorism or other geopolitical events may have an adverse effect on our contract manufacturer’s ability to deliver quality products on time. Any significant change in our relationship with these manufacturers could have a material adverse effect on our business, operating results, and financial condition. We make substantially all of our purchases from our CMs and ODMs on a purchase order basis. Our CMs and ODMs are not required to manufacture our products for any specific period or in any specific quantity. We expect that it would take approximately six to nine months to transition manufacturing, quality assurance, and shipping services to new providers. Relying on CMs for manufacturing, quality assurance, and shipping also presents significant risks to us, including the inability of our CMs to:
•qualify appropriate component suppliers;
•manage capacity during periods of high demand;
•meet delivery schedules;
•assure the quality of our products;
•ensure adequate supplies of materials;
•protect our intellectual property; and
•deliver finished products at agreed-upon prices.
Additionally relying on ODMs for development, production, and shipping our products also presents significant risks to us including the inability of our ODMs to:
•develop products in timely and cost-effective way with good quality;
•assist us in ongoing support and maintenance for our products we are commercially shipping to our customers;
•meet delivery schedules for ongoing production with assured quality;
•protect Airgain’s confidential information.
Any failure by us or our CMs to timely deliver products of satisfactory quality or in sufficient quantities in compliance with applicable laws could hurt our reputation, cause customers to cancel orders or refrain from placing new orders for our products, which could have a material adverse effect on our business, operating results, and financial condition.
We may experience delays in obtaining product from manufacturers and may not be a high priority for our manufacturers.
The ability and willingness of our CMs to perform is largely outside of our control. We believe that our orders may not represent a material portion of our CMs’ total orders and, as a result, fulfilling our orders may not be a priority if
our CMs are constrained in their abilities or resources to fulfill all of their customer obligations in a timely manner. If any of our CMs suffers an interruption in its business, experiences delays, disruptions, or quality control problems in its manufacturing operations or we have to change or add additional CMs, our ability to ship products to our customers would be delayed and our sales could become volatile, and our cost of sales may increase. For example, throughout 2021 and 2022, we experienced a disruption in our supply chain for certain components located in Asia and made several purchases of available inventory in order to secure supply for our customers, sometimes at higher than our traditional prices. Additionally, any or all of the following could either limit supply or increase costs, directly or indirectly, to us or our CMs:
•financial problems of either CMs or component suppliers;
•reservation of manufacturing capacity at our contract manufactures by other companies, inside or outside of our industry;
•changes or uncertainty in U.S and non-U.S. tariffs and trade policy, economic sanctions, and other trade barriers, political unrest, or military conflict in regions where manufacturers are located; and potential conflicts involving other countries;
•industry consolidation occurring within one or more component supplier markets, such as the semiconductor market; and
•labor strikes or shortages, or restrictions imposed to limit pandemic or epidemics.
We cannot predict with certainty in the future whether a pandemic or epidemic will cause delays or disrupt our product shipments or impact manufacturing. If such disruption were to extend over a prolonged period, it could have a material impact on our sales and business and those of our customers.
Our CMs purchase some components, subassemblies and products from a single or limited number of suppliers. The loss of any of these suppliers may substantially disrupt our ability to obtain orders and fulfill sales as we design in and qualify new components.
We rely on third-party components and technology companies to provide contents of our bills of material to that ultimately configure the devices that are deployed in our integrate solutions. Thus, we rely on our CMs to obtain the components and subassemblies necessary for the manufacture of our devices. In 2024 we experienced continued relief from the shortages in supply of components that we experienced from 2021 to 2022, but we expect that we will experience shortages, constraints, hoarding, and higher prices due to export controls on critical minerals for semiconductors and tariffs in 2025. In 2023 we saw relief on supply disruptions due to over correction. A return to such shortages or other supply disruptions are possible, as well as inflation of prices of certain components, and our ability to predict the availability and pricing of such components is limited. Over the past four years, there have been and continue to exist fluctuations between shortages of certain electronic components used in our industry and a surplus that have led to ongoing uncertainty regarding lead times for the manufacture of certain components in some of our products. If shortages return or occur in the future, as, our business, operating results and financial condition would be materially adversely affected. Unpredictable price increases of such components due to market demand may occur as well. While components and supplies are generally available from a variety of sources, our CMs depend on a single or limited number of suppliers for several components for our products. Further, certain products may utilize custom components available from only one or a limited number of sources. When a component or product uses new technologies, capacity constraints may exist until the suppliers’ manufacturing capacity has increased. Many factors may affect the continued availability of these components at acceptable prices, including if those suppliers decide to concentrate on the production of common components instead of components customized to meet our requirements. There is no assurance that the supply of such components will not be delayed or constrained. If our suppliers of these components or technology were to enter into exclusive relationships with other providers of wireless networking equipment or were to discontinue providing such components and technology to us and we were unable to replace them cost effectively, or at all, our ability to provide our products would be impaired. Additionally, poor quality in any of the single or limited sourced components in our products could result in lost sales or lost sales opportunities. Our CMs generally rely on purchase orders rather than long-term contracts with these suppliers. As a result, even if available, our CMs may not be able to secure sufficient components at reasonable prices or of acceptable quality to build our products in a
timely manner. Therefore, we may be unable to meet customer demand for our products, which would have a material adverse effect on our business, operating results, and financial condition.
We rely significantly on channel partners to sell and support our products, and the failure of this channel to be effective could materially reduce our sales.
We believe that establishing and maintaining successful relationships with these channel partners is, and will continue to be, important to our financial success. Recruiting and retaining qualified channel partners and training them in our technology and product offerings require significant time and resources. To develop and expand our channel, we must continue to scale and improve our processes and procedures that support our channel partners, including investment in systems and training.
Existing and future channel partners will only work with us if we are able to provide them with competitive products on terms that are commercially reasonable to them. If we fail to maintain the quality of our products or to update and enhance them, existing and future channel partners may elect to work instead with one or more of our competitors. If channel partners stop actively selling our products, we may experience further decline in sales. In addition, the terms of our arrangements with our channel partners must be commercially reasonable for both parties. If we are unable to reach agreements that are beneficial to both parties, then our channel partner relationships will not succeed.
We have no minimum purchase commitments with any of our channel partners, and our contracts with channel partners do not prohibit them from offering products or services that compete with ours, including products they currently offer or may develop in the future and incorporate into their own systems. Some of our competitors may have stronger relationships with our channel partners than we do, and we have limited control, if any, as to whether those partners use our products, rather than our competitors’ products, or whether they devote resources to market and support our competitors’ products, rather than our offerings.
The reduction in or loss of sales by these channel partners could materially reduce our sales. If we fail to maintain relationships with our channel partners, fail to develop new relationships with other channel partners in new markets, fail to manage, train or incentivize existing channel partners effectively, fail to provide channel partners with competitive products on terms acceptable to them, or if these channel partners are not successful in their sales efforts, our sales may decrease, and our operating results could suffer.
Defects in our products or poor design and engineering services could result in lost sales and subject us to substantial liability.
Our advanced wireless connectivity technologies and systems are an increasingly complex and critical element in determining the operating performance of our customers’ products. If our connectivity solutions perform poorly, whether due to design, engineering, placement, failure to properly support the products, or other reasons, we could lose sales. In certain cases, if our connectivity solutions are found to be the component that leads to failure or a failure to meet the performance specifications of our customer, we could be required to pay monetary damages to our customer. Real or perceived defects or errors in our connectivity solutions could result in claims by channel partners and customers for losses they sustain. If channel partners or customers make these types of claims, we may be required, or may choose, for customer relations or other reasons, to expend additional resources to help correct the problem, including warranty and repair costs, process management costs and costs associated with remanufacturing our inventory. Liability provisions in our standard terms and conditions of sale may not be enforceable under some circumstances or may not fully or effectively protect us from claims and related liabilities and costs. In addition, regardless of the party at fault, errors of these kinds divert the attention of our engineering personnel from our product development efforts, damage our reputation and the reputation of our products, cause significant customer relations problems and can result in reduced future customer sales and even product liability claims. We maintain insurance to protect against certain types of claims associated with the use of our products, but our insurance coverage may not adequately cover any such claims. In addition, even claims that ultimately are unsuccessful could result in expenditures of funds in connection with litigation and divert management’s time and other resources. We also may incur costs and expenses relating to a recall of one or more of our products.
The process of identifying recalled products that have been widely distributed may be lengthy and require significant resources, and we may incur significant replacement costs, contract damage claims from our customers
and significant harm to our reputation. The occurrence of these problems could result in the delay or loss of market acceptance of our products and could adversely affect our business, operating results and financial condition.
The loss of key personnel or an inability to attract, retain and motivate qualified personnel may impair our ability to expand our business.
Our success depends upon the continued service and performance of our senior management team and key technical, marketing and production personnel. We have experienced management turnover in the past. The replacement of any member of our senior management team or other key employees or consultants involves significant time and costs and may significantly delay or prevent the achievement of our business objectives.
Our future success also depends, in part, on our ability to continue to attract, integrate and retain highly skilled personnel. Competition for highly skilled personnel, especially our design and technical personnel is frequently intense. As the source of our technological and product innovations, our design and technical personnel represent a significant asset. Any inability to retain, attract or motivate such personnel could have a material adverse effect on our business and results of operations. Further, competition for highly skilled personnel is frequently intense. Any difficulties in obtaining or retaining human resource competencies we need to achieve our business objectives may have an adverse effect on our performance.
Our inability to raise additional capital on acceptable terms in the future may limit our ability to develop and commercialize new solutions and technologies and expand our operations.
If our available cash balances and anticipated cash flow from operations are insufficient to satisfy our liquidity requirements, including because of lower demand for our products as a result of other risks described in this “Risk Factors” section and elsewhere in this annual report on Form 10-K, we may seek to raise additional capital through equity offerings, debt financings, collaborations or licensing arrangements. We may also consider raising additional capital in the future due to liquidity considerations or to expand our business, pursue strategic investments, take advantage of financing opportunities, or other reasons. For example, in March 2024, we entered into an at-the-market issuance sales agreement (the Sales Agreement) with Craig-Hallum Capital Group LLC (the Agent), pursuant to which we may, from time to time, sell shares of our common stock having an aggregate offering price of up to $5 million in “at the market” offerings through or to the Agent, as sales agent or principal. However, there can be no assurance that the Agent will be successful in consummating future sales based on prevailing market conditions or in the quantities or at the prices that we deem appropriate. In addition, the Sales Agreement may be terminated by us or the Agent at any time upon specified notice to the other party, or by the Agent at any time in certain circumstances, including the occurrence of a material adverse change.
Additional funding may not be available to us on acceptable terms, or at all. If we raise funds by issuing equity securities, dilution to our stockholders could result. Any equity securities issued also may provide for rights, preferences or privileges senior to those of holders of our common stock. The terms of debt securities issued, or borrowings could impose significant restrictions on our operations. The incurrence of indebtedness or the issuance of certain equity securities could result in increased fixed payment obligations and could also result in restrictive covenants, such as limitations on our ability to incur additional debt or issue additional equity, limitations on our ability to acquire or license intellectual property rights, and other operating restrictions that could adversely affect our ability to conduct our business. In addition, the issuance of additional equity securities by us, or the possibility of such issuance, may cause the market price of our common stock to decline. The global credit and financial markets have in the past experienced extreme volatility and disruptions (including as a result of pandemic, war and conflict and liquidity concerns regarding financial institutions and others in the financial services industry). If the equity and credit markets are volatile or deteriorate, or if adverse developments are experienced by financial institutions, it may make any necessary debt or equity financing more difficult to obtain, more costly, more onerous with respect to financial and operating covenants, and more dilutive. If we do not have, or are not able to obtain, sufficient funds, we may have to delay development or commercialization of our products or license to third parties the rights to commercialize products or technologies that we would otherwise seek to commercialize. If we raise additional funds through collaboration and licensing arrangements with third parties, it may be necessary to relinquish some rights to our technologies or our products, or to grant licenses on terms that are not favorable to us. If we are unable to raise adequate funds, we may have to liquidate some or all of our assets, or delay, reduce the scope of or eliminate some or all of our development programs. We also may have to reduce marketing; customer support or other resources devoted to our products or cease operations. Any of these actions could harm our business, operating results and financial condition.
If we raise additional capital through credit facilities or debt financing, the terms of any new debt could further restrict our ability to operate our business.
We may enter into credit facilities with banks or secure other debt financing that could require us to provide a security interest in our assets and/or place restrictions on our operating and financial flexibility. Any such credit facility or debt instrument could contain customary affirmative and negative covenants and events of default applicable to us and our subsidiaries. The affirmative covenants could include, among others, covenants requiring us and our subsidiaries to maintain our respective legal existence and governmental approvals, deliver certain financial reports, maintain insurance coverage, keep inventory, if any, in good and marketable condition and protect material intellectual property. The negative covenants could include, among others, restrictions on us and our subsidiaries from transferring collateral, incurring additional indebtedness, engaging in mergers or acquisitions, paying dividends or making other distributions, making investments, creating liens, selling assets and making any payment on subordinated debt, in each case subject to certain exceptions. If we default under the facility or debt instrument, the lender or debt holders may accelerate all of our repayment obligations and take control of our pledged assets, potentially requiring us to renegotiate the facility or debt on terms less favorable to us or to immediately cease operations. Further, if we are liquidated, the lender’s or debt holders’ right to repayment would be senior to the rights of the holders of our common stock to receive any proceeds from the liquidation. The lender or debt holders could declare a default upon the occurrence of any event that they interpret as a material adverse effect as defined under the applicable agreement, thereby requiring us to repay the loan or debt immediately or to attempt to reverse the declaration of default through negotiation or litigation. Any declaration by the lender or debt holders of an event of default could significantly harm our business and prospects and could cause the price of our common stock to decline.
Our business may suffer if our strategic alliances are not successful.
We enter into strategic alliances and other relationships with companies whose capabilities complement our own. For example, we recently entered into a strategic partnership with Omantel, a telecommunications provider in Oman, regarding 5G connectivity solutions in the Middle East and North Africa. The objectives and goals for a strategic alliance can include one or more of the following: technology exchange, product development, joint sales and marketing, or new-market creation. To be successful, we must first be able to define, identify and secure alliance partners which align with our growth and technological plans. We cannot be certain that our alliance partners will provide us with the support we anticipate, or that such alliance or other relationships will be successful in creating new or improved products. Our success is also highly dependent upon our ability to manage the alliances, promote the benefits to us, and to not prohibit or discourage other opportunities which may be beneficial to us in the future. Also, certain provisions of alliance agreements may include restrictions that limit our ability to independently pursue or exploit the developments under such strategic alliances. If a strategic alliance fails to perform as expected or if the relationship is terminated, we could experience delays in new product development or impairment of our relationships with customers, and our ability to develop new solutions in response to industry trends or changing technology may be impaired and our results of operations could be adversely affected.
We are developing a number of our new products and wireless connectivity solutions in partnership with other companies. If any of these companies were to fail to perform, or our partnerships were to be unsuccessful, we may not be able to bring our solutions to market successfully or on a timely basis.
We have partnered, and expect to continue to partner, with certain companies to further advance or develop our wireless connectivity solutions and develop or expand on new and existing technologies. These arrangements involve the commitment by each company of various resources, including technology, and research and development. If these arrangements do not develop as expected, especially those that involve our proprietary technologies, or if the products and/or services produced by our partners do not meet the required quality standards, our ability to introduce new antenna products and wireless connectivity solutions successfully and on schedule may be limited. Further, we cannot provide any assurances that our existing partnerships will be maintained successfully or at all, the failure of which could have a material adverse effect on our business and results of operations. If existing partnership entity has any technical difficulties, if our partnership with them does not continue to develop, or if the technology developed in partnership does not develop or the partnership entity
does not perform as expected or suffers market-launch delay or project-cost overrun, our sales may decrease, and our operating results could suffer.
We are subject to the risk that third-party consultants will not perform their tasks effectively and that we will be unsuccessful in operating our business as a result.
We have in the past relied on third parties, such as sales consultants and engineering contractors, for a portion of the design and sales and marketing of our products. In the future, we may rely on third-party consultants in addition to our own employees to perform the daily tasks necessary to operate our business in certain areas, including sales and engineering, and cannot ensure that third-party consultants will be able to complete their work for us in a timely manner. The failure of any third-party consultants to perform as anticipated could result in substantial costs, divert management’s attention from other strategic activities, or create other operational or financial problems for us. Terminating or transitioning arrangements with key consultants could result in additional costs and a risk of operational delays, potential errors and possible control issues as a result of the termination or during the transition. Accordingly, our reliance on third parties exposes us to the risk that our business will be unsuccessful if they do not design and sell our product as expected.
Our acquisitions expose us to risks that could adversely affect our business and adversely affect our operating results, financial condition, and cash flows.
As part of our strategy to develop and identify new products, services and technologies, we have made, and may continue to make, acquisitions of select assets and businesses. Integrating any newly acquired business could be expensive and time-consuming. Integration efforts often take a significant amount of time, place a significant strain on managerial, operational and financial resources and could prove to be more difficult or expensive than predicted. The diversion of management’s attention and any delay or difficulties encountered in connection with any future acquisitions we may consummate could result in the disruption of on-going business or inconsistencies in standards and controls that could negatively affect our ability to maintain third-party relationships.
When pursuing acquisitions, we may not be able to find suitable acquisition candidates, and we may not be able to complete such acquisitions on favorable terms, if at all. Moreover, we may need to raise additional funds through public or private debt or equity financing, or issue additional shares, to acquire any businesses or products, which may result in dilution for stockholders or the incurrence of indebtedness. Any acquisitions we complete, may not ultimately strengthen our competitive position or achieve our goals, and could be viewed negatively by our end-customers, investors and financial analysts. Acquisitions involve many risks. An acquisition may negatively affect our operating results, financial condition or cash flows because it may require us to incur charges or assume substantial debt or other liabilities, may cause adverse tax consequences or unfavorable accounting treatment, may expose us to claims and disputes by third parties, including intellectual property claims and disputes, or may not generate sufficient financial return to offset additional costs and expenses related to the acquisition.
Our ability to use our net operating loss carryforwards and other tax attributes may be limited.
As of December 31, 2024, the Company had net operating loss (NOL) carryforwards of approximately $19.6 million for federal income tax purposes and $11.9 million for state income tax purposes, subject to limitations may be available to offset our future taxable income, if any. Our federal and state NOL carryforwards begin to expire in 2029, and 2026, respectively. Federal NOLs generated in taxable years beginning after December 31, 2018 however, will carryforward indefinitely and may generally only be used to offset 80% of future taxable income in taxable years. As of December 31, 2024, we also had federal and state research and development and other tax credit carryforwards of approximately $2.4 million and $2.0 million, respectively, available to reduce future income tax liabilities, subject to limitations.
Our federal tax credit carryforwards begin to expire in 2026, and our state tax credits will begin to expire in 2032. These NOL and tax credit carryforwards could expire unused, to the extent subject to expiration, and be unavailable to offset future taxable income or income tax liabilities.
Furthermore, in general, under Sections 382 and 383 of the U.S. Internal Revenue Code of 1986, as amended (the Code), a corporation that undergoes an “ownership change” is subject to limitations on its ability to use pre-change NOL and tax credit carryforwards to offset future taxable income and income taxes, respectively. For these purposes, an ownership change generally occurs where the aggregate change in stock ownership of one or more stockholders or groups of stockholders owning at least 5% of a corporation’s stock exceeds 50 percentage points over a rolling three-year period. The Company’s use of U.S. federal and state NOL and tax credit carryforwards could be limited further by ownership changes. We have recorded a $16.7 million valuation allowance related to our
NOL carryforwards and other deferred tax assets due to the uncertainty of the ultimate realization of the future tax benefits of such assets.
If we are unable to implement and maintain effective internal control over financial reporting in the future, the accuracy and timeliness of our financial reporting may be adversely affected. In addition, because of our status as a non-accelerated filer, you will not be able to depend on any attestation from our independent registered public accounting firm as to our internal control over financial reporting for the foreseeable future.
The Sarbanes-Oxley Act of 2002, as amended (the Sarbanes-Oxley Act), requires, among other things, that we maintain effective disclosure controls and procedures and controls over financial reporting. In particular, we are required to perform system and process evaluations and testing of our internal control over financial reporting to allow management to report on the effectiveness of our internal controls over financial reporting, as required by Section 404 of the Sarbanes-Oxley Act. We are required to furnish a report by management on, among other things, the effectiveness of our internal control over financial reporting which began for our fiscal year ending December 31, 2017. However, our independent registered public accounting firm will not be required to attest to the effectiveness of our internal control over financial reporting pursuant to Section 404 of the Sarbanes-Oxley Act until the time we are no longer considered a non-accelerated filer. Accordingly, you will not be able to depend on any attestation concerning our internal control over financial reporting from our independent registered public accounting firm for the foreseeable future.
Compliance with environmental matters and worker health and safety laws could be costly, and noncompliance with these laws could have a material adverse effect on our operating results, expenses and financial condition.
Some of our operations use substances regulated under various federal, state, local and international laws governing the environment and worker health and safety, including those governing the discharge of pollutants into the ground, air and water, the management and disposal of hazardous substances and wastes, and the cleanup of contaminated sites. Some of our products are subject to various federal, state, local and international laws governing chemical substances in electronic products. We could be subject to increased costs, fines, civil or criminal sanctions, third-party property damage or personal injury claims if we violate or become liable under environmental and/or worker health and safety laws.
Our business and prospects depend on the strength of our market efforts and our brand. Failure to maintain and enhance our brand would harm our ability to maintain and expand our base of customers.
Maintaining and enhancing our brand is important to maintaining and expanding our base of customers who purchase our products. This will depend largely on our ability to continue to provide high-quality solutions, and we may not be able to do so effectively. While we may engage in a broader marketing campaign to further promote our brand, this effort may not succeed. Our efforts in developing our brand may be affected by the marketing efforts of our competitors. If we are unable to cost-effectively maintain and increase awareness of our brand, our business, results of operations and financial condition could be harmed. Our brand may be impaired by other factors, including product malfunctions. Any inability to effectively police our trademark rights against unauthorized uses by third parties could adversely impact the value of our trademarks and our brand recognition. If we fail to maintain and enhance our brand, or if we need to incur unanticipated expenses to establish our brand in new markets, our operating results would be negatively affected from reduced sales and increased marketing expenses.
Our financial condition and results of operations could be adversely affected by the outbreak of contagious diseases, including pandemics and epidemics.
Our business could be adversely affected by the effects of a widespread outbreak of contagious disease, including any pandemic or epidemic. For example, the COVID-19 pandemic created considerable instability and disruption in the U.S. and world economies and had a material and adverse effect on our business and operations. The COVID-19 pandemic caused disruption and restrictions on our and our customers’ ability to travel, temporary closures of our office buildings and the facilities of our customers or suppliers, cancellations or modification of key industry
marketing events, disruptions with our CMs and suppliers located in affected regions and overall adversely affect development of and sales for our products and solutions.
Future pandemics or other public health epidemics may have material adverse effect on our business, financial condition and results of operations, and may also have the effect of heightening many of the other risks described in this “Risk Factors” section.
Risks Relating to Intellectual Property
If we are unable to protect our intellectual property rights, our competitive position could be harmed, or we could be required to incur significant expenses to enforce our rights.
Our ability to compete effectively is dependent in part upon our ability to protect our proprietary technology. We rely on patents, trademarks, trade secret laws, confidentiality procedures and licensing arrangements to protect our intellectual property rights. There can be no assurance these protections will be available in all cases or will be adequate to prevent our competitors from copying, reverse engineering or otherwise obtaining and using our technology, proprietary rights or products. For example, the laws of certain countries in which our products are manufactured or licensed do not protect our proprietary rights to the same extent as the laws of the United States. In addition, third parties may seek to challenge, invalidate or circumvent our patents, trademarks, copyrights and trade secrets, or applications for any of the foregoing. There can be no assurance that our competitors will not independently develop technologies that are substantially equivalent or superior to our technology or design around our proprietary rights. In each case, our ability to compete could be significantly impaired. To prevent substantial unauthorized use of our intellectual property rights, it may be necessary to prosecute actions for infringement and/or misappropriation of our proprietary rights against third parties. Any such action could result in significant costs and diversion of our resources and management’s attention, and there can be no assurance we will be successful in such action. Furthermore, many of our current and potential competitors have the ability to dedicate substantially greater resources to enforce their intellectual property rights than we do. Accordingly, despite our efforts, we may not be able to prevent third parties from infringing upon or misappropriating our intellectual property.
Claims by others that we infringe their intellectual property rights could harm our business.
Our industry is characterized by vigorous enforcement and pursuit of intellectual property rights, which has resulted in protracted and expensive litigation for many companies. Third parties may in the future assert claims of infringement of intellectual property rights against us or against our customers or channel partners for which we may be liable. As the number of products and competitors in our market increases and overlaps occur, infringement claims may increase.
Intellectual property claims against us, and any resulting lawsuits, may result in our incurring significant expenses and could subject us to significant liability for damages and invalidate what we currently believe are our proprietary rights. Our involvement in any patent dispute or other intellectual property dispute or action to protect trade secrets and know-how could have a material adverse effect on our business. Adverse determinations in any litigation could subject us to significant liabilities to third parties, require us to seek licenses from third parties and prevent us from manufacturing and selling our products. Any of these situations could have a material adverse effect on our business.
These claims, regardless of their merits or outcome, would likely be time consuming and expensive to resolve and could divert management’s time and attention.
We are generally obligated to indemnify our channel partners and end-customers for certain expenses and liabilities resulting from intellectual property infringement claims regarding our products, which could force us to incur substantial costs.
We have agreed, and expect to continue to agree, to indemnify our channel partners and end-customers for certain intellectual property infringement claims regarding our products. As a result, in the case of infringement claims against these channel partners and end-customers, we could be required to indemnify them for losses resulting from such claims or to refund amounts they have paid to us. Our channel partners and other end-customers in the future may seek indemnification from us in connection with infringement claims brought against them. We will evaluate each such request on a case-by-case basis, and we may not succeed in refuting all such claims. If a
channel partner or end-customer elects to invest resources in enforcing a claim for indemnification against us, we could incur significant costs disputing it. If we do not succeed in disputing it, we could face substantial liability.
Risks Related to Data Privacy
Because we collect, process, use and store information about individuals, including our customers’ and our own employees, this creates data privacy compliance risks that could result in additional cost and liability to us.
In the normal course of our business, we collect, process, use and disclose information about individuals. Many federal, state and foreign governmental bodies and agencies have adopted, or are considering adopting, laws and regulations that impose limits on the collection, processing, use, disclosure and security of information about individuals. In some cases, such laws and regulations can be enforced by private parties in addition to government entities. In addition, privacy advocacy and industry groups may propose new and different self-regulatory standards that either legally or contractually apply to us. These laws, regulations, and standards are complex and currently evolving, not uniform and likely to remain uncertain for the foreseeable future.
In the United States, data privacy laws and regulations are promulgated at the federal and state level, some of which are enforced by the Federal Trade Commission (FTC). There are also laws regulating the use of personal information for direct marketing purposes, including the Controlling the Assault of Non-Solicited Pornography and Marketing Act of 2003, which establishes specific requirements for commercial email messages, and the Telephone Consumer Protection Act, and the Telemarketing Sales Rule as interpreted and implemented by the FCC and United States courts, or TCPA, which imposes significant restrictions on the use of telephone calls and text messages to residential and mobile telephone numbers. At the state level, California enacted legislation, the California Consumer Privacy Act of 2018, or CCPA, which provides new data privacy rights for California consumers and the California Privacy Rights Act, or CPRA, which took effect on January 1, 2023. The CPRA modifies the CCPA by providing significant new data privacy rights. The enactment of the CCPA is prompting a wave of similar legislative developments in other states in the United States, which has created the potential for a patchwork of overlapping but different state laws. Since the CCPA went into effect, general privacy statutes that share similarities with the CCPA are now in effect and enforceable in Virginia, Colorado, Connecticut, Utah, Connecticut, Utah, Texas, Montana, Oregon, Delaware, Iowa, New Hampshire, Nebraska, and New Jersey, and will soon be enforceable in several other states as well. Many other states are also currently reviewing or proposing the need for greater regulation of the collection, sharing, use and other processing of information related to individuals for marketing purposes or otherwise, and there remains increased interest at the federal level.
Foreign data protection laws, including the EU General Data Protection Regulation 2016/679, (GDPR) and the U.K. data protection regime consisting primarily of the UK General Data Protection Regulation and the UK Data Protection Act 2018 (together, UK GDPR) (the EU GDPR and UK GDPR together referred to as the GDPR), may also apply to other personal information obtained outside of the United States. The GDPR impose stringent requirements for entities processing personal information, including specific requirements regarding transfers of data outside of the European Economic Area (EEA) and UK. In relation to such cross border transfers of personal data, we expect the existing legal complexity and uncertainty regarding international personal data transfers to continue. In particular, we expect the European Commission approval of the current EU-US Data Privacy Framework for data transfers to certified entities in the United States to be challenged and international transfers to the United States and to other jurisdictions more generally to continue to be subject to enhanced scrutiny by regulators. As the regulatory guidance and enforcement landscape in relation to data transfers continue to develop, we could suffer additional costs, complaints and/or regulatory investigations or fines; we may have to stop using certain tools and vendors and make other operational changes; we may have to implement alternative data transfer mechanisms under the GDPR and/ or take additional compliance and operational measures; and/or it could otherwise affect the manner in which we provide our services, and could adversely affect our business, operations and financial condition. Since we are under the supervision of relevant data protection authorities in both the EEA and the UK, we may be fined under both the EU GDPR and UK GDPR for the same breach. In addition, there are other European laws and regulations regarding ePrivacy, that apply in addition to the GDPR and UK GDPR, to cookies and similar tracking technologies, electronic communications and marketing. Recent European court and regulator decisions are driving increased attention to cookies and tracking technologies. If the trend of increasing enforcement by regulators of the strict approach to opt-in consent for all but essential use cases, as seen in recent guidance and decisions continues, this could lead to additional costs, require systems changes, limit the effectiveness of our marketing activities, divert the attention of our technology personnel, adversely affect our margins, and subject us to additional liabilities. In light of the complex and evolving nature of EU, EU Member State and UK privacy laws on cookies and tracking technologies, there can be no assurances that we will be successful in our efforts to comply with such laws; violations of such laws could result in regulatory investigations, fines, orders to cease/ change our use of such technologies, as well as civil claims including class actions, and reputational
damage. Changes proposed by providers of major browsers to allow users to limit the collection of certain data generally or from specified websites could impair our ability to collect user information, including personal data and usage information, that helps us provide more targeted advertising to our current and prospective consumers. These changes could adversely affect our business, given our use of cookies and similar technologies to target our marketing and personalize the consumer experience. These and other recent legal developments in Europe have created complexity and uncertainty regarding these laws, the sufficiency of certain transfer mechanisms and how to comply.
In addition to the EU, the UK, and Asia have addition of data privacy legislation including China, Hong Kong, Japan, Singapore, and South Korea. Although we are continuing to take steps to comply with these and future laws and regulations, the scope of many of the requirements remains unclear, can be subject to significant change or interpretive or enforcement application, and may be inconsistent from one jurisdiction to another, and regulatory guidance on several topics is still forthcoming. Therefore, we cannot assure you that such steps will be sufficient. Compliance with current and future laws and regulations may require changes to our collection, use, transfer, disclosure or other processing of information about individuals and systems, and may thereby increase compliance costs. If we are unsuccessful, whether actual or perceived, in our efforts to comply with these and future laws and regulations, we may incur substantial additional costs in compliance, reputational harm, affect the manner in which we provide our services, including the geographies we service, and be subject to complaints and/or regulatory investigations (including orders to cease or change our processing of personal information), significant monetary liability, fines, penalties, regulatory enforcement, individual or class action lawsuits, public criticism, loss of customers, loss of goodwill or other additional liabilities, such as claims by industry groups or other third parties, which may have a material adverse effect on our business, operating results and financial condition.
Risks Related to Our International Operations
We are subject to risks associated with international geopolitical and military conflicts.
Our business has been impacted and may continue to be impacted by geopolitical conditions, such as a resultant international trade war, military conflicts in other countries, and increased political tensions with or related to Russia, Europe, the Middle East, and Asia. Currently, significant uncertainty surrounds the future trade relationships among the United States and other countries. Polices made by the U.S. government and policies made by other countries may make significant changes in trade policies that could negatively affect our business.
Our international sales and operations subject us to additional risks that can adversely affect our operating results and financial condition.
For the year ended December 31, 2024, approximately 41% of our products, based on sales, are outside of North America, and we are continuing to expand our international operations as part of our growth strategy. We have limited sales personnel and sales and support operations in the United States, Asia, and Europe. In addition, we anticipate further expansion of our global presence and extending our salesforce reach internationally. Our ability to convince customers to expand their use of our antenna products is directly correlated to our direct engagement with our end-customers and our channel partners. To the extent we are unable to engage with non-U.S. customers effectively with our limited sales force capacity, we may be unable to grow sales to existing customers.
Our international operations subject us to a variety of risks and challenges, including: increased management, travel, infrastructure and legal compliance costs associated with having multiple international operations; reliance on channel partners; increased financial accounting and reporting burdens and complexities; compliance with foreign laws and regulations; compliance with U.S. laws and regulations for foreign operations; and reduced protection for intellectual property rights in some countries and practical difficulties of enforcing rights abroad. Any of these risks could adversely affect our international operations, reduce our international sales or increase our operating costs, adversely affecting our business, operating results and financial condition and growth prospects.
In addition, we are subject to risks related to regulation of exports, re-exports and transfers of products, software or technology regulated under United States laws and regulations. From time to time, the U.S. Department of Commerce may impose licensing restrictions on certain parties with whom we conduct business, which may limit or prohibit our ability to continue these activities. For example, certain of our customers have been or are designated on the U.S. Department of Commerce’s Entity List and subject to licensing requirements in connection with exports, re-exports, and transfers of US-regulated items. These designations may result in the loss or temporary loss of such customers and could have a material adverse effect on our business, financial condition and results of operations and affect our international sales strategy in China and elsewhere around the world. Although we undertake to conduct our business in compliance with applicable laws and regulations and have no knowledge of
any issues of noncompliance with respect to export controls, our failure to successfully comply therewith may expose us to negative legal and business consequences, including civil or criminal penalties, government investigations, and reputational harm.
We are subject to governmental export and import controls and supply chain-related regulations that could impair our ability to compete in international markets due to licensing requirements, result in the disruption of our supply chains and/or subject us to liability and reputational harm if we are not in compliance with applicable laws.
Our products are subject to export control and import laws and regulations, including the U.S. Export Administration Regulations, U.S. Customs regulations and various economic and trade sanctions regulations administered by the U.S. Treasury Department’s Office of Foreign Assets Controls. Exports of our products must be made in compliance with these laws and regulations. If we violate these laws and regulations, we and certain of our employees could be subject to substantial civil or criminal penalties, including the possible loss of export or import privileges, fines, which may be imposed on us and responsible employees or managers, and, in extreme cases, the incarceration of responsible employees or managers. In addition, if our channel partners, agents or consultants fail to obtain appropriate import, export or re-export licenses or authorizations, we may also be adversely affected through reputational harm and penalties. Obtaining the necessary authorizations, including any required license, for a particular sale may be time-consuming, is not guaranteed and may result in the delay or loss of sales opportunities. Changes in our products or changes in applicable export or import laws and regulations may also create delays in the introduction and sale of our products in international markets, prevent our end-customers with international operations from deploying our products or, in some cases, prevent the export or import of our products to certain countries, governments or persons altogether. Any change in export or import laws and regulations, shift in the enforcement or scope of existing laws and regulations, or change in the countries or territories, governments, persons or technologies targeted by such laws and regulations, could also result in decreased use of our products, or in our decreased ability to export or sell our products to existing or potential end-customers with international operations. Any decreased use of our products or limitation on our ability to export or sell our products would likely adversely affect our business, financial condition and operating results.
Furthermore, U.S. export control laws and economic sanctions prohibit the provision of certain products and services to countries and territories, governments, and persons targeted by U.S. sanctions. U.S. sanctions that have been or may be imposed, including as a result of military conflicts in other countries may impact our ability to sell our products within regions covered by such sanctions or with or involving targeted persons. Despite our compliance efforts and activities, we cannot assure compliance by our employees or representatives for which we may be held responsible. If we fail to comply with export and import regulations and such economic sanctions, penalties could be imposed, including, for example, fines and/or denial of certain export privileges. These export and import controls, and economic sanctions could also adversely affect our manufacturers, suppliers and customers.
We are subject to risks generally associated with having a global supply chain, including certain laws and regulations related to forced labor and human rights. In June 2022, the U.S. Uyghur Forced Labor Prevention Act (UFLPA) went into effect, which imposes a rebuttable presumption that that the importation of any goods, wares, articles and merchandise mined, produced or manufactured wholly or in part in the UFLPA-designated region, or produced by certain entities, is prohibited by Section 307 of the Tariff Act of 1930 and that such goods, wares, articles and merchandise are not permitted entry to the United States. UFLPA or other U.S. human rights trade restrictions could affect the sourcing and availability of products, lead to our products being held for inspection by CBP and delayed or rejected for entry into the United States, result in other supply chain disruptions, or cause us to be subject to penalties, fines or sanctions. In the future, these human rights-related trade restrictions may expand in the United States or extend beyond the United States. For example, the Corporate Sustainability Due Diligence Directive (CSDDD) was approved by the EU in July 2024. When the CSDDD comes into force, it will be required to be transposed into the national laws of EU member states. The CSDDD will introduce, amongst other obligations, new due diligence, stakeholder engagement, monitoring and disclosure obligations. The CSDDD also introduces a new civil liability and penalty regime in relation to compliance with its terms. These new regimes might introduce new avenues for regulatory enforcement or litigation against us, which could be time-consuming, costly and harmful to our reputation, even if successfully resolved or settled. In addition, the EU Forced Labour Regulation (Forced Labour Regulation) will prohibit the sale, import and export of products made with forced labour in the EU market and give EU member states additional investigatory powers to enforce such ban, and will come fully into force in December 2027. The UFLPA, the CSDDD, the Forced Labour Regulation and similar regulations (including product-specific requirements, like the EU’s Batteries Regulation) could all similarly impact our supply chain. Even if
we were not subject to penalties, fines or sanctions or supply chain disruption under these restrictions, if products we source are linked in any way to forced labor, our reputation could be harmed.
On October 7, 2022, the Bureau of Industry and Security (BIS) issued new export controls related to the Chinese semiconductor manufacturing, advanced computing, and supercomputer industries. The new export controls impose broad end-use and other restrictions on facilities in China that develop or produce semiconductor chips or manufacturing equipment, may impact our ability to license or support our products to entities in or doing business with certain advanced AI or “supercomputer” design companies, foundries and manufacturers of assemblies and components in China. Such restrictions, and any subsequent restrictions, may have an adverse effect on our business, results of operations, or financial condition. In October 2023, BIS announced additional restrictions on the export of certain advanced computing chips and manufacturing technology to China, primarily focused on integrated circuits with military, data center, or artificial intelligence applications. These export control changes of certain integrated circuits are now subject to export licensing and export control restrictions for export or re-export to China and certain other countries. Furthermore, increased restrictions on China exports may lead to regulatory retaliation by the Chinese government and possibly further escalate geopolitical tensions, and any such scenarios may adversely impact our business. The prospect of future export controls that are implemented in a similar manner may continue to have an ongoing impact on our business, results of operation, or financial conditions. On January 13, 2025, BIS also announced new controls on advanced computing chips and certain closed AI model weights, including worldwide licensing requirements on certain advanced computing integrated circuits and certain semiconductor end-uses.
Changes to United States tax, tariff, Department of Defense’s Section 1260H List, and import/export regulations may have a negative effect on global economic conditions, financial markets and our business.
There have been significant changes and proposed changes to United States trade policies, treaties, tariffs and taxes, including trade policies and tariffs regarding China, Canada, and Mexico, among others. Tariffs in particular are in flux, potentially volatile, and involve some of the United States’ largest trading partners. For example, in late 2024, the U.S. announced an increase in tariffs on solar wafers and polysilicon imported from China, raising them from 25% to 50% effective January 1, 2025. These tariffs, along with existing and potential future trade restrictions, pose significant risks to our operations, especially given our reliance on ODMs for wireless connectivity solutions systems. ODMs frequently source critical components from China, and higher tariffs will likely increase production costs, disrupt supply chains, and impact our cost of goods sold. Additionally, stockpiling behaviors and supply shortages driven by these tariffs may lead to delays, reduced margins, and increased pricing pressures.
Regulatory changes and geopolitical developments further compound these risks. In 2024, new requirements under environmental regulations, including restrictions on PFAS chemicals, expanded emissions reporting, and the EU Battery Regulation, increased compliance complexity and operational costs. At the same time, China’s 2024 export ban on critical minerals such as gallium, germanium, and antimony has disrupted and may continue to disrupt global supply chains, driving up costs for semiconductors, sensors, and LEDs — core components in our wireless connectivity solutions. Given that China dominates the global gallium supply, and the resulting price inflation and supplier limitations create additional uncertainty for our production timelines and profitability.
Additionally, evolving regulatory measures under the DoD’s Section 1260H List introduce significant uncertainties for our business, particularly regarding our ability to engage in contracts with U.S. Department of Defense agencies. While Section 1260H does not directly impose prohibitions, further legislative measures, including those under the FY 2024 and FY 2025 National Defense Authorization Acts, will prohibit DoD agencies from acquiring certain goods, services or technologies from entities included on the 1260H List. The prohibition impacts contracts for direct sales from entities on the 1260H List beginning in June 2026 and for indirect sales from entities on the 1260H List beginning in June 2027. To the extent that any of our suppliers are included on or added to the 1260H List, the use of goods, services or technologies from those suppliers could restrict our business opportunities with certain customers, further affecting our operations.
The United States may maintain or increase existing tariffs or impose new ones. In response, China, Canada, Mexico, and other countries have imposed or proposed additional tariffs on certain exports from the United States, and it is unclear what future actions countries will or will not take with respect to trade policies, treaties, and tariffs.
Because we use products containing imported components that are covered under these fluctuating trade policies, we have engaged new CMs outside of China for additional supply chain diversity as well as an option of supply of components and assemblies for our wireless solutions that are less likely to be subject to delivery disruptions or increased tariffs.
Nonetheless, the changes and proposed changes to United States trade policies, treaties, tariffs and taxes, which are outside of our control, , contribute to significant uncertainty about the future relationship between the United
States, China, Canada, Mexico, and other countries. Specifically, such developments may have a material adverse effect on global economic conditions and the stability of global financial markets, and may significantly reduce global trade particularly between the above-listed countries. Any of these factors could depress economic activity; restrict our access to suppliers or customers; have a material adverse effect on our business, financial condition, and results of operations; and/or affect our strategy in China and elsewhere around the world.
New regulations or standards or changes in existing regulations or standards in the United States or internationally related to our products or our end-customer’s products may result in unanticipated costs or liabilities, which could have a material adverse effect on our business, operating results and future sales, and could place additional burdens on the operations of our business.
Our products and our end-customers’ products are subject to governmental regulations regarding radio frequency devices in many jurisdictions. To achieve and maintain market acceptance, our products, or our end-customers’ products must continue to comply with these regulations and many industry standards designed to prevent interference with other radio services and to limit human exposure to harmful radiation. In the United States, our end-customers’ products and our products (in cases where we provide devices that are end-device certified) must comply with such regulations issued by the (FCC) before they can be marketed or sold, or imported into, the United States, and may also be required to conform to industry standards defined by industry associations or organizations, such as Underwriters Laboratories, for commercial acceptance. We and our end-customers must also comply with similar international regulations and standards.
As these regulations and standards evolve, and if new regulations or standards are implemented, we may have to modify or redesign our products or our end-customers may have to modify their products, which could increase costs. The failure of our products or their products to comply, or cause delays in compliance, with the existing and evolving industry regulations and standards could prevent or delay introduction of our products or our antennas used in third-party products, which could harm our business. End-customer uncertainty regarding future policies may also affect demand for communications products, including our products. Moreover, channel partners or customers may require us, or we may otherwise deem it necessary or advisable, to alter our products to address actual or anticipated changes in the regulatory environment. Our inability to alter our products to address these requirements and any regulatory changes may have a material adverse effect on our business, operating results and financial condition.
We could be adversely affected by violations of the U.S. Foreign Corrupt Practices Act and similar worldwide anti-bribery laws.
We operate directly and indirectly in several foreign countries and are subject to anti-bribery laws in the jurisdiction in which we operate. The U.S. Foreign Corrupt Practices Act, or FCPA, and similar anti-bribery laws generally prohibit companies and their intermediaries from making improper payments to foreign government officials for the purpose of obtaining or retaining business or an unfair business advantage; many anti-bribery laws also prohibit commercial bribery. In addition, we are subject to the FCPA’s recordkeeping and internal controls requirements. Practices in the local business communities of many countries in which we do business have a heightened level of corruption. As part of our business, we may have direct or indirect sales to, and other interactions with, non-U.S. government agencies. Our policies mandate compliance with these anti-bribery laws and we have established policies and procedures reasonably designed to promote compliance with applicable anti-bribery law requirements; however, we cannot assure that our policies and procedures will protect us from violations committed by individual employees, agents or intermediaries. Allegations or violations of anti-bribery law violations could result in costly investigations, criminal or civil penalties or other sanctions that could have a material adverse effect on our business and reputation.
Risks Related to Our Common Stock
The price of our common stock may be volatile.
The trading price of our common stock may be volatile and may fluctuate substantially in response to various factors. This may be especially true for companies with a small public float. As a result of this volatility, investors may not be able to sell their common stock at or above the price at which they paid. The trading price of our
common stock depends on several factors, including those described in this “Risk Factors” section and elsewhere in this annual report on Form 10-K, including:
•price and volume fluctuations in the overall stock market from time to time;
•volatility in the market prices and trading volumes of technology stocks;
•changes in operating performance and stock market valuations of other technology companies generally, or those in our industry in particular;
•sales of shares of our common stock by us or our stockholders;
•failure of financial analysts to maintain coverage of us, changes in financial estimates by any analysts who follow our company, or our failure to meet these estimates or the expectations of investors;
•the financial projections we may provide to the public, any changes in those projections or our failure to meet those projections;
•announcements by us or our competitors of new products or new or terminated significant contracts, commercial relationships or capital commitments;
•the development and sustainability of an active trading market for our common stock;
•the public’s reaction to our press releases, other public announcements and filings with the SEC;
•rumors and market speculation involving us or other companies in our industry;
•actual or anticipated changes in our operating results or fluctuations in our operating results;
•actual or anticipated developments in our business or our competitors’ businesses or the competitive landscape generally;
•litigation involving us, our industry or both or investigations by regulators into our operations or those of our competitors;
•developments or disputes concerning our intellectual property or other proprietary rights;
•announced or completed acquisitions of businesses or technologies by us or our competitors;
•new laws or regulations or new interpretations of existing laws or regulations applicable to our business;
•changes in accounting standards, policies, guidelines, interpretations or principles;
•any major change in our management;
•general economic conditions and slow or negative growth of our markets; and
•other events or factors, including those resulting from outbreaks of contagious disease, inflation and interest rate changes, financial institution instability, wars, political unrest, regional tensions, and global and regional, terrorism or other geopolitical events.
In addition, the stock market in general, and the market for technology companies in particular, have experienced extreme price and volume fluctuations that have often been unrelated or disproportionate to the operating performance of those companies. Broad market and industry factors, as well as general economic, political and market conditions such as recessions or interest rate changes, may seriously affect the market price of our common stock, regardless of our actual operating performance. The realization of any of the above risks or any of a broad range of other risks, including those described in this “Risk Factors” section and elsewhere in this annual report on Form 10-K could have a dramatic and material adverse impact on the market price for our common stock.
In addition, in the past, following periods of volatility in the overall market and the market prices of particular companies’ securities, securities class action litigations have often been instituted against these companies. Litigation of this type, if instituted against us, could result in substantial costs and a diversion of our management’s attention and resources. Any adverse determination in any such litigation or any amounts paid to settle any such actual or threatened litigation could require that we make significant payments.
If securities or industry analysts issue an adverse opinion regarding our stock our stock price and trading volume could decline.
The trading market for our common stock is influenced by the research and reports that securities or industry analysts may publish about us, our business, our market or our competitors. We currently have limited research coverage by securities and industry analysts. If any of the analysts who may cover us change their recommendation regarding our common stock adversely, or provide more favorable relative recommendations about our competitors, the trading price of our common stock would likely decline. If any analyst who may cover us were to cease coverage of our company or fail to regularly publish reports on us, we could lose visibility in the financial markets, which in turn could cause the trading price of our common stock or trading volume to decline.
Anti-takeover provisions in our charter documents and under Delaware law could make an acquisition of us, which may be beneficial to our stockholders, more difficult and may prevent attempts by our stockholders to replace or remove our current management and limit the market price of our common stock.
Provisions in our amended and restated certificate of incorporation and amended and restated bylaws may have the effect of delaying or preventing a change of control or changes in our management. Some of these provisions:
•authorize our board of directors to issue, without further action by the stockholders, up to 10,000,000 shares of undesignated preferred stock and up to 200,000,000 shares of authorized common stock;
•require that any action to be taken by our stockholders be effected at a duly called annual or special meeting and not by written consent;
•specify that special meetings of our stockholders can be called only by our board of directors, the Chairman, the Chief Executive Officer or the President;
•establish an advance notice procedure for stockholder approvals to be brought before an annual meeting of our stockholders, including proposed nominations of persons for election to our board of directors;
•establish that our board of directors is divided into three classes, Class I, Class II and Class III, with each class serving staggered terms;
•provide that our directors may be removed only for cause; and
•provide that vacancies on our board of directors may, except as otherwise required by law, be filled only by a majority of directors then in office, even if less than a quorum.
In addition, we are subject to the provisions of Section 203 of the Delaware General Corporation Law, which limits the ability of stockholders owning in excess of 15% of our outstanding voting stock to merge or combine with us. Furthermore, our amended and restated certificate of incorporation specifies that, unless we consent in writing to the selection of an alternative forum, the Court of Chancery of the State of Delaware will be the sole and exclusive forum for most legal actions involving actions brought against us by stockholders. We believe this provision benefits us by providing increased consistency in the application of Delaware law by chancellors particularly experienced in resolving corporate disputes, efficient administration of cases on a more expedited schedule relative to other forums and protection against the burdens of multi-forum litigation. However, the provision may have the effect of discouraging lawsuits against our directors and officers. The enforceability of similar choice of forum provisions in other companies’ certificates of incorporation has been challenged in legal proceedings, and it is possible that, in connection with any applicable action brought against us, a court could find the choice of forum provisions contained in our amended and restated certificate of incorporation to be inapplicable or unenforceable in such action.
These anti-takeover provisions and other provisions in our amended and restated certificate of incorporation and amended and restated bylaws could make it more difficult for stockholders or potential acquirers to obtain control of our board of directors or initiate actions that are opposed by the then-current board of directors and could also delay or impede a merger, tender offer or proxy contest involving our company. These provisions could also discourage proxy contests and make it more difficult for you and other stockholders to elect directors of your choosing or cause us to take other corporate actions you desire. Any delay or prevention of a change of control transaction or changes in our board of directors could cause the market price of our common stock to decline.
We have never paid cash dividends on our common stock, and we do not anticipate paying cash dividends in the foreseeable future.
We have never declared or paid any cash dividends on our common stock and do not intend to pay any cash dividends in the foreseeable future. We currently intend to retain any future earnings to fund the growth of our business. Any determination to pay dividends in the future will be at the discretion of our board of directors and will depend on our financial condition, operating results, capital requirements, general business conditions and other factors that our board of directors may deem relevant and subject to the restrictions contained in any loan or financing instruments. As a result, capital appreciation, if any, of our common stock will be the sole source of gain for the foreseeable future.
We are a “smaller reporting company,” and if we take advantage of certain exemptions from disclosure requirements available to smaller reporting companies, this could make our stock less attractive to investors and may make it more difficult to compare our performance with other public companies.
We are a “smaller reporting company” as defined in Item 10(f)(1) of Regulation S-K. Smaller reporting companies may take advantage of certain reduced disclosure obligations, including, among other things, reduced executive compensation disclosures and providing only two years of audited financial statements. We will remain a smaller reporting company until the last day of the fiscal year in which (1) the market value of our common stock held by non-affiliates equals or exceeds $250 million as of the prior June 30, or (2) our annual revenue equals or exceeds $100 million during such completed fiscal year and the market value of our common stock held by non-affiliates equals or exceeds $700 million as of the prior June 30. To the extent we take advantage of such reduced disclosure obligations, our stockholders may not have access to certain information they may deem important. It may also make comparison of our financial statements with other public companies difficult or impossible. If investors find our common stock less attractive as a result of our reliance on these exemptions, the trading prices of our common stock may be lower than they otherwise would be, there may be a less active trading market for our common stock and the trading prices of our common stock may be more volatile.
We incur significant costs as a result of operating as a public company, and our management is required to devote substantial time to comply with the laws and regulations affecting public companies, particularly after we are no longer a smaller reporting company or a non-accelerated filer.
As a public company, particularly after we cease to qualify as a smaller reporting company or non-accelerated filer, we incur significant legal, accounting and other expenses that we did not incur as a private company, including costs associated with public company reporting and corporate governance requirements, to comply with the rules and regulations imposed by the Sarbanes-Oxley Act and the Dodd-Frank Act, as well as rules implemented by the SEC and Nasdaq. Our management and other personnel need to devote a substantial amount of time to these compliance initiatives and our legal and accounting compliance costs will increase. It is likely that we will need to hire additional staff in the areas of investor relations, legal and accounting. These new rules and regulations may make it more difficult and expensive for us to obtain director and officer liability insurance, and we may be required to accept reduced policy limits and coverage or incur substantially higher costs to obtain the same or similar coverage. As a result, it may be more difficult for us to attract and retain qualified individuals to serve on our board of directors or as executive officers. We are evaluating and monitoring developments regarding these rules, and we cannot predict or estimate the amount of additional costs we may incur or the timing of such costs.
For example, the Sarbanes-Oxley Act requires, among other things, that we maintain effective internal controls over financial reporting and disclosure controls and procedures. In particular, as a public company, we are required to perform system and process evaluations and testing of our internal control over financial reporting to allow management to report on the effectiveness of our internal controls over financial reporting, as required by Section 404 of the Sarbanes-Oxley Act. As described above, as long as we are considered a non-accelerated filer, we will not need to comply with the auditor attestation provisions of Section 404. Our testing, or the subsequent testing by our independent registered public accounting firm, may reveal deficiencies in our internal control over financial reporting that are deemed to be material weaknesses. Our compliance with Section 404 will require that we incur substantial accounting expense and management time on compliance-related issues. Moreover, if we are not able to comply with the requirements of Section 404 in a timely manner, or if we or our independent registered public accounting firm identify deficiencies in our internal control over financial reporting that are deemed to be material weaknesses, we could lose investor confidence in the accuracy and completeness of our financial reports, which could cause our stock price to decline.
Until December 31, 2021, we qualified for further exemptions and reduced disclosure requirements as an “emerging growth company,” as defined in the JOBS Act. Since we are no longer an emerging growth company, we are no longer exempt from certain requirements, including, without limitation, holding non-binding stockholder votes
on executive compensation arrangements and compliance with new or revised accounting standards and audit requirements. We expect to incur additional expenses and devote increased management effort toward ensuring compliance with these requirements, as well as when the available exemptions for a smaller reporting company or a non-accelerated filer are no longer available to us. We cannot predict or estimate the amount of additional costs we may incur as a result of becoming a public company or the timing of such costs.
General Risk Factors
Litigation or legal proceedings could expose us to significant liabilities and damage our reputation.
We may become party to litigation claims and legal proceedings. Litigation involves significant risks, uncertainties and costs, including distraction of management attention away from our current business operations. We evaluate litigation claims and legal proceedings to assess the likelihood of unfavorable outcomes and to estimate, if possible, the amount of potential losses. We caution you that actual outcomes or losses may differ materially from those envisioned by our current estimates. Our policies and procedures require strict compliance by our employees and agents with all United States and local laws and regulations applicable to our business operations, including those prohibiting improper payments to government officials. Nonetheless, there can be no assurance that our policies and procedures will always ensure full compliance by our employees and agents with all applicable legal requirements. Improper conduct by our employees or agents could damage our reputation in the United States and internationally or lead to litigation or legal proceedings that could result in civil or criminal penalties, including substantial monetary fines, as well as disgorgement of profits.
A failure in our information technology systems could negatively impact our business.
We rely on information technology to process, transmit, and store electronic and financial information and information about individuals, to manage a variety of business processes and activities, to maintain the financial accuracy of our records, and to comply with regulatory, legal and tax requirements. We also depend on our information technology infrastructure for digital marketing and sales activities and for electronic communications among our locations, personnel, customers, and suppliers around the world. We own and manage some of these information technology systems but also rely on third parties for a range of information technology systems and related products and services, including but not limited to cloud computing services. Third party products including cloud computing services and hardware come with risks that Airgain continuously monitors to ensure industry best practices are in use and consistent with replacement cycles to mitigate these risks. These information technology systems are susceptible to damage, disruptions, or shutdowns due to failures during the process of upgrading or replacing software, databases or components thereof, power outages, hardware failures, computer viruses, cyber-attacks, telecommunication failures, defects, errors, catastrophic events, terrorism or war, which according to United States government sources and others has resulted in a heightened risk of cyberattacks against companies like ours. If our information technology systems suffer severe damage, disruption, or shutdown and our business continuity plans do not effectively resolve the issues in a timely manner, our product sales, financial condition, and results of operations may be materially affected, and we could experience delays in reporting our financial results.
Information technology security threats are increasing in frequency, persistence, intensity and sophistication. We and our third-party service providers may also experience information technology security threats that may remain undetected for an extended period. Any perceived or actual compromise, breach, or misuse of our or our third-party service providers’ systems or information could cause us to incur damage to our reputation, and expose us to a risk of loss or litigation (including by our customers) and possible monetary liability, affect the manner in which we provide our services, and subject us to complaints and/or regulatory investigations, fines, penalties, regulatory enforcement, individual or class action lawsuits, public criticism, loss of customers, loss of goodwill or other additional liabilities, and could adversely affect our business, results of operations, financial condition and prospects. We may also incur significant costs to notify, in particular, affected individuals, maintain our security precautions and/or to correct problems caused by the compromise, breach or misuse of our systems or information. The costs of any compromise, breach or misuse of our systems or information could exceed our available insurance coverage, or could result in denial of coverage as to any specific claim, or a change or cessation in our insurance policies and coverages, including premium increases or the imposition of large deductible requirements. And any failure by our third party information technology providers, or any other entity in our collective supply chain, to prevent or mitigate security breaches or improper access to, or use, acquisition, disclosure, alteration, or destruction of, systems or information could have similar adverse consequences for us. To date, we have seen no material impact on our business or operations from these information technology security threats. Any future significant compromise, breach, or misuse of our data security could result in significant costs and damage to our reputation, and could materially adversely affect our business, results of operations, and financial condition. The
ever-evolving threats mean us, and our third-party service providers must continually evaluate and adapt our respective systems and processes and overall security environment, as well as those of any companies we acquire. There is no guarantee that these measures will be adequate to safeguard against all data security compromises, breaches, or misuses.
Our business is subject to the risks of earthquakes, fire, floods and other natural catastrophic events.
Our corporate headquarters are located in Southern California, some of our CMs are located in eastern Asia, both regions known for seismic activity. A significant natural disaster, such as an earthquake, a fire or a flood, occurring near our headquarters, or near the facilities of our CMs, could have a material adverse impact on our business, operating results and financial condition.
Changes in tax law may materially adversely affect our financial condition, results of operations and cash flows.
New income, sales, use or other tax laws, statutes, rules, regulations or ordinances could be enacted at any time, or interpreted, changed, modified or applied adversely to us, any of which could adversely affect our business operations and financial performance. The likelihood of these changes being enacted or implemented is unclear. We are currently unable to predict whether such changes will occur. If such changes are enacted or implemented, we are currently unable to predict the ultimate impact on our business. We urge our investors to consult with their legal and tax advisors with respect to any changes in tax law and the potential tax consequences of investing in our common stock.
Our business, operating results and growth rates may be adversely affected by current or future unfavorable economic and market conditions and adverse developments with respect to financial institutions and associated liquidity risk.
Our business depends on the economic health and general willingness of our current and prospective end- customers to make those capital commitments necessary to purchase our products. If the conditions in the U.S. and global economies become uncertain or volatile, or if they deteriorate, including as a result of the current or anticipated impact of military conflict, political unrest, regional tensions, and global and regional, terrorism or other geopolitical events, our business, operating results and financial condition may be materially adversely affected. Economic weakness, end-customer financial difficulties, inflation and increases in interest rates, limited availability of credit, liquidity shortages and constrained capital spending have at times in the past resulted, and may in the future result, in challenging and delayed sales cycles, slower adoption of new technologies and increased price competition, and could negatively affect our ability to forecast future periods, which could result in an inability to satisfy demand for our products and a loss of market share.
In addition, if interest rates rise or foreign exchange rates weaken for our international customers, overall demand for our products and services could decline and related capital spending may be reduced. Furthermore, any increase in worldwide commodity prices may result in higher component prices for us and increased shipping costs, both of which may negatively affect our business, operating results and financial condition.
In addition, the closures in 2023 of financial institutions and their placement into receivership with the FDIC created bank-specific and broader financial institution liquidity risk and concerns. Future adverse developments with respect to specific financial institutions or the broader financial services industry may lead to market-wide liquidity shortages, impair the ability of companies to access near-term working capital needs, and create additional market and economic uncertainty. There can be no assurance that future credit and financial market instability and a deterioration in confidence in economic conditions will not occur. Our general business strategy may be adversely affected by any such economic downturn, liquidity shortages, volatile business environment or continued unpredictable and unstable market conditions. If the equity and credit markets deteriorate, or if adverse developments are experienced by financial institutions, it may cause short-term liquidity risk and also make any necessary debt or equity financing more difficult, more costly, more onerous with respect to financial and operating covenants and more dilutive. Failure to secure any necessary financing in a timely manner and on favorable terms could have a material adverse effect on our growth strategy, financial performance and stock price and could require us to alter our operating plans. In addition, there is a risk that one or more of our current service providers, financial institutions, manufacturers, suppliers, customers and other partners may be adversely affected by the foregoing risks, which could directly affect our ability to attain our operating goals on schedule and on budget.
ITEM 1B. UNRESOLVED STAFF COMMENTS
None.
ITEM 1C. CYBERSECURITY
Cybersecurity Risk Management and Strategy
We use the CIS benchmarks as a guideline to strengthen our cybersecurity practices. This is intended to protect the confidentiality, integrity, and availability of our critical systems and information. Our adoption of the CIS benchmarks is a helpful baseline for potential future alignment with internationally recognized frameworks such as NIST Cybersecurity Framework, or ISO 27001.
Integration with Enterprise Risk Management
Our cybersecurity risk management program is integrated into our enterprise risk management framework. It shares methodologies, reporting channels, and governance processes applied across other risk domains, including legal, compliance, strategic, operational, and financial risks.
Core Components of the Cybersecurity Risk Management Program
Our program includes the following:
•Risk Assessments: Conducting risk capacity evaluations, pressure tests, and gap analyses while formalizing risk tolerance.
•Security Team: A team dedicated to managing cybersecurity risks, implementing security controls, and responding to incidents.
•External Expertise: Engaging third-party providers to evaluate, test, and enhance aspects of our security controls.
•Cybersecurity Awareness Training: Ongoing training for employees, incident response personnel, and senior leadership.
•Third-Party Risk Management: Assessing and monitoring vendors, suppliers, and service providers to mitigate risks to our organization.
Material Cybersecurity Risk Assessment
We have recently completed an IT Audit of our China Office as part of our broader cybersecurity risk management efforts. This audit identified certain gaps in our systems, processes, and controls specific to our operations in China. These gaps do not indicate the presence of any known cybersecurity threats or incidents, but they highlight areas for improvement to strengthen our overall cybersecurity posture.
We are actively and diligently working to address and mitigate these gaps by enhancing our security controls and aligning them with our enterprise-wide cybersecurity strategy. This proactive approach ensures that our systems remain resilient and secure in an evolving regulatory and operational environment.
At this time, no cybersecurity threats or incidents have been identified that have materially affected or are reasonably likely to materially affect our operations, business strategy, results, or financial condition.
Cybersecurity Governance
Our board of directors considers cybersecurity risk as part of its risk oversight function and has delegated to the audit committee of our board of directors (Audit Committee) oversight of cybersecurity and other information technology risks. The Audit Committee oversees management’s implementation of our cybersecurity risk management program.
Management updates the Audit Committee and executives as necessary, regarding any material cybersecurity incidents, as well as any incidents with lesser impact potential.
Our management team, including the CTO and IT Manager, is responsible for assessing and managing our material risks from cybersecurity threats. The team has primary responsibility for our overall cybersecurity risk management program and supervises both our internal cybersecurity personnel and our retained external cybersecurity consultants.
Our management team has several years of experience and has been trained for various roles in information technology and cybersecurity at numerous technology companies. The team supervises efforts to prevent, detect, mitigate, and remediate cybersecurity risks and incidents through various means, which may include:
•Briefings from internal security personnel;
•Threat intelligence and information obtained from governmental, public, or private sources, including external consultants engaged by us; and
•Alerts and reports produced by security tools deployed in our IT environment.
ITEM 2. PROPERTIES
Our corporate headquarters occupy approximately 11,200 square feet in San Diego, California, under a lease that expires in September 2031. Our NimbeLink facility, located in Plymouth, Minnesota, occupies 9,000 square feet under a lease that expires in June 2025. We utilize a 5,200 square foot research, development, and test facility in Scottsdale, Arizona, under a lease that expires in February 2025. We utilize a 3,000 square foot warehouse in Scottsdale, Arizona, under a lease that expires in February 2028. For testing services, we lease a 4,100 square foot property in Vero Beach, Florida, and a 3,500 square foot property in Jonestown, Texas.
We lease an office space in four locations outside of the United States including leases in Shenzhen, China; Jiangsu Province, China; Zhubei City, Taiwan; and Cambridge, United Kingdom.
We believe our facilities are suitable and sufficient to meet our current operating needs.
ITEM 3. LEGAL PROCEEDINGS
From time to time, we may be a party to legal proceedings and subject to claims incident in the ordinary course of business. Although the results of litigation and claims cannot be predicted with certainty, we believe that the final outcome of these matters will not have a material adverse effect on our financial condition or business. Regardless of the outcome, litigation can have an adverse impact on us because of defense and settlement costs, diversion of management resources, and other factors.
ITEM 4. MINE SAFETY DISCLOSURES
Not applicable.
PART II
ITEM 5. MARKET FOR REGISTRANT’S COMMON EQUITY, RELATED STOCKHOLDER MATTERS AND ISSUER PURCHASES OF EQUITY SECURITIES
Market Information
Our common stock is listed on the Nasdaq Capital Market under the symbol “AIRG”.
Holders of Common Stock
As of February 20, 2025, there were 11,558,901 shares of our common stock outstanding held by approximately 27 holders of record of our common stock. This number was derived from our shareholder records and does not include beneficial owners of our common stock whose shares are held in the name of various dealers, clearing agencies, banks, brokers and other fiduciaries.
Dividend Policy
We have never declared or paid cash dividends on our common stock. We currently intend to retain all available funds and any future earnings for use in the operation of our business and do not anticipate paying any cash dividends on our common stock in the near future. Any future determination to declare dividends will be made at the discretion of our board of directors and will depend on our financial condition, operating results, capital requirements, general business conditions and other factors that our board of directors may deem relevant and subject to the restrictions contained in any loan or financing instruments.
Equity Compensation Plan Information
See Part III, Item 12, “Security Ownership of Certain Beneficial Owners and Management and Related Stockholder Matters” for information regarding securities authorized for issuance under equity compensation plans.
Unregistered Sales of Equity Securities
None.
Issuer Repurchases of Equity Securities
None.
ITEM 6. [Reserved]
380
ITEM 7. MANAGEMENT’S DISCUSSION AND ANALYSIS OF FINANCIAL CONDITION AND RESULTS OF OPERATIONS
You should carefully consider the following risk factors, together with the other information contained in this annual report on Form 10-K, including our financial statements and the related notes and “Management’s Discussion and Analysis of Financial Condition and Results of Operations,” before deciding to purchase or sell shares of our common stock. We cannot assure you that any of the events discussed in the risk factors below will not occur. These risks could have a material and adverse impact on our business, results of operations, financial condition and growth prospects. If that were to happen, the trading price of our common stock could decline. Additional risks and uncertainties not presently known to us or that we currently deem immaterial also may impair our business operations or financial condition.
Business Overview
Headquartered in San Diego, California, Airgain, Inc. (NASDAQ: AIRG) is a leading provider of advanced wireless connectivity solutions that drive cutting-edge innovation in 5G technology. We are committed to delivering high-performance, cost-effective, and energy-efficient wireless solutions that enable rapid market deployment. Our mission is to connect the world through integrated, innovative, and optimized wireless solutions. Our diverse product portfolio serves three primary markets: enterprise, automotive, and consumer.
Our enterprise products include Smart Network Controlled Cellular Repeaters (Smart NCRs), fixed wireless access (FWA) devices, asset tracking solutions, embedded cellular modems, and antennas for access points and Internet of Things (IoT) applications. Our automotive products include our second generation AirgainConnect® Fleet system solution – a low profile, roof-mounted, all-in-one 5G vehicle gateway – and aftermarket antennas. Our consumer products include embedded antennas for consumer access points, wireless gateways, smart home devices and FWA devices.
We have a rich history of providing radio frequency (RF) expertise, services, and solutions to mobile operators and major original equipment manufacturers (OEMs). We expanded our current portfolio of embedded cellular modems, asset tracking solutions and custom IoT systems with advanced 5G connectivity solutions, including our AirgainConnect Fleet vehicle gateway, Smart Network Controlled Cellular Repeaters, and FWA system solutions. We are leveraging our RF and systems experience, and our Mobile Network Operator (MNO) and Multiple Service Operator (MSO) relationships to deliver complex and differentiated system solutions.
Core Markets
The enterprise market requires reliable wireless access across various use cases, including smart cities, utilities, factories, buildings, campuses, transportation hubs, stadiums, and suburban developments. Our Lighthouse smart repeater platform consists of a high-power large area indoor and outdoor network repeater for MNOs and systems integrators. Our outdoor 5G LanternTM FWA device is designed to address 5G connectivity challenges, reduce deployment costs and enhance customer experiences. Our asset tracking solutions are deployed across transportation, supply chain, and other specialized applications. In addition to hardware, our asset tracking solution includes a recurring revenue component, our subscription-based NLink cloud-based device enablement platform, which allows for deployment and integration with enterprise systems via open application programming interfaces (API). Our NimbeLink embedded modems serve numerous enterprise IoT sectors requiring cellular connectivity such as packaging, logistics, EV charging, smart cities, smart buildings, agriculture, asset tracking, and self-service innovations. Our custom products feature joint engineering collaboration with strategic customers to develop industrial IoT products (IIoT) for specific applications while helping them reduce their time to market. Our enterprise IoT and machine-to-machine (M2M) antennas are extensively deployed in diverse systems, products, and applications, including access points, gateways, FWA devices and utility meters.
In the automotive market, our products are deployed in a wide range of vehicles in the fleet and aftermarket applications, supporting a variety of technologies that include 5G, LTE, Wi-Fi, LPWAN, GNSS, and Bluetooth. Fleet and aftermarket products in the automotive market typically consist of applications where vehicular wireless routers are paired with external antenna systems to provide connectivity to mobile assets. In the third quarter of 2024, we expanded our product offering with our second generation AirgainConnect® Fleet (AC-Fleet) system solution – a low profile, roof-mounted, all-in-one 5G vehicle gateway – that provides 4G/5G cellular connectivity with built-in multi-profile eSIM, GPS, Wi-Fi, and gigabit ethernet router functionalities. We also offer a full line of external fleet antennas that are designed to be rugged, reliable, and flexible to meet almost any need. These antennas include
high-performance and low-profile versions that mount on the roof, trunk, windshield, or dashboard and are optimized for 5G, 4G, Wi-Fi, and GNSS.
The consumer market represents a vast audience utilizing wireless-enabled devices. Our embedded antennas are deployed in various consumer applications including access points, wireless gateways, FWA devices, Wi-Fi routers and extenders, smart TVs, smart home devices, and set-top boxes. These consumer products support a variety of technologies, products and services, including 4G/LTE, 5G, Wi-Fi, Bluetooth, LPWAN and GNSS (Global Navigation Satellite System).
Macroeconomic conditions
Macroeconomic conditions have continued to create demand softness in certain markets. While our sales grew by 8% year-over-year, we experienced a demand softness combined with excess inventories in our channels and our direct customers, in our existing markets. While we are experiencing a market recovery with our consumer customers, we anticipate the inventory surplus some of our enterprise and automotive customers have may extend into the first half of 2025. We believe the previously broad demand softness that we experienced in 2023 has become more product and customer specific, as the industry re-calibrates to optimal inventory levels. We remain focused on the execution of our strategic product initiatives and operational efficiencies, which lay the foundation of our revenue and profitability growth when market conditions improve.
Factors Affecting Our Operating Results
We believe that our performance and future success depend upon several factors including macro-economic and geopolitical uncertainties, import/export controls and trade policies of the United States and other countries, the impact of inflation on consumer spending, and our ability to transition from a component provider to a wireless systems provider and to develop technology leadership and expand our markets.
Our performance and future success also depend on factors such as continued investments in our growth, our ability to expand into growing addressable markets, including enterprise, automotive, and consumer, our ability to develop, market and sell advanced systems solutions that meet our customers’ requirements, the average selling prices of our products and solutions, and manufacturing costs. Our customers are price conscious, and our operating results are affected by pricing pressure which may force us to lower prices below our established list prices. Our ability to maintain or increase our sales depends on, among other things:
•new and existing end customers selecting our solutions for their wireless devices and networks;
•investments in our growth to address customer needs;
•timely development of our differentiated product offerings and technology solutions;
•our ability to target new end markets;
•the proliferation of Wi-Fi connected home devices and data intensive applications;
•the impact of global supply shortages on our business and that of our end customers;
•international expansion in light of continuing global tensions; and
•the ability to successfully integrate past and any future acquisitions
In addition, inflation generally affects us by increasing our raw material and employee-related costs and other expenses. Our financial condition and results of operations may also be impacted by other factors we may not be able to control, such as uncertain global economic conditions, pandemics and epidemics, global trade disputes or political instability, as well as conflicts around the world. We do not believe that such factors had a material adverse impact on our results of operations during 2024.
While each of these areas presents significant opportunities for us, they also pose significant risks and challenges we must successfully address. We discuss many of these risks, uncertainties and other factors in greater detail in the section entitled “Risk Factors” included in Item 1A of this annual report on Form 10-K.
Our operating results historically have not been subject to significant seasonal variations. Although it is difficult to make broad generalizations, our sales tend to be lower in the first quarter of each year compared to other quarters due to the Lunar New Year. Results for any quarter may not be indicative of the results that may be achieved for the full fiscal year and these patterns may change because of general customer demand or product cycles.
Our financial highlights for 2024 include the following:
•Sales increased by 8.1% in 2024 compared to 2023. The increase in sales was primarily driven by the enterprise and consumer markets.
•Gross profit as a percentage of sales increased to 40.9% in 2024 compared to 37.1% in 2023. The increase was primarily due to improved automotive and enterprise product margins rate.
•Loss from operations decreased by $3.5 million in 2024 compared to 2023. The decrease in the loss from operations was primarily due to an increase of $4.0 million in gross profit on higher sales.
•Our effective tax rate for each year was 2% and -1% in 2024 and in 2023, respectively.
•We ended 2024 with cash and cash equivalents and restricted cash totaling $8.6 million, which is a $0.6 million increase from the prior year.
Key Components of Our Results of Operations and Financial Condition
Sales
We primarily generate revenue from the sales of our products. We recognize revenue to depict the transfer of control over promised goods or services to customers in an amount that reflects the consideration to which the entity expects to be entitled for those goods or services. We generally recognize product sales at the time of shipment to our customers, provided that all other revenue recognition criteria have been met. We also generate service revenue from agreements to provide design, engineering, and testing services as well as subscription revenue from the sale of data plans.
Cost of Goods Sold
The cost of goods sold reflects the cost of producing antenna, embedded modem and system solutions products that are shipped to our customers as well as costs incurred for service agreements. This primarily includes manufacturing costs of our products payable to our third-party CMs. The cost of goods sold that we generate from services and subscription revenues primarily includes personnel costs and the cost to maintain data lines.
Operating Expenses
Our operating expenses are classified into three categories: research and development, sales and marketing, general and administrative. The largest component of expense is personnel costs, which includes salaries, employee benefit costs, bonuses, and stock-based compensation. Operating expenses also include allocated overhead costs for depreciation of equipment, facilities and information technology. Allocated costs for facilities consist of amortization of leasehold improvements as well as rent and utility expenses and taxes. Operating expenses are generally recognized as incurred.
Research and Development. Research and development expenses primarily consist of personnel and project development costs. These expenses include work related to the design, development and testing of system solutions and components. These expenses include salaries, stock-based compensation, benefits, bonuses, project development and testing, prototype material, consulting, travel, and similar costs, and depreciation and allocated costs for certain facilities. We expect research and development expenses to increase in absolute dollars in future periods as we continue to invest in the development of advanced system solutions, although our research and development expense may fluctuate as a percentage of total sales.
Sales and Marketing. Sales and marketing expenses primarily consist of personnel and facility-related costs for our sales, marketing, and business development personnel, stock-based compensation and bonuses earned by our sales personnel, and commissions earned by our third-party sales representative firms. Sales and marketing expenses also include the costs of trade shows, advertising, marketing programs, promotional materials, demonstration equipment, travel, and allocated costs for certain facilities. We expect sales and marketing expenses to increase in absolute dollars in future periods as we continue to market and sell our advanced system solutions globally, although our sales and marketing expense may fluctuate as a percentage of total sales.
General and Administrative. General and administrative expenses primarily consist of personnel and facility related costs for our executive, legal, human resource finance, and administrative personnel, including stock-based compensation, as well as legal, accounting, other professional services fees, depreciation and intangible
amortization, and other corporate expenses. We expect general and administrative expenses to fluctuate as we grow our operations.
Other (Income) Expense
Interest Income, net. Interest income consists of interest from our cash and cash equivalents offset by interest expense which consists of interest charges on credit card charges and certain vendor bills.
Other Expense (Income), net. Other expense and income consists of realized foreign exchange gains or losses, state franchise tax benefit, and other income.
Provision for Income Taxes
Provision for income taxes consists of federal and state income taxes. In assessing the realizability of deferred tax assets, management considers whether it is more likely than not that some portion or all of the deferred tax assets will not be realized. The ultimate realization of deferred tax assets is dependent upon the generation of future taxable income during the periods in which those temporary differences become deductible. Management considers the scheduled reversal of deferred tax liabilities (including the impact of available carryback and carryforward periods), projected future taxable income, and tax-planning strategies in making this assessment. It is difficult for us to project future taxable income as the timing and size of sales of our products are variable and difficult to predict. We concluded that it is not more likely than not that we will utilize our deferred tax assets other than those that are offset by reversing temporary differences.
Results of Operations
The following tables set forth our operating results for the periods presented and as a percentage of our total sales for those periods. The period-to-period comparison of financial results is not necessarily indicative of financial results to be achieved in future periods.
| | | | | | | | | | | | | | | | |
Statements of Operations Data (dollars in thousands) | | For the Years Ended December 31, | |
| | 2024 | | | 2023 | | | 2024 | | | 2023 | |
Sales | | $ | 60,599 | | | $ | 56,040 | | | | 100.0 | % | | | 100.0 | % |
Cost of goods sold | | | 35,797 | | | | 35,277 | | | | 59.1 | | | | 62.9 | |
Gross profit | | | 24,802 | | | | 20,763 | | | | 40.9 | | | | 37.1 | |
Operating expenses: | | | | | | | | | | | | |
Research and development | | | 11,864 | | | | 10,505 | | | | 19.5 | | | | 18.7 | |
Sales and marketing | | | 9,203 | | | | 9,126 | | | | 15.2 | | | | 16.3 | |
General and administrative | | | 12,663 | | | | 13,532 | | | | 20.9 | | | | 24.2 | |
Total operating expenses | | | 33,730 | | | | 33,163 | | | | 55.6 | | | | 59.2 | |
Loss from operations | | | (8,928 | ) | | | (12,400 | ) | | | (14.7 | ) | | | (22.1 | ) |
Other income, net | | | (88 | ) | | | (100 | ) | | | (0.1 | ) | | | 0.2 | |
Loss before income taxes | | | (8,840 | ) | | | (12,300 | ) | | | (14.6 | ) | | | (21.9 | ) |
Income tax (benefit) expense | | | (152 | ) | | | 128 | | | | (0.3 | ) | | | 0.3 | |
Net loss | | $ | (8,688 | ) | | $ | (12,428 | ) | | | (14.3 | )% | | | (22.2 | )% |
Comparison of the Years Ended December 31, 2024 and 2023
(all tables—dollars in thousands)
| | | | | | | | | | | | | | | | |
Sales | | For the Years Ended December 31, | |
| | 2024 | | | 2023 | | | $ Change | | | % Change | |
Sales | | $ | 60,599 | | | $ | 56,040 | | | $ | 4,559 | | | | 8.1 | % |
Sales for 2024 increased $4.6 million, or 8.1% compared to 2023. Consumer market sales increased $2.8 million to $21.7 million for 2024 from $18.9 million for 2023, driven by higher sales to cable and mobile network operators. Enterprise market sales increased $2.3 million, to $29.5 million for 2024 from $27.2 million for 2023, primarily
driven by higher embedded modems sales. Automotive market sales decreased $0.5 million to $9.4 million for 2024, from $9.9 million for 2023, due to lower Aftermarket sales, partially offset by shipments of AirgainConnect Fleet.
| | | | | | | | | | | | | | | | |
Cost of Goods Sold | | For the Years Ended December 31, | |
| | 2024 | | | 2023 | | | $ Change | | | % Change | |
Cost of goods sold | | $ | 35,797 | | | $ | 35,277 | | | $ | 520 | | | | 1.5 | % |
Cost of goods sold for 2024 increased $0.5 million or 1.5% compared to 2023. The increase was due to higher sales, partially offset by improved automotive and enterprise product margin rates.
| | | | | | | | | | | | | | | | |
Gross Profit | | For the Years Ended December 31, | |
| | 2024 | | | 2023 | | | $ Change | | | % Change | |
Gross profit | | $ | 24,802 | | | $ | 20,763 | | | $ | 4,039 | | | | 19.5 | % |
Gross profit (percentage of sales) | | | 40.9 | % | | | 37.1 | % | | | | | | 3.8 | % |
Gross profit for 2024 increased $4.0 million, or 19.5%, compared to 2023 primarily due to improved automotive and enterprise product margin rates.
Gross profit as a percentage of sales for 2024 increased by 380 basis points compared to 2023.
| | | | | | | | | | | | | | | | |
Operating Expenses | | For the Years Ended December 31, | |
| | 2024 | | | 2023 | | | $ Change | | | % Change | |
Research and development | | $ | 11,864 | | | $ | 10,505 | | | $ | 1,359 | | | | 12.9 | % |
Sales and marketing | | | 9,203 | | | | 9,126 | | | | 77 | | | | 0.8 | % |
General and administrative | | | 12,663 | | | | 13,532 | | | | (869 | ) | | | (6.4 | )% |
Total operating expenses | | $ | 33,730 | | | $ | 33,163 | | | $ | 567 | | | | 1.7 | % |
Operating expenses for 2024 increased $0.6 million or 1.7% compared to 2023. The increase was due to higher engineering expenses developing the company’s product roadmap, partially offset by lower general and administrative expenses driven by operational efficiencies.
| | | | | | | | | | | | | | | | |
Other (income) expense: | | For the Years Ended December 31, | |
| | 2024 | | | 2023 | | | $ Change | | | % Change | |
Interest income, net | | $ | (115 | ) | | $ | (109 | ) | | $ | (6 | ) | | | 5.5 | % |
Other expense, net | | | 27 | | | | 9 | | | | 18 | | | | 200.0 | |
Total other income, net | | $ | (88 | ) | | $ | (100 | ) | | $ | 12 | | | | (12.0 | )% |
Other expenses for 2024 and 2023 consists primarily of unfavorable foreign currency transaction remeasurement adjustments.
Income Tax Expense
| | | | | | | | | | | | | | | | |
| | For the Years Ended December 31, | |
| | 2024 | | | 2023 | | | $ Change | | | % Change | |
Income tax (benefit) expense | | $ | (152 | ) | | $ | 128 | | | $ | (280 | ) | | | (218.8 | )% |
Income tax benefit for 2024 increased $0.3 million or 218.8%, compared to 2023 primarily due to a decrease in foreign income tax accrual.
Liquidity and Capital Resources
We had cash and cash equivalents of $8.5 million at December 31, 2024. Each year from 2013 through 2024, we have incurred net losses. As a result, we have an accumulated deficit of $87.2 million at December 31, 2024.
We plan to continue to invest for long-term growth, including expanding our engineering and sales teams to execute on our product roadmap and further penetrate domestic and international markets. We anticipate that these investments will continue to increase in absolute dollars. We believe that our existing cash and cash equivalents balance will be sufficient to meet our working capital requirements for at least the next 12 months.
The following table presents a summary of our cash flow activity for the periods set forth below (in thousands):
| | | | | | | | |
| | Twelve months ended December 31, | |
| | 2024 | | | 2023 | |
Net cash used in operating activities | | $ | (3,527 | ) | | $ | (3,301 | ) |
Net cash used in investing activities | | | (178 | ) | | | (346 | ) |
Net cash provided by (used in) financing activities | | | 4,301 | | | | (458 | ) |
Effect of foreign currency exchange rate changes on cash, cash equivalents and restricted cash | | | (7 | ) | | | 3 | |
Net increase (decrease) in cash, cash equivalents and restricted cash | | $ | 589 | | | $ | (4,102 | ) |
Net Cash Used in Operating Activities.
Net cash used in operating activities was $3.5 million for the year ended December 31, 2024. The cash decrease was primarily driven by the net loss of $8.7 million, and by a $3.2 million net increase of operating assets and liabilities, offset by $8.4 million in non-cash expenses.
Net Cash Used in Investing Activities.
Net cash used in investing activities of $0.2 million for the year ended December 31, 2024 was primarily for purchases of property and equipment.
Net Cash provided by Financing Activities.
Net cash used in financing activities of $4.3 million for the year ended December 31, 2024 was primarily from $4.1 million of net proceeds after fees and expenses from the issuance of approximately 760,000 shares of common stock via our ATM offering program. Additionally, we received $0.3 million from the proceeds of common stock issuances under the ESPP and equity option exercises. These proceeds were partially offset by $0.1 million tax payments for net share settlement of restricted stock units.
Employee Retention Credit
On March 27, 2020, the Coronavirus Aid, Relief, and Economic Security Act (CARES Act) was signed into law providing an employee retention credit (ERC), which is a refundable tax credit against certain employment taxes on qualified wages. The Taxpayer Certainty and Disaster Tax Relief Act of 2020, the American Rescue Plan Act of 2021 and the Infrastructure Investment and Jobs Act amended the qualifications for eligible employers who could apply and extended the availability of the ERC employment taxes on qualified wages paid after December 31, 2020 through September 30, 2021. We believe that we qualify for application of the ERC on qualified wages from the second quarter of 2020 through the third quarter of 2021.
We applied for ERC refunds in 2023, totaling $2.5 million, net of professional fees. In January 2025, we received refunds of $1.4 million, net of professional fees, plus an additional $0.2 million for interest. There is no assurance that we will ultimately receive the remaining refund balance, or the timeframe of any such receipt, based on IRS review or otherwise. As of December 31, 2024, we have not recognized the ERC in our financial statements.
At-the-Market Sales Agreement
On March 7, 2024, the Company entered into an At-the-Market Issuance Sales Agreement (the Sales Agreement) with Craig-Hallum Capital Group LLC (Craig-Hallum). Pursuant to the Sales Agreement, the Company may sell at its option, up to an aggregate of $5.0 million in shares of its common stock through Craig-Hallum, as sales agent. Subject to the terms and conditions of the Sales Agreement, Craig-Hallum may sell the shares, if any, only by methods deemed to be an “at the market” offering as defined in Rule 415(a)(4) promulgated under the Securities Act of 1933, as amended. The Company has agreed to pay Craig-Hallum a sales commission of 3.0% of the gross proceeds for sales under the Sales Agreement.
The Company is not obligated to sell, and Craig-Hallum is not obligated to buy or sell, any shares of common stock under the Sales Agreement. No assurance can be given that the Company will sell any additional shares of
common stock under the Sales Agreement, or, if it does, as to the price or amount of shares of common stock that the Company may sell or the dates when such sales will take place. During the year ended December 31, 2024, 760,000 shares of common stock were issued pursuant to the Sales Agreement for net proceeds of $4.1 million, after deducting commissions. As of December 31, 2024, $0.5 million remains available under the Sales Agreement for future sales of the Company’s common stock.
Lease Modification
On December 31, 2024, the Company entered into a Third Amendment (Lease Amendment) to the Office Lease, relating to the Company’s corporate headquarters in San Diego, California. The Lease Amendment extends the term for the Lease from the prior expiration on November 30, 2025 to its new expiration on September 30, 2031. There is no right to further extend the term of the Lease. The Lease Amendment provides that the annual base rent for the leased space shall be $699,051, or $58,254 on a monthly basis for the 12-month period beginning January 1, 2025, which amount shall increase 3% annually beginning on January 1, 2026. The Company is entitled to base rent abatement beginning on January 1, 2025 through October 31, 2025.
Since an implicit rate of the lease was not available and having limited comparative information, the Company engage a valuation specialist to develop a methodology to estimate the incremental borrowing rate (IBR) to calculate the present value of future lease payments. The IBR was developed using quantitative analysis that involved developing an unsecured credit rating, determining a collateral adjustment, and applying a debt yield curve.
For more details of the headquarter lease modification, see exhibit 10.23 filed with the Company’s Annual Report on Form 10-K for the fiscal year ending December 31, 2024.
Liquidity and Capital Resources Assessment
As of December 31, 2024, management performed the annual assessment of the Company's ability to meet its obligations as they become due within one year based on relevant conditions and events that are known and reasonably knowable. Following ASC 205-40 guidance, management considered quantitative and qualitative information to evaluate the Company's ability to meet obligations. Based on the analysis of the relevant conditions and events that are known and reasonably known as of December 31, 2024, the Company concluded that it is probable that it will be able to meet all of its financial obligations as they become due in the next twelve months.
The relevant conditions and events that are known and reasonably known as of February 27, 2025 related to the Company have not significantly changed since December 31, 2024. Therefore, the resulting cash inflows along with the existing funds are expected to be sufficient for the Company’s financial obligations as they become due in the next twelve months.
Critical Accounting Estimates
Our management’s discussion and analysis of financial condition and operating results is based on our consolidated financial statements, which have been prepared in accordance with GAAP. The preparation of these consolidated financial statements requires us to make estimates and assumptions that affect the reported amounts of assets and liabilities and the disclosure of contingent assets and liabilities at the date of the consolidated financial statements, as well as the reported sales and expenses during the reporting periods. These items are monitored and analyzed by us for changes in facts and circumstances, and material changes in these estimates could occur in the future. We base our estimates on historical experience and on various other factors that we believe are reasonable under the circumstances, the results of which form the basis for making judgments about the carrying value of assets and liabilities that are not readily apparent from other sources. Changes in estimates are reflected in reported results for the period in which they become known. Actual results may differ materially from these estimates under different assumptions or conditions.
Inventory Valuation
Inventory is stated at the lower of cost or net realizable value (first-in, first-out method). For items manufactured by third parties, cost is determined using the first-in, first-out method (FIFO). For items that are manufactured by the Company's CMs, cost is determined using the weighted average cost method. We write-down inventory when it has been determined that conditions exist that may not allow the inventory to be sold for at the intended price or the inventory is determined to be obsolete based on assumption about future demand and market conditions. The charge related to inventory write-downs is recorded as cost of goods sold. We evaluate inventory at least annually
and at other times during the year. Charges to cost of goods sold for excess, obsolete, and lower of cost or net realizable inventories totaled $0.8 million and $1.2 million in 2024 and 2023, respectively.
Stock-Based Compensation
The assumptions used in calculating the fair value of stock-based payment awards represent management’s best estimates. These estimates involve inherent uncertainties and the application of management’s judgment. If factors change and different assumptions are used, our stock-based compensation expense could be materially different in the future.
Stock-based compensation expense is measured and recognized in the consolidated financial statements based on the fair value of the awards granted. We use the Black-Scholes option-pricing model to estimate the fair value of our stock-based awards including: stock options and employee stock purchase plan (ESPP). This valuation model requires the input of highly subjective assumptions, the most significant of which is our estimates of expected volatility and the forfeiture rate of the award. We determine volatility by solely using the Company’s own historical volatility measurements from the time the Company traded public publicly. The forfeiture of stock awards is recognized upon the actual forfeitures date.
We estimate the fair value of Performance Stock Units (PSU) with a market condition using a Monte Carlo simulation model as of the date of grant to forecast performance achievement of market price and revenue targets. Key inputs in the valuation include cost of capital, market price volatility and discount rate. The number of PSUs that will ultimately be awarded are contingent on our actual level of achievement compared to the corporate financial target performance targets.
Goodwill and Other Intangible Assets
We have a significant amount of goodwill and finite-lived intangible assets. At December 31, 2024, the Company's goodwill and intangible assets totaled $16.6 million, or 34% of our total assets.
Our intangible assets were obtained from business combinations, such as goodwill, customer relationships, developed technologies, market related intangibles and non-compete covenants. The intangible assets were initially recorded at estimated fair value. We amortize the non-goodwill intangibles over an estimated life of 2 to 11 years, using the straight-line method.
These assets are carried at the estimated fair value at the time of acquisition and assets. However, if their estimated fair value is less than the carrying amount, we would recognize an impairment charge for the amount by which the carrying amount of these assets exceeds their estimated fair value.
Goodwill
We perform a goodwill impairment assessment annually and during the interim when events or circumstances indicates that the fair value of a reporting unit might be below its carrying amount. The analysis may include both qualitative and quantitative factors to assess the likelihood of an impairment. Qualitative factors include industry and market considerations, overall financial performance, and other relevant events. Our quantitative impairment test may consider both the income approach and the market approach to estimate a reporting unit's fair value. Significant estimates include market segment growth rates, our assumed market segment share, estimated costs, and discount rates on the cost of capital.
The Company evaluated qualitative factors for goodwill impairment as of December 31, 2024. The Company is expecting cash flows will be sufficient to meet its obligations in the next twelve months. Several factors indicates that macroeconomic and industry conditions have improved since December 31, 2023, including the Company's stock share value, annual sales total, working capital and gross margin. Raw material costs per unit slightly increased in 2024 and are expected to increase in the next twelve months, but we expect the favorable macroeconomic and industry factors to minimize effects of increasing raw material costs. After assessing the totality of events or circumstances, the Company determined that there were no events or circumstances as of December 31, 2024 that indicate that it is more likely than not that the fair value of a reporting unit may be less than its carrying amount.
Since there was no indication that it is more likely than not that the fair value of a reporting unit is less than its carrying amount, the Company determined that a quantitative goodwill impairment test was not necessary as of December 31, 2024. Based on the assessment performed, we concluded that an impairment charge to goodwill was not required as of December 31, 2024.
No impairment losses were recorded against the goodwill during each of the twelve months ended December 31, 2024 and 2023.
Other Intangible Assets
We perform an intangible assets impairment assessment annually and during the interim when facts and circumstances indicate that the carrying amount may not be recoverable. These reviews can be affected by various factors, including external factors such as industry and economic trends, and internal factors such as changes in our business strategy and our forecasts for product lines.
The Company performed an impairment test as of December 31, 2024 to determine the recoverability of the assets group by comparing the future undiscounted cash flows expected from the use of the asset group to the carrying value. The recoverability test indicated that the future expected cash flows will materially exceed the asset group carrying value. In addition, the Company determined that there were no other triggering events or circumstances to indicate that the carrying value of the finite-lived asset group may not be recoverable. Therefore, the Company did not proceed with the third step to determine the fair value of the intangible assets and compare fair value against the carrying value. Based on the assessment performed, we determined that the intangible asset carrying values are not impaired as of September 30, 2023 and the useful lives remain appropriate.
No impairment losses were recorded against the other intangibles during each of the twelve months ended December 31, 2024 and 2023.
Certain future events and circumstances, including adverse changes in the business and economic conditions and changes in customer behavior could result in changes to our assumptions and judgments used in the impairment tests. A downward revision of these assumptions could cause the total fair value of our goodwill and intangible assets to fall below carrying values and a non-cash impairment charge would be required. Such a charge may have a material effect on the consolidated financial statements.
Contractual Obligations and Commitments
We subcontract with other companies to manufacture our products. During the normal course of business, our CMs procure components based upon orders placed by us. If we cancel all or part of the orders, we may still be liable to the CMs for the cost of the components purchased by the subcontractors to manufacture our products. We periodically review the potential liability, and as of December 31, 2024, we have no significant accruals recorded.
ITEM 7A. QUANTITATIVE AND QUALITATIVE DISCLOSURES ABOUT MARKET RISK
We are a smaller reporting company as defined by Rule 12b-2 of the Securities Exchange Act of 1934 and are not required to provide the information under this item.
ITEM 8. FINANCIAL STATEMENTS AND SUPPLEMENTARY DATA
Airgain, Inc.
Index to Financial Statements
REPORT OF INDEPENDENT REGISTERED PUBLIC ACCOUNTING FIRM
Board of Directors and Shareholders
Airgain, Inc
Opinion on the financial statements
We have audited the accompanying consolidated balance sheets of Airgain, Inc. (a Delaware corporation) and subsidiaries (the “Company”) as of December 31, 2024 and 2023, the related consolidated statements of operations, comprehensive loss, stockholders’ equity, and cash flows for each of the two years in the period ended December 31, 2024, and the related notes (collectively referred to as the “consolidated financial statements”). In our opinion, the consolidated financial statements present fairly, in all material respects, the financial position of the Company as of December 31, 2024 and 2023, and the results of its operations and its cash flows for each of the two years in the period ended December 31, 2024, in conformity with accounting principles generally accepted in the United States of America.
Basis for opinion
These consolidated financial statements are the responsibility of the Company’s management. Our responsibility is to express an opinion on the Company’s consolidated financial statements based on our audits. We are a public accounting firm registered with the Public Company Accounting Oversight Board (United States) (“PCAOB”) and are required to be independent with respect to the Company in accordance with the U.S. federal securities laws and the applicable rules and regulations of the Securities and Exchange Commission and the PCAOB.
We conducted our audits in accordance with the standards of the PCAOB. Those standards require that we plan and perform the audit to obtain reasonable assurance about whether the financial statements are free of material misstatement, whether due to error or fraud. The Company is not required to have, nor were we engaged to perform, an audit of its internal control over financial reporting. As part of our audits, we are required to obtain an understanding of internal control over financial reporting but not for the purpose of expressing an opinion on the effectiveness of the Company’s internal control over financial reporting. Accordingly, we express no such opinion.
Our audits included performing procedures to assess the risks of material misstatement of the financial statements, whether due to error or fraud, and performing procedures that respond to those risks. Such procedures included examining, on a test basis, evidence regarding the amounts and disclosures in the financial statements. Our audits also included evaluating the accounting principles used and significant estimates made by management, as well as evaluating the overall presentation of the financial statements. We believe that our audits provide a reasonable basis for our opinion.
Critical audit matters
Critical audit matters are matters arising from the current period audit of the consolidated financial statements that were communicated or required to be communicated to the audit committee and that: (1) relate to accounts or disclosures that are material to the financial statements and (2) involved our especially challenging, subjective, or complex judgments. We determined that there are no critical audit matters.
/s/ GRANT THORNTON LLP
We have served as the Company’s auditor since 2022.
San Diego, California
February 27, 2025
Airgain, Inc.
Consolidated Balance Sheets
(in thousands, except par value)
| | | | | | | | |
| | As of December 31, | |
| | 2024 | | | 2023 | |
Assets | | | | | | |
Current assets: | | | | | | |
Cash and cash equivalents | | $ | 8,510 | | | $ | 7,881 | |
Trade accounts receivable, net | | | 11,671 | | | | 7,375 | |
Inventories | | | 3,952 | | | | 2,403 | |
Prepaid expenses and other current assets | | | 1,698 | | | | 1,422 | |
Total current assets | | | 25,831 | | | | 19,081 | |
Property and equipment, net | | | 1,993 | | | | 2,507 | |
Leased right-of-use assets | | | 3,901 | | | | 1,392 | |
Goodwill | | | 10,845 | | | | 10,845 | |
Intangible assets, net | | | 5,799 | | | | 8,234 | |
Other assets | | | 74 | | | | 170 | |
Total assets | | $ | 48,443 | | | $ | 42,229 | |
Liabilities and stockholders’ equity | | | | | | |
Current liabilities: | | | | | | |
Accounts payable | | $ | 9,499 | | | $ | 6,472 | |
Accrued compensation | | | 2,041 | | | | 728 | |
Accrued liabilities and other | | | 1,872 | | | | 1,926 | |
Short-term lease liabilities | | | 89 | | | | 865 | |
Total current liabilities | | | 13,501 | | | | 9,991 | |
Deferred tax liability | | | 163 | | | | 151 | |
Long-term lease liabilities | | | 3,810 | | | | 674 | |
Total liabilities | | | 17,474 | | | | 10,816 | |
Commitments and contingencies (Note 13) | | | | | | |
Stockholders’ equity: | | | | | | |
Common stock and additional paid-in capital, par value $0.0001, 200,000 shares authorized; 12,070 shares issued and 11,529 shares outstanding at December 31, 2024; and 11,010 shares issued and 10,469 shares outstanding at December 31, 2023 | | | 123,546 | | | | 115,295 | |
Treasury stock, at cost: 541 shares at December 31, 2024 and 2023 | | | (5,364 | ) | | | (5,364 | ) |
Accumulated deficit | | | (87,209 | ) | | | (78,521 | ) |
Accumulated other comprehensive (loss) income | | | (4 | ) | | | 3 | |
Total stockholders’ equity | | | 30,969 | | | | 31,413 | |
Total liabilities and stockholders’ equity | | $ | 48,443 | | | $ | 42,229 | |
The accompanying notes are an integral part of these consolidated financial statements.
Airgain, Inc.
Consolidated Statements of Operations
(in thousands, except per share data)
| | | | | | | | |
| | For the Years Ended December 31, | |
| | 2024 | | | 2023 | |
Sales | | $ | 60,599 | | | $ | 56,040 | |
Cost of goods sold | | | 35,797 | | | | 35,277 | |
Gross profit | | | 24,802 | | | | 20,763 | |
Operating expenses: | | | | | | |
Research and development | | | 11,864 | | | | 10,505 | |
Sales and marketing | | | 9,203 | | | | 9,126 | |
General and administrative | | | 12,663 | | | | 13,532 | |
Total operating expenses | | | 33,730 | | | | 33,163 | |
Loss from operations | | | (8,928 | ) | | | (12,400 | ) |
Other (income) expense: | | | | | | |
Interest income, net | | | (115 | ) | | | (109 | ) |
Other expense, net | | | 27 | | | | 9 | |
Total other income, net | | | (88 | ) | | | (100 | ) |
Loss before income taxes | | | (8,840 | ) | | | (12,300 | ) |
Income tax (benefit) expense | | | (152 | ) | | | 128 | |
Net loss | | $ | (8,688 | ) | | $ | (12,428 | ) |
Net loss per share: | | | | | | |
Basic | | $ | (0.79 | ) | | $ | (1.20 | ) |
Diluted | | $ | (0.79 | ) | | $ | (1.20 | ) |
Weighted average shares used in calculating loss per share: | | | | | | |
Basic | | | 11,053 | | | | 10,392 | |
Diluted | | | 11,053 | | | | 10,392 | |
The accompanying notes are an integral part of these consolidated financial statements.
Airgain, Inc.
Consolidated Statements of Comprehensive Loss
(in thousands)
| | | | | | | | | |
| | | For the Years Ended December 31, | |
| | | 2024 | | | 2023 | |
Net loss | | | $ | (8,688 | ) | | $ | (12,428 | ) |
Other comprehensive income: | | | | | | | |
Foreign currency translation adjustment | | | | (7 | ) | | | 3 | |
Comprehensive loss | | | $ | (8,695 | ) | | $ | (12,425 | ) |
The accompanying notes are an integral part of these consolidated financial statements.
Airgain, Inc.
Consolidated Statements of Stockholders’ Equity
(in thousands)
| | | | | | | | | | | | | | | | | | | | | | | | | | | | |
| | Fiscal Years Ended December 31, | |
| | Common Stock And Additional Paid-In Capital | | | Treasury Stock | | | | | | | | | | |
| | Shares | | | Amount | | | Shares | | | Amount | | | Accumulated Other Comprehensive (Loss) Income | | | Accumulated
Deficit | | | Total
Stockholders’ Equity | |
Balance at December 31, 2022 | | | 10,767 | | | $ | 111,282 | | | | (541 | ) | | $ | (5,364 | ) | | $ | — | | | $ | (66,093 | ) | | $ | 39,825 | |
Net loss | | | — | | | | — | | | | — | | | | — | | | | — | | | | (12,428 | ) | | | (12,428 | ) |
Stock-based compensation | | | — | | | | 4,471 | | | | — | | | | — | | | | — | | | | — | | | | 4,471 | |
Common stock issued through restricted stock awards | | | 312 | | | | — | | | | — | | | | — | | | | — | | | | — | | | | — | |
Common stock withheld related to net share settlement of equity awards | | | (120 | ) | | | (690 | ) | | | — | | | | — | | | | — | | | | — | | | | (690 | ) |
Common stock issued under ESPP | | | 39 | | | | 204 | | | | — | | | | — | | | | — | | | | — | | | | 204 | |
Common stock issued through stock options | | | 12 | | | | 28 | | | | — | | | | — | | | | — | | | | — | | | | 28 | |
Foreign currency translation adjustments | | | — | | | | — | | | | — | | | | — | | | | 3 | | | | — | | | | 3 | |
Balance at December 31, 2023 | | | 11,010 | | | $ | 115,295 | | | | (541 | ) | | $ | (5,364 | ) | | $ | 3 | | | $ | (78,521 | ) | | $ | 31,413 | |
Net loss | | | — | | | | — | | | | — | | | | — | | | | — | | | | (8,688 | ) | | | (8,688 | ) |
Stock-based compensation | | | — | | | | 3,950 | | | | — | | | | — | | | | — | | | | — | | | | 3,950 | |
Common stock issued through restricted stock awards | | | 253 | | | | — | | | | — | | | | — | | | | — | | | | — | | | | — | |
Common stock withheld related to net share settlement of equity awards | | | (25 | ) | | | (94 | ) | | | — | | | | — | | | | — | | | | — | | | | (94 | ) |
Common stock issued under ESPP | | | 46 | | | | 152 | | | | — | | | | — | | | | — | | | | — | | | | 152 | |
Common stock issued through stock options | | | 26 | | | | 127 | | | | — | | | | — | | | | — | | | | — | | | | 127 | |
Foreign currency translation adjustments | | | — | | | | — | | | | — | | | | — | | | | (7 | ) | | | — | | | | (7 | ) |
Common stock issued in connection with at-the-market offerings, net | | | 760 | | | | 4,116 | | | | — | | | | — | | | | — | | | | — | | | | 4,116 | |
Balance at December 31, 2024 | | | 12,070 | | | $ | 123,546 | | | | (541 | ) | | $ | (5,364 | ) | | $ | (4 | ) | | $ | (87,209 | ) | | $ | 30,969 | |
The accompanying notes are an integral part of these consolidated financial statements.
Airgain, Inc.
Consolidated Statements of Cash Flows
(in thousands)
| | | | | | | | |
| | For the Years Ended December 31, | |
| | 2024 | | | 2023 | |
Cash flows from operating activities: | | | | | | |
Net loss | | $ | (8,688 | ) | | $ | (12,428 | ) |
Adjustments to reconcile net loss to net cash used in operating activities: | | | | | | |
Depreciation | | | 548 | | | | 661 | |
Amortization of intangible assets | | | 3,029 | | | | 2,969 | |
Stock-based compensation | | | 4,635 | | | | 3,681 | |
Deferred tax liability | | | 11 | | | | 12 | |
Amortization of prepaid assets | | | 132 | | | | — | |
Changes in operating assets and liabilities: | | | | | | |
Trade accounts receivable | | | (4,297 | ) | | | 1,367 | |
Inventories | | | (1,549 | ) | | | 1,823 | |
Prepaid expenses and other current assets | | | (316 | ) | | | 822 | |
Other assets | | | 96 | | | | 6 | |
Accounts payable | | | 2,928 | | | | (93 | ) |
Accrued compensation | | | 668 | | | | (1,253 | ) |
Accrued liabilities and other | | | (576 | ) | | | (793 | ) |
Lease liabilities | | | (148 | ) | | | (75 | ) |
Net cash used in operating activities | | | (3,527 | ) | | | (3,301 | ) |
Cash flows from investing activities: | | | | | | |
Purchases of property and equipment | | | (178 | ) | | | (346 | ) |
Net cash used in investing activities | | | (178 | ) | | | (346 | ) |
Cash flows from financing activities: | | | | | | |
Proceeds from at-the-market common stock offering, net of offering costs | | | 4,116 | | | | — | |
Payments for withholding taxes related to net share settlement of equity awards | | | (94 | ) | | | (690 | ) |
Issuance of shares for stock purchase and option plans | | | 279 | | | | 232 | |
Net cash provided by (used in) financing activities | | | 4,301 | | | | (458 | ) |
| | | | | | |
Effect of foreign currency exchange rate changes on cash, cash equivalents and restricted cash | | | (7 | ) | | | 3 | |
| | | | | | |
Net increase (decrease) in cash, cash equivalents and restricted cash | | | 589 | | | | (4,102 | ) |
Cash, cash equivalents, and restricted cash; beginning of period | | | 7,976 | | | | 12,078 | |
Cash, cash equivalents, and restricted cash; end of period | | $ | 8,565 | | | $ | 7,976 | |
| | | | | | |
Supplemental disclosure of cash flow information: | | | | | | |
Income taxes paid | | $ | 50 | | | $ | 112 | |
Income taxes refunded | | $ | 67 | | | $ | — | |
| | | | | | |
Supplemental disclosure of non-cash investing and financing activities: | | | | | | |
Operating lease liabilities resulting from right-of-use assets | | $ | 3,729 | | | $ | 11 | |
Accrual of property and equipment | | $ | — | | | $ | 58 | |
Accrual of intellectual property | | $ | 581 | | | $ | — | |
| | | | | | |
Cash and cash equivalents | | $ | 8,510 | | | $ | 7,881 | |
Restricted cash included in other assets | | | 55 | | | | 95 | |
Total cash, cash equivalents, and restricted cash | | $ | 8,565 | | | $ | 7,976 | |
The accompanying notes are an integral part of these consolidated financial statements.
Airgain, Inc.
Notes to Consolidated Financial Statements
Note 1. Description of Business and Basis of Presentation
Description of Business
Airgain, Inc. was incorporated in the State of California on March 20, 1995; and reincorporated in the State of Delaware on August 17, 2016. Airgain, Inc. together with its subsidiaries are herein referred to as the “Company,” “we,” or “our.” Headquartered in San Diego, California, Airgain, Inc. (NASDAQ: AIRG) is a leading provider of advanced wireless connectivity solutions that drive cutting-edge innovation in 5G technology. We are committed to delivering high-performance, cost-effective, and energy-efficient wireless solutions that enable rapid market deployment. Our mission is to connect the world through integrated, innovative, and optimized wireless solutions. Our diverse product portfolio serves three primary markets: enterprise, automotive, and consumer.
Basis of Presentation and Principles of Consolidation
The accompanying consolidated financial statements have been prepared in accordance with U.S. generally accepted accounting principles (GAAP) and applicable rules and regulations of the Securities and Exchange Commission (SEC) regarding financial reporting. The consolidated financial statements include the accounts of the Company and our wholly owned subsidiary. All intercompany transactions and investments have been eliminated in consolidation.
Segment Information
The Company is engaged in research and development, production, commercialization and sale of wireless connectivity solutions, offering integrated systems, embedded components, and external antennas worldwide. All of the Company’s products are manufactured by third-party contract manufacturers. Product sales for the year ended December 31, 2024 accounted for approximate 95% of the Company’s total revenue, as compared to 5% coming from service revenue. Due to similarities in its products, and methods of production, the Company has a single company-wide management team that administers operations on a consolidated basis. We concluded that we have only one operating and reportable segment: to provide wireless connectivity solutions.
The determination of a single business segment is consistent with the consolidated financial information regularly reviewed by the Chief Operating Decision Maker (CODM), the Chief Executive Officer Jacob Suen, for the purposes of assessing performance, allocating resources and planning. The CODM regularly reviews consolidated revenue, gross margin, significant expenses, operating margin, and profit and loss. The CODM compares and analyzes the underlying determinants of the current metrics with the prior performance data and forecasts.
Use of Estimates
The preparation of financial statements in conformity with GAAP requires management to make estimates and assumptions that affect the reported amounts of assets and liabilities and disclosure of contingent assets and liabilities at the date of the consolidated financial statements and the reported amounts of revenues and expenses during the reporting period. Actual results could differ from those estimates.
For the year ended December 31, 2024, we changed the format within the Statements of Stockholders’ Equity from the format of prior years. Without changing how the amounts are classified, we moved the equity element names from the left side to the top of the statement. The equity element names are now the column headings across the top of the statement. In the current year Form 10-K, the Statement of Stockholders’ Equity for the year ending December 31, 2023 has been formatted to be comparable with the year ending December 31, 2024.
Certain amounts in the prior year financial statements have been reclassified to conform to the presentation of the current year financial statements.
Note 2. Significant Accounting Policies
Cash Equivalents
Cash equivalents are comprised of short-term, highly liquid investments with maturities of 90 days or less at the date of purchase. The cash balances may, at times, exceed federally insured limits. Accounts are guaranteed by the Federal Deposit Insurance Corporation (FDIC) up to $250,000.
Trade Accounts Receivable
We perform ongoing credit evaluations of our customers and assess each customer’s credit worthiness. The policy for determining when receivables are past due or delinquent is based on the contractual terms agreed upon. We monitor collections and payments from our customers and analyze for an allowance for credit losses. The allowance for credit losses is based upon applying an expected credit loss rate to receivables based on the historical loss rate and is adjusted for current conditions, including any specific customer collection issues identified, and economic conditions forecast. Delinquent account balances are written off after management has determined that the likelihood of collection is remote.
An allowance for credit losses is established when, in the opinion of management, collection of the account is doubtful.
Trade accounts receivable, net amounted to $11.7 million, $7.4 million, and $8.7 million as of December 31, 2024, 2023, and 2022, respectively.
Inventories
All of the Company’s products are manufactured by third parties that retain ownership of the inventory until title is transferred to the customer at the shipping point. In some situations, the Company retains ownership of consigned inventories at third-party contract manufacturer (CM) locations due to actual or pending customers' orders. The Company recognized the consigned inventory as an asset in its financial statements. In certain instances, shipping terms are delivery-at-place and the Company is responsible for arranging transportation and delivery of goods ready for unloading at the named place. In those instances, the Company bears all risk involved in bringing the goods to the named place and records the related inventory in transit to the customer as inventory on the accompanying consolidated balance sheets.
Inventory is stated at the lower of cost or net realizable value. For items manufactured by our CMs, cost is determined using the weighted average cost method. For items manufactured by third parties, cost is determined using the first-in, first-out method (FIFO). Any adjustments to reduce the cost of inventories to their net realizable value are recognized in earnings in the current period. Write downs for excess and obsolete inventories are estimated based on product life cycles, quality issues, and historical experience.
Property and Equipment
Property and equipment are stated at cost and are depreciated using the straight-line method over the estimated useful lives of the assets, generally three to ten years. The estimated useful lives for leasehold improvements are determined as either the estimated useful life of the asset or the lease term, whichever is shorter. Repairs and maintenance are expensed as incurred. Property and equipment are reviewed for impairment whenever events or changes in circumstances indicate the carrying amount of an asset may not be recoverable. When assets are disposed of (or otherwise sold), the cost and related accumulated depreciation are removed from the accounts and any gain or loss on the disposal of property and equipment is classified as other expense (income) in the Company's consolidated statement of operations.
Goodwill
We account for our goodwill under the authoritative guidance ASC 250 for goodwill and other intangible assets and the provisions of ASU 2017-04, Simplifying the Test for Goodwill Impairment, which we early adopted in fiscal year 2020. Goodwill is not amortized but is tested for impairment annually as of December 31 or more frequently if events or changes in circumstances indicate that our goodwill might be impaired. Such circumstances may include, but not limited to (1) a decline in macro-economic conditions, (2) a significant decline in our financial performance or (3) a significant decline in the price of our common stock for a sustained period of time. We consider the
aggregation of the relevant qualitative factors, and conclude whether it is more likely than not that the fair value of our reporting unit is less than the carrying value.
If we conclude that it is more likely than not that the fair value of our reporting unit is less than the carrying value, we perform a quantitative impairment test. The quantitative impairment test compares the fair value of the reporting unit to its carrying amount, including goodwill. If the fair value of the reporting unit exceeds the carrying amount of the net assets assigned to that reporting unit, goodwill is not considered impaired. However, if the fair value of the reporting unit is lower than the carrying amount of the net assets assigned to the reporting unit, an impairment charge is recognized equal to the excess of the carrying amount over the fair value. The impairment charge is limited to the goodwill amount of the reporting unit.
Determining the fair value of a reporting unit is judgmental in nature and involves the use of significant estimates and assumptions. For the market approach of valuation, we may use the guideline public company method. Under this method we utilize information from comparable publicly traded companies with similar operating and investment characteristics as the reporting unit to derive an indication of value. For the income approach of valuation, we use a discounted cash flow methodology to derive an indication of value, which required management to make estimates and assumptions related to forecasted revenues, gross profit margins, operating income margins, working capital cash flow, income tax rates, EBITDA, perpetual growth rates, and long-term discount rates, among others. In addition, we make certain judgments and assumptions in determining our reporting unit. We base our fair value estimates on assumptions we believe to be reasonable but that are unpredictable and inherently uncertain. Actual future results may differ from those estimates.
Intangibles
The Company’s identifiable finite-lived intangible assets are comprised of acquired intangibles, developed technologies, customer relationships, noncompete agreements and licensed technology. The cost of the finite-lived intangible assets are amortized on a straight-line basis over the assets’ respective estimated useful lives.
We assess potential impairments to our intangible assets in accordance with the authoritative guidance for impairment or disposal of long-lived assets (ASC 360) when events or changes in circumstances indicate that the carrying value may not be recoverable. We assess the impairment of long-lived and intangible assets whenever events or changes in circumstances indicate that the carrying value may not be recoverable. As a first step, we consider factors, which may include the following, but are not limited to: (1) significant underperformance relative to historical or projected future operating results; (2) significant negative industry or economic trends; and (3) a significant decline in our stock price for a sustained period.
If this assessment indicates that the carrying value of the assets may not be recoverable, the Company is required to perform the second step to test the asset group for recoverability. This recoverability test compares the future undiscounted cash flows expected from the use of the asset group to its carrying value. If the carrying value is more than the undiscounted future cash flows, the Company is required perform a third step to determine the fair value of the asset group and compare fair value against the carrying value. Any excess carrying value over the fair value needs to be recognized as an impairment loss.
Determining the recoverability of long-lived or intangible assets is judgmental in nature and involves the use of significant estimates and assumptions. These estimates and assumptions include revenue growth rates and operating margins used to calculate projected future cash flows and the future market value of our asset group. In addition, we make certain judgments and assumptions in determining our asset group. We base our recoverability estimates on assumptions we believe to be reasonable but that are unpredictable and inherently uncertain. Actual future results may differ from those estimates.
Revenue Recognition
Under ASC Topic 606 “Revenue from Contracts with Customers”, the Company recognize revenue when, or as the control of the promised goods or services is transferred to the customers in an amount that reflects the consideration the Company expects to be entitled in exchange for those goods or services. In applying this core principle, the Company performs the following five-steps only when it is probable that substantially all of the consideration that it will be entitled in exchange for the goods or services that will be transferred to the customer:
(i) identify the contract(s) with the customer,
(ii) identify the performance obligations in the contract,
(iii) determine the transaction price,
(iv) allocate the transaction price to the performance obligation(s) in the contract and
(v) recognize revenue when or as the entity satisfies performance obligations. A performance obligation is at a point in time, except if it meets any of the three criteria, which will require recognition of revenue over time:
• the customer simultaneously receives and consumes the benefit provided by the entity’s performance as the entity performs,
• the entity’s performance creates or enhances an asset (for example, work in process) that the customer controls as the asset is created or enhanced, and
• the entity's performance does not create an asset with an alternative use to the entity and the entity has an enforceable right to payment for performance completed to date.
Most of the Company's revenue is generated from product sales and the revenue is recognized at a point-in-time when control is transferred to the customer. Each purchase order, along with existing customer agreements, when applicable, represents a contract from a customer and each product sold represents a distinct performance obligation. Revenue is recognized when control is transferred to the customer at a point in time either when the product is shipped to or received by the customer, based on the terms of the specific agreement with the customer, and the Company has an enforceable right to payment for the product. The Company allocates the transaction price, which is generally the quoted price per terms of the contract and the consideration the Company expects to receive, to each performance obligation. The Company offers return rights, general sales return, and/or pricing credits under certain circumstances. We estimate product returns based on historical sales and return trends to record a refund liability allowance, and amounts against revenue and cost of goods sold.
A portion of the Company's revenue is recognized over time, including: data subscription, test services or custom design services. Revenue from data subscription plans relate to purchased asset trackers with activated data lines, through a third-party service provider. Data subscription plan revenues are recognized monthly based on the fee stated in the contract, as the customer is simultaneously receiving and consuming the benefits provided throughout the Company's monthly performance obligation. Test service revenues are recognized monthly based on the fee stated in the contract for obligations over time on assets that the customer controls. Design service fees are paid in advance; the prepayments are deferred revenues and are recorded as contract liabilities. Most of the design service fees are recognized based on the Company's achievement of milestones. The Company's performance for the design services does not create an asset with an alternative use to the Company and the Company has an enforceable right to payment for performance completed to date. We recognize from the contract liabilities as milestones are achieved over service periods ranging from three (3) to eighteen (18) months.
The Company's contracts with customers do not typically include extended payment terms. Payment terms may vary by contract and type of customer and generally range from 30 to 90 days from delivery.
For a limited number of customers, the Company elected the practical expedient provided in ASC 606-10-25-18B, whereby the Company accounts for shipping and handling as activities to fulfill the promise to transfer the good. To the extent that the Company charges its customers shipping fees, such amounts are included as a component of revenue and the corresponding costs are included as a component of cost of sales.
The Company provides assurance-type warranties on all product sales ranging from one to two years. The estimated warranty costs are accrued for at the time of sale based on historical warranty experience plus any known or expected changes in warranty exposure.
The Company has opted to not disclose the portion of revenues allocated to partially unsatisfied performance obligations, which represent products to be shipped within 12 months under open customer purchase orders, at the end of the current reporting period as allowed under ASC 606. The Company has also elected to record sales commissions when incurred, pursuant to the practical expedient under ASC 340, Other Assets and Deferred Costs, as the period over which the sales commission asset that would have been recognized is less than one year.
To the extent the Company collects and remits taxes on product sales from customers, it has elected to exclude from the measurement of transaction price taxes that are assessed by governmental authorities.
Shipping and Transportation Costs
Shipping and other transportation costs expensed as incurred were $0.5 million and $0.4 million for the years ended December 31, 2024 and 2023, respectively. These costs are included in sales and marketing expenses in the accompanying consolidated statements of operations.
Research and Development Costs
Research and development costs are expensed as incurred.
Advertising Costs
Advertising costs are expensed as incurred and were $0.1 million and $0.3 million for the years ended December 31, 2024 and 2023, respectively. These costs are included in sales and marketing expenses in the accompanying consolidated statements of operations.
Income Taxes
The Company records income taxes under the asset and liability method. Deferred tax assets and liabilities are recognized for the future tax consequences attributable to differences between the financial statements carrying amounts of existing assets and liabilities and their respective tax bases. Deferred tax assets and liabilities are measured using enacted tax rates expected to apply to taxable income in the years in which those temporary differences are expected to be recovered or settled. The effect on deferred tax assets and liabilities of a change in tax rates is recognized in income in the period that includes the enactment date. When applicable a valuation allowance is established to reduce any deferred tax asset when we determine that it is more likely than not that some portion of the deferred tax asset will not be realized.
The Company recognizes the effect of income tax positions only if those positions are more likely than not of being sustained. Recognized income tax positions are measured at the largest amount that is greater than 50% likely of being realized. Changes in recognition or measurement are reflected in the period in which the change in judgment occurs. The Company records interest related to unrecognized tax benefits in interest expense and penalties in general and administrative expenses.
Stock-Based Compensation
We recognize compensation costs related to stock options and restricted stock units granted to employees and directors based on the estimated fair value of the awards on the date of grant. We estimate the option grant fair values, and the resulting stock-based compensation expense, using the Black-Scholes option-pricing model. The grant date fair value of stock-based awards are expensed on a straight-line basis over the requisite service period of the entire reward. The Company recognizes forfeitures when incurred.
The assumptions used in the Black-Scholes option-pricing model are as follows:
•Fair value of our common stock. The Company’s common stock is valued by reference to the publicly traded price of our common stock.
•Expected term. The expected term represents the period of time stock-based awards are expected to be outstanding.
•Expected weighted average volatility. We estimated expected volatility, using solely our historical share price volatilities.
•Risk-free interest rate. The risk-free interest rate is based on the U.S. Treasury yield in effect at the time of grant for zero coupon U.S. Treasury notes with maturities approximately equal to the expected term.
•Expected dividend. The expected dividend is assumed to be zero as the Company has never paid dividends and have no current plans to pay any dividends.
Fair Value Measurements
The carrying values of the Company’s financial instruments, including cash, trade accounts receivable, accounts payable, and accrued liabilities approximate their fair values due to the short maturity of these instruments.
Fair value measurements are market-based measurements, not entity-specific measurements. Therefore, fair value measurements are determined based on the assumptions that market participants would use in pricing the asset or liability. The Company follows a three-level hierarchy to prioritize the inputs used in the valuation techniques to derive fair values. The basis for fair value measurements for each level within the hierarchy is described below:
•Level 1: Quoted prices in active markets for identical assets or liabilities.
•Level 2: Quoted prices for similar assets or liabilities in active markets; quoted prices for identical or similar instruments in markets that are not active; and model-derived valuations in which all significant inputs are observable in active markets.
•Level 3: Valuations derived from valuation techniques in which one or more significant inputs are unobservable in active markets.
Recently Adopted Accounting Pronouncements
In November 2023, the FASB issued ASU 2023-07, “Segment Reporting (Topic 280): Improvements to Reportable Segment Disclosures.” ASU No. 2023-07 require that a public entity disclose, on an annual and interim basis the significant segment expenses, and other measures of profit or loss that are regularly used by an entity's chief operating decision maker (CODM) to assess segment performance and how to allocate resources. The ASU is applicable to entities with a single reportable segment. This ASU is effective for fiscal years beginning after December 15, 2023, and for interim periods within fiscal years beginning after December 15, 2024. The Company adopted ASU 2023-07 in fourth quarter of the fiscal year 2024 and applied the disclosure requirements retrospectively to all prior periods presented in the financial statements. The adoption did not have an impact on the Company’s financial position, results of operations, and cash flows. For additional information, see Note 17 Segment Information in the accompanying notes to the consolidated financial statements.
Recently Issued Accounting Pronouncements
In December 2023, the FASB issued ASU 2023-09, "Income Taxes (Topic 740): Improvements to Income Tax Disclosures." ASU No. 2023-09 requires expanded disaggregated information about a reporting entity’s effective tax rate reconciliation as well as disclosure of income taxes paid by jurisdiction. The amendments in ASU are effective for fiscal years beginning after December 15, 2024 with early adoption permitted. Retrospective application of the amendments are permitted. The Company is evaluating the impact and will apply for 2025 financial statements. As the amendments apply to income tax disclosures only, the Company does not expect adoption to have a material impact on its consolidated financial statements.
In March 2024, the FASB issued ASU 2024-02, "Codification Improvements—Amendments to Remove References to the Concepts Statements." ASU No. 2024-02 removes various references to concepts statements from the FASB Accounting Standards Codification. The ASU indicates that the goal of the amendments is to simplify the Codification and distinguish between non-authoritative and authoritative guidance since, unlike the Codification, the concepts statements are non-authoritative. The amendments in ASU are effective for fiscal years beginning after December 15, 2024 with early adoption permitted. Retrospective application of the amendments are permitted. The Company will evaluate the ASU to determine its impact on the Company’s disclosures. The Company does not expect adoption to have a material impact on its consolidated financial statements
In November 2024, the FASB issued ASU No. 2024-03, "Expense Disaggregation Disclosures (Subtopic 220-40)." The ASU requires public entities to disaggregate, in a tabular presentation, certain relevant income statement expenses into different categories, such as purchases of inventory, employee compensation, depreciation, and intangible asset amortization in commonly presented expense captions such as cost of sales, selling, general and administrative expense, and research and development. The guidance is effective for all public business entities in annual reporting periods beginning after December 15, 2026, and interim periods within annual reporting periods beginning after December 15, 2027, with early adoption permitted, and may be applied retrospectively. The Company intends to adopt the amendments in this update. The impact of the adoption of the amendments in this update is not expected to be material to the Company’s consolidated financial position and results of operations, as the requirements only require more detailed disclosures in the footnotes to the Company’s consolidated financial statements.
We have assessed all other ASUs issued but not yet adopted and concluded that those ASUs are not relevant to the Company or are not expected to have a material impact.
Note 3. Net Loss Per Share
Basic net loss per share is calculated by dividing net loss available to common stockholders by the weighted average shares of common stock outstanding for the period. Diluted net loss per share is calculated by dividing net loss by the weighted average shares of common stock outstanding for the period plus amounts representing the dilutive effect of securities that are convertible into common stock. The Company calculates diluted loss per common share using the treasury stock method.
The following table presents the computation of net loss per share (in thousands except per share data):
| | | | | | | | |
| | For the Years Ended December 31, | |
| | 2024 | | | 2023 | |
Numerator: | | | | | | |
Net loss | | $ | (8,688 | ) | | $ | (12,428 | ) |
Denominator: | | | | | | |
Basic weighted average common shares outstanding | | | 11,053 | | | | 10,392 | |
Diluted weighted average common shares outstanding | | | 11,053 | | | | 10,392 | |
Net loss per share: | | | | | | |
Basic | | $ | (0.79 | ) | | $ | (1.20 | ) |
Diluted | | $ | (0.79 | ) | | $ | (1.20 | ) |
Potentially dilutive securities (in common stock equivalent shares) not included in the calculation of diluted net loss per share because to do so would be anti-dilutive are as follows (in thousands):
| | | | | | | | |
| | For the Years Ended December 31, | |
| | 2024 | | | 2023 | |
Stock options and restricted stock | | | 2,040 | | | | 2,246 | |
Total common stock equivalent shares | | | 2,040 | | | | 2,246 | |
Note 4. Cash and Cash Equivalents
The following tables show the Company’s cash and cash equivalents by significant investment category (in thousands):
| | | | | | | | |
| | As of December 31, | |
| | 2024 | | | 2023 | |
Cash | | $ | 8,477 | | | $ | 7,581 | |
Level 1: | | | | | | |
Money market funds | | | 33 | | | | 300 | |
Total | | $ | 8,510 | | | $ | 7,881 | |
Restricted Cash
As of December 31, 2024, the Company had $55,000 in cash on deposit to secure certain lease commitments, which is restricted for more than twelve months and recorded in long-term other assets in the Company’s consolidated balance sheet. As of December 31, 2023, the Company had $95,000 in cash on deposit to secure certain lease commitments; $40,000 of which is short-term in nature and recorded in prepaid expenses and other current assets and $55,000 of which is restricted for more than twelve months and recorded in long-term other assets in the Company’s consolidated balance sheet.
Note 5. Inventory
Inventory is comprised of the following (in thousands):
| | | | | | | | |
| | As of December 31, | |
| | 2024 | | | 2023 | |
Finished goods | | $ | 3,521 | | | $ | 1,742 | |
Raw materials | | | 431 | | | | 661 | |
Total Inventory | | $ | 3,952 | | | $ | 2,403 | |
Consigned Inventory (which is included in Total Inventory) is comprised of the following (in thousands):
| | | | | | | | |
| | As of December 31, | |
| | 2024 | | | 2023 | |
Finished goods | | $ | 1,124 | | | $ | 598 | |
Raw materials |
| | 166 | | | | 558 | |
Total Consigned Inventory | | $ | 1,290 | | | $ | 1,156 | |
Excess and obsolete inventory reserves were $0.7 million and $1.7 million as of December 31, 2024 and 2023, respectively.
Note 6. Property and Equipment
Depreciation and amortization of property and equipment is calculated on the straight-line method based on the shorter of the estimated useful life or the term of the lease for tenant improvements and three to ten years for all other property and equipment. Property and equipment consist of the following (in thousands):
| | | | | | | | |
| | As of December 31, | |
| | 2024 | | | 2023 | |
Computers and software | | $ | 557 | | | $ | 811 | |
Furniture, fixtures, and equipment | | | 427 | | | | 427 | |
Manufacturing and testing equipment | | | 5,507 | | | | 5,371 | |
Construction in process | | | 6 | | | | 45 | |
Leasehold improvements | | | 848 | | | | 848 | |
Software Development – Internal Use | | | 66 | | | | — | |
Vehicles | | | 55 | | | | 55 | |
Property and equipment, gross | | | 7,466 | | | | 7,557 | |
Less accumulated depreciation | | | (5,473 | ) | | | (5,050 | ) |
Property and equipment, net | | $ | 1,993 | | | $ | 2,507 | |
Depreciation expense was $0.5 million and $0.7 million or the years ended December 31, 2024 and 2023, respectively.
Note 7. Intangible Assets and Goodwill
Other Intangible Assets
The following is a summary of the Company’s acquired intangible assets (dollars in thousands):
| | | | | | | | | | | | | | |
| | December 31, 2024 | |
| | Weighted average amortization period (in years) | | Gross carrying amount | | | Accumulated amortization | | | Net carrying amount | |
Market related intangibles | | 5 | | $ | 1,820 | | | $ | 1,475 | | | $ | 345 | |
Customer relationships | | 7 | | | 13,780 | | | | 11,266 | | | | 2,514 | |
Developed technologies | | 11 | | | 4,380 | | | | 1,973 | | | | 2,407 | |
Covenants to non-compete | | 2 | | | 115 | | | | 115 | | | | — | |
Licensed technology | | 3 | | | 581 | | | | 48 | | | | 533 | |
Total intangible assets, net | | | | $ | 20,676 | | | $ | 14,877 | | | $ | 5,799 | |
| | | | | | | | | | | | | | |
| | December 31, 2023 | |
| | Weighted average amortization period (in years) | | Gross carrying amount | | | Accumulated amortization | | | Net carrying amount | |
Market related intangibles | | 5 | | $ | 1,820 | | | $ | 1,135 | | | $ | 685 | |
Customer relationships | | 7 | | | 13,780 | | | | 8,993 | | | | 4,787 | |
Developed technologies | | 11 | | | 4,380 | | | | 1,618 | | | | 2,762 | |
Covenants to non-compete | | 2 | | | 115 | | | | 115 | | | | — | |
Total intangible assets, net | | | | $ | 20,095 | | | $ | 11,861 | | | $ | 8,234 | |
Amortization expense was $3.0 million for the each of the years ended December 31, 2024 and 2023, respectively.
Estimated annual amortization of intangible assets for the next five years and thereafter is shown in the following table (in thousands):
| | | | |
| | Estimated future amortization | |
2025 | | $ | 3,152 | |
2026 | | | 751 | |
2027 | | | 501 | |
2028 | | | 275 | |
2029 | | | 275 | |
Thereafter | | | 845 | |
Total | | $ | 5,799 | |
Actual amortization expense to be reported in future periods could differ from these estimates as a result of acquisitions, divestitures, and asset impairments, among other factors.
No impairment losses were recorded against the other intangibles for the years ended December 31, 2024 and 2023, respectively.
For the annual finite-lived intangible assets impairment assessment as of December 31, 2024, the Company evaluated the impairment considerations. As a first step, we consider factors, which may include the following, but are not limited to: (1) significant underperformance relative to historical or projected future operating results; (2) significant negative industry or economic trends; or (3) a significant decline in our stock price for a sustained period. If this assessment indicates that the carrying value of the assets may not be recoverable, the Company would be required to perform the second step to test the asset group for recoverability. This recoverability test compares the future undiscounted cash flows expected from the use of the asset group to its carrying value.
The Company determined that there were no triggering events or circumstances to indicate that the carrying value of the finite-lived asset group may not be recoverable. Therefore, the Company did not perform the test to evaluate
the asset group for recoverability. Based on the assessment performed, we concluded that an impairment charge to finite-lived intangible assets was not required as of December 31, 2024 and the useful lives remain appropriate.
Goodwill
For each of the years ended December 31, 2024 and 2023, the Company's goodwill assets totaled $10.8 million. No impairment losses were recorded against the goodwill during the for the years ended December 31, 2024 and 2023, respectively.
For the annual goodwill impairment assessment, as of December 31, 2024, the Company evaluated the impairment considerations. As a first step, we consider events or changes in circumstances that indicate that our goodwill might be impaired. Such circumstances may include, but not limited to (1) a decline in macro-economic conditions, (2) a significant decline in our financial performance or (3) a significant decline in the price of our common stock for a sustained period of time. We consider the aggregation of the relevant qualitative factors, and conclude whether it is more likely than not that the fair value of our reporting unit is less than the carrying value. If we conclude that it is more likely than not that the fair value of our reporting unit is less than the carrying value, we perform a quantitative impairment test. The quantitative impairment test compares the fair value of the reporting unit to its carrying amount, including goodwill.
The Company determined that there were no events or circumstances as of December 31, 2024 that indicated that it is more likely than not that the fair value of a reporting unit may be less than its carrying amount. Since there was no indication that it is more likely than not that the fair value of a reporting unit is less than its carrying amount, the Company determined that a quantitative goodwill impairment test was not necessary. Based on the assessment performed, we concluded that an impairment charge to goodwill was not required as of December 31, 2024.
Certain future events and circumstances could result in changes to our assumptions and judgments used in the impairment tests. A downward revision of these assumptions could cause the total fair value of our goodwill and intangible assets to fall below carrying values and a non-cash impairment charge would be required. Such a charge may have a material effect on the consolidated financial statements.
Note 8. Accrued Liabilities and Other
Accrued liabilities and other is comprised of the following (in thousands):
| | | | | | | | |
| | As of December 31, | |
| | 2024 | | | 2023 | |
Accrued expenses | | $ | 1,351 | | | $ | 1,031 | |
VAT payable | | | — | | | | 339 | |
Accrued income taxes | | | 6 | | | | 145 | |
Advanced payments from contract manufacturers | | | 73 | | | | — | |
Contract liabilities | | | — | | | | 17 | |
Goods received not invoiced | | | 31 | | | | 185 | |
Other current liabilities | | | 411 | | | | 209 | |
Accrued liabilities and other | | $ | 1,872 | | | $ | 1,926 | |
Note 9. Leases
Operating Leases
The Company has made certain assumptions and judgments when applying ASC 842, the Company elected not to recognize right-of-use assets and lease liabilities for short-term leases (lease terms of twelve months or less).
Operating lease arrangements primarily consist of office, warehouse and test house leases expiring during different years through 2031. The facility leases have original lease terms of approximately one to seven years and may contain options to extend up to 5 years and/or terminate early. Options to extend are included in leased right-of-use assets and lease liabilities in the consolidated balance sheet when we are reasonably certain to renew a lease. Since the implicit rate of such leases is unknown and we may not be reasonably certain to renew leases, the Company has elected to apply a collateralized incremental borrowing rate to facility leases on the original lease term in calculating the present value of future lease payments. As of December 31, 2024 and 2023, the weighted
average discount rate for operating leases was 6.5% and 3.8%, respectively, and the weighted average remaining lease term for operating leases was 6.3 years and 1.8 years, respectively.
The Company has entered into various short-term operating leases, primarily for test houses and office equipment with initial terms of 12 months or less. These short-term leases are not recorded on the Company's consolidated balance sheet and the related short-term lease expense was $0.2 million and $0.1 million for the year ended December 31, 2024 and 2023, respectively. Total operating lease cost were $0.8 million $1.0 million for year ended December 31, 2024 and 2023, respectively.
Capital area maintenance, property taxes and non-lease costs are excluded from lease expense.
The table below presents aggregate future minimum payments due under leases, reconciled to lease liabilities included in the consolidated balance sheet as of December 31, 2024 (in thousands):
| | | | |
| | | |
Future operating lease obligations: | | | |
2025 | | $ | 331 | |
2026 | | | 812 | |
2027 | | | 800 | |
2028 | | | 773 | |
2029 | | | 787 | |
Thereafter | | | 1,436 | |
Total minimum payments | | $ | 4,939 | |
Less imputed interest | | | (1,040 | ) |
Less unrealized translation gain | | | — | |
Total lease liabilities | | $ | 3,899 | |
Less short-term lease liabilities | | | (89 | ) |
Long-term lease liability | | $ | 3,810 | |
Note 10. Income Taxes
Income Taxes
The components of the pretax loss from operations for the years ended December 31 are as follows (in thousands):
| | | | | | | | |
| | For the Years Ended December 31, | |
| | 2024 | | | 2023 | |
U.S. Domestic | | $ | 8,761 | | | $ | 12,235 | |
Foreign | | | 79 | | | | 65 | |
Pretax loss from operations | | $ | 8,840 | | | $ | 12,300 | |
The income tax expense (benefit) is as follows (in thousands):
| | | | | | | | |
| | For the Years Ended December 31, | |
| | 2024 | | | 2023 | |
Current: | | | | | | |
U.S. federal | | $ | — | | | $ | — | |
State and local | | | 30 | | | | 16 | |
Foreign | | | (193 | ) | | | 100 | |
Total current income tax (benefit) expense | | | (163 | ) | | | 116 | |
Deferred: | | | | | | |
U.S. federal | | | 9 | | | | 9 | |
State and local | | | 2 | | | | 3 | |
Total deferred income tax expense | | | 11 | | | | 12 | |
Income tax (benefit) expense | | $ | (152 | ) | | $ | 128 | |
Tax Rate Reconciliation
Reconciliations of the total income tax provision tax rate to the statutory federal income tax rate of 21% for the years ended December 31, 2024 and 2023, respectively, are as follows (in thousands):
| | | | | | | | |
| | For the Years Ended December 31, | |
| | 2024 | | | 2023 | |
Income taxes at statutory rates | | $ | (1,856 | ) | | $ | (2,583 | ) |
State income tax, net of federal benefit | | | 32 | | | | 23 | |
Permanent items | | | 106 | | | | 40 | |
Equity based compensation | | | 259 | | | | 386 | |
Federal research credits | | | (347 | ) | | | (122 | ) |
Federal return to provision | | | 35 | | | | (10 | ) |
Foreign taxes | | | (194 | ) | | | 100 | |
Other | | | 98 | | | | 17 | |
Change in federal valuation allowance | | | 1,715 | | | | 2,277 | |
Income tax (benefit) expense | | $ | (152 | ) | | $ | 128 | |
Significant Components of Current and Deferred Taxes
The tax effects of temporary differences that give rise to significant portions of the deferred tax assets and deferred tax liabilities are as follows (in thousands):
| | | | | | | | |
| | As of December 31, | |
| | 2024 | | | 2023 | |
Deferred tax assets: | | | | | | |
Net operating loss carryforwards | | $ | 5,094 | | | $ | 5,846 | |
Research and AMT credits | | | 4,427 | | | | 3,937 | |
Stock based compensation | | | 2,080 | | | | 1,831 | |
Lease liability | | | 954 | | | | 383 | |
Section 174 R&D Capitalization | | | 5,527 | | | | 4,159 | |
Accrued and other | | | 908 | | | | 760 | |
Deferred tax assets | | | 18,990 | | | | 16,916 | |
Less valuation allowance | | | (16,696 | ) | | | (14,578 | ) |
Deferred tax assets, net of allowance | | | 2,294 | | | | 2,338 | |
Deferred tax liabilities: | | | | | | |
Fixed assets | | | (411 | ) | | | (501 | ) |
Goodwill | | | (518 | ) | | | (468 | ) |
Right-of-use asset | | | (953 | ) | | | (340 | ) |
Intangible asset | | | (575 | ) | | | (1,180 | ) |
Deferred tax liabilities | | | (2,457 | ) | | | (2,489 | ) |
Total deferred tax liabilities | | $ | (163 | ) | | $ | (151 | ) |
We have established a valuation allowance against our net deferred tax assets due to the uncertainty surrounding the realization of such assets. The Company periodically evaluates the recoverability of the deferred tax assets. At such time it is determined that it is more likely than not that deferred assets are realizable, the valuation allowance will be reduced. The Company has recorded a valuation allowance of $16.7 million as of December 31, 2024 as it does not believe it is more likely than not that certain deferred tax assets will be realized due to the recent history of both pre-tax book income and losses, the lack of taxable income available in carryback periods or feasible tax-planning strategies, the limited existing taxable temporary differences, and the subjective nature of forecasting future taxable income into the future. The Company increased its valuation allowance by approximately $2.1 million during the year ended December 31, 2024.
As of December 31, 2024 the Company had federal and state tax loss carryforwards of approximately $19.6 million, and $11.9 million, respectively. The federal loss generated post 2018 of $11.2 million will carryforward indefinitely and be available to offset up to 80% of future taxable income each year. The remaining federal and state net operating loss carryforwards begin to expire in 2029 and 2026, respectively, if unused.
As of December 31, 2024 the Company had federal and state tax credit carryforwards of approximately $2.4 million, and $2.0 million, respectively, after reduction for uncertain tax positions. The federal credits will begin to
expire in 2026, if unused, and the California credits carryforwards indefinitely. The other states credits will begin to expire in 2032.
The above NOL carryforward and the federal and state research tax credit carryforwards may be subject to an annual limitation under section 382 and 383 of the Internal Revenue Code of 1986, as amended (the "Code"), and similar state provisions if we experience one or more ownership changes which would limit the amount of NOL and tax credit carryforwards that can be utilized to offset future taxable income and tax, respectively. In general, an ownership change as defined by Section 382 and 383, results from transactions increasing ownership of certain stockholders or public groups in the stock of the corporation by more than 50 percentage points over a rolling three-year period. The Company has completed an ownership change analysis through December 31, 2024 and incorporated the impact of ownership changes prior to this date by reducing the Company's net operating loss and R&D credit carryovers that may not be utilized due to the annual limitations associated with those ownership change dates. Our use of federal and state NOLs and research credits could be limited further by the provisions of Section 382 of the U.S. Internal Revenue Code of 1986, as amended, depending upon the timing and amount of additional equity securities that we have issued or will issue, subsequent to December 31, 2024.State NOL carryforwards may be similarly limited. If a change in ownership were to have occurred, NOL and tax credits carryforwards could be eliminated or restricted. If eliminated, the related asset would be removed from the deferred tax asset schedule with a corresponding reduction in the valuation allowance. Due to the existence of the valuation allowance, limitations created by ownership changes, if any, will not impact our effective tax rate.
The following table summarizes the reconciliation of the unrecognized tax benefits activity during the years ended December 31 (in thousands):
| | | | | | | | |
| | 2024 | | | 2023 | |
Beginning unrecognized tax benefits | | $ | 1,354 | | | $ | 1,305 | |
Gross increases - tax positions in prior period | | | — | | | | (65 | ) |
Gross decreases – tax positions in prior period | | | (175 | ) | | | — | |
Gross increases - current year tax positions | | | 135 | | | | 114 | |
Purchase accounting | | | — | | | | — | |
Ending unrecognized tax benefits | | $ | 1,314 | | | $ | 1,354 | |
The unrecognized tax benefit amounts are reflected in the determination of the Company’s deferred tax assets. If recognized, none of these amounts would impact the company’s effective tax rate due to the existence of the valuation allowance against deferred tax assets. The Company does not foresee material changes to its uncertain tax benefits within the next twelve months.
The Company’s policy is to recognize interest and/or penalties related to income tax matters in income tax expense. The Company has no accrual for interest or penalties on balance sheets as of December 31, 2024. The Company had $0.1 million accrual for interest or penalties on balance sheets as of December 31, 2023. The Company has recognized no interest and/or penalties in the Statement of Operations for each of the years ended December 31, 2024 and 2023.
The Company is subject to taxation in the United States, various state jurisdictions, China and the United Kingdom. Due to the existence of federal, state and foreign net operating loss and credit carryovers, the Company's tax years that remain open and subject to examination by tax jurisdiction are years 2006 and forward for federal and years 2008 and forward for the state of California.
Note 11. Stockholders’ Equity
In August 2016, the Company's Board adopted the 2016 Equity Incentive Plan (the 2016 Plan) for employees, directors and consultants. In February 2021, the Board adopted the 2021 Employment Inducement Incentive Award Plan (Inducement Plan), which provides for grants of equity-based awards.
The following table presents common stock reserved for future issuance(1) (in thousands):
| | | | | | | | |
| | As of December 31, | |
| | 2024 | | | 2023 | |
Stock options issued and outstanding | | | 2,376 | | | | 2,104 | |
Stock awards issued and outstanding | | | 945 | | | | 817 | |
Authorized for grants under the 2016 Plan(2) | | | 164 | | | | 448 | |
Authorized for grants under the Inducement Plan(3) | | | 210 | | | | 174 | |
Authorized for grants under the 2016 Employee Stock Purchase Plan(4) | | | 494 | | | | 540 | |
(1)Treasury stock of 541,000 shares as of December 31, 2024 and 2023 are excluded from the table above.
(2)On January 1 ,2024, the number of authorized shares in the 2016 Plan increased by 440,000 shares pursuant to the evergreen provisions of the 2016 Plan.
(3)On February 5, 2021, 300,000 shares were authorized pursuant to the terms of the Inducement Plan.
(4)On January 1, 2024, the number of authorized shares in the 2016 Employee Stock Purchase Plan increased by 100,000 shares pursuant to the evergreen provisions of the 2016 Employee Stock Purchase Plan.
Issuance of Common Stock
In March 2024, we established an at-the-market (ATM) offering program to sell up to $5.0 million of the Company's common stock. As of December 31, 2024, we have $0.5 million available under the offering program for future sales of our common stock.
The Company recorded the ATM gross sales proceeds and offering costs in additional paid-in capital of the consolidated balance sheet. The following table summarizes the Company’s ATM sales activity during the period indicated (in thousands):
| | | | |
| | For the year ended December 31, 2024 | |
Shares issued | | | 760 | |
Gross proceeds | | $ | 4,493 | |
Net proceeds after offering costs | | $ | 4,116 | |
Note 12. Stock Based Compensation
Stock-Based Compensation Expense
Stock-based compensation is recorded in the consolidated statements of operations as follows (in thousands):
| | | | | | | | |
| | For the Years Ended December 31, | |
| | 2024 | | | 2023 | |
Cost of goods sold | | $ | 311 | | | $ | 107 | |
Research and development | | | 1,379 | | | | 1,062 | |
Sales and marketing | | | 379 | | | | 373 | |
General and administrative | | | 2,566 | | | | 2,139 | |
Total stock-based compensation expense | | $ | 4,635 | | | $ | 3,681 | |
Stock Options
The vesting period for stock options granted to employees is generally one to four years. All stock options granted under the 2016 Plan have a maximum contractual term of ten years.
Commencing in 2019, each non-employee member of the board of directors will receive an annual award on the first trading day in February a number of stock options having a value of $30,000 (with the award to the chairperson of the board of directors having a value of $45,000), (calculated as of the date of grant in accordance with the Black-Scholes option pricing model).
The grant-date fair value of each option award is estimated on the date of grant using the Black-Scholes-Merton option-pricing model. The weighted average assumptions for grants during the years ended December 31, 2024 and 2023 are provided in the following table:
| | | | | | | | |
| | For the Years Ended December 31, | |
| | 2024 | | | 2023 | |
Expected dividend yield | | | 0 | % | | | 0 | % |
Expected volatility | | | 68.7 | % | | | 61.0 | % |
Expected term (years) | | | 4.1 | | | | 4.3 | |
Risk-free interest rate | | | 4.2 | % | | | 4.0 | % |
A summary of the Company’s stock option activity is as follows (shares in thousands):
| | | | | | | | | | | | | | | |
| | | | | Weighted Average | | | |
| | Number of
stock options | | | Exercise
price | | | Remaining contractual term (years) | | Aggregate Intrinsic Value (in thousands) | |
Balance at December 31, 2023 | | | 2,104 | | | $ | 10.20 | | | | 6.2 | | $ | 329 | |
Granted | | | 425 | | | $ | 5.23 | | | | | | |
Exercised | | | (26 | ) | | $ | 4.98 | | | | | $ | 18 | |
Expired/Forfeited | | | (127 | ) | | $ | 14.95 | | | | | | |
Balance at December 31, 2024 | | | 2,376 | | | $ | 9.12 | | | | 5.9 | | $ | 2,357 | |
| | | | | | | | | | | |
Vested and exercisable at December 31, 2024 | | | 1,677 | | | $ | 10.60 | | | | 4.7 | | $ | 1,049 | |
Vested and expected to vest at December 31, 2024 | | | 2,376 | | | $ | 9.12 | | | | 5.9 | | $ | 2,357 | |
During the years ended December 31, 2024 and 2023, the Company received proceeds of $127,000 and $28,000 respectively from the exercise of options.
The weighted average grant-date fair values of options granted during the years ended December 31, 2024 and 2023 were $2.90 and $2.53 per share, respectively. The grant-date fair value of each option award is estimated on the date of grant using the Black-Scholes-Merton option-pricing model. The grant date fair value of shares vested during the years ended December 31, 2024 and 2023 was $1.4 million and $1.9 million, respectively. For stock options vested and expected to vest, the aggregate intrinsic value as of December 31, 2024 and 2023 was $2.4 million and $0.3 million, respectively.
At December 31, 2024, there was $1.6 million of unrecognized compensation cost related to unvested stock options granted under the Company’s equity plans that is expected to be recognized over the next 2.1 years.
Restricted Stock Units
The following table summarizes the Company’s restricted stock unit activity (shares in thousands):
| | | | | | | | |
| | Restricted
stock units | | | Weighted average grant date fair value | |
Balance at December 31, 2023 | | | 706 | | | $ | 6.97 | |
Grants | | | 507 | | | $ | 5.30 | |
Vested and released | | | (253 | ) | | $ | 7.41 | |
Forfeited | | | (125 | ) | | $ | 6.09 | |
Balance at December 31, 2024 | | | 835 | | | $ | 5.95 | |
Commencing in 2019, each non-employee member of the board of directors receives, on the first trading day in February of each year, such number of restricted stock units as is determined by dividing $30,000 (with the award to the chairperson of the board of directors having a value of $45,000) by the 30 trade days trailing average share price.
During the year ended December 31, 2024, 54,500 restricted stock units with an average fair value of $4.45 per share were granted to the members of the Company’s board of directors of which fully vest on the one year anniversary of the grant date. Employees and consultants were granted 429,300 restricted stock units with an average fair value of $5.50 per share, which vest on grant date or vest equally after each of the annual anniversaries over a four year period. During the year ended December 31, 2023, 28,000 restricted stock units with a fair value of $8.00 per share were granted to members of the Company’s board of directors of which fully vest on the first anniversary of the grant date, and 698,200 restricted stock units with a fair value of $4.82 per share were issued to employees which vest equally after each of the annual anniversaries over a four-year period.
As of December 31, 2024, there was $3.0 million of total unrecognized stock-based compensation expense related to non-vested restricted stock units which is expected to be recognized over a remaining weighted-average vesting period of 2.3 years.
The Company currently uses authorized and unissued shares to satisfy share award exercises.
Performance Stock Units
The following table summarizes the Company's PSU activity during the period indicated (shares in thousands):
| | | | | | | | |
| | Performance
stock units | | | Weighted average grant date fair value | |
Balance at December 31, 2023 | | | 110 | | | $ | 1.79 | |
Grants | | | — | | | $ | — | |
Vested and released | | | — | | | $ | — | |
Forfeited | | | — | | | $ | — | |
Balance at December 31, 2024 | | | 110 | | | $ | 1.79 | |
Service as well as market and performance conditions determine the number of PSUs that the holder will earn from 0% to 150% of the target number of shares. The percentage received is based on the Company common stock price targets over a three-year service period. Additionally, the Company must achieve or exceed 75% of the year to date revenue target measured at the end of the quarter in which the price target is achieved. The market conditions have not currently been met. As of December 31, 2024, there was $4,000 of total unrecognized compensation cost related to unvested PSUs having a weighted average remaining contractual term of 0.3 years.
We estimate the fair value of PSUs with a market condition using a Monte Carlo simulation model as of the date of grant to forecast performance achievement of market price. Key inputs in the valuation include cost of equity, market price volatility and discount rate.
Share-Settled Obligation
Share-settled compensation to the Board of Directors and consultants were incurred and recognized as stock-based compensation expense and recorded in accrued expense. Within ninety days after the calendar year-end, the liabilities are settled in RSU grants and vest on the grant date. The share-settled obligations were $0.8 million and $0.1 million as of December 31, 2024 and 2023, respectively.
Employee Stock Purchase Plan (ESPP)
The Company maintains the 2016 Employee Stock Purchase Plan (ESPP) that provides employees an opportunity to purchase common stock through payroll deductions. The ESPP is implemented through consecutive 6-month offering periods commencing on March 1 and September 1 of each year. The purchase price is set at 85% of the fair market value of the Company's common stock on either the first or last trading day of the offering period, whichever is lower. Annual contributions are limited to the lower of 20% of an employee's eligible compensation or such other limits as apply under Section 423 of the Internal Revenue Code. The ESPP is intended to qualify as an employee stock purchase plan for purposes of Section 423 of the Internal Revenue Code.
Based on the 15% discount and the fair value of the option feature of the ESPP, it is considered compensatory. Compensation expense is calculated using the fair value of the employees’ purchase rights under the Black-Scholes model. The Company currently uses authorized and unissued shares to satisfy share award exercises.
During the year ended December 31, 2024, the Company received $0.2 million from the issuance of 45,809 shares and during the year ended December 31, 2023, the Company received $0.2 million from the issuance of 38,401 shares under the ESPP.
Note 13. Commitments and Contingencies
Potential Product Warranty Claims
The Company had a general warranty accrual of approximately $0.1 million as of each year ending December 31, 2024 and December 31, 2023.
Indemnification
In some agreements to which the Company is a party, the Company has agreed to indemnify the other party for certain matters, including, but not limited to product liability and intellectual property. To date, we have not recorded any material liabilities in the accompanying consolidated financial statements.
Note 14. Concentrations
Concentration of Sales and Accounts Receivable
The following represents customers that accounted for 10% or more of total revenue:
| | | | | | | | |
| | For the Years Ended December 31, | |
| | 2024 | | | 2023 | |
Customer A | | | 25 | % | | | 16 | % |
Customer B | | | 15 | % | | | 15 | % |
Customer C | | | 15 | % | | | 9 | % |
The following represents customers that accounted for 10% or more of total trade accounts receivable:
| | | | | | | | |
| | As of December, 31 | |
| | 2024 | | | 2023 | |
Customer A | | | 29 | % | | | 7 | % |
Customer B | | | 19 | % | | | 17 | % |
Customer C | | | 15 | % | | | 14 | % |
The allowance for credit losses as of December 31, 2024 and 2023 were not material.
Concentration of Purchases
During the year ended December 31, 2024, the Company’s products were manufactured by eight CMs with locations in China, Taiwan, Vietnam, Mexico and the United States.
Concentration of Cash
The Company’s cash deposits exceeded the Federal Deposit Insurance Corporation’s insured limits. The Company has not experienced losses on these accounts. Most of the Company's deposits are in several accounts at a large institutional bank.
Concentration of Property and Equipment
The Company’s property and equipment, net by geographic region, are as follows (in thousands):
| | | | | | | | |
| | As of December, 31 | |
| | 2024 | | | 2023 | |
| | | | | | |
North America | | $ | 1,841 | | | $ | 2,295 | |
Asia Pacific (APAC) | | | 56 | | | | 86 | |
Europe, Middle East and Africa (EMEA) | | | 96 | | | | 126 | |
Property and equipment, net | | $ | 1,993 | | | $ | 2,507 | |
Note 15. Revenues
Disaggregated revenues are as follows (in thousands):
| | | | | | | | |
| | For the Years Ended December 31, | |
| | 2024 | | | 2023 | |
By Market Group: | | | | | | |
Consumer | | $ | 21,691 | | | $ | 18,934 | |
Enterprise | | | 29,497 | | | | 27,209 | |
Automotive | | | 9,411 | | | | 9,897 | |
Total sales | | $ | 60,599 | | | $ | 56,040 | |
| | | | | | |
By Geography: | | | | | | |
North America | | $ | 35,896 | | | $ | 33,916 | |
China (including Hong Kong and Taiwan) | | | 22,354 | | | | 20,293 | |
Rest of the world | | | 2,349 | | | | 1,831 | |
Total sales | | $ | 60,599 | | | $ | 56,040 | |
| | | | | | |
Timing of revenue recognition: | | | | | | |
Products and services transferred at a point in time | | $ | 57,817 | | | $ | 52,736 | |
Products and services transferred over time | | | 2,782 | | | | 3,304 | |
Total sales | | $ | 60,599 | | | $ | 56,040 | |
Revenue generated from the United States was $35.9 million and $33.6 million for the year ended December 31, 2024 and 2023, respectively.
Contract liabilities are deferred revenues that were recorded when advance payment were received for remaining performance obligations that are recognized over time. The contract liabilities were $72,400 and $17,000 as of December 31, 2024 and 2023, respectively.
We have stock rotation return rights arrangements with certain customers to return a limited percentage of product. Estimated allowances for stock rotation were $0.3 million and $0.1 million as of December 31, 2024 and December 31, 2023, respectively and are included in accrued liabilities in the accompanying consolidated balance sheets. The expected product returns under the stock rotation arrangement were $0.1 million and $34,000 as of December 31, 2024 and December 31, 2023, respectively and are included in inventory in the accompanying consolidated balance sheets.
Note 16. Employee Benefit Plan
The Company’s 401(k) plan covers all U.S. employees beginning the first day of the month that follows the first 90 days of their employment. Under this plan, employees may elect to contribute up to 20% of their annual compensation to the 401(k) plan up to the statutorily prescribed annual limit. The Company matches 100% of the employee’s elective deferrals up to 4% of their annual compensation. The Company may make discretionary contributions to the 401(k) plan, but there were no discretionary contributions during the year ended December 31, 2024. The Company’s contribution expense was $0.4 million and $0.3 million for the years ended December 31, 2024 and 2023, respectively.
Note 17. Segment Information
Due to similarities of its products, methods of production and it's management and administrative structure, the Company operates as a single operating and reportable segment.
The following table presents segment revenue, gross profit, net loss and certain operating financial results of the Company’s single operating segment for the periods presented, as viewed by the CODM:
| | | | | | | |
| Years Ended December 31, | |
| 2024 | | | 2023 | |
Sales | $ | 60,599 | | | $ | 56,040 | |
Less cost of goods sold: | | | | | |
Other cost of goods sold | | 34,899 | | | | 34,553 | |
Stock-based compensation | | 311 | | | | 107 | |
Amortization of intangible assets | | 355 | | | | 355 | |
Depreciation | | 232 | | | | 262 | |
Gross profit | | 24,802 | | | | 20,763 | |
Gross margin | | 41 | % | | | 37 | % |
| | | | | |
Less research and development: | | | | | |
Other research and development expenses | | 10,207 | | | | 9,066 | |
Stock-based compensation expense | | 1,379 | | | | 1,062 | |
Severance and exit costs | | — | | | | 20 | |
Depreciation | | 278 | | | | 357 | |
Total research and development | | 11,864 | | | | 10,505 | |
| | | | | |
Less sales and marketing: | | | | | |
Other sales and marketing expenses | | 8,811 | | | | 8,269 | |
Stock-based compensation expense | | 379 | | | | 373 | |
Severance and exit costs | | — | | | | 481 | |
Depreciation | | 13 | | | | 3 | |
Total sales and marketing | | 9,203 | | | | 9,126 | |
| | | | | |
Less general and administrative: | | | | | |
Other general and administrative expenses | | 7,459 | | | | 8,629 | |
Stock-based compensation expense | | 2,566 | | | | 2,139 | |
Amortization of intangible assets | | 2,613 | | | | 2,614 | |
Severance and exit costs | | — | | | | 111 | |
Depreciation | | 25 | | | | 39 | |
Total general and administrative | | 12,663 | | | | 13,532 | |
| | | | | |
Loss from operations | | (8,928 | ) | | | (12,400 | ) |
| | | | | |
Plus interest income, net | | 115 | | | | 109 | |
| | | | | |
Income tax benefit (expense) | | 152 | | | | (128 | ) |
| | | | | |
Less other segment expenses (1) | | 27 | | | | 9 | |
| | | | | |
Net loss | $ | (8,688 | ) | | $ | (12,428 | ) |
(1) Other segment expenses are primarily foreign currency transaction remeasurements and franchise taxes.
The CODM reviews the segment assets that are reported in the Consolidated Balance Sheets.
Note 18. Subsequent Events
In January 2025, we received ERC refunds, under the CARES Act, of $1.4 million, net of professional fees, plus an additional $0.2 million for interest earnings. As of December 31, 2024, we have not recognized any ERC in our financial statements.
ITEM 9. CHANGES IN AND DISAGREEMENTS WITH ACCOUNTANTS ON ACCOUNTING AND FINANCIAL DISCLOSURE
None.
ITEM 9A. CONTROLS AND PROCEDURES
Conclusion Regarding the Effectiveness of Disclosure Controls and Procedures
We maintain disclosure controls and procedures that are designed to ensure that information required to be disclosed in our periodic and current reports that we file with the SEC is recorded, processed, summarized and reported within the time periods specified in the SEC’s rules and forms, and that such information is accumulated and communicated to our management, including our principal executive officer and principal financial officer, as appropriate, to allow timely decisions regarding required disclosure. In designing and evaluating the disclosure controls and procedures, management recognized that any controls and procedures, no matter how well designed and operated, can provide only reasonable and not absolute assurance of achieving the desired control objectives. In reaching a reasonable level of assurance, management necessarily was required to apply its judgment in evaluating the cost-benefit relationship of possible controls and procedures. In addition, the design of any system of controls also is based in part upon certain assumptions about the likelihood of future events, and there can be no assurance that any design will succeed in achieving its stated goals under all potential future conditions; over time, controls may become inadequate because of changes in conditions, or the degree of compliance with policies or procedures may deteriorate. Because of the inherent limitations in a cost-effective control system, misstatements due to error or fraud may occur and not be detected.
Our management, with the participation of our principal executive officer and principal financial officer, has evaluated the effectiveness of our disclosure controls and procedures as defined in Rules 13a-15(e) and 15d-15(e) under the Exchange Act, as of the end of the period covered by this annual report on Form 10- K. Based on such evaluation, our principal executive officer and principal financial officer have concluded that as of such date, our disclosure controls and procedures were effective at the reasonable assurance level.
Management’s Annual Report on Internal Control Over Financial Reporting
Our management is responsible for establishing and maintaining adequate internal controls over financial reporting, as such term is defined in Rules 13a-15(f) and 15d-15(f) of the Exchange Act. Internal control over financial reporting is a process designed under the supervision and with the participation of our management, including our principal executive officer and principal financial officer, to provide reasonable assurance regarding the reliability of financial reporting and the preparation of financial statements for external purposes in accordance with GAAP. Our internal control over financial reporting includes those policies and procedures that: (i) pertain to the maintenance of records that in reasonable detail accurately and fairly reflect the transactions and dispositions of our assets, (ii) provide reasonable assurance that transactions are recorded as necessary to permit preparation of financial statements in accordance with GAAP, and that our receipts and expenditures are being made only in accordance with authorizations of our management and directors, and (iii) provide reasonable assurance regarding prevention or timely detection of unauthorized acquisition, use or disposition of our assets that could have a material effect on our financial statements. Because of its inherent limitations, internal controls over financial reporting may not prevent or detect all misstatements. Therefore, even those systems determined to be effective can provide only reasonable assurance with respect to financial statement preparation and presentation.
We conducted an evaluation of the effectiveness of our internal control over financial reporting. Based on our evaluation, management has concluded that our internal control over financial reporting was effective as of December 31, 2024.
Attestation Report of the Registered Public Accounting Firm
This annual report on Form 10-K does not include an attestation report of our independent registered public
accounting firm due to our non-accelerated filer status.
Changes in Internal Control Over Financial Reporting
There have been no changes in our internal control over financial reporting (as defined in Rules 13a-15(f) and 15d-15(f) under the Exchange Act) during the quarter ended December 31, 2024 that has materially affected, or is reasonably likely to materially affect, our internal control over financial reporting.
ITEM 9B. OTHER INFORMATION
Director and Officer Trading Arrangements:
Rule 10b5-1 Trading Plans
From time to time, our officers (as defined in Rule 16a-1(f) of the Exchange Act) and directors may enter into Rule 10b5-1 or non-Rule 10b5-1 trading arrangements (as each such term is defined in Item 408 of Regulation S-K).
During the three months ended December 31, 2024, no director or officer adopted, modified or terminated any Rule 10b5-1 trading arrangement or non-Rule 10b5-1 trading arrangement.
ITEM 9C. DISCLOSURE REGARDING FOREIGN JURISDICTIONS THAT PREVENT INSPECTIONS
Not applicable.
PART III
ITEM 10. DIRECTORS, EXECUTIVE OFFICERS AND CORPORATE GOVERNANCE.
The information required by this item not otherwise set forth below will be contained in our definitive proxy statement to be filed with the SEC in connection with our 2025 Annual Meeting of Stockholders, or the Definitive Proxy Statement, which we expect to file with the SEC within 120 days after the close of our year ended December 31, 2024, under the headings “Election of Directors,” “Executive Officers,” and, if applicable, “Delinquent Section 16(a) Reports,” and is incorporated herein by reference.
Code of Business Conduct and Ethics
We adopted a Code of Business Conduct and Ethics that applies to our officers, directors and employees which is available, free of charge, on our website at www.airgain.com. The Code of Business Conduct and Ethics contains general guidelines for conducting the business of our company consistent with the highest standards of business ethics, and is intended to qualify as a “code of ethics” within the meaning of Section 406 of the Sarbanes-Oxley Act of 2002 and Item 406 of Regulation S-K. In addition, we intend to promptly disclose on our website in the future (i) the nature of any amendment to our Code of Business Conduct and Ethics that applies to our principal executive officer, principal financial officer, principal accounting officer or controller or persons performing similar functions, and (ii) the nature of any waiver, including an implicit waiver, from a provision of our Code of Business Conduct and Ethics that is granted to one of these specified officers, the name of such person who is granted the waiver and the date of the waiver.
Insider Trading Policy
On February 1, 2023, we have adopted the Airgain, Inc. Insider Trading Compliance Policy and Procedures, governing the purchase, sale, and/or other dispositions of our securities by our directors, officers, employees and other covered persons that are designed to promote compliance with insider trading laws, rules and regulations, and the Nasdaq Stock Market LLC listing rules, as applicable. A copy of our Insider Trading Compliance Policy and Procedures is filed as Exhibit 19.1 to this annual report on Form 10-K. It is our policy to comply with U.S. insider trading laws and regulations, including with respect to transactions in our own securities.
ITEM 11. EXECUTIVE COMPENSATION
The information required by this item will be contained in our Definitive Proxy Statement under the headings “Election of Directors” and “Executive Compensation and Other Information” and is incorporated herein by reference.
ITEM 12. SECURITY OWNERSHIP OF CERTAIN BENEFICIAL OWNERS AND MANAGEMENT AND RELATED STOCKHOLDER MATTERS
The information required by this item will be contained in our Definitive Proxy Statement under the heading “Security Ownership of Certain Beneficial Owners and Management” and is incorporated herein by reference.
The information required by Item 201(d) of Regulation S-K will be contained in our Definitive Proxy Statement under the heading “Executive Compensation and Other Information” and is incorporated herein by reference.
ITEM 13. CERTAIN RELATIONSHIPS AND RELATED TRANSACTIONS, AND DIRECTOR INDEPENDENCE
The information required by this item will be contained in our Definitive Proxy Statement under the headings “Certain Relationships and Related Person Transactions,” “Board Independence” and “Board Committees and Independence” and is incorporated herein by reference.
ITEM 14. PRINCIPAL ACCOUNTING FEES AND SERVICES
The information required by this item will be contained in our Definitive Proxy Statement under the heading “Independent Registered Public Accounting Firm’s Fees” and is incorporated herein by reference.
PART IV
ITEM 15. EXHIBITS, FINANCIAL STATEMENT SCHEDULES
The following documents are filed as part of this annual report on Form 10-K:
Reference is made to the Index to the registrant’s Financial Statements under Item 8 in Part II of this annual report on Form 10-K.
2.Financial Statement Schedules.
All schedules are omitted because they are not applicable, or the required information is shown in the financial statements or notes thereto.
The documents listed in the following Exhibit Index are incorporated by reference or are filed with this annual report on Form 10-K.
| | | | | | | | | | |
EXHIBIT INDEX |
| | | | Incorporated by Reference | | |
Exhibit
Number | | Exhibit Description | | Form | | Date | | Exhibit Number | | Filed Herewith |
| | | | | | | | | | |
3.1 | | Amended and Restated Certificate of Incorporation | | 8-K | | 08/17/2016 | | 3.1 | | |
| |
| | | | | | | | |
3.2 | | Amended and Restated Bylaws, effective as of February 1, 2023 | | 8-K | | 02/06/2023 | | 3.1 | | |
| |
| | | | | | | | |
4.1 | | Specimen stock certificate evidencing the shares of common stock | | S-1 | | 07/29/2016 | | 4.1 | | |
| |
| | | | | | | | |
4.2 | | Description of Registered Securities | | 10-K | | 03/21/2021 | | 4.3 | | |
| |
| | | | | | | | |
10.1 | | Form of Indemnity Agreement for Directors and Officers | | S-1 | | 07/29/2016 | | 10.4 | | |
| |
| | | | | | | | |
10.2# | | Airgain, Inc. 2013 Equity Incentive Plan | | S-1 | | 07/15/2016 | | 10.7 | | |
| |
| | | | | | | | |
10.3# | | Form of Stock Option Grant Notice and Stock Option Agreement under the Airgain, Inc. 2013 Equity Incentive Plan | | S-1 | | 07/15/2016 | | 10.8 | | |
| |
| | | | | | | | |
10.4# | | Airgain, Inc. 2016 Incentive Award Plan | | S-1 | | 07/29/2016 | | 10.10 | | |
| |
| | | | | | | | |
10.5# | | Form of Stock Option Agreement under the Airgain, Inc. 2016 Incentive Award Plan | | S-1 | | 07/29/2016 | | 10.12 | | |
| |
| | | | | | | | |
10.6# | | Form of Restricted Stock Unit Agreement under the Airgain, Inc. 2016 Incentive Award Plan | | 10-K | | 03/15/2019 | | 10.10 | | |
| |
| | | | | | | | |
10.7# | | Form of Performance Stock Unit Agreement under the Airgain, Inc. 2016 Incentive Award Plan | | 10-K | | 03/20/2023 | | 10.8 | | |
| | | | | | | | | | |
10.8# | | Airgain, Inc. 2016 Employee Stock Purchase Plan | | S-1 | | 07/29/2016 | | 10.12 | | |
| | | | | | | | | | |
10.9# | | Airgain, Inc. 2021 Employment Inducement Incentive Award Plan | | 10-K | | 03/20/2023 | | 10.10 | | |
| | | | | | | | | | |
10.10# | | Amendment to Airgain, Inc. 2021 Employment Inducement Incentive Award Plan | | S-8 | | 11/16/2022 | | 10.3 | | |
| | | | | | | | | | |
10.11# | | Form of Stock Option Agreement under the 2021 Employment Inducement Incentive Award Plan | | 10-K | | 02/19/2021 | | 10.19 | | |
| | | | | | | | | | |
10.12# | | Form of Restricted Stock Unit Agreement under the Airgain, Inc. 2021 Employment Inducement Incentive Award Plan | | S-8 | | 11/16/2022 | | 10.5 | | |
| | | | | | | | | | |
10.13# | | Form of Performance Stock Unit Agreement under the Airgain, Inc. 2021 Employment Inducement Incentive Award Plan | | S-8 | | 11/16/2022 | | 10.6 | | |
| | | | | | | | | | |
10.14# | | NimbeLink Corp. 2016 Stock Incentive Plan | | S-8 | | 03/03/2021 | | 10.7 | | |
| | | | | | | | | | |
10.15# | | Form of Stock Option Agreement under the NimbeLink Corp. 2016 Stock Incentive Plan | | S-8 | | 03/03/2021 | | 10.8 | | |
| | | | | | | | | | |
| | | | | | | | | | |
10.16# | | Non-Employee Director Compensation Program and Stock Ownership Guidelines (as amended and restated effective February 1, 2023) | | 10-K | | 03/20/2023 | | 10.17 | | |
| | | | | | | | | | |
10.17# | | Second Amended and Restated Employment Agreement, dated April 27, 2020, by and between Jacob Suen and the Registrant | | 10-K | | 02/19/2021 | | 10.12 | | |
| | | | | | | | | | |
10.18# | | Severance Agreement effective as of April 20, 2021 between Airgain, Inc. and Ali Sadri | | 10-K | | 03/21/2021 | | 10.22 | | |
| | | | | | | | | | |
10.19# | | Employment Agreement, dated October 17, 2022, between Airgain, Inc. and Michael Elbaz | | 10-K | | 03/20/2023 | | 10.22 | | |
| | | | | | | | | | |
10.20 | | Office Lease, dated June 13, 2013, by and between Kilroy Realty, L.P. and the Registrant | | S-1 | | 07/15/2016 | | 10.3 | | |
| | | | | | | | | | |
10.21 | | First Amendment to Office Lease, dated February 13, 2020, by and between Kilroy Realty, L.P. and the Registrant | | 10-Q | | 05/07/2020 | | 10.2 | | |
| | | | | | | | | | |
10.22^ | | Second Amendment to Office Lease, dated March 3, 2022, by and between Kilroy Realty, L.P. and the Registrant | | | | | | | | X |
| | | | | | | | | | |
10.23^ | | Third Amendment to Office Lease, dated December 31, 2024, by and between Kilroy Realty, L.P. and the Registrant | | | | | | | | X |
| | | | | | | | | | |
10.24 | | At-The-Market Issuance Sales Agreement by and between the Registrant and Craig-Hallum Capital Group LLC, dated March 6, 2024 | | 8-K | | 03/07/2024 | | 1.1 | | |
| | | | | | | | | | |
19.1 | | Insider Trading Compliance Policy and Procedures | | | | | | | | X |
| | | | | | | | | | |
21.1 | | List of Subsidiaries of the Registrant | | 10-K | | 03/06/2024 | | 21.1 | | |
| | | | | | | | | | |
23.1 | | Consent of Grant Thornton LLP, independent registered public accounting firm | | | | | | | | X |
| | | | | | | | | | |
31.1 | | Certification of Chief Executive Officer pursuant to Rules 13a-14 and 15d-14 promulgated pursuant to the Securities Exchange Act of 1934, as amended | | | | | | | | X |
| | | | | | | | | | |
31.2 | | Certification of Chief Financial Officer pursuant to Rules 13a-14 and 15d-14 promulgated pursuant to the Securities Exchange Act of 1934, as amended | | | | | | | | X |
| | | | | | | | | | |
32.1* | | Certification of Chief Executive Officer pursuant to Section 906 of the Sarbanes-Oxley Act of 2002 | | | | | | | | X |
| | | | | | | | | | |
32.2* | | Certification of Chief Financial Officer pursuant to Section 906 of the Sarbanes-Oxley Act of 2002 | | | | | | | | X |
| | | | | | | | | | |
97.1 | | Policy for Recovery of Erroneously Awarded Compensation | | 10-K | | 03/06/2024 | | 97.1 | | |
| | | | | | | | | | |
| | | | | | | | | | |
101.INS | | Inline XBRL Instance Document–the instance document does not appear in the Interactive Data File because its XBRL tags are embedded within the inline XBRL document | | | | | | | | |
| | | | | | | | | | |
101.SCH | | Inline XBRL Taxonomy Extension Schema Document | | | | | | | | |
| | | | | | | | | | |
101.CAL | | Inline XBRL Taxonomy Extension Calculation Linkbase Document | | | | | | | | |
| | | | | | | | | | |
101.DEF | | Inline XBRL Taxonomy Extension Definition Linkbase Document | | | | | | | | |
| | | | | | | | | | |
101.LAB | | Inline XBRL Taxonomy Extension Label Linkbase Document | | | | | | | | |
| | | | | | | | | | |
101.PRE | | Inline XBRL Taxonomy Extension Presentation Linkbase Document | | | | | | | | |
| | | | | | | | | | |
104 | | Cover Page Interactive Data File (formatted as inline XBRL and contained in Exhibit 101) | | | | | | | | |
# Indicates management contract or compensatory plan.
^ Certain schedules and annexes have been omitted in accordance with Item 601(a)(5) of Regulation S-K. A copy of any omitted schedule and/or annex will be furnished supplementally to the Securities and Exchange Commission upon request.
* These certifications are being furnished solely to accompany this annual report pursuant to 18 U.S.C. Section 1350 and are not being filed for purposes of Section 18 of the Securities Exchange Act of 1934 and are not to be incorporated by reference into any filing of the Registrant, whether made before or after the date hereof, regardless of any general incorporation language in such filing.
ITEM 16. FORM 10-K SUMMARY
None.
SIGNATURES
Pursuant to the requirements of Section 13 or 15(d) of the Securities Exchange Act of 1934, the registrant has duly caused this annual report to be signed on its behalf by the undersigned, thereunto duly authorized.
AIRGAIN, INC.
Date: February 27, 2025 /s/ Jacob Suen_______
Jacob Suen
President and Chief Executive Officer
(principal executive officer)
Pursuant to the requirements of the Securities Exchange Act of 1934, this annual report has been signed below by the following persons on behalf of the registrant and in the capacities and on the dates indicated.
| | |
Signature
| Title
| Date
|
|
|
|
/s/ Jacob Suen
Jacob Suen | President, Chief Executive Officer, and Director (Principal Executive Officer) | February 27, 2025 |
|
|
|
/s/ Michael Elbaz
Michael Elbaz | Chief Financial Officer and Secretary (Principal Financial and Accounting Officer) | February 27, 2025 |
|
|
|
/s/ James K. Sims
James K. Sims | Chairman | February 27, 2025 |
|
|
|
/s/ Kiva A. Allgood
Kiva A. Allgood | Director | February 27, 2025 |
|
|
|
/s/ Tzau-Jin Chung
Tzau-Jin Chung | Director | February 27, 2025 |
|
|
|
/s/ Joan H. Gillman
Joan H. Gillman | Director | February 27, 2025 |
| | |
/s/ Thomas A. Munro
Thomas A. Munro | Director | February 27, 2025 |
|
|
|
/s/ Arthur M. Toscanini
Arthur M. Toscanini | Director | February 27, 2025 |