UNITED STATES
SECURITIES AND EXCHANGE COMMISSION
WASHINGTON, D.C. 20549
FORM N-CSR
CERTIFIED SHAREHOLDER REPORT OF REGISTERED
MANAGEMENT INVESTMENT COMPANIES
Investment Company Act file number 811-21474
Oppenheimer Rochester Limited Term California Municipal Fund
(Exact name of registrant as specified in charter)
6803 South Tucson Way, Centennial, Colorado 80112-3924
(Address of principal executive offices) (Zip code)
Arthur S. Gabinet
OFI Global Asset Management, Inc.
225 Liberty Street, New York, New York 10281-1008
(Name and address of agent for service)
Registrant’s telephone number, including area code: (303) 768-3200
Date of fiscal year end: July 31
Date of reporting period: 7/31/2015
| Item 1. | Reports to Stockholders. |
| 3 | ||||||
| 16 | ||||||
| 21 | ||||||
| 23 | ||||||
| 55 | ||||||
| 57 | ||||||
| 58 | ||||||
| 59 | ||||||
| 60 | ||||||
| 64 | ||||||
| 81 | ||||||
| 82 | ||||||
Portfolio Proxy Voting Policies and Procedures; Updates to | 83 | |||||
| 84 | ||||||
| 93 | ||||||
Class A Shares
AVERAGE ANNUAL TOTAL RETURNS AT 7/31/15
| Class A Shares of the Fund | |||||||||||||||
| Without Sales Charge | With Sales Charge | Barclays Municipal 5 Year (4-6) Index | |||||||||||||
1-Year | 0.97 | % | -1.30 | % | 1.87 | % | |||||||||
5-Year | 3.25 | 2.79 | 2.86 | ||||||||||||
10-Year | 3.29 | 3.05 | 4.07 | ||||||||||||
Performance data quoted represents past performance, which does not guarantee future results. The investment return and principal value of an investment in the Fund will fluctuate so that an investor’s shares, when redeemed, may be worth more or less than their original cost. Fund returns include changes in share price, reinvested distributions, and a 2.25% maximum applicable sales charge except where “without sales charge” is indicated. Prior to April 1, 2012, the maximum initial sales charge for Class A shares of the Fund was 3.50%. Current performance may be lower or higher than the performance quoted. Returns do not consider capital gains or income taxes on an individual’s investment. For performance data current to the most recent month-end, visit oppenheimerfunds.com or call 1.800.CALL OPP (225.5677).
Oppenheimer Rochester is using social media to provide timely information related to muni market developments at www.twitter.com/RochesterFunds.
2 OPPENHEIMER ROCHESTER LIMITED TERM CALIFORNIA MUNICIPAL FUND
Amid low interest rates and coverage that we believe was often narrowly focused on the market’s challenges, Oppenheimer Limited Term California Municipal Fund delivered high levels of tax-free income in the 12 months ended July 31, 2015. The Fund’s Class A shares provided a distribution yield of 3.75% at net asset value (NAV) at the end of this reporting period trailing only one category peer – this Fund’s Y shares – in Lipper’s California Short-Intermediate Municipal Debt Funds category. The A shares also beat the average in Lipper’s California Municipal Debt Funds category, which consists of longer-term funds. Tax-free income generated by this Fund’s holdings contributed 100% of the Fund’s total return this reporting period.
MARKET OVERVIEW
Yields on high-grade municipal bonds rose during this reporting period as the market continued to anticipate changes to the Fed Funds target rate. Since October 2014, when the Federal Open Market Committee (FOMC) voted to end its program of purchasing mortgage-backed securities and long-term Treasuries in an effort to stimulate the economy (quantitative easing), speculation about the Fed’s plans often triggered movements in the equity and bond markets.
Near the end of this reporting period, Federal Reserve Chairman Janet Yellen told the U.S.
The average distribution yield in Lipper’s California Short-Intermediate Municipal Debt Funds category was 1.45% at the end of this reporting period. At 3.75%, the distribution yield at NAV for this Fund’s Class A shares was 230 basis points higher than the category average.
Congress that improving economic conditions “would likely make it appropriate for the central bank to raise rates at some point this year,” assuming the labor market continues to advance.
YIELDS & DISTRIBUTIONS FOR CLASS A SHARES
| ||||
| Dividend Yield w/o sales charge | 3.75% | |||
| ||||
| Dividend Yield with sales charge | 3.67 | |||
| ||||
| Standardized Yield | 2.98 | |||
| ||||
| Taxable Equivalent Yield | 6.13 | |||
| ||||
| Last distribution (7/28/15) | $ | 0.0100 | ||
| ||||
| Total distributions (8/1/14 to 7/31/15) | $ | 0.1250 | ||
| ||||
Endnotes for this discussion begin on page 18 of this report
3 OPPENHEIMER ROCHESTER LIMITED TERM CALIFORNIA MUNICIPAL FUND
While not definitive by any measure, the statement was more specific than earlier announcements from the Fed. For example, in October 2014, the FOMC said it planned to keep the Fed Funds target rate at its current level “for a considerable time” after the end of its bond-buying program. According to a statement released November 19, 2014, the FOMC observed solid job gains, a lower unemployment rate and increases in household and business spending. The committee’s concerns about inflation and falling energy prices, among other factors, played into its decision to “maintain its existing policy of reinvesting principal payments from its holdings of agency debt and agency mortgage-backed securities and rolling over maturing Treasury securities at auction.”
In December 2014, the committee said it could “be patient in beginning to normalize the stance of monetary policy,” but the word “patient” did not appear in the minutes of the February 2015 meeting. In a press conference after the February meeting, Ms. Yellen cautioned that “just because we removed the word ‘patient’ doesn’t mean we will be impatient.” Fed officials also stated in February that “the committee will increase the Fed Funds rate only when it has seen further improvement in the labor market and is reasonably confident that inflation will move back to its 2% objective over the medium term.”
By late April, the Fed had removed all calendar-based language relating to possible rate increases, citing a “transitory” decline in
output and employment during the first quarter of 2015 with declines in energy prices and non-energy imports keeping inflation low.
In a speech after the May 2015 FOMC meeting, Ms. Yellen said, “If the economy continues to improve as I expect, I think it will be appropriate at some point this year to take the initial step to raise the Federal Funds rate target and begin the process of normalizing monetary policy.”
With the current Fed Funds rate set between zero and 0.25% since December 2008, the only plausible change would be an increase. We remind investors that a change in the Fed Funds rate does not automatically translate into a change in longer-term interest rates, which are determined by the marketplace.
The Fund’s investment team will continue to search for value in the muni market as it seeks to produce competitive levels of tax-free income amid stable or changing market conditions.
As of July 31, 2015, the average yield on 30-year, AAA-rated muni bonds was 4.53%, up 109 basis points from July 31, 2014. The average yield on 10-year, AAA-rated muni bonds was 2.40% on July 31, 2015, up 18 basis points from the July 2014 date, and the average yield on 1-year, AAA-rated muni bonds was 0.37%, up 22 basis points from the July 2014 date.
In California, Governor Jerry Brown was re-elected in November 2014. At the start of his
4 OPPENHEIMER ROCHESTER LIMITED TERM CALIFORNIA MUNICIPAL FUND
second term, his state was leading the nation in job growth with a 67,300 increase in employment. Just 4 years earlier, California faced a $26.6 billion budget deficit and annual shortfalls of roughly $20 billion. Since then, an improving economy, budget cuts and “temporary,” voter-approved tax increases have helped the state eliminate these deficits. More than 1.3 million new jobs have been created in the past 4 years, and the unemployment rate has dropped from 12.1% to the current 6.3%.
Along with these improvements came ratings changes. In November 2014, Standard & Poor’s raised California’s general obligation (G.O.) debt rating to A-plus; in April 2015, S&P upgraded the state’s G.O.s to AA-minus, stating that “the rating action follows enactment of California’s 2015-2016 budget, which, in our view, marks another step forward in the state’s journey toward improved fiscal sustainability.” Moody’s Investors Service and Fitch Ratings have assigned ratings of Aa3 and A, respectively.
During the first half of this reporting period, the governor announced the 2015 California Infrastructure Plan with $57 billion to be spent mostly on the state’s transportation system over the next 5 years. Sources of funding are expected to include $5.5 billion of G.O.s and $1.6 billion of lease revenue bonds.
In other transportation news, the California High-Speed Rail Authority broke ground on the nation’s first high-speed rail system in January 2015. With a projected cost of $68
billion, the system is expected to run from San Francisco to the Los Angeles basin in less than 3 hours by 2029 and will eventually extend from Sacramento to San Diego.
California’s fiscal 2015 ended June 30 with a positive cash balance for the second time in a row, with general fund receipts surpassing the governor’s estimate by $859.4 million. Compared with fiscal 2014, state revenues were $12.7 billion higher, a 12.5% increase. Personal income tax revenues led the increase and came in $762.5 million higher than had been anticipated. The volatility of the Golden State’s revenue levels is tied to swings in personal income tax, which itself can fluctuate significantly because of taxpayers’ capital gains.
In late June 2015, legislators approved the $115.4 billion budget for fiscal year 2016. It blends savings with targeted spending programs in light of the state’s better-than-expected tax revenues. The budget also offers a state earned income tax credit, a freeze on tuition growth at the University of California, and a large increase in K-12 education spending. Approximately $1.9 billion is slated for the rainy day fund, bringing its balance to $3.5 billion. “California’s economy is thriving and this budget supports continued economic growth for our communities and our families,” said Assembly member Marc Levine.
At the end of the reporting period, Gov. Brown signed a new law (known as SB 222) securing revenues for G.O. bonds issued by local governments, thereby strengthening the
5 OPPENHEIMER ROCHESTER LIMITED TERM CALIFORNIA MUNICIPAL FUND
protections for bondholders in case an issuer filed for Ch. 9 bankruptcy. “Secured” creditors of a bankrupt municipality are supposed to be first in line to recover their money, but California law was previously quiet on whether local G.O.s were “secured” for that purpose. The new law removed that ambiguity.
Successful investors, we have found, maintain a long-term perspective regardless of the specific developments associated with any given reporting period. To maximize the benefits that municipal bond funds seek to provide, many investors reinvest their dividends and allow the income generated from their investments to compound over time.
FUND PERFORMANCE
Oppenheimer Limited Term California Municipal Fund held more than 1,000 securities as of July 31, 2015. The Fund was invested in a broad range of sectors, providing shareholders with a diversity of holdings that we believe would be difficult and costly to replicate in an individual portfolio.
The Fund’s Class A distribution yield at NAV was ranked second in Lipper’s California Short-Intermediate Municipal Debt Funds category as of July 31, 2015. At 3.75%, the distribution yield at NAV for this Fund’s Class A shares was 230 basis points higher than the category average, which was 1.45%. Additionally, for a taxable investment to have provided a greater benefit than an investment in this Fund, it would have had to yield more than 6.13%, based on the Fund’s
standardized yield as of July 31, 2015, and the current top federal and California income tax rates. As long-time investors know, yields on fixed-income funds rise when share prices fall, and yields have historically contributed the lion’s share of the long-term total returns generated by bonds.
Market conditions created pressure on the dividends of many fixed-income funds this reporting period. This Fund’s Class A dividend, which was 1.05 cents per share at the outset of the reporting period, was reduced to 1.0 cents per share beginning with the June 2015 payout. In all, the Fund distributed 12.5 cents per Class A share this reporting period.
The Fund remained invested in land development (or “dirt”) bonds as of July 31, 2015, which are Special Tax and Special Assessment bonds that help finance the infrastructure needs of new real estate development. At the end of this reporting period, the Special Tax sector represented 12.2% of total assets (12.7% of net assets) and the Special Assessment sector represented 2.0% of total assets (2.1% of total assets). Both sectors contributed positively to Fund performance this reporting period.
Overall, we believe that the bonds in these sectors have several appealing characteristics: The debt service payments securing these bonds are on parity with real estate taxes and senior to mortgage payments, and assessments or taxes must be paid by whoever owns the land when the tax bill comes due.
6 OPPENHEIMER ROCHESTER LIMITED TERM CALIFORNIA MUNICIPAL FUND
The Rochester Portfolio Management Team


Additionally, we continue to believe that improvements in the housing market and the general economy could further strengthen the credit profiles of these sectors.
The Fund’s holdings in municipal bonds issued by utilities represented 12.6% of total assets (13.2% of net assets) at the end of this reporting period. This set of holdings included water utilities with 6.6% of total assets (6.8% of net assets), electric utilities with 3.3% of total assets (3.5% of net assets), gas utilities with 1.4% of total
assets (1.5% of net assets), and sewer utilities with 1.3% of total assets (1.4% of net assets) as of July 31, 2015. Our holdings in these sectors consist of securities in the mid-range of the credit spectrum and include bonds issued by PREPA and PRASA. Each of these sectors contributed positively to Fund performance this reporting period.
As of July 31, 2015, the Fund continued to be invested in the municipal leases sector this reporting period, which accounted for 10.6% of the Fund’s total assets (11.1% of
7 OPPENHEIMER ROCHESTER LIMITED TERM CALIFORNIA MUNICIPAL FUND
The Rochester Credit Research Team


8 OPPENHEIMER ROCHESTER LIMITED TERM CALIFORNIA MUNICIPAL FUND
net assets), including some bonds issued in Puerto Rico. As state and local governments seek new ways to reduce costs and improve near-term cash flow, many lease all types of assets, including office space for public sector employees. The bonds held by this Fund are backed by the proceeds of these lease arrangements. The sector, which continues to be fundamentally sound, also contributed positively to the Fund’s total return this reporting period.
G.O. securities, which are backed by the full faith and taxing authority of state and local governments, comprised 10.6% of total assets (11.1% of net assets) as of July 31, 2015. The Fund’s holdings in this sector, which included bonds issued in various California municipalities and in the Commonwealth of Puerto Rico at the end of this reporting period, contributed positively to performance.
Securities issued in the Commonwealth of Puerto Rico, which are exempt from federal, state and local income taxes, represented 10.0% of the Fund’s total assets (10.4% of net assets) at the end of this reporting period. Puerto Rico’s “tobacco bonds” are excluded from this figure, as they are backed by proceeds from the tobacco Master Settlement Agreement (the MSA) and included in this Fund’s tobacco holdings. The Fund’s holdings, some of which are insured, include G.O. debt and securities from many different sectors. Most of the Fund’s investments in securities issued in Puerto
Rico are supported by taxes and other revenues and are designed to help finance electric utilities, highways and education, among other things.
During this reporting period, the government agreed to raise its sales tax rate to 11.5%, from 7.0%. By April 1, 2016, the sales tax will be replaced by a value-added tax (VAT), which is expected to lead to higher tax revenues for the Commonwealth.
News from the Commonwealth that it had once again passed a balanced budget was tempered by the sudden announcement by Governor Alejandro García Padilla in late June 2015 that Puerto Rico was not able to pay its debts. A government-commissioned study known as the Krueger Report reached a similar conclusion. Investors should note that the report is unaudited and does not compel the administration to implement the report’s recommendations.
The $9.8 billion budget for fiscal year 2016 includes approximately $1 billion to cover the Commonwealth’s G.O. debt-service obligations. Operational spending totals about $8.3 billion. The legislature also created a $275 million special fund from the Government Development Bank’s allocation to cover debt obligations and economic development. With the lowest operational spending level in at least 10 years, the budget reduces the operational budgets of most government agencies by 2% to 3% versus fiscal year 2015, which ended June 30, 2015. Nonprofits that provide essential social services
9 OPPENHEIMER ROCHESTER LIMITED TERM CALIFORNIA MUNICIPAL FUND
had their budgets decreased by no more than 10%.
A decision that we believe has important implications for the muni industry – and our funds in particular – was announced earlier in the reporting period: On February 6, 2015, a federal judge ruled that the Puerto Rico Public Corporation Debt Enforcement and Recovery Act (the “Recovery Act”) violated the U.S. Constitution and was invalid. As you may recall, the Recovery Act was passed in late June 2014 and the Oppenheimer Rochester municipal bond funds filed suit immediately, challenging the legislation that was designed to allow PREPA (the island’s electric utility authority), PRASA (the aqueduct and sewer authority) and PRHTA (the highway authority) to restructure their debt under the supervision of a Commonwealth court. On July 6, 2015, a federal appeals court unanimously affirmed the earlier decision.
The forbearance agreement that was reached in August 2014 between PREPA and many of its creditors, including this Fund, was extended several times beyond March 31, 2015, its initial expiration date. In the agreement, now set to expire September 15, 2015, the bondholders have agreed to forbear from exercising rights in connection with events that would constitute a default on PREPA bonds, and PREPA had agreed to a variety of financial terms and to submit a 5-year restructuring plan. PREPA made a full $415 million bond payment on July 1, 2015
and promised to reach a comprehensive restructuring plan with its creditors by September 1, 2015. PREPA’s payment was among more than $1 billion in transfers made by Puerto Rico public entities, as money came due at the start of the Commonwealth’s new fiscal year, July 1, 2015.
We are encouraged by the government’s efforts to reduce spending and increase revenue. We continue to believe that Puerto Rico must act within the tenets of the law, including its Constitution. Questions about the degree to which Puerto Rico and its agencies and authorities are committed to honoring their debt-service obligations created significant pressure on the prices of their securities, especially in the latter months of this reporting period. As a result, the Fund’s Puerto Rico holdings in aggregate had a negative impact on the Fund’s total return.
Our investment team’s commitment to protecting the interests of our shareholders is unwavering. Investors should note that deterioration of the Puerto Rican economy could have an adverse impact on Puerto Rico bonds and the performance of the Oppenheimer Rochester municipal funds that hold them, including this Fund. We will continue to monitor credit rating changes and other developments related to our Puerto Rico holdings closely.
Given the degree to which Oppenheimer Rochester funds have been cited in news coverage about the economic and fiscal
10 OPPENHEIMER ROCHESTER LIMITED TERM CALIFORNIA MUNICIPAL FUND
challenges facing Puerto Rico, we feel compelled to remind investors that all fund investments are actively managed. Our team is responsive to the dynamics of the market and may choose to adjust trading strategies in the interest of maximizing the potential benefits to our shareholders. Further, while we remain committed to keeping investors informed about our basic investing strategies, we do not provide comment about near-term trading strategies as we believe doing so might allow other market participants to impair our team’s ability to deliver shareholder value.
Update (as of September 21, 2015): In the weeks that followed the end of this reporting period, several developments in Puerto Rico and decisions by its agencies and officials kept the Commonwealth in the spotlight. For example, of the four Puerto Rico bond issuers that had payments due on August 3, 2015, three made their payments on time and in full; the Puerto Rico Finance Corporation (PFC) did not.
The PFC’s bond covenant called for a $58 million payment of principal and interest on August 3. Instead, a payment of $628,000 was made to PFC bondholders, a group that includes individual Americans on the mainland and in the Commonwealth, Puerto Rican credit unions, and Oppenheimer Rochester municipal bond funds and other retail municipal bond funds, among others. Prior to August 3, prices of PFC bonds fell sharply, a signal that the market had
anticipated this default; as of this update, these securities continued to trade in the teens.
As long-time investors know, net asset values (NAVs) of municipal bond funds are adjusted daily based on a third party’s pricing of all bonds in the marketplace. Thus, the NAVs of our funds, many of which have invested in the Commonwealth and its agencies and government instrumentalities, reflect all price changes. In light of the non-payment by the PFC, investors should expect volatility in the prices of PFC bonds and other bonds issued by the Commonwealth.
We note that two issuers of revenue-backed bonds – the Puerto Rico Sales Tax Financing Corporation (COFINA) and the Puerto Rico Municipal Finance Agency (MFA) – met their August 3, 2015 debt-service obligations on time and in full.
The COFINA bonds, which are backed by sales tax revenue, are held by several of the Oppenheimer Rochester funds. The MFA bonds – which are backed by ad valorem taxes that are based on the assessed value of real estate, personal property and/or the duty levied on imported items – also paid their bondholders, including Oppenheimer Rochester funds. We believe that the legal protections for the COFINA bonds and Puerto Rico’s general obligation (G.O.) debt are strong, and many of our funds have overweight positions in these bonds.
11 OPPENHEIMER ROCHESTER LIMITED TERM CALIFORNIA MUNICIPAL FUND
Also on August 3, 2015, the Government Development Bank for Puerto Rico (GDB) made loan payments to banks that totaled approximately $140 million.
Later in the month, on August 21, 2015, the Commonwealth petitioned the U.S. Supreme Court to overturn a federal district court ruling, which had been affirmed on appeal, related to the Recovery Act: that the Act violated the U.S. Constitution and was invalid. In its petition, the Commonwealth argues that Puerto Rico’s issuers should have the right to restructure their debt pursuant to the terms set forth in the Commonwealth’s Recovery Act. As bondholders, we see things differently: The Commonwealth and its issuers agreed to specific and carefully constructed bond covenants when they sold securities, and the contracts should be honored. Our team remains ready to defend the terms of our investments’ bond indentures.
On September 1, 2015, just prior to the expiration of the forbearance agreement, PREPA and the forbearing bondholders reached an agreement in principle on the major financial terms of a securitization transaction to lower PREPA’s debt service costs. Although the proposed agreement would result in a reduction in the par value of PREPA’s existing bonds, we nevertheless believe the agreement – if implemented – will be a win for bondholders.
Investors should note that the new bond structure would be bankruptcy remote, which serves to protect bondholders from event risks; that the term sheet requires that the new securitization bonds earn an investment-grade rating; that the deal requires high participation by all bondholders, and that insurers reach agreement with PREPA on the treatment of the insured bonds. If all goes as planned, bondholders will face neither the risks and uncertainties related to any inefficiency in PREPA’s operations nor the costs that would mount should any future litigation be required. While we expect that all parties will work toward a restructuring support agreement, we remind investors that there is no guarantee of either a timeline or implementation.
The forbearance agreement with bondholders, which has been extended repeatedly since first signed in August 2014 and was set to expire September 18, 2015, was extended on that date to October 1, 2015. However, PREPA did not secure an extension from its bond insurers, a group that guarantees $2.5 billion of the utility’s debt. According to PREPA’s chief restructuring officer, negotiations with the bond insurers will continue.
After a week-long delay that officials said was caused by Hurricane Erika, the Working Group that had been charged by the governor to deliver a 5-Year Fiscal Plan by September 1, 2015, handed in its plan. Like the government-commissioned Krueger Report that preceded it, the Working Group’s plan included a lengthy roster of policy changes and austerity measures
12 OPPENHEIMER ROCHESTER LIMITED TERM CALIFORNIA MUNICIPAL FUND
designed to resolve some of the Commonwealth’s financial difficulties. Politicians, including some candidates for the presidency, have voiced concerns about the current circumstances in Puerto Rico, and we believe the situation will remain political in the near term. In fact, many of the recommendations would require action by the U.S. Congress or the Puerto Rico Legislature. Even if all the recommendations were implemented, the plan indicated that Puerto Rico would still face a $14 billion financing gap between 2016 and 2020. In the weeks following the release of the plan, leading market analysts raised what we believe to be substantive questions about the accuracy of many of the plan’s figures.
Investors should note that the plan also seeks to reduce and/or restructure some of Puerto Rico’s debt. In a televised address, the governor said, “The plan itself will not get us out of the hole we find ourselves in. It’s time that creditors come to the table and share in the sacrifice.” We continue to believe that Puerto Rico must act within the tenets of the law, including its Constitution.
Separately, it is noteworthy that PRASA, the water utility, had announced plans to issue $750 million in bonds. Originally slated for August 25, 2015, the offering has since been revised to provide greater bondholder protections and higher initial yields and, as of this writing, was listed as “day-to-day.” PRASA’s ability to cut expenses and reduce its debt service obligations helped the utility
achieve stronger-than-expected results for fiscal year 2015 despite lower-than-expected revenue, according to results released in September.
The Oppenheimer Rochester team has been an active participant in negotiations with Puerto Rico officials, and shareholders should be confident that we will continue to work to protect our shareholders’ rights and best interests.
As of July 31, 2015, the Fund was invested in the hospital/healthcare sector, which represented 9.7% of total assets (10.1% of net assets) and contributed positively to Fund performance. Our holdings in this sector consist of securities across the credit spectrum, but most are investment grade.
Municipal bonds backed by proceeds from the tobacco MSA, the national litigation settlement with U.S. tobacco manufacturers, represented 8.9% of the Fund’s total assets (9.3% of net assets) at the end of this reporting period. The sector was a positive contributor to the Fund’s total return.
We believe the securities we hold in this sector are fundamentally sound credits, and we like that “tobacco bonds” can provide tax-exempt income for investors as well as benefits to the issuing states and territories. Our long-term view of the sector remains bullish and, given attractive valuations, we believe that it is likely we will continue to hold a greater percentage of tobacco bonds in our portfolios than our
13 OPPENHEIMER ROCHESTER LIMITED TERM CALIFORNIA MUNICIPAL FUND
peers. As in prior reporting periods, the tobacco bonds this Fund held during this reporting period made all scheduled payments of interest and principal on time and in full.
Many sectors in which the Fund maintained relatively smaller investments as of July 31, 2015, also contributed positively to performance. Investors benefited this reporting period from the tax increment financing (TIF) sector, marine/aviation facilities securities and the bonds in several other sectors.
As of July 31, 2015, only one sector detracted from the Fund’s performance—the sales tax sector, which represented 3.8% of total assets (4.0% of net assets). Debt-service payments on securities in this sector, including those issued in Puerto Rico and the U.S. Virgin Islands, are paid using the issuing municipality’s sales tax revenue. More than three-quarters of the Fund’s holdings in this sector were issued in Puerto Rico at the end of this reporting period, based on current market value.
During this reporting period, the Fund maintained an investment in municipal inverse-floating rate securities, which are tax-exempt securities with interest payments that move inversely to changes in short-term interest rates. “Inverse floaters” continued to provide high levels of income to funds across the industry during this reporting period and contributed positively to this Fund’s
performance. We continue to believe that “inverse floaters” are an essential element of this Fund’s portfolio because they can produce attractive yields under certain market conditions.
Our approach to municipal bond investing is flexible and responsive to market conditions. Shareholders should note that market conditions during this reporting period did not affect the Fund’s overall investment goals or cause it to pay any capital gain distributions. In closing, we believe that the Fund’s structure and sector composition as well as our time-tested strategies will continue to benefit fixed-income investors through interest rate and economic cycles.
INVESTMENT STRATEGY
The Rochester investment team focuses exclusively on municipal bonds and has consistently used a time-tested, value-oriented and security-specific approach to fund management. We know that market conditions can and do fluctuate, but we do not waver in our belief in the power of tax-free yield to help investors achieve their long-term objectives.
This “maturity managed” Fund uses a dollar-weighted approach to measuring the average maturity of its securities and seeks an average effective maturity of 5 years or less for its portfolio. While the Fund invests primarily in investment-grade municipal securities, it may invest up to 5% of its total assets in below-investment grade securities, or “junk” bonds; the percentage of assets is measured at the
14 OPPENHEIMER ROCHESTER LIMITED TERM CALIFORNIA MUNICIPAL FUND
time of purchase as is the credit quality of the securities. Additionally, the credit quality is based on Nationally Recognized Statistical Rating Organization (“NRSRO”) ratings or, if no NRSRO rating, on internal ratings. As of July 31, 2015, market movements or rating changes of municipal bonds, notably the Fund’s investments in Puerto Rico paper, caused the Fund’s below-investment-grade holdings to exceed this threshold. As a result, no further purchases of below-investment-grade bonds will be made until the Fund’s holdings of these types of bonds is once again below 5% of total assets.
Our team continually searches for bonds that we believe are undervalued and can provide a meaningful level of tax-free income until maturity. Rather than making allocation shifts based on expected market conditions, we search the marketplace for what we believe to be the best values for generating income. It remains important to note that we do not manage our funds based on predictions of interest rate changes.
Instead, our investment approach involves scouring the market for municipal securities that meet our stringent credit criteria and buying bonds that we believe will deliver above-average yields relative to peer funds. We focus on identifying inefficiencies in market pricing that can lead to investment advantages. We seek to maintain a thoughtful mix of industry sectors, maturities and credit ratings in this Fund’s portfolio.
The Rochester team also prospects for yield-enhancing opportunities in the secondary market, often picking up odd lots that we believe can add significant incremental yield to our portfolios. We will also look for non-rated issues with solid credit qualities, which we believe can often help enhance a fund’s tax-free yield. Investors should note that non-rated or unrated securities may or may not be the equivalent of investment grade securities.
The Rochester Way, we believe, distinguishes our approach to municipal investing from those of our competitors.
 |  |
Daniel G. Loughran,
Senior Vice President, Senior Portfolio Manager and Team Leader, on behalf of the rest of the Rochester portfolio management team: Scott S. Cottier, Troy E. Willis, Mark R. DeMitry, Michael L. Camarella, Charles S. Pulire and Elizabeth S. Mossow.
15 OPPENHEIMER ROCHESTER LIMITED TERM CALIFORNIA MUNICIPAL FUND
TOP TEN CATEGORIES
Special Tax | 12.2 | % | ||
Municipal Leases | 10.6 | |||
General Obligation | 10.6 | |||
Hospital/Healthcare | 9.7 | |||
Tobacco Master Settlement Agreement | 8.9 | |||
Tax Increment Financing (TIF) | 7.6 | |||
Water Utilities | 6.6 | |||
Marine/Aviation Facilities | 6.5 | |||
Sales Tax Revenue | 3.8 | |||
Electric Utilities | 3.3 |
Portfolio holdings are subject to change. Percentages are as of July 31, 2015, and are based on total assets.
CREDIT ALLOCATION
| NRSRO- Rated | Sub- Adviser- Rated | Total | |||||||||||||
AAA | 0.4 | % | 0.3 | % | 0.7 | % | |||||||||
AA | 37.6 | 0.0 | 37.6 | ||||||||||||
A | 22.7 | 2.4 | 25.1 | ||||||||||||
BBB | 15.0 | 10.5 | 25.5 | ||||||||||||
BB or lower | 9.8 | 1.3 | 11.1 | ||||||||||||
Total | 85.5 | % | 14.5 | % | 100.0 | % | |||||||||
The percentages above are based on the market value of the securities as of July 31, 2015, and are subject to change. OppenheimerFunds, Inc. determines the credit allocation of the Fund’s assets using ratings by nationally recognized statistical rating organizations (NRSROs), such as Standard & Poor’s. For any security rated by an NRSRO other than S&P, the sub-adviser, OppenheimerFunds, Inc., converts that security’s rating to the equivalent S&P rating. If two or more NRSROs have assigned a rating to a security, the highest rating is used. For securities not rated by an NRSRO, the sub-adviser uses its own credit analysis to assign ratings in categories similar to those of S&P. The use of similar categories is not an indication that the sub-adviser’s credit analysis process is consistent or comparable with any NRSRO’s process were that NRSRO to rate the same security.
For the purposes of this Credit Allocation table, securities rated within the NRSROs’ four highest categories—AAA, AA, A and BBB—are investment-grade securities. For further details, please consult the Fund’s prospectus or Statement of Additional Information.
16 OPPENHEIMER ROCHESTER LIMITED TERM CALIFORNIA MUNICIPAL FUND
Performance
DISTRIBUTION YIELDS
As of 7/31/15
| Without Sales Charge | With Sales Charge | |||||||||
Class A | 3.75 | % | 3.67 | % | ||||||
Class B | 2.73 | N/A | ||||||||
Class C | 2.89 | N/A | ||||||||
Class Y | 4.01 | N/A | ||||||||
STANDARDIZED YIELDS
For the 30 Days Ended 7/31/15
Class A | 2.98 | % | ||||
Class B | 2.27 | |||||
Class C | 2.29 | |||||
Class Y | 3.27 |
TAXABLE EQUIVALENT YIELDS
As of 7/31/15
Class A | 6.13 | % | ||||
Class B | 4.67 | |||||
Class C | 4.71 | |||||
Class Y | 6.73 |
AVERAGE ANNUAL TOTAL RETURNS WITHOUT SALES CHARGE AS OF 7/31/15
| Inception Date | 1-Year | 5-Year | 10-Year | Since Inception | ||||||||||||||||
Class A (OLCAX) | 2/25/04 | 0.97 | % | 3.25 | % | 3.29 | % | 4.01 | % | |||||||||||
Class B (OLCBX) | 2/25/04 | 0.13 | 2.36 | 2.76 | 3.72 | |||||||||||||||
Class C (OLCCX) | 2/25/04 | 0.22 | 2.47 | 2.48 | 3.20 | |||||||||||||||
Class Y (OLCYX) | 11/29/10 | 1.22 | N/A | N/A | 3.57 | |||||||||||||||
AVERAGE ANNUAL TOTAL RETURNS WITH SALES CHARGE AS OF 7/31/15
| Inception Date | 1-Year | 5-Year | 10-Year | Since Inception | ||||||||||||||||
Class A (OLCAX) | 2/25/04 | -1.30 | % | 2.79 | % | 3.05 | % | 3.80 | % | |||||||||||
Class B (OLCBX) | 2/25/04 | -3.76 | 2.19 | 2.76 | 3.72 | |||||||||||||||
Class C (OLCCX) | 2/25/04 | -0.76 | 2.47 | 2.48 | 3.20 | |||||||||||||||
Class Y (OLCYX) | 11/29/10 | 1.22 | N/A | N/A | 3.57 | |||||||||||||||
17 OPPENHEIMER ROCHESTER LIMITED TERM CALIFORNIA MUNICIPAL FUND
Performance data quoted represents past performance, which does not guarantee future results. The investment return and principal value of an investment in the Fund will fluctuate so that an investor’s shares, when redeemed, may be worth more or less than their original cost. Current performance may be lower or higher than the performance quoted. Returns do not consider capital gains or income taxes on an individual’s investments. For performance data current to the most recent month-end, visit oppenheimerfunds.com or call 1.800.CALL OPP (225.5677). Fund returns include changes in share price, reinvested distributions, and the applicable sales charge: for Class A shares, the current maximum initial sales charge of 2.25%; for Class B shares, the contingent deferred sales charge of 4% (1-year) and 1% (5-year); and for Class C, the contingent deferred sales charge of 1% for the 1-year period. Prior to April 1, 2012, the maximum initial sales charge for Class A shares of the Fund was 3.50%. There is no sales charge for Class Y shares. Because Class B shares convert to Class A shares 72 months after purchase, the 10-year return for Class B shares uses Class A performance for the period after conversion.
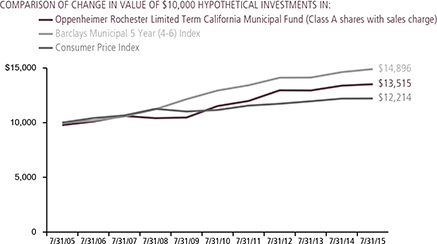
The Fund’s performance is compared to the performance of the Barclays Municipal Bond 5- Year (4-6) Index, which is an index of a broad range of investment-grade municipal bonds and is the 4- to 6- year component of the Barclays Municipal Bond Index, itself a measure of the general municipal bond market. The Fund’s performance is also compared to the Consumer Price Index, a non-securities index that measures changes in the inflation rate. Indices are unmanaged and cannot be purchased by investors. While index comparisons may be useful to provide a benchmark for the Fund’s performance, it must be noted that the Fund’s investments are not limited to the investments comprising the indices. Index performance includes reinvestment of income, but does not reflect transaction costs, fees, expenses or taxes. Index performance is shown for illustrative purposes only as a benchmark for the Fund’s performance, and does not predict or depict performance of the Fund. The Fund’s performance reflects the effects of the Fund’s business and operating expenses.
Distribution yields for Class A shares are based on dividends of $0.010 for the 35-day accrual period ended July 28, 2015. The yield without sales charge for Class A shares is calculated by dividing annualized dividends by the Class A net asset value on July 28, 2015; for the yield with sales charge, the denominator is the Class A maximum offering price on that date.
18 OPPENHEIMER ROCHESTER LIMITED TERM CALIFORNIA MUNICIPAL FUND
Distribution yields for Class B, C and Y are annualized based on dividends of $0.0075, $0.0077 and $0.0107, respectively, for the 35-day accrual period ended July 28, 2015, and on the corresponding net asset values on that date.
Standardized yield is based on the Fund’s net investment income for the 30-day period ended July 31, 2015, and either that date’s maximum offering price (for Class A shares) or net asset value (for the other classes). Each result is compounded semiannually and annualized. Falling share prices artificially increase yields.
The average distribution yield in Lipper’s California Short-Intermediate Municipal Debt Funds category was calculated based on the distributions and the final net asset values (NAVs) of the reporting period for the funds in each category. The calculation included 22 NAVs, one for each class of each fund in the category; a fund can have up to 4 classes. Lipper yields do not include sales charges – which, if included, would reduce results.
Taxable equivalent yield is based on the standardized yield and the top combined federal and California 2015 tax rate of 51.4%. Calculations factor in the 3.8% tax on unearned income under the Patient Protection and Affordable Care Act, as applicable. A portion of the Fund’s distributions may be subject to tax; distributions may also increase an investor’s exposure to the alternative minimum tax. Capital gains distributions are taxable as capital gains. Tax treatments of the Fund’s distributions and capital gains may vary by state; investors should consult a tax advisor to determine if the Fund is appropriate for them. Each result is compounded semiannually and annualized. Falling share prices artificially increase yields. This Report must be preceded or accompanied by a Fund prospectus.
The average yields for AAA-rated municipal securities are provided by Municipal Market Advisors (MMA) and are based on its benchmark of general obligation bonds structured with a 5% coupon. The MMA 5% benchmark is constructed using yields from the leading underwriters, who represent a significant percentage of the primary activity of the top 10 underwriters and therefore the total issuance.
Investments in “tobacco bonds,” which are backed by the proceeds a state or territory receives from the 1998 national litigation settlement with tobacco manufacturers, may be vulnerable to economic and/or legislative events that affect issuers in a particular municipal market sector. Annual payments by MSA-participating manufacturers, for example, hinge on many factors, including annual domestic cigarette shipments, inflation and the relative market share of non-participating manufacturers. To date, we believe consumption figures remain within an acceptable range of the assumptions used to structure MSA bonds. Future MSA payments could be reduced if consumption were to fall more rapidly than originally forecast.
The Fund’s investment strategy and focus can change over time. The mention of specific fund holdings does not constitute a recommendation by OppenheimerFunds, Inc. or its affiliates.
Before investing in any of the Oppenheimer funds, investors should carefully consider a fund’s investment objectives, risks, charges and expenses. Fund prospectuses and summary prospectuses contain this and other information about the funds, and may be obtained by asking your financial advisor, visiting oppenheimerfunds.com, or calling 1.800.CALL OPP (225.5677). Read prospectuses and summary prospectuses carefully before investing.
19 OPPENHEIMER ROCHESTER LIMITED TERM CALIFORNIA MUNICIPAL FUND
Shares of Oppenheimer funds are not deposits or obligations of any bank, are not guaranteed by any bank, are not insured by the FDIC or any other agency and involve investment risks, including the possible loss of the principal amount invested.
20 OPPENHEIMER ROCHESTER LIMITED TERM CALIFORNIA MUNICIPAL FUND
Fund Expenses. As a shareholder of the Fund, you incur two types of costs: (1) transaction costs, which may include sales charges (loads) on purchase payments and/or contingent deferred sales charges on redemptions; and (2) ongoing costs, including management fees; distribution and service fees; and other Fund expenses. These examples are intended to help you understand your ongoing costs (in dollars) of investing in the Fund and to compare these costs with the ongoing costs of investing in other mutual funds.
The examples are based on an investment of $1,000.00 invested at the beginning of the period and held for the entire 6-month period ended July 31, 2015.
Actual Expenses. The first section of the table provides information about actual account values and actual expenses. You may use the information in this section for the class of shares you hold, together with the amount you invested, to estimate the expense that you paid over the period. Simply divide your account value by $1,000.00 (for example, an $8,600.00 account value divided by $1,000.00 = 8.60), then multiply the result by the number in the first section under the heading entitled “Expenses Paid During 6 Months Ended July 31, 2015” to estimate the expenses you paid on your account during this period.
Hypothetical Example for Comparison Purposes. The second section of the table provides information about hypothetical account values and hypothetical expenses based on the Fund’s actual expense ratio for each class of shares, and an assumed rate of return of 5% per year for each class before expenses, which is not the Fund’s actual return. The hypothetical account values and expenses may not be used to estimate the actual ending account balance or expenses you paid for the period. You may use this information to compare the ongoing costs of investing in the Fund and other funds. To do so, compare this 5% hypothetical example for the class of shares you hold with the 5% hypothetical examples that appear in the shareholder reports of the other funds.
Please note that the expenses shown in the table are meant to highlight your ongoing costs only and do not reflect any transactional costs, such as front-end or contingent deferred sales charges (loads). Therefore, the “hypothetical” section of the table is useful in comparing ongoing costs only, and will not help you determine the relative total costs of owning different funds. In addition, if these transactional costs were included, your costs would have been higher.
21 OPPENHEIMER ROCHESTER LIMITED TERM CALIFORNIA MUNICIPAL FUND
| Actual | Beginning Account Value February 1, 2015 | Ending Account Value July 31, 2015 | Expenses 6 Months Ended | |||||||||||||||
Class A | $ | 1,000.00 | $ | 970.50 | $ | 4.36 | ||||||||||||
Class B | 1,000.00 | 967.50 | 8.18 | |||||||||||||||
Class C | 1,000.00 | 966.80 | 8.08 | |||||||||||||||
Class Y | 1,000.00 | 971.80 | 3.13 | |||||||||||||||
| Hypothetical | ||||||||||||||||||
(5% return before expenses) | ||||||||||||||||||
Class A | 1,000.00 | 1,020.38 | 4.47 | |||||||||||||||
Class B | 1,000.00 | 1,016.51 | 8.38 | |||||||||||||||
Class C | 1,000.00 | 1,016.61 | 8.28 | |||||||||||||||
Class Y | 1,000.00 | 1,021.62 | 3.21 | |||||||||||||||
Expenses are equal to the Fund’s annualized expense ratio for that class, multiplied by the average account value over the period, multiplied by 181/365 (to reflect the one-half year period). Those annualized expense ratios, excluding indirect expenses from affiliated funds, based on the 6-month period ended July 31, 2015 are as follows:
| Class | Expense Ratios | |||||
Class A | 0.89 | % | ||||
Class B | 1.67 | |||||
Class C | 1.65 | |||||
Class Y | 0.64 | |||||
22 OPPENHEIMER ROCHESTER LIMITED TERM CALIFORNIA MUNICIPAL FUND
STATEMENT OF INVESTMENTS July 31, 2015
| Principal Amount | Coupon | Maturity | Effective Maturity* | Value | ||||||||||||||||
| Municipal Bonds and Notes—101.8% | |||||||||||||||||||
| California—85.5% | |||||||||||||||||||
| $645,000 | Adelanto, CA Improvement Agency, Series B | 5.500 | % | 12/01/2023 | 12/01/2015 | A | $ | 647,741 | ||||||||||||
| 765,000 | Adelanto, CA Public Financing Authority, Series B1 | 6.300 | 09/01/2028 | 09/01/2015 | A | 768,718 | ||||||||||||||
| 200,000 | Adelanto, CA Public Utility Authority | 6.000 | 07/01/2023 | 07/01/2019 | A | 225,108 | ||||||||||||||
| 100,000 | Adelanto, CA Public Utility Authority | 5.875 | 07/01/2022 | 07/01/2019 | A | 112,290 | ||||||||||||||
| 975,000 | Adelanto, CA Public Utility Authority | 6.625 | 07/01/2031 | 07/01/2019 | A | 1,108,263 | ||||||||||||||
| 12,725,000 | Adelanto, CA Public Utility Authority | 6.750 | 07/01/2039 | 07/01/2019 | A | 14,472,142 | ||||||||||||||
| 5,985,000 | Adelanto, CA Public Utility Authority | 5.000 | 07/01/2024 | 12/08/2018 | A | 6,193,876 | ||||||||||||||
| 600,000 | Adelanto, CA Public Utility Authority | 6.250 | 07/01/2026 | 07/01/2019 | A | 676,104 | ||||||||||||||
| 1,000,000 | Alameda, CA Corridor Transportation Authority1 | 5.450 | 2 | 10/01/2025 | 10/01/2017 | A | 1,086,550 | |||||||||||||
| 1,750,000 | Alameda, CA Corridor Transportation Authority | 5.000 | 10/01/2029 | 10/01/2023 | A | 2,029,247 | ||||||||||||||
| 55,000 | Antelope Valley, CA Healthcare District1 | 5.200 | 01/01/2027 | 08/31/2015 | A | 55,140 | ||||||||||||||
| 30,000 | Antelope Valley, CA Healthcare District | 5.200 | 01/01/2017 | 08/31/2015 | A | 30,124 | ||||||||||||||
| 2,000,000 | Antelope Valley, CA Healthcare District1 | 5.200 | 01/01/2020 | 08/31/2015 | A | 2,007,220 | ||||||||||||||
| 180,000 | Arcadia, CA Redevel. Agency Tax Allocation (Central Redevel.) | 5.125 | 05/01/2023 | 08/31/2015 | A | 180,727 | ||||||||||||||
| 25,000 | Arcadia, CA Redevel. Agency Tax Allocation (Central Redevel.)1 | 5.125 | 05/01/2019 | 08/31/2015 | A | 25,079 | ||||||||||||||
| 15,000 | Aromas, CA Water District | 5.600 | 09/01/2018 | 09/01/2015 | A | 15,029 | ||||||||||||||
| 5,000,000 | Asuza, CA Public Financing Authority1 | 5.000 | 07/01/2031 | 01/01/2017 | A | 5,322,000 | ||||||||||||||
| 15,000 | Atwater, CA Redevel. Agency (Downtown Redevel.)1 | 5.500 | 06/01/2019 | 08/31/2015 | A | 15,023 | ||||||||||||||
| 25,000 | Auburn, CA Union School District COP1 | 5.750 | 09/01/2017 | 09/01/2015 | A | 25,084 | ||||||||||||||
| 25,000 | Baldwin Park, CA Public Financing Authority (San Gabriel River) | 5.000 | 08/01/2015 | 08/01/2015 | 25,000 | |||||||||||||||
| 120,000 | Baldwin Park, CA Redevel. Agency1 | 5.750 | 09/01/2030 | 09/01/2015 | A | 120,212 | ||||||||||||||
| 280,000 | Bay Area, CA Governments Association1 | 6.000 | 12/15/2024 | 12/15/2015 | A | 285,961 | ||||||||||||||
| 135,000 | Beaumont, CA Financing Authority, Series A3 | 7.000 | 09/01/2023 | 09/01/2015 | A | 135,417 | ||||||||||||||
| 655,000 | Beaumont, CA Financing Authority, Series A | 5.000 | 09/01/2027 | 09/01/2023 | A | 697,817 | ||||||||||||||
| 25,000 | Beaumont, CA Financing Authority, Series A | 5.700 | 09/01/2035 | 09/01/2015 | A | 25,531 | ||||||||||||||
| 855,000 | Beaumont, CA Financing Authority, Series C | 5.500 | 09/01/2029 | 09/01/2015 | A | 875,520 | ||||||||||||||
| 25,000 | Bell, CA Community Redevel. Agency Tax Allocation1 | 5.625 | 10/01/2033 | 08/31/2015 | A | 25,002 | ||||||||||||||
| 70,000 | Big Bear, CA Municipal Water District COP1 | 5.000 | 11/01/2024 | 08/31/2015 | A | 70,064 | ||||||||||||||
| 115,000 | Blythe, CA Financing Authority (City Hall & County Courthouse)1 | 5.500 | 09/01/2027 | 09/01/2015 | A | 115,133 | ||||||||||||||
| 50,000 | Blythe, CA Redevel. Agency (Redevel. Project No. 1 Tax Allocation) | 5.750 | 05/01/2034 | 08/31/2015 | A | 50,046 | ||||||||||||||
| 45,000 | Brea & Olinda, CA Unified School District COP | 5.500 | 08/01/2017 | 08/31/2015 | A | 45,202 | ||||||||||||||
| 100,000 | Buena Park, CA Community Redevel. Agency1 | 5.250 | 09/01/2025 | 09/01/2018 | A | 109,936 | ||||||||||||||
| 100,000 | Buena Park, CA Community Redevel. Agency1 | 5.625 | 09/01/2033 | 09/01/2018 | A | 111,113 | ||||||||||||||
| 50,000 | CA ABAG Finance Authority for Nonprofit Corporation (Children’s Hospital & Research Center at Oakland) | 5.250 | 12/01/2027 | 12/01/2017 | A | 55,275 | ||||||||||||||
| 15,000 | CA ABAG Finance Authority for NonProfit Corporation COP (Over 60-CEI / LLMC / CEI Obligated Group) | 5.200 | 11/15/2023 | 08/31/2015 | A | 15,059 | ||||||||||||||
| 35,000 | CA ABAG Finance Authority for NonProfit Corporations (Bijou Woods Apartments)1 | 5.200 | 12/01/2021 | 09/01/2015 | A | 35,065 | ||||||||||||||
23 OPPENHEIMER ROCHESTER LIMITED TERM CALIFORNIA MUNICIPAL FUND
STATEMENT OF INVESTMENTS Continued
| Principal Amount | Coupon | Maturity | Effective Maturity* | Value | ||||||||||||||||
| California (Continued) | |||||||||||||||||||
| $250,000 | CA ABAG Finance Authority for NonProfit Corporations (Episcopal Senior Communities)1 | 5.000 | % | 07/01/2024 | 07/01/2022 | A | $ | 281,600 | ||||||||||||
| 8,625,000 | CA ABAG Finance Authority for NonProfit Corporations (HSH / SRHF / SRMB Obligated Group)1 | 6.000 | 05/15/2029 | 05/15/2019 | A | 9,830,085 | ||||||||||||||
| 5,000 | CA ABAG Finance Authority for NonProfit Corporations COP1 | 5.800 | 03/01/2023 | 09/01/2015 | A | 5,017 | ||||||||||||||
| 5,000 | CA ABAG Finance Authority for NonProfit Corporations COP | 5.600 | 11/01/2023 | 08/31/2015 | A | 5,021 | ||||||||||||||
| 205,000 | CA ABAG Finance Authority for NonProfit Corporations COP (Palo Alto Gardens Apartments)1 | 5.350 | 10/01/2029 | 08/31/2015 | A | 205,184 | ||||||||||||||
| 35,000 | CA ABAG Finance Authority for NonProfit Corporations COP (Tarzana Treatment Center) | 5.200 | 12/01/2023 | 09/09/2015 | A | 35,186 | ||||||||||||||
| 360,000 | CA Affordable Hsg. Agency (Merced County Hsg. Authority) | 6.500 | 01/01/2033 | 12/31/2015 | A | 359,968 | ||||||||||||||
| 545,000 | CA Communities Transportation Revenue COP | 5.250 | 06/01/2025 | 06/01/2022 | A | 620,690 | ||||||||||||||
| 575,000 | CA Communities Transportation Revenue COP | 5.250 | 06/01/2026 | 06/01/2022 | A | 649,796 | ||||||||||||||
| 605,000 | CA Communities Transportation Revenue COP | 5.250 | 06/01/2027 | 06/01/2022 | A | 679,972 | ||||||||||||||
| 515,000 | CA Communities Transportation Revenue COP | 5.250 | 06/01/2024 | 06/01/2022 | A | 590,200 | ||||||||||||||
| 490,000 | CA Communities Transportation Revenue COP | 5.250 | 06/01/2023 | 06/01/2022 | A | 566,489 | ||||||||||||||
| 65,000 | CA Community College Financing Authority (GCCCD / PCCD / STTJCCD Obligated Group)1 | 5.000 | 04/01/2021 | 10/01/2015 | A | 65,285 | ||||||||||||||
| 680,000 | CA Community College Financing Authority (GCCCD / PCCD / STTJCCD Obligated Group)1 | 5.625 | 04/01/2026 | 10/01/2015 | A | 682,700 | ||||||||||||||
| 55,000 | CA County Tobacco Securitization Agency (Golden Gate Tobacco)1 | 4.500 | 06/01/2021 | 12/14/2017 | B | 54,251 | ||||||||||||||
| 435,000 | CA County Tobacco Securitization Agency (TASC) | 6.000 | 06/01/2042 | 11/30/2015 | A | 434,965 | ||||||||||||||
| 390,000 | CA County Tobacco Securitization Agency (TASC)1 | 5.875 | 06/01/2035 | 11/30/2015 | A | 389,973 | ||||||||||||||
| 7,055,000 | CA County Tobacco Securitization Agency (TASC)1 | 5.750 | 06/01/2029 | 11/30/2015 | A | 7,054,506 | ||||||||||||||
| 505,000 | CA County Tobacco Securitization Agency (TASC)1 | 5.100 | 2 | 06/01/2028 | 06/29/2023 | B | 487,668 | |||||||||||||
| 10,700,000 | CA County Tobacco Securitization Agency (TASC) | 6.068 | 4 | 06/01/2046 | 05/29/2046 | B | 482,891 | |||||||||||||
| 575,000 | CA County Tobacco Securitization Agency (TASC)1 | 5.000 | 06/01/2026 | 11/30/2015 | A | 574,977 | ||||||||||||||
| 305,000 | CA County Tobacco Securitization Agency (TASC)1 | 5.875 | 06/01/2043 | 11/30/2015 | A | 304,979 | ||||||||||||||
| 220,000 | CA County Tobacco Securitization Agency (TASC)1 | 5.500 | 06/01/2033 | 01/10/2018 | B | 218,550 | ||||||||||||||
| 495,000 | CA County Tobacco Securitization Agency (TASC)1 | 5.625 | 06/01/2023 | 11/30/2015 | A | 494,970 | ||||||||||||||
| 5,230,000 | CA County Tobacco Securitization Agency (TASC)1 | 6.000 | 06/01/2035 | 11/30/2015 | A | 5,229,582 | ||||||||||||||
| 170,000 | CA County Tobacco Securitization Agency (TASC)1 | 5.875 | 06/01/2027 | 11/30/2015 | A | 169,988 | ||||||||||||||
| 1,005,000 | CA Dept. of Transportation COP | 5.250 | 03/01/2016 | 09/01/2015 | A | 1,009,311 | ||||||||||||||
| 690,000 | CA Dept. of Water Resources (Center Valley) | 5.250 | 07/01/2022 | 08/31/2015 | A | 692,939 | ||||||||||||||
24 OPPENHEIMER ROCHESTER LIMITED TERM CALIFORNIA MUNICIPAL FUND
| Principal Amount | Coupon | Maturity | Effective Maturity* | Value | ||||||||||||||||
| California (Continued) | |||||||||||||||||||
| $1,135,000 | CA Educational Facilities Authority (California College of Arts & Crafts) | 5.000 | % | 06/01/2022 | 06/01/2022 | $ | 1,274,968 | |||||||||||||
| 400,000 | CA Educational Facilities Authority (California College of Arts & Crafts) | 5.000 | 06/01/2024 | 06/01/2022 | A | 447,232 | ||||||||||||||
| 80,000 | CA Educational Facilities Authority (California Western School of Law)1 | 5.000 | 10/01/2028 | 08/31/2015 | A | 80,120 | ||||||||||||||
| 85,000 | CA Educational Facilities Authority (California Western School of Law) | 5.000 | 10/01/2018 | 08/31/2015 | A | 85,321 | ||||||||||||||
| 1,390,000 | CA Educational Facilities Authority (Dominican University of California)1 | 5.000 | 12/01/2036 | 12/01/2016 | A | 1,443,056 | ||||||||||||||
| 20,000 | CA Educational Facilities Authority (Pepperdine University)1 | 5.000 | 12/01/2035 | 12/01/2015 | A | 20,323 | ||||||||||||||
| 95,000 | CA Educational Facilities Authority (Southwestern Law School)1 | 5.000 | 11/01/2023 | 08/31/2015 | A | 95,174 | ||||||||||||||
| 265,000 | CA Educational Facilities Authority (University of Redlands) | 5.000 | 10/01/2025 | 10/01/2015 | A | 267,157 | ||||||||||||||
| 235,000 | CA Educational Facilities Authority (University of Redlands)1 | 5.000 | 10/01/2025 | 10/01/2015 | A | 236,779 | ||||||||||||||
| 3,975,000 | CA GO1 | 5.000 | 09/01/2028 | 03/01/2016 | A | 4,073,540 | ||||||||||||||
| 10,000 | CA GO1 | 5.625 | 09/01/2024 | 09/01/2015 | A | 10,045 | ||||||||||||||
| 5,000 | CA GO1 | 5.000 | 02/01/2033 | 08/31/2015 | A | 5,018 | ||||||||||||||
| 1,465,000 | CA GO1 | 5.900 | 04/01/2023 | 10/01/2015 | A | 1,478,903 | ||||||||||||||
| 5,000 | CA GO | 5.000 | 10/01/2028 | 08/31/2015 | A | 5,020 | ||||||||||||||
| 500,000 | CA GO1 | 5.000 | 08/01/2025 | 02/01/2017 | A | 531,520 | ||||||||||||||
| 5,000 | CA GO1 | 5.600 | 09/01/2021 | 09/01/2015 | A | 5,023 | ||||||||||||||
| 5,000 | CA GO1 | 5.200 | 11/01/2031 | 08/31/2015 | A | 5,019 | ||||||||||||||
| 25,000 | CA GO1 | 5.000 | 08/01/2023 | 08/31/2015 | A | 25,102 | ||||||||||||||
| 50,000 | CA GO1 | 5.000 | 08/01/2028 | 08/31/2015 | A | 50,200 | ||||||||||||||
| 2,995,000 | CA GO1 | 5.750 | 11/01/2017 | 11/01/2015 | A | 3,037,200 | ||||||||||||||
| 5,000 | CA GO1 | 6.000 | 08/01/2019 | 02/01/2016 | A | 5,146 | ||||||||||||||
| 90,000 | CA GO1 | 6.000 | 08/01/2024 | 02/01/2016 | A | 92,533 | ||||||||||||||
| 5,000 | CA GO1 | 6.000 | 05/01/2024 | 11/01/2015 | A | 5,072 | ||||||||||||||
| 905,000 | CA GO1 | 6.250 | 10/01/2019 | 10/01/2015 | A | 914,222 | ||||||||||||||
| 20,000 | CA GO1 | 6.000 | 05/01/2018 | 11/01/2015 | A | 20,294 | ||||||||||||||
| 75,000 | CA GO | 5.900 | 03/01/2025 | 09/01/2015 | A | 75,354 | ||||||||||||||
| 20,000 | CA GO1 | 6.000 | 08/01/2015 | 08/01/2015 | 20,000 | |||||||||||||||
| 55,000 | CA GO1 | 6.000 | 10/01/2021 | 10/01/2015 | A | 55,535 | ||||||||||||||
| 230,000 | CA GO1 | 5.900 | 04/01/2023 | 10/01/2015 | A | 232,183 | ||||||||||||||
| 65,000 | CA GO1 | 5.600 | 09/01/2021 | 09/01/2015 | A | 65,295 | ||||||||||||||
| 15,000 | CA GO1 | 5.750 | 11/01/2017 | 11/01/2015 | A | 15,211 | ||||||||||||||
| 35,000 | CA GO | 5.000 | 10/01/2023 | 08/31/2015 | A | 35,140 | ||||||||||||||
| 20,000 | CA GO | 5.125 | 10/01/2027 | 08/31/2015 | A | 20,084 | ||||||||||||||
| 5,000 | CA GO | 5.000 | 10/01/2018 | 08/31/2015 | A | 5,020 | ||||||||||||||
| 45,000 | CA GO1 | 6.000 | 03/01/2024 | 09/01/2015 | A | 45,217 | ||||||||||||||
| 15,000 | CA GO1 | 5.250 | 10/01/2015 | 10/01/2015 | 15,130 | |||||||||||||||
| 1,305,000 | CA GO1 | 5.000 | 11/01/2032 | 11/01/2017 | A | 1,419,305 | ||||||||||||||
| 5,000 | CA GO | 5.000 | 02/01/2033 | 08/31/2015 | A | 5,018 | ||||||||||||||
| 5,000 | CA GO | 5.000 | 10/01/2017 | 08/31/2015 | A | 5,020 | ||||||||||||||
| 4,970,000 | CA GO1 | 5.250 | 09/01/2024 | 09/01/2021 | A | 5,969,616 | ||||||||||||||
| 20,000 | CA GO | 5.000 | 10/01/2023 | 08/31/2015 | A | 20,080 | ||||||||||||||
| 25,000 | CA GO1 | 5.500 | 03/01/2020 | 09/01/2015 | A | 25,112 | ||||||||||||||
25 OPPENHEIMER ROCHESTER LIMITED TERM CALIFORNIA MUNICIPAL FUND
STATEMENT OF INVESTMENTS Continued
| Principal Amount | Coupon | Maturity | Effective Maturity* | Value | ||||||||||||||||
| California (Continued) | |||||||||||||||||||
| $85,000 | CA GO1 | 5.750 | % | 03/01/2023 | 09/01/2015 | A | $ | 85,394 | ||||||||||||
| 195,000 | CA GO1 | 5.250 | 06/01/2021 | 12/01/2015 | A | 198,297 | ||||||||||||||
| 110,000 | CA GO1 | 5.375 | 06/01/2026 | 12/01/2015 | A | 111,871 | ||||||||||||||
| 80,000 | CA GO1 | 5.250 | 06/01/2017 | 12/01/2015 | A | 81,368 | ||||||||||||||
| 10,000 | CA GO1 | 5.000 | 08/01/2028 | 08/31/2015 | A | 10,040 | ||||||||||||||
| 20,000 | CA GO1 | 5.250 | 06/01/2016 | 12/01/2015 | A | 20,343 | ||||||||||||||
| 10,000 | CA GO | 4.750 | 02/01/2017 | 08/31/2015 | A | 10,038 | ||||||||||||||
| 65,000 | CA GO1 | 5.500 | 04/01/2019 | 10/01/2015 | A | 65,582 | ||||||||||||||
| 15,000 | CA GO1 | 5.500 | 03/01/2020 | 09/01/2015 | A | 15,067 | ||||||||||||||
| 15,000 | CA GO1 | 5.375 | 06/01/2026 | 12/01/2015 | A | 15,255 | ||||||||||||||
| 40,000 | CA GO | 5.625 | 05/01/2026 | 08/31/2015 | A | 40,180 | ||||||||||||||
| 110,000 | CA GO1 | 5.000 | 12/01/2026 | 12/01/2016 | A | 116,478 | ||||||||||||||
| 10,000 | CA GO1 | 5.625 | 10/01/2026 | 10/01/2015 | A | 10,090 | ||||||||||||||
| 30,000 | CA GO | 5.000 | 02/01/2032 | 08/31/2015 | A | 30,108 | ||||||||||||||
| 25,000 | CA GO | 5.000 | 06/01/2017 | 08/31/2015 | A | 25,102 | ||||||||||||||
| 235,000 | CA GO1 | 5.625 | 10/01/2023 | 10/01/2015 | A | 237,124 | ||||||||||||||
| 5,000 | CA GO | 5.000 | 10/01/2018 | 08/31/2015 | A | 5,020 | ||||||||||||||
| 125,000 | CA GO1 | 5.000 | 11/01/2022 | 11/01/2015 | A | 126,505 | ||||||||||||||
| 40,000 | CA GO | 5.000 | 02/01/2033 | 08/31/2015 | A | 40,144 | ||||||||||||||
| 40,000 | CA GO1 | 5.000 | 11/01/2022 | 11/01/2015 | A | 40,482 | ||||||||||||||
| 25,000 | CA GO | 5.250 | 04/01/2019 | 08/31/2015 | A | 25,107 | ||||||||||||||
| 25,000 | CA GO | 5.250 | 04/01/2018 | 08/31/2015 | A | 25,107 | ||||||||||||||
| 605,000 | CA GO1 | 6.250 | 10/01/2019 | 10/01/2015 | A | 611,165 | ||||||||||||||
| 25,000 | CA GO | 5.250 | 04/01/2021 | 08/31/2015 | A | 25,106 | ||||||||||||||
| 20,000 | CA GO1 | 5.500 | 10/01/2022 | 10/01/2015 | A | 20,178 | ||||||||||||||
| 80,000 | CA GO1 | 5.625 | 10/01/2021 | 10/01/2015 | A | 80,729 | ||||||||||||||
| 5,000 | CA GO | 5.000 | 10/01/2022 | 08/31/2015 | A | 5,020 | ||||||||||||||
| 50,000 | CA GO | 5.000 | 06/01/2019 | 08/31/2015 | A | 50,203 | ||||||||||||||
| 2,000,000 | CA Health Facilities Financing Authority (Cedars-Sinai Medical Center)1 | 5.000 | 11/15/2019 | 11/15/2015 | A | 2,027,360 | ||||||||||||||
| 150,000 | CA Health Facilities Financing Authority (Cedars-Sinai Medical Center)1 | 5.000 | 11/15/2027 | 11/15/2015 | A | 151,923 | ||||||||||||||
| 2,000,000 | CA Health Facilities Financing Authority (CHCW)1 | 5.250 | 03/01/2024 | 03/01/2016 | A | 2,054,980 | ||||||||||||||
| 1,750,000 | CA Health Facilities Financing Authority (El Camino Hospital)1 | 5.000 | 02/01/2032 | 02/01/2025 | A | 1,955,362 | ||||||||||||||
| 3,000,000 | CA Health Facilities Financing Authority (El Camino Hospital)1 | 5.000 | 02/01/2033 | 02/01/2025 | A | 3,331,590 | ||||||||||||||
| 10,000 | CA Health Facilities Financing Authority (FF/OCTC/SCADP Obligated Group) | 6.500 | 12/01/2022 | 08/31/2015 | A | 10,050 | ||||||||||||||
| 1,890,000 | CA Health Facilities Financing Authority (Pomona Valley Hospital Medical Center)1 | 5.625 | 07/01/2019 | 08/31/2015 | A | 1,897,919 | ||||||||||||||
| 35,000 | CA Health Facilities Financing Authority (San Fernando Valley Community Mental Health Center) | 5.250 | 06/01/2023 | 08/31/2015 | A | 35,140 | ||||||||||||||
| 50,000 | CA Health Facilities Financing Authority (SCADP)1 | 5.150 | 05/01/2016 | 08/31/2015 | A | 50,197 | ||||||||||||||
| 15,000 | CA Health Facilities Financing Authority (Sunny View Lutheran Home)1 | 5.500 | 01/01/2019 | 08/31/2015 | A | 15,052 | ||||||||||||||
| 110,000 | CA Health Facilities Financing Authority (Sunny View Lutheran Home) | 5.100 | 01/01/2024 | 08/31/2015 | A | 110,426 | ||||||||||||||
26 OPPENHEIMER ROCHESTER LIMITED TERM CALIFORNIA MUNICIPAL FUND
| Principal Amount | Coupon | Maturity | Effective Maturity* | Value | ||||||||||||||||
| California (Continued) | |||||||||||||||||||
| $1,000,000 | CA Health Facilities Financing Authority (Sutter Health)1 | 5.250 | % | 08/15/2031 | 08/15/2021 | A | $ | 1,166,050 | ||||||||||||
| 2,000,000 | CA HFA (Home Mtg.)1 | 4.950 | 08/01/2026 | 02/01/2016 | A | 2,029,640 | ||||||||||||||
| 550,000 | CA HFA (Home Mtg.)1,3 | 5.500 | 02/01/2042 | 02/01/2016 | A | 559,575 | ||||||||||||||
| 2,050,000 | CA HFA (Home Mtg.)1,3 | 5.500 | 08/01/2042 | 08/01/2016 | A | 2,107,523 | ||||||||||||||
| 280,000 | CA HFA (Home Mtg.)1,3 | 5.000 | 08/01/2037 | 02/01/2016 | A | 286,286 | ||||||||||||||
| 1,000,000 | CA HFA (Home Mtg.)1 | 4.950 | 08/01/2023 | 02/01/2017 | A | 1,028,620 | ||||||||||||||
| 5,650,000 | CA HFA (Home Mtg.)1 | 5.300 | 08/01/2023 | 08/01/2017 | A | 5,788,199 | ||||||||||||||
| 3,000,000 | CA HFA (Home Mtg.)1 | 5.450 | 08/01/2028 | 08/01/2017 | A | 3,052,080 | ||||||||||||||
| 1,060,000 | CA HFA, Series C1,3 | 5.750 | 08/01/2030 | 02/01/2016 | A | 1,078,942 | ||||||||||||||
| 1,075,000 | CA HFA, Series E1 | 5.000 | 02/01/2024 | 02/01/2016 | A | 1,079,558 | ||||||||||||||
| 10,000 | CA Infrastructure and Economic Devel. (Energy Efficiency) | 5.000 | 03/01/2017 | 09/01/2015 | A | 10,040 | ||||||||||||||
| 65,000 | CA Infrastructure and Economic Devel. (Scripps Research Institute) | 5.625 | 07/01/2020 | 08/31/2015 | A | 65,285 | ||||||||||||||
| 3,550,000 | CA Infrastructure and Economic Devel. (Scripps Research Institute)1 | 5.750 | 07/01/2030 | 08/31/2015 | A | 3,564,697 | ||||||||||||||
| 45,000 | CA M-S-R Public Power Agency (San Juan) | 6.000 | 07/01/2022 | 09/30/2015 | A | 53,954 | ||||||||||||||
| 335,000 | CA Municipal Finance Authority (Biola University)1 | 5.000 | 10/01/2029 | 10/01/2023 | A | 368,413 | ||||||||||||||
| 465,000 | CA Municipal Finance Authority (Biola University) | 5.000 | 10/01/2030 | 10/01/2023 | A | 508,966 | ||||||||||||||
| 50,000 | CA Municipal Finance Authority (Biola University)1 | 5.625 | 10/01/2023 | 04/01/2018 | A | 54,595 | ||||||||||||||
| 1,025,000 | CA Municipal Finance Authority (Community Hospitals of Central California)1 | 5.250 | 02/01/2024 | 02/01/2019 | A | 1,139,943 | ||||||||||||||
| 230,000 | CA Municipal Finance Authority (Emerson College)1 | 5.000 | 01/01/2028 | 01/01/2022 | A | 254,964 | ||||||||||||||
| 1,100,000 | CA Municipal Finance Authority (NorthBay Healthcare Group)1 | 5.000 | 11/01/2035 | 11/01/2024 | A | 1,177,693 | ||||||||||||||
| 440,000 | CA Municipal Finance Authority (NorthBay Healthcare Group)1 | 5.000 | 11/01/2030 | 11/01/2024 | A | 474,597 | ||||||||||||||
| 1,030,000 | CA Pollution Control Financing Authority (Southern California Water Company) | 5.500 | 12/01/2026 | 08/31/2015 | A | 1,034,130 | ||||||||||||||
| 750,000 | CA Pollution Control Financing Authority (WM / MGC / USAWCA / WMC&R / WMC / CWM / WWI Obligated Group)1 | 5.125 | 5 | 11/01/2023 | 11/01/2015 | A | 765,915 | |||||||||||||
| 1,250,000 | CA Pollution Control Financing Authority (WM/WMC/USAWCA Obligated Group)1 | 5.000 | 01/01/2022 | 01/01/2016 | A | 1,295,512 | ||||||||||||||
| 95,000 | CA Public Works1 | 6.625 | 11/01/2034 | 05/08/2016 | A | 95,534 | ||||||||||||||
| 4,370,000 | CA Public Works1 | 6.500 | 09/01/2017 | 09/17/2016 | B | 4,653,001 | ||||||||||||||
| 10,000 | CA Public Works | 5.250 | 10/01/2016 | 08/31/2015 | A | 10,042 | ||||||||||||||
| 210,000 | CA Public Works | 5.250 | 10/01/2015 | 08/31/2015 | A | 210,892 | ||||||||||||||
| 45,000 | CA Public Works (California Community Colleges)1 | 5.125 | 06/01/2029 | 08/31/2015 | A | 45,167 | ||||||||||||||
| 70,000 | CA Public Works (California Community Colleges) | 5.250 | 12/01/2016 | 08/31/2015 | A | 70,294 | ||||||||||||||
| 10,000 | CA Public Works (California Community Colleges) | 5.125 | 06/01/2025 | 08/31/2015 | A | 10,041 | ||||||||||||||
| 270,000 | CA Public Works (California Community Colleges)1 | 5.000 | 12/01/2017 | 08/31/2015 | A | 274,976 | ||||||||||||||
27 OPPENHEIMER ROCHESTER LIMITED TERM CALIFORNIA MUNICIPAL FUND
STATEMENT OF INVESTMENTS Continued
| Principal Amount | Coupon | Maturity | Effective Maturity* | Value | ||||||||||||||||
| California (Continued) | |||||||||||||||||||
| $140,000 | CA Public Works (California Community Colleges) | 5.250 | % | 12/01/2015 | 08/31/2015 | A | $ | 140,591 | ||||||||||||
| 450,000 | CA Public Works (California Community Colleges) | 5.250 | 12/01/2015 | 08/31/2015 | A | 451,899 | ||||||||||||||
| 60,000 | CA Public Works (California Community Colleges) | 5.000 | 12/01/2016 | 08/31/2015 | A | 60,239 | ||||||||||||||
| 50,000 | CA Public Works (California Community Colleges) | 5.125 | 09/01/2016 | 09/01/2015 | A | 50,205 | ||||||||||||||
| 215,000 | CA Public Works (California Community Colleges) | 5.250 | 09/01/2019 | 09/01/2015 | A | 215,877 | ||||||||||||||
| 25,000 | CA Public Works (California Community Colleges) | 5.000 | 12/01/2016 | 08/31/2015 | A | 25,100 | ||||||||||||||
| 90,000 | CA Public Works (California Community Colleges) | 5.250 | 12/01/2016 | 08/31/2015 | A | 90,378 | ||||||||||||||
| 25,000 | CA Public Works (California Highway Patrol) | 5.000 | 11/01/2015 | 08/31/2015 | A | 25,101 | ||||||||||||||
| 50,000 | CA Public Works (California Science Center) | 5.250 | 10/01/2022 | 08/31/2015 | A | 50,199 | ||||||||||||||
| 360,000 | CA Public Works (California Science Center) | 5.250 | 10/01/2017 | 08/31/2015 | A | 361,505 | ||||||||||||||
| 2,000,000 | CA Public Works (California State Prisons)1 | 5.750 | 10/01/2031 | 10/01/2021 | A | 2,435,620 | ||||||||||||||
| 400,000 | CA Public Works (California State University) | 5.500 | 09/01/2015 | 08/31/2015 | A | 401,788 | ||||||||||||||
| 50,000 | CA Public Works (California State University) | 5.375 | 10/01/2017 | 08/31/2015 | A | 50,214 | ||||||||||||||
| 5,000 | CA Public Works (California State University) | 5.000 | 09/01/2015 | 08/31/2015 | A | 5,020 | ||||||||||||||
| 50,000 | CA Public Works (California State University) | 5.375 | 10/01/2016 | 08/31/2015 | A | 50,215 | ||||||||||||||
| 600,000 | CA Public Works (California State University) | 5.250 | 10/01/2015 | 08/31/2015 | A | 602,550 | ||||||||||||||
| 750,000 | CA Public Works (Dept. of Corrections and Rehabilitation)1 | 5.750 | 11/01/2029 | 11/01/2019 | A | 881,302 | ||||||||||||||
| 350,000 | CA Public Works (Dept. of Corrections) | 5.500 | 10/01/2019 | 08/31/2015 | A | 351,498 | ||||||||||||||
| 60,000 | CA Public Works (Dept. of Corrections) | 5.250 | 09/01/2015 | 08/31/2015 | A | 60,256 | ||||||||||||||
| 100,000 | CA Public Works (Dept. of Corrections) | 5.375 | 10/01/2015 | 08/31/2015 | A | 100,435 | ||||||||||||||
| 110,000 | CA Public Works (Dept. of Corrections)1 | 5.000 | 09/01/2018 | 09/01/2015 | A | 110,375 | ||||||||||||||
| 45,000 | CA Public Works (Dept. of Corrections) | 5.625 | 10/01/2020 | 08/31/2015 | A | 45,193 | ||||||||||||||
| 45,000 | CA Public Works (Dept. of Corrections)1 | 5.000 | 09/01/2018 | 09/01/2015 | A | 45,153 | ||||||||||||||
| 65,000 | CA Public Works (Dept. of Corrections) | 5.500 | 10/01/2017 | 08/31/2015 | A | 65,285 | ||||||||||||||
| 125,000 | CA Public Works (Dept. of Corrections) | 5.375 | 10/01/2016 | 08/31/2015 | A | 125,537 | ||||||||||||||
| 75,000 | CA Public Works (Dept. of Corrections) | 5.250 | 09/01/2015 | 08/31/2015 | A | 75,321 | ||||||||||||||
| 225,000 | CA Public Works (Dept. of Corrections) | 5.250 | 09/01/2015 | 08/31/2015 | A | 225,958 | ||||||||||||||
| 50,000 | CA Public Works (Dept. of Corrections)1 | 5.250 | 09/01/2016 | 09/01/2015 | A | 50,206 | ||||||||||||||
| 370,000 | CA Public Works (Dept. of Corrections) | 5.500 | 10/01/2018 | 08/31/2015 | A | 371,609 | ||||||||||||||
| 2,000,000 | CA Public Works (Dept. of Forestry & Fire Protecton)1 | 5.000 | 04/01/2026 | 04/01/2016 | A | 2,057,900 | ||||||||||||||
| 15,000 | CA Public Works (Dept. of General Services East End) | 5.250 | 12/01/2020 | 08/31/2015 | A | 15,063 | ||||||||||||||
| 100,000 | CA Public Works (Dept. of General Services) | 5.250 | 06/01/2025 | 08/31/2015 | A | 100,399 | ||||||||||||||
| 170,000 | CA Public Works (Dept. of General Services) | 5.250 | 12/01/2017 | 08/31/2015 | A | 170,711 | ||||||||||||||
| 515,000 | CA Public Works (Dept. of General Services) | 5.250 | 12/01/2016 | 08/31/2015 | A | 517,163 | ||||||||||||||
| 200,000 | CA Public Works (Dept. of General Services)1 | 5.250 | 06/01/2030 | 08/31/2015 | A | 200,840 | ||||||||||||||
| 220,000 | CA Public Works (Dept. of General Services)1 | 5.000 | 12/01/2027 | 08/31/2015 | A | 221,269 | ||||||||||||||
| 505,000 | CA Public Works (Dept. of General Services) | 5.250 | 12/01/2019 | 08/31/2015 | A | 507,060 | ||||||||||||||
| 750,000 | CA Public Works (Dept. of General Services) | 5.250 | 12/01/2018 | 08/31/2015 | A | 753,105 | ||||||||||||||
| 75,000 | CA Public Works (Dept. of General Services) | 5.000 | 12/01/2023 | 08/31/2015 | A | 75,290 | ||||||||||||||
| 85,000 | CA Public Works (Dept. of General Services)1 | 5.125 | 12/01/2021 | 08/31/2015 | A | 86,876 | ||||||||||||||
| 180,000 | CA Public Works (Dept. of General Services)1 | 5.000 | 03/01/2027 | 09/01/2015 | A | 181,039 | ||||||||||||||
28 OPPENHEIMER ROCHESTER LIMITED TERM CALIFORNIA MUNICIPAL FUND
| Principal Amount | Coupon | Maturity | Effective Maturity* | Value | ||||||||||||||||
| California (Continued) | |||||||||||||||||||
| $20,000 | CA Public Works (Dept. of General Services) | 4.800 | % | 03/01/2019 | 09/01/2015 | A | $ | 20,074 | ||||||||||||
| 20,000 | CA Public Works (Dept. of General Services) | 5.250 | 06/01/2028 | 08/31/2015 | A | 20,080 | ||||||||||||||
| 25,000 | CA Public Works (Dept. of General Services) | 5.250 | 03/01/2020 | 09/01/2015 | A | 25,100 | ||||||||||||||
| 125,000 | CA Public Works (Dept. of General Services)1 | 5.250 | 12/01/2015 | 08/31/2015 | A | 125,665 | ||||||||||||||
| 20,000 | CA Public Works (Dept. of Justice Building) | 5.250 | 11/01/2020 | 08/31/2015 | A | 20,080 | ||||||||||||||
| 30,000 | CA Public Works (Dept. of Justice) | 5.250 | 11/01/2016 | 08/31/2015 | A | 30,126 | ||||||||||||||
| 50,000 | CA Public Works (Dept. of Justice) | 5.125 | 11/01/2017 | 08/31/2015 | A | 50,204 | ||||||||||||||
| 35,000 | CA Public Works (Dept. of Mental Health) | 5.250 | 04/01/2023 | 08/31/2015 | A | 35,149 | ||||||||||||||
| 10,000 | CA Public Works (Dept. of Youth Authority) | 5.500 | 10/01/2017 | 08/31/2015 | A | 10,044 | ||||||||||||||
| 30,000 | CA Public Works (Dept. of Youth Authority) | 5.500 | 10/01/2018 | 08/31/2015 | A | 30,130 | ||||||||||||||
| 250,000 | CA Public Works (Dept. of Youth Authority) | 5.375 | 10/01/2015 | 08/31/2015 | A | 251,087 | ||||||||||||||
| 875,000 | CA Public Works (Judicial Council) | 5.000 | 03/01/2026 | 03/01/2023 | A | 1,027,687 | ||||||||||||||
| 3,000,000 | CA Public Works (Judicial Council)1 | 5.250 | 12/01/2026 | 12/01/2021 | A | 3,597,270 | ||||||||||||||
| 25,000 | CA Public Works (Library & Courts Annex)1 | 5.000 | 05/01/2018 | 08/31/2015 | A | 25,018 | ||||||||||||||
| 1,465,000 | CA Public Works (State Universities) | 5.500 | 12/01/2018 | 08/31/2015 | A | 1,471,461 | ||||||||||||||
| 460,000 | CA Public Works (State Universities) | 5.400 | 10/01/2022 | 08/31/2015 | A | 461,960 | ||||||||||||||
| 50,000 | CA Public Works (Trustees California State University)1 | 5.000 | 10/01/2019 | 08/31/2015 | A | 50,719 | ||||||||||||||
| 20,000 | CA Public Works (Various California State Universities) | 5.550 | 09/01/2016 | 09/01/2015 | A | 20,089 | ||||||||||||||
| 1,390,000 | CA Public Works (Various Community Colleges)1 | 5.625 | 03/01/2016 | 09/01/2015 | A | 1,409,794 | ||||||||||||||
| 2,295,000 | CA Public Works (Various Community Colleges)1 | 5.625 | 03/01/2019 | 09/01/2015 | A | 2,326,900 | ||||||||||||||
| 1,020,000 | CA Public Works (Various Community Colleges) | 5.625 | 03/01/2016 | 09/01/2015 | A | 1,024,600 | ||||||||||||||
| 140,000 | CA Public Works (Various Community Colleges) | 5.200 | 09/01/2017 | 09/01/2015 | A | 140,580 | ||||||||||||||
| 135,000 | CA Public Works (Various State Universities) | 5.400 | 10/01/2022 | 08/31/2015 | A | 135,575 | ||||||||||||||
| 1,160,000 | CA Public Works (Various State Universities) | 5.400 | 10/01/2022 | 08/31/2015 | A | 1,164,942 | ||||||||||||||
| 280,000 | CA Public Works (Various State Universities) | 5.500 | 09/01/2015 | 08/31/2015 | A | 281,252 | ||||||||||||||
| 30,000 | CA Public Works Board (California Highway Patrol) | 5.250 | 11/01/2020 | 08/31/2015 | A | 30,120 | ||||||||||||||
| 400,000 | CA School Finance Authority Charter School (Coastal Academy) | 5.000 | 10/01/2022 | 01/15/2020 | B | 437,416 | ||||||||||||||
| 750,000 | CA State University1 | 5.000 | 11/01/2017 | 11/01/2015 | A | 759,157 | ||||||||||||||
| 1,030,000 | CA State University1 | 5.000 | 11/01/2035 | 11/01/2015 | A | 1,042,576 | ||||||||||||||
| 30,000 | CA State University1 | 5.000 | 11/01/2026 | 09/04/2015 | A | 30,134 | ||||||||||||||
| 25,000 | CA Statewide CDA | 6.625 | 09/01/2027 | 09/01/2015 | A | 25,048 | ||||||||||||||
| 7,000,000 | CA Statewide CDA (Bakersfield Reassessment District)1 | 5.000 | 09/02/2022 | 07/03/2020 | B | 7,628,460 | ||||||||||||||
| 1,220,000 | CA Statewide CDA (California Hsg. Foundation)1 | 5.250 | 12/01/2027 | 12/01/2017 | A | 1,285,477 | ||||||||||||||
| 1,040,000 | CA Statewide CDA (Cathedral City Heritage Park / Glendale Heritage Park Obligated Group) | 5.200 | 06/01/2036 | 08/31/2015 | A | 1,046,261 | ||||||||||||||
| 100,000 | CA Statewide CDA (CHF-Irvine-UCI East Campus Apartments)1 | 6.000 | 05/15/2023 | 05/15/2018 | A | 111,053 | ||||||||||||||
| 1,425,000 | CA Statewide CDA (DHlth / BMH / CmntyHOSB / MSrH / SFMH / SNVMMH / CMF Obligated Group)1 | 5.500 | 07/01/2031 | 07/01/2017 | A | 1,530,307 | ||||||||||||||
| 2,825,000 | CA Statewide CDA (DHlth / BMH / CmntyHOSB / MSrH / SFMH / SNVNNH / CMF Obligated Group)1 | 5.500 | 07/01/2030 | 06/29/2017 | A | 3,032,101 | ||||||||||||||
| 45,000 | CA Statewide CDA (Escrow Term) | 6.750 | 09/01/2037 | 09/01/2015 | A | 45,076 | ||||||||||||||
29 OPPENHEIMER ROCHESTER LIMITED TERM CALIFORNIA MUNICIPAL FUND
STATEMENT OF INVESTMENTS Continued
| Principal Amount | Coupon | Maturity | Effective Maturity* | Value | ||||||||||||||||
| California (Continued) | |||||||||||||||||||
| $1,500,000 | CA Statewide CDA (EVLAJHA / GVLAJHA / JHAGS / LAJHFTA / FEV / JHAW / BCSC / ASN Obligated Group) | 4.750 | % | 08/01/2020 | 11/01/2016 | A | $ | 1,504,770 | ||||||||||||
| 185,000 | CA Statewide CDA (John Muir Health)1 | 5.000 | 08/15/2036 | 08/15/2016 | A | 192,413 | ||||||||||||||
| 2,220,000 | CA Statewide CDA (John Muir Health)1 | 5.000 | 08/15/2029 | 08/15/2016 | A | 2,310,354 | ||||||||||||||
| 2,475,000 | CA Statewide CDA (John Muir Health)1 | 5.000 | 08/15/2028 | 08/15/2016 | A | 2,576,524 | ||||||||||||||
| 3,745,000 | CA Statewide CDA (John Muir Health)1 | 5.000 | 08/15/2034 | 08/15/2016 | A | 3,895,849 | ||||||||||||||
| 380,000 | CA Statewide CDA (Rio Bravo) | 6.300 | 12/01/2018 | 07/04/2018 | B | 371,480 | ||||||||||||||
| 3,225,000 | CA Statewide CDA (Sherman Oaks Health System)1 | 5.000 | 08/01/2022 | 12/02/2020 | B | 3,665,922 | ||||||||||||||
| 300,000 | CA Statewide CDA (SJHS / SJHO / SJHosp / MHRMC / QVHN / SRMH / SAHS / SJHE / RMHF / CHlthSys /MHL / MHPT Obligated Group)1 | 5.125 | 07/01/2024 | 07/01/2018 | A | 334,029 | ||||||||||||||
| 450,000 | CA Statewide CDA (Water & Wastewater) | 5.125 | 10/01/2022 | 08/31/2015 | A | 451,750 | ||||||||||||||
| 25,000 | CA Statewide CDA Community Facilities District | 6.350 | 09/01/2021 | 09/01/2015 | A | 25,060 | ||||||||||||||
| 790,000 | CA Statewide CDA COP (CVHP / CVMC / FH Obligated Group)1 | 5.125 | 04/01/2023 | 08/31/2015 | A | 791,090 | ||||||||||||||
| 120,000 | CA Statewide CDA COP (Internext Group)1 | 5.375 | 04/01/2030 | 08/31/2015 | A | 120,332 | ||||||||||||||
| 365,000 | CA Statewide CDA School Facilities (47th & Main) | 5.125 | 07/01/2022 | 09/05/2019 | A | 388,309 | ||||||||||||||
| 5,000 | CA Statewide CDA Water & Wastewater | 5.250 | 10/01/2027 | 08/31/2015 | A | 5,021 | ||||||||||||||
| 5,000 | CA Statewide CDA Water & Wastewater1 | 5.000 | 10/01/2031 | 08/31/2015 | A | 5,018 | ||||||||||||||
| 10,000 | CA Statewide CDA Water & Wastewater | 5.750 | 10/01/2025 | 08/31/2015 | A | 10,045 | ||||||||||||||
| 3,398,000 | CA Statewide Financing Authority Tobacco Settlement (TASC)1 | 5.625 | 05/01/2029 | 10/31/2015 | A | 3,397,762 | ||||||||||||||
| 1,620,000 | CA Statewide Financing Authority Tobacco Settlement (TASC)1 | 5.625 | 05/01/2029 | 10/31/2015 | A | 1,619,887 | ||||||||||||||
| 3,395,000 | CA Statewide Financing Authority Tobacco Settlement (TASC) | 6.000 | 05/01/2037 | 10/31/2015 | A | 3,394,728 | ||||||||||||||
| 50,000 | CA Water Resource Devel. GO, Series L | 4.500 | 08/01/2017 | 08/31/2015 | A | 50,177 | ||||||||||||||
| 25,000 | CA Water Resource Devel. GO, Series P & N | 5.000 | 06/01/2020 | 08/31/2015 | A | 25,101 | ||||||||||||||
| 60,000 | CA Water Resource Devel. GO, Series Q | 5.000 | 03/01/2016 | 08/31/2015 | A | 60,245 | ||||||||||||||
| 15,000 | CA Water Resource Devel. GO, Series Q & R | 5.000 | 03/01/2017 | 08/31/2015 | A | 15,061 | ||||||||||||||
| 15,000 | CA Y/S School Facilities Financing Authority (Chula Vista Elementary School)1 | 5.000 | 09/01/2024 | 09/01/2015 | A | 15,432 | ||||||||||||||
| 45,000 | Calabasas, CA Special Tax Community Facilities District 98-1 | 5.650 | 09/01/2020 | 09/01/2015 | A | 45,085 | ||||||||||||||
| 10,000 | Calabasas, CA Special Tax Community Facilities District 98-1 | 5.750 | 09/01/2028 | 09/01/2015 | A | 10,010 | ||||||||||||||
| 250,000 | Campbell, CA COP (Civic Center) | 5.250 | 10/01/2028 | 08/31/2015 | A | 251,067 | ||||||||||||||
| 15,000 | Campbell, CA Redevel. Agency Tax Allocation1 | 5.800 | 10/01/2027 | 08/31/2015 | A | 15,022 | ||||||||||||||
| 25,000 | Capistrano, CA Unified School District1 | 5.000 | 09/01/2022 | 09/01/2015 | A | 25,102 | ||||||||||||||
| 15,000 | Carlsbad, CA Hsg. & Redevel. Commission (Village Redevel.)1 | 5.300 | 09/01/2023 | 09/01/2015 | A | 15,023 | ||||||||||||||
| 40,000 | Carlsbad, CA Hsg. and Redevel. Commission Tax Allocation1 | 5.250 | 09/01/2019 | 09/01/2015 | A | 40,094 | ||||||||||||||
| 30,000 | Carlsbad, CA Improvement Bond Act 1915 | 6.000 | 09/02/2022 | 09/02/2015 | A | 30,088 | ||||||||||||||
| 50,000 | Carlsbad, CA Improvement Bond Act 1915 | 5.550 | 09/02/2028 | 09/02/2015 | A | 50,099 | ||||||||||||||
| 65,000 | Carson, CA Improvement Bond Act 1915 | 7.375 | 09/02/2022 | 09/02/2015 | A | 65,166 | ||||||||||||||
| 2,385,000 | Castaic, CA Union School District Community Facilities District No. 92-1 | 9.000 | 10/01/2019 | 10/01/2015 | A | 2,407,538 | ||||||||||||||
30 OPPENHEIMER ROCHESTER LIMITED TERM CALIFORNIA MUNICIPAL FUND
| Principal Amount | Coupon | Maturity | Effective Maturity* | Value | ||||||||||||||||
| California (Continued) | |||||||||||||||||||
| $70,000 | Cathedral City, CA Improvement Bond Act 1915 | 5.950 | % | 09/02/2034 | 09/02/2015 | A | $ | 72,221 | ||||||||||||
| 50,000 | Cathedral City, CA Special Tax Community Facilities District No. 1 | 6.625 | 09/01/2023 | 09/25/2022 | B | 42,560 | ||||||||||||||
| 50,000 | Cathedral City, CA Special Tax Community Facilities District No. 1 | 6.700 | 09/01/2030 | 01/10/2028 | B | 41,423 | ||||||||||||||
| 5,000 | Central CA Unified School District | 5.625 | 03/01/2018 | 09/01/2015 | A | 5,023 | ||||||||||||||
| 150,000 | Chico, CA Public Financing Authority1 | 5.000 | 04/01/2018 | 08/31/2015 | A | 150,487 | ||||||||||||||
| 110,000 | Chico, CA Public Financing Authority1 | 5.000 | 04/01/2019 | 08/31/2015 | A | 110,337 | ||||||||||||||
| 850,000 | Chico, CA Unified School District1 | 5.000 | 08/01/2025 | 08/01/2018 | A | 946,577 | ||||||||||||||
| 225,000 | Chino Hills, CA COP1 | 5.000 | 09/01/2026 | 09/01/2015 | A | 225,380 | ||||||||||||||
| 50,000 | Chino, CA Community Facilities District Special Tax No. 2 | 5.000 | 09/01/2026 | 09/01/2015 | A | 50,703 | ||||||||||||||
| 2,980,000 | Chino, CA Public Financing Authority1 | 5.000 | 09/01/2032 | 09/01/2025 | A | 3,303,479 | ||||||||||||||
| 1,280,000 | Chino, CA Public Financing Authority1 | 5.000 | 09/01/2029 | 09/01/2025 | A | 1,443,072 | ||||||||||||||
| 1,230,000 | Chino, CA Public Financing Authority1 | 5.000 | 09/01/2028 | 09/01/2025 | A | 1,393,762 | ||||||||||||||
| 950,000 | Chino, CA Public Financing Authority1 | 5.000 | 09/01/2031 | 09/01/2025 | A | 1,058,205 | ||||||||||||||
| 900,000 | Chino, CA Public Financing Authority1 | 5.000 | 09/01/2030 | 09/01/2025 | A | 1,008,153 | ||||||||||||||
| 250,000 | Chula Vista, CA Industrial Devel. (San Diego Gas & Electric Company)1 | 5.000 | 12/01/2027 | 12/01/2015 | A | 258,910 | ||||||||||||||
| 7,250,000 | Chula Vista, CA Industrial Devel. (San Diego Gas & Electric Company)1 | 5.000 | 12/01/2027 | 12/01/2015 | A | 7,508,390 | ||||||||||||||
| 1,250,000 | Chula Vista, CA Industrial Devel. (San Diego Gas & Electric Company)1 | 5.000 | 12/01/2027 | 12/01/2015 | A | 1,294,550 | ||||||||||||||
| 50,000 | Chula Vista, CA Public Financing Authority | 4.750 | 09/02/2015 | 08/31/2015 | A | 50,178 | ||||||||||||||
| 190,000 | Chula Vista, CA Public Financing Authority | 5.000 | 09/02/2016 | 09/02/2015 | A | 190,792 | ||||||||||||||
| 100,000 | Clovis, CA Public Financing Authority1 | 5.000 | 08/01/2035 | 08/31/2015 | A | 100,101 | ||||||||||||||
| 70,000 | Colton, CA Community Facilities District Special Tax | 5.800 | 09/01/2018 | 09/01/2015 | A | 70,146 | ||||||||||||||
| 1,310,000 | Compton, CA Community College District | 5.000 | 07/01/2023 | 07/01/2022 | A | 1,498,496 | ||||||||||||||
| 1,710,000 | Compton, CA Community College District | 5.000 | 07/01/2020 | 07/01/2020 | 1,943,928 | |||||||||||||||
| 1,895,000 | Compton, CA Community College District | 5.000 | 07/01/2021 | 07/01/2021 | 2,172,599 | |||||||||||||||
| 445,000 | Compton, CA Sewer1 | 5.375 | 09/01/2023 | 09/01/2015 | A | 445,396 | ||||||||||||||
| 25,000 | Concord, CA GO1 | 5.000 | 08/01/2017 | 08/31/2015 | A | 25,075 | ||||||||||||||
| 465,000 | Contra Costa County, CA Public Financing Authority (Pleasant Hill Bart)1,3 | 5.125 | 08/01/2019 | 08/26/2015 | A | 465,065 | ||||||||||||||
| 90,000 | Corona, CA Dept. of Water & Power1 | 5.000 | 09/01/2035 | 09/01/2015 | A | 90,072 | ||||||||||||||
| 100,000 | Corona-Norco, CA Unified School District Community Facilities District No. 06-1 | 6.000 | 09/01/2027 | 09/01/2015 | A | 102,187 | ||||||||||||||
| 25,000 | Corona-Norco, CA Unified School District Public Financing Authority | 5.000 | 09/01/2026 | 09/01/2015 | A | 25,280 | ||||||||||||||
| 185,000 | Cudahy, CA Community Devel. Commission Tax Allocation1 | 7.000 | 10/01/2021 | 10/01/2021 | 228,806 | |||||||||||||||
| 35,000 | Cudahy, CA Community Devel. Commission Tax Allocation1 | 6.875 | 10/01/2020 | 10/01/2020 | 42,320 | |||||||||||||||
| 155,000 | Cudahy, CA Community Devel. Commission Tax Allocation1 | 6.875 | 10/01/2019 | 10/01/2019 | 183,658 | |||||||||||||||
| 10,000 | Cudahy, CA Community Devel. Commission Tax Allocation1 | 6.000 | 10/01/2016 | 04/01/2016 | B | 10,278 | ||||||||||||||
| 115,000 | Cudahy, CA Community Devel. Commission Tax Allocation1 | 6.250 | 10/01/2017 | 10/01/2017 | 126,339 | |||||||||||||||
31 OPPENHEIMER ROCHESTER LIMITED TERM CALIFORNIA MUNICIPAL FUND
STATEMENT OF INVESTMENTS Continued
| Principal Amount | Coupon | Maturity | Effective Maturity* | Value | ||||||||||||||||
| California (Continued) | |||||||||||||||||||
| $120,000 | Cudahy, CA Community Devel. Commission Tax Allocation1 | 6.625 | % | 10/01/2018 | 10/01/2018 | $ | 137,122 | |||||||||||||
| 110,000 | Cudahy, CA Community Devel. Commission Tax Allocation1 | 7.125 | 10/01/2020 | 10/01/2020 | 134,286 | |||||||||||||||
| 315,000 | Cudahy, CA Community Devel. Commission Tax Allocation1 | 7.750 | 10/01/2027 | 10/01/2021 | A | 411,576 | ||||||||||||||
| 130,000 | Cudahy, CA Community Devel. Commission Tax Allocation1 | 7.250 | 10/01/2021 | 10/01/2021 | 162,612 | |||||||||||||||
| 40,000 | Culver City, CA COP | 5.750 | 01/01/2016 | 08/31/2015 | A | 40,160 | ||||||||||||||
| 25,000 | Culver City, CA Redevel. Agency1 | 5.500 | 11/01/2020 | 08/31/2015 | A | 25,452 | ||||||||||||||
| 25,000 | Culver City, CA Redevel. Finance Authority1 | 5.500 | 11/01/2019 | 08/31/2015 | A | 25,452 | ||||||||||||||
| 15,000 | Culver City, CA Redevel. Finance Authority | 5.600 | 11/01/2025 | 08/31/2015 | A | 15,064 | ||||||||||||||
| 20,000 | Cypress, CA Improvement Bond Act 1915 (Business and Professional Center) | 5.700 | 09/02/2022 | 08/31/2015 | A | 20,033 | ||||||||||||||
| 1,000,000 | Davis, CA Redevel. Agency Tax Allocation1 | 6.500 | 12/01/2026 | 12/01/2021 | A | 1,233,670 | ||||||||||||||
| 975,000 | Delano, CA Union High School District1 | 5.100 | 02/01/2023 | 02/01/2023 | 1,158,680 | |||||||||||||||
| 510,000 | Desert Hot Springs, CA Redevel. Agency Tax Allocation (Merged Redevel.)1 | 6.000 | 09/01/2023 | 09/01/2019 | A | 581,849 | ||||||||||||||
| 320,000 | Dinuba, CA Redevel. Agency Tax Allocation1 | 5.750 | 09/01/2028 | 03/03/2020 | A | 356,474 | ||||||||||||||
| 50,000 | Downey, CA Community Devel. Commission Tax Allocation (Downey Redevel.)1 | 5.125 | 08/01/2028 | 02/01/2016 | A | 50,319 | ||||||||||||||
| 360,000 | Downey, CA Community Devel. Commission Tax Allocation (Downey Redevel.)1,3 | 5.125 | 08/01/2020 | 01/05/2016 | A | 364,270 | ||||||||||||||
| 115,000 | East Palo Alto, CA Public Financing Authority (University Circle Gateway)1 | 5.000 | 10/01/2029 | 10/01/2015 | A | 116,446 | ||||||||||||||
| 135,000 | Eastern CA Municipal Water District | 6.000 | 09/02/2026 | 09/02/2015 | A | 135,198 | ||||||||||||||
| 10,000 | Eastern CA Municipal Water District Improvement Bond Act 1915 | 5.750 | 09/02/2020 | 09/02/2015 | A | 10,021 | ||||||||||||||
| 20,000 | Eastside, CA Union School District1 | 5.125 | 08/01/2026 | 02/01/2016 | A | 20,231 | ||||||||||||||
| 145,000 | El Cerrito, CA Redevel. Agency Tax Allocation1 | 5.000 | 07/01/2019 | 08/31/2015 | A | 145,228 | ||||||||||||||
| 800,000 | El Dorado County, CA Special Tax Community Facilities District No. 9288 | 5.000 | 09/01/2027 | 09/01/2022 | A | 895,256 | ||||||||||||||
| 630,000 | El Dorado County, CA Special Tax Community Facilities District No. 9288 | 5.000 | 09/01/2026 | 09/01/2022 | A | 708,706 | ||||||||||||||
| 45,000 | El Monte, CA COP (Dept. of Public Social Services Facility)1 | 5.000 | 06/01/2019 | 06/01/2016 | A | 46,201 | ||||||||||||||
| 3,240,000 | Emery, CA Unified School District1 | 6.500 | 08/01/2031 | 08/01/2021 | A | 4,077,022 | ||||||||||||||
| 1,170,000 | Emery, CA Unified School District1 | 6.250 | 08/01/2026 | 08/01/2021 | A | 1,430,454 | ||||||||||||||
| 10,000 | Encinitas, CA Improvement Bond Act 1915 | 6.900 | 09/02/2017 | 09/02/2015 | A | 10,000 | ||||||||||||||
| 5,000 | Escondido, CA Special Tax Community Facilities District No. 1 (Eureka) | 5.000 | 09/01/2019 | 09/01/2015 | A | 5,070 | ||||||||||||||
| 10,000 | Fairfield, CA Improvement Bond Act 1915 (Green Valley Road/Mangels Blvd.) | 7.375 | 09/02/2018 | 09/02/2015 | A | 10,337 | ||||||||||||||
| 15,000 | Florin, CA Resource Conservation District COP | 6.000 | 02/01/2029 | 04/04/2027 | B | 6,901 | ||||||||||||||
| 20,000 | Folsom Cordova, CA Unified School District School COP1 | 5.125 | 03/01/2018 | 09/01/2015 | A | 20,083 | ||||||||||||||
| 30,000 | Folsom, CA Public Financing Authority | 5.625 | 09/02/2020 | 09/02/2015 | A | 30,055 | ||||||||||||||
| 15,000 | Folsom, CA Public Financing Authority | 5.400 | 09/02/2020 | 09/02/2015 | A | 15,028 | ||||||||||||||
| 845,000 | Folsom, CA Public Financing Authority | 5.000 | 09/01/2023 | 09/01/2017 | A | 879,324 | ||||||||||||||
| 250,000 | Fontana, CA Public Financing Authority (North Fontana Redevel.)1 | 5.000 | 10/01/2022 | 10/01/2015 | A | 251,892 | ||||||||||||||
32 OPPENHEIMER ROCHESTER LIMITED TERM CALIFORNIA MUNICIPAL FUND
| Principal Amount | Coupon | Maturity | Effective Maturity* | Value | ||||||||||||||||
| California (Continued) | |||||||||||||||||||
| $95,000 | Fontana, CA Public Financing Authority (North Fontana Redevel.)1 | 5.000 | % | 09/01/2023 | 09/01/2015 | A | $ | 95,190 | ||||||||||||
| 1,665,000 | Fontana, CA Public Financing Authority (North Fontana Redevel.)1 | 5.250 | 09/01/2020 | 09/01/2015 | A | 1,667,131 | ||||||||||||||
| 725,000 | Fontana, CA Public Financing Authority (North Fontana Redevel.)1 | 5.500 | 09/01/2032 | 09/01/2015 | A | 734,084 | ||||||||||||||
| 25,000 | Fontana, CA Redevel. Agency (Downtown Redevel.)1 | 5.000 | 09/01/2021 | 09/01/2015 | A | 25,043 | ||||||||||||||
| 200,000 | Fontana, CA Redevel. Agency (Downtown Redevel.) | 5.000 | 09/01/2016 | 09/01/2015 | A | 200,604 | ||||||||||||||
| 220,000 | Fontana, CA Redevel. Agency (Jurupa Hills)1 | 5.500 | 10/01/2027 | 10/01/2015 | A | 221,010 | ||||||||||||||
| 40,000 | Fontana, CA Redevel. Agency (Sierra Corridor Commercial Redevel.)1 | 5.450 | 09/01/2029 | 09/01/2015 | A | 40,060 | ||||||||||||||
| 615,000 | Fontana, CA Redevel. Agency (Southwest Industrial Park)1 | 5.000 | 09/01/2022 | 09/01/2015 | A | 616,310 | ||||||||||||||
| 265,000 | Fontana, CA Special Tax (Citrus) | 5.000 | 09/01/2020 | 09/01/2015 | A | 268,209 | ||||||||||||||
| 1,510,000 | Fontana, CA Special Tax Community Facilities District No. 2-A1 | 5.250 | 09/01/2017 | 09/01/2015 | A | 1,515,889 | ||||||||||||||
| 10,000 | Fontana, CA Special Tax Community Facilities District No. 4 | 7.125 | 10/01/2015 | 10/01/2015 | 10,097 | |||||||||||||||
| 1,105,000 | Fremont, CA Union High School District1 | 5.000 | 09/01/2022 | 09/01/2015 | A | 1,109,497 | ||||||||||||||
| 100,000 | Freshwater, CA School District1 | 5.000 | 08/01/2025 | 02/01/2016 | A | 100,721 | ||||||||||||||
| 25,000 | Fresno, CA Joint Powers Financing Authority1 | 5.125 | 06/01/2031 | 08/31/2015 | A | 25,033 | ||||||||||||||
| 870,000 | Fresno, CA Joint Powers Financing Authority1 | 5.000 | 04/01/2022 | 04/01/2018 | A | 898,710 | ||||||||||||||
| 110,000 | Fresno, CA Joint Powers Financing Authority1 | 5.250 | 08/01/2018 | 08/31/2015 | A | 110,244 | ||||||||||||||
| 2,160,000 | Fresno, CA Joint Powers Financing Authority1 | 5.250 | 10/01/2024 | 08/31/2015 | A | 2,161,490 | ||||||||||||||
| 30,000 | Fresno, CA Joint Powers Financing Authority | 5.000 | 06/01/2020 | 08/31/2015 | A | 30,121 | ||||||||||||||
| 10,000 | Fresno, CA Joint Powers Financing Authority | 5.000 | 06/01/2019 | 08/31/2015 | A | 10,040 | ||||||||||||||
| 65,000 | Fresno, CA Joint Powers Financing Authority1 | 5.000 | 06/01/2028 | 08/31/2015 | A | 65,090 | ||||||||||||||
| 140,000 | Fresno, CA Joint Powers Financing Authority1 | 5.750 | 06/01/2026 | 08/31/2015 | A | 143,137 | ||||||||||||||
| 135,000 | Fullerton, CA Redevel. Agency COP1 | 5.000 | 04/01/2026 | 04/01/2017 | A | 141,915 | ||||||||||||||
| 400,000 | Galt, CA Redevel. Agency Tax Allocation1 | 7.375 | 09/01/2033 | 09/01/2021 | A | 495,712 | ||||||||||||||
| 115,000 | Garden Grove, CA COP1 | 5.375 | 03/01/2017 | 09/01/2015 | A | 115,353 | ||||||||||||||
| 50,000 | Granada, CA Sanitation District Improvement Bond Act 1915 | 5.700 | 09/02/2016 | 09/02/2015 | A | 50,151 | ||||||||||||||
| 20,000 | Granada, CA Sanitation District Improvement Bond Act 1915 | 6.125 | 09/02/2022 | 09/02/2015 | A | 20,039 | ||||||||||||||
| 425,000 | Grand Terrace, CA Community Redevel. Agency1 | 5.100 | 09/01/2022 | 09/01/2019 | A | 480,615 | ||||||||||||||
| 15,000 | Greenfield, CA Redevel. Agency | 6.000 | 02/01/2029 | 08/31/2015 | A | 15,007 | ||||||||||||||
| 20,000 | Greenfield, CA Union School District | 6.250 | 09/01/2030 | 09/01/2015 | A | 20,638 | ||||||||||||||
| 10,000 | Guadalupe, CA Redevel. Agency Tax Allocation1 | 5.125 | 08/01/2035 | 08/31/2015 | A | 10,028 | ||||||||||||||
| 1,000,000 | Hawaiian Gardens, CA Public Finance Authority Tax Allocation | 5.250 | 12/01/2023 | 08/31/2015 | A | 1,003,990 | ||||||||||||||
| 1,475,000 | Hawaiian Gardens, CA Public Finance Authority Tax Allocation | 5.250 | 12/01/2022 | 08/31/2015 | A | 1,480,885 | ||||||||||||||
| 85,000 | Hawthorne, CA Community Redevel. Agency3 | 5.000 | 09/01/2018 | 09/01/2015 | A | 85,321 | ||||||||||||||
| 75,000 | Hawthorne, CA Community Redevel. Agency | 5.000 | 09/01/2024 | 09/01/2015 | A | 75,277 | ||||||||||||||
| 3,220,000 | Hawthorne, CA Community Redevel. Agency Special Tax | 6.125 | 10/01/2025 | 10/01/2015 | A | 3,230,014 | ||||||||||||||
| 145,000 | Hawthorne, CA Parking Authority3 | 8.125 | 09/01/2019 | 09/01/2015 | A | 145,526 | ||||||||||||||
| 10,000 | Hawthorne, CA Parking Authority | 8.000 | 09/01/2015 | 09/01/2015 | 10,050 | |||||||||||||||
33 OPPENHEIMER ROCHESTER LIMITED TERM CALIFORNIA MUNICIPAL FUND
STATEMENT OF INVESTMENTS Continued
| Principal Amount | Coupon | Maturity | Effective Maturity* | Value | ||||||||||||||||
| California (Continued) | |||||||||||||||||||
| $30,000 | Hayward, CA Improvement Bond Act 1915 | 7.100 | % | 09/02/2018 | 09/02/2015 | A | $ | 30,106 | ||||||||||||
| 125,000 | Hayward, CA Unified School District1 | 5.250 | 08/01/2028 | 08/01/2016 | A | 131,231 | ||||||||||||||
| 100,000 | Hayward, CA Unified School District1 | 5.000 | 08/01/2023 | 08/01/2016 | A | 104,736 | ||||||||||||||
| 10,000 | Hollister, CA Improvement Bond Act 1915 | 7.125 | 09/02/2022 | 09/02/2015 | A | 10,323 | ||||||||||||||
| 10,000 | Huntington Beach, CA Community Facilities District1 | 5.400 | 10/01/2020 | 10/01/2015 | A | 10,075 | ||||||||||||||
| 20,000 | Huntington Beach, CA Community Facilities District Special Tax | 6.250 | 09/01/2027 | 09/01/2015 | A | 20,024 | ||||||||||||||
| 1,055,000 | Huntington Beach, CA Community Facilities District Special Tax (Huntington Center) | 5.250 | 09/01/2025 | 09/01/2018 | A | 1,125,020 | ||||||||||||||
| 1,115,000 | Huntington Beach, CA Community Facilities District Special Tax (Huntington Center) | 5.250 | 09/01/2026 | 09/01/2018 | A | 1,186,639 | ||||||||||||||
| 15,000 | Huntington Beach, CA Redevel. Agency (Huntington Beach Redevel.)1 | 5.000 | 08/01/2024 | 08/31/2015 | A | 15,028 | ||||||||||||||
| 100,000 | Huntington Beach, CA Redevel. Agency (Huntington Beach Redevel.)1 | 5.000 | 08/01/2018 | 02/01/2016 | A | 101,784 | ||||||||||||||
| 25,000 | Huntington Park, CA Pulic Financing Authority | 5.000 | 09/01/2022 | 09/01/2015 | A | 25,589 | ||||||||||||||
| 2,735,000 | Imperial, CA Public Financing Authority (Water Facility) | 5.000 | 10/15/2026 | 10/15/2022 | A | 3,047,282 | ||||||||||||||
| 20,000 | Indio, CA Improvement Bond Act 1915 Assessment District No. 2004-3 | 5.400 | 09/02/2023 | 09/02/2015 | A | 20,464 | ||||||||||||||
| 300,000 | Industry, CA GO | 5.000 | 01/01/2024 | 08/31/2015 | A | 304,509 | ||||||||||||||
| 70,000 | Industry, CA GO | 5.000 | 01/01/2027 | 08/31/2015 | A | 71,295 | ||||||||||||||
| 710,000 | Irvine, CA Improvement Bond Act 1915 | 5.000 | 09/02/2025 | 09/02/2023 | A | 812,346 | ||||||||||||||
| 100,000 | Jurupa, CA Community Services District Special Tax | 5.000 | 09/01/2027 | 09/01/2015 | A | 101,407 | ||||||||||||||
| 55,000 | Kern Valley, CA Healthcare District | 5.250 | 08/01/2021 | 08/31/2015 | A | 55,219 | ||||||||||||||
| 2,000,000 | Kern, CA Community College District | 5.250 | 11/01/2031 | 11/01/2018 | A | 2,208,240 | ||||||||||||||
| 10,000 | La Habra, CA Redevel. Agency Community Facilities District | 6.000 | 09/01/2019 | 08/31/2015 | A | 10,023 | ||||||||||||||
| 45,000 | La Mesa, CA Improvement Bond Act 19153 | 5.750 | 09/02/2023 | 09/02/2015 | A | 45,072 | ||||||||||||||
| 500,000 | Lake Elsinore, CA Special Tax | 5.100 | 09/01/2022 | 09/01/2015 | A | 512,075 | ||||||||||||||
| 15,000 | Lancaster, CA Community Facilities District Special Tax | 6.000 | 10/01/2016 | 10/01/2015 | A | 15,093 | ||||||||||||||
| 615,000 | Lancaster, CA Redevel. Agency1 | 5.500 | 12/01/2028 | 12/01/2020 | A | 708,357 | ||||||||||||||
| 55,000 | Lathrop, CA Financing Authority (Water Supply) | 5.700 | 06/01/2019 | 12/01/2015 | A | 55,588 | ||||||||||||||
| 10,000 | Lathrop, CA Financing Authority (Water Supply) | 5.750 | 06/01/2020 | 12/01/2015 | A | 10,101 | ||||||||||||||
| 150,000 | Lawndale, CA Elementary School District1 | 5.000 | 08/01/2029 | 02/01/2016 | A | 153,291 | ||||||||||||||
| 230,000 | Lincoln, CA Public Financing Authority1 | 5.000 | 08/01/2028 | 02/01/2016 | A | 231,831 | ||||||||||||||
| 20,000 | Livermore, CA Community Facilities District Special Tax (Tri Valley Tech Park) | 6.125 | 09/01/2016 | 09/01/2015 | A | 20,100 | ||||||||||||||
| 15,000 | Livermore, CA Community Facilities District Special Tax (Tri Valley Tech Park) | 6.400 | 09/01/2030 | 09/01/2015 | A | 15,078 | ||||||||||||||
| 160,000 | Livermore, CA Community Facilities District Special Tax (Tri Valley Tech Park) | 6.400 | 09/01/2026 | 09/01/2015 | A | 160,837 | ||||||||||||||
| 50,000 | Livermore, CA Redevel. Agency Tax Allocation | 5.250 | 08/01/2018 | 08/31/2015 | A | 50,366 | ||||||||||||||
| 925,000 | Livermore, CA Redevel. Agency Tax Allocation | 5.000 | 08/01/2026 | 08/31/2015 | A | 931,438 | ||||||||||||||
| 2,000,000 | Lodi, CA Public Financing Authority | 5.250 | 10/01/2026 | 04/01/2022 | A | 2,244,300 | ||||||||||||||
| 370,000 | Long Beach, CA Bond Finance Authority1 | 5.250 | 11/15/2023 | 11/15/2023 | 426,599 | |||||||||||||||
| 500,000 | Long Beach, CA Bond Finance Authority (Rainbow Harbor)1 | 5.000 | 05/01/2024 | 05/01/2016 | A | 527,375 | ||||||||||||||
34 OPPENHEIMER ROCHESTER LIMITED TERM CALIFORNIA MUNICIPAL FUND
| Principal Amount | Coupon | Maturity | Effective Maturity* | Value | ||||||||||||||||
| California (Continued) | |||||||||||||||||||
| $620,000 | Long Beach, CA Bond Finance Authority Natural Gas1 | 5.000 | % | 11/15/2017 | 11/15/2017 | $ | 665,868 | |||||||||||||
| 685,000 | Long Beach, CA Bond Finance Authority Natural Gas1 | 5.250 | 11/15/2018 | 11/15/2018 | 754,582 | |||||||||||||||
| 850,000 | Long Beach, CA Marina1 | 5.000 | 05/15/2027 | 05/15/2025 | A | 959,692 | ||||||||||||||
| 50,000 | Long Beach, CA Special Tax (Pike) | 6.250 | 10/01/2026 | 08/31/2015 | A | 50,079 | ||||||||||||||
| 500,000 | Long Beach, CA Unified School District1 | 5.750 | 08/01/2033 | 08/01/2019 | A | 587,720 | ||||||||||||||
| 5,585,000 | Los Angeles County, CA Community College District1 | 5.000 | 08/01/2029 | 08/01/2024 | A | 6,580,024 | ||||||||||||||
| 5,000 | Los Angeles County, CA Community Facilities District No. 4 Special Tax | 7.750 | 09/01/2017 | 09/01/2015 | A | 5,024 | ||||||||||||||
| 30,000 | Los Angeles County, CA Community Facilities District No. 5 (Rowland Heights Area)1 | 5.000 | 09/01/2019 | 09/01/2015 | A | 30,120 | ||||||||||||||
| 65,000 | Los Angeles County, CA Public Works Financing Authority (Calabasas Landfill) | 5.000 | 06/01/2022 | 08/31/2015 | A | 65,259 | ||||||||||||||
| 65,000 | Los Angeles County, CA Sanitation Districts Financing Authority1 | 5.000 | 10/01/2034 | 10/01/2015 | A | 65,523 | ||||||||||||||
| 90,000 | Los Angeles, CA Community Facilities District Special Tax (Cascade Business Park) | 6.400 | 09/01/2022 | 09/01/2015 | A | 90,247 | ||||||||||||||
| 60,000 | Los Angeles, CA Community Redevel. Agency (Freeway Recovery) | 6.000 | 09/01/2031 | 09/01/2015 | A | 60,098 | ||||||||||||||
| 50,000 | Los Angeles, CA Community Redevel. Agency (Grand Central Square)1 | 5.200 | 12/01/2017 | 08/31/2015 | A | 50,175 | ||||||||||||||
| 40,000 | Los Angeles, CA Community Redevel. Agency (Grand Central Square) | 5.100 | 12/01/2015 | 08/31/2015 | A | 40,167 | ||||||||||||||
| 50,000 | Los Angeles, CA Community Redevel. Agency (Grand Central Square) | 5.200 | 12/01/2018 | 08/31/2015 | A | 50,202 | ||||||||||||||
| 80,000 | Los Angeles, CA Community Redevel. Agency (Grand Central Square) | 5.250 | 12/01/2021 | 08/31/2015 | A | 80,326 | ||||||||||||||
| 125,000 | Los Angeles, CA Community Redevel. Agency (Grand Central Square) | 5.250 | 12/01/2020 | 08/31/2015 | A | 125,510 | ||||||||||||||
| 120,000 | Los Angeles, CA Community Redevel. Agency (Grand Central Square) | 5.200 | 12/01/2019 | 08/31/2015 | A | 120,484 | ||||||||||||||
| 10,000,000 | Los Angeles, CA Dept. of Airports (Los Angeles International Airport)6 | 5.375 | 05/15/2025 | 01/30/2016 | A | 11,088,978 | ||||||||||||||
| 500,000 | Los Angeles, CA Dept. of Airports (Ontario International Airport)1 | 5.000 | 05/15/2025 | 05/15/2016 | A | 516,530 | ||||||||||||||
| 2,605,000 | Los Angeles, CA Dept. of Airports (Ontario International Airport)1 | 5.000 | 05/15/2022 | 05/15/2016 | A | 2,697,217 | ||||||||||||||
| 125,000 | Los Angeles, CA Dept. of Water & Power1 | 5.000 | 07/01/2031 | 07/01/2016 | A | 129,968 | ||||||||||||||
| 10,000 | Los Angeles, CA Dept. of Water & Power | 4.750 | 10/15/2020 | 08/31/2015 | A | 10,038 | ||||||||||||||
| 100,000 | Los Angeles, CA Dept. of Water & Power1 | 5.000 | 07/01/2026 | 07/01/2016 | A | 104,214 | ||||||||||||||
| 1,900,000 | Los Angeles, CA Dept. of Water & Power1 | 5.000 | 07/01/2039 | 07/01/2017 | A | 2,039,954 | ||||||||||||||
| 15,000 | Los Angeles, CA Dept. of Water & Power | 4.750 | 08/15/2017 | 08/31/2015 | A | 15,058 | ||||||||||||||
| 500,000 | Los Angeles, CA Harbor Dept.1 | 5.000 | 08/01/2024 | 08/01/2016 | A | 531,670 | ||||||||||||||
| 65,000 | Los Angeles, CA Mtg. (Section 8)1 | 5.350 | 07/01/2022 | 08/31/2015 | A | 65,131 | ||||||||||||||
| 15,000 | Los Angeles, CA Mtg. (Section 8)1 | 6.500 | 07/01/2022 | 08/31/2015 | A | 15,043 | ||||||||||||||
| 35,000 | Los Angeles, CA Multifamily Hsg. (Earthquake Rehabilitation)1 | 5.900 | 01/01/2030 | 08/31/2015 | A | 35,057 | ||||||||||||||
| 145,000 | Los Angeles, CA Municipal Improvement Corp. (Figueroa Plaza) | 5.000 | 08/01/2027 | 08/31/2015 | A | 145,577 | ||||||||||||||
35 OPPENHEIMER ROCHESTER LIMITED TERM CALIFORNIA MUNICIPAL FUND
STATEMENT OF INVESTMENTS Continued
| Principal Amount | Coupon | Maturity | Effective Maturity* | Value | ||||||||||||||||
| California (Continued) | |||||||||||||||||||
| $10,000 | Los Angeles, CA Municipal Improvement Corp. (Figueroa Plaza) | 5.000 | % | 08/01/2023 | 08/31/2015 | A | $ | 10,039 | ||||||||||||
| 205,000 | Los Angeles, CA State Building Authority | 5.500 | 10/01/2019 | 08/31/2015 | A | 205,861 | ||||||||||||||
| 70,000 | Los Angeles, CA State Building Authority | 5.500 | 10/01/2016 | 08/31/2015 | A | 70,294 | ||||||||||||||
| 20,000 | Los Angeles, CA State Building Authority | 5.400 | 10/01/2015 | 08/31/2015 | A | 20,088 | ||||||||||||||
| 70,000 | Los Angeles, CA State Building Authority | 5.500 | 10/01/2018 | 08/31/2015 | A | 70,294 | ||||||||||||||
| 200,000 | Los Angeles, CA State Building Authority | 5.500 | 10/01/2017 | 08/31/2015 | A | 200,840 | ||||||||||||||
| 50,000 | Los Angeles, CA State Building Authority | 5.400 | 10/01/2015 | 08/31/2015 | A | 50,219 | ||||||||||||||
| 325,000 | Madera County, CA Board of Education COP1 | 6.125 | 10/01/2036 | 10/01/2021 | A | 387,576 | ||||||||||||||
| 455,000 | Madera County, CA COP (Valley Children’s Hospital)1 | 5.750 | 03/15/2028 | 08/31/2015 | A | 456,406 | ||||||||||||||
| 1,005,000 | Madera County, CA COP (Valley Children’s Hospital) | 5.000 | 03/15/2023 | 08/31/2015 | A | 1,008,528 | ||||||||||||||
| 50,000 | Mammoth Lakes, CA Community Facilities District (North Village Area) | 5.750 | 10/01/2033 | 10/01/2015 | A | 50,104 | ||||||||||||||
| 1,285,000 | Manteca, CA Unified School District Special Tax Community Facilities District No. 1989 | 5.000 | 09/01/2027 | 09/01/2023 | A | 1,459,657 | ||||||||||||||
| 1,025,000 | Marysville, CA (Fremont-Rideout Health Group / Rideout Memorial Hospital/United Com-Serve Obligated Group)1 | 5.250 | 01/01/2027 | 01/01/2021 | A | 1,150,101 | ||||||||||||||
| 25,000 | Maywood, CA Public Financing Authority3 | 6.500 | 09/01/2018 | 09/01/2015 | A | 25,056 | ||||||||||||||
| 705,000 | Mendocino Coast, CA Healthcare District1 | 5.875 | 02/01/2020 | 08/31/2015 | A | 707,094 | ||||||||||||||
| 5,000 | Menlo Park, CA GO | 5.000 | 08/01/2015 | 08/01/2015 | 5,000 | |||||||||||||||
| 5,000 | Milpitas, CA Improvement Bond Act 1915 | 5.700 | 09/02/2018 | 09/02/2015 | A | 5,161 | ||||||||||||||
| 500,000 | Modesto, CA COP (Golf Course)1 | 5.000 | 11/01/2023 | 02/29/2020 | B | 531,810 | ||||||||||||||
| 350,000 | Modesto, CA Wastewater1 | 5.250 | 11/01/2022 | 11/01/2015 | A | 354,403 | ||||||||||||||
| 1,000,000 | Monrovia, CA Redevel. Agency (Central Redev. Project Area No. 1) | 5.000 | 08/01/2026 | 08/01/2022 | A | 1,099,580 | ||||||||||||||
| 2,000,000 | Montclair, CA Redevel. Agency Tax Allocation1 | 5.300 | 10/01/2030 | 08/31/2015 | A | 2,003,160 | ||||||||||||||
| 95,000 | Montebello, CA Community Redevel. Agency (South Montebello)1 | 5.300 | 09/01/2022 | 09/09/2015 | A | 95,516 | ||||||||||||||
| 10,000 | Montebello, CA Community Redevel. Agency (South Montebello) | 5.500 | 09/01/2022 | 09/09/2015 | A | 10,056 | ||||||||||||||
| 130,000 | Montebello, CA Community Redevel. Agency Tax Allocation1 | 5.000 | 03/01/2019 | 09/01/2015 | A | 130,524 | ||||||||||||||
| 730,000 | Montebello, CA Community Redevel. Agency Tax Alloccation1 | 5.250 | 09/01/2024 | 09/01/2015 | A | 733,088 | ||||||||||||||
| 470,000 | Montebello, CA Public Financing Authority (Montebello Hotel)1 | 5.000 | 12/01/2024 | 12/01/2017 | A | 504,540 | ||||||||||||||
| 1,050,000 | Montebello, CA Public Financing Authority (Montebello Hotel)1 | 5.000 | 12/01/2028 | 12/01/2017 | A | 1,116,980 | ||||||||||||||
| 40,000 | Monterey, CA Joint Powers Financing Authority (Materials Recovery Facilities)1 | 5.750 | 03/01/2017 | 09/01/2015 | A | 40,370 | ||||||||||||||
| 20,000 | Monterey, CA Joint Powers Financing Authority (Materials Recovery Facilities) | 5.700 | 03/01/2016 | 09/01/2015 | A | 20,142 | ||||||||||||||
| 355,000 | Moreno Valley, CA Unified School District Community Facilities District No. 2005-5 | 5.500 | 09/01/2031 | 09/01/2015 | A | 366,165 | ||||||||||||||
| 25,000 | Murrieta, CA Community Facilities District Special Tax (Meadowlane/Amberwalk) | 5.000 | 09/01/2028 | 09/01/2015 | A | 25,021 | ||||||||||||||
| 10,000 | Napa, CA Hsg. Auth. (Vintage at Napa Senior Apartments)1 | 5.200 | 06/15/2034 | 08/31/2015 | A | 10,036 | ||||||||||||||
36 OPPENHEIMER ROCHESTER LIMITED TERM CALIFORNIA MUNICIPAL FUND
| Principal Amount | Coupon | Maturity | Effective Maturity* | Value | ||||||||||||||||
| California (Continued) | |||||||||||||||||||
| $100,000 | National City, CA Community Devel. Commission Tax Allocation (National City Redevel.)1 | 5.250 | % | 08/01/2019 | 08/01/2019 | $ | 114,143 | |||||||||||||
| 260,000 | Needles, CA Public Utility Authority | 6.650 | 02/01/2032 | 08/31/2015 | A | 260,075 | ||||||||||||||
| 395,000 | Northern, CA Inyo County Local Hospital District1 | 5.000 | 12/01/2015 | 12/01/2015 | 399,689 | |||||||||||||||
| 100,000 | Northern, CA Inyo County Local Hospital District1 | 5.600 | 08/01/2035 | 11/01/2015 | A | 100,567 | ||||||||||||||
| 835,000 | Northern, CA Inyo County Local Hospital District1 | 6.375 | 12/01/2025 | 12/01/2020 | A | 935,726 | ||||||||||||||
| 10,000 | Oakdale, CA Public Financing Authority Tax Allocation (Central City Redevel.) | 6.000 | 06/01/2019 | 12/01/2015 | A | 10,088 | ||||||||||||||
| 50,000 | Oakdale, CA Public Financing Authority Tax Allocation (Central City Redevel.) | 6.100 | 06/01/2027 | 12/01/2015 | A | 50,242 | ||||||||||||||
| 265,000 | Oakland, CA Building Authority (Elihu M Harris) | 5.000 | 04/01/2016 | 08/31/2015 | A | 266,068 | ||||||||||||||
| 150,000 | Oakland, CA Building Authority (Elihu M Harris) | 5.000 | 04/01/2017 | 08/31/2015 | A | 150,605 | ||||||||||||||
| 1,120,000 | Oakland, CA Building Authority (Elihu M Harris) | 5.000 | 04/01/2023 | 08/31/2015 | A | 1,124,491 | ||||||||||||||
| 300,000 | Oakland, CA Unified School District | 5.250 | 08/01/2022 | 08/31/2015 | A | 301,281 | ||||||||||||||
| 2,000,000 | Oakland, CA Unified School District | 6.000 | 08/01/2026 | 08/01/2018 | A | 2,219,660 | ||||||||||||||
| 1,000,000 | Oakland, CA Unified School District | 6.125 | 08/01/2029 | 08/01/2019 | A | 1,141,750 | ||||||||||||||
| 50,000 | Oakland, CA Unified School District | 5.250 | 08/01/2018 | 08/31/2015 | A | 50,214 | ||||||||||||||
| 750,000 | Oakland, CA Unified School District | 5.000 | 08/01/2022 | 01/15/2021 | B | 855,255 | ||||||||||||||
| 160,000 | Oakland, CA Unified School District | 5.250 | 08/01/2019 | 08/31/2015 | A | 160,669 | ||||||||||||||
| 50,000 | Oakland, CA Unified School District | 5.250 | 08/01/2015 | 08/01/2015 | 50,000 | |||||||||||||||
| 100,000 | Oakland, CA Unified School District | 5.250 | 08/01/2017 | 08/31/2015 | A | 100,422 | ||||||||||||||
| 370,000 | Oakland, CA Unified School District | 5.250 | 08/01/2020 | 08/31/2015 | A | 371,532 | ||||||||||||||
| 715,000 | Oakland, CA Unified School District | 5.000 | 08/01/2026 | 08/31/2015 | A | 717,703 | ||||||||||||||
| 200,000 | Oakland, CA Unified School District | 5.250 | 08/01/2016 | 08/31/2015 | A | 200,812 | ||||||||||||||
| 3,110,000 | Oakland, CA Unified School District | 5.250 | 08/01/2024 | 08/31/2015 | A | 3,122,409 | ||||||||||||||
| 745,000 | Oceanside, CA Community Facilities District Special Tax (Ocean Ranch Corp. Center) | 5.000 | 09/01/2027 | 09/01/2023 | A | 802,216 | ||||||||||||||
| 685,000 | Oceanside, CA Community Facilities District Special Tax (Ocean Ranch Corp. Center) | 5.000 | 09/01/2026 | 09/01/2023 | A | 741,232 | ||||||||||||||
| 805,000 | Oceanside, CA Community Facilities District Special Tax (Ocean Ranch Corp. Center) | 5.000 | 09/01/2028 | 09/01/2023 | A | 864,320 | ||||||||||||||
| 1,470,000 | Ontario, CA Improvement Bond Act 1915 Assessment District No. 108 | 7.500 | 09/02/2020 | 09/02/2015 | A | 1,478,820 | ||||||||||||||
| 55,000 | Orange County, CA Community Facilities District3 | 5.250 | 08/15/2019 | 08/28/2015 | A | 55,200 | ||||||||||||||
| 30,000 | Orange County, CA Improvement Bond Act 1915 | 5.500 | 09/02/2016 | 09/02/2015 | A | 30,122 | ||||||||||||||
| 20,000 | Orange County, CA Improvement Bond Act 1915 (Irvine Coast Assessment) | 5.500 | 09/02/2018 | 09/02/2015 | A | 20,063 | ||||||||||||||
| 5,000 | Orange County, CA Water District | 5.000 | 08/15/2017 | 08/31/2015 | A | 5,020 | ||||||||||||||
| 1,500,000 | Orange, CA Community Facilities District Special Tax (Serrano Heights Public Improvements) | 5.000 | 10/01/2028 | 10/01/2022 | A | 1,670,355 | ||||||||||||||
| 50,000 | Oxnard, CA Financing Authority1 | 5.300 | 06/01/2029 | 06/01/2021 | A | 55,838 | ||||||||||||||
| 100,000 | Oxnard, CA Financing Authority1 | 5.000 | 06/01/2036 | 06/01/2016 | A | 103,014 | ||||||||||||||
| 2,000,000 | Oxnard, CA Financing Authority Wastewater1 | 5.000 | 06/01/2029 | 06/01/2024 | A | 2,276,680 | ||||||||||||||
| 845,000 | Oxnard, CA Harbor District1 | 5.000 | 08/01/2020 | 08/01/2020 | 941,955 | |||||||||||||||
| 530,000 | Oxnard, CA School District | 5.000 | 08/01/2027 | 08/01/2023 | A | 610,629 | ||||||||||||||
37 OPPENHEIMER ROCHESTER LIMITED TERM CALIFORNIA MUNICIPAL FUND
STATEMENT OF INVESTMENTS Continued
| Principal Amount | Coupon | Maturity | Effective Maturity* | Value | ||||||||||||||||
| California (Continued) | |||||||||||||||||||
| $460,000 | Oxnard, CA School District | 5.000 | % | 08/01/2026 | 08/01/2023 | A | $ | 533,996 | ||||||||||||
| 360,000 | Palm Desert, CA Financing Authority1 | 5.000 | 04/01/2030 | 10/01/2015 | A | 360,878 | ||||||||||||||
| 50,000 | Palm Desert, CA Financing Authority1 | 5.200 | 10/01/2028 | 10/01/2015 | A | 50,150 | ||||||||||||||
| 50,000 | Palm Desert, CA Financing Authority1 | 5.000 | 04/01/2026 | 10/01/2015 | A | 50,152 | ||||||||||||||
| 55,000 | Palm Desert, CA Financing Authority1 | 5.000 | 04/01/2027 | 10/01/2015 | A | 55,158 | ||||||||||||||
| 15,000 | Palm Desert, CA Financing Authority1 | 4.600 | 04/01/2022 | 10/01/2015 | A | 15,050 | ||||||||||||||
| 1,230,000 | Palm Desert, CA Financing Authority1 | 5.000 | 08/01/2021 | 02/01/2016 | A | 1,245,879 | ||||||||||||||
| 125,000 | Palm Desert, CA Financing Authority1 | 5.000 | 04/01/2025 | 10/01/2015 | A | 125,408 | ||||||||||||||
| 320,000 | Palm Springs, CA Airport Passenger Facilities (Palm Springs International Airport) | 6.000 | 07/01/2018 | 07/01/2016 | A | 324,970 | ||||||||||||||
| 145,000 | Palm Springs, CA Airport Passenger Facilities (Palm Springs Regional Airport) | 5.250 | 01/01/2022 | 08/31/2015 | A | 145,609 | ||||||||||||||
| 10,000 | Palm Springs, CA Financing Authority (Palm Springs Regional Airport) | 5.500 | 01/01/2028 | 08/31/2015 | A | 10,039 | ||||||||||||||
| 45,000 | Palm Springs, CA Improvement Bond Act 1915 | 5.650 | 09/02/2029 | 09/02/2015 | A | 45,214 | ||||||||||||||
| 100,000 | Palmdale, CA Civic Authority | 5.000 | 07/01/2025 | 08/31/2015 | A | 100,401 | ||||||||||||||
| 125,000 | Palmdale, CA Community Facilities District Special Tax | 5.400 | 09/01/2035 | 09/01/2015 | A | 126,391 | ||||||||||||||
| 20,000 | Palmdale, CA COP (Park Improvement and Avenue South Construction)1 | 5.000 | 09/01/2024 | 09/01/2015 | A | 20,038 | ||||||||||||||
| 25,000 | Palmdale, CA COP (Park Improvement and Avenue South Construction)1 | 5.000 | 09/01/2032 | 09/01/2015 | A | 25,033 | ||||||||||||||
| 15,000 | Palmdale, CA COP (Park Improvement and Avenue South Construction)1 | 5.000 | 09/01/2017 | 09/01/2015 | A | 15,052 | ||||||||||||||
| 365,000 | Palmdale, CA Elementary School District Special Tax Community Facilities District No. 90-13 | 5.700 | 08/01/2018 | 08/27/2015 | A | 366,526 | ||||||||||||||
| 15,000 | Palo Alto, CA Utility1 | 5.250 | 06/01/2024 | 12/01/2015 | A | 15,254 | ||||||||||||||
| 175,000 | Palo Alto, CA Utility1 | 5.250 | 06/01/2021 | 12/01/2015 | A | 177,977 | ||||||||||||||
| 30,000 | Parlier, CA Redevel. Agency Tax Allocation1 | 5.000 | 08/01/2018 | 08/24/2015 | A | 30,051 | ||||||||||||||
| 100,000 | Parlier, CA Redevel. Agency Tax Allocation1 | 5.125 | 08/01/2023 | 08/31/2015 | A | 100,111 | ||||||||||||||
| 90,000 | Patterson, CA Joint Unified School District | 5.000 | 08/01/2015 | 08/01/2015 | 90,000 | |||||||||||||||
| 185,000 | Perris, CA Elementary School District1 | 6.000 | 08/01/2027 | 08/01/2024 | A | 231,491 | ||||||||||||||
| 205,000 | Perris, CA Elementary School District1 | 6.000 | 08/01/2028 | 08/01/2024 | A | 254,305 | ||||||||||||||
| 545,000 | Perris, CA Joint Powers Authority | 5.000 | 09/01/2025 | 09/01/2023 | A | 602,912 | ||||||||||||||
| 20,000 | Perris, CA Public Financing Authority | 5.350 | 10/01/2036 | 08/28/2015 | A | 20,086 | ||||||||||||||
| 390,000 | Perris, CA Public Financing Authority1 | 7.000 | 10/01/2033 | 10/01/2018 | A | 442,108 | ||||||||||||||
| 150,000 | Petaluma, CA COP (Airport)1 | 5.125 | 08/01/2028 | 08/31/2015 | A | 150,116 | ||||||||||||||
| 20,000 | Petaluma, CA Improvement Bond Act 1915 | 6.000 | 09/02/2020 | 09/02/2015 | A | 20,043 | ||||||||||||||
| 2,265,000 | Pico Rivera, CA Public Financing Authority1 | 5.500 | 09/01/2031 | 09/01/2019 | A | 2,575,577 | ||||||||||||||
| 20,000 | Pinole, CA Redevel. Agency Tax Allocation (Pinole Vista Redevel.) | 5.250 | 08/01/2016 | 08/31/2015 | A | 20,084 | ||||||||||||||
| 100,000 | Placentia-Yorba Linda, CA Unified School District1 | 5.000 | 10/01/2026 | 10/01/2015 | A | 100,757 | ||||||||||||||
| 30,000 | Pomona, CA Public Financing Authority | 5.000 | 02/01/2024 | 08/31/2015 | A | 30,103 | ||||||||||||||
| 25,000 | Pomona, CA Public Financing Authority1 | 5.250 | 02/01/2018 | 08/31/2015 | A | 25,082 | ||||||||||||||
| 65,000 | Pomona, CA Public Financing Authority | 5.125 | 02/01/2016 | 08/31/2015 | A | 65,240 | ||||||||||||||
| 400,000 | Pomona, CA Public Financing Authority (Merfed Redevel.)1 | 5.250 | 02/01/2020 | 08/31/2015 | A | 401,156 | ||||||||||||||
| 35,000 | Pomona, CA Public Financing Authority (Merged Redevel.)1 | 5.000 | 02/01/2027 | 08/31/2015 | A | 35,049 | ||||||||||||||
| 45,000 | Poway, CA Hsg. (Poinsetta Mobile Home Park)1 | 5.000 | 05/01/2023 | 08/31/2015 | A | 45,088 | ||||||||||||||
38 OPPENHEIMER ROCHESTER LIMITED TERM CALIFORNIA MUNICIPAL FUND
| Principal Amount | Coupon | Maturity | Effective Maturity* | Value | ||||||||||||||||
| California (Continued) | |||||||||||||||||||
| $10,000 | Poway, CA Public Financing Authority (Water Services) | 5.500 | % | 11/01/2015 | 08/31/2015 | A | $ | 10,036 | ||||||||||||
| 855,000 | Poway, CA Unified School District Public Financing Authority Special Tax | 5.000 | 09/15/2025 | 09/15/2023 | A | 978,513 | ||||||||||||||
| 1,210,000 | Poway, CA Unified School District Public Financing Authority Special Tax | 5.000 | 09/15/2029 | 09/15/2023 | A | 1,349,985 | ||||||||||||||
| 170,000 | Poway, CA Unified School District Special Tax Community Facilities District No. 14 | 5.125 | 09/01/2026 | 09/01/2015 | A | 172,409 | ||||||||||||||
| 150,000 | Poway, CA Unified School District Special Tax Community Facilities District No. 6 | 5.125 | 09/01/2028 | 09/01/2015 | A | 150,626 | ||||||||||||||
| 1,800,000 | Rancho Cucamonga, CA Community Facilities District Special Tax No. 2003-1 | 5.750 | 09/01/2028 | 09/01/2018 | A | 1,924,578 | ||||||||||||||
| 30,000 | Rancho Mirage, CA Improvement Bond Act 1915 | 5.750 | 09/02/2022 | 09/02/2015 | A | 30,047 | ||||||||||||||
| 20,000 | Rancho Mirage, CA Improvement Bond Act 1915 | 5.750 | 09/02/2026 | 09/02/2015 | A | 20,017 | ||||||||||||||
| 20,000 | Rancho Mirage, CA Improvement Bond Act 1915 | 5.500 | 09/02/2024 | 09/02/2015 | A | 20,016 | ||||||||||||||
| 25,000 | Redding, CA Redevel. Agency (Redding School District)1 | 5.000 | 09/01/2021 | 09/01/2015 | A | 25,060 | ||||||||||||||
| 100,000 | Redding, CA Redevel. Agency (Redding School District)1 | 5.125 | 09/01/2030 | 09/01/2015 | A | 100,160 | ||||||||||||||
| 30,000 | Redding, CA Redevel. Agency (Redding School District)1 | 5.000 | 09/01/2026 | 09/01/2015 | A | 30,053 | ||||||||||||||
| 25,000 | Redding, CA Redevel. Agency (Shastec Redevel.)1 | 5.000 | 09/01/2017 | 09/01/2015 | A | 25,066 | ||||||||||||||
| 10,000 | Redlands, CA Community Facilities District | 5.850 | 09/01/2033 | 09/01/2015 | A | 10,010 | ||||||||||||||
| 20,000 | Redlands, CA Unified School District | 5.000 | 07/01/2022 | 08/31/2015 | A | 20,079 | ||||||||||||||
| 25,000 | Redlands, CA Unified School District | 5.000 | 07/01/2026 | 08/31/2015 | A | 25,095 | ||||||||||||||
| 690,000 | Redwood City, CA Special Tax | 5.000 | 09/01/2029 | 09/01/2022 | A | 747,208 | ||||||||||||||
| 50,000 | Rialto, CA Special Tax Community Facilities District No. 2006-1 | 5.250 | 09/01/2021 | 09/01/2015 | A | 50,589 | ||||||||||||||
| 65,000 | Rialto, CA Special Tax Community Facilities District No. 2006-1 | 5.125 | 09/01/2018 | 09/01/2015 | A | 65,795 | ||||||||||||||
| 100,000 | Rialto, CA Special Tax Community Facilities District No. 2006-1 | 5.250 | 09/01/2020 | 09/01/2015 | A | 101,192 | ||||||||||||||
| 50,000 | Rialto, CA Special Tax Community Facilities District No. 2006-1 | 5.000 | 09/01/2016 | 09/01/2015 | A | 50,639 | ||||||||||||||
| 25,000 | Rialto, CA Special Tax Community Facilities District No. 2006-1 | 5.050 | 09/01/2017 | 09/01/2015 | A | 25,310 | ||||||||||||||
| 100,000 | Rialto, CA Special Tax Community Facilities District No. 2006-1 | 5.200 | 09/01/2019 | 09/01/2015 | A | 101,209 | ||||||||||||||
| 20,000 | Rio Hondo, CA Community College District1 | 5.000 | 08/01/2017 | 08/31/2015 | A | 20,082 | ||||||||||||||
| 450,000 | Riverside County, CA Community Facilities District (Lake Hills Crest) | 5.000 | 09/01/2028 | 09/01/2022 | A | 490,046 | ||||||||||||||
| 385,000 | Riverside County, CA Community Facilities District Special Tax No. 87-1 | 5.200 | 09/01/2015 | 09/01/2015 | 386,278 | |||||||||||||||
| 225,000 | Riverside County, CA Community Facilities District Special Tax No. 87-1 | 5.250 | 09/01/2016 | 09/01/2015 | A | 227,921 | ||||||||||||||
| 475,000 | Riverside County, CA Community Facilities District Special Tax No. 88-8 | 5.500 | 09/01/2015 | 09/01/2015 | 476,530 | |||||||||||||||
| 735,000 | Riverside County, CA COP (Historic Courthouse)1 | 5.000 | 11/01/2024 | 11/01/2015 | A | 743,791 | ||||||||||||||
| 190,000 | Riverside County, CA Public Financing Authority | 5.250 | 10/01/2017 | 08/31/2015 | A | 190,806 | ||||||||||||||
39 OPPENHEIMER ROCHESTER LIMITED TERM CALIFORNIA MUNICIPAL FUND
STATEMENT OF INVESTMENTS Continued
Principal Amount | Coupon | Maturity | Effective Maturity* | Value | ||||||||||||||||
| California (Continued) | |||||||||||||||||||
| $100,000 | Riverside County, CA Public Financing Authority (Jurupa Valley Desert & Interstate 215 Corridor Redevel.)1 | 5.000 | % | 10/01/2022 | 10/01/2016 | A | $ | 103,058 | ||||||||||||
| 300,000 | Riverside County, CA Public Financing Authority COP | 5.750 | 05/15/2019 | 12/10/2017 | B | 251,817 | ||||||||||||||
| 305,000 | Riverside County, CA Redevel. Agency (Jurupa Valley Redevel.)1 | 5.750 | 10/01/2020 | 10/01/2020 | 352,351 | |||||||||||||||
| 20,000 | Riverside, CA Improvement Bond Act 1915 | 8.250 | 09/02/2016 | 09/02/2015 | A | 20,113 | ||||||||||||||
| 335,000 | Riverside, CA Improvement Bond Act 1915 (Riverside Auto Center Assessment District) | 5.000 | 09/02/2024 | 09/02/2015 | A | 345,502 | ||||||||||||||
| 315,000 | Riverside, CA Improvement Bond Act 1915 (Riverside Auto Center Assessment District) | 5.000 | 09/02/2023 | 09/02/2015 | A | 324,926 | ||||||||||||||
| 200,000 | Riverside, CA Improvement Bond Act 1915 (Riverwalk Business) | 6.250 | 09/02/2029 | 09/02/2015 | A | 200,344 | ||||||||||||||
| 1,640,000 | Riverside, CA Public Financing Authority | 5.000 | 11/01/2027 | 11/01/2022 | A | 1,817,448 | ||||||||||||||
| 1,155,000 | Riverside, CA Public Financing Authority | 5.000 | 11/01/2028 | 11/01/2022 | A | 1,272,926 | ||||||||||||||
| 100,000 | Riverside, CA Public Financing Authority (University Corridor/Sycamore)1 | 5.000 | 08/01/2019 | 08/01/2017 | A | 106,312 | ||||||||||||||
| 150,000 | Riverside, CA Unified School District1 | 5.000 | 12/01/2026 | 12/01/2015 | A | 152,321 | ||||||||||||||
| 100,000 | Rocklin, CA Unified School District Community Facilities District No. 1 | 5.000 | 09/01/2025 | 09/01/2015 | A | 100,378 | ||||||||||||||
| 25,000 | Romoland, CA School District Special Tax | 6.000 | 09/01/2033 | 09/01/2015 | A | 25,042 | ||||||||||||||
| 85,000 | Romoland, CA School District Special Tax | 6.375 | 09/01/2033 | 09/01/2015 | A | 85,170 | ||||||||||||||
| 50,000 | Romoland, CA School District Special Tax | 6.375 | 09/01/2033 | 09/01/2015 | A | 50,100 | ||||||||||||||
| 500,000 | Romoland, CA School District Special Tax Community Facilities District No. 2004-1 | 5.000 | 09/01/2028 | 09/01/2023 | A | 532,920 | ||||||||||||||
| 405,000 | Romoland, CA School District Special Tax Community Facilities District No. 2004-1 | 5.000 | 09/01/2027 | 09/01/2023 | A | 432,913 | ||||||||||||||
| 365,000 | Romoland, CA School District Special Tax Community Facilities District No. 2004-1 | 5.000 | 09/01/2025 | 09/01/2023 | A | 393,908 | ||||||||||||||
| 440,000 | Romoland, CA School District Special Tax Community Facilities District No. 2004-1 | 5.000 | 09/01/2026 | 09/01/2023 | A | 472,635 | ||||||||||||||
| 110,000 | Romoland, CA School District Special Tax Community Facilities District No. 91-1 | 5.400 | 09/01/2028 | 09/01/2015 | A | 110,150 | ||||||||||||||
| 190,000 | Roseville, CA Natural Gas Finance Authority1 | 5.000 | 02/15/2021 | 02/15/2021 | 212,340 | |||||||||||||||
| 100,000 | Roseville, CA Natural Gas Finance Authority1 | 5.000 | 02/15/2025 | 02/15/2025 | 113,376 | |||||||||||||||
| 80,000 | Roseville, CA Natural Gas Finance Authority1 | 5.000 | 02/15/2023 | 02/15/2023 | 89,925 | |||||||||||||||
| 265,000 | Roseville, CA Natural Gas Finance Authority1 | 5.000 | 02/15/2024 | 02/15/2024 | 299,757 | |||||||||||||||
| 555,000 | Sacramento County, CA (Juvenile Courthouse) COP | 5.000 | 12/01/2022 | 08/31/2015 | A | 557,148 | ||||||||||||||
| 795,000 | Sacramento County, CA (Juvenile Courthouse) COP | 5.000 | 12/01/2021 | 08/31/2015 | A | 798,124 | ||||||||||||||
| 430,000 | Sacramento County, CA (Juvenile Courthouse) COP | 5.000 | 12/01/2023 | 08/31/2015 | A | 431,625 | ||||||||||||||
| 100,000 | Sacramento County, CA Airport System1 | 5.500 | 07/01/2027 | 07/01/2018 | A | 111,651 | ||||||||||||||
| 1,200,000 | Sacramento County, CA Airport System1 | 5.250 | 07/01/2033 | 07/01/2018 | A | 1,306,920 | ||||||||||||||
| 600,000 | Sacramento County, CA Airport System1 | 5.000 | 07/01/2022 | 07/01/2018 | A | 668,478 | ||||||||||||||
| 7,505,000 | Sacramento County, CA Airport System1 | 5.750 | 07/01/2024 | 07/01/2018 | A | 8,455,808 | ||||||||||||||
| 2,975,000 | Sacramento County, CA COP1 | 5.750 | 02/01/2030 | 02/01/2020 | A | 3,334,291 | ||||||||||||||
| 100,000 | Sacramento County, CA COP | 4.750 | 10/01/2017 | 08/31/2015 | A | 100,259 | ||||||||||||||
40 OPPENHEIMER ROCHESTER LIMITED TERM CALIFORNIA MUNICIPAL FUND
Principal Amount | Coupon | Maturity | Effective Maturity* | Value | ||||||||||||||||
| California (Continued) | |||||||||||||||||||
| $905,000 | Sacramento County, CA Hsg. Authority (Cottage Estates Apartments)1,3 | 6.000 | % | 02/01/2033 | 09/01/2015 | A | $ | 917,109 | ||||||||||||
| 1,500,000 | Sacramento County, CA Hsg. Authority (Verandas Apartments Senior Community)1 | 5.700 | 03/01/2034 | 09/01/2015 | A | 1,504,755 | ||||||||||||||
| 400,000 | Sacramento County, CA Hsg. Authority (Vintage Willow Creek Senior Apartments) | 5.250 | 06/01/2027 | 08/31/2015 | A | 401,872 | ||||||||||||||
| 20,000 | Sacramento County, CA Public Financing Authority (County & City Redevel.)1 | 5.125 | 12/01/2028 | 08/31/2015 | A | 20,027 | ||||||||||||||
| 10,000 | Sacramento County, CA Public Financing Authority (County & City Redevel.) | 5.000 | 12/01/2022 | 08/31/2015 | A | 10,038 | ||||||||||||||
| 25,000 | Sacramento County, CA Public Financing Authority (Sacramento City Redevel.)1 | 5.200 | 12/01/2019 | 08/31/2015 | A | 25,069 | ||||||||||||||
| 50,000 | Sacramento County, CA Public Financing Authority (Sacramento City Redevel.)1 | 5.000 | 12/01/2017 | 08/31/2015 | A | 50,154 | ||||||||||||||
| 50,000 | Sacramento County, CA Public Financing Authority (Sacramento City Redevel.)1 | 5.000 | 12/01/2033 | 08/31/2015 | A | 50,049 | ||||||||||||||
| 250,000 | Sacramento, CA City Financing Authority1 | 5.000 | 12/01/2034 | 12/01/2015 | A | 251,505 | ||||||||||||||
| 225,000 | Sacramento, CA City Financing Authority1 | 5.000 | 12/01/2024 | 12/01/2015 | A | 228,404 | ||||||||||||||
| 50,000 | Sacramento, CA City Financing Authority1 | 5.000 | 12/01/2023 | 12/01/2015 | A | 50,774 | ||||||||||||||
| 30,000 | Sacramento, CA City Financing Authority (City Hall) | 5.250 | 12/01/2016 | 08/31/2015 | A | 30,127 | ||||||||||||||
| �� | 750,000 | Sacramento, CA City Financing Authority (North Natomas CFD No. 2) | 6.250 | 09/01/2023 | 09/01/2015 | A | 753,735 | |||||||||||||
| 455,000 | Sacramento, CA City Financing Authority (Westlake & Regency Park) | 5.000 | 09/01/2027 | 03/01/2023 | A | 509,855 | ||||||||||||||
| 785,000 | Sacramento, CA City Financing Authority (Westlake & Regency Park)1 | 5.000 | 09/01/2026 | 03/01/2023 | A | 889,240 | ||||||||||||||
| 1,840,000 | Sacramento, CA City Financing Authority (Westlake & Regency Park) | 5.000 | 09/01/2024 | 03/01/2023 | A | 2,122,937 | ||||||||||||||
| 850,000 | Sacramento, CA City Financing Authority (Westlake & Regency Park) | 5.000 | 09/01/2025 | 03/01/2023 | A | 965,745 | ||||||||||||||
| 15,000 | Sacramento, CA Improvement Bond Act 1915 (Citywide Landscaping & Lighting) | 5.500 | 09/02/2016 | 08/31/2015 | A | 15,057 | ||||||||||||||
| 1,235,000 | Sacramento, CA Municipal Utility District1 | 5.000 | 07/01/2030 | 07/01/2025 | A | 1,459,424 | ||||||||||||||
| 220,000 | Saddleback Valley, CA Unified School District | 5.650 | 09/01/2017 | 09/01/2015 | A | 221,001 | ||||||||||||||
| 70,000 | Salinas, CA Redevel. Agency Tax Allocation (Central City Revitalization) | 5.500 | 11/01/2023 | 08/31/2015 | A | 70,294 | ||||||||||||||
| 50,000 | San Bernardino County, CA (Single Family Mtg.) | 5.376 | 4 | 05/01/2031 | 08/31/2015 | A | 21,730 | |||||||||||||
| 15,000 | San Bernardino County, CA COP (Medical Center Financing)3 | 5.250 | 08/01/2016 | 08/16/2015 | A | 15,064 | ||||||||||||||
| 200,000 | San Bernardino County, CA COP (Medical Center Financing)1 | 5.000 | 08/01/2026 | 08/31/2015 | A | 200,708 | ||||||||||||||
| 180,000 | San Bernardino County, CA COP (Medical Center Financing)1 | 5.000 | 08/01/2028 | 08/31/2015 | A | 180,418 | ||||||||||||||
| 270,000 | San Bernardino County, CA Flood Control District1 | 5.000 | 08/01/2029 | 08/31/2015 | A | 271,004 | ||||||||||||||
| 190,000 | San Bernardino County, CA Redevel. Agency (San Sevaine Redevel.)1 | 5.000 | 09/01/2019 | 09/01/2015 | A | 190,667 | ||||||||||||||
| 35,000 | San Bernardino, CA Community College District1 | 5.000 | 08/01/2017 | 08/31/2015 | A | 35,143 | ||||||||||||||
| 50,000 | San Bernardino, CA Joint Powers Financing Authority1 | 5.750 | 10/01/2022 | 10/01/2022 | 59,213 | |||||||||||||||
41 OPPENHEIMER ROCHESTER LIMITED TERM CALIFORNIA MUNICIPAL FUND
STATEMENT OF INVESTMENTS Continued
Principal Amount | Coupon | Maturity | Effective Maturity* | Value | ||||||||||||||||
| California (Continued) | |||||||||||||||||||
| $70,000 | San Bernardino, CA Joint Powers Financing Authority1 | 5.750 | % | 10/01/2023 | 10/01/2023 | $ | 83,318 | |||||||||||||
| 10,000 | San Bernardino, CA Joint Powers Financing Authority1 | 5.750 | 10/01/2018 | 10/01/2018 | 11,192 | |||||||||||||||
| 200,000 | San Bernardino, CA Joint Powers Financing Authority1 | 5.750 | 10/01/2019 | 10/01/2019 | 229,014 | |||||||||||||||
| 180,000 | San Bernardino, CA Joint Powers Financing Authority1 | 5.750 | 10/01/2023 | 10/01/2023 | 214,245 | |||||||||||||||
| 335,000 | San Bernardino, CA Joint Powers Financing Authority (California Dept. of Transportation Lease)1 | 5.500 | 12/01/2020 | 08/31/2015 | A | 335,918 | ||||||||||||||
| 160,000 | San Bernardino, CA Joint Powers Financing Authority (California Dept. of Transportation Lease)1 | 5.500 | 12/01/2020 | 08/31/2015 | A | 160,438 | ||||||||||||||
| 440,000 | San Bernardino, CA Joint Powers Financing Authority (Police Station)1 | 5.500 | 09/01/2024 | 08/31/2015 | A | 439,969 | ||||||||||||||
| 285,000 | San Bernardino, CA Joint Powers Financing Authority (Police Station)1 | 5.500 | 09/01/2020 | 09/01/2015 | A | 285,011 | ||||||||||||||
| 150,000 | San Bernardino, CA Joint Powers Financing Authority (Tax Allocation) | 6.625 | 04/01/2026 | 08/31/2015 | A | 150,240 | ||||||||||||||
| 295,000 | San Bernardino, CA Mountains Community Hospital District COP | 5.000 | 02/01/2017 | 08/05/2016 | B | 300,071 | ||||||||||||||
| 135,000 | San Bernardino, CA Municipal Water Dept.1 | 5.000 | 02/01/2017 | 08/31/2015 | A | 135,375 | ||||||||||||||
| 25,000 | San Bernardino, CA Redevel. Agency (Ramona Senior Complex) | 7.875 | 07/01/2025 | 01/01/2016 | A | 25,212 | ||||||||||||||
| 50,000 | San Bruno, CA Police Facilities Financing1 | 5.250 | 02/01/2021 | 08/31/2015 | A | 50,177 | ||||||||||||||
| 1,520,000 | San Diego County, CA Regional Airport Authority1 | 5.000 | 07/01/2026 | 07/01/2023 | A | 1,748,395 | ||||||||||||||
| 90,000 | San Diego County, CA Water Authority | 4.750 | 05/01/2028 | 08/31/2015 | A | 90,318 | ||||||||||||||
| 640,000 | San Diego, CA Community Facilities District No. 3 Special Tax | 5.000 | 09/01/2028 | 09/01/2023 | A | 694,541 | ||||||||||||||
| 545,000 | San Diego, CA Community Facilities District No. 3 Special Tax | 5.000 | 09/01/2025 | 09/01/2023 | A | 598,884 | ||||||||||||||
| 720,000 | San Diego, CA Community Facilities District No. 3 Special Tax | 5.000 | 09/01/2030 | 09/01/2023 | A | 775,469 | ||||||||||||||
| 610,000 | San Diego, CA Community Facilities District No. 3 Special Tax | 5.000 | 09/01/2027 | 09/01/2023 | A | 663,906 | ||||||||||||||
| 4,680,000 | San Diego, CA Hsg. Authority (Island Village Apartments)1 | 5.650 | 5 | 07/01/2034 | 08/31/2015 | A | 4,699,562 | |||||||||||||
| 255,000 | San Diego, CA Improvement Bond Act 1915 | 5.375 | 09/02/2030 | 09/02/2018 | A | 263,951 | ||||||||||||||
| 245,000 | San Diego, CA Improvement Bond Act 1915 | 5.375 | 09/02/2029 | 09/02/2018 | A | 253,742 | ||||||||||||||
| 285,000 | San Diego, CA Improvement Bond Act 1915 | 5.500 | 09/02/2032 | 09/02/2018 | A | 294,966 | ||||||||||||||
| 265,000 | San Diego, CA Improvement Bond Act 1915 | 5.500 | 09/02/2031 | 09/02/2018 | A | 274,654 | ||||||||||||||
| 30,000 | San Diego, CA Improvement Bond Act 1915 | 5.800 | 09/02/2017 | 09/02/2015 | A | 30,072 | ||||||||||||||
| 190,000 | San Diego, CA Improvement Bond Act 1915 | 5.000 | 09/02/2024 | 09/02/2018 | A | 197,000 | ||||||||||||||
| 180,000 | San Diego, CA Improvement Bond Act 1915 | 5.000 | 09/02/2023 | 09/02/2018 | A | 187,592 | ||||||||||||||
| 170,000 | San Diego, CA Improvement Bond Act 1915 | 5.000 | 09/02/2022 | 09/02/2018 | A | 178,050 | ||||||||||||||
| 165,000 | San Diego, CA Improvement Bond Act 1915 | 5.000 | 09/02/2021 | 09/02/2018 | A | 174,085 | ||||||||||||||
| 230,000 | San Diego, CA Improvement Bond Act 1915 | 5.250 | 09/02/2028 | 09/02/2018 | A | 238,011 | ||||||||||||||
| 220,000 | San Diego, CA Improvement Bond Act 1915 | 5.125 | 09/02/2027 | 09/02/2018 | A | 227,152 | ||||||||||||||
| 210,000 | San Diego, CA Improvement Bond Act 1915 | 5.125 | 09/02/2026 | 09/02/2018 | A | 217,279 | ||||||||||||||
42 OPPENHEIMER ROCHESTER LIMITED TERM CALIFORNIA MUNICIPAL FUND
Principal Amount | Coupon | Maturity | Effective Maturity* | Value | ||||||||||||||||
| California (Continued) | |||||||||||||||||||
| $195,000 | San Diego, CA Improvement Bond Act 1915 | 5.000 | % | 09/02/2025 | 09/02/2018 | A | $ | 201,458 | ||||||||||||
| 60,000 | San Diego, CA Mtg. (Mariners Cove) | 5.800 | 09/01/2015 | 08/31/2015 | A | 60,247 | ||||||||||||||
| 1,250,000 | San Diego, CA Public Facilities Financing Authority1 | 5.000 | 10/15/2033 | 10/15/2025 | A | 1,409,688 | ||||||||||||||
| 1,000,000 | San Diego, CA Public Facilities Financing Authority1 | 5.000 | 10/15/2034 | 10/15/2025 | A | 1,121,360 | ||||||||||||||
| 1,000,000 | San Diego, CA Public Facilities Financing Authority (Ballpark)1 | 5.250 | 02/15/2032 | 02/15/2017 | A | 1,055,240 | ||||||||||||||
| 10,000 | San Diego, CA Redevel. Agency | 6.000 | 11/01/2015 | 08/31/2015 | A | 10,049 | ||||||||||||||
| 5,000 | San Diego, CA Redevel. Agency (Centre City Redevel.)1 | 5.250 | 09/01/2020 | 09/01/2015 | A | 5,021 | ||||||||||||||
| 175,000 | San Diego, CA Redevel. Agency (Centre City) | 5.250 | 09/01/2021 | 09/01/2015 | A | 175,732 | ||||||||||||||
| 115,000 | San Diego, CA Redevel. Agency (Centre City)1 | 5.350 | 09/01/2024 | 09/01/2015 | A | 115,123 | ||||||||||||||
| 55,000 | San Diego, CA Redevel. Agency (Centre City) | 5.000 | 09/01/2026 | 09/01/2015 | A | 55,208 | ||||||||||||||
| 1,000,000 | San Diego, CA Redevel. Agency (Centre City)1 | 6.400 | 09/01/2019 | 09/01/2015 | A | 1,003,800 | ||||||||||||||
| 95,000 | San Diego, CA Redevel. Agency (Centre City)1 | 5.250 | 09/01/2026 | 09/01/2015 | A | 95,106 | ||||||||||||||
| 100,000 | San Diego, CA Redevel. Agency (Centre City)1 | 5.200 | 09/01/2019 | 09/01/2015 | A | 100,213 | ||||||||||||||
| 55,000 | San Diego, CA Redevel. Agency (Centre City)1 | 5.300 | 09/01/2020 | 09/01/2015 | A | 55,091 | ||||||||||||||
| 10,000 | San Diego, CA Redevel. Agency (Centre City)1 | 5.500 | 09/01/2019 | 09/01/2015 | A | 10,021 | ||||||||||||||
| 25,000 | San Diego, CA Redevel. Agency (Centre City)1 | 5.600 | 09/01/2024 | 09/01/2015 | A | 25,032 | ||||||||||||||
| 20,000 | San Diego, CA Redevel. Agency (Centre City) | 5.000 | 09/01/2015 | 08/31/2015 | A | 20,070 | ||||||||||||||
| 20,000 | San Diego, CA Redevel. Agency (Mt. Hope Redevel.) | 5.000 | 10/01/2026 | 08/31/2015 | A | 20,076 | ||||||||||||||
| 95,000 | San Diego, CA Redevel. Agency (Mt. Hope Redevel.) | 5.875 | 10/01/2019 | 08/31/2015 | A | 95,450 | ||||||||||||||
| 20,000 | San Diego, CA Redevel. Agency (Mt. Hope Redevel.) | 5.000 | 10/01/2021 | 08/31/2015 | A | 20,080 | ||||||||||||||
| 70,000 | San Diego, CA Redevel. Agency (North Bay Redevel.)1 | 5.800 | 09/01/2022 | 09/01/2015 | A | 70,132 | ||||||||||||||
| 300,000 | San Diego, CA Redevel. Agency (North Bay Redevel.)1 | 5.875 | 09/01/2030 | 09/01/2015 | A | 300,429 | ||||||||||||||
| 85,000 | San Diego, CA Redevel. Agency (North Park Redevel.)1 | 5.600 | 09/01/2019 | 09/01/2015 | A | 85,280 | ||||||||||||||
| 710,000 | San Diego, CA Redevel. Agency (North Park Redevel.)1 | 5.900 | 09/01/2025 | 09/01/2015 | A | 712,024 | ||||||||||||||
| 110,000 | San Diego, CA Redevel. Agency (North Park Redevel.)1 | 5.700 | 09/01/2020 | 09/01/2015 | A | 110,370 | ||||||||||||||
| 25,000 | San Diego, CA Redevel. Agency Tax Allocation (North Park Redevel.)1 | 5.900 | 09/01/2030 | 09/01/2015 | A | 25,062 | ||||||||||||||
| 5,000 | San Dimas, CA Redevel. Agency (Creative Growth Redevel.)1 | 6.750 | 09/01/2016 | 09/01/2015 | A | 5,027 | ||||||||||||||
| 325,000 | San Francisco, CA City & County Airports Commission1 | 5.250 | 01/01/2026 | 08/31/2015 | A | 325,406 | ||||||||||||||
| 7,500,000 | San Francisco, CA City & County Airports Commission | 5.500 | 05/01/2027 | 05/01/2018 | A | 8,314,650 | ||||||||||||||
| 320,000 | San Francisco, CA City & County Airports Commission (SFO Fuel Company)1 | 5.250 | 01/01/2024 | 08/31/2015 | A | 320,477 | ||||||||||||||
| 510,000 | San Francisco, CA City & County Airports Commission (SFO Fuel Company) | 6.125 | 01/01/2027 | 08/31/2015 | A | 512,361 | ||||||||||||||
| 1,130,000 | San Francisco, CA City & County Airports Commission (SFO Fuel Company) | 6.100 | 01/01/2020 | 08/31/2015 | A | 1,135,401 | ||||||||||||||
43 OPPENHEIMER ROCHESTER LIMITED TERM CALIFORNIA MUNICIPAL FUND
STATEMENT OF INVESTMENTS Continued
Principal Amount | Coupon | Maturity | Effective Maturity* | Value | ||||||||||||||||
| California (Continued) | |||||||||||||||||||
| $225,000 | San Francisco, CA City & County Airports Commission (SFO Fuel Company) | 5.125 | % | 01/01/2017 | 08/31/2015 | A | $ | 225,612 | ||||||||||||
| 1,385,000 | San Francisco, CA City & County Airports Commission (SFO Fuel Company)1 | 5.250 | 01/01/2022 | 08/31/2015 | A | 1,387,396 | ||||||||||||||
| 75,000 | San Francisco, CA City & County Airports Commission (SFO Fuel Company)1 | 5.250 | 01/01/2027 | 08/31/2015 | A | 75,091 | ||||||||||||||
| 3,040,000 | San Francisco, CA City & County Airports Commission (SFO Fuel Company)1 | 5.250 | 01/01/2019 | 08/31/2015 | A | 3,047,326 | ||||||||||||||
| 95,000 | San Francisco, CA City & County Airports Commission (SFO Fuel Company)1 | 5.250 | 01/01/2023 | 08/31/2015 | A | 95,154 | ||||||||||||||
| 120,000 | San Francisco, CA City & County Airports Commission (SFO Fuel Company)1 | 5.250 | 01/01/2021 | 08/31/2015 | A | 120,234 | ||||||||||||||
| 165,000 | San Francisco, CA City & County Airports Commission (SFO Fuel Company)1 | 5.250 | 01/01/2020 | 08/31/2015 | A | 165,366 | ||||||||||||||
| 10,000 | San Francisco, CA City & County COP | 5.000 | 09/01/2017 | 09/01/2015 | A | 10,040 | ||||||||||||||
| 25,000 | San Francisco, CA City & County COP | 5.000 | 09/01/2018 | 09/01/2015 | A | 25,100 | ||||||||||||||
| 40,000 | San Francisco, CA City & County Improvement Bond Act 1915 | 6.850 | 09/02/2026 | 09/02/2015 | A | 41,294 | ||||||||||||||
| 1,250,000 | San Francisco, CA City & County Redevel. Agency (Mission Bay South Public Improvements) | 5.000 | 08/01/2026 | 08/01/2022 | A | 1,394,888 | ||||||||||||||
| 500,000 | San Francisco, CA City & County Redevel. Agency (Mission Bay South Public Improvements) | 5.000 | 08/01/2023 | 08/01/2022 | A | 574,225 | ||||||||||||||
| 1,600,000 | San Francisco, CA City & County Redevel. Agency (Mission Bay South Public Improvements) | 5.000 | 08/01/2025 | 08/01/2022 | A | 1,792,928 | ||||||||||||||
| 115,000 | San Francisco, CA City & County Redevel. Financing Authority (Mission Bay North Redevel.)1 | 6.000 | 08/01/2029 | 08/01/2019 | A | 130,756 | ||||||||||||||
| 920,000 | San Gorgonio, CA Memorial Health Care District | 5.000 | 08/01/2024 | 08/01/2020 | A | 1,032,452 | ||||||||||||||
| 505,000 | San Jose, CA (Evergreen Community College District)1 | 5.000 | 09/01/2025 | 09/01/2015 | A | 507,055 | ||||||||||||||
| 15,000 | San Jose, CA (Libraries & Parks) | 5.000 | 09/01/2017 | 09/01/2015 | A | 15,061 | ||||||||||||||
| 35,000 | San Jose, CA (Libraries & Parks) | 5.000 | 09/01/2015 | 08/31/2015 | A | 35,145 | ||||||||||||||
| 105,000 | San Jose, CA (Libraries & Parks) | 5.100 | 09/01/2025 | 09/01/2015 | A | 105,433 | ||||||||||||||
| 235,000 | San Jose, CA (Libraries & Parks) | 5.000 | 09/01/2018 | 09/01/2015 | A | 235,961 | ||||||||||||||
| 85,000 | San Jose, CA (Libraries & Parks) | 5.100 | 09/01/2020 | 09/01/2015 | A | 85,355 | ||||||||||||||
| 50,000 | San Jose, CA (Libraries & Parks) | 5.100 | 09/01/2022 | 09/01/2015 | A | 50,208 | ||||||||||||||
| 30,000 | San Jose, CA (Libraries, Parks & Public Safety)1 | 5.000 | 09/01/2017 | 09/01/2015 | A | 30,055 | ||||||||||||||
| 50,000 | San Jose, CA (Libraries, Parks & Public Safety)1 | 5.000 | 09/01/2020 | 09/01/2015 | A | 50,091 | ||||||||||||||
| 105,000 | San Jose, CA (Libraries, Parks & Public Safety)1 | 5.000 | 09/01/2022 | 09/01/2015 | A | 105,191 | ||||||||||||||
| 15,000 | San Jose, CA (Libraries, Parks & Public Safety)1 | 5.000 | 09/01/2030 | 09/01/2015 | A | 15,060 | ||||||||||||||
| 1,000,000 | San Jose, CA Airport1 | 6.250 | 03/01/2034 | 03/01/2021 | A | 1,177,070 | ||||||||||||||
| 25,000 | San Jose, CA Finance Authority (4th & San Fernando Parking Facility) | 5.000 | 09/01/2026 | 09/01/2015 | A | 25,095 | ||||||||||||||
| 15,000 | San Jose, CA Finance Authority (4th & San Fernando Parking Facility) | 5.000 | 09/01/2024 | 09/01/2015 | A | 15,057 | ||||||||||||||
| 225,000 | San Jose, CA Finance Authority (Convention Center) | 5.000 | 09/01/2016 | 09/01/2015 | A | 225,923 | ||||||||||||||
| 50,000 | San Jose, CA Finance Authority (Convention Center) | 5.000 | 09/01/2018 | 09/01/2015 | A | 50,205 | ||||||||||||||
| 90,000 | San Jose, CA Finance Authority (Convention Center) | 5.000 | 09/01/2017 | 09/01/2015 | A | 90,369 | ||||||||||||||
44 OPPENHEIMER ROCHESTER LIMITED TERM CALIFORNIA MUNICIPAL FUND
Principal Amount | Coupon | Maturity | Effective Maturity* | Value | ||||||||||||||||
| California (Continued) | |||||||||||||||||||
| $280,000 | San Jose, CA Finance Authority (Convention Center) | 5.000 | % | 09/01/2019 | 09/01/2015 | A | $ | 281,145 | ||||||||||||
| 60,000 | San Jose, CA Finance Authority (Convention Center)1 | 5.000 | 09/01/2015 | 08/31/2015 | A | 60,059 | ||||||||||||||
| 60,000 | San Jose, CA Improvement Bond Act 1915 | 5.750 | 09/02/2020 | 09/02/2015 | A | 61,919 | ||||||||||||||
| 95,000 | San Jose, CA Improvement Bond Act 1915 | 5.750 | 09/02/2019 | 09/02/2015 | A | 98,060 | ||||||||||||||
| 20,000 | San Jose, CA Improvement Bond Act 1915 | 5.600 | 09/02/2016 | 09/02/2015 | A | 20,660 | ||||||||||||||
| 25,000 | San Jose, CA Improvement Bond Act 1915 | 5.700 | 09/02/2018 | 09/02/2015 | A | 25,810 | ||||||||||||||
| 245,000 | San Jose, CA Multifamily Hsg. (Almaden Senior Hsg. Partners)1 | 5.350 | 5 | 07/15/2034 | 05/12/2017 | A | 254,851 | |||||||||||||
| 25,000 | San Jose, CA Multifamily Hsg. (El Parador Apartments)1 | 6.100 | 01/01/2031 | 08/31/2015 | A | 25,018 | ||||||||||||||
| 380,000 | San Jose, CA Multifamily Hsg. (Sixth & Martha Family Apartments)1 | 5.875 | 03/01/2033 | 09/01/2015 | A | 382,371 | ||||||||||||||
| 355,000 | San Jose, CA Redevel. Agency1 | 5.000 | 08/01/2017 | 08/31/2015 | A | 356,413 | ||||||||||||||
| 25,000 | San Jose, CA Redevel. Agency1 | 5.000 | 08/01/2023 | 08/01/2017 | A | 26,794 | ||||||||||||||
| 1,570,000 | San Jose, CA Redevel. Agency1 | 5.000 | 08/01/2019 | 08/31/2015 | A | 1,597,318 | ||||||||||||||
| 65,000 | San Jose, CA Redevel. Agency1 | 5.000 | 08/01/2020 | 08/31/2015 | A | 65,252 | ||||||||||||||
| 45,000 | San Jose, CA Redevel. Agency1 | 5.000 | 08/01/2028 | 08/31/2015 | A | 45,170 | ||||||||||||||
| 35,000 | San Jose, CA Redevel. Agency | 5.500 | 08/01/2016 | 08/31/2015 | A | 35,154 | ||||||||||||||
| 35,000 | San Jose, CA Redevel. Agency1,3 | 5.750 | 08/01/2017 | 08/22/2015 | A | 35,120 | ||||||||||||||
| 5,300,000 | San Jose, CA Redevel. Agency | 5.850 | 08/01/2027 | 08/31/2015 | A | 5,322,313 | ||||||||||||||
| 75,000 | San Jose, CA Redevel. Agency1 | 5.000 | 08/01/2026 | 08/01/2017 | A | 80,197 | ||||||||||||||
| 200,000 | San Jose, CA Redevel. Agency1 | 6.375 | 08/01/2021 | 08/01/2018 | A | 222,716 | ||||||||||||||
| 1,210,000 | San Jose, CA Redevel. Agency (Merged Area Redevel.) | 5.250 | 08/01/2019 | 08/31/2015 | A | 1,215,009 | ||||||||||||||
| 20,000 | San Jose, CA Redevel. Agency (Merged Area Redevel.) | 4.000 | 08/01/2017 | 08/31/2015 | A | 20,059 | ||||||||||||||
| 25,000 | San Jose, CA Redevel. Agency (Merged Area Redevel.) | 5.000 | 08/01/2019 | 08/31/2015 | A | 25,098 | ||||||||||||||
| 115,000 | San Jose, CA Redevel. Agency (Merged Area Redevel.)1 | 5.000 | 08/01/2027 | 08/31/2015 | A | 116,889 | ||||||||||||||
| 30,000 | San Jose, CA Redevel. Agency (Merged Area Redevel.)1 | 5.000 | 08/01/2025 | 08/01/2017 | A | 32,153 | ||||||||||||||
| 255,000 | San Jose, CA Redevel. Agency (Merged Area Redevel.)1 | 5.000 | 08/01/2022 | 08/01/2017 | A | 272,669 | ||||||||||||||
| 100,000 | San Jose, CA Redevel. Agency (Merged Area Redevel.)1 | 5.000 | 08/01/2024 | 08/01/2017 | A | 107,422 | ||||||||||||||
| 500,000 | San Jose, CA Redevel. Agency (Merged Area Redevel.)1 | 5.000 | 08/01/2026 | 08/01/2016 | A | 517,645 | ||||||||||||||
| 210,000 | San Jose, CA Redevel. Agency (Merged Area Redevel.)1 | 5.000 | 08/01/2023 | 08/01/2017 | A | 224,034 | ||||||||||||||
| 5,000 | San Jose, CA Redevel. Agency Tax Allocation | 5.600 | 08/01/2019 | 08/31/2015 | A | 5,022 | ||||||||||||||
| 160,000 | San Mateo, CA Flood Control District COP (Colma Creek Flood Control Zone)1 | 5.125 | 08/01/2032 | 09/04/2015 | A | 160,726 | ||||||||||||||
| 100,000 | Santa Ana, CA Community Redevel. Agency (South Main Street) | 5.000 | 09/01/2015 | 08/31/2015 | A | 100,388 | ||||||||||||||
| 50,000 | Santa Ana, CA Community Redevel. Agency (South Main Street)1 | 5.000 | 09/01/2017 | 09/01/2015 | A | 50,158 | ||||||||||||||
| 105,000 | Santa Barbara, CA Redevel. Agency (Central City) | 5.000 | 03/01/2018 | 09/01/2015 | A | 105,421 | ||||||||||||||
| 60,000 | Santa Barbara, CA Redevel. Agency (Central City) | 5.000 | 03/01/2019 | 09/01/2015 | A | 60,239 | ||||||||||||||
45 OPPENHEIMER ROCHESTER LIMITED TERM CALIFORNIA MUNICIPAL FUND
STATEMENT OF INVESTMENTS Continued
Principal Amount | Coupon | Maturity | Effective Maturity* | Value | ||||||||||||||||
| California (Continued) | |||||||||||||||||||
| $25,000 | Santa Clara County, CA Board of Education1 | 5.000 | % | 04/01/2021 | 08/31/2015 | A | $ | 25,044 | ||||||||||||
| 15,000 | Santa Clara County, CA Hsg. Authority (John Burns Gardens Apartments)1 | 5.700 | 08/01/2021 | 08/31/2015 | A | 15,281 | ||||||||||||||
| 1,715,000 | Santa Clara County, CA Hsg. Authority (John Burns Gardens Apartments)1 | 5.850 | 08/01/2031 | 08/31/2015 | A | 1,716,235 | ||||||||||||||
| 80,000 | Santa Clara County, CA Hsg. Authority (Rivertown Apartments)1 | 5.700 | 08/01/2021 | 08/31/2015 | A | 80,111 | ||||||||||||||
| 400,000 | Santa Clara, CA Redevel. Agency (Bayshore North)1 | 5.000 | 06/01/2020 | 12/01/2015 | A | 406,188 | ||||||||||||||
| 25,000 | Santa Clara, CA Redevel. Agency (Bayshore North)1 | 5.375 | 06/01/2016 | 12/01/2015 | A | 25,423 | ||||||||||||||
| 500,000 | Santa Clara, CA Redevel. Agency (Bayshore North)1 | 5.000 | 06/01/2022 | 12/01/2015 | A | 507,830 | ||||||||||||||
| 185,000 | Santa Clara, CA Redevel. Agency (Bayshore North)1 | 5.500 | 06/01/2023 | 12/01/2015 | A | 188,206 | ||||||||||||||
| 1,020,000 | Santa Clara, CA Redevel. Agency Tax Allocation (Bayshore North)1 | 5.250 | 06/01/2019 | 12/01/2015 | A | 1,036,820 | ||||||||||||||
| 100,000 | Santa Clara, CA Redevel. Agency Tax Allocation (Bayshore North)1 | 5.250 | 06/01/2018 | 12/01/2015 | A | 101,649 | ||||||||||||||
| 785,000 | Santa Clarita, CA Community Facilities District (Valencia Town Center) | 5.000 | 11/15/2027 | 11/15/2022 | A | 862,252 | ||||||||||||||
| 1,170,000 | Santa Clarita, CA Community Facilities District (Valencia Town Center) | 5.000 | 11/15/2028 | 11/15/2022 | A | 1,278,050 | ||||||||||||||
| 325,000 | Santa Clarita, CA Community Facilities District (Valencia Town Center) | 5.000 | 11/15/2024 | 11/15/2022 | A | 362,749 | ||||||||||||||
| 635,000 | Santa Clarita, CA Community Facilities District (Valencia Town Center) | 5.000 | 11/15/2023 | 11/15/2022 | A | 711,168 | ||||||||||||||
| 925,000 | Santa Clarita, CA Community Facilities District (Valencia Town Center) | 5.000 | 11/15/2025 | 11/15/2022 | A | 1,022,625 | ||||||||||||||
| 40,000 | Santa Fe Springs, CA Community Devel. Commission1 | 5.375 | 09/01/2019 | 09/01/2015 | A | 40,131 | ||||||||||||||
| 85,000 | Santa Fe Springs, CA Community Devel. Commission Tax Allocation1 | 5.375 | 09/01/2018 | 09/01/2015 | A | 85,298 | ||||||||||||||
| 800,000 | Santa Fe Springs, CA Community Devel. Commission Tax Allocation1 | 5.375 | 09/01/2021 | 09/01/2015 | A | 802,224 | ||||||||||||||
| 25,000 | Santa Nella County, CA Water District | 6.250 | 09/02/2028 | 02/22/2023 | B | 24,719 | ||||||||||||||
| 20,000 | Santa Rosa, CA Improvement Bond Act 1915 (Nielson Ranch) | 6.700 | 09/02/2022 | 09/02/2015 | A | 20,049 | ||||||||||||||
| 35,000 | Santa Rosa, CA Redevel. Agency (Southwest Redevel.)1 | 5.000 | 08/01/2025 | 08/31/2015 | A | 35,132 | ||||||||||||||
| 500,000 | Santa Rosa, CA Wastewater1 | 5.250 | 09/01/2026 | 09/01/2016 | A | 536,970 | ||||||||||||||
| 710,000 | Saugus, CA Union School District Community Facilities District No. 2002-1 | 5.000 | 09/01/2025 | 09/01/2023 | A | 790,741 | ||||||||||||||
| 895,000 | Saugus, CA Union School District Community Facilities District No. 2002-1 | 5.000 | 09/01/2028 | 09/01/2023 | A | 984,366 | ||||||||||||||
| 830,000 | Saugus, CA Union School District Community Facilities District No. 2002-1 | 5.000 | 09/01/2027 | 09/01/2023 | A | 915,532 | ||||||||||||||
| 770,000 | Saugus, CA Union School District Community Facilities District No. 2002-1 | 5.000 | 09/01/2026 | 09/01/2023 | A | 853,537 | ||||||||||||||
| 1,390,000 | Selma, CA Redevel. Agency | 5.750 | 09/01/2024 | 09/01/2016 | A | 1,409,891 | ||||||||||||||
| 15,000 | Sequoia, CA Hospital District | 5.375 | 08/15/2023 | 08/30/2015 | A | 16,677 | ||||||||||||||
46 OPPENHEIMER ROCHESTER LIMITED TERM CALIFORNIA MUNICIPAL FUND
Principal Amount | Coupon | Maturity | Effective Maturity* | Value | ||||||||||||||||
| California (Continued) | |||||||||||||||||||
| $100,000 | Shafter, CA Community Devel. Agency Tax Allocation | 5.300 | % | 11/01/2018 | 11/01/2016 | A | $ | 103,282 | ||||||||||||
| 100,000 | Shafter, CA Community Devel. Agency Tax Allocation | 5.375 | 11/01/2020 | 11/01/2016 | A | 102,754 | ||||||||||||||
| 100,000 | Shafter, CA Community Devel. Agency Tax Allocation | 5.350 | 11/01/2019 | 11/01/2016 | A | 103,046 | ||||||||||||||
| 100,000 | Shafter, CA Community Devel. Agency Tax Allocation | 5.250 | 11/01/2017 | 11/01/2016 | A | 103,526 | ||||||||||||||
| 80,000 | Shasta Lake, CA Public Finance Authority1 | 5.000 | 04/01/2025 | 10/01/2015 | A | 80,606 | ||||||||||||||
| 15,000 | Sierra Kings, CA Health Care District1 | 5.000 | 08/01/2029 | 08/31/2015 | A | 15,022 | ||||||||||||||
| 400,000 | Sierra View, CA Local Health Care District1 | 5.250 | 07/01/2024 | 07/01/2017 | A | 421,916 | ||||||||||||||
| 40,000 | Signal Hill CA Redevel. Agency1 | 5.250 | 10/01/2024 | 10/01/2019 | A | 44,754 | ||||||||||||||
| 525,000 | Simi Valley, CA Community Devel. Agency (Tapo Canyon & West End)1 | 5.250 | 09/01/2019 | 09/01/2015 | A | 526,580 | ||||||||||||||
| 25,000 | Simi Valley, CA Community Devel. Agency (Tapo Canyon & West End) | 5.250 | 09/01/2021 | 09/01/2015 | A | 25,100 | ||||||||||||||
| 25,000 | Simi Valley, CA Community Devel. Agency (Tapo Canyon & West End)1 | 5.000 | 09/01/2030 | 09/01/2015 | A | 25,035 | ||||||||||||||
| 165,000 | Soledad, CA Redevel. Agency (Soledad Redevel.)1 | 5.350 | 12/01/2028 | 08/31/2015 | A | 165,150 | ||||||||||||||
| 1,020,000 | Sonora, CA Union High School District | 5.625 | 08/01/2029 | 08/01/2023 | A | 1,211,974 | ||||||||||||||
| 1,925,000 | South Gate, CA Utility Authority | 5.250 | 10/01/2027 | 10/01/2022 | A | 2,211,402 | ||||||||||||||
| 50,000 | South Orange County, CA Public Financing Authority | 5.250 | 08/15/2015 | 08/15/2015 | 50,101 | |||||||||||||||
| 30,000 | South Orange County, CA Public Financing Authority3 | 5.250 | 08/15/2018 | 08/26/2015 | A | 30,124 | ||||||||||||||
| 40,000 | South Orange County, CA Public Financing Authority1 | 5.800 | 09/02/2018 | 09/02/2015 | A | 40,192 | ||||||||||||||
| 250,000 | South Orange County, CA Public Financing Authority (Ladera Ranch)1 | 5.000 | 08/15/2024 | 08/31/2015 | A | 250,855 | ||||||||||||||
| 260,000 | Southern CA Mono Health Care District1 | 5.000 | 08/01/2021 | 08/01/2021 | 292,487 | |||||||||||||||
| 300,000 | Southern CA Public Power Authority1 | 6.000 | 07/01/2025 | 07/01/2018 | A | 344,742 | ||||||||||||||
| 5,000 | Southern CA Public Power Authority | 5.500 | 07/01/2020 | 08/31/2015 | A | 5,022 | ||||||||||||||
| 925,000 | Southern CA Public Power Authority1 | 5.000 | 11/01/2018 | 11/01/2018 | 1,022,023 | |||||||||||||||
| 50,000 | Southern CA Public Power Authority | 5.250 | 10/01/2015 | 08/31/2015 | A | 50,216 | ||||||||||||||
| 25,000 | Southern CA Public Power Authority | 5.500 | 07/01/2020 | 08/31/2015 | A | 25,111 | ||||||||||||||
| 20,000 | Southern CA Public Power Authority | 5.750 | 07/01/2021 | 08/31/2015 | A | 20,093 | ||||||||||||||
| 4,050,000 | Southern CA Tobacco Securitization Authority1 | 4.750 | 06/01/2025 | 04/25/2020 | B | 4,038,093 | ||||||||||||||
| 65,000 | Stockton, CA Improvement Bond Act 1915 | 5.800 | 09/02/2020 | 09/02/2015 | A | 65,140 | ||||||||||||||
| 25,000 | Stockton, CA Public Financing Authority (Parking & Capital Projects)1 | 5.375 | 09/01/2021 | 09/01/2021 | 24,782 | |||||||||||||||
| 250,000 | Stockton, CA Unified School District (Election 2005)1 | 5.000 | 09/01/2019 | 09/01/2015 | A | 250,945 | ||||||||||||||
| 50,000 | Stockton, CA Unified School District (Election 2008)1 | 5.000 | 08/01/2023 | 08/01/2016 | A | 52,932 | ||||||||||||||
| 25,000 | Stockton-East, CA Water District1 | 5.000 | 04/01/2019 | 08/31/2015 | A | 25,055 | ||||||||||||||
| 20,000 | Sunnyvale, CA COP (Parking Facility) | 5.000 | 10/01/2017 | 08/31/2015 | A | 20,082 | ||||||||||||||
| 25,000 | Sunnyvale, CA COP (Parking Facility) | 5.000 | 10/01/2022 | 08/31/2015 | A | 25,102 | ||||||||||||||
| 1,490,000 | Sutter Butte, CA Flood Agency Assessment | 5.000 | 10/01/2029 | 10/01/2023 | A | 1,703,204 | ||||||||||||||
| 700,000 | Sutter Butte, CA Flood Agency Assessment | 5.000 | 10/01/2027 | 10/01/2023 | A | 807,975 | ||||||||||||||
| 300,000 | Sutter Butte, CA Flood Agency Assessment | 5.000 | 10/01/2025 | 10/01/2023 | A | 353,022 | ||||||||||||||
47 OPPENHEIMER ROCHESTER LIMITED TERM CALIFORNIA MUNICIPAL FUND
STATEMENT OF INVESTMENTS Continued
Principal Amount | Coupon | Maturity | Effective Maturity* | Value | ||||||||||||||||
| California (Continued) | |||||||||||||||||||
| $415,000 | Sutter Butte, CA Flood Agency Assessment | 5.000 | % | 10/01/2026 | 10/01/2023 | A | $ | 482,541 | ||||||||||||
| 1,465,000 | Sutter Butte, CA Flood Agency Assessment | 5.000 | 10/01/2028 | 10/01/2023 | A | 1,680,619 | ||||||||||||||
| 4,550,000 | Sweetwater, CA Union High School District1 | 5.000 | 09/01/2027 | 09/01/2015 | A | 4,567,199 | ||||||||||||||
| 135,000 | Sweetwater, CA Union High School District1 | 5.000 | 09/01/2029 | 09/01/2015 | A | 135,425 | ||||||||||||||
| 35,000 | Taft, CA Public Financing Authority (Community Correctional Facility) | 6.050 | 01/01/2017 | 08/31/2015 | A | 35,135 | ||||||||||||||
| 825,000 | Tejon Ranch, CA Public Facilities Finance Authority Special Tax | 5.250 | 09/01/2028 | 09/01/2022 | A | 878,262 | ||||||||||||||
| 500,000 | Temecula, CA Redevel. Agency | 5.125 | 08/01/2027 | 08/31/2015 | A | 503,920 | ||||||||||||||
| 50,000 | Temecula, CA Redevel. Agency1 | 5.000 | 08/01/2020 | 08/31/2015 | A | 50,085 | ||||||||||||||
| 2,020,000 | Torrance, CA Hospital (Torrance Memorial Medical Center)1 | 6.000 | 06/01/2022 | 08/31/2015 | A | 2,054,421 | ||||||||||||||
| 100,000 | Torrance, CA Hospital (Torrance Memorial Medical Center)1 | 5.500 | 06/01/2031 | 08/31/2015 | A | 101,863 | ||||||||||||||
| 270,000 | Torrance, CA Redevel. Agency1 | 5.500 | 09/01/2028 | 09/01/2015 | A | 270,300 | ||||||||||||||
| 10,000 | Torrance, CA Redevel. Agency (Downtown Redevel.)1 | 5.550 | 09/01/2018 | 09/01/2015 | A | 10,028 | ||||||||||||||
| 50,000 | Tracy, CA Community Facilities District | 6.300 | 09/01/2026 | 09/01/2015 | A | 50,099 | ||||||||||||||
| 25,000 | Tracy, CA Community Facilities District (205 Parcel Glen) | 6.250 | 09/01/2032 | 08/31/2015 | A | 25,041 | ||||||||||||||
| 30,000 | Truckee-Donner, CA Public Utility District Special Tax | 5.800 | 09/01/2035 | 09/01/2015 | A | 30,005 | ||||||||||||||
| 2,550,000 | Tulare, CA Public Financing Authority1 | 5.250 | 04/01/2027 | 04/01/2018 | A | 2,827,032 | ||||||||||||||
| 805,000 | Turlock, CA Health Facility (Emanuel Medical Center) COP | 5.000 | 10/15/2017 | 10/27/2016 | B | 845,274 | ||||||||||||||
| 30,000 | Turlock, CA Public Financing Authority | 5.250 | 09/01/2015 | 08/31/2015 | A | 30,108 | ||||||||||||||
| 515,000 | Tustin, CA Community Facilities District Special Tax (Legacy/John Laing Homes) | 5.000 | 09/01/2028 | 09/01/2023 | A | 578,726 | ||||||||||||||
| 420,000 | Tustin, CA Community Facilities District Special Tax (Legacy/John Laing Homes) | 5.000 | 09/01/2024 | 09/01/2023 | A | 488,393 | ||||||||||||||
| 445,000 | Tustin, CA Community Facilities District Special Tax (Legacy/John Laing Homes) | 5.000 | 09/01/2025 | 09/01/2023 | A | 510,860 | ||||||||||||||
| 470,000 | Tustin, CA Community Facilities District Special Tax (Legacy/John Laing Homes) | 5.000 | 09/01/2026 | 09/01/2023 | A | 536,049 | ||||||||||||||
| 490,000 | Tustin, CA Community Facilities District Special Tax (Legacy/John Laing Homes) | 5.000 | 09/01/2027 | 09/01/2023 | A | 555,601 | ||||||||||||||
| 130,000 | Tustin, CA Unified School District1 | 5.000 | 09/01/2032 | 09/01/2015 | A | 130,529 | ||||||||||||||
| 125,000 | Twentynine Palms, CA Redevel. Agency Tax Allocation (Four Corners)1 | 7.125 | 09/01/2026 | 09/01/2021 | A | 157,809 | ||||||||||||||
| 250,000 | Ukiah, CA Redevel. Agency (Ukiah Redevel.)1 | 6.500 | 12/01/2028 | 06/01/2021 | A | 302,760 | ||||||||||||||
| 25,000 | Union City, CA Community Redevel. Agency1 | 5.000 | 10/01/2027 | 08/31/2015 | A | 25,018 | ||||||||||||||
| 750,000 | University of California (Regents Medical Center)1 | 5.000 | 05/15/2026 | 05/15/2016 | A | 784,028 | ||||||||||||||
| 20,000 | Vacaville, CA Improvement Bond Act 1915 (East Monte Vista Avenue) | 5.850 | 09/02/2016 | 09/02/2015 | A | 20,057 | ||||||||||||||
| 245,000 | Vacaville, CA Redevel. Agency (Vacaville Community Hsg.)1 | 6.000 | 11/01/2024 | 08/31/2015 | A | 245,451 | ||||||||||||||
| 100,000 | Vallejo City, CA Unified School District | 5.000 | 08/01/2027 | 08/31/2015 | A | 100,324 | ||||||||||||||
| 325,000 | Vallejo City, CA Unified School District Special Tax Community Facilities District No. 2 | 5.000 | 09/01/2019 | 09/01/2015 | A | 326,112 | ||||||||||||||
48 OPPENHEIMER ROCHESTER LIMITED TERM CALIFORNIA MUNICIPAL FUND
Principal Amount | Coupon | Maturity | Effective Maturity* | Value | ||||||||||||||||
| California (Continued) | |||||||||||||||||||
| $175,000 | Vallejo City, CA Unified School District Special Tax Community Facilities District No. 2 | 5.000 | % | 09/01/2026 | 09/01/2015 | A | $ | 175,599 | ||||||||||||
| 25,000 | Vallejo, CA Public Financing Authority, Series A | 7.500 | 09/01/2020 | 09/01/2015 | A | 25,075 | ||||||||||||||
| 40,000 | Vallejo, CA Quadrant Improvement District No. 001 | 6.000 | 09/01/2017 | 09/01/2015 | A | 40,096 | ||||||||||||||
| 40,000 | Vallejo, CA Quadrant Improvement District No. 001 | 6.125 | 09/01/2034 | 09/01/2015 | A | 40,038 | ||||||||||||||
| 30,000 | Vallejo, CA Quadrant Improvement District No. 001 | 6.000 | 09/01/2026 | 09/01/2015 | A | 30,029 | ||||||||||||||
| 270,000 | Ventura County, CA Area Hsg. Authority (Mira Vista Senior Apartments) | 5.050 | 12/01/2026 | 12/01/2016 | A | 272,117 | ||||||||||||||
| 165,000 | Vernon, CA Electric System | 5.125 | 08/01/2021 | 08/30/2018 | C | 191,187 | ||||||||||||||
| 370,000 | Vernon, CA Electric System1 | 5.125 | 08/01/2021 | 09/06/2018 | A | 408,140 | ||||||||||||||
| 25,000 | Victorville, CA Redevel. Agency (Bear Valley Road)1 | 5.125 | 12/01/2031 | 08/31/2015 | A | 25,036 | ||||||||||||||
| 135,000 | Vista, CA Joint Powers Financing Authority1 | 6.100 | 10/01/2021 | 10/01/2015 | A | 136,268 | ||||||||||||||
| 10,000 | Vista, CA Unified School District1 | 5.125 | 05/01/2023 | 11/01/2015 | A | 10,117 | ||||||||||||||
| 10,000 | Wasco, CA Public Financing Authority | 7.500 | 09/15/2023 | 08/31/2015 | A | 10,028 | ||||||||||||||
| 15,000 | Wasco, CA Public Financing Authority | 7.350 | 09/15/2015 | 08/31/2015 | A | 15,067 | ||||||||||||||
| 770,000 | Washington Township, CA Health Care District1 | 5.000 | 07/01/2018 | 08/31/2015 | A | 772,926 | ||||||||||||||
| 800,000 | Washington Township, CA Health Care District1 | 5.250 | 07/01/2029 | 08/31/2015 | A | 802,136 | ||||||||||||||
| 3,420,000 | West Contra Costa, CA Healthcare District COP | 5.500 | 07/01/2029 | 08/31/2015 | A | 3,428,003 | ||||||||||||||
| 180,000 | West Covina, CA Redevel. Agency1 | 5.000 | 09/01/2026 | 09/01/2015 | A | 180,151 | ||||||||||||||
| 150,000 | West Covina, CA Redevel. Agency1 | 5.100 | 09/01/2025 | 09/01/2015 | A | 150,581 | ||||||||||||||
| 25,000 | West Covina, CA Redevel. Agency1 | 5.000 | 09/01/2031 | 09/01/2015 | A | 25,013 | ||||||||||||||
| 60,000 | West Covina, CA Redevel. Agency (Executive Lodge Apartments)1 | 5.300 | 09/01/2025 | 09/01/2015 | A | 60,054 | ||||||||||||||
| 1,000,000 | West Hollywood, CA Community Devel. Commission Tax Allocation (East Side Redevel.)1 | 7.250 | 09/01/2031 | 09/01/2021 | A | 1,253,220 | ||||||||||||||
| 875,000 | West Hollywood, CA Community Devel. Commission Tax Allocation (East Side Redevel.)1 | 7.000 | 09/01/2026 | 09/01/2021 | A | 1,085,849 | ||||||||||||||
| 135,000 | West Valley-Mission, CA Community College District1 | 5.000 | 08/01/2022 | 08/01/2016 | A | 141,404 | ||||||||||||||
| 2,335,000 | Western Riverside County, CA Trust & Wastewater Finance Authority | 5.000 | 09/01/2025 | 09/01/2023 | A | 2,671,544 | ||||||||||||||
| 1,295,000 | Western Riverside County, CA Trust & Wastewater Finance Authority | 5.000 | 09/01/2027 | 09/01/2018 | A | 1,346,528 | ||||||||||||||
| 1,190,000 | Western Riverside County, CA Trust & Wastewater Finance Authority | 5.000 | 09/01/2025 | 09/01/2018 | A | 1,245,966 | ||||||||||||||
| 835,000 | William S. Hart CA Union High School District | 5.000 | 09/01/2025 | 09/01/2023 | A | 904,146 | ||||||||||||||
| 260,000 | Yorba Linda, CA Redevel. Agency Tax Allocation1 | 5.250 | 09/01/2023 | 09/01/2015 | A | 260,385 | ||||||||||||||
| 200,000 | Yuba County, CA COP1 | 5.000 | 02/01/2029 | 08/01/2020 | A | 224,916 | ||||||||||||||
| 165,000 | Yuba County, CA COP1 | 5.000 | 02/01/2025 | 08/01/2020 | A | 186,282 | ||||||||||||||
| 170,000 | Yuba County, CA COP1 | 5.000 | 02/01/2026 | 08/01/2020 | A | 190,801 | ||||||||||||||
| 155,000 | Yuba County, CA COP1 | 5.000 | 02/01/2024 | 08/01/2020 | A | 174,992 | ||||||||||||||
| 190,000 | Yuba County, CA COP1 | 5.000 | 02/01/2028 | 08/01/2020 | A | 212,219 | ||||||||||||||
| 180,000 | Yuba County, CA COP1 | 5.000 | 02/01/2027 | 08/01/2020 | A | 201,049 | ||||||||||||||
| 523,085,638 | ||||||||||||||||||||
49 OPPENHEIMER ROCHESTER LIMITED TERM CALIFORNIA MUNICIPAL FUND
STATEMENT OF INVESTMENTS Continued
Principal Amount | Coupon | Maturity | Effective Maturity* | Value | ||||||||||||||||
| U.S. Possessions—16.3% | |||||||||||||||||||
| $1,250,000 | Guam International Airport Authority | 6.000 | % | 10/01/2023 | 08/01/2018 | A | $ | 1,394,462 | ||||||||||||
| 155,000 | Guam Power Authority, Series A | 5.000 | 10/01/2022 | 10/01/2022 | 183,091 | |||||||||||||||
| 150,000 | Guam Power Authority, Series A | 5.000 | 10/01/2021 | 10/01/2021 | 175,648 | |||||||||||||||
| 265,000 | Guam Power Authority, Series A | 5.000 | 10/01/2025 | 10/01/2022 | A | 311,778 | ||||||||||||||
| 155,000 | Guam Power Authority, Series A | 5.000 | 10/01/2027 | 10/01/2022 | A | 180,358 | ||||||||||||||
| 225,000 | Guam Power Authority, Series A | 5.000 | 10/01/2026 | 10/01/2022 | A | 263,745 | ||||||||||||||
| 100,000 | Guam Power Authority, Series A | 5.000 | 10/01/2019 | 10/01/2019 | 114,584 | |||||||||||||||
| 150,000 | Guam Power Authority, Series A | 5.000 | 10/01/2020 | 10/01/2020 | 174,300 | |||||||||||||||
| 2,500,000 | Puerto Rico Aqueduct & Sewer Authority | 6.125 | 2 | 07/01/2024 | 04/23/2021 | B | 1,873,700 | |||||||||||||
| 7,320,000 | Puerto Rico Children’s Trust Fund (TASC)1 | 5.500 | 05/15/2039 | 11/15/2015 | A | 7,319,488 | ||||||||||||||
| 21,679,000 | Puerto Rico Children’s Trust Fund (TASC)1 | 5.375 | 05/15/2033 | 08/31/2015 | A | 21,707,183 | ||||||||||||||
| 560,000 | Puerto Rico Commonwealth GO | 5.625 | 07/01/2031 | 02/04/2031 | B | 357,095 | ||||||||||||||
| 370,000 | Puerto Rico Commonwealth GO1 | 6.000 | 07/01/2027 | 07/01/2018 | A | 371,066 | ||||||||||||||
| 2,000,000 | Puerto Rico Commonwealth GO | 5.000 | 07/01/2020 | 07/01/2020 | 1,322,080 | |||||||||||||||
| 75,000 | Puerto Rico Commonwealth GO1 | 6.125 | 2 | 07/01/2024 | 04/23/2021 | B | 73,669 | |||||||||||||
| 100,000 | Puerto Rico Commonwealth GO | 5.375 | 07/01/2030 | 07/01/2030 | 63,396 | |||||||||||||||
| 2,000,000 | Puerto Rico Commonwealth GO | 6.000 | 07/01/2029 | 07/01/2029 | 1,295,120 | |||||||||||||||
| 1,270,000 | Puerto Rico Commonwealth GO | 5.500 | 07/01/2020 | 07/01/2020 | 1,266,215 | |||||||||||||||
| 205,000 | Puerto Rico Commonwealth GO | 5.500 | 07/01/2017 | 07/01/2017 | 174,363 | |||||||||||||||
| 170,000 | Puerto Rico Commonwealth GO1 | 5.500 | 07/01/2018 | 07/01/2018 | 170,127 | |||||||||||||||
| 70,000 | Puerto Rico Commonwealth GO1 | 5.500 | 07/01/2016 | 07/01/2016 | 70,234 | |||||||||||||||
| 1,145,000 | Puerto Rico Commonwealth GO | 5.250 | 07/01/2030 | 05/09/2029 | B | 724,373 | ||||||||||||||
| 200,000 | Puerto Rico Commonwealth GO | 5.000 | 07/01/2022 | 07/01/2022 | 129,222 | |||||||||||||||
| 3,000,000 | Puerto Rico Electric Power Authority, Series AAA7 | 5.250 | 07/01/2028 | 07/01/2028 | 1,740,450 | |||||||||||||||
| 260,000 | Puerto Rico Electric Power Authority, Series B7 | 5.000 | 07/01/2016 | 07/01/2016 | 153,299 | |||||||||||||||
| 500,000 | Puerto Rico Electric Power Authority, Series CCC7 | 5.250 | 07/01/2028 | 07/01/2028 | 290,075 | |||||||||||||||
| 555,000 | Puerto Rico Electric Power Authority, Series KK | 5.500 | 07/01/2016 | 07/01/2016 | 549,805 | |||||||||||||||
| 175,000 | Puerto Rico Electric Power Authority, Series PP | 5.000 | 07/01/2022 | 07/01/2022 | 166,274 | |||||||||||||||
| 300,000 | Puerto Rico Electric Power Authority, Series PP | 5.000 | 07/01/2025 | 07/01/2025 | 282,357 | |||||||||||||||
| 3,460,000 | Puerto Rico Electric Power Authority, Series RR | 5.000 | 07/01/2023 | 07/01/2023 | 3,280,634 | |||||||||||||||
| 230,000 | Puerto Rico Electric Power Authority, Series RR | 5.000 | 07/01/2024 | 07/01/2024 | 218,208 | |||||||||||||||
| 25,000 | Puerto Rico Electric Power Authority, Series SS | 5.000 | 07/01/2025 | 07/01/2025 | 23,530 | |||||||||||||||
| 455,000 | Puerto Rico Electric Power Authority, Series UU | 5.000 | 07/01/2024 | 07/01/2024 | 451,237 | |||||||||||||||
| 2,015,000 | Puerto Rico Electric Power Authority, Series WW7 | 5.500 | 07/01/2018 | 07/01/2018 | 1,176,014 | |||||||||||||||
| 9,000,000 | Puerto Rico Electric Power Authority, Series ZZ7 | 5.250 | 07/01/2026 | 07/01/2026 | 5,224,950 | |||||||||||||||
| 40,000 | Puerto Rico Electric Power Authority, Series ZZ7 | 5.000 | 07/01/2018 | 07/01/2018 | 23,346 | |||||||||||||||
| 990,000 | Puerto Rico Electric Power Authority, Series ZZ7 | 5.000 | 07/01/2017 | 07/01/2017 | 579,229 | |||||||||||||||
| 150,000 | Puerto Rico Government Devel. Bank | 5.000 | 12/01/2016 | 12/01/2016 | 63,228 | |||||||||||||||
| 15,000 | Puerto Rico HFA1 | 5.500 | 12/01/2019 | 12/01/2018 | A | 16,417 | ||||||||||||||
| 215,000 | Puerto Rico Highway & Transportation Authority | 5.250 | 07/01/2018 | 07/01/2018 | 137,209 | |||||||||||||||
| 750,000 | Puerto Rico Highway & Transportation Authority | 5.750 | 07/01/2020 | 07/01/2020 | 468,907 | |||||||||||||||
50 OPPENHEIMER ROCHESTER LIMITED TERM CALIFORNIA MUNICIPAL FUND
Principal Amount | Coupon | Maturity | Effective Maturity* | Value | ||||||||||||||||
| U.S. Possessions (Continued) | |||||||||||||||||||
| $1,000,000 | Puerto Rico Highway & Transportation Authority | 5.250 | % | 07/01/2022 | 07/01/2022 | $ | 613,310 | |||||||||||||
| 195,000 | Puerto Rico Highway & Transportation Authority, Series E1 | 5.500 | 07/01/2016 | 07/01/2016 | 196,071 | |||||||||||||||
| 70,000 | Puerto Rico Highway & Transportation Authority, Series G | 5.000 | 07/01/2022 | 07/01/2022 | 42,955 | |||||||||||||||
| 260,000 | Puerto Rico IMEPCF (American Home Products)1 | 5.100 | 12/01/2018 | 08/31/2015 | A | 264,753 | ||||||||||||||
| 130,000 | Puerto Rico Infrastructure Financing Authority | 5.000 | 07/01/2018 | 07/01/2018 | 93,089 | |||||||||||||||
| 1,000,000 | Puerto Rico Infrastructure Financing Authority1 | 5.250 | 12/15/2026 | 12/15/2026 | 479,660 | |||||||||||||||
| 100,000 | Puerto Rico ITEMECF (Ana G. Mendez University) | 5.000 | 04/01/2019 | 04/01/2019 | 95,529 | |||||||||||||||
| 100,000 | Puerto Rico ITEMECF (Ana G. Mendez University) | 5.000 | 04/01/2021 | 04/01/2021 | 93,492 | |||||||||||||||
| 100,000 | Puerto Rico ITEMECF (Ana G. Mendez University) | 5.000 | 04/01/2022 | 04/01/2022 | 91,306 | |||||||||||||||
| 2,365,000 | Puerto Rico ITEMECF (Cogeneration Facilities)1 | 6.625 | 06/01/2026 | 10/17/2024 | B | 2,234,594 | ||||||||||||||
| 50,000 | Puerto Rico ITEMECF (International American University) | 5.000 | 10/01/2021 | 10/01/2021 | 49,072 | |||||||||||||||
| 500,000 | Puerto Rico ITEMECF (University Plaza)1 | 5.625 | 07/01/2019 | 07/01/2019 | 497,050 | |||||||||||||||
| 175,000 | Puerto Rico Municipal Finance Agency, Series A | 5.250 | 08/01/2017 | 08/01/2017 | 174,988 | |||||||||||||||
| 1,180,000 | Puerto Rico Municipal Finance Agency, Series A | 5.250 | 08/01/2016 | 08/31/2015 | A | 1,180,566 | ||||||||||||||
| 600,000 | Puerto Rico Municipal Finance Agency, Series A | 5.250 | 08/01/2018 | 08/01/2018 | 599,952 | |||||||||||||||
| 3,260,000 | Puerto Rico Municipal Finance Agency, Series A | 5.250 | 08/01/2015 | 08/01/2015 | 3,260,000 | |||||||||||||||
| 40,000 | Puerto Rico Municipal Finance Agency, Series A1 | 4.750 | 08/01/2022 | 08/01/2022 | 38,436 | |||||||||||||||
| 90,000 | Puerto Rico Municipal Finance Agency, Series A | 5.500 | 07/01/2017 | 08/31/2015 | A | 90,012 | ||||||||||||||
| 45,000 | Puerto Rico Municipal Finance Agency, Series A | 5.250 | 08/01/2019 | 08/01/2019 | 44,601 | |||||||||||||||
| 830,000 | Puerto Rico Municipal Finance Agency, Series A | 5.250 | 08/01/2020 | 08/01/2020 | 818,654 | |||||||||||||||
| 460,000 | Puerto Rico Public Buildings Authority | 5.500 | 07/01/2018 | 07/01/2018 | 453,652 | |||||||||||||||
| 1,070,000 | Puerto Rico Public Buildings Authority | 6.250 | 07/01/2023 | 07/01/2023 | 683,291 | |||||||||||||||
| 2,735,000 | Puerto Rico Public Buildings Authority1 | 5.250 | 07/01/2019 | 07/01/2019 | 2,718,946 | |||||||||||||||
| 8,305,000 | Puerto Rico Public Buildings Authority | 5.375 | 07/01/2033 | 09/18/2030 | B | 4,744,563 | ||||||||||||||
| 2,710,000 | Puerto Rico Public Buildings Authority | 7.000 | 07/01/2021 | 07/01/2021 | 1,813,315 | |||||||||||||||
| 2,600,000 | Puerto Rico Public Buildings Authority | 7.000 | 07/01/2025 | 04/13/2025 | B | 1,673,126 | ||||||||||||||
| 450,000 | Puerto Rico Public Buildings Authority | 5.500 | 07/01/2017 | 07/01/2017 | 447,318 | |||||||||||||||
| 1,750,000 | Puerto Rico Public Finance Corp., Series B8 | 5.500 | 08/01/2031 | 07/17/2029 | B | 218,750 | ||||||||||||||
| 3,300,000 | Puerto Rico Public Finance Corp., Series B8 | 6.000 | 08/01/2026 | 08/01/2026 | 412,500 | |||||||||||||||
| 1,400,000 | Puerto Rico Public Finance Corp., Series B8 | 6.000 | 08/01/2025 | 08/01/2025 | 175,000 | |||||||||||||||
| 600,000 | Puerto Rico Public Finance Corp., Series B8 | 6.000 | 08/01/2024 | 08/01/2024 | 75,000 | |||||||||||||||
| 70,000 | Puerto Rico Sales Tax Financing Corp., Series A | 5.000 | 08/01/2018 | 08/01/2018 | 34,276 | |||||||||||||||
| 230,000 | Puerto Rico Sales Tax Financing Corp., Series A | 5.375 | 08/01/2039 | 02/21/2039 | B | 93,920 | ||||||||||||||
51 OPPENHEIMER ROCHESTER LIMITED TERM CALIFORNIA MUNICIPAL FUND
STATEMENT OF INVESTMENTS Continued
Principal Amount | Coupon | Maturity | Effective Maturity* | Value | ||||||||||||||||
| U.S. Possessions (Continued) | |||||||||||||||||||
| $5,030,000 | Puerto Rico Sales Tax Financing Corp., Series A | 5.500 | % | 08/01/2037 | 06/26/2037 | B | $ | 2,066,425 | ||||||||||||
| 4,735,000 | Puerto Rico Sales Tax Financing Corp., Series A | 6.125 | 08/01/2029 | 08/01/2029 | 2,052,102 | |||||||||||||||
| 600,000 | Puerto Rico Sales Tax Financing Corp., Series A | 5.500 | 08/01/2028 | 08/01/2028 | 253,362 | |||||||||||||||
| 10,000,000 | Puerto Rico Sales Tax Financing Corp., Series A | 5.375 | 08/01/2020 | 08/01/2020 | 4,408,800 | |||||||||||||||
| 885,000 | Puerto Rico Sales Tax Financing Corp., Series A | 5.500 | 08/01/2023 | 08/01/2023 | 383,957 | |||||||||||||||
| 7,150,000 | Puerto Rico Sales Tax Financing Corp., Series A | 5.500 | 08/01/2022 | 08/01/2022 | 3,122,476 | |||||||||||||||
| 9,850,000 | Puerto Rico Sales Tax Financing Corp., Series A | 5.500 | 08/01/2021 | 08/01/2021 | 4,332,621 | |||||||||||||||
| 1,080,000 | Puerto Rico Sales Tax Financing Corp., Series A | 5.750 | 08/01/2037 | 01/31/2037 | B | 446,375 | ||||||||||||||
| 2,505,000 | Puerto Rico Sales Tax Financing Corp., Series A | 5.000 | 08/01/2024 | 08/01/2024 | 1,054,830 | |||||||||||||||
| 475,000 | Puerto Rico Sales Tax Financing Corp., Series C | 5.375 | 08/01/2038 | 07/12/2038 | B | 194,551 | ||||||||||||||
| 2,575,000 | Puerto Rico Sales Tax Financing Corp., Series C | 6.000 | 08/01/2039 | 08/01/2039 | 1,083,509 | |||||||||||||||
| 1,280,000 | Puerto Rico Sales Tax Financing Corp., Series C | 5.375 | 08/01/2036 | 08/01/2036 | 524,288 | |||||||||||||||
| 315,000 | University of Puerto Rico, Series P | 5.000 | 06/01/2024 | 06/01/2024 | 151,767 | |||||||||||||||
| 495,000 | University of Puerto Rico, Series Q | 5.000 | 06/01/2021 | 06/01/2021 | 241,877 | |||||||||||||||
| 125,000 | V.I. Public Finance Authority (Gross Receipts Taxes Loan Notes)1 | 5.000 | 10/01/2026 | 10/01/2016 | A | 130,024 | ||||||||||||||
| 160,000 | V.I. Public Finance Authority (Gross Receipts Taxes Loan Notes)1 | 5.000 | 10/01/2025 | 10/01/2016 | A | 166,886 | ||||||||||||||
| 300,000 | V.I. Public Finance Authority (Gross Receipts Taxes Loan Notes)1 | 5.000 | 10/01/2023 | 10/01/2016 | A | 313,128 | ||||||||||||||
|
| |||||||||||||||||||
| 99,989,191 | ||||||||||||||||||||
| Total Investments, at Value (Cost $655,383,408)—101.8% | 623,074,829 | ||||||||||||||||||
| Net Other Assets (Liabilities)—(1.8) |
| (10,927,159 | ) | ||||||||||||||||
|
| |||||||||||||||||||
| Net Assets—100.0% |
| $ | 612,147,670 | ||||||||||||||||
|
| |||||||||||||||||||
Footnotes to Statement of Investments
| * | Call Date, Put Date or Average Life of Sinking Fund, if applicable, as detailed. |
A. Optional call date; corresponds to the most conservative yield calculation.
B. Average life due to mandatory, or expected, sinking fund principal payments prior to maturity.
C. Average life due to mandatory, or expected, sinking fund principal payments prior to the applicable optional call date.
1. All or a portion of the security position has been segregated for collateral to cover borrowings. See Note 8 of the accompanying Notes.
2. Denotes a step bond: a zero coupon bond that converts to a fixed or variable interest rate at a designated future date.
3. All or a portion of the security position is when-issued or delayed delivery to be delivered and settled after period end. See Note 4 of the accompanying Notes.
52 OPPENHEIMER ROCHESTER LIMITED TERM CALIFORNIA MUNICIPAL FUND
Footnotes to Statement of Investments (Continued)
4. Zero coupon bond reflects effective yield on the date of purchase.
5. Represents the current interest rate for a variable or increasing rate security.
6. Security represents the underlying municipal bond with respect to an inverse floating rate security held by the Fund. The bond was purchased by the Fund and subsequently transferred to a trust, which issued the related inverse floating rate security. See Note 4 of the accompanying Notes.
7. Subject to a forbearance agreement. Rate shown is the contractual interest rate. See Note 4 of the accompanying Notes.
8. This security is not accruing income because the issuer has missed an interest payment on it and/or is not anticipated to make future interest and or principal payments. The rate shown is the contractual interest rate. See Note 4 of the accompanying Notes.
To simplify the listings of securities, abbreviations are used per the table below:
| ABAG | Association of Bay Area Governments | |
| ASN | Annenberg School of Nursing | |
| BCSC | Brandman Center for Senior Care | |
| BMH | Bakersfield Memorial Hospital | |
| CDA | Communities Devel. Authority | |
| CEI | Coalition for Elders Independence | |
| CFD | Community Facilities District | |
| CHCW | Catholic Healthcare West | |
| CHF | City Hospital Foundation | |
| CHlthSys | Covenant Health System | |
| CMF | CHW Medical Foundation | |
| CmntyHOSB | Community Hospital of San Bernardino | |
| COP | Certificates of Participation | |
| CVHP | Citrus Valley Health Partners | |
| CVMC | Citrus Valley Medical Center | |
| CWM | Chemical Waste Management | |
| DHlth | Dignity Health | |
| EVLAJHA | Eisenberg Village of the Los Angeles Jewish Home for the Aging | |
| FEV | Fountainview at Eisenberg Village | |
| FF | Feedback Foundation | |
| FH | Foothill Hospital | |
| GCCCD | Grossmont-Cuyamaca Community College District | |
| GO | General Obligation | |
| GVLAJHA | Grancell Village of the Los Angeles Jewish Home for the Aging | |
| HFA | Housing Finance Agency | |
| HSH | Hayward Sisters Hospital | |
| IMEPCF | Industrial, Medican and Environmental Pollution Control Facilities | |
| ITEMECF | Industrial, Tourist, Educational, Medical and Environmental Community Facilities | |
| JHAGS | JHA Geriatric Sercives | |
| JHAW | JHA West 16 | |
| LAJHFTA | Los Angeles Jewish Home for the Aging | |
| LLMC | Lifelong Medical Care | |
| MGC | Modesto Garbage Company | |
| MHL | Methodist Horpital Levelland | |
| MHPT | Methodist Hospital Plainview Texas | |
| MHRMC | Mission Hospital Regional Medical Center | |
| MSrH | Mercy Senior Housing | |
| M-S-R | Modesto Irrigation District of the City of Santa Clara and the City of Redding | |
| OCTC | Olive Crest Treatment Centers | |
| PCCD | Palomar Community College District | |
| QVHN | Queen of the Valley Hospital of Napa | |
| RMHF | Redwood Memorial Hospital of Fortuna |
53 OPPENHEIMER ROCHESTER LIMITED TERM CALIFORNIA MUNICIPAL FUND
STATEMENT OF INVESTMENTS Continued
Abbreviations (Continued)
| SAHS | SRM Alliance Hospital Services | |
| SCADP | Southern California Alcohol & Drug Programs | |
| SFMH | St. Francis Memorial Hospital | |
| SJHE | St. Joseph Hospital of Eureka | |
| SJHO | St. Joseph Hospital of Orange | |
| SJHosp | St. Jude Hospital | |
| SJHS | St. Joseph Health System | |
| SNVMMH | Sierra Nevada Memorial-Miners Hospital | |
| SRHF | Saint Rose Hospital Foundation | |
| SRMB | Saint Rose Medical Building | |
| SRMH | SRM Alliance Hospital Services | |
| STTJCCD | Shasta-Tehama-Trinity Joint Community College District | |
| TASC | Tobacco Settlement Asset-Backed Bonds | |
| UCI | University of California Irvine | |
| USAWCA | USA Waste of California | |
| V.I. | United States Virgin Islands | |
| WM | Waste Management | |
| WMC | Waste Management of California | |
| WMC&R | Waste Management Collection & Recycling | |
| WWI | Western Waste Industries | |
| Y/S | Yucaipa/Sweetwater |
See accompanying Notes to Financial Statements.
54 OPPENHEIMER ROCHESTER LIMITED TERM CALIFORNIA MUNICIPAL FUND
STATEMENT OF ASSETS AND LIABILITIES July 31, 2015
| ||||
Assets | ||||
Investments, at value (cost $655,383,408)—see accompanying statement of investments | $ | 623,074,829 | ||
| ||||
Cash | 589,493 | |||
| ||||
Receivables and other assets: | ||||
Investments sold (including $10,260,918 sold on a when-issued or delayed delivery basis) | 14,484,254 | |||
Interest | 10,507,625 | |||
Shares of beneficial interest sold | 332,706 | |||
Other | 266,434 | |||
|
| |||
Total assets | 649,255,341 | |||
| ||||
Liabilities | ||||
Payables and other liabilities: | ||||
Payable for borrowings (See Note 8) | 26,000,000 | |||
Payable for short-term floating rate notes issued (See Note 4) | 6,665,000 | |||
Shares of beneficial interest redeemed | 3,878,760 | |||
Dividends | 332,732 | |||
Distribution and service plan fees | 105,967 | |||
Trustees’ compensation | 37,082 | |||
Shareholder communications | 10,605 | |||
Interest expense on borrowings | 3,175 | |||
Other | 74,350 | |||
|
| |||
Total liabilities | 37,107,671 | |||
| ||||
Net Assets | $ | 612,147,670 | ||
|
| |||
| ||||
Composition of Net Assets | ||||
Par value of shares of beneficial interest | $ | 191,207 | ||
| ||||
Additional paid-in capital | 681,796,395 | |||
| ||||
Accumulated net investment income | 2,422,009 | |||
| ||||
Accumulated net realized loss on investments | (39,953,362) | |||
| ||||
Net unrealized depreciation on investments | (32,308,579) | |||
|
| |||
Net Assets | $ | 612,147,670 | ||
|
| |||
55 OPPENHEIMER ROCHESTER LIMITED TERM CALIFORNIA MUNICIPAL FUND
STATEMENT OF ASSETS AND LIABILITIES Continued
| ||||
Net Asset Value Per Share | ||||
Class A Shares: | ||||
| Net asset value and redemption price per share (based on net assets of $299,041,360 and 93,388,747 shares of beneficial interest outstanding) | $ | 3.20 | ||
| Maximum offering price per share (net asset value plus sales charge of 2.25% of offering price) | $ | 3.27 | ||
| ||||
Class B Shares: | ||||
| Net asset value, redemption price (excludes applicable contingent deferred sales charge) and offering price per share (based on net assets of $424,123 and 128,515 shares of beneficial interest outstanding) | $ | 3.30 | ||
| ||||
Class C Shares: | ||||
| Net asset value, redemption price (excludes applicable contingent deferred sales charge) and offering price per share (based on net assets of $152,645,560 and 47,844,070 shares of beneficial interest outstanding) | $ | 3.19 | ||
| ||||
Class Y Shares: | ||||
| Net asset value, redemption price and offering price per share (based on net assets of $160,036,627 and 49,845,174 shares of beneficial interest outstanding) | $ | 3.21 | ||
See accompanying Notes to Financial Statements.
56 OPPENHEIMER ROCHESTER LIMITED TERM CALIFORNIA MUNICIPAL FUND
STATEMENT OF OPERATIONS For the Year Ended July 31, 2015
| ||||
Investment Income | ||||
Interest | $ | 29,464,580 | ||
| ||||
Expenses | ||||
Management fees | 2,845,786 | |||
| ||||
Distribution and service plan fees: | ||||
Class A | 868,713 | |||
Class B | 6,299 | |||
Class C | 1,575,640 | |||
| ||||
Transfer and shareholder servicing agent fees: | ||||
Class A | 347,192 | |||
Class B | 630 | |||
Class C | 157,588 | |||
Class Y | 162,047 | |||
| ||||
Shareholder communications: | ||||
Class A | 9,550 | |||
Class B | 301 | |||
Class C | 8,752 | |||
Class Y | 10,099 | |||
| ||||
Borrowing fees | 560,779 | |||
| ||||
Interest expense and fees on short-term floating rate notes issued (See Note 4) | 50,345 | |||
| ||||
Trustees’ compensation | 10,190 | |||
| ||||
Interest expense on borrowings | 5,290 | |||
| ||||
Custodian fees and expenses | 3,565 | |||
| ||||
Other | 93,875 | |||
|
| |||
Total expenses | 6,716,641 | |||
| ||||
Net Investment Income | 22,747,939 | |||
| ||||
Realized and Unrealized Loss | ||||
Net realized loss on investments | (4,661,109) | |||
| ||||
Net change in unrealized appreciation/depreciation on investments | (13,200,444) | |||
| ||||
Net Increase in Net Assets Resulting from Operations | $ | 4,886,386 | ||
|
| |||
See accompanying Notes to Financial Statements.
57 OPPENHEIMER ROCHESTER LIMITED TERM CALIFORNIA MUNICIPAL FUND
STATEMENTS OF CHANGES IN NET ASSETS
| Year Ended July 31, 2015 | Year Ended July 31, 2014 | |||||||
| ||||||||
Operations | ||||||||
Net investment income | $ | 22,747,939 | $ | 26,805,445 | ||||
| ||||||||
Net realized loss | (4,661,109 | ) | (3,747,045) | |||||
| ||||||||
Net change in unrealized appreciation/depreciation | (13,200,444 | ) | (3,862,979) | |||||
|
|
|
| |||||
Net increase in net assets resulting from operations | 4,886,386 | 19,195,421 | ||||||
| ||||||||
Dividends and/or Distributions to Shareholders | ||||||||
Dividends from net investment income: | ||||||||
Class A | (12,918,844 | ) | (14,762,048) | |||||
Class B | (17,680 | ) | (26,685) | |||||
Class C | (4,700,921 | ) | (4,188,243) | |||||
Class Y | (6,421,540 | ) | (4,467,022) | |||||
|
| |||||||
| (24,058,985 | ) | (23,443,998) | ||||||
| ||||||||
Beneficial Interest Transactions | ||||||||
Net increase (decrease) in net assets resulting from beneficial interest transactions: | ||||||||
Class A | (62,748,538 | ) | (88,470,012) | |||||
Class B | (355,317 | ) | (458,997) | |||||
Class C | 12,989,591 | (10,958,212) | ||||||
Class Y | 43,291,822 | (9,867,887) | ||||||
|
|
|
| |||||
| (6,822,442 | ) | (109,755,108) | ||||||
| ||||||||
Net Assets | ||||||||
Total decrease | (25,995,041 | ) | (114,003,685) | |||||
| ||||||||
Beginning of period | 638,142,711 | 752,146,396 | ||||||
|
|
|
| |||||
End of period (including accumulated net investment income of $2,422,009 and $3,691,053, respectively) | $ | 612,147,670 | $ | 638,142,711 | ||||
|
| |||||||
See accompanying Notes to Financial Statements.
58 OPPENHEIMER ROCHESTER LIMITED TERM CALIFORNIA MUNICIPAL FUND
STATEMENT OF CASH FLOWS For the Year Ended July 31, 2015
Cash Flows from Operating Activities | ||||
Net increase in net assets from operations | $ | 4,886,386 | ||
| ||||
Adjustments to reconcile net increase in net assets from operations to net cash provided by operating activities: | ||||
Purchase of investment securities | (263,666,190) | |||
Proceeds from disposition of investment securities | 253,858,560 | |||
Short-term investment securities, net | 77,920 | |||
Premium amortization | 6,131,613 | |||
Discount accretion | (250,567) | |||
Net realized loss on investments | 4,661,109 | |||
Net change in unrealized appreciation/depreciation on investments | 13,200,444 | |||
Change in assets: | ||||
Increase in other assets | (56,657) | |||
Decrease in interest receivable | 287,011 | |||
Increase in receivable for securities sold | (8,669,254) | |||
Change in liabilities: | ||||
Decrease in other liabilities | (11,407) | |||
Decrease in payable for securities purchased | (416,620) | |||
|
| |||
Net cash provided by operating activities | 10,032,348 | |||
| ||||
Cash Flows from Financing Activities | ||||
Proceeds from borrowings | 117,200,000 | |||
Payments on borrowings | (97,300,000) | |||
Proceeds from shares sold | 254,724,458 | |||
Payments on shares redeemed | (278,274,810) | |||
Cash distributions paid | (6,564,220) | |||
|
| |||
Net cash used in financing activities | (10,214,572) | |||
| ||||
Net decrease in cash | (182,224) | |||
| ||||
Cash, beginning balance | 771,717 | |||
|
| |||
Cash, ending balance | $ | 589,493 | ||
|
| |||
Supplemental disclosure of cash flow information:
Noncash financing activities not included herein consist of reinvestment of dividends and distributions of $17,668,691.
Cash paid for interest on borrowings—$2,548.
Cash paid for interest on short-term floating rate notes issued—$50,345.
See accompanying Notes to Financial Statements.
59 OPPENHEIMER ROCHESTER LIMITED TERM CALIFORNIA MUNICIPAL FUND
| Year Ended | Year Ended | Year Ended | Year Ended | Year Ended | ||||||||||||||||
| Class A | July 31, | July 31, | July 31, | July 31, | July 29, | |||||||||||||||
| 2015 | 2014 | 2013 | 2012 | 20111 | ||||||||||||||||
| ||||||||||||||||||||
| Per Share Operating Data | ||||||||||||||||||||
| Net asset value, beginning of period | $ | 3 .29 | $ | 3 .30 | $ | 3 .43 | $ | 3 .33 | $ | 3 .36 | ||||||||||
| ||||||||||||||||||||
| Income (loss) from investment operations: | ||||||||||||||||||||
| Net investment income2 | 0 .12 | 0 .14 | 0 .13 | 0 .15 | 0 .16 | |||||||||||||||
| Net realized and unrealized gain (loss) | (0 .08) | (0 .03) | (0 .13) | 0 .11 | (0 .03) | |||||||||||||||
|
| |||||||||||||||||||
| Total from investment operations | 0 .04 | 0 .11 | 0 .00 | 0 .26 | 0 .13 | |||||||||||||||
| ||||||||||||||||||||
| Dividends and/or distributions to shareholders: | ||||||||||||||||||||
| Dividends from net investment income | (0 .13) | (0 .12) | (0 .13) | (0 .16) | (0 .16) | |||||||||||||||
| ||||||||||||||||||||
| Net asset value, end of period | $ | 3 .20 | $ | 3 .29 | $ | 3 .30 | $ | 3 .43 | $ | 3 .33 | ||||||||||
|
| |||||||||||||||||||
| ||||||||||||||||||||
| Total Return, at Net Asset Value3 | 0 .97% | 3 .40% | (0 .07)% | 8 .09% | 4 .07% | |||||||||||||||
| ||||||||||||||||||||
| Ratios/Supplemental Data | ||||||||||||||||||||
| Net assets, end of period (in thousands) | $ | 299,041 | $ | 370,784 | $ | 461,700 | $ | 289,266 | $ | 198,431 | ||||||||||
| ||||||||||||||||||||
| Average net assets (in thousands) | $ | 345,303 | $ | 405,307 | $ | 385,057 | $ | 225,504 | $ | 197,240 | ||||||||||
| ||||||||||||||||||||
| Ratios to average net assets:4 | ||||||||||||||||||||
| Net investment income | 3 .56% | 4 .15% | 3 .68% | 4 .41% | 4 .94% | |||||||||||||||
| Expenses excluding interest and fees on short-term floating rate notes issued and interest and fees from borrowings | 0 .79% | 0 .78% | 0 .73% | 0 .76% | 0 .77% | |||||||||||||||
| Interest and fees from borrowings | 0 .09% | 0 .09% | 0 .06% | 0 .07% | 0 .12% | |||||||||||||||
| Interest and fees on short-term floating rate notes issued5 | 0 .01% | 0 .01% | 0 .01% | 0 .02% | 0 .05% | |||||||||||||||
|
| |||||||||||||||||||
| Total expenses | 0 .89% | 0 .88% | 0 .80% | 0 .85% | 0 .94% | |||||||||||||||
| Expenses after payments, waivers and/or reimbursements and reduction to custodian expenses | 0 .89% | 0 .88% | 0 .80% | 0 .85% | 0 .94% | |||||||||||||||
| ||||||||||||||||||||
| Portfolio turnover rate | 39% | 19% | 37% | 20% | 32% | |||||||||||||||
1. July 29, 2011 represents the last business day of the Fund’s reporting period.
2. Per share amounts calculated based on the average shares outstanding during the period.
3. Assumes an initial investment on the business day before the first day of the fiscal period, with all dividends and distributions reinvested in additional shares on the reinvestment date, and redemption at the net asset value calculated on the last business day of the fiscal period. Sales charges are not reflected in the total returns. Total returns are not annualized for periods less than one full year. Returns do not reflect the deduction of taxes that a shareholder would pay on fund distributions or the redemption of fund shares. The returns do not include adjustments in accordance with generally accepted accounting principles required at the period end for financial reporting purposes.
4. Annualized for periods less than one full year.
5. Interest and fee expense related to the Fund’s liability for short-term floating rate notes issued in conjunction with inverse floating rate securities.
See accompanying Notes to Financial Statements.
60 OPPENHEIMER ROCHESTER LIMITED TERM CALIFORNIA MUNICIPAL FUND
| Year Ended | Year Ended | Year Ended | Year Ended | Year Ended | ||||||||||||||||
| Class B | July 31, | July 31, | July 31, | July 31, | July 29, | |||||||||||||||
| 2015 | 2014 | 2013 | 2012 | 20111 | ||||||||||||||||
| ||||||||||||||||||||
| Per Share Operating Data | ||||||||||||||||||||
| Net asset value, beginning of period | $ | 3 .39 | $ | 3 .39 | $ | 3 .52 | $ | 3 .41 | $ | 3 .44 | ||||||||||
| ||||||||||||||||||||
| Income (loss) from investment operations: | ||||||||||||||||||||
| Net investment income2 | 0 .09 | 0 .11 | 0 .10 | 0 .12 | 0 .14 | |||||||||||||||
| Net realized and unrealized gain (loss) | (0 .08) | (0 .02) | (0 .13) | 0 .12 | (0 .04) | |||||||||||||||
|
| |||||||||||||||||||
| Total from investment operations | 0 .01 | 0 .09 | (0 .03) | 0 .24 | 0 .10 | |||||||||||||||
| ||||||||||||||||||||
| Dividends and/or distributions to shareholders: | ||||||||||||||||||||
| Dividends from net investment income | (0 .10) | (0 .09) | (0 .10) | (0 .13) | (0 .13) | |||||||||||||||
| ||||||||||||||||||||
| Net asset value, end of period | $ | 3 .30 | $ | 3 .39 | $ | 3 .39 | $ | 3 .52 | $ | 3 .41 | ||||||||||
|
| |||||||||||||||||||
| ||||||||||||||||||||
| Total Return, at Net Asset Value3 | 0 .13% | 2 .73% | (1 .02)% | 7 .18% | 2 .98% | |||||||||||||||
| ||||||||||||||||||||
| Ratios/Supplemental Data | ||||||||||||||||||||
| Net assets, end of period (in thousands) | $ | 424 | $ | 792 | $ | 1,253 | $ | 1,629 | $ | 1,539 | ||||||||||
| ||||||||||||||||||||
| Average net assets (in thousands) | $ | 626 | $ | 1,008 | $ | 1,470 | $ | 1,657 | $ | 1,720 | ||||||||||
| ||||||||||||||||||||
| Ratios to average net assets:4 | ||||||||||||||||||||
| Net investment income | 2 .78% | 3 .29% | 2 .78% | 3 .51% | 3 .99% | |||||||||||||||
| Expenses excluding interest and fees on short-term floating rate notes issued and interest and fees from borrowings | 1 .59% | 1 .65% | 1 .69% | 1 .71% | 1 .72% | |||||||||||||||
| Interest and fees from borrowings | 0 .09% | 0 .09% | 0 .06% | 0 .07% | 0 .12% | |||||||||||||||
| Interest and fees on short-term floating rate notes issued5 | 0 .01% | 0 .01% | 0 .01% | 0 .02% | 0 .05% | |||||||||||||||
|
| |||||||||||||||||||
| Total expenses | 1 .69% | 1 .75% | 1 .76% | 1 .80% | 1 .89% | |||||||||||||||
| Expenses after payments, waivers and/or reimbursements and reduction to custodian expenses | 1 .69% | 1 .75% | 1 .76% | 1 .80% | 1 .89% | |||||||||||||||
| ||||||||||||||||||||
| Portfolio turnover rate | 39% | 19% | 37% | 20% | 32% | |||||||||||||||
1. July 29, 2011 represents the last business day of the Fund’s reporting period.
2. Per share amounts calculated based on the average shares outstanding during the period.
3. Assumes an initial investment on the business day before the first day of the fiscal period, with all dividends and distributions reinvested in additional shares on the reinvestment date, and redemption at the net asset value calculated on the last business day of the fiscal period. Sales charges are not reflected in the total returns. Total returns are not annualized for periods less than one full year. Returns do not reflect the deduction of taxes that a shareholder would pay on fund distributions or the redemption of fund shares. The returns do not include adjustments in accordance with generally accepted accounting principles required at the period end for financial reporting purposes.
4. Annualized for periods less than one full year.
5. Interest and fee expense related to the Fund’s liability for short-term floating rate notes issued in conjunction with inverse floating rate securities.
See accompanying Notes to Financial Statements.
61 OPPENHEIMER ROCHESTER LIMITED TERM CALIFORNIA MUNICIPAL FUND
FINANCIAL HIGHLIGHTS Continued
| Year Ended | Year Ended | Year Ended | Year Ended | Year Ended | ||||||||||||||||
| Class C | July 31, | July 31, | July 31, | July 31, | July 29, | |||||||||||||||
| 2015 | 2014 | 2013 | 2012 | 20111 | ||||||||||||||||
| ||||||||||||||||||||
Per Share Operating Data | ||||||||||||||||||||
| Net asset value, beginning of period | $ | 3 .28 | $ | 3 .29 | $ | 3 .41 | $ | 3 .31 | $ | 3 .35 | ||||||||||
| ||||||||||||||||||||
| Income (loss) from investment operations: | ||||||||||||||||||||
| Net investment income2 | 0 .09 | 0 .11 | 0 .10 | 0 .12 | 0 .14 | |||||||||||||||
| Net realized and unrealized gain (loss) | (0 .08) | (0 .03) | (0 .12) | 0 .12 | (0 .04) | |||||||||||||||
|
| |||||||||||||||||||
| Total from investment operations | 0 .01 | 0 .08 | (0 .02) | 0 .24 | 0 .10 | |||||||||||||||
| ||||||||||||||||||||
| Dividends and/or distributions to shareholders: | ||||||||||||||||||||
| Dividends from net investment income | (0 .10) | (0 .09) | (0 .10) | (0 .14) | (0 .14) | |||||||||||||||
| ||||||||||||||||||||
| Net asset value, end of period | $ | 3 .19 | $ | 3 .28 | $ | 3 .29 | $ | 3 .41 | $ | 3 .31 | ||||||||||
|
| |||||||||||||||||||
| ||||||||||||||||||||
Total Return, at Net Asset Value3 | 0 .22% | 2 .62% | (0 .56)% | 7 .30% | 2 .96% | |||||||||||||||
| ||||||||||||||||||||
Ratios/Supplemental Data | ||||||||||||||||||||
| Net assets, end of period (in thousands) | $ | 152,646 | $ | 144,345 | $ | 156,017 | $ | 118,105 | $ | 74,654 | ||||||||||
| ||||||||||||||||||||
| Average net assets (in thousands) | $ | 156,790 | $ | 144,718 | $ | 138,944 | $ | 91,711 | $ | 74,225 | ||||||||||
| ||||||||||||||||||||
| Ratios to average net assets:4 | ||||||||||||||||||||
| Net investment income | 2 .77% | 3 .38% | 2 .91% | 3 .61% | 4 .15% | |||||||||||||||
| Expenses excluding interest and fees on short-term floating rate notes issued and interest and fees from borrowings | 1 .55% | 1 .55% | 1 .52% | 1 .54% | 1 .56% | |||||||||||||||
| Interest and fees from borrowings | 0 .09% | 0 .09% | 0 .06% | 0 .07% | 0 .12% | |||||||||||||||
| Interest and fees on short-term floating rate notes issued5 | 0 .01% | 0 .01% | 0 .01% | 0 .02% | 0 .05% | |||||||||||||||
|
| |||||||||||||||||||
| Total expenses | 1 .65% | 1 .65% | 1 .59% | 1 .63% | 1 .73% | |||||||||||||||
| Expenses after payments, waivers and/or reimbursements and reduction to custodian expenses | 1 .65% | 1 .65% | 1 .59% | 1 .63% | 1 .73% | |||||||||||||||
| ||||||||||||||||||||
| Portfolio turnover rate | 39% | 19% | 37% | 20% | 32% | |||||||||||||||
1. July 29, 2011 represents the last business day of the Fund’s reporting period.
2. Per share amounts calculated based on the average shares outstanding during the period.
3. Assumes an initial investment on the business day before the first day of the fiscal period, with all dividends and distributions reinvested in additional shares on the reinvestment date, and redemption at the net asset value calculated on the last business day of the fiscal period. Sales charges are not reflected in the total returns. Total returns are not annualized for periods less than one full year. Returns do not reflect the deduction of taxes that a shareholder would pay on fund distributions or the redemption of fund shares. The returns do not include adjustments in accordance with generally accepted accounting principles required at the period end for financial reporting purposes.
4. Annualized for periods less than one full year.
5. Interest and fee expense related to the Fund’s liability for short-term floating rate notes issued in conjunction with inverse floating rate securities.
See accompanying Notes to Financial Statements.
62 OPPENHEIMER ROCHESTER LIMITED TERM CALIFORNIA MUNICIPAL FUND
| Year Ended | Year Ended | Year Ended | Year Ended | Period Ended | ||||||||||||||||
| Class Y | July 31, | July 31, | July 31, | July 31, | July 29, | |||||||||||||||
| 2015 | 2014 | 2013 | 2012 | 20111 | ||||||||||||||||
| ||||||||||||||||||||
Per Share Operating Data | ||||||||||||||||||||
| Net asset value, beginning of period | $ | 3 .30 | $ | 3 .31 | $ | 3 .43 | $ | 3 .33 | $ | 3 .34 | ||||||||||
| ||||||||||||||||||||
| Income (loss) from investment operations: | ||||||||||||||||||||
| Net investment income2 | 0 .12 | 0 .14 | 0 .13 | 0 .15 | 0 .11 | |||||||||||||||
| Net realized and unrealized gain (loss) | (0 .08) | (0 .02) | (0 .11) | 0 .12 | (0 .01) | |||||||||||||||
|
| |||||||||||||||||||
| Total from investment operations | 0 .04 | 0 .12 | 0 .02 | 0 .27 | 0 .10 | |||||||||||||||
| ||||||||||||||||||||
| Dividends and/or distributions to shareholders: | ||||||||||||||||||||
| Dividends from net investment income | (0 .13) | (0 .13) | (0 .14) | (0 .17) | (0 .11) | |||||||||||||||
| ||||||||||||||||||||
| Net asset value, end of period | $ | 3 .21 | $ | 3 .30 | $ | 3 .31 | $ | 3 .43 | $ | 3 .33 | ||||||||||
|
| |||||||||||||||||||
| ||||||||||||||||||||
Total Return, at Net Asset Value3 | 1 .22% | 3 .63% | 0 .46% | 8 .33% | 3 .20% | |||||||||||||||
| ||||||||||||||||||||
Ratios/Supplemental Data | ||||||||||||||||||||
| Net assets, end of period (in thousands) | $ | 160,037 | $ | 122,222 | $ | 133,176 | $ | 94,773 | $ | 13,031 | ||||||||||
| ||||||||||||||||||||
| Average net assets (in thousands) | $ | 161,312 | $ | 115,517 | $ | 125,603 | $ | 53,265 | $ | 5,548 | ||||||||||
| ||||||||||||||||||||
| Ratios to average net assets:4 | ||||||||||||||||||||
| Net investment income | 3 .76% | 4 .38% | 3 .91% | 4 .48% | 5 .05% | |||||||||||||||
| Expenses excluding interest and fees on short-term floating rate notes issued and interest and fees from borrowings | 0 .55% | 0 .54% | 0 .50% | 0 .51% | 0 .58% | |||||||||||||||
| Interest and fees from borrowings | 0 .09% | 0 .09% | 0 .06% | 0 .07% | 0 .10% | |||||||||||||||
| Interest and fees on short-term floating rate notes issued5 | 0 .01% | 0 .01% | 0 .01% | 0 .02% | 0 .05% | |||||||||||||||
|
| |||||||||||||||||||
| Total expenses | 0 .65% | 0 .64% | 0 .57% | 0 .60% | 0 .73% | |||||||||||||||
| Expenses after payments, waivers and/or reimbursements and reduction to custodian expenses | 0 .65% | 0 .64% | 0 .57% | 0 .60% | 0 .73% | |||||||||||||||
| ||||||||||||||||||||
| Portfolio turnover rate | 39% | 19% | 37% | 20% | 32% | |||||||||||||||
1. For the period from November 29, 2010 (inception of offering) to July 29, 2011, which represents the last business day of the Fund’s reporting period.
2. Per share amounts calculated based on the average shares outstanding during the period.
3. Assumes an initial investment on the business day before the first day of the fiscal period, with all dividends and distributions reinvested in additional shares on the reinvestment date, and redemption at the net asset value calculated on the last business day of the fiscal period. Sales charges are not reflected in the total returns. Total returns are not annualized for periods less than one full year. Returns do not reflect the deduction of taxes that a shareholder would pay on fund distributions or the redemption of fund shares. The returns do not include adjustments in accordance with generally accepted accounting principles required at the period end for financial reporting purposes.
4. Annualized for periods less than one full year.
5. Interest and fee expense related to the Fund’s liability for short-term floating rate notes issued in conjunction with inverse floating rate securities.
See accompanying Notes to Financial Statements.
63 OPPENHEIMER ROCHESTER LIMITED TERM CALIFORNIA MUNICIPAL FUND
NOTES TO FINANCIAL STATEMENTS July 31, 2015
1. Organization
Oppenheimer Rochester Limited Term California Municipal Fund (the “Fund”) is a diversified open-end management investment company registered under the Investment Company Act of 1940 (“1940 Act”), as amended. The Fund’s investment objective is to seek tax-free income. The Fund’s investment adviser is OFI Global Asset Management, Inc. (“OFI Global” or the “Manager”), a wholly-owned subsidiary of OppenheimerFunds, Inc. (“OFI” or the “Sub-Adviser”). The Manager has entered into a sub-advisory agreement with OFI.
The Fund offers Class A, Class C and Class Y shares, and previously offered Class B shares for new purchase through June 29, 2012. Subsequent to that date, no new purchases of Class B shares are permitted, however reinvestment of dividend and/or capital gain distributions and exchanges of Class B shares into and from other Oppenheimer funds will be allowed. Class A shares are sold at their offering price, which is normally net asset value plus a front-end sales charge. Class C shares are sold, and Class B shares were sold, without a front-end sales charge but may be subject to a contingent deferred sales charge (“CDSC”). Class Y shares are sold to certain institutional investors or intermediaries without either a front-end sales charge or a CDSC, however, the intermediaries may impose charges on their accountholders who beneficially own Class Y shares. All classes of shares have identical rights and voting privileges with respect to the Fund in general and exclusive voting rights on matters that affect that class alone. Earnings, net assets and net asset value per share may differ due to each class having its own expenses, such as transfer and shareholder servicing agent fees and shareholder communications, directly attributable to that class. Class A, B and C shares have separate distribution and/or service plans under which they pay fees. Class Y shares do not pay such fees. Class B shares will automatically convert to Class A shares 72 months after the date of purchase.
The following is a summary of significant accounting policies followed in the Fund’s preparation of financial statements in accordance with accounting principles generally accepted in the United States (“U.S. GAAP”).
2. Significant Accounting Policies
Security Valuation. All investments in securities are recorded at their estimated fair value, as described in Note 3.
Reporting Period End Date. The last day of the Fund’s reporting period is the last day the New York Stock Exchange was open for trading during the period. The Fund’s financial statements have been presented through that date to maintain consistency with the Fund’s net asset value calculations used for shareholder transactions.
Allocation of Income, Expenses, Gains and Losses. Income, expenses (other than those attributable to a specific class), gains and losses are allocated on a daily basis to each class of shares based upon the relative proportion of net assets represented by such class. Operating expenses directly attributable to a specific class are charged against the operations of that class.
64 OPPENHEIMER ROCHESTER LIMITED TERM CALIFORNIA MUNICIPAL FUND
2. Significant Accounting Policies (Continued)
Dividends and Distributions to Shareholders. Dividends and distributions to shareholders, which are determined in accordance with income tax regulations and may differ from U.S. generally accepted accounting principles, are recorded on the ex-dividend date. Income distributions, if any, are declared daily and paid monthly. Capital gain distributions, if any, are declared and paid annually.
Investment Income. Interest income is recognized on an accrual basis. Discount and premium, which are included in interest income on the Statement of Operations, are amortized or accreted daily.
Custodian Fees. “Custodian fees and expenses” in the Statement of Operations may include interest expense incurred by the Fund on any cash overdrafts of its custodian account during the period. Such cash overdrafts may result from the effects of failed trades in portfolio securities and from cash outflows resulting from unanticipated shareholder redemption activity. The Fund pays interest to its custodian on such cash overdraft at a rate equal to the 1 Month LIBOR Rate plus 2.00%. The “Reduction to custodian expenses” line item, if applicable, represents earnings on cash balances maintained by the Fund during the period. Such interest expense and other custodian fees may be paid with these earnings.
Security Transactions. Security transactions are recorded on the trade date. Realized gains and losses on securities sold are determined on the basis of identified cost.
Indemnifications. The Fund’s organizational documents provide current and former Trustees and officers with a limited indemnification against liabilities arising in connection with the performance of their duties to the Fund. In the normal course of business, the Fund may also enter into contracts that provide general indemnifications. The Fund’s maximum exposure under these arrangements is unknown as this would be dependent on future claims that may be made against the Fund. The risk of material loss from such claims is considered remote.
Federal Taxes. The Fund intends to comply with provisions of the Internal Revenue Code applicable to regulated investment companies and to distribute substantially all of its investment company taxable income, including any net realized gain on investments not offset by capital loss carryforwards, if any, to shareholders. Therefore, no federal income or excise tax provision is required. The Fund files income tax returns in U.S. federal and applicable state jurisdictions. The statute of limitations on the Fund’s tax return filings generally remains open for the three preceding fiscal reporting period ends.
The tax components of capital shown in the following table represent distribution requirements the Fund must satisfy under the income tax regulations, losses the Fund may be able to offset against income and gains realized in future years and unrealized appreciation or depreciation of securities and other investments for federal income tax purposes.
65 OPPENHEIMER ROCHESTER LIMITED TERM CALIFORNIA MUNICIPAL FUND
NOTES TO FINANCIAL STATEMENTS Continued
2. Significant Accounting Policies (Continued)
| Undistributed Net Investment Income | Undistributed Long-Term Gain | Accumulated Loss Carryforward1,2,3,4 | Net Unrealized Depreciation Based on cost of Securities and Other Investments for Federal Income Tax Purposes | |||
$3,005,172 | $— | $39,947,861 | $32,450,434 |
1. At period end, the Fund had $39,947,861 of net capital loss carryforward available to offset future realized capital gains, if any, and thereby reduce future taxable gain distributions. Details of the capital loss carryforwards are included in the table below. Capital loss carryovers with no expiration, if any, must be utilized prior to those with expiration dates.
| Expiring | ||||
| ||||
2016 | $ | 55,871 | ||
2017 | 2,457,882 | |||
2018 | 10,731,096 | |||
2019 | 3,010,369 | |||
No expiration | 23,692,643 | |||
|
| |||
Total | $ | 39,947,861 | ||
|
| |||
2. During the reporting period, the Fund did not utilize any capital loss carryforward.
3. During the previous reporting period, the Fund utilized $591,547 of capital loss carryforward to offset capital gains realized in that fiscal year.
4. During the reporting period, $172,117 of unused capital loss carryforward expired.
Net investment income (loss) and net realized gain (loss) may differ for financial statement and tax purposes. The character of dividends and distributions made during the fiscal year from net investment income or net realized gains are determined in accordance with federal income tax requirements, which may differ from the character of net investment income or net realized gains presented in those financial statements in accordance with GAAP. Also, due to timing of dividends and distributions, the fiscal year in which amounts are distributed may differ from the fiscal year in which the income or net realized gain was recorded by the Fund.
Accordingly, the following amounts have been reclassified for the reporting period. Net assets of the Fund were unaffected by the reclassifications.
| Reduction to Paid-in Capital | Increase to Accumulated Net Investment Income | Reduction to Accumulated Net Realized Loss on Investments | ||||||
$172,117 | $42,002 | $130,115 | ||||||
The tax character of distributions paid during the reporting periods:
| Year Ended | Year Ended | |||||||||
| July 31, 2015 | July 31, 2014 | |||||||||
| ||||||||||
Distributions paid from: | ||||||||||
Exempt-interest income | $ | 23,666,081 | $ | 23,315,272 | ||||||
Ordinary income | 392,904 | 128,726 | ||||||||
|
| |||||||||
Total | $ | 24,058,985 | $ | 23,443,998 | ||||||
|
| |||||||||
66 OPPENHEIMER ROCHESTER LIMITED TERM CALIFORNIA MUNICIPAL FUND
2. Significant Accounting Policies (Continued)
The aggregate cost of securities and other investments and the composition of unrealized appreciation and depreciation of securities and other investments for federal income tax purposes at period end are noted in the following table. The primary difference between book and tax appreciation or depreciation of securities and other investments, if applicable, is attributable to the tax deferral of losses or tax realization of financial statement unrealized gain or loss.
Federal tax cost of securities | $ | 648,964,565 | 1 | |
|
| |||
Gross unrealized appreciation | $ | 14,413,040 | ||
Gross unrealized depreciation | (46,863,474 | ) | ||
|
| |||
Net unrealized depreciation | $ | (32,450,434 | ) | |
|
|
1. The Federal tax cost of securities does not include cost of $6,560,698, which has otherwise been recognized for financial reporting purposes, related to bonds placed into trusts in conjunction with certain investment transactions. See the Inverse Floating Rate Securities note in Note 4.
Use of Estimates. The preparation of financial statements in conformity with accounting principles generally accepted in the United States of America requires management to make estimates and assumptions that affect the reported amounts of assets and liabilities and disclosure of contingent assets and liabilities at the date of the financial statements and the reported amounts of increases and decreases in net assets from operations during the reporting period. Actual results could differ from those estimates.
3. Securities Valuation
The Fund calculates the net asset value of its shares as of the close of the New York Stock Exchange (the “Exchange”), normally 4:00 P.M. Eastern time, on each day the Exchange is open for trading.
The Fund’s Board has adopted procedures for the valuation of the Fund’s securities and has delegated the day-to-day responsibility for valuation determinations under those procedures to the Manager. The Manager has established a Valuation Committee which is responsible for determining a “fair valuation” for any security for which market quotations are not “readily available.” The Valuation Committee’s fair valuation determinations are subject to review, approval and ratification by the Fund’s Board at its next regularly scheduled meeting covering the calendar quarter in which the fair valuation was determined.
Valuation Methods and Inputs
Securities are valued using unadjusted quoted market prices, when available, as supplied primarily by third party pricing services or dealers.
The following methodologies are used to determine the market value or the fair value of the types of securities described below:
Securities traded on a registered U.S. securities exchange (including exchange-traded derivatives other than futures and futures options) are valued based on the last sale price of the security reported on the principal exchange on which it is traded, prior to the time when
67 OPPENHEIMER ROCHESTER LIMITED TERM CALIFORNIA MUNICIPAL FUND
NOTES TO FINANCIAL STATEMENTS Continued
3. Securities Valuation (Continued)
the Fund’s assets are valued. In the absence of a sale, the security is valued at the last sale price on the prior trading day, if it is within the spread of the current day’s closing “bid” and “asked” prices, and if not, at the current day’s closing bid price. A security of a foreign issuer traded on a foreign exchange, but not listed on a registered U.S. securities exchange, is valued based on the last sale price on the principal exchange on which the security is traded, as identified by the third party pricing service used by the Manager, prior to the time when the Fund’s assets are valued. If the last sale price is unavailable, the security is valued at the most recent official closing price on the principal exchange on which it is traded. If the last sales price or official closing price for a foreign security is not available, the security is valued at the mean between the bid and asked price per the exchange or, if not available from the exchange, obtained from two dealers. If bid and asked prices are not available from either the exchange or two dealers, the security is valued by using one of the following methodologies (listed in order of priority): (1) using a bid from the exchange, (2) the mean between the bid and asked price as provided by a single dealer, or (3) a bid from a single dealer.
Shares of a registered investment company that are not traded on an exchange are valued at that investment company’s net asset value per share.
Corporate and government debt securities (of U.S. or foreign issuers) and municipal debt securities, event-linked bonds, loans, mortgage-backed securities, collateralized mortgage obligations, and asset-backed securities are valued at the mean between the “bid” and “asked” prices utilizing evaluated prices obtained from third party pricing services or broker-dealers who may use matrix pricing methods to determine the evaluated prices.
Short-term money market type debt securities with a remaining maturity of sixty days or less are valued at cost adjusted by the amortization of discount or premium to maturity (amortized cost), which approximates market value. Short-term debt securities with a remaining maturity in excess of sixty days are valued at the mean between the “bid” and “asked” prices utilizing evaluated prices obtained from third party pricing services or broker-dealers.
A description of the standard inputs that may generally be considered by the third party pricing vendors in determining their evaluated prices is provided below.
| Security Type | Standard inputs generally considered by third-party pricing vendors | |
Corporate debt, government debt, municipal, mortgage-backed and asset-backed securities | Reported trade data, broker-dealer price quotations, benchmark yields, issuer spreads on comparable securities, the credit quality, yield, maturity, and other appropriate factors. | |
| Loans | Information obtained from market participants regarding reported trade data and broker-dealer price quotations. | |
| Event-linked bonds | Information obtained from market participants regarding reported trade data and broker-dealer price quotations. |
If a market value or price cannot be determined for a security using the methodologies described above, or if, in the “good faith” opinion of the Manager, the market value or price obtained does not constitute a “readily available market quotation,” or a significant event has occurred that would materially affect the value of the security, the security is fair valued either (i) by a standardized fair valuation methodology applicable to the security type or the
68 OPPENHEIMER ROCHESTER LIMITED TERM CALIFORNIA MUNICIPAL FUND
3. Securities Valuation (Continued)
significant event as previously approved by the Valuation Committee and the Fund’s Board or (ii) as determined in good faith by the Manager’s Valuation Committee. The Valuation Committee considers all relevant facts that are reasonably available, through either public information or information available to the Manager, when determining the fair value of a security. Fair value determinations by the Manager are subject to review, approval and ratification by the Fund’s Board at its next regularly scheduled meeting covering the calendar quarter in which the fair valuation was determined. Those fair valuation standardized methodologies include, but are not limited to, valuing securities at the last sale price or initially at cost and subsequently adjusting the value based on: changes in company specific fundamentals, changes in an appropriate securities index, or changes in the value of similar securities which may be further adjusted for any discounts related to security-specific resale restrictions. When possible, such methodologies use observable market inputs such as unadjusted quoted prices of similar securities, observable interest rates, currency rates and yield curves. The methodologies used for valuing securities are not necessarily an indication of the risks associated with investing in those securities nor can it be assured that the Fund can obtain the fair value assigned to a security if it were to sell the security.
To assess the continuing appropriateness of security valuations, the Manager, or its third party service provider who is subject to oversight by the Manager, regularly compares prior day prices, prices on comparable securities, and sale prices to the current day prices and challenges those prices exceeding certain tolerance levels with the third party pricing service or broker source. For those securities valued by fair valuations, whether through a standardized fair valuation methodology or a fair valuation determination, the Valuation Committee reviews and affirms the reasonableness of the valuations based on such methodologies and fair valuation determinations on a regular basis after considering all relevant information that is reasonably available.
Classifications
Each investment asset or liability of the Fund is assigned a level at measurement date based on the significance and source of the inputs to its valuation. Various data inputs are used in determining the value of each of the Fund’s investments as of the reporting period end. These data inputs are categorized in the following hierarchy under applicable financial accounting standards:
1) Level 1-unadjusted quoted prices in active markets for identical assets or liabilities (including securities actively traded on a securities exchange)
2) Level 2-inputs other than unadjusted quoted prices that are observable for the asset or liability (such as unadjusted quoted prices for similar assets and market corroborated inputs such as interest rates, prepayment speeds, credit risks, etc.)
3) Level 3-significant unobservable inputs (including the Manager’s own judgments about assumptions that market participants would use in pricing the asset or liability).
The inputs used for valuing securities are not necessarily an indication of the risks associated with investing in those securities.
69 OPPENHEIMER ROCHESTER LIMITED TERM CALIFORNIA MUNICIPAL FUND
NOTES TO FINANCIAL STATEMENTS Continued
3. Securities Valuation (Continued)
The table below categorizes amounts that are included in the Fund’s Statement of Assets and Liabilities at period end based on valuation input level:
| Level 1— Unadjusted Quoted Prices | Level 2— Other Significant Observable Inputs | Level 3— Significant Unobservable Inputs | Value | |||||||||||||
| ||||||||||||||||
Assets Table | ||||||||||||||||
Investments, at Value: | ||||||||||||||||
Municipal Bonds and Notes | ||||||||||||||||
California | $ | — | $ | 523,085,638 | $ | — | $ | 523,085,638 | ||||||||
U.S. Possessions | — | 99,989,191 | — | 99,989,191 | ||||||||||||
|
| |||||||||||||||
Total Assets | $ | — | $ | 623,074,829 | $ | — | $ | 623,074,829 | ||||||||
|
| |||||||||||||||
Forward currency exchange contracts and futures contracts, if any, are reported at their unrealized appreciation/depreciation at measurement date, which represents the change in the contract’s value from trade date. All additional assets and liabilities included in the above table are reported at their market value at measurement date.
4. Investments and Risks
Inverse Floating Rate Securities. The Fund invests in inverse floating rate securities that pay interest at a rate that varies inversely with short-term interest rates. Because inverse floating rate securities are leveraged instruments, the value of an inverse floating rate security will change more significantly in response to changes in interest rates and other market fluctuations than the market value of a conventional fixed-rate municipal security of similar maturity and credit quality, including the municipal bond underlying an inverse floating rate security.
An inverse floating rate security is created as part of a financial transaction referred to as a “tender option bond” transaction. In most cases, in a tender option bond transaction the Fund sells a fixed-rate municipal bond (the “underlying municipal bond”) to a trust (the “Trust”). The Trust then issues and sells short-term floating rate securities with a fixed principal amount representing a senior interest in the underlying municipal bond to third parties and a residual, subordinate interest in the underlying municipal bond (referred to as an “inverse floating rate security”) to the Fund. The interest rate on the short-term floating rate securities resets periodically, usually weekly, to a prevailing market rate and holders of these securities are granted the option to tender their securities back to the Trust for repurchase at their principal amount plus accrued interest thereon (the “purchase price”) periodically, usually daily or weekly. A remarketing agent for the Trust is required to attempt to re-sell any tendered short-term floating rate securities to new investors for the purchase price. If the remarketing agent is unable to successfully re-sell the tendered short-term floating rate securities, a liquidity provider to the Trust must contribute cash to the Trust to ensure that the tendering holders receive the purchase price of their securities on the repurchase date.
Because holders of the short-term floating rate securities are granted the right to tender their securities to the Trust for repurchase at frequent intervals for the purchase price, with such payment effectively guaranteed by the liquidity provider, the securities generally bear
70 OPPENHEIMER ROCHESTER LIMITED TERM CALIFORNIA MUNICIPAL FUND
4. Investments and Risks (Continued)
short-term rates of interest commensurate with money market instruments. When interest is paid on the underlying municipal bond to the Trust, such proceeds are first used to pay the Trust’s administrative expenses and accrued interest to holders of the short-term floating rate securities, with any remaining amounts being paid to the Fund, as the holder of the inverse floating rate security. Accordingly, the amount of such interest on the underlying municipal bond paid to the Fund is inversely related the rate of interest on the short-term floating rate securities. Additionally, because the principal amount of the short-term floating rate securities is fixed and is not adjusted in response to changes in the market value of the underlying municipal bond, any change in the market value of the underlying municipal bond is reflected entirely in a change to the value of the inverse floating rate security.
Typically, the terms of an inverse floating rate security grant certain rights to the Fund, as holder. For example, the Fund typically has the right upon request to require that the Trust compel a tender of the short-term floating rate securities to facilitate the Fund’s acquisition of the underlying municipal bond. Following such a request, the Fund pays the Trust the purchase price of the short-term floating rate securities and a specified portion of any market value gain on the underlying municipal bond since its deposit into the Trust, which the Trust uses to redeem the short-term floating rate securities. The Trust then distributes the underlying municipal bond to the Fund. Through the exercise of this right, the Fund can voluntarily terminate or “collapse” the Trust, terminate its investment in the related inverse floating rate security and obtain the underlying municipal bond. Additionally, the Fund also typically has the right to exchange with the Trust (i) a principal amount of short-term floating rate securities held by the Fund for a corresponding additional principal amount of the inverse floating rate security or (ii) a principal amount of the inverse floating rate security held by the Fund for a corresponding additional principal amount of short-term floating rate securities (which are typically then sold to other investors). Through the exercise of this right, the Fund may increase (or decrease) the principal amount of short-term floating rate securities outstanding, thereby increasing (or decreasing) the amount of leverage provided by the short-term floating rate securities to the Fund’s investment exposure to the underlying municipal bond.
The Fund’s investments in inverse floating rate securities involve certain risks. As short-term interest rates rise, an inverse floating rate security produces less current income (and, in extreme cases, may pay no income) and as short-term interest rates fall, an inverse floating rate security produces more current income. Thus, if short-term interest rates rise after the issuance of the inverse floating rate security, any yield advantage is reduced or eliminated. All inverse floating rate securities entail some degree of leverage represented by the outstanding principal amount of the related short-term floating rate securities, relative to the par value of the underlying municipal bond. The value of, and income earned on, an inverse floating rate security that has a higher degree of leverage will fluctuate more significantly in response to changes in interest rates and to changes in the market value of the related underlying municipal bond than that of an inverse floating rate security with a lower degree of leverage, and is more likely to be eliminated entirely under adverse market conditions. Changes in the value of an inverse floating rate security will also be more significant than changes in the market value of the related underlying municipal bond because the leverage provided by the
71 OPPENHEIMER ROCHESTER LIMITED TERM CALIFORNIA MUNICIPAL FUND
NOTES TO FINANCIAL STATEMENTS Continued
4. Investments and Risks (Continued)
related short-term floating rate securities increases the sensitivity of an inverse floating rate security to changes in interest rates and to the market value of the underlying municipal bond. An inverse floating rate security can be expected to underperform fixed-rate municipal bonds when the difference between long-term and short-term interest rates is decreasing (or is already small) or when long-term interest rates are rising, but can be expected to outperform fixed-rate municipal bonds when the difference between long-term and short-term interest rates is increasing (or is already large) or when long-term interest rates are falling. Additionally, a tender option bond transaction typically provides for the automatic termination or “collapse” of a Trust upon the occurrence of certain adverse events, usually referred to as “mandatory tender events” or “tender option termination events.” These events may include, among others, a credit ratings downgrade of the underlying municipal bond below a specified level, a decrease in the market value of the underlying municipal bond below a specified amount, a bankruptcy of the liquidity provider or the inability of the remarketing agent to re-sell to new investors short-term floating rate securities that have been tendered for repurchase by holders thereof. Following the occurrence of such an event, the underlying municipal bond is generally sold for current market value and the proceeds distributed to holders of the short-term floating rate securities and inverse floating rate security, with the holder of the inverse floating rate security (the Fund) generally receiving the proceeds of such sale only after the holders of the short-term floating rate securities have received proceeds equal to the purchase price of their securities (and the liquidity provider is generally required to contribute cash to the Trust only in an amount sufficient to ensure that the holders of the short-term floating rate securities receive the purchase price of their securities in connection with such termination of the Trust). Following the occurrence of such events, the Fund could potentially lose the entire amount of its investment in the inverse floating rate security.
Finally, the Fund may enter into shortfall/reimbursement agreements with the liquidity provider of certain tender option bond transactions in connection with certain inverse floating rate securities held by the Fund. These agreements commit the Fund to reimburse the liquidity provider to the extent that the liquidity provider must provide cash to a Trust, including following the termination of a Trust resulting from the occurrence of a “mandatory tender event.” In connection with the occurrence of such an event and the termination of the Trust triggered thereby, the shortfall/reimbursement agreement will make the Fund liable for the amount of the negative difference, if any, between the liquidation value of the underlying municipal bond and the purchase price of the short-term floating rate securities issued by the Trust. Under the standard terms of a tender option bond transaction, absent such a shortfall/reimbursement agreement, the Fund, as holder of the inverse floating rate security, would not be required to make such a reimbursement payment to the liquidity provider. The Manager monitors the Fund’s potential exposure with respect to these agreements on a daily basis and intends to take action to terminate the Fund’s investment in related inverse floating rate securities, if it deems it appropriate to do so. At period end, the Fund’s maximum exposure under such agreements is estimated at $6,665,000.
72 OPPENHEIMER ROCHESTER LIMITED TERM CALIFORNIA MUNICIPAL FUND
4. Investments and Risks (Continued)
When the Fund creates an inverse floating rate security in a tender option bond transaction by selling an underlying municipal bond to a Trust, the transaction is considered a secured borrowing for financial reporting purposes. As a result of such accounting treatment, the Fund includes the underlying municipal bond on its Statement of Investments and as an asset on its Statement of Assets and Liabilities (but does not separately include the related inverse floating rate security on either). The Fund also includes a liability on its Statement of Assets and Liabilities equal to the outstanding principal amount and accrued interest on the related short-term floating rate securities issued by the Trust. Interest on the underlying municipal bond is recorded as investment income on the Fund’s Statement of Operations, while interest payable on the related short-term floating rate securities is recorded as interest expense. At period end, municipal bond holdings with a value of $11,088,978 shown on the Fund’s Statement of Investments are held by such Trusts and serve as the underlying municipal bonds for the related $6,665,000 in short-term floating rate securities issued and outstanding at that date.
At period end, the inverse floating rate securities associated with tender option bond transactions accounted for as secured borrowings were as follows:
| Principal Amount | Inverse Floater1 | Coupon Rate2 | Maturity Date | Value | ||||||||||
| $ 3,335,000 | Los Angeles, CA Dept. of Airports Tender Option Bond Series 2015-XF2021 Trust3 | 12.669% | 5/15/25 | $ | 4,423,978 | |||||||||
1. For a list of abbreviations used in the Inverse Floater table see the Portfolio Abbreviations table at the end of the Statement of Investments.
2. Represents the current interest rate for the inverse floating rate security.
3. Represents an inverse floating rate security that is subject to a shortfall/reimbursement agreement.
The Fund may also purchase an inverse floating rate security created as part of a tender option bond transaction not initiated by the Fund when a third party, such as a municipal issuer or financial institution, transfers an underlying municipal bond to a Trust. For financial reporting purposes, the Fund includes the inverse floating rate security related to such transaction on its Statement of Investments and as an asset on its Statement of Assets and Liabilities, and interest on the security is recorded as investment income on the Fund’s Statement of Operations.
The Fund may invest in inverse floating rate securities with any degree of leverage (as measured by the outstanding principal amount of related short-term floating rate securities). However, the Fund may only expose up to 5% of its total assets to the effects of leverage from its investments in inverse floating rate securities. This limitation is measured by comparing the aggregate principal amount of the short-term floating rate securities that are related to the inverse floating rate securities held by the Fund to the total assets of the Fund. The Fund’s exposure to the effects of leverage from its investments in inverse floating rate securities amounts to $6,665,000 or 1.03% of its total assets at period end.
Securities on a When-Issued or Delayed Delivery Basis. The Fund may purchase securities on a “when-issued” basis, and may purchase or sell securities on a “delayed delivery” basis. “When-issued” or “delayed delivery” refers to securities whose terms and
73 OPPENHEIMER ROCHESTER LIMITED TERM CALIFORNIA MUNICIPAL FUND
NOTES TO FINANCIAL STATEMENTS Continued
4. Investments and Risks (Continued)
indenture are available and for which a market exists, but which are not available for immediate delivery. Delivery and payment for securities that have been purchased by the Fund on a when-issued basis normally takes place within six months and possibly as long as two years or more after the trade date. During this period, such securities do not earn interest, are subject to market fluctuation and may increase or decrease in value prior to their delivery. The purchase of securities on a when-issued basis may increase the volatility of the Fund’s net asset value to the extent the Fund executes such transactions while remaining substantially fully invested. When the Fund engages in when-issued or delayed delivery transactions, it relies on the buyer or seller, as the case may be, to complete the transaction. Their failure to do so may cause the Fund to lose the opportunity to obtain or dispose of the security at a price and yield it considers advantageous. The Fund may also sell securities that it purchased on a when-issued basis or forward commitment prior to settlement of the original purchase.
At period end, the Fund had sold securities issued on a delayed delivery basis as follows:
| When-Issued or Delayed Delivery Basis Transactions | ||
Sold securities | $10,260,918 |
Credit Risk. The Fund invests in high-yield, non-investment-grade bonds, which may be subject to a greater degree of credit risk. Credit risk relates to the ability of the issuer to meet interest or principal payments or both as they become due. The Fund may acquire securities that have missed an interest payment, and is not obligated to dispose of securities whose issuers or underlying obligors subsequently miss an interest payment.
Information concerning securities not accruing interest at period end is as follows:
Cost | $ | 6,895,157 | ||
Market Value | $ | 881,250 | ||
Market Value as % of Net Assets | 0.14% |
The Fund has entered into forbearance agreements with certain obligors under which the Fund has agreed to temporarily forego receipt of the original principal or coupon interest rates. At period end, securities with an aggregate market value of $9,187,363, representing 1.50% of the Fund’s net assets, were subject to these forbearance agreements.
Concentration Risk. There are certain risks arising from geographic concentration in any state, commonwealth or territory. Certain economic, regulatory or political developments occurring in the state, commonwealth or territory may impair the ability of certain issuers of municipal securities to pay principal and interest on their obligations.
5. Shares of Beneficial Interest
The Fund has authorized an unlimited number of $0.001 par value shares of beneficial interest of each class. Transactions in shares of beneficial interest were as follows:
74 OPPENHEIMER ROCHESTER LIMITED TERM CALIFORNIA MUNICIPAL FUND
5. Shares of Beneficial Interest (Continued)
| Year Ended July 31, 2015 | Year Ended July 31, 2014 | |||||||||||||||
| Shares | Amount | Shares | Amount | |||||||||||||
| ||||||||||||||||
Class A | ||||||||||||||||
Sold | 30,272,184 | $ | 100,633,864 | 31,198,424 | $ | 102,259,924 | ||||||||||
Dividends and/or distributions reinvested | 3,010,632 | 9,977,652 | 3,186,740 | 10,464,964 | ||||||||||||
Redeemed | (52,564,621 | ) | (173,360,054 | ) | (61,563,945 | ) | (201,194,900) | |||||||||
|
| |||||||||||||||
Net decrease | (19,281,805 | ) | $ | (62,748,538 | ) | (27,178,781 | ) | $ | (88,470,012) | |||||||
|
| |||||||||||||||
| ||||||||||||||||
Class B | ||||||||||||||||
Sold | 4,075 | $ | 14,036 | 13,055 | $ | 44,104 | ||||||||||
Dividends and/or distributions reinvested | 4,751 | 16,236 | 7,152 | 24,157 | ||||||||||||
Redeemed | (113,975 | ) | (385,589 | ) | (155,856 | ) | (527,258) | |||||||||
|
| |||||||||||||||
Net decrease | (105,149 | ) | $ | (355,317 | ) | (135,649 | ) | $ | (458,997) | |||||||
|
| |||||||||||||||
| ||||||||||||||||
Class C | ||||||||||||||||
Sold | 14,021,922 | $ | 46,404,136 | 11,798,640 | $ | 38,586,345 | ||||||||||
Dividends and/or distributions reinvested | 1,005,740 | 3,320,784 | 873,944 | 2,863,392 | ||||||||||||
Redeemed | (11,190,240 | ) | (36,735,329 | ) | (16,071,958 | ) | (52,407,949) | |||||||||
|
| |||||||||||||||
Net increase (decrease) | 3,837,422 | $ | 12,989,591 | (3,399,374 | ) | $ | (10,958,212) | |||||||||
|
| |||||||||||||||
| ||||||||||||||||
Class Y | ||||||||||||||||
Sold | 32,137,036 | $ | 106,896,727 | 25,156,128 | $ | 82,794,659 | ||||||||||
Dividends and/or distributions reinvested | 1,311,166 | 4,354,019 | 794,065 | 2,615,784 | ||||||||||||
Redeemed | (20,641,373 | ) | (67,958,924 | ) | (29,140,459 | ) | (95,278,330) | |||||||||
|
| |||||||||||||||
Net increase (decrease) | 12,806,829 | $ | 43,291,822 | (3,190,266 | ) | $ | (9,867,887) | |||||||||
|
| |||||||||||||||
6. Purchases and Sales of Securities
The aggregate cost of purchases and proceeds from sales of securities, other than short-term obligations, for the reporting period were as follows:
| Purchases | Sales | |||||||
| ||||||||
Investment securities | $263,666,190 | $253,858,560 | ||||||
7. Fees and Other Transactions with Affiliates
Management Fees. Under the investment advisory agreement, the Fund pays the Manager a management fee based on the daily net assets of the Fund at an annual rate as shown in the following table:
| Fee Schedule | ||||
Up to $100 million | 0.50% | |||
Next $150 million | 0.45 | |||
Next $1.75 billion | 0.40 | |||
Over $2 billion | 0.39 | |||
75 OPPENHEIMER ROCHESTER LIMITED TERM CALIFORNIA MUNICIPAL FUND
NOTES TO FINANCIAL STATEMENTS Continued
7. Fees and Other Transactions with Affiliates (Continued)
The Fund’s effective management fee for the reporting period was 0.43% of average annual net assets before any applicable waivers.
Sub-Adviser Fees. The Manager has retained the Sub-Adviser to provide the day-to-day portfolio management of the Fund. Under the Sub-Advisory Agreement, the Manager pays the Sub-Adviser an annual fee in monthly installments, equal to a percentage of the investment management fee collected by the Manager from the Fund, which shall be calculated after any investment management fee waivers. The fee paid to the Sub-Adviser is paid by the Manager, not by the Fund.
Transfer Agent Fees. OFI Global (the “Transfer Agent”) serves as the transfer and shareholder servicing agent for the Fund. The Fund pays the Transfer Agent a fee based on annual net assets. Fees incurred and average net assets for each class with respect to these services are detailed in the Statement of Operations and Financial Highlights, respectively.
Sub-Transfer Agent Fees. The Transfer Agent has retained Shareholder Services, Inc., a wholly-owned subsidiary of OFI (the “Sub-Transfer Agent”), to provide the day-to-day transfer agent and shareholder servicing of the Fund. Under the Sub-Transfer Agency Agreement, the Transfer Agent pays the Sub-Transfer Agent an annual fee in monthly installments, equal to a percentage of the transfer agent fee collected by the Transfer Agent from the Fund, which shall be calculated after any applicable fee waivers. The fee paid to the Sub-Transfer Agent is paid by the Transfer Agent, not by the Fund.
Trustees’ Compensation. The Fund has adopted an unfunded retirement plan (the “Plan”) for the Fund’s Independent Trustees. Benefits are based on years of service and fees paid to each Trustee during their period of service. The Plan was frozen with respect to adding new participants effective December 31, 2006 (the “Freeze Date”) and existing Plan Participants as of the Freeze Date will continue to receive accrued benefits under the Plan. Active Independent Trustees as of the Freeze Date have each elected a distribution method with respect to their benefits under the Plan. During the reporting period, the Fund’s projected benefit obligations, payments to retired Trustees and accumulated liability were as follows:
Projected Benefit Obligations Increased | $ | — | ||
Payments Made to Retired Trustees | 1,759 | |||
Accumulated Liability as of July 31, 2015 | 13,940 |
The Fund’s Board of Trustees (“Board”) has adopted a compensation deferral plan for Independent Trustees that enables Trustees to elect to defer receipt of all or a portion of the annual compensation they are entitled to receive from the Fund. For purposes of determining the amount owed to the Trustee under the plan, deferred amounts are treated as though equal dollar amounts had been invested in shares of the Fund or in other Oppenheimer funds selected by the Trustee. The Fund purchases shares of the funds selected for deferral by the Trustee in amounts equal to his or her deemed investment, resulting in a Fund asset equal to the deferred compensation liability. Such assets are included as a component of “Other” within the asset section of the Statement of Assets and Liabilities. Deferral of Trustees’ fees
76 OPPENHEIMER ROCHESTER LIMITED TERM CALIFORNIA MUNICIPAL FUND
7. Fees and Other Transactions with Affiliates (Continued)
under the plan will not affect the net assets of the Fund and will not materially affect the Fund’s assets, liabilities or net investment income per share. Amounts will be deferred until distributed in accordance with the compensation deferral plan.
Distribution and Service Plan (12b-1) Fees. Under its General Distributor’s Agreement with the Fund, OppenheimerFunds Distributor, Inc. (the “Distributor”) acts as the Fund’s principal underwriter in the continuous public offering of the Fund’s classes of shares.
Service Plan for Class A Shares. The Fund has adopted a Service Plan (the “Plan”) for Class A shares pursuant to Rule 12b-1 under the 1940 Act. Under the Plan, the Fund reimburses the Distributor for a portion of its costs incurred for services provided to accounts that hold Class A shares. Reimbursement is made periodically at an annual rate of up to 0.25% of the daily net assets of Class A shares of the Fund. The Distributor currently uses all of those fees to pay dealers, brokers, banks and other financial institutions periodically for providing personal service and maintenance of accounts of their customers that hold Class A shares. Any unreimbursed expenses the Distributor incurs with respect to Class A shares in any fiscal year cannot be recovered in subsequent periods. Fees incurred by the Fund under the Plan are detailed in the Statement of Operations.
Distribution and Service Plans for Class B and Class C Shares. The Fund has adopted Distribution and Service Plans (the “Plans”) for Class B and Class C shares pursuant to Rule 12b-1 under the 1940 Act to compensate the Distributor for distributing those share classes, maintaining accounts and providing shareholder services. Under the Plans, the Fund pays the Distributor an annual asset-based sales charge of 0.75% on Class B and Class C shares’ daily net assets. The Fund also pays a service fee under the Plans at an annual rate of 0.25% of daily net assets. The Plans continue in effect from year to year only if the Fund’s Board of Trustees votes annually to approve their continuance at an in person meeting called for that purpose. Fees incurred by the Fund under the Plans are detailed in the Statement of Operations.
Sales Charges. Front-end sales charges and CDSC do not represent expenses of the Fund. They are deducted from the proceeds of sales of Fund shares prior to investment or from redemption proceeds prior to remittance, as applicable. The sales charges retained by the Distributor from the sale of shares and the CDSC retained by the Distributor on the redemption of shares is shown in the following table for the period indicated.
| Year Ended | Class A Front-End Sales Charges Retained by Distributor | Class A Contingent Deferred Sales Charges Retained by Distributor | Class B Contingent Deferred Sales Charges Retained by Distributor | Class C Contingent Deferred Sales Charges Retained by Distributor | ||||||||||||
July 31, 2015 | $29,438 | $10,311 | $638 | $17,050 | ||||||||||||
77 OPPENHEIMER ROCHESTER LIMITED TERM CALIFORNIA MUNICIPAL FUND
NOTES TO FINANCIAL STATEMENTS Continued
8. Borrowings and Other Financing
Borrowings. The Fund can borrow money from banks in amounts up to one third of its total assets (including the amount borrowed) less all liabilities and indebtedness other than borrowings (meaning that the value of those assets must be at least 300% of the amount borrowed). The Fund can use those borrowings for investment-related purposes such as purchasing portfolio securities. The Fund also may borrow to meet redemption obligations or for temporary and emergency purposes. When the Fund invests borrowed money in portfolio securities, it is using a speculative investment technique known as leverage and changes in the value of the Fund’s investments will have a larger effect on its share price than if it did not borrow because of the effect of leverage.
The Fund can also use the borrowings for other investment-related purposes, including in connection with the Fund’s inverse floater investments as discussed in Note 4. The Fund may use the borrowings to reduce the leverage amount of, or unwind or “collapse” trusts that issued “inverse floaters” owned by the Fund, or in circumstances in which the Fund has entered into a shortfall and forbearance agreement with the sponsor of the inverse floater trust to meet the Fund’s obligation to reimburse the sponsor of the inverse floater for the difference between the liquidation value of the underlying bond and the amount due to holders of the short-term floating rate notes issued by the Trust. See the discussion in Note 4 (Inverse Floating Rate Securities) for additional information.
The Fund will pay interest and may pay other fees in connection with loans. If the Fund does borrow, it will be subject to greater expenses than funds that do not borrow. The interest on borrowed money and the other fees incurred in conjunction with loans are an expense that might reduce the Fund’s yield and return. Expenses incurred by the Fund with respect to interest on borrowings and commitment fees are disclosed separately or as other expenses on the Statement of Operations.
The Fund entered into a Revolving Credit and Security Agreement (the “Agreement”) with conduit lenders and Citibank N.A. which enables it to participate with certain other Oppenheimer funds in a committed, secured borrowing facility that permits borrowings of up to $2.5 billion, collectively, by the Oppenheimer Rochester Funds. To secure the loan, the Fund pledges investment securities in accordance with the terms of the Agreement. Securities held in collateralized accounts to cover these borrowings are noted in the Statement of Investments. Interest is charged to the Fund, based on its borrowings, at current commercial paper issuance rates (0.1925% at period end). The Fund pays additional fees monthly to its lender on its outstanding borrowings to manage and administer the facility and is allocated its pro-rata share of an annual structuring fee and ongoing commitment fees both of which are based on the total facility size. Total fees and interest that are included in expenses on the Fund’s Statement of Operations related to its participation in the borrowing facility during the reporting period equal 0.07% of the Fund’s average net assets on an annualized basis. The Fund has the right to prepay such loans and terminate its participation in the conduit loan facility at any time upon prior notice.
At period end, the Fund had borrowings outstanding at an interest rate of 0.1925%.
78 OPPENHEIMER ROCHESTER LIMITED TERM CALIFORNIA MUNICIPAL FUND
8. Borrowings and Other Financing (Continued)
Details of the borrowings for the reporting period are as follows:
Average Daily Loan Balance | $ | 2,776,164 | ||
Average Daily Interest Rate | 0.1690 | % | ||
Fees Paid | $ | 486,064 | ||
Interest Paid | $ | 2,548 |
Reverse Repurchase Agreements. The Fund may engage in reverse repurchase agreements. A reverse repurchase agreement is the sale of one or more securities to a counterparty at an agreed-upon purchase price with the simultaneous agreement to repurchase those securities on a future date at a higher repurchase price. The repurchase price represents the repayment of the purchase price and interest accrued thereon over the term of the repurchase agreement. The cash received by the Fund in connection with a reverse repurchase agreement may be used for investment-related purposes such as purchasing portfolio securities or for other purposes such as those described in the preceding “Borrowings” note.
The Fund entered into a Committed Repurchase Transaction Facility (the “Facility”) with J.P. Morgan Securities LLC (the “counterparty’) which enables it to participate with certain other Oppenheimer funds in a committed reverse repurchase agreement facility that permits aggregate outstanding reverse repurchase agreements of up to $750 million, collectively. Interest is charged to the Fund on the purchase price of outstanding reverse repurchase agreements at current LIBOR rates plus an applicable spread. The Fund is also allocated its pro-rata share of an annual structuring fee based on the total Facility size and ongoing commitment fees based on the total unused amount of the Facility. The Fund retains the economic exposure to fluctuations in the value of securities subject to reverse repurchase agreements under the Facility and therefore these transactions are considered secured borrowings for financial reporting purposes. The Fund also continues to receive the economic benefit of interest payments received on securities subject to reverse repurchase agreements, in the form of a direct payment from the counterparty. These payments are included in interest income on the Statement of Operations. Total fees and interest related to the Fund’s participation in the Facility during the reporting period are included in expenses on the Fund’s Statement of Operations and equal 0.02% of the Fund’s average net assets on an annualized basis.
The securities subject to reverse repurchase agreements under the Facility are valued on a daily basis. To the extent this value, after adjusting for certain margin requirements of the Facility, exceeds the cash proceeds received, the Fund may request the counterparty to return securities equal in margin value to this excess. To the extent that the cash proceeds received exceed the margin value of the securities subject to the transaction, the counterparty may request additional securities from the Fund. The Fund has the right to declare each Wednesday as the repurchase date for any outstanding reverse repurchase agreement upon delivery of advanced notification and may also recall any security subject to such a transaction by substituting eligible securities of equal or greater margin value according to the Facility’s terms.
The Fund executed no transactions under the Facility during the reporting period.
Fees Paid | $ | 148,996 |
79 OPPENHEIMER ROCHESTER LIMITED TERM CALIFORNIA MUNICIPAL FUND
NOTES TO FINANCIAL STATEMENTS Continued
9. Pending Litigation
In 2009, several putative class action lawsuits were filed and later consolidated before the U.S. District Court for the District of Colorado against OppenheimerFunds, Inc. (“OFI”), OppenheimerFunds Distributor, Inc. (“OFDI”), and Oppenheimer Rochester California Municipal Fund, a fund advised by OFI Global Asset Management, Inc. and distributed by the Distributor (the “Defendant Fund”), in connection with the Defendant Fund’s investment performance. The plaintiffs asserted claims against OFI, OFDI and certain present and former trustees and officers of the Defendant Fund under the federal securities laws, alleging, among other things, that the disclosure documents of the Defendant Fund contained misrepresentations and omissions and the investment policies of the Defendant Fund were not followed. Plaintiffs in the suit filed an amended complaint and defendants filed a motion to dismiss. In 2011, the court issued an order which granted in part and denied in part the defendants’ motion to dismiss. In 2012, plaintiffs filed a motion, which defendants opposed, to certify a class and appoint class representatives and class counsel. In March 2015, the court granted plaintiffs’ motion for class certification. In May 2015, the U.S. Court of Appeals for the Tenth Circuit vacated the class certification order and remanded the matter to the district court for further proceedings. In July 2015, the district court held an evidentiary hearing on plaintiffs’ motion for class certification.
OFI and OFDI believe the suit is without merit; that it is premature to render any opinion as to the likelihood of an outcome unfavorable to them in the suit; and that no estimate can yet be made as to the amount or range of any potential loss. Furthermore, OFI believes that the suit should not impair the ability of OFI or OFDI to perform their respective duties to the Fund and that the outcome of the suit should not have any material effect on the operations of any of the Oppenheimer funds.
80 OPPENHEIMER ROCHESTER LIMITED TERM CALIFORNIA MUNICIPAL FUND
REPORT OF INDEPENDENT REGISTERED PUBLIC ACCOUNTING FIRM
The Board of Trustees and Shareholders of Oppenheimer Rochester Limited Term California Municipal Fund:
We have audited the accompanying statement of assets and liabilities of Oppenheimer Rochester Limited Term California Municipal Fund, including the statement of investments, as of July 31, 2015, and the related statements of operations and cash flows for the year then ended, the statements of changes in net assets for each of the years in the two-year period then ended, and the financial highlights for each of the years or periods in the five-year period then ended. These financial statements and financial highlights are the responsibility of the Fund’s management. Our responsibility is to express an opinion on these financial statements and financial highlights based on our audits.
We conducted our audits in accordance with the standards of the Public Company Accounting Oversight Board (United States). Those standards require that we plan and perform the audit to obtain reasonable assurance about whether the financial statements and financial highlights are free of material misstatement. An audit includes examining, on a test basis, evidence supporting the amounts and disclosures in the financial statements. Our procedures included confirmation of securities owned as of July 31, 2015, by correspondence with the custodian and brokers, or by other appropriate auditing procedures where replies from brokers were not received. An audit also includes assessing the accounting principles used and significant estimates made by management, as well as evaluating the overall financial statement presentation. We believe that our audits provide a reasonable basis for our opinion.
In our opinion, the financial statements and financial highlights referred to above present fairly, in all material respects, the financial position of Oppenheimer Rochester Limited Term California Municipal Fund as of July 31, 2015, the results of its operations and cash flows for the year then ended, the changes in its net assets for each of the years in the two-year period then ended, and the financial highlights for each of the years or periods in the five-year period then ended, in conformity with U.S. generally accepted accounting principles.
KPMG LLP
Denver, Colorado
September 28, 2015
81 OPPENHEIMER ROCHESTER LIMITED TERM CALIFORNIA MUNICIPAL FUND
FEDERAL INCOME TAX INFORMATION Unaudited
In early 2015, if applicable, shareholders of record received information regarding all dividends and distributions paid to them by the Fund during calendar year 2014.
None of the dividends paid by the Fund during the reporting period are eligible for the corporate dividend-received deduction. 98.34% of the dividends were derived from interest on municipal bonds and are not subject to federal income taxes. To the extent a shareholder is subject to any state or local tax laws, some or all of the dividends received may be taxable.
The foregoing information is presented to assist shareholders in reporting distributions received from the Fund to the Internal Revenue Service. Because of the complexity of the federal regulations which may affect your individual tax return and the many variations in state and local tax regulations, we recommend that you consult your tax advisor for specific guidance.
82 OPPENHEIMER ROCHESTER LIMITED TERM CALIFORNIA MUNICIPAL FUND
PORTFOLIO PROXY VOTING POLICIES AND PROCEDURES;
UPDATES TO STATEMENTS OF INVESTMENTS Unaudited
The Fund has adopted Portfolio Proxy Voting Policies and Procedures under which the Fund votes proxies relating to securities (“portfolio proxies”) held by the Fund. A description of the Fund’s Portfolio Proxy Voting Policies and Procedures is available (i) without charge, upon request, by calling the Fund toll-free at 1.800.CALL OPP (225.5677), (ii) on the Fund’s website at www.oppenheimerfunds.com, and (iii) on the SEC’s website at www.sec.gov. In addition, the Fund is required to file Form N-PX, with its complete proxy voting record for the 12 months ended June 30th, no later than August 31st of each year. The Fund’s voting record is available (i) without charge, upon request, by calling the Fund toll-free at 1.800.CALL OPP (225.5677), and (ii) in the Form N-PX filing on the SEC’s website at www.sec.gov.
The Fund files its complete schedule of portfolio holdings with the SEC for the first quarter and the third quarter of each fiscal year on Form N-Q. The Fund’s Form N-Q filings are available on the SEC’s website at www.sec.gov. Those forms may be reviewed and copied at the SEC’s Public Reference Room in Washington, D.C. Information on the operation of the Public Reference Room may be obtained by calling 1-800-SEC-0330.
Householding—Delivery of Shareholder Documents
This is to inform you about OppenheimerFunds’ “householding” policy. If more than one member of your household maintains an account in a particular fund, OppenheimerFunds will mail only one copy of the fund’s prospectus (or, if available, the fund’s summary prospectus), annual and semiannual report and privacy policy. The consolidation of these mailings, called householding, benefits your fund through reduced mailing expense, and benefits you by reducing the volume of mail you receive from OppenheimerFunds. Householding does not affect the delivery of your account statements.
Please note that we will continue to household these mailings for as long as you remain an OppenheimerFunds shareholder, unless you request otherwise. If you prefer to receive multiple copies of these materials, please call us at 1.800.CALL-OPP (225-5677). You may also notify us in writing or via email. We will begin sending you individual copies of the prospectus (or, if available, the summary prospectus), reports and privacy policy within 30 days of receiving your request to stop householding.
83 OPPENHEIMER ROCHESTER LIMITED TERM CALIFORNIA MUNICIPAL FUND
TRUSTEES AND OFFICERS Unaudited
| Name, Position(s) Held with the Fund, Length of Service, Year of Birth | Principal Occupation(s) During the Past 5 Years; Other Trusteeships/Directorships Held; Number of Portfolios in the Fund Complex Currently Overseen | |
INDEPENDENT TRUSTEES | The address of each Trustee in the chart below is 6803 S. Tucson Way, Centennial, Colorado 80112-3924. Each Trustee serves for an indefinite term, or until his or her resignation, retirement, death or removal. | |
Brian F. Wruble, Chairman of the Board of | Director and Vice Chairman of Community Foundation of the Florida Keys (non-profit) (since July 2012); Trustee of the Board of Trustees, The Jackson Laboratory (non-profit) (1991-2011 and since May 2014); Chairman Emeritus (since August 2011) of The Jackson Laboratory (non-profit); Director of Special Value Opportunities Fund, LLC (registered investment company) (affiliate of the Sub-Adviser’s parent company) (since September 2004); Member of Zurich Insurance Group’s Investment Management Advisory Council (insurance) (since 2004); Treasurer (since 2007) and Trustee of the Institute for Advanced Study (non-profit educational institute) (since May 1992); General Partner of Odyssey Partners, L.P. (hedge fund) (September 1995-December 2007); Special Limited Partner of Odyssey Investment Partners, LLC (private equity investment) (January 1999-September 2004). Oversees 53 portfolios in the OppenheimerFunds complex. Mr. Wruble has served on the Boards of certain Oppenheimer funds since April 2001, during which time he has become familiar with the Fund’s (and other Oppenheimer funds’) financial, accounting, regulatory and investment matters and has contributed to the Boards’ deliberations. | |
David K. Downes, Trustee (since 2007) | Director of THL Credit Inc. (since June 2009); Chief Executive Officer and Board Member of Community Capital Management (investment management company) (since January 2004); President of The Community Reinvestment Act Qualified Investment Fund (investment management company) (since 2004); Director of Actua Corporation (information technology company) (since October 2003); formerly, Independent Chairman GSK Employee Benefit Trust (April 2006- June 2013); Director of Correctnet (January 2006-2007); Independent Chairman of the Board of Trustees of Quaker Investment Trust (registered investment company) (2004-2007); Chief Operating Officer and Chief Financial Officer of Lincoln National Investment Companies, Inc. (subsidiary of Lincoln National Corporation, a publicly traded company) and Delaware Investments U.S., Inc. (investment management subsidiary of Lincoln National Corporation) (1993- 2003); President, Chief Executive Officer and Trustee of Delaware Investment Family of Funds (1993-2003); President and Board Member of Lincoln National Convertible Securities Funds, Inc. and the Lincoln National Income Funds, TDC (1993-2003); Chairman and Chief Executive Officer of Retirement Financial Services, Inc. (registered transfer agent and investment adviser and subsidiary of Delaware Investments U.S., Inc.) (1993-2003); President and Chief Executive Officer of Delaware Service Company, Inc. (1995-2003); Chief Administrative Officer, Chief Financial Officer, Vice Chairman and Director of Equitable Capital Management Corporation (investment subsidiary of Equitable Life Assurance Society) (1985-1992); Corporate Controller of Merrill Lynch Company (financial services holding company) (1977-1985); held the following positions at the Colonial Penn Group, Inc. (insurance company): Corporate Budget Director (1974-1977), Assistant Treasurer (1972-1974) and Director of Corporate Taxes (1969-1972); held the following positions at Price Waterhouse Company (financial services firm): Tax Manager (1967-1969), Tax Senior (1965-1967) and Staff Accountant (1963-1965); United States Marine Corps (1957-1959). | |
84 OPPENHEIMER ROCHESTER LIMITED TERM CALIFORNIA MUNICIPAL FUND
David K. Downes, Continued | Oversees 53 portfolios in the OppenheimerFunds complex. Mr. Downes has served on the Boards of certain Oppenheimer funds since December 2005, during which time he has become familiar with the Fund’s (and other Oppenheimer funds’) financial, accounting, regulatory and investment matters and has contributed to the Boards’ deliberations. | |
Matthew P. Fink, Trustee (since 2005) Year of Birth: 1941 | Trustee of the Committee for Economic Development (policy research foundation) (2005-2011); Director of ICI Education Foundation (education foundation) (October 1991-August 2006); President of the Investment Company Institute (trade association) (October 1991-June 2004); Director of ICI Mutual Insurance Company (insurance company) (October 1991-June 2004); Author of The Rise of Mutual Funds: An Insider’s View published by Oxford University Press (second edition 2010). Oversees 53 portfolios in the OppenheimerFunds complex. Mr. Fink has served on the Boards of certain Oppenheimer funds since January 2005, during which time he has become familiar with the Fund’s (and other Oppenheimer funds’) financial, accounting, regulatory and investment matters and has contributed to the Boards’ deliberations. | |
Edmund P. Giambastiani, Jr., Trustee (since 2013) Year of Birth: 1948 | Advisory Board Member of the Maxwell School of Citizenship and Public Affairs of Syracuse University (since April 2012); Director of Mercury Defense Systems Inc. (information technology) (August 2011-February 2013); Trustee of the U.S. Naval Academy Foundation (since November 2010); Advisory Board Member of the Massachusetts Institute of Technology Lincoln Laboratory (federally-funded research development center) (since May 2010); Director of The Boeing Company (aerospace and defense) (since October 2009); Trustee of MITRE Corporation (federally-funded research development center) (since September 2008); Independent Director of QinetiQ Group Plc (defense technology and security) (February 2008-August 2011); Director of Monster Worldwide, Inc. (on-line career services) (since January 2008, Lead Director since June 2011); Chairman of Alenia North America, Inc. (military and defense products) (January 2008-October 2009); Director of SRA International, Inc. (information technology and services) (January 2008-July 2011); President of Giambastiani Group LLC (national security and energy consulting) (since October 2007); United States Navy, career nuclear submarine officer (June 1970-October 2007), Vice Chairman of the Joint Chiefs of Staff (2005-October 2007), Supreme Allied Commander of NATO Commander Transformation (2003-2005), Commander, U.S. Joint Forces Command (2002-2005). Since his retirement from the U.S. Navy in October 2007, Admiral Giambastiani has also served on numerous U.S. Government advisory boards, investigations and task forces for the Secretaries of Defense, State and Interior and the Central Intelligence Agency. Oversees 53 portfolios in the OppenheimerFunds complex. Admiral Giambastiani has served on the Boards of certain Oppenheimer funds since February 2013, including as an Advisory Board Member for certain Oppenheimer funds, during which time he has become familiar with the Fund’s (and other Oppenheimer funds’) financial, accounting, regulatory and investment matters and has contributed to the Boards’ deliberations. For purposes of this report, Admiral Giambastiani is identified as a Trustee. | |
Elizabeth Krentzman, Trustee (since 2014) Year of Birth: 1959 | Advisory Board Member of the Securities and Exchange Commission Historical Society (since 2007); held the following positions at Deloitte & Touche LLP: Principal and Chief Regulatory Advisor for Asset Management Services (2007-2014) and U.S. Mutual Fund Leader (2011-2014); General Counsel of the Investment Company Institute (trade association) (June 2004-April 2007); held | |
85 OPPENHEIMER ROCHESTER LIMITED TERM CALIFORNIA MUNICIPAL FUND
TRUSTEES AND OFFICERS Unaudited
Elizabeth Krentzman, Continued | the following positions at Deloitte & Touche LLP: National Director of the Investment Management Regulatory Consulting Practice (1997-2004), Principal (2003-2004), Director (1998-2003) and Senior Manager (1997-1998); Assistant Director of the Division of Investment Management-Office of Disclosure and Investment Adviser Regulation (1996-1997) and various positions with the Division of Investment Management – Office of Regulatory Policy (1991-1996) of the U.S. Securities and Exchange Commission; Associate at Ropes & Gray (1987-1991); former Chair of the Investment Management Subcommittee of the Washington, D.C. Bar. Oversees 53 portfolios in the OppenheimerFunds complex. Ms. Krentzman has served on the Boards of certain Oppenheimer funds since August 2014, during which time she has become familiar with the Fund’s (and other Oppenheimer funds’) financial, accounting, regulatory and investment matters and has contributed to the Boards’ deliberations. | |
Mary F. Miller, Trustee (since 2005) Year of Birth: 1942 | Trustee of International House (not-for-profit) (since June 2007); Trustee of the American Symphony Orchestra (not-for-profit) (October 1998-November 2011); and Senior Vice President and General Auditor of American Express Company (financial services company) (July 1998-February 2003). Oversees 53 portfolios in the OppenheimerFunds complex. Ms. Miller has served on the Boards of certain Oppenheimer funds since August 2004, during which time she has become familiar with the Fund’s (and other Oppenheimer funds’) financial, accounting, regulatory and investment matters and has contributed to the Boards’ deliberations. | |
Joel W. Motley, Trustee (since 2005) Year of Birth: 1952 | Director of Greenwall Foundation (since October 2013); Member of the Vestry of Trinity Wall Street (since April 2012); Director of Southern Africa Legal Services Foundation (since March 2012); Board Member of Pulitzer Center for Crisis Reporting (non-profit journalism) (since March 2011); Managing Director of Public Capital Advisors, LLC (privately-held financial advisor) (since January 2006); Managing Director of Carmona Motley, Inc. (privately-held financial advisor) (since January 2002); Director of Columbia Equity Financial Corp. (privately-held financial advisor) (2002-2007); Managing Director of Carmona Motley Hoffman Inc. (privately-held financial advisor) (January 1998-December 2001); Member of the Finance and Budget Committee of the Council on Foreign Relations, Member of the Investment Committee and Board of Human Rights Watch (since July 2000) and Member of the Investment Committee and Board of Historic Hudson Valley (since February 2010). Oversees 53 portfolios in the OppenheimerFunds complex. Mr. Motley has served on the Boards of certain Oppenheimer funds since October 2002, during which time he has become familiar with the Fund’s (and other Oppenheimer funds’) financial, accounting, regulatory and investment matters and has contributed to the Boards’ deliberations. | |
Joanne Pace, Trustee (since 2012) Year of Birth: 1958 | Board Director of Horizon Blue Cross Blue Shield of New Jersey (since November 2012); Advisory Board Director of The Alberleen Group LLC (since March, 2012); Advisory Council Member of 100 Women in Hedge Funds (non-profit) (since December, 2012); Advisory Council Member of Morgan Stanley Children’s Hospital (non-profit) (since May, 2012); Board Director of The Komera Project (non-profit) (since April, 2012); Advisory Board Director of The Agile Trading Group LLC (2012-2013); New York Advisory Board Director of Peace First (non-profit) (2010-2013); Senior Advisor of SECOR Asset Management, LP (2010- 2011); Managing Director and Chief Operating Officer of Morgan Stanley | |
86 OPPENHEIMER ROCHESTER LIMITED TERM CALIFORNIA MUNICIPAL FUND
Joanne Pace, Continued | Investment Management (2006-2010); Partner and Chief Operating Officer of FrontPoint Partners, LLC (hedge fund) (2005-2006); held the following positions at Credit Suisse: Managing Director (2003-2005); Global Head of Human Resources and member of Executive Board and Operating Committee (2004- 2005), Global Head of Operations and Product Control (2003-2004); held the following positions at Morgan Stanley: Managing Director (1997-2003), Controller and Principal Accounting Officer (1999-2003); Chief Financial Officer (temporary assignment) for the Oversight Committee, Long Term Capital Management (1998-1999). Lead Independent Director and Chair of the Audit and Nominating Committee of The Global Chartist Fund, LLC of Oppenheimer Asset Management (2011-2012); Board Director of Managed Funds Association (2008-2010); Board Director of Morgan Stanley Foundation (2007-2010) and Investment Committee Chair (2008-2010). Oversees 53 portfolios in the OppenheimerFunds complex. Ms. Pace has served on the Boards of certain Oppenheimer funds since November 2012, including as an Advisory Board Member for certain Oppenheimer funds, during which time she has become familiar with the Fund’s (and other Oppenheimer funds’) financial, accounting, regulatory and investment matters and has contributed to the Board’s deliberations. For purposes of this report, Ms. Pace is identified as a Trustee. | |
Daniel Vandivort, Trustee (since 2014) Year of Birth: 1954 | Chairman and Lead Independent Director/Trustee (March 2010-September 2014), Chairman of the Audit Committee (March 2009-September 2014) and Director/Trustee (December 2008-September 2014) of the Board of Directors/Trustees of Value Line Funds; Trustee, Board of Trustees of Huntington Disease Foundation of America (June 2007-December 2013): Trustee, Board of Trustees, RIM Retirement Savings Plan (2005-2007); President and Chief Investment Officer, Robeco Investment Management, formerly known as Weiss Peck and Greer (January 2005-June 2007); Member, Management Committee of Robeco Investment Management (2001-2007); Chairman and Trustee of the Board of Trustees of Weiss, Peck and Greer Funds (2004-2005); Managing Director and Head of Fixed Income, Weiss, Peck and Greer (November 1994- January 2005); Managing Director and Head of Fixed Income, CS First Boston Investment Management (January 1992-November 1994); Director, Global Product Development, First Boston Asset Management (November 1989-January 1992); Vice President, Fixed Income Sales, First Boston Corp. (May 1984- November 1989). Oversees 53 portfolios in the OppenheimerFunds complex. Mr. Vandivort has served on the Boards of certain Oppenheimer funds since 2014, during which time he has become familiar with the Fund’s (and other Oppenheimer funds’) financial, accounting, regulatory and investment matters and has contributed to the Boards’ deliberations. | |
| ||
INTERESTED TRUSTEES | Mr. Glavin is an “Interested Trustee” because he is affiliated with the Manager and the Sub-Adviser by virtue of his positions as director of the Sub-Adviser, and as a shareholder of the Sub-Adviser’s parent company. As a Trustee, he serves for an indefinite term, or until his resignation, retirement, death or removal. Mr. Glavin’s address is 225 Liberty Street, New York, New York 10281-1008.
Mr. Steinmetz is an “Interested Trustee” because he is affiliated with the Manager and the Sub-Adviser by virtue of his positions as Chairman of the Sub- Adviser and officer and director of the Manager. Both as a Trustee and as an officer, Mr. Steinmetz serves for an indefinite term, or until his resignation, retirement, death or removal. Mr. Steinmetz’s address is 225 Liberty Street, New York, New York 10281-1008. | |
87 OPPENHEIMER ROCHESTER LIMITED TERM CALIFORNIA MUNICIPAL FUND
TRUSTEES AND OFFICERS Unaudited
William F. Glavin, Jr., Trustee (since 2009) Year of Birth: 1958 | Chairman of the Sub-Adviser (July 2014 -December 2014 and December 2009- December 2012) and Director of the Sub-Adviser (since January 2009); Chairman, Director and Chief Executive Officer (January 2013-June 2014) of the Manager; President of the Manager (January 2013-May 2013); Chief Executive Officer (January 2009-December 2012); President of the Sub-Adviser (May 2009- December 2012); Management Director (June 2009-June 2014), President (December 2009-June 2014) and Chief Executive Officer (January 2011-June 2014) of Oppenheimer Acquisition Corp. (“OAC”) (the Sub-Adviser’s parent holding company); Director of Oppenheimer Real Asset Management, Inc. (March 2010-June 2014); Executive Vice President (March 2006-February 2009) and Chief Operating Officer (July 2007-February 2009) of Massachusetts Mutual Life Insurance Company (OAC’s parent company); Director (May 2004-March 2006) and Chief Operating Officer and Chief Compliance Officer (May 2004- January 2005), President (January 2005-March 2006) and Chief Executive Officer (June 2005-March 2006) of Babson Capital Management LLC; Director (March 2005-March 2006), President (May 2003-March 2006) and Chief Compliance Officer (July 2005-March 2006) of Babson Capital Securities, Inc. (a broker-dealer); President (May 2003-March 2006) of Babson Investment Company, Inc.; Director (May 2004-August 2006) of Babson Capital Europe Limited; Director (May 2004-October 2006) of Babson Capital Guernsey Limited; Director (May 2004-March 2006) of Babson Capital Management LLC; Non- Executive Director (March 2005-March 2007) of Baring Asset Management Limited; Director (February 2005-June 2006) Baring Pension Trustees Limited; Director and Treasurer (December 2003-November 2006) of Charter Oak Capital Management, Inc.; Director (May 2006-September 2006) of C.M. Benefit Insurance Company; Director (May 2008-June 2009) and Executive Vice President (June 2007-July 2009) of C.M. Life Insurance Company; President (March 2006-May 2007) of MassMutual Assignment Company; Director (January 2005-December 2006), Deputy Chairman (March 2005-December 2006) and President (February 2005-March 2005) of MassMutual Holdings (Bermuda) Limited; Director (May 2008-June 2009) and Executive Vice President (June 2007-July 2009) of MML Bay State Life Insurance Company; Chief Executive Officer and President (April 2007-January 2009) of MML Distributors, LLC; and Chairman (March 2006-December 2008) and Chief Executive Officer (May 2007- December 2008) of MML Investors Services, Inc. An officer of 91 portfolios in the OppenheimerFunds complex. Mr. Glavin has served on the Boards of certain Oppenheimer funds since December 2009, during which time he has become familiar with the Fund’s (and other Oppenheimer funds’) financial, accounting, regulatory and investment matters and has contributed to the Boards’ deliberations. | |
Arthur P. Steinmetz, Trustee (since 2015), President and Principal Executive Officer (since 2014) Year of Birth: 1958 | Chairman of the Sub-Adviser (since January 2015); CEO and Chairman of the Manager (since July 2014), President of the Manager (since May 2013), a Director of the Manager (since January 2013), Director of the Sub-Adviser (since July 2014), President, Management Director and CEO of Oppenheimer Acquisition Corp. (the Sub-Adviser’s parent holding company) (since July 2014), and President and Director of OFI SteelPath, Inc. (since January 2013). Chief Investment Officer of the OppenheimerFunds advisory entities from (January 2013-December 2013); Executive Vice President of the Manager (January 2013- May 2013); Chief Investment Officer of the Sub-Adviser (October 2010- December 2012); Chief Investment Officer, Fixed-Income, of the Sub-Adviser (April 2009-October 2010); Executive Vice President of the Sub-Adviser (October | |
88 OPPENHEIMER ROCHESTER LIMITED TERM CALIFORNIA MUNICIPAL FUND
Arthur P. Steinmetz, Continued | 2009-December 2012); Director of Fixed Income of the Sub-Adviser (January 2009-April 2009); and a Senior Vice President of the Sub-Adviser (March 1993- September 2009). An officer of 91 portfolios in the OppenheimerFunds complex. | |
| ||
OFFICERS OF THE FUND | The addresses of the Officers in the chart below are as follows: for Messrs. Loughran, Cottier, Willis, DeMitry, Camarella, Pulire, Stein, Gabinet, Mss. Sexton and Picciotto, 225 Liberty Street, New York, New York 10281-1008, for Mr. Wixted, 6803 S. Tucson Way, Centennial, Colorado 80112-3924. Each Officer serves for an indefinite term or until his or her resignation, retirement, death or removal. | |
Daniel G. Loughran, Vice President (since 2005) Year of Birth: 1963 | Senior Vice President of the Sub-Adviser (since July 2007) and a Senior Portfolio Manager (since December 2001); Vice President of the Sub-Adviser (April 2001- June 2007) and a Portfolio Manager with the Sub-Adviser (December 1999- November 2001). Team Leader, a Senior Portfolio Manager, an officer and a trader for the Fund and other Oppenheimer funds. | |
Scott S. Cottier, Vice President (since 2005) Year of Birth: 1971 | Vice President of the Sub-Adviser and a Senior Portfolio Manager (since September 2002). Portfolio Manager and trader at Victory Capital Management (1999-2002). Senior Portfolio Manager, an officer and a trader for the Fund and other Oppenheimer funds. | |
Troy E. Willis, Vice President (since 2005) Year of Birth: 1972 | Vice President of the Sub-Adviser (since July 2009) and a Senior Portfolio Manager (since January 2006); Assistant Vice President of the Sub-Adviser (July 2005-June 2009). Portfolio Manager of the Sub-Adviser (June 2002-December 2005). Corporate Attorney for Southern Resource Group (June 1999-July 2001). Senior Portfolio Manager, an officer and a trader for the Fund and other Oppenheimer funds. | |
Mark R. DeMitry, Vice President (since 2009) Year of Birth: 1976 | Vice President of the Sub-Adviser and a Senior Portfolio Manager (since July 2009); Associate Portfolio Manager of the Fund (September 2006- June 2009). Research Analyst of the Sub-Adviser (June 2003-September 2006) and a Credit Analyst of the Sub-Adviser (July 2001-May 2003). Senior Portfolio Manager, an officer and a trader for the Fund and other Oppenheimer funds. | |
Michael L. Camarella, Vice President (since 2009) Year of Birth: 1976 | Vice President of the Sub-Adviser and a Senior Portfolio Manager (since January 2011); Assistant Vice President of the Sub-Adviser (July 2009-December 2010); Associate Portfolio Manager of the Sub-Adviser (January 2008-December 2010). Research Analyst of the Sub-Adviser (April 2006-December 2007) and a Credit Analyst of the Sub-Adviser (June 2003-March 2006). Senior Portfolio Manager, an officer and a trader for the Fund and other Oppenheimer funds. | |
Charles S. Pulire, Vice President (since 2011) Year of Birth: 1977 | Vice President of the Sub-Adviser and a Senior Portfolio Manager (since February 2013); Assistant Vice President of the Sub-Adviser (December 2010-January 2013); Research Analyst of the Manager (February 2008-November 2010); Credit Analyst of the Sub-Adviser (May 2006-January 2008). Senior Portfolio Manager, an officer and a trader for the Fund and other Oppenheimer funds. | |
Richard A. Stein, Vice President (since 2007) Year of Birth: 1957 | Director of the Rochester Credit Analysis team (since March 2004); Senior Vice President of the Sub-Adviser (since June 2011) and a Vice President of the Sub- Adviser (November 1997-May 2011); heads up the Rochester Credit Analysis team (since May 1993). | |
89 OPPENHEIMER ROCHESTER LIMITED TERM CALIFORNIA MUNICIPAL FUND
TRUSTEES AND OFFICERS Unaudited
Arthur S. Gabinet, Secretary and Chief Legal Officer (since 2011) Year of Birth: 1958 | Executive Vice President, Secretary and General Counsel of the Manager (since January 2013); General Counsel OFI SteelPath, Inc. (since January 2013); Executive Vice President (May 2010-December 2012) and General Counsel (since January 2011) of the Sub-Adviser; General Counsel of the Distributor (since January 2011); General Counsel of Centennial Asset Management Corporation (January 2011-December 2012); Executive Vice President (January 2011-December 2012) and General Counsel of HarbourView Asset Management Corporation (since January 2011); Assistant Secretary (since January 2011) and Director (since January 2011) of OppenheimerFunds International Ltd. and OppenheimerFunds plc; Director of Oppenheimer Real Asset Management, Inc. (January 2011-December 2012) and General Counsel (since January 2011); Executive Vice President (January 2011-December 2011) and General Counsel of Shareholder Financial Services, Inc. and Shareholder Services, Inc. (since January 2011); Executive Vice President (January 2011-December 2012) and General Counsel of OFI Private Investments Inc. (since January 2011); Vice President of OppenheimerFunds Legacy Program (January 2011-December 2011); Executive Vice President (January 2011-December 2012) and General Counsel of OFI Institutional Asset Management, Inc. (since January 2011); General Counsel, Asset Management of the Sub-Adviser (May 2010-December 2010); Principal, The Vanguard Group (November 2005-April 2010); District Administrator, U.S. Securities and Exchange Commission (January 2003-October 2005). An officer of 91 portfolios in the OppenheimerFunds complex. | |
Jennifer Sexton, Vice President and Chief Business Officer (since 2014) Year of Birth: 1969 | Senior Vice President of OppenheimerFunds Distributor, Inc. (since June 2014); Vice President of OppenheimerFunds Distributor, Inc. (April 2006-June 2014); Vice President of the Sub-Adviser (January 1998-March 2006); Assistant Vice President of the Sub-Adviser (October 1991-December 1998). An officer of 91 portfolios in the OppenheimerFunds complex. | |
Mary Ann Picciotto, Chief Compliance Officer and Chief Anti-Money Laundering Officer (since 2014) Year of Birth: 1973 | Senior Vice President and Chief Compliance Officer of the Manager (since March 2014); Chief Compliance Officer of the Sub-Adviser, OFI SteelPath, Inc., OFI Global Trust Company, OFI Global Institutional, Inc., Oppenheimer Real Asset Management, Inc., OFI Private Investments, Inc., Harborview Asset Management Corporation, Trinity Investment Management Corporation, and Shareholder Services, Inc. (since March 2014); Managing Director of Morgan Stanley Investment Management Inc. and certain of its various affiliated entities; Chief Compliance Officer of various Morgan Stanley Funds (May 2010-January 2014); Chief Compliance Officer of Morgan Stanley Investment Management Inc. (April 2007-January 2014). An officer of 91 portfolios in the OppenheimerFunds complex. | |
Brian W. Wixted, Treasurer and Principal Financial & Accounting Officer (since 2007) Year of Birth: 1959 | Senior Vice President of the Manager (since January 2013); Treasurer of the Sub-Adviser, HarbourView Asset Management Corporation, Shareholder Financial Services, Inc., Shareholder Services, Inc., and Oppenheimer Real Asset Management, Inc. (March 1999-June 2008), OFI Private Investments, Inc. (March 2000-June 2008), OppenheimerFunds International Ltd. and OppenheimerFunds plc (since May 2000), OFI Institutional Asset Management, Inc. (November 2000-June 2008), and OppenheimerFunds Legacy Program (charitable trust program established by the Sub-Adviser) (June 2003-December 2011); Treasurer and Chief Financial Officer of OFI Trust Company (since May 2000); Assistant Treasurer of Oppenheimer Acquisition Corporation (March 1999-June 2008). An officer of 91 portfolios in the OppenheimerFunds complex. | |
90 OPPENHEIMER ROCHESTER LIMITED TERM CALIFORNIA MUNICIPAL FUND
The Fund’s Statement of Additional Information contains additional information about the Fund’s Trustees and Officers and is available without charge upon request, by calling 1.800.CALL OPP (225.5677).
91 OPPENHEIMER ROCHESTER LIMITED TERM CALIFORNIA MUNICIPAL FUND
OPPENHEIMER ROCHESTER LIMITED TERM
CALIFORNIA MUNICIPAL FUND
| Manager | OFI Global Asset Management, Inc. | |
| Sub-Adviser | OppenheimerFunds, Inc. | |
| Distributor | OppenheimerFunds Distributor, Inc. | |
Transfer and Shareholder Servicing Agent | OFI Global Asset Management, Inc. | |
| Sub-Transfer Agent | Shareholder Services, Inc. DBA OppenheimerFunds Services | |
Independent Registered Public Accounting Firm | KPMG LLP | |
| Legal Counsel | Kramer Levin Naftalis & Frankel LLP |
© 2015 OppenheimerFunds, Inc. All rights reserved.
92 OPPENHEIMER ROCHESTER LIMITED TERM CALIFORNIA MUNICIPAL FUND
As an Oppenheimer fund shareholder, you are entitled to know how we protect your personal information and how we limit its disclosure.
Information Sources
We obtain nonpublic personal information about our shareholders from the following sources:
| ● | Applications or other forms |
| ● | When you create a user ID and password for online account access |
| ● | When you enroll in eDocs Direct, our electronic document delivery service |
| ● | Your transactions with us, our affiliates or others |
| ● | A software program on our website, often referred to as a “cookie,” which indicates which parts of our site you’ve visited |
| ● | When you set up challenge questions to reset your password online |
If you visit oppenheimerfunds.com and do not log on to the secure account information areas, we do not obtain any personal information about you. When you do log on to a secure area, we do obtain your user ID and password to identify you. We also use this information to provide you with products and services you have requested, to inform you about products and services that you may be interested in and assist you in other ways.
We do not collect personal information through our website unless you willingly provide it to us, either directly by email or in those areas of the website that request information. In order to update your personal information (including your mailing address, email address and phone number) you must first log on and visit your user profile.
If you have set your browser to warn you before accepting cookies, you will receive the warning message with each cookie. You can refuse cookies by turning them off in your browser. However, doing so may limit your access to certain sections of our website.
We use cookies to help us improve and manage our website. For example, cookies help us recognize new versus repeat visitors to the site, track the pages visited, and enable some special features on the website. This data helps us provide a better service for our website visitors.
Protection of Information
We do not disclose any non-public personal information (such as names on a customer list) about current or former customers to anyone, except as permitted by law.
Disclosure of Information
Copies of confirmations, account statements and other documents reporting activity in your fund accounts are made available to your financial advisor (as designated by you). We may also use details about you and your investments to help us, our financial service affiliates, or firms that jointly market their financial products and services with ours, to better serve your investment needs or suggest financial services or educational material that may be of interest to you. If this requires us to provide you with an opportunity to “opt in” or “opt out” of such information sharing with a firm not affiliated with us, you will receive notification on how to do so, before any such sharing takes place.
Right of Refusal
We will not disclose your personal information to unaffiliated third parties (except as permitted by law), unless we first offer you a reasonable opportunity to refuse or “opt out” of such disclosure.
93 OPPENHEIMER ROCHESTER LIMITED TERM CALIFORNIA MUNICIPAL FUND
PRIVACY POLICY NOTICE Continued
Internet Security and Encryption
In general, the email services provided by our website are encrypted and provide a secure and private means of communication with us. To protect your own privacy, confidential and/or personal information should only be communicated via email when you are advised that you are using a secure website. As a security measure, we do not include personal or account information in non-secure emails, and we advise you not to send such information to us in non-secure emails. Instead, you may take advantage of the secure features of our website to encrypt your email correspondence. To do this, you will need to use a browser that supports Secure Sockets Layer (SSL) protocol.
We do not guarantee or warrant that any part of our website, including files available for download, are free of viruses or other harmful code. It is your responsibility to take appropriate precautions, such as use of an anti-virus software package, to protect your computer hardware and software.
| ● | All transactions, including redemptions, exchanges and purchases, are secured by SSL and 256-bit encryption. SSL is used to establish a secure connection between your PC and OppenheimerFunds’ server. It transmits information in an encrypted and scrambled format. |
| ● | Encryption is achieved through an electronic scrambling technology that uses a “key” to code and then decode the data. Encryption acts like the cable converter box you may have on your television set. It scrambles data with a secret code so that no one can make sense of it while it is being transmitted. When the data reaches its destination, the same software unscrambles the data. |
| ● | You can exit the secure area by either closing your browser, or for added security, you can use the Log Out button before you close your browser. |
Other Security Measures
We maintain physical, electronic and procedural safeguards to protect your personal account information. Our employees and agents have access to that information only so that they may offer you products or provide services, for example, when responding to your account questions.
How You Can Help
You can also do your part to keep your account information private and to prevent unauthorized transactions. If you obtain a user ID and password for your account, do not allow it to be used by anyone else. Also, take special precautions when accessing your account on a computer used by others.
Who We Are
This joint notice describes the privacy policies of the Oppenheimer funds, OppenheimerFunds, Inc., each of its investment adviser subsidiaries, OppenheimerFunds Distributor, Inc. and OFI Global Trust Co. It applies to all Oppenheimer fund accounts you presently have, or may open in the future, using your Social Security number—whether or not you remain a shareholder of our funds. This notice was last updated March 2015. In the event it is updated or changed, we will post an updated notice on our website at oppenheimerfunds.com. If you have any questions about this privacy policy, write to us at P.O. Box 5270, Denver, CO 80217-5270, email us by clicking on the Contact Us section of our website at oppenheimerfunds.com or call us at 1.800.CALL OPP (225.5677).
94 OPPENHEIMER ROCHESTER LIMITED TERM CALIFORNIA MUNICIPAL FUND
THIS PAGE INTENTIONALLY LEFT BLANK.
95 OPPENHEIMER ROCHESTER LIMITED TERM CALIFORNIA MUNICIPAL FUND

| Item 2. | Code of Ethics. |
The registrant has adopted a code of ethics that applies to the registrant’s principal executive officer, principal financial officer, principal accounting officer or controller or persons performing similar functions.
| Item 3. | Audit Committee Financial Expert. |
The Board of Trustees of the registrant has determined that David Downes, the Board’s Audit Committee Chairman, is an audit committee financial expert and that Mr. Downes is “independent” for purposes of this Item 3.
| Item 4. | Principal Accountant Fees and Services. |
| (a) | Audit Fees |
The principal accountant for the audit of the registrant’s annual financial statements billed $49,700 in fiscal 2015 and $42,300 in fiscal 2014.
| (b) | Audit-Related Fees |
The principal accountant for the audit of the registrant’s annual financial statements billed $2,500 in fiscal 2015 and $2,500 in fiscal 2014.
The principal accountant for the audit of the registrant’s annual financial statements billed $897,697 in fiscal 2015 and $727,131 in fiscal 2014 to the registrant’s investment adviser or any entity controlling, controlled by, or under common control with the adviser that provides ongoing services to the registrant.
Such services include: Internal control reviews, GIPS attestation procedures, reorganization, and system conversion testing
| (c) | Tax Fees |
The principal accountant for the audit of the registrant’s annual financial statements billed no such fees in fiscal 2015 and no such fees in fiscal 2014.
The principal accountant for the audit of the registrant’s annual financial statements billed $559,556 in fiscal 2015 and $202,044 in fiscal 2014 to the registrant’s investment adviser or any entity controlling, controlled by, or under common control with the adviser that provides ongoing services to the registrant.
Such services include: tax compliance, tax planning and tax advice. Tax compliance generally involves preparation of original and amended tax returns, claims for a refund and tax payment-planning services. Tax planning and tax advice includes assistance with tax audits and appeals, tax advice related to mergers and acquisitions and requests for rulings or technical advice from taxing authorities.
| (d) | All Other Fees |
The principal accountant for the audit of the registrant’s annual financial statements billed no such fees in fiscal 2015 and no such fees in fiscal 2014.
The principal accountant for the audit of the registrant’s annual financial statements billed no such fees in fiscal 2015 and no such fees in fiscal 2014 to the registrant’s investment adviser or any entity controlling, controlled by, or under common control with the adviser that provides ongoing services to the registrant.
Such fees would include the cost to the principal accountant of attending audit committee meetings and consultations regarding the registrant’s retirement plan with respect to its Trustees.
| (e) | (1) During its regularly scheduled periodic meetings, the registrant’s audit committee will pre-approve all audit, audit-related, tax and other services to be provided by the principal accountants of the registrant. |
The audit committee has delegated pre-approval authority to its Chairman for any subsequent new engagements that arise between regularly scheduled meeting dates provided that any fees such pre-approved are presented to the audit committee at its next regularly scheduled meeting.
Under applicable laws, pre-approval of non-audit services may be waived provided that: 1) the aggregate amount of all such services provided constitutes no more than five percent of the total amount of fees paid by the registrant to its principal accountant during the fiscal year in which services are provided 2) such services were not recognized by the registrant at the time of engagement as non-audit services and 3) such services are promptly brought to the attention of the audit committee of the registrant and approved prior to the completion of the audit.
(2) 0%
| (f) | Not applicable as less than 50%. |
| (g) | The principal accountant for the audit of the registrant’s annual financial statements billed $1,459,753 in fiscal 2015 and $931,675 in fiscal 2014 to the registrant and the registrant’s investment adviser or any entity controlling, controlled by, or under common control with the adviser that provides ongoing services to the registrant related to non-audit fees. Those billings did not include any prohibited non-audit services as defined by the Securities Exchange Act of 1934. |
| (h) | The registrant’s audit committee of the board of Trustees has considered whether the provision of non-audit services that were rendered to the registrant’s investment adviser, and any entity controlling, controlled by, or under common control with the investment adviser that provides ongoing services to the registrant that were not pre-approved pursuant to paragraph (c)(7)(ii) of Rule 2-01 of Regulation S-X is compatible with maintaining the principal accountant’s independence. No such services were rendered. |
| Item 5. | Audit Committee of Listed Registrants |
Not applicable.
| Item 6. | Schedule of Investments. |
a) Not applicable. The complete schedule of investments is included in Item 1 of this Form N-CSR.
b) Not applicable.
Item 7. Disclosure of Proxy Voting Policies and Procedures for Closed-End Management Investment Companies.
Not applicable.
| Item 8. | Portfolio Managers of Closed-End Management Investment Companies. |
Not applicable.
Item 9. Purchases of Equity Securities by Closed-End Management Investment Company and Affiliated Purchasers.
Not applicable.
| Item 10. | Submission of Matters to a Vote of Security Holders. |
The Fund’s Governance Committee Provisions with Respect to Nominations of Directors/Trustees to the Respective Boards
None
| Item 11. | Controls and Procedures. |
Based on their evaluation of the registrant’s disclosure controls and procedures (as defined in rule 30a-3(c) under the Investment Company Act of 1940 (17 CFR 270.30a-3(c)) as of 7/31/2015, the registrant’s principal executive officer and principal financial officer found the registrant’s disclosure controls and procedures to provide reasonable assurances that information required to be disclosed by the registrant in the reports that it files under the Securities Exchange Act of 1934 (a) is accumulated and communicated to registrant’s management, including its principal executive officer and principal financial officer, to allow timely decisions regarding required disclosure, and (b) is recorded, processed, summarized and reported, within the time periods specified in the rules and forms adopted by the U.S. Securities and Exchange Commission.
There have been no changes in the registrant’s internal controls over financial reporting that occurred during the registrant’s second fiscal quarter of the period covered by this report that
have materially affected, or are reasonably likely to materially affect, the registrant’s internal control over financial reporting.
| Item 12. | Exhibits. |
| (a) | (1) Exhibit attached hereto. |
(2) Exhibits attached hereto.
(3) Not applicable.
| (b) | Exhibit attached hereto. |
SIGNATURES
Pursuant to the requirements of the Securities Exchange Act of 1934 and the Investment Company Act of 1940, the registrant has duly caused this report to be signed on its behalf by the undersigned, thereunto duly authorized.
Oppenheimer Rochester Limited Term California Municipal Fund
| By: | /s/ Arthur P. Steinmetz | |
| Arthur P. Steinmetz | ||
| Principal Executive Officer | ||
| Date: | 9/9/2015 | |
Pursuant to the requirements of the Securities Exchange Act of 1934 and the Investment Company Act of 1940, this report has been signed below by the following persons on behalf of the registrant and in the capacities and on the dates indicated.
| By: | /s/ Arthur P. Steinmetz | |
| Arthur P. Steinmetz | ||
| Principal Executive Officer | ||
| Date: | 9/9/2015 | |
| By: | /s/ Brian W. Wixted | |
| Brian W. Wixted | ||
| Principal Financial Officer | ||
| Date: | 9/9/2015 | |