UNITED STATES
SECURITIES AND EXCHANGE COMMISSION
Washington, D.C. 20549
FORM N-CSR
CERTIFIED SHAREHOLDER REPORT OF REGISTERED MANAGEMENT
INVESTMENT COMPANIES
Investment Company Act file number 811-21475
RBC Funds Trust
(Exact name of registrant as specified in charter)
50 South Sixth Street, Suite 2350
Minneapolis, MN 55402
(Address of principal executive offices) (Zip code)
Jay Jackson, Esq.
50 South Sixth Street, Suite 2350
Minneapolis, MN 55402
(Name and address of agent for service)
Registrant’s telephone number, including area code: (612)-376-7132
Date of fiscal year end: March 31
Date of reporting period: March 31, 2016
Item 1. Reports to Stockholders.
The Report to Shareholders is attached herewith.
Annual Report
For the year ended March 31, 2016
RBC Emerging Markets Equity Fund
RBC Emerging Markets Small Cap Equity Fund
RBC Global Opportunities Fund
RBC International Opportunities Fund
RBC®
Global Asset Management
| ||||||||||||||
RBC Funds
| ||||||||||||||
About Your Annual Report |
This annual report includes detailed information about your Fund including financial statements, performance, and a complete list of its holdings. The RBC Funds compare their performance against various equity indices. Each of these indices is a widely recognized measure of return for the underlying category of securities. However, the indices are unmanaged, do not include fees, and cannot be invested in directly.
We hope the financial information presented will help you evaluate your investment in the RBC Funds. We also encourage you to read your Fund’s prospectus for further detail as to your Fund’s investment policies and risk profile. RBC Funds prospectuses and performance information subsequent to the date of this report are available on our website at www.rbcgam.us.
A description of the policies and procedures that your Fund uses to determine how to vote proxies relating to portfolio securities is available (i) without charge, upon request, by calling 1-800-422-2766; (ii) on the Fund’s website at www.rbcgam.us; and (iii) on the Securities and Exchange Commission’s (the “Commission”) website at http://www.sec.gov.
Information regarding how your Fund voted proxies relating to portfolio securities during the most recent 12-month period ended June 30 will be available (i) on the Fund’s website at www.rbcgam.us; and (ii) on the Commission’s website at http://www.sec.gov.
A schedule of each Fund’s portfolio holdings will be filed with the Commission for the first and third quarters of each fiscal year on Form N-Q. This information is available on the Commission’s website at http://www.sec.gov and may be reviewed and copied at the Commission’s Public Reference Room in Washington, D.C. Information on the operation of the Public Reference Room is available by calling 1-800-SEC-0330.
| |||||||||||||
Contents |
Letter from the Portfolio Manager of Emerging Market Equities | 1 | ||||||||||||
| Letter from the Portfolio Manager of Global Equities | 4 | |||||||||||||
| Portfolio Managers | 7 | |||||||||||||
| Performance Summary (Unaudited) | 8 | |||||||||||||
| Management Discussion and Analysis (Unaudited) | 10 | |||||||||||||
| - RBC Emerging Markets Equity Fund | 10 | |||||||||||||
| - RBC Emerging Markets Small Cap Equity Fund | 12 | |||||||||||||
| - RBC Global Opportunities Fund | 14 | |||||||||||||
| - RBC International Opportunities Fund | 16 | |||||||||||||
| �� | Schedules of Portfolio Investments | 18 | ||||||||||||
| Financial Statements | 33 | |||||||||||||
| - Statements of Assets and Liabilities | 33 | |||||||||||||
| - Statements of Operations | 35 | |||||||||||||
| - Statements of Changes in Net Assets | 36 | |||||||||||||
| Financial Highlights | 40 | |||||||||||||
| Notes to Financial Statements | 46 | |||||||||||||
| Report of Independent Registered Public Accounting Firm | 59 | |||||||||||||
| Other Federal Income Tax Information (Unaudited) | 60 | |||||||||||||
| Management (Unaudited) | 62 | |||||||||||||
| Share Class Information (Unaudited) | 65 | |||||||||||||
| Supplemental Information (Unaudited) | 66 | |||||||||||||
| ||||||||||||||
1
LETTER FROM THE PORTFOLIO MANAGER OF EMERGING MARKET EQUITIES
| ||||||||||||
Outlook | ||||||||||||
While it is too early to say whether commodity prices will sustain their rally, or even whether the Fed will revert to its tightening stance, we still maintain that the headwinds of 2015 should ease overall in 2016. | ||||||||||||
There were at least three inter-related headwinds that we spoke about as being responsible for negatively impacting EM performance: the Fed’s December rate hike and associated credit fears; China growth concerns; and weakness in overall EM earnings. In addition we have highlighted how commodity price performance has unduly impacted sentiment about the EM asset class. We stated that we believe that the negative impact for all of these headwinds would be reduced in 2016 and we have seen that, to some extent, some of these headwinds have already shown signs of easing in the first quarter of 2016.
| ||||||||||||
| As such, although the Funds have been predominantly driven by our bottom-up research, we see the environment for EM equities going into the second quarter of 2016, as supportive both relative to Developed Markets and compared to recent years’ performance. | ||||||||||||
| ||||||||||||
Phil Langham | ||||||||||||
Senior Portfolio Manager, Emerging Market Equities | ||||||||||||
RBC Global Asset Management (UK) Limited | ||||||||||||
The information provided herein represents the opinions of the Fund Managers and is not intended to be a forecast of future events, a guarantee of future results, nor investment advice. | ||||||||||||
Mutual fund investing involves risk. Principal loss is possible. The Funds invest in foreign securities which involve greater volatility and political, economic and currency risks and differences in accounting methods. These risks can be greater in emerging markets. There is a possibility that issuers of securities in which the Fund may invest may default on the payment of interest or principal on the securities when due, which would cause the Fund to lose money. Investing in small cap companies involves additional risks, including greater fluctuations in value and less liquidity than larger companies. These risks are more fully described in the prospectus. | ||||||||||||
| ||||||||||||

2
LETTER FROM THE PORTFOLIO MANAGER OF EMERGING MARKET EQUITIES
| ||||||
A Correlation coefficient is a measure of the interdependence of two random variables that ranges in value from -1 to +1, indicating perfect negative correlation at -1, absence of correlation at zero, and perfect positive correlation at +1. | ||||||
Must be proceeded or accompanied by a prospectus. | ||||||
Fund holdings and sector allocations are subject to change at any time and should not be considered recommendations to buy or sell any security. Please refer to the Schedule of Portfolio Investments in this report for a complete list of Fund holdings. | ||||||
|
3
4
LETTER FROM THE PORTFOLIO MANAGER OF GLOBAL EQUITIES
| ||||||
landmark initiative to build a manufacturing plant in China and suggestions it will be the sole supplier of processors to Apple for its next iteration of the iPhone. | ||||||
Canadian oil services company Enbridge, Inc. was the largest detractor suffering from long term structural pressures in the oil supply market. Canadian operator of copper mines globally, First Quantum, was the second largest detractor hurt by a prolonged downturn in copper prices and issues bringing new mines on track. Both positions had been exited by the period end. | ||||||
Outlook | ||||||
Current market volatility is emblematic of an environment where many investors are looking for clear signals and seemingly isolated events can have profound market implications. | ||||||
The growth environment appears stagnant and the projected boost from both low oil and zero rates has failed to materialise in any meaningful way globally. What is clear is that households are still fearful and are electing to improve balance sheets over consumption. | ||||||
There are many non-market issues to grapple with too – a wretched U.S. election cycle; a potential UK exit from its European Union trading zone; a migrant crisis with few clear solutions and a China grappling with a slowdown whilst caught between market forces and autocracy. | ||||||
The RBC Global Equity Team aims to discover companies with strong inherent qualities that should be robust enough to withstand shorter term market forces. What we will not do, for example, is chase style rotations or second guess central banks in our pursuit of companies with strong competitive dynamics that we are confident can outperform over the long term. | ||||||
| ||||||
Habib Subjally | ||||||
Senior Portfolio Manager, Global Equities | ||||||
RBC Global Asset Management (UK) Limited | ||||||
The information provided herein represents the opinions of the Fund Managers and is not intended to be a forecast of future events, a guarantee of future results, nor investment advice. | ||||||
Mutual fund investing involves risk. Principal loss is possible. The Funds invest in foreign securities which involve greater volatility and political, economic and currency risks and differences in accounting methods. These risks can be greater in emerging markets. There is a possibility that issuers of securities in which the Fund may invest may default on the payment of interest or principal on the securities when due, which would cause the Fund to lose money. Investing in small cap companies involves additional risks, including greater fluctuations in value and less liquidity than larger companies. These risks are fully described in the prospectus. | ||||||
Must be proceeded or accompanied by a prospectus.
|

5
LETTER FROM THE PORTFOLIO MANAGER OF GLOBAL EQUITIES
| ||||||||||||||
Fund holdings and sector allocations are subject to change at any time and should not be considered recommendations to buy or sell any security. Please refer to the Schedule of Investments in this report for a complete list of fund holdings.
| ||||||||||||||
RBC Global Asset Management (U.S) Inc. serves as investment advisor for RBC Funds. The Funds are sub-advised by RBC Global Asset Management (UK) Limited. The RBC Funds are distributed by Quasar Distributors, LLC, an affiliate of U.S. Bancorp Fund Services, LLC.
| ||||||||||||||
| ||||||||||||||
6
| ||||||||
RBC Global Asset Management (U.S.) Inc. (“RBC GAM (US)”) serves as the investment advisor and RBC Global Asset Management (UK) Limited (“RBC GAM (UK)”) serves as the investment sub-advisor to the Funds and is responsible for the overall management of the Funds’ portfolios. The individual primarily responsible for the day-to-day management of the Funds’ portfolios is set forth below.
| ||||||||
Philippe Langham | ||||||||
Head of Emerging Market Equities | ||||||||
Philippe Langham is Head of Emerging Market Equities at RBC GAM (UK) and is responsible for portfolio management of RBC Emerging Markets Equity Fund and RBC Emerging Markets Small Cap Equity Fund. Philippe joined RBC GAM (UK) in November 2009 from Societe Generale Asset Management, where he was Head of Global Emerging Markets. He was previously Director and Head of Emerging Markets and Asia at Credit Suisse in Zurich. Prior to that, he managed Global Emerging Markets, Asian, Latin American and U.S. portfolios for nine years at the Kuwait Investment Office. Philippe holds a BSc in economics from the University of Manchester in England and is a Chartered Accountant.
| ||||||||
Habib Subjally | ||||||||
Senior Portfolio Manager and Head of Global Equities | ||||||||
Habib Subjally is Head of Global Equities at RBC GAM (UK) and is responsible for portfolio management of RBC Global Opportunities Fund and RBC International Opportunities Fund. Prior to joining RBC GAM (UK) in 2006, Habib held various leadership and portfolio management positions at Credit Suisse, Invesco and Merrill Lynch Investment Managers, and also worked at Ernst & Young. He holds a BSc (Hons) from the London School of Economics and holds Chartered Accountant and ASIP designations. | ||||||||
|
7
|
1 Year | Since | Net | Gross | |||||||||||||||||
Average Annual Total Returns as of March 31, 2016 (Unaudited) | ||||||||||||||||||||
RBC Emerging Markets Equity Fund | ||||||||||||||||||||
Class A | ||||||||||||||||||||
- Including Maximum | ||||||||||||||||||||
Sales Charge of 5.75% | -14.60 | % | -1.40 | % | ||||||||||||||||
- At Net Asset Value | -9.39 | % | 1.20 | % | 1.14 | % | 2.74 | % | ||||||||||||
Class I | -9.18 | % | 1.42 | % | 0.75 | % | 1.89 | % | ||||||||||||
MSCI Emerging Markets | ||||||||||||||||||||
Net Index (b) | -12.03 | % | -4.84 | % | ||||||||||||||||
RBC Emerging Markets Small Cap Equity Fund | ||||||||||||||||||||
Class A | ||||||||||||||||||||
- Including Maximum | ||||||||||||||||||||
Sales Charge of 5.75% | -15.04 | % | -3.51 | % | ||||||||||||||||
- At Net Asset Value | -9.86 | % | -0.96 | % | 1.85 | % | 5.42 | % | ||||||||||||
Class I | -9.60 | % | -0.72 | % | 1.60 | % | 5.17 | % | ||||||||||||
MSCI Emerging Markets | ||||||||||||||||||||
Small Cap Net Index (b) | -9.20 | % | -1.29 | % | ||||||||||||||||
RBC Global Opportunities Fund | ||||||||||||||||||||
Class I | -0.63 | % | 1.87 | % | 1.05 | % | 3.97 | % | ||||||||||||
MSCI ACWI Index (b) | -4.34 | % | -2.93 | % | ||||||||||||||||
RBC International Opportunities Fund | ||||||||||||||||||||
Class I | -5.52 | % | -2.67 | % | 1.00 | % | 3.92 | % | ||||||||||||
MSCI ACWI ex US Index (b) | -9.19 | % | -6.72 | % | ||||||||||||||||
Performance data quoted represents past performance. Past performance is no guarantee of future results. Investment return and principal value of an investment will fluctuate so that an investor’s shares, when redeemed, may be worth more or less than their original cost. Current performance may be lower or higher than performance quoted. Performance shown reflects contractual fee waivers, without such fee waivers total returns would be reduced. Performance information does not reflect the 2% fee on shares redeemed or exchanged within 30 days of purchase. If such redemption fee was included, performance would be reduced. For performance data current to the most recent month-end go to www.rbcgam.us.
8
PERFORMANCE SUMMARY
|
| (1) | The Funds’ expenses reflect actual expenses for the most recent fiscal year ended March 31, 2016. | |
| (2) | The Advisor has contractually agreed to waive fees and/or make payments in order to keep total operating expenses of the Fund to the levels listed under net expense ratio until July 31, 2017 (October 31, 2017 for RBC Emerging Markets Equity Fund). For RBC Emerging Markets Equity Fund, effective August 3, 2015, the annual rate under the expense limitation agreement is 0.975% for Class A and 0.725% for Class I. The ratio of net expenses to average net assets represents a blended percentage for the year ended March 31, 2016. | |
| (a) | The since inception date (commencement of operations) is December 20, 2013 for RBC Emerging Markets Equity Fund and RBC Emerging Markets Small Cap Equity Fund and December 3, 2014 for RBC Global Opportunities Fund and RBC International Opportunities Fund. | |
| (b) | Each of the comparative indices is a widely recognized market value weighted measure of the return of securities, but do not include sales fees or operating expenses. You cannot invest directly in indices. | |
The MSCI Emerging Markets Net Index is a free float-adjusted market capitalization index that is designed to measure equity performance of emerging markets.
The MSCI Emerging Markets Small Cap Net Index includes small cap representation across 21 emerging markets countries. The index covers approximately 14% of the free float-adjusted market capitalization in each country.
The MSCI All Country World (“ACWI”) Index is a free float-adjusted market capitalization weighted index that is designed to measure the equity market performance of developed and emerging markets.
The MSCI All Country World (“ACWI”) ex US Index is a free float-adjusted market capitalization weighted index that is designed to measure the equity market performance of developed and emerging markets, excluding the US.
9
10
MANAGEMENT DISCUSSION AND ANALYSIS (UNAUDITED)
| ||||||||||||||||
RBC Emerging Markets Equity Fund
| ||||||||||||||||
Long-term growth of capital.
| Investment Objective | |||||||||||||||
MSCI Emerging Markets Net Index
| Benchmark | |||||||||||||||
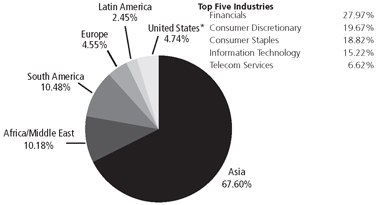
| Asset Allocation as of 3/31/16 (% of Fund’s investments) & Top Five Industries as of 3/31/16 (% of Fund’s net assets) | |||||||||||||||
| *Includes U.S. dollar denominated cash equivalent investments representing 4.74% of investments. | ||||||||||||||||
Taiwan Semiconductor Manufacturing Co. Ltd. |
4.08% |
SM Investments Corp. |
3.28% |
Top Ten Holdings (excluding investment companies) as of 3/31/16 (% of Fund’s net assets) | ||||||||||||
Infosys Ltd. ADR | 3.76% | Banco Bradesco SA ADR | 3.12% | |||||||||||||
Dr. Reddy’s Laboratories Ltd. ADR | 3.73% | China Mobile Ltd. | 2.70% | |||||||||||||
HDFC Bank Ltd. ADR | 3.34% | Samsung Electronics Co. Ltd., | 2.55% | |||||||||||||
Naspers Ltd. | 3.32% | Preferred | ||||||||||||||
AIA Group, Ltd. | 2.48% | |||||||||||||||
*A listing of all portfolio holdings can be found beginning on page 18. | ||||||||||||||||
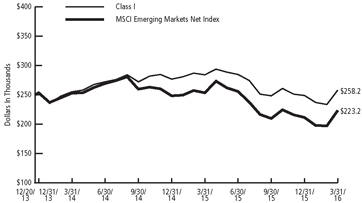
| Growth of $250,000 Initial Investment Since Inception (12/20/13) | |||||||||||||||
The graph reflects an initial investment of $250,000 over the period from December 20, 2013 (commencement of operations) to March 31, 2016 and is based on Class I shares. The Fund’s total return includes reinvested dividends and capital gains. The Fund’s total return also includes operating expenses that reduce return while the total return of the index does not. The graph does not reflect the deduction of taxes that a shareholder would pay on fund distributions or redemption of fund shares. Performance of other classes will vary due to differences in fee structures. | ||||||||||||||||
| ||||||||||||||||
11
12
MANAGEMENT DISCUSSION AND ANALYSIS (UNAUDITED)
| ||||||||||||||
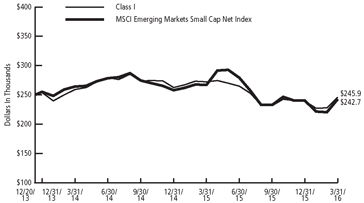
RBC Emerging Markets Small Cap Equity Fund
| ||||||||||||||
Long-term growth of capital.
|
Investment Objective | |||||||||||||
MSCI Emerging Markets Small Cap Net Index
|
Benchmark | |||||||||||||
|
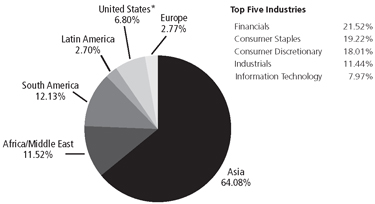
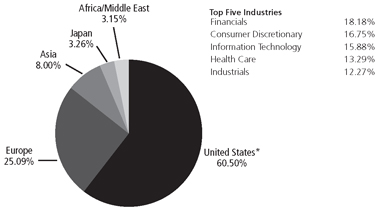
Asset Allocation as of 3/31/16 (% of Fund’s investments) & Top Five Industries as of 3/31/16 (% of Fund’s net assets) | |||||||||||||
*Includes U.S. dollar denominated cash equivalent investments representing 6.80% of investments.
| ||||||||||||||
Security Bank Corp. |
4.19% |
Delta Electronics Thailand Public Co. Ltd. - FOR |
3.00% |
Top Ten Holdings (excluding investment companies) as of 3/31/16 (% of Fund’s net assets)
| ||||||||||
Market Vectors India Small-Cap Index ETF | 4.12% | Inversiones Aguas Metropolitanas SA | 2.93% | |||||||||||
Ace Hardware Indonesia Tbk PT | 3.14% | Luthai Textile Co. Ltd., B Shares | 2.85% | |||||||||||
Aeon Thana Sinsap Thailand Public Co. Ltd. NVDR | 3.10% | Aramex PJSC | 2.77% | |||||||||||
Amorepacific Corp., Preferred | 3.03% | Standards Foods Corp. | 2.72% | |||||||||||
*A listing of all portfolio holdings can be found beginning on page 22.
| ||||||||||||||
|
Growth of $250,000 Initial Investment Since Inception (12/20/13) | |||||||||||||
The graph reflects an initial investment of $250,000 over the period from December 20, 2013 (commencement of operations) to March 31, 2016 and is based on Class I shares. The Fund’s total return includes reinvested dividends and capital gains. The Fund’s total return also includes operating expenses that reduce return, while the total return of the index does not. The graph does not reflect the deduction of taxes that a shareholder would pay on fund distributions or redemption of fund shares. Performance of other classes will vary due to differences in fee structures.
| ||||||||||||||
13
MANAGEMENT DISCUSSION AND ANALYSIS (UNAUDITED)
| ||||||||||
| ||||||||||
Investment Strategy |
Seeks to provide long-term capital growth by primarily investing in equity securities of issuers located throughout the world, including both developed and emerging markets.
| |||||||||
| Performance |
For the year ended March 31, 2016, the Fund had an annualized total return of -0.63%. That compares to an annualized total return of -4.34% for the MSCI All Country World Index, the Fund’s primary benchmark.
| |||||||||
Factors That Made Positive Contributions |
Stock selection in the Financials, Information Technology and Consumer Discretionary sectors contributed positively to the Fund’s relative performance during the year, specifically with regard to the following positions:
● U.S. retailer Amazon.com, Inc. saw strong growth in its cloud computing services alongside healthy retail figures.
| |||||||||
● U.S. electricity distribution utility ITC Holdings Corp., which became the subject of bid speculation. | ||||||||||
● U.S.-based First Republic Bank continued to see its strong service model rewarded.
| ||||||||||
Factors That Detracted From Relative Returns |
Performance of the following individual stocks detracted from the Fund’s performance during the year:
● Canadian oil services company Enbridge, Inc. was the largest detractor suffering from long term structural pressures in the oil supply market. | |||||||||
● U.S. alternative financial The Blackstone Group had a negative impact on Fund performance, despite its strong balance sheet.
| ||||||||||
| ||||||||||
14
MANAGEMENT DISCUSSION AND ANALYSIS (UNAUDITED)
| ||||||||||||
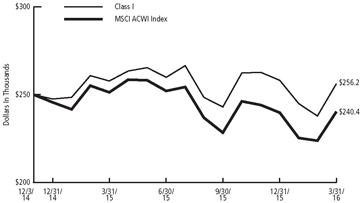
RBC Global Opportunities Fund
| ||||||||||||
Long-term growth of capital.
|
Investment Objective | |||||||||||
MSCI ACWI Index
|
Benchmark | |||||||||||
*Includes U.S. dollar denominated cash equivalent investments representing 0.90% of investments.
|
Asset Allocation as of 3/31/16 (% of Fund’s investments) & Top Five Industries as of 3/31/16 (% of Fund’s net assets) | |||||||||||
TJX Cos., Inc. (The) | 4.22% | HDFC Bank Ltd. ADR | 3.79% | Top Ten Holdings (excluding investment companies) as of 3/31/16 (% of Fund’s net assets) | ||||||||
| UnitedHealth Group, Inc. | 4.22% | Intuit, Inc. | 3.79% | |||||||||
| Danaher Corp. | 4.02% | Alphabet, Inc., Class A | 3.74% | |||||||||
| Estee Lauder Cos., Inc. (The), Class A | 3.99% | International Flavors & Fragrances, Inc. | 3.72% | |||||||||
| First Republic Bank | 3.98% | Amgen, Inc. | 3.64% | |||||||||
*A listing of all portfolio holdings can be found beginning on page 27.
| ||||||||||||
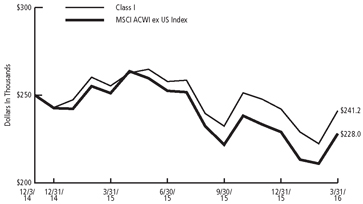
The graph reflects an initial investment of $250,000 over the period from December 3, 2014 (commencement of operations) to March 31, 2016 and is based on Class I shares. The Fund’s total return includes reinvested dividends and capital gains. The Fund’s total return also includes operating expenses that reduce return while the total return of the index does not. The graph does not reflect the deduction of taxes that a shareholder would pay on fund distributions or redemption of fund shares. Performance of other classes will vary due to differences in fee structures.
|
Growth of $250,000 Initial Investment Since Inception (12/3/14) | |||||||||||
15
16
MANAGEMENT DISCUSSION AND ANALYSIS (UNAUDITED)
| ||||||||||||||||
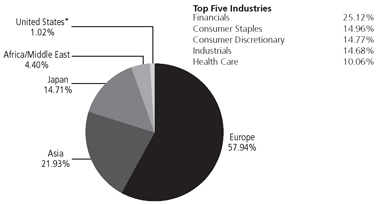
RBC International Opportunities Fund
| ||||||||||||||||
Long-term growth of capital.
| Investment Objective | |||||||||||||||
MSCI ACWI ex US Index
| Benchmark | |||||||||||||||
| Asset Allocation as of 3/31/16 (% of Fund’s investments) & Top Five Industries as of 3/31/16 (% of Fund’s net assets) | |||||||||||||||
*Includes U.S. dollar denominated cash equivalent investments representing 1.02% of investments.
| ||||||||||||||||
Anheuser-Busch InBev NV |
4.69% |
Taiwan Semiconductor Manufacturing Co. Ltd. ADR |
4.06% |
Top Ten Holdings (excluding investment companies) as of 3/31/16 (% of Fund’s net assets) | ||||||||||||
Naspers Ltd., N Shares | 4.46% | Admiral Group Plc | 3.92% | |||||||||||||
Safran SA | 4.29% | AIA Group Ltd. | 3.90% | |||||||||||||
Pernod Ricard SA | 4.25% | Deutsche Post AG | 3.69% | |||||||||||||
HDFC Bank Ltd. ADR | 4.16% | Roche Holding AG | 3.66% | |||||||||||||
*A listing of all portfolio holdings can be found beginning on page 30.
| ||||||||||||||||
| Growth of $250,000 Initial Investment Since Inception (12/3/14) | |||||||||||||||
The graph reflects an initial investment of $250,000 over the period from December 3, 2014 (commencement of operations) to March 31, 2016 and is based on Class I shares. The Fund’s total return includes reinvested dividends and capital gains. The Fund’s total return also includes operating expenses that reduce return, while the total return of the index does not. The graph does not reflect the deduction of taxes that a shareholder would pay on fund distributions or redemption of fund shares. Performance of other classes will vary due to differences in fee structures. | ||||||||||||||||
| ||||||||||||||||
17
SCHEDULE OF PORTFOLIO INVESTMENTS
|
RBC Emerging Markets Equity Fund
March 31, 2016
| Shares | Value | |||||
| ||||||
Common Stocks — 91.11% | ||||||
Brazil — 6.58% | ||||||
325,720 | Banco Bradesco SA ADR | $ | 2,426,614 | |||
153,200 | Natura Cosmeticos SA | 1,138,886 | ||||
120,700 | Totvs SA | 898,960 | ||||
169,800 | WEG SA
|
| 656,882
|
| ||
|
| |||||
|
5,121,342 |
| ||||
|
| |||||
Chile — 1.68% | ||||||
81,078 | Cia Cervecerias Unidas SA | 913,643 | ||||
212,765 | Quinenco SA
|
| 390,657
|
| ||
|
| |||||
|
1,304,300 |
| ||||
|
| |||||
China — 21.72% | ||||||
340,000 | AIA Group Ltd. | 1,932,568 | ||||
17,500 | Alibaba Group Holding Ltd. ADR* | 1,383,025 | ||||
7,612 | Baidu, Inc. ADR* | 1,452,979 | ||||
482,600 | China Merchants Holdings International Co. Ltd. | 1,434,985 | ||||
189,500 | China Mobile Ltd. | 2,098,707 | ||||
317,000 | China Resources Land Ltd. | 813,295 | ||||
141,749 | CK Hutchison Holdings Ltd. | 1,841,609 | ||||
622,069 | Fuyao Glass Industry Group Co. Ltd. - Series A | 1,430,950 | ||||
766,000 | Guangdong Investment Ltd. | 968,581 | ||||
1,733,000 | Lenovo Group Ltd. | 1,350,658 | ||||
482,900 | Samsonite International SA | 1,617,502 | ||||
279,200 | Weifu High-Technology Group Co. Ltd. - Series B
|
| 570,909
|
| ||
|
| |||||
|
16,895,768 |
| ||||
|
| |||||
India — 14.22% | ||||||
81,000 | Cummins India Ltd. | 1,031,252 | ||||
64,200 | Dr. Reddy’s Laboratories Ltd. ADR | 2,901,198 | ||||
42,200 | HDFC Bank Ltd. ADR | 2,600,786 | ||||
36,000 | Hero Motocorp Ltd. | 1,601,065 | ||||
153,800 | Infosys Ltd. ADR
|
| 2,925,276
|
| ||
|
| |||||
|
11,059,577 |
| ||||
|
| |||||
Indonesia — 3.00% | ||||||
1,085,300 | Bank Central Asia Tbk PT | 1,088,097 | ||||
11,418,200 | Kalbe Farma Tbk PT
|
| 1,243,316
|
| ||
|
| |||||
|
2,331,413 |
| ||||
|
| |||||
Jordan — 1.53% | ||||||
41,981 | Hikma Pharmaceuticals Plc | 1,192,109 | ||||
Korea — 6.39% | ||||||
2,800 | Amorepacific Corp | 946,879 | ||||
91,240 | Hanon Systems | 735,068 | ||||
18
SCHEDULE OF PORTFOLIO INVESTMENTS
|
RBC Emerging Markets Equity Fund (cont.)
March 31, 2016
| Shares | Value | |||||
| ||||||
1,312 | Samsung Electronics Co. Ltd. | $ | 1,505,661 | |||
2,428 | Samsung Fire & Marine Insurance Co. Ltd. | 627,071 | ||||
32,784 | Shinhan Financial Group Co. Ltd.
|
| 1,153,991
|
| ||
|
| |||||
|
4,968,670 |
| ||||
|
| |||||
Malaysia — 3.63% | ||||||
1,057,700 | Axiata Group Berhad | 1,596,448 | ||||
255,700 | Public Bank Berhad
|
| 1,230,305
|
| ||
|
| |||||
|
2,826,753 |
| ||||
|
| |||||
Mexico — 2.45% | ||||||
24,900 | Grupo Televisa SAB ADR | 683,754 | ||||
505,900 | Kimberly-Clark de Mexico SAB de CV - Series A
|
| 1,222,208
|
| ||
|
| |||||
|
1,905,962 |
| ||||
|
| |||||
Nigeria — 0.49% | ||||||
5,284,466 | Guaranty Trust Bank Plc | 379,798 | ||||
Peru — 2.24% | ||||||
13,291 | Credicorp Ltd. | 1,741,254 | ||||
Philippines — 3.28% | ||||||
123,630 | SM Investments Corp. | 2,548,227 | ||||
Poland — 1.17% | ||||||
20,647 | Bank Pekao SA | 910,289 | ||||
Russia — 1.05% | ||||||
20,478 | Magnit OJSC GDR | 818,096 | ||||
South Africa — 7.06% | ||||||
285,961 | Clicks Group Ltd. | 1,883,754 | ||||
85,127 | Mr. Price Group Ltd. | 1,021,929 | ||||
18,545 | Naspers Ltd.
|
| 2,585,168
|
| ||
|
| |||||
|
5,490,851 |
| ||||
|
| |||||
Taiwan — 9.88% | ||||||
112,400 | Airtac International Group | 664,116 | ||||
189,000 | Delta Electronics, Inc. | 833,167 | ||||
110,000 | Giant Manufacturing Co. Ltd. | 635,733 | ||||
594,471 | Standard Foods Corp. | 1,474,405 | ||||
636,000 | Taiwan Semiconductor Manufacturing Co. Ltd. | 3,172,262 | ||||
19
SCHEDULE OF PORTFOLIO INVESTMENTS
|
RBC Emerging Markets Equity Fund (cont.)
March 31, 2016
| Shares | Value | |||||
| ||||||
517,468 | Uni-President Enterprises Corp.
| $
| 908,707
|
| ||
|
| |||||
| 7,688,390 | ||||||
|
| |||||
Thailand — 1.29% | ||||||
685,800 | Central Pattana Public Co. Ltd. - FOR | 1,001,933 | ||||
Turkey — 2.34% | ||||||
289,629 | Akbank TAS | 824,976 | ||||
574,353 | Enka Insaat Ve Sanayi AS
|
| 995,707
|
| ||
|
| |||||
| 1,820,683 | ||||||
|
| |||||
United Arab Emirates — 1.11% | ||||||
1,106,418 | Emaar Malls Group PJSC*
|
| 866,934
|
| ||
|
| |||||
Total Common Stocks | 70,872,349 | |||||
|
| |||||
(Cost $69,214,884) | ||||||
Preferred Stocks — 4.32% | ||||||
Korea — 4.32% | ||||||
5,369 | Hyundai Motor Co. | 487,871 | ||||
2,050 | Samsung Electronics Co. Ltd. | 1,984,766 | ||||
5,239 | Samsung Fire & Marine Insurance Co. Ltd.
|
| 884,392
|
| ||
|
| |||||
Total Preferred Stocks | 3,357,029 | |||||
|
| |||||
(Cost $3,165,073) | ||||||
20
SCHEDULE OF PORTFOLIO INVESTMENTS
|
RBC Emerging Markets Equity Fund (cont.)
March 31, 2016
| Shares | Value | |||||
| ||||||
Investment Company — 4.74% | ||||||
3,690,845 | Dreyfus Cash Management, Institutional Shares | $ | 3,690,845 | |||
|
| |||||
Total Investment Company | 3,690,845 | |||||
|
| |||||
(Cost $3,690,845) | ||||||
Total Investments | $ | 77,920,223 | ||||
(Cost $76,070,802)(a) — 100.17% | ||||||
Liabilities in excess of other assets — (0.17)% | (129,755 | ) | ||||
|
| |||||
NET ASSETS — 100.00% | $ | 77,790,468 | ||||
|
| |||||
| * | Non-income producing security. |
| (a) | See Notes to Financial Statements for the tax cost of securities and the breakdown of unrealized appreciation (depreciation). |
Abbreviations used are defined below:
ADR - American Depositary Receipt
FOR - Foreign Ownership Restrictions
GDR - Global Depositary Receipt
Portfolio Diversification (Unaudited)
Industries | Percentage | |||
Financials | 27.97 | % | ||
Consumer Staples | 18.82 | % | ||
Consumer Discretionary | 19.67 | % | ||
Information Technology | 15.22 | % | ||
Telecom Services | 6.62 | % | ||
Industrials | 5.88 | % | ||
Utilities | 1.25 | % | ||
Other* | 4.57 | % | ||
|
| |||
| 100.00 | % | |||
|
| |||
| * | Includes cash, Investment Company, interest and dividend receivable, |
| pending trades and Fund share transactions and accrued expenses payable. |
See Notes to Financial Statements.
21
SCHEDULE OF PORTFOLIO INVESTMENTS
|
RBC Emerging Markets Small Cap Equity Fund
March 31, 2016
| Shares | Value | |||
| ||||
Common Stocks — 77.03% | ||||||
Brazil — 5.95% | ||||||
13,700 | Cia Hering | $ | 55,857 | |||
21,000 | Duratex SA* | 44,737 | ||||
10,200 | Natura Cosmeticos SA | 75,827 | ||||
7,850 | Totvs SA | 58,466 | ||||
4,850 | Wilson Sons Ltd. BDR
|
| 42,961
|
| ||
|
| |||||
| 277,848 | ||||||
|
| |||||
Chile — 6.17% | ||||||
86,000 | Inversiones Aguas Metropolitanas SA | 136,581 | ||||
41,323 | Parque Arauco SA | 75,836 | ||||
39,184 | Sonda SA
|
| 75,473
|
| ||
|
| |||||
| 287,890 | ||||||
|
| |||||
China — 8.97% | ||||||
29,000 | Asia Satellite Telecommunications Holdings Ltd. | 39,445 | ||||
4,300 | Hollysys Automation Technologies Ltd.* | 90,515 | ||||
100,300 | Luthai Textile Co. Ltd., B Shares | 133,140 | ||||
35,000 | Samsonite International SA | 117,234 | ||||
168,000 | Tao Heung Holdings Ltd.
|
| 38,127
|
| ||
|
| |||||
| 418,461 | ||||||
|
| |||||
Egypt — 2.01% | ||||||
3,253 | Edita Food Industries SAE GDR* | 50,747 | ||||
8,754 | Integrated Diagnostics Holdings Plc*(a)
|
| 42,895
|
| ||
|
| |||||
| 93,642 | ||||||
|
| |||||
Hong Kong — 1.90% | ||||||
25,000 | Stella International Holdings Ltd. | 58,877 | ||||
15,990 | Vitasoy International Holdings Ltd.
|
| 29,861
|
| ||
|
| |||||
| 88,738 | ||||||
|
| |||||
Indonesia — 3.92% | ||||||
2,167,300 | Ace Hardware Indonesia Tbk PT | 146,286 | ||||
1,000,000 | Pakuwon Jati Tbk PT
|
| 36,459
|
| ||
|
| |||||
| 182,745 | ||||||
|
| |||||
Korea — 5.18% | ||||||
400 | Cuckoo Electronics Co. Ltd. | 70,190 | ||||
14,095 | DGB Financial Group, Inc. | 109,714 | ||||
60 | Medy-Tox, Inc. | 23,147 | ||||
616 | Youngone Holdings Co. Ltd.
|
| 38,817
|
| ||
|
| |||||
| 241,868 | ||||||
|
| |||||
22
SCHEDULE OF PORTFOLIO INVESTMENTS
|
RBC Emerging Markets Small Cap Equity Fund (cont.)
March 31, 2016
| Shares | Value | |||
| ||||
Malaysia — 3.95% | ||||||
176,000 | CapitaMalls Malaysia Trust REIT | $ | 64,962 | |||
18,400 | LPI Capital Berhad | 72,443 | ||||
123,200 | Oldtown Berhad
|
| 46,730
|
| ||
|
| |||||
| 184,135 | ||||||
|
| |||||
Mexico — 2.70% | ||||||
40,084 | Corp. Inmobiliaria Vesta SAB de CV | 60,066 | ||||
29,800 | Grupo Herdez SAB de CV
|
| 65,750
|
| ||
|
| |||||
| 125,816 | ||||||
|
| |||||
Nigeria — 0.50% | ||||||
324,500 | Guaranty Trust Bank Plc | 23,322 | ||||
Philippines — 5.55% | ||||||
153,100 | Century Pacific Food, Inc. | 63,190 | ||||
51,500 | Security Bank Corp.
|
| 195,675
|
| ||
|
| |||||
| 258,865 | ||||||
|
| |||||
South Africa — 9.01% | ||||||
18,083 | Clicks Group Ltd. | 119,121 | ||||
38,900 | Consolidated Infrastructure Group Ltd.* | 75,432 | ||||
15,398 | Hyprop Investments Ltd. REIT | 122,350 | ||||
12,218 | Oceana Group Ltd.
|
| 103,545
|
| ||
|
| |||||
| 420,448 | ||||||
|
| |||||
Taiwan — 12.58% | ||||||
19,900 | Airtac International Group | 117,579 | ||||
54,000 | Chroma ATE, Inc. | 116,055 | ||||
11,000 | Giant Manufacturing Co. Ltd. | 63,573 | ||||
5,000 | Ginko International Co. Ltd. | 49,873 | ||||
22,000 | Lumax International Corp. Ltd. | 31,585 | ||||
21,000 | Pacific Hospital Supply Co. Ltd. | 53,095 | ||||
51,150 | Standard Foods Corp. | 126,862 | ||||
20,000 | Yungtay Engineering Co. Ltd.
|
| 28,553
|
| ||
|
| |||||
| 587,175 | ||||||
|
| |||||
Thailand — 8.64% | ||||||
53,300 | Aeon Thana Sinsap Thailand Public Co. Ltd. NVDR | 144,789 | ||||
56,700 | Delta Electronics Thailand Public Co. Ltd. - FOR | 140,094 | ||||
23
SCHEDULE OF PORTFOLIO INVESTMENTS
|
RBC Emerging Markets Small Cap Equity Fund (cont.)
March 31, 2016
| Shares | Value | |||||
| ||||||
320,000
| MC Group Public Co. Ltd. - FOR
| $
| 118,172
|
| ||
|
| |||||
| 403,055 | ||||||
|
| |||||
Total Common Stocks (Cost $4,121,348) | 3,594,008 | |||||
|
| |||||
Equity Linked Securities — 8.98% | ||||||
India — 6.21% | ||||||
22,017 | Godrej Industries Ltd. | 118,027 | ||||
20,000 | Marico Ltd. | 73,782 | ||||
5,000
| Sundaram Finance Ltd.
|
| 98,199
|
| ||
|
| |||||
| 290,008 | ||||||
|
| |||||
Luxembourg — 2.77% | ||||||
140,000
| Aramex PJSC
|
| 129,213
|
| ||
|
| |||||
Total Equity Linked Securities | 419,221 | |||||
|
| |||||
(Cost $303,448) | ||||||
Exchange Traded Funds — 4.12% | ||||||
India — 4.12% | ||||||
5,000 | Market Vectors India Small-Cap Index ETF
|
| 192,050
|
| ||
|
| |||||
Total Exchange Traded Funds | 192,050 | |||||
|
| |||||
(Cost $149,435) | ||||||
Preferred Stocks — 3.03% | ||||||
Korea — 3.03% | ||||||
732 | Amorepacific Corp. | 141,287 | ||||
Philippines — 0.00% | ||||||
58,000
| Security Bank Corp.(b)
|
| 126
|
| ||
|
| |||||
Total Preferred Stocks | 141,413 | |||||
|
| |||||
(Cost $41,615) | ||||||
24
SCHEDULE OF PORTFOLIO INVESTMENTS
|
RBC Emerging Markets Small Cap Equity Fund (cont.)
March 31, 2016
| Shares | Value | |||||
| ||||||
Investment Company — 6.79% | ||||||
316,905 | Dreyfus Cash Management, Institutional Shares | $ | 316,905 | |||
|
| |||||
Total Investment Company | 316,905 | |||||
|
| |||||
(Cost $316,905) | ||||||
Total Investments | $ | 4,663,597 | ||||
(Cost $4,932,751)(c) — 99.95% | ||||||
Other assets in excess of liabilities — 0.05% | 2,179 | |||||
|
| |||||
NET ASSETS — 100.00% | $ | 4,665,776 | ||||
|
| |||||
| * | Non-income producing security. |
| (a) | Security exempt from registration under Rule 144A or Section 4(2) of the Securities Act of 1933, as amended. These securities may be resold in transactions exempt from registration, normally to qualified institutional buyers. Security has been deemed to be liquid based on procedures approved by the Board of Trustees. |
| (b) | The Pricing Committee has fair valued this security under procedures established by the Fund’s Board of Trustees. |
| (c) | See Notes to Financial Statements for the tax cost of securities and the breakdown of unrealized appreciation (depreciation). |
Abbreviations used are defined below:
BDR - Brazilian Depositary Receipt
FOR - Foreign Ownership Restrictions
GDR - Global Depositary Receipt
NVDR - Non-Voting Depository Receipt
REIT - Real Estate Investment Trust
25
SCHEDULE OF PORTFOLIO INVESTMENTS
|
RBC Emerging Markets Small Cap Equity Fund (cont.)
March 31, 2016
Portfolio Diversification (Unaudited)
Industries | Percentage | |||
Financials | 21.52 | % | ||
Consumer Staples | 19.22 | % | ||
Consumer Discretionary | 18.01 | % | ||
Industrials | 11.44 | % | ||
Information Technology | 7.97 | % | ||
Health Care | 3.62 | % | ||
Materials | 3.49 | % | ||
Utilities | 2.93 | % | ||
Telecom Services | 0.84 | % | ||
Other* | 10.96 | % | ||
|
| |||
| 100.00 | % | |||
|
| |||
| * | Includes cash, Exchange Traded Funds, Investment Company, interest and dividend receivable, pending trades and Fund share transactions, and accrued expenses payable. |
See Notes to Financial Statements.
26
SCHEDULE OF PORTFOLIO INVESTMENTS
|
RBC Global Opportunities Fund
March 31, 2016
| Shares | Value | |||||
| ||||||
Common Stocks — 100.74% | ||||||
Belgium — 3.27% | ||||||
1,369 | Anheuser-Busch InBev NV | $ | 170,081 | |||
France — 6.93% | ||||||
1,652 | Pernod Ricard SA | 183,955 | ||||
2,523 | Safran SA
|
| 176,106
|
| ||
|
| |||||
| 360,061 | ||||||
|
| |||||
Germany — 4.17% | ||||||
5,780 | Deutsche Post AG | 160,418 | ||||
1,371 | Drillisch AG
|
| 56,101
|
| ||
|
| |||||
| 216,519 | ||||||
|
| |||||
Hong Kong — 1.82% | ||||||
16,600 | AIA Group Ltd. | 94,355 | ||||
India — 3.79% | ||||||
3,200 | HDFC Bank Ltd. ADR | 197,216 | ||||
Ireland — 1.52% | ||||||
567 | Paddy Power Betfair Plc | 78,868 | ||||
Japan — 3.31% | ||||||
400 | SMC Corp. | 92,691 | ||||
1,500 | Toyota Motor Corp.
|
| 79,553
|
| ||
|
| |||||
| 172,244 | ||||||
|
| |||||
South Africa — 3.20% | ||||||
1,193 | Naspers Ltd., N Shares | 166,304 | ||||
Switzerland — 3.36% | ||||||
711 | Roche Holding AG | 174,579 | ||||
Taiwan — 2.52% | ||||||
5,000 | Taiwan Semiconductor Manufacturing Co. Ltd. ADR | 131,000 | ||||
United Kingdom — 6.26% | ||||||
4,110 | InterContinental Hotels Group Plc | 169,111 | ||||
50,295 | Lloyds Banking Group Plc | 48,987 | ||||
8,158 | St. James’s Place Plc
|
| 107,264
|
| ||
|
| |||||
| 325,362 | ||||||
|
| |||||
United States — 60.59% | ||||||
255 | Alphabet Inc., Class A* | 194,539 | ||||
265 | Amazon.com, Inc.* | 157,315 | ||||
27
SCHEDULE OF PORTFOLIO INVESTMENTS
|
RBC Global Opportunities Fund (cont.)
March 31, 2016
| Shares | Value | |||||
| ||||||
1,262 | Amgen, Inc. | $ | 189,212 | |||
6,600 | Blackstone Group LP (The) - MLP | 185,130 | ||||
1,200 | Citigroup, Inc. | 50,100 | ||||
2,862 | Cognizant Technology Solutions Corp., Class A* | 179,447 | ||||
2,200 | Danaher Corp. | 208,692 | ||||
2,400 | EOG Resources, Inc. | 174,192 | ||||
2,200 | Estee Lauder Cos., Inc. (The), Class A | 207,482 | ||||
3,100 | First Republic Bank | 206,584 | ||||
1,378 | Gartner Inc.* | 123,124 | ||||
1,485 | Incyte Corp.* | 107,618 | ||||
1,700 | International Flavors & Fragrances, Inc. | 193,409 | ||||
1,893 | Intuit, Inc. | 196,891 | ||||
1,800 | Invesco Ltd. | 55,386 | ||||
4,100 | ITC Holdings Corp. | 178,637 | ||||
1,500 | Occidental Petroleum Corp. | 102,645 | ||||
2,800 | TJX Cos., Inc. (The) | 219,380 | ||||
1,700
| UnitedHealth Group, Inc.
|
| 219,130
|
| ||
|
| |||||
| 3,148,913 | ||||||
|
| |||||
Total Common Stocks | 5,235,502 | |||||
|
| |||||
(Cost $5,041,420) | ||||||
Investment Company — 0.92% | ||||||
47,618 | Dreyfus Cash Management, Institutional Shares | 47,618 | ||||
|
| |||||
Total Investment Company | 47,618 | |||||
|
| |||||
(Cost $47,618) | ||||||
Total Investments | $ | 5,283,120 | ||||
(Cost $5,089,038)(a) — 101.66% | ||||||
Liabilities in excess of other assets — (1.66)% | (86,331 | ) | ||||
|
| |||||
NET ASSETS — 100.00% | $ | 5,196,789 | ||||
|
| |||||
| * | Non-income producing security. |
| (a) | See Notes to Financial Statements for the tax cost of securities and the breakdown of unrealized appreciation (depreciation). |
28
SCHEDULE OF PORTFOLIO INVESTMENTS
|
RBC Global Opportunities Fund (cont.)
March 31, 2016
Abbreviations used are defined below:
ADR - American Depositary Receipt
MLP - Master Limited Partnership
Portfolio Diversification (Unaudited)
Industries | Percentage | |||
Financials | 18.18 | % | ||
Consumer Discretionary | 16.75 | % | ||
Information Technology | 15.88 | % | ||
Health Care | 13.29 | % | ||
Industrials | 12.27 | % | ||
Consumer Staples | 10.80 | % | ||
Energy | 5.33 | % | ||
Materials | 3.72 | % | ||
Utilities | 3.44 | % | ||
Telecom Services | 1.08 | % | ||
Other* | (0.74 | )% | ||
|
| |||
| 100.00 | % | |||
|
| |||
| * | Includes cash, Investment Company, interest and dividend receivable, pending trades and Fund share transactions and accrued expenses payable. |
See Notes to Financial Statements.
29
SCHEDULE OF PORTFOLIO INVESTMENTS
|
RBC International Opportunities Fund
March 31, 2016
| Shares | Value | |||||
| ||||||
Common Stocks — 100.45% | ||||||
Australia — 3.07% | ||||||
32,294 | Oil Search Ltd. | $168,168 | ||||
Belgium — 4.68% | ||||||
2,068 | Anheuser-Busch InBev NV | 256,922 | ||||
France — 10.23% | ||||||
823 | Air Liquide SA | 92,333 | ||||
2,095 | Pernod Ricard SA | 233,284 | ||||
3,373 | Safran SA
|
| 235,436
|
| ||
|
| |||||
| 561,053 | ||||||
|
| |||||
Germany — 6.64% | ||||||
294 | Continental AG | 66,682 | ||||
7,285 | Deutsche Post AG | 202,187 | ||||
2,322 | Drillisch AG
|
| 95,015
|
| ||
|
| |||||
| 363,884 | ||||||
|
| |||||
Hong Kong — 3.90% | ||||||
37,600 | AIA Group Ltd. | 213,719 | ||||
India — 4.16% | ||||||
3,700 | HDFC Bank Ltd. ADR | 228,031 | ||||
Ireland — 1.49% | ||||||
588 | Paddy Power Betfair Plc | 81,789 | ||||
Japan — 14.93% | ||||||
9,500 | Astellas Pharma, Inc. | 126,250 | ||||
6,000 | Kubota Corp. | 81,900 | ||||
1,800 | Nidec Corp. | 123,160 | ||||
7,200 | Santen Pharmaceutical Co. Ltd. | 108,220 | ||||
700 | SMC Corp. | 162,210 | ||||
2,600 | Sumitomo Mitsui Financial Group, Inc. | 78,930 | ||||
2,600 | Toyota Motor Corp.
|
| 137,892
|
| ||
|
| |||||
| 818,562 | ||||||
|
| |||||
Korea — 3.44% | ||||||
657 | LG Chem Ltd. | 188,553 | ||||
Netherlands — 2.95% | ||||||
1,000 | AKZO Nobel NV | 68,167 | ||||
930 | ASML Holding NV
|
| 93,590
|
| ||
|
| |||||
| 161,757 | ||||||
|
| |||||
30
SCHEDULE OF PORTFOLIO INVESTMENTS
|
RBC International Opportunities Fund (cont.)
March 31, 2016
| Shares | Value | |||||
| ||||||
Philippines — 3.63% | ||||||
42,320 | Universal Robina Corp. | $ | 199,263 | |||
South Africa — 4.46% | ||||||
1,755 | Naspers Ltd., N Shares | 244,647 | ||||
Spain — 1.49% | ||||||
27,658 | CaixaBank SA | 81,524 | ||||
Sweden — 2.39% | ||||||
4,201 | Svenska Cellulosa AB SCA, Series B | 131,032 | ||||
Switzerland — 9.82% | ||||||
365 | Partners Group Holding AG | 146,638 | ||||
817 | Roche Holding AG | 200,606 | ||||
184 | Syngenta AG | 76,304 | ||||
7,138
| UBS Group AG
|
| 114,822
|
| ||
|
| |||||
| 538,370 | ||||||
|
| |||||
Taiwan — 4.06% | ||||||
8,500 | Taiwan Semiconductor Manufacturing Co. Ltd. ADR | 222,700 | ||||
United Kingdom — 19.11% | ||||||
7,562 | Admiral Group Plc | 214,844 | ||||
4,799 | InterContinental Hotels Group Plc | 197,461 | ||||
2,107 | Liberty Global Plc, Series A* | 81,120 | ||||
145,877 | Lloyds Banking Group Plc | 142,084 | ||||
5,696 | Royal Dutch Shell Plc, B Shares | 138,610 | ||||
2,046 | Shire Plc | 116,693 | ||||
11,935
| St. James’s Place Plc
|
| 156,925
|
| ||
|
| |||||
| 1,047,737 | ||||||
|
| |||||
Total Common Stocks | 5,507,711 | |||||
|
| |||||
(Cost $5,623,449) | ||||||
Investment Company — 1.04% | ||||||
57,051 | Dreyfus Cash Management, Institutional Shares | 57,051 | ||||
|
| |||||
Total Investment Company | 57,051 | |||||
|
| |||||
(Cost $57,051) | ||||||
31
SCHEDULE OF PORTFOLIO INVESTMENTS
|
RBC International Opportunities Fund (cont.)
March 31, 2016
| Value | ||||||
| ||||||
Total Investments | $ | 5,564,762 | ||||
(Cost $5,680,500)(a) — 101.49% | ||||||
Liabilities in excess of other assets — (1.49)% | (81,700 | ) | ||||
|
| |||||
NET ASSETS — 100.00% | $ | 5,483,062 | ||||
|
| |||||
| * | Non-income producing security. |
| (a) | See Notes to Financial Statements for the tax cost of securities and the breakdown of unrealized appreciation (depreciation). |
Abbreviations used are defined below:
ADR - American Depositary Receipt
Portfolio Diversification (Unaudited)
Industries | Percentage | |||
Financials | 25.12 | % | ||
Consumer Staples | 14.96 | % | ||
Consumer Discretionary | 14.77 | % | ||
Industrials | 14.68 | % | ||
Health Care | 10.06 | % | ||
Materials | 7.76 | % | ||
Information Technology | 5.77 | % | ||
Energy | 5.60 | % | ||
Telecom Services | 1.73 | % | ||
Other* | (0.45 | )% | ||
|
| |||
| 100.00 | % | |||
|
| |||
| * | Includes cash, Investment Company, interest and dividend receivable, pending trades and Fund share transactions, and accrued expenses payable. |
See Notes to Financial Statements.
32
|
Statements of Assets and Liabilities
March 31, 2016
Emerging | Emerging | Global | International | |||||||||||||||||||||||||
Assets: | ||||||||||||||||||||||||||||
Investments, at value (cost $76,070,802, $4,932,751, $5,089,038 and $5,680,500, respectively) | $ | 77,920,223 | $ | 4,663,597 | $ | 5,283,120 | $ | 5,564,762 | ||||||||||||||||||||
Cash | — | — | — | 8 | ||||||||||||||||||||||||
Interest and dividends receivable | 181,697 | 15,963 | 10,241 | 18,890 | ||||||||||||||||||||||||
Receivable from advisor | 28,881 | 24,065 | 3,783 | 5,127 | ||||||||||||||||||||||||
Receivable for Fund shares sold | 410,064 | — | — | — | ||||||||||||||||||||||||
Receivable for investments sold | — | 36,005 | 8,837 | 53,223 | ||||||||||||||||||||||||
Prepaid expenses | 21,230 | 18,108 | 8,838 | 8,901 | ||||||||||||||||||||||||
|
|
|
|
|
|
|
| |||||||||||||||||||||
Total Assets | 78,562,095 | 4,757,738 | 5,314,819 | 5,650,911 | ||||||||||||||||||||||||
|
|
|
|
|
|
|
| |||||||||||||||||||||
Liabilities: | ||||||||||||||||||||||||||||
Cash overdraft | 4 | 7 | 8 | — | ||||||||||||||||||||||||
Foreign withholding tax payable | 10,223 | — | — | — | ||||||||||||||||||||||||
Payable for investments purchased | 677,668 | 35,290 | 27,816 | 75,823 | ||||||||||||||||||||||||
Accrued expenses and other payables: | ||||||||||||||||||||||||||||
Accounting fees | 7,586 | 7,085 | 7,090 | 7,092 | ||||||||||||||||||||||||
Distribution fees | 3,181 | 2,779 | — | — | ||||||||||||||||||||||||
Custodian fees | 10,487 | 2,051 | 683 | 801 | ||||||||||||||||||||||||
Trustees’ fees | 3 | 2 | 2 | 1 | ||||||||||||||||||||||||
Shareholder reports | 13,368 | 910 | 1,024 | 1,076 | ||||||||||||||||||||||||
Audit fees | 34,900 | 34,900 | 34,900 | 34,900 | ||||||||||||||||||||||||
Transfer agent fees | 4,388 | 1,271 | 620 | 635 | ||||||||||||||||||||||||
Offering costs | — | — | 37,535 | 37,535 | ||||||||||||||||||||||||
Other | 9,819 | 7,667 | 8,352 | 9,986 | ||||||||||||||||||||||||
|
|
|
|
|
|
|
| |||||||||||||||||||||
Total Liabilities | 771,627 | 91,962 | 118,030 | 167,849 | ||||||||||||||||||||||||
|
|
|
|
|
|
|
| |||||||||||||||||||||
Net Assets | $ | 77,790,468 | $ | 4,665,776 | $ | 5,196,789 | $ | 5,483,062 | ||||||||||||||||||||
|
|
|
|
|
|
|
| |||||||||||||||||||||
Net Assets Consist Of: | ||||||||||||||||||||||||||||
Capital | $ | 76,441,713 | $ | 4,931,040 | $ | 5,085,583 | $ | 5,756,088 | ||||||||||||||||||||
Undistributed/(distributions in excess of) net investment income | (12,720 | ) | 48,423 | 8,071 | 8,003 | |||||||||||||||||||||||
Accumulated net realized losses from investment and foreign currency transactions | (475,762 | ) | (44,404 | ) | (91,089 | ) | (165,637 | ) | ||||||||||||||||||||
Net unrealized appreciation/(depreciation) on investments and foreign currency transactions | 1,837,237 | (269,283 | ) | 194,224 | (115,392 | ) | ||||||||||||||||||||||
|
|
|
|
|
|
|
| |||||||||||||||||||||
Net Assets | $ | 77,790,468 | $ | 4,665,776 | $ | 5,196,789 | $ | 5,483,062 | ||||||||||||||||||||
|
|
|
|
|
|
|
| |||||||||||||||||||||
See Notes to Financial Statements.
33
FINANCIAL STATEMENTS
|
Statements of Assets and Liabilities (cont.)
March 31, 2016
Emerging | Emerging | Global | International | |||||||||||||||||||||||
Net Assets: | ||||||||||||||||||||||||||
Class A | $ | 2,540,178 | $ | 2,319,053 | N/A | N/A | ||||||||||||||||||||
Class I | 75,250,290 | 2,346,723 | $ | 5,196,789 | $ | 5,483,062 | ||||||||||||||||||||
|
|
|
|
|
|
|
| |||||||||||||||||||
Total | $ | 77,790,468 | $ | 4,665,776 | $ | 5,196,789 | $ | 5,483,062 | ||||||||||||||||||
|
|
|
|
|
|
|
| |||||||||||||||||||
Shares Outstanding (Unlimited number of shares authorized, no par value): | ||||||||||||||||||||||||||
Class A | 259,007 | 247,985 | N/A | N/A | ||||||||||||||||||||||
Class I | 7,561,436 | 250,902 | 513,507 | 579,232 | ||||||||||||||||||||||
|
|
|
|
|
|
|
| |||||||||||||||||||
Total | 7,820,443 | 498,887 | 513,507 | 579,232 | ||||||||||||||||||||||
|
|
|
|
|
|
|
| |||||||||||||||||||
Net Asset Values and Redemption Prices Per Share: | ||||||||||||||||||||||||||
Class A (a) | $ | 9.81 | $ | 9.35 | N/A | N/A | ||||||||||||||||||||
|
|
|
|
|
|
|
| |||||||||||||||||||
Class I | $ | 9.95 | $ | 9.35 | $ | 10.12 | $ | 9.47 | ||||||||||||||||||
|
|
|
|
|
|
|
| |||||||||||||||||||
Maximum Offering Prices Per Share: | ||||||||||||||||||||||||||
Class A | $ | 10.41 | $ | 9.92 | N/A | N/A | ||||||||||||||||||||
|
|
|
|
|
|
|
| |||||||||||||||||||
Maximum Sales Charge - Class A | 5.75 | % | 5.75 | % | N/A | N/A | ||||||||||||||||||||
|
|
|
|
|
|
|
| |||||||||||||||||||
(a) For Class A shares, redemption price per share will be reduced by 1.00% for sales of shares within 12 months of purchase (only applicable on purchases of $1 million or more on which no initial sales charge was paid). Such reduction is not reflected in the net asset value and the redemption price per share.
See Notes to Financial Statements.
34
FINANCIAL STATEMENTS
|
For the Year Ended March 31, 2016
Emerging | Emerging | Global | International Fund | |||||||||||||||||||||||||
Investment Income: | ||||||||||||||||||||||||||||
Dividend income | $ | 456,351 | $ | 162,309 | $ | 84,235 | $ | 135,492 | ||||||||||||||||||||
Foreign tax withholding | (49,118 | ) | (13,127 | ) | (5,318 | ) | (13,411 | ) | ||||||||||||||||||||
|
|
|
|
|
|
|
| |||||||||||||||||||||
Total Investment Income | 407,233 | 149,182 | 78,917 | 122,081 | ||||||||||||||||||||||||
|
|
|
|
|
|
|
| |||||||||||||||||||||
Expenses: | ||||||||||||||||||||||||||||
Investment advisory fees | 271,062 | 60,001 | 43,707 | 43,790 | ||||||||||||||||||||||||
Tax Expense | 883 | 206 | — | — | ||||||||||||||||||||||||
Distribution fees - Class A | 7,540 | 5,981 | — | — | ||||||||||||||||||||||||
Accounting fees | 44,427 | 43,240 | 43,257 | 43,274 | ||||||||||||||||||||||||
Audit fees | 49,577 | 49,577 | 40,999 | 40,999 | ||||||||||||||||||||||||
Legal fees | 11,943 | 5,983 | 8,802 | 8,803 | ||||||||||||||||||||||||
Custodian fees | 68,225 | 17,931 | 653 | 2,651 | ||||||||||||||||||||||||
Insurance fees | 4,916 | 4,916 | 3,207 | 3,207 | ||||||||||||||||||||||||
Trustees’ fees | 700 | 187 | 188 | 200 | ||||||||||||||||||||||||
Transfer agent fees - Class A | 4,235 | 3,623 | — | — | ||||||||||||||||||||||||
Transfer agent fees - Class I | 17,504 | 3,685 | 3,649 | 3,713 | ||||||||||||||||||||||||
Shareholder reports | 24,689 | 2,433 | 4,907 | 5,322 | ||||||||||||||||||||||||
Registration and filing fees | 37,397 | 35,686 | 13,704 | 13,833 | ||||||||||||||||||||||||
Offering costs | — | — | 32,239 | 32,253 | ||||||||||||||||||||||||
Other fees | 22,715 | 20,589 | 8,806 | 16,635 | ||||||||||||||||||||||||
|
|
|
|
|
|
|
| |||||||||||||||||||||
Total expenses before fee waiver/reimbursement | 565,813 | 254,038 | 204,118 | 214,680 | ||||||||||||||||||||||||
|
|
|
|
|
|
|
| |||||||||||||||||||||
Expenses waived/reimbursed by: | ||||||||||||||||||||||||||||
Advisor | (338,439 | ) | (171,048 | ) | (150,126 | ) | (159,942 | ) | ||||||||||||||||||||
|
|
|
|
|
|
|
| |||||||||||||||||||||
Net Expenses | 227,374 | 82,990 | 53,992 | 54,738 | ||||||||||||||||||||||||
|
|
|
|
|
|
|
| |||||||||||||||||||||
Net Investment Income | 179,859 | 66,192 | 24,925 | 67,343 | ||||||||||||||||||||||||
|
|
|
|
|
|
|
| |||||||||||||||||||||
Realized/Unrealized Gains/(Losses): | ||||||||||||||||||||||||||||
Net realized losses on: | ||||||||||||||||||||||||||||
Investment transactions | (405,123 | ) | (44,289 | ) | (80,160 | ) | (160,209 | ) | ||||||||||||||||||||
Foreign currency transactions | (113,437 | ) | (6,590 | ) | (6,089 | ) | (12,421 | ) | ||||||||||||||||||||
|
|
|
|
|
|
|
| |||||||||||||||||||||
Net realized losses | (518,560 | ) | (50,879 | ) | (86,249 | ) | (172,630 | ) | ||||||||||||||||||||
|
|
|
|
|
|
|
| |||||||||||||||||||||
Net change in unrealized appreciation/(depreciation) on: | ||||||||||||||||||||||||||||
Investments | 1,329,198 | (559,541 | ) | 33,822 | (225,341 | ) | ||||||||||||||||||||||
Foreign currency transactions | (1,105 | ) | 1,390 | 157 | 490 | |||||||||||||||||||||||
Foreign deferred tax | (10,223 | ) | — | — | — | |||||||||||||||||||||||
|
|
|
|
|
|
|
| |||||||||||||||||||||
Net unrealized gains/(losses) | 1,317,870 | (558,151 | ) | 33,979 | (224,851 | ) | ||||||||||||||||||||||
|
|
|
|
|
|
|
| |||||||||||||||||||||
Change in net assets resulting from operations | $ | 979,169 | $ | (542,838 | ) | $ | (27,345 | ) | $ | (330,138 | ) | |||||||||||||||||
|
|
|
|
|
|
|
| |||||||||||||||||||||
See Notes to Financial Statements.
35
FINANCIAL STATEMENTS
|
Statements of Changes in Net Assets
| Emerging Markets Equity Fund | ||||||||||||
| For the Year Ended March 31, 2016 | For the Year Ended March 31, 2015 | |||||||||||
From Investment Activities: | ||||||||||||
Operations: | ||||||||||||
Net investment income | $ | 179,859 | $ | 44,178 | ||||||||
Net realized gains/(losses) from investments and foreign currency transactions | (518,560 | ) | 200,633 | |||||||||
Net change in unrealized appreciation (depreciation) on investments and foreign currency transactions | 1,317,870 | 369,171 | ||||||||||
|
|
|
| |||||||||
Change in net assets resulting from operations | 979,169 | 613,982 | ||||||||||
|
|
|
| |||||||||
Distributions to Class A Shareholders: | ||||||||||||
From net investment income | (32,401 | ) | (54,630 | ) | ||||||||
From net realized gains from investment transactions | (11,199 | ) | (27,392 | ) | ||||||||
Distributions to Class I Shareholders: | ||||||||||||
From net investment income | (46,215 | ) | (63,092 | ) | ||||||||
From net realized gains from investment transactions | (161,444 | ) | (30,012 | ) | ||||||||
|
|
|
| |||||||||
Change in net assets resulting from shareholder distributions | (251,259 | ) | (175,126 | ) | ||||||||
|
|
|
| |||||||||
Capital Transactions: | ||||||||||||
Proceeds from shares issued | 73,792,423 | 1,151,428 | ||||||||||
Distributions reinvested | 199,469 | 175,126 | ||||||||||
Cost of shares redeemed | (3,795,706 | ) | (10 | ) | ||||||||
|
|
|
| |||||||||
Change in net assets resulting from capital transactions | 70,196,186 | 1,326,544 | ||||||||||
|
|
|
| |||||||||
Net increase in net assets | 70,924,096 | 1,765,400 | ||||||||||
Net Assets: | ||||||||||||
Beginning of year | 6,866,372 | 5,100,972 | ||||||||||
|
|
|
| |||||||||
End of year | $ | 77,790,468 | $ | 6,866,372 | ||||||||
|
|
|
| |||||||||
Distributions in excess of net investment income | $ | (12,720 | ) | $ | (1,382 | ) | ||||||
|
|
|
| |||||||||
Share Transactions: | ||||||||||||
Issued | 7,559,913 | 107,153 | ||||||||||
Reinvested | 21,504 | 16,936 | ||||||||||
Redeemed | (385,062 | ) | (1 | ) | ||||||||
|
|
|
| |||||||||
Change in shares resulting from capital transactions | 7,196,355 | 124,088 | ||||||||||
|
|
|
| |||||||||
See Notes to Financial Statements.
36
FINANCIAL STATEMENTS
|
Statements of Changes in Net Assets (cont.)
| Emerging Markets Small Cap Equity Fund | |||||||||||||
For the 2016 |
For the | ||||||||||||
From Investment Activities: | |||||||||||||
Operations: | |||||||||||||
Net investment income | $ | 66,192 | $ | 23,744 | |||||||||
Net realized gains (losses) from investments and foreign currency transactions | (50,879 | ) | 127,605 | ||||||||||
Net change in unrealized appreciation (depreciation) on investments and foreign currency transactions | (558,151 | ) | 97,156 | ||||||||||
|
|
|
| ||||||||||
Change in net assets resulting from operations | (542,838 | ) | 248,505 | ||||||||||
|
|
|
| ||||||||||
Distributions to Class A Shareholders: | |||||||||||||
From net investment income | (5,032 | ) | (49,928 | ) | |||||||||
From net realized gains from investment transactions | (19,436 | ) | (37,490 | ) | |||||||||
Distributions to Class I Shareholders: | |||||||||||||
From net investment income | (11,302 | ) | (56,725 | ) | |||||||||
From net realized gains from investment transactions | (19,546 | ) | (37,270 | ) | |||||||||
|
|
|
| ||||||||||
Change in net assets resulting from shareholder distributions | (55,316 | ) | (181,413 | ) | |||||||||
|
|
|
| ||||||||||
Capital Transactions: | |||||||||||||
Proceeds from shares issued | 21,662 | 30,762 | |||||||||||
Distributions reinvested | 55,315 | 181,413 | |||||||||||
Cost of shares redeemed | (255,922 | ) | (21,873 | ) | |||||||||
|
|
|
| ||||||||||
Change in net assets resulting from capital transactions | (178,945 | ) | 190,302 | ||||||||||
|
|
|
| ||||||||||
Net increase (decrease) in net assets | (777,099 | ) | 257,394 | ||||||||||
Net Assets: | |||||||||||||
Beginning of year | 5,442,875 | 5,185,481 | |||||||||||
|
|
|
| ||||||||||
End of year | $ | 4,665,776 | $ | 5,442,875 | |||||||||
|
|
|
| ||||||||||
Undistributed net investment income | $ | 48,423 | $ | 4,952 | |||||||||
|
|
|
| ||||||||||
Share Transactions: | |||||||||||||
Issued | 2,355 | 2,846 | |||||||||||
Reinvested | 6,286 | 17,980 | |||||||||||
Redeemed | (28,554 | ) | (2,026 | ) | |||||||||
|
|
|
| ||||||||||
Change in shares resulting from capital transactions | (19,913 | ) | 18,800 | ||||||||||
|
|
|
| ||||||||||
See Notes to Financial Statements.
37
FINANCIAL STATEMENTS
|
Statements of Changes in Net Assets (cont.)
Global Opportunities Fund | ||||||||||||||
For the 2016 |
For the | |||||||||||||
From Investment Activities: | ||||||||||||||
Operations: | ||||||||||||||
Net investment income | $ | 24,925 | $ | 3,160 | ||||||||||
Net realized losses from investments and foreign currency transactions | (86,249 | ) | (8,872 | ) | ||||||||||
Net change in unrealized appreciation (depreciation) on investments and foreign currency transactions | 33,979 | 160,245 | ||||||||||||
|
|
|
| |||||||||||
Change in net assets resulting from operations | (27,345 | ) | 154,533 | |||||||||||
|
|
|
| |||||||||||
Distributions to Class I Shareholders: | ||||||||||||||
From net investment income | (62,197 | ) | (1,445 | ) | ||||||||||
|
|
|
| |||||||||||
Change in net assets resulting from shareholder distributions | (62,197 | ) | (1,445 | ) | ||||||||||
|
|
|
| |||||||||||
Capital Transactions: | ||||||||||||||
Proceeds from shares issued | 69,951 | 5,000,500 | ||||||||||||
Distributions reinvested | 62,197 | 1,445 | ||||||||||||
Cost of shares redeemed | (850 | ) | — | |||||||||||
|
|
|
| |||||||||||
Change in net assets resulting from capital transactions | 131,298 | 5,001,945 | ||||||||||||
|
|
|
| |||||||||||
Net increase in net assets | 41,756 | 5,155,033 | ||||||||||||
Net Assets: | ||||||||||||||
Beginning of period | 5,155,033 | — | ||||||||||||
|
|
|
| |||||||||||
End of period | $ | 5,196,789 | $ | 5,155,033 | ||||||||||
|
|
|
| |||||||||||
Undistributed net investment income | $ | 8,071 | $ | 16,439 | ||||||||||
|
|
|
| |||||||||||
Share Transactions: | ||||||||||||||
Issued | 7,130 | 500,051 | ||||||||||||
Reinvested | 6,257 | 150 | ||||||||||||
Redeemed | (81 | ) | — | |||||||||||
|
|
|
| |||||||||||
Change in shares resulting from capital transactions | 13,306 | 500,201 | ||||||||||||
|
|
|
| |||||||||||
(a) For the period from December 3, 2014 (commencement of operations) to March 31, 2015.
See Notes to Financial Statements.
38
FINANCIAL STATEMENTS
|
Statements of Changes in Net Assets (cont.)
International Opportunities Fund | ||||||||||||||
For the Year Ended 2016 |
For the Period Ended 2015(a) | |||||||||||||
From Investment Activities: | ||||||||||||||
Operations: | ||||||||||||||
Net investment income | $ | 67,343 | $ | 9,637 | ||||||||||
Net realized losses from investments and foreign currency transactions | (172,630 | ) | (10,738 | ) | ||||||||||
Net change in unrealized appreciation (depreciation) on investments and foreign currency transactions | (224,851 | ) | 109,459 | |||||||||||
|
|
|
| |||||||||||
Change in net assets resulting from operations | (330,138 | ) | 108,358 | |||||||||||
|
|
|
| |||||||||||
Distributions to Class I Shareholders: | ||||||||||||||
From net investment income | (97,891 | ) | (1,025 | ) | ||||||||||
|
|
|
| |||||||||||
Change in net assets resulting from shareholder distributions | (97,891 | ) | (1,025 | ) | ||||||||||
|
|
|
| |||||||||||
Capital Transactions: | ||||||||||||||
Proceeds from shares issued | 505,607 | 5,200,000 | ||||||||||||
Distributions reinvested | 97,891 | 1,025 | ||||||||||||
Cost of shares redeemed | (765 | ) | — | |||||||||||
|
|
|
| |||||||||||
Change in net assets resulting from capital transactions | 602,733 | 5,201,025 | ||||||||||||
|
|
|
| |||||||||||
Net increase (decrease) in net assets | 174,704 | 5,308,358 | ||||||||||||
Net Assets: | ||||||||||||||
Beginning of period | 5,308,358 | — | ||||||||||||
|
|
|
| |||||||||||
End of period | $ | 5,483,062 | $ | 5,308,358 | ||||||||||
|
|
|
| |||||||||||
Undistributed net investment income | $ | 8,003 | $ | 18,719 | ||||||||||
|
|
|
| |||||||||||
Share Transactions: | ||||||||||||||
Issued | 48,876 | 519,763 | ||||||||||||
Reinvested | 10,560 | 107 | ||||||||||||
Redeemed | (74 | ) | — | |||||||||||
|
|
|
| |||||||||||
Change in shares resulting from capital transactions | 59,362 | 519,870 | ||||||||||||
|
|
|
| |||||||||||
(a) For the period from December 3, 2014 (commencement of operations) to March 31, 2015.
See Notes to Financial Statements.
39
|
RBC Emerging Markets Equity Fund
(Selected data for a share outstanding throughout the periods indicated)
For the 2016 | For the Year Ended 2015 | For the | ||||||||||||||||||||
Class A
| ||||||||||||||||||||||
Per Share Operating Performance: | ||||||||||||||||||||||
Net asset value, beginning of period | $ | 10.99 | $ | 10.20 | $ | 10.00 | ||||||||||||||||
|
|
|
|
|
| |||||||||||||||||
Net investment income(b) | 0.07 | 0.07 | — | |||||||||||||||||||
Realized and unrealized gains/(losses) | (1.11 | ) | 1.05 | 0.20 | ||||||||||||||||||
|
|
|
|
|
| |||||||||||||||||
Total from investment activities | (1.04 | ) | 1.12 | 0.20 | ||||||||||||||||||
|
|
|
|
|
| |||||||||||||||||
Distributions: | ||||||||||||||||||||||
Net investment income | (0.10 | ) | (0.22 | ) | — | |||||||||||||||||
Realized gains | (0.04 | ) | (0.11 | ) | — | |||||||||||||||||
|
|
|
|
|
| |||||||||||||||||
Total distributions | (0.14 | ) | (0.33 | ) | — | |||||||||||||||||
|
|
|
|
|
| |||||||||||||||||
Net asset value, end of period | $ | 9.81 | $ | 10.99 | $ | 10.20 | ||||||||||||||||
|
|
|
|
|
| |||||||||||||||||
Total Return:*(c) | (9.39)% | 11.17 | % | 2.00%(d) | ||||||||||||||||||
Ratios to Average Net Assets: | ||||||||||||||||||||||
Ratio of Net Expenses to Average Net Assets | 1.14%(e) | 1.45 | % | 1.45%(f) | ||||||||||||||||||
Ratio of Net Investment Income to Average Net Assets | 0.71% | 0.64 | % | 0.04%(f) | ||||||||||||||||||
Ratio of Expenses to Average Net Assets** | 2.74% | 4.96 | % | 8.77%(f) | ||||||||||||||||||
Net assets, end of period (in thousands) | $2,540 | $2,849 | $2,550 | |||||||||||||||||||
Portfolio turnover*** | 19 | % | 37 | % | 11 | % | ||||||||||||||||
| * | Excludes sales charge. |
| ** | During the period, certain fees were contractually or voluntarily reduced and/or reimbursed. If such contractual/voluntary fee reductions and reimbursements had not occurred, the ratio would have been as indicated. |
| *** | Portfolio turnover rate is calculated on the basis of the Fund as a whole without distinguishing between the classes of shares issued. |
| (a) | For the period from December 20, 2013 (commencement of operations) to March 31, 2014. |
| (b) | Per share net investment income has been calculated using the average daily shares method. |
| (c) | Assumes investment at net asset value at the beginning of the period, reinvestment of all dividends and distributions, and a complete redemption of the investment at net asset value at the end of the period. |
| (d) | Not Annualized. |
| (e) | Beginning August 3, 2015, the net operating expenses were contractually limited to 0.975% of average daily net assets of Class A. The ratio of net expenses to average net assets represents a blended percentage for the year ended March 31, 2016. |
| (f) | Annualized. |
See Notes to Financial Statements.
40
FINANCIAL HIGHLIGHTS
|
RBC Emerging Markets Equity Fund
(Selected data for a share outstanding throughout the periods indicated)
For the Year Ended 2016 | For the Year Ended March 31, 2015 | For the Period Ended March 31, 2014(a) | ||||||||||||||||||||||||
Class I
| ||||||||||||||||||||||||||
Per Share Operating Performance: | ||||||||||||||||||||||||||
Net asset value, beginning of period | $ | 11.01 | $ | 10.21 | $ | 10.00 | ||||||||||||||||||||
|
|
|
|
|
| |||||||||||||||||||||
Net investment income(b) | 0.06 | 0.09 | 0.01 | |||||||||||||||||||||||
Realized and unrealized gains/(losses) | (1.07 | ) | 1.05 | 0.20 | ||||||||||||||||||||||
|
|
|
|
|
| |||||||||||||||||||||
Total from investment activities | (1.01 | ) | 1.14 | 0.21 | ||||||||||||||||||||||
|
|
|
|
|
| |||||||||||||||||||||
Distributions: | ||||||||||||||||||||||||||
Net investment income | (0.01 | ) | (0.23 | ) | — | |||||||||||||||||||||
Realized gains | (0.04 | ) | (0.11 | ) | — | |||||||||||||||||||||
|
|
|
|
|
| |||||||||||||||||||||
Total distributions | (0.05 | ) | (0.34 | ) | — | |||||||||||||||||||||
|
|
|
|
|
| |||||||||||||||||||||
Net asset value, end of period | $ | 9.95 | $ | 11.01 | $ | 10.21 | ||||||||||||||||||||
|
|
|
|
|
| |||||||||||||||||||||
Total Return:(c) | (9.18)% | 11.38 | % | 2.10%(d) | ||||||||||||||||||||||
Ratios to Average Net Assets: | ||||||||||||||||||||||||||
Ratio of Net Expenses to Average Net Assets | 0.75%(e) | 1.20 | % | 1.20%(f) | ||||||||||||||||||||||
Ratio of Net Investment Income to Average Net Assets | 0.62% | 0.87 | % | 0.29%(f) | ||||||||||||||||||||||
Ratio of Expenses to Average Net Assets* | 1.89% | 4.65 | % | 8.52%(f) | ||||||||||||||||||||||
Net assets, end of period (in thousands) | $75,250 | $4,017 | $2,551 | |||||||||||||||||||||||
Portfolio turnover** | 19 | % | 37 | % | 11 | % | ||||||||||||||||||||
| * | During the period, certain fees were contractually or voluntarily reduced and/or reimbursed. If such contractual/voluntary fee reductions and reimbursements had not occurred, the ratio would have been as indicated. |
| ** | Portfolio turnover rate is calculated on the basis of the Fund as a whole without distinguishing between the classes of shares issued. |
| (a) | For the period from December 20, 2013 (commencement of operations) to March 31, 2014. |
| (b) | Per share net investment income has been calculated using the average daily shares method. |
| (c) | Assumes investment at net asset value at the beginning of the period, reinvestment of all dividends and distributions, and a complete redemption of the investment at net asset value at the end of the period. |
| (d) | Not Annualized. |
| (e) | Beginning August 3, 2015, the net operating expenses were contractually limited to 0.725% of average daily net assets of Class I. The ratio of net expenses to average net assets represents a blended percentage for the year ended March 31, 2016. |
| (f) | Annualized. |
See Notes to Financial Statements.
41
FINANCIAL HIGHLIGHTS
|
RBC Emerging Markets Small Cap Equity Fund
(Selected data for a share outstanding throughout the periods indicated)
For the | For the | For the 2014(a) | ||||||||||||||
Class A | ||||||||||||||||
Per Share Operating Performance: | ||||||||||||||||
Net asset value, beginning of period | $10.49 | $10.37 | $10.00 | |||||||||||||
Net investment income(b) | 0.12 | 0.03 | 0.04 | |||||||||||||
Realized and unrealized gains/(losses) | (1.16 | ) | 0.44 | 0.33 | ||||||||||||
Total from investment activities | (1.04 | ) | 0.47 | 0.37 | ||||||||||||
Distributions: | ||||||||||||||||
Net investment income | (0.02 | ) | (0.20 | ) | — | |||||||||||
Realized gains | (0.08 | ) | (0.15 | ) | — | |||||||||||
Total distributions | (0.10 | ) | (0.35 | ) | — | |||||||||||
Net asset value, end of period | $ 9.35 | $10.49 | $10.37 | |||||||||||||
Total Return:*(c) | (9.86)% | 4.64 | % | 3.70%(d) | ||||||||||||
Ratios to Average Net Assets: | ||||||||||||||||
Ratio of Net Expenses to Average Net Assets | 1.85% | 1.85 | % | 1.85%(e) | ||||||||||||
Ratio of Net Investment Income to Average Net Assets | 1.25% | 0.31 | % | 1.49%(e) | ||||||||||||
Ratio of Expenses to Average Net Assets** | 5.42% | 5.58 | % | 8.96%(e) | ||||||||||||
Net assets, end of period (in thousands) | $2,319 | $2,719 | $2,592 | |||||||||||||
Portfolio turnover*** | 34 | % | 32 | % | 19 | % | ||||||||||
| * | Excludes sales charge. |
| ** | During the period, certain fees were contractually or voluntarily reduced and/or reimbursed. If such contractual/voluntary fee reductions and reimbursements had not occurred, the ratio would have been as indicated. |
| *** | Portfolio turnover rate is calculated on the basis of the Fund as a whole without distinguishing between the classes of shares issued. |
| (a) | For the period from December 20, 2013 (commencement of operations) to March 31, 2014. |
| (b) | Per share net investment income has been calculated using the average daily shares method. |
| (c) | Assumes investment at net asset value at the beginning of the period, reinvestment of all dividends and distributions, and a complete redemption of the investment at net asset value at the end of the period. |
| (d) | Not Annualized. |
| (e) | Annualized. |
See Notes to Financial Statements.
42
FINANCIAL HIGHLIGHTS
|
RBC Emerging Markets Small Cap Equity Fund
(Selected data for a share outstanding throughout the periods indicated)
For the | For the | For the | ||||||||||
Class I | ||||||||||||
Per Share Operating Performance: | ||||||||||||
Net asset value, beginning of period | $10.49 | $10.37 | $10.00 | |||||||||
Net investment income(b) | 0.14 | 0.06 | 0.05 | |||||||||
Realized and unrealized gains/(losses) | (1.15 | ) | 0.44 | 0.32 | ||||||||
Total from investment activities | (1.01 | ) | 0.50 | 0.37 | ||||||||
Distributions: | ||||||||||||
Net investment income | (0.05 | ) | (0.23 | ) | — | |||||||
Realized gains | (0.08 | ) | (0.15 | ) | — | |||||||
Total distributions | (0.13 | ) | (0.38 | ) | — | |||||||
Net asset value, end of period | $ 9.35 | $10.49 | $10.37 | |||||||||
Total Return:(c) | (9.60)% | 4.93 | % | 3.70%(d) | ||||||||
Ratios to Average Net Assets: | ||||||||||||
Ratio of Net Expenses to Average Net Assets | 1.60% | 1.60 | % | 1.60%(e) | ||||||||
Ratio of Net Investment Income to Average Net Assets | 1.50% | 0.56 | % | 1.74%(e) | ||||||||
Ratio of Expenses to Average Net Assets* | 5.17% | 5.32 | % | 8.71%(e) | ||||||||
Net assets, end of period (in thousands) | $2,347 | $2,724 | $2,594 | |||||||||
Portfolio turnover** | 34 | % | 32 | % | 19 | % | ||||||
| * | During the period, certain fees were contractually or voluntarily reduced and/or reimbursed. If such contractual/voluntary fee reductions and reimbursements had not occurred, the ratio would have been as indicated. |
| ** | Portfolio turnover rate is calculated on the basis of the Fund as a whole without distinguishing between the classes of shares issued. |
| (a) | For the period from December 20, 2013 (commencement of operations) to March 31, 2014. |
| (b) | Per share net investment income has been calculated using the average daily shares method. |
| (c) | Assumes investment at net asset value at the beginning of the period, reinvestment of all dividends and distributions, and a complete redemption of the investment at net asset value at the end of the period. |
| (d) | Not Annualized. |
| (e) | Annualized. |
See Notes to Financial Statements.
43
FINANCIAL HIGHLIGHTS
|
RBC Global Opportunities Fund
(Selected data for a share outstanding throughout the period indicated)
| For the Year Ended March 31, 2016 | For the Period Ended March 31, 2015(a) | |||||||
Class I | ||||||||
Per Share Operating Performance: | ||||||||
Net asset value, beginning of period | $10.31 | $10.00 | ||||||
Net investment income(b) | 0.05 | 0.01 | ||||||
Realized and unrealized gains/(losses) | (0.12 | ) | 0.30 | |||||
Total from investment activities | (0.07 | ) | 0.31 | |||||
Distributions: | ||||||||
Net investment income | (0.12) | 0.00(c) | ||||||
Total distributions | (0.12) | 0.00(c) | ||||||
Net asset value, end of period | $10.12 | $10.31 | ||||||
Total Return:(d) | (0.63 | )% | 3.13%(e) | |||||
Ratios to Average Net Assets: | ||||||||
Ratio of Net Expenses to Average Net Assets | 1.05 | % | 1.05%(f) | |||||
Ratio of Net Investment Income to Average Net Assets | 0.48 | % | 0.19%(f) | |||||
Ratio of Expenses to Average Net Assets* | 3.97 | % | 3.46%(f) | |||||
Net assets, end of period (in thousands) | $5,197 | $5,155 | ||||||
Portfolio turnover** | 34 | % | 11 | % | ||||
| * | During the year, certain fees were contractually or voluntarily reduced and/or reimbursed. If such contractual/voluntary fee reductions and reimbursements had not occurred, the ratio would have been as indicated. |
| ** | Portfolio turnover rate is calculated on the basis of the Fund as a whole without distinguishing between the classes of shares issued. |
| (a) | For the period from December 3, 2014 (commencement of operations) to March 31, 2015. |
| (b) | Per share net investment income has been calculated using the average daily shares method. |
| (c) | Less than $0.01 or $(0.01) per share. |
| (d) | Assumes investment at net asset value at the beginning of the period, reinvestment of all dividends and distributions, and a complete redemption of the investment at net asset value at the end of the period. |
| (e) | Not Annualized. |
| (f) | Annualized. |
See Notes to Financial Statements.
44
FINANCIAL HIGHLIGHTS
|
RBC International Opportunities Fund
(Selected data for a share outstanding throughout the period indicated)
For the | For the | |||||||
Class I | ||||||||
Per Share Operating Performance: | ||||||||
Net asset value, beginning of period | $10.21 | $10.00 | ||||||
Net investment income(b) | 0.12 | 0.02 | ||||||
Realized and unrealized gains/(losses) | (0.69 | ) | 0.19 | |||||
Total from investment activities | (0.57 | ) | 0.21 | |||||
Distributions: | ||||||||
Net investment income | (0.17) | 0.00(c) | ||||||
Total distributions | (0.17) | 0.00(c) | ||||||
Net asset value, end of period | $ 9.47 | $10.21 | ||||||
Total Return:(d) | (5.52 | )% | 2.12%(e) | |||||
Ratios to Average Net Assets: | ||||||||
Ratio of Net Expenses to Average Net Assets | 1.00% | 1.00%(f) | ||||||
Ratio of Net Investment Income to Average Net Assets | 1.23% | 0.59%(f) | ||||||
Ratio of Expenses to Average Net Assets* | 3.92% | 3.50%(f) | ||||||
Net assets, end of period (in thousands) | $5,483 | $5,308 | ||||||
Portfolio turnover** | 35 | % | 8 | % | ||||
| * | During the year, certain fees were contractually or voluntarily reduced and/or reimbursed. If such contractual/voluntary fee reductions and reimbursements had not occurred, the ratio would have been as indicated. |
| ** | Portfolio turnover rate is calculated on the basis of the Fund as a whole without distinguishing between the classes of shares issued. |
| (a) | For the period from December 3, 2014 (commencement of operations) to March 31, 2015. |
| (b) | Per share net investment income has been calculated using the average daily shares method. |
| (c) | Less than $0.01 or $(0.01) per share. |
| (d) | Assumes investment at net asset value at the beginning of the period, reinvestment of all dividends and distributions, and a complete redemption of the investment at net asset value at the end of the period. |
| (e) | Not Annualized. |
| (f) | Annualized. |
See Notes to Financial Statements.
45
|
March 31, 2016
1.Organization:
RBC Funds Trust (the “Trust”) is registered under the Investment Company Act of 1940 (as amended) as an open-end management investment company. The Trust was organized as a Delaware statutory trust on December 16, 2003 and currently consists of 22 portfolios. This report includes the following four investment portfolios (each a “Fund” and collectively, the “Funds”):
- RBC Emerging Markets Equity Fund (“Emerging Markets Equity Fund”)
- RBC Emerging Markets Small Cap Equity Fund (“Emerging Markets Small Cap Equity Fund”)
- RBC Global Opportunities Fund (“Global Opportunities Fund”)
- RBC International Opportunities Fund (“International Opportunities Fund”)
Emerging Markets Equity Fund and Emerging Markets Small Cap Equity Fund offer two share classes: Class A and Class I shares. Global Opportunities Fund and International Opportunities Fund offer Class I shares. Class A shares are offered with a 5.75% maximum front-end sales charge and a 1.00% contingent deferred sales charge (“CDSC”) for redemption within 12 months of a $1 million or greater purchase on which no front-end sales charge was paid. Class I shares (intended for investors meeting certain investment minimum thresholds) are not subject to either a front-end sales charge or a CDSC.
RBC Global Asset Management (U.S.) Inc. (“RBC GAM (US)” or “Advisor” or “Co-Administrator”) acts as the investment advisor for the Funds and RBC Global Asset Management (UK) Limited (“RBC GAM (UK)” or “Sub-Advisor”) serves as the investment sub-advisor. The officers of the Trust (“Fund Management”) are also employees of RBC GAM (US).
2. Significant Accounting Policies:
The Trust, which is an investment company within the scope of Financial Accounting Standards Board (“FASB”) Accounting Standard Update 2013-08, follows accounting and reporting guidance under FASB Accounting Standards Codification Topic 946, “Financial Services-Investment Companies.” Summarized below are the significant accounting policies of the Funds. These policies conform to accounting principles generally accepted in the United States of America (“US GAAP”). Fund Management follows these policies when preparing financial statements. Fund Management may also be required to make estimates and assumptions that affect the reported amounts of assets and liabilities at the date of the financial statements and the reported amounts of income and expenses for the period. Actual results could differ from those estimates. The financial statements are as of the close of regular trading on the New York Stock Exchange (“NYSE”).
Security Valuation:
The Trust’s Board of Trustees (the “Board”) has adopted pricing and valuation procedures for determining the fair value of each Fund’s investments. Fair value of a security is considered to be the price that a fund might reasonably expect to receive upon its current sale in an orderly transaction between market participants.
Equity securities are generally valued on the basis of prices furnished by third-party pricing services approved by the Board. Equity securities listed on one or more exchanges shall be valued at the last available quoted sale price on the primary trading exchange as of the close of regular trading on the exchange and are categorized as Level 1 in the fair value hierarchy. An equity security not listed on an exchange but listed on NASDAQ shall be valued at the NASDAQ official closing price and is also categorized as Level 1. If there was no sale on the primary exchange on the day the net asset value is calculated or a NASDAQ official closing price is not available, the most recent bid quotation generally will be used and such securities will be generally categorized as Level 2. Investments in open-end
46
NOTES TO FINANCIAL STATEMENTS
|
investment companies (mutual funds) are valued at net asset value and are categorized as Level 1 in the fair value hierarchy.
Fixed income securities, including to-be-announced (“TBA”) commitments and municipal bonds, are generally valued based on evaluated prices received from third-party pricing services or from broker-dealers who make markets in the securities and are generally categorized as Level 2 in the fair value hierarchy. The pricing services utilize both dealer-supplied valuations and electronic data processing techniques that take into account multiple appropriate factors such as institutional-size trading in similar groups of securities, market spreads, interest rates, and fundamental security analytical data including yield, quality, coupon rate, maturity and type of issue.
Foreign securities valued in non-U.S. dollars are valued in the foreign currency and then converted into the U.S. dollar equivalent using the foreign exchange rate in effect at the close of the NYSE on the day the security’s value is determined. The value of securities traded in markets outside the United States may be affected on a day that the NYSE is closed and an investor is not able to purchase, exchange or redeem shares of the Funds.
Many securities markets and exchanges outside of North American time zones close prior to the close of the NYSE; therefore, the closing prices for equity securities in such markets or on such exchanges may not fully reflect events that occur after such close but before the close of the NYSE. The Funds have procedures in place to fair value foreign equity securities traded in countries outside North American time zones daily in order to take into account, among other things, any significant events occurring after the close of trading in a foreign market. The Funds receive adjusted fair value prices from a designated independent pricing vendor. In general, the vendor utilizes a multi-factor model to consider such information as the issue’s closing price, relevant general and sector indices and currency fluctuations to generate an evaluated adjustment factor for each security and provide an evaluated fair value price. The Funds generally categorize such evaluated fair value prices as Level 2 in the fair value hierarchy.
The Board has delegated to the Funds’ Pricing Committee (“Pricing Committee”) the responsibility for implementing the pricing and valuation procedures, including responsibility for determining the fair value of the Funds’ securities. The Pricing Committee includes representatives of the Funds’ Advisor and Co-Administrator, including personnel from accounting and operations, investment management, trading, risk management, compliance and legal. The Pricing Committee meets at least quarterly to review and approve Fund valuation matters, including a review of the Funds’ pricing activity and operations, fair value measurements, pricing vendors, policies and procedures, and related controls. At least a quorum of the Pricing Committee shall meet more frequently, as needed, to consider and approve time-sensitive fair valuation matters. The Pricing Committee reports to the Valuation, Portfolio Management and Performance Committee (“Valuation Committee”) of the Board. Members of the Pricing Committee meet with the Valuation Committee and the Board at each of their regularly scheduled meetings to discuss valuation matters and actions taken during the period.
The Board has adopted procedures to determine the fair value of a security when a price is not available from a pricing service or broker-dealer or Fund Management determines that a price provided by a pricing service or broker-dealer does not approximate fair value. Fair valuation may also be used when a significant valuation event affecting the value of a security or market sector is determined to have occurred between the time when a security’s market closes and the time the Fund’s net asset value is calculated. The fair value of the security will be determined in good faith by the Pricing Committee in accordance with procedures and methodologies adopted by the Board. General factors used in determining the fair value of securities include, but are not limited to, fundamental analytical data relating to the security, the issuer and the market, such as duration, prepayment and default rates; general level of interest rates and changes in interest rates; information from broker-dealers; trading in similar securities; any restrictions on disposition of the security; and an evaluation of the forces that influence the market in which the investments are traded. These securities are either categorized as Level 2 or 3 in the fair value hierarchy, depending on the relevant inputs used.
47
NOTES TO FINANCIAL STATEMENTS
|
When the Funds utilize fair valuation methods that use significant unobservable inputs to determine a security’s value, such securities will be categorized as Level 3 of the fair value hierarchy. These methods may require subjective determinations about the value of a security. While the Funds’ policy is intended to result in a calculation of a Fund’s net asset value that fairly reflects security values as of the time of pricing, the Funds cannot guarantee that values determined by the Board or persons acting at their direction would accurately reflect the price that the Funds could obtain for a security if they were to dispose of it as of the time of pricing (for instance, in a forced or distressed sale). The prices used by the Funds may differ from the value that would be realized if the securities were sold.
The Pricing Committee employs various methods for calibrating the valuation approach related to securities categorized within Level 2 and Level 3 of the fair value hierarchy. These methods may include regular due diligence of the Funds’ pricing vendors, a regular review of key inputs and assumptions, transaction back-testing or disposition analysis to compare unrealized gains and losses to realized gains and losses, reviews of missing and stale prices and large movements in market value, and reviews of any market related activities. Additionally, the pricing of all fair value holdings is subsequently reported to the Valuation Committee and Board.
Fair Value Measurements:
The Funds disclose the fair value of their investments in a hierarchy that categorizes investments based on the inputs to valuation techniques used to measure fair value. The three levels of the fair value hierarchy are as follows:
● Level 1 - Inputs that reflect unadjusted quoted prices in active markets for identical assets or liabilities that the Funds have the ability to access at the measurement date.
● Level 2 - Significant inputs other than quoted prices that are observable for the asset or liability either directly or indirectly, including inputs in markets that are not considered to be active. Observable inputs may include quoted prices for similar securities, interest rates, spreads, prepayment speeds, etc.
● Level 3 - Significant unobservable inputs based on the best information available in the circumstances, to the extent observable inputs are not available (including the Fund’s own assumptions in determining the fair value of investments).
The inputs or methodology used for valuing investments are not necessarily an indication of the risk associated with investing in those securities.
Inputs used in determining fair value of an investment may include, but are not limited to, price information, volatility statistics, credit and market data, and other factors, all of which may be either observable or unobservable. Inputs can vary among investments and will be impacted by the investment type and volume of activity for the particular security or similar securities in the market. Investments in the Level 3 category are generally supported by transactions and quoted prices from dealers participating in the market for those investments. Investments may be included in the Level 3 category due to a lack of market activity or transparency. Internal valuation models may also be used as a pricing source for Level 3 investments. Internal valuation models may rely on one or more unobservable inputs, such as estimated cash flows, financial statement analysis and discount rates.
The summary of inputs used to determine the fair value of each Fund’s investments as of March 31, 2016 is as follows:
Level 1 | Level 2 | Level 3 | Total | |||||||||||||
Emerging Markets Equity Fund Investments in Securities | ||||||||||||||||
Common Stocks: | ||||||||||||||||
Brazil | $5,121,342 | $ — | $ — | $ 5,121,342 | ||||||||||||
Chile | 1,304,300 | — | — | 1,304,300 | ||||||||||||
China | 2,836,004 | 14,059,764 | — | 16,895,768 | ||||||||||||
48
NOTES TO FINANCIAL STATEMENTS
|
Level 1 Quoted Prices | Level 2 | Level 3 | Total | |||||||||||||
Common Stocks: (continued) | ||||||||||||||||
India | $ 8,427,260 | $ 2,632,317 | — | $11,059,577 | ||||||||||||
Indonesia | — | 2,331,413 | — | 2,331,413 | ||||||||||||
Jordan | — | 1,192,109 | — | 1,192,109 | ||||||||||||
Korea | — | 4,968,670 | — | 4,968,670 | ||||||||||||
Malaysia | — | 2,826,753 | — | 2,826,753 | ||||||||||||
Mexico | 1,905,962 | — | — | 1,905,962 | ||||||||||||
Nigeria | — | 379,798 | — | 379,798 | ||||||||||||
Peru | 1,741,254 | — | — | 1,741,254 | ||||||||||||
Philippines | — | 2,548,227 | — | 2,548,227 | ||||||||||||
Poland | — | 910,289 | — | 910,289 | ||||||||||||
Russia | 818,096 | — | — | 818,096 | ||||||||||||
South Africa | — | 5,490,851 | — | 5,490,851 | ||||||||||||
Taiwan | — | 7,688,390 | — | 7,688,390 | ||||||||||||
Thailand | — | 1,001,933 | — | 1,001,933 | ||||||||||||
Turkey | — | 1,820,683 | — | 1,820,683 | ||||||||||||
United Arab Emirates | — | 866,934 | — | 866,934 | ||||||||||||
Total Common Stocks | 22,154,218 | 48,718,131 | — | 70,872,349 | ||||||||||||
Preferred Stock | ||||||||||||||||
Korea | — | 3,357,029 | — | 3,357,029 | ||||||||||||
Investment Company | 3,690,845 | — | — | 3,690,845 | ||||||||||||
Total Investments | $25,845,063 | $52,075,160 | $ — | $77,920,223 | ||||||||||||
Level 1 | Level 2 | Level 3 | Total | |||||||||||||
Emerging Markets Small Cap Equity Fund Investments in Securities | ||||||||||||||||
Common Stocks: | ||||||||||||||||
Brazil | $ 277,848 | $ — | $ — | $ 277,848 | ||||||||||||
Chile | 287,890 | — | — | 287,890 | ||||||||||||
China | 90,515 | 327,946 | — | 418,461 | ||||||||||||
Egypt | 93,642 | — | — | 93,642 | ||||||||||||
Hong Kong | — | 88,738 | 88,738 | |||||||||||||
Indonesia | — | 182,745 | — | 182,745 | ||||||||||||
Korea | — | 241,868 | — | 241,868 | ||||||||||||
Malaysia | — | 184,135 | — | 184,135 | ||||||||||||
Mexico | 125,816 | — | — | 125,816 | ||||||||||||
Nigeria | — | 23,322 | — | 23,322 | ||||||||||||
Philippines | — | 258,865 | — | 258,865 | ||||||||||||
South Africa | — | 420,448 | — | 420,448 | ||||||||||||
Taiwan | — | 587,175 | — | 587,175 | ||||||||||||
Thailand | — | 403,055 | — | 403,055 | ||||||||||||
Total Common Stocks | 875,711 | 2,718,297 | — | 3,594,008 | ||||||||||||
49
NOTES TO FINANCIAL STATEMENTS
|
Level 1 | Level 2 | Level 3 | Total | |||||||||||||||||||
Equity Linked Securities | ||||||||||||||||||||||
India | $ — | $ 290,008 | $ — | $ 290,008 | ||||||||||||||||||
Luxembourg | — | 129,213 | — | 129,213 | ||||||||||||||||||
Exchange Traded Funds | ||||||||||||||||||||||
India | 192,050 | — | — | 192,050 | ||||||||||||||||||
Preferred Stock | ||||||||||||||||||||||
Korea | — | 141,287 | — | 141,287 | ||||||||||||||||||
Philippines | — | — | 126 | 126 | ||||||||||||||||||
Investment Company | 316,905 | — | — | 316,905 | ||||||||||||||||||
|
|
|
| |||||||||||||||||||
Total Investments | $ 1,384,666 | $3,278,805 | $ 126 | $4,663,597 | ||||||||||||||||||
|
|
|
| |||||||||||||||||||
|
|
|
| |||||||||||||||||||
Level 1 | Level 2 | Level 3 | Total | |||||||||||||||||||
Global Opportunities Fund | ||||||||||||||||||||||
Common Stocks: | ||||||||||||||||||||||
Belgium | $ — | $ 170,081 | $ — | $ 170,081 | ||||||||||||||||||
France | — | 360,061 | — | 360,061 | ||||||||||||||||||
Germany | — | 216,519 | — | 216,519 | ||||||||||||||||||
Hong Kong | — | 94,355 | — | 94,355 | ||||||||||||||||||
India | 197,216 | — | — | 197,216 | ||||||||||||||||||
Ireland | — | 78,868 | — | 78,868 | ||||||||||||||||||
Japan | — | 172,244 | — | 172,244 | ||||||||||||||||||
South Africa | — | 166,304 | — | 166,304 | ||||||||||||||||||
Switzerland | — | 174,579 | — | 174,579 | ||||||||||||||||||
Taiwan | 131,000 | — | — | 131,000 | ||||||||||||||||||
United Kingdom | — | 325,362 | — | 325,362 | ||||||||||||||||||
United States | 3,148,913 | — | — | 3,148,913 | ||||||||||||||||||
|
|
|
| |||||||||||||||||||
Total Common Stocks | 3,477,129 | 1,758,373 | — | 5,235,502 | ||||||||||||||||||
Investment Company | 47,618 | — | — | 47,618 | ||||||||||||||||||
|
|
|
| |||||||||||||||||||
Total Investments | $ 3,524,747 | $1,758,373 | $ — | $5,283,120 | ||||||||||||||||||
|
|
|
| |||||||||||||||||||
|
|
|
| |||||||||||||||||||
Level 1 | Level 2 | Level 3 | Total
| |||||||||||||||||||
International Opportunities Fund | ||||||||||||||||||||||
Common Stocks: | ||||||||||||||||||||||
Australia | $ — | $ 168,168 | $ — | $ 168,168 | ||||||||||||||||||
Belgium | — | 256,922 | — | 256,922 | ||||||||||||||||||
France | — | �� | 561,053 | — | 561,053 | |||||||||||||||||
Germany | — | 363,884 | — | 363,884 | ||||||||||||||||||
Hong Kong | — | 213,719 | — | 213,719 | ||||||||||||||||||
India | 228,031 | — | — | 228,031 | ||||||||||||||||||
Ireland | — | 81,789 | — | 81,789 | ||||||||||||||||||
Japan | — | 818,562 | — | 818,562 | ||||||||||||||||||
Korea | — | 188,553 | — | 188,553 | ||||||||||||||||||
Netherlands | — | 161,757 | — | 161,757 | ||||||||||||||||||
Philippines | — | 199,263 | — | 199,263 | ||||||||||||||||||
South Africa | — | 244,647 | — | 244,647 | ||||||||||||||||||
Spain | — | 81,524 | — | 81,524 | ||||||||||||||||||
Sweden | — | 131,032 | — | 131,032 | ||||||||||||||||||
50
NOTES TO FINANCIAL STATEMENTS
|
Level 1 | Level 2 | Level 3 | Total
| |||||||||||||||||||
Common Stocks: (continued) | ||||||||||||||||||||||
Switzerland | $ — | $ 538,370 | $ — | $ 538,370 | ||||||||||||||||||
Taiwan | 222,700 | — | — | 222,700 | ||||||||||||||||||
United Kingdom | 81,120 | 966,617 | — | 1,047,737 | ||||||||||||||||||
|
|
|
| |||||||||||||||||||
Total Common Stocks | 531,851 | 4,975,860 | — | 5,507,711 | ||||||||||||||||||
Investment Company | 57,051 | — | — | 57,051 | ||||||||||||||||||
|
|
|
| |||||||||||||||||||
Total Investments | $ 588,902 | $4,975,860 | $ — | $5,564,762 | ||||||||||||||||||
|
|
|
| |||||||||||||||||||
|
|
|
| |||||||||||||||||||
The Funds did not have any liabilities that were measured at fair value on a recurring basis at March 31, 2016.
During the year ended March 31, 2016, the Funds, except Emerging Markets Small Cap Equity Fund, recognized no transfers to/from Level 1 or Level 2. The Emerging Markets Small Cap Equity Fund recognized a transfer from Level 2 to Level 1 in the amount of $21,465 since the trading market became active for the security. The Funds’ policy is to recognize transfers between Level 1, Level 2 and Level 3 at the end of the year utilizing fair value at the beginning of the year.
The following is a reconciliation of Level 3 investments for which significant unobservable inputs were used to determine fair value:
| Emerging Markets Equity Fund | Emerging Markets Small Cap Equity Fund | |||||||||||||||||||
| Preferred Stock (China) |
| Preferred Stock (Philippines) | Convertible Bonds (Oman) | |||||||||||||||||
Balance as of 3/31/15 (value) | $ | 25,761 | $ | 130 | $ | 1,813 | ||||||||||||||
Purchases | — | — | — | |||||||||||||||||
Sales (Paydowns) | (25,761 | ) | — | (1,705 | ) | |||||||||||||||
Realized gain (loss) | — | — | (126 | ) | ||||||||||||||||
Change in unrealized appreciation (depreciation) | — | (4 | )* | 18 | ||||||||||||||||
|
|
|
|
|
| |||||||||||||||
Balance as of 3/31/16 (value) | $ | — | $ | 126 | $ | — | ||||||||||||||
|
|
|
|
|
| |||||||||||||||
|
|
|
|
|
| |||||||||||||||
* Net change in unrealized appreciation/(depreciation) in Level 3 securities still held at March 31, 2016.
The Funds’ assets assigned to the Level 3 category were valued using market data or trade information specific to the security or comparable issues. However, due to a lack of market activity or corroborating data to support the valuations, the investments were classified as Level 3.
The significant unobservable inputs used in fair value measurement of the Funds’ investments are (i) an estimation of a normalized earnings level for the company and (ii) the likelihood of achieving normalized earnings. Significant changes in any of those inputs in isolation would result in a significantly lower or higher fair value measurement. Generally, a change in the assumptions used for the normalized earnings level will be accompanied by a directionally similar change in the discounts applied to the list of comparable investments.
Repurchase Agreements:
The Funds may enter into repurchase agreements with counterparties whom the Advisor has deemed creditworthy, including primary dealers that report to the Federal Reserve Bank of New York or other large U.S. commercial banks or broker-dealers. These repurchase agreements are subject to the seller’s
51
NOTES TO FINANCIAL STATEMENTS
|
agreement to repurchase such securities at a mutually agreed upon date and price. The repurchase price generally equals the price paid by the Funds plus interest negotiated on the basis of current short-term rates.
Securities pledged as collateral for repurchase agreements are held by a custodian bank until maturity of the repurchase agreement. The Funds have procedures to monitor additional collateral, if needed, to ensure that the daily market value of the collateral remains in excess of the repurchase agreement in the event of a default. There were no repurchase agreements held at March 31, 2016.
Offering Costs:
Upon commencement of operations, offering costs associated with the establishment of the Funds were incurred by the Funds. Offering costs are amortized and included in expenses over a 12-month period beginning with the commencement of operations and are included in the Statements of Operations. Unamortized offering costs are included in prepaid expenses on the Statements of Assets and Liabilities.
Investment Transactions and Income:
Investment transactions are recorded on one business day after trade date, except on the last day of each fiscal quarter end, when they are recorded on trade date. Dividend income is recorded on the ex-dividend date. Realized gains and losses from investment transactions are calculated based on the cost of the specific security (also known as identified cost basis). Interest income is recognized on the accrual basis and includes, where applicable, the amortization or accretion of premium or discount using the effective yield method.
Expense, Investment Income and Gain/Loss Allocation:
Each Fund pays the expenses that are directly related to its operations, such as custodian fees or investment advisory fees. Expenses incurred by the Trust, such as trustee or legal fees, are allocated among each of the Funds in the Trust either proportionately based upon each Fund’s relative net assets or using another reasonable basis such as equally across all Funds in the Trust. Individual share classes within a Fund are charged expenses specific to that class, such as distribution fees and transfer agent fees. Within a Fund, expenses other than class specific expenses are allocated daily to each class based upon the proportion of relative net assets. Investment income and realized and unrealized gains or losses are allocated to each class of shares based on relative net assets.
Real Estate Investment Trusts:
The Funds may own shares of real estate investment trusts (“REITs”) which report information on the source of their distributions annually. Dividends paid by a REIT, other than capital gain distributions, will be taxable as ordinary income up to the amount of the REIT’s current and accumulated earnings and profits. Capital gain dividends paid by a REIT to a fund will be treated as long term capital gains by the Fund and, in turn, may be distributed by the Fund to its shareholders as a capital gain distribution. Distributions received from a REIT in excess of its income are recorded as a return of capital and a reduction to the cost basis of the REIT.
Distributions to Shareholders:
Each Fund pays out any income that it receives, less expenses, in the form of dividends and capital gain distributions to its shareholders. Income dividends and capital gain distributions for each Fund are declared and paid at least annually. Distributions to shareholders are recorded on the ex-dividend date. The amount of dividends and distributions are calculated based on federal income tax regulations, which may differ from US GAAP. These “book/tax” differences may be either temporary or permanent in nature. To the extent these differences are determined, as of the end of the tax year, to be permanent (e.g., foreign currency transactions, partnership transactions and non deductible expenses), they are reclassified within a Fund’s capital accounts based on their federal tax basis treatment.
52
NOTES TO FINANCIAL STATEMENTS
|
For the year ended March 31, 2016, permanent difference reclassification amounts were as follows:
| Decrease Paid in Capital | Increase Undistributed Net Investment Income/(Loss) | Increase Accumulated Realized Gain/(Loss) | ||||||||||||||
Emerging Markets Equity Fund | $ | (883) | $ | (112,581) | $113,464 | |||||||||||
Emerging Markets Small Cap Equity Fund | (206) | (6,387) | 6,593 | |||||||||||||
Global Opportunities Fund | (32,239) | 28,904 | 3,335 | |||||||||||||
International Opportunities Fund | (32,253) | 19,832 | 12,421 | |||||||||||||
3. Agreements and Other Transactions with Affiliates:
The Trust has entered into investment advisory agreements with RBC GAM (US) under which RBC GAM (US) manages each Fund’s assets and furnishes related office facilities, equipment, research and personnel. The agreements require each Fund to pay RBC GAM (US) a monthly fee based upon average daily net assets. Under the terms of the advisory contracts, RBC GAM (US) is entitled to receive fees based on a percentage of the average daily net assets of each of the Funds as follows:
| Annual Rate | ||
Emerging Markets Equity Fund | 0.95% | |
Emerging Markets Small Cap Equity Fund | 1.25% | |
Global Opportunities Fund | 0.85% | |
International Opportunities Fund | 0.80% |
RBC GAM (US) has contractually agreed to waive fees and/or make payments in order to keep total operating expenses (excluding certain fees such as interest, taxes and acquired fund fees and expenses) of Class A and Class I shares of each Fund to the following levels:
| Class A Annual Rate | Class I Annual Rate | |||||
Emerging Markets Equity Fund | 0.975%* | 0.725%* | ||||
Emerging Markets Small Cap Equity Fund | 1.85% | 1.60% | ||||
Global Opportunities Fund | N/A | 1.05% | ||||
International Opportunities Fund | N/A | 1.00% |
| * | Prior to August 3, 2015, the annual rate for Emerging Markets Equity Fund under the expense limitation agreement was 1.20% for Class I and 1.45% for Class A. |
This expense limitation agreement is in place until July 31, 2017 (October 31, 2017 for Emerging Markets Equity Fund). Each Fund will carry forward, for a period not to exceed 3 years from the end of the fiscal year in which a waiver or reimbursement is made by RBC GAM (US), any expenses in excess of the expense limitation and repay RBC GAM (US) such amounts, provided the Fund is able to effect such repayment and remain in compliance with the expense limitation.
At March 31, 2016, the amounts subject to possible recoupment under the expense limitation agreement were:
| FYE 3/31/14 (Expiration Date 3/31/17) | FYE 3/31/15 (Expiration Date 3/31/18) | FYE 3/31/16 (Expiration Date 3/31/19) | Total | |||||||||||||
Emerging Markets Equity Fund | $97,097 | $201,948 | $338,439 | $637,484 | ||||||||||||
Emerging Markets Small Cap Equity Fund | 95,703 | 202,750 | 171,048 | 469,501 | ||||||||||||
Global Opportunities Fund | — | 70,819 | 150,126 | 220,945 | ||||||||||||
International Opportunities Fund | — | 72,565 | 159,942 | 232,507 | ||||||||||||
53
NOTES TO FINANCIAL STATEMENTS
|
RBC GAM (US) may also voluntarily waive and/or reimburse operating expenses of any Fund from time to time. Any such voluntary program may be changed or eliminated at any time without notice, and expenses waived under such program are not subject to recoupment. There were no voluntary waivers for the year ended March 31, 2016.
The Funds are sub-advised by RBC GAM (UK), which is a wholly-owned subsidiary of Royal Bank of Canada, which is the parent company of the Advisor. The Sub-Advisor is paid by the Advisor out of the advisory fee paid by the Funds to the Advisor.
RBC GAM (US) serves as co-administrator to the Funds. BNY Mellon Investment Servicing (US) Inc. (“BNY Mellon”) serves as co-administrator and fund accounting agent. Services provided under the administrative services contract include providing day-to-day administration of matters related to the Funds, maintenance of their records and the preparation of reports. Under the terms of the administrative services contract, RBC GAM (US) does not receive a fee for its role as co-administrator. BNY Mellon receives a fee for its services payable by each Fund based on each Fund’s average net assets. BNY Mellon’s fee is included with “Accounting fees” in the Statements of Operations.
Certain Officers and Trustees of the Trust are affiliated with the Advisor. Such Officers and Trustees receive no compensation from the Funds for serving in their respective roles.
The Trust currently pays each of the independent Trustees (Trustees of the Trust who are not directors, officers or employees of the Advisor, either Co-Administrator or Distributor) an annual retainer of $46,000 ($41,500 prior to October 1, 2015). The Board Chairperson and Audit Committee Chairperson each receive an additional retainer of $2,500 annually, and all other trustees serving as Chair of a Board committee each receive an additional retainer of $1,000 annually. In addition, Independent Trustees receive a quarterly meeting fee of $6,000 ($5,500 prior to October 1, 2015) for each in-person Board meeting attended, a meeting fee of $1,500 for each telephonic or Special Board meeting attended, a $1,500 fee for each Board committee meeting attended, and are reimbursed for all out-of-pocket expenses relating to attendance at such meetings.
In conjunction with the launch of each of the Funds, the Advisor invested seed capital to provide the Fund with each of the Fund’s initial investment assets. The table below shows, as of March 31, 2016, each Fund’s net assets, the shares of each Fund held by the Advisor, and the percent of total net assets represented by the Advisor’s investment.
| Net Assets | Shares held by Advisor | % of Fund Net Assets | ||||||||||
Emerging Markets Equity Fund | $77,790,468 | 494,934 | 6.3% | |||||||||
Emerging Markets Small Cap Equity Fund | 4,665,776 | 496,234 | 99.4% | |||||||||
Global Opportunities Fund | 5,196,789 | 506,338 | 98.6% | |||||||||
International Opportunities Fund | 5,483,062 | 509,420 | 88.0% | |||||||||
4. Fund Distribution:
Each of the Funds has adopted a Master Distribution 12b-1 Plan (the “Plan”) in which Quasar Distributors LLC (the “Distributor”) acts as the Funds’ distributor. The Plan permits each Fund to make payments for or to reimburse the Distributor for distribution-related costs and expenses of marketing shares of Class A covered under the Plan, and/or for providing shareholder services. The Plan does not apply to Class I. The current Plan fee rate for Class A is 0.25%.
Under the 12b-1 plan, the maximum fee rate for Class A shares is 0.50%. Currently the Board of Trustees has approved an annual limit of 0.25%.
Plan fees are based on average daily net assets of Class A. Up to 0.25% of each Plan fee may be designated as a Service Fee, as defined by the applicable rules of the Financial Industry Regulatory Authority. The Distributor, subject to applicable legal requirements, may waive a Plan fee voluntarily, in whole or in part. For the year ended March 31, 2016, there were no fees waived by the Distributor.
54
NOTES TO FINANCIAL STATEMENTS
|
For the year ended March 31, 2016, the Distributor received commissions of $7,863 from front-end sales charges of Class A shares of the Funds, of which $1,801 was paid to affiliated broker-dealers, and the remainder was either paid to unaffiliated broker-dealers or retained by the Distributor.
The Distributor did not receive any CDSC fees from Class A shares of the Funds during the year ended March 31, 2016.
5. Securities Transactions:
The cost of securities purchased and proceeds from securities sold (excluding securities maturing less than one year from acquisition) for the year ended March 31, 2016 were as follows:
| Purchases | Sales | |||||||
Emerging Markets Equity Fund | $72,166,841 | $5,521,531 | ||||||
Emerging Markets Small Cap Equity Fund | 1,571,116 | 1,983,851 | ||||||
Global Opportunities Fund | 1,953,127 | 1,752,062 | ||||||
International Opportunities Fund | 2,510,239 | 1,896,791 | ||||||
6. Capital Share Transactions:
The Trust is authorized to issue an unlimited number of shares of beneficial interest (“shares outstanding”) without par value. Transactions in capital stock of the Funds are summarized below:
| Emerging Markets Equity Fund | Emerging Markets Small Cap Equity Fund | |||||||||||||||
| For the Year Ended March 31, 2016 | For the Year Ended March 31, 2015 | For the Year Ended March 31, 2016 | For the Year Ended March 31, 2015 | |||||||||||||
CAPITAL TRANSACTIONS: | �� | |||||||||||||||
Class A | ||||||||||||||||
Proceeds from shares issued | $ | 1,512,867 | $ | 14,768 | $ | 4,712 | $ | 25,406 | ||||||||
Distributions reinvested | 39,863 | 82,022 | 24,467 | 87,418 | ||||||||||||
Cost of shares redeemed | (1,514,293 | ) | (10 | ) | (130,922 | ) | (19,020 | ) | ||||||||
|
|
|
|
|
|
|
| |||||||||
Change in Class A | $ | 38,437 | $ | 96,780 | $ | (101,743 | ) | $ | 93,804 | |||||||
|
|
|
|
|
|
|
| |||||||||
Class I | ||||||||||||||||
Proceeds from shares issued | $ | 72,279,556 | $ | 1,136,660 | $ | 16,950 | $ | 5,356 | ||||||||
Distributions reinvested | 159,606 | 93,104 | 30,848 | 93,995 | ||||||||||||
Cost of shares redeemed | (2,281,413 | ) | — | (125,000 | ) | (2,853 | ) | |||||||||
|
|
|
|
|
|
|
| |||||||||
Change in Class I | $ | 70,157,749 | $ | 1,229,764 | $ | (77,202 | ) | $ | 96,498 | |||||||
|
|
|
|
|
|
|
| |||||||||
Change in net assets resulting from capital transactions | $ | 70,196,186 | $ | 1,326,544 | $ | (178,945 | ) | $ | 190,302 | |||||||
|
|
|
|
|
|
|
| |||||||||
|
|
|
|
|
|
|
| |||||||||
SHARE TRANSACTIONS: | ||||||||||||||||
Class A | ||||||||||||||||
Issued | 150,642 | 1,376 | 554 | 2,341 | ||||||||||||
Reinvested | 4,342 | 7,940 | 2,781 | 8,664 | ||||||||||||
Redeemed | (155,292 | ) | (1 | ) | (14,588 | ) | (1,767 | ) | ||||||||
|
|
|
|
|
|
|
| |||||||||
Change in Class A | (308 | ) | 9,315 | (11,253 | ) | 9,238 | ||||||||||
|
|
|
|
|
|
|
| |||||||||
Class I | ||||||||||||||||
Issued | 7,409,271 | 105,777 | 1,801 | 505 | ||||||||||||
Reinvested | 17,162 | 8,996 | 3,505 | 9,316 | ||||||||||||
Redeemed | (229,770 | ) | — | (13,966 | ) | (259 | ) | |||||||||
|
|
|
|
|
|
|
| |||||||||
Change in Class I | 7,196,663 | 114,773 | (8,660 | ) | 9,562 | |||||||||||
|
|
|
|
|
|
|
| |||||||||
Change in shares resulting from capital transactions | 7,196,355 | 124,088 | (19,913 | ) | 18,800 | |||||||||||
|
|
|
|
|
|
|
| |||||||||
|
|
|
|
|
|
|
| |||||||||
55
NOTES TO FINANCIAL STATEMENTS
|
| Global Opportunities Fund | International Opportunities Fund | |||||||||||||||
| For the Year Ended March 31, 2016 | For the Period Ended March 31, 2015(a) | For the Year Ended March 31, 2016 | For the Period Ended March 31, 2015(a) | |||||||||||||
CAPITAL TRANSACTIONS: | ||||||||||||||||
Class I | ||||||||||||||||
Proceeds from shares issued | $ | 69,951 | $ | 5,000,500 | $ | 505,607 | $ | 5,200,000 | ||||||||
Distributions reinvested | 62,197 | 1,445 | 97,891 | 1,025 | ||||||||||||
Cost of shares redeemed | (850 | ) | — | (765 | ) | — | ||||||||||
|
|
|
|
|
|
|
| |||||||||
Change in Class I | $ | 131,298 | $ | 5,001,945 | $ | 602,733 | $ | 5,201,025 | ||||||||
|
|
|
|
|
|
|
| |||||||||
Change in net assets resulting from capital transactions | $ | 131,298 | $ | 5,001,945 | $ | 602,733 | $ | 5,201,025 | ||||||||
|
|
|
|
|
|
|
| |||||||||
|
|
|
|
|
|
|
| |||||||||
SHARE TRANSACTIONS: | ||||||||||||||||
Class I | ||||||||||||||||
Issued | 7,130 | 500,051 | 48,876 | 519,763 | ||||||||||||
Reinvested | 6,257 | 150 | 10,560 | 107 | ||||||||||||
Redeemed | (81 | ) | — | (74 | ) | — | ||||||||||
|
|
|
|
|
|
|
| |||||||||
Change in Class I | 13,306 | 500,201 | 59,362 | 519,870 | ||||||||||||
|
|
|
|
|
|
|
| |||||||||
Change in shares resulting from capital transactions | 13,306 | 500,201 | 59,362 | 519,870 | ||||||||||||
|
|
|
|
|
|
|
| |||||||||
|
|
|
|
|
|
|
| |||||||||
(a) For the period from December 3, 2014 (commencement of operations) to March 31, 2015.
7. Federal Income Taxes:
It is the policy of each Fund to continue to qualify as a regulated investment company by complying with the provisions available to certain investment companies, as defined under Subchapter M of the Internal Revenue Code, and to distribute substantially all of its net investment income and net realized capital gains. Therefore, no federal tax liability is recorded in the financial statements of each Fund.
Fund Management has analyzed the Funds’ tax positions taken or expected to be taken on federal income tax returns for all open tax years (for the tax years ended March 31 of the years 2014, 2015 and 2016 for Emerging Markets Equity Fund and Emerging Markets Small Cap Equity Fund, and the tax years ended March 31 of the years 2015 and 2016 for Global Opportunities Fund and International Opportunities Fund), and has concluded that no provision for federal income tax is required in the Funds’ financial statements. The Funds’ federal and state income and federal excise tax returns for tax years for which the applicable statutes of limitations have not expired are subject to examination by the Internal Revenue Service and state departments of revenue.
As of March 31, 2016, the tax cost of securities and the breakdown of unrealized appreciation (depreciation) for each Fund were as follows:
| Tax Cost of Securities | Unrealized Appreciation | Unrealized Depreciation | Net Unrealized Appreciation (Depreciation) | |||||||||||||
Emerging Markets Equity Fund | $76,310,086 | $3,993,864 | $ | (2,383,727) | $1,610,137 | |||||||||||
Emerging Markets Small Cap Equity Fund | 4,934,740 | 449,227 | (720,370) | (271,143) | ||||||||||||
Global Opportunities Fund | 5,098,852 | 441,550 | (257,282) | 184,268 | ||||||||||||
International Opportunities Fund | 5,691,254 | 339,328 | (465,820) | (126,492) | ||||||||||||
The difference between book basis and tax basis unrealized appreciation/depreciation is attributable to the tax deferral of losses on wash sales, PFIC MTM adjustment and cumulative partnership basis adjustment.
56
NOTES TO FINANCIAL STATEMENTS
|
The tax character of distributions during the year ended March 31, 2016 were as follows:
| Distributions Paid From |
| |||||||||||
| Ordinary Income | Long-Term Capital Gains | Total Distributions Paid | ||||||||||
Emerging Markets Equity Fund | $184,078 | $67,181 | $251,259 | |||||||||
Emerging Markets Small Cap Equity Fund | 46,953 | 8,363 | 55,316 | |||||||||
Global Opportunities Fund | 62,197 | — | 62,197 | |||||||||
International Opportunities Fund | 97,891 | — | 97,891 | |||||||||
The tax character of distributions during the year ended March 31, 2015 were as follows:
| Distributions Paid From | ||||||||
| Ordinary Income | Total Distributions Paid | |||||||
Emerging Markets Equity Fund | $ | 175,126 | $175,126 | |||||
Emerging Markets Small Cap Equity Fund | 181,413 | 181,413 | ||||||
Global Opportunities Fund | 1,445 | 1,445 | ||||||
International Opportunities Fund | 1,025 | 1,025 | ||||||
As of March 31, 2016, the components of accumulated earnings/(losses) on a tax basis were as follows:
| Emerging Markets Equity Fund | Emerging Markets Small Cap Equity Fund | Global | International | |||||||||||||||||
Undistributed Ordinary Income | $ | — | $ | 48,524 | $ | 8,071 |
| $ | 8,003 | |||||||||||
Undistributed Long Term Gain | — | — | — | — | ||||||||||||||||
|
|
|
|
|
|
|
| |||||||||||||
Accumulated Earnings | — | 48,524 | 8,071 | 8,003 | ||||||||||||||||
Distributions Payable | — | — | — | — | ||||||||||||||||
Accumulated Capital Loss Carryforwards | — | (42,516) | (81,275) | (154,883) | ||||||||||||||||
Deferred Qualified Late-Year Losses | (249,198) | — | — | — | ||||||||||||||||
Unrealized Appreciation/(Depreciation) | 1,597,953 | (271,272) | 184,410 | (126,146) | ||||||||||||||||
|
|
|
|
|
|
|
| |||||||||||||
Total Accumulated Earnings/(Losses) | $ | 1,348,755 | $ | (265,264) | $ | 111,206 | $ | (273,026) | ||||||||||||
|
|
|
|
|
|
|
| |||||||||||||
|
|
|
|
|
|
|
| |||||||||||||
As of March 31, 2016, the Emerging Markets Small Cap Equity Fund, Global Opportunities Fund and International Opportunities Fund had a short-term capital loss carryforward of $42,516, $21,917 and $103,417, respectively, and Global Opportunities Fund and International Opportunities Fund had a long-term capital loss carryforward of $59,358 and $51,466, respectively, available to offset future realized capital gains in accordance with the Regulated Investment Company Modernization Act of 2010. These capital loss carryforwards are not subject to expiration.
Under current tax law, capital losses realized after October 31 and ordinary losses after December 31 of a Fund’s fiscal year may be deferred and treated as occurring on the first business day of the following fiscal year for tax purposes. The Emerging Markets Equity Fund deferred a qualified late-year ordinary loss of $12,720 and short-term qualified late-year capital losses of $236,478, which will be treated as arising on the first business day of the year ended March 31, 2017.
8. Market Timing:
The Trust strongly discourages attempts at market timing by Fund shareholders. Each Fund charges a redemption fee of 2% of the value of the shares redeemed or exchanged within 30 days of purchase, and may also limit the number of exchanges that may be made between Funds to five (5) per calendar
57
NOTES TO FINANCIAL STATEMENTS
|
year. When assessed, the redemption fee is deducted from the redemption proceeds and retained by the Fund, not by the Advisor. This redemption fee is not charged in certain situations, such as where the redemption results from an automatic reinvestment or asset re-allocation not specifically directed by the shareholder. The Trust also reserves the right to reject any Fund purchase order made by persons deemed to be market timers. The Funds’ prospectus contains a full description of the Trust’s policies on market timing and/or excessive trading. The redemption fee is recorded as a credit to capital and is included in the capital transactions on the Statements of Changes in Net Assets.
During the year ended March 31, 2016, there were no redemption fees collected by the Funds, other than Global Opportunities Fund, which received less than $1.
9. Soft Dollars:
The term soft dollars generally refers to arrangements in which services other than trade execution are received from a broker-dealer. Federal securities laws permit a fund advisor to incur commission charges on behalf of a fund that are higher than another broker-dealer would have charged if the advisor believes the charges are reasonable in relation to the brokerage and research services received. RBC GAM (US) has a fiduciary duty to the shareholders of the Funds to seek the best execution price for all of the Funds’ securities transactions. Fund Management believes that using soft dollars to purchase brokerage and research services may, in certain cases, be in a Fund’s best interest. As of March 31, 2016, the Funds used soft dollar arrangements on a limited basis. Fund Management continues to closely monitor its current use of soft dollars, in addition to regulatory developments in this area for any possible impact on Fund policies.
10. Subsequent Events:
Fund Management has evaluated the impact of subsequent events of the Funds and has determined that there are no subsequent events that require recognition or disclosure in the financial statements.
58
REPORT OF INDEPENDENT REGISTERED PUBLIC ACCOUNTING FIRM
|
To the Shareholders and Board of Trustees of RBC Funds Trust
We have audited the accompanying statements of assets and liabilities, including the schedules of portfolio investments, of RBC Emerging Markets Equity Fund, RBC Emerging Markets Small Cap Equity Fund, RBC Global Opportunities Fund and RBC International Opportunities Fund (collectively the “Funds”), four of the portfolios constituting the RBC Funds Trust (the “Trust”), as of March 31, 2016, and the related statements of operations for the year then ended and the statements of changes in net assets and the financial highlights for the periods presented. These financial statements and financial highlights are the responsibility of the Funds’ management. Our responsibility is to express an opinion on these financial statements and financial highlights based on our audits.
We conducted our audits in accordance with the standards of the Public Company Accounting Oversight Board (United States). Those standards require that we plan and perform the audits to obtain reasonable assurance about whether the financial statements and financial highlights are free of material misstatement. The Funds are not required to have, nor were we engaged to perform, an audit of their internal control over financial reporting. Our audits included consideration of internal control over financial reporting as a basis for designing audit procedures that are appropriate in the circumstances, but not for the purpose of expressing an opinion on the effectiveness of the Funds’ internal control over financial reporting. Accordingly, we express no such opinion. An audit also includes examining, on a test basis, evidence supporting the amounts and disclosures in the financial statements, assessing the accounting principles used and significant estimates made by management, as well as evaluating the overall financial statement presentation. Our procedures included confirmation of securities owned as of March 31, 2016, by correspondence with the Funds’ custodian and brokers; where replies were not received from brokers, we performed other auditing procedures. We believe that our audits provide a reasonable basis for our opinion.
In our opinion, the financial statements and financial highlights referred to above present fairly, in all material respects, the financial position of each of the portfolios constituting the RBC Funds Trust referred to above, as of March 31, 2016, the results of their operations, the changes in their net assets, and the financial highlights for the periods presented, in conformity with accounting principles generally accepted in the United States of America.
DELOITTE & TOUCHE LLP
Chicago, Illinois
May 24, 2016
59
OTHER FEDERAL INCOME TAX INFORMATION (UNAUDITED)
|
For the year ended March 31, 2016, certain dividends paid by the Funds may be subject to a maximum tax rate of 20% as provided for by the Jobs and Growth Tax Reconciliation Act of 2003. The Funds intend to report the maximum amount allowable as taxed at a maximum rate of 20%. Complete information will be reported in conjunction with your 2016 Form 1099-DIV.
All reportings are based on financial information available as of the date of this annual report and, accordingly, are subject to change. For each item, it is the intention of the Funds to report the maximum amount permitted under the Internal Revenue Code and the regulations thereunder.
For the year ended March 31, 2016, the following Funds had a qualified interest income percentage of:
| Qualified Interest Income
| ||||
Emerging Markets Equity Fund |
|
0.73% |
| |
Emerging Markets Small Cap Equity Fund | 0.10% | |||
Global Opportunities Fund | 0.07% | |||
International Opportunities Fund | 0.03% | |||
For the year ended March 31, 2016, the following Funds had a qualified short term gains percentage of:
| Qualified Short-term Gains
| ||||
Emerging Markets Equity Fund |
|
100.00% |
| |
Emerging Markets Small Cap Equity Fund | 100.00% | |||
For corporate shareholders, the following percentage of the total ordinary income distributions paid during the fiscal year ended March 31, 2016 qualify for the corporate dividends received deduction:
| Dividends Received Deduction
| ||||
Global Opportunities Fund |
|
52.94% |
| |
For the year ended March 31, 2016, the following Funds had a qualified dividend income percentage of:
| Qualified Dividend Income
| ||||
Emerging Markets Equity Fund |
|
62.05% |
| |
Emerging Markets Small Cap Equity Fund | 47.55% | |||
Global Opportunities Fund | 100.00% | |||
International Opportunities Fund | 100.00% | |||
For the year ended March 31, 2016, the following Funds had a qualified foreign source income percentage of:
| Qualified Foreign Source Income
| ||||
Emerging Markets Equity Fund |
|
100.00% |
| |
Emerging Markets Small Cap Equity Fund | 99.69% | |||
International Opportunities Fund | 100.00% | |||
60
OTHER FEDERAL INCOME TAX INFORMATION (UNAUDITED)
|
The Funds have elected to pass through to their shareholders the foreign taxes paid for the year ended March 31, 2016 as follows:
| Foreign Taxes Paid
| Foreign Source Income
| |||||||
Emerging Markets Equity Fund |
$ |
27,737 |
|
$ |
458,973 |
| ||
Emerging Markets Small Cap Equity Fund | 5,180 | 155,488 | ||||||
International Opportunities Fund | 10,442 | 135,520 | ||||||
Pursuant to Internal Revenue Code Section 852(b)(3), Emerging Markets Equity Fund and Emerging Markets Small Cap Equity Fund reported $67,181 and $8,363, respectively, as long-term capital gain distributions for the year ended March 31,2016.
61
|
Independent Trustees(1)(2)
T. Geron Bell (74)
Position, Term of Office and Length of Time Served with the Trust: Trustee since January 2004
Principal Occupation(s) During Past 5 Years: Chairman of the Executive Board of the Minnesota Twins (2011 to present); President of Twins Sports, Inc. (parent company of the Minnesota Twins) (2002 to 2011); President of the Minnesota Twins Baseball Club Incorporated (1987 to 2002)
Number of Portfolios in Fund Complex Overseen by Trustee: 22
Other Director/Trustee Positions Held by Trustee During Past 5 Years: None
Lucy Hancock Bode (64)
Position, Term of Office and Length of Time Served with the Trust: Trustee since January 2004
Principal Occupation(s) During Past 5 Years: Healthcare consultant (self-employed) (1986 to present)
Number of Portfolios in Fund Complex Overseen by Trustee: 22
Other Director/Trustee Positions Held by Trustee During Past 5 Years: BioSignia (2006 to 2010); Franklin Street Partners (2014 to present)
Leslie H. Garner Jr. (65)
Position, Term of Office and Length of Time Served with the Trust: Trustee since January 2004
Principal Occupation(s) During Past 5 Years: President and CEO, The Greater Cedar Rapids Community Foundation (2010 to present); President, Cornell College (1994 to 2010)
Number of Portfolios in Fund Complex Overseen by Trustee: 22
Other Director/Trustee Positions Held by Trustee During Past 5 Years: None
Ronald James (65)
Position, Term of Office and Length of Time Served with the Trust: Trustee since January 2004
Principal Occupation(s) During Past 5 Years: President and Chief Executive Officer, Center for Ethical Business Cultures (2000 to present)
Number of Portfolios in Fund Complex Overseen by Trustee: 22
Other Director/Trustee Positions Held by Trustee During Past 5 Years: Best Buy Co. Inc. (2004 to 2013); Bremer Financial Corporation (2004 to present)
John A. MacDonald (67)
Position, Term of Office and Length of Time Served with the Trust: Trustee since January 2004
Principal Occupation(s) During Past 5 Years: Vice President and Treasurer, Hall Family Foundation (1988 to present)
Number of Portfolios in Fund Complex Overseen by Trustee: 22
Other Director/Trustee Positions Held by Trustee During Past 5 Years: None
H. David Rybolt (73)
Position, Term of Office and Length of Time Served with the Trust: Trustee since January 2004
Principal Occupation(s) During Past 5 Years: Consultant, HDR Associates (management consulting) (1985 to present)
Number of Portfolios in Fund Complex Overseen by Trustee: 22
Other Director/Trustee Positions Held by Trustee During Past 5 Years: None
62
MANAGEMENT (Unaudited)
|
Independent Trustees(1)(2)
James R. Seward (63)
Position, Term of Office and Length of Time Served with the Trust: Chairman of the Board and Trustee since January 2004
Principal Occupation(s) During Past 5 Years: Private investor (2000 to present); CFA (1987 to present)
Number of Portfolios in Fund Complex Overseen by Trustee: 22
Other Director/Trustee Positions Held by Trustee During Past 5 Years: Sooner Holdings (formerly Syntroleum Corporation) (1988 to 2014); Brookdale Senior Living Inc. (2008 to present)
William B. Taylor (70)
Position, Term of Office and Length of Time Served with the Trust: Trustee since September 2005
Principal Occupation(s) During Past 5 Years: Consultant (2003 to present); Partner, Ernst & Young LLP (1982 to 2003)
Number of Portfolios in Fund Complex Overseen by Trustee: 22
Other Director/Trustee Positions Held by Trustee During Past 5 Years: National Association of Corporate Directors - Heartland Chapter (2013-present); William Henry Insurance, LLC (2005 to present); Balance Innovations LLC (2014 to present); Kansas City Symphony (1995 to present)
Interested Trustees(1)(2)(3)
Kathleen A. Gorman (52)(5)
Position, Term of Office and Length of Time Served with the Trust: Trustee since September 2012
Principal Occupation(s) During Past 5 Years: President and Chief Executive Officer, RBC Funds (2012 to present); Chief Compliance Officer, RBC Funds (2006 to 2012); Director of Regulatory Administration, RBC Global Asset Management (U.S.) Inc. (2007 to 2012)
Number of Portfolios in Fund Complex Overseen by Trustee: 22
Other Director/Trustee Positions Held by Trustee During Past 5 Years: None
Executive Officers(1)(3)(4)
Kathleen A. Gorman (52)
Position, Term of Office and Length of Time Served with the Trust: President and Chief Executive Officer since September 2012
Principal Occupation(s) During Past 5 Years: President and Chief Executive Officer, RBC Funds (2012 to present); Chief Compliance Officer, RBC Funds (2006 to 2012); Director of Regulatory Administration, RBC Global Asset Management (U.S.) Inc. (2007 to 2012)
Kathleen A. Hegna (49)
Position, Term of Office and Length of Time Served with the Trust: Chief Financial Officer and Principal Accounting Officer since May 2009 and Treasurer since March 2014
Principal Occupation(s) During Past 5 Years: Associate Vice President and Director, Mutual Fund Accounting and Administration, RBC Global Asset Management (U.S.) Inc. (2009 to present)
63
MANAGEMENT (Unaudited)
|
Executive Officers(1)(3)(4)
Christina M. Weber (47)
Position, Term of Office and Length of Time Served with the Trust: Chief Compliance Officer since December 2012 and Assistant Secretary since March 2013
Principal Occupation(s) During Past 5 Years: Chief Compliance Officer, RBC Funds (2012 to present); Senior Compliance Officer, RBC Funds (March 2012 to December 2012); Compliance Manager, Minnesota Life Insurance Company (2006 to 2012)
Jay Jackson (38)
Position, Term of Office and Length of Time Served with the Trust: Chief Legal Officer and Secretary since December 2015
Principal Occupation(s) During Past 5 Years: Associate General Counsel, RBC Global Asset Management (U.S.) Inc. (2011-present); Associate, K&L Gates (2008 to 2010)
| (1) | Except as otherwise noted, the address of each Trustee/Officer is RBC Funds Trust, 50 South Sixth Street, Suite 2350, Minneapolis, Minnesota 55402. |
| (2) | All Trustees must retire on or before December 31 of the year in which they reach age 75. The Board may temporarily waive this requirement when necessary to avoid depriving the Board of a Trustee with critical skills. |
| (3) | On December 31, 2009, Voyageur Asset Management Inc. changed its name to RBC Global Asset Management (U.S.) Inc. Any references to RBC Global Asset Management (U.S.) Inc. for prior periods are deemed to be references to the prior entity. |
| (4) | Each officer serves in such capacity for an indefinite period of time until his or her removal, resignation or retirement. |
| (5) | Kathleen A. Gorman has been determined to be an interested Trustee by virtue of her position with the Advisor. |
The Funds’ Statement of Additional Information includes information about the Funds’ Trustees. To receive your free copy of the Statement of Additional Information, call toll free: 1-800-422-2766.
64
SHARE CLASS INFORMATION (UNAUDITED)
|
The Emerging Markets Equity and Emerging Markets Small Cap Equity Funds offer two share classes. These two share classes are the A and I classes. The Global Opportunities Fund and International Opportunities Fund only offer Class I shares.
Class A
Class A shares of all Funds are available for purchase primarily through investment advisors, broker-dealers, banks and other financial services intermediaries. Class A shares of the Funds are currently subject to a maximum up-front sales charge of 5.75% and a 1.00% CDSC for redemption within 12 months of a $1 million or greater purchase. Class A shares currently include a 0.25% (25 bps) annual 12b-1 service and distribution fee.
Class I
Class I shares are intended for investors meeting certain minimum investment thresholds. This share class does not have an up-front sales charge (load) or a 12b-1 service and distribution fee.
65
SUPPLEMENTAL INFORMATION (UNAUDITED)
|
Shareholder Expense Examples
As a shareholder of the RBC Funds, you incur two types of costs: (1) transaction costs, including sales charges (loads) and (2) ongoing costs, including management fees; 12b-1 distribution and service fees; and other Fund expenses. This example is intended to help you understand your ongoing costs (in dollars) of investing in the RBC Funds and to compare these costs with the ongoing costs of investing in other mutual funds.
The example is based on an investment of $1,000 invested at the beginning of the period and held for the entire period from October 1, 2015 through March 31, 2016.
Actual Expenses and Performance
The table below provides information about actual account values and actual expenses. You may use the information below, together with the amount you invested, to estimate the expenses that you paid over the period. Simply divide your account value by $1,000 (for example, an $8,600 account value divided by $1,000 = 8.6), then multiply the result by the number in the table under the heading entitled “Expenses Paid During Period” to estimate the expenses you paid on your account during this period.
| Beginning Account Value 10/1/15
| Ending Account Value 3/31/16
| Expenses Paid During Period* 10/1/15-3/31/16
| Annualized Expense Ratio During Period 10/1/15-3/31/16
| |||||||||||||
Emerging Markets Equity Fund | Class A | $1,000.00 | $1,040.50 | $4.95 | 0.97% | |||||||||||
Class I
|
| 1,000.00
|
|
| 1,040.50
|
|
| 3.72
|
| 0.73%
| ||||||
Emerging Markets Small Cap Equity Fund | Class A | 1,000.00 | 1,058.90 | 9.57 | 1.86% | |||||||||||
Class I
|
| 1,000.00
|
|
| 1,060.80
|
|
| 8.29
|
| 1.61%
| ||||||
Global Opportunities Fund
| Class I
|
| 1,000.00
|
|
| 1,054.00
|
|
| 5.39
|
| 1.05%
| |||||
International Opportunities Fund
| Class I
|
| 1,000.00
|
|
| 1,038.40
|
|
| 5.10
|
| 1.00%
| |||||
*Expenses are equal to the average account value times the Fund’s annualized expense ratio multiplied by 183/366 (to reflect one half year period).
66
SUPPLEMENTAL INFORMATION (UNAUDITED)
|
Hypothetical Example for Comparison Purposes
The table below provides information about hypothetical account values and hypothetical expenses based on each RBC Funds’ actual expense ratio and an assumed rate of return of 5% per year before expenses, which is not the Fund’s actual return. The hypothetical account values and expenses may not be used to estimate the actual ending account balance or expenses you paid for the period. You may use this information to compare this 5% hypothetical example with the 5% hypothetical examples that appear in the shareholder reports of other funds.
Please note that the expenses shown in the table are meant to highlight your ongoing costs only and do not reflect any transactional costs, such as sales charges (loads), redemption fees, or exchange fees. Therefore, the table is useful in comparing ongoing costs only, and will not help you determine the relative total costs of owning different funds. In addition, if these transactional costs were included, your costs would have been higher.
| Beginning Account Value 10/1/15
| Ending Account Value 3/31/16
| Expenses Paid During Period* 10/1/15-3/31/16
| Annualized Expense Ratio During Period 10/1/15-3/31/16
| |||||||||||
Emerging Markets Equity Fund |
Class A | $1,000.00 |
|
$1,020.15 |
| $4.90 | 0.97% | |||||||
| Class I | 1,000.00 | 1,021.35 | 3.69 | 0.73% | ||||||||||
Emerging Markets Small Cap Equity Fund |
Class A |
|
1,000.00 |
|
|
1,015.70 |
|
9.37 |
1.86% | |||||
| Class I | 1,000.00 | 1,016.95 | 8.12 | 1.61% | ||||||||||
Global Opportunities Fund |
Class I |
|
1,000.00 |
|
|
1,019.75 |
|
5.30 |
1.05% | |||||
International Opportunities Fund |
Class I |
|
1,000.00 |
|
|
1,020.00 |
|
5.05 |
1.00% | |||||
*Expenses are equal to the average account value times the Fund’s annualized expense ratio multiplied by 183/366 (to reflect one half year period).
67
|
This Page Intentionally Left Blank
68
|
This Page Intentionally Left Blank
69
|
This Page Intentionally Left Blank
70
|
This Page Intentionally Left Blank
71
|
This Page Intentionally Left Blank
72
RBC Funds
P.O. Box 701
Milwaukee, WI 53201-0701
800-422-2766
www.rbcgam.us
Performance data represents past performance and does not guarantee future results. The principal value of an investment and investment return will fluctuate so that an investor’s shares, when redeemed, may be worth more or less than their original cost.
This report and the financial statements contained herein are provided for the information of RBC Funds shareholders. This report is not authorized for distribution to prospective investors unless preceded or accompanied by a current prospectus, which contains information concerning investment objectives, risks, charges and expenses of the funds. Please read the prospectus carefully before investing.
This report and the financial statements contained herein are not intended to be a forecast of future events, a guarantee of future results, or investment advice. There is no assurance that certain securities will remain in or out of each fund’s portfolio. The views expressed in this report reflect those of the portfolio managers through the year ended March 31, 2016.
NOT FDIC INSURED ● NO BANK GUARANTEE ● MAY LOSE VALUE
RBC Global Asset Management (U.S.) Inc. serves as investment advisor for the RBC Funds. RBC Funds are distributed by Quasar Distributors LLC, an affiliate of U.S. Bancorp Fund Services, LLC.

| The RBC Funds are pleased to offer shareholder reports printed entirely on Forest Stewardship Council® certified paper. FSC® certification ensures that the paper used in this report contains fiber from well-managed and responsibly harvested forests that meet strict environmental and socioeconomic standards. |
RBCF-EM AR 03-16
|
| |||||||||
RBC Funds | ||||||||||
About Your Annual Report |
This annual report includes detailed information about your Fund including financial statements, performance, and a complete list of its holdings.
The RBC Funds compare their performance against various indices. Each of these indices is a widely recognized measure of return for the underlying category of securities. However, the indices are unmanaged, do not include fees, and cannot be invested in directly.
We hope the financial information presented will help you evaluate your investment in the RBC Funds. We also encourage you to read your Fund’s prospectus for further detail as to your Fund’s investment policies and risk profile. RBC Funds prospectuses and performance information subsequent to the date of this report are available on our website at www.rbcgam.us.
A description of the policies and procedures that your Fund uses to determine how to vote proxies relating to portfolio securities is available (i) without charge, upon request, by calling 1-800-422-2766; (ii) on the Fund’s website at www.rbcgam.us; and (iii) on the Securities and Exchange Commission’s (the “Commission”) website at http://www.sec.gov.
Information regarding how your Fund voted proxies relating to portfolio securities during the most recent 12-month period ended June 30 will be available (i) on the Fund’s website at www.rbcgam.us; and (ii) on the Commission’s website at http://www.sec.gov.
A schedule of each Fund’s portfolio holdings will be filed with the Commission for the first and third quarters of each fiscal year on Form N-Q. This information is available on the Commission’s website at http://www.sec.gov and may be reviewed and copied at the Commission’s Public Reference Room in Washington, D.C. Information on the operation of the Public Reference Room is available by calling 1-800-SEC-0330.
|
| ||||||||
Contents | ||||||||||
| Letter from the CIO | 1 | |||||||||
| Portfolio Managers | 3 | |||||||||
| Performance Summary (Unaudited) | 4 | |||||||||
| Management Discussion and Analysis (Unaudited) | ||||||||||
| - RBC Short Duration Fixed Income Fund | 6 | |||||||||
| - RBC Ultra-Short Fixed Income Fund | 8 | |||||||||
| Schedules of Portfolio Investments | 10 | |||||||||
| Financial Statements | ||||||||||
| - Statements of Assets and Liabilities | 21 | |||||||||
| - Statements of Operations | 23 | |||||||||
| - Statements of Changes in Net Assets | 24 | |||||||||
| Financial Highlights | 26 | |||||||||
| Notes to Financial Statements | 30 | |||||||||
| Report of Independent Registered Public Accounting Firm | 41 | |||||||||
| Other Federal Income Tax Information (Unaudited) | 42 | |||||||||
| Management (Unaudited) | 43 | |||||||||
| Share Class Information (Unaudited) | 46 | |||||||||
| Supplemental Information (Unaudited) | 47 | |||||||||
| ||||||||||
| ||||||||||
| ||||||
Dear Shareholder:
RBC Global Asset Management (U.S.) Inc. (“RBC GAM (US)”) launched the RBC Short Duration Fixed Income Fund and RBC Ultra-Short Fixed Income Fund (the “Funds”) on December 30, 2013. We are pleased that the funds now have two year track records of delivering what we see as high quality, diversified fixed income vehicles to clients seeking shorter duration investment solutions.
For the twelve month period ended March 31, 2016, the Funds outperformed their benchmarks. The RBC Short Duration Fixed Income Fund had a net total return of 1.28% (Class I shares) compared to a return of 1.06% for the BofA Merrill Lynch 1-3 Year U.S. Corporate/Government Index. The RBC Ultra-Short Fixed Income Fund had a net total return of 1.24% (Class I shares) compared to a return of 0.49% for the BofA Merrill Lynch U.S. 1-Year Treasury Bill Index.
During the last year, the U.S. Treasury Yield Curve flattened with bills (maturities of less than one year) pegged since the December 2015 U.S. Federal Reserve rate hike, and all other maturities essentially falling to where they were one year prior. The long end of the curve is likely being weighed down both from demand due to negative rates in other high quality sovereigns and also decreasing global growth expectations. Long-term treasury yields mildly rebounded from quarter lows, but they did not recover to the levels that were last seen at the end of the year.
In the corporate sector, option adjusted spreads, a measure of a security’s risk, peaked at levels that have not been seen since 2011-2012. The increasing market risk was driven primarily by the Energy sector, which saw heightened concern of credit downgrades from unsustainable energy prices. As market fears abated, spreads tightened and ended largely where they began the quarter but higher than a year prior. Our Funds were underweight Energy and Metals issuers during this period which contributed to better than benchmark performance.
Looking forward, we will continue to seek opportunities to positively impact performance by focusing on well researched security selection opportunities and maintaining a well diversified portfolio of higher quality bonds. Thank you for your confidence and trust in the RBC Funds.
Sincerely,
Michael Lee, CFA CEO, President and Chief Investment Officer RBC Global Asset Management (U.S.) Inc. | ||||||

| 1 |
LETTER FROM THE CIO | ||||||
Past performance is not a guarantee of future results.
Opinions expressed are subject to change, are not guaranteed, and should not be considered a recommendation to buy or sell any security.
Diversification does not assure a profit or protect against a loss in a declining market.
Mutual fund investing involves risk. Principal loss is possible. Investments in debt securities typically decrease in value when interest rates rise. This risk is usually greater for longer-term debt securities. Investments in lower-rated and non-rated securities present a greater risk of loss to principal and interest than higher-rated securities. Investments in foreign securities involve greater volatility and political, economic and currency risks and differences in accounting methods. These risks are greater for emerging markets. Derivatives such as futures, forwards, and swaps involve risks different from, and in certain cases, greater than the risks presented by more traditional investments. Investments in asset backed and mortgage related securities including pass-through securities and Collateralized Mortgage Obligations include additional risks that investors should be aware of including credit risk, prepayment risk, possible illiquidity and default, as well as increased susceptibility to adverse economic developments. These risks are more fully described in the prospectus. The Fund may invest in Illiquid securities which involve the risk that the securities will not be able to be sold at the time or prices desired by the fund, particularly during times of market turmoil.
The BofA Merrill Lynch 1-3 Year U.S. Corporate/Government Bond Index includes publicly issued U.S. Treasury debt, U.S. government agency debt, taxable debt issued by U.S. states and territories and their political subdivisions, debt issued by U.S. and non-U.S. corporations, non-U.S. government debt and supranational debt.
The BofA Merrill Lynch 1-Year U.S. Treasury Bill Index is an unmanaged index tracking U.S. Government Securities. You cannot invest directly in this index.
The U.S. Treasury Yield Curve represents the yield of a U.S. Treasury bond at different maturities. A U.S. Treasury bond is theoretically considered to be free of default risk, and represents the minimum yield investors are prepared to accept for bonds of different maturities.
Duration is a measure of price sensitivity of a debt security or a portfolio of debt securities relative to changes in interest rates. The longer a security’s duration, the more sensitive it will be to changes in interest rates. | ||||||
2 |
| ||||||
RBC Global Asset Management (U.S.) Inc. (“RBC GAM (US)”) serves as the investment advisor to the RBC Funds. RBC GAM (US) employs a team approach to the management of the Funds, with no individual team member being solely responsible for the investment decisions. Each Fund’s management team has access to RBC GAM (US)’s investment research and other money management resources. | ||||||
| Brian Svendahl, CFA | ||||||
| Managing Director, Co-Head, U.S. Fixed Income |
Brian Svendahl, CFA | |||||
| Brian Svendahl oversees the fixed income research, portfolio management and trading at RBC GAM (US). In addition to shaping the firm’s overall fixed income philosophy and process, he is a portfolio manager for the Funds and many of RBC GAM (US)’s government mandates. Brian joined RBC GAM (US) in 2005 and most recently led the mortgage and government team before being promoted to Co-Head. Prior to joining RBC GAM (US), he held several risk management, research and trading positions at Wells Fargo. Brian’s experience also includes liability management and implementing balance sheet hedging strategies. He earned a BS in economics from the University of Minnesota and a BBA in finance and an MBA from the University of Minnesota Carlson School of Management. Brian is a CFA charterholder. | ||||||
| Brandon T. Swensen, CFA |
Brandon T. Swensen, CFA | |||||
| Vice-President, Co-Head, U.S. Fixed Income | ||||||
| Brandon Swensen oversees RBC GAM (US)’s fixed income research, portfolio management and trading. In addition to shaping the firm’s overall fixed income philosophy and process, he is a portfolio manager for the Funds and several cash management and core solutions. Brandon joined RBC GAM (US) in 2000 and most recently was a portfolio manager on the mortgage and government team before being promoted to Co-Head. He also held research analyst positions covering asset-backed securities and credit and served as a financial analyst for the firm. Brandon earned a BS in finance from St. Cloud State University and an MBA in finance from the University of St. Thomas. He is a CFA charterholder and member of the CFA Society of Minnesota. | ||||||


| 3 |
| ||||||||||||||
Average Total Returns as of March 31, 2016 (Unaudited)
| ||||||||||||||
| 1 Year | Since Inception(a) | Net Expense Ratio(1)(2) | Gross Expense Ratio(1)(2) | |||||||||||
| RBC Short Duration Fixed Income Fund | ||||||||||||||
| - At Net Asset Value | ||||||||||||||
| Class F | 1.18% | 1.21% | 0.45% | 1.70% | ||||||||||
Class I
| 1.28% | 1.49% | 0.35% | 1.37% | ||||||||||
| BofA Merrill Lynch 1-3 Year U.S. Corporate/Government Bond Index (b) | 1.06% | 1.08% | ||||||||||||
| RBC Ultra-Short Fixed Income Fund | ||||||||||||||
| - At Net Asset Value | ||||||||||||||
| Class F | 1.16% | 0.96% | 0.40% | 1.25% | ||||||||||
| Class I | 1.24% | 0.98% | 0.30% | 1.13% | ||||||||||
BofA Merrill Lynch 1-Year U.S. Treasury Bill Index (b)
| 0.49%
| 0.35%
| ||||||||||||
Performance data quoted represents past performance. Past performance is no guarantee of future results. Investment return and principal value of an investment will fluctuate so that an investor’s shares, when redeemed, may be worth more or less than their original cost. Current performance may be lower or higher than performance quoted. For performance data current to most recent month-end go to www.rbcgam.us. Please see footnotes below. | ||||||||||||||
The BofA Merrill Lynch 1-3 Year U.S. Corporate/Government Bond Index is an unmanaged index that tracks the performance of U.S. dollar denominated investment grade debt publicly issued in the U.S. domestic market with a remaining term to final maturity less than 3 years, including U.S. Treasury, U.S. agency, foreign government, supranational and corporate securities. | ||||||||||||||
The BofA Merrill Lynch 1-Year U.S. Treasury Bill Index is an unmanaged index tracking U.S. government securities with 1 year remaining to maturity. | ||||||||||||||
| (1) The Funds’ expenses reflect the most recent fiscal year end (March 31, 2016). | ||||||||||||||
| (2) The advisor has contractually agreed to waive fees and/or make payments in order to keep total operating expenses of the Fund to the levels listed under net expense ratio until July 31, 2017. | ||||||||||||||
| (a) The inception date (commencement date) is March 3, 2014 for Class F shares and December 30, 2013 for Class I shares. | ||||||||||||||
| (b) Each of the comparative indices is a widely recognized market value weighted measure of the return of securities, but do not include sales fees or operating expenses. You cannot invest directly in indices. | ||||||||||||||
4 |
|
This Page Intentionally Left Blank
| 5 |
6 |
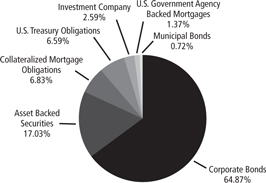
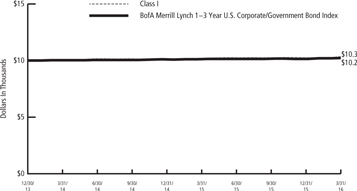
| 7 |
8 |
MANAGEMENT DISCUSSION AND ANALYSIS (UNAUDITED)
|
| |||||||||||||||
RBC Ultra-Short Fixed Income Fund
| ||||||||||||||||
Current income and capital appreciation. |
| Investment Objective | ||||||||||||||
BofA Merrill Lynch 1-Year US Treasury Bill Index
|
| Benchmark | ||||||||||||||
|
| Asset Allocation (as of 3/31/16)
| ||||||||||||||
Springleaf Mortgage Loan Trust, Series 2013-3A, |
|
2.26 |
% |
General Motors Financial Co., Inc., 3.10%, 1/15/19 Actavis Funding SCS, 2.35%, 3/12/18 |
|
1.42 1.41 |
% % | Top Ten Holdings (excluding investment companies) (as of 3/31/16) (% of Fund’s net assets) | ||||||||
Bank of America, N.A., 5.30%, 3/15/17 | 1.45 | % | JPMorgan Chase Bank, N.A., 5.88%, 6/13/16 | 1.41 | % | |||||||||||
Santander Drive Auto Receivables Trust, Series 2013-4, | 1.43 | % | Kraft Heinz Foods Co., 2.00%, 7/2/18 Verizon Communications, Inc., 2.50%, 9/15/16 |
| 1.41 1.41 | % % | ||||||||||
L-3 Communications Corp., 3.95%, 11/15/16 | 1.42 | % | ||||||||||||||
Ecolab, Inc., 3.00%, 12/8/16 | 1.42 | % | ||||||||||||||
*A listing of all portfolio holdings can be found beginning on page 15.
|
| |||||||||||||||
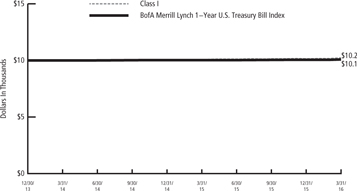 | Growth of | |||||||||||||||
| The graph reflects an initial investment of $10,000 over the period from December 30, 2013 (commencement of operations) to March 31, 2016 and is based on Class I shares. The Fund’s total return includes reinvested dividends and capital gains. The Fund’s total return also includes operating expenses that reduce return while the total return of the index does not. The graph does not reflect the deduction of taxes that a shareholder would pay on fund distributions or redemption of fund shares. | ||||||||||||||||
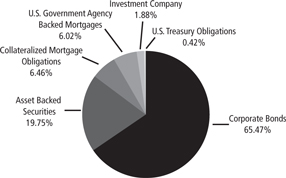
| 9 |
SCHEDULE OF PORTFOLIO INVESTMENTS
|
RBC Short Duration Fixed Income Fund
March 31, 2016
Principal Amount | Value | |||||
Asset Backed Securities — 16.72% |
| |||||
$150,000 | AmeriCredit Automobile Receivables Trust, Series 2012-3, Class E, 4.46%, 11/8/19(a) | $ | 152,170 | |||
150,000 | AmeriCredit Automobile Receivables Trust, Series 2013-1, Class D, 2.09%, 2/8/19 | 150,095 | ||||
150,000 | AmeriCredit Automobile Receivables Trust, Series 2014-2, Class B, 1.60%, 7/8/19 | 149,722 | ||||
250,000 | AmeriCredit Automobile Receivables Trust, Series 2014-3, Class C, 2.58%, 9/8/20 | 250,477 | ||||
150,000 | AmeriCredit Automobile Receivables Trust, Series 2014-4, Class C, 2.47%, 11/9/20 | 150,571 | ||||
175,000 | Americredit Automobile Receivables Trust, Series 2015-2, Class C, 2.40%, 1/8/21 | 175,148 | ||||
84,396 | Credit-Based Asset Servicing and Securitization LLC, Series 2005-CB2, Class M1, 1.09%, 4/25/36(b) | 82,600 | ||||
250,000 | Macquarie Equipment Funding Trust, Series 2014-A, Class B, 1.99%, 7/20/21(a) | 247,620 | ||||
156,593 | RASC Trust, Series 2005-KS9, Class M2, 0.86%, 10/25/35(b) | 154,057 | ||||
250,000 | Santander Drive Auto Receivables Trust, Series 2013-4, Class D, 3.92%, 1/15/20 | 256,365 | ||||
150,000 | Santander Drive Auto Receivables Trust, Series 2014-2, Class C, 2.33%, 11/15/19 | 150,706 | ||||
250,000 | Santander Drive Auto Receivables Trust, Series 2014-3, Class C, 2.13%, 8/17/20 | 250,118 | ||||
100,000 | Santander Drive Auto Receivables Trust, Series 2016-1, Class B, 2.47%, 12/15/20 | 100,311 | ||||
109,243 | Structured Asset Securities Corp., Class 2005-NC1, Class M1, 0.90%, 2/25/35(b) | 108,824 | ||||
|
| |||||
Total Asset Backed Securities | 2,378,784 | |||||
|
| |||||
(Cost $2,381,314) | ||||||
Collateralized Mortgage Obligations — 6.70% |
| |||||
37,310 | Adjustable Rate Mortgage Trust, Series 2004-2, Class 7A2, 1.27%, 2/25/35(b) | 37,188 | ||||
97,812 | BCAP LLC Trust, Series 2010-RR7, Class 12A6, 6.00%, 8/26/36(a) | 99,729 | ||||
101,009 | JP Morgan Resecuritization Trust, Series 2014-1, Class 9A3, 0.73%, 12/26/35(a)(b) | 98,484 | ||||
31,597 | Nomura Asset Acceptance Corp Alternative Loan Trust, Series 2005-AR1, Class 1A2, 2.84%, 2/25/35(b) | 31,569 | ||||
120,997 | RBSSP Resecuritization Trust, Series 2009-6, Class 13A4, 5.14%, 8/26/35(a)(b) | 120,765 | ||||
213,547 | Springleaf Mortgage Loan Trust, Series 2013-1A, Class A, 1.27%, 6/25/58(a)(b) | 212,575 | ||||
10 |
SCHEDULE OF PORTFOLIO INVESTMENTS
|
RBC Short Duration Fixed Income Fund (cont.)
March 31, 2016
Principal Amount | Value | |||||
$96,750 | Springleaf Mortgage Loan Trust, Series 2013-2A, Class A, 1.78%, 12/25/65(a)(b) | $ | 96,452 | |||
257,764 | Springleaf Mortgage Loan Trust, Series 2013-3A, Class A, 1.87%, 9/25/57(a)(b) | 257,231 | ||||
|
| |||||
Total Collateralized Mortgage Obligations | 953,993 | |||||
|
| |||||
(Cost $961,007) | ||||||
Corporate Bonds — 63.68% |
| |||||
Banks — 11.47% |
| |||||
250,000 | Bank of America, N.A., 5.30%, 3/15/17 | 258,720 | ||||
200,000 | Barclays Plc, 2.00%, 3/16/18 | 196,442 | ||||
150,000 | Goldman Sachs Group, Inc. (The), 2.88%, 2/25/21 | 152,637 | ||||
200,000 | ING Bank NV, 3.75%, 3/7/17(a) | 204,448 | ||||
200,000 | Morgan Stanley, 6.25%, 8/28/17 | 212,508 | ||||
250,000 | PNC Funding Corp., 5.63%, 2/1/17 | 258,575 | ||||
150,000 | Toronto-Dominion Bank, 1.63%, 4/7/21(b) | 150,000 | ||||
200,000 | Wachovia Corp., 0.90%, 6/15/17(b) | 199,234 | ||||
|
| |||||
| 1,632,564 | ||||||
|
| |||||
Consumer Discretionary — 8.45% |
| |||||
100,000 | Constellation Brands, Inc., 7.25%, 5/15/17 | 105,750 | ||||
250,000 | Ford Motor Credit Co. LLC, 2.55%, 10/5/18 | 250,865 | ||||
100,000 | Hewlett Packard Enterprise Co., 2.85%, 10/5/18(a) | 101,679 | ||||
100,000 | Hyundai Capital America, 2.00%, 3/19/18(a) | 100,707 | ||||
123,000 | L Brands, Inc., 6.90%, 7/15/17 | 130,226 | ||||
100,000 | Reynolds American, Inc., 2.30%, 6/12/18 | 101,997 | ||||
200,000 | Southwest Airlines Co., 2.75%, 11/6/19 | 205,737 | ||||
200,000 | Tyson Foods, Inc., 2.65%, 8/15/19 | 205,114 | ||||
|
| |||||
| 1,202,075 | ||||||
|
| |||||
Consumer Non Cyclicals — 2.34% |
| |||||
150,000 | Anheuser-Busch Inbev Finance, Inc., 2.65%, 2/1/21 | 154,138 | ||||
125,000 | Biogen, Inc., 2.90%, 9/15/20 | 128,644 | ||||
50,000 | McGraw Hill Financial Inc., 2.50%, 8/15/18 | 50,666 | ||||
|
| |||||
| 333,448 | ||||||
|
| |||||
Finance - Diversified — 8.04% |
| |||||
150,000 | Ally Financial, Inc., 2.75%, 1/30/17 | 149,250 | ||||
200,000 | American Tower Corp. REIT, 4.50%, 1/15/18 | 208,400 | ||||
250,000 | General Motors Financial Co., Inc., 3.10%, 1/15/19 | 252,990 | ||||
200,000 | Perrigo Finance Unlimited Co., 3.50%, 3/15/21 | 204,948 | ||||
125,000 | Regions Financial Corp., 2.25%, 9/14/18 | 124,785 | ||||
200,000 | Santander Holdings USA, Inc., 3.45%, 8/27/18 | 203,399 | ||||
|
| |||||
| 1,143,772 | ||||||
|
| |||||
| 11 |
SCHEDULE OF PORTFOLIO INVESTMENTS
|
RBC Short Duration Fixed Income Fund (cont.)
March 31, 2016
Principal Amount | Value | |||||
Health Care — 4.27% |
| |||||
$250,000 | Actavis Funding SCS, 3.00%, 3/12/20 | $ | 257,052 | |||
50,000 | Mylan NV, 3.00%, 12/15/18(a) | 50,686 | ||||
45,000 | St. Jude Medical, Inc., 2.80%, 9/15/20 | 46,016 | ||||
250,000 | Zimmer Holdings, Inc., 2.70%, 4/1/20 | 253,505 | ||||
|
| |||||
| 607,259 | ||||||
|
| |||||
Industrials — 5.53% |
| |||||
150,000 | Case New Holland, Inc., 7.88%, 12/1/17 | 161,250 | ||||
97,000 | L-3 Communications Corp., 1.50%, 5/28/17 | 96,668 | ||||
200,000 | L-3 Communications Corp., 3.95%, 11/15/16 | 202,607 | ||||
150,000 | Newell Rubbermaid, Inc., 3.15%, 4/1/21 | 154,083 | ||||
12,000 | Owens Corning, 6.50%, 12/1/16 | 12,258 | ||||
160,000 | Pentair Finance SA, 2.90%, 9/15/18 | 160,459 | ||||
|
| |||||
| 787,325 | ||||||
|
| |||||
Materials — 6.44% |
| |||||
150,000 | CF Industries, Inc., 6.88%, 5/1/18 | 163,205 | ||||
200,000 | Dow Chemical Co. (The), 8.55%, 5/15/19 | 237,902 | ||||
100,000 | Ecolab, Inc., 2.00%, 1/14/19 | 100,889 | ||||
200,000 | Georgia-Pacific LLC, 2.54%, 11/15/19(a) | 200,822 | ||||
200,000 | LyondellBasell Industries NV, 5.00%, 4/15/19 | 213,670 | ||||
|
| |||||
| 916,488 | ||||||
|
| |||||
Media — 4.84% |
| |||||
150,000 | 21st Century Fox America Inc., 8.25%, 8/10/18 | 171,619 | ||||
150,000 | CBS Corp., 4.63%, 5/15/18 | 158,332 | ||||
200,000 | Time Warner Cable, Inc., 5.85%, 5/1/17 | 208,487 | ||||
150,000 | Viacom, Inc., 2.50%, 12/15/16 | 150,765 | ||||
|
| |||||
| 689,203 | ||||||
|
| |||||
Oil & Gas — 7.62% |
| |||||
200,000 | Anadarko Petroleum Corp., 8.70%, 3/15/19 | 223,470 | ||||
200,000 | Enbridge Energy Partners LP, 6.50%, 4/15/18 | 205,745 | ||||
110,000 | Enterprise Products Operating LLC, 7.03%, 1/15/68(b) | 111,540 | ||||
135,000 | Marathon Oil Corp., 6.00%, 10/1/17 | 136,844 | ||||
100,000 | Pioneer Natural Resources Co., 5.88%, 7/15/16 | 101,008 | ||||
100,000 | Schlumberger Holdings Corp., 2.35%, 12/21/18(a) | 100,656 | ||||
200,000 | Williams Partners LP/Williams Partners Finance Corp., 7.25%, 2/1/17 | 204,967 | ||||
|
| |||||
| 1,084,230 | ||||||
|
| |||||
Telecommunication Services — 3.23% |
| |||||
230,000 | AT&T, Inc., 5.20%, 3/15/20 | 255,381 | ||||
200,000 | CenturyLink, Inc., 5.15%, 6/15/17 | 204,000 | ||||
|
| |||||
| 459,381 | ||||||
|
| |||||
12 |
SCHEDULE OF PORTFOLIO INVESTMENTS
|
RBC Short Duration Fixed Income Fund (cont.)
March 31, 2016
Principal Amount | Value | |||||
Utilities — 1.45% |
| |||||
$200,000 | Southwestern Electric Power Co., 5.55%, 1/15/17 | $ | 206,452 | |||
|
| |||||
Total Corporate Bonds | 9,062,197 | |||||
|
| |||||
(Cost $9,042,599) | ||||||
Municipal Bonds — 0.70% |
| |||||
California — 0.70% |
| |||||
100,000 | University of California Revenue Bonds, Series Y-1, 0.94%, 7/1/41(b) | 99,969 | ||||
|
| |||||
Total Municipal Bonds | 99,969 | |||||
|
| |||||
(Cost $100,000) | ||||||
U.S. Government Agency Backed Mortgages — 1.35% |
| |||||
Fannie Mae — 0.58% |
| |||||
7,841 | Series 2001-70, Class OF, 1.38%, 10/25/31(b) | 7,956 | ||||
4,019 | Series 2002-55, Class QE, 5.50%, 9/25/17 | 4,080 | ||||
15,138 | Series 2005-68, Class BC, 5.25%, 6/25/35 | 16,092 | ||||
5,896 | Series 2009-87, Class FX, 1.18%, 11/25/39(b) | 5,972 | ||||
45,821 | Series 2012-3, Class EA, 3.50%, 10/25/29 | 47,774 | ||||
|
| |||||
| 81,874 | ||||||
|
| |||||
Freddie Mac — 0.77% |
| |||||
6,081 | Series 2448, Class FT, 1.44%, 3/15/32(b) | 6,188 | ||||
6,145 | Series 2488, Class FQ, 1.44%, 3/15/32(b) | 6,255 | ||||
45,194 | Series 2627, Class MW, 5.00%, 6/15/23 | 48,781 | ||||
4,458 | Series 3725, Class A, 3.50%, 9/15/24 | 4,547 | ||||
6,249 | Series 3770, Class FP, 0.94%, 11/15/40(b) | 6,259 | ||||
37,360 | Series 4027, Class GD, 2.00%, 10/15/25 | 37,736 | ||||
|
| |||||
| 109,766 | ||||||
|
| |||||
Total U.S. Government Agency Backed Mortgages | 191,640 | |||||
|
| |||||
(Cost $189,534) | ||||||
| 13 |
SCHEDULE OF PORTFOLIO INVESTMENTS
|
RBC Short Duration Fixed Income Fund (cont.)
March 31, 2016
Principal Amount | Value | |||||
U.S. Treasury Obligations — 6.47% |
| |||||
U.S. Treasury Notes — 6.47% |
| |||||
$920,000 | 0.75%, 2/28/18 | $ | 920,215 | |||
|
| |||||
Total U.S. Treasury Obligations | 920,215 | |||||
|
| |||||
(Cost $919,898) | ||||||
| Shares | ||||||
Investment Company — 2.54% |
| |||||
361,980 | RBC Prime Money Market Fund, Institutional Class 1(c) | 361,980 | ||||
|
| |||||
Total Investment Company | 361,980 | |||||
|
| |||||
(Cost $361,980) | ||||||
Total Investments | $ | 13,968,778 | ||||
(Cost $13,956,332)(d) — 98.16% | ||||||
Other assets in excess of liabilities — 1.84% | 261,980 | |||||
|
| |||||
NET ASSETS — 100.00% | $ | 14,230,758 | ||||
|
| |||||
| (a) | Security exempt from registration under Rule 144A or Section 4(2) of the Securities Act of 1933, as amended. These securities may be resold in transactions exempt from registration, normally to qualified institutional buyers. Security has been deemed to be liquid based on procedures approved by the Board of Trustees. |
| (b) | Variable rate security. The rate reflected in the Schedule of Portfolio Investments is the rate in effect on March 31, 2016. |
| (c) | Affiliated investment. |
| (d) | See Notes to Financial Statements for the tax cost of securities and the breakdown of unrealized appreciation (depreciation). |
Abbreviations used are defined below:
REIT - Real Estate Investment Trust
Financial futures contracts as of March 31, 2016:
Long Position | Number of | Expiration Date | Unrealized | Notional Value | Clearinghouse | |||||||||
Two Year U.S. Treasury Bonds | 8 | June, 2016 | $(1,250) | USD | 1,751,250 | Barclays Plc | ||||||||
Short Position | Number of | Expiration Date | Unrealized | Notional Value | Clearinghouse | |||||||||
Five Year U.S. Treasury Bonds | 8 | June, 2016 | $750 | USD | 970,050 | Barclays Plc | ||||||||
See Notes to Financial Statements.
14 |
SCHEDULE OF PORTFOLIO INVESTMENTS
|
RBC Ultra-Short Fixed Income Fund
March 31, 2016
Principal Amount | Value | |||||
Asset Backed Securities — 19.88% |
| |||||
$250,000 | Ally Auto Receivables Trust, Series 2014-SN2, Class A4, 1.21%, 2/20/19 | $ | 249,738 | |||
150,000 | AmeriCredit Automobile Receivables Trust, Series 2012-3, Class E, 4.46%, 11/8/19(a) | 152,170 | ||||
150,000 | AmeriCredit Automobile Receivables Trust, Series 2013-1, Class D, 2.09%, 2/8/19 | 150,095 | ||||
150,000 | AmeriCredit Automobile Receivables Trust, Series 2014-2, Class B, 1.60%, 7/8/19 | 149,722 | ||||
250,000 | AmeriCredit Automobile Receivables Trust, Series 2014-3, Class C, 2.58%, 9/8/20 | 250,477 | ||||
150,000 | AmeriCredit Automobile Receivables Trust, Series 2014-4, Class C, 2.47%, 11/9/20 | 150,571 | ||||
230,000 | Americredit Automobile Receivables Trust, Series 2015-2, Class C, 2.40%, 1/8/21 | 230,195 | ||||
83,636 | Credit-Based Asset Servicing and Securitization LLC, Series 2005-CB2, Class M1, 1.09%, 4/25/36(b) | 81,856 | ||||
158,120 | Enterprise Fleet Financing LLC, Series 2014-2, Class A2, 1.05%, 3/20/20(a) | 157,464 | ||||
250,000 | Macquarie Equipment Funding Trust, Series 2014-A, Class B, 1.99%, 7/20/21(a) | 247,620 | ||||
250,000 | Mercedes Benz Auto Lease Trust 2015-B, Class A4, 1.53%, 5/17/21 | 250,527 | ||||
225,412 | RASC Trust, Series 2005-KS9, Class M2, 0.86%, 10/25/35(b) | 221,761 | ||||
250,000 | Santander Drive Auto Receivables Trust, Series 2013-3, Class D, 2.42%, 4/15/19 | 250,018 | ||||
250,000 | Santander Drive Auto Receivables Trust, Series 2013-4, Class D, 3.92%, 1/15/20 | 256,365 | ||||
250,000 | Santander Drive Auto Receivables Trust, Series 2014-1, Class C, 2.36%, 4/15/20 | 250,805 | ||||
250,000 | Santander Drive Auto Receivables Trust, Series 2014-3, Class C, 2.13%, 8/17/20 | 250,118 | ||||
145,000 | Santander Drive Auto Receivables Trust, Series 2016-1, Class B, 2.47%, 12/15/20 | 145,451 | ||||
109,243 | Structured Asset Securities Corp., Series 2005-NC1, Class M1, 0.90%, 2/25/35(b) | 108,824 | ||||
|
| |||||
Total Asset Backed Securities | 3,553,777 | |||||
|
| |||||
(Cost $3,559,571) | ||||||
Collateralized Mortgage Obligations — 6.50% |
| |||||
97,812 | BCAP LLC Trust, Series 2010-RR7, Class 12A6, 6.00%, 8/26/36(a) | 99,729 | ||||
101,009 | JP Morgan Resecuritization Trust, Series 2014-1, Class 9A3, 0.73%, 12/26/35(a)(b) | 98,484 | ||||
31,597 | Nomura Asset Acceptance Corp. Alternative Loan Trust, Series 2005-AR1, Class 1A2, 2.84%, 2/25/35(b) | 31,569 | ||||
| 15 |
SCHEDULE OF PORTFOLIO INVESTMENTS
|
RBC Ultra-Short Fixed Income Fund (cont.)
March 31, 2016
Principal Amount | Value | |||||
$120,997 | RBSSP Resecuritization Trust, Series 2009-6, Class 13A4, 5.14%, 8/26/35(a)(b) | $ | 120,765 | |||
92,591 | RBSSP Resecuritization Trust, Series 2010-3, Class 9A1, 5.50%, 2/26/35(a) | 92,876 | ||||
217,996 | Springleaf Mortgage Loan Trust, Series 2013-1A, Class A, 1.27%, 6/25/58(a)(b) | 217,004 | ||||
96,750 | Springleaf Mortgage Loan Trust, Series 2013-2A, Class A, 1.78%, 12/25/65(a)(b) | 96,452 | ||||
405,635 | Springleaf Mortgage Loan Trust, Series 2013-3A, Class A, 1.87%, 9/25/57(a)(b) | 404,797 | ||||
|
| |||||
Total Collateralized Mortgage Obligations | 1,161,676 | |||||
|
| |||||
(Cost $1,172,116) | ||||||
Corporate Bonds — 65.87% |
| |||||
Banks — 15.27% |
| |||||
250,000 | Bank of America, N.A., 5.30%, 3/15/17 | 258,720 | ||||
150,000 | Barclays Bank Plc, 5.00%, 9/22/16 | 152,809 | ||||
250,000 | Branch Banking & Trust Co., 0.95%, 9/13/16(b) | 249,826 | ||||
250,000 | Citigroup, Inc., 1.30%, 11/15/16(b) | 250,353 | ||||
100,000 | Citigroup, Inc., 2.05%, 12/7/18 | 100,419 | ||||
125,000 | Citigroup, Inc., 2.15%, 7/30/18 | 125,686 | ||||
250,000 | Fifth Third Bancorp, 1.04%, 12/20/16(b) | 249,134 | ||||
150,000 | Goldman Sachs Group Inc., (The), 5.63%, 1/15/17 | 154,749 | ||||
150,000 | HSBC USA, Inc., 2.00%, 8/7/18 | 150,469 | ||||
250,000 | JP Morgan Chase Bank, N.A., 5.88%, 6/13/16 | 252,375 | ||||
75,000 | Morgan Stanley, 2.45%, 2/1/19 | 76,109 | ||||
150,000 | Morgan Stanley, 6.25%, 8/28/17 | 159,381 | ||||
200,000 | Toronto-Dominion Bank, 1.63%, 4/7/21 | 200,000 | ||||
250,000 | Wachovia Corp., 0.99%, 10/15/16(b) | 249,911 | ||||
100,000 | Wells Fargo & Co., 1.65%, 12/7/20(b) | 99,777 | ||||
|
| |||||
| 2,729,718 | ||||||
|
| |||||
Consumer Discretionary — 10.32% |
| |||||
200,000 | AbbVie, Inc., 1.80%, 5/14/18 | 201,343 | ||||
100,000 | Constellation Brands, Inc., 7.25%, 5/15/17 | 105,750 | ||||
150,000 | CVS Health Corp., 1.90%, 7/20/18 | 152,189 | ||||
250,000 | Ford Motor Credit Co. LLC, 1.72%, 12/6/17 | 248,157 | ||||
250,000 | Ford Motor Credit Co. LLC, 2.55%, 10/5/18 | 250,865 | ||||
150,000 | Hewlett Packard Enterprise Co., 2.45%, 10/5/17(a) | 150,979 | ||||
100,000 | Hyundai Capital America, 2.00%, 3/19/18(a) | 100,708 | ||||
250,000 | Kraft Heinz Foods Co., 2.00%, 7/2/18(a) | 252,313 | ||||
120,000 | L Brands, Inc., 6.90%, 7/15/17 | 127,050 | ||||
150,000 | Macy’s Retail Holdings, Inc., 5.90%, 12/1/16 | 154,583 | ||||
100,000 | Reynolds American, Inc., 2.30%, 6/12/18 | 101,997 | ||||
|
| |||||
| 1,845,934 | ||||||
|
| |||||
16 |
SCHEDULE OF PORTFOLIO INVESTMENTS
|
RBC Ultra-Short Fixed Income Fund (cont.)
March 31, 2016
Principal Amount | Value | |||||
Consumer Non Cyclicals — 1.56% |
| |||||
$225,000 | Anheuser-Busch Inbev Finance, Inc., 1.90%, 2/1/19 | $ | 228,213 | |||
50,000 | McGraw Hill Financial, Inc., 2.50%, 8/15/18 | 50,666 | ||||
|
| |||||
| 278,879 | ||||||
|
| |||||
Finance - Diversified — 6.18% |
| |||||
200,000 | Ally Financial, Inc., 2.75%, 1/30/17 | 199,000 | ||||
200,000 | American Tower Corp. REIT, 4.50%, 1/15/18 | 208,400 | ||||
100,000 | General Motors Financial Co., Inc., 2.75%, 5/15/16 | 100,136 | ||||
250,000 | General Motors Financial Co., Inc., 3.10%, 1/15/19 | 252,990 | ||||
20,000 | PACCAR Financial Corp., 1.24%, 12/6/18(b) | 20,043 | ||||
125,000 | Regions Financial Corp., 2.25%, 9/14/18 | 124,785 | ||||
200,000 | Synchrony Financial, 1.88%, 8/15/17 | 199,381 | ||||
|
| |||||
| 1,104,735 | ||||||
|
| |||||
Health Care — 8.43% |
| |||||
250,000 | Actavis Funding SCS, 2.35%, 3/12/18 | 252,953 | ||||
150,000 | Cardinal Health Inc., 1.95%, 6/15/18 | 150,701 | ||||
100,000 | EMD Finance LLC, 1.70%, 3/19/18(a) | 99,635 | ||||
150,000 | Express Scripts Holding Co., 1.25%, 6/2/17 | 149,695 | ||||
200,000 | Laboratory Corp. of America Holdings, 2.20%, 8/23/17 | 201,118 | ||||
150,000 | McKesson Corp., 1.29%, 3/10/17 | 150,273 | ||||
75,000 | Mylan NV, 3.00%, 12/15/18(a) | 76,029 | ||||
125,000 | St. Jude Medical, Inc., 2.00%, 9/15/18 | 126,369 | ||||
150,000 | Zimmer Holdings, Inc., 1.45%, 4/1/17 | 149,950 | ||||
150,000 | Zimmer Holdings, Inc., 2.00%, 4/1/18 | 150,356 | ||||
|
| |||||
| 1,507,079 | ||||||
|
| |||||
Industrials — 4.28% |
| |||||
250,000 | L-3 Communications Corp., 3.95%, 11/15/16 | 253,259 | ||||
150,000 | Newell Rubbermaid, Inc., 2.60%, 3/29/19 | 152,181 | ||||
8,000 | Owens Corning, 6.50%, 12/1/16 | 8,172 | ||||
200,000 | Pentair Finance SA, 2.90%, 9/15/18 | 200,574 | ||||
150,000 | Thermo Fisher Scientific, Inc., 2.25%, 8/15/16 | 150,819 | ||||
|
| |||||
| 765,005 | ||||||
|
| |||||
Information Technology — 0.04% |
| |||||
7,000 | Oracle Corp., 1.20%, 1/15/19(b) | 7,030 | ||||
Insurance — 1.16% |
| |||||
200,000 | Hartford Financial Services Group, Inc., (The), 5.38%, 3/15/17 | 207,378 | ||||
Materials — 2.12% |
| |||||
125,000 | Ecolab, Inc., 2.00%, 1/14/19 | 126,112 | ||||
250,000 | Ecolab, Inc., 3.00%, 12/8/16 | 253,039 | ||||
|
| |||||
| 379,151 | ||||||
|
| |||||
Media — 3.46% |
| |||||
200,000 | 21st Century Fox America, Inc., 8.00%, 10/17/16 | 207,152 | ||||
| 17 |
SCHEDULE OF PORTFOLIO INVESTMENTS
|
RBC Ultra-Short Fixed Income Fund (cont.)
March 31, 2016
Principal Amount | Value | |||||
$200,000 | Time Warner Cable, Inc., 5.85%, 5/1/17 | $ | 208,487 | |||
200,000 | Viacom, Inc., 3.50%, 4/1/17 | 202,464 | ||||
|
| |||||
| 618,103 | ||||||
|
| |||||
Oil & Gas — 5.72% |
| |||||
200,000 | Anadarko Petroleum Corp., 5.95%, 9/15/16 | 203,472 | ||||
150,000 | Enbridge, Inc., 1.08%, 6/2/17(b) | 143,775 | ||||
200,000 | Marathon Oil Corp., 6.00%, 10/1/17 | 202,733 | ||||
170,000 | Pioneer Natural Resources Co., 5.88%, 7/15/16 | 171,713 | ||||
150,000 | Schlumberger Holdings Corp., 2.35%, 12/21/18(a) | 150,984 | ||||
150,000 | TransCanada Pipelines Ltd., 1.88%, 1/12/18 | 149,788 | ||||
|
| |||||
| 1,022,465 | ||||||
|
| |||||
Telecommunication Services — 3.78% |
| |||||
220,000 | AT&T, Inc., 2.40%, 8/15/16 | 221,333 | ||||
200,000 | AT&T, Inc., 2.40%, 3/15/17 | 202,334 | ||||
250,000 | Verizon Communications, Inc., 2.50%, 9/15/16 | 251,925 | ||||
|
| |||||
| 675,592 | ||||||
|
| |||||
Utilities — 3.55% |
| |||||
200,000 | Exelon Corp., 1.55%, 6/9/17 | 199,681 | ||||
200,000 | PSEG Power LLC, 5.32%, 9/15/16 | 203,629 | ||||
225,000 | Southwestern Electric Power Co., 5.55%, 1/15/17 | 232,258 | ||||
|
| |||||
| 635,568 | ||||||
|
| |||||
Total Corporate Bonds | 11,776,637 | |||||
|
| |||||
(Cost $11,762,295) | ||||||
U.S. Government Agency Backed Mortgages — 6.05% |
| |||||
Fannie Mae — 3.96% |
| |||||
39,705 | Pool #254235, 6.00%, 3/1/17 | 40,413 | ||||
80,265 | Pool #725098, 5.50%, 12/1/18 | 83,412 | ||||
44,953 | Pool #739413, 5.00%, 10/1/18 | 46,649 | ||||
100,343 | Pool #888467, 6.00%, 6/1/22 | 109,051 | ||||
114,901 | Pool #AL0202, 4.00%, 4/1/21 | 119,731 | ||||
6,231 | Series 2002-73, Class OE, 5.00%, 11/25/17 | 6,382 | ||||
58,770 | Series 2003-120, Class BL, 3.50%, 12/25/18 | 59,981 | ||||
30,429 | Series 2003-55, Class CD, 5.00%, 6/25/23 | 32,995 | ||||
34,669 | Series 2004-3, Class BE, 4.00%, 2/25/19 | 35,534 | ||||
33,460 | Series 2011-23, Class AB, 2.75%, 6/25/20 | 33,965 | ||||
138,202 | Series 2012-1, Class GB, 2.00%, 2/25/22 | 139,492 | ||||
|
| |||||
| 707,605 | ||||||
|
| |||||
Freddie Mac — 2.09% |
| |||||
5,254 | Series 2543, Class NM, 5.00%, 12/15/17 | 5,380 | ||||
42,819 | Series 2649, Class QH, 4.50%, 7/15/18 | 44,157 | ||||
27,774 | Series 2675, Class CK, 4.00%, 9/15/18 | 28,487 | ||||
18 |
SCHEDULE OF PORTFOLIO INVESTMENTS
|
RBC Ultra-Short Fixed Income Fund (cont.)
March 31, 2016
Principal Amount | Value | |||||
$33,407 | Series 2761, Class CB, 4.00%, 3/15/19 | $ | 34,312 | |||
81,675 | Series 3710, Class AB, 2.00%, 8/15/20 | 82,516 | ||||
88,150 | Series 3726, Class BA, 2.00%, 8/15/20 | 88,882 | ||||
87,849 | Series 3852, Class EA, 4.50%, 12/15/21 | 91,253 | ||||
|
| |||||
| 374,987 | ||||||
|
| |||||
Total U.S. Government Agency Backed Mortgages | 1,082,592 | |||||
|
| |||||
(Cost $1,084,202) | ||||||
U.S. Treasury Obligations — 0.42% |
| |||||
U.S. Treasury Notes — 0.42% |
| |||||
75,000 | 0.63%, 2/15/17 | 75,012 | ||||
|
| |||||
Total U.S. Treasury Obligations | 75,012 | |||||
|
| |||||
(Cost $74,949) | ||||||
| Shares | ||||||
Investment Company — 1.90% |
| |||||
338,908 | RBC Prime Money Market Fund, Institutional Class 1(c) | 338,908 | ||||
|
| |||||
Total Investment Company | 338,908 | |||||
|
| |||||
(Cost $338,908) | ||||||
Total Investments | $ | 17,988,602 | ||||
(Cost $17,992,041)(d) — 100.62% | ||||||
Liabilities in excess of other assets — (0.62)% | (111,478 | ) | ||||
|
| |||||
NET ASSETS — 100.00% | $ | 17,877,124 | ||||
|
| |||||
| (a) | Security exempt from registration under Rule 144A or Section 4(2) of the Securities Act of 1933, as amended. These securities may be resold in transactions exempt from registration, normally to qualified institutional buyers. Security has been deemed to be liquid based on procedures approved by the Board of Trustees. |
| (b) | Variable rate security. The rate reflected in the Schedule of Portfolio Investments is the rate in effect on March 31, 2016. |
| (c) | Affiliated investment. |
| (d) | See Notes to Financial Statements for the tax cost of securities and the breakdown of unrealized appreciation (depreciation). |
Abbreviations used are defined below:
REIT - Real Estate Investment Trust
| 19 |
SCHEDULE OF PORTFOLIO INVESTMENTS
|
RBC Ultra-Short Fixed Income Fund (cont.)
March 31, 2016
Financial futures contracts as of March 31, 2016:
Short Position | Number of | Expiration Date | Unrealized | Notional Value | Clearinghouse | |||||||||||
Two Year U.S. | ||||||||||||||||
Treasury Bonds | 13 | June, 2016 | $2,031 | USD | 2,845,781 | Barclays Plc | ||||||||||
See Notes to Financial Statements.
20 |
|
Statement of Assets and Liabilities
March 31, 2016
| Short Duration Fixed Income Fund | Ultra-Short Fixed Income Fund | |||||||||
Assets: | ||||||||||
Investments in securities, at value: | ||||||||||
Unaffiliated investments (cost $13,594,352 and $17,653,133, respectively) | $ | 13,606,798 | $ | 17,649,694 | ||||||
Affiliated investment (cost $361,980 and $338,908, respectively) | 361,980 | 338,908 | ||||||||
Cash | 309,340 | — | ||||||||
Interest and dividends receivable | 93,414 | 90,638 | ||||||||
Receivable from advisor | 12,516 | 15,134 | ||||||||
Cash pledged for financial futures contracts | 25,514 | 16,083 | ||||||||
Unrealized appreciation on futures contracts | 750 | 2,031 | ||||||||
Prepaid expenses and other assets | 20,453 | 21,687 | ||||||||
|
|
|
| |||||||
Total Assets | 14,430,765 | 18,134,175 | ||||||||
|
|
|
| |||||||
Liabilities: | ||||||||||
Payable for capital shares redeemed | 561 | 7,529 | ||||||||
Payable for investments purchased | 150,000 | 200,000 | ||||||||
Unrealized depreciation on futures contracts | 1,250 | — | ||||||||
Accrued expenses and other payables: | ||||||||||
Accounting fees | 4,207 | 4,244 | ||||||||
Trustee fees | 6 | 6 | ||||||||
Shareholder reports | 2,881 | 3,815 | ||||||||
Audit fees | 36,900 | 36,900 | ||||||||
Transfer Agent fees | 1,453 | 1,576 | ||||||||
Other | 2,749 | 2,981 | ||||||||
|
|
|
| |||||||
Total Liabilities | 200,007 | 257,051 | ||||||||
|
|
|
| |||||||
Net Assets | $ | 14,230,758 | $ | 17,877,124 | ||||||
|
|
|
| |||||||
Net Assets Consist Of: | ||||||||||
Capital | $ | 14,325,356 | $ | 18,037,934 | ||||||
Undistributed net investment income | 25,013 | 351 | ||||||||
Accumulated net realized losses from investment transactions and futures contracts | (131,557 | ) | (159,753 | ) | ||||||
Net unrealized appreciation (depreciation) on investments and futures contracts | 11,946 | (1,408 | ) | |||||||
|
|
|
| |||||||
Net Assets | $ | 14,230,758 | $ | 17,877,124 | ||||||
|
|
|
| |||||||
| 21 |
FINANCIAL STATEMENTS
|
Statement of Assets and Liabilities (cont.)
March 31, 2016
| Short Duration Fixed Income Fund | Ultra-Short Fixed Income Fund | |||||||||
Net Assets: | ||||||||||
Class F | $ | 1,305,336 | $ | 4,394,862 | ||||||
Class I | 12,925,422 | 13,482,262 | ||||||||
|
|
|
| |||||||
Total | $ | 14,230,758 | $ | 17,877,124 | ||||||
|
|
|
| |||||||
Shares Outstanding (Unlimited number of shares authorized, no par value): | ||||||||||
Class F | 131,529 | 445,375 | ||||||||
Class I | 1,302,913 | 1,366,538 | ||||||||
|
|
|
| |||||||
Total | 1,434,442 | 1,811,913 | ||||||||
|
|
|
| |||||||
Net Asset Values and Redemption Price Per Share: | ||||||||||
Class F | $ | 9.92 | $ | 9.87 | ||||||
|
|
|
| |||||||
Class I | $ | 9.92 | $ | 9.87 | ||||||
|
|
|
| |||||||
See Notes to Financial Statements.
22 |
FINANCIAL STATEMENTS
|
For the Year Ended March 31, 2016
| Short Duration Fixed Income Fund | Ultra-Short Fixed Income Fund | |||||||||
Investment Income: | ||||||||||
Interest income | $ | 267,755 | $ | 259,914 | ||||||
Dividend income - affiliated investment | 317 | 512 | ||||||||
|
|
|
| |||||||
Total Investment Income | 268,072 | 260,426 | ||||||||
|
|
|
| |||||||
Expenses: | ||||||||||
Investment advisory fees | 39,198 | 43,079 | ||||||||
Distribution fees - Class F | 1,406 | 3,954 | ||||||||
Accounting fees | 25,653 | 25,862 | ||||||||
Audit fees | 38,623 | 38,623 | ||||||||
Legal fees | 6,493 | 8,228 | ||||||||
Custodian fees | 2,262 | 2,982 | ||||||||
Insurance fees | 4,916 | 4,916 | ||||||||
Trustees’ fees | 509 | 649 | ||||||||
Transfer agent fees - Class F | 3,981 | 3,631 | ||||||||
Transfer agent fees - Class I | 4,294 | 4,923 | ||||||||
Shareholder reports | 9,507 | 12,838 | ||||||||
Registration and filing fees | 35,398 | 37,408 | ||||||||
Other fees | 11,529 | 11,797 | ||||||||
|
|
|
| |||||||
Total expenses | 183,769 | 198,890 | ||||||||
|
|
|
| |||||||
Expenses waived/reimbursed by: | ||||||||||
Advisor | (136,632 | ) | (143,242 | ) | ||||||
|
|
|
| |||||||
Net Expenses | 47,137 | 55,648 | ||||||||
|
|
|
| |||||||
Net Investment Income | 220,935 | 204,778 | ||||||||
|
|
|
| |||||||
Realized/Unrealized Gains (Losses): | ||||||||||
Net realized losses on: | ||||||||||
Investment transactions | (6,573 | ) | (1,434 | ) | ||||||
Futures contracts | (89,756 | ) | (32,891 | ) | ||||||
|
|
|
| |||||||
Net realized losses | (96,329 | ) | (34,325 | ) | ||||||
|
|
|
| |||||||
Net change in unrealized appreciation (depreciation) on: | ||||||||||
Investments | (22,705 | ) | 7,701 | |||||||
Futures contracts | 76,972 | 16,056 | ||||||||
|
|
|
| |||||||
Net unrealized gains | 54,267 | 23,757 | ||||||||
|
|
|
| |||||||
Change in net assets resulting from operations | $ | 178,873 | $ | 194,210 | ||||||
|
|
|
| |||||||
See Notes to Financial Statements.
| 23 |
FINANCIAL STATEMENTS
|
Statement of Changes in Net Assets
| Short Duration Fixed Income Fund | ||||||||||
| For the Year Ended March 31, 2016 | For the Year Ended March 31, 2015 | |||||||||
From Investment Activities: | ||||||||||
Operations: | ||||||||||
Net investment income | $ | 220,935 | $ | 239,407 | ||||||
Net realized losses from investments | (96,329 | ) | (20,098 | ) | ||||||
Net change in unrealized appreciation (depreciation) on investments and futures contracts | 54,267 | (40,118 | ) | |||||||
|
|
|
| |||||||
Change in net assets resulting from operations | 178,873 | 179,191 | ||||||||
|
|
|
| |||||||
Distributions to Class F Shareholders: | ||||||||||
From net investment income | (23,247 | ) | (31,038 | ) | ||||||
From net realized gains | — | (2,950 | ) | |||||||
Distributions to Class I Shareholders: | ||||||||||
From net investment income | (206,762 | ) | (263,186 | ) | ||||||
From net realized gains | — | (23,825 | ) | |||||||
|
|
|
| |||||||
Change in net assets resulting from shareholder distributions | (230,009 | ) | (320,999 | ) | ||||||
|
|
|
| |||||||
Capital Transactions: | ||||||||||
Proceeds from shares issued | 3,177,552 | 11,038,294 | ||||||||
Distributions reinvested | 229,598 | 307,731 | ||||||||
Cost of shares redeemed | (3,402,675 | ) | (7,373,127 | ) | ||||||
|
|
|
| |||||||
Change in net assets resulting from capital transactions | 4,475 | 3,972,898 | ||||||||
|
|
|
| |||||||
Net increase (decrease) in net assets | (46,661 | ) | 3,831,090 | |||||||
Net Assets: | ||||||||||
Beginning of year | 14,277,419 | 10,446,329 | ||||||||
|
|
|
| |||||||
End of year | $ | 14,230,758 | $ | 14,277,419 | ||||||
|
|
|
| |||||||
Undistributed net investment income | $ | 25,013 | $ | 25,740 | ||||||
|
|
|
| |||||||
Share Transactions: | ||||||||||
Issued | 322,078 | 1,099,984 | ||||||||
Reinvested | 23,148 | 30,840 | ||||||||
Redeemed | (342,720 | ) | (741,452 | ) | ||||||
|
|
|
| |||||||
Change in shares resulting from capital transactions | 2,506 | 389,372 | ||||||||
|
|
|
| |||||||
See Notes to Financial Statements.
24 |
FINANCIAL STATEMENTS
|
Statement of Changes in Net Assets (cont.)
| Ultra-Short Fixed Income Fund | ||||||||||
| For the Year Ended March 31, 2016 | For the Year Ended March 31, 2015 | |||||||||
From Investment Activities: | ||||||||||
Operations: | ||||||||||
Net investment income | $ | 204,778 | $ | 156,304 | ||||||
Net realized losses from investments | (34,325 | ) | (26,305 | ) | ||||||
Net change in unrealized appreciation (depreciation) on investments and futures contracts | 23,757 | (21,225 | ) | |||||||
|
|
|
| |||||||
Change in net assets resulting from operations | 194,210 | 108,774 | ||||||||
|
|
|
| |||||||
Distributions to Class F Shareholders: | ||||||||||
From net investment income | (52,121 | ) | (7,399 | ) | ||||||
Distributions to Class I Shareholders: | ||||||||||
From net investment income | (190,398 | ) | (275,613 | ) | ||||||
|
|
|
| |||||||
Change in net assets resulting from shareholder distributions | (242,519 | ) | (283,012 | ) | ||||||
|
|
|
| |||||||
Capital Transactions: | ||||||||||
Proceeds from shares issued | 7,951,400 | 10,905,826 | ||||||||
Distributions reinvested | 242,519 | 282,961 | ||||||||
Cost of shares redeemed | (4,798,975 | ) | (6,652,389 | ) | ||||||
|
|
|
| |||||||
Change in net assets resulting from capital transactions | 3,394,944 | 4,536,398 | ||||||||
|
|
|
| |||||||
Net increase in net assets | 3,346,635 | 4,362,160 | ||||||||
Net Assets: | ||||||||||
Beginning of year | 14,530,489 | 10,168,329 | ||||||||
|
|
|
| |||||||
End of year | $ | 17,877,124 | $ | 14,530,489 | ||||||
|
|
|
| |||||||
Undistributed (Distributions in excess of) net investment income | $ | 351 | $ | (1 | ) | |||||
|
|
|
| |||||||
Share Transactions: | ||||||||||
Issued | 804,849 | 1,093,877 | ||||||||
Reinvested | 24,587 | 28,520 | ||||||||
Redeemed | (486,122 | ) | (672,212 | ) | ||||||
|
|
|
| |||||||
Change in shares resulting from capital transactions | 343,314 | 450,185 | ||||||||
|
|
|
| |||||||
See Notes to Financial Statements.
| 25 |
|
RBC Short Duration Fixed Income Fund
(Selected data for a share outstanding throughout the periods indicated)
| For the Year Ended March 31, 2016 | For the Year Ended March 31, 2015 | For the Period Ended March 31, 2014(a) | |||||||||||||
Class F | |||||||||||||||
Per Share Operating Performance: | |||||||||||||||
Net asset value, beginning of period | $ | 9.97 | $ | 10.02 | $ | 10.04 | |||||||||
|
|
|
|
|
| ||||||||||
Net investment income(b) | 0.16 | 0.14 | 0.01 | ||||||||||||
Realized and unrealized gains/(losses) | (0.04 | ) | — | (c) | (0.02 | ) | |||||||||
|
|
|
|
|
| ||||||||||
Total from investment activities | 0.12 | 0.14 | (0.01 | ) | |||||||||||
|
|
|
|
|
| ||||||||||
Distributions: | |||||||||||||||
Net investment income | (0.17 | ) | (0.18 | ) | (0.01 | ) | |||||||||
Realized gains | — | (0.01 | ) | — | |||||||||||
|
|
|
|
|
| ||||||||||
Total distributions | (0.17 | ) | (0.19 | ) | (0.01 | ) | |||||||||
|
|
|
|
|
| ||||||||||
Net asset value, end of period | $ | 9.92 | $ | 9.97 | $ | 10.02 | |||||||||
|
|
|
|
|
| ||||||||||
Total Return: | 1.18% | 1.42% | (0.08)%(d) | ||||||||||||
Ratios to Average Net Assets: | |||||||||||||||
Ratio of Net Expenses to Average Net Assets | 0.45% | 0.45% | 0.45%(e) | ||||||||||||
Ratio of Net Investment Income to Average Net Assets | 1.60% | 1.45% | 1.33%(e) | ||||||||||||
Ratio of Expenses to Average Net Assets* | 1.70% | 2.07% | 43.21%(e) | ||||||||||||
Net assets, end of period (in thousands) | $ | 1,305 | $ | 1,934 | $ | 10 | |||||||||
Portfolio turnover** | 50 | % | 57 | % | 46 | % | |||||||||
| * | During the period, certain fees were contractually or voluntarily reduced and/or reimbursed. If such contractual/voluntary fee reductions and reimbursements had not occurred, the ratio would have been as indicated. |
| ** | Portfolio turnover rate is calculated on the basis of the Fund as a whole without distinguishing between the classes of shares issued. |
| (a) | For the period from March 3, 2014 (commencement of operations) to March 31, 2014. |
| (b) | Per share net investment income has been calculated using the average daily shares method. |
| (c) | Less than $0.01 or $(0.01) per share. |
| (d) | Not Annualized. |
| (e) | Annualized. |
See Notes to Financial Statements.
26 |
FINANCIAL HIGHLIGHTS
|
RBC Short Duration Fixed Income Fund
(Selected data for a share outstanding throughout the periods indicated)
| For the Year Ended March 31, 2016 | For the Year Ended March 31, 2015 | For the Period Ended March 31, 2014(a) | |||||||||||||
Class I | |||||||||||||||
Per Share Operating Performance: | |||||||||||||||
Net asset value, beginning of period | $ | 9.97 | $ | 10.02 | $ | 10.00 | |||||||||
|
|
|
|
|
| ||||||||||
Net investment income(b) | 0.17 | 0.15 | 0.04 | ||||||||||||
Realized and unrealized gains/(losses) | (0.04 | ) | — | (c) | 0.02 | ||||||||||
|
|
|
|
|
| ||||||||||
Total from investment activities | 0.13 | 0.15 | 0.06 | ||||||||||||
|
|
|
|
|
| ||||||||||
Distributions: | |||||||||||||||
Net investment income | (0.18 | ) | (0.19 | ) | (0.04 | ) | |||||||||
Realized gains | — | (0.01 | ) | — | |||||||||||
|
|
|
|
|
| ||||||||||
Total distributions | (0.18 | ) | (0.20 | ) | (0.04 | ) | |||||||||
|
|
|
|
|
| ||||||||||
Net asset value, end of period | $ | 9.92 | $ | 9.97 | $ | 10.02 | |||||||||
|
|
|
|
|
| ||||||||||
Total Return: | 1.28% | 1.51% | 0.57%(d) | ||||||||||||
Ratios to Average Net Assets: | |||||||||||||||
Ratio of Net Expenses to Average Net Assets | 0.35% | 0.35% | 0.35%(e) | ||||||||||||
Ratio of Net Investment Income to Average Net Assets | 1.70% | 1.55% | 1.41%(e) | ||||||||||||
Ratio of Expenses to Average Net Assets* | 1.37% | 1.68% | 3.66%(e) | ||||||||||||
Net assets, end of period (in thousands) | $ | 12,925 | $ | 12,344 | $ | 10,436 | |||||||||
Portfolio turnover** | 50 | % | 57 | % | 46 | % | |||||||||
| * | During the period, certain fees were contractually or voluntarily reduced and/or reimbursed. If such contractual/voluntary fee reductions and reimbursements had not occurred, the ratio would have been as indicated. |
| ** | Portfolio turnover rate is calculated on the basis of the Fund as a whole without distinguishing between the classes of shares issued. |
| (a) | For the period from December 20, 2013 (commencement of operations) to March 31, 2014. |
| (b) | Per share net investment income has been calculated using the average daily shares method. |
| (c) | Less than $0.01 or $(0.01) per share. |
| (d) | Not Annualized. |
| (e) | Annualized. |
See Notes to Financial Statements.
27 |
FINANCIAL HIGHLIGHTS
|
RBC Ultra-Short Fixed Income Fund
(Selected data for a share outstanding throughout the periods indicated)
| For the Year Ended March 31, 2016 | For the Year Ended March 31, 2015 | For the Period Ended March 31, 2014(a) | |||||||||||||
Class F | |||||||||||||||
Per Share Operating Performance: | |||||||||||||||
Net asset value, beginning of period | $ | 9.89 | $ | 9.99 | $ | 9.98 | |||||||||
|
|
|
|
|
| ||||||||||
Net investment income(b) | 0.11 | 0.08 | — | ||||||||||||
Realized and unrealized gains/(losses) | — | (0.02 | ) | 0.02 | |||||||||||
|
|
|
|
|
| ||||||||||
Total from investment activities | 0.11 | 0.06 | 0.02 | ||||||||||||
|
|
|
|
|
| ||||||||||
Distributions: | |||||||||||||||
Net investment income | (0.13 | ) | (0.16 | ) | (0.01 | ) | |||||||||
|
|
|
|
|
| ||||||||||
Total distributions | (0.13 | ) | (0.16 | ) | (0.01 | ) | |||||||||
|
|
|
|
|
| ||||||||||
Net asset value, end of period | $ | 9.87 | $ | 9.89 | $ | 9.99 | |||||||||
|
|
|
|
|
| ||||||||||
Total Return: | 1.16% | 0.62% | 0.21%(c) | ||||||||||||
Ratios to Average Net Assets: | |||||||||||||||
Ratio of Net Expenses to Average Net Assets | 0.40% | 0.40% | 0.40%(d) | ||||||||||||
Ratio of Net Investment Income to Average Net Assets | 1.09% | 0.78% | (0.08)%(d) | ||||||||||||
Ratio of Expenses to Average Net Assets* | 1.25% | 3.04% | 43.18%(d) | ||||||||||||
Net assets, end of period (in thousands) | $ | 4,395 | $ | 608 | $ | 10 | |||||||||
Portfolio turnover** | 41 | % | 63 | % | 41 | % | |||||||||
| * | During the period, certain fees were contractually or voluntarily reduced and/or reimbursed. If such contractual/voluntary fee reductions and reimbursements had not occurred, the ratio would have been as indicated. |
| ** | Portfolio turnover rate is calculated on the basis of the Fund as a whole without distinguishing between the classes of shares issued. |
| (a) | For the period from March 3, 2014 (commencement of operations) to March 31, 2014. |
| (b) | Per share net investment income has been calculated using the average daily shares method. |
| (c) | Not Annualized. |
| (d) | Annualized. |
See Notes to Financial Statements.
28 |
FINANCIAL HIGHLIGHTS
|
RBC Ultra-Short Fixed Income Fund
(Selected data for a share outstanding throughout the periods indicated)
| For the Year Ended March 31, 2016 | For the Year Ended March 31, 2015 | For the Period Ended March 31, 2014(a) | |||||||||||||
Class I | |||||||||||||||
Per Share Operating Performance: | |||||||||||||||
Net asset value, beginning of period | $ | 9.89 | $ | 9.98 | $ | 10.00 | |||||||||
|
|
|
|
|
| ||||||||||
Net investment income(b) | 0.12 | 0.10 | 0.02 | ||||||||||||
Realized and unrealized losses | — | (0.02 | ) | (0.01 | ) | ||||||||||
|
|
|
|
|
| ||||||||||
Total from investment activities | 0.12 | 0.08 | 0.01 | ||||||||||||
|
|
|
|
|
| ||||||||||
Distributions: | |||||||||||||||
Net investment income | (0.14 | ) | (0.17 | ) | (0.03 | ) | |||||||||
|
|
|
|
|
| ||||||||||
Total distributions | (0.14 | ) | (0.17 | ) | (0.03 | ) | |||||||||
|
|
|
|
|
| ||||||||||
Net asset value, end of period | $ | 9.87 | $ | 9.89 | $ | 9.98 | |||||||||
|
|
|
|
|
| ||||||||||
Total Return: | 1.24% | 0.83% | 0.14%(c) | ||||||||||||
Ratios to Average Net Assets: | |||||||||||||||
Ratio of Net Expenses to Average Net Assets | 0.30% | 0.30% | 0.30%(d) | ||||||||||||
Ratio of Net Investment Income to Average Net Assets | 1.22% | 1.03% | 0.88%(d) | ||||||||||||
Ratio of Expenses to Average Net Assets* | 1.13% | 1.65% | 3.70%(d) | ||||||||||||
Net assets, end of period (in thousands) | $ | 13,482 | $ | 13,922 | $ | 10,158 | |||||||||
Portfolio turnover** | 41 | % | 63 | % | 41 | % | |||||||||
| * | During the period, certain fees were contractually or voluntarily reduced and/or reimbursed. If such contractual/voluntary fee reductions and reimbursements had not occurred, the ratio would have been as indicated. |
| ** | Portfolio turnover rate is calculated on the basis of the Fund as a whole without distinguishing between the classes of shares issued. |
| (a) | For the period from December 30, 2013 (commencement of operations) to March 31, 2014. |
| (b) | Per share net investment income has been calculated using the average daily shares method. |
| (c) | Not Annualized. |
| (d) | Annualized. |
See Notes to Financial Statements.
| 29 |
|
March 31, 2016
1. Organization
RBC Funds Trust (the “Trust”) is registered under the Investment Company Act of 1940 (as amended) as an open-end management investment company. The Trust was organized as a Delaware statutory trust on December 16, 2003 and currently consists of 22 portfolios. This report includes the following two investment portfolios (each a “Fund” and collectively, the “Funds”):
- RBC Short Duration Fixed Income Fund (“Short Duration Fixed Income Fund”)
- RBC Ultra-Short Fixed Income Fund (“Ultra-Short Fixed Income Fund”)
The Funds offer Class F and Class I shares. Class F and Class I shares (intended for investors meeting certain investment minimum thresholds) are not subject to either a front-end sales charge or a contingent deferred sales charge.
RBC Global Asset Management (U.S.) Inc. (“RBC GAM (US)” or “Advisor” or “Co-Administrator”) acts as the investment advisor for the Funds. The officers of the Trust (“Fund Management”) are also employees of RBC GAM (US).
2. Significant Accounting Policies
The Trust, which is an investment company within the scope of Financial Accounting Standards Board (“FASB”) Accounting Standard Update 2013-08, follows accounting and reporting guidance under FASB Accounting Standards Codification Topic 946, “Financial Services-Investment Companies.” Summarized below are the significant accounting policies of the Funds. These policies conform to accounting principles generally accepted in the United States of America (“US GAAP”). Fund Management follows these policies when preparing financial statements. Fund Management may also be required to make estimates and assumptions that affect the reported amounts of assets and liabilities at the date of the financial statements and the reported amounts of income and expenses for the period. Actual results could differ from those estimates. The financial statements are as of the close of regular trading on the New York Stock Exchange.
Security Valuation:
The Trust’s Board of Trustees (the “Board”) has adopted pricing and valuation procedures for determining the fair value of the Funds’ investments. Fair value of a security is considered to be the price that a fund might reasonably expect to receive upon its current sale in an orderly transaction between market participants.
Fixed income securities, including to-be-announced (“TBA”) commitments and municipal bonds, are generally valued based on evaluated prices received from third-party pricing services or from broker-dealers who make markets in the securities and are generally categorized as Level 2 in the fair value hierarchy. The pricing services utilize both dealer-supplied valuations and electronic data processing techniques that take into account multiple appropriate factors such as institutional-size trading in similar groups of securities, market spreads, interest rates, and fundamental security analytical data including yield, quality, coupon rate, maturity and type of issue.
Mortgage-related securities represent direct or indirect participation in, or are secured by and payable from, mortgage loans secured by real property and include pass-through securities and collateralized mortgage obligations. These securities may be issued or guaranteed by U.S. Government agencies or instrumentalities, or private issuers, including commercial banks, savings and loan institutions, private mortgage insurance bankers and other secondary market issuers. These mortgage-related securities are generally valued by pricing services that use broker-dealer quotations or valuation estimates from their internal pricing models. These pricing models generally consider such factors as current market data, estimated cash flows, market-based yield spreads, and estimated prepayment rates. Securities valued
30 |
NOTES TO FINANCIAL STATEMENTS
|
using such techniques and inputs are generally categorized as Level 2 in the fair value hierarchy. To the extent significant inputs are unobservable, the securities will be categorized as Level 3.
Exchange-traded futures are valued at the last sale price at the close of the market on the principal exchange on which they are traded and are categorized as Level 1 in the fair value hierarchy. Investments in open-end investment companies (mutual funds) are valued at net asset value and are categorized as Level 1 in the fair value hierarchy.
The Board has delegated to the Funds’ Pricing Committee (“Pricing Committee”) the responsibility for implementing the pricing and valuation procedures, including responsibility for determining the fair value of the Funds’ securities. The Pricing Committee includes representatives of the Funds’ Advisor and Co-Administrator, including personnel from accounting and operations, investment management, trading, risk management, compliance and legal. The Pricing Committee meets at least quarterly to review and approve Fund valuation matters, including a review of the Funds’ pricing activity and operations, fair value measurements, pricing vendors, policies and procedures, and related controls. At least a quorum of the Pricing Committee shall meet more frequently, as needed, to consider and approve time-sensitive fair valuation matters. The Pricing Committee reports to the Valuation, Portfolio Management and Performance Committee (“Valuation Committee”) of the Board. Members of the Pricing Committee meet with the Valuation Committee and the Board at each of their regularly scheduled meetings to discuss valuation matters and actions taken during the period.
The Board has adopted procedures to determine the fair value of a security when a price is not available from a pricing service or broker-dealer or Fund Management determines that a price provided by a pricing service or broker-dealer does not approximate fair value. Fair valuation may also be used when a significant valuation event affecting the value of a security or market sector is determined to have occurred between the time when a security’s market closes and the time the Funds’ net asset value is calculated. The fair value of the security will be determined in good faith by the Pricing Committee in accordance with procedures and methodologies adopted by the Board. General factors used in determining the fair value of securities include, but are not limited to, fundamental analytical data relating to the security, the issuer and the market, such as duration, prepayment and default rates; general level of interest rates and changes in interest rates; information from broker-dealers; trading in similar securities; any restrictions on disposition of the security; and an evaluation of the forces that influence the market in which the investments are traded. These securities are either categorized as Level 2 or 3 in the fair value hierarchy, depending on the relevant inputs used.
When the Funds utilize fair valuation methods that use significant unobservable inputs to determine a security’s value, such securities will be categorized as Level 3 of the fair value hierarchy. These methods may require subjective determinations about the value of a security. While the Funds’ policy is intended to result in a calculation of a Fund’s net asset value that fairly reflects security values as of the time of pricing, the Funds cannot guarantee that values determined by the Board or persons acting at their direction would accurately reflect the price that the Funds could obtain for a security if they were to dispose of it as of the time of pricing (for instance, in a forced or distressed sale). The prices used by the Funds may differ from the value that would be realized if the securities were sold.
The Pricing Committee employs various methods for calibrating the valuation approach related to securities categorized within Level 2 and Level 3 of the fair value hierarchy. These methods may include regular due diligence of the Funds’ pricing vendors, a regular review of key inputs and assumptions, transaction back-testing or disposition analysis to compare unrealized gains and losses to realized gains and losses, reviews of missing and stale prices and large movements in market value, and reviews of any market related activities. Additionally, the pricing of all fair value holdings is subsequently reported to the Valuation Committee and Board.
| 31 |
NOTES TO FINANCIAL STATEMENTS
|
Fair Value Measurements:
The Funds disclose the fair value of their investments in a hierarchy that categorizes investments based on the inputs to valuation techniques used to measure fair value. The three levels of the fair value hierarchy are as follows:
● Level 1 - Inputs that reflect unadjusted quoted prices in active markets for identical assets or liabilities that the Funds have the ability to access at the measurement date.
● Level 2 - Significant inputs other than quoted prices that are observable for the asset or liability either directly or indirectly, including inputs in markets that are not considered to be active. Observable inputs may include quoted prices for similar securities, interest rates, spreads, prepayment speeds, etc.
● Level 3 - Significant unobservable inputs based on the best information available in the circumstances, to the extent observable inputs are not available (including the Fund’s own assumptions in determining the fair value of investments).
The inputs or methodology used for valuing investments are not necessarily an indication of the risk associated with investing in those securities.
Inputs used in determining fair value of an investment may include, but are not limited to, price information, volatility statistics, credit and market data, and other factors, all of which may be either observable or unobservable. Inputs can vary among investments and will be impacted by the investment type and volume of activity for the particular security or similar securities in the market. Investments in the Level 3 category are generally supported by transactions and quoted prices from dealers participating in the market for those investments. Investments may be included in the Level 3 category due to a lack of market activity or transparency. Internal valuation models may also be used as a pricing source for Level 3 investments. Internal valuation models may rely on one or more unobservable inputs, such as estimated cash flows, financial statement analysis and discount rates.
The summary of inputs used to determine the fair value of each Fund’s investments as of March 31, 2016 is as follows:
| Level 1 Quoted Prices | Level 2 Significant Observable Inputs | Level 3 Significant Unobservable Inputs | Total | |||||||||||||||||
Short Duration Fixed Income Fund | ||||||||||||||||||||
Assets: | ||||||||||||||||||||
Investments in Securities | ||||||||||||||||||||
Asset Backed Securities | $ | — | $ | 2,378,784 | $ | — | $ | 2,378,784 | ||||||||||||
Collateralized Mortgage Obligations | — | 953,993 | — | 953,993 | ||||||||||||||||
Corporate Bonds | — | 9,062,197 | — | 9,062,197 | ||||||||||||||||
Municipal Bonds | — | 99,969 | — | 99,969 | ||||||||||||||||
U.S. Government Agency Backed Mortgages | — | 191,640 | — | 191,640 | ||||||||||||||||
U.S. Treasury Obligations | — | 920,215 | — | 920,215 | ||||||||||||||||
Investment Company | 361,980 | — | — | 361,980 | ||||||||||||||||
Other Financial Instruments(*) | ||||||||||||||||||||
Interest Rate Contracts | 750 | — | — | 750 | ||||||||||||||||
|
|
|
|
|
|
|
| |||||||||||||
| $ | 362,730 | $ | 13,606,798 | $ | — | $ | 13,969,528 | |||||||||||||
|
|
|
|
|
|
|
| |||||||||||||
Liabilities: | ||||||||||||||||||||
Other Financial Instruments(*) | ||||||||||||||||||||
Interest Rate Contracts | $ | (1,250 | ) | $ | — | $ | — | $ | (1,250 | ) | ||||||||||
|
|
|
|
|
|
|
| |||||||||||||
32 |
NOTES TO FINANCIAL STATEMENTS
|
| Level 1 Quoted Prices | Level 2 Significant Observable Inputs | Level 3 Significant Unobservable Inputs | Total | |||||||||||||||||
Ultra-Short Fixed Income Fund | ||||||||||||||||||||
Assets: | ||||||||||||||||||||
Investments in Securities | ||||||||||||||||||||
Asset Backed Securities | $ | — | $ | 3,553,777 | $ | — | $ | 3,553,777 | ||||||||||||
Collateralized Mortgage Obligations | — | 1,161,676 | — | 1,161,676 | ||||||||||||||||
Corporate Bonds | — | 11,776,637 | — | 11,776,637 | ||||||||||||||||
U.S. Government Agency Backed Mortgages | — | 1,082,592 | — | 1,082,592 | ||||||||||||||||
U.S. Government Agency Obligations | — | 75,012 | — | 75,012 | ||||||||||||||||
Investment Company | 338,908 | — | — | 338,908 | ||||||||||||||||
Other Financial Instruments(*) | ||||||||||||||||||||
Interest Rate Contracts | 2,031 | — | — | 2,031 | ||||||||||||||||
|
|
|
|
|
|
|
| |||||||||||||
| $ | 340,939 | $ | 17,649,694 | $ | — | $ | 17,990,633 | |||||||||||||
|
|
|
|
|
|
|
| |||||||||||||
* Other financial instruments are futures contracts which are reflected in the Schedule of Portfolio Investments and are shown at the unrealized appreciation/(depreciation) on the contracts.
During the year ended March 31, 2016, the Funds held no investments categorized as Level 3 in the hierarchy.
During the year ended March 31, 2016, the Funds recognized no transfers to/from Level 1 or Level 2. The Funds’ policy is to recognize transfers between Level 1, Level 2 and Level 3 at the end of the year utilizing fair value at the beginning of the year.
Financial Instruments:
Derivatives:
The Funds may use derivative instruments, including futures, forwards, options, indexed securities, swaps and inverse securities for hedging purposes only. Derivatives allow the Funds to manage its risk exposure more quickly and efficiently than other types of instruments. Derivatives may be riskier than other types of investments and could result in losses that significantly exceed a Fund’s original investment. Derivatives are subject to the risk that changes in the value of a derivative may not correlate perfectly with the underlying asset, rate or index. The use of derivatives may not be successful, resulting in losses to a Fund, and the cost of such strategies may reduce the Funds’ returns.
Hedging also involves the risk that changes in the value of the derivative will not match those of the holdings being hedged as expected by the Funds, in which case any losses on the holdings being hedged may not be reduced and may be increased. There can be no assurance that the Funds’ hedging strategy will reduce risk or that hedging transactions will be available or cost effective. The Funds are subject to interest rate risk in the normal course of pursuing their investment objectives by investing in various derivative financial instruments, as described below. For open derivative instruments as of March 31, 2016, see the following section for financial futures contracts.
Financial Futures Contracts:
The Funds entered into futures contracts in an effort to both manage their cash position and hedge against certain market risk. A futures contract on a securities index is an agreement obligating one party to pay, and entitling the other party to receive, during the term of the contract, cash payments based on the level of a specified securities index. Futures transactions involve brokerage costs and require a Fund to segregate assets to cover contracts that would require it to purchase securities or currencies. A Fund may lose the expected benefit of futures transactions if interest rates, exchange
| 33 |
NOTES TO FINANCIAL STATEMENTS
|
rates or securities prices change in an unanticipated manner. Such unanticipated changes may also result in lower overall performance than if a Fund had not entered into any futures transactions.
Upon entering into a futures contract, a Fund is required to pledge to the broker an amount of cash, U.S. government securities, or other assets equal to a certain percentage of the contract amount. Subsequent payments are made or received by the Funds each day, depending on the daily fluctuations in the fair value of the underlying instrument. A Fund would record an unrealized gain or loss each day equal to these daily payments.
Open futures contracts are shown on the Schedules of Portfolio Investments. Underlying collateral pledged for open futures contracts is the cash at brokers shown on the Statements of Assets and Liabilities at March 31, 2016.
Fair value of derivative instruments as of March 31, 2016:
Derivative Instruments Categorized by Risk Exposure | Statement of Assets and Liabilities Location | Amount | ||||
Short Duration Fixed Income Fund | ||||||
| Asset Derivatives | ||||||
Interest Rate Risk | Unrealized Appreciation on Futures Contracts | $ | 750 | |||
|
| |||||
| Liability Derivatives | ||||||
Interest Rate Risk | Unrealized Depreciation on Futures Contracts | $ | 1,250 | |||
|
| |||||
Derivative Instruments Categorized by Risk Exposure | Statement of Assets and Liabilities Location | Amount | ||||
Ultra-Short Fixed Income Fund | ||||||
| Asset Derivatives | ||||||
Interest Rate Risk | Unrealized Appreciation on Futures Contracts | $ | 2,031 | |||
|
| |||||
The effect of derivative instruments on the Statements of Operations during the year ended March 31, 2016 is as follows:
| Derivative Instruments Categorized by Risk Exposure | Net Realized Gains (Losses) from Futures Contracts | Net Change in Unrealized Appreciation/(Depreciation) on Futures Contracts | ||||||||||
Short Duration Fixed Income Fund | Interest Rate Risk | $(89,756 | ) | $76,972 | ||||||||
Ultra-Short Fixed Income Fund | Interest Rate Risk | (32,891 | ) | 16,056 | ||||||||
For the year ended March 31, 2016, the average quarterly volume of derivative activities are as follows:
| Futures Long Positions (Contracts) | Futures Short Positions (Contracts) | |||||||
Short Duration Fixed Income Fund | 17 | 25 | ||||||
Ultra-Short Fixed Income Fund | — | 15 | ||||||
Counterparty Credit Risk:
Derivatives may also expose a Fund to counterparty risk (the risk that the derivative counterparty will not fulfill its contractual obligations). To the extent amounts due to the Funds from their counterparties are not fully collateralized, contractually or otherwise, the Funds bear the risk of loss from counterparty non-performance. The Funds’ maximum risk of loss from counterparty credit risk on over-the-counter derivatives is generally the aggregate unrealized gain in excess of any collateral pledged by the counterparty to the Funds.
With exchange-traded futures, the exchange or clearinghouse, as counterparty to such instruments, guarantees against a possible default. The clearinghouse stands between the buyer and the seller of the contract; therefore, credit risk is limited to failure of the clearinghouse. While offset rights may
34 |
NOTES TO FINANCIAL STATEMENTS
|
exist under applicable law, the Funds do not have a contractual right of offset against a clearing broker or clearinghouse in the event of a default (including the bankruptcy or insolvency) of the clearing broker or clearinghouse. Additionally, credit risk exists in exchange-traded futures with respect to initial and variation margin that is held in a clearing broker’s customer accounts. While clearing brokers are required to segregate customer margin from their own assets, in the event that a clearing broker becomes insolvent or goes into bankruptcy and at that time there is a shortfall in the aggregate amount of margin held by the clearing broker for all its clients, typically the shortfall would be allocated on a pro rata basis across all the clearing broker’s customers, potentially resulting in losses to the Funds.
TBA Commitments:
The Funds may enter into to-be-announced (“TBA”) commitments to purchase or sell securities for a fixed price at a future date. TBA commitments are considered securities in themselves, and involve a risk of loss if the value of the security to be purchased/sold declines/increases prior to settlement date, which is in addition to the risk of decline in the value of a Fund’s other assets. Unsettled TBA commitments are valued at the current value of the underlying securities, according to the procedures described under “Security Valuation”. As of March 31, 2016, the Funds had no outstanding TBA commitments.
Affiliated Investments:
Each Fund invests in other Funds of the Trust (an “Affiliated Fund”). The income and both realized and change in unrealized gains and losses earned by each Fund from the Affiliated Funds, if any, for the period is disclosed in the Statements of Operations. The table below details the transactions of each Fund in Affiliated Funds.
| Value March 31, 2015 | Purchases | Sales | Value March 31, 2016 | Dividends | ||||||||||||||||
Investments in RBC Prime Money Market Fund — Institutional Class 1 | ||||||||||||||||||||
Short Duration Fixed Income Fund | $ | 163,927 | $ | 6,796,510 | $ | 6,598,457 | $ | 361,980 | $ | 317 | ||||||||||
Ultra-Short Fixed Income Fund | 388,442 | 10,412,311 | 10,461,845 | 338,908 | 512 | |||||||||||||||
Credit Enhancement:
Certain obligations held in the Funds have credit enhancement or liquidity features that may, under certain circumstances, provide for repayment of principal and interest on the obligation upon demand date, interest rate reset date or final maturity. These enhancements may include: letters of credit; liquidity guarantees; security purchase agreements; tender option purchase agreements; and third party insurance. As of March 31, 2016, there are no obligations with credit enhancement or liquidity features.
Offering Costs:
Upon commencement of operations, offering costs associated with the establishment of the Funds were incurred by the Funds. Offering costs are amortized and included in expenses over a 12-month period beginning with the commencement of operations and are included in the Statements of Operations.
Investment Transactions and Income:
Investment transactions are recorded one business day after trade date, except for on the last day of each fiscal quarter end, when they are recorded on trade date. Dividend income is recorded on the ex-dividend date. Realized gains and losses from investment transactions are calculated based on the costs of the specific security (also known as identified cost basis). Interest income is recognized on the accrual basis and includes the amortization and accretion of premium or discount using the effective yield method. Paydown gains and losses on mortgage-backed and asset-backed securities are included in the financial statements as interest income.
| 35 |
NOTES TO FINANCIAL STATEMENTS
|
Expense, Investment Income and Gain/Loss Allocation:
Each Fund pays the expenses that are directly related to its operations, such as custodian fees or advisory fees. Expenses incurred by the Trust, such as trustee or legal fees, are allocated among each of the Funds in the Trust either proportionately based upon the Funds’ relative net assets or using another reasonable basis such as equally across all Funds in the Trust, depending on the nature of the expense. Individual share classes within the Funds are charged expenses specific to that class, such as distribution fees and transfer agent fees. Within the Funds, expenses other than class specific expenses are allocated daily to each class based upon the proportion of relative net assets. Investment income and realized and unrealized gains or losses are allocated to each class of shares based upon the proportion of relative net assets.
Distributions to Shareholders:
The Funds pay out any income that it receives, less expenses, in the form of dividends and capital gains to its shareholders. Income dividends are declared daily and paid monthly. Dividends will also be paid at any time during the month upon total redemption of shares in an account. Capital gain distributions are declared and paid at least annually. Distributions to shareholders are recorded on the ex-dividend date. The amount of dividends and distributions are calculated based on federal income tax regulations, which may differ from US GAAP. These “book/tax” differences may be either temporary or permanent in nature. To the extent these differences are determined, as of the end of the tax year, to be permanent (e.g., reclassification of paydown gains and losses), they are reclassified within a Fund’s capital account based on their federal tax basis treatment.
For the year ended March 31, 2016, permanent difference reclassification amounts were as follows:
| Increase Undistributed Net Investment Income | Decrease Accumulated Realized Gain/Loss | |||||||
Short Duration Fixed Income Fund | $8,347 | $(8,347 | ) | |||||
Ultra-Short Fixed Income Fund | 38,093 | (38,093 | ) | |||||
3. Agreements and Other Transactions with Affiliates
The Trust has entered into investment advisory agreements with RBC GAM (US) under which RBC GAM (US) manages each Fund’s assets and furnishes related office facilities, equipment, research and personnel. The agreements require each Fund to pay RBC GAM (US) a monthly fee based upon average daily net assets. Under the terms of the advisory contracts, RBC GAM (US) is entitled to receive fees based on a percentage of the average daily net assets of each of the Funds as follows:
| Annual Rate | ||||
Short Duration Fixed Income Fund | 0.30% | |||
Ultra-Short Fixed Income Fund | 0.25% | |||
RBC GAM (US) has contractually agreed to waive fees and/or make payments in order to keep total operating expenses (excluding certain fees such as interest, taxes and acquired fund fees and expenses) of Class F and Class I shares of each Fund to the following levels. This expense limitation agreement is in place until July 31, 2017.
| Class F Annual Rate | Class I Annual Rate | |||||||
Short Duration Fixed Income Fund | 0.45% | 0.35% | ||||||
Ultra-Short Fixed Income Fund | 0.40% | 0.30% | ||||||
Each Fund will carry forward, for a period not to exceed 3 years from the end of the fiscal year in which a waiver or reimbursement is made by RBC GAM (US), any expenses in excess of the expense limitation and repay RBC GAM (US) such amounts, provided the Fund is able to effect such repayment and remain in compliance with the expense limitation.
36 |
NOTES TO FINANCIAL STATEMENTS
|
The amounts subject to possible recoupment under the expense limitation agreement were:
| FYE 3/31/14 (Expiration Date 3/31/17) | FYE 3/31/15 (Expiration Date 3/31/18) | FYE 3/31/16 (Expiration Date 3/31/19) | Total | |||||||||||||
Short Duration Fixed Income Fund | $85,840 | $212,292 | $136,348 | $ | 434,480 | |||||||||||
Ultra-Short Fixed Income Fund | 85,790 | 211,248 | 142,691 | 439,729 | ||||||||||||
RBC GAM (US) voluntarily agreed to waive its investment advisory fees by the amount of investment advisory fees each Fund pays to RBC GAM (US) indirectly through its investment in an affiliated money market fund. These waivers are voluntary and not subject to recoupment. These amounts are included in expenses waived/reimbursed by Advisor in the Statements of Operations. For the year ended March 31, 2016, the amounts waived were as follows:
| Fees Waived | ||||
Short Duration Fixed Income Fund | $284 | |||
Ultra-Short Fixed Income Fund | $551 | |||
RBC GAM (US) serves as co-administrator to the Funds. BNY Mellon Investment Servicing (US) Inc. (“BNY Mellon”) serves as co-administrator and fund accounting agent. Services provided under the administrative services contract include providing day-to-day administration of matters related to the Funds, maintenance of their records and the preparation of reports. Under the terms of the administrative services contract, RBC GAM (US) does not receive a fee for its role as co-administrator. BNY Mellon receives a fee for its services payable by the Funds based on the Funds’ average net assets. BNY Mellon’s fee is included with “Accounting fees” in the Statements of Operations.
Certain Officers and Trustees of the Trust are affiliated with the Advisor. Such Officers and Trustees receive no compensation from the Funds for serving in their respective roles.
The Trust currently pays each of the independent trustees (trustees of the Trust who are not directors, officers or employees of the Advisor, either Co-Administrator or Distributor) an annual retainer of $46,000, ($41,500 prior to October 1, 2015). The Board Chairperson and Audit Committee Chairperson each receive an additional retainer of $2,500 annually, and all other trustees serving as Chair of a Board committee each receive an additional retainer of $1,000 annually. In addition, independent trustees receive a quarterly meeting fee of $6,000, ($5,500 prior to October 1, 2015), for each in-person Board meeting attended, a meeting fee of $1,500 for each telephonic or special board meeting attended, a $1,500 fee for each Board committee meeting attended, and are reimbursed for all out-of-pocket expenses relating to attendance at such meetings.
On December 30, 2013, the Advisor invested $10 million in each Fund to provide each Fund with its initial investment assets, and on March 3, 2014, invested $10,000 in Class F of each Fund to provide the initial assets for that share class. The table below shows, as of March 31, 2016, each Fund’s net assets, the shares of each Fund held by the Advisor, and the percent of total net assets represented by the Advisor’s investment.
| Net Assets | Shares held by Advisor | % of Fund Net Assets | ||||||||||
Short Duration Fixed Income Fund | $ | 14,230,758 | 889,642 | 62.0% | ||||||||
Ultra-Short Fixed Income Fund | $ | 17,877,124 | 1,035,696 | 57.2% | ||||||||
4. Fund Distribution
Each of the Funds has adopted a Master Distribution 12b-1 Plan (the “Plan”) in which Quasar Distributors LLC (the “Distributor”) acts as the Funds’ distributor. The Plan permits each Fund to make payments for or to reimburse the Distributor for distribution-related costs and expenses of marketing shares of Class F covered under the Plan, and/or for providing shareholder services. The Plan does not apply to Class I. The current Plan fee rate for Class F is 0.10%.
| 37 |
NOTES TO FINANCIAL STATEMENTS
|
Plan fees are based on average daily net assets of Class F. The Distributor, subject to applicable legal requirements, may waive a Plan fee voluntarily, in whole or in part. For the year ended March 31, 2016, there were no fees waived by the Distributor.
5. Securities Transactions
The cost of securities purchased and proceeds from securities sold (excluding securities maturing less than one year from acquisition) for the year ended March 31, 2016 were as follows:
| Short Duration Fixed Income Fund | Ultra-Short Fixed Income Fund | |||||||
Purchases (Excl. US Gov’t.) | $6,392,498 | $ | 10,723,253 | |||||
Sales (Excl. US Gov’t.) | $6,650,104 | $ | 6,780,248 | |||||
6. Capital Share Transactions
The Trust is authorized to issue an unlimited number of shares of beneficial interest (“shares outstanding”) without par value. Transactions in shares of the Funds are summarized below:
| Short Duration Fixed Income Fund | Ultra-Short Fixed Income Fund | |||||||||||||||
| For the Year Ended March 31, 2016 | For the Year Ended March 31, 2015 | For the Year Ended March 31, 2016 | For the Year Ended March 31, 2015 | |||||||||||||
CAPITAL TRANSACTIONS: | ||||||||||||||||
Class F | ||||||||||||||||
Proceeds from shares issued | $ | 611,397 | $ | 3,436,366 | $ | 4,200,000 | $ | 677,054 | ||||||||
Distributions reinvested | 22,856 | 30,156 | 52,121 | 7,395 | ||||||||||||
Cost of shares redeemed | (1,253,300 | ) | (1,527,968 | ) | (454,695 | ) | (81,073 | ) | ||||||||
|
|
|
|
|
|
|
| |||||||||
Change in Class F | $ | (619,047 | ) | $ | 1,938,554 | $ | 3,797,426 | $ | 603,376 | |||||||
|
|
|
|
|
|
|
| |||||||||
Class I | ||||||||||||||||
Proceeds from shares issued | $ | 2,566,155 | $ | 7,601,928 | $ | 3,751,400 | $ | 10,228,772 | ||||||||
Distributions reinvested | 206,742 | 277,575 | 190,398 | 275,566 | ||||||||||||
Cost of shares redeemed | (2,149,375 | ) | (5,845,159 | ) | (4,344,280 | ) | (6,571,316 | ) | ||||||||
|
|
|
|
|
|
|
| |||||||||
Change in Class I | $ | 623,522 | $ | 2,034,344 | $ | (402,482 | ) | $ | 3,933,022 | |||||||
|
|
|
|
|
|
|
| |||||||||
Change in net assets resulting from capital transactions | $ | 4,475 | $ | 3,972,898 | $ | 3,394,944 | $ | 4,536,398 | ||||||||
|
|
|
|
|
|
|
| |||||||||
SHARE TRANSACTIONS: | ||||||||||||||||
Class F | ||||||||||||||||
Issued | 61,714 | 342,475 | 424,692 | 67,894 | ||||||||||||
Reinvested | 2,302 | 3,025 | 5,285 | 746 | ||||||||||||
Redeemed | (126,362 | ) | (152,622 | ) | (46,102 | ) | (8,143 | ) | ||||||||
|
|
|
|
|
|
|
| |||||||||
Change in Class F | (62,346 | ) | 192,878 | 383,875 | 60,497 | |||||||||||
|
|
|
|
|
|
|
| |||||||||
Class I | ||||||||||||||||
Issued | 260,364 | 757,509 | 380,157 | 1,025,983 | ||||||||||||
Reinvested | 20,846 | 27,815 | 19,302 | 27,774 | ||||||||||||
Redeemed | (216,358 | ) | (588,830 | ) | (440,020 | ) | (664,069 | ) | ||||||||
|
|
|
|
|
|
|
| |||||||||
Change in Class I | 64,852 | 196,494 | (40,561 | ) | 389,688 | |||||||||||
|
|
|
|
|
|
|
| |||||||||
Change in shares resulting from capital transactions | 2,506 | 389,372 | 343,314 | 450,185 | ||||||||||||
|
|
|
|
|
|
|
| |||||||||
38 |
NOTES TO FINANCIAL STATEMENTS
|
7. Federal Income Taxes
It is the policy of each Fund to continue to qualify as a regulated investment company by complying with the provisions available to certain investment companies, as defined under Subchapter M of the Internal Revenue Code, and to distribute substantially all of its net investment income and net realized capital gains. Therefore, no federal tax liability is recorded in the financial statements of each Fund.
Fund Management has analyzed the Fund’s tax positions taken or expected to be taken on federal income tax returns for all open tax years (for the period ended March 31, 2014 and the years ended March 31, 2015 and March 31, 2016) and has concluded that no provision for federal income tax is required in the Funds’ financial statements. The Funds’ federal and state income and federal excise tax returns for tax years for which the applicable statutes of limitations have not expired are subject to examination by the Internal Revenue Service and state departments of revenue.
As of and during the year ended March 31, 2016, the Funds did not have a liability for any unrecognized tax benefits. The Funds recognize interest and penalties, if any, related to unrecognized tax benefits as income tax expense in the Statement of Operations. During the year, the Funds did not incur any interest or penalties. This assessment is not expected to change in the next twelve months.
As of March 31, 2016, tax cost of securities and the breakdown of unrealized appreciation (depreciation) was as follows:
| Tax Cost of Securities | Unrealized Appreciation | Unrealized Depreciation | Net Unrealized Depreciation | |||||||||||||
Short Duration Fixed Income Fund | $ | 13,956,332 | $ 73,274 | $ | (60,828) | $ 12,446 | ||||||||||
Ultra-Short Fixed Income Fund | 17,992,460 | 48,751 | (52,609) | (3,858) | ||||||||||||
The difference between book basis and tax basis unrealized appreciation/depreciation is attributable to the tax deferral of losses on wash sales.
The tax character of distributions during the year ended March 31, 2016 were as follows:
| Distributions Paid From | ||||||||||||
| Ordinary Income | Net Long Term Capital Gains | Total Distributions Paid | ||||||||||
Short Duration Fixed Income Fund | $ | 230,085 | $— | $230,085 | ||||||||
Ultra-Short Fixed Income Fund | 242,520 | — | 242,520 | |||||||||
The tax character of distributions during the year ended March 31, 2015 were as follows:
| Distributions Paid From | ||||||||||||
| Ordinary Income | Net Long Term Gains | Total Distributions Paid | ||||||||||
Short Duration Fixed Income Fund | $ 317,814 | $3,109 | $ 320,923 | |||||||||
Ultra-Short Fixed Income Fund | 283,011 | — | 283,011 | |||||||||
| 39 |
NOTES TO FINANCIAL STATEMENTS |
As of March 31, 2016, the components of accumulated earnings/(losses) on a tax basis were as follows:
| Short Duration Fixed Income Fund | Ultra-Short Fixed Income Fund | |||||||
Undistributed Ordinary Income | $ 25,013 | $ 351 | ||||||
Accumulated Earnings | 25,013 | 351 | ||||||
Accumulated Capital Loss Carryforwards | (132,057) | (157,303 | ) | |||||
Unrealized Appreciation/(Depreciation) | 12,446 | (3,858 | ) | |||||
Total Accumulated Earnings/(Losses) | $ (94,598) | $(160,810 | ) | |||||
As of March 31, 2016, Short Duration Fixed Income Fund and Ultra-Short Fixed Income Fund had a short-term capital loss carryforward of $69,980 and $89,711, respectively, and a long-term capital loss carryforward of $62,077 and $67,592 respectively, available to offset future realized capital gains in accordance with the Regulated Investment Company Modernization Act of 2010. This capital loss carryforward is not subject to expiration.
Under current tax law, capital losses realized after October 31 and ordinary losses after December 31 of a Fund’s fiscal year may be deferred and treated as occurring on the first business day of the following fiscal year for tax purposes. The Short Duration Fixed Income Fund and Ultra-Short Fixed Income Fund did not have any deferred qualified late-year capital losses.
8. Subsequent Events
Fund Management has evaluated the impact of all subsequent events on the Funds and has determined that there were no subsequent events requiring recognition or disclosure in the financial statements.
40 |
REPORT OF INDEPENDENT REGISTERED PUBLIC ACCOUNTING FIRM
|
To the Shareholders and Board of Trustees of RBC Funds Trust:
We have audited the accompanying statements of assets and liabilities, including the schedules of portfolio investments, of RBC Short Duration Fixed Income Fund and RBC Ultra-Short Fixed Income Fund (collectively the “Funds”), two of the portfolios constituting the RBC Funds Trust (the “Trust”), as of March 31, 2016, and the related statements of operations for the year then ended and the statements of changes in net assets and the financial highlights for the periods presented. These financial statements and financial highlights are the responsibility of the Funds’ management. Our responsibility is to express an opinion on these financial statements and financial highlights based on our audits.
We conducted our audits in accordance with the standards of the Public Company Accounting Oversight Board (United States). Those standards require that we plan and perform the audits to obtain reasonable assurance about whether the financial statements and financial highlights are free of material misstatement. The Funds are not required to have, nor were we engaged to perform, an audit of their internal control over financial reporting. Our audits included consideration of internal control over financial reporting as a basis for designing audit procedures that are appropriate in the circumstances, but not for the purpose of expressing an opinion on the effectiveness of the Funds’ internal control over financial reporting. Accordingly, we express no such opinion. An audit also includes examining, on a test basis, evidence supporting the amounts and disclosures in the financial statements, assessing the accounting principles used and significant estimates made by management, as well as evaluating the overall financial statement presentation. Our procedures included confirmation of securities owned as of March 31, 2016, by correspondence with the Funds’ custodian and brokers. We believe that our audits provide a reasonable basis for our opinion.
In our opinion, the financial statements and financial highlights referred to above present fairly, in all material respects, the financial position of each of the portfolios constituting the RBC Funds Trust referred to above, as of March 31, 2016, and the results of their operations for the year then ended and the changes in their net assets and the financial highlights for the periods presented, in conformity with accounting principles generally accepted in the United States of America.
DELOITTE & TOUCHE LLP
Chicago, Illinois
May 24, 2016
| 41 |
OTHER FEDERAL INCOME TAX INFORMATION (UNAUDITED)
|
The Funds report a portion of the income dividends distributed during the fiscal year ended March 31, 2016 as U.S. Government Income as follows:
| U.S. Government Income | ||
| Short Duration Fixed Income Fund | 0.25% | |
| Ultra-Short Fixed Income Fund | 0.26% |
The Funds report a portion of the income dividends distributed during the fiscal year ended March 31, 2016, as qualified interest income as defined in the Internal Revenue Code:
| Qualified Interest Income | ||
Short Duration Fixed Income Fund | 100.00% | |
Ultra-Short Fixed Income Fund | 100.00% |
All reportings are based on financial information available as of the date of this annual report and, accordingly, are subject to change. It is the intention of the Funds to report the maximum amount permitted under the Internal Revenue Code and the regulations thereunder.
42 |
|
Independent Trustees(1)(2)
T. Geron Bell (74)
Position, Term of Office and Length of Time Served with the Trust: Trustee since January 2004
Principal Occupation(s) During Past 5 Years: Chairman of the Executive Board of the Minnesota Twins (2011 to present); President of Twins Sports, Inc. (parent company of the Minnesota Twins) (2002 to 2011); President of the Minnesota Twins Baseball Club Incorporated (1987 to 2002)
Number of Portfolios in Fund Complex Overseen by Trustee: 22
Other Director/Trustee Positions Held by Trustee During Past 5 Years: None
Lucy Hancock Bode (64)
Position, Term of Office and Length of Time Served with the Trust: Trustee since January 2004
Principal Occupation(s) During Past 5 Years: Healthcare consultant (self-employed) (1986 to present)
Number of Portfolios in Fund Complex Overseen by Trustee: 22
Other Director/Trustee Positions Held by Trustee During Past 5 Years: BioSignia (2006 to 2010); Franklin Street Partners (2014 to present)
Leslie H. Garner Jr. (65)
Position, Term of Office and Length of Time Served with the Trust: Trustee since January 2004
Principal Occupation(s) During Past 5 Years: President and CEO, The Greater Cedar Rapids Community Foundation (2010 to present); President, Cornell College (1994 to 2010)
Number of Portfolios in Fund Complex Overseen by Trustee: 22
Other Director/Trustee Positions Held by Trustee During Past 5 Years: None
Ronald James (65)
Position, Term of Office and Length of Time Served with the Trust: Trustee since January 2004
Principal Occupation(s) During Past 5 Years: President and Chief Executive Officer, Center for Ethical Business Cultures (2000 to present)
Number of Portfolios in Fund Complex Overseen by Trustee: 22
Other Director/Trustee Positions Held by Trustee During Past 5 Years: Best Buy Co. Inc. (2004 to 2013); Bremer Financial Corporation (2004 to present)
John A. MacDonald (67)
Position, Term of Office and Length of Time Served with the Trust: Trustee since January 2004
Principal Occupation(s) During Past 5 Years: Vice President and Treasurer, Hall Family Foundation (1988 to present)
Number of Portfolios in Fund Complex Overseen by Trustee: 22
Other Director/Trustee Positions Held by Trustee During Past 5 Years: None
H. David Rybolt (73)
Position, Term of Office and Length of Time Served with the Trust: Trustee since January 2004
Principal Occupation(s) During Past 5 Years: Consultant, HDR Associates (management consulting) (1985 to present)
Number of Portfolios in Fund Complex Overseen by Trustee: 22
Other Director/Trustee Positions Held by Trustee During Past 5 Years: None
| 43 |
MANAGEMENT (Unaudited)
|
Independent Trustees(1)(2)
James R. Seward (63)
Position, Term of Office and Length of Time Served with the Trust: Chairman of the Board and Trustee since January 2004
Principal Occupation(s) During Past 5 Years: Private investor (2000 to present); CFA (1987 to present)
Number of Portfolios in Fund Complex Overseen by Trustee: 22
Other Director/Trustee Positions Held by Trustee During Past 5 Years: Sooner Holdings (formerly Syntroleum Corporation) (1988 to 2014); Brookdale Senior Living Inc. (2008 to present)
William B. Taylor (70)
Position, Term of Office and Length of Time Served with the Trust: Trustee since September 2005
Principal Occupation(s) During Past 5 Years: Consultant (2003 to present); Partner, Ernst & Young LLP (1982 to 2003)
Number of Portfolios in Fund Complex Overseen by Trustee: 22
Other Director/Trustee Positions Held by Trustee During Past 5 Years: National Association of Corporate Directors - Heartland Chapter (2013-present); William Henry Insurance, LLC (2005 to present); Balance Innovations LLC (2014 to present); Kansas City Symphony (1995 to present)
Interested Trustees(1)(2)(3)
Kathleen A. Gorman (52)(5)
Position, Term of Office and Length of Time Served with the Trust: Trustee since September 2012
Principal Occupation(s) During Past 5 Years: President and Chief Executive Officer, RBC Funds (2012 to present); Chief Compliance Officer, RBC Funds (2006 to 2012); Director of Regulatory Administration, RBC Global Asset Management (U.S.) Inc. (2007 to 2012)
Number of Portfolios in Fund Complex Overseen by Trustee: 22
Other Director/Trustee Positions Held by Trustee During Past 5 Years: None
Executive Officers(1)(3)(4)
Kathleen A. Gorman (52)
Position, Term of Office and Length of Time Served with the Trust: President and Chief Executive Officer since September 2012
Principal Occupation(s) During Past 5 Years: President and Chief Executive Officer, RBC Funds (2012 to present); Chief Compliance Officer, RBC Funds (2006 to 2012); Director of Regulatory Administration, RBC Global Asset Management (U.S.) Inc. (2007 to 2012)
Kathleen A. Hegna (49)
Position, Term of Office and Length of Time Served with the Trust: Chief Financial Officer and Principal Accounting Officer since May 2009 and Treasurer since March 2014
Principal Occupation(s) During Past 5 Years: Associate Vice President and Director, Mutual Fund Accounting and Administration, RBC Global Asset Management (U.S.) Inc. (2009 to present)
44 |
MANAGEMENT (Unaudited)
|
Executive Officers(1)(3)(4)
Christina M. Weber (47)
Position, Term of Office and Length of Time Served with the Trust: Chief Compliance Officer since December 2012 and Assistant Secretary since March 2013
Principal Occupation(s) During Past 5 Years: Chief Compliance Officer, RBC Funds (2012 to present); Senior Compliance Officer, RBC Funds (March 2012 to December 2012); Compliance Manager, Minnesota Life Insurance Company (2006 to 2012)
Jay Jackson (38)
Position, Term of Office and Length of Time Served with the Trust: Chief Legal Officer and Secretary since December 2015
Principal Occupation(s) During Past 5 Years: Associate General Counsel, RBC Global Asset Management (U.S.) Inc. (2011-present); Associate, K&L Gates (2008-2010)
| (1) | Except as otherwise noted, the address of each Trustee/Officer is RBC Funds Trust, 50 South Sixth Street, Suite 2350, Minneapolis, Minnesota 55402. |
| (2) | All Trustees must retire on or before December 31 of the year in which they reach age 75. The Board may temporarily waive this requirement when necessary to avoid depriving the Board of a Trustee with critical skills. |
| (3) | On December 31, 2009, Voyageur Asset Management Inc. changed its name to RBC Global Asset Management (U.S.) Inc. Any references to RBC Global Asset Management (U.S.) Inc. for prior periods are deemed to be references to the prior entity. |
| (4) | Each officer serves in such capacity for an indefinite period of time until his or her removal, resignation or retirement. |
| (5) | Kathleen A. Gorman has been determined to be an interested Trustee by virtue of her position with the Advisor. |
The Funds’ Statement of Additional Information includes information about the Funds’ Trustees. To receive your free copy of the Statement of Additional Information, call toll free: 1-800-422-2766.
| 45 |
SHARE CLASS INFORMATION (UNAUDITED)
|
The Funds offer Class F and Class I shares.
Class F
Class F shares are intended for investors meeting certain minimum investment thresholds. This share class does not have an up-front sales charge (load). Class F shares currently include a 0.10% (10 bps) annual 12b-1 service and distribution fee.
Class I
Class I shares are intended for investors meeting certain minimum investment thresholds. This share class does not have an up-front sales charge (load) or a 12b-1 service and distribution fee.
46 |
SUPPLEMENTAL INFORMATION (UNAUDITED)
|
Shareholder Expense Examples
As a shareholder of the RBC Funds, you incur two types of costs: (1) transaction costs, and (2) ongoing costs, including management fees; 12b-1 distribution and service fees; and other Fund expenses. This example is intended to help you understand your ongoing costs (in dollars) of investing in the Fund and to compare these costs with the ongoing costs of investing in other mutual funds.
The Example is based on an investment of $1,000 invested at the beginning of the period and held for the entire period from October 1, 2015 through March 31, 2016.
Actual Expenses
The table below provides information about actual account values and actual expenses. You may use the information below, together with the amount you invested, to estimate the expenses that you paid over the period. Simply divide your account value by $1,000 (for example, an $8,600 account value divided by $1,000 = 8.6), then multiply the result by the number in the table under the heading entitled “Expenses Paid During Period” to estimate the expenses you paid on your account during this period.
| Beginning Account Value 10/1/15 | Ending Account Value 3/31/16 | Expenses Paid During Period* 10/1/15-3/31/16 | Annualized Expense Ratio During Period 10/1/15-3/31/16 | |||||||||||||||||||
Short Duration Fixed Income Fund | Class F | $ | 1,000.00 | $ | 1,000.00 | $ | 2.25 | 0.45 | % | |||||||||||||
Class I | 1,000.00 | 1,009.30 | 1.76 | 0.35 | % | |||||||||||||||||
Ultra-Short Fixed Income Fund | Class F | 1,000.00 | 1,000.00 | 2.00 | 0.40 | % | ||||||||||||||||
Class I | 1,000.00 | 1,007.40 | 1.51 | 0.30 | % | |||||||||||||||||
Hypothetical Example for Comparison Purposes
The table below provides information about hypothetical account values and hypothetical expenses based on the Fund’s actual expense ratio and an assumed rate of return of 5% per year before expenses, which is not the Fund’s actual return. The hypothetical account values and expenses may not be used to estimate the actual ending account balance or expenses you paid for the period. You may use this information to compare this 5% hypothetical example with the 5% hypothetical examples that appear in the shareholder reports of other funds.
Please note that the expenses shown in the table are meant to highlight your ongoing costs only and do not reflect any transactional costs, such as sales charges (loads), redemption fees, or exchange fees. Therefore, the table is useful in comparing ongoing costs only, and will not help you determine the relative total costs of owning different funds. In addition, if these transactional costs were included, your costs would have been higher.
| Beginning Account Value 10/1/15 | Ending Account Value 3/31/16 | Expenses Paid During Period* 10/1/15-3/31/16 | Annualized Expense Ratio During Period 10/1/15-3/31/16 | |||||||||||||||||||
Short Duration Fixed Income Fund | Class F | $ | 1,000.00 | $ | 1,022.75 | $ | 2.28 | 0.45 | % | |||||||||||||
Class I | 1,000.00 | 1,023.25 | 1.77 | 0.35 | % | |||||||||||||||||
Ultra-Short Fixed Income Fund | Class F | 1,000.00 | 1,023.00 | 2.02 | 0.40 | % | ||||||||||||||||
Class I | 1,000.00 | 1,023.50 | 1.52 | 0.30 | % | |||||||||||||||||
* Expenses are equal to the average account value times the Fund’s annualized expense ratio multiplied by 183/366 (to reflect one half year period).
| 47 |
|
This Page Intentionally Left Blank
48 |
RBC Funds
P.O. Box 701
Milwaukee, WI 53201-0701
800-422-2766
www.rbcgam.us
Performance data represents past performance and does not guarantee future results. The principal value of an investment and investment return will fluctuate so that an investor’s shares, when redeemed, may be worth more or less than their original cost.
This report and the financial statements contained herein are provided for the information of RBC Funds shareholders. This report is not authorized for distribution to prospective investors unless preceded or accompanied by a current prospectus, which contains information concerning investment objectives, risks, charges and expenses of the funds. Please read the prospectus carefully before investing.
This report and the financial statements contained herein are not intended to be a forecast of future events, a guarantee of future results, or investment advice. There is no assurance that certain securities will remain in or out of the funds’ portfolio. The views expressed in this report reflect those of the portfolio managers through the year ended March 31, 2016.
NOT FDIC INSURED • NO BANK GUARANTEE • MAY LOSE VALUE
RBC Global Asset Management (U.S.) Inc. serves as investment adviser for the RBC Funds. The Funds are distributed by Quasar Distributors LLC, an affiliate of U.S. Bancorp Fund Services, LLC.

The RBC Funds are pleased to offer shareholder reports printed entirely on Forest
Stewardship Council® certified paper. FSC® certification ensures that the paper
used in this report contains fiber from well-managed and responsibly harvested
forests that meet strict environmental and socioeconomic standards.
RBCF-FI AR 03-16
Item 2. Code of Ethics.
| (a) | The registrant, as of the end of the period covered by this report, has adopted a code of ethics that applies to the registrant’s principal executive officer, principal financial officer, principal accounting officer or controller, or persons performing similar functions, regardless of whether these individuals are employed by the registrant or a third party. |
| (c) | There have been no amendments, during the period covered by this report, to a provision of the code of ethics that applies to the registrant’s principal executive officer, principal financial officer, principal accounting officer or controller, or persons performing similar functions, regardless of whether these individuals are employed by the registrant or a third party, and that relates to any element of the code of ethics description. |
| (d) | The registrant has not granted any waivers, including an implicit waiver, from a provision of the code of ethics that applies to the registrant’s principal executive officer, principal financial officer, principal accounting officer or controller, or persons performing similar functions, regardless of whether these individuals are employed by the registrant or a third party, that relates to one or more of the items set forth in paragraph (b) of this item’s instructions. |
Item 3. Audit Committee Financial Expert.
As of the end of the period covered by the report, the registrant’s board of directors has determined that William B. Taylor is qualified to serve as an audit committee financial expert serving on its audit committee and that he is “independent,” as defined by Item 3 of Form N-CSR.
Item 4. Principal Accountant Fees and Services.
Audit Fees
| (a) | The aggregate fees billed for each of the last two fiscal years for professional services rendered by the principal accountant for the audit of the registrant’s annual financial statements or services that are normally provided by the accountant in connection with statutory and regulatory filings or engagements for those fiscal years are $184,000 for 2016 and $178,400 for 2015. |
Audit-Related Fees
| (b) | The aggregate fees billed in each of the last two fiscal years for assurance and related services by the principal accountant that are reasonably related to the performance of the audit of the registrant’s financial statements and are not reported under paragraph (a) of this Item are $0 for 2016 and $0 for 2015. |
Tax Fees
| (c) | The aggregate fees billed in each of the last two fiscal years for professional services rendered by the principal accountant for tax compliance, tax advice, and tax planning are $22,500 for 2016 and $22,170 for 2015. |
Tax fees for both years relate to the review of the registrant’s tax returns. Amount requiring approval of the registrant’s audit committee is $0 and $0, respectively.
All Other Fees
| (d) | The aggregate fees billed in each of the last two fiscal years for products and services provided by the principal accountant, other than the services reported in paragraphs (a) through (c) of this Item are $0 for 2016 and $0 for 2015. |
| (e)(1) | Disclose the audit committee’s pre-approval policies and procedures described in paragraph (c)(7) of Rule 2-01 of Regulation S-X. |
The Audit Committee (“Committee”) will review and approve in advance any proposal (except as set forth in (1) through (3) below) that the Trust employ the Funds’ auditor to render “permissible non-audit services” to the Funds. A “permissible non-audit service” is defined as a non-audit service that is not prohibited by Rule 2-01(c)(4) of Regulation S-X or other applicable law or regulation. The Committee will also review and approve in advance any proposal (except as set forth in (1) through (3) below) that the Adviser, and any entity controlling, controlled by, or under common control with the Adviser that provides ongoing services to the Funds (an “Adviser-affiliated service provider”), employ the Funds’ auditor to render non-audit services, if such engagement would relate directly to the operations and financial reporting of the Funds. As a part of its review, the Committee shall consider whether the provision of such services is consistent with the auditor’s independence. (See also “Delegation” below.)
Pre-approval by the Committee of non-audit services is not required so long as:
| (1) | (A) with respect to the Funds, the aggregate amount of all such permissible non-audit services provided to the Funds constitutes no more than 5% of the total amount of revenues paid to the auditor by the Funds during the fiscal year in which the services are provided; or |
(B) with respect to the Adviser and any Adviser-affiliated service provider, the aggregate amount of all such non-audit services provided constitutes no more than 5% of the total amount of revenues (of the type that would have to be pre-approved by the Committee) paid to the auditor by the Funds, the Adviser and any Adviser-affiliated service provider during the fiscal year in which the services are provided;
(2) such services were not recognized by the Funds at the time of the engagement to be non-audit services; and
(3) such services are promptly brought to the attention of the Committee and approved by the Committee or its delegate or delegates, as defined below, prior to the completion of the audit.
| (c) | Delegation |
The Committee may delegate to one or more of its members and/or to officers of the Trust the authority to pre-approve the auditor’s provision of audit services or permissible non-audit services to the Funds up to a predetermined amount. Any pre-approval determination made by a delegate will be presented to the full Committee at its next meeting. The Committee will communicate any pre-approval made by a delegate to the Trust’s fund accounting agent, which will ensure that the appropriate disclosure is made in the Funds’ periodic reports and other documents as required under the Federal securities laws.
| (e)(2) | The percentage of services described in each of paragraphs (b) through (d) of this Item that were approved by the audit committee pursuant to paragraph (c)(7)(i)(C) of Rule 2-01 of Regulation S-X are as follows: |
(b) N/A
(c) 100%
(d) N/A
| (f) | The percentage of hours expended on the principal accountant’s engagement to audit the registrant’s financial statements for the most recent fiscal year that were attributed to work performed by persons other than the principal accountant’s full-time, permanent employees was less than fifty percent. |
| (g) | The aggregate non-audit fees billed by the registrant’s accountant for services rendered to the registrant, and rendered to the registrant’s investment adviser (not including any sub-adviser whose role is primarily portfolio management and is subcontracted with or overseen by another investment adviser), and any entity controlling, controlled by, or under common control with the adviser that provides ongoing services to the registrant for each of the last two fiscal years of the registrant was $115,000 for 2016 and $115,000 for 2015. |
| (h) | The registrant’s audit committee of the board of directors has considered whether the provision of non-audit services that were rendered to the registrant’s investment adviser (not including any sub-adviser whose role is primarily portfolio management and is subcontracted with or overseen by another investment adviser), and any entity controlling, controlled by, or under common control with the investment adviser that provides ongoing services to the registrant that were not pre-approved pursuant to paragraph (c)(7)(ii) of Rule 2-01 of Regulation S-X is compatible with maintaining the principal accountant’s independence. |
Item 5. Audit Committee of Listed Registrants.
Not applicable.
Item 6. Investments.
| (a) | Schedule of Investments in securities of unaffiliated issuers as of the close of the reporting period is included as part of the report to shareholders filed under Item 1 of this form. |
| (b) | Not applicable. |
Item 7. Disclosure of Proxy Voting Policies and Procedures for Closed-End Management Investment Companies.
Not applicable.
Item 8. Portfolio Managers of Closed-End Management Investment Companies.
Not applicable.
Item 9. Purchases of Equity Securities by Closed-End Management Investment Company and Affiliated Purchasers.
Not applicable.
Item 10. Submission of Matters to a Vote of Security Holders.
There have been no material changes to the procedures by which the shareholders may recommend nominees to the registrant’s board of directors, where those changes were implemented after the registrant last provided disclosure in response to the requirements of Item 407(c)(2)(iv) of Regulation S-K (17 CFR 229.407) (as required by Item 22(b)(15) of Schedule 14A (17 CFR 240.14a-101)), or this Item.
Item 11. Controls and Procedures.
| (a) | The registrant’s principal executive and principal financial officers, or persons performing similar functions, have concluded that the registrant’s disclosure controls and procedures (as defined in Rule 30a-3(c) under the Investment Company Act of 1940, as amended (the “1940 Act”) (17 CFR 270.30a-3(c))) are effective, as of a date within 90 days of the filing date of the report that includes the disclosure required by this paragraph, based on their evaluation of these controls and procedures required by Rule 30a-3(b) under the 1940 Act (17 CFR 270.30a-3(b)) and Rules 13a-15(b) or 15d-15(b) under the Securities Exchange Act of 1934, as amended (17 CFR 240.13a-15(b) or 240.15d-15(b)). |
| (b) | There were no changes in the registrant’s internal control over financial reporting (as defined in Rule 30a-3(d) under the 1940 Act (17 CFR 270.30a-3(d)) that occurred during the registrant’s second fiscal quarter of the period covered by this report that has materially affected, or is reasonably likely to materially affect, the registrant’s internal control over financial reporting. |
Item 12. Exhibits.
| (a)(1) | Code of ethics, or any amendment thereto, that is the subject of disclosure required by Item 2 is attached hereto. |
| (a)(2) | Certifications pursuant to Rule 30a-2(a) under the 1940 Act and Section 302 of the Sarbanes-Oxley Act of 2002 are attached hereto. |
| (a)(3) | Not applicable. |
| (b) | Certifications pursuant to Rule 30a-2(b) under the 1940 Act and Section 906 of the Sarbanes-Oxley Act of 2002 are attached hereto. |
(12.other) Not applicable.
SIGNATURES
Pursuant to the requirements of the Securities Exchange Act of 1934 and the Investment Company Act of 1940, the registrant has duly caused this report to be signed on its behalf by the undersigned, thereunto duly authorized.
(Registrant) RBC Funds Trust | ||||||
By (Signature and Title)* | /s/ Kathleen A. Gorman | |||||
Kathleen A. Gorman, President and Chief Executive Officer | ||||||
(principal executive officer) | ||||||
Date | 5/26/2016 | |||||
Pursuant to the requirements of the Securities Exchange Act of 1934 and the Investment Company Act of 1940, this report has been signed below by the following persons on behalf of the registrant and in the capacities and on the dates indicated.
By (Signature and Title)* | /s/ Kathleen A. Gorman | |||||
Kathleen A. Gorman, President and Chief Executive Officer | ||||||
(principal executive officer) | ||||||
Date | 5/26/2016 | |||||
By (Signature and Title)* | /s/ Kathleen A. Hegna | |||||
Kathleen A. Hegna, Treasurer and Chief Financial Officer | ||||||
(principal financial officer) | ||||||
Date | 5/26/2016 | |||||
* Print the name and title of each signing officer under his or her signature.