UNITED STATES
SECURITIES AND EXCHANGE COMMISSION
Washington, D.C. 20549
FORM N-CSR
CERTIFIED SHAREHOLDER REPORT OF REGISTERED MANAGEMENT
INVESTMENT COMPANIES
Investment Company Act file number 811-21475
RBC Funds Trust
(Exact name of registrant as specified in charter)
50 South Sixth Street, Suite 2350
Minneapolis, MN 55402
(Address of principal executive offices) (Zip code)
Tara Tilbury
50 South Sixth Street, Suite 2350
Minneapolis, MN 55402
(Name and address of agent for service)
Registrant’s telephone number, including area code: (612) 376-7132
Date of fiscal year end: September 30
Date of reporting period: September 30, 2021
Item 1. Reports to Stockholders.
| (a) | The Report to Shareholders is attached herewith. |

Annual Report For the year ended September 30, 2021 Access Capital Community Investment Fund RBC Impact Bond Fund
1
| LETTER FROM THE PORTFOLIO MANAGERS | ||||||||||
| 6,071 Nursing home facility beds | ||||||||||
| 27 Rural housing | ||||||||||
| 88 Rural Enterprise | ||||||||||
| 618 SBA loans | ||||||||||
| 89 Community Economic development | ||||||||||
| 16 Community-based not-for-profit organizations | ||||||||||
All of the Fund’s investments support low-to-moderate (LMI) income communities and families. In addition, a substantial percentage of the Fund’s investments support BIPOC communities:
| ||||||||||
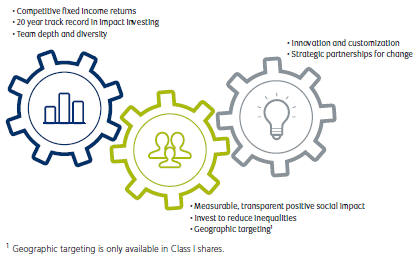
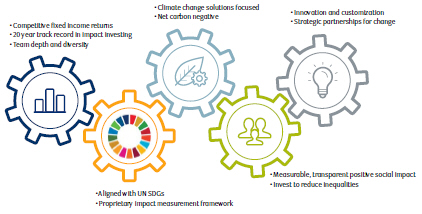
The RBC Impact Bond Fund (the “Impact Fund”) strives to maximize positive social and environmental impact within the context of a competitive fixed income portfolio, presenting a unique value proposition for investors:
| ||||||||||
| We implement the team’s expertise in impact investing in social justice themes, and combine it with a lens on creating meaningful progress toward climate change solutions. In doing so, we seek not just to avoid investments that harm the environment, but also strive to invest in those that explicitly align with advancing climate change solutions. This results in a portfolio that produces both positive social and environmental outcomes. The negative impacts of climate change continue to take a toll on our planet and on people, with a disproportionately negative impact on already disadvantaged and lower-income populations. We continue to examine investments with a | ||||||||||
| ||||||||||

2
LETTER FROM THE PORTFOLIO MANAGERS | ||||
critical eye toward understanding the social and environmental impact of each project, with a goal to maximize the positive and minimize the negative.
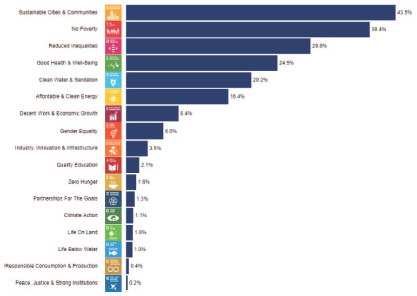
Impact Bond Fund’s core holdings must also have meaningful alignment with the United Nations Sustainable Development Goals (SDGs) - a global agenda to end poverty, protect the planet, and ensure prosperity for all people.
For the fiscal year ended September 30, 2021, Impact Bond Fund has generated a net-of-fees return of -1.13% (Class I shares; gross-of-fees return of -0.68%) versus the Bloomberg Barclays US Aggregate Bond Index that returned -0.90%. The effective duration of the Impact Bond Fund is 6.10 years, in line with the benchmark’s 6.10, and the 30-day SEC yield of the Impact Bond Fund is 1.22%.
Negative absolute returns were driven by rising rates as the economy strengthened post COVID shutdowns. The Fund maintained a yield advantage for the year, and spread returns were positive as most asset classes tightened during the period. The Fund’s corporates lagged benchmark securities slightly due to our higher quality bias, while our specified Agency MBS pools outperformed the benchmark on a spread basis by nearly 60 basis points (bps). Municipals also tightened dramatically, driving positive relative performance.
Impact Bond Fund has made measurable progress toward demonstrating the positive social and environmental impacts of investing in the Fund. The holdings of the Impact Bond Fund as of September 30, 2021 were invested to support the following themes (as illustrated below; totals may exceed 100% as projects may impact multiple themes/SDGs):
| ||||
| ||||
| ||||
3
| LETTER FROM THE PORTFOLIO MANAGERS | ||||
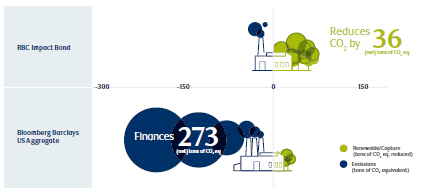
In addition to these meaningful contributions to advancing the SDGs, the Fund also has a low carbon footprint relative to the benchmark, financing significantly less carbon and more carbon capture equivalents than securities held in the benchmark. This is illustrated below, and is calculated using our internally developed, proprietary impact measurement framework:
| ||||
| Continued investment in our impact measurement capabilities is a key focus for the team. We believe the ability to accurately and transparently measure the environmental and social impact of the Funds will continue to be important to clients and consultants. We have demonstrated proficiency in this regard and seek to maintain and expand our competitive edge. | ||||
| The need for investment strategies that address the widespread economic disparities that persist across the United States has never been greater, and our distinct approach of seeking double-bottom line results in a high-quality investment vehicle is one way to help move the dial toward reducing inequalities. We remain committed to investing in positive change for the future while also delivering competitive returns for our shareholders. Thank you for your continued confidence and trust in our impact investing capabilities. | ||||
| Sincerely, | ||||
| Brian Svendahl | ||||
| Managing Director, Senior Portfolio Manager | ||||
| Scott Kirby | ||||
| Vice President, Senior Portfolio Manager | ||||
| RBC Global Asset Management (U.S.) Inc. | ||||
| Past performance is not a guarantee of future results. | ||||
| Mutual fund investing involves risk. Principal loss is possible. | ||||
| Effective duration is a weighted average duration calculation for bonds with embedded options. It takes into account that expected cash flows will fluctuate as interest rates change. Duration measures the sensitivity of a bond’s price to changes in interest rates. | ||||
| The Bloomberg Barclays US Securitized Bond Index represents the securitized portion (mortgage-backed, asset-backed and commercial mortgage-backed securities) of the Bloomberg Barclays US Aggregate Bond Index, which measures the investment grade, U.S. dollar-denominated, fixed-rate taxable bond market and includes Treasuries, government-related and corporate | ||||
4
| LETTER FROM THE PORTFOLIO MANAGERS | ||||||
securities, mortgage-backed securities (agency fixed-rate and hybrid adjustable-rate mortgage pass-throughs), asset-backed securities, and commercial mortgage-backed securities (agency and non-agency). Spread measures the difference between two rates or yields. | ||||||
| The U.S. Treasury yield curve represents the yield of a U.S. Treasury bond at different maturities. A U.S. Treasury bond is theoretically considered to be free of default risk, and represents the minimum yield investors are prepared to accept for bonds of different maturities. | ||||||
| ||||||
5
RBC Global Asset Management (U.S.) Inc.(“RBC GAM-US”) serves as the investment advisor to the Funds. RBC GAM-US employs a team approach to the management of the Funds, with no individual team member being solely responsible for the investment decisions. The Funds’ management team has access to RBC GAM-US’s investment research and other money management resources.
| ||||||
Brian Svendahl, CFA
|
Brian Svendahl, CFA
Managing Director, Senior Portfolio Manager
Brian Svendahl oversees the fixed income research, portfolio management and trading at RBC GAM-US. In addition to shaping the firm’s overall fixed income philosophy and process, he is a portfolio manager for the Funds and many of RBC GAM-US’s government mandates. Brian joined RBC GAM-US in 2005 and most recently led the mortgage and government team before being promoted to his current position. Prior to joining RBC GAM-US, he held several risk management, research and trading positions at Wells Fargo. Brian’s experience also includes liability management and implementing balance sheet hedging strategies. He first started in the investment industry in 1992. He earned a BS in economics from the University of Minnesota and a BBA in finance and an MBA from the University of Minnesota Carlson School of Management. Brian is a CFA charterholder.
| |||||
Scott Kirby |
Scott Kirby
Vice President, Senior Portfolio Manager
Scott Kirby is a member of the government and mortgage research team in RBC GAM-US’s fixed income group and serves as co-portfolio manager for the firm’s community investment strategy, including the Access Capital Community Investment Fund. Scott joined RBC GAM-US in 2012 and most recently served as manager of investments of a broad-based asset portfolio for a large foundation, supporting its mission to reduce poverty. Previously he led the structured assets investment team of Ameriprise Financial/Riversource Investments, where he served as senior portfolio manager for more than $20 billion in agency and non-agency mortgage-backed, commercial mortgage-backed and asset-backed securities. He earned a BS in finance and an MBA in finance from the University of Minnesota Carlson School of Management. | |||||


6
PERFORMANCE SUMMARY (UNAUDITED)
|
| 1 Year | 3 Year | 5 Year | 10 Year | Since Inception | Net Expense Ratio(a)(b) | Gross Expense Ratio(a)(b) | ||||||||||||||||||||||
Average Annual Total Returns as of September 30, 2021 (Unaudited) |
| |||||||||||||||||||||||||||
Access Capital Community Investment Fund |
| |||||||||||||||||||||||||||
Class A(c) | ||||||||||||||||||||||||||||
- Including Max Sales Charge of 3.75% | (4.38 | )% | 1.99 | % | 0.72 | % | 1.46 | % | 3.46 | % | ||||||||||||||||||
- At Net Asset Value | (0.61 | )% | 3.31 | % | 1.49 | % | 1.84 | % | 3.63 | % | 0.80 | % | 0.86 | % | ||||||||||||||
Class I(e) | ||||||||||||||||||||||||||||
- At Net Asset Value | (0.37 | )% | 3.63 | % | 1.84 | % | 2.18 | % | 3.94 | % | 0.45 | % | 0.52 | % | ||||||||||||||
Class IS(f) | ||||||||||||||||||||||||||||
- At Net Asset Value | (0.21 | )% | 3.71 | % | 1.97 | % | 2.36 | % | 4.19 | % | 0.40 | % | 0.55 | % | ||||||||||||||
Bloomberg Barclays U.S. Securitized Index(h) | (0.35 | )% | 3.98 | % | 2.25 | % | 2.50 | % | 4.50 | % | ||||||||||||||||||
RBC Impact Bond Fund | ||||||||||||||||||||||||||||
Class A(d) | ||||||||||||||||||||||||||||
- Including Max Sales Charge of 3.75% | (5.15 | )% | 3.37 | % | N/A | N/A | 2.02 | % | ||||||||||||||||||||
- At Net Asset Value | (1.47 | )% | 4.68 | % | N/A | N/A | 3.05 | % | 0.70 | % | 54.43 | % | ||||||||||||||||
Class I | ||||||||||||||||||||||||||||
- At Net Asset Value | (1.13 | )% | 5.01 | % | N/A | N/A | 3.36 | % | 0.45 | % | 0.73 | % | ||||||||||||||||
Class R6 | ||||||||||||||||||||||||||||
- At Net Asset Value | (1.17 | )% | 5.06 | % | N/A | N/A | 3.41 | % | 0.40 | % | 0.62 | % | ||||||||||||||||
Class Y(g) | ||||||||||||||||||||||||||||
- At Net Asset Value | (1.39 | )% | 4.71 | % | N/A | N/A | 3.05 | % | 0.40 | % | 0.59 | % | ||||||||||||||||
Bloomberg Barclays U.S. Aggregate Bond Index(h) | (0.90 | )% | 5.36 | % | 2.94 | % | 3.01 | % | 3.80 | % | ||||||||||||||||||
Performance data quoted represents past performance. Past performance is no guarantee of future results. Investment return and principal value of an investment will fluctuate so that an investor’s shares, when redeemed, may be worth more or less than their original cost. Current performance may be lower or higher than performance quoted. Performance shown reflects contractual fee waivers, without such fee waivers total returns would be reduced. For performance data current to the most recent month-end go to www.rbcgam.com. Please see footnotes below.
| (a) | The Fund’s expenses reflect the most recent fiscal year ended September 30, 2021. For Class Y of Impact Bond Fund, the expenses reflect the period from April 12, 2021 (commencement of operations) to September 30, 2021. |
| (b) | The advisor has contractually agreed to waive fees and/or pay operating expenses to keep total operating expenses (excluding certain fees such as brokerage costs, interest, taxes and acquired fund fees and expenses) at 0.80% for Class A shares, 0.45% for Class I shares and 0.40% for Class IS shares of the Access Capital Community Investment Fund and at 0.70% for Class A shares, 0.45% for Class I shares, 0.40% for Class R6 shares and 0.40% for Class Y shares of the Impact Bond Fund until January 31, 2023. |
| (c) | The inception date for Class A shares of the Fund is January 29, 2009. All performance shown for such class of shares prior to its inception date is based on the performance of the Class I shares of the Fund, adjusted to reflect the fees and expenses of Class A shares, as applicable. |
| (d) | The inception date for Class A shares of the Fund is January 28,2020. All performance shown for such class of shares prior to its inception date is based on the performance of the Class I shares of the Fund, adjusted to reflect the fees and expenses of Class A shares, as applicable. |
7
PERFORMANCE SUMMARY (UNAUDITED)
|
| (e) | Class I shares commenced operations on July 28, 2008. The performance in the table prior to that date reflects the performance of Access Capital Strategies Community Investment Fund, Inc., the predecessor to the Fund. From its inception, June 23, 1998, until May 30, 2006, the predecessor fund elected status as a business development company. From May 31, 2006 until July 27, 2008, the predecessor fund operated as a continuously offered closed-end interval management company. If the predecessor fund had operated as an open-end management company, performance may have been adversely affected. Fund performance reflects applicable fee waivers/expense reimbursements which, if excluded, would cause performance to be lower. |
| (f) | The inception date for Class IS shares of the Fund is March 11, 2019. All performance shown for such class of shares prior to its inception date is based on the performance of the Class I shares of the Fund, adjusted to reflect the fees and expenses of Class IS shares, as applicable. |
| (g) | The inception date for Class Y shares of the Fund is April 12, 2021. All performance shown for such class of shares prior to its inception date is based on the performance of the Class I shares of the Fund, adjusted to reflect the fees and expenses of Class Y shares, as applicable. |
| (h) | Each of the comparative indices is a widely recognized market value weighted measure of the return of securities, but do not include sales fees or operating expenses. You cannot invest directly in indices. |
The Bloomberg Barclays US Securitized Index represents the securitized portion (mortgage-backed, asset-backed and commercial mortgage-backed securities) of the Bloomberg Barclays US Aggregate Bond Index. You cannot invest directly in an index.
The Bloomberg Barclays US Aggregate Bond Index measures the investment grade, U.S. dollar-denominated, fixed-rate taxable bond market. It includes Treasuries, government-related and corporate securities, mortgage-backed securities (agency fixed-rate and hybrid adjustable-rate mortgage pass-throughs), asset-backed securities, and commercial mortgage-backed securities (agency and non-agency).
8
|
This Page Intentionally Left Blank
9
10
| MANAGEMENT DISCUSSION AND ANALYSIS (UNAUDITED) | ||||
| Access Capital Community Investment Fund | ||||
| The Bloomberg Barclays US Securitized Index represents the securitized portion (mortgage-backed, asset-backed and commercial mortgage-backed securities) of the Bloomberg Barclays US Aggregate Bond Index. You cannot invest directly in an index. | ||||
| Past performance is not a guarantee of future results. | ||||
| Fund holdings and/or sector allocations are subject to change and should not be considered a recommendation to buy or sell any security. Current and future holdings are subject to risk. For a complete list of Fund holdings please refer to the Schedule of Portfolio Investments included in this report. | ||||
| ||||
11
MANAGEMENT DISCUSSION AND ANALYSIS (UNAUDITED)
| ||||||||||||
Access Capital Community Investment Fund
| ||||||||||||
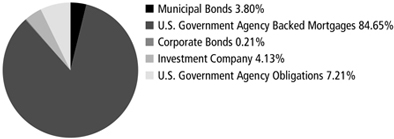
Investment Objective | Seeks to invest in geographically specific debt securities located in portions of the United States, which may include securities purchased as the result of geographic preferences expressed by certain eligible investors with respect to the amount of their investment in the Fund. | |||||||||||
Benchmark | Bloomberg Barclays U.S. Securitized Index
| |||||||||||
Asset Allocation as of 9/30/21 (% of Fund’s investments) |
| |||||||||||
Top Ten Holdings (excluding investment companies) (as of 9/30/21) (% of Fund’s net assets) |
Fannie Mae, Pool #CB1575, 2.50%, 9/1/51 Fannie Mae, Pool #BL4650, 2.30%, 10/1/31 Freddie Mac, Pool #RA5427, 2.50%, 6/1/51 Freddie Mac, Pool #RA5020, 2.00%, 4/1/51 Freddie Mac, Pool #RA4195, 2.00%, 12/1/50 California Health Facilities Financing Authority, Revenue, 2.70%, 6/1/30 | 1.40% 1.25% 1.16% 1.15% 1.15% 0.89% | Freddie Mac, Pool #RA4254, 2.00%, 12/1/50 Freddie Mac, Pool #RA3249, 2.50%, 8/1/50 Small Business Administration, Pool #510709, (Prime Index - 0.675%), 2.58%, 11/25/45 Fannie Mae, Pool #CA9048, 2.00%, 2/1/51 | 0.83% 0.77% 0.71%
0.67% | ||||||||
*A listing of all portfolio holdings can be found beginning on page 17
| ||||||||||||
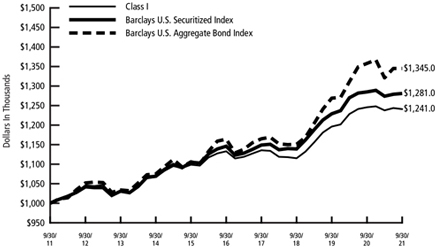
Growth of $1,000,000 Initial Investment Over 10 Years |
| |||||||||||
| The graph reflects an initial investment of $1,000,000 over a 10 year period and is based on Class I shares. The Fund’s total return includes reinvested dividends and capital gains. The Fund’s total return also includes operating expenses that reduce return, while the total return of the index does not. The graph does not reflect the deduction of taxes that a shareholder would pay on fund distributions or redemption of fund shares. Performance of other classes will vary due to differences in fee structures. | ||||||||||||
12
|
This Page Intentionally Left Blank
13
14
| MANAGEMENT DISCUSSION AND ANALYSIS (UNAUDITED) | ||||
| RBC Impact Bond Fund | ||||
| Fund holdings and/or sector allocations are subject to change and should not be considered a recommendation to buy or sell any security. Current and future holdings are subject to risk. For a complete list of Fund holdings please refer to the Schedule of Portfolio Investments included in this report. | ||||
| ||||
15
MANAGEMENT DISCUSSION AND ANALYSIS (UNAUDITED)
| ||||||||||||
RBC Impact Bond Fund
| ||||||||||||
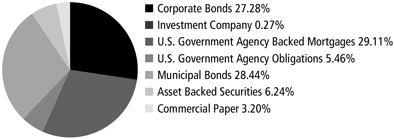
Investment Objective | Seeks to achieve a high level of current income consistent with preservation of capital.
| |||||||||||
Benchmark |
Bloomberg Barclays U.S. Aggregate Bond Index
| |||||||||||
Asset Allocation as of 9/30/21 (% of Fund’s investments) |
| |||||||||||
Top Ten Holdings (excluding investment companies) (as of 9/30/21) (% of Fund’s net assets) |
NextEra Energy Capital Holdings, Inc., 1.90%, 6/15/28 City of Tacoma Electric System, Revenue, Series C, 5.64%, 1/1/27 Astrazeneca Finance LLC, 1.75%, 5/28/28 Reinvestment Fund, Inc. (The), 3.93%, 2/15/28 Gilead Sciences, Inc., 3.65%, 3/1/26 |
1.38%
1.33% 1.32% 1.28% 1.25% |
Agilent Technologies, Inc., 2.75%, 9/15/29 Freddie Mac, Pool #RA5873, 2.50%, 9/1/51 BlueHub Loan Fund, Inc., Series 2020, 3.10%, 1/1/30 Vodafone Group Plc, 4.38%, 5/30/28 Freddie Mac, Pool #RA5525, 2.50%, 7/1/51 |
1.23% 1.14% | ||||||||
*A listing of all portfolio holdings can be found beginning on page 40
| ||||||||||||
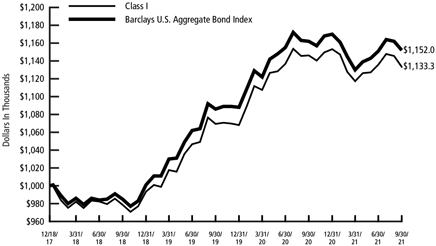
Growth of $1,000,000 Initial Investment Since Inception (12/18/17) |
| |||||||||||
| The graph reflects an initial investment of $1,000,000 over the period from December 18, 2017 (commencement of operations) to September 30, 2021 and is based on Class I shares. The Fund’s total return includes reinvested dividends and capital gains. The Fund’s total return also includes operating expenses that reduce return while the total return of the index does not. The graph does not reflect the deduction of taxes that a shareholder would pay on fund distributions or redemption of fund shares. | ||||||||||||
16
SCHEDULE OF PORTFOLIO INVESTMENTS
|
Access Capital Community Investment Fund
September 30, 2021
| Principal Amount | Value | |||||||
U.S. Government Agency Backed Mortgages — 84.53% | ||||||||
Fannie Mae — 42.91% | ||||||||
| $ 52,791 | Pool #257656, 6.00%, 8/1/38 | $ | 56,489 | |||||
| 103,713 | Pool #257892, 5.50%, 2/1/38 | 114,332 | ||||||
| 68,812 | Pool #257913, 5.50%, 1/1/38 | 74,558 | ||||||
| 51,286 | Pool #258022, 5.50%, 5/1/34 | 55,395 | ||||||
| 46,544 | Pool #258070, 5.00%, 6/1/34 | 52,982 | ||||||
| 33,306 | Pool #258121, 5.50%, 6/1/34 | 35,205 | ||||||
| 40,768 | Pool #258152, 5.50%, 8/1/34 | 42,833 | ||||||
| 56,547 | Pool #258157, 5.00%, 8/1/34 | 64,370 | ||||||
| 54,718 | Pool #258163, 5.50%, 8/1/34 | 58,865 | ||||||
| 59,084 | Pool #258224, 5.50%, 12/1/34 | 62,248 | ||||||
| 78,502 | Pool #258251, 5.50%, 1/1/35 | 84,954 | ||||||
| 93,334 | Pool #258305, 5.00%, 3/1/35 | 106,242 | ||||||
| 55,266 | Pool #258394, 5.00%, 5/1/35 | 62,909 | ||||||
| 70,247 | Pool #258404, 5.00%, 6/1/35 | 79,961 | ||||||
| 41,265 | Pool #258410, 5.00%, 4/1/35 | 46,972 | ||||||
| 75,189 | Pool #258448, 5.00%, 8/1/35 | 85,587 | ||||||
| 87,679 | Pool #258450, 5.50%, 8/1/35 | 95,508 | ||||||
| 176,100 | Pool #258627, 5.50%, 2/1/36 | 192,273 | ||||||
| 41,005 | Pool #258737, 5.50%, 12/1/35 | 43,268 | ||||||
| 34,758 | Pool #259181, 6.50%, 3/1/31 | 37,005 | ||||||
| 3,846 | Pool #259187, 6.50%, 4/1/31 | 3,854 | ||||||
| 24,197 | Pool #259378, 6.00%, 12/1/31 | 25,367 | ||||||
| 27,273 | Pool #259393, 6.00%, 1/1/32 | 28,658 | ||||||
| 35,714 | Pool #259590, 5.50%, 11/1/32 | 37,844 | ||||||
| 137,545 | Pool #259611, 5.50%, 11/1/32 | 151,975 | ||||||
| 23,557 | Pool #259634, 5.50%, 12/1/32 | 23,991 | ||||||
| 116,081 | Pool #259659, 5.50%, 2/1/33 | 128,780 | ||||||
| 27,717 | Pool #259671, 5.50%, 2/1/33 | 29,160 | ||||||
| 67,059 | Pool #259686, 5.50%, 3/1/33 | 72,550 | ||||||
| 29,454 | Pool #259722, 5.00%, 5/1/33 | 33,309 | ||||||
| 84,294 | Pool #259725, 5.00%, 5/1/33 | 95,325 | ||||||
| 62,822 | Pool #259729, 5.00%, 6/1/33 | 71,044 | ||||||
| 51,715 | Pool #259761, 5.00%, 6/1/33 | 58,482 | ||||||
| 86,947 | Pool #259777, 5.00%, 7/1/33 | 98,325 | ||||||
| 69,609 | Pool #259781, 5.00%, 7/1/33 | 78,719 | ||||||
| 42,126 | Pool #259789, 5.00%, 7/1/33 | 47,639 | ||||||
| 98,643 | Pool #259816, 5.00%, 8/1/33 | 111,552 | ||||||
| 23,312 | Pool #259819, 5.00%, 8/1/33 | 26,362 | ||||||
| 43,097 | Pool #259830, 5.00%, 8/1/33 | 48,737 | ||||||
| 28,549 | Pool #259848, 5.00%, 9/1/33 | 32,285 | ||||||
| 61,103 | Pool #259867, 5.50%, 10/1/33 | 65,888 | ||||||
| 44,234 | Pool #259869, 5.50%, 10/1/33 | 46,522 | ||||||
| 45,164 | Pool #259875, 5.50%, 10/1/33 | 47,726 | ||||||
| 32,069 | Pool #259998, 5.00%, 3/1/34 | 36,505 | ||||||
| 251,787 | Pool #469101, 3.75%, 2/1/27 | 279,205 | ||||||
17
SCHEDULE OF PORTFOLIO INVESTMENTS
|
Access Capital Community Investment Fund (cont.)
September 30, 2021
| Principal Amount | Value | |||||||
| $ 269,560 | Pool #470828, 3.53%, 3/1/32 | $ | 305,526 | |||||
| 67,524 | Pool #557295, 7.00%, 12/1/29 | 73,920 | ||||||
| 16,464 | Pool #576445, 6.00%, 1/1/31 | 16,739 | ||||||
| 57,834 | Pool #579402, 6.50%, 4/1/31 | 63,547 | ||||||
| 65,816 | Pool #583728, 6.50%, 6/1/31 | 72,303 | ||||||
| 14,467 | Pool #590931, 6.50%, 7/1/31 | 15,353 | ||||||
| 27,243 | Pool #590932, 6.50%, 7/1/31 | 28,132 | ||||||
| 17,308 | Pool #601865, 6.50%, 4/1/31 | 17,504 | ||||||
| 26,720 | Pool #601868, 6.00%, 7/1/29 | 28,012 | ||||||
| 41,553 | Pool #607611, 6.50%, 11/1/31 | 44,805 | ||||||
| 18,666 | Pool #644432, 6.50%, 7/1/32 | 19,367 | ||||||
| 33,916 | Pool #644437, 6.50%, 6/1/32 | 36,111 | ||||||
| 1,177,427 | Pool #663159, 5.00%, 7/1/32 | 1,331,432 | ||||||
| 59,409 | Pool #670278, 5.50%, 11/1/32 | 64,462 | ||||||
| 22,385 | Pool #676702, 5.50%, 11/1/32 | 22,943 | ||||||
| 43,419 | Pool #677591, 5.50%, 12/1/32 | 46,336 | ||||||
| 49,915 | Pool #681883, 6.00%, 3/1/33 | 53,293 | ||||||
| 82,354 | Pool #686542, 5.50%, 3/1/33 | 86,649 | ||||||
| 185,681 | Pool #695961, 5.50%, 1/1/33 | 206,984 | ||||||
| 110,767 | Pool #696407, 5.50%, 4/1/33 | 122,641 | ||||||
| 342,073 | Pool #702478, 5.50%, 6/1/33 | 385,168 | ||||||
| 100,187 | Pool #702479, 5.00%, 6/1/33 | 113,298 | ||||||
| 40,654 | Pool #723066, 5.00%, 4/1/33 | 45,975 | ||||||
| 165,302 | Pool #723067, 5.50%, 5/1/33 | 181,127 | ||||||
| 131,040 | Pool #723070, 4.50%, 5/1/33 | 145,873 | ||||||
| 227,873 | Pool #727311, 4.50%, 9/1/33 | 253,667 | ||||||
| 112,901 | Pool #727312, 5.00%, 9/1/33 | 127,676 | ||||||
| 130,755 | Pool #727315, 6.00%, 10/1/33 | 146,673 | ||||||
| 33,147 | Pool #738589, 5.00%, 9/1/33 | 37,485 | ||||||
| 41,711 | Pool #739269, 5.00%, 9/1/33 | 47,170 | ||||||
| 43,934 | Pool #743595, 5.50%, 10/1/33 | 47,067 | ||||||
| 84,902 | Pool #748041, 4.50%, 10/1/33 | 94,513 | ||||||
| 75,970 | Pool #749891, 5.00%, 9/1/33 | 85,911 | ||||||
| 153,502 | Pool #753533, 5.00%, 11/1/33 | 173,590 | ||||||
| 37,013 | Pool #755679, 6.00%, 1/1/34 | 39,752 | ||||||
| 79,587 | Pool #763820, 5.50%, 1/1/34 | 86,609 | ||||||
| 39,467 | Pool #776851, 6.00%, 10/1/34 | 42,458 | ||||||
| 334,766 | Pool #777621, 5.00%, 2/1/34 | 378,575 | ||||||
| 71,559 | Pool #781741, 6.00%, 9/1/34 | 78,243 | ||||||
| 100,271 | Pool #781954, 5.00%, 6/1/34 | 114,142 | ||||||
| 90,196 | Pool #781959, 5.50%, 6/1/34 | 97,054 | ||||||
| 126,819 | Pool #783893, 5.50%, 12/1/34 | 140,323 | ||||||
| 64,012 | Pool #783929, 5.50%, 10/1/34 | 69,387 | ||||||
| 7,653 | Pool #788329, 6.50%, 8/1/34 | 7,694 | ||||||
| 38,053 | Pool #798725, 5.50%, 11/1/34 | 40,074 | ||||||
| 55,509 | Pool #799548, 6.00%, 9/1/34 | 60,270 | ||||||
| 642,520 | Pool #806754, 4.50%, 9/1/34 | 715,447 | ||||||
| 275,811 | Pool #806757, 6.00%, 9/1/34 | 309,429 | ||||||
18
SCHEDULE OF PORTFOLIO INVESTMENTS
|
Access Capital Community Investment Fund (cont.)
September 30, 2021
| Principal Amount | Value | |||||||||||
| $ 366,224 | Pool #806761, 5.50%, 9/1/34 | $ | 419,499 | |||||||||
| 99,636 | Pool #808205, 5.00%, 1/1/35 | 113,419 | ||||||||||
| 171,085 | Pool #815009, 5.00%, 4/1/35 | 194,744 | ||||||||||
| 67,028 | Pool #817641, 5.00%, 11/1/35 | 76,298 | ||||||||||
| 105,645 | Pool #820334, 5.00%, 9/1/35 | 120,254 | ||||||||||
| 135,833 | Pool #820335, 5.00%, 9/1/35 | 154,618 | ||||||||||
| 97,835 | Pool #820336, 5.00%, 9/1/35 | 111,365 | ||||||||||
| 90,981 | Pool #822008, 5.00%, 5/1/35 | 103,563 | ||||||||||
| 144,159 | Pool #829275, 5.00%, 8/1/35 | 164,095 | ||||||||||
| 136,972 | Pool #829276, 5.00%, 8/1/35 | 155,914 | ||||||||||
| 218,596 | Pool #829649, 5.50%, 3/1/35 | 241,156 | ||||||||||
| 144,484 | Pool #844361, 5.50%, 11/1/35 | 157,795 | ||||||||||
| 89,281 | Pool #845245, 5.50%, 11/1/35 | 97,297 | ||||||||||
| 29,295 | Pool #866969, 6.00%, 2/1/36 | 30,361 | ||||||||||
| 72,423 | Pool #884693, 5.50%, 4/1/36 | 78,486 | ||||||||||
| 325,036 | Pool #885724, 5.50%, 6/1/36 | 361,311 | ||||||||||
| 2,372 | Pool #911730, 5.50%, 12/1/21 | 2,373 | ||||||||||
| 65,580 | Pool #919368, 5.50%, 4/1/37 | 70,786 | ||||||||||
| 256,048 | Pool #922582, 6.00%, 12/1/36 | 285,734 | ||||||||||
| 199,525 | Pool #934941, 5.00%, 8/1/39 | 227,021 | ||||||||||
| 273,408 | Pool #934942, 5.00%, 9/1/39 | 311,085 | ||||||||||
| 34,403 | Pool #941204, 5.50%, 6/1/37 | 35,967 | ||||||||||
| 54,998 | Pool #943394, 5.50%, 6/1/37 | 59,273 | ||||||||||
| 184,905 | Pool #948600, 6.00%, 8/1/37 | 205,037 | ||||||||||
| 69,758 | Pool #952678, 6.50%, 8/1/37 | 76,111 | ||||||||||
| 77,703 | Pool #952693, 6.50%, 8/1/37 | 84,448 | ||||||||||
| 93,669 | Pool #975769, 5.50%, 3/1/38 | 102,294 | ||||||||||
| 99,683 | Pool #986239, 6.00%, 7/1/38 | 108,755 | ||||||||||
| 114,840 | Pool #986957, 5.50%, 7/1/38 | 125,861 | ||||||||||
| 51,738 | Pool #990510, 5.50%, 8/1/38 | 55,240 | ||||||||||
| 153,732 | Pool #990511, 6.00%, 8/1/38 | 170,765 | ||||||||||
| 152,729 | Pool #990617, 5.50%, 9/1/38 | 169,131 | ||||||||||
| 174,722 | Pool #AA0645, 4.50%, 3/1/39 | 195,096 | ||||||||||
| 125,611 | Pool #AA2243, 4.50%, 5/1/39 | 140,879 | ||||||||||
| 120,046 | Pool #AA3142, 4.50%, 3/1/39 | 134,044 | ||||||||||
| 81,568 | Pool #AA3206, 4.00%, 4/1/39 | 90,383 | ||||||||||
| 389,012 | Pool #AA3207, 4.50%, 3/1/39 | 434,373 | ||||||||||
| 214,067 | Pool #AA7042, 4.50%, 6/1/39 | 239,028 | ||||||||||
| 339,504 | Pool #AA7658, 4.00%, 6/1/39 | 373,599 | ||||||||||
| 92,276 | Pool #AA7659, 4.50%, 6/1/39 | 103,036 | ||||||||||
| 63,229 | Pool #AA7741, 4.50%, 6/1/24 | 65,074 | ||||||||||
| 1,321,946 | Pool #AB7798, 3.00%, 1/1/43 | 1,408,648 | ||||||||||
| 971,854 | Pool #AB9204, 3.00%, 4/1/43 | 1,036,363 | ||||||||||
| 179,656 | Pool #AC1463, 5.00%, 8/1/39 | 204,413 | ||||||||||
| 263,041 | Pool #AC2109, 4.50%, 7/1/39 | 293,713 | ||||||||||
| 23,136 | Pool #AC4394, 5.00%, 9/1/39 | 26,324 | ||||||||||
| 247,599 | Pool #AC4395, 5.00%, 9/1/39 | 281,719 | ||||||||||
19
SCHEDULE OF PORTFOLIO INVESTMENTS
|
Access Capital Community Investment Fund (cont.)
September 30, 2021
Principal Amount | Value | |||||||
| $ 92,803 | Pool #AC5329, 5.00%, 10/1/39 | $ | 105,591 | |||||
| 114,925 | Pool #AC6304, 5.00%, 11/1/39 | 130,763 | ||||||
| 194,565 | Pool #AC6305, 5.00%, 11/1/39 | 221,376 | ||||||
| 132,634 | Pool #AC6307, 5.00%, 12/1/39 | 150,911 | ||||||
| 286,769 | Pool #AC6790, 5.00%, 12/1/39 | 326,287 | ||||||
| 529,622 | Pool #AC7199, 5.00%, 12/1/39 | 602,606 | ||||||
| 281,470 | Pool #AD1470, 5.00%, 2/1/40 | 320,161 | ||||||
| 791,441 | Pool #AD1471, 4.50%, 2/1/40 | 883,728 | ||||||
| 588,399 | Pool #AD1585, 4.50%, 2/1/40 | 657,009 | ||||||
| 333,630 | Pool #AD1586, 5.00%, 1/1/40 | 379,605 | ||||||
| 234,704 | Pool #AD1638, 4.50%, 2/1/40 | 261,907 | ||||||
| 137,516 | Pool #AD1640, 4.50%, 3/1/40 | 153,455 | ||||||
| 780,037 | Pool #AD1942, 4.50%, 1/1/40 | 870,994 | ||||||
| 140,071 | Pool #AD1943, 5.00%, 1/1/40 | 159,373 | ||||||
| 155,062 | Pool #AD1988, 4.50%, 2/1/40 | 173,143 | ||||||
| 264,903 | Pool #AD2896, 5.00%, 3/1/40 | 301,317 | ||||||
| 94,629 | Pool #AD4456, 4.50%, 4/1/40 | 105,597 | ||||||
| 555,380 | Pool #AD4458, 4.50%, 4/1/40 | 619,750 | ||||||
| 248,583 | Pool #AD4940, 4.50%, 6/1/40 | 277,394 | ||||||
| 85,059 | Pool #AD4946, 4.50%, 6/1/40 | 94,918 | ||||||
| 113,897 | Pool #AD5728, 5.00%, 4/1/40 | 129,554 | ||||||
| 209,316 | Pool #AD7239, 4.50%, 7/1/40 | 233,576 | ||||||
| 50,551 | Pool #AD7242, 4.50%, 7/1/40 | 56,410 | ||||||
| 87,814 | Pool #AD7256, 4.50%, 7/1/40 | 97,992 | ||||||
| 231,508 | Pool #AD7271, 4.50%, 7/1/40 | 258,340 | ||||||
| 253,473 | Pool #AD7272, 4.50%, 7/1/40 | 282,851 | ||||||
| 159,523 | Pool #AD8960, 5.00%, 6/1/40 | 181,451 | ||||||
| 442,043 | Pool #AD9614, 4.50%, 8/1/40 | 493,277 | ||||||
| 45,314 | Pool #AE2011, 4.00%, 9/1/40 | 49,829 | ||||||
| 981,766 | Pool #AE2012, 4.00%, 9/1/40 | 1,079,590 | ||||||
| 112,651 | Pool #AE2023, 4.00%, 9/1/40 | 124,179 | ||||||
| 410,519 | Pool #AE5432, 4.00%, 10/1/40 | 451,423 | ||||||
| 316,834 | Pool #AE5435, 4.50%, 9/1/40 | 353,555 | ||||||
| 314,677 | Pool #AE5806, 4.50%, 9/1/40 | 351,149 | ||||||
| 487,790 | Pool #AE5861, 4.00%, 10/1/40 | 536,394 | ||||||
| 125,086 | Pool #AE5862, 4.00%, 10/1/40 | 137,550 | ||||||
| 160,552 | Pool #AE5863, 4.00%, 10/1/40 | 176,550 | ||||||
| 268,319 | Pool #AE6850, 4.00%, 10/1/40 | 295,054 | ||||||
| 15,749 | Pool #AE6851, 4.00%, 10/1/40 | 17,318 | ||||||
| 148,003 | Pool #AE7699, 4.00%, 11/1/40 | 162,750 | ||||||
| 396,842 | Pool #AE7703, 4.00%, 10/1/40 | 436,383 | ||||||
| 279,210 | Pool #AE7707, 4.00%, 11/1/40 | 307,031 | ||||||
| 225,931 | Pool #AH0300, 4.00%, 11/1/40 | 248,443 | ||||||
| 359,427 | Pool #AH0301, 3.50%, 11/1/40 | 389,079 | ||||||
| 28,686 | Pool #AH0302, 4.00%, 11/1/40 | 31,544 | ||||||
| 267,948 | Pool #AH0306, 4.00%, 12/1/40 | 295,367 | ||||||
| 354,692 | Pool #AH0508, 4.00%, 11/1/40 | 390,034 | ||||||
| 726,019 | Pool #AH0537, 4.00%, 12/1/40 | 798,360 | ||||||
20
SCHEDULE OF PORTFOLIO INVESTMENTS
|
Access Capital Community Investment Fund (cont.)
September 30, 2021
Principal Amount | Value | |||||||
| $ 533,156 | Pool #AH0914, 4.50%, 11/1/40 | $ | 594,950 | |||||
| 280,538 | Pool #AH0917, 4.00%, 12/1/40 | 308,491 | ||||||
| 233,381 | Pool #AH1077, 4.00%, 1/1/41 | 259,166 | ||||||
| 338,407 | Pool #AH2973, 4.00%, 12/1/40 | 372,126 | ||||||
| 405,051 | Pool #AH2980, 4.00%, 1/1/41 | 445,410 | ||||||
| 697,925 | Pool #AH5656, 4.00%, 1/1/41 | 767,467 | ||||||
| 339,694 | Pool #AH5658, 4.00%, 2/1/41 | 373,541 | ||||||
| 243,894 | Pool #AH5662, 4.00%, 2/1/41 | 268,851 | ||||||
| 301,490 | Pool #AH5882, 4.00%, 2/1/26 | 320,934 | ||||||
| 155,735 | Pool #AH6764, 4.00%, 3/1/41 | 171,253 | ||||||
| 642,637 | Pool #AH6768, 4.00%, 3/1/41 | 706,637 | ||||||
| 124,688 | Pool #AH7277, 4.00%, 3/1/41 | 137,105 | ||||||
| 596,458 | Pool #AH7281, 4.00%, 3/1/41 | 655,858 | ||||||
| 108,548 | Pool #AH7526, 4.50%, 3/1/41 | 121,072 | ||||||
| 451,524 | Pool #AH7537, 4.00%, 3/1/41 | 496,490 | ||||||
| 230,825 | Pool #AH8878, 4.50%, 4/1/41 | 257,457 | ||||||
| 246,853 | Pool #AH8885, 4.50%, 4/1/41 | 275,334 | ||||||
| 144,325 | Pool #AH9050, 3.50%, 2/1/26 | 153,905 | ||||||
| 355,334 | Pool #AI0114, 4.00%, 3/1/41 | 390,722 | ||||||
| 297,038 | Pool #AI1846, 4.50%, 5/1/41 | 331,309 | ||||||
| 303,473 | Pool #AI1847, 4.50%, 5/1/41 | 338,487 | ||||||
| 766,803 | Pool #AI1848, 4.50%, 5/1/41 | 855,274 | ||||||
| 364,936 | Pool #AI1849, 4.50%, 5/1/41 | 407,041 | ||||||
| 172,099 | Pool #AJ0651, 4.00%, 8/1/41 | 189,238 | ||||||
| 117,723 | Pool #AJ7668, 4.00%, 11/1/41 | 129,447 | ||||||
| 577,327 | Pool #AJ9133, 4.00%, 1/1/42 | 634,822 | ||||||
| 361,937 | Pool #AK6715, 3.50%, 3/1/42 | 390,839 | ||||||
| 345,869 | Pool #AK6716, 3.50%, 3/1/42 | 373,488 | ||||||
| 470,537 | Pool #AK6718, 3.50%, 2/1/42 | 508,112 | ||||||
| 829,416 | Pool #AM1750, 3.04%, 12/1/30 | 856,839 | ||||||
| 2,754,209 | Pool #AM4392, 3.79%, 10/1/23 | 2,875,538 | ||||||
| 222,779 | Pool #AM6907, 3.68%, 10/1/32 | 252,888 | ||||||
| 1,394,901 | Pool #AM7764, 3.05%, 1/1/27 | 1,505,593 | ||||||
| 463,849 | Pool #AM9780, 3.31%, 3/1/31 | 516,949 | ||||||
| 350,000 | Pool #AN0360, 3.95%, 12/1/45 | 410,416 | ||||||
| 299,866 | Pool #AN1381, 2.56%, 8/1/26 | 317,096 | ||||||
| 906,471 | Pool #AN2066, 2.75%, 7/1/26 | 938,266 | ||||||
| 922,969 | Pool #AN2746, 2.30%, 9/1/26 | 968,466 | ||||||
| 458,135 | Pool #AN3919, 2.82%, 12/1/26 | 490,550 | ||||||
| 1,145,000 | Pool #AN4045, 3.15%, 1/1/29 | 1,237,246 | ||||||
| 829,939 | Pool #AN5053, 3.34%, 4/1/27 | 909,172 | ||||||
| 202,984 | Pool #AN6580, 3.36%, 9/1/29 | 225,460 | ||||||
| 932,218 | Pool #AN7154, 3.21%, 10/1/32 | 1,041,670 | ||||||
| 471,305 | Pool #AN7982, 2.80%, 1/1/26 | 497,690 | ||||||
| 2,000,000 | Pool #AN8055, 3.05%, 1/1/30 | 2,198,510 | ||||||
| 1,500,000 | Pool #AN8121, 3.16%, 1/1/35 | 1,679,648 | ||||||
| 953,643 | Pool #AN9844, 3.80%, 7/1/30 | 1,089,708 | ||||||
21
SCHEDULE OF PORTFOLIO INVESTMENTS
|
Access Capital Community Investment Fund (cont.)
September 30, 2021
Principal Amount | Value | |||||||
| $ 208,625 | Pool #AO2923, 3.50%, 5/1/42 | $ | 226,221 | |||||
| 585,923 | Pool #AO8029, 3.50%, 7/1/42 | 632,712 | ||||||
| 139,860 | Pool #AP7483, 3.50%, 9/1/42 | 151,028 | ||||||
| 210,770 | Pool #AQ6710, 2.50%, 10/1/27 | 219,558 | ||||||
| 830,433 | Pool #AQ7193, 3.50%, 7/1/43 | 900,012 | ||||||
| 226,531 | Pool #AR6928, 3.00%, 3/1/43 | 242,812 | ||||||
| 836,223 | Pool #AS1916, 4.00%, 3/1/44 | 914,131 | ||||||
| 143,303 | Pool #AS1917, 4.00%, 3/1/44 | 157,037 | ||||||
| 184,108 | Pool #AS2129, 4.00%, 3/1/44 | 201,261 | ||||||
| 500,584 | Pool #AS2439, 4.00%, 5/1/44 | 548,559 | ||||||
| 496,185 | Pool #AS3244, 4.00%, 9/1/44 | 542,413 | ||||||
| 792,584 | Pool #AS3494, 4.00%, 10/1/44 | 866,426 | ||||||
| 188,365 | Pool #AS3726, 4.00%, 11/1/44 | 203,560 | ||||||
| 202,033 | Pool #AS3728, 4.00%, 11/1/44 | 220,855 | ||||||
| 367,298 | Pool #AS3929, 4.00%, 12/1/44 | 401,518 | ||||||
| 469,845 | Pool #AS3930, 4.00%, 11/1/44 | 513,619 | ||||||
| 489,433 | Pool #AS4070, 4.00%, 12/1/44 | 539,345 | ||||||
| 150,644 | Pool #AS4390, 3.50%, 2/1/45 | 163,238 | ||||||
| 173,470 | Pool #AS4732, 3.50%, 4/1/45 | 187,000 | ||||||
| 681,188 | Pool #AS4905, 3.50%, 4/1/45 | 732,528 | ||||||
| 989,020 | Pool #AS5341, 3.50%, 7/1/45 | 1,060,939 | ||||||
| 570,443 | Pool #AS5576, 4.00%, 8/1/45 | 621,326 | ||||||
| 568,634 | Pool #AS5919, 3.50%, 9/1/45 | 616,210 | ||||||
| 483,558 | Pool #AS6303, 4.00%, 11/1/45 | 526,690 | ||||||
| 239,881 | Pool #AS6607, 4.00%, 1/1/46 | 261,278 | ||||||
| 1,095,849 | Pool #AS6778, 3.50%, 3/1/46 | 1,178,595 | ||||||
| 275,376 | Pool #AS6958, 3.50%, 4/1/46 | 298,459 | ||||||
| 750,316 | Pool #AS7138, 3.50%, 5/1/46 | 799,336 | ||||||
| 390,691 | Pool #AS7139, 3.50%, 5/1/46 | 416,216 | ||||||
| 836,004 | Pool #AS7334, 3.00%, 6/1/46 | 885,739 | ||||||
| 909,354 | Pool #AS7335, 3.00%, 5/1/46 | 961,098 | ||||||
| 555,112 | Pool #AS7336, 3.00%, 6/1/46 | 594,713 | ||||||
| 1,499,280 | Pool #AS7504, 3.00%, 7/1/46 | 1,584,593 | ||||||
| 460,897 | Pool #AS7516, 3.00%, 7/1/46 | 487,123 | ||||||
| 637,550 | Pool #AS7517, 3.00%, 6/1/46 | 673,828 | ||||||
| 124,768 | Pool #AS7518, 3.00%, 7/1/46 | 133,337 | ||||||
| 156,517 | Pool #AS7674, 3.00%, 8/1/46 | 165,423 | ||||||
| 1,065,012 | Pool #AS7676, 3.00%, 8/1/46 | 1,125,613 | ||||||
| 660,276 | Pool #AS8077, 3.00%, 10/1/46 | 697,848 | ||||||
| 487,342 | Pool #AS8289, 3.00%, 10/1/46 | 515,073 | ||||||
| 1,370,204 | Pool #AS8441, 3.00%, 11/1/46 | 1,448,172 | ||||||
| 1,003,302 | Pool #AS8633, 3.50%, 1/1/47 | 1,068,851 | ||||||
| 321,889 | Pool #AS8776, 3.50%, 2/1/47 | 342,919 | ||||||
| 348,664 | Pool #AS9381, 4.00%, 4/1/47 | 379,352 | ||||||
| 164,821 | Pool #AS9549, 4.00%, 5/1/47 | 179,756 | ||||||
| 1,006,072 | Pool #AS9550, 4.00%, 5/1/47 | 1,090,439 | ||||||
| 435,816 | Pool #AS9727, 3.50%, 6/1/47 | 463,668 | ||||||
| 243,792 | Pool #AS9729, 4.00%, 6/1/47 | 262,698 | ||||||
22
SCHEDULE OF PORTFOLIO INVESTMENTS
|
Access Capital Community Investment Fund (cont.)
September 30, 2021
Principal Amount | Value | |||||||
| $ 196,528 | Pool #AS9825, 4.00%, 6/1/47 | $ | 213,825 | |||||
| 450,244 | Pool #AT2688, 3.00%, 5/1/43 | 480,130 | ||||||
| 89,930 | Pool #AT2691, 3.00%, 5/1/43 | 96,936 | ||||||
| 400,489 | Pool #AT3963, 2.50%, 3/1/28 | 417,387 | ||||||
| 126,135 | Pool #AT7873, 2.50%, 6/1/28 | 132,324 | ||||||
| 335,303 | Pool #AU0971, 3.50%, 8/1/43 | 363,397 | ||||||
| 377,093 | Pool #AU2165, 3.50%, 7/1/43 | 408,688 | ||||||
| 527,293 | Pool #AU2188, 3.50%, 8/1/43 | 571,473 | ||||||
| 70,939 | Pool #AU6054, 4.00%, 9/1/43 | 78,502 | ||||||
| 302,254 | Pool #AU6718, 4.00%, 10/1/43 | 331,324 | ||||||
| 367,880 | Pool #AU7003, 4.00%, 11/1/43 | 408,454 | ||||||
| 243,278 | Pool #AU7005, 4.00%, 11/1/43 | 267,840 | ||||||
| 493,551 | Pool #AV0679, 4.00%, 12/1/43 | 543,382 | ||||||
| 344,304 | Pool #AV9282, 4.00%, 2/1/44 | 374,456 | ||||||
| 340,976 | Pool #AW0993, 4.00%, 5/1/44 | 377,242 | ||||||
| 136,046 | Pool #AW1565, 4.00%, 4/1/44 | 148,216 | ||||||
| 712,005 | Pool #AW5046, 4.00%, 7/1/44 | 778,456 | ||||||
| 271,444 | Pool #AW5047, 4.00%, 7/1/44 | 296,734 | ||||||
| 108,990 | Pool #AW7040, 4.00%, 6/1/44 | 119,139 | ||||||
| 228,755 | Pool #AW8629, 3.50%, 5/1/44 | 246,224 | ||||||
| 698,640 | Pool #AX2884, 3.50%, 11/1/44 | 761,674 | ||||||
| 748,021 | Pool #AX4860, 3.50%, 12/1/44 | 806,318 | ||||||
| 576,025 | Pool #AY1389, 3.50%, 4/1/45 | 617,912 | ||||||
| 406,122 | Pool #AY3435, 3.50%, 5/1/45 | 435,653 | ||||||
| 614,923 | Pool #AY5571, 3.50%, 6/1/45 | 659,639 | ||||||
| 327,135 | Pool #BC0802, 3.50%, 4/1/46 | 352,698 | ||||||
| 528,553 | Pool #BC0804, 3.50%, 4/1/46 | 566,239 | ||||||
| 661,982 | Pool #BC1135, 3.00%, 6/1/46 | 703,716 | ||||||
| 952,775 | Pool #BD5021, 3.50%, 2/1/47 | 1,024,718 | ||||||
| 1,146,070 | Pool #BD7140, 4.00%, 4/1/47 | 1,234,944 | ||||||
| 1,414,138 | Pool #BE4232, 3.00%, 12/1/46 | 1,494,606 | ||||||
| 183,310 | Pool #BE9743, 3.50%, 4/1/47 | 197,054 | ||||||
| 1,195,048 | Pool #BH2665, 3.50%, 9/1/47 | 1,277,547 | ||||||
| 476,363 | Pool #BH4659, 4.00%, 6/1/47 | 516,311 | ||||||
| 664,607 | Pool #BJ0657, 4.00%, 2/1/48 | 711,791 | ||||||
| 598,645 | Pool #BJ2670, 4.00%, 4/1/48 | 641,147 | ||||||
| 764,661 | Pool #BJ5158, 4.00%, 4/1/48 | 825,121 | ||||||
| 622,940 | Pool #BK7685, 4.00%, 10/1/48 | 667,166 | ||||||
| 557,708 | Pool #BK7924, 4.00%, 11/1/48 | 604,469 | ||||||
| 8,920,000 | Pool #BL4650, 2.30%, 10/1/31 | 9,348,130 | ||||||
| 2,400,000 | Pool #BL4970, 2.80%, 11/1/36 | 2,558,067 | ||||||
| 2,622,777 | Pool #BL9077, 1.50%, 1/1/31 | 2,604,217 | ||||||
| 3,000,000 | Pool #BL9218, 1.41%, 11/1/30 | 2,941,225 | ||||||
| 500,000 | Pool #BL9633, 1.92%, 12/1/35 | �� | 495,804 | |||||
| 1,527,000 | Pool #BL9652, 1.56%, 12/1/30 | 1,521,834 | ||||||
| 1,500,000 | Pool #BL9824, 1.56%, 12/1/30 | 1,488,808 | ||||||
| 250,000 | Pool #BL9895, 1.62%, 12/1/32 | 245,497 | ||||||
23
SCHEDULE OF PORTFOLIO INVESTMENTS
|
Access Capital Community Investment Fund (cont.)
September 30, 2021
Principal Amount | Value | |||||||
| $ 523,451 | Pool #BO1263, 3.50%, 6/1/49 | $ | 556,754 | |||||
| 716,770 | Pool #BO3599, 3.00%, 9/1/49 | 749,102 | ||||||
| 582,293 | Pool #BO5263, 3.00%, 9/1/49 | 608,987 | ||||||
| 2,840,629 | Pool #BO6771, 2.50%, 5/1/51 | 2,928,888 | ||||||
| 909,032 | Pool #BP3417, 2.50%, 5/1/51 | 937,276 | ||||||
| 1,173,441 | Pool #BP8731, 2.50%, 6/1/50 | 1,209,039 | ||||||
| 1,506,348 | Pool #BP8741, 2.50%, 6/1/50 | 1,552,046 | ||||||
| 1,908,978 | Pool #BQ4469, 2.00%, 2/1/51 | 1,914,235 | ||||||
| 510,199 | Pool #BQ4493, 1.50%, 2/1/51 | 495,932 | ||||||
| 472,494 | Pool #BQ5723, 2.00%, 10/1/50 | 473,772 | ||||||
| 1,706,011 | Pool #BQ7523, 2.00%, 11/1/50 | 1,710,708 | ||||||
| 1,014,187 | Pool #BQ7524, 2.50%, 10/1/50 | 1,044,954 | ||||||
| 4,810,454 | Pool #BR0940, 2.00%, 4/1/51 | 4,823,067 | ||||||
| 924,325 | Pool #BR1037, 2.50%, 5/1/51 | 953,044 | ||||||
| 2,545,844 | Pool #BR1113, 2.00%, 11/1/50 | 2,553,057 | ||||||
| 885,651 | Pool #BR1114, 1.50%, 11/1/50 | 860,886 | ||||||
| 411,427 | Pool #BR1115, 2.50%, 12/1/50 | 423,908 | ||||||
| 1,356,578 | Pool #BR2051, 2.50%, 6/1/51 | 1,398,728 | ||||||
| 2,915,720 | Pool #BR2234, 2.50%, 8/1/51 | 3,006,492 | ||||||
| 1,060,545 | Pool #BR3565, 2.00%, 1/1/51 | 1,063,550 | ||||||
| 823,979 | Pool #BR3566, 2.50%, 12/1/50 | 851,321 | ||||||
| 227,824 | Pool #BR7088, 2.00%, 3/1/51 | 228,421 | ||||||
| 1,762,616 | Pool #BS0025, 1.38%, 12/1/30 | 1,738,672 | ||||||
| 3,000,000 | Pool #BS0046, 1.23%, 12/1/27 | 2,976,427 | ||||||
| 2,950,000 | Pool #BS0179, 1.67%, 1/1/33 | 2,912,180 | ||||||
| 4,436,485 | Pool #BS0345, 1.61%, 1/1/36 | 4,316,074 | ||||||
| 2,545,000 | Pool #BS0391, 1.63%, 1/1/33 | 2,499,968 | ||||||
| 1,990,000 | Pool #BS0596, 1.38%, 1/1/31 | 1,944,173 | ||||||
| 3,700,000 | Pool #BS0915, 1.62%, 3/1/31 | 3,675,109 | ||||||
| 1,000,000 | Pool #BS1281, 1.59%, 3/1/31 | 992,466 | ||||||
| 690,000 | Pool #BS1326, 1.19%, 3/1/26 | 695,270 | ||||||
| 1,979,908 | Pool #BS1482, 1.61%, 3/1/31 | 1,980,778 | ||||||
| 700,000 | Pool #BS1524, 2.01%, 3/1/33 | 708,530 | ||||||
| 1,500,000 | Pool #BS1560, 2.03%, 4/1/31 | 1,534,303 | ||||||
| 2,032,840 | Pool #BS1877, 2.97%, 5/1/51 | 2,215,351 | ||||||
| 923,071 | Pool #CA0114, 3.50%, 8/1/47 | 982,062 | ||||||
| 602,029 | Pool #CA0334, 3.50%, 9/1/47 | 645,792 | ||||||
| 1,564,335 | Pool #CA0534, 3.50%, 10/1/47 | 1,664,308 | ||||||
| 405,847 | Pool #CA0536, 3.50%, 10/1/47 | 433,864 | ||||||
| 613,660 | Pool #CA0551, 4.00%, 10/1/47 | 665,120 | ||||||
| 518,737 | Pool #CA0565, 3.50%, 10/1/47 | 557,264 | ||||||
| 1,329,263 | Pool #CA0742, 3.50%, 11/1/47 | 1,414,213 | ||||||
| 648,909 | Pool #CA0743, 3.50%, 11/1/47 | 697,995 | ||||||
| 906,712 | Pool #CA0825, 3.50%, 12/1/47 | 964,658 | ||||||
| 690,520 | Pool #CA0981, 3.50%, 12/1/47 | 734,649 | ||||||
| 427,444 | Pool #CA1070, 3.50%, 1/1/48 | 454,761 | ||||||
| 494,181 | Pool #CA1115, 3.50%, 1/1/48 | 525,763 | ||||||
| 1,014,423 | Pool #CA1130, 3.50%, 1/1/48 | 1,079,253 | ||||||
24
SCHEDULE OF PORTFOLIO INVESTMENTS
|
Access Capital Community Investment Fund (cont.)
September 30, 2021
Principal Amount | Value | |||||||
| $ 672,511 | Pool #CA1131, 3.50%, 2/1/48 | $ | 715,489 | |||||
| 666,205 | Pool #CA1132, 3.50%, 1/1/48 | 708,781 | ||||||
| 862,276 | Pool #CA1144, 3.50%, 2/1/48 | 921,803 | ||||||
| 138,083 | Pool #CA1152, 3.50%, 2/1/48 | 147,616 | ||||||
| 410,132 | Pool #CA1160, 3.50%, 2/1/48 | 440,883 | ||||||
| 517,043 | Pool #CA1161, 3.50%, 2/1/48 | 548,278 | ||||||
| 578,386 | Pool #CA1338, 4.00%, 3/1/48 | 622,083 | ||||||
| 888,015 | Pool #CA1339, 3.50%, 3/1/48 | 941,661 | ||||||
| 519,929 | Pool #CA1418, 4.00%, 3/1/48 | 559,208 | ||||||
| 251,541 | Pool #CA1420, 4.00%, 3/1/48 | 269,906 | ||||||
| 191,624 | Pool #CA1468, 4.00%, 3/1/48 | 207,338 | ||||||
| 1,208,400 | Pool #CA1469, 4.00%, 3/1/48 | 1,294,190 | ||||||
| 416,057 | Pool #CA1471, 4.00%, 3/1/48 | 448,954 | ||||||
| 1,122,313 | Pool #CA1507, 4.00%, 4/1/48 | 1,204,251 | ||||||
| 421,454 | Pool #CA1610, 3.50%, 3/1/48 | 446,915 | ||||||
| 448,148 | Pool #CA1611, 4.00%, 4/1/48 | 483,581 | ||||||
| 607,708 | Pool #CA1612, 3.50%, 4/1/48 | 650,406 | ||||||
| 523,925 | Pool #CA1613, 4.00%, 4/1/48 | 561,121 | ||||||
| 203,978 | Pool #CA2381, 4.00%, 9/1/48 | 220,705 | ||||||
| 218,734 | Pool #CA2440, 4.00%, 9/1/48 | 236,028 | ||||||
| 347,924 | Pool #CA2441, 4.00%, 10/1/48 | 377,095 | ||||||
| 261,223 | Pool #CA2442, 4.00%, 10/1/48 | 283,125 | ||||||
| 611,781 | Pool #CA2443, 4.00%, 10/1/48 | 660,152 | ||||||
| 198,413 | Pool #CA2468, 4.00%, 10/1/48 | 214,685 | ||||||
| 740,151 | Pool #CA2594, 4.00%, 11/1/48 | 805,808 | ||||||
| 252,916 | Pool #CA2913, 4.00%, 1/1/49 | 271,381 | ||||||
| 317,098 | Pool #CA3042, 4.00%, 1/1/49 | 340,249 | ||||||
| 538,346 | Pool #CA3043, 4.00%, 2/1/49 | 582,494 | ||||||
| 585,043 | Pool #CA3045, 4.50%, 1/1/49 | 638,582 | ||||||
| 28,397 | Pool #CA3132, 4.00%, 2/1/49 | 30,926 | ||||||
| 257,387 | Pool #CA3557, 3.50%, 5/1/49 | 275,520 | ||||||
| 977,061 | Pool #CA3628, 3.50%, 6/1/49 | 1,032,783 | ||||||
| 672,133 | Pool #CA3793, 3.50%, 6/1/49 | 710,465 | ||||||
| 145,243 | Pool #CA3936, 3.50%, 7/1/49 | 155,217 | ||||||
| 441,285 | Pool #CA4043, 3.00%, 8/1/49 | 461,190 | ||||||
| 515,169 | Pool #CA4320, 3.00%, 9/1/49 | 538,407 | ||||||
| 697,995 | Pool #CA5106, 3.00%, 1/1/50 | 729,480 | ||||||
| 436,339 | Pool #CA5132, 3.00%, 2/1/50 | 456,021 | ||||||
| 995,730 | Pool #CA5309, 3.00%, 3/1/50 | 1,040,828 | ||||||
| 557,301 | Pool #CA5312, 3.00%, 3/1/50 | 582,649 | ||||||
| 927,840 | Pool #CA6150, 2.50%, 6/1/50 | 955,988 | ||||||
| 1,223,122 | Pool #CA6151, 2.50%, 6/1/50 | 1,260,227 | ||||||
| 547,552 | Pool #CA6251, 3.00%, 6/1/50 | 572,352 | ||||||
| 1,876,854 | Pool #CA6253, 2.00%, 7/1/50 | 1,882,171 | ||||||
| 4,384,058 | Pool #CA6261, 2.50%, 6/1/50 | 4,519,330 | ||||||
| 1,834,602 | Pool #CA6263, 2.50%, 7/1/50 | 1,890,258 | ||||||
| 866,153 | Pool #CA6285, 2.50%, 7/1/50 | 892,429 | ||||||
25
SCHEDULE OF PORTFOLIO INVESTMENTS
|
Access Capital Community Investment Fund (cont.)
September 30, 2021
Principal Amount | Value | |||||||
| $ 1,773,450 | Pool #CA6966, 2.00%, 9/1/50 | $ | 1,778,333 | |||||
| 2,842,569 | Pool #CA6967, 2.00%, 9/1/50 | 2,850,396 | ||||||
| 1,813,185 | Pool #CA6968, 2.00%, 9/1/50 | 1,818,178 | ||||||
| 1,110,663 | Pool #CA6969, 2.00%, 9/1/50 | 1,113,721 | ||||||
| 1,565,478 | Pool #CA6971, 2.50%, 9/1/50 | 1,612,969 | ||||||
| 1,775,357 | Pool #CA6972, 2.50%, 8/1/50 | 1,829,215 | ||||||
| 1,031,595 | Pool #CA6973, 2.50%, 9/1/50 | 1,062,890 | ||||||
| 1,157,832 | Pool #CA7258, 2.50%, 9/1/50 | 1,192,957 | ||||||
| 1,218,520 | Pool #CA7259, 2.50%, 9/1/50 | 1,255,486 | ||||||
| 1,693,029 | Pool #CA7317, 2.00%, 10/1/50 | 1,697,825 | ||||||
| 1,869,350 | Pool #CA7549, 2.00%, 10/1/50 | 1,874,497 | ||||||
| 1,849,666 | Pool #CA7917, 2.00%, 11/1/50 | 1,863,117 | ||||||
| 1,110,514 | Pool #CA8069, 1.50%, 12/1/50 | 1,079,461 | ||||||
| 1,427,682 | Pool #CA8070, 2.00%, 12/1/50 | 1,431,726 | ||||||
| 3,883,498 | Pool #CA8077, 2.00%, 12/1/50 | 3,894,191 | ||||||
| 4,325,861 | Pool #CA8337, 1.50%, 12/1/50 | 4,204,897 | ||||||
| 4,888,410 | Pool #CA8340, 2.00%, 12/1/50 | 4,901,870 | ||||||
| 916,606 | Pool #CA8425, 1.50%, 12/1/50 | 890,975 | ||||||
| 1,295,641 | Pool #CA8432, 2.00%, 12/1/50 | 1,299,312 | ||||||
| 2,832,580 | Pool #CA8518, 2.00%, 1/1/51 | 2,840,605 | ||||||
| 1,430,929 | Pool #CA8685, 1.50%, 1/1/51 | 1,390,916 | ||||||
| 4,419,447 | Pool #CA8811, 2.00%, 1/1/51 | 4,431,615 | ||||||
| 5,022,570 | Pool #CA9048, 2.00%, 2/1/51 | 5,036,400 | ||||||
| 4,062,282 | Pool #CB0063, 2.50%, 4/1/51 | 4,188,498 | ||||||
| 346,756 | Pool #CB0245, 2.50%, 4/1/51 | 357,530 | ||||||
| 919,493 | Pool #CB0437, 2.50%, 5/1/51 | 948,061 | ||||||
| 652,513 | Pool #CB0480, 2.50%, 5/1/51 | 672,786 | ||||||
| 261,354 | Pool #CB0576, 2.50%, 5/1/51 | 269,474 | ||||||
| 274,372 | Pool #CB0582, 2.50%, 5/1/51 | 282,897 | ||||||
| 2,314,909 | Pool #CB0688, 2.50%, 6/1/51 | 2,387,882 | ||||||
| 492,206 | Pool #CB0689, 2.50%, 6/1/51 | 507,498 | ||||||
| 1,080,025 | Pool #CB0972, 2.50%, 6/1/51 | 1,113,581 | ||||||
| 505,012 | Pool #CB1003, 2.50%, 7/1/51 | 520,703 | ||||||
| 318,006 | Pool #CB1010, 2.50%, 7/1/51 | 327,887 | ||||||
| 1,433,453 | Pool #CB1060, 2.00%, 7/1/51 | 1,437,212 | ||||||
| 2,133,697 | Pool #CB1311, 2.50%, 8/1/51 | 2,200,122 | ||||||
| 2,116,697 | Pool #CB1444, 2.50%, 8/1/51 | 2,182,758 | ||||||
| 1,022,075 | Pool #CB1515, 2.50%, 8/1/51 | 1,053,973 | ||||||
| 1,796,063 | Pool #CB1532, 2.50%, 9/1/51 | 1,852,117 | ||||||
| 10,136,567 | Pool #CB1575, 2.50%, 9/1/51 | 10,452,922 | ||||||
| 49,749 | Pool #MC0013, 5.50%, 12/1/38 | 53,840 | ||||||
| 80,556 | Pool #MC0014, 5.50%, 12/1/38 | 88,246 | ||||||
| 66,561 | Pool #MC0016, 5.50%, 11/1/38 | 72,437 | ||||||
| 63,879 | Pool #MC0038, 4.50%, 3/1/39 | 71,643 | ||||||
| 44,044 | Pool #MC0059, 4.00%, 4/1/39 | 49,111 | ||||||
| 78,101 | Pool #MC0081, 4.00%, 5/1/39 | 86,542 | ||||||
| 41,664 | Pool #MC0112, 4.50%, 6/1/39 | 46,729 | ||||||
| 83,502 | Pool #MC0127, 4.50%, 7/1/39 | 93,239 | ||||||
26
SCHEDULE OF PORTFOLIO INVESTMENTS
|
Access Capital Community Investment Fund (cont.)
September 30, 2021
Principal Amount | Value | |||||||
| $ 461,569 | Pool #MC0154, 4.50%, 8/1/39 | $ | 515,391 | |||||
| 83,756 | Pool #MC0160, 4.50%, 8/1/39 | 93,523 | ||||||
| 201,334 | Pool #MC0177, 4.50%, 9/1/39 | 224,810 | ||||||
| 114,298 | Pool #MC0270, 4.50%, 3/1/40 | 125,720 | ||||||
| 259,234 | Pool #MC0325, 4.50%, 7/1/40 | 289,280 | ||||||
| 145,875 | Pool #MC0584, 4.00%, 1/1/42 | 160,402 | ||||||
| 58,587 | Pool #MC3344, 5.00%, 12/1/38 | 66,716 | ||||||
|
| |||||||
| 320,603,486 | ||||||||
|
| |||||||
Freddie Mac—34.24% | ||||||||
| 434,958 | Pool #Q63813, 3.50%, 4/1/49 | 463,682 | ||||||
| 943,928 | Pool #QB5148, 2.00%, 11/1/50 | 946,479 | ||||||
| 1,403,868 | Pool #QB5731, 2.00%, 11/1/50 | 1,407,732 | ||||||
| 2,215,707 | Pool #QB5732, 2.50%, 11/1/50 | 2,282,889 | ||||||
| 1,764,998 | Pool #QB6982, 2.00%, 11/1/50 | 1,769,857 | ||||||
| 531,453 | Pool #QB6992, 1.50%, 12/1/50 | 516,595 | ||||||
| 1,333,326 | Pool #QC4676, 2.50%, 7/1/51 | 1,374,753 | ||||||
| 1,190,581 | Pool #QC6090, 2.50%, 8/1/51 | 1,227,646 | ||||||
| 1,758,151 | Pool #QC6108, 2.50%, 8/1/51 | 1,813,021 | ||||||
| 1,068,630 | Pool #QC6643, 2.50%, 8/1/51 | 1,101,981 | ||||||
| 498,940 | Pool #RA1234, 3.50%, 8/1/49 | 528,885 | ||||||
| 829,001 | Pool #RA1382, 3.00%, 9/1/49 | 866,411 | ||||||
| 1,667,210 | Pool #RA1383, 3.00%, 9/1/49 | 1,742,445 | ||||||
| 778,623 | Pool #RA1470, 3.00%, 10/1/49 | 813,760 | ||||||
| 472,692 | Pool #RA1713, 3.00%, 11/1/49 | 494,023 | ||||||
| 686,121 | Pool #RA1714, 3.00%, 11/1/49 | 717,083 | ||||||
| 440,162 | Pool #RA1715, 3.00%, 10/1/49 | 460,025 | ||||||
| 919,608 | Pool #RA1716, 3.00%, 11/1/49 | 961,106 | ||||||
| 491,763 | Pool #RA1724, 2.50%, 10/1/49 | 506,494 | ||||||
| 527,417 | Pool #RA1979, 3.00%, 12/1/49 | 551,570 | ||||||
| 936,207 | Pool #RA1987, 3.00%, 12/1/49 | 979,145 | ||||||
| 1,579,514 | Pool #RA1988, 3.00%, 1/1/50 | 1,651,956 | ||||||
| 809,818 | Pool #RA2158, 3.00%, 2/1/50 | 846,438 | ||||||
| 1,001,764 | Pool #RA2162, 3.00%, 2/1/50 | 1,051,594 | ||||||
| 1,060,315 | Pool #RA2255, 3.00%, 3/1/50 | 1,108,263 | ||||||
| 1,591,699 | Pool #RA2256, 3.00%, 3/1/50 | 1,663,677 | ||||||
| 973,577 | Pool #RA2340, 3.00%, 3/1/50 | 1,017,603 | ||||||
| 406,305 | Pool #RA2395, 2.50%, 4/1/50 | 418,624 | ||||||
| 458,380 | Pool #RA3097, 2.50%, 7/1/50 | 473,340 | ||||||
| 1,665,841 | Pool #RA3207, 2.50%, 7/1/50 | 1,716,351 | ||||||
| 3,267,192 | Pool #RA3208, 2.50%, 7/1/50 | 3,366,256 | ||||||
| 5,592,656 | Pool #RA3249, 2.50%, 8/1/50 | 5,762,232 | ||||||
| 855,799 | Pool #RA3339, 2.00%, 8/1/50 | 858,155 | ||||||
| 1,438,825 | Pool #RA3552, 2.00%, 9/1/50 | 1,442,900 | ||||||
| 1,190,256 | Pool #RA3553, 2.50%, 8/1/50 | 1,226,346 | ||||||
| 3,979,692 | Pool #RA3679, 2.00%, 9/1/50 | 3,990,647 | ||||||
| 1,910,825 | Pool #RA3680, 2.50%, 9/1/50 | 1,968,763 | ||||||
| 817,846 | Pool #RA3711, 2.00%, 9/1/50 | 820,098 | ||||||
27
SCHEDULE OF PORTFOLIO INVESTMENTS
|
Access Capital Community Investment Fund (cont.)
September 30, 2021
Principal Amount | Value | |||||||
| $ 615,790 | Pool #RA3712, 2.50%, 9/1/50 | $ | 634,461 | |||||
| 547,530 | Pool #RA3733, 2.00%, 10/1/50 | 549,081 | ||||||
| 744,038 | Pool #RA3734, 2.50%, 10/1/50 | 766,598 | ||||||
| 869,373 | Pool #RA3747, 2.00%, 9/1/50 | 871,766 | ||||||
| 4,805,271 | Pool #RA3748, 2.50%, 10/1/50 | 4,950,973 | ||||||
| 1,897,007 | Pool #RA3751, 2.00%, 10/1/50 | 1,904,187 | ||||||
| 2,792,239 | Pool #RA3803, 1.50%, 12/1/50 | 2,714,173 | ||||||
| 409,543 | Pool #RA3861, 1.50%, 10/1/50 | 398,093 | ||||||
| 1,723,295 | Pool #RA3862, 2.00%, 10/1/50 | 1,728,039 | ||||||
| 1,970,905 | Pool #RA3917, 1.50%, 10/1/50 | 1,915,802 | ||||||
| 3,799,883 | Pool #RA3918, 2.00%, 10/1/50 | 3,810,344 | ||||||
| 846,631 | Pool #RA3928, 1.50%, 11/1/50 | 822,961 | ||||||
| 244,921 | Pool #RA3929, 2.00%, 10/1/50 | 246,166 | ||||||
| 585,798 | Pool #RA4018, 2.00%, 1/1/51 | 587,457 | ||||||
| 701,046 | Pool #RA4055, 2.00%, 11/1/50 | 702,976 | ||||||
| 735,885 | Pool #RA4056, 1.50%, 11/1/50 | 715,311 | ||||||
| 8,574,877 | Pool #RA4195, 2.00%, 12/1/50 | 8,598,482 | ||||||
| 6,208,242 | Pool #RA4254, 2.00%, 12/1/50 | 6,225,827 | ||||||
| 926,765 | Pool #RA4274, 1.50%, 12/1/50 | 900,854 | ||||||
| 1,390,403 | Pool #RA4357, 2.00%, 1/1/51 | 1,394,230 | ||||||
| 1,588,957 | Pool #RA4377, 2.00%, 2/1/51 | 1,594,971 | ||||||
| 2,539,298 | Pool #RA4420, 2.00%, 1/1/51 | 2,546,288 | ||||||
| 3,522,252 | Pool #RA4503, 2.00%, 2/1/51 | 3,531,948 | ||||||
| 908,750 | Pool #RA4548, 2.00%, 2/1/51 | 911,251 | ||||||
| 2,391,592 | Pool #RA4578, 2.00%, 2/1/51 | 2,397,861 | ||||||
| 473,853 | Pool #RA4590, 2.00%, 2/1/51 | 475,095 | ||||||
| 310,371 | Pool #RA4597, 2.00%, 2/1/51 | 311,225 | ||||||
| 259,184 | Pool #RA4618, 2.00%, 2/1/51 | 259,918 | ||||||
| 1,053,261 | Pool #RA4621, 2.00%, 2/1/51 | 1,056,022 | ||||||
| 1,764,328 | Pool #RA4738, 2.00%, 3/1/51 | 1,768,953 | ||||||
| 4,453,932 | Pool #RA4745, 2.00%, 3/1/51 | 4,465,607 | ||||||
| 1,454,449 | Pool #RA4775, 2.00%, 3/1/51 | 1,458,262 | ||||||
| 1,370,240 | Pool #RA4835, 2.50%, 3/1/51 | 1,412,813 | ||||||
| 2,715,901 | Pool #RA4872, 2.50%, 4/1/51 | 2,800,284 | ||||||
| 4,876,717 | Pool #RA4960, 2.50%, 4/1/51 | 5,028,237 | ||||||
| 8,603,767 | Pool #RA5020, 2.00%, 4/1/51 | 8,626,320 | ||||||
| 3,415,500 | Pool #RA5021, 1.50%, 4/1/51 | 3,317,838 | ||||||
| 420,043 | Pool #RA5043, 2.50%, 4/1/51 | 433,094 | ||||||
| 728,653 | Pool #RA5045, 2.50%, 5/1/51 | 751,292 | ||||||
| 3,117,108 | Pool #RA5068, 2.00%, 4/1/51 | 3,125,279 | ||||||
| 1,801,458 | Pool #RA5173, 2.50%, 4/1/51 | 1,857,429 | ||||||
| 1,079,397 | Pool #RA5195, 2.50%, 5/1/51 | 1,127,426 | ||||||
| 917,234 | Pool #RA5197, 2.50%, 5/1/51 | 945,733 | ||||||
| 1,567,089 | Pool #RA5217, 2.50%, 5/1/51 | 1,615,779 | ||||||
| 2,290,969 | Pool #RA5234, 2.50%, 5/1/51 | 2,362,150 | ||||||
| 1,153,424 | Pool #RA5237, 2.50%, 5/1/51 | 1,189,261 | ||||||
| 2,827,668 | Pool #RA5278, 2.50%, 5/1/51 | 2,915,524 | ||||||
| 2,349,302 | Pool #RA5350, 2.50%, 6/1/51 | 2,422,296 | ||||||
28
SCHEDULE OF PORTFOLIO INVESTMENTS
|
Access Capital Community Investment Fund (cont.)
September 30, 2021
Principal Amount | Value | |||||||
| $3,036,109 | Pool #RA5379, 2.50%, 6/1/51 | $ | 3,130,442 | |||||
| 3,587,310 | Pool #RA5380, 2.50%, 6/1/51 | 3,698,769 | ||||||
| 1,931,749 | Pool #RA5387, 2.50%, 6/1/51 | 2,003,226 | ||||||
| 247,064 | Pool #RA5404, 2.50%, 6/1/51 | 254,740 | ||||||
| 8,385,309 | Pool #RA5427, 2.50%, 6/1/51 | 8,645,842 | ||||||
| 2,437,606 | Pool #RA5452, 2.50%, 6/1/51 | 2,513,343 | ||||||
| 1,481,122 | Pool #RA5509, 2.50%, 7/1/51 | 1,527,140 | ||||||
| 528,538 | Pool #RA5525, 2.50%, 7/1/51 | 544,959 | ||||||
| 879,647 | Pool #RA5541, 2.50%, 7/1/51 | 906,978 | ||||||
| 2,354,136 | Pool #RA5597, 2.50%, 7/1/51 | 2,427,424 | ||||||
| 2,321,889 | Pool #RA5621, 2.50%, 8/1/51 | 2,394,173 | ||||||
| 248,866 | Pool #RA5686, 2.50%, 7/1/51 | 256,750 | ||||||
| 1,952,288 | Pool #RA5701, 2.00%, 8/1/51 | 1,957,872 | ||||||
| 3,391,459 | Pool #RA5726, 2.50%, 8/1/51 | 3,497,303 | ||||||
| 1,874,830 | Pool #RA5796, 2.50%, 8/1/51 | 1,933,342 | ||||||
| 1,966,523 | Pool #RA5873, 2.50%, 9/1/51 | 2,027,896 | ||||||
| 834,697 | Pool #RA5874, 2.50%, 9/1/51 | 860,812 | ||||||
| 175,000 | Pool #RA5951, 2.50%, 9/1/51 | 180,475 | ||||||
| 4,089,000 | Pool #RA6030, 2.50%, 10/1/51 | 4,216,931 | ||||||
| 1,536,355 | Pool #WA3103, 3.30%, 2/1/27 | 1,613,347 | ||||||
| 4,716,173 | Pool #WA3125, 1.75%, 10/1/34 | 4,629,960 | ||||||
| 989,310 | Pool #WA3211, 1.91%, 9/1/35 | 974,499 | ||||||
| 1,088,264 | Pool #WA3305, 1.75%, 6/1/37 | 1,036,215 | ||||||
| 969,966 | Pool #WA5002, 2.62%, 11/1/31 | 1,037,261 | ||||||
| 1,906,382 | Pool #WN3000, 3.14%, 1/1/28 | 2,080,087 | ||||||
| 1,000,000 | Pool #WN3049, 2.39%, 9/1/31 | 1,052,365 | ||||||
| 445,057 | Pool #ZA4828, 4.00%, 3/1/47 | 479,723 | ||||||
| 80,278 | Pool #ZA4891, 3.50%, 3/1/47 | 87,633 | ||||||
| 657,023 | Pool #ZA4892, 4.00%, 5/1/47 | 708,199 | ||||||
| 690,664 | Pool #ZA4893, 3.50%, 4/1/47 | 740,909 | ||||||
| 923,411 | Pool #ZA4912, 3.50%, 5/1/47 | 982,470 | ||||||
| 642,386 | Pool #ZA4913, 4.00%, 5/1/47 | 692,422 | ||||||
| 633,385 | Pool #ZA5036, 3.50%, 9/1/47 | 673,894 | ||||||
| 1,142,384 | Pool #ZA5070, 3.50%, 11/1/47 | 1,225,491 | ||||||
| 162,764 | Pool #ZA5090, 3.50%, 11/1/47 | 174,977 | ||||||
| 1,094,757 | Pool #ZA5174, 3.50%, 12/1/47 | 1,164,775 | ||||||
| 1,801,475 | Pool #ZA5238, 3.50%, 2/1/48 | 1,916,693 | ||||||
| 691,178 | Pool #ZA5245, 3.50%, 1/1/48 | 735,384 | ||||||
| 1,492,436 | Pool #ZA5253, 3.50%, 1/1/48 | 1,595,546 | ||||||
| 744,182 | Pool #ZA5254, 4.00%, 1/1/48 | 806,864 | ||||||
| 609,797 | Pool #ZA5308, 4.00%, 1/1/48 | 657,294 | ||||||
| 787,532 | Pool #ZA5575, 4.00%, 7/1/48 | 845,170 | ||||||
| 1,027,747 | Pool #ZA5637, 4.50%, 8/1/48 | 1,110,145 | ||||||
| 919,765 | Pool #ZA5645, 4.00%, 8/1/48 | 985,224 | ||||||
| 146,484 | Pool #ZA6576, 3.50%, 4/1/49 | 156,578 | ||||||
| 102,549 | Pool #ZI0238, 5.00%, 6/1/33 | 115,978 | ||||||
| 177,476 | Pool #ZI0412, 5.00%, 8/1/33 | 200,716 | ||||||
29
SCHEDULE OF PORTFOLIO INVESTMENTS
|
Access Capital Community Investment Fund (cont.)
September 30, 2021
Principal Amount | Value | |||||||
| $ 69,442 | Pool #ZI0543, 4.50%, 8/1/33 | $ | 77,300 | |||||
| 49,055 | Pool #ZI0549, 5.00%, 8/1/33 | 55,479 | ||||||
| 99,980 | Pool #ZI0807, 5.00%, 9/1/33 | 113,072 | ||||||
| 117,902 | Pool #ZI1023, 5.50%, 11/1/33 | 130,793 | ||||||
| 17,504 | Pool #ZI1352, 5.50%, 12/1/33 | 17,713 | ||||||
| 92,741 | Pool #ZI1353, 5.50%, 1/1/34 | 102,809 | ||||||
| 139,638 | Pool #ZI1493, 5.50%, 1/1/34 | 154,084 | ||||||
| 147,412 | Pool #ZI1524, 5.50%, 2/1/34 | 164,550 | ||||||
| 70,892 | Pool #ZI1630, 5.50%, 3/1/34 | 76,886 | ||||||
| 159,585 | Pool #ZI1689, 5.50%, 4/1/34 | 176,989 | ||||||
| 76,719 | Pool #ZI1802, 5.50%, 4/1/34 | 80,878 | ||||||
| 140,868 | Pool #ZI1991, 5.00%, 5/1/34 | 160,459 | ||||||
| 131,814 | Pool #ZI2332, 5.00%, 6/1/34 | 150,146 | ||||||
| 46,743 | Pool #ZI2333, 5.00%, 6/1/34 | 53,244 | ||||||
| 157,439 | Pool #ZI2888, 6.00%, 12/1/34 | 177,010 | ||||||
| 206,838 | Pool #ZI2939, 5.50%, 12/1/34 | 231,940 | ||||||
| 128,624 | Pool #ZI3102, 5.00%, 1/1/35 | 146,512 | ||||||
| 84,908 | Pool #ZI3254, 5.50%, 4/1/35 | 93,638 | ||||||
| 180,228 | Pool #ZI3507, 5.00%, 9/1/35 | 205,117 | ||||||
| 108,726 | Pool #ZI3713, 5.00%, 5/1/35 | 123,741 | ||||||
| 82,201 | Pool #ZI4118, 5.50%, 1/1/36 | 89,486 | ||||||
| 96,700 | Pool #ZI4119, 5.00%, 1/1/36 | 110,054 | ||||||
| 146,537 | Pool #ZI4120, 5.50%, 1/1/36 | 160,468 | ||||||
| 208,669 | Pool #ZI4200, 5.50%, 2/1/36 | 234,230 | ||||||
| 87,247 | Pool #ZI4201, 6.00%, 2/1/36 | 95,431 | ||||||
| 234,612 | Pool #ZI4429, 5.00%, 6/1/35 | 267,012 | ||||||
| 59,788 | Pool #ZI4521, 5.50%, 7/1/35 | 64,445 | ||||||
| 174,172 | Pool #ZI4572, 5.50%, 8/1/35 | 192,928 | ||||||
| 77,961 | Pool #ZI4605, 5.50%, 9/1/35 | 84,399 | ||||||
| 74,065 | Pool #ZI4606, 5.50%, 9/1/35 | 80,036 | ||||||
| 115,458 | Pool #ZI4704, 5.00%, 11/1/35 | 131,403 | ||||||
| 122,838 | Pool #ZI4705, 5.00%, 11/1/35 | 139,802 | ||||||
| 51,708 | Pool #ZI4706, 5.50%, 11/1/35 | 56,161 | ||||||
| 124,641 | Pool #ZI4855, 6.00%, 5/1/36 | 135,887 | ||||||
| 72,549 | Pool #ZI4882, 6.00%, 5/1/36 | 79,965 | ||||||
| 226,930 | Pool #ZI4979, 6.00%, 6/1/36 | 252,626 | ||||||
| 52,645 | Pool #ZI5006, 6.00%, 6/1/36 | 54,832 | ||||||
| 109,212 | Pool #ZI5896, 5.50%, 4/1/37 | 118,529 | ||||||
| 176,337 | Pool #ZI5912, 5.50%, 4/1/37 | 196,207 | ||||||
| 91,346 | Pool #ZI6311, 5.50%, 6/1/37 | 99,669 | ||||||
| 136,603 | Pool #ZI6583, 5.50%, 8/1/37 | 151,730 | ||||||
| 118,214 | Pool #ZI6598, 6.00%, 8/1/37 | 129,962 | ||||||
| 61,369 | Pool #ZI6814, 6.00%, 10/1/37 | 67,687 | ||||||
| 55,356 | Pool #ZI6976, 5.50%, 7/1/37 | 60,603 | ||||||
| 211,340 | Pool #ZI9925, 5.00%, 4/1/40 | 240,344 | ||||||
| 70,570 | Pool #ZJ0038, 4.50%, 5/1/40 | 78,729 | ||||||
| 337,422 | Pool #ZJ0482, 4.50%, 9/1/40 | 376,429 | ||||||
| 236,677 | Pool #ZJ0844, 4.00%, 12/1/40 | 260,282 | ||||||
30
SCHEDULE OF PORTFOLIO INVESTMENTS
|
Access Capital Community Investment Fund (cont.)
September 30, 2021
Principal Amount | Value | |||||||
| $ 126,339 | Pool #ZJ1058, 4.00%, 12/1/40 | $ | 138,939 | |||||
| 93,142 | Pool #ZJ1264, 4.00%, 1/1/41 | 103,232 | ||||||
| 348,800 | Pool #ZJ1444, 4.00%, 3/1/41 | 384,703 | ||||||
| 219,070 | Pool #ZJ1445, 4.50%, 3/1/41 | 244,357 | ||||||
| 21,999 | Pool #ZJ4162, 7.50%, 2/1/30 | 22,789 | ||||||
| 54,390 | Pool #ZJ5032, 6.50%, 5/1/31 | 59,172 | ||||||
| 40,556 | Pool #ZJ5104, 6.50%, 6/1/31 | 43,400 | ||||||
| 34,508 | Pool #ZJ5458, 6.50%, 11/1/31 | 36,852 | ||||||
| 33,423 | Pool #ZJ5928, 6.50%, 3/1/32 | 35,173 | ||||||
| 82,839 | Pool #ZJ6638, 6.00%, 11/1/32 | 92,006 | ||||||
| 66,812 | Pool #ZJ6955, 5.50%, 3/1/33 | 73,097 | ||||||
| 48,053 | Pool #ZJ6956, 5.50%, 3/1/33 | 51,574 | ||||||
| 87,469 | Pool #ZK4661, 2.50%, 11/1/27 | 91,269 | ||||||
| 437,470 | Pool #ZL2630, 3.50%, 12/1/41 | 473,940 | ||||||
| 340,248 | Pool #ZL2708, 3.50%, 1/1/42 | 368,613 | ||||||
| 1,053,963 | Pool #ZL5676, 3.00%, 4/1/43 | 1,124,136 | ||||||
| 415,341 | Pool #ZL6090, 3.00%, 6/1/43 | 442,994 | ||||||
| 351,210 | Pool #ZL6097, 3.00%, 6/1/43 | 374,593 | ||||||
| 674,790 | Pool #ZL9372, 3.00%, 4/1/45 | 717,863 | ||||||
| 365,512 | Pool #ZL9669, 3.50%, 6/1/45 | 392,125 | ||||||
| 211,552 | Pool #ZM1422, 3.50%, 7/1/46 | 226,737 | ||||||
| 522,256 | Pool #ZM1423, 3.50%, 7/1/46 | 556,605 | ||||||
| 598,792 | Pool #ZM1736, 3.00%, 9/1/46 | 634,403 | ||||||
| 1,294,840 | Pool #ZM1738, 3.00%, 9/1/46 | 1,368,495 | ||||||
| 718,267 | Pool #ZM8750, 4.00%, 9/1/48 | 769,386 | ||||||
| 519,980 | Pool #ZN1022, 4.00%, 11/1/48 | 561,194 | ||||||
| 19,010 | Pool #ZN5269, 6.50%, 10/1/31 | 19,455 | ||||||
| 45,939 | Pool #ZN5316, 5.00%, 5/1/34 | 52,328 | ||||||
| 70,550 | Pool #ZN5321, 5.50%, 5/1/34 | 76,343 | ||||||
| 42,984 | Pool #ZN5322, 5.50%, 5/1/34 | 46,086 | ||||||
| 50,658 | Pool #ZN5332, 5.00%, 11/1/34 | 57,703 | ||||||
| 28,620 | Pool #ZN5333, 5.50%, 11/1/34 | 29,563 | ||||||
| 814,937 | Series 2017-SB42, Class A10F, 2.96%, 10/25/27(a) | 847,612 | ||||||
| 2,299,013 | Series 2018-SB47, Class A10F, 3.35%, 1/25/28(a) | 2,415,292 | ||||||
| 398,773 | Series 2018-SB52, Class A10F, 3.48%, 6/25/28(a) | 414,748 | ||||||
| 949,142 | Series 2018-SB53, Class A10F, 3.66%, 6/25/28(a) | 1,020,090 | ||||||
| 373,526 | Series 2018-SB56, Class A10F, 3.70%, 10/25/28(a) | 392,300 | ||||||
| 1,624,570 | Series 2019-SB63, Class A10F, 2.78%, 3/25/29(a) | 1,692,052 | ||||||
| 682,492 | Series 2019-SB64, Class A10F, 2.71%, 5/25/29(a) | 709,116 | ||||||
| 1,724,340 | Series 2019-SB65, Class A5F, 1.99%, 5/25/24(a) | 1,767,992 | ||||||
| 813,564 | Series 2019-SB66, Class A5H, 2.32%, 6/25/39(a) | 838,915 | ||||||
| 1,985,095 | Series 2020-SB81, Class A10H, 1.26%, 10/25/40(a) | 1,922,909 | ||||||
| 3,098,134 | Series Q014, Class A1, 1.56%, 1/25/36 | 2,974,845 | ||||||
| 1,000,000 | Series-K158, Class A2, 3.90%, 12/25/30(a) | 1,169,069 | ||||||
|
| |||||||
| 255,848,759 | ||||||||
|
| |||||||
Ginnie Mae—7.38% | ||||||||
| 76,086 | Pool #409117, 5.50%, 6/20/38 | 82,306 | ||||||
31
SCHEDULE OF PORTFOLIO INVESTMENTS
|
Access Capital Community Investment Fund (cont.)
September 30, 2021
Principal Amount | Value | |||||||
| $196,685 | Pool #442423, 4.00%, 9/20/41 | $ | 216,662 | |||||
| 123,457 | Pool #616936, 5.50%, 1/15/36 | 143,461 | ||||||
| 815,417 | Pool #618363, 4.00%, 9/20/41 | 898,236 | ||||||
| 368,264 | Pool #664269, 5.85%, 6/15/38 | 368,264 | ||||||
| 22,465 | Pool #675509, 5.50%, 6/15/38 | 23,551 | ||||||
| 148,232 | Pool #697672, 5.50%, 12/15/38 | 165,095 | ||||||
| 64,934 | Pool #697814, 5.00%, 2/15/39 | 69,832 | ||||||
| 327,535 | Pool #697885, 4.50%, 3/15/39 | 365,290 | ||||||
| 100,622 | Pool #698112, 4.50%, 5/15/39 | 113,685 | ||||||
| 469,382 | Pool #698113, 4.50%, 5/15/39 | 530,318 | ||||||
| 47,801 | Pool #699294, 5.63%, 9/20/38 | 51,900 | ||||||
| 904,780 | Pool #713519, 6.00%, 7/15/39 | 1,068,375 | ||||||
| 249,506 | Pool #716822, 4.50%, 4/15/39 | 282,154 | ||||||
| 61,762 | Pool #716823, 4.50%, 4/15/39 | 70,425 | ||||||
| 107,967 | Pool #717132, 4.50%, 5/15/39 | 121,983 | ||||||
| 319,652 | Pool #720080, 4.50%, 6/15/39 | 361,965 | ||||||
| 260,460 | Pool #724629, 5.00%, 7/20/40 | 298,346 | ||||||
| 342,948 | Pool #726550, 5.00%, 9/15/39 | 378,701 | ||||||
| 260,420 | Pool #729346, 4.50%, 7/15/41 | 296,699 | ||||||
| 317,019 | Pool #738844, 3.50%, 10/15/41 | 344,322 | ||||||
| 150,140 | Pool #738845, 3.50%, 10/15/41 | 163,071 | ||||||
| 342,101 | Pool #738862, 4.00%, 10/15/41 | 376,880 | ||||||
| 263,085 | Pool #747241, 5.00%, 9/20/40 | 301,354 | ||||||
| 569,445 | Pool #748654, 3.50%, 9/15/40 | 618,213 | ||||||
| 117,201 | Pool #748846, 4.50%, 9/20/40 | 131,505 | ||||||
| 279,937 | Pool #757016, 3.50%, 11/15/40 | 303,911 | ||||||
| 179,211 | Pool #757017, 4.00%, 12/15/40 | 197,328 | ||||||
| 270,613 | Pool #759297, 4.00%, 1/20/41 | 298,171 | ||||||
| 218,653 | Pool #759298, 4.00%, 2/20/41 | 240,920 | ||||||
| 150,312 | Pool #762877, 4.00%, 4/15/41 | 165,593 | ||||||
| 83,639 | Pool #763564, 4.50%, 5/15/41 | 96,012 | ||||||
| 182,593 | Pool #770481, 4.00%, 8/15/41 | 201,156 | ||||||
| 41,752 | Pool #770482, 4.50%, 8/15/41 | 48,175 | ||||||
| 304,577 | Pool #770517, 4.00%, 8/15/41 | 335,541 | ||||||
| 234,817 | Pool #770529, 4.00%, 8/15/41 | 258,689 | ||||||
| 50,594 | Pool #770537, 4.00%, 8/15/41 | 56,609 | ||||||
| 236,325 | Pool #770738, 4.50%, 6/20/41 | 264,919 | ||||||
| 167,360 | Pool #779592, 4.00%, 11/20/41 | 184,359 | ||||||
| 111,419 | Pool #779593, 4.00%, 11/20/41 | 122,735 | ||||||
| 423,429 | Pool #AA6312, 3.00%, 4/15/43 | 453,572 | ||||||
| 458,519 | Pool #AA6424, 3.00%, 5/15/43 | 491,160 | ||||||
| 851,942 | Pool #AB2733, 3.50%, 8/15/42 | 924,977 | ||||||
| 618,940 | Pool #AB2745, 3.00%, 8/15/42 | 663,164 | ||||||
| 792,737 | Pool #AB2841, 3.00%, 9/15/42 | 849,379 | ||||||
| 112,002 | Pool #AB2843, 3.00%, 9/15/42 | 121,394 | ||||||
| 112,784 | Pool #AB2852, 3.50%, 9/15/42 | 122,453 | ||||||
| 412,351 | Pool #AE6946, 3.00%, 6/15/43 | 443,330 | ||||||
| 76,343 | Pool #AG8915, 4.00%, 2/20/44 | 84,604 | ||||||
32
SCHEDULE OF PORTFOLIO INVESTMENTS
|
Access Capital Community Investment Fund (cont.)
September 30, 2021
Principal Amount | Value | |||||||
| $ 510,209 | Pool #AK6446, 3.00%, 1/15/45 | $ | 547,672 | |||||
| 404,169 | Pool #AK7036, 3.00%, 4/15/45 | 430,169 | ||||||
| 301,684 | Pool #AO3594, 3.50%, 8/20/45 | 322,156 | ||||||
| 157,996 | Pool #AP3887, 3.50%, 9/20/45 | 169,824 | ||||||
| 421,797 | Pool #AR4919, 3.50%, 3/20/46 | 449,100 | ||||||
| 489,296 | Pool #AR4970, 3.50%, 4/20/46 | 520,968 | ||||||
| 483,941 | Pool #AS2921, 3.50%, 4/20/46 | 517,134 | ||||||
| 371,535 | Pool #AS4332, 3.00%, 6/20/46 | 391,032 | ||||||
| 428,991 | Pool #AS5511, 3.50%, 3/20/46 | 456,760 | ||||||
| 787,414 | Pool #AX7237, 3.50%, 11/20/46 | 841,743 | ||||||
| 680,076 | Pool #BO2104, 3.00%, 8/20/49 | 717,351 | ||||||
| 1,537,640 | Pool #BR3787, 3.00%, 12/20/49 | 1,621,919 | ||||||
| 700,000 | Series 2012-100, Class B, 2.31%, 11/16/51(a) | 718,132 | ||||||
| 646,216 | Series 2012-107, Class A, 1.15%, 1/16/45 | 646,859 | ||||||
| 1,438,130 | Series 2012-112, Class B, 2.42%, 1/16/53(a) | 1,483,307 | ||||||
| 1,136,849 | Series 2012-115, Class A, 2.13%, 4/16/45 | 1,163,564 | ||||||
| 1,181,747 | Series 2012-120, Class A, 1.90%, 2/16/53 | 1,201,565 | ||||||
| 550,312 | Series 2012-131, Class A, 1.90%, 2/16/53 | 559,581 | ||||||
| 182,187 | Series 2012-144, Class AD, 1.77%, 1/16/53 | 185,073 | ||||||
| 1,020,419 | Series 2012-33, Class B, 2.89%, 3/16/46 | 1,029,985 | ||||||
| 31,233 | Series 2012-35, Class C, 3.25%, 11/16/52(a) | 32,057 | ||||||
| 1,780,646 | Series 2012-58, Class B, 2.20%, 3/16/44 | 1,788,964 | ||||||
| 252,441 | Series 2012-78, Class A, 1.68%, 3/16/44 | 253,332 | ||||||
| 314,415 | Series 2013-105, Class A, 1.71%, 2/16/37 | 316,616 | ||||||
| 156,755 | Series 2013-107, Class A, 2.00%, 5/16/40 | 158,136 | ||||||
| 204,200 | Series 2013-126, Class BK, 2.45%, 10/16/47(a) | 210,546 | ||||||
| 31,739 | Series 2013-17, Class A, 1.13%, 1/16/49 | 31,768 | ||||||
| 309,273 | Series 2013-29, Class AB, 1.77%, 10/16/45 | 312,828 | ||||||
| 206,145 | Series 2013-33, Class A, 1.06%, 7/16/38 | 206,315 | ||||||
| 794,372 | Series 2013-63, Class AB, 1.38%, 3/16/45 | 796,963 | ||||||
| 462,061 | Series 2013-97, Class AC, 2.00%, 6/16/45 | 472,091 | ||||||
| 101,512 | Series 2014-82, Class AB, 2.40%, 5/16/45 | 102,512 | ||||||
| 48,459 | Series 2015-107, Class AB, 2.50%, 11/16/49 | 50,076 | ||||||
| 865,965 | Series 2015-114, Class AD, 2.50%, 11/15/51 | 891,742 | ||||||
| 245,534 | Series 2015-128, Class AD, 2.50%, 12/16/50 | 251,566 | ||||||
| 236,620 | Series 2015-130, Class AH, 2.90%, 8/16/47(a) | 241,797 | ||||||
| 1,139,819 | Series 2015-135, Class AC, 2.35%, 4/16/49 | 1,173,521 | ||||||
| 575,891 | Series 2015-136, Class AC, 2.50%, 3/16/47 | 594,773 | ||||||
| 225,502 | Series 2015-15, Class A, 2.00%, 11/16/48 | 230,375 | ||||||
| 657,210 | Series 2015-154, Class AD, 2.50%, 5/16/54 | 678,999 | ||||||
| 459,226 | Series 2015-171, Class DA, 2.37%, 3/16/46 | 473,069 | ||||||
| 425,946 | Series 2015-22, Class A, 2.40%, 8/16/47 | 435,733 | ||||||
| 656,435 | Series 2015-70, Class AB, 2.30%, 11/16/48 | 675,023 | ||||||
| 130,491 | Series 2015-98, Class AB, 2.20%, 11/16/43 | 133,049 | ||||||
| 194,121 | Series 2016-11, Class AD, 2.25%, 11/16/43 | 197,636 | ||||||
| 349,475 | Series 2016-14, Class AB, 2.15%, 8/16/42 | 356,145 | ||||||
| 1,145,642 | Series 2016-152, Class EA, 2.20%, 8/15/58 | 1,165,165 | ||||||
33
SCHEDULE OF PORTFOLIO INVESTMENTS
|
Access Capital Community Investment Fund (cont.)
September 30, 2021
Principal Amount | Value | |||||||
| $1,650,845 | Series 2016-157, Class AC, 2.00%, 11/16/50 | $ | 1,678,305 | |||||
| 261,108 | Series 2016-26, Class A, 2.25%, 12/16/55 | 266,086 | ||||||
| 268,308 | Series 2016-28, Class AB, 2.40%, 11/16/55 | 273,870 | ||||||
| 155,806 | Series 2016-36, Class AB, 2.30%, 6/16/56 | 159,116 | ||||||
| 447,556 | Series 2016-39, Class AH, 2.50%, 9/16/44 | 461,015 | ||||||
| 283,801 | Series 2016-50, Class A, 2.30%, 7/16/52 | 289,847 | ||||||
| 990,460 | Series 2016-64, Class CA, 2.30%, 3/16/45 | 1,017,155 | ||||||
| 141,969 | Series 2016-67, Class A, 2.30%, 7/16/56 | 143,581 | ||||||
| 243,588 | Series 2016-94, Class AC, 2.20%, 8/16/57 | 248,719 | ||||||
| 315,936 | Series 2016-96, Class BA, 1.95%, 3/16/43 | 320,945 | ||||||
| 554,805 | Series 2017-127, Class AB, 2.50%, 2/16/59 | 570,700 | ||||||
| 913,270 | Series 2017-135, Class AE, 2.60%, 10/16/58 | 942,882 | ||||||
| 332,803 | Series 2017-140, Class A, 2.50%, 2/16/59 | 341,920 | ||||||
| 137,499 | Series 2017-157, Class AH, 2.55%, 2/16/53 | 142,037 | ||||||
| 1,081,895 | Series 2017-41, Class AC, 2.25%, 3/16/57 | 1,111,364 | ||||||
| 621,280 | Series 2017-46, Class A, 2.50%, 11/16/57 | 638,224 | ||||||
| 967,448 | Series 2017-71, Class AS, 2.70%, 4/16/57 | 1,001,846 | ||||||
| 376,186 | Series 2017-9, Class AE, 2.40%, 9/16/50 | 387,819 | ||||||
| 1,696,032 | Series 2017-94, Class AH, 2.60%, 2/16/59 | 1,752,888 | ||||||
| 605,082 | Series 2018-2, Class AD, 2.40%, 3/16/59 | 623,798 | ||||||
| 418,931 | Series 2018-26, Class AD, 2.50%, 3/16/52 | 431,880 | ||||||
| 1,335,312 | Series 2018-3, Class AG, 2.50%, 10/16/58 | 1,378,481 | ||||||
|
| |||||||
| 55,157,913 | ||||||||
|
| |||||||
| | Total U.S. Government Agency Backed Mortgages (Cost $624,561,849) | 631,610,158 | ||||||
|
| |||||||
U.S. Government Agency Obligations — 7.19% | ||||||||
Small Business Administration — 7.19% | ||||||||
| 135,965 | Certificate of Originator’s Fee, 0.23%, 4/15/31(b) | 971 | ||||||
| 179,855 | (Prime Index - 2.600%), 0.65%, 7/25/41(c) | 180,368 | ||||||
| 337,469 | (Prime Index - 2.600%), 0.65%, 9/25/41(c) | 338,432 | ||||||
| 267,544 | (Prime Index - 2.600%), 0.65%, 9/25/41(c) | 269,476 | ||||||
| 393,066 | (Prime Index - 2.600%), 0.65%, 7/25/42(c) | 396,002 | ||||||
| 1,182,468 | (Prime Index - 2.550%), 0.70%, 7/25/42(c) | 1,192,741 | ||||||
| 283,738 | (Prime Index - 2.525%), 0.73%, 11/25/41(c) | 285,903 | ||||||
| 485,387 | (Prime Index - 2.500%), 0.75%, 2/25/28(c) | 488,502 | ||||||
| 25,419 | 0.88%, 1/1/32(a),(b) | 26,446 | ||||||
| 560,469 | Certificate of Originator’s Fee, 0.98%, 4/15/31(b) | 17,059 | ||||||
| 304,864 | Certificate of Originator’s Fee, 1.23%, 3/15/31(b) | 11,647 | ||||||
| 749,754 | Certificate of Originator’s Fee, 1.23%, 4/15/31(b) | 28,642 | ||||||
| 404,145 | Certificate of Originator’s Fee, 1.23%, 5/15/31(b) | 15,439 | ||||||
| 243,399 | Certificate of Originator’s Fee, 1.23%, 5/15/31(b) | 9,298 | ||||||
| 2,936,379 | 1.26%, 7/18/30(b),(d),(e) | 48,368 | ||||||
| 801,882 | (Prime Index - 1.400%), 1.85%, 7/25/41(c) | 838,985 | ||||||
| 1,736,044 | (Prime Index - 0.675%), 2.58%, 9/25/43(c) | 1,856,343 | ||||||
| 4,879,079 | (Prime Index - 0.675%), 2.58%, 11/25/45(c) | 5,284,401 | ||||||
| 3,507,547 | (Prime Index - 0.675%), 2.58%, 1/25/46(c) | 3,807,893 | ||||||
34
SCHEDULE OF PORTFOLIO INVESTMENTS
|
Access Capital Community Investment Fund (cont.)
September 30, 2021
Principal Amount | Value | |||||||
| $ 266,302 | (Prime Index - 0.437%), 2.81%, 11/25/27(c) | $ | 274,988 | |||||
| 1,352,925 | (Prime Index - 0.356%), 2.89%, 12/25/45(c) | 1,493,208 | ||||||
| 237,569 | (Prime Index - 0.210%), 3.04%, 2/25/40(c) | 251,328 | ||||||
| 478,042 | (Prime Index - 0.074%), 3.18%, 7/25/29(c) | 497,899 | ||||||
| 95,028 | (Prime Index + 0.048%), 3.30%, 12/25/40(c) | 102,552 | ||||||
| 547,273 | 3.36%, 7/8/24(b),(f) | 566,109 | ||||||
| 563,859 | (Prime Index + 0.114%), 3.36%, 8/25/29(c) | 588,778 | ||||||
| 673,883 | (Prime Index + 0.117%), 3.37%, 1/25/46(c) | 750,128 | ||||||
| 399,221 | (Prime Index + 0.138%), 3.39%, 6/25/29(c) | 416,939 | ||||||
| 487,155 | (Prime Index + 0.194%), 3.44%, 11/25/28(c) | 505,898 | ||||||
| 98,543 | (Prime Index + 0.325%), 3.58%, 10/25/30(c) | 106,312 | ||||||
| 3,056,441 | (Prime Index + 0.325%), 3.58%, 11/25/30(c) | 3,321,229 | ||||||
| 1,481,938 | (Prime Index + 0.325%), 3.58%, 6/25/31(c) | 1,639,693 | ||||||
| 2,046,842 | (Prime Index + 0.325%), 3.58%, 7/25/31(c) | 2,266,227 | ||||||
| 710,428 | (Prime Index + 0.325%), 3.58%, 2/25/45(c) | 789,049 | ||||||
| 967,535 | (Prime Index + 0.325%), 3.58%, 8/25/46(c) | 1,089,742 | ||||||
| 96,076 | (Prime Index + 0.355%), 3.61%, 2/25/26(c) | 99,195 | ||||||
| 2,427,431 | (Prime Index + 0.375%), 3.63%, 5/25/31(c) | 2,671,281 | ||||||
| 2,790,688 | (Prime Index + 0.569%), 3.82%, 12/25/45(c) | 3,156,915 | ||||||
| 1,457,469 | (Prime Index + 0.575%), 3.83%, 4/25/31(c) | 1,608,662 | ||||||
| 304,431 | 3.85%, 9/16/34(a),(b) | 325,307 | ||||||
| 55,025 | (Prime Index + 0.642%), 3.89%, 8/25/27(c) | 56,971 | ||||||
| 1,057,546 | (Prime Index + 0.668%), 3.92%, 11/25/30(c) | 1,147,795 | ||||||
| 71,777 | (Prime Index + 0.700%), 3.95%, 2/25/28(c) | 75,729 | ||||||
| 576,897 | (Prime Index + 0.709%), 3.96%, 3/25/30(c) | 613,809 | ||||||
| 533,344 | (TBA), 4.00%, 9/1/31(b) | 605,494 | ||||||
| 267,797 | (Prime Index + 0.772%), 4.02%, 3/25/29(c) | 279,887 | ||||||
| 630,516 | (Prime Index + 0.776%), 4.03%, 5/25/29(c) | 659,649 | ||||||
| 426,617 | (Prime Index + 0.794%), 4.04%, 2/25/28(c) | 450,762 | ||||||
| 303,725 | (Prime Index + 0.793%), 4.04%, 9/25/28(c) | 318,484 | ||||||
| 595,878 | (Prime Index + 0.822%), 4.07%, 6/25/29(c) | 628,152 | ||||||
| 113,035 | (Prime Index + 0.827%), 4.08%, 6/25/28(c) | 117,713 | ||||||
| 1,935,159 | (Prime Index + 0.825%), 4.08%, 9/25/31(c) | 2,167,684 | ||||||
| 448,001 | (Prime Index + 0.846%), 4.10%, 2/25/29(c) | 470,525 | ||||||
| 174,792 | (Prime Index + 0.852%), 4.10%, 3/25/31(c) | 193,030 | ||||||
| 178,402 | (Prime Index + 0.863%), 4.11%, 2/25/30(c) | 189,610 | ||||||
| 304,081 | (Prime Index + 0.897%), 4.15%, 8/25/30(c) | 330,738 | ||||||
| 409,959 | (Prime Index + 0.913%), 4.16%, 7/25/30(c) | 438,502 | ||||||
| 89,798 | (Prime Index + 0.929%), 4.18%, 7/25/29(c) | 96,120 | ||||||
| 1,196,620 | (Prime Index + 0.925%), 4.18%, 12/25/30(c) | 1,317,958 | ||||||
| 246,623 | (Prime Index + 0.944%), 4.19%, 5/25/29(c) | 263,490 | ||||||
| 112,200 | (Prime Index + 0.946%), 4.20%, 1/25/29(c) | 117,867 | ||||||
| 296,386 | (Prime Index + 0.956%), 4.21%, 7/25/29(c) | 312,737 | ||||||
| 254,922 | (Prime Index + 0.984%), 4.23%, 1/25/31(c) | 281,416 | ||||||
| 73,909 | (Prime Index + 1.001%), 4.25%, 11/25/28(c) | 78,618 | ||||||
| 345,780 | (Prime Index + 1.028%), 4.28%, 2/25/31(c) | 382,660 | ||||||
| 184,194 | (Prime Index + 1.056%), 4.31%, 9/25/29(c) | 197,839 | ||||||
35
SCHEDULE OF PORTFOLIO INVESTMENTS
|
Access Capital Community Investment Fund (cont.)
September 30, 2021
Principal Amount | Value | |||||||
| $ 288,158 | (Prime Index + 1.062%), 4.31%, 12/25/29(c) | $ | 310,214 | |||||
| 211,097 | (Prime Index + 1.069%), 4.32%, 6/25/30(c) | 229,909 | ||||||
| 560,810 | (Prime Index + 1.148%), 4.40%, 9/25/28(c) | 589,773 | ||||||
| 53,110 | (Prime Index + 1.203%), 4.45%, 11/25/26(c) | 55,741 | ||||||
| 312,574 | (Prime Index + 1.207%), 4.46%, 5/25/29(c) | 330,084 | ||||||
| 142,820 | (Prime Index + 1.225%), 4.48%, 6/25/29(c) | 153,337 | ||||||
| 604,811 | (Prime Index + 1.265%), 4.52%, 6/25/31(c) | 681,058 | ||||||
| 95,944 | (Prime Index + 1.283%), 4.53%, 10/25/31(c) | 108,470 | ||||||
| 422,820 | (Prime Index + 1.575%), 4.83%, 7/25/30(c) | 467,236 | ||||||
| 37,307 | (Prime Index + 1.605%), 4.86%, 7/25/28(c) | 39,389 | ||||||
| 26,620 | 5.13%, 2/28/24(b) | 27,427 | ||||||
| 108,205 | (Prime Index + 2.325%), 5.58%, 10/25/30(c) | 121,948 | ||||||
| 242,876 | (Prime Index + 2.325%), 5.58%, 1/25/31(c) | 276,361 | ||||||
| 123,162 | 6.08%, 12/19/29(a),(b) | 139,745 | ||||||
| 159,726 | 6.58%, 4/8/29(b),(c) | 183,289 | ||||||
| 396,208 | 7.08%, 7/25/30(b) | 437,588 | ||||||
| 86,794 | 9.08%, 9/25/29(b) | 101,304 | ||||||
| 93,855 | 9.88%, 6/7/29(b) | 105,048 | ||||||
|
| |||||||
| 53,769,515 | ||||||||
|
| |||||||
| | Total U.S. Government Agency Obligations (Cost $54,562,823) | 53,769,515 | ||||||
|
| |||||||
Municipal Bonds — 3.80% | ||||||||
California — 1.94% | ||||||||
| 6,375,000 | California Health Facilities Financing Authority Revenue, 2.70%, 6/1/30, Callable 6/1/29 @ 100 | 6,668,314 | ||||||
| 2,000,000 | California Health Facilities Financing Authority Revenue, 2.93%, 6/1/32, Callable 6/1/29 @ 100 | 2,098,220 | ||||||
| 860,000 | California Statewide Communities Development Authority Revenue, Series B, 5.25%, 10/20/42, (Credit Support: Ginnie Mae), Callable 11/1/21 @ 100 | 861,737 | ||||||
| 200,000 | City & County of San Francisco GO, Series C, 1.95%, 6/15/27 | 206,648 | ||||||
| 1,790,000 | City & County of San Francisco GO, Series A, 1.78%, 6/15/29 | 1,801,528 | ||||||
| 1,000,000 | City & County of San Francisco Affordable Housing GO, Series F, 2.39%, 6/15/26 | 1,058,340 | ||||||
| 1,675,000 | City of Los Angeles Housing GO, Series A, 2.95%, 9/1/28, Callable 9/1/27 @ 100 | 1,794,092 | ||||||
|
| |||||||
| 14,488,879 | ||||||||
|
| |||||||
Colorado — 0.03% | ||||||||
| 249,608 | Colorado Housing & Finance Authority Revenue, Series V, 3.40%, 11/1/45, (Credit Support: FHA) | 241,715 | ||||||
|
| |||||||
District of Columbia — 0.10% | ||||||||
| 711,208 | District of Columbia Housing Finance Agency Refunding Revenue, 3.24%, 3/1/49, (Credit Support: FHA) | 715,724 | ||||||
|
| |||||||
36
SCHEDULE OF PORTFOLIO INVESTMENTS
|
Access Capital Community Investment Fund (cont.)
September 30, 2021
Principal Amount | Value | |||||||
Georgia — 0.14% | ||||||||
| $1,000,000 | Atlanta Development Authority Revenue, 2.87%, 12/1/26 | $ | 1,078,170 | |||||
|
| |||||||
Illinois — 0.11% | ||||||||
| 260,000 | City of Chicago Multi Family Revenue, Mercy Preservation Project, 4.55%, 8/1/26, (Credit Support: Freddie Mac), Callable 11/1/21 @ 100 | 260,793 | ||||||
| 546,751 | Illinois State Housing Development Authority Revenue, Series A, 2.63%, 3/1/48, (Credit Support: FHA) | 573,099 | ||||||
|
| |||||||
| 833,892 | ||||||||
|
| |||||||
Minnesota — 0.07% | ||||||||
| 475,109 | City of Minnetonka Housing Revenue, Series A, 3.00%, 11/1/34, (Credit Support: Fannie Mae) | 514,168 | ||||||
|
| |||||||
Missouri — 0.40% | ||||||||
| 2,877,431 | Missouri Housing Development Commission Revenue, Series 1, 3.75%, 3/1/42, (Credit Support: FHA), Callable 3/1/25 @ 100 | 2,979,551 | ||||||
|
| |||||||
New York — 0.84% | ||||||||
| 400,000 | New York City Housing Development Corp. Revenue, Series G, 1.93%, 11/1/21 | 400,548 | ||||||
| 170,000 | New York City Housing Development Corp. Revenue, Series G, 2.04%, 5/1/22 | 171,883 | ||||||
| 100,000 | New York City Housing Development Corp. Revenue, Series G, 2.14%, 11/1/22 | 102,109 | ||||||
| 200,000 | New York City Housing Development Corp. Revenue, Series G, 2.37%, 5/1/24 | 208,904 | ||||||
| 40,000 | New York City Housing Development Corp. Revenue, Series G, 2.47%, 11/1/24 | 42,035 | ||||||
| 300,000 | New York City Housing Development Corp. Revenue, Series B, 1.02%, 5/1/26 | 296,094 | ||||||
| 300,000 | New York City Housing Development Corp. Revenue, Series G, 2.62%, 5/1/26, Callable 11/1/25 @ 100 | 315,780 | ||||||
| 200,000 | New York City Housing Development Corp. Revenue, Series B, 1.12%, 11/1/26 | 196,904 | ||||||
| 500,000 | New York City Housing Development Corp. Revenue, Series B, 3.56%, 11/1/26, Callable 2/1/26 @ 100 | 545,390 | ||||||
| 160,000 | New York City Housing Development Corp. Revenue, Series B, 1.38%, 5/1/27 | 158,133 | ||||||
| 250,000 | New York City Housing Development Corp. Revenue, Series B, 1.48%, 11/1/27 | 246,405 | ||||||
| 1,000,000 | New York City Housing Development Corp. Revenue, Series B, 3.61%, 11/1/27, Callable 2/1/26 @ 100 | 1,079,370 | ||||||
| 500,000 | New York City Housing Development Corp. Revenue, State of New York Mortgage Agency, 3.33%, 2/1/28, (Credit Support: SONYMA), Callable 8/1/25 @ 100 | 532,550 | ||||||
| 500,000 | New York City Housing Development Corp. Revenue, Series B, 3.81%, 11/1/29, Callable 2/1/26 @ 100 | 532,580 | ||||||
37
SCHEDULE OF PORTFOLIO INVESTMENTS
|
Access Capital Community Investment Fund (cont.)
September 30, 2021
Principal Amount | Value | |||||||
| $ 455,000 | New York State Housing Finance Agency Revenue, Series A, 4.50%, 11/15/27, Callable 11/1/21 @ 100 | $ | 456,356 | |||||
| 1,000,000 | New York State Housing Finance Agency Revenue, Series A, 4.65%, 11/15/38, Callable 11/1/21 @ 100 | 1,002,410 | ||||||
|
| |||||||
| 6,287,451 | ||||||||
|
| |||||||
Oregon — 0.03% | ||||||||
| 250,000 | State of Oregon GO, Series D, 1.19%, 5/1/26 | 251,908 | ||||||
|
| |||||||
Vermont — 0.02% | ||||||||
| 100,000 | Vermont Housing Finance Agency Revenue, 3.45%, 11/1/29 | 111,268 | ||||||
|
| |||||||
Washington — 0.12% | ||||||||
| 800,000 | City of Seattle WA GO, Series B, 3.38%, 12/1/28, Callable 12/1/27 @ 100 | 886,080 | ||||||
|
| |||||||
| | Total Municipal Bonds (Cost $27,453,678) | | 28,388,806 | | ||||
|
| |||||||
Corporate Bonds — 0.21% | ||||||||
Consumer, Non-cyclical — 0.04% | ||||||||
| 285,000 | Montefiore Medical Center, 2.15%, 10/20/26 | 289,490 | ||||||
|
| |||||||
Financial — 0.17% | ||||||||
| 1,250,000 | Century Housing Corp., Series 2019, 4.00%, 11/1/21 | 1,253,239 | ||||||
|
| |||||||
| | Total Corporate Bonds (Cost $1,535,000) | 1,542,729 | ||||||
|
| |||||||
| Shares | ||||||||
|
| |||||||
Investment Company — 4.12% | ||||||||
| 30,836,880 | U.S. Government Money Market Fund, RBC Institutional Class 1(g) | 30,836,880 | ||||||
|
| |||||||
| | Total Investment Company (Cost $30,836,880) | | 30,836,880 | | ||||
|
| |||||||
|
| Total Investments
(Cost $738,950,230)(h) — 99.85% | $
| 746,148,088
|
| ||||
|
| |||||||
Other assets in excess of liabilities — 0.15% | 1,089,545 | |||||||
|
| |||||||
NET ASSETS — 100.00% | $ | 747,237,633 | ||||||
|
| |||||||
38
SCHEDULE OF PORTFOLIO INVESTMENTS
|
Access Capital Community Investment Fund (cont.)
September 30, 2021
| (a) | Variable or floating rate security, which interest rate adjusts periodically based on changes in current interest rates and prepayments on the underlying pool of assets. Rate shown is the rate in effect as of period end. |
| (b) | The Pricing Committee has fair valued this security under procedures established by the Fund’s Board of Trustees. |
| (c) | Floating rate note. Rate shown is as of report date. |
| (d) | Interest Only represents the right to receive the monthly interest payment on an underlying pool of mortgage loans. The principal amount shown represents the par value on the underlying pool. |
| (e) | Security is valued using significant unobservable inputs and is classified as Level 3 in the fair value hierarchy. |
| (f) | Variable rate security. The rate reflected in the Schedule of Portfolio Investments is the rate in effect on September 30, 2021. |
| (g) | Affiliated investment. |
| (h) | See Notes to Schedules of Portfolio Investments for the tax cost of securities and the breakdown of unrealized appreciation (depreciation). |
Financial futures contracts as of September 30, 2021:
Short Position | Number of Contracts | Expiration Date | Value/Unrealized Appreciation | Notional Value | Clearinghouse | |||||||||||||||||
| 10 Year U.S. Ultra Treasury Bond | 245 | December 2021 | $ 627,836 | USD | $ | 35,586,250 | Barclays Capital Group | |||||||||||||||
| 30 Year U.S. Treasury Bond | 70 | December 2021 | 263,958 | USD | 11,145,313 | Barclays Capital Group | ||||||||||||||||
| 30 Year U.S. Ultra Treasury Bond | 26 | December 2021 | 145,313 | USD | 4,967,625 | Barclays Capital Group | ||||||||||||||||
| Five Year U.S. Treasury Note | 50 | December 2021 | 32,422 | USD | 6,137,110 | Barclays Capital Group | ||||||||||||||||
| Total | $1,069,529 | |||||||||||||||||||||
Abbreviations used are defined below:
FHA - Insured by Federal Housing Administration
GO - General Obligations
SONYMA - State of New York Mortgage Agency
TBA - To-be-announced
USD - United States Dollar
See Notes to the Financial Statements.
39
SCHEDULE OF PORTFOLIO INVESTMENTS
|
RBC Impact Bond Fund
September 30, 2021
| Principal Amount | Value | |||||
U.S. Government Agency Backed Mortgages — 29.56% | ||||||
Fannie Mae — 10.36% | ||||||
$ 89,764 | Pool #468942, 4.67%, 9/1/26 | $ | 101,821 | |||
88,639 | Pool #AM4271, 4.41%, 9/1/28 | 102,175 | ||||
141,564 | Pool #AM4668, 3.76%, 11/1/23 | 148,091 | ||||
132,140 | Pool #AM4724, 3.95%, 11/1/25 | 144,954 | ||||
50,000 | Pool #AN0360, 3.95%, 12/1/45 | 58,631 | ||||
248,630 | Pool #AN0959, 2.92%, 5/1/31 | 271,724 | ||||
90,430 | Pool #AN1381, 2.56%, 8/1/26 | 95,626 | ||||
50,000 | Pool #AN6149, 3.14%, 7/1/32 | 55,839 | ||||
93,664 | Pool #AN7354, 3.03%, 11/1/27 | 101,727 | ||||
93,809 | Pool #AN7868, 3.06%, 12/1/27 | 102,070 | ||||
93,685 | Pool #AN8300, 3.03%, 2/1/30 | 102,450 | ||||
96,364 | Pool #AN8422, 3.71%, 4/1/33 | 111,708 | ||||
97,417 | Pool #AN8458, 2.97%, 2/1/25 | 103,018 | ||||
240,452 | Pool #AN9483, 3.43%, 6/1/28 | 266,993 | ||||
24,732 | Pool #BJ0657, 4.00%, 2/1/48 | 26,488 | ||||
54,822 | Pool #BJ2670, 4.00%, 4/1/48 | 58,714 | ||||
61,594 | Pool #BJ3178, 4.00%, 11/1/47 | 67,755 | ||||
52,000 | Pool #BJ3251, 4.00%, 1/1/48 | 56,577 | ||||
60,763 | Pool #BJ4987, 4.00%, 3/1/48 | 66,685 | ||||
38,347 | Pool #BJ5158, 4.00%, 4/1/48 | 41,379 | ||||
44,000 | Pool #BJ9439, 4.00%, 2/1/48 | 47,689 | ||||
66,267 | Pool #BJ9477, 4.00%, 4/1/48 | 71,823 | ||||
63,111 | Pool #BK7924, 4.00%, 11/1/48 | 68,402 | ||||
96,198 | Pool #BL1459, 3.84%, 2/1/29 | 109,438 | ||||
243,901 | Pool #BL1581, 3.89%, 2/1/29 | 278,137 | ||||
300,000 | Pool #BL7153, 1.81%, 6/1/35 | 292,882 | ||||
112,250 | Pool #BO1263, 3.50%, 6/1/49 | 119,392 | ||||
969,049 | Pool #BP3417, 2.50%, 5/1/51 | 999,157 | ||||
257,844 | Pool #BP8741, 2.50%, 6/1/50 | 265,666 | ||||
358,713 | Pool #BQ7523, 2.00%, 11/1/50 | 359,701 | ||||
431,120 | Pool #BQ7524, 2.50%, 10/1/50 | 444,199 | ||||
928,599 | Pool #BR1037, 2.50%, 5/1/51 | 957,451 | ||||
1,707,822 | Pool #BR2051, 2.50%, 6/1/51 | 1,760,884 | ||||
2,117,776 | Pool #BR2234, 2.50%, 8/1/51 | 2,183,706 | ||||
300,000 | Pool #BS0915, 1.62%, 3/1/31 | 297,982 | ||||
1,122,847 | Pool #BT0853, 2.50%, 5/1/51 | 1,158,242 | ||||
45,604 | Pool #CA1066, 4.00%, 1/1/48 | 49,140 | ||||
22,738 | Pool #CA1068, 3.50%, 1/1/48 | 24,192 | ||||
75,989 | Pool #CA2595, 4.50%, 11/1/48 | 82,070 | ||||
23,795 | Pool #CA2597, 4.00%, 11/1/48 | 25,484 | ||||
87,533 | Pool #CA2912, 4.00%, 12/1/48 | 95,298 | ||||
46,211 | Pool #CA3132, 4.00%, 2/1/49 | 50,327 | ||||
45,742 | Pool #CA3174, 4.00%, 2/1/49 | 49,577 | ||||
274,362 | Pool #CA3451, 3.50%, 5/1/49 | 290,009 | ||||
197,808 | Pool #CA3456, 3.50%, 5/1/49 | 211,392 | ||||
390,262 | Pool #CA9048, 2.00%, 2/1/51 | 391,337 | ||||
40
SCHEDULE OF PORTFOLIO INVESTMENTS
|
RBC Impact Bond Fund (cont.)
September 30, 2021
| Principal Amount | Value | |||||
$1,006,750 | Pool #CB0437, 2.50%, 5/1/51 | $ | 1,038,030 | |||
1,052,165 | Pool #CB0480, 2.50%, 5/1/51 | 1,084,856 | ||||
1,044,154 | Pool #CB0576, 2.50%, 5/1/51 | 1,076,596 | ||||
1,821,518 | Pool #CB0582, 2.50%, 5/1/51 | 1,878,114 | ||||
1,847,138 | Pool #CB0675, 2.50%, 5/1/51 | 1,904,529 | ||||
1,022,176 | Pool #CB0689, 2.50%, 6/1/51 | 1,053,936 | ||||
1,909,774 | Pool #CB1003, 2.50%, 7/1/51 | 1,969,112 | ||||
|
| |||||
| 22,773,175 | ||||||
|
| |||||
Freddie Mac — 19.00% | ||||||
71,104 | Pool #Q59453, 4.00%, 11/1/48 | 76,735 | ||||
229,935 | Pool #QB5731, 2.00%, 11/1/50 | 230,568 | ||||
234,760 | Pool #QB5732, 2.50%, 11/1/50 | 241,878 | ||||
921,772 | Pool #QC3844, 2.00%, 6/1/51 | 924,409 | ||||
366,111 | Pool #QC3845, 2.50%, 6/1/51 | 377,487 | ||||
1,354,083 | Pool #QC7895, 2.00%, 9/1/51 | 1,357,633 | ||||
89,857 | Pool #RA1713, 3.00%, 11/1/49 | 93,912 | ||||
117,024 | Pool #RA1714, 3.00%, 11/1/49 | 122,305 | ||||
81,598 | Pool #RA1715, 3.00%, 10/1/49 | 85,280 | ||||
201,896 | Pool #RA2256, 3.00%, 3/1/50 | 211,026 | ||||
239,298 | Pool #RA2340, 3.00%, 3/1/50 | 250,119 | ||||
233,665 | Pool #RA2395, 2.50%, 4/1/50 | 240,750 | ||||
447,191 | Pool #RA2575, 2.50%, 5/1/50 | 460,750 | ||||
145,524 | Pool #RA2727, 2.00%, 5/1/50 | 145,936 | ||||
145,977 | Pool #RA2728, 2.50%, 5/1/50 | 150,403 | ||||
420,366 | Pool #RA2740, 2.50%, 6/1/50 | 434,085 | ||||
343,464 | Pool #RA3680, 2.50%, 9/1/50 | 353,878 | ||||
234,871 | Pool #RA3751, 2.00%, 10/1/50 | 235,760 | ||||
383,330 | Pool #RA4503, 2.00%, 2/1/51 | 384,385 | ||||
444,114 | Pool #RA4598, 2.00%, 2/1/51 | 445,278 | ||||
381,652 | Pool #RA4927, 2.00%, 3/1/51 | 382,653 | ||||
517,620 | Pool #RA5020, 2.00%, 4/1/51 | 518,976 | ||||
1,036,689 | Pool #RA5045, 2.50%, 5/1/51 | 1,068,899 | ||||
1,409,460 | Pool #RA5195, 2.50%, 5/1/51 | 1,472,176 | ||||
1,065,206 | Pool #RA5197, 2.50%, 5/1/51 | 1,098,302 | ||||
1,050,514 | Pool #RA5234, 2.50%, 5/1/51 | 1,083,153 | ||||
483,321 | Pool #RA5237, 2.50%, 5/1/51 | 498,338 | ||||
1,772,135 | Pool #RA5278, 2.50%, 5/1/51 | 1,827,196 | ||||
1,821,707 | Pool #RA5350, 2.50%, 6/1/51 | 1,878,307 | ||||
1,792,756 | Pool #RA5379, 2.50%, 6/1/51 | 1,848,457 | ||||
1,095,010 | Pool #RA5380, 2.50%, 6/1/51 | 1,129,032 | ||||
1,967,682 | Pool #RA5404, 2.50%, 6/1/51 | 2,028,818 | ||||
1,822,151 | Pool #RA5452, 2.50%, 6/1/51 | 1,878,765 | ||||
1,938,376 | Pool #RA5509, 2.50%, 7/1/51 | 1,998,602 | ||||
2,204,378 | Pool #RA5525, 2.50%, 7/1/51 | 2,272,868 | ||||
1,996,338 | Pool #RA5541, 2.50%, 7/1/51 | 2,058,364 | ||||
1,613,151 | Pool #RA5571, 2.50%, 7/1/51 | 1,663,371 | ||||
1,600,459 | Pool #RA5597, 2.50%, 7/1/51 | 1,650,284 | ||||
41
SCHEDULE OF PORTFOLIO INVESTMENTS
|
RBC Impact Bond Fund (cont.)
September 30, 2021
| Principal Amount | Value | |||||
$ 255,853 | Pool #RA5621, 2.50%, 8/1/51 | $ | 263,818 | |||
815,082 | Pool #RA5701, 2.00%, 8/1/51 | 817,414 | ||||
1,036,554 | Pool #RA5796, 2.50%, 8/1/51 | 1,068,904 | ||||
2,437,321 | Pool #RA5873, 2.50%, 9/1/51 | 2,513,388 | ||||
225,646 | Pool #RA5874, 2.50%, 9/1/51 | 232,706 | ||||
59,253 | Pool #V84044, 4.00%, 1/1/48 | 63,851 | ||||
55,697 | Pool #V84506, 4.00%, 7/1/48 | 59,771 | ||||
44,576 | Pool #V84836, 4.00%, 11/1/48 | 48,237 | ||||
103,839 | Pool #V85041, 4.50%, 1/1/49 | 112,324 | ||||
59,830 | Pool #V85181, 4.00%, 2/1/49 | 64,559 | ||||
102,854 | Pool #V85351, 4.00%, 3/1/49 | 111,286 | ||||
152,982 | Pool #V85365, 3.50%, 4/1/49 | 163,515 | ||||
185,604 | Pool #V85381, 3.50%, 4/1/49 | 198,383 | ||||
109,357 | Pool #V85445, 3.50%, 4/1/49 | 116,574 | ||||
198,682 | Series 2018-KF57, Class A, (LIBOR USD 1-Month + 0.540%), 0.62%, 12/25/28(a) | 200,599 | ||||
67,717 | Series 2018-SB45, Class A10F, 3.16%, 11/25/27(b) | 70,626 | ||||
79,276 | Series 2018-SB47, Class A10F, 3.35%, 1/25/28(b) | 83,286 | ||||
74,646 | Series 2018-SB48, Class A10F, 3.37%, 2/25/28(b) | 77,937 | ||||
208,229 | Series 2019-SB59, Class A10F, 3.47%, 1/25/29(b) | 224,618 | ||||
1,809,980 | Series 2021-SB87, Class A5H, 0.78%, 4/25/41(b) | 1,802,748 | ||||
340,882 | Series Q014, Class A1, 1.56%, 1/25/36 | 327,317 | ||||
|
| |||||
| 41,800,999 | ||||||
|
| |||||
Ginnie Mae — 0.20% | ||||||
212,659 | Pool #AC3667, 1.66%, 8/15/26 | 213,295 | ||||
57,896 | Pool #BB3740, 4.00%, 11/15/47 | 62,794 | ||||
71,604 | Pool #BE3008, 4.00%, 4/20/48 | 77,358 | ||||
43,220 | Series 2018-2, Class AD, 2.40%, 3/16/59 | 44,557 | ||||
41,893 | Series 2018-26, Class AD, 2.50%, 3/16/52 | 43,188 | ||||
|
| |||||
| 441,192 | ||||||
|
| |||||
Total U.S. Government Agency Backed Mortgages | 65,015,366 | |||||
|
| |||||
(Cost $65,381,443) | ||||||
Municipal Bonds — 28.88% | ||||||
Alabama — 0.98% | ||||||
1,000,000 | Water Works Board of the City of Birmingham (The) Revenue, 0.85%, 1/1/25 | 1,004,410 | ||||
150,000 | Water Works Board of the City of Birmingham (The) Revenue, 2.60%, 1/1/27 | 160,103 | ||||
1,000,000 | Water Works Board of the City of Birmingham (The) Revenue, 2.39%, 1/1/35, Callable 7/1/31 @ 100 | 994,030 | ||||
|
| |||||
| 2,158,543 | ||||||
|
| |||||
42
SCHEDULE OF PORTFOLIO INVESTMENTS
|
RBC Impact Bond Fund (cont.)
September 30, 2021
| Principal Amount | Value | |||||
Arizona — 0.45% | ||||||
$ 750,000 | City of Phoenix Civic Improvement Corp. Revenue, Series C, 1.38%, 7/1/27 | $ | 751,162 | |||
250,000 | City of Tucson Water System Revenue, 1.88%, 7/1/30 | 250,558 | ||||
|
| |||||
| 1,001,720 | ||||||
|
| |||||
Arkansas — 0.04% | ||||||
100,000 | City of Russellville Water & Sewer Revenue, Series B, 1.23%, 7/1/26, (Credit Support: BAM) | 99,243 | ||||
|
| |||||
California — 7.50% | ||||||
150,000 | California Health Facilities. Financing Authority Revenue, 2.02%, 6/1/24 | 155,473 | ||||
250,000 | California Health Facilities. Financing Authority Revenue, 1.68%, 6/1/28 | 248,690 | ||||
815,000 | California Health Facilities. Financing Authority Revenue, 1.98%, 6/1/30 | 809,042 | ||||
990,000 | California Health Facilities. Financing Authority Revenue, 2.53%, 6/1/35 | 1,002,702 | ||||
460,000 | Calleguas Municipal Water District Revenue, Series A, 2.52%, 7/1/36 | 476,137 | ||||
135,000 | City & County of San Francisco GO, Series A, 2.82%, 6/15/24 | 142,995 | ||||
100,000 | City & County of San Francisco GO, Series C, 1.95%, 6/15/27 | 103,324 | ||||
100,000 | City of Los Angeles Housing GO, Series A, 2.95%, 9/1/28, Callable 9/1/27 @ 100 | 107,110 | ||||
300,000 | City of Modesto Wastewater Revenue, Series A, 0.99%, 11/1/25 | 300,264 | ||||
350,000 | City of San Buenaventura Revenue, 1.17%, 1/1/26 | 352,093 | ||||
1,580,000 | City of San Francisco Public Utilities Commission Water Revenue, Series G, 1.79%, 11/1/30 | 1,569,983 | ||||
300,000 | City of Santa Rosa Wastewater Revenue, Series B, 2.32%, 9/1/33 | 307,260 | ||||
100,000 | City of Sunnyvale Wastewater Revenue, Series A, 3.20%, 4/1/26 | 109,538 | ||||
210,000 | Cucamonga Valley Water District Financing Authority Revenue, Series A, 1.54%, 9/1/27 | 211,882 | ||||
1,500,000 | Cucamonga Valley Water District Financing Authority Revenue, Series B, 3.60%, 9/1/27 | 1,688,265 | ||||
150,000 | Escondido Joint Powers Financing Authority Revenue, Series B, 2.44%, 9/1/25 | 157,092 | ||||
150,000 | Kern Community College District GO, 2.54%, 11/1/26 | 159,490 | ||||
175,000 | Lancaster Power Authority Revenue, 0.45%, 11/1/22 | 175,028 | ||||
190,000 | Lancaster Power Authority Revenue, 0.87%, 11/1/24, (Credit Support: AGM) | 189,954 | ||||
240,000 | Lancaster Power Authority Revenue, 1.67%, 11/1/27, (Credit Support: AGM) | 239,074 | ||||
285,000 | Lancaster Power Authority Revenue, 1.92%, 11/1/28, (Credit Support: AGM) | 283,820 | ||||
300,000 | Riverside Community College District GO, 0.82%, 8/1/25 | 299,661 | ||||
200,000 | Rosemead School District GO, Series A, 2.17%, 8/1/25 | 208,826 | ||||
250,000 | Rowland Water District Revenue, Series A, 0.87%, 12/1/25 | 248,787 | ||||
43
SCHEDULE OF PORTFOLIO INVESTMENTS
|
RBC Impact Bond Fund (cont.)
September 30, 2021
| Principal Amount | Value | |||||
$ 250,000 | Rowland Water District Revenue, Series A, 1.61%, 12/1/29 | $ | 244,067 | |||
1,000,000 | Rowland Water District Revenue, Series A, 1.91%, 12/1/31 | 975,600 | ||||
125,000 | San Diego County Water Authority Revenue, Series A, 1.17%, 5/1/27 | 123,825 | ||||
100,000 | San Francisco City & County Public Utilities Commission Wastewater Revenue, 5.40%, 10/1/28 | 124,932 | ||||
400,000 | Santa Clara Valley Water District Certificate Participation, Series D, 1.78%, 6/1/31, Callable 6/1/30 @ 100 | 389,100 | ||||
1,060,000 | Santa Clara Valley Water District Certificate Participation, Series D, 1.88%, 6/1/32, Callable 6/1/30 @ 100 | 1,028,889 | ||||
950,000 | Santa Clara Valley Water District Certificate Participation, Series D, 2.08%, 6/1/34, Callable 6/1/30 @ 100 | 921,785 | ||||
600,000 | Sonoma-Marin Area Rail Transit District Revenue, Series A, 2.02%, 3/1/28 | 609,666 | ||||
1,250,000 | State of California Department of Water Resources Revenue, 0.51%, 12/1/24 | 1,244,100 | ||||
100,000 | State of California Department of Water Resources Revenue, 0.92%, 12/1/26 | 98,734 | ||||
245,000 | Walnut Valley Water District Revenue, Series A, 0.76%, 6/1/25 | 243,275 | ||||
315,000 | Walnut Valley Water District Revenue, Series A, 0.96%, 6/1/26 | 311,412 | ||||
320,000 | Walnut Valley Water District Revenue, Series A, 1.17%, 6/1/27 | 314,986 | ||||
325,000 | Walnut Valley Water District Revenue, Series A, 1.37%, 6/1/28 | 318,572 | ||||
|
| |||||
| 16,495,433 | ||||||
|
| |||||
Colorado — 0.84% | ||||||
1,120,000 | Denver City & County Housing Authority Revenue, Series B, 0.84%, 8/1/24, (Credit Support: HUD SECT 8), Callable 2/1/24 @ 100 | 1,117,570 | ||||
50,000 | Denver City & County School District No 1 GO, Series B, 2.99%, 12/1/24, (Credit Support: State Aid Withholding) | 53,687 | ||||
275,000 | Parker Water & Sanitation District GO, 2.10%, 8/1/29 | 282,485 | ||||
400,000 | Regional Transportation District Sales Tax Revenue, Series A, 0.70%, 11/1/25 | 397,096 | ||||
|
| |||||
| 1,850,838 | ||||||
|
| |||||
Connecticut — 0.22% | ||||||
325,000 | Connecticut Green Bank Revenue, 1.95%, 11/15/28 | 323,693 | ||||
150,000 | South Central Connecticut Regional Water Authority Revenue, Series B, 2.86%, 8/1/30, Callable 8/1/29 @ 100 | 157,763 | ||||
|
| |||||
| 481,456 | ||||||
|
| |||||
District of Columbia — 1.03% | ||||||
340,000 | District of Columbia Housing Finance Agency Revenue, Series A-2, 1.05%, 3/1/25, (Credit Support: FHA) | 338,562 | ||||
155,000 | District of Columbia Housing Finance Agency Revenue, Series A-2, 1.15%, 9/1/25, (Credit Support: FHA) | 154,059 | ||||
350,000 | District of Columbia Housing Finance Agency Revenue, Series A-2, 1.20%, 3/1/26, (Credit Support: FHA) | 347,162 | ||||
195,000 | District of Columbia Housing Finance Agency Revenue, Series A-2, 1.50%, 3/1/27, (Credit Support: FHA) | 192,798 | ||||
44
SCHEDULE OF PORTFOLIO INVESTMENTS
|
RBC Impact Bond Fund (cont.)
September 30, 2021
| Principal Amount | Value | |||||
$ 195,000 | District of Columbia Housing Finance Agency Revenue, Series A-2, 1.60%, 9/1/27, (Credit Support: FHA) | $ | 192,481 | |||
200,000 | District of Columbia Housing Finance Agency Revenue, Series A-2, 1.70%, 3/1/28, (Credit Support: FHA) | 197,136 | ||||
135,000 | District of Columbia Housing Finance Agency Revenue, Series A-2, 1.75%, 9/1/28, (Credit Support: FHA) | 132,860 | ||||
140,000 | District of Columbia Housing Finance Agency Revenue, Series A-2, 1.95%, 9/1/29, (Credit Support: FHA) | 137,560 | ||||
590,000 | District of Columbia Housing Finance Agency Revenue, Series A-2, 2.15%, 3/1/31, (Credit Support: FHA), Callable 3/1/30 @ 100 | 579,014 | ||||
|
| |||||
| 2,271,632 | ||||||
|
| |||||
Florida — 1.12% | ||||||
500,000 | City of Deltona Utility System Revenue, 0.31%, 10/1/23, (Credit Support: BAM) | 497,015 | ||||
2,000,000 | City of Palm Coast Utility Revenue, 1.44%, 10/1/28 | 1,963,320 | ||||
|
| |||||
| 2,460,335 | ||||||
|
| |||||
Georgia — 0.83% | ||||||
75,000 | Atlanta Urban Residential Finance Authority Revenue, Series A, 2.39%, 12/1/22 | 76,833 | ||||
450,000 | Carroll County Water Authority Revenue, Series B, 0.73%, 7/1/24 | 449,654 | ||||
285,000 | Carroll County Water Authority Revenue, Series B, 1.51%, 7/1/27 | 284,587 | ||||
500,000 | Coweta County Water & Sewage Authority Revenue, Series A, 2.00%, 6/1/25 | 520,190 | ||||
75,000 | Macon-Bibb County Urban Development Authority Revenue, Series A, 3.00%, 12/1/24, (Credit Support: County Guaranteed) | 79,946 | ||||
425,000 | Tift County Hospital Authority Revenue, 1.05%, 12/1/25, (Credit Support: County Guaranteed) | 424,192 | ||||
|
| |||||
| 1,835,402 | ||||||
|
| |||||
Hawaii — 0.62% | ||||||
150,000 | City & County Honolulu Wastewater System Revenue, Series A, 2.00%, 7/1/22 | 151,997 | ||||
260,000 | City & County of Honolulu GO, Series C, 0.30%, 7/1/22 | 260,182 | ||||
695,000 | City & County of Honolulu GO, Series C, 1.47%, 7/1/28 | 693,415 | ||||
250,000 | Honolulu City & County Board of Water Supply Revenue, Series B, 1.98%, 7/1/27 | 257,995 | ||||
|
| |||||
| 1,363,589 | ||||||
|
| |||||
Idaho — 0.23% | ||||||
500,000 | Idaho Energy Resources Authority Revenue, 2.86%, 9/1/46 | 499,260 | ||||
|
| |||||
45
SCHEDULE OF PORTFOLIO INVESTMENTS
|
RBC Impact Bond Fund (cont.)
September 30, 2021
| Principal Amount | Value | |||||
Illinois — 0.14% | ||||||
$ 300,000 | Illinois Finance Authority Revenue, 0.06%, 2/15/46, Callable 9/30/21 @ 100 | $ | 300,000 | |||
|
| |||||
Iowa — 0.34% | ||||||
650,000 | Iowa Finance Authority Revenue, Series B, 0.47%, 8/1/24 | 646,997 | ||||
100,000 | Northeast Iowa Community College GO, Series 1, 3.45%, 6/1/26, Callable 6/1/24 @ 100 | 106,680 | ||||
|
| |||||
| 753,677 | ||||||
|
| |||||
Kentucky — 0.17% | ||||||
370,000 | Louisville and Jefferson County Metropolitan Sewer District Revenue, Series C, 0.72%, 5/15/24 | 371,217 | ||||
|
| |||||
Maryland — 0.10% | ||||||
225,000 | City of Baltimore Revenue, Series B, 1.58%, 7/1/28 | 219,965 | ||||
|
| |||||
Massachusetts — 0.88% | ||||||
600,000 | Boston Water & Sewer Commission Revenue, 1.37%, 11/1/27 | 602,142 | ||||
1,040,000 | Massachusetts Bay Transportation Authority Sales Tax Revenue, Series B, 2.49%, 7/1/33, Callable 7/1/31 @ 100 | 1,066,208 | ||||
250,000 | Massachusetts Water Resources Authority Revenue, Series F, 1.86%, 8/1/24 | 258,437 | ||||
|
| |||||
| 1,926,787 | ||||||
|
| |||||
Michigan — 1.91% | ||||||
750,000 | City of Grand Rapids Sanitary Sewer System Revenue, 1.86%, 1/1/31 | 741,195 | ||||
1,330,000 | City of Grand Rapids Sanitary Sewer System Revenue, 2.01%, 1/1/32, Callable 1/1/31 @ 100 | 1,322,379 | ||||
95,000 | Marquette Brownfield Redevelopment Authority Revenue, 3.05%, 5/1/27, (Credit Support: Municipal Government Guaranteed), Callable 5/1/26 @ 100 | 100,665 | ||||
175,000 | Michigan Finance Authority Revenue, 0.65%, 10/1/24 | 174,092 | ||||
175,000 | Michigan Finance Authority Revenue, 0.65%, 10/1/24 | 174,092 | ||||
1,140,000 | Pontiac Wastewater Treatment Facility Drainage District Special Assessment, 2.00%, 6/1/23, (Credit Support: County Guaranteed) | 1,170,860 | ||||
300,000 | Romulus Community Schools GO, Series B, 1.00%, 5/1/25, (Credit Support: Q-SBLF) | 301,605 | ||||
225,000 | State of Michigan GO, Series B, 1.54%, 5/15/30 | 219,874 | ||||
|
| |||||
| 4,204,762 | ||||||
|
| |||||
Missouri — 0.05% | ||||||
100,000 | Riverview Gardens School District GO, Series B, 3.15%, 4/1/22, (Credit Support: State Aid Direct Deposit) | 101,340 | ||||
|
| |||||
46
SCHEDULE OF PORTFOLIO INVESTMENTS
|
RBC Impact Bond Fund (cont.)
September 30, 2021
| Principal Amount | Value | |||||
Nebraska — 0.16% | ||||||
$ 100,000 | City of Omaha Sewer Revenue, Series B, 1.04%, 4/1/26 | $ | 99,750 | |||
250,000 | Papio-Missouri River Natural Resource District Special Tax, 2.20%, 12/15/25, Callable 6/15/24 @ 100 | 247,975 | ||||
|
| |||||
| 347,725 | ||||||
|
| |||||
Nevada — 0.12% | ||||||
250,000 | City of Henderson GO, Series A-2, 2.23%, 6/1/28 | 257,023 | ||||
|
| |||||
New Jersey — 0.72% | ||||||
150,000 | Mercer County Improvement Authority (The) Revenue, Series A, 4.90%, 9/15/27, (Credit Support: County Guaranteed), Callable 11/1/21 @ 100 | 150,483 | ||||
1,335,000 | Morris County Improvement Authority Revenue, 0.89%, 6/15/25 | 1,329,860 | ||||
100,000 | Township of Brick GO, Series B, 3.00%, 9/1/22 | 102,381 | ||||
|
| |||||
| 1,582,724 | ||||||
|
| |||||
New York — 0.76% | ||||||
570,000 | New York State Housing Finance Agency Revenue, 1.13%, 11/1/25, (Credit Support: SONYMA), Callable 7/1/23 @ 100 | 569,407 | ||||
600,000 | Western Nassau County Water Authority Revenue, Series B, 2.50%, 4/1/34 | 598,686 | ||||
500,000 | Western Nassau County Water Authority Revenue, Series B, 2.58%, 4/1/35 | 496,780 | ||||
|
| |||||
| 1,664,873 | ||||||
|
| |||||
Ohio — 0.29% | ||||||
130,000 | City of Cincinnati Revenue, Series C, 3.95%, 11/1/28 | 144,041 | ||||
100,000 | County of Franklin Revenue, 2.88%, 11/1/50, Callable 5/1/50 @ 100 | 98,132 | ||||
400,000 | Northeast Ohio Regional Sewer District Revenue, 0.26%, 11/15/22 | 400,196 | ||||
|
| |||||
| 642,369 | ||||||
|
| |||||
Oregon — 0.50% | ||||||
350,000 | City of Portland GO, Series B, 1.51%, 6/15/28 | 349,072 | ||||
300,000 | City of Tigard Water Revenue, 2.00%, 8/1/28, (Credit Support: BAM) | 305,061 | ||||
90,000 | State of Oregon GO, Series B, 2.77%, 5/1/23 | 93,488 | ||||
345,000 | State of Oregon GO, Series F, 1.32%, 6/1/27 | 345,890 | ||||
|
| |||||
| 1,093,511 | ||||||
|
| |||||
Pennsylvania — 1.31% | ||||||
1,750,000 | City of Philadelphia Water & Wastewater Revenue, Series B, 1.49%, 7/1/27 | 1,746,273 | ||||
185,000 | City of Philadelphia Water & Wastewater Revenue, Series A, 3.55%, 10/1/28 | 205,801 | ||||
47
SCHEDULE OF PORTFOLIO INVESTMENTS
|
RBC Impact Bond Fund (cont.)
September 30, 2021
| Principal Amount | Value | |||||
$ 825,000 | Economy Borough Municipal Authority Revenue, Series A, 1.65%, 12/15/28, (Credit Support: BAM) | $ | 817,294 | |||
100,000 | Redevelopment Authority of the City of Philadelphia Revenue, 4.50%, 11/1/31, Callable 11/1/28 @ 100 | 111,828 | ||||
|
| |||||
| 2,881,196 | ||||||
|
| |||||
Rhode Island — 1.83% | ||||||
1,295,000 | Narragansett Bay Commission Revenue, 2.09%, 9/1/30 | 1,309,893 | ||||
400,000 | Narragansett Bay Commission Revenue, 2.26%, 9/1/32, Callable 9/1/30 @ 100 | 404,676 | ||||
150,000 | Rhode Island Infrastructure Bank Revenue, Series R, 2.70%, 10/1/28 | 161,220 | ||||
1,000,000 | Rhode Island Infrastructure Bank State Revolving Fund Revenue, Series A, 1.00%, 10/1/26 | 994,000 | ||||
1,000,000 | Rhode Island Infrastructure Bank State Revolving Fund Revenue, Series A, 1.40%, 10/1/28 | 989,850 | ||||
150,000 | State of Rhode Island GO, Series B, 3.00%, 5/1/23 | 156,312 | ||||
|
| |||||
| 4,015,951 | ||||||
|
| |||||
South Carolina — 0.03% | ||||||
75,000 | Spartanburg Sanitary Sewer District Revenue, 1.19%, 3/1/26 | 75,905 | ||||
|
| |||||
Texas — 2.51% | ||||||
930,000 | City of Houston Combined Utility System Revenue, Series B, 0.81%, 11/15/25 | 922,281 | ||||
250,000 | City of Houston Combined Utility System Revenue, Series C, 2.05%, 11/15/26 | 259,775 | ||||
400,000 | City of Lubbock Water & Wastewater System Revenue, Series C, 1.39%, 2/15/27 | 402,004 | ||||
350,000 | Dallas Area Rapid Transit Revenue, 1.15%, 12/1/26 | 348,166 | ||||
800,000 | Dallas Area Rapid Transit Revenue, 2.18%, 12/1/32 | 803,064 | ||||
1,150,000 | Hidalgo County Drain District No 1 GO, Series A, 0.59%, 9/1/24 | 1,145,320 | ||||
335,000 | Hidalgo County Drain District No 1 GO, Series A, 0.96%, 9/1/25 | 333,663 | ||||
275,000 | Hidalgo County Drain District No 1 GO, Series A, 1.11%, 9/1/26 | 272,767 | ||||
225,000 | Hidalgo County Drain District No 1 GO, Series A, 1.35%, 9/1/27 | 222,631 | ||||
130,000 | Hidalgo County Drain District No 1 GO, Series A, 1.50%, 9/1/28 | 127,967 | ||||
300,000 | Hidalgo County Drain District No 1 GO, Series A, 1.67%, 9/1/29 | 294,999 | ||||
150,000 | State of Texas GO, Series B, 3.13%, 8/1/22 | 153,613 | ||||
200,000 | United Independent School District GO, 5.00%, 8/15/24, (Credit Support: PSF-GTD) | 224,962 | ||||
|
| |||||
| 5,511,212 | ||||||
|
| |||||
Utah — 1.20% | ||||||
150,000 | Central Utah Water Conservancy District Revenue, Series E, 0.72%, 10/1/25 | 148,661 | ||||
1,240,000 | Metropolitan Water District of Salt Lake & Sandy Revenue, Series B, 0.82%, 7/1/25 | 1,234,432 | ||||
48
SCHEDULE OF PORTFOLIO INVESTMENTS
|
RBC Impact Bond Fund (cont.)
September 30, 2021
| Principal Amount | Value | |||||
$ 520,000 | Metropolitan Water District of Salt Lake & Sandy Revenue, Series B, 1.52%, 7/1/28 | $ | 516,792 | |||
750,000 | North Davis County Sewer District Revenue, Series B, 0.79%, 3/1/25 | 747,840 | ||||
|
| |||||
| 2,647,725 | ||||||
|
| |||||
Vermont — 0.05% | ||||||
100,000 | Vermont Housing Finance Agency Revenue, 3.45%, 11/1/29 | 111,268 | ||||
|
| |||||
Virginia — 0.16% | ||||||
200,000 | County of Henrico Water & Sewer Revenue, Series B, 0.52%, 5/1/24 | 199,816 | ||||
150,000 | Loudoun County Economic Development Authority Revenue, Series B, 2.05%, 12/1/22 | 153,151 | ||||
|
| |||||
| 352,967 | ||||||
|
| |||||
Washington — 1.79% | ||||||
2,400,000 | City of Tacoma Electric System Revenue, Series C, 5.64%, 1/1/27 | 2,917,032 | ||||
260,000 | County of King Sewer Revenue, Series A, 0.19%, 7/1/22 | 259,964 | ||||
250,000 | County of King Sewer Revenue, Series A, 0.57%, 7/1/24 | 249,470 | ||||
200,000 | County of King Sewer Revenue, Series A, 0.80%, 7/1/25 | 199,078 | ||||
300,000 | Grant County Public Utility District No 2 Priest Rapids Hydroelectric Project Revenue, 1.90%, 1/1/27 | 306,285 | ||||
|
| |||||
| 3,931,829 | ||||||
|
| |||||
Total Municipal Bonds | 63,511,477 | |||||
|
| |||||
(Cost $63,761,779) | ||||||
Corporate Bonds — 27.70% | ||||||
Communications — 2.05% | ||||||
250,000 | Verizon Communications, Inc., 3.88%, 2/8/29 | 280,320 | ||||
693,000 | Vodafone Group Plc, 4.13%, 5/30/25 | 766,617 | ||||
2,030,000 | Vodafone Group Plc, 4.38%, 5/30/28 | 2,329,863 | ||||
875,000 | Vodafone Group Plc, 5.25%, 5/30/48 | 1,133,134 | ||||
|
| |||||
| 4,509,934 | ||||||
|
| |||||
Consumer, Non-cyclical — 15.84% | ||||||
250,000 | Abbott Laboratories, 1.15%, 1/30/28 | 244,876 | ||||
545,000 | AbbVie, Inc., 3.60%, 5/14/25 | 589,857 | ||||
2,030,000 | AbbVie, Inc., 3.80%, 3/15/25 | 2,204,555 | ||||
995,000 | Amgen, Inc., 1.90%, 2/21/25 | 1,022,972 | ||||
475,000 | Amgen, Inc., 2.20%, 2/21/27 | 491,145 | ||||
400,000 | Amgen, Inc., 2.80%, 8/15/41 | 385,970 | ||||
225,000 | Amgen, Inc., 3.00%, 1/15/52 | 216,697 | ||||
100,000 | Amgen, Inc., 3.15%, 2/21/40 | 101,594 | ||||
275,000 | Amgen, Inc., 3.20%, 11/2/27 | 299,149 | ||||
350,000 | Amgen, Inc., 4.40%, 5/1/45 | 419,170 | ||||
49
SCHEDULE OF PORTFOLIO INVESTMENTS
|
RBC Impact Bond Fund (cont.)
September 30, 2021
| Principal Amount | Value | |||||
$2,892,000 | Astrazeneca Finance LLC, 1.75%, 5/28/28 | $ | 2,904,602 | |||
490,000 | Astrazeneca Finance LLC, 2.25%, 5/28/31 | 497,475 | ||||
207,000 | Baxalta, Inc., 5.25%, 6/23/45 | 276,272 | ||||
1,000,000 | Becton Dickinson and Co., 2.82%, 5/20/30 | 1,045,782 | ||||
159,000 | Becton Dickinson and Co., 3.36%, 6/6/24 | 169,022 | ||||
398,000 | Becton Dickinson and Co., 3.73%, 12/15/24 | 430,235 | ||||
1,089,000 | Becton Dickinson and Co., 4.67%, 6/6/47 | 1,352,585 | ||||
400,000 | Becton Dickinson and Co., 4.69%, 12/15/44 | 495,720 | ||||
200,000 | Biogen, Inc., 2.25%, 5/1/30 | 198,388 | ||||
575,000 | Bristol-Myers Squibb Co., 3.20%, 6/15/26 | 626,882 | ||||
731,000 | Bristol-Myers Squibb Co., 3.40%, 7/26/29 | 809,093 | ||||
50,000 | Bristol-Myers Squibb Co., 4.25%, 10/26/49 | 61,948 | ||||
60,000 | California Endowment (The), Series 2021, 2.50%, 4/1/51 | 57,548 | ||||
200,000 | Children’s Hospital Medical Center, 2.82%, 11/15/50 | 194,944 | ||||
75,000 | Danaher Corp., 2.60%, 10/1/50 | 71,242 | ||||
1,000,000 | DH Europe Finance II Sarl, 2.05%, 11/15/22 | 1,019,039 | ||||
995,000 | DH Europe Finance II Sarl, 2.60%, 11/15/29 | 1,036,298 | ||||
100,000 | DH Europe Finance II Sarl, 3.25%, 11/15/39 | 106,588 | ||||
100,000 | Doris Duke Charitable Foundation (The), Series 2020, 2.35%, 7/1/50 | 88,793 | ||||
150,000 | EMD Finance LLC, 2.95%, 3/19/22(c) | 151,184 | ||||
1,850,000 | EMD Finance LLC, 3.25%, 3/19/25(c) | 1,972,734 | ||||
210,000 | Gilead Sciences, Inc., 1.20%, 10/1/27 | 205,299 | ||||
2,500,000 | Gilead Sciences, Inc., 3.65%, 3/1/26 | 2,738,590 | ||||
250,000 | Gilead Sciences, Inc., 4.80%, 4/1/44 | 313,468 | ||||
150,000 | Gilead Sciences, Inc., 5.65%, 12/1/41 | 205,559 | ||||
400,000 | John D and Catherine T MacArthur Foundation, 1.30%, 12/1/30 | 375,376 | ||||
2,000,000 | Kaiser Foundation Hospitals, Series 2021, 2.81%, 6/1/41 | 2,026,775 | ||||
150,000 | Kaiser Foundation Hospitals, 3.15%, 5/1/27 | 163,025 | ||||
1,200,000 | Mary Free Bed Rehabilitation Hospital, 3.79%, 4/1/51 | 1,200,000 | ||||
150,000 | Mass General Brigham, Inc., Series 2020, 3.19%, 7/1/49 | 157,434 | ||||
300,000 | Mead Johnson Nutrition Co., 4.13%, 11/15/25 | 333,644 | ||||
78,000 | Medtronic, Inc., 3.50%, 3/15/25 | 84,611 | ||||
250,000 | Medtronic, Inc., 4.38%, 3/15/35 | 307,492 | ||||
225,000 | PerkinElmer, Inc., 1.90%, 9/15/28 | 223,125 | ||||
625,000 | PerkinElmer, Inc., 2.25%, 9/15/31 | 616,452 | ||||
75,000 | Pfizer, Inc., 2.63%, 4/1/30 | 79,094 | ||||
250,000 | Providence St. Joseph Health Obligated Group, Series H, 2.75%, 10/1/26 | 265,154 | ||||
645,000 | Shire Acquisitions Investments Ireland DAC, 3.20%, 9/23/26 | 696,243 | ||||
1,000,000 | Southeast Alaska Regional Health Consortium, 2.26%, 7/1/31 | 978,236 | ||||
1,300,000 | Takeda Pharmaceutical Co. Ltd., 2.05%, 3/31/30 | 1,279,262 | ||||
150,000 | Takeda Pharmaceutical Co. Ltd., 3.18%, 7/9/50 | 151,968 | ||||
1,150,000 | Takeda Pharmaceutical Co. Ltd., 5.00%, 11/26/28 | 1,371,484 | ||||
1,100,000 | Thermo Fisher Scientific, Inc., 1.75%, 10/15/28 | 1,096,351 | ||||
50
SCHEDULE OF PORTFOLIO INVESTMENTS
|
RBC Impact Bond Fund (cont.)
September 30, 2021
| Principal Amount | Value | |||||
$ 300,000 | Thermo Fisher Scientific, Inc., 2.60%, 10/1/29 | $ | 313,559 | |||
100,000 | Trinity Health Corp., 4.13%, 12/1/45 | 123,429 | ||||
|
| |||||
| 34,847,989 | ||||||
|
| |||||
Financial — 4.37% | ||||||
350,000 | Andrew W Mellon Foundation (The), Series 2020, 0.95%, 8/1/27 | 343,912 | ||||
250,000 | BlueHub Loan Fund, Inc., Series 2020, 2.89%, 1/1/27 | 266,464 | ||||
2,375,000 | BlueHub Loan Fund, Inc., Series 2020, 3.10%, 1/1/30 | 2,456,807 | ||||
1,100,000 | Bridge Housing Corp., 3.25%, 7/15/30 | 1,193,190 | ||||
250,000 | Century Housing Corp., Series 2019, 4.00%, 11/1/21 | 250,648 | ||||
250,000 | Community Preservation Corp. (The), Series 2020, 2.87%, 2/1/30 | 258,736 | ||||
590,000 | Low Income Investment Fund, Series 2019, 3.39%, 7/1/26 | 629,209 | ||||
1,300,000 | Low Income Investment Fund, Series 2019, 3.71%, 7/1/29 | 1,384,132 | ||||
2,500,000 | Reinvestment Fund, Inc. (The), 3.93%, 2/15/28 | 2,817,898 | ||||
|
| |||||
| 9,600,996 | ||||||
|
| |||||
Industrial — 2.16% | ||||||
2,600,000 | Agilent Technologies, Inc., 2.75%, 9/15/29 | 2,715,146 | ||||
1,000,000 | Nature Conservancy (The), Series A, 0.94%, 7/1/26 | 974,783 | ||||
1,000,000 | Nature Conservancy (The), Series A, 1.15%, 7/1/27 | 982,242 | ||||
70,000 | Nature Conservancy (The), Series A, 1.51%, 7/1/29 | 68,280 | ||||
|
| |||||
| 4,740,451 | ||||||
|
| |||||
Utilities — 3.28% | ||||||
1,534,000 | Avangrid, Inc., 3.15%, 12/1/24 | 1,634,300 | ||||
1,350,000 | Avangrid, Inc., 3.80%, 6/1/29 | 1,502,383 | ||||
150,000 | MidAmerican Energy Co., 3.10%, 5/1/27 | 163,131 | ||||
800,000 | MidAmerican Energy Co., 3.65%, 4/15/29 | 894,915 | ||||
3,020,000 | NextEra Energy Capital Holdings, Inc., 1.90%, 6/15/28 | 3,025,102 | ||||
|
| |||||
| 7,219,831 | ||||||
|
| |||||
Total Corporate Bonds | 60,919,201 | |||||
|
| |||||
(Cost $60,523,624) | ||||||
Asset Backed Securities — 6.33% | ||||||
960,759 | GoodLeap Sustainable Home Solutions Trust, Series 2021-3CS, Class A, 2.10%, 5/20/48(c) | 952,618 | ||||
851,340 | Loanpal Solar Loan Ltd., Series 2021-2GS, Class A, 2.22%, 3/20/48(c) | 850,140 | ||||
1,215,489 | Sunnova Helios II Issuer LLC, Series 2019-AA, Class A, 3.75%, 6/20/46(c) | 1,268,742 | ||||
470,545 | Sunnova Helios II Issuer LLC, Series 2021-A, Class A, 1.80%, 2/20/48(c) | 465,065 | ||||
1,122,639 | Sunnova Helios II Issuer LLC, Series 2021-B, Class A, 1.62%, 7/20/48(c) | 1,114,636 | ||||
980,738 | Sunrun Vulcan Issuer LLC, Series 2021-1A, Class A, 2.46%, 1/30/52(c) | 991,402 | ||||
51
SCHEDULE OF PORTFOLIO INVESTMENTS
|
RBC Impact Bond Fund (cont.)
September 30, 2021
| Principal Amount | Value | |||||
$ 400,000 | Tesla Auto Lease Trust, Series 2019-A, Class C, 2.68%, 1/20/23(c) | $ | 408,051 | |||
1,700,000 | Tesla Auto Lease Trust, Series 2019-A, Class D, 3.37%, 1/20/23(c) | 1,743,727 | ||||
190,000 | Tesla Auto Lease Trust, Series 2020-A, Class B, 1.18%, 1/22/24(c) | 191,603 | ||||
1,900,000 | Tesla Auto Lease Trust, Series 2020-A, Class D, 2.33%, 2/20/24(c) | 1,940,823 | ||||
2,000,000 | Tesla Auto Lease Trust, Series 2021-A, Class D, 1.34%, 3/20/25(c) | 2,005,558 | ||||
2,000,000 | Tesla Auto Lease Trust, Series 2021-B, Class D, 1.32%, 9/22/25(c) | 1,998,343 | ||||
|
| |||||
Total Asset Backed Securities | 13,930,708 | |||||
|
| |||||
(Cost $13,955,644) | ||||||
U.S. Government Agency Obligations — 5.54% | ||||||
Small Business Administration — 3.04% | ||||||
244,717 | Certificate of Originator’s Fee, 0.03%, 4/15/31(d) | 240 | ||||
897,300 | Certificate of Originator’s Fee, 0.03%, 7/15/31(d) | 882 | ||||
143,106 | Certificate of Originator’s Fee, 0.23%, 12/15/30(d) | 1,078 | ||||
447,502 | Certificate of Originator’s Fee, 0.23%, 3/15/31(d) | 3,371 | ||||
344,250 | Certificate of Originator’s Fee, 0.23%, 5/15/31(d) | 2,593 | ||||
389,700 | Certificate of Originator’s Fee, 0.28%, 5/17/46(d) | 4,614 | ||||
443,934 | Certificate of Originator’s Fee, 0.53%, 6/15/31(d) | 7,706 | ||||
48,539 | (Prime Index - 2.500%), 0.75%, 2/25/28(a) | 48,850 | ||||
98,161 | (Prime Index - 2.500%), 0.75%, 4/25/44(a) | 99,224 | ||||
222,833 | Certificate of Originator’s Fee, 0.78%, 4/15/31(d) | 5,692 | ||||
1,350,000 | Certificate of Originator’s Fee, 0.78%, 7/15/31(d) | 34,485 | ||||
495,000 | Certificate of Originator’s Fee, 0.78%, 8/15/31(d) | 12,645 | ||||
315,000 | Certificate of Originator’s Fee, 0.78%, 8/15/31(d) | 8,047 | ||||
103,500 | Certificate of Originator’s Fee, 0.78%, 8/15/31(d) | 2,644 | ||||
494,802 | Certificate of Originator’s Fee, 0.98%, 4/15/31(d) | 15,061 | ||||
404,563 | Certificate of Originator’s Fee, 1.03%, 4/15/46(d) | 17,622 | ||||
940,950 | Certificate of Originator’s Fee, 1.28%, 4/7/46(d) | 50,934 | ||||
437,400 | Certificate of Originator’s Fee, 1.28%, 6/23/46(d) | 23,677 | ||||
1,226,700 | Certificate of Originator’s Fee, 1.28%, 6/30/46(d) | 66,402 | ||||
72,335 | (Prime Index - 0.675%), 2.58%, 9/25/43(a) | 77,348 | ||||
219,573 | (Prime Index - 0.675%), 2.58%, 11/25/45(a) | 237,813 | ||||
252,706 | (Prime Index + 0.117%), 3.37%, 1/25/46(a) | 281,298 | ||||
440,503 | (Prime Index + 0.325%), 3.58%, 6/25/31(a) | 487,395 | ||||
486,186 | (Prime Index + 0.325%), 3.58%, 7/25/31(a) | 538,296 | ||||
547,717 | (Prime Index + 0.325%), 3.58%, 2/25/32(a) | 609,191 | ||||
133,905 | (Prime Index + 0.325%), 3.58%, 9/25/44(a) | 148,162 | ||||
833,510 | (Prime Index + 0.325%), 3.58%, 8/25/46(a) | 938,789 | ||||
306,146 | (Prime Index + 0.575%), 3.83%, 4/25/31(a) | 337,904 | ||||
61,858 | (Prime Index + 0.591%), 3.84%, 3/25/43(a) | 68,495 | ||||
41,598 | (Prime Index + 0.700%), 3.95%, 2/25/28(a) | 43,888 | ||||
450,000 | (TBA), 4.00%, 9/1/31(d) | 510,875 | ||||
52
SCHEDULE OF PORTFOLIO INVESTMENTS
|
RBC Impact Bond Fund (cont.)
September 30, 2021
| Principal Amount | Value | |||||
$ 969,199 | (Prime Index + 0.825%), 4.08%, 9/25/31(a) | $ | 1,085,656 | |||
49,272 | (Prime Index + 1.001%), 4.25%, 11/25/28(a) | 52,412 | ||||
81,709 | (Prime Index + 1.225%), 4.48%, 6/25/29(a) | 87,727 | ||||
142,295 | (Prime Index + 1.575%), 4.83%, 7/25/30(a) | 157,243 | ||||
42,082 | (TBA), 5.27%, 3/30/28(d) | 46,709 | ||||
35,869 | (TBA), 5.58%, 9/23/25(d) | 39,502 | ||||
125,517 | (Prime Index + 2.325%), 5.58%, 10/25/30(a) | 141,460 | ||||
108,886 | (Prime Index + 2.325%), 5.58%, 1/25/31(a) | 123,898 | ||||
145,382 | 7.08%, 7/25/30(d) | 160,565 | ||||
86,794 | 9.08%, 9/25/29(d) | 101,305 | ||||
|
| |||||
| 6,681,698 | ||||||
|
| |||||
U.S. International Development Finance Corp. — 2.50% | ||||||
2,000,000 | 0.00%, 7/23/22(e) | 1,996,666 | ||||
1,000,000 | 0.00%, 1/17/25(e) | 994,912 | ||||
1,000,000 | (US Treasury Bill Yield 3-Month + 0.000%), 0.06%, 7/5/38(a),(d) | 1,000,000 | ||||
1,000,000 | 1.44%, 4/15/28 | 1,010,802 | ||||
500,000 | 1.65%, 4/15/28(d) | 500,000 | ||||
|
| |||||
| 5,502,380 | ||||||
|
| |||||
Total U.S. Government Agency Obligations | 12,184,078 | |||||
|
| |||||
(Cost $12,282,937) | ||||||
Commercial Paper — 3.25% | ||||||
1,000,000 | Advocate Health Corp., 0.11%, 1/7/22(d) | 999,744 | ||||
1,500,000 | BJC Health System, 0.11%, 12/7/21(d) | 1,500,064 | ||||
1,500,000 | Carolinas Healthcare System, 0.11%, 10/19/21(d) | 1,499,880 | ||||
1,500,000 | Harris County Cultural Education Facilities, 0.09%, 10/18/21(d) | 1,500,004 | ||||
1,400,000 | Harris County Cultural Education Facilities, 0.10%, 11/1/21 | 1,399,997 | ||||
245,000 | Self-Help Federal Credit Union, 0.40%, 12/17/21(d) | 245,000 | ||||
|
| |||||
Total Commercial Paper | 7,144,689 | |||||
|
| |||||
(Cost $7,144,618) | ||||||
53
SCHEDULE OF PORTFOLIO INVESTMENTS
|
RBC Impact Bond Fund (cont.)
September 30, 2021
| Shares | Value | |||||
Investment Company — 0.27% | ||||||
600,418 | U.S. Government Money Market Fund, RBC Institutional Class 1(f) | $ | 600,418 | |||
|
| |||||
Total Investment Company | 600,418 | |||||
|
| |||||
(Cost $600,418) | ||||||
Total Investments | $ | 223,305,937 | ||||
|
| |||||
(Cost $223,650,463)(g) — 101.53% | ||||||
Liabilities in excess of other assets — (1.53)% | (3,357,017) | |||||
|
| |||||
NET ASSETS — 100.00% | $ | 219,948,920 | ||||
|
| |||||
| (a) | Floating rate note. Rate shown is as of report date. |
| (b) | Variable or floating rate security, which interest rate adjusts periodically based on changes in current interest rates and prepayments on the underlying pool of assets. Rate shown is the rate in effect as of period end. |
| (c) | Security exempt from registration under Rule 144A or Section 4(2) of the Securities Act of 1933, as amended. These securities may be resold in transactions exempt from registration, normally to qualified institutional buyers. |
| (d) | The Pricing Committee has fair valued this security under procedures established by the Fund’s Board of Trustees. |
| (e) | Zero Coupon Bond. The rate represents the yield at time of purchase. |
| (f) | Affiliated investment. |
| (g) | See Notes to Schedules of Portfolio Investments for the tax cost of securities and the breakdown of unrealized appreciation (depreciation). |
Financial futures contracts as of September 30, 2021:
Long Position | Number of Contracts | Expiration Date | Value/Unrealized Depreciation | Notional Value | Clearinghouse | |||||||||||||||||||||||
30 Year U.S. Ultra Treasury Bond | 117 | December 2021 | $ | (802,093) | USD | $ | 22,354,313 | | Barclays Capital Group | | ||||||||||||||||||
|
| |||||||||||||||||||||||||||
Total | $ | (802,093) | ||||||||||||||||||||||||||
|
| |||||||||||||||||||||||||||
54
SCHEDULE OF PORTFOLIO INVESTMENTS
|
RBC Impact Bond Fund (cont.)
September 30, 2021
Short Position | Number of Contracts | Expiration Date | Value/Unrealized Appreciation | Notional Value | Clearinghouse | |||||||||||||||||||||
10 Year U.S. Ultra Treasury Bond | 85 | December 2021 | $ | 233,775 | USD | $ | 12,346,250 | Barclays Capital Group | ||||||||||||||||||
Five Year U.S. Treasury Note | 75 | December 2021 | 64,578 | USD | 9,205,664 | Barclays Capital Group | ||||||||||||||||||||
|
| |||||||||||||||||||||||||
Total | $ | 298,353 | ||||||||||||||||||||||||
|
| |||||||||||||||||||||||||
Abbreviations used are defined below:
AGM - Assured Guaranty Municipal Corp.
BAM - Bank of America
FHA - Insured by Federal Housing Administration
GO - General Obligations
LIBOR - London Interbank Offered Rate
PSF-GTD - Permanent School Fund Guarantee
Q-SBLF - Qualified School Bond Loan Fund
SONYMA - State of New York Mortgage Agency
TBA - To-be-announced
USD - United States Dollar
See Notes to the Financial Statements.
55
|
Statements of Assets and Liabilities
September 30, 2021
| Access Capital Community Investment Fund | RBC Impact Bond Fund | |||||||||
Assets: | ||||||||||
Investments in securities, at value: | ||||||||||
Unaffiliated investments (cost $708,113,350 and $223,050,045, respectively) | $ | 715,311,208 | $ | 222,705,519 | ||||||
Affiliated investments (cost $30,836,880 and $600,418, respectively) | 30,836,880 | 600,418 | ||||||||
Cash | — | 3,462 | ||||||||
Cash at broker for financial futures contracts | 1,812,400 | 1,098,770 | ||||||||
Interest and dividend receivable | 1,914,790 | 856,780 | ||||||||
Receivable for capital shares issued | 1,723,430 | 217,892 | ||||||||
Receivable for investments sold | 561,629 | 58,299 | ||||||||
Unrealized appreciation on futures contracts | 1,069,529 | 298,353 | ||||||||
Prepaid expenses and other assets | 24,822 | 47,403 | ||||||||
|
|
|
| |||||||
Total Assets | 753,254,688 | 225,886,896 | ||||||||
|
|
|
| |||||||
Liabilities: | ||||||||||
Foreign withholding tax payable | 6,190 | 6,190 | ||||||||
Distributions payable | 407,780 | 5,737 | ||||||||
Payable for capital shares redeemed | 307,343 | 9,342 | ||||||||
Payable for investments purchased | 4,913,515 | 5,017,076 | ||||||||
Unrealized depreciation on futures contracts | — | 802,093 | ||||||||
Accrued expenses and other payables: | ||||||||||
Investment advisory fees | 144,099 | 8,407 | ||||||||
Accounting fees | 10,216 | 5,846 | ||||||||
Audit fees | 42,777 | 26,433 | ||||||||
Trustees’ fees | 1,361 | 33 | ||||||||
Distribution fees | 5,955 | 47 | ||||||||
Custodian fees | 8,414 | 1,937 | ||||||||
Shareholder reports | 24,589 | 4,003 | ||||||||
Shareholder servicing fees | 28,821 | — | ||||||||
Transfer agent fees | 65,742 | 35,843 | ||||||||
Other | 50,253 | 14,989 | ||||||||
|
|
|
| |||||||
Total Liabilities | 6,017,055 | 5,937,976 | ||||||||
|
|
|
| |||||||
Net Assets | $ | 747,237,633 | $ | 219,948,920 | ||||||
|
|
|
| |||||||
Net Assets Consists of: | ||||||||||
Capital | $ | 773,593,519 | $ | 219,586,861 | ||||||
Accumulated earnings | (26,355,886 | ) | 362,059 | |||||||
|
|
|
| |||||||
Net Assets | $ | 747,237,633 | $ | 219,948,920 | ||||||
|
|
|
| |||||||
56
FINANCIAL STATEMENTS
|
Statements of Assets and Liabilities (cont.)
September 30, 2021
| Access Capital Community Investment Fund | RBC Impact Bond Fund | |||||||||||||||
Net Assets | ||||||||||||||||
Class A | $ | 14,233,191 | $ | 21,486 | ||||||||||||
Class I | 701,767,817 | 77,792,590 | ||||||||||||||
Class IS | 31,236,625 | N/A | ||||||||||||||
Class R6 | N/A | 81,761,818 | ||||||||||||||
Class Y | N/A | 60,373,026 | ||||||||||||||
|
|
|
| |||||||||||||
Total | $ | 747,237,633 | $ | 219,948,920 | ||||||||||||
|
|
|
| |||||||||||||
Shares Outstanding (Unlimited number of shares authorized, no par value): | ||||||||||||||||
Class A | 1,594,032 | 2,112 | ||||||||||||||
Class I | 78,636,805 | 7,633,451 | ||||||||||||||
Class IS | 3,503,318 | N/A | ||||||||||||||
Class R6 | N/A | 8,020,741 | ||||||||||||||
Class Y | N/A | 5,927,534 | ||||||||||||||
|
|
|
| |||||||||||||
Total | 83,734,155 | 21,583,838 | ||||||||||||||
|
|
|
| |||||||||||||
Net Asset Values and Redemption Prices Per Share: | ||||||||||||||||
Class A | $ | 8.93 | $ | 10.17 | ||||||||||||
|
|
|
| |||||||||||||
Class I | $ | 8.92 | $ | 10.19 | ||||||||||||
|
|
|
| |||||||||||||
Class IS | $ | 8.92 | $ | N/A | ||||||||||||
|
|
|
| |||||||||||||
Class R6 | $ | N/A | $ | 10.19 | ||||||||||||
|
|
|
| |||||||||||||
Class Y | $ | N/A | $ | 10.19 | ||||||||||||
|
|
|
| |||||||||||||
Maximum Offering Price Per Share: | ||||||||||||||||
Class A | $ | 9.28 | $ | 10.57 | ||||||||||||
|
|
|
| |||||||||||||
Maximum Sales Charge - Class A | 3.75 | % | 3.75 | % | ||||||||||||
|
|
|
| |||||||||||||
See Notes to the Financial Statements.
57
FINANCIAL STATEMENTS
|
For the Year Ended September 30, 2021
| Access Capital Community Investment Fund | RBC Impact Bond Fund | |||||||||||||||
Investment Income: | ||||||||||||||||
Interest income | $ | 12,827,180 | $ | 1,557,939 | ||||||||||||
Dividend income - affiliated | 8,238 | 1,063 | ||||||||||||||
|
| �� |
|
| ||||||||||||
Total Investment Income | 12,835,418 | 1,559,002 | ||||||||||||||
Expenses: | ||||||||||||||||
Investment advisory fees | 2,403,508 | 358,438 | ||||||||||||||
Distribution fees–Class A | 38,369 | 38 | ||||||||||||||
Accounting fees | 186,435 | 67,779 | ||||||||||||||
Audit fees | 54,613 | 39,583 | ||||||||||||||
Custodian fees | 48,661 | 8,745 | ||||||||||||||
Insurance fees | 8,062 | 1,806 | ||||||||||||||
Legal fees | 21,710 | 40,874 | ||||||||||||||
Registrations and filing fees | 86,813 | 54,354 | ||||||||||||||
Shareholder reports | 78,532 | 34,120 | ||||||||||||||
Transfer agent fees–Class A | 28,331 | 8,237 | ||||||||||||||
Transfer agent fees–Class I | 254,373 | 34,303 | ||||||||||||||
Transfer agent fees–Class IS | 30,860 | — | ||||||||||||||
Transfer agent fees–Class R6 | — | 3,761 | ||||||||||||||
Transfer agent fees–Class Y | — | 13,723 | ||||||||||||||
Trustees’ fees and expenses | 23,633 | 2,864 | ||||||||||||||
Shareholder services administration fees–Class I | 323,466 | — | ||||||||||||||
Tax expense | 4,220 | 4,219 | ||||||||||||||
Other fees | 11,585 | 5,736 | ||||||||||||||
|
|
|
| |||||||||||||
Total expenses before fee waiver/reimbursement | 3,603,171 | 678,580 | ||||||||||||||
Expenses waived/reimbursed by: | ||||||||||||||||
Advisor | (471,450 | ) | (249,454 | ) | ||||||||||||
|
|
|
| |||||||||||||
Net expenses | 3,131,721 | 429,126 | ||||||||||||||
|
|
|
| |||||||||||||
Net Investment Income | 9,703,697 | 1,129,876 | ||||||||||||||
|
|
|
| |||||||||||||
Realized/Unrealized Gains/(Losses): | ||||||||||||||||
Net realized gains/(losses) on: | ||||||||||||||||
Investment transactions | 1,090 | 107,935 | ||||||||||||||
Futures contracts | 3,596,886 | 1,222,657 | ||||||||||||||
|
|
|
| |||||||||||||
Net realized gains | 3,597,976 | 1,330,592 | ||||||||||||||
Net change in unrealized appreciation/ | ||||||||||||||||
(depreciation) on: | ||||||||||||||||
Investments | (16,757,276 | ) | (2,051,789 | ) | ||||||||||||
Futures contracts | 1,172,022 | (488,193 | ) | |||||||||||||
|
|
|
| |||||||||||||
Net unrealized losses | (15,585,254 | ) | (2,539,982 | ) | ||||||||||||
|
|
|
| |||||||||||||
Change in net assets resulting from operations | $ | (2,283,581 | ) | $ | (79,514 | ) | ||||||||||
|
|
|
| |||||||||||||
See Notes to the Financial Statements.
58
FINANCIAL STATEMENTS
|
Statements of Changes in Net Assets
| Access Capital Community Investment Fund | ||||||||||||||||
For the Year Ended | For the Year Ended | |||||||||||||||
From Investment Activities | ||||||||||||||||
Operations: | ||||||||||||||||
Net investment income | $ | 9,703,697 | $ | 11,658,112 | ||||||||||||
Net realized gains/(losses) from investments and futures contracts | 3,597,976 | (740,249 | ) | |||||||||||||
Net change in unrealized appreciation/(depreciation) on investments and futures contracts | (15,585,254 | ) | 11,988,663 | |||||||||||||
|
|
|
| |||||||||||||
Change in net assets resulting from operations | (2,283,581 | ) | 22,906,526 | |||||||||||||
|
|
|
| |||||||||||||
Distributions to Shareholders: | ||||||||||||||||
Class A | (246,708 | ) | (371,478 | ) | ||||||||||||
Class I | (12,633,263 | ) | (13,625,108 | ) | ||||||||||||
Class IS | (486,652 | ) | (226,620 | ) | ||||||||||||
|
|
|
| |||||||||||||
Change in net assets resulting from shareholder distributions | (13,366,623 | ) | (14,223,206 | ) | ||||||||||||
|
|
|
| |||||||||||||
Capital Transactions: | ||||||||||||||||
Proceeds from shares issued | 239,477,070 | 100,742,546 | ||||||||||||||
Distributions reinvested | 8,052,034 | 8,099,938 | ||||||||||||||
Cost of shares redeemed | (79,442,472 | ) | (96,436,327 | ) | ||||||||||||
|
|
|
| |||||||||||||
Change in net assets resulting from capital transactions | 168,086,632 | 12,406,157 | ||||||||||||||
|
|
|
| |||||||||||||
Net increase in net assets | 152,436,428 | 21,089,477 | ||||||||||||||
Net Assets: | ||||||||||||||||
Beginning of year | 594,801,205 | 573,711,728 | ||||||||||||||
|
|
|
| |||||||||||||
End of year | $ | 747,237,633 | $ | 594,801,205 | ||||||||||||
|
|
|
| |||||||||||||
Share Transactions: | ||||||||||||||||
Issued | 26,470,734 | 11,054,493 | ||||||||||||||
Reinvested | 892,352 | 891,784 | ||||||||||||||
Redeemed | (8,792,062 | ) | (10,579,568 | ) | ||||||||||||
|
|
|
| |||||||||||||
Change in shares resulting from capital transactions | 18,571,024 | 1,366,709 | ||||||||||||||
|
|
|
| |||||||||||||
See Notes to the Financial Statements.
59
FINANCIAL STATEMENTS
|
Statements of Changes in Net Assets
| RBC Impact Bond Fund | ||||||||||||||||
| For the Year Ended September 30, 2021 | For the Year Ended September 30, 2020 | |||||||||||||||
From Investment Activities | ||||||||||||||||
Operations: | ||||||||||||||||
Net investment income | $ | 1,129,876 | $ | 642,284 | ||||||||||||
Net realized gains from investments and futures contracts | 1,330,592 | 692,253 | ||||||||||||||
Net change in unrealized appreciation/(depreciation) on investments and futures contracts | (2,539,982 | ) | 914,448 | |||||||||||||
|
|
|
| |||||||||||||
Change in net assets resulting from operations | (79,514 | ) | 2,248,985 | |||||||||||||
|
|
|
| |||||||||||||
Distributions to Shareholders: | ||||||||||||||||
Class A | (300 | ) | (123 | ) | ||||||||||||
Class I | (829,502 | ) | (504,754 | ) | ||||||||||||
Class R6 | (691,803 | ) | (512,336 | ) | ||||||||||||
Class Y | (275,265 | ) | — | |||||||||||||
|
|
|
| |||||||||||||
Change in net assets resulting from shareholder distributions | (1,796,870 | ) | (1,017,213 | ) | ||||||||||||
|
|
|
| |||||||||||||
Capital Transactions: | ||||||||||||||||
Proceeds from shares issued | 187,535,964 | 15,802,469 | ||||||||||||||
Distributions reinvested | 1,736,264 | 1,007,542 | ||||||||||||||
Cost of shares redeemed | (5,232,227 | ) | (3,881,189 | ) | ||||||||||||
|
|
|
| |||||||||||||
Change in net assets resulting from capital transactions | 184,040,001 | 12,928,822 | ||||||||||||||
|
|
|
| |||||||||||||
Net increase in net assets | 182,163,617 | 14,160,594 | ||||||||||||||
Net Assets: | ||||||||||||||||
Beginning of year | 37,785,303 | 23,624,709 | ||||||||||||||
|
|
|
| |||||||||||||
End of year | $ | 219,948,920 | $ | 37,785,303 | ||||||||||||
|
|
|
| |||||||||||||
Share Transactions: | ||||||||||||||||
Issued | 18,353,758 | 1,539,606 | ||||||||||||||
Reinvested | 167,889 | 98,083 | ||||||||||||||
Redeemed | (505,635 | ) | (380,982 | ) | ||||||||||||
|
|
|
| |||||||||||||
Change in shares resulting from capital transactions | 18,016,012 | 1,256,707 | ||||||||||||||
|
|
|
| |||||||||||||
See Notes to the Financial Statements.
60
|
Access Capital Community Investment Fund
(Selected data for a share outstanding throughout the periods indicated)
| Investment Activities | Distributions | |||||||||||||||||||||||||||
| Net Asset Value, Beginning of Year | Net Investment Income(a) | Net Realized and Unrealized Gains (Losses) on Investments | Total from Investment Activities | Net Investment Income | Total Distributions | Net Asset Value, End of Year | ||||||||||||||||||||||
Class A | ||||||||||||||||||||||||||||
Year Ended 9/30/21 | $9.13 | 0.10 | (0.15 | ) | (0.05 | ) | (0.15 | ) | (0.15 | ) | $8.93 | |||||||||||||||||
Year Ended 9/30/20 | 9.00 | 0.16 | 0.17 | 0.33 | (0.20 | ) | (0.20 | ) | 9.13 | |||||||||||||||||||
Year Ended 9/30/19 | 8.62 | 0.19 | 0.41 | 0.60 | (0.22 | ) | (0.22 | ) | 9.00 | |||||||||||||||||||
Year Ended 9/30/18 | 9.02 | 0.18 | (0.37 | ) | (0.19 | ) | (0.21 | ) | (0.21 | ) | 8.62 | |||||||||||||||||
Year Ended 9/30/17 | 9.26 | 0.18 | (0.20 | ) | (0.02 | ) | (0.22 | ) | (0.22 | ) | 9.02 | |||||||||||||||||
Class I | ||||||||||||||||||||||||||||
Year Ended 9/30/21 | $9.13 | 0.13 | (0.16 | ) | (0.03 | ) | (0.18 | ) | (0.18 | ) | $8.92 | |||||||||||||||||
Year Ended 9/30/20 | 8.99 | 0.19 | 0.18 | 0.37 | (0.23 | ) | (0.23 | ) | 9.13 | |||||||||||||||||||
Year Ended 9/30/19 | 8.62 | 0.22 | 0.40 | 0.62 | (0.25 | ) | (0.25 | ) | 8.99 | |||||||||||||||||||
Year Ended 9/30/18 | 9.02 | 0.21 | (0.37 | ) | (0.16 | ) | (0.24 | ) | (0.24 | ) | 8.62 | |||||||||||||||||
Year Ended 9/30/17 | 9.25 | 0.21 | (0.19 | ) | 0.02 | (0.25 | ) | (0.25 | ) | 9.02 | ||||||||||||||||||
Class IS | ||||||||||||||||||||||||||||
Year Ended 9/30/21 | $9.12 | 0.13 | (0.15 | ) | (0.02 | ) | (0.18 | ) | (0.18 | ) | $8.92 | |||||||||||||||||
Year Ended 9/30/20 | 8.98 | 0.19 | 0.18 | 0.37 | (0.23 | ) | (0.23 | ) | 9.12 | |||||||||||||||||||
Period Ended 9/30/19(b) | 8.73 | 0.13 | 0.26 | 0.39 | (0.14 | ) | (0.14 | ) | 8.98 | |||||||||||||||||||
| (a) | Per share net investment income (loss) has been calculated using the average daily shares method. |
| (b) | For the period from March 11, 2019, (commencement of operations) to September 30, 2019. |
61
FINANCIAL HIGHLIGHTS
|
Access Capital Community Investment Fund
(Selected data for a share outstanding throughout the periods indicated)
| Ratios/Supplemental Data | |||||||||||||||||||||||||||||||||||
| Total Return(a)(b) | Net Assets, End of Year (000’s) | Ratio of Net Expenses to Average Net Assets | Ratio of Expenses to Average Net Assets After Fees Waived/ Reimbursed and Excluding Interest Expense | Ratio of Net Investment Income (Loss) to Average Net Assets | Ratio of Expenses to Average Net Assets* | Portfolio Turnover Rate** | |||||||||||||||||||||||||||||
Class A | |||||||||||||||||||||||||||||||||||
Year Ended 9/30/21 | (0.61)% | $ | 14,233 | 0.80% | 0.80% | 1.07% | 0.86% | 25% | |||||||||||||||||||||||||||
Year Ended 9/30/20 | 3.65% | 16,662 | 0.80% | 0.80% | 1.71% | 0.90% | 23% | ||||||||||||||||||||||||||||
Year Ended 9/30/19 | 7.03% | 17,583 | 0.95% | (c) | 0.87% | 2.18% | 1.11% | 12% | |||||||||||||||||||||||||||
Year Ended 9/30/18 | (2.12)% | 22,258 | 1.06% | 0.95% | 2.10% | 1.20% | 20% | ||||||||||||||||||||||||||||
Year Ended 9/30/17 | (0.24)% | 24,568 | 0.99% | 0.95% | 2.01% | 1.09% | 17% | ||||||||||||||||||||||||||||
Class I | |||||||||||||||||||||||||||||||||||
Year Ended 9/30/21 | (0.37)% | $ | 701,768 | 0.45% | 0.45% | 1.42% | 0.52% | 25% | |||||||||||||||||||||||||||
Year Ended 9/30/20 | 4.13% | 562,573 | 0.45% | 0.45% | 2.06% | 0.51% | 23% | ||||||||||||||||||||||||||||
Year Ended 9/30/19 | 7.27% | 550,213 | 0.60% | (c) | 0.53% | 2.53% | 0.66% | 12% | |||||||||||||||||||||||||||
Year Ended 9/30/18 | (1.79)% | 568,592 | 0.73% | 0.61% | 2.44% | 0.73% | 20% | ||||||||||||||||||||||||||||
Year Ended 9/30/17 | 0.23% | 619,328 | 0.63% | 0.58% | 2.38% | 0.64% | 17% | ||||||||||||||||||||||||||||
Class IS | |||||||||||||||||||||||||||||||||||
Year Ended 9/30/21 | (0.21)% | $ | 31,237 | 0.40% | 0.40% | 1.47% | 0.55% | 25% | |||||||||||||||||||||||||||
Year Ended 9/30/20 | 4.19% | 15,566 | 0.40% | 0.40% | 2.06% | 0.59% | 23% | ||||||||||||||||||||||||||||
Period Ended 9/30/19(d) | 4.33% | (e) | 5,916 | 0.40% | (f) | 0.40% | (f) | 2.61% | (f) | 0.73% | (f) | 12% | |||||||||||||||||||||||
| * | During the period, certain fees were contractually or voluntarily reduced and/or reimbursed. If such contractual/voluntary fee reductions and reimbursements had not occurred, the ratio would have been as indicated. |
| ** | Portfolio turnover rate is calculated on the basis of the Fund as a whole without distinguishing between the classes of shares issued. |
| (a) | Excludes sales charge. |
| (b) | Assumes investment at net asset value at the beginning of the period, reinvestment of all dividends and distributions, and a complete redemption of the investment at net asset value at the end of the period. |
| (c) | Beginning March 11, 2019, the net operating expenses were contractually limited to 0.80% and 0.45% for Class A and Class I respectively. The ratio of net expenses to average net assets represents a blended percentage for the period ended September 30, 2019. |
| (d) | For the period from March 11, 2019, (commencement of operations) to September 30, 2019. |
| (e) | Not annualized. |
| (f) | Annualized. |
See Notes to the Financial Statements.
62
FINANCIAL HIGHLIGHTS
|
RBC Impact Bond Fund
(Selected data for a share outstanding throughout the periods indicated)
| Investment Activities | Distributions | |||||||||||||||||||||||||||||||
| Net Asset Value, Beginning of Period | Net Investment Income(a) | Net Realized and Unrealized Gains (Losses) on Investments | Total from Investment Activities | Net Investment Income | Net Realized Gains | Total Distributions | Net Asset Value, End of Year | |||||||||||||||||||||||||
Class A | ||||||||||||||||||||||||||||||||
Year Ended 9/30/21 | $10.58 | 0.09 | (0.24) | (0.15) | (0.12) | (0.14) | (0.26) | $10.17 | ||||||||||||||||||||||||
Period Ended 9/30/20(b) | 10.15 | 0.11 | 0.44 | 0.55 | (0.12) | — | (0.12) | 10.58 | ||||||||||||||||||||||||
Class I | ||||||||||||||||||||||||||||||||
Year Ended 9/30/21 | $10.59 | 0.12 | (0.23) | (0.11) | (0.15) | (0.14) | (0.29) | $10.19 | ||||||||||||||||||||||||
Year Ended 9/30/20 | 10.22 | 0.20 | 0.52 | 0.72 | (0.23) | (0.12) | (0.35) | 10.59 | ||||||||||||||||||||||||
Year Ended 9/30/19 | 9.61 | 0.26 | 0.62 | 0.88 | (0.27) | — | (0.27) | 10.22 | ||||||||||||||||||||||||
Period Ended 9/30/18(c) | 10.00 | 0.17 | (0.38) | (0.21) | (0.18) | — | (0.18) | 9.61 | ||||||||||||||||||||||||
Class R6 | ||||||||||||||||||||||||||||||||
Year Ended 9/30/21 | $10.60 | 0.12 | (0.24) | (0.12) | (0.15) | (0.14) | (0.29) | $10.19 | ||||||||||||||||||||||||
Year Ended 9/30/20 | 10.22 | 0.21 | 0.52 | 0.73 | (0.23) | (0.12) | (0.35) | 10.60 | ||||||||||||||||||||||||
Year Ended 9/30/19 | 9.61 | 0.27 | 0.61 | 0.88 | (0.27) | — | (0.27) | 10.22 | ||||||||||||||||||||||||
Period Ended 9/30/18(c) | 10.00 | 0.18 | (0.39) | (0.21) | (0.18) | — | (0.18) | 9.61 | ||||||||||||||||||||||||
Class Y | ||||||||||||||||||||||||||||||||
Period Ended 9/30/21(d) | $10.15 | 0.05 | 0.04 | 0.09 | (0.05) | — | (0.05) | $10.19 | ||||||||||||||||||||||||
| (a) | Per share net investment income (loss) has been calculated using the average daily shares method. |
| (b) | For the period from January 28, 2020 (commencement of operations) to September 30, 2020. |
| (c) | For the period from December 18, 2017 (commencement of operations) to September 30, 2018. |
| (d) | For the period from April 12, 2021 (commencement of operations) to September 30, 2021. |
63
FINANCIAL HIGHLIGHTS
|
RBC Impact Bond Fund
(Selected data for a share outstanding throughout the periods indicated)
| Ratios/Supplemental Data | ||||||||||||||||||||||||
| Total Return(a)(b) | Net Assets, End of Year (000’s) | Ratio of Net Expenses to Average Net Assets | Ratio of Net Investment Income (Loss) to Average Net Assets | Ratio of Expenses to Average Net Assets* | Portfolio Turnover Rate** | |||||||||||||||||||
Class A | ||||||||||||||||||||||||
Year Ended 9/30/21 | (1.47)% | $ 21 | 0.70% | 0.91% | 54.43% | 36 | % | |||||||||||||||||
Period Ended 9/30/20(c) | 5.48%(d) | 11 | 0.70%(e) | 1.56%(e) | 85.65%(e) | 31 | % | |||||||||||||||||
Class I | ||||||||||||||||||||||||
Year Ended 9/30/21 | (1.13)% | $77,793 | 0.45% | 1.14% | 0.73% | 36 | % | |||||||||||||||||
Year Ended 9/30/20 | 7.18% | 21,661 | 0.45% | 1.94% | 1.08% | 31 | % | |||||||||||||||||
Year Ended 9/30/19 | 9.27% | 6,467 | 0.45% | 2.67% | 1.62% | 175 | % | |||||||||||||||||
Period Ended 9/30/18(f) | (2.14)%(d) | 2,630 | 0.45%(e) | 2.29%(e) | 3.82%(e) | 329 | % | |||||||||||||||||
Class R6 | ||||||||||||||||||||||||
Year Ended 9/30/21 | (1.17)% | $81,762 | 0.40% | 1.14% | 0.62% | 36 | % | |||||||||||||||||
Year Ended 9/30/20 | 7.33% | 16,113 | 0.40% | 2.06% | 0.97% | 31 | % | |||||||||||||||||
Year Ended 9/30/19 | 9.33% | 17,158 | 0.40% | 2.73% | 1.52% | 175 | % | |||||||||||||||||
Period Ended 9/30/18(f) | (2.10)%(d) | 2,447 | 0.40%(e) | 2.33%(e) | 3.70%(e) | 329 | % | |||||||||||||||||
Class Y | ||||||||||||||||||||||||
Period Ended 9/30/21(g) | 0.90%(d) | $60,373 | 0.40%(e) | 0.99%(e) | 0.59%(e) | 36 | % | |||||||||||||||||
| * | During the period, certain fees were contractually or voluntarily reduced and/or reimbursed. If such contractual/voluntary fee reductions and reimbursements had not occurred, the ratio would have been as indicated. |
| ** | Portfolio turnover rate is calculated on the basis of the Fund as a whole without distinguishing between the classes of shares issued. |
| (a) | Excludes sales charge. |
| (b) | Assumes investment at net asset value at the beginning of the period, reinvestment of all dividends and distributions, and a complete redemption of the investment at net asset value at the end of the period. |
| (c) | For the period from January 28, 2020 (commencement of operations) to September 30, 2020. |
| (d) | Not annualized. |
| (e) | Annualized. |
| (f) | For the period from December 18, 2017 (commencement of operations) to September 30, 2018. |
| (g) | For the period from April 12, 2021 (commencement of operations) to September 30, 2021. |
See Notes to the Financial Statements.
64
|
September 30, 2021
1. Organization:
RBC Funds Trust (the “Trust”) is registered under the Investment Company Act of 1940 (as amended) as an open-end management investment company. The Trust was organized as a Delaware statutory trust on December 16, 2003 and currently consists of 16 portfolios. Overall responsibility for the management of the Trust is vested in its Board of Trustees (the “Board”). The predecessor fund for the Access Capital Community Investment Fund was reorganized into a series of the Trust, effective July 28, 2008. This report includes the following two investment portfolios (each a “Fund” and collectively, the “Funds”):
- Access Capital Community Investment Fund
- RBC Impact Bond Fund (“Impact Bond Fund”)
The Access Capital Community Investment Fund offers three share classes: Class A, Class I and Class IS shares. The Impact Bond Fund offers four share classes: Class A, Class I, Class R6, and Class Y shares. Class A shares are offered with a 3.75% maximum front-end sales charge and a 1.00% contingent deferred sales charge (“CDSC”) for redemption within 12 months of a $1 million or greater purchase on which no front-end sales charge was paid. Class I, Class IS, Class R6 and Class Y shares (intended for investors meeting certain investment minimum thresholds) are not subject to either a front-end sales charge or a CDSC.
RBC Global Asset Management (U.S.) Inc. (“RBC GAM-US” or “Advisor” or “Co-Administrator”) acts as the investment advisor for the Fund. The officers of the Trust (“Fund Management”) are also employees of RBC GAM-US or its affiliates.
2. Significant Accounting Policies
Each Fund is an investment company that follows accounting and reporting guidance under the Financial Accounting Standards Board. Summarized below are the significant accounting policies of the Funds. These policies conform to accounting principles generally accepted in the United States of America (“U.S. GAAP”). Fund Management follows these policies when preparing financial statements. Fund Management may also be required to make estimates and assumptions that affect the reported amounts of assets and liabilities at the date of the financial statements and the reported amounts of income and expenses for the period. Actual results could differ from those estimates. The financial statements are as of the close of regular trading on the New York Stock Exchange (“NYSE”).
Security Valuation:
The Board has adopted pricing and valuation procedures for determining the fair value of each Fund’s investments. Fair value of a security is considered to be the price that a fund might reasonably expect to receive upon its current sale in an orderly transaction between market participants.
Fixed income securities, including to-be-announced (“TBA”) commitments and municipal bonds, are generally valued based on evaluated prices received from third-party pricing services or from broker-dealers who make markets in the securities and are generally categorized as Level 2 in the fair value hierarchy (see “Fair Value Measurements” below for additional information). The pricing services utilize both dealer-supplied valuations and electronic data processing techniques that take into account multiple appropriate factors such as institutional-size trading in similar groups of securities, market spreads, interest rates, and fundamental security analytical data including yield, quality, coupon rate, maturity and type of issue.
Mortgage-related securities represent direct or indirect participation in, or are secured by and payable from, mortgage loans secured by real property and include pass-through securities and collateralized mortgage obligations. These securities may be issued or guaranteed by U.S. Government agencies or instrumentalities, or private issuers, including commercial banks, savings and loan institutions, private mortgage insurance bankers and other secondary market issuers. These mortgage-related securities are generally valued by pricing services that use broker-dealer quotations or valuation estimates from their internal pricing models. These pricing models generally consider such factors as current market data, estimated cash flows, market-based yield spreads, and estimated prepayment rates. Securities valued using such techniques and inputs are generally categorized as Level 2 in the fair value hierarchy. To the extent significant inputs are unobservable, the securities will be categorized as Level 3.
65
NOTES TO FINANCIAL STATEMENTS
|
Exchange-traded futures are valued at the last sale price at the close of the market on the principal exchange on which they are traded and are categorized as Level 1 in the fair value hierarchy. Investments in open-end investment companies (mutual funds) are valued at net asset value and are categorized as Level 1 in the fair value hierarchy.
The Board has delegated to the Funds’ Pricing Committee (“Pricing Committee”) the responsibility for implementing the pricing and valuation procedures, including responsibility for determining the fair value of the Funds’ securities or other assets and liabilities. The Pricing Committee includes representatives of the Funds’ Advisor, and Co-Administrator, including personnel from accounting and operations, investment management, trading, risk management and compliance. The Pricing Committee meets at least quarterly to review and approve Fund valuation matters, including a review of the Funds’ pricing activity and operations, fair value measurements, pricing vendors, policies and procedures, and related controls. At least a quorum of the Pricing Committee shall meet more frequently, as needed, to consider and approve time-sensitive fair valuation matters. The Pricing Committee reports to the Valuation, Portfolio Management and Performance Committee (“Valuation Committee”) of the Board. Members of the Pricing Committee meet with the Valuation Committee and the Board at each of their regularly scheduled meetings to discuss valuation matters and actions taken during the period.
The Board has adopted procedures to determine the fair value of a security when a price is not available from a pricing service or broker- dealer or Fund Management determines that a price provided by a pricing service or broker-dealer does not approximate fair value. Fair valuation may also be used when a significant valuation event affecting the value of a security or market sector is determined to have occurred between the time when a security’s market closes and the time the Fund’s net asset value is calculated. The fair value of the security will be determined in good faith by the Pricing Committee in accordance with procedures and methodologies adopted by the Board. General factors used in determining the fair value of securities include, but are not limited to, fundamental analytical data relating to the security, the issuer and the market, such as duration, prepayment and default rates; general level of interest rates and changes in interest rates; information from broker-dealers; trading in similar securities; any restrictions on disposition of the security; and an evaluation of the forces that influence the market in which the investments are traded. These securities are either categorized as Level 2 or 3 in the fair value hierarchy, depending on the relevant inputs used.
When the Funds utilize fair valuation methods that use significant unobservable inputs to determine a security’s value, such securities will be categorized as Level 3 of the fair value hierarchy. These methods may require subjective determinations about the value of a security. While the Funds’ policy is intended to result in a calculation of a Fund’s net asset value that fairly reflects security values as of the time of pricing, the Funds cannot guarantee that values determined by the Board or persons acting at their direction would accurately reflect the price that the Funds could obtain for a security if they were to dispose of it as of the time of pricing (for instance, in a forced or distressed sale). The prices used by the Funds may differ from the value that would be realized if the securities were sold.
The Funds’ Pricing Committee employs various methods for calibrating the valuation approach related to securities categorized within Level 2 and Level 3 of the fair value hierarchy. These methods may include regular due diligence of the Funds’ pricing vendors, a regular review of key inputs and assumptions, transaction back-testing or disposition analysis to compare unrealized gains and losses to realized gains and losses, reviews of missing and stale prices and large movements in market value, and reviews of any market related activities. Additionally, the pricing of all fair value holdings is subsequently reported to the Valuation Committee and Board.
66
|
Fair Value Measurements:
The Funds disclose the fair value of their investments in a hierarchy that categorizes investments based on the inputs to valuation techniques used to measure fair value. The three levels of the fair value hierarchy are as follows:
• Level 1 - Inputs that reflect unadjusted quoted prices in active markets for identical assets or liabilities that the Funds have the ability to access at the measurement date.
• Level 2 - Significant inputs other than quoted prices that are observable for the asset or liability either directly or indirectly, including inputs in markets that are not considered to be active. Observable inputs may include quoted prices for similar securities, interest rates, spreads, prepayment spreads, etc.
• Level 3 - Significant unobservable inputs based on the best information available in the circumstances, to the extent observable inputs are not available (including the Fund’s own assumptions in determining the fair value of investments).
The inputs or methodology used for valuing investments are not necessarily an indication of the risk associated with investing in those securities.
Inputs used in determining fair value of an investment may include, but are not limited to, price information, volatility statistics, credit and market data, and other factors, all of which may be either observable or unobservable. Inputs can vary among investments and will be impacted by the investment type and volume of activity for the particular security or similar securities in the market. Investments in the Level 3 category are generally supported by transactions and quoted prices from dealers participating in the market for those investments. Investments may be included in the Level 3 category due to a lack of market activity or transparency. Internal valuation models may also be used as a pricing source for Level 3 investments. Internal valuation models may rely on one or more unobservable inputs, such as estimated cash flows, financial statement analysis and discount rates.
The summary of inputs used to determine the fair value of the Funds’ investments as of September 30, 2021 is as follows:
| Level 1 Quoted Prices | Level 2 Significant Observable Inputs | Level 3 Significant Unobservable Inputs | Total | |||||||||||||||||
Access Capital Community | ||||||||||||||||||||
Investment Fund | ||||||||||||||||||||
Assets: | ||||||||||||||||||||
Investments in Securities | ||||||||||||||||||||
Municipal Bonds | $ | — | $ | 28,388,806 | $ | — | $ | 28,388,806 | ||||||||||||
U.S. Government Agency Backed Mortgages | — | 631,610,158 | — | 631,610,158 | ||||||||||||||||
U.S. Government Agency Obligations | — | 53,721,147 | 48,368 | 53,769,515 | ||||||||||||||||
Investment Company | 30,836,880 | — | — | 30,836,880 | ||||||||||||||||
Corporate Bonds | — | 1,542,729 | — | 1,542,729 | ||||||||||||||||
Other Financial Instruments* | ||||||||||||||||||||
Financial futures contracts | 1,069,529 | — | — | 1,069,529 | ||||||||||||||||
|
|
|
|
|
|
|
| |||||||||||||
Total Assets | $ | 31,906,409 | $ | 715,262,840 | $48,368 | $ | 747,217,617 | |||||||||||||
|
|
|
|
|
|
|
| |||||||||||||
67
NOTES TO FINANCIAL STATEMENTS
|
Impact Bond Fund | ||||||||||||||||
Assets: | ||||||||||||||||
Investments in Securities | ||||||||||||||||
Municipal Bonds | $ | — | $ | 63,511,477 | $ | — | $ | 63,511,477 | ||||||||
U.S. Government Agency Backed Mortgages | — | 65,015,366 | — | 65,015,366 | ||||||||||||
U.S. Government Agency Obligations | — | 12,184,078 | — | 12,184,078 | ||||||||||||
Asset Backed Securities | — | 13,930,708 | — | 13,930,708 | ||||||||||||
Commercial Paper | — | 7,144,689 | — | 7,144,689 | ||||||||||||
Investment Company | 600,418 | — | — | 600,418 | ||||||||||||
Corporate Bonds | — | 60,919,201 | — | 60,919,201 | ||||||||||||
Other Financial Instruments* | ||||||||||||||||
Financial futures contracts | 298,353 | — | — | 298,353 | ||||||||||||
|
|
|
|
|
|
|
| |||||||||
Total Assets | $ | 898,771 | $ | 222,705,519 | $ | — | $ | 223,604,290 | ||||||||
|
|
|
|
|
|
|
| |||||||||
Liabilities: | ||||||||||||||||
Other Financial Instruments* | ||||||||||||||||
Financial futures contracts | $ | (802,093 | ) | $ | — | $ | — | $ | (802,093) | |||||||
|
|
|
|
|
|
|
|
*Other financial instruments are instruments shown on the Schedule of Portfolio Investments, such as futures contracts which are valued at fair value.
The following is a reconciliation of Level 3 investments for which significant unobservable inputs were used to determine fair value:
| Access Capital | ||||
| Community | ||||
| Investment Fund | ||||
| U.S. Government Agency Obligations– (Small Business Administration) | ||||
Balance as of 9/30/20(value) | $ 48,673 | |||
Change in unrealized appreciation (depreciation) | (305) | |||
Balance as of 9/30/21(value) | $ 48,368 | |||
The Access Capital Community Investment Fund’s assets assigned to the Level 3 category were valued using the valuation methodology and technique deemed most appropriate in the circumstances. The significant unobservable inputs used include assumptions regarding the particular security’s cash flow profile, prepayments and potential defaults which may not be generally observable for either the security or for assets of a similar type. Inputs with respect to variable rate securities may also include assumptions regarding future interest rate changes. Significant changes in any of these assumptions may result in a lower or higher fair value measurement.
| Quantitative Information about Level 3 Fair Value Measurements | ||||||||
| Fair Value at September 30, 2021 | Valuation Technique(s) | Unobservable Input | Range (Weighted Average) | |||||
| U.S. Government Agency Obligations (Small Business Administration) | $48,368 | Discounted Cash Flow | Yield (Discount Rate of Cash Flows) Constant Default Rate Amortization Rate | 3.12%-3.30%(3.18%) 0.00%(0.00%) 0.0025-0.0038(0.0031) | ||||
68
NOTES TO FINANCIAL STATEMENTS
|
Reverse Repurchase Agreements:
To obtain short-term financing, the Access Capital Community Investment Fund may enter into reverse repurchase agreements with primary dealers that report to the Federal Reserve Bank of New York or the 100 largest U.S. commercial banks, who are deemed creditworthy under guidelines approved by the Board. Interest on the value of the reverse repurchase agreements is based upon competitive market rates at the time of issuance. At the time the Fund enters into a reverse repurchase agreement, it will establish and maintain a segregated account with the custodian containing qualifying assets having a value, including accrued interest, not less than the repurchase price. Based on requirements with certain exchanges and third party broker-dealers, the Fund may also be required to deliver or deposit securities or cash as collateral.
As of September 30, 2021 there were no open reverse Repurchase Agreements.
Reverse repurchase transactions are entered into by the Fund under Master Repurchase Agreements (“MRA”), which permit the Fund, under certain circumstances, including an event of default (such as bankruptcy or insolvency), to offset payables and/or receivables under the MRA with collateral held and/or posted to the counterparty and create one single net payment due to or from the Fund. With reverse repurchase transactions, typically the Fund and the counterparties are permitted to sell, repledge, or use the collateral associated with the transaction. However, bankruptcy or insolvency laws of a particular jurisdiction may impose restrictions on or prohibitions against such a right of offset in the event of the MRA counterparty’s bankruptcy or insolvency. Pursuant to the terms of the MRA, the Fund receives or posts securities as collateral with a market value in excess of the repurchase price to be received or paid by the Fund upon the maturity of the transaction. Upon a bankruptcy or insolvency of the MRA counterparty, the Fund is considered an unsecured creditor with respect to excess collateral and, as such, the return of excess collateral may be delayed.
In the event the buyer of securities under a MRA files for bankruptcy or becomes insolvent, the Fund’s use of the proceeds of the agreement may be restricted while the other party, or its trustee or receiver, determines whether or not to enforce the Fund’s obligation to repurchase the securities.
TBA Commitments:
The Funds may enter into TBA commitments to purchase or sell securities for a fixed price at a future date. TBA commitments are considered securities in themselves, and involve a risk of loss if the value of the security to be purchased/sold declines/increases prior to settlement date, which is in addition to the risk of decline in the value of a Fund’s other assets. Unsettled TBA commitments are valued at the current value of the underlying securities, according to the procedures described under “Security Valuation”. As of September 30, 2021, the Funds each have outstanding TBA commitments.
Mortgage Backed Securities:
Because the Funds will focus on community development investments, such as securities backed by commercial and/or residential mortgage loans, it will be affected by risks not typically associated with funds that do not specialize in community development investments. These risks include credit and prepayment risk and risk due to default on underlying loans within a security. Changes in economic conditions, including delinquencies and/or defaults or assets underlying these securities, can affect the value, income and/or liquidity of such positions.
In addition, the Access Capital Community Investment Fund invests in certain mortgage backed securities that qualify under the Community Reinvestment Act of 1977 (“CRA”) in which the Fund may pay a premium for the geographically or other targeted nature of the securities. There can be no guarantee, however, that a similar premium will be received if the security is sold by the Fund.
Derivatives:
The Funds may use derivative instruments, including futures, forwards, options, indexed securities, swaps and inverse securities as tools in the management of portfolio assets. The Funds may use such derivatives through either the creation of long or short positions to hedge various investments, for investment purposes, for risk management and/or to increase income or gain to the Funds. Derivatives allow the Funds to manage their risk exposure more quickly and efficiently than other types of instruments. Derivatives may be riskier than other types of investments and could result in losses that significantly exceed a Fund’s original investment. Derivatives are subject to the risk that changes in the
69
NOTES TO FINANCIAL STATEMENTS
|
value of a derivative may not correlate perfectly with the underlying asset, rate or index. The use of derivatives may not be successful, resulting in losses to a Fund, and the cost of such strategies may reduce the Fund’s returns.
Hedging also involves the risk that changes in the value of the derivative will not match those of the holdings being hedged as expected by the Funds, in which case any losses on the holdings being hedged may not be reduced and may be increased. There can be no assurance that a Fund’s hedging strategy will reduce risk or that hedging transactions will be available or cost effective. The Funds are subject to interest rate risk in the normal course of pursuing their investment objectives by investing in various derivative financial instruments, as described below.
Financial Futures Contracts:
The Funds may enter into futures contracts in an effort to manage the duration of the portfolio and hedge against certain market risk. A futures contract on a securities index is an agreement obligating one party to pay, and entitling the other party to receive, during the term of the contract, cash payments based on the level of a specified securities index. Futures transactions involve brokerage costs and require a Fund to segregate assets to cover contracts that would require it to purchase securities or currencies. A Fund may lose the expected benefit of futures transactions if interest rates, exchange rates or securities prices change in an unanticipated manner. Such unanticipated changes may also result in lower overall performance than if a Fund had not entered into any futures transactions.
The Funds entered into U.S. Treasury Bond futures and U.S. Treasury Notes futures during the year ended September 30, 2021.
Upon entering into a futures contract, a Fund is required to pledge to the broker an amount of cash, U.S. government securities, or other assets equal to a certain percentage of the contract amount. Subsequent payments are made or received by the Funds each day, depending on the daily fluctuations in the fair value of the underlying instrument. A Fund would record an unrealized gain or loss each day equal to these daily payments.
Open futures contracts are shown on the Schedules of Portfolio Investments. Underlying collateral pledged for open futures contracts is the cash at brokers for financial futures contracts shown on the Statements of Assets and Liabilities at September 30, 2021.
Fair Values of Derivative Financial Instrument as of September 30, 2021 | ||||||||
Statement of Assets and Liabilities Location | ||||||||
Asset Derivatives | ||||||||
| Access Capital | ||||||||
| Community | Impact | |||||||
| Investment Fund | Bond Fund | |||||||
Interest Rate Risk: | ||||||||
Unrealized appreciation on futures contracts | $1,069,529 | $298,353 | ||||||
Total | $1,069,529 | $298,353 | ||||||
| ||||||||
Liability Derivatives | ||||||||
| Access Capital Community Investment Fund | Impact Bond Fund | |||||||
Interest Rate Risk: | ||||||||
Unrealized depreciation on futures contracts | $— | $802,093 | ||||||
Total | $— | $802,093 | ||||||
70
NOTES TO FINANCIAL STATEMENTS
|
The effect of derivative instruments on the Statement of Operations during the year ended September 30, 2021 is as follows:
| Access Capital | ||||||||
| Derivative Instruments | Community | Impact | ||||||
Categorized by Risk Exposure | Investment Fund | Bond Fund | ||||||
Net realized Gain/(Loss) From: | ||||||||
Interest Rate Risk: | ||||||||
Financial futures contracts | $3,596,886 | $1,222,657 | ||||||
Total | $3,596,886 | $1,222,657 | ||||||
| Access Capital | ||||||||
| Derivative Instruments | Community | Impact | ||||||
Categorized by Risk Exposure | Investment Fund | Bond Fund | ||||||
Net Change in Unrealized Appreciation/(Depreciation) From: | ||||||||
Interest Rate Risk: | ||||||||
Financial futures contracts | $1,172,022 | $(488,193) | ||||||
Total | $1,172,022 | $(488,193) | ||||||
| For the year ended September 30, 2021, the average volume of derivative activities based on ending quarterly outstanding amounts are as follows: |
| |||||||
| Access Capital | ||||||||
| Community | Impact | |||||||
| Investment Fund | Bond Fund | |||||||
Futures long position (contracts) | — | 105 | ||||||
Futures short position (contracts) | 426 | 71 | ||||||
Counterparty Credit Risk:
Derivatives may also expose a Fund to counterparty risk (the risk that the derivative counterparty will not fulfill its contractual obligations). To the extent amounts due to the Funds from their counterparties are not fully collateralized contractually or otherwise, the Funds bear the risk of loss from counterparty non-performance. A Fund’s maximum risk of loss from counterparty credit risk on over-the-counter (“OTC”) derivatives is generally the aggregate unrealized gain in excess of any collateral pledged by the counterparty to the Funds.
With exchange-traded futures, the exchange or clearinghouse, as counterparty to such instruments, guarantees against a possible default. The clearinghouse stands between the buyer and the seller of the contract; therefore, credit risk is limited to failure of the clearinghouse. While offset rights may exist under applicable law, the Fund does not have a contractual right of offset against a clearing broker or clearinghouse in the event of a default (including the bankruptcy or insolvency) of the clearing broker or clearinghouse. Additionally, credit risk exists in exchange-traded futures with respect to initial and variation margin that is held in a clearing broker’s customer accounts. While clearing brokers are required to segregate customer margin from their own assets, in the event that a clearing broker becomes insolvent or goes into bankruptcy and at that time there is a shortfall in the aggregate amount of margin held by the clearing broker for all its clients, typically the shortfall would be allocated on a pro rata basis across all the clearing broker’s customers, potentially resulting in losses to the Funds.
Affiliated Investments:
The Funds invest in another Fund of the Trust (an “Affiliated Fund”), U.S. Government Money Market Fund-RBC Institutional Class 1, as a cash sweep vehicle. The income earned by the Funds from the Affiliated Fund for the period is disclosed in the Statement of Operations. The table below details the transactions of the Funds in the Affiliated Fund.
71
NOTES TO FINANCIAL STATEMENTS
|
| Value | Value | |||||||||||||||||||
| September 30, 2020 | Purchases | Sales | September 30, 2021 | Dividends | ||||||||||||||||
Investments in U.S. Government Money Market Fund — RBC Institutional Class 1 | ||||||||||||||||||||
Access | ||||||||||||||||||||
Capital | ||||||||||||||||||||
Community | ||||||||||||||||||||
Investment | ||||||||||||||||||||
Fund | $42,431,532 | $339,110,986 | $350,705,638 | $30,836,880 | $8,238 | |||||||||||||||
Impact | ||||||||||||||||||||
Bond | ||||||||||||||||||||
Fund | 7,987 | 204,029,351 | 203,436,920 | 600,418 | 1,063 | |||||||||||||||
Credit Enhancement:
Certain obligations held by the Funds have credit enhancement or liquidity features that may, under certain circumstances, provide for repayment of principal and interest on the obligation upon demand date, interest rate reset date or final maturity. These enhancements may include: letters of credit; liquidity guarantees; security purchase agreements; tender option purchase agreements and third party insurance.
Investment Transactions and Income:
Investment transactions are recorded on trade date. Dividend income is recorded on the ex-dividend date. Non-cash dividends, if any, are recorded on the ex-dividend date at fair value. Realized gains and losses from investment transactions are calculated based on the cost of the specific security (also known as identified cost basis). Interest income is recognized on the accrual basis and includes, where applicable, the amortization or accretion of premium or discount using the effective yield method. Paydown gains and losses on mortgage- and asset-backed securities are included in the financial statements as interest income.
Expense, Investment Income and Gain/Loss Allocation:
Each Fund pays the expenses that are directly related to its operations, such as custodian fees or advisory fees. Expenses incurred by the Trust, such as trustee or legal fees, are allocated among each of the Funds in the Trust either proportionately based upon each Fund’s relative net assets or using another reasonable basis such as equally across all Funds in the Trust, depending on the nature of the expense. Individual share classes within a Fund are charged expenses specific to that class, such as distribution fees and transfer agent fees. Within a Fund, expenses other than class specific expenses are allocated daily to each class based upon the proportion of relative net assets. Investment income and realized and unrealized gains or losses are allocated to each class of shares based on relative net assets.
Distributions to Shareholders:
Each Fund pays out any income that it receives, less expenses, in the form of dividends and capital gains to its shareholders. Income dividends are declared daily and paid monthly. Capital gain distributions are declared and paid at least annually. Distributions to shareholders are recorded on the ex-dividend date. The amount of dividends and distributions are calculated based on federal income tax regulations, which may differ from US GAAP. These “book/tax” differences may be either temporary or permanent in nature. To the extent these differences are determined, as of the end of the tax year, to be permanent (e.g., reclassification of paydown gains and losses ), they are reclassified within a Fund’s capital account based on their federal tax basis treatment.
3. Agreements and Other Transactions with Affiliates:
The Trust has entered into an investment advisory agreement with RBC GAM-US under which RBC GAM-US manages each Fund’s assets and furnishes related office facilities, equipment, research and personnel. The agreement requires each Fund to pay RBC GAM-US a monthly fee based upon average
72
NOTES TO FINANCIAL STATEMENTS
|
daily net assets. Under the terms of the agreement, RBC GAM-US is entitled to receive fees based on a percentage of the average daily net assets of each of the Funds as follows:
| Annual Rate | ||||
Access Capital Community Investment Fund | 0.35% | |||
Impact Bond Fund | 0.35% | |||
RBC GAM-US has contractually agreed to waive fees and/or make payments in order to keep total operating expenses (excluding certain fees such as interest, taxes and acquired fund fees and expenses) of the Funds to the following levels pursuant to an expense limitation agreement.
| Class A | Class I | Class IS | Class R6 | Class Y | ||||||||||||||||
| Annual Rate | Annual Rate | Annual Rate | Annual Rate | Annual Rate | ||||||||||||||||
Access Capital | ||||||||||||||||||||
Community Investment | ||||||||||||||||||||
Fund | 0.80 | % | 0.45 | % | 0.40 | % | N/A | N/A | ||||||||||||
Impact Bond Fund | 0.70 | % | 0.45 | % | N/A | 0.40 | % | 0.40 | % | |||||||||||
This expense limitation agreement is in place until January 31, 2023, and shall continue for additional one-year terms unless terminated by either party at any time. The Advisor is entitled to recoup from the Fund or class the fees and/or operating expenses waived or reimbursed during any of the previous 12 months (3 years for the Impact Bond Fund), provided the Fund is able to do so and remain in compliance with the expense limitation in place at the time the fees were waived or expenses paid.
As of September 30, 2021, the amounts subject to possible recoupment under the expense limitation agreement were:
| FYE 9/30/19 | FYE 9/30/20 | FYE 9/30/21 | Total | |||||||||||||
Access Capital Community Investment Fund | $ | — | $ | — | $ | 413,820 | $ | 413,820 | ||||||||
Impact Bond Fund | 188,125 | 199,252 | 243,047 | 630,424 | ||||||||||||
RBC GAM-US may also voluntarily waive and/or reimburse operating expenses of any Fund from time to time. Any such voluntary program may be changed or eliminated at any time without notice, and expenses waived under such programs are not subject to recoupment.
RBC GAM-US voluntarily agreed to waive its investment advisory fees by the amount of investment advisory fees the Funds pay to RBC GAM-US indirectly through its investment in an affiliated money market fund. For the year ended September 30, 2021, the amount waived was $57,630 and $6,407 for Access Capital Community Investment Fund and Impact Bond Fund, respectively, and is included in expenses waived/reimbursed by Advisor in the Statement of Operations.
RBC GAM-US serves as co-administrator to the Funds. BNY Mellon Investment Servicing (US) Inc. (“BNY Mellon”) serves as co-administrator and fund accounting agent. Services provided under the administrative services contract include providing day-to-day administration of matters related to the Funds, maintenance of their records and the preparation of reports. Under the terms of the administrative services contract, RBC GAM-US does not receive a fee for its role as co-administrator. BNY Mellon receives a fee for its services payable by each Fund based in part on each Fund’s average net assets. BNY Mellon’s fee is included with “Accounting fees” in the Statement of Operation.
RBC GAM-US also provides certain CRA-related administrative services to Class I shareholders of Access Capital Community Investment Fund pursuant to a Special Administrative Services Agreement with the Trust. In consideration for such services and the assumption of related expenses, RBC GAM-US receives a fee of 0.05% of the average daily net assets of Class I shares of the Fund.
Certain Officers and Trustees of the Trust are affiliated with the Advisor. Such Officers and Trustees receive no compensation from the Funds for serving their respective roles.
73
NOTES TO FINANCIAL STATEMENTS
|
The Trust currently pays each of the independent Trustees (Trustees of the Trust who are not directors, officers or employees of the Advisor, either Co-Administrator or Distributor) an annual retainer of $68,000. The Board Chairperson and Audit Committee Chairperson each receive an additional retainer of $2,500 annually, and all other trustees serving as Chair of a Board committee each receive an additional retainer of $1,000 annually. In addition, Independent Trustees receive a quarterly meeting fee of $6,500 for each in-person Board meeting attended, a meeting fee of $1,500 for each telephonic or Special Board meeting attended, a $1,500 fee for each Board committee meeting attended, and are reimbursed for all out-of -pocket expenses relating to attendance at such meetings. These amounts are included in the Statements of Operations in “Trustee’ fees”.
In conjunction with the initial launch of the Impact Bond Fund and the subsequent launch of Class A and Class Y shares, the Advisor invested seed capital in the Fund to provide the Fund or share class with its initial investment assets. The table below shows, as of September 30, 2021, the Fund’s net assets, the shares held by the Advisor, and the percent of total net assets represented by the Advisor’s investment.
| Shares held | % of Fund | |||||||||||
| Net Assets | by Advisor | Net Assets | ||||||||||
Impact Bond Fund | $ | 219,948,920 | 6,485,162 | 30.0 | % | |||||||
4. Fund Distribution:
Each of the Funds that offers Class A shares has adopted a Master Distribution 12b-1 Plan (the “Plan”) in which Quasar Distributors LLC (the “Distributor”) acts as the Funds’ distributor. The Plan permits each Fund to make payments for, or to reimburse the Distributor for, distribution-related costs and expenses of marketing shares of Class A covered under the Plan, and/or for providing shareholder services. The Plan does not apply to Class I and Class R6. The following chart shows the current Plan fee rate for Class A.
| Class A | ||||
12b-1 Plan Fee | 0.25 | %* | ||
* Under the 12b-1 plan, the maximum fee rate for Class A shares is 0.50%. Currently the Board has approved an annual limit of 0.25%.
Plan fees are based on average daily net assets of Class A. Up to 0.25% of each Plan fee may be designated as a service fee, as defined by the applicable rules of the Financial Industry Regulatory Authority. The Distributor, subject to applicable legal requirements, may waive the Plan fee voluntarily, in whole or in part. For the year ended September 30, 2021, there were no fees waived by the Distributor.
For the year ended September 30, 2021, the Distributor received commissions of $23,804 for front-end sales charges of Class A shares of the Funds, of which $23,426 was paid to affiliated broker-dealers and the remainder was either paid to unaffiliated broker-dealers or retained by the Distributor.
5. Securities Transactions:
The cost of securities purchased and proceeds from securities sold (excluding securities maturing less than one year from acquisition) for the year ended September 30, 2021 were as follows:
| Purchases | Sales | Purchases | Sales | |||||||||||||
| (Excl. U.S. Gov’t) | (Excl. U.S. Gov’t) | of U.S. Gov’t. | of U.S. Gov’t. | |||||||||||||
Access Capital Community Investment Fund | $ | 10,340,624 | $ | 1,102,592 | $ | 333,748,955 | $ | 165,863,818 | ||||||||
Impact Bond Fund | 147,730,676 | 28,377,151 | 67,695,809 | 6,121,804 | ||||||||||||
74
NOTES TO FINANCIAL STATEMENTS
|
6. Capital Share Transactions:
The Trust is authorized to issue an unlimited number of shares of beneficial interest (“Shares Outstanding”) without par value. Transactions in capital stock of the Funds are summarized on the following pages:
| Access Capital Community Investment Fund | Impact Bond Fund | |||||||||||||||
| For the | For the | For the | For the | |||||||||||||
| Year Ended | Year Ended | Year Ended | Year Ended | |||||||||||||
| September 30, | September 30, | September 30, | September 30, | |||||||||||||
| 2021 | 2020 | 2021 | 2020 | |||||||||||||
CAPITAL | ||||||||||||||||
TRANSACTIONS: | ||||||||||||||||
Class A | ||||||||||||||||
Proceeds from shares issued | $ | 4,289,357 | $ | 2,560,350 | $ | 13,950 | $ | 10,000 | ||||||||
Distributions reinvested | 245,262 | 365,871 | 301 | 123 | ||||||||||||
Cost of shares redeemed | (6,622,084 | ) | (4,038,793 | ) | (2,915 | ) | — | |||||||||
|
|
|
|
|
|
|
| |||||||||
Change in Class A | $ | (2,087,465 | ) | $ | (1,112,572 | ) | $ | 11,336 | $ | 10,123 | ||||||
|
|
|
|
|
|
|
| |||||||||
Class I | ||||||||||||||||
Proceeds from shares issued | $ | 213,915,716 | $ | 86,650,378 | $ | 61,822,014 | $ | 14,792,469 | ||||||||
Distributions reinvested | 7,320,148 | 7,507,447 | 768,897 | 495,083 | ||||||||||||
Cost of shares redeemed | (67,319,554 | ) | (90,200,626 | ) | (5,229,312 | ) | (781,191 | ) | ||||||||
|
|
|
|
|
|
|
| |||||||||
Change in Class I | $ | 153,916,310 | $ | 3,957,199 | $ | 57,361,599 | $ | 14,506,361 | ||||||||
|
|
|
|
|
|
|
| |||||||||
Class IS | ||||||||||||||||
Proceeds from shares issued | $ | 21,271,997 | $ | 11,531,818 | $ | — | $ | — | ||||||||
Distributions reinvested | 486,624 | 226,620 | — | — | ||||||||||||
Cost of shares redeemed | (5,500,834 | ) | (2,196,908 | ) | — | — | ||||||||||
|
|
|
|
|
|
|
| |||||||||
Change in Class IS | $ | 16,257,787 | $ | 9,561,530 | $ | — | $ | — | ||||||||
|
|
|
|
|
|
|
| |||||||||
Class R6 | ||||||||||||||||
Proceeds from shares issued | $ | — | $ | — | $ | 65,700,000 | $ | 1,000,000 | ||||||||
Distributions reinvested | — | — | 691,801 | 512,336 | ||||||||||||
Cost of shares redeemed | — | — | — | (3,099,998 | ) | |||||||||||
|
|
|
|
|
|
|
| |||||||||
Change in Class R6 | $ | — | $ | — | $ | 66,391,801 | $ | (1,587,662 | ) | |||||||
|
|
|
|
|
|
|
| |||||||||
75
NOTES TO FINANCIAL STATEMENTS
|
| Access Capital Community Investment Fund | Impact Bond Fund | |||||||||||||||
| For the | For the | For the | For the | |||||||||||||
| Year Ended | Year Ended | Year Ended | Year Ended | |||||||||||||
| September 30, | September 30, | September 30, | September 30, | |||||||||||||
| 2021 | 2020 | 2021 | 2020 | |||||||||||||
Class Y | ||||||||||||||||
Proceeds from shares issued | $ | — | $ | — | $ | 60,000,000 | $ | — | ||||||||
Distributions reinvested | — | — | 275,265 | — | ||||||||||||
|
|
|
|
|
|
|
| |||||||||
Change in Class Y | $ | — | $ | — | $ | 60,275,265 | $ | — | ||||||||
|
|
|
|
|
|
|
| |||||||||
Change in net assets resulting from capital transactions | $ | 168,086,632 | $ | 12,406,157 | $ | 184,040,001 | $ | 12,928,822 | ||||||||
|
|
|
|
|
|
|
| |||||||||
SHARE TRANSACTIONS: | ||||||||||||||||
Class A | ||||||||||||||||
Issued | 472,755 | 273,360 | 1,371 | 985 | ||||||||||||
Reinvested | 27,148 | 40,255 | 29 | 12 | ||||||||||||
Redeemed | (730,240 | ) | (443,451 | ) | (285 | ) | — | |||||||||
|
|
|
|
|
|
|
| |||||||||
Change in Class A | (230,337 | ) | (129,836 | ) | 1,115 | 997 | ||||||||||
|
|
|
|
|
|
|
| |||||||||
Class I | ||||||||||||||||
Issued | 23,646,511 | 9,516,656 | 6,018,469 | 1,440,293 | ||||||||||||
Reinvested | 811,194 | 826,593 | 74,181 | 48,164 | ||||||||||||
Redeemed | (7,452,922 | ) | (9,894,858 | ) | (505,350 | ) | (75,262 | ) | ||||||||
|
|
|
|
|
|
|
| |||||||||
Change in Class I | 17,004,783 | 448,391 | 5,587,300 | 1,413,195 | ||||||||||||
|
|
|
|
|
|
|
| |||||||||
Class IS | ||||||||||||||||
Issued | 2,351,468 | 1,264,477 | — | — | ||||||||||||
Reinvested | 54,010 | 24,936 | — | — | ||||||||||||
Redeemed | (608,900 | ) | (241,259 | ) | — | — | ||||||||||
|
|
|
|
|
|
|
| |||||||||
Change in Class IS | 1,796,578 | 1,048,154 | — | — | ||||||||||||
|
|
|
|
|
|
|
| |||||||||
Class R6 | ||||||||||||||||
Issued | — | — | 6,433,228 | 98,328 | ||||||||||||
Reinvested | — | — | 66,835 | 49,907 | ||||||||||||
Redeemed | — | — | — | (305,720 | ) | |||||||||||
|
|
|
|
|
|
|
| |||||||||
Change in Class R6 | — | — | 6,500,063 | (157,485 | ) | |||||||||||
|
|
|
|
|
|
|
| |||||||||
Class Y | ||||||||||||||||
Issued | — | — | 5,900,690 | — | ||||||||||||
Reinvested | — | — | 26,844 | — | ||||||||||||
|
|
|
|
|
|
|
| |||||||||
Change in Class Y | — | — | 5,927,534 | — | ||||||||||||
|
|
|
|
|
|
|
| |||||||||
Change in shares resulting from capital transactions | 18,571,024 | 1,366,709 | 18,016,012 | 1,256,707 | ||||||||||||
|
|
|
|
|
|
|
| |||||||||
76
NOTES TO FINANCIAL STATEMENTS
|
7. Federal Income Taxes:
It is the policy of each Fund to continue to qualify as a regulated investment company by complying with the provisions available to certain investment companies, as defined under Subchapter M of the Internal Revenue Code, and to distribute substantially all of its net investment income and net realized capital gains. Therefore, no federal tax liability is recorded in the financial statements of each Fund. For all open tax years and all major taxing jurisdictions, management of the Funds has concluded that there are no significant uncertain tax positions that would require recognition in the financial statements. Open tax years are those that are open for examination by taxing authorities (i.e., generally the last three tax year ends and the interim tax period since then). Furthermore, management of the Funds is also not aware of any tax positions for which it is reasonably possible that the total amounts of unrecognized tax benefits will significantly change in the next twelve months.
As of September 30, 2021, the tax cost of investments and the breakdown of unrealized appreciation (depreciation) for each Fund was as follows:
| Net Unrealized | ||||||||||||||||
| Tax Cost Of | Unrealized | Unrealized | Appreciation/ | |||||||||||||
| Investments | Appreciation | Depreciation | (Depreciation) | |||||||||||||
Access Capital Community Investment Fund | $ | 740,019,760 | $ | 16,043,576 | $ | (8,845,719 | ) | $ | 7,197,857 | |||||||
Impact Bond Fund | 223,146,723 | 1,306,948 | (1,651,474 | ) | (344,526 | ) | ||||||||||
The difference between book basis and tax basis unrealized appreciation/depreciation is attributable primarily to the tax mark-to-market of derivatives.
The tax character of distributions during the year ended September 30, 2021 were as follows:
| Distributions Paid From | ||||||||||||||||
| Total | ||||||||||||||||
| Ordinary | Net Long Term | Total Taxable | Distributions | |||||||||||||
| Income | Capital Gains | Distributions | Paid | |||||||||||||
Access Capital Community Investment Fund | $ | 13,346,199 | $ | — | $ | 13,346,199 | $ | 13,346,199 | ||||||||
Impact Bond Fund | 1,493,156 | 300,119 | 1,793,275 | 1,793,275 | ||||||||||||
The tax character of distributions during the year ended September 30, 2020 were as follows:
| Distributions Paid From | ||||||||||||||||
| Total | ||||||||||||||||
| Ordinary | Net Long Term | Total Taxable | Distributions | |||||||||||||
| Income | Capital Gains | Distributions | Paid | |||||||||||||
Access Capital Community Investment Fund | $ | 14,534,257 | $ | — | $ | 14,534,257 | $ | 14,534,257 | ||||||||
Impact Bond Fund | 940,744 | 74,327 | 1,015,071 | 1,015,071 | ||||||||||||
Total distributions paid may differ from the Statements of Changes in Net Assets because distributions are recognized when actually paid for tax purposes.
77
NOTES TO FINANCIAL STATEMENTS
|
As of September 30, 2021, the components of accumulated earnings/(losses) on a tax basis were as follows:
| Access Capital | ||||||||
| Community | Impact | |||||||
| Investment Fund | Bond Fund | |||||||
Undistributed ordinary income | $ | 51,813 | $ | 196,729 | ||||
Undistributed long term gain | — | 515,593 | ||||||
|
|
|
| |||||
Accumulated earnings | 51,813 | 712,322 | ||||||
Distributions payable | (1,094,353 | ) | (5,737 | ) | ||||
Accumulated capital loss carryforwards | (32,511,203 | ) | — | |||||
Unrealized appreciation/depreciation | 7,197,857 | (344,526 | ) | |||||
|
|
|
| |||||
Total Accumulated Earnings/(Losses) | $ | (26,355,886 | ) | $ | 362,059 | |||
|
|
|
| |||||
During the year ended September 30, 2021, the Access Capital Community Investment Fund utilized $1,075,684 of capital losses.
As of September 30, 2021, the Access Capital Community Investment Fund had a short-term capital loss carryforward of $10,299,880 and a long-term capital loss carryforward of $22,211,323 available to offset future realized capital gains in accordance with the Regulated Investment Company Modernization Act of 2010. These capital loss carryforwards are not subject to expiration and must first be utilized to offset future realized gains of the same character.
Under current tax law, Post-October Capital Losses and Late-Year Ordinary Losses may be deferred and treated as occurring on the first business day of the following fiscal year for tax purposes. The Funds did not have any Post-October Capital Losses or Late-Year Ordinary Losses for the year ending September 30, 2021.
8. Line of Credit
The Funds are participants in an uncommitted, secured $500,000,000 line of credit with U.S. Bank, N.A. (the “Bank”), the Funds’ custodian, to be used to fund shareholder redemption requests and for other short-term temporary or emergency general business purposes. The line of credit has a scheduled termination date of July 30, 2022. Interest is charged on borrowings under this line of credit at the Bank’s prime lending rate per annum. Since each Fund participates in this line of credit, there is no assurance that an individual fund will have access to all or any part of the $500,000,000 at any particular time. There were no loans outstanding pursuant to this line of credit at September 30, 2021. During the year ended September 30, 2021, the Funds did not utilize this line of credit.
9. Significant Risks
Shareholder concentration risk:
As of September 30, 2021, the Funds had omnibus accounts which each owned more than 10% of a Fund’s outstanding shares as shown below:
| # of Omnibus Accounts | % of Fund | |||||||
Access Capital Community Investment Fund | 1 | 15.2 | % | |||||
In addition, an unaffiliated shareholder owned 27.4% of the Impact Bond Fund as of September 30, 2021. Significant transactions by these shareholders may impact the Funds’ performance.
Market risk:
One or more markets in which a Fund invests may go down in value, sometimes sharply and unpredictably, and the value of a Fund’s portfolio securities may fall or fail to rise. Market risk may affect a single issuer, sector of the economy, industry or the market as a whole. In addition, global economies and financial markets are becoming increasingly interconnected, and political, economic and other conditions and events (including, but not limited to, natural disasters, pandemics, epidemics,
78
NOTES TO FINANCIAL STATEMENTS
|
and social unrest) in one country, region, or financial market may adversely impact issuers in a different country, region or financial market. Furthermore, the occurrence of, among other events, natural or man-made disasters, severe weather or geological events, fires, floods, earthquakes, outbreaks of disease (such as COVID-19, avian influenza or H1N1/09), epidemics, pandemics, malicious acts, cyber-attacks, terrorist acts or the occurrence of climate change, may also adversely impact the performance of a Fund. Such events could adversely impact issuers, markets and economies over the short- and long-term, including in ways that cannot necessarily be foreseen. A Fund could be negatively impacted if the value of a portfolio holding were harmed by such political or economic conditions or events. Moreover, such negative political and economic conditions and events could disrupt the processes necessary for a Fund’s operations.
10. Subsequent Events:
Fund Management has evaluated the impact of all subsequent events on the Funds and has determined that there were no subsequent events requiring recognition or disclosure in the financial statements.
79
REPORT OF INDEPENDENT REGISTERED PUBLIC ACCOUNTING FIRM
|
To the Board of Trustees of RBC Funds Trust and Shareholders of Access Capital Community Investment Fund and RBC Impact Bond Fund
Opinions on the Financial Statements
We have audited the accompanying statements of assets and liabilities, including the schedules of portfolio investments, of Access Capital Community Investment Fund and RBC Impact Bond Fund (two of the funds constituting RBC Funds Trust, hereafter collectively referred to as the “Funds”) as of September 30, 2021, the related statements of operations for the year ended September 30, 2021, the statements of changes in net assets for each of the two years in the period ended September 30, 2021, including the related notes, and the financial highlights for each of the periods indicated therein (collectively referred to as the “financial statements”). In our opinion, the financial statements present fairly, in all material respects, the financial position of each of the Funds as of September 30, 2021, the results of each of their operations for the year then ended, the changes in each of their net assets for each of the two years in the period ended September 30, 2021 and each of the financial highlights for each of the periods indicated therein in conformity with accounting principles generally accepted in the United States of America.
Basis for Opinions
These financial statements are the responsibility of the Funds’ management. Our responsibility is to express an opinion on the Funds’ financial statements based on our audits. We are a public accounting firm registered with the Public Company Accounting Oversight Board (United States) (PCAOB) and are required to be independent with respect to the Funds in accordance with the U.S. federal securities laws and the applicable rules and regulations of the Securities and Exchange Commission and the PCAOB.
We conducted our audits of these financial statements in accordance with the standards of the PCAOB. Those standards require that we plan and perform the audit to obtain reasonable assurance about whether the financial statements are free of material misstatement, whether due to error or fraud.
Our audits included performing procedures to assess the risks of material misstatement of the financial statements, whether due to error or fraud, and performing procedures that respond to those risks. Such procedures included examining, on a test basis, evidence regarding the amounts and disclosures in the financial statements. Our audits also included evaluating the accounting principles used and significant estimates made by management, as well as evaluating the overall presentation of the financial statements. Our procedures included confirmation of securities owned as of September 30, 2021 by correspondence with the custodian and brokers; when replies were not received from brokers, we performed other auditing procedures. We believe that our audits provide a reasonable basis for our opinions.
/s/PricewaterhouseCoopers LLP
Minneapolis, Minnesota
November 23, 2021
We have served as the auditor of one or more investment companies in the RBC Funds since 2016.
80
OTHER FEDERAL INCOME TAX INFORMATION (UNAUDITED)
|
For the year ended September 30, 2021, the following Funds had a qualified interest income percentage of:
| Qualified Interest Income | ||||
Access Capital Community Investment Fund | 100.00% | |||
Impact Bond Fund | 98.26% | |||
Pursuant to Internal Revenue Code Section 852(b)(3), the Impact Bond Fund reported $521,809 as long-term capital gain distributions and short-term capital gain distributions were 12.64% for the year ended September 30, 2021.
All reportings are based on financial information available as of the date of this annual report and, accordingly, are subject to change. For each item above, it is the intention of the Funds to report the maximum amount permitted under the Internal Revenue Code and the regulations thereunder.
81
|
Independent Trustees(1)(2)
Lucy Hancock Bode (70)
Position, Term of Office and Length of Time Served with the Trust: Trustee since January 2004
Principal Occupation(s) During Past 5 Years: Healthcare consultant (self-employed) (1986 to present)
Number of Portfolios in Fund Complex Overseen by Trustee: 18
Other Director/Trustee Positions Held by Trustee During Past 5 Years: Franklin Street Partners (2014 to present); BioSignia (2006 to 2010).
Leslie H. Garner Jr. (71)
Position, Term of Office and Length of Time Served with the Trust: Trustee since January 2004
Principal Occupation(s) During Past 5 Years: President and Chief Executive Officer, The Greater Cedar Rapids Community Foundation (2010 to present); President, Cornell College (1994 to 2010)
Number of Portfolios in Fund Complex Overseen by Trustee: 18
Other Director/Trustee Positions Held by Trustee During Past 5 Years: None
Phillip G. Goff. (58)
Position, Term of Office and Length of Time Served with the Trust: Trustee since January 2020
Principal Occupation(s) During Past 5 Years: Senior Vice President/Corporate Controller and Funds Treasurer, TIAA (October 2006-August 2017)
Number of Portfolios in Fund Complex Overseen by Trustee: 18
Other Director/Trustee Positions Held by Trustee During Past 5 Years: None
Ronald James (70)
Position, Term of Office and Length of Time Served with the Trust: Trustee since January 2004
Principal Occupation(s) During Past 5 Years: Faculty member (part time), University of St. Thomas (2004 to present), President and Chief Executive Officer, Center for Ethical Business Cultures (2000 to January 2017)
Number of Portfolios in Fund Complex Overseen by Trustee: 18
Other Director/Trustee Positions Held by Trustee During Past 5 Years: Bremer Financial Corporation (2004 to present); Greater Twin Cities United Way (2012 to 2020); Best Buy Co. Inc. (2004 to 2013)
John A. MacDonald (72)
Position, Term of Office and Length of Time Served with the Trust: Trustee since January 2004
Principal Occupation(s) During Past 5 Years: Vice President and Treasurer, Hall Family Foundation (1988 to 2020); Chief Investment Officer, Chinquapin Trust Company (1999 to 2020)
Number of Portfolios in Fund Complex Overseen by Trustee: 18
Other Director/Trustee Positions Held by Trustee During Past 5 Years: None
82
MANAGEMENT (UNAUDITED)
|
Independent Trustees(1)(2)
James R. Seward, CFA (69)
Position, Term of Office and Length of Time Served with the Trust: Chairman of the Board and Trustee since January 2004
Principal Occupation(s) During Past 5 Years: Private investor (2000 to present)
Number of Portfolios in Fund Complex Overseen by Trustee: 18
Other Director/Trustee Positions Held by Trustee During Past 5 Years: Sooner Holdings (formerly Syntroleum Corporation) (1988 to 2015); Brookdale Senior Living Inc. (2008 to 2019)
Interested Trustees(1)(2)(3)
Kathleen A. Gorman (57)(5)
Position, Term of Office and Length of Time Served with the Trust: Trustee since September 2012
Principal Occupation(s) During Past 5 Years: President and Chief Executive Officer, RBC Funds (2012 to present); Assistant Secretary (March 2018 to present); Chief Compliance Officer, RBC Funds (2006 to 2012)
Number of Portfolios in Fund Complex Overseen by Trustee: 18
Other Director/Trustee Positions Held by Trustee During Past 5 Years: None
83
MANAGEMENT (UNAUDITED)
|
Executive Officers(1)(3)(4)
Kathleen A. Gorman (57)
Position, Term of Office and Length of Time Served with the Trust: President and Chief Executive Officer since September 2012 and Assistant Secretary, (March 2018 to present)
Principal Occupation(s) During Past 5 Years: President and Chief Executive Officer, RBC Funds (2012 to present); Assistant Secretary, RBC Funds (March 2018 to present); Chief Compliance Officer, RBC Funds (2006 to 2012)
Kathleen A. Hegna (54)
Position, Term of Office and Length of Time Served with the Trust: Chief Financial Officer and Principal Accounting Officer since May 2009 and Treasurer since March 2014
Principal Occupation(s) During Past 5 Years: Associate Vice President and Director, Mutual Fund Services, RBC Global Asset Management (U.S.) Inc. (2009 to present)
Christina M. Weber (53)
Position, Term of Office and Length of Time Served with the Trust: Chief Compliance Officer since December 2012 and Secretary since September 2017
Principal Occupation(s) During Past 5 Years: Chief Compliance Officer, RBC Global Asset Management (U.S.) Inc. (June 2018 to present); Chief Compliance Officer, RBC Funds (2012 to present); Assistant Secretary, RBC Funds (2013 to 2017); Senior Compliance Officer, RBC Funds (March 2012 to December 2012)
| (1) | Except as otherwise noted, the address of each Trustee/Officer is RBC Funds Trust, 50 South Sixth Street, Suite 2350, Minneapolis, Minnesota 55402. |
| (2) | All Trustees must retire on or before December 31 of the year in which they reach age 75. The Board may temporarily waive this requirement when necessary to avoid depriving the Board of a Trustee with critical skills. |
| (3) | On December 31, 2009, Voyageur Asset Management Inc. changed its name to RBC Global Asset Management (U.S.) Inc. Any references to RBC Global Asset Management (U.S.) Inc. for prior periods are deemed to be references to the prior entity. |
| (4) | Each officer serves in such capacity for an indefinite period of time until his or her removal, resignation or retirement. |
| (5) | Kathleen A. Gorman has been determined to be an interested Trustee by virtue of her position with the Advisor. |
The Fund’s Statement of Additional Information includes information about the Funds’ Trustees. To receive your free copy of the Statement of Additional Information, call toll free: 1-800-422-2766.
84
SHARE CLASS INFORMATION (UNAUDITED)
|
The Funds offer Class A, Class IS, Class I, Class R6 and Class Y shares.
Class A
Class A shares are available for purchase primarily through investment advisors, broker-dealers, banks and other financial services intermediaries. Class A shares are currently subject to a maximum up-front sales charge of 3.75% and a 1.00% CDSC for redemption within 12 months of a $1 million or greater purchase. Class A shares currently include a 0.25% annual 12b-1 service and distribution fee.
Class I
Class I shares are intended for investors meeting certain minimum investment thresholds. This share class does not have an up-front sales charge (load) or a 12b-1 service and distribution fee.
Class IS
Class IS shares are offered in Access Capital Community Investment Fund and are available to investors who meet the $2,500 minimum initial investment requirement. This share class does not have an up-front sales charge (load) or a 12b-1 service and distribution fee.
Class R6
Class R6 shares are available in Impact Bond Fund. This share class is intended for investors meeting certain minimum investment thresholds. This share class does not have an up-front sales charge (load) or a 12b-1 service and distribution fee.
Class Y
Class Y shares are offered in Impact Bond Fund for institutional investors that hold shares through an account held directly with the Fund and meet the $5,000,000 minimum requirement for initial investment. This share class does not have an upfront sales charge (load) or a 12b-1 distribution and servicing fee.
85
SUPPLEMENTAL INFORMATION (UNAUDITED)
|
Shareholder Expense Examples
As a shareholder of the RBC Funds, you incur two types of costs: (1) transaction costs and (2) ongoing costs, including management fees; and other Fund expenses. This example is intended to help you understand your ongoing costs (in dollars) of investing in the RBC Funds and to compare these costs with the ongoing costs of investing in other mutual funds.
The example is based on an investment of $1,000 invested at the beginning of the period and held for the entire period from April 1, 2021 through September 30, 2021.
Actual Expenses
The table below provides information about actual account values and actual expenses. You may use the information below, together with the amount you invested, to estimate the expenses that you paid over the period. Simply divide your account value by $1,000 (for example, an $8,600 account value divided by $1,000 = 8.6), then multiply the result by the number in the table under the heading entitled “Expenses Paid During Period” to estimate the expenses you paid on your account during this period.
| Beginning Account Value 4/1/21 | Ending Account Value 9/30/21 | Expenses Paid During Period* 4/1/21–9/30/21 | Annualized Expense Ratio During Period 4/1/21–9/30/21 | |||||||||||||||
Access Capital Community Investment Fund |
| |||||||||||||||||
| Class A | $1,000.00 | $1,002.10 | $4.02 | 0.80% | ||||||||||||||
| Class I | 1,000.00 | 1,002.70 | 2.26 | 0.45% | ||||||||||||||
| Class IS | 1,000.00 | 1,004.10 | 2.01 | 0.40% | ||||||||||||||
Impact Bond Fund | ||||||||||||||||||
| Class A | 1,000.00 | 1,012.10 | 3.53 | 0.70% | ||||||||||||||
| Class I | 1,000.00 | 1,014.30 | 2.27 | 0.45% | ||||||||||||||
| Class R6 | 1,000.00 | 1,013.60 | 2.02 | 0.40% | ||||||||||||||
| Class Y | 1,000.00 | 1,013.40 | 2.02 | 0.40% | ||||||||||||||
*Expenses are equal to the average account value times the Fund’s annualized expense ratio multiplied by 183/365 (to reflect one half year period).
86
SUPPLEMENTAL INFORMATION (UNAUDITED)
|
Hypothetical Example for Comparison Purposes
The table below provides information about hypothetical account values and hypothetical expenses based on each RBC Funds’ actual expense ratio and an assumed rate of return of 5% per year before expenses, which is not the Fund’s actual return. The hypothetical account values and expenses may not be used to estimate the actual ending account balance or expenses you paid for the period. You may use this information to compare this 5% hypothetical example with the 5% hypothetical examples that appear in the shareholder reports of other funds.
Please note that the expenses shown in the table are meant to highlight your ongoing costs only and do not reflect any transactional costs, such as sales charges (loads), redemption fees, or exchange fees. Therefore, the table is useful in comparing ongoing costs only, and will not help you determine the relative total costs of owning different funds. In addition, if these transactional costs were included, your costs would have been higher.
| Beginning Account Value 4/1/21 | Ending Account Value 9/30/21 | Expenses Paid During Period* 4/1/21-9/30/21 | Annualized Expense Ratio During Period 4/1/21-9/30/21 | |||||||||||||||
Access Capital Community Investment Fund |
| |||||||||||||||||
| Class A | $1,000.00 | $1,021.06 | $4.05 | 0.80% | ||||||||||||||
| Class I | 1,000.00 | 1,022.81 | 2.28 | 0.45% | ||||||||||||||
| Class IS | 1,000.00 | 1,023.06 | 2.03 | 0.40% | ||||||||||||||
Impact Bond Fund | ||||||||||||||||||
| Class A | 1,000.00 | 1,021.56 | 3.55 | 0.70% | ||||||||||||||
| Class I | 1,000.00 | 1,022.81 | 2.28 | 0.45% | ||||||||||||||
| Class R6 | 1,000.00 | 1,023.06 | 2.03 | 0.40% | ||||||||||||||
| Class Y | 1,000.00 | 1,023.06 | 2.03 | 0.40% | ||||||||||||||
*Expenses are equal to the average account value times the Fund’s annualized expense ratio multiplied by 183/365 (to reflect one half year period).
87
APPROVAL OF INVESTMENT ADVISORY AGREEMENT (UNAUDITED)
|
Information Regarding the Approval of Investment Advisory Agreement
In September 2021, after evaluating the services provided by RBC Global Asset Management (U.S.) Inc. (the “Advisor”) and reviewing the performance, fees, and expenses of the Funds, the RBC Funds Board of Trustees determined to approve the continuation of the investment advisory agreement (“Agreement”) with the Advisor for the Funds. Additionally, in July 2021, the RBC Funds Board of Trustees determined to approve a new investment advisory agreement (“New Agreement” and collectively with the Agreement, “Agreements”) with the Advisor for the Funds to take effect on or about November 1, 2021. The implementation of this new Agreement, which was approved by shareholders of each of the Funds on September 30, 2021, was intended to reflect certain structural changes anticipated as a result of the pending merger of the Advisor with one of its affiliates, BlueBay Asset Management USA LLC.
As part of their review of the Agreements, the Trustees requested and considered information regarding the advisory services performed by the Advisor; the staffing and qualifications of the personnel responsible for operating and managing the Funds; and the Funds’ performance, fees, and expenses. The Trustees considered information provided at regular quarterly Board and Committee meetings throughout the year as well as information presented at each of a special meeting held to review the proposed New Agreement, a special meeting held to review requested material related to the proposed renewal and a regular meeting at which the proposed renewal was considered. The information included material provided by the Advisor, as well as reports prepared by Broadridge Financial Solutions, Inc., an independent statistical compilation company providing comparative fee and expense information and comparative performance information for the Funds. The Board also reviewed certain changes to the Funds that had been made in the prior year, including the launching of Class Y shares for the RBC Impact Bond Fund. In connection with their deliberations, the independent Trustees were advised by independent legal counsel with regard to the materials and their responsibilities under relevant laws and regulations.
The Trustees met with representatives from the Advisor’s senior management team, as well as the senior investment professionals responsible for managing the Funds, to discuss the information and the Advisor’s ongoing management of the Funds. The Trustees reviewed the nature, quality, and extent of the services provided to the Funds by the Advisor, including information as to each Fund’s performance relative to appropriate index benchmarks and their respective Morningstar categories as well as information with respect to custom peer groups designed to align more closely with the Funds’ specific investment strategies. With respect to the RBC Access Capital Community Investment Fund, the Trustees were informed that the Fund’s category consists of funds that own Treasury bonds in addition to mortgage bonds, while the Fund does not invest in Treasuries, and that only one other fund in its category employs a socially conscious strategy and, accordingly, the available comparative data is not necessarily fully applicable.
In considering the nature and quality of services to be provided by the Advisor, the Trustees were informed with respect to the research, credit, and fundamental analysis capabilities; the specialized expertise in the area of fixed income investments eligible for regulatory credit under the Community Reinvestment Act of 1977 (“CRA”); the Advisor’s significant expertise with regard to evaluating environmental, social and governance (ESG) factors, and the extensive portfolio management experience of the Advisor’s staff as well as its operational and compliance structure and systems and financial strength. The Trustees reviewed the Funds’ investment advisory fees and reviewed comparative fee and expense information for similarly situated funds, noting that the effective advisory fee rate for the Access Capital Community Investment Fund was slightly higher than the median for its category and peer group. The Trustees also received reports from the Advisor regarding the performance and fee levels for other advisory client accounts it advises in similar strategies and discussed differences in services provided, noting that the need to: manage liquidity for shareholder redemptions; collateral requirements, and regulatory matters; and evaluating relevant ESG factors and CRA eligibility, all require additional time and attention from the investment team.
88
APPROVAL OF INVESTMENT ADVISORY AGREEMENT (UNAUDITED)
|
The Trustees reviewed profitability data — including year-over-year variances — for the Advisor and considered information regarding other benefits the Advisor and its affiliates derived from their relationships with the Funds.
Based upon their review, the Trustees determined that the advisory fees payable to the Advisor were fair and reasonable in light of the nature and quality of services provided under all the circumstances and was within the range of what might have been negotiated at arms’ length. The Trustees concluded that it is in the interests of the Funds and their shareholders for the Trustees to approve the Agreements, as well as continuation of the expense limitation agreements for the Funds for an additional year. In arriving at their collective decision to approve the Agreements, the Trustees did not assign relative weights to the factors discussed above or deem any one or group of them to be controlling in and of itself.
89
|
This Page Intentionally Left Blank
90
|
This Page Intentionally Left Blank
91
|
This Page Intentionally Left Blank
92
|
This Page Intentionally Left Blank
93
|
This Page Intentionally Left Blank
94
RBC Funds
P.O. Box 701
Milwaukee, WI 53201-0701
800-422-2766
www.rbcgam.com
Performance data represents past performance and does not guarantee future results. The principal value of an investment and investment return will fluctuate so that an investor’s shares, when redeemed, may be worth more or less than their original cost.
This report and the financial statements contained herein are provided for the information of RBC Funds shareholders. This report is not authorized for distribution to prospective investors unless preceded or accompanied by a current prospectus, which contains information concerning investment objectives, risks, charges and expenses of the funds. Please read the prospectus carefully before investing.
This report and the financial statements contained herein are not intended to be a forecast of future events, a guarantee of future results, or investment advice. There is no assurance that certain securities will remain in or out of each fund’s portfolio. The views expressed in this report reflect those of the portfolio managers through the year ended September 30, 2021.
NOT FDIC INSURED • NO BANK GUARANTEE • MAY LOSE VALUE
RBC Global Asset Management (U.S.) Inc. serves as investment advisor for the RBC Funds. RBC Funds are distributed by Quasar Distributors LLC.

The RBC Funds are pleased to offer shareholder reports printed entirely on Forest
Stewardship Council® certified paper. FSC® certification ensures that the paper
used in this report contains fiber from well-managed and responsibly harvested
forests that meet strict environmental and socioeconomic standards.
RBCF-II AR 09-21
RBC Global Asset Management
Annual Report
For the year ended September 30, 2021
RBC BlueBay Emerging Market Debt Fund
RBC BlueBay High Yield Bond Fund
| ||||||||||||
RBC Funds | ||||||||||||
| About your Annual Report |
This annual report includes detailed information about your Fund including financial statements, performance, and a complete list of its holdings.
| |||||||||||
The RBC Funds compare their performance against various indices. Each of these indices is a widely recognized measure of return for the underlying category of securities. However, the indices are unmanaged, do not include fees, and cannot be invested in directly.
| ||||||||||||
We hope the financial information presented will help you evaluate your investment in the RBC Funds. We also encourage you to read your Fund’s prospectus for further detail as to your Fund’s investment policies and risk profile. RBC Funds prospectuses and performance information subsequent to the date of this report are available on our website at www.rbcgam.com.
| ||||||||||||
A description of the policies and procedures that your Fund uses to determine how to vote proxies relating to portfolio securities is available (i) without charge, upon request, by calling 1-800-422-2766; (ii) on the Fund’s website at www.rbcgam.com; and (iii) on the Securities and Exchange Commission’s (the “Commission”) website at http://www.sec.gov.
| ||||||||||||
Each year the Trust files its proxy voting record for the twelve-month period ended June 30 with the SEC on Form N-PX no later than August 31. The records can be obtained on the SEC’s website at www.sec.gov and without charge by calling the Funds at 1-800-422-2766.
| ||||||||||||
A schedule of each Fund’s portfolio holdings is filed with the Commission for the first and third quarters of each fiscal year on Form N-PORT. This information is available on the Commission’s website at http://www.sec.gov and on the Funds’ website at www.rbcgam.com.
| ||||||||||||
Table of Contents | Letter from the Chief Investment Officer | 1 | ||||||||||
| Portfolio Managers | 3 | |||||||||||
| Performance Summary (Unaudited) | 5 | |||||||||||
| Management Discussion and Analysis (Unaudited) | ||||||||||||
| - RBC BlueBay Emerging Market Debt Fund | 8 | |||||||||||
| - RBC BlueBay High Yield Bond Fund | 12 | |||||||||||
| Schedule of Portfolio Investments | 15 | |||||||||||
| Financial Statements | ||||||||||||
| - Statements of Assets and Liabilities | 35 | |||||||||||
| - Statements of Operations | 37 | |||||||||||
| - Statements of Changes in Net Assets | 39 | |||||||||||
| Financial Highlights | 41 | |||||||||||
| Notes to Financial Statements | 46 | |||||||||||
| Report of Independent Registered Public Accounting Firm | 67 | |||||||||||
| Other Federal Income Tax Information (Unaudited) | 68 | |||||||||||
| Management (Unaudited) | 69 | |||||||||||
| Share Class Information (Unaudited) | 72 | |||||||||||
| Supplemental Information (Unaudited) | 73 | |||||||||||
| Approval of Investment Advisory Agreements (Unaudited) | 75 | |||||||||||
1
| LETTER FROM THE CHIEF INVESTMENT OFFICER | ||||||
| with purchases to end mid 2022 which we think will mean first US rate hike in quarter four 2022. With this path set the markets focus will be the data. | ||||||
| Turning to Europe, we expect a very slow taper of ECB Pandemic Emergency Purchase Programme (PEPP) purchases, but with inflation lagging somewhat we expect Asset Purchase Programmes to increase, and so bond purchases will remain supportive for bunds and credit. In rates markets we continue to look for 10yr US yields to head somewhat higher in quarter four, especially as they lose the support of central bank buying. This year has shown that patience is required on our short duration view and that we may see some reversals, as higher yields create some volatility in risk assets. Certainly, the timing of the unwind of monetary policy makes for interesting alpha opportunities in duration and curves, both on an absolute and relative basis. In particular, we have conviction that US and UK yields continue to underperform Bunds and Chinese rates. | ||||||
| Policy should continue to be supportive of European Sovereign credit, but with peripheral spreads close to recent tights, valuations keep us from being too positive here, given that policy will soon start to be withdrawn and that political risk is never far away, especially as we head towards election season in Europe. | ||||||
| As before, we reiterate that while we live in uncertain times, the last eighteen months has shown us that the resulting volatility creates more opportunity for active investors. Looking ahead, uncertainties surrounding the path of policy, virus and growth will likely lead to alpha opportunities from macro positioning, but also from playing the geographic/sector/issuer performance dispersion that follows, as the market starts to differentiate between the winners and losers. While low yields make future market returns look more challenged, the volatility gives opportunities to generate significant alpha from our approach of long/short investing and a capital preservation mindset. | ||||||
| Mark Dowding | ||||||
| Chief Investment Officer | ||||||
| BlueBay Asset Management LLP | ||||||
| Past performance is not a guarantee of future results. | ||||||
| Mutual fund investing involves risk. Principal loss is possible. | ||||||
| Alpha is a risk-adjusted performance measurement of a portfolio’s excess return relative to its benchmark after considering its risk relative to the benchmark. [A positive alpha indicates that a portfolio has produced higher-than-expected returns for its risk level, and vice versa for a negative alpha.] | ||||||
| Spread measures the difference between two rates or yields. | ||||||
| Duration measures the sensitivity of a bond’s price to changes in interest rates. | ||||||
| The U.S. Treasury yield curve represents the yield of a U.S. Treasury bond at different maturities. A U.S. Treasury bond is theoretically considered to be free of default risk, and represents the minimum yield investors are prepared to accept for bonds of different maturities. | ||||||
2
3
PORTFOLIO MANAGERS
| ||||||
Connecticut, office before being promoted to portfolio manager in January 2017. Prior to joining BlueBay, he was a director in high yield and distressed credit trading at the Royal Bank of Scotland. Before that, Tim spent three years as an analyst on the leveraged loan trading desk at Bear Stearns & Co. Tim holds a BS in Business Administration with Finance concentration from Fordham University.
| ||||||
| ||||||
4
| PERFORMANCE SUMMARY (UNAUDITED) | ||
| 1 Year | 3 Year | 5 Year | Since Inception(a) | Net Expense Ratio(b)(c) | Gross Expense Ratio(b)(c) | |||||||||||||||||||||||||
Average Annual Total Returns as of September 30, 2021 (Unaudited) | ||||||||||||||||||||||||||||||
RBC BlueBay Emerging Market Debt Fund | ||||||||||||||||||||||||||||||
Class A | ||||||||||||||||||||||||||||||
- Including Max Sales Charge of 4.25% | 0.63% | 4.15% | 2.96% | 2.40% | ||||||||||||||||||||||||||
- At Net Asset Value | 5.06% | 5.68% | 3.85% | 2.85% | 1.04% | 43.25% | ||||||||||||||||||||||||
Class I | ||||||||||||||||||||||||||||||
- At Net Asset Value | 5.28% | 5.99% | 4.12% | 3.09% | 0.79% | 1.72% | ||||||||||||||||||||||||
Class R6 | ||||||||||||||||||||||||||||||
- At Net Asset Value | 5.35% | 6.02% | 4.18% | 3.18% | 0.74% | 28.96% | ||||||||||||||||||||||||
JPMorgan EMBI Global Diversified Index(d) | 4.36% | 5.65% | 3.89% | 5.54% | ||||||||||||||||||||||||||
RBC BlueBay High Yield Bond Fund | ||||||||||||||||||||||||||||||
Class A | ||||||||||||||||||||||||||||||
- Including Max Sales Charge of 4.25% | 4.93% | 6.33% | 6.01% | 6.29% | ||||||||||||||||||||||||||
- At Net Asset Value | 9.60% | 7.87% | 6.92% | 6.75% | 0.82% | 1.18% | ||||||||||||||||||||||||
Class I | ||||||||||||||||||||||||||||||
- At Net Asset Value | 9.89% | 8.15% | 7.25% | 7.05% | 0.57% | 0.87% | ||||||||||||||||||||||||
ICE BofAML US High Yield Index(d) | 11.46% | 6.62% | 6.35% | 7.04% | ||||||||||||||||||||||||||
Performance data quoted represents past performance. Past performance is no guarantee of future results. Investment return and principal value of an investment will fluctuate so that an investor’s shares, when redeemed, may be worth more or less than their original cost. Current performance may be lower or higher than performance quoted. Performance shown reflects contractual fee waivers, without such fee waivers total returns would be reduced. Performance information does not reflect the 2% fee on shares redeemed or exchanged within 30 days of purchase. If such redemption fee was included, performance would be reduced. For performance data current to the most recent month-end go to www.rbcgam.com. Please see footnotes below.
| (a) | The inception date (commencement of operations) is November 27, 2013 for Class A shares, November 30, 2011 for Class I shares for each Fund, and December 27, 2016 for Class R6 shares of BlueBay Emerging Market Debt Fund. The performance in the table for the Class A and Class R6 shares prior to the inception of those classes reflects the performance of the Class I shares since the Fund’s inception. |
| (b) | The Funds’ expenses reflect actual expenses for the most recent fiscal year ended (September 30, 2021). |
| (c) | The advisor has contractually agreed to waive fees and/or make payments in order to keep total operating expenses at annual ratios of 1.04% for Class A, 0.79% for Class I and 0.74% for Class R6 of BlueBay Emerging Market Debt Fund and 0.82% for Class A and 0.57% for Class I of BlueBay High Yield Bond Fund until January 31, 2023. |
| (d) | Each of the comparative indices is a widely recognized market value weighted measure of the return of securities, but do not include sales fees or operating expenses. You cannot invest directly in indices. |
JPMorgan Emerging Markets Bond Index (“EMBI”) Global Diversified Index is a subset of the JPMorgan EMBI. The JPMorgan EMBI tracks the performance of U.S. dollar-denominated Brady bonds, Eurobonds and traded loans issued by sovereign and quasi-sovereign entities in emerging markets. The JPMorgan
5
| PERFORMANCE SUMMARY (UNAUDITED) | ||
EMBI Global Diversified limits the weights of countries with larger debt stocks by including only a specified portion of these countries’ eligible current face amounts of debt outstanding.
The ICE BofAML US High Yield Index tracks the performance of U.S. dollar--denominated below investment grade corporate debt publicly issued in the U.S. domestic market.
6
| ||||||||||
This Page Intentionally Left Blank
|
7
8
| MANAGEMENT DISCUSSION AND ANALYSIS (UNAUDITED) | ||||||
RBC BlueBay Emerging Market Debt Fund | ||||||
| The J.P. Morgan Emerging Market Bond Index tracks the performance of U.S. dollar-denominated Brady bonds, Eurobonds, and traded loans issued by sovereign and quasi-sovereign entities in emerging markets. The J.P. Morgan Emerging Market Bond Index Global Diversified limits the weights of countries with larger debt stocks by including only a specified portion of these countries’ eligible current face amounts of debt outstanding. You cannot invest directly in an index. | ||||||
| Past performance is not a guarantee of future results. | ||||||
| Fund holdings and/or sector allocations are subject to change and should not be considered a recommendation to buy or sell any security. Current and future holdings are subject to risk. For a complete list of Fund holdings please refer to the Schedule of Portfolio Investments included in this report. | ||||||
9
| MANAGEMENT DISCUSSION AND ANALYSIS (UNAUDITED) |
| |||||||||||||||||||||||
RBC BlueBay Emerging Market Debt Fund
|
| |||||||||||||||||||||||
Investment Objective Benchmark | High level of total return consisting of income and capital appreciation.
|
| ||||||||||||||||||||||
JPMorgan EMBI Global Diversified Index
|
| |||||||||||||||||||||||
Asset Allocation as of 9/30/21 (% of Fund’s investments) & Top Five Industries (as of 9/30/21) (% of Fund’s net assets) |
|
| ||||||||||||||||||||||
*Includes U.S. dollar denominated cash equivalent investments representing 2.28% of investments.
|
| |||||||||||||||||||||||
Top Ten Holdings (excluding investment companies) (as of 9/30/21) (% of Fund’s net assets) |
Oman Government International Bond, 6.25%, 1/25/31 |
|
3.02 |
% |
Turkey Government International Bond, 4.88%, 4/16/43 |
|
1.73 |
% | ||||||||||||||||
| Galaxy Pipeline Assets Bidco Ltd., 2.94%, 9/30/40 | 2.30 | % | Petroleos Mexicanos, 5.63%, 1/23/46 | 1.68 | % | |||||||||||||||||||
| Egypt Treasury Bills, %, 12/21/21 | 2.15 | % | Nigeria Government International Bond, 7.88%, 2/16/32 | 1.63 | % | |||||||||||||||||||
| Argentine Republic Government International Bond, 2.50%, 7/9/41 | 2.15 | % | Pakistan Government International Bond, 6.00%, 4/8/26 | 1.63 | % | |||||||||||||||||||
| Ecuador Government International Bond, 1.00%, 7/31/35 | 2.08 | % | ||||||||||||||||||||||
| Ukraine Government International Bond, 1.26%, 5/31/40 | 1.77 | % | ||||||||||||||||||||||
*A listing of all portfolio holdings can be found beginning on page 15
| ||||||||||||||||||||||||
 |
| |||||||||||||||||||||||
Growth of $1,000,000 Initial Investment Since Inception (11/30/11) | ||||||||||||||||||||||||
| The graph reflects an initial investment of $1,000,000 over the period from November 30, 2011 (commencement of operations) to September 30, 2021 and is based on Class I shares. The Fund’s total return includes reinvested dividends and capital gains. The Fund’s total return also includes operating expenses that reduce return, while the total return of the index does not. The graph does not reflect the deduction of taxes that a shareholder would pay on fund distributions or redemption of fund shares. |
| |||||||||||||||||||||||

10
| ||||||||||
This Page Intentionally Left Blank
|
11
12
13
MANAGEMENT DISCUSSION AND ANALYSIS (UNAUDITED)
|
| |||||||||||||||||||||||||||
RBC BlueBay High Yield Bond Fund
|
| |||||||||||||||||||||||||||
Investment Objective Benchmark | High level of total return consisting of income and capital appreciation.
|
| ||||||||||||||||||||||||||
ICE BofAML US High Yield Index
|
| |||||||||||||||||||||||||||
Asset Allocation as of 9/30/21 (% of Fund’s investments) & Top Five Industries (as of 9/30/21) (% of Fund’s net assets) |
*Includes U.S. dollar denominated cash equivalent investments representing 7.23% of investments.
|
| ||||||||||||||||||||||||||
Top Ten Holdings (excluding investment companies) (as of 9/30/21) (% of Fund’s net assets) |
Carriage Services, Inc., 4.25%, 5/15/29 |
|
1.41 |
% |
Alliance Data Systems Corp., 7.00%, 1/15/26 |
|
1.08 |
% | ||||||||||||||||||||
Adient US LLC, 9.00%, 4/15/25 | 1.38 | % | CQP Holdco LP / BIP-V Chinook Holdco LLC, 5.50%, 6/15/31 | 1.05 | % | |||||||||||||||||||||||
Specialty Building Products Holdings LLC / SBP Finance Corp., 6.38%, 9/30/26 | 1.30 | % | Allegheny Technologies, Inc., 7.88%, 8/15/23 | 0.98 | % | |||||||||||||||||||||||
Roller Bearing Co. of America, Inc., 4.38%, 10/15/29 | 1.24 | % | Ford Motor Co., 9.00%, 4/22/25 | 0.96 | % | |||||||||||||||||||||||
ADT Security Corp. (The), 4.13%, 8/1/29 | 1.14 | % | Forestar Group, Inc., 3.85%, 5/15/26 | 0.95 | % | |||||||||||||||||||||||
*A listing of all portfolio holdings can be found beginning on page 26
| ||||||||||||||||||||||||||||
Growth of $1,000,000 Initial Investment Since Inception (11/30/11) |
|
| ||||||||||||||||||||||||||
| The graph reflects an initial investment of $1,000,000 over the period from November 30, 2011 (commencement of operations) to September 30, 2021 and is based on Class I shares. The Fund’s total return includes reinvested dividends and capital gains. The Fund’s total return also includes operating expenses that reduce return, while the total return of the index does not. The graph does not reflect the deduction of taxes that a shareholder would pay on fund distributions or redemption of fund shares. |
| |||||||||||||||||||||||||||
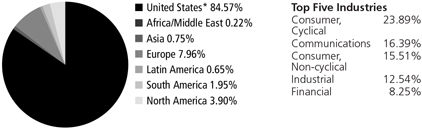
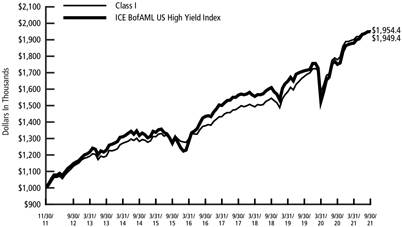
14
SCHEDULE OF PORTFOLIO INVESTMENTS |
RBC BlueBay Emerging Market Debt Fund
September 30, 2021
Principal Amount | Value | |||||
| ||||||
Foreign Government Bonds — 73.12% | ||||||
Angola — 3.31% | ||||||
$ 285,000 | Angolan Government International Bond, 8.00%, 11/26/29 | $ | 292,665 | |||
200,000 | Angolan Government International Bond, 8.25%, 5/9/28 | 207,517 | ||||
225,000 | Angolan Government International Bond, 9.13%, 11/26/49 | 229,131 | ||||
200,000 | Angolan Government International Bond, 9.50%, 11/12/25 | 220,713 | ||||
|
| |||||
| 950,026 | ||||||
|
| |||||
Argentina — 4.05% | ||||||
125,137 | Argentine Republic Government International Bond, 1.00%, 7/9/29 | 47,972 | ||||
397,095 | Argentine Republic Government International Bond, 1.13%, 7/9/35 | 129,968 | ||||
400,204 | Argentine Republic Government International Bond, 2.00%, 1/9/38 | 152,077 | ||||
1,680,000 | Argentine Republic Government International Bond, 2.50%, 7/9/41 | 615,876 | ||||
475,000 | Provincia de Buenos Aires/Government Bonds, 3.90%, 9/1/37 | 215,966 | ||||
|
| |||||
| 1,161,859 | ||||||
|
| |||||
Armenia — 0.80% | ||||||
200,000 | Republic of Armenia International Bond, 7.15%, 3/26/25 | 228,147 | ||||
|
| |||||
Bahrain — 0.64% | ||||||
200,000 | Bahrain Government International Bond, 6.25%, 1/25/51 | 183,689 | ||||
|
| |||||
Brazil — 1.36% | ||||||
440,000 | Brazilian Government International Bond, 4.75%, 1/14/50 | 388,790 | ||||
|
| |||||
Colombia — 1.90% | ||||||
200,000 | Colombia Government International Bond, 3.00%, 1/30/30 | 189,000 | ||||
210,000 | Colombia Government International Bond, 3.25%, 4/22/32 | 195,820 | ||||
200,000 | Colombia Government International Bond, 3.88%, 2/15/61 | 161,624 | ||||
|
| |||||
| 546,444 | ||||||
|
| |||||
Dominican Republic — 4.23% | ||||||
150,000 | Dominican Republic International Bond, 4.50%, 1/30/30 | 152,880 | ||||
420,000 | Dominican Republic International Bond, 4.88%, 9/23/32 | 428,975 | ||||
345,000 | Dominican Republic International Bond, 5.88%, 1/30/60 | 338,500 | ||||
260,000 | Dominican Republic International Bond, 5.95%, 1/25/27 | 292,427 | ||||
|
| |||||
| 1,212,782 | ||||||
|
| |||||
Ecuador — 2.08% | ||||||
912,441 | Ecuador Government International Bond, 1.00%, 7/31/35 | 595,824 | ||||
|
| |||||
15
SCHEDULE OF PORTFOLIO INVESTMENTS |
RBC BlueBay Emerging Market Debt Fund (cont.)
September 30, 2021
Principal Amount | Value | |||||
| ||||||
Egypt — 3.37% | ||||||
$ 400,000 | Egypt Government International Bond, 7.50%, 2/16/61 | $ | 350,941 | |||
9,967,000(a) | Egypt Treasury Bills, 0.00%, 12/21/21(b) | 616,698 | ||||
|
| |||||
| 967,639 | ||||||
|
| |||||
El Salvador — 1.69% | ||||||
325,000 | El Salvador Government International Bond, 5.88%, 1/30/25 | 249,301 | ||||
113,000 | El Salvador Government International Bond, 6.38%, 1/18/27 | 84,293 | ||||
120,000 | El Salvador Government International Bond, 7.65%, 6/15/35 | 87,019 | ||||
85,000 | El Salvador Government International Bond, 8.63%, 2/28/29 | 65,321 | ||||
|
| |||||
| 485,934 | ||||||
|
| |||||
Guatemala — 1.67% | ||||||
290,000 | Guatemala Government Bond, 3.70%, 10/7/33 | 283,124 | ||||
200,000 | Guatemala Government Bond, 4.65%, 10/7/41 | 194,916 | ||||
|
| |||||
| 478,040 | ||||||
|
| |||||
Indonesia — 2.20% | ||||||
150,000(c) | Indonesia Government International Bond, 1.30%, 3/23/34 | 169,649 | ||||
200,000 | Indonesia Government International Bond, 3.35%, 3/12/71 | 184,935 | ||||
270,000 | Perusahaan Penerbit SBSN Indonesia III, 3.80%, 6/23/50 | 275,250 | ||||
|
| |||||
| 629,834 | ||||||
|
| |||||
Iraq — 2.08% | ||||||
406,250 | Iraq International Bond, 5.80%, 1/15/28 | 392,427 | ||||
200,000 | Iraq International Bond, 6.75%, 3/9/23 | 203,229 | ||||
|
| |||||
| 595,656 | ||||||
|
| |||||
Lebanon — 0.66% | ||||||
36,000 | Lebanon Government International Bond, 5.80%, 4/14/20(d) | 6,035 | ||||
66,000 | Lebanon Government International Bond, 6.00%, 1/27/23(d) | 11,036 | ||||
85,000 | Lebanon Government International Bond, EMTN, 6.10%, 10/4/22(d) | 14,213 | ||||
106,000 | Lebanon Government International Bond, GMTN, 6.15%, 6/19/20(d) | 17,590 | ||||
675,000 | Lebanon Government International Bond, GMTN, 6.38%, 3/9/20(d) | 112,590 | ||||
166,000 | Lebanon Government International Bond, 8.25%, 4/12/21(d) | 28,153 | ||||
5,000 | Lebanon Government International Bond, 8.25%, 5/17/34(d) | 800 | ||||
|
| |||||
| 190,417 | ||||||
|
| |||||
Macedonia — 0.79% | ||||||
200,000(c) | North Macedonia Government International Bond, 1.63%, 3/10/28 | 225,766 | ||||
|
| |||||
Mexico — 2.05% | ||||||
340,000 | Mexico Government International Bond, 3.77%, 5/24/61 | 302,057 | ||||
280,000 | Mexico Government International Bond, 4.50%, 1/31/50 | 286,700 | ||||
|
| |||||
| 588,757 | ||||||
|
| |||||
16
SCHEDULE OF PORTFOLIO INVESTMENTS |
RBC BlueBay Emerging Market Debt Fund (cont.)
September 30, 2021
Principal Amount | Value | |||||
| ||||||
Nigeria — 3.06% | ||||||
$ 200,000 | Nigeria Government International Bond, 6.50%, 11/28/27 | $ | 207,442 | |||
200,000 | Nigeria Government International Bond, 7.38%, 9/28/33 | 202,459 | ||||
450,000 | Nigeria Government International Bond, 7.88%, 2/16/32 | 467,408 | ||||
|
| |||||
| 877,309 | ||||||
|
| |||||
Oman — 7.60% | ||||||
200,000 | Oman Government International Bond, 4.13%, 1/17/23 | 204,292 | ||||
200,000 | Oman Government International Bond, 4.75%, 6/15/26 | 205,264 | ||||
200,000 | Oman Government International Bond, 4.88%, 2/1/25 | 208,140 | ||||
810,000 | Oman Government International Bond, 6.25%, 1/25/31 | 867,592 | ||||
265,000 | Oman Government International Bond, 6.75%, 10/28/27 | 295,013 | ||||
200,000 | Oman Government International Bond, 6.75%, 1/17/48 | 198,188 | ||||
200,000 | Oman Government International Bond, 7.00%, 1/25/51 | 202,439 | ||||
|
| |||||
| 2,180,928 | ||||||
|
| |||||
Pakistan — 2.31% | ||||||
470,000 | Pakistan Government International Bond, 6.00%, 4/8/26 | 466,349 | ||||
200,000 | Pakistan Water & Power Development Authority, 7.50%, 6/4/31 | 197,070 | ||||
|
| |||||
| 663,419 | ||||||
|
| |||||
Paraguay — 2.77% | ||||||
300,000 | Paraguay Government International Bond, 2.74%, 1/29/33 | 288,053 | ||||
250,000 | Paraguay Government International Bond, 5.00%, 4/15/26 | 277,903 | ||||
200,000 | Paraguay Government International Bond, 5.40%, 3/30/50 | 229,900 | ||||
|
| |||||
| 795,856 | ||||||
|
| |||||
Philippines — 1.35% | ||||||
200,000 | Philippine Government International Bond, 2.95%, 5/5/45 | 190,758 | ||||
200,000 | Philippine Government International Bond, 3.20%, 7/6/46 | 197,192 | ||||
|
| |||||
| 387,950 | ||||||
|
| |||||
Qatar — 0.85% | ||||||
200,000 | Qatar Government International Bond, 4.40%, 4/16/50 | 243,873 | ||||
|
| |||||
Romania — 3.05% | ||||||
35,000(c) | Romanian Government International Bond, 2.00%, 4/14/33 | 38,666 | ||||
135,000(c) | Romanian Government International Bond, 2.12%, 7/16/31 | 156,184 | ||||
100,000(c) | Romanian Government International Bond, 2.63%, 12/2/40 | 108,011 | ||||
295,000(c) | Romanian Government International Bond, 2.75%, 4/14/41 | 317,435 | ||||
107,000(c) | Romanian Government International Bond, 3.38%, 1/28/50 | 122,006 | ||||
134,000 | Romanian Government International Bond, 4.00%, 2/14/51 | 133,015 | ||||
|
| |||||
| 875,317 | ||||||
|
| |||||
Saudi Arabia — 1.62% | ||||||
260,000 | Saudi Government International Bond, 3.45%, 2/2/61 | 255,625 | ||||
200,000 | Saudi Government International Bond, 3.75%, 1/21/55 | 209,346 | ||||
|
| |||||
| 464,971 | ||||||
|
| |||||
17
SCHEDULE OF PORTFOLIO INVESTMENTS |
RBC BlueBay Emerging Market Debt Fund (cont.)
September 30, 2021
Principal Amount | Value | |||||
| ||||||
South Africa — 1.49% | ||||||
$ 200,000 | Republic of South Africa Government International Bond, 4.85%, 9/30/29 | $ | 205,829 | |||
250,000 | Republic of South Africa Government International Bond, 5.00%, 10/12/46 | 222,116 | ||||
|
| |||||
| 427,945 | ||||||
|
| |||||
Sri Lanka — 0.43% | ||||||
200,000 | Sri Lanka Government International Bond, 6.83%, 7/18/26 | 124,771 | ||||
|
| |||||
Tajikistan — 0.62% | ||||||
200,000 | Republic of Tajikistan International Bond, 7.13%, 9/14/27 | 179,239 | ||||
|
| |||||
Trinidad & Tobago — 1.47% | ||||||
400,000 | Trinidad & Tobago Government International Bond, 4.50%, 8/4/26 | 421,375 | ||||
|
| |||||
Tunisia — 2.20% | ||||||
300,000(c) | Banque Centrale de Tunisie International Bond, 5.63%, 2/17/24 | 292,911 | ||||
400,000 | Banque Centrale de Tunisie International Bond, 5.75%, 1/30/25 | 339,260 | ||||
|
| |||||
| 632,171 | ||||||
|
| |||||
Turkey — 4.00% | ||||||
640,000 | Turkey Government International Bond, 4.88%, 4/16/43 | 496,744 | ||||
400,000 | Turkey Government International Bond, 5.75%, 5/11/47 | 330,973 | ||||
340,000 | Turkey Government International Bond, 5.95%, 1/15/31 | 321,042 | ||||
|
| |||||
| 1,148,759 | ||||||
|
| |||||
Ukraine — 1.77% | ||||||
470,000 | Ukraine Government International Bond, 1.26%, 5/31/40(e) | 509,010 | ||||
|
| |||||
United Arab Emirates — 3.45% | ||||||
250,000 | Abu Dhabi Government International Bond, 3.13%, 9/30/49 | 251,379 | ||||
360,000 | Finance Department Government of Sharjah, 3.63%, 3/10/33 | 354,946 | ||||
430,000 | Finance Department Government of Sharjah, 4.00%, 7/28/50 | 383,436 | ||||
|
| |||||
| 989,761 | ||||||
|
| |||||
Uruguay — 1.45% | ||||||
332,599 | Uruguay Government International Bond, 4.98%, 4/20/55 | 417,080 | ||||
|
| |||||
Venezuela — 0.12% | ||||||
85,000 | Venezuela Government International Bond, 7.75%, 10/13/19(d) | 8,708 | ||||
73,800 | Venezuela Government International Bond, 8.25%, 10/13/24(d) | 7,561 | ||||
170,000 | Venezuela Government International Bond, 11.75%, 10/21/26(d) | 17,417 | ||||
|
| |||||
| 33,686 | ||||||
|
| |||||
18
SCHEDULE OF PORTFOLIO INVESTMENTS |
RBC BlueBay Emerging Market Debt Fund (cont.)
September 30, 2021
Principal Amount | Value | |||||
| ||||||
Zambia — 0.63% | ||||||
$ 240,000 | Zambia Government International Bond, 5.38%, 9/20/22 | $ | 179,702 | |||
|
| |||||
Total Foreign Government Bonds | 20,982,726 | |||||
|
| |||||
(Cost $21,633,719) | ||||||
Corporate Bonds — 24.44% | ||||||
Argentina — 1.54% | ||||||
122,500 | YPF SA, 8.50%, 3/23/25 | 112,357 | ||||
120,000 | YPF SA, 8.50%, 7/28/25 | 101,100 | ||||
254,000 | YPF SA, 8.75%, 4/4/24 | 227,254 | ||||
|
| |||||
| 440,711 | ||||||
|
| |||||
Brazil — 2.02% | ||||||
200,000 | Cemig Geracao e Transmissao SA, 9.25%, 12/5/24 | 227,000 | ||||
186,754 | MV24 Capital BV, 6.75%, 6/1/34 | 198,020 | ||||
150,000 | Petrobras Global Finance BV, 6.85%, 6/5/2115 | 154,612 | ||||
|
| |||||
| 579,632 | ||||||
|
| |||||
Chile — 0.85% | ||||||
250,000 | Empresa de los Ferrocarriles del Estado, 3.83%, 9/14/61(f) | 244,034 | ||||
|
| |||||
Colombia — 0.88% | ||||||
250,000 | Ecopetrol SA, 5.88%, 5/28/45 | 252,500 | ||||
|
| |||||
Ecuador — 0.14% | ||||||
41,579 | Petroamazonas EP, 4.63%, 12/6/21 | 41,433 | ||||
|
| |||||
Mexico — 5.12% | ||||||
200,000 | Mexico City Airport Trust, 3.88%, 4/30/28 | 206,220 | ||||
200,000 | Mexico City Airport Trust, 5.50%, 7/31/47 | 203,500 | ||||
600,000 | Petroleos Mexicanos, 5.63%, 1/23/46 | 482,052 | ||||
506,000 | Petroleos Mexicanos, 6.35%, 2/12/48 | 426,432 | ||||
3,250,000(a) | Petroleos Mexicanos, 7.19%, 9/12/24 | 150,692 | ||||
|
| |||||
| 1,468,896 | ||||||
|
| |||||
Oman — 0.71% | ||||||
200,000 | OQ SAOC, 5.13%, 5/6/28 | 202,857 | ||||
|
| |||||
Paraguay — 0.73% | ||||||
200,000 | Telefonica Celular del Paraguay SA, 5.88%, 4/15/27 | 209,450 | ||||
|
| |||||
Peru — 1.12% | ||||||
320,000 | InRetail Consumer, 3.25%, 3/22/28 | 320,245 | ||||
|
| |||||
19
SCHEDULE OF PORTFOLIO INVESTMENTS |
RBC BlueBay Emerging Market Debt Fund (cont.)
September 30, 2021
Principal Amount | Value | |||||
| ||||||
Qatar — 1.54% | ||||||
$220,000 | Qatar Petroleum, 3.13%, 7/12/41 | $ | 219,589 | |||
220,000 | Qatar Petroleum, 3.30%, 7/12/51 | 221,881 | ||||
|
| |||||
| 441,470 | ||||||
|
| |||||
Saudi Arabia — 1.43% | ||||||
220,000 | SA Global Sukuk Ltd., 2.69%, 6/17/31 | 222,090 | ||||
200,000 | Saudi Arabian Oil Co., 3.50%, 11/24/70 | 188,456 | ||||
|
| |||||
| 410,546 | ||||||
|
| |||||
Trinidad & Tobago — 0.72% | ||||||
200,000 | Trinidad Generation UnLtd, 5.25%, 11/4/27 | 206,291 | ||||
|
| |||||
Turkey — 0.97% | ||||||
280,000 | Hazine Mustesarligi Varlik Kiralama AS, 5.13%, 6/22/26 | 278,670 | ||||
|
| |||||
United Arab Emirates — 5.39% | ||||||
200,000 | DP World Salaam, 6.00%, (g),(h) | 219,458 | ||||
260,000 | Galaxy Pipeline Assets Bidco Ltd., 2.16%, 3/31/34 | 255,775 | ||||
660,000 | Galaxy Pipeline Assets Bidco Ltd., 2.94%, 9/30/40 | 658,850 | ||||
200,000 | MDGH - GMTN BV, GMTN, 2.88%, 5/21/30 | 210,830 | ||||
200,000 | Sharjah Sukuk Program Ltd., 2.94%, 6/10/27 | 202,628 | ||||
|
| |||||
| 1,547,541 | ||||||
|
| |||||
United States — 1.02% | ||||||
400,000 | Rutas 2 and 7 Finance Ltd., 0.00%, 9/30/36(b) | 293,760 | ||||
|
| |||||
Venezuela — 0.26% | ||||||
173,584 | Petroleos de Venezuela SA, 6.00%, 11/15/26(d) | 9,981 | ||||
260,000 | Petroleos de Venezuela SA, 8.50%, 10/27/20(d) | 65,000 | ||||
|
| |||||
| 74,981 | ||||||
|
| |||||
Total Corporate Bonds | 7,013,017 | |||||
|
| |||||
(Cost $7,188,091) | ||||||
Shares | ||||||
Investment Company — 2.28% | ||||||
654,507 | U.S. Government Money Market Fund, RBC Institutional Class 1 (i) | 654,507 | ||||
|
| |||||
Total Investment Company | 654,507 | |||||
|
| |||||
(Cost $654,507) | ||||||
Total Investments | $ | 28,650,250 | ||||
(Cost $29,476,317)(j) — 99.84% | ||||||
Other assets in excess of liabilities — 0.16% | 44,987 | |||||
|
| |||||
NET ASSETS — 100.00% | $ | 28,695,237 | ||||
|
| |||||
20
SCHEDULE OF PORTFOLIO INVESTMENTS |
RBC BlueBay Emerging Market Debt Fund (cont.)
September 30, 2021
| (a) | Investment in non-U.S. Dollars. Principal amount reflects local currency. |
| (b) | Zero Coupon Bond. The rate represents the yield at time of purchase. |
| (c) | Principal amount denoted in Euros. |
| (d) | Issuer filed for bankruptcy and/or is in default of interest payments. |
| (e) | Variable or floating rate security, which interest rate adjusts periodically based on changes in current interest rates and prepayments on the underlying pool of assets. Rate shown is the rate in effect as of period end. |
| (f) | Security exempt from registration under Rule 144A or Section 4(2) of the Securities Act of 1933, as amended. These securities may be resold in transactions exempt from registration, normally to qualified institutional buyers. |
| (g) | Security is a fix-to-float security, which carries a fixed coupon until a certain date, upon which it switches to a floating rate. Reference rate and spread are provided if the rate is currently floating. |
| (h) | Perpetual security with no stated maturity date. |
| (i) | Affiliated investment. |
| (j) | See Notes to Schedules of Portfolio Investments for the tax cost of securities and the breakdown of unrealized appreciation (depreciation). |
21
SCHEDULE OF PORTFOLIO INVESTMENTS |
RBC BlueBay Emerging Market Debt Fund (cont.)
September 30, 2021
Foreign currency exchange contracts as of September 30, 2021:
Currency Purchased | Currency Sold | Counterparty | Settlement Date | Value/Unrealized Appreciation (Depreciation) | ||||||||||||||||||||||||
OMR | 19,334 | USD | 50,000 | Citibank N.A. | 10/20/21 | $ | 213 | |||||||||||||||||||||
COP | 1,060,387,200 | USD | 270,000 | Citibank N.A. | 10/27/21 | 7,937 | ||||||||||||||||||||||
USD | 176,000 | EUR | 150,000 | Citibank N.A. | 10/27/21 | 2,160 | ||||||||||||||||||||||
USD | 1,850,314 | EUR | 1,561,000 | Citibank N.A. | 10/27/21 | 41,215 | ||||||||||||||||||||||
USD | 197,087 | MXN | 3,965,902 | Citibank N.A. | 10/27/21 | 5,717 | ||||||||||||||||||||||
USD | 97,369 | MXN | 1,953,355 | Citibank N.A. | 10/27/21 | 3,113 | ||||||||||||||||||||||
USD | 47,926 | ZAR | 691,250 | Citibank N.A. | 10/27/21 | 2,188 | ||||||||||||||||||||||
USD | 143,888 | ZAR | 2,073,750 | Citibank N.A. | 10/27/21 | 6,674 | ||||||||||||||||||||||
USD | 48,028 | ZAR | 691,250 | Citibank N.A. | 10/27/21 | 2,290 | ||||||||||||||||||||||
USD | 95,139 | ZAR | 1,382,500 | Citibank N.A. | 10/27/21 | 3,662 | ||||||||||||||||||||||
USD | 47,529 | ZAR | 691,250 | Citibank N.A. | 10/27/21 | 1,791 | ||||||||||||||||||||||
|
| |||||||||||||||||||||||||||
| $ | 76,960 | |||||||||||||||||||||||||||
USD | 672,306 | OMR | 263,275 | Citibank N.A. | 10/20/21 | $ | (11,451 | ) | ||||||||||||||||||||
COP | 1,126,906,200 | USD | 300,000 | Citibank N.A. | 10/27/21 | (4,627 | ) | |||||||||||||||||||||
EUR | 198,000 | USD | 232,778 | Citibank N.A. | 10/27/21 | (3,309 | ) | |||||||||||||||||||||
EUR | 230,000 | USD | 269,009 | Citibank N.A. | 10/27/21 | (2,454 | ) | |||||||||||||||||||||
MXN | 5,460,211 | USD | 270,000 | Citibank N.A. | 10/27/21 | (6,525 | ) | |||||||||||||||||||||
USD | 290,000 | COP | 1,111,575,800 | Citibank N.A. | 10/27/21 | (1,354 | ) | |||||||||||||||||||||
USD | 300,000 | COP | 1,162,413,000 | Citibank N.A. | 10/27/21 | (4,679 | ) | |||||||||||||||||||||
ZAR | 5,670,000 | USD | 376,956 | Citibank N.A. | 10/27/21 | (1,789) | ||||||||||||||||||||||
|
| |||||||||||||||||||||||||||
| $ | (36,188 | ) | ||||||||||||||||||||||||||
|
| |||||||||||||||||||||||||||
Total | $ | 40,772 | ||||||||||||||||||||||||||
|
| |||||||||||||||||||||||||||
22
SCHEDULE OF PORTFOLIO INVESTMENTS |
RBC BlueBay Emerging Market Debt Fund (cont.)
September 30, 2021
Financial futures contracts as of September 30, 2021:
Short Position | Number of Contracts | Expiration Date | Value/Unrealized Appreciation | Notional Value | Clearinghouse | |||||||||||||||||||||||
10 Year Euro-Bund | 3 | December 2021 | $ | 8,094 | EUR | $ | 509,460 | Citigroup Global Markets, Inc. | ||||||||||||||||||||
30 Year Euro-Buxl | 1 | December 2021 | 6,845 | EUR | 203,340 | Citigroup Global Markets, Inc. | ||||||||||||||||||||||
30 Year U.S. Treasury Bond | 2 | December 2021 | 10,064 | USD | 318,438 | Citigroup Global Markets, Inc. | ||||||||||||||||||||||
30 Year U.S. Ultra Treasury Bond | 2 | December 2021 | 16,647 | USD | 382,125 | Citigroup Global Markets, Inc. | ||||||||||||||||||||||
Ten Year U.S. Treasury Note | 3 | December 2021 | 6,133 | USD | 394,828 | Citigroup Global Markets, Inc. | ||||||||||||||||||||||
|
| |||||||||||||||||||||||||||
Total | $ | 47,783 | ||||||||||||||||||||||||||
|
| |||||||||||||||||||||||||||
Interest rate swaps as of September 30, 2021:
Fixed | Floating Rate | Payment Frequency | Counterparty | Expiration Date | Notional Amount (000) | Value/ Unrealized Appreciation (Depreciation) | ||||||||||||||||||||||||
| 2.58% | CNY-CITILDN | Quarterly | Citigroup Global Markets, Inc. | 10/27/26 | CNY | 4,110 | $ | 2,254 | ||||||||||||||||||||||
| 6.89% | MXN-BNPLDN | Every 28 days | Citigroup Global Markets, Inc. | 10/15/31 | MXN | 5,919 | (12,372 | ) | ||||||||||||||||||||||
|
| |||||||||||||||||||||||||||||
| Total | $ | (10,118 | ) | |||||||||||||||||||||||||||
|
| |||||||||||||||||||||||||||||
Credit default swaps buy protection as of September 30, 2021:
Fixed | Issuer | Payment Frequency | Counterparty | Expiration Date | Notional Amount (000) | Premium Paid/ (Received) | Unrealized Appreciation | Value | ||||||||||||||||||||
| 1.00% | Turkey Government International Bond | Quarterly | HSBC Bank Plc | 12/20/23 | USD | 577 | $ | 26,609 | $ 7,395 | $ | 34,004 | |||||||||||||||||
| 1.00% | Turkey Government International Bond | Quarterly | HSBC Bank Plc | 12/20/26 | USD | 504 | 66,851 | 8,178 | 75,029 | |||||||||||||||||||
23
SCHEDULE OF PORTFOLIO INVESTMENTS |
RBC BlueBay Emerging Market Debt Fund (cont.)
September 30, 2021
Fixed | Issuer | Payment Frequency | Counterparty | Expiration Date | Notional Amount (000) | Premium Paid/ (Received) | Unrealized Appreciation | Value | ||||||||||||||||||||||||
| 1.00% | Turkey Government International Bond | Quarterly | Citigroup Global Markets Limited | 12/20/23 | USD | 955 | 46,114 | 10,165 | 56,279 | |||||||||||||||||||||||
| 1.00% | Russian Foreign Bond - Eurobond | Quarterly | Barclays Bank Plc | 12/20/26 | USD | 820 | (6,435 | ) | 1,510 | (4,925 | ) | |||||||||||||||||||||
| 5.00% | Markit ITRAXX XOver Index, Series 36 | Quarterly | Citigroup Global Markets, Inc. | 12/20/26 | EUR | 720 | (100,189 | ) | 85 | (100,104 | ) | |||||||||||||||||||||
| 5.00% | Markit ITRAXX XOver Index, Series 36 | Quarterly | Citigroup Global Markets, Inc. | 12/20/26 | EUR | 460 | (64,702 | ) | 747 | (63,955 | ) | |||||||||||||||||||||
|
|
|
|
|
| |||||||||||||||||||||||||||
| Total | $ | (31,752 | ) | $ | 28,080 | $ | (3,672 | ) | ||||||||||||||||||||||||
|
|
|
|
|
| |||||||||||||||||||||||||||
Abbreviations used are defined below:
CNY - China Yuan
COP - Colombian Peso
EMTN - Euro Medium Term Note
EUR - Euro
GMTN - Global Medium Term Note
MXN - Mexican Peso
OMR - Omani Rial
USD - United States Dollar
ZAR - South African Rand
24
SCHEDULE OF PORTFOLIO INVESTMENTS |
RBC BlueBay Emerging Market Debt Fund (cont.)
September 30, 2021
Portfolio Diversification (Unaudited)
Industries | Percentage | |||||||
Foreign Government Bonds | 73.12 | % | ||||||
Energy | 13.92 | % | ||||||
Industrial | 3.99 | % | ||||||
Government | 1.68 | % | ||||||
Utilities | 1.51 | % | ||||||
Consumer, Cyclical | 1.12 | % | ||||||
Consumer, Non-cyclical | 0.76 | % | ||||||
Communications | 0.73 | % | ||||||
Financial | 0.73 | % | ||||||
Other* | 2.44 | % | ||||||
|
| |||||||
| 100.00 | % | |||||||
|
| |||||||
* Includes cash, Investment Company, interest and dividend receivable, pending trades and Fund share transactions, interest rate swaps, credit default swaps, financial futures contracts, foreign currency exchange contracts and accrued expenses payable.
See Notes to the Financial Statements.
25
| SCHEDULE OF PORTFOLIO INVESTMENTS | ||
RBC BlueBay High Yield Bond Fund
| ||
| ||
September 30, 2021 | ||
Principal Amount | Value | |||||
| ||||||
Corporate Bonds — 89.99% | ||||||
Australia — 0.12% | ||||||
$ 143,548 | Quintis Australia Pty Ltd., PIK, 0.00%, 10/1/28(a),(b),(c) | $ | 106,369 | |||
204,302 | Quintis Australia Pty Ltd., PIK, 7.50%, 10/1/26(a),(b),(c) | 203,485 | ||||
|
| |||||
| 309,854 | ||||||
|
| |||||
Bermuda — 0.64% | ||||||
1,493,427 | Highlands Holdings Bond Issuer Ltd. / Highlands Holdings Bond Co-Issuer, Inc., PIK, 7.63%, 10/15/25(a) | 1,582,099 | ||||
|
| |||||
Brazil — 1.12% | ||||||
1,000,000 | MARB BondCo Plc, 3.95%, 1/29/31 | 954,800 | ||||
1,874,000 | Movida Europe SA, 5.25%, 2/8/31(a) | 1,822,465 | ||||
|
| |||||
| 2,777,265 | ||||||
|
| |||||
Canada — 3.79% | ||||||
2,190,000 | Baffinland Iron Mines Corp. / Baffinland Iron Mines LP, 8.75%, 7/15/26(a) | 2,317,672 | ||||
1,098,000 | Bombardier, Inc., 6.00%, 2/15/28(a) | 1,107,013 | ||||
1,198,000 | Bombardier, Inc., 7.88%, 4/15/27(a) | 1,241,068 | ||||
1,579,000 | Intelligent Packaging Ltd. Finco, Inc. / Intelligent Packaging Ltd. Co-Issuer LLC, 6.00%, 9/15/28(a) | 1,657,161 | ||||
1,215,000 | Kronos Acquisition Holdings, Inc. / KIK Custom Products, Inc., 7.00%, 12/31/27(a) | 1,163,594 | ||||
730,000 | New Gold, Inc., 7.50%, 7/15/27(a) | 751,681 | ||||
1,162,000 | Primo Water Holdings, Inc., 4.38%, 4/30/29(a) | 1,162,191 | ||||
|
| |||||
| 9,400,380 | ||||||
|
| |||||
Cayman Islands — 0.78% | ||||||
1,951,674 | Global Aircraft Leasing Co. Ltd., PIK, 6.50%, 9/15/24(a) | 1,927,278 | ||||
|
| |||||
France — 1.20% | ||||||
650,000 | Altice France SA, 5.13%, 7/15/29(a) | 638,475 | ||||
2,280,000 | Banijay Entertainment SASU, 5.38%, 3/1/25(a) | 2,351,250 | ||||
|
| |||||
| 2,989,725 | ||||||
|
| |||||
Germany — 1.47% | ||||||
400,000(d) | Adler Group SA, 2.25%, 1/14/29 | 375,711 | ||||
1,383,000 | Cheplapharm Arzneimittel GmbH, 5.50%, 1/15/28(a) | 1,432,695 | ||||
1,000,000 | Commerzbank AG, 7.00%, (e),(f) | 1,087,188 | ||||
705,000 | TK Elevator Holdco GmbH, 7.63%, 7/15/28(a) | 753,469 | ||||
|
| |||||
| 3,649,063 | ||||||
|
| |||||
Italy — 2.23% | ||||||
400,000(d) | Banca Monte dei Paschi di Siena SpA, 8.50%, 9/10/30(e) | 379,553 | ||||
350,000(d) | Banca Monte dei Paschi di Siena SpA, EMTN, 10.50%, 7/23/29 | 412,720 | ||||
1,129,000 | F-Brasile SpA / F-Brasile US LLC, Series XR, 7.38%, 8/15/26(a) | 1,156,683 | ||||
300,000 | Intesa Sanpaolo SpA, MTN, 7.70%, (a),(e),(f) | 339,896 | ||||
1,150,000 | Telecom Italia Capital SA, 6.38%, 11/15/33 | 1,334,170 | ||||
26
SCHEDULE OF PORTFOLIO INVESTMENTS |
RBC BlueBay High Yield Bond Fund (cont.)
September 30, 2021
Principal Amount | Value | |||||
| ||||||
$1,500,000 | UniCredit SpA, MTN, 5.46%, 6/30/35(a),(e) | $ | 1,647,501 | |||
220,000 | UniCredit SpA, MTN, 7.30%, 4/2/34(a),(e) | 266,443 | ||||
|
| |||||
| 5,536,966 | ||||||
|
| |||||
Korea — 0.27% | ||||||
650,000 | Clark Equipment Co., 5.88%, 6/1/25(a) | 682,257 | ||||
|
| |||||
Luxembourg — 1.18% | ||||||
423,000 | Altice Financing SA, 5.00%, 1/15/28(a) | 407,489 | ||||
778,000 | Altice Financing SA, 5.75%, 8/15/29(a) | 759,311 | ||||
1,612,000 | Altice France Holding SA, 10.50%, 5/15/27(a) | 1,762,883 | ||||
|
| |||||
| 2,929,683 | ||||||
|
| |||||
Netherlands — 0.42% | ||||||
1,000,000 | UPC Holding BV, 5.50%, 1/15/28(a) | 1,045,000 | ||||
|
| |||||
Singapore — 0.32% | ||||||
950,288 | Avation Capital SA, PIK, MTN, 8.25%, 10/31/26(a) | 800,285 | ||||
|
| |||||
United Arab Emirates — 0.21% | ||||||
508,000 | GEMS MENASA Cayman Ltd. / GEMS Education Delaware LLC, 7.13%, 7/31/26(a) | 522,342 | ||||
|
| |||||
United Kingdom — 1.22% | ||||||
770,000(g) | Constellation Automotive Financing Plc, 4.88%, 7/15/27(a) | 1,028,857 | ||||
870,000(d) | Pinnacle Bidco Plc, 5.50%, 2/15/25 | 1,036,025 | ||||
680,000(g) | Stonegate Pub Co. Financing 2019 Plc, 8.25%, 7/31/25 | 962,410 | ||||
|
| |||||
| 3,027,292 | ||||||
|
| |||||
United States — 75.02% | ||||||
694,000 | 180 Medical, Inc., 3.88%, 10/15/29(a) | 694,000 | ||||
3,169,000 | Adient US LLC, 9.00%, 4/15/25(a) | 3,435,868 | ||||
2,849,000 | ADT Security Corp. (The), 4.13%, 8/1/29(a) | 2,831,842 | ||||
300,000 | ADT Security Corp. (The), 4.88%, 7/15/32(a) | 302,454 | ||||
1,749,000 | Adtalem Global Education, Inc., 5.50%, 3/1/28(a) | 1,766,590 | ||||
1,050,000 | Aircastle Ltd., 5.25%, (a),(e),(f) | 1,068,813 | ||||
1,519,000 | Albertsons Cos., Inc. / Safeway, Inc. / New Albertsons LP / Albertsons LLC, 3.50%, 3/15/29(a) | 1,512,866 | ||||
1,482,000 | Albertsons Cos., Inc. / Safeway, Inc. / New Albertsons LP / Albertsons LLC, 7.50%, 3/15/26(a) | 1,602,853 | ||||
812,000 | Allegheny Technologies, Inc., 4.88%, 10/1/29 | 814,214 | ||||
2,177,000 | Allegheny Technologies, Inc., 7.88%, 8/15/23 | 2,422,879 | ||||
2,500,000 | Alliance Data Systems Corp., 7.00%, 1/15/26(a) | 2,676,014 | ||||
2,080,000 | Allison Transmission, Inc., 5.88%, 6/1/29(a) | 2,262,890 | ||||
1,369,000 | AMC Networks, Inc., 4.25%, 2/15/29 | 1,362,155 | ||||
828,000 | APi Group DE, Inc., 4.13%, 7/15/29(a) | 812,108 | ||||
27
SCHEDULE OF PORTFOLIO INVESTMENTS |
RBC BlueBay High Yield Bond Fund (cont.)
September 30, 2021
Principal Amount | Value | |||||
| ||||||
$ 400,000 | Ardagh Packaging Finance Plc / Ardagh Holdings USA, Inc., 5.25%, 4/30/25(a) | $ | 417,712 | |||
648,000 | Ardagh Packaging Finance Plc / Ardagh Holdings USA, Inc., 5.25%, 8/15/27(a) | 660,555 | ||||
653,749 | Artera Services LLC, 9.03%, 12/4/25(a) | 709,185 | ||||
1,709,000 | Asbury Automotive Group, Inc., 4.50%, 3/1/28 | 1,758,227 | ||||
1,500,000 | Ashton Woods USA LLC / Ashton Woods Finance Co., 4.63%, 4/1/30(a) | 1,510,027 | ||||
825,000 | Bausch Health Americas, Inc., 8.50%, 1/31/27(a) | 884,812 | ||||
1,096,000 | Bausch Health Cos., Inc., 6.25%, 2/15/29(a) | 1,084,514 | ||||
405,333 | BCPE Ulysses Intermediate, Inc., PIK, 7.75%, 4/1/27(a) | 404,014 | ||||
1,512,000 | Boxer Parent Co., Inc., 7.13%, 10/2/25(a) | 1,614,060 | ||||
760,000 | Boyne USA, Inc., 4.75%, 5/15/29(a) | 784,774 | ||||
2,257,000 | Brundage-Bone Concrete Pumping Holdings, Inc., 6.00%, 2/1/26(a) | 2,349,144 | ||||
1,279,000 | Builders FirstSource, Inc., 4.25%, 2/1/32(a) | 1,306,592 | ||||
1,000,000 | Builders FirstSource, Inc., 5.00%, 3/1/30(a) | 1,070,000 | ||||
1,000,000 | Builders FirstSource, Inc., 6.75%, 6/1/27(a) | 1,059,803 | ||||
525,000 | Cablevision Lightpath LLC, 3.88%, 9/15/27(a) | 515,459 | ||||
1,216,000 | Cablevision Lightpath LLC, 5.63%, 9/15/28(a) | 1,220,465 | ||||
587,000 | Caesars Entertainment, Inc., 4.63%, 10/15/29(a) | 595,165 | ||||
516,000 | Caesars Entertainment, Inc., 6.25%, 7/1/25(a) | 543,668 | ||||
662,000 | Caesars Entertainment, Inc., 8.13%, 7/1/27(a) | 743,878 | ||||
1,650,000 | Caesars Resort Collection LLC / CRC Finco, Inc., 5.25%, 10/15/25(a) | 1,673,311 | ||||
525,000 | Caesars Resort Collection LLC / CRC Finco, Inc., 5.75%, 7/1/25(a) | 552,173 | ||||
3,475,000 | Carriage Services, Inc., 4.25%, 5/15/29(a) | 3,507,099 | ||||
723,000 | CCO Holdings LLC / CCO Holdings Capital Corp., 4.50%, 6/1/33(a) | 736,506 | ||||
768,000 | CCO Holdings LLC / CCO Holdings Capital Corp., 4.75%, 3/1/30(a) | 802,118 | ||||
1,043,000 | Cedar Fair LP / Canada’s Wonderland Co. / Magnum Management Corp. / Millennium Op, 5.50%, 5/1/25(a) | 1,087,967 | ||||
1,799,000 | Central Garden & Pet Co., 4.13%, 4/30/31(a) | 1,826,507 | ||||
1,025,000 | Clarios Global LP / Clarios US Finance Co., 6.25%, 5/15/26(a) | 1,077,557 | ||||
1,445,000 | Clarios Global LP / Clarios US Finance Co., 8.50%, 5/15/27(a) | 1,536,396 | ||||
1,655,000 | Clearway Energy Operating LLC, 3.75%, 2/15/31(a) | 1,669,092 | ||||
411,000 | CNX Midstream Partners LP, 4.75%, 4/15/30(a) | 416,439 | ||||
969,000 | CommScope Technologies LLC, 6.00%, 6/15/25(a) | 983,752 | ||||
1,207,000 | Constellium SE, 3.75%, 4/15/29(a) | 1,176,825 | ||||
1,073,000 | Coty, Inc., 5.00%, 4/15/26(a) | 1,096,756 | ||||
2,455,000 | CQP Holdco LP / BIP-V Chinook Holdco LLC, 5.50%, 6/15/31(a) | 2,609,256 | ||||
689,000 | CSC Holdings LLC, 4.63%, 12/1/30(a) | 653,228 | ||||
643,000 | CSC Holdings LLC, 5.75%, 1/15/30(a) | 654,265 | ||||
1,500,000 | CSC Holdings LLC, 7.50%, 4/1/28(a) | 1,621,998 | ||||
1,248,000 | DCP Midstream Operating LP, 5.63%, 7/15/27 | 1,421,087 | ||||
2,038,000 | Dealer Tire LLC / DT Issuer LLC, 8.00%, 2/1/28(a) | 2,135,138 | ||||
28
SCHEDULE OF PORTFOLIO INVESTMENTS |
RBC BlueBay High Yield Bond Fund (cont.)
September 30, 2021
| Principal Amount | Value | |||||
| ||||||
$ 725,000 | DIRECTV Holdings LLC / DIRECTV Financing Co., Inc., 5.88%, 8/15/27(a) | $ | 756,992 | |||
2,195,000 | DISH DBS Corp., 5.13%, 6/1/29 | 2,153,311 | ||||
645,000 | DISH DBS Corp., 7.38%, 7/1/28 | 686,997 | ||||
790,000 | Encompass Health Corp., 4.50%, 2/1/28 | 819,588 | ||||
1,159,000 | Ferrellgas LP / Ferrellgas Finance Corp., 5.38%, 4/1/26(a) | 1,133,070 | ||||
1,130,000 | Ferrellgas LP / Ferrellgas Finance Corp., 5.88%, 4/1/29(a) | 1,102,799 | ||||
1,144,000 | First Student Bidco, Inc. / First Transit Parent, Inc., 4.00%, 7/31/29(a) | 1,128,599 | ||||
1,975,000 | Ford Motor Co., 9.00%, 4/22/25 | 2,375,238 | ||||
1,619,000 | Ford Motor Credit Co. LLC, 4.13%, 8/17/27 | 1,718,614 | ||||
957,000 | Ford Motor Credit Co. LLC, 5.13%, 6/16/25 | 1,039,731 | ||||
2,350,000 | Forestar Group, Inc., 3.85%, 5/15/26(a) | 2,351,848 | ||||
762,000 | Fortress Transportation and Infrastructure Investors LLC, 5.50%, 5/1/28(a) | 768,250 | ||||
1,187,000 | Foundation Building Materials, Inc., 6.00%, 3/1/29(a) | 1,165,263 | ||||
1,218,750 | Freedom Mortgage Corp., 6.63%, 1/15/27(a) | 1,189,616 | ||||
713,000 | Gap, Inc. (The), 3.63%, 10/1/29(a) | 714,144 | ||||
423,000 | Gap, Inc. (The), 3.88%, 10/1/31(a) | 423,710 | ||||
1,991,000 | G-III Apparel Group Ltd., 7.88%, 8/15/25(a) | 2,158,384 | ||||
447,000 | Global Partners LP / GLP Finance Corp., 6.88%, 1/15/29 | 463,807 | ||||
1,048,000 | Global Partners LP / GLP Finance Corp., 7.00%, 8/1/27 | 1,090,291 | ||||
1,971,000 | GPD Cos., Inc., 10.13%, 4/1/26(a) | 2,135,748 | ||||
1,710,000 | GrafTech Finance, Inc., 4.63%, 12/15/28(a) | 1,754,189 | ||||
744,000 | Gray Television, Inc., 4.75%, 10/15/30(a) | 730,295 | ||||
1,262,000 | Gray Television, Inc., 7.00%, 5/15/27(a) | 1,351,074 | ||||
1,034,000 | Great Lakes Dredge & Dock Corp., 5.25%, 6/1/29(a) | 1,070,919 | ||||
1,028,000 | Griffon Corp., 5.75%, 3/1/28 | 1,085,704 | ||||
1,554,000 | Grinding Media, Inc. / Moly-Cop AltaSteel Ltd., 7.38%, 12/15/23(a) | 1,584,214 | ||||
600,000 | International Game Technology Plc, 4.13%, 4/15/26(a) | 621,457 | ||||
826,000 | International Game Technology Plc, 5.25%, 1/15/29(a) | 881,772 | ||||
1,086,000 | IRB Holding Corp., 7.00%, 6/15/25(a) | 1,152,530 | ||||
1,967,000 | ITT Holdings LLC, 6.50%, 8/1/29(a) | 1,985,283 | ||||
1,135,000 | Jefferies Finance LLC / JFIN Co-Issuer Corp., 5.00%, 8/15/28(a) | 1,151,589 | ||||
1,233,000 | Kraton Polymers LLC / Kraton Polymers Capital Corp., 4.25%, 12/15/25(a) | 1,287,423 | ||||
1,438,000 | LBM Acquisition LLC, 6.25%, 1/15/29(a) | 1,437,830 | ||||
2,046,000 | LCPR Senior Secured Financing DAC, 6.75%, 10/15/27(a) | 2,167,839 | ||||
200,000 | Legacy LifePoint Health LLC, 4.38%, 2/15/27(a) | 198,957 | ||||
688,000 | Level 3 Financing, Inc., 3.75%, 7/15/29(a) | 665,134 | ||||
1,377,000 | Life Time, Inc., 5.75%, 1/15/26(a) | 1,432,740 | ||||
480,000 | Lithia Motors, Inc., 3.88%, 6/1/29(a) | 499,098 | ||||
1,053,000 | Lithia Motors, Inc., 4.38%, 1/15/31(a) | 1,127,135 | ||||
1,800,000 | Lumen Technologies, Inc., Series W, 6.75%, 12/1/23 | 1,975,362 | ||||
1,721,000 | Matthews International Corp., 5.25%, 12/1/25(a) | 1,772,873 | ||||
2,314,000 | Metis Merger Sub LLC, 6.50%, 5/15/29(a) | 2,250,898 | ||||
29
SCHEDULE OF PORTFOLIO INVESTMENTS |
RBC BlueBay High Yield Bond Fund (cont.)
September 30, 2021
Principal Amount | Value | |||||
| ||||||
$ 946,000 | MGM Growth Properties Operating Partnership LP / MGP Finance Co-Issuer, Inc., 4.63%, 6/15/25(a) | $ | 1,021,543 | |||
1,132,000 | Michaels Cos., Inc. (The), 5.25%, 5/1/28(a) | 1,163,897 | ||||
1,017,000 | Michaels Cos., Inc. (The), 7.88%, 5/1/29(a) | 1,054,505 | ||||
1,492,000 | Mozart Debt Merger Sub, Inc., 3.88%, 4/1/29(a) | 1,492,000 | ||||
538,000 | Mozart Debt Merger Sub, Inc., 5.25%, 10/1/29(a) | 538,000 | ||||
379,000 | Nationstar Mortgage Holdings, Inc., 5.50%, 8/15/28(a) | 390,303 | ||||
351,000 | Nationstar Mortgage Holdings, Inc., 6.00%, 1/15/27(a) | 368,096 | ||||
1,112,000 | Nexstar Media, Inc., 5.63%, 7/15/27(a) | 1,177,917 | ||||
485,000 | NuStar Logistics LP, 5.75%, 10/1/25 | 522,802 | ||||
632,000 | NuStar Logistics LP, 6.38%, 10/1/30 | 701,408 | ||||
1,117,000 | Organon & Co. / Organon Foreign Debt Co-Issuer BV, 5.13%, 4/30/31(a) | 1,172,989 | ||||
1,127,000 | Pike Corp., 5.50%, 9/1/28(a) | 1,149,195 | ||||
1,015,000 | Post Holdings, Inc., 5.75%, 3/1/27(a) | 1,054,311 | ||||
726,000 | Radiate Holdco LLC / Radiate Finance, Inc., 6.50%, 9/15/28(a) | 739,919 | ||||
951,000 | Rayonier AM Products, Inc., 5.50%, 6/1/24(a) | 951,716 | ||||
1,102,000 | Rayonier AM Products, Inc., 7.63%, 1/15/26(a) | 1,163,567 | ||||
578,000 | Realogy Group LLC / Realogy Co-Issuer Corp., 7.63%, 6/15/25(a) | 617,579 | ||||
1,292,000 | Realogy Group LLC / Realogy Co-Issuer Corp., 9.38%, 4/1/27(a) | 1,424,105 | ||||
2,166,000 | RegionalCare Hospital Partners Holdings, Inc. / LifePoint Health, Inc., 9.75%, 12/1/26(a) | 2,290,497 | ||||
722,000 | Resolute Forest Products, Inc., 4.88%, 3/1/26(a) | 736,443 | ||||
3,000,000 | Roller Bearing Co. of America, Inc., 4.38%, 10/15/29(a) | 3,074,904 | ||||
1,176,000 | SBA Communications Corp., 3.13%, 2/1/29(a) | 1,136,886 | ||||
691,000 | Scientific Games International, Inc., 5.00%, 10/15/25(a) | 710,504 | ||||
678,000 | Scientific Games International, Inc., 7.00%, 5/15/28(a) | 732,104 | ||||
837,000 | Scientific Games International, Inc., 8.25%, 3/15/26(a) | 891,779 | ||||
1,332,000 | Sinclair Television Group, Inc., 4.13%, 12/1/30(a) | 1,305,852 | ||||
1,147,000 | Sinclair Television Group, Inc., 5.88%, 3/15/26(a) | 1,175,672 | ||||
1,610,000 | Sirius XM Radio, Inc., 4.00%, 7/15/28(a) | 1,638,713 | ||||
1,377,000 | Southwestern Energy Co., 5.38%, 3/15/30 | 1,486,983 | ||||
3,071,000 | Specialty Building Products Holdings LLC / SBP Finance Corp., 6.38%, 9/30/26(a) | 3,232,677 | ||||
300,000 | Sprint Capital Corp., 8.75%, 3/15/32 | 448,321 | ||||
2,000,000 | Sprint Communications, Inc., 11.50%, 11/15/21 | 2,024,338 | ||||
1,503,000 | SRM Escrow Issuer LLC, 6.00%, 11/1/28(a) | 1,592,745 | ||||
1,300,000 | Suburban Propane Partners LP/Suburban Energy Finance Corp., 5.00%, 6/1/31(a) | 1,348,750 | ||||
1,817,000 | Summer BC Bidco B LLC, 5.50%, 10/31/26(a) | 1,863,313 | ||||
1,170,000 | Sylvamo Corp., 7.00%, 9/1/29(a) | 1,196,449 | ||||
625,000 | Targa Resources Partners LP / Targa Resources Partners Finance Corp., 4.88%, 2/1/31 | 674,379 | ||||
1,581,000 | TEGNA, Inc., 5.00%, 9/15/29 | 1,628,739 | ||||
2,039,000 | Tenet Healthcare Corp., 6.13%, 10/1/28(a) | 2,139,287 | ||||
1,200,000 | Tenet Healthcare Corp., 6.25%, 2/1/27(a) | 1,247,402 | ||||
2,144,000 | Terrier Media Buyer, Inc., 8.88%, 12/15/27(a) | 2,270,102 | ||||
1,103,000 | TransDigm, Inc., 5.50%, 11/15/27 | 1,139,667 | ||||
30
SCHEDULE OF PORTFOLIO INVESTMENTS |
RBC BlueBay High Yield Bond Fund (cont.)
September 30, 2021
Principal Amount | Value | |||||
| ||||||
$ 542,000 | TransDigm, Inc., 6.25%, 3/15/26(a) | $ | 567,051 | |||
570,000 | Triumph Group, Inc., 6.25%, 9/15/24(a) | 570,429 | ||||
412,000 | Unifrax Escrow Issuer Corp., 5.25%, 9/30/28(a) | 416,727 | ||||
353,000 | Unifrax Escrow Issuer Corp., 7.50%, 9/30/29(a) | 361,930 | ||||
1,120,000 | United Rentals North America, Inc., 3.75%, 1/15/32 | 1,132,842 | ||||
1,371,000 | Univision Communications, Inc., 6.63%, 6/1/27(a) | 1,486,606 | ||||
773,000 | Venture Global Calcasieu Pass LLC, 3.88%, 8/15/29(a) | 796,672 | ||||
773,000 | Venture Global Calcasieu Pass LLC, 4.13%, 8/15/31(a) | 807,827 | ||||
1,262,000 | Victoria’s Secret & Co., 4.63%, 7/15/29(a) | 1,282,546 | ||||
521,000 | Voyager Aviation Holdings LLC, 8.50%, 5/9/26(a) | 474,497 | ||||
1,011,000 | White Cap Buyer LLC, 6.88%, 10/15/28(a) | 1,069,686 | ||||
1,000,000 | Yum! Brands, Inc., 7.75%, 4/1/25(a) | 1,068,803 | ||||
|
| |||||
| 186,321,359 | ||||||
|
| |||||
Total Corporate Bonds | 223,500,848 | |||||
|
| |||||
(Cost $219,382,597) | ||||||
Shares | ||||||
Common Stocks — 0.06% | ||||||
Australia — 0.01% | ||||||
70,137 | Quintis Ltd.*,(b),(c) | 11,222 | ||||
|
| |||||
United Kingdom — 0.00% | ||||||
12,023 | AVTCAP WARR* | 6,925 | ||||
|
| |||||
United States — 0.05% | ||||||
12,785 | Vertellus Escrow U.S.*,(b),(c) | 997 | ||||
1,445 | Voyager Aviation Holdings LLC* | 132,940 | ||||
241 | Voyager Aviation Holdings LLC*,(b),(c) | 0 | ||||
12,785 | W R Grace & Co.*,(b),(c) | 985 | ||||
|
| |||||
| 134,922 | ||||||
|
| |||||
Total Common Stocks | 153,069 | |||||
|
| |||||
(Cost $2) | ||||||
Rights/Warrants — 0.00% | ||||||
Mexico — 0.00% | ||||||
3,026 | Urbi Desarrollos Urbanos SAB de CV Warrants, Expire 12/31/49* | 1 | ||||
|
| |||||
Total Rights/Warrants | 1 | |||||
|
| |||||
(Cost $0) | ||||||
31
SCHEDULE OF PORTFOLIO INVESTMENTS |
RBC BlueBay High Yield Bond Fund (cont.)
September 30, 2021
| Shares | Value | |||||
| ||||||
Investment Company — 7.01% | ||||||
17,427,198 | U.S. Government Money Market Fund, RBC Institutional Class 1 (h) | $ | 17,427,198 | |||
|
| |||||
Total Investment Company | 17,427,198 | |||||
|
| |||||
(Cost $17,427,198) | ||||||
Total Investments | $ | 241,081,116 | ||||
(Cost $236,809,797)(i) — 97.06% | ||||||
Other assets in excess of liabilities — 2.94% | 7,289,929 | |||||
|
| |||||
NET ASSETS — 100.00% | $ | 248,371,045 | ||||
|
| |||||
| * | Non-income producing security. |
| (a) | Security exempt from registration under Rule 144A or Section 4(2) of the Securities Act of 1933, as amended. These securities may be resold in transactions exempt from registration, normally to qualified institutional buyers. |
| (b) | The Pricing Committee has fair valued this security under procedures established by the Fund’s Board of Trustees. |
| (c) | Security is valued using significant unobservable inputs and is classified as Level 3 in the fair value hierarchy. |
| (d) | Principal amount denoted in Euros. |
| (e) | Security is a fix-to-float security, which carries a fixed coupon until a certain date, upon which it switches to a floating rate. Reference rate and spread are provided if the rate is currently floating. |
| (f) | Perpetual security with no stated maturity date. |
| (g) | Principal amount denoted in British Pounds. |
| (h) | Affiliated investment. |
| (i) | See Notes to Schedules of Portfolio Investments for the tax cost of securities and the breakdown of unrealized appreciation (depreciation). |
32
SCHEDULE OF PORTFOLIO INVESTMENTS |
RBC BlueBay High Yield Bond Fund (cont.)
September 30, 2021
Foreign currency exchange contracts as of September 30, 2021:
Currency Purchased | Currency Sold | Counterparty | Settlement Date | Value/Unrealized Appreciation (Depreciation) | ||||||||||||||||||||||||||||||
USD | 721,020 | EUR | 605,212 | Citibank N.A. | 10/27/21 | $ | 19,619 | |||||||||||||||||||||||||||
USD | 1,451,248 | EUR | 1,218,171 | Citibank N.A. | 10/27/21 | 39,465 | ||||||||||||||||||||||||||||
USD | 2,919,435 | EUR | 2,450,617 | Citibank N.A. | 10/27/21 | 79,326 | ||||||||||||||||||||||||||||
USD | 87,745 | EUR | 75,000 | Citibank N.A. | 10/27/21 | 825 | ||||||||||||||||||||||||||||
USD | 204,631 | EUR | 175,000 | Citibank N.A. | 10/27/21 | 1,817 | ||||||||||||||||||||||||||||
USD | 1,847,367 | GBP | 1,325,000 | Citibank N.A. | 10/27/21 | 62,000 | ||||||||||||||||||||||||||||
|
| |||||||||||||||||||||||||||||||||
| $ | 203,052 | |||||||||||||||||||||||||||||||||
EUR | 1,625,000 | USD | 1,903,242 | Citibank N.A. | 10/27/21 | $ | (19,971 | ) | ||||||||||||||||||||||||||
EUR | 900,000 | USD | 1,057,123 | Citibank N.A. | 10/27/21 | (14,081 | ) | |||||||||||||||||||||||||||
|
| |||||||||||||||||||||||||||||||||
| $ | (34,052 | ) | ||||||||||||||||||||||||||||||||
|
| |||||||||||||||||||||||||||||||||
Total | $ | 169,000 | ||||||||||||||||||||||||||||||||
|
| |||||||||||||||||||||||||||||||||
Financial futures contracts as of September 30, 2021:
Short Position | Number of Contracts | Expiration Date | Value/Unrealized Appreciation | Notional Value | Clearinghouse | |||||||||||||||||||||||
10 Year Euro-Bund | 5 | December 2021 | $ | 13,476 | EUR | $ | 849,100 | Citigroup Global Markets, Inc. | ||||||||||||||||||||
10 Year U.S. Ultra Treasury Bond | 69 | December 2021 | 199,628 | USD | 10,022,250 | Citigroup Global Markets, Inc. | ||||||||||||||||||||||
5 Year Euro-Bobl | 6 | December 2021 | 5,206 | EUR | 809,580 | Citigroup Global Markets, Inc. | ||||||||||||||||||||||
|
| |||||||||||||||||||||||||||
Total | $ | 218,310 | ||||||||||||||||||||||||||
|
| |||||||||||||||||||||||||||
Abbreviations used are defined below:
Bobl - German Bundesobligationen
EMTN - Euro Medium Term Note
EUR - Euro
GBP - United Kingdom Pound Sterling
MTN - Medium Term Note
USD - United States Dollar
33
SCHEDULE OF PORTFOLIO INVESTMENTS |
RBC BlueBay High Yield Bond Fund (cont.)
September 30, 2021
Portfolio Diversification (Unaudited)
Industries | Percentage of Net Assets | |||||||
Consumer, Cyclical | 23.89 | % | ||||||
Communications | 16.39 | % | ||||||
Consumer, Non-cyclical | 15.51 | % | ||||||
Industrial | 12.54 | % | ||||||
Financial | 8.25 | % | ||||||
Basic Materials | 6.47 | % | ||||||
Energy | 5.22 | % | ||||||
Utilities | 1.13 | % | ||||||
Technology | 0.65 | % | ||||||
Other* | 9.95 | % | ||||||
|
| |||||||
| 100.00 | % | |||||||
|
| |||||||
* Includes cash, Investment Company, interest and dividend receivable, pending trades and Fund share transactions, warrants, financial futures contracts, foreign currency exchange contracts and accrued expenses payable.
See Notes to the Financial Statements.
34
|
Statements of Assets and Liabilities
September 30, 2021
RBC BlueBay | RBC BlueBay High Yield Bond Fund | |||||||||||
Assets: | ||||||||||||
Investments in securities, at value: | ||||||||||||
Unaffiliated investments (cost $28,821,810 and $219,382,599, respectively) | $ | 27,995,743 | $ | 223,653,918 | ||||||||
Affiliated investments (cost $654,507 and $17,427,198, respectively) | 654,507 | 17,427,198 | ||||||||||
Cash | 50,001 | 50,002 | ||||||||||
Cash at broker for financial futures contracts | 178,862 | 24,281 | ||||||||||
Segregated cash for swap contracts | 267,769 | — | ||||||||||
Cash at broker for forward foreign currency exchange contracts | 40,000 | 60,000 | ||||||||||
Foreign currency, at value (cost $59,433 and $73,181, respectively) | 59,035 | 73,170 | ||||||||||
Interest and dividend receivable | 338,790 | 3,404,785 | ||||||||||
Receivable from advisor | 7,663 | — | ||||||||||
Receivable for capital shares issued | — | 13,489,597 | ||||||||||
Receivable for investments sold | 573,886 | 1,021,250 | ||||||||||
Due from broker | 14,972 | — | ||||||||||
Credit default swaps at value (premiums paid $139,574 and $0, respectively) | 165,312 | — | ||||||||||
Unrealized appreciation on futures contracts | 47,783 | 218,310 | ||||||||||
Unrealized appreciation on interest rate swaps contracts | 2,254 | — | ||||||||||
Unrealized appreciation on forward foreign currency exchange contracts | 76,960 | 203,052 | ||||||||||
Prepaid expenses and other assets | 7,793 | 11,311 | ||||||||||
|
|
|
| |||||||||
Total Assets | 30,481,330 | 259,636,874 | ||||||||||
|
|
|
| |||||||||
Liabilities: | ||||||||||||
Payable for capital shares redeemed | — | 1,291,748 | ||||||||||
Payable for investments purchased | 1,490,705 | 9,733,402 | ||||||||||
Credit default swaps at value (premiums received $171,326 and $0, respectively) | 168,984 | — | ||||||||||
Unrealized depreciation on forward foreign currency exchange contracts | 36,188 | 34,052 | ||||||||||
Unrealized depreciation on interest rate swaps contracts | 12,372 | — | ||||||||||
Accrued expenses and other payables: | ||||||||||||
Investment advisory fees | — | 65,753 | ||||||||||
Accounting fees | 7,310 | 8,948 | ||||||||||
Audit fees | 36,672 | 39,409 | ||||||||||
Trustees’ fees | 51 | 94 | ||||||||||
Distribution fees | — | 1,217 | ||||||||||
Custodian fees | 4,205 | 5,005 | ||||||||||
Shareholder reports | 6,127 | 15,381 | ||||||||||
Transfer agent fees | 9,029 | 52,763 | ||||||||||
Other | 14,450 | 18,057 | ||||||||||
|
|
|
| |||||||||
Total Liabilities | 1,786,093 | 11,265,829 | ||||||||||
|
|
|
| |||||||||
Net Assets | $ | 28,695,237 | $ | 248,371,045 | ||||||||
|
|
|
| |||||||||
35
FINANCIAL STATEMENTS
|
Statements of Assets and Liabilities (cont.)
September 30, 2021
RBC BlueBay | RBC BlueBay High Yield Bond Fund | |||||||||
Net Assets Consists of: | ||||||||||
Capital | $ | 34,444,573 | $ | 239,079,286 | ||||||
Accumulated earnings | (5,749,336 | ) | 9,291,759 | |||||||
|
|
|
| |||||||
Net Assets | $ | 28,695,237 | $ | 248,371,045 | ||||||
|
|
|
| |||||||
Net Assets | ||||||||||
Class A | $ | 14,958 | $ | 3,726,699 | ||||||
Class I | 28,667,274 | 244,644,346 | ||||||||
Class R6 | 13,005 | N/A | ||||||||
|
|
|
| |||||||
Total | $ | 28,695,237 | $ | 248,371,045 | ||||||
|
|
|
| |||||||
Shares Outstanding (Unlimited number of shares authorized, no par value): | ||||||||||
Class A | 1,531 | 342,128 | ||||||||
Class I | 2,897,754 | 22,288,954 | ||||||||
Class R6 | 1,309 | N/A | ||||||||
|
|
|
| |||||||
Total | 2,900,594 | 22,631,082 | ||||||||
|
|
|
| |||||||
Net Asset Values and Redemption Prices Per Share: | ||||||||||
Class A | $ | 9.77 | $ | 10.89 | ||||||
|
|
|
| |||||||
Class I | $ | 9.89 | $ | 10.98 | ||||||
|
|
|
| |||||||
Class R6 | $ | 9.94 | $ | N/A | ||||||
|
|
|
| |||||||
Maximum Offering Price Per Share: | ||||||||||
Class A | $ | 10.20 | $ | 11.37 | ||||||
|
|
|
| |||||||
Maximum Sales Charge - Class A | 4.25 | % | 4.25 | % | ||||||
|
|
|
| |||||||
See Notes to the Financial Statements.
36
FINANCIAL STATEMENTS |
For the Year Ended September 30, 2021
RBC BlueBay | RBC BlueBay High Yield Bond Fund | |||||||||||
Investment Income: | ||||||||||||
Interest income | $ | 1,528,071 | $ | 9,392,766 | ||||||||
Dividend income - unaffiliated | — | 13,487 | ||||||||||
Dividend income - affiliated | 122 | 2,343 | ||||||||||
Foreign tax withholding | (18 | ) | — | |||||||||
|
|
|
| |||||||||
Total Investment Income | 1,528,175 | 9,408,596 | ||||||||||
Expenses: | ||||||||||||
Investment advisory fees | 178,986 | 1,007,445 | ||||||||||
Distribution fees–Class A | 23 | 6,383 | ||||||||||
Accounting fees | 51,192 | 74,797 | ||||||||||
Audit fees | 46,523 | 50,155 | ||||||||||
Custodian fees | 84,326 | 85,635 | ||||||||||
Insurance fees | 3,264 | 3,264 | ||||||||||
Legal fees | 580 | 6,019 | ||||||||||
Registrations and filing fees | 63,752 | 57,224 | ||||||||||
Shareholder reports | 30,312 | 60,949 | ||||||||||
Transfer agent fees–Class A | 3,807 | 4,892 | ||||||||||
Transfer agent fees–Class I | 3,937 | 228,795 | ||||||||||
Transfer agent fees–Class R6 | 3,535 | — | ||||||||||
Trustees’ fees and expenses | 954 | 6,014 | ||||||||||
Tax expense | 4,220 | 4,220 | ||||||||||
Other fees | 5,001 | 5,040 | ||||||||||
|
|
|
| |||||||||
Total expenses before fee waiver/reimbursement | 480,412 | 1,600,832 | ||||||||||
Expenses waived/reimbursed by: | ||||||||||||
Advisor | (262,858 | ) | (550,369 | ) | ||||||||
|
|
|
| |||||||||
Net expenses | 217,554 | 1,050,463 | ||||||||||
|
|
|
| |||||||||
Net Investment Income | 1,310,621 | 8,358,133 | ||||||||||
|
|
|
| |||||||||
Realized/Unrealized Gains/(Losses): | ||||||||||||
Net realized gains/(losses) on: | ||||||||||||
Investment transactions | 337,674 | 4,241,538 | ||||||||||
Foreign currency transactions | (5,171 | ) | (29,180 | ) | ||||||||
Foreign currency exchange contracts | (10,074 | ) | (16,715 | ) | ||||||||
Written options | 3,436 | — | ||||||||||
Futures contracts | 25,362 | (309,121 | ) | |||||||||
Swap agreements | (272,755 | ) | 384,327 | |||||||||
|
|
|
| |||||||||
Net realized gains | 78,472 | 4,270,849 | ||||||||||
Net change in unrealized appreciation/(depreciation) on: | ||||||||||||
Investments | (315,369 | ) | 2,432,803 | |||||||||
Foreign currency | (2,056 | ) | 666 | |||||||||
Foreign currency exchange contracts | 35,455 | 129,682 | ||||||||||
Written Options | (767 | ) | — | |||||||||
37
FINANCIAL STATEMENTS |
Statements of Operations (cont.)
For the Year Ended September 30, 2021
RBC BlueBay | RBC BlueBay High Yield Bond Fund | |||||||||
Futures contracts | $ | 48,790 | $ | 218,556 | ||||||
Swap agreements | 56,190 | — | ||||||||
|
|
|
| |||||||
Net unrealized gains/(losses) | (177,757 | ) | 2,781,707 | |||||||
|
|
|
| |||||||
Change in net assets resulting from operations | $ | 1,211,336 | $ | 15,410,689 | ||||||
|
|
|
| |||||||
See Notes to the Financial Statements.
38
FINANCIAL STATEMENTS |
Statements of Changes in Net Assets
| RBC BlueBay Emerging Market Debt Fund | ||||||||||||||||
For the | For the | |||||||||||||||
From Investment Activities | ||||||||||||||||
Operations: | ||||||||||||||||
Net investment income | $ | 1,310,621 | $ | 1,018,465 | ||||||||||||
Net realized gains from investments, foreign currency, written options, futures contracts and swap contracts transactions | 78,472 | 81,080 | ||||||||||||||
Net change in unrealized depreciation on investments, foreign currency, written options, futures contracts and swap contracts | (177,757 | ) | (793,554 | ) | ||||||||||||
|
|
|
| |||||||||||||
Change in net assets resulting from operations | 1,211,336 | 305,991 | ||||||||||||||
|
|
|
| |||||||||||||
Distributions to Shareholders: | ||||||||||||||||
Class A | (413 | ) | (957 | ) | ||||||||||||
Class I | (1,356,829 | ) | (1,004,880 | ) | ||||||||||||
Class R6 | (676 | ) | (577 | ) | ||||||||||||
|
|
|
| |||||||||||||
Change in net assets resulting from shareholder distributions | (1,357,918 | ) | (1,006,414 | ) | ||||||||||||
|
|
|
| |||||||||||||
Capital Transactions: | ||||||||||||||||
Proceeds from shares issued | 6,512,694 | 77,902 | ||||||||||||||
Distributions reinvested | 1,345,090 | 994,853 | ||||||||||||||
Cost of shares redeemed | (390,913 | ) | (560,168 | ) | ||||||||||||
|
|
|
| |||||||||||||
Change in net assets resulting from capital transactions | 7,466,871 | 512,587 | ||||||||||||||
|
|
|
| |||||||||||||
Net increase/(decrease) in net assets | 7,320,289 | (187,836 | ) | |||||||||||||
Net Assets: | ||||||||||||||||
Beginning of year | 21,374,948 | 21,562,784 | ||||||||||||||
|
|
|
| |||||||||||||
End of year | $ | 28,695,237 | $ | 21,374,948 | ||||||||||||
|
|
|
| |||||||||||||
Share Transactions: | ||||||||||||||||
Issued | 645,173 | 7,672 | ||||||||||||||
Reinvested | 134,963 | 99,755 | ||||||||||||||
Redeemed | (38,710 | ) | (55,622 | ) | ||||||||||||
|
|
|
| |||||||||||||
Change in shares resulting from capital transactions | 741,426 | 51,805 | ||||||||||||||
|
|
|
| |||||||||||||
See Notes to the Financial Statements.
39
FINANCIAL STATEMENTS |
Statements of Changes in Net Assets
| RBC BlueBay High Yield Bond Fund | ||||||||||||||||
| For the Year Ended September 30, 2021 | For the Year Ended September 30, 2020 | |||||||||||||||
From Investment Activities | ||||||||||||||||
Operations: | ||||||||||||||||
Net investment income | $ | 8,358,133 | $ | 3,877,926 | ||||||||||||
Net realized gains from investments, foreign currency, futures contracts and swap contracts transactions | 4,270,849 | 2,167,460 | ||||||||||||||
Net change in unrealized appreciation on investments, foreign currency, futures contracts and swap contracts | 2,781,707 | 167,537 | ||||||||||||||
|
|
|
| |||||||||||||
Change in net assets resulting from operations | 15,410,689 | 6,212,923 | ||||||||||||||
|
|
|
| |||||||||||||
Distributions to Shareholders: | ||||||||||||||||
Class A | (147,499 | ) | (38,616 | ) | ||||||||||||
Class I | (10,608,216 | ) | (3,262,142 | ) | ||||||||||||
|
|
|
| |||||||||||||
Change in net assets resulting from shareholder distributions | (10,755,715 | ) | (3,300,758 | ) | ||||||||||||
|
|
|
| |||||||||||||
Capital Transactions: | ||||||||||||||||
Proceeds from shares issued | 165,844,099 | 98,962,182 | ||||||||||||||
Distributions reinvested | 9,041,391 | 3,069,931 | ||||||||||||||
Cost of shares redeemed | (61,601,053 | ) | (24,369,669 | ) | ||||||||||||
|
|
|
| |||||||||||||
Change in net assets resulting from capital transactions | 113,284,437 | 77,662,444 | ||||||||||||||
|
|
|
| |||||||||||||
Net increase in net assets | 117,939,411 | 80,574,609 | ||||||||||||||
Net Assets: | ||||||||||||||||
Beginning of year | 130,431,634 | 49,857,025 | ||||||||||||||
|
|
|
| |||||||||||||
End of year | $ | 248,371,045 | $ | 130,431,634 | ||||||||||||
|
|
|
| |||||||||||||
Share Transactions: | ||||||||||||||||
Issued | 15,177,850 | 9,591,788 | ||||||||||||||
Reinvested | 832,476 | 294,317 | ||||||||||||||
Redeemed | (5,641,559 | ) | (2,361,768 | ) | ||||||||||||
|
|
|
| |||||||||||||
Change in shares resulting from capital transactions | 10,368,767 | 7,524,337 | ||||||||||||||
|
|
|
| |||||||||||||
See Notes to the Financial Statements.
40
|
RBC BlueBay Emerging Market Debt Fund
(Selected data for a share outstanding throughout the periods indicated)
| Investment Activities | Distributions | |||||||||||||||||||||||||||||||||||
| Net Asset Value, Beginning of Year | Net Investment Income(a) | Net Realized and Unrealized Gains (Losses) on Investments | Total from Investment Activities | Net Investment Income | Total Distributions | Net Asset Value, End of Year | ||||||||||||||||||||||||||||||
Class A | ||||||||||||||||||||||||||||||||||||
Year Ended 9/30/21 | $ | 9.78 | 0.45 | 0.04(b) | 0.49 | (0.50 | ) | (0.50 | ) | $ | 9.77 | |||||||||||||||||||||||||
Year Ended 9/30/20 | 10.14 | 0.48 | (0.38 | ) | 0.10 | (0.46 | ) | (0.46 | ) | 9.78 | ||||||||||||||||||||||||||
Year Ended 9/30/19 | 9.63 | 0.52 | 0.51 | 1.03 | (0.52 | ) | (0.52 | ) | 10.14 | |||||||||||||||||||||||||||
Year Ended 9/30/18 | 10.36 | 0.50 | (0.85 | ) | (0.35 | ) | (0.38 | ) | (0.38 | ) | 9.63 | |||||||||||||||||||||||||
Year Ended 9/30/17 | 9.78 | 0.50 | 0.08 | 0.58 | — | — | 10.36 | |||||||||||||||||||||||||||||
Class I | ||||||||||||||||||||||||||||||||||||
Year Ended 9/30/21 | $ | 9.90 | 0.48 | 0.03(b) | 0.51 | (0.52 | ) | (0.52 | ) | $ | 9.89 | |||||||||||||||||||||||||
Year Ended 9/30/20 | 10.23 | 0.47 | (0.33 | ) | 0.14 | (0.47 | ) | (0.47 | ) | 9.90 | ||||||||||||||||||||||||||
Year Ended 9/30/19 | 9.71 | 0.55 | 0.52 | 1.07 | (0.55 | ) | (0.55 | ) | 10.23 | |||||||||||||||||||||||||||
Year Ended 9/30/18 | 10.41 | 0.51 | (0.84 | ) | (0.33 | ) | (0.37 | ) | (0.37 | ) | 9.71 | |||||||||||||||||||||||||
Year Ended 9/30/17 | 9.81 | 0.54 | 0.06 | 0.60 | — | — | 10.41 | |||||||||||||||||||||||||||||
Class R6 | ||||||||||||||||||||||||||||||||||||
Year Ended 9/30/21 | $ | 9.94 | 0.49 | 0.04(b) | 0.53 | (0.53 | ) | (0.53 | ) | $ | 9.94 | |||||||||||||||||||||||||
Year Ended 9/30/20 | 10.27 | 0.48 | (0.33 | ) | 0.15 | (0.48 | ) | (0.48 | ) | 9.94 | ||||||||||||||||||||||||||
Year Ended 9/30/19 | 9.74 | 0.56 | 0.52 | 1.08 | (0.55 | ) | (0.55 | ) | 10.27 | |||||||||||||||||||||||||||
Year Ended 9/30/18 | 10.42 | 0.53 | (0.86 | ) | (0.33 | ) | (0.35 | ) | (0.35 | ) | 9.74 | |||||||||||||||||||||||||
Period Ended 9/30/17(c) | 9.25 | 0.45 | 0.72 | 1.17 | — | — | 10.42 | |||||||||||||||||||||||||||||
| (a) | Per share net investment income (loss) has been calculated using the average daily shares method. |
| (b) | Calculation of the net gain per share (both realized and unrealized) does not correlate to the aggregate realized and unrealized losses presented in the Statement of Operations due to the timing of the sales and repurchases of Fund shares in relation to fluctuating market values of the investments of the Fund. |
| (c) | For the period from December 27, 2016 (commencement of operations) to September 30, 2017. |
41
FINANCIAL HIGHLIGHTS |
RBC BlueBay Emerging Market Debt Fund
(Selected data for a share outstanding throughout the periods indicated)
| Ratios/Supplemental Data | ||||||||||||||||||||||||||||
| Total Return(a)(b) | Net Assets, End of Year (000’s) | Ratio of Net Expenses to Average Net Assets | Ratio of Net Investment Income (Loss) to Average Net Assets | Ratio of Expenses to Average Net Assets* | Portfolio Turnover Rate** | |||||||||||||||||||||||
Class A | ||||||||||||||||||||||||||||
Year Ended 9/30/21 | 5.06 | % | $ | 15 | 1.04 | % | 4.52 | % | 43.25 | % | 181 | % | ||||||||||||||||
Year Ended 9/30/20 | 1.06 | % | 7 | 1.11 | %(c) | 4.95 | % | 28.23 | % | 249 | % | |||||||||||||||||
Year Ended 9/30/19 | 11.17 | % | 21 | 1.12 | % | 5.38 | % | 20.37 | % | 236 | % | |||||||||||||||||
Year Ended 9/30/18 | (3.38 | )% | 19 | 1.13 | % | 5.05 | % | 11.41 | % | 364 | % | |||||||||||||||||
Year Ended 9/30/17 | 5.94 | % | 63 | 1.15 | % | 5.17 | % | 7.94 | % | 251 | % | |||||||||||||||||
Class I | ||||||||||||||||||||||||||||
Year Ended 9/30/21 | 5.28 | % | $ | 28,667 | 0.79 | % | 4.76 | % | 1.72 | % | 181 | % | ||||||||||||||||
Year Ended 9/30/20 | 1.44 | % | 21,356 | 0.85 | %(c) | 4.87 | % | 2.14 | % | 249 | % | |||||||||||||||||
Year Ended 9/30/19 | 11.48 | % | 21,529 | 0.87 | % | 5.62 | % | 2.13 | % | 236 | % | |||||||||||||||||
Year Ended 9/30/18 | (3.26 | )% | 23,952 | 0.88 | % | 5.21 | % | 2.18 | % | 364 | % | |||||||||||||||||
Year Ended 9/30/17 | 6.23 | % | 18,484 | 0.90 | % | 5.54 | % | 2.24 | % | 251 | % | |||||||||||||||||
Class R6 | ||||||||||||||||||||||||||||
Year Ended 9/30/21 | 5.35 | % | $ | 13 | 0.74 | % | 4.82 | % | 28.96 | % | 181 | % | ||||||||||||||||
Year Ended 9/30/20 | 1.40 | % | 12 | 0.79 | %(c) | 4.91 | % | 31.83 | % | 249 | % | |||||||||||||||||
Year Ended 9/30/19 | 11.57 | % | 12 | 0.82 | % | 5.67 | % | 33.09 | % | 236 | % | |||||||||||||||||
Year Ended 9/30/18 | (3.18 | )% | 11 | 0.84 | % | 5.32 | % | 34.20 | % | 364 | % | |||||||||||||||||
Period Ended 9/30/17(d) | 12.65 | %(e) | 11 | 0.85 | %(f) | 5.93 | %(f) | 53.42 | %(f) | 251 | % | |||||||||||||||||
| * | During the period, certain fees were contractually or voluntarily reduced and/or reimbursed. If such contractual/voluntary fee reductions and reimbursements had not occurred, the ratio would have been as indicated. |
| ** | Portfolio turnover rate is calculated on the basis of the Fund as a whole without distinguishing between the classes of shares issued. |
| (a) | Excludes sales charge. |
| (b) | Assumes investment at net asset value at the beginning of the period, reinvestment of all dividends and distributions, and a complete redemption of the investment at net asset value at the end of the period. |
| (c) | Beginning June 18, 2020, the net operating expenses were contractually limited to 1.04%, 0.79% and 0.74% of average daily net assets for Class A, Class I and Class R6, respectively. The ratio of net expenses to average net assets represents a blended percentage for the year ended September 30, 2020. |
42
FINANCIAL HIGHLIGHTS |
RBC BlueBay Emerging Market Debt Fund
(Selected data for a share outstanding throughout the periods indicated)
| (d) | For the period from December 27, 2016 (commencement of operations) to September 30, 2017. |
| (e) | Not annualized. |
| (f) | Annualized. |
See Notes to the Financial Statements.
43
FINANCIAL HIGHLIGHTS |
RBC BlueBay High Yield Bond Fund
(Selected data for a share outstanding throughout the periods indicated)
| Investment Activities | Distributions | |||||||||||||||||||||||||||||||||||||||||||
| Net Asset Value, Beginning of Year | Net Investment Income(a) | Net Realized and Unrealized Gains (Losses) on Investments | Redemption Fees | Total from Investment Activities | Net Investment Income | Net Realized Gains | Total Distributions | Net Asset Value, End of Year | ||||||||||||||||||||||||||||||||||||
Class A | ||||||||||||||||||||||||||||||||||||||||||||
Year Ended 9/30/21 | $ | 10.56 | 0.47 | 0.52 | —(b) | 0.99 | (0.52) | (0.14 | ) | (0.66) | $ | 10.89 | ||||||||||||||||||||||||||||||||
Year Ended 9/30/20 | 10.46 | 0.48 | 0.09 | — | 0.57 | (0.47) | — | (0.47) | 10.56 | |||||||||||||||||||||||||||||||||||
Year Ended 9/30/19 | 10.42 | 0.54 | 0.26 | — | 0.80 | (0.76) | — | (0.76) | 10.46 | |||||||||||||||||||||||||||||||||||
Year Ended 9/30/18 | 10.42 | 0.47 | (0.10 | ) | 0.01 | 0.38 | (0.38) | — | (0.38) | 10.42 | ||||||||||||||||||||||||||||||||||
Year Ended 9/30/17 | 9.98 | 0.47 | 0.26 | — | 0.73 | (0.29) | — | (0.29) | 10.42 | |||||||||||||||||||||||||||||||||||
Class I | ||||||||||||||||||||||||||||||||||||||||||||
Year Ended 9/30/21 | $ | 10.64 | 0.50 | 0.53 | —(b) | 1.03 | (0.55) | (0.14) | (0.69) | $ | 10.98 | |||||||||||||||||||||||||||||||||
Year Ended 9/30/20 | 10.52 | 0.51 | 0.10 | — | 0.61 | (0.49) | — | (0.49) | 10.64 | |||||||||||||||||||||||||||||||||||
Year Ended 9/30/19 | 10.47 | 0.58 | 0.25 | — | 0.83 | (0.78) | — | (0.78) | 10.52 | |||||||||||||||||||||||||||||||||||
Year Ended 9/30/18 | 10.46 | 0.47 | (0.07 | ) | — | 0.40 | (0.39) | — | (0.39) | 10.47 | ||||||||||||||||||||||||||||||||||
Year Ended 9/30/17 | 9.98 | 0.49 | 0.28 | — | 0.77 | (0.29) | — | (0.29) | 10.46 | |||||||||||||||||||||||||||||||||||
| (a) | Per share net investment income (loss) has been calculated using the average daily shares method. |
| (b) | Less than $0.01 or $(0.01) per share. |
44
FINANCIAL HIGHLIGHTS |
RBC BlueBay High Yield Bond Fund
(Selected data for a share outstanding throughout the periods indicated)
| Ratios/Supplemental Data | ||||||||||||||||||||||||||||
| Total Return(a)(b) | Net Assets, End of Year (000’s) | Ratio of Net Expenses to Average Net Assets | Ratio of Net Investment Income (Loss) to Average Net Assets | Ratio of Expenses to Average Net Assets* | Portfolio Turnover Rate** | |||||||||||||||||||||||
Class A | ||||||||||||||||||||||||||||
Year Ended 9/30/21 | 9.60% | $ | 3,727 | 0.82% | 4.32% | 1.18% | 100% | |||||||||||||||||||||
Year Ended 9/30/20 | 5.64% | 1,586 | 0.82% | 4.64% | 1.92% | 187% | ||||||||||||||||||||||
Year Ended 9/30/19 | 8.41% | 460 | 0.82% | 5.35% | 2.50% | 143% | ||||||||||||||||||||||
Year Ended 9/30/18 | 3.71% | 556 | 0.82%(c) | 4.56% | 2.82% | 158% | ||||||||||||||||||||||
Year Ended 9/30/17 | 7.37% | 33 | 0.70% | 4.59% | 4.44% | 101% | ||||||||||||||||||||||
Class I | ||||||||||||||||||||||||||||
Year Ended 9/30/21 | 9.89% | $ | 244,644 | 0.57% | 4.57% | 0.87% | 100% | |||||||||||||||||||||
Year Ended 9/30/20 | 6.03% | 128,846 | 0.57% | 4.92% | 1.10% | 187% | ||||||||||||||||||||||
Year Ended 9/30/19 | 8.58% | 49,397 | 0.57% | 5.66% | 1.39% | 143% | ||||||||||||||||||||||
Year Ended 9/30/18 | 3.95% | 38,469 | 0.56%(c) | 4.56% | 1.49% | 158% | ||||||||||||||||||||||
Year Ended 9/30/17 | 7.89% | 37,349 | 0.45% | 4.83% | 1.44% | 101% | ||||||||||||||||||||||
| * | During the period, certain fees were contractually or voluntarily reduced and/or reimbursed. If such contractual/voluntary fee reductions and reimbursements had not occurred, the ratio would have been as indicated. |
| ** | Portfolio turnover rate is calculated on the basis of the Fund as a whole without distinguishing between the classes of shares issued. |
| (a) | Excludes sales charge. |
| (b) | Assumes investment at net asset value at the beginning of the period, reinvestment of all dividends and distributions, and a complete redemption of the investment at net asset value at the end of the period. |
| (c) | Beginning November 1, 2017, the net operating expenses were contractually limited to 0.82% and 0.57% of average daily net assets for Class A and Class I, respectively. The ratio of net expenses to average net assets represents a blended percentage for the period ended September 30, 2018. |
See Notes to the Financial Statements.
45
|
September 30, 2021
1. Organization:
RBC Funds Trust (the “Trust”) is registered under the Investment Company Act of 1940 (as amended) as an open-end management investment company. The Trust was organized as a Delaware statutory trust on December 16, 2003 and currently consists of 16 portfolios. Overall responsibility for the management of the Trust is vested in its Board of Trustees (the “Board”).This report includes the following three investment portfolios (each a “Fund” and collectively, the “Funds”):
- RBC BlueBay Emerging Market Debt Fund (“Emerging Market Debt Fund”)
- RBC BlueBay High Yield Bond Fund (“High Yield Bond Fund”)
Class A and Class I shares are offered by each Fund; Class R6 shares are offered by Emerging Market Debt Fund. Class A shares are offered with a 4.25% maximum front-end sales charge and a 1.00% contingent deferred sales charge (“CDSC”) for redemption within 12 months of a $1 million or greater purchase on which no front-end sales charge was paid. Class I shares and Class R6 shares (intended for investors meeting certain investment minimum thresholds) are not subject to either a front-end sales charge or a CDSC.
RBC Global Asset Management (U.S.) Inc. (“RBC GAM-US)” or “Advisor” or “Co-Administrator”) acts as the investment advisor for the Funds and BlueBay Asset Management LLP (“BlueBay” or “Sub-Advisor”) acts as a sub-advisor for each of the Funds. The officers of the Trust (“Fund Management”) are also employees of RBC GAM-US.
2. Significant Accounting Policies
Each Fund is an investment company that follows accounting and reporting guidance under the Financial Accounting Standards Board. Summarized below are the significant accounting policies of the Funds. These policies conform to accounting principles generally accepted in the United States of America (“U.S. GAAP”). Fund Management follows these policies when preparing financial statements. Fund Management may also be required to make estimates and assumptions that affect the reported amounts of assets and liabilities at the date of the financial statements and the reported amounts of income and expenses for the period. Actual results could differ from those estimates. The financial statements are as of the close of regular trading on the New York Stock Exchange (“NYSE”).
Security Valuation:
The Board has adopted pricing and valuation procedures for determining the fair value of each Fund’s investments. Fair value of a security is considered to be the price that a fund might reasonably expect to receive upon its current sale in an orderly transaction between market participants.
Equity securities are generally valued on the basis of prices furnished by third-party pricing services approved by the Board. Equity securities listed on one or more exchanges shall be valued at the last available quoted sale price on the primary trading exchange as of the regularly scheduled closing time of the exchange and are categorized as Level 1 in the fair value hierarchy. (See “Fair Value Measurements” below for additional information). An equity security not listed on an exchange but listed on NASDAQ shall be valued at the NASDAQ official closing price and is also categorized as Level 1. If there was no sale on the primary exchange on the day the net asset value is calculated or a NASDAQ official closing price is not available, the most recent bid quotation generally will be used and such securities will generally be categorized as Level 2. Investments in open-end investment companies (mutual funds) are valued at net asset value and are categorized as Level 1 in the fair value hierarchy.
Fixed income securities, including to-be-announced (“TBA”) commitments and municipal bonds, are generally valued based on evaluated prices received from third-party pricing services or from broker-dealers who make markets in the securities and are generally categorized as Level 2 in the fair value hierarchy (see “Fair Value Measurements” below for additional information). The pricing services utilize both dealer-supplied valuations and electronic data processing techniques that take into account multiple appropriate factors such as institutional-size trading in similar groups of securities, market
46
NOTES TO FINANCIAL STATEMENTS
|
spreads, interest rates, and fundamental security analytical data including yield, quality, coupon rate, maturity and type of issue.
Bank loans are valued based on evaluated prices received from third-party pricing services or fair valued using recently executed transactions, market price quotations, credit/market events, and cross-asset pricing. Inputs are generally observable market inputs obtained from independent sources. Bank Loans are generally categorized as Level 2 of the fair value hierarchy, unless key inputs are unobservable which would then be as Level 3.
Exchange-traded options, futures and options on futures are valued at the last sale price at the close of the market on the principal exchange on which they are traded. In the absence of any transactions on that day, the closing bid price shall be used for purchased options, futures and options on futures, and the closing ask price shall be used for written options. Such instruments are categorized as Level 1 of the fair value hierarchy. Options contracts traded in the over-the-counter (“OTC”) market shall be valued at the evaluated price provided by an independent pricing service or broker-dealer using a mathematical model which incorporates a number of market data factors, such as trades and prices of the underlying instruments. These contracts are categorized as Level 2 of the fair value hierarchy. Forward foreign currency exchange contracts are marked to market daily based upon foreign currency exchange rates provided by an independent pricing service as of the close of the NYSE, generally 4:00 p.m. EST, and are generally classified as Level 2 within the fair value hierarchy.
Swaps, including credit-default swaps, interest rate swaps and total return swaps, are generally valued by an independent pricing service using a discounted cash flow methodology. This technique is used to value both the fixed and variable components of the swap contracts and takes into account market data and inputs sourced from various institutions and market-makers and includes daily intra-day and closing spreads, credit index quotes, yield curves, and recovery rate assumptions. The Fund’s net benefit or obligation under the derivative contract, as measured by the fair market value of the contract, is included in the Fund’s net assets. These swap contracts are categorized as Level 2 in the fair valuation hierarchy.
Foreign securities valued in non-U.S. dollars are valued in the foreign currency and then converted into the U.S. dollar equivalent using the foreign exchange rate in effect at the close of NYSE on the day the security’s value is determined. The value of securities traded in markets outside the United States may be affected on a day that the NYSE is closed and an investor is not able to purchase, exchange or redeem shares of the Funds.
The Board has delegated to the Funds’ Pricing Committee (“Pricing Committee”) the responsibility for implementing the pricing and valuation procedures, including responsibility for determining the fair value of the Funds’ securities or other assets and liabilities. The Pricing Committee includes representatives of the Funds’ Advisor, Co-Administrator and Sub-Advisor, including personnel from accounting and operations, investment management, trading, risk management and compliance. The Pricing Committee meets at least quarterly to review and approve Fund valuation matters, including a review of the Funds’ pricing activity and operations, fair value measurements, pricing vendors, policies and procedures, and related controls. At least a quorum of the Pricing Committee shall meet more frequently, as needed, to consider and approve time-sensitive fair valuation matters. The Pricing Committee reports to the Valuation, Portfolio Management and Performance Committee (“Valuation Committee”) of the Board. Members of the Pricing Committee meet with the Valuation Committee and the Board at each of their regularly scheduled meetings to discuss valuation matters and actions taken during the period.
The Board has adopted procedures to determine the fair value of a security when a price is not available from a pricing service or broker- dealer or Fund Management determines that a price provided by a pricing service or broker-dealer does not approximate fair value. Fair valuation may also be used when a significant valuation event affecting the value of a security or market sector is determined to have occurred between the time when a security’s market closes and the time the Fund’s net asset value is calculated. The fair value of the security will be determined in good faith by the Pricing Committee in accordance with procedures and methodologies adopted by the Board. General factors used in determining the fair value of securities include, but are not limited to,
47
NOTES TO FINANCIAL STATEMENTS
|
fundamental analytical data relating to the security, the issuer and the market, such as duration, prepayment and default rates; general level of interest rates and changes in interest rates; information from broker-dealers; trading in similar securities; any restrictions on disposition of the security; and an evaluation of the forces that influence the market in which the investments are traded. These securities are either categorized as Level 2 or 3 in the fair value hierarchy, depending on the relevant inputs used.
When the Funds utilize fair valuation methods that use significant unobservable inputs to determine a security’s value, such securities will be categorized as Level 3 of the fair value hierarchy. These methods may require subjective determinations about the value of a security. While the Funds’ policy is intended to result in a calculation of a Fund’s net asset value that fairly reflects security values as of the time of pricing, the Funds cannot guarantee that values determined by the Board or persons acting at their direction would accurately reflect the price that the Funds could obtain for a security if they were to dispose of it as of the time of pricing (for instance, in a forced or distressed sale). The prices used by the Funds may differ from the value that would be realized if the securities were sold.
The Funds’ Pricing Committee employs various methods for calibrating the valuation approach related to securities categorized within Level 2 and Level 3 of the fair value hierarchy. These methods may include regular due diligence of the Funds’ pricing vendors, a regular review of key inputs and assumptions, transaction back-testing or disposition analysis to compare unrealized gains and losses to realized gains and losses, reviews of missing and stale prices and large movements in market value, and reviews of any market related activities. Additionally, the pricing of all fair value holdings is subsequently reported to the Valuation Committee and Board.
Fair Value Measurements:
The Funds disclose the fair value of their investments in a hierarchy that categorizes investments based on the inputs to valuation techniques used to measure fair value. The three levels of the fair value hierarchy are as follows:
• Level 1 - Inputs that reflect unadjusted quoted prices in active markets for identical assets or liabilities that the Funds have the ability to access at the measurement date.
• Level 2 - Significant inputs other than quoted prices that are observable for the asset or liability either directly or indirectly, including inputs in markets that are not considered to be active. Observable inputs may include quoted prices for similar securities, interest rates, spreads, prepayment spreads, etc.
• Level 3 - Significant unobservable inputs based on the best information available in the circumstances, to the extent observable inputs are not available (including the Fund’s own assumptions in determining the fair value of investments).
The inputs or methodology used for valuing investments are not necessarily an indication of the risk associated with investing in those securities.
Inputs used in determining fair value of an investment may include, but are not limited to, price information, volatility statistics, credit and market data, and other factors, all of which may be either observable or unobservable. Inputs can vary among investments and will be impacted by the investment type and volume of activity for the particular security or similar securities in the market. Investments in the Level 3 category are generally supported by transactions and quoted prices from dealers participating in the market for those investments. Investments may be included in the Level 3 category due to a lack of market activity or transparency. Internal valuation models may also be used as a pricing source for Level 3 investments. Internal valuation models may rely on one or more unobservable inputs, such as estimated cash flows, financial statement analysis and discount rates.
48
NOTES TO FINANCIAL STATEMENTS
|
The summary of inputs used to determine the fair value of the Funds’ investments as of September 30, 2021 is as follows:
| Level 1 Quoted Prices | Level 2 Significant Observable Inputs | Level 3 Significant Unobservable Inputs | Total | |||||||||||||||||||||||||||||
Emerging Market Debt Fund | ||||||||||||||||||||||||||||||||
Assets: | ||||||||||||||||||||||||||||||||
Investments in Securities | ||||||||||||||||||||||||||||||||
Foreign Government Bonds | $ | — | $ | 20,982,726 | $ | — | $ | 20,982,726 | ||||||||||||||||||||||||
Corporate Bonds | — | 7,013,017 | — | 7,013,017 | ||||||||||||||||||||||||||||
Investment Company | 654,507 | — | — | 654,507 | ||||||||||||||||||||||||||||
Other Financial Instruments* | ||||||||||||||||||||||||||||||||
Foreign currency exchange contracts - forward contracts | — | 76,960 | — | 76,960 | ||||||||||||||||||||||||||||
Financial futures contracts | 47,783 | — | — | 47,783 | ||||||||||||||||||||||||||||
Credit default swaps | — | 165,312 | — | 165,312 | ||||||||||||||||||||||||||||
Interest rate swaps - Appreciation | — | 2,254 | — | 2,254 | ||||||||||||||||||||||||||||
|
|
|
|
|
|
|
| |||||||||||||||||||||||||
Total Assets | $ | 702,290 | $ | 28,240,269 | $ | — | $ | 28,942,559 | ||||||||||||||||||||||||
|
|
|
|
|
|
|
| |||||||||||||||||||||||||
Liabilities: | ||||||||||||||||||||||||||||||||
Other Financial Instruments* | ||||||||||||||||||||||||||||||||
Interest Rate Swaps | $ | — | $ | (12,372 | ) | $ | — | $ | (12,372 | ) | ||||||||||||||||||||||
Foreign currency exchange contracts - forward contracts | — | (36,188 | ) | — | (36,188 | ) | ||||||||||||||||||||||||||
Credit default swaps | — | (168,984 | ) | — | (168,984 | ) | ||||||||||||||||||||||||||
|
|
|
|
|
|
|
| |||||||||||||||||||||||||
Total Liabilities | $ | — | $ | (217,544 | ) | $ | — | $ | (217,544 | ) | ||||||||||||||||||||||
|
|
|
|
|
|
|
| |||||||||||||||||||||||||
49
NOTES TO FINANCIAL STATEMENTS
|
Level 1 | Level 2 | Level 3 | Total | |||||||||||||||||||||||||||||
High Yield Bond Fund | ||||||||||||||||||||||||||||||||
Assets: | ||||||||||||||||||||||||||||||||
Investments in Securities | ||||||||||||||||||||||||||||||||
Corporate Bonds | ||||||||||||||||||||||||||||||||
Australia | $ | — | $ | — | $ | 309,854 | $ | 309,854 | ||||||||||||||||||||||||
Bermuda | — | 1,582,099 | — | 1,582,099 | ||||||||||||||||||||||||||||
Brazil | — | 2,777,265 | — | 2,777,265 | ||||||||||||||||||||||||||||
Canada | — | 9,400,380 | — | 9,400,380 | ||||||||||||||||||||||||||||
Cayman Islands | — | 1,927,278 | — | 1,927,278 | ||||||||||||||||||||||||||||
France | — | 2,989,725 | — | 2,989,725 | ||||||||||||||||||||||||||||
Germany | — | 3,649,063 | — | 3,649,063 | ||||||||||||||||||||||||||||
Italy | — | 5,536,966 | — | 5,536,966 | ||||||||||||||||||||||||||||
Korea | — | 682,257 | — | 682,257 | ||||||||||||||||||||||||||||
Luxembourg | — | 2,929,683 | — | 2,929,683 | ||||||||||||||||||||||||||||
Netherlands | — | 1,045,000 | — | 1,045,000 | ||||||||||||||||||||||||||||
Singapore | — | 800,285 | — | 800,285 | ||||||||||||||||||||||||||||
United Arab Emirates | — | 522,342 | — | 522,342 | ||||||||||||||||||||||||||||
United Kingdom | — | 3,027,292 | — | 3,027,292 | ||||||||||||||||||||||||||||
United States | — | 186,321,359 | — | 186,321,359 | ||||||||||||||||||||||||||||
Investment Company | 17,427,198 | — | — | 17,427,198 | ||||||||||||||||||||||||||||
Common Stocks | ||||||||||||||||||||||||||||||||
Australia | — | — | 11,222 | 11,222 | ||||||||||||||||||||||||||||
United Kingdom | — | 6,925 | — | 6,925 | ||||||||||||||||||||||||||||
United States | — | 132,940 | 1,982 | 134,922 | ||||||||||||||||||||||||||||
Rights/Warrants | — | 1 | — | 1 | ||||||||||||||||||||||||||||
Other Financial Instruments* | ||||||||||||||||||||||||||||||||
Foreign currency exchange contracts - forward contracts | — | 203,052 | — | 203,052 | ||||||||||||||||||||||||||||
Financial futures contracts | 218,310 | — | — | 218,310 | ||||||||||||||||||||||||||||
|
|
|
|
|
|
|
| |||||||||||||||||||||||||
Total Assets | $ | 17,645,508 | $ | 223,533,912 | $ | 323,058 | $ | 241,502,478 | ||||||||||||||||||||||||
|
|
|
|
|
|
|
| |||||||||||||||||||||||||
Liabilities: | ||||||||||||||||||||||||||||||||
Other Financial Instruments* | ||||||||||||||||||||||||||||||||
Foreign currency exchange contracts - forward contracts | $ | — | $ | (34,052 | ) | $ | — | $ | (34,052 | ) | ||||||||||||||||||||||
*Other financial instruments are instruments shown on the Schedule of Portfolio Investments, such as futures contracts, swaps and foreign currency contracts which are valued at fair value.
The following is a reconciliation of Level 3 investments for which significant unobservable inputs were used to determine fair value:
| High Yield Bond Fund | ||||||||||||
| Bank Loans– (United States) | Common Stocks | Corporate Bonds– (Australia) | ||||||||||
Balance as of 9/30/20(value) | $ | 15,981 | $ | 79,874 | $ | 260,467 | ||||||
Purchases | — | 3,925 | 15,412 | |||||||||
Sales (Paydowns) | (15,981 | ) | (30,077 | ) | — | |||||||
Change in unrealized appreciation (depreciation) | — | (40,518 | ) | 33,975 | ||||||||
|
|
|
|
|
| |||||||
Balance as of 9/30/21(value) | $ | — | $ | 13,204 | $ | 309,854 | ||||||
|
|
|
|
|
| |||||||
50
NOTES TO FINANCIAL STATEMENTS
|
The Funds’ assets assigned to the Level 3 category are valued utilizing the valuation technique deemed the most appropriate in the circumstances. The significant unobservable inputs used include assumptions regarding the particular security’s cash flow profile and potential defaults that may not be generally observable for the security. The Common Stock in High Yield Bond Fund were fair valued using a discounted cash flow model based on unobservable inputs that include estimated cash flows, implied credit spread and discount rate (weighted average cost of capital). The Corporate Bonds in High Yield Bond Fund were fair valued using discount cash flows. Significant changes in any of these assumptions may result in a lower or higher fair value measurement.
Quantitative Information about Level 3 Fair Value Measurements | ||||||||||||||||||||||||
| Fund | Fair Value at September 30, 2021 | Valuation Technique(s) | Unobservable Input | Range (Weighted Average) | ||||||||||||||||||||
Corporate Bonds (Australia) | High Yield Bond Fund | $309,854 | Discounted Cash Flow | Discount Rate of Cash Flows | 7.1%—14.8% (8.9%) | |||||||||||||||||||
| Liquidity Discount | 5.0%—7.5% (5.8%) | |||||||||||||||||||||||
Common Stocks (Australia) | High Yield Bond Fund | $ 11,222 | Discounted Cash Flow | Discount Rate of Cash Flows | 16.8%—19.3% (17.6%) | |||||||||||||||||||
| Liquidity Discount | 10% | |||||||||||||||||||||||
Foreign Currency Transactions:
The values of foreign securities, foreign currencies and other assets and liabilities denominated in foreign currencies are translated into U.S. dollars using current exchange rates each business day. Fluctuations in the value of foreign currency holdings and other assets and liabilities resulting from movements in currency exchange rates are recorded as unrealized foreign currency gains or losses. The effects of changes in foreign currency exchange rates on investments in securities are not segregated from the effects of changes in market prices of those securities on the Statements of Operations. Such fluctuations are included with the net change in unrealized appreciation/depreciation on investment transactions. However, for tax purposes, the effects of fluctuations in foreign currency exchange rates when determining the realized gain or loss upon the sale or maturity of foreign currency denominated debt obligations are segregated pursuant to U.S. Federal income tax regulations; such amounts are categorized as foreign exchange gain or loss for income tax reporting purposes.
Bank Loans:
A Fund may invest in fixed and floating rate loans from one or more financial institutions (“lender(s)”) to a borrower by way of: (i) assignment/transfer of; or (ii) participation in the whole or part of the loan amount outstanding. In both instances, assignments or participations of such loans must be capable of being freely traded and transferred between investors in the loans. Participations typically will result in a Fund having a contractual relationship only with a lender as grantor of the participation but not with the borrower. A Fund acquires a participation interest only if the lender(s) positioned between the Fund and the borrower is determined by the Sub-Advisor to be creditworthy. When purchasing loan participations, a Fund assumes the economic risk associated with the corporate borrower and the credit risk associated with an interposed bank or other financial intermediary. Loan assignments typically involve a transfer of debt from a lender to a third party. When purchasing loan assignments, a Fund assumes the credit risk associated with the corporate borrower only.
51
NOTES TO FINANCIAL STATEMENTS
|
Such loans may be secured or unsecured. Loans that are fully secured offer a Fund more protection than an unsecured loan in the event of non-payment of scheduled interest or principal. However, there is no assurance that the liquidation of collateral from a secured loan would satisfy the corporate borrower’s obligation. In addition, investments in loans through a direct assignment include the risk that if a loan is terminated, a Fund could become part owner of any collateral, and would bear the costs and liabilities associated with owning and disposing of the collateral.
Loan participations typically represent direct participation in a loan to a corporate borrower, and generally are offered by banks or other financial institutions or lending syndicates.
A loan is often administered by an agent bank acting as agent for all holders. Unless, under the terms of the loan or other indebtedness, a Fund has direct recourse against the corporate borrower, the Fund may have to rely on the agent bank or other financial intermediary to apply appropriate credit remedies against a corporate borrower.
When a Fund purchases a floating rate loan interest, it may receive a facility fee and when it sells a floating rate loan interest, it may pay a facility fee. On an ongoing basis, the Funds may receive a commitment fee based on the undrawn portion of the underlying line of credit amount of a floating rate loan interest. Facility and commitment fees are typically amortized to income over the term of the loan or term of the commitment, respectively. Consent and amendment fees are recorded to income as earned. Prepayment penalty fees, which may be received by the Funds upon the prepayment of a floating rate loan interest by a borrower, are recorded as realized gains. The Funds may invest in multiple series or tranches of a loan. A different series or tranche may have varying terms and carry different associated risks.
In connection with floating rate loan interests, the Funds may also enter into unfunded floating rate loan interests (“commitments”). In connection with these commitments, the Funds earn a commitment fee, typically set as a percentage of the commitment amount. Such fee income, which is included in interest income in the Statement of Operations, is recognized ratably over the commitment period. Unfunded floating rate loan interests are marked-to-market daily, and any unrealized appreciation or depreciation is included in the Statements of Assets and Liabilities and Statements of Operations. As of September 30, 2021, the Funds did not have any bank loans or unfunded floating rate loan interests.
Payment-in-Kind Securities:
The Funds may invest in payment-in-kind securities (“PIKs”). PIKs give the issuer the option at each interest payment date of making interest payments in either cash or additional debt securities. Those additional debt securities usually have the same terms, including maturity dates and interest rates, and associated risks as the original bonds. The daily market quotations of the original bonds may include the accrued interest (referred to as a dirty price) and require a pro-rata adjustment from the unrealized appreciation or depreciation on investments to interest receivable on the Statement of Assets and Liabilities.
For the year ended September 30, 2021, the total in-kind payments received by the High Yield Bond Fund with respect to PIKs constituted less than 5% of the Fund’s total income and, therefore, such payments were not disclosed as a separate line item on the Statement of Operations.
Derivatives:
The Funds may use derivative instruments, including futures, forwards, options, indexed securities, swaps and inverse securities as tools in the management of portfolio assets. A Fund may use such derivatives through either the creation of long or short positions to hedge various investments, for investment purposes, for risk management and/or to increase income or gain to the Fund. Derivatives allow a Fund to increase or decrease its risk exposure more quickly and efficiently than other types of instruments. Derivatives may be riskier than other types of investments and could result in losses that significantly exceed a Fund’s original investment. Derivatives are subject to the risk that changes in the value of a derivative may not correlate perfectly with the underlying asset, rate or index. The use of derivatives may not be successful, resulting in losses to a Fund, and the cost of such strategies may reduce the Fund’s returns.
52
NOTES TO FINANCIAL STATEMENTS
|
Hedging also involves the risk that changes in the value of the derivative will not match those of the holdings being hedged as expected by the Funds, in which case any losses on the holdings being hedged may not be reduced and may be increased. There can be no assurance that a Fund’s hedging strategy will reduce risk or that hedging transactions will be available or cost effective. The Funds are subject to interest rate risk and foreign currency exchange risk in the normal course of pursuing their investment objectives by investing in various derivative financial instruments, as described below.
In addition to the risks associated with derivatives in general, the Funds will also be subject to risks related to swap agreements. Because swap agreements are not exchange-traded, but are private contracts into which a Fund and a swap counterparty enter as principals, a Fund may experience a loss or delay in recovering assets if the counterparty defaults on its obligations. Each Fund will segregate or earmark liquid assets in an amount sufficient to cover its obligations under swap agreements.
Financial Futures Contracts:
The Funds may enter into futures contracts in an effort to manage the duration of the portfolio and hedge against certain market risk. A futures contract on a securities index is an agreement obligating one party to pay, and entitling the other party to receive, during the term of the contract, cash payments based on the level of a specified securities index. Futures transactions involve brokerage costs and require a Fund to segregate assets to cover contracts that would require it to purchase securities or currencies. A Fund may lose the expected benefit of futures transactions if interest rates, exchange rates or securities prices change in an unanticipated manner. Such unanticipated changes may also result in lower overall performance than if a Fund had not entered into any futures transactions.
The Funds entered into U.S. Treasury Bond futures, Euro Dollar futures and Euro-Bund futures during the year ended September 30, 2021.
Upon entering into a futures contract, a Fund is required to pledge to the broker an amount of cash, U.S. government securities, or other assets equal to a certain percentage of the contract amount. Subsequent payments are made or received by the Funds each day, depending on the daily fluctuations in the fair value of the underlying instrument. A Fund would record an unrealized gain or loss each day equal to these daily payments.
Open futures contracts are shown on the Schedules of Portfolio Investments. Underlying collateral pledged for open futures contracts is the cash at brokers for financial futures contracts shown on the Statements of Assets and Liabilities at September 30, 2021.
Options:
The Funds may write (or sell) put and call options on the securities that the Funds are authorized to buy or already hold in their portfolio. The Funds may also purchase put and call options.
A call option gives the purchaser of the option the right (but not the obligation) to buy, and obligates the seller to sell (when the option is exercised), the underlying instrument at the exercise price at any time or at a specified time during the option period. A put option gives the holder the right to sell and obligates the writer to buy the underlying instrument at the exercise price at any time or at a specified time during the option period. When a Fund purchases (writes) an option, an amount equal to the premium paid (received) by a Fund is reflected as an asset (liability). The amount of the asset (liability) is subsequently marked-to-market to reflect the current market value of the option purchased (written). When an instrument is purchased or sold through an exercise of an option, the related premium paid (or received) is added to (or deducted from) the basis of the instrument acquired or deducted from (or added to) the proceeds of the instrument sold. When an option expires (or a Fund enters into a closing transaction), a Fund realizes a gain or loss on the option to the extent of the premiums received or paid (or gain or loss to the extent the cost of the closing transaction exceeds the premium received or paid). When a Fund writes a call option, such option is “covered,” meaning that a Fund holds the underlying instrument subject to being called by the option counterparty, or cash in an amount sufficient to cover the obligation. When a Fund writes a put option, such option is covered by cash in an amount sufficient to cover the obligation.
53
NOTES TO FINANCIAL STATEMENTS
|
In purchasing and writing options, a Fund bears the market risk of an unfavorable change in the price of the underlying instrument or the risk that a Fund may not be able to enter into a closing transaction due to an illiquid market. Exercise of a written option could result in a Fund purchasing or selling a security at a price different from the current market value.
A Fund may execute transactions in both listed (exchange-traded) and OTC options. Listed options involve minimal counterparty risk since listed options are guaranteed against default by the exchange on which they trade. Transactions in certain OTC options may expose a Fund to the risk of default by the counterparty to the transaction. In the event of default by the counterparty to the OTC option transaction, a Fund’s maximum amount of loss is the premium paid (as purchaser) or the unrealized gain of the contract (as writer).
Forward Foreign Currency Exchange Contracts:
The Funds enter into forward foreign currency contracts (“Forward”) to hedge their exposure to changes in foreign currency exchange rates on foreign portfolio holdings (foreign currency exchange risk). In addition, certain Funds may use a Forward to provide exposure to the foreign currency market. A Forward is an agreement between two parties to purchase or sell a foreign currency at a future date at a negotiated forward rate. A Forward is marked-to-market daily and the change in market value is recorded by the Funds as unrealized appreciation or depreciation until the contract settlement date.
The market value of the Forward is determined using the forward rate for the remainder of the outstanding period of the contract, through the delivery date. When a Forward is closed or settled, the Funds record a realized gain or loss equal to the fluctuation in rates during the period a Forward was open.
In the event of default by the counterparty to the transaction, the Fund’s maximum amount of loss, as either the buyer or seller, is the unrealized gain of the contract.
Details of Forward contracts at period end are included in the Schedules of Portfolio Investments under the caption “Foreign currency exchange contracts.”
Swap Agreements:
The Funds may enter into swap agreements, which are agreements involving two parties to exchange the return generated by a security, currency, commodity, interest rate, index, or other measures for the return generated by another instrument, for example, the agreement to pay interest in exchange for a market-linked return based on a notional amount. The Funds entered into interest rate, credit default and other swap agreements as of September 30, 2021.
Interest rate swap agreements generally involve the agreement by a Fund to pay a counterparty a fixed or floating rate on a fixed notional amount and to receive a fixed or floating rate on a fixed notional amount, but may also involve the agreement to pay or receive payments derived from changes in interest rates. Periodic payments are generally made during the life of the swap agreement according to the terms and conditions of the agreement and at termination or maturity.
The Funds enter into cross-currency swaps to gain or reduce exposure to foreign currencies or as an economic hedge against either specific transactions or portfolio instruments (foreign currency exchange rate and/or interest rate risk). Cross-currency swaps are interest rate swaps in which one party pays a stream of interest payments, either fixed or floating, in exchange for another party’s stream of interest payments, either fixed or floating, based on the notional amounts of two different currencies. The notional amounts are typically determined based on the spot exchange rates at the inception of the trade. Cross-currency swaps may also involve an exchange of notional amounts at the start, during and/or at expiration of the contract, either at the current spot rate or another specified rate.
The Funds enter into credit default swaps to manage their exposure to the market or certain sectors of the market, to reduce their risk exposure to defaults of corporate and/or sovereign issuers or to create exposure to corporate and/or sovereign issuers to which they are not otherwise exposed (credit risk). The Funds enter into credit default swap agreements to provide a measure of protection against the default of an issuer (as buyer of protection) and/or gain credit exposure to an issuer to which it is not otherwise exposed (as seller of protection). The Funds may either buy or sell (write) credit default
54
NOTES TO FINANCIAL STATEMENTS
|
swaps on single-name issuers (corporate or sovereign), a combination or basket of single-name issuers or traded indexes. Credit default swaps on single-name issuers are agreements in which the buyer pays fixed periodic payments to the seller in consideration for a guarantee from the seller to make a specific payment should a negative credit event take place with respect to the referenced entity (e.g., bankruptcy, failure to pay, obligation accelerators, repudiation, moratorium or restructuring). Credit default swaps on traded indexes are agreements in which the buyer pays fixed periodic payments to the seller in consideration for a guarantee from the seller to make a specific payment should a writedown, principal or interest shortfall or default of all or individual underlying securities included in the index occurs. As a buyer, if an underlying credit event occurs, the Funds will either receive from the seller an amount equal to the notional amount of the swap and deliver the referenced security or underlying securities comprising the index or receive a net settlement of cash equal to the notional amount of the swap less the recovery value of the security or underlying securities comprising the index. As a seller (writer), if an underlying credit event occurs, the Funds will either pay the buyer an amount equal to the notional amount of the swap and take delivery of the referenced security or underlying securities comprising the index or pay a net settlement of cash equal to the notional amount of the swap less the recovery value of the security or underlying securities comprising the index.
Total return swap agreements involve the commitments to pay or receive an amount generally determined by reference to a security, index or other measure in exchange for a specific market linked return, based on notional amounts. To the extent that the total return of the security, index or other measure underlying the transaction exceeds or falls short of the offsetting interest rate-based obligation, the Funds receive or make a payment to the counterparty. Interim payments and payments received or made by a Fund at the expiration or other termination of the swap agreements are recorded in the Statement of Operations as realized gains or losses, respectively. Swap agreements are marked-to-market daily based on dealer-supplied valuations, and changes in value, including the periodic amounts of interest to be paid or received on swaps, are recorded as unrealized appreciation/ (depreciation). Risks may exceed amounts recognized on the Statements of Assets and Liabilities. These risks include changes in the returns of the underlying instruments, failure of the counterparties to perform under the contracts’ terms and the possible lack of liquidity with respect to the swap agreements. Details of swap agreements open at period end are included in the Schedules of Portfolio Investments under the captions “Interest rate swaps” and “Credit default swaps”.
Fair Values of Derivative Financial Instrument as of September 30, 2021 | ||||||||||||||||
Statement of Assets and Liabilities Location | ||||||||||||||||
Asset Derivatives | ||||||||||||||||
| Emerging Market Debt Fund | High Yield Bond Fund | |||||||||||||||
Credit Risk: | ||||||||||||||||
Credit default swaps, at value | $ | 165,312 | $ | — | ||||||||||||
Interest Rate Risk: | ||||||||||||||||
Unrealized appreciation on interest rate swaps contracts | 2,254 | — | ||||||||||||||
Unrealized appreciation on futures contracts | 47,783 | 218,310 | ||||||||||||||
Foreign currency exchange risk: | ||||||||||||||||
Unrealized appreciation on forward foreign currency exchange contracts | 76,960 | 203,052 | ||||||||||||||
|
|
|
| |||||||||||||
Total | $ | 292,309 | $ | 421,362 | ||||||||||||
|
|
|
| |||||||||||||
55
NOTES TO FINANCIAL STATEMENTS
|
Liability Derivatives | ||||||||||||||||
| Emerging Market Debt Fund | High Yield Bond Fund | |||||||||||||||
Credit Risk: | ||||||||||||||||
Credit default swaps, at value | $ | 168,984 | $ | — | ||||||||||||
Interest Rate Risk: | ||||||||||||||||
Unrealized depreciation on interest rate swaps | 12,372 | — | ||||||||||||||
Foreign currency exchange risk: | ||||||||||||||||
Unrealized depreciation on forward foreign currency exchange contracts | 36,188 | 34,052 | ||||||||||||||
|
|
|
| |||||||||||||
Total | $ | 217,544 | $ | 34,052 | ||||||||||||
|
|
|
| |||||||||||||
The effect of derivative instruments on the Statement of Operations during the year ended September 30, 2021 is as follows:
Derivative Instruments Categorized by Risk Exposure | Emerging Market Debt Fund | High Yield Bond Fund | ||||||||||||||
Net realized Gain/(Loss) From: | ||||||||||||||||
Credit Risk: | ||||||||||||||||
Credit default swaps | $ | (129,516 | ) | $ | 384,327 | |||||||||||
Equity Risk: | ||||||||||||||||
Purchased options(1) | (10,930 | ) | — | |||||||||||||
Written Options | 2,386 | — | ||||||||||||||
Interest Rate Risk: | ||||||||||||||||
Purchased options(1) | 350 | — | ||||||||||||||
Interest rate swaps | (143,239 | ) | — | |||||||||||||
Financial futures contracts | 25,362 | (309,121 | ) | |||||||||||||
Written Options | 1,050 | — | ||||||||||||||
Foreign currency exchange risk: | ||||||||||||||||
Forward foreign currency exchange contracts | (10,074) | (16,715 | ) | |||||||||||||
|
|
|
| |||||||||||||
Total | $ | (264,611) | $ | 58,491 | ||||||||||||
|
|
|
| |||||||||||||
Derivative Instruments Categorized by Risk Exposure | Emerging Market Debt Fund | High Yield Bond Fund | ||||||||||||||
Net Change in Unrealized Appreciation/(Depreciation) From: | ||||||||||||||||
Credit Risk: | ||||||||||||||||
Credit default swaps | $ | 26,449 | $ | — | ||||||||||||
Equity Risk: | ||||||||||||||||
Written options | (782 | ) | — | |||||||||||||
Interest Rate Risk: | ||||||||||||||||
Purchased options(2) | 1,376 | — | ||||||||||||||
Interest rate swaps | 29,741 | — | ||||||||||||||
Financial futures contracts | 48,790 | 218,556 | ||||||||||||||
Written options | 15 | — | ||||||||||||||
Foreign currency exchange risk: | ||||||||||||||||
Forward foreign currency exchange contracts | 35,455 | 129,682 | ||||||||||||||
|
|
|
| |||||||||||||
Total | $ | 141,044 | $ | 348,238 | ||||||||||||
|
|
|
| |||||||||||||
(1) Included in net realized gains/(losses) on investment transactions on Statement of Operations.
56
NOTES TO FINANCIAL STATEMENTS
|
(2) Included in net change in unrealized appreciation/(depreciation) on investment transactions on Statement of Operations.
For the year ended September 30, 2021, the average volume of derivative activities based on ending quarterly outstanding amounts are as follows:
| Emerging Market Debt Fund | High Yield Bond Fund | |||||||||||||||
Futures short position (contracts) | 9 | 45 | ||||||||||||||
Forward foreign currency exchange contracts purchased (U.S. dollar amounts) | $4,793,630 | $ | 8,055,382 | |||||||||||||
Forward foreign currency exchange contracts sold (U.S. dollar amounts) | 2,861,414 | 1,298,209 | ||||||||||||||
Purchased options (Cost $) | 1,400 | — | ||||||||||||||
Written Options (Premium received $) | 263 | — | ||||||||||||||
Interest rate swaps (Notional Amount in U.S. Dollars) | 3,470,166 | — | ||||||||||||||
Credit default swaps (Notional Amount in U.S. Dollars) | 3,576,213 | — | ||||||||||||||
Counterparty Credit Risk:
Derivatives may also expose a Fund to counterparty risk (the risk that the derivative counterparty will not fulfill its contractual obligations). To the extent amounts due to the Funds from their counterparties are not fully collateralized contractually or otherwise, the Funds bear the risk of loss from counterparty non-performance. A Fund’s maximum risk of loss from counterparty credit risk on over-the-counter (“OTC”) derivatives is generally the aggregate unrealized gain in excess of any collateral pledged by the counterparty to the Funds.
For foreign currency exchange contracts, risks may arise upon entering into these contracts from the potential inability of the counterparties to meet the terms of their contracts, or if the foreign currency rates change unfavorably.
The Funds’ risk of loss from counterparty credit risk on OTC derivatives is generally limited to the aggregate unrealized gain netted against any collateral held by the Funds. For OTC purchased options, the Funds bear the risk of loss in the amount of the premiums paid and change in market value of the options should the counterparty not perform under the contracts. Written options by the Funds do not give rise to counterparty credit risk, as written options obligate the Funds to perform and not the counterparty. Counterparty risk related to exchange-traded financial futures contracts and options is minimal because of the protection against defaults provided by the exchange on which they trade.
With exchange-traded purchased options and futures and centrally cleared swaps, the exchange or clearinghouse, as counterparty to such instruments, guarantees against a possible default. The clearinghouse stands between the buyer and the seller of the contract; therefore, credit risk is limited to failure of the clearinghouse. While offset rights may exist under applicable law, the Fund does not have a contractual right of offset against a clearing broker or clearinghouse in the event of a default (including the bankruptcy or insolvency) of the clearing broker or clearinghouse. Additionally, credit risk exists in exchange-traded futures and centrally cleared swaps with respect to initial and variation margin that is held in a clearing broker’s customer accounts. While clearing brokers are required to segregate customer margin from their own assets, in the event that a clearing broker becomes insolvent or goes into bankruptcy and at that time there is a shortfall in the aggregate amount of margin held by the clearing broker for all its clients, typically the shortfall would be allocated on a pro rata basis across all the clearing broker’s customers, potentially resulting in losses to the Funds.
In order to better define its contractual rights and to secure rights that will help the Funds mitigate its counterparty risk, the Funds may enter into an International Swaps and Derivatives Association, Inc. Master Agreement (“ISDA Master Agreement”) or similar agreement with its derivative contract counterparties. An ISDA Master Agreement is a bilateral agreement between a Fund and a counterparty that governs certain OTC derivatives and typically contains, among other things, collateral posting terms and netting provisions in the event of a default and/or termination event. Under an ISDA
57
NOTES TO FINANCIAL STATEMENTS
|
Master Agreement, a Fund may, under certain circumstances, offset with the counterparty certain derivative financial instruments’ payables and/or receivables with collateral held and/or posted and create one single net payment. The provisions of the ISDA Master Agreement typically permit a single net payment in the event of default including the bankruptcy or insolvency of the counterparty. However, bankruptcy or insolvency laws of a particular jurisdiction may impose restrictions on or prohibitions against the right of offset in bankruptcy, insolvency or other events. In addition, certain ISDA Master Agreements allow counterparties to OTC derivatives to terminate derivative contracts prior to maturity in the event a Fund’s net assets decline by a stated percentage or the Fund fails to meet the terms of its ISDA Master Agreements, which would cause the Fund to accelerate payment of any net liability owed to the counterparty.
Collateral Requirements:
For derivatives traded under an ISDA Master Agreement, the collateral requirements are typically calculated by netting the mark-to-market amount for each transaction under such agreement and comparing that amount to the value of any collateral currently pledged by the Fund and the counterparty.
Cash collateral that has been pledged to cover obligations of a Fund and cash collateral received from the counterparty, if any, is reported separately on the Statements of Assets and Liabilities as cash due to broker for options contracts, cash at broker for financial futures contracts and segregated cash and foreign currency for options contracts and swap contracts and cash received as payable to broker, respectively. Non-cash collateral pledged by the Fund, if any, is noted in the Schedule of Portfolio Investments. Generally, the amount of collateral due from or to a party has to exceed a minimum transfer amount threshold (e.g. $500,000) before a transfer is required, which is determined at the close of business of a Fund and any additional required collateral is delivered to/pledged by a Fund on the next business day. Typically, a Fund and its counterparties are not permitted to sell, re-pledge or use the collateral they receive. To the extent amounts due to a Fund from its counterparties are not fully collateralized, contractually or otherwise, a Fund bears the risk of loss from counterparty non-performance. The Funds attempt to mitigate counterparty risk by entering into agreements only with counterparties that it believes have the financial resources to honor their obligations and by monitoring the financial stability of those counterparties.
58
NOTES TO FINANCIAL STATEMENTS
|
Emerging Market Debt Fund
| Barclays Bank Plc | Citibank N.A. | Citigroup Global Markets | HSBC Bank Plc | Total | ||||||||||||||||
Assets: | ||||||||||||||||||||
Forward | ||||||||||||||||||||
Currency | ||||||||||||||||||||
Exchange | ||||||||||||||||||||
Contracts | $ | — | $ | 76,960 | $ | — | $ | — | $ | 76,960 | ||||||||||
Swaps | — | — | 58,533 | 109,033 | 167,566 | |||||||||||||||
|
|
|
|
|
|
|
|
|
| |||||||||||
Total Assets | — | 76,960 | 58,533 | 109,033 | 244,526 | |||||||||||||||
|
|
|
|
|
|
|
|
|
| |||||||||||
Liabilities: | ||||||||||||||||||||
Forward | ||||||||||||||||||||
Currency | ||||||||||||||||||||
Exchange | ||||||||||||||||||||
Contracts | — | 36,188 | — | — | 36,188 | |||||||||||||||
Swaps | 4,925 | — | 176,431 | — | 181,356 | |||||||||||||||
|
|
|
|
|
|
|
|
|
| |||||||||||
Total Liabilities | 4,925 | 36,188 | 176,431 | — | 217,544 | |||||||||||||||
|
|
|
|
|
|
|
|
|
| |||||||||||
Total Financial and Derivative Net Assets1 | (4,925 | ) | 40,772 | (117,898 | ) | 109,033 | 26,982 | |||||||||||||
Total Collateral (Received) Pledged2 | — | — | 117,898 | — | 117,898 | |||||||||||||||
|
|
|
|
|
|
|
|
|
| |||||||||||
Net Amount3 | $ | (4,925 | ) | $ | 40,772 | $ | — | $ | 109,033 | $ | 144,880 | |||||||||
|
|
|
|
|
|
|
|
|
| |||||||||||
High Yield Bond Fund
| Citibank N.A. | Total | |||||||||||||||
Assets: | ||||||||||||||||
Forward Currency Exchange Contracts | $ | 203,052 | $ | 203,052 | ||||||||||||
|
|
|
| |||||||||||||
Total Assets | 203,052 | 203,052 | ||||||||||||||
|
|
|
| |||||||||||||
Liabilities: | ||||||||||||||||
Forward Currency Exchange Contracts | 34,052 | 34,052 | ||||||||||||||
|
|
|
| |||||||||||||
Total Liabilities | 34,052 | 34,052 | ||||||||||||||
|
|
|
| |||||||||||||
Total Financial and Derivative Net Assets1 | 169,000 | 169,000 | ||||||||||||||
|
|
|
| |||||||||||||
Net Amount3 | $ | 169,000 | $ | 169,000 | ||||||||||||
|
|
|
| |||||||||||||
1 The amount of derivatives for offset is limited to the amount of assets and/or liabilities that are subject to a MNA.
2 Excess of collateral (received) pledged from/to the individual counterparty may not be shown for financial reporting purposes.
3 Net amount represents the net amount receivable (payable) from/to the individual counterparty in the event of default.
Affiliated Investments:
The Funds invest in another Fund of the Trust (an “Affiliated Fund”), U.S. Government Money Market Fund-RBC Institutional Class 1, as a cash sweep vehicle. The income earned by the Funds from the Affiliated Fund for the period is disclosed in the Statement of Operations. The table below details the transactions of the Funds in the Affiliated Fund.
59
NOTES TO FINANCIAL STATEMENTS
|
| Value September 30, 2020 | Purchases | Sales | Value September 30, 2021 | Dividends | ||||||||||||||||
Investments in U.S. Government Money Market Fund—RBC Institutional Class 1 | ||||||||||||||||||||
Emerging Market Debt Fund | $ | 573,140 | $ | 26,490,073 | $ | 26,408,706 | $ | 654,507 | $ | 122 | ||||||||||
High Yield Bond Fund | 9,666,601 | 165,102,376 | 157,341,779 | 17,427,198 | 2,343 | |||||||||||||||
Credit Enhancement:
Certain obligations held by the Funds have credit enhancement or liquidity features that may, under certain circumstances, provide for repayment of principal and interest on the obligation upon demand date, interest rate reset date or final maturity. These enhancements may include: letters of credit; liquidity guarantees; security purchase agreements; tender option purchase agreements and third party insurance.
Investment Transactions and Income:
Investment transactions are recorded on trade date. Dividend income net of non-reclaimable withholding taxes is recorded on the ex-dividend date. Non-cash dividends, if any, are recorded on the ex-dividend date at fair value. Realized gains and losses from investment transactions are calculated based on the cost of the specific security (also known as identified cost basis). Interest income is recognized on the accrual basis and includes, where applicable, the amortization or accretion of premium or discount using the effective yield method.
Expense, Investment Income and Gain/Loss Allocation:
Each Fund pays the expenses that are directly related to its operations, such as custodian fees or advisory fees. Expenses incurred by the Trust, such as trustee or legal fees, are allocated among each of the Funds in the Trust either proportionately based upon each Fund’s relative net assets or using another reasonable basis such as equally across all Funds in the Trust, depending on the nature of the expense. Individual share classes within a Fund are charged expenses specific to that class, such as distribution fees and transfer agent fees. Within a Fund, expenses other than class specific expenses are allocated daily to each class based upon the proportion of relative net assets. Investment income and realized and unrealized gains or losses are allocated to each class of shares based on relative net assets.
Distributions to Shareholders:
Each Fund pays out any income that it receives, less expenses, in the form of dividends and capital gains to its shareholders. Income dividends are declared and paid monthly. Capital gain distributions are declared and paid at least annually. Distributions to shareholders are recorded on the ex-dividend date. The amount of dividends and distributions are calculated based on federal income tax regulations, which may differ from US GAAP. These “book/tax” differences may be either temporary or permanent in nature. To the extent these differences are determined, as of the end of the tax year, to be permanent, they are reclassified within a Fund’s capital accounts based on their federal tax basis treatment. Permanent differences include reclassification of foreign currency from capital to ordinary, currency treatment for the accrual of certain foreign denominated swaps and early termination on such swaps, and reclassification of foreign currency options from capital to currency.
3. Agreements and Other Transactions with Affiliates:
The Trust has entered into an investment advisory agreement with RBC GAM-US under which RBC GAM-US manages each Fund’s assets and furnishes related office facilities, equipment, research and personnel. The agreement requires each Fund to pay RBC GAM-US a monthly fee based upon average
60
NOTES TO FINANCIAL STATEMENTS
|
daily net assets. Under the terms of the agreement, RBC GAM-US is entitled to receive fees based on a percentage of the average daily net assets of each of the Funds as follows:
| Annual Rate | ||||
Emerging Market Debt Fund | 0.65% | |||
High Yield Bond Fund | 0.55% | |||
RBC GAM-US has contractually agreed to waive fees and/or make payments in order to keep total operating expenses (excluding certain fees such as interest, taxes and acquired fund fees and expenses) of the Funds to the following levels pursuant to an expense limitation agreement.
| Class A Annual Rate | Class I Annual Rate | Class R6 Annual Rate | ||||||||||
Emerging Market Debt Fund | 1.04% | 0.79% | 0.74% | |||||||||
High Yield Bond Fund | 0.82% | 0.57% | N/A | |||||||||
This expense limitation agreement is in place until January 31, 2023 and may not be terminated by RBC GAM-US prior to that date. The agreement shall continue for additional one-year terms unless terminated or revised by the Board at any time or by RBC GAM-US at the expiration of any one-year period. The Advisor is entitled to recoup from the Fund or class the fees and/or operating expenses waived or reimbursed during any of the previous 3 years, provided the Fund is able to do so and remain in compliance with the expense limitation in place at the time the fees were waived or expenses paid.
The amounts subject to possible recoupment under the expense limitation agreement were:
| FYE 9/30/19 | FYE 9/30/20 | FYE 9/30/21 | Total | |||||||||||||
Emerging Market Debt Fund | $ | 281,605 | $ | 276,235 | $ | 262,010 | $ | 819,850 | ||||||||
High Yield Bond Fund | 357,042 | 418,696 | 535,173 | 1,310,911 | ||||||||||||
There was no recoupment of expense reimbursement/waivers during the year. Amounts from years prior to those shown are no longer subject to recoupment
RBC GAM-US may also voluntarily waive and/or reimburse operating expenses of any Fund from time to time. Any such voluntary program may be changed or eliminated at any time without notice, and expenses waived under such program are not subject to recoupment.
RBC GAM-US voluntarily agreed to waive its investment advisory fees by the amount of investment advisory fees the Funds pay to RBC GAM-US indirectly through its investment in an affiliated money market fund. For the year ended September 30, 2021, the amount waived was $848 and $15,196 for the Emerging Market Debt Fund and High Yield Bond Fund, respectively, and is included in expenses waived/reimbursed by Advisory in the Statement of Operations.
Each of the Funds are sub-advised by BlueBay, a wholly-owned subsidiary of Royal Bank of Canada, which is also the parent company of the Advisor. The Sub-Advisor is paid by the Advisor out of the advisory fee paid by the Funds to the Advisor.
RBC GAM-US serves as co-administrator to the Funds. BNY Mellon serves as co-administrator and fund accounting agent. Services provided under the administrative services agreement include providing day-to-day administration of matters related to the Funds, maintenance of their records and the preparation of reports. Under the terms of the administrative services agreement, RBC GAM-US does not receive a fee for its role as co-administrator. BNY Mellon receives a fee for its services payable by the Funds based in part on the Funds’ average net assets. BNY Mellon’s fee is included with “Accounting fees” in the Statements of Operations.
Certain Officers and Trustees of the Trust are affiliated with the Advisor. Such Officers and Trustees receive no compensation from the Funds for serving in their respective roles.
61
NOTES TO FINANCIAL STATEMENTS
|
The Trust currently pays each of the independent Trustees (Trustees of the Trust who are not directors, officers or employees of the Advisor, either Co-Administrator or Distributor) an annual retainer of $68,000. The Board Chairperson and Audit Committee Chairperson each receive an additional retainer of $2,500 annually, and all other trustees serving as Chair of a Board committee each receive an additional retainer of $1,000 annually. In addition, Independent Trustees receive a quarterly meeting fee of $6,500 for each in-person Board meeting attended, a meeting fee of $1,500 for each telephonic or Special Board meeting attended, a $1,500 fee for each Board committee meeting attended, and are reimbursed for all out-of-pocket expenses relating to attendance at such meetings. These amounts are included in the Statement of Operations in “Trustees’ fees”.
In conjunction with the launch of each of the Funds or additional share classes, the Advisor invested seed capital in each Fund to provide each Fund or share class with its initial investment assets. The table below shows, as of September 30, 2021, each Fund’s net assets, the shares (if any) of each Fund held by the Advisor, and the percent of total net assets represented by the Advisor’s investment.
| Net Assets | Shares held by Advisor | % of Fund Net Assets | ||||||||||
Emerging Market Debt Fund | $ | 28,695,237 | 1,309 | 0.0% | ||||||||
4. Fund Distribution:
Each of the Funds that offers Class A shares has adopted a Master Distribution 12b-1 Plan (the “Plan”) in which Quasar Distributors LLC (the “Distributor”) acts as the Funds’ distributor. The Plan permits each Fund to make payments for, or to reimburse the Distributor for, distribution-related costs and expenses of marketing shares of Class A covered under the Plan, and/or for providing shareholder services. The Plan does not apply to Class I and Class R6. The following chart shows the current Plan fee rate for Class A.
| Class A | ||||
12b-1 Plan Fee | 0.25% | * | ||
* Under the 12b-1 plan, the maximum fee rate for Class A shares is 0.50%. Currently the Board has approved an annual limit of 0.25%.
Plan fees are based on average daily net assets of Class A. Up to 0.25% of each Plan fee may be designated as a service fee, as defined by the applicable rules of the Financial Industry Regulatory Authority. The Distributor, subject to applicable legal requirements, may waive the Plan fee voluntarily, in whole or in part. For the year ended September 30, 2021, there were no fees waived by the Distributor.
For the year ended September 30, 2021, the Distributor received commissions of $36,902 for front-end sales charges of Class A shares of the Funds, of which $27,897 paid to affiliated broker-dealers and the remainder was either paid to unaffiliated broker-dealers or retained by the Distributor.
The Distributor did not receive any CDSC fees from Class A shares of the Funds during the year ended September 30, 2021.
5. Securities Transactions:
The cost of securities purchased and proceeds from securities sold (excluding securities maturing less than one year from acquisition) for the year ended September 30, 2021 were as follows:
| Purchases (Excl. U.S. Gov’t) | Sales (Excl. U.S. Gov’t) | Purchases of U.S. Gov’t. | Sales of U.S. Gov’t. | |||||||||||||
Emerging Market Debt Fund | $ | 52,965,639 | $ | 45,985,412 | $ | 873,530 | $ | 873,026 | ||||||||
High Yield Bond Fund | 262,508,259 | 170,443,978 | — | — | ||||||||||||
62
NOTES TO FINANCIAL STATEMENTS
|
6. Capital Share Transactions:
The Trust is authorized to issue an unlimited number of shares of beneficial interest (“shares outstanding”) without par value. Transactions in capital stock of the Funds are summarized on the following pages:
| Emerging Market Debt Fund | High Yield Bond Fund | |||||||||||||||||||||||||||
| For the Year Ended September 30, 2021 | For the Year Ended September 30, 2020 | For the Year Ended September 30, 2021 | For the Year Ended September 30, 2020 | |||||||||||||||||||||||||
CAPITAL TRANSACTIONS: | ||||||||||||||||||||||||||||
Class A | ||||||||||||||||||||||||||||
Proceeds from shares issued | $ | 7,700 | $ | 201 | $ | 3,275,138 | $ | 1,340,033 | ||||||||||||||||||||
Distributions reinvested | 413 | 957 | 139,854 | 33,354 | ||||||||||||||||||||||||
Cost of shares redeemed | (102 | ) | (12,613 | ) | (1,332,894 | ) | (253,685 | ) | ||||||||||||||||||||
|
|
|
|
|
|
|
| |||||||||||||||||||||
Change in Class A | $ | 8,011 | $ | (11,455 | ) | $ | 2,082,098 | $ | 1,119,702 | |||||||||||||||||||
|
|
|
|
|
|
|
| |||||||||||||||||||||
Class I | ||||||||||||||||||||||||||||
Proceeds from shares issued | $ | 6,504,994 | $ | 77,701 | $ | 162,568,961 | $ | 97,622,149 | ||||||||||||||||||||
Distributions reinvested | 1,344,001 | 993,319 | 8,901,537 | 3,036,577 | ||||||||||||||||||||||||
Cost of shares redeemed | (390,811 | ) | (547,555 | ) | (60,268,159 | ) | (24,115,984 | ) | ||||||||||||||||||||
|
|
|
|
|
|
|
| |||||||||||||||||||||
Change in Class I | $ | 7,458,184 | $ | 523,465 | $ | 111,202,339 | $ | 76,542,742 | ||||||||||||||||||||
|
|
|
|
|
|
|
| |||||||||||||||||||||
Class R6 | ||||||||||||||||||||||||||||
Distributions reinvested | $ | 676 | $ | 577 | $ | — | $ | — | ||||||||||||||||||||
|
|
|
|
|
|
|
| |||||||||||||||||||||
Change in Class R6 | $ | 676 | $ | 577 | $ | — | $ | — | ||||||||||||||||||||
|
|
|
|
|
|
|
| |||||||||||||||||||||
Change in net assets resulting from capital transactions | $ | 7,466,871 | $ | 512,587 | $ | 113,284,437 | $ | 77,662,444 | ||||||||||||||||||||
|
|
|
|
|
|
|
| |||||||||||||||||||||
SHARE TRANSACTIONS: | ||||||||||||||||||||||||||||
Class A | ||||||||||||||||||||||||||||
Issued | 775 | 21 | 301,720 | 128,181 | ||||||||||||||||||||||||
Reinvested | 42 | 97 | 12,960 | 3,217 | ||||||||||||||||||||||||
Redeemed | (10 | ) | (1,507 | ) | (122,686 | ) | (25,265 | ) | ||||||||||||||||||||
|
|
|
|
|
|
|
| |||||||||||||||||||||
Change in Class A | 807 | (1,389 | ) | 191,994 | 106,133 | |||||||||||||||||||||||
|
|
|
|
|
|
|
| |||||||||||||||||||||
Class I | ||||||||||||||||||||||||||||
Issued | 644,398 | 7,651 | 14,876,130 | 9,463,607 | ||||||||||||||||||||||||
Reinvested | 134,853 | 99,601 | 819,516 | 291,100 | ||||||||||||||||||||||||
Redeemed | (38,700 | ) | (54,115 | ) | (5,518,873 | ) | (2,336,503 | ) | ||||||||||||||||||||
|
|
|
|
|
|
|
| |||||||||||||||||||||
Change in Class I | 740,551 | 53,137 | 10,176,773 | 7,418,204 | ||||||||||||||||||||||||
|
|
|
|
|
|
|
| |||||||||||||||||||||
Class R6 | ||||||||||||||||||||||||||||
Reinvested | 68 | 57 | — | — | ||||||||||||||||||||||||
|
|
|
|
|
|
|
| |||||||||||||||||||||
Change in Class R6 | 68 | 57 | — | — | ||||||||||||||||||||||||
|
|
|
|
|
|
|
| |||||||||||||||||||||
Change in shares resulting from capital transactions | 741,426 | 51,805 | 10,368,767 | 7,524,337 | ||||||||||||||||||||||||
|
|
|
|
|
|
|
| |||||||||||||||||||||
7. Federal Income Taxes:
It is the policy of each Fund to continue to qualify as a regulated investment company by complying with the provisions available to certain investment companies, as defined under Subchapter M of the
63
NOTES TO FINANCIAL STATEMENTS
|
Internal Revenue Code, and to distribute substantially all of its net investment income and net realized capital gains. Therefore, no federal tax liability is recorded in the financial statements of each Fund.
For all open tax years and all major taxing jurisdictions, management of the Funds has concluded that there are no significant uncertain tax positions that would require recognition in the financial statements. Open tax years are those that are open for examination by taxing authorities (i.e., generally the last three tax year ends and the interim tax period since then). Furthermore, management of the Funds is also not aware of any tax positions for which it is reasonably possible that the total amounts of unrecognized tax benefits will significantly change in the next twelve months.
As of September 30, 2021, the tax cost of investments and the breakdown of unrealized appreciation (depreciation) for each Fund was as follows:
| Tax Cost Of Investments | Unrealized Appreciation | Unrealized Depreciation | Net Unrealized Appreciation/ (Depreciation) | |||||||||||||
Emerging Market Debt Fund | $ | 29,740,545 | $ | 482,979 | $ | (1,516,581 | ) | $ | (1,033,602 | ) | ||||||
High Yield Bond Fund | 237,298,973 | 5,383,447 | (1,215,505 | ) | 4,167,942 | |||||||||||
The difference between book basis and tax basis unrealized appreciation/depreciation is attributable primarily to the tax deferral of losses on wash sales, currency straddle losses, and mark to market on derivatives.
The tax character of distributions during the year ended September 30, 2021 were as follows:
| Distributions Paid From | ||||||||||||||||
| Ordinary Income | Net Long Term Capital Gains | Total Taxable Distributions | Total Distributions Paid | |||||||||||||
Emerging Market Debt Fund | $ | 1,357,918 | $ | — | $ | 1,357,918 | $ | 1,357,918 | ||||||||
High Yield Bond Fund | 10,742,064 | 13,651 | 10,755,715 | 10,755,715 | ||||||||||||
The tax character of distributions during the year ended September 30, 2020 were as follows:
| Distributions Paid From | ||||||||||||
| Ordinary Income | Total Taxable Distributions | Total Distributions Paid | ||||||||||
Emerging Market Debt Fund | $ | 1,006,414 | $ | 1,006,414 | $ | 1,006,414 | ||||||
High Yield Bond Fund | 3,300,758 | 3,300,758 | 3,300,758 | |||||||||
As of September 30, 2021, the components of accumulated earnings/(losses) on a tax basis were as follows:
| Emerging Market Debt Fund | High Yield Bond Fund | |||||||||||
Undistributed ordinary income | $ | 283,859 | $ | 4,577,920 | ||||||||
Undistributed long term gain | — | 545,897 | ||||||||||
|
|
|
| |||||||||
Accumulated earnings | 283,859 | 5,123,817 | ||||||||||
Accumulated capital loss carryforwards | (4,999,593) | — | ||||||||||
Unrealized appreciation/depreciation | (1,033,602) | 4,167,942 | ||||||||||
|
|
|
| |||||||||
Total Accumulated Earnings/(Losses) | $ | (5,749,336) | $ | 9,291,759 | ||||||||
|
|
|
| |||||||||
64
NOTES TO FINANCIAL STATEMENTS
|
During the year ended September 30, 2021, the Emerging Market Debt Fund utilized $354,240 of capital losses.
As of September 30, 2021, the Emerging Market Debt Fund had a short-term capital loss carryforward of $4,950,196 and a long-term capital loss carryforward of $49,397 available to offset future realized capital gains in accordance with the Regulated Investment Company Modernization Act of 2010. These capital loss carryforwards are not subject to expiration and must first be utilized to offset future realized gains of the same character.
Under current tax law, Post-October Capital Losses and Late-Year Ordinary Losses may be deferred and treated as occurring on the first business day of the following fiscal year for tax purposes.
8. Market Timing:
The Trust strongly discourages attempts at market timing by Fund shareholders. Prior to June 11, 2021, each Fund charged a redemption fee of 2% of the value of the shares redeemed or exchanged within 30 days of purchase. In addition, the Trust may limit the number of exchanges that may be made between Funds to five (5) per calendar year. When assessed, the redemption fee was deducted from the redemption proceeds and retained by the Fund, not by the Advisor. This redemption fee was not charged in cases where, for example, the redemption resulted from an automatic reinvestment or asset re-allocation not specifically directed by the shareholder. The Trust also reserves the right to reject any Fund purchase order made by persons deemed to be market timers. The Funds’ prospectus contains a full description of the Trust’s policies on market timing and/or excessive trading. The redemption fee is recorded as a credit to capital and is included in the capital transactions on the Statements of Changes in Net Assets.
During the year ended September 30, 2021, the following redemption fees were collected by the Funds.
| Redemption Fees | ||||
High Yield Bond Fund | $560 | |||
9. Commitments:
High Yield Bond Fund may invest in floating rate loan interests. In connection with these investments, High Yield Bond Fund may also enter into bridge loan commitments (“commitments”). Commitments may obligate High Yield Bond Fund to furnish temporary financing to a borrower until permanent financing can be arranged. As of September 30, 2021, High Yield Bond Fund had no outstanding commitments. In connection with these commitments, High Yield Bond Fund earns a commitment fee, typically set as a percentage of the commitment amount. Such fee income, which is included in interest income in the Statements of Operations, is recognized ratably over the commitment period.
10. Significant Risks
Shareholder concentration risk:
As of September 30, 2021, the following Funds had omnibus accounts which each owned more than 10% of a Fund’s outstanding shares as shown below:
| # of Omnibus Accounts | % of Fund | |||||||
High Yield Bond Fund | 1 | 39.7% | ||||||
In addition, three unaffiliated shareholders in aggregate owned 96.6% of the Emerging Market Debt Fund as of September 30, 2021. Significant transactions by these shareholders may impact the Fund’s performance.
Market risk:
One or more markets in which a Fund invests may go down in value, sometimes sharply and unpredictably, and the value of a Fund’s portfolio securities may fall or fail to rise. Market risk may affect a single issuer, sector of the economy, industry or the market as a whole. In addition, global
65
NOTES TO FINANCIAL STATEMENTS
|
economies and financial markets are becoming increasingly interconnected, and political, economic and other conditions and events (including, but not limited to, natural disasters, pandemics, epidemics, and social unrest) in one country, region, or financial market may adversely impact issuers in a different country, region or financial market. Furthermore, the occurrence of, among other events, natural or man-made disasters, severe weather or geological events, fires, floods, earthquakes, outbreaks of disease (such as COVID-19, avian influenza or H1N1/09), epidemics, pandemics, malicious acts, cyber-attacks, terrorist acts or the occurrence of climate change, may also adversely impact the performance of a Fund. Such events could adversely impact issuers, markets and economies over the short- and long-term, including in ways that cannot necessarily be foreseen. A Fund could be negatively impacted if the value of a portfolio holding were harmed by such political or economic conditions or events. Moreover, such negative political and economic conditions and events could disrupt the processes necessary for a Fund’s operations.
11. Subsequent Events:
Fund Management has evaluated the impact of all subsequent events on the Funds and has determined that there were no subsequent events requiring recognition or disclosure in the financial statements.
66
REPORT OF INDEPENDENT REGISTERED PUBLIC ACCOUNTING FIRM
|
To the Board of Trustees of RBC Funds Trust and Shareholders of RBC BlueBay Emerging Market Debt Fund and RBC BlueBay High Yield Bond Fund.
Opinions on the Financial Statements
We have audited the accompanying statements of assets and liabilities, including the schedules of portfolio investments, of RBC BlueBay Emerging Market Debt Fund and RBC BlueBay High Yield Bond Fund (two of the funds constituting RBC Funds Trust, hereafter collectively referred to as the “Funds”) as of September 30, 2021, the related statements of operations for the year ended September 30, 2021, the statements of changes in net assets for each of the two years in the period ended September 30, 2021, including the related notes, and the financial highlights for each of the periods indicated therein (collectively referred to as the “financial statements”). In our opinion, the financial statements present fairly, in all material respects, the financial position of each of the Funds as of September 30, 2021, the results of each of their operations for the year then ended, the changes in each of their net assets for each of the two years in the period ended September 30, 2021 and each of the financial highlights for each of the periods indicated therein in conformity with accounting principles generally accepted in the United States of America.
Basis for Opinions
These financial statements are the responsibility of the Funds’ management. Our responsibility is to express an opinion on the Funds’ financial statements based on our audits. We are a public accounting firm registered with the Public Company Accounting Oversight Board (United States) (PCAOB) and are required to be independent with respect to the Funds in accordance with the U.S. federal securities laws and the applicable rules and regulations of the Securities and Exchange Commission and the PCAOB.
We conducted our audits of these financial statements in accordance with the standards of the PCAOB. Those standards require that we plan and perform the audit to obtain reasonable assurance about whether the financial statements are free of material misstatement, whether due to error or fraud.
Our audits included performing procedures to assess the risks of material misstatement of the financial statements, whether due to error or fraud, and performing procedures that respond to those risks. Such procedures included examining, on a test basis, evidence regarding the amounts and disclosures in the financial statements. Our audits also included evaluating the accounting principles used and significant estimates made by management, as well as evaluating the overall presentation of the financial statements. Our procedures included confirmation of securities owned as of September 30, 2021 by correspondence with the custodian and brokers; when replies were not received from brokers, we performed other auditing procedures. We believe that our audits provide a reasonable basis for our opinions.
/s/PricewaterhouseCoopers LLP
Minneapolis, Minnesota
November 23, 2021
We have served as the auditor of one or more investment companies in the RBC Funds since 2016.
67
OTHER FEDERAL INCOME TAX INFORMATION (UNAUDITED)
|
For the year ended September 30, 2021, the following Funds had a qualified dividend income percentage of:
Qualified | ||||
High Yield Bond Fund | 0.08% | |||
For corporate shareholders, the following percentage of the total ordinary income distributions paid during the fiscal year ended September 30, 2021 qualify for the corporate dividends received deduction:
Dividends | ||||
High Yield Bond Fund | 0.08% | |||
For the year ended September 30, 2021, the following Funds had a qualified interest income percentage of:
Qualified | �� | |||
Emerging Market Debt Fund | 91.90% | |||
High Yield Bond Fund | 97.46% | |||
Pursuant to Internal Revenue Code Section 852(b)(3), the High Yield Bond Fund reported $559,548 as long-term capital gain distributions and qualified short-term capital gain distributions were 35.20% for the year ended September 30, 2021.
All reportings are based on financial information available as of the date of this annual report and, accordingly, are subject to change. For each item above, it is the intention of the Funds to report the maximum amount permitted under the Internal Revenue Code and the regulations thereunder.
68
|
Independent Trustees(1)(2)
Lucy Hancock Bode (70)
Position, Term of Office and Length of Time Served with the Trust: Trustee since January 2004
Principal Occupation(s) During Past 5 Years: Healthcare consultant (self-employed) (1986 to present)
Number of Portfolios in Fund Complex Overseen by Trustee: 18
Other Director/Trustee Positions Held by Trustee During Past 5 Years: Franklin Street Partners (2014 to present); BioSignia (2006 to 2010).
Leslie H. Garner Jr. (71)
Position, Term of Office and Length of Time Served with the Trust: Trustee since January 2004
Principal Occupation(s) During Past 5 Years: President and Chief Executive Officer, The Greater Cedar Rapids Community Foundation (2010 to present); President, Cornell College (1994 to 2010)
Number of Portfolios in Fund Complex Overseen by Trustee: 18
Other Director/Trustee Positions Held by Trustee During Past 5 Years: None
Phillip G. Goff. (58)
Position, Term of Office and Length of Time Served with the Trust: Trustee since January 2020
Principal Occupation(s) During Past 5 Years: Senior Vice President/Corporate Controller and Funds Treasurer, TIAA (October 2006-August 2017)
Number of Portfolios in Fund Complex Overseen by Trustee: 18
Other Director/Trustee Positions Held by Trustee During Past 5 Years: None
Ronald James (70)
Position, Term of Office and Length of Time Served with the Trust: Trustee since January 2004
Principal Occupation(s) During Past 5 Years: Faculty member (part time), University of St. Thomas (2004 to present), President and Chief Executive Officer, Center for Ethical Business Cultures (2000 to January 2017)
Number of Portfolios in Fund Complex Overseen by Trustee: 18
Other Director/Trustee Positions Held by Trustee During Past 5 Years: Bremer Financial Corporation (2004 to present); Greater Twin Cities United Way (2012 to 2020); Best Buy Co. Inc. (2004 to 2013)
John A. MacDonald (72)
Position, Term of Office and Length of Time Served with the Trust: Trustee since January 2004
Principal Occupation(s) During Past 5 Years: Vice President and Treasurer, Hall Family Foundation (1988 to 2020); Chief Investment Officer, Chinquapin Trust Company (1999 to 2020)
Number of Portfolios in Fund Complex Overseen by Trustee: 18
Other Director/Trustee Positions Held by Trustee During Past 5 Years: None
69
MANAGEMENT (UNAUDITED)
|
Independent Trustees(1)(2)
James R. Seward, CFA (69)
Position, Term of Office and Length of Time Served with the Trust: Chairman of the Board and Trustee since January 2004
Principal Occupation(s) During Past 5 Years: Private investor (2000 to present)
Number of Portfolios in Fund Complex Overseen by Trustee: 18
Other Director/Trustee Positions Held by Trustee During Past 5 Years: Sooner Holdings (formerly Syntroleum Corporation) (1988 to 2015); Brookdale Senior Living Inc. (2008 to 2019)
Interested Trustees(1)(2)(3)
Kathleen A. Gorman (57)(5)
Position, Term of Office and Length of Time Served with the Trust: Trustee since September 2012
Principal Occupation(s) During Past 5 Years: President and Chief Executive Officer, RBC Funds (2012 to present); Assistant Secretary (March 2018 to present); Chief Compliance Officer, RBC Funds (2006 to 2012)
Number of Portfolios in Fund Complex Overseen by Trustee: 18
Other Director/Trustee Positions Held by Trustee During Past 5 Years: None
70
MANAGEMENT (UNAUDITED)
|
Executive Officers(1)(3)(4)
Kathleen A. Gorman (57)
Position, Term of Office and Length of Time Served with the Trust: President and Chief Executive Officer since September 2012 and Assistant Secretary, (March 2018 to present)
Principal Occupation(s) During Past 5 Years: President and Chief Executive Officer, RBC Funds (2012 to present); Assistant Secretary, RBC Funds (March 2018 to present);Chief Compliance Officer, RBC Funds (2006 to 2012)
Kathleen A. Hegna (54)
Position, Term of Office and Length of Time Served with the Trust: Chief Financial Officer and Principal Accounting Officer since May 2009 and Treasurer since March 2014
Principal Occupation(s) During Past 5 Years: Associate Vice President and Director, Mutual Fund Services, RBC Global Asset Management (U.S.) Inc. (2009 to present)
Christina M. Weber (53)
Position, Term of Office and Length of Time Served with the Trust: Chief Compliance Officer since December 2012 and Secretary since September 2017
Principal Occupation(s) During Past 5 Years: Chief Compliance Officer, RBC Global Asset Management (U.S.) Inc. (June 2018 to present); Chief Compliance Officer, RBC Funds (2012 to present); Assistant Secretary, RBC Funds (2013 to 2017); Senior Compliance Officer, RBC Funds (March 2012 to December 2012)
| (1) | Except as otherwise noted, the address of each Trustee/Officer is RBC Funds Trust, 50 South Sixth Street, Suite 2350, Minneapolis, Minnesota 55402. |
| (2) | All Trustees must retire on or before December 31 of the year in which they reach age 75. The Board may temporarily waive this requirement when necessary to avoid depriving the Board of a Trustee with critical skills. |
| (3) | On December 31, 2009, Voyageur Asset Management Inc. changed its name to RBC Global Asset Management (U.S.) Inc. Any references to RBC Global Asset Management (U.S.) Inc. for prior periods are deemed to be references to the prior entity. |
| (4) | Each officer serves in such capacity for an indefinite period of time until his or her removal, resignation or retirement. |
| (5) | Kathleen A. Gorman has been determined to be an interested Trustee by virtue of her position with the Advisor. |
The Fund’s Statement of Additional Information includes information about the Funds’ Trustees. To receive your free copy of the Statement of Additional Information, call toll free: 1-800-422-2766.
71
SHARE CLASS INFORMATION (UNAUDITED)
|
The Funds offer Class A, Class I and Class R6 shares.
Class A
Class A shares are available in all Funds. This share class is available for purchase primarily through investment advisors, broker-dealers, banks and other financial services intermediaries. Class A shares of the Funds are currently subject to a maximum up-front sales charge of 4.25% and a 1.00% CDSC for redemption within 12 months of a $1 million or greater purchase. Class A shares currently include a 0.25% (25 bps) annual 12b-1 service and distribution fee.
Class I
Class I shares are available in all Funds. This share class is intended for investors meeting certain minimum investment thresholds. This share class does not have an up-front sales charge (load) or a 12b-1 service and distribution fee.
Class R6
Class R6 shares are available in Emerging Market Debt Fund. This share class is intended for investors meeting certain minimum investment thresholds. This share class does not have an up-front sales charge (load) or a 12b-1 service and distribution fee.
72
SUPPLEMENTAL INFORMATION (UNAUDITED)
|
Shareholder Expense Examples
As a shareholder of the RBC Funds, you incur two types of costs: (1) transaction costs and (2) ongoing costs, including management fees; and other Fund expenses. This example is intended to help you understand your ongoing costs (in dollars) of investing in the RBC Funds and to compare these costs with the ongoing costs of investing in other mutual funds.
The example is based on an investment of $1,000 invested at the beginning of the period and held for the entire period from April 1, 2021 through September 30, 2021.
Actual Expenses
The table below provides information about actual account values and actual expenses. You may use the information below, together with the amount you invested, to estimate the expenses that you paid over the period. Simply divide your account value by $1,000 (for example, an $8,600 account value divided by $1,000 = 8.6), then multiply the result by the number in the table under the heading entitled “Expenses Paid During Period” to estimate the expenses you paid on your account during this period.
| Beginning Account Value 4/1/21 | Ending Account Value 9/30/21 | Expenses Paid During Period* 4/1/21–9/30/21 | Annualized Expense Ratio During Period 4/1/21–9/30/21 | |||||||||||||||||
Emerging Market Debt Fund | ||||||||||||||||||||
| Class A | $1,000.00 | $1,032.10 | $5.30 | 1.04% | ||||||||||||||||
| Class I | 1,000.00 | 1,033.10 | 4.03 | 0.79% | ||||||||||||||||
| Class R6 | 1,000.00 | 1,033.40 | 3.77 | 0.74% | ||||||||||||||||
High Yield Bond Fund | ||||||||||||||||||||
| Class A | 1,000.00 | 1,026.00 | 4.16 | 0.82% | ||||||||||||||||
| Class I | 1,000.00 | 1,028.00 | 2.90 | 0.57% | ||||||||||||||||
*Expenses are equal to the average account value times the Fund’s annualized expense ratio multiplied by 183/365 (to reflect one half year period).
73
SUPPLEMENTAL INFORMATION (UNAUDITED)
|
Hypothetical Example for Comparison Purposes
The table below provides information about hypothetical account values and hypothetical expenses based on each RBC Funds’ actual expense ratio and an assumed rate of return of 5% per year before expenses, which is not the Fund’s actual return. The hypothetical account values and expenses may not be used to estimate the actual ending account balance or expenses you paid for the period. You may use this information to compare this 5% hypothetical example with the 5% hypothetical examples that appear in the shareholder reports of other funds.
Please note that the expenses shown in the table are meant to highlight your ongoing costs only and do not reflect any transactional costs, such as sales charges (loads), redemption fees, or exchange fees. Therefore, the table is useful in comparing ongoing costs only, and will not help you determine the relative total costs of owning different funds. In addition, if these transactional costs were included, your costs would have been higher.
| Beginning Account Value 4/1/21 | Ending Account Value 9/30/21 | Expenses Paid During Period* 4/1/21-9/30/21 | Annualized Expense Ratio During Period 4/1/21-9/30/21 | |||||||||||||||||
Emerging Market Debt Fund | ||||||||||||||||||||
| Class A | $1,000.00 | $1,019.85 | $5.27 | 1.04% | ||||||||||||||||
| Class I | 1,000.00 | 1,021.11 | 4.00 | 0.79% | ||||||||||||||||
| Class R6 | 1,000.00 | 1,021.36 | 3.75 | 0.74% | ||||||||||||||||
High Yield Bond Fund | ||||||||||||||||||||
| Class A | 1,000.00 | 1,020.96 | 4.15 | 0.82% | ||||||||||||||||
| Class I | 1,000.00 | 1,022.21 | 2.89 | 0.57% | ||||||||||||||||
*Expenses are equal to the average account value times the Fund’s annualized expense ratio multiplied by 183/365 (to reflect one half year period).
74
APPROVAL OF INVESTMENT ADVISORY AGREEMENT (UNAUDITED)
|
Information Regarding the Approval of Investment Advisory and Sub-Advisory Agreements
In September 2021, after evaluating the services provided by RBC Global Asset Management (U.S.) Inc. (the “Advisor”), BlueBay Asset Management USA LLC, and BlueBay Asset Management LLP (together, the “Sub-Advisors”) and reviewing the performance, fees, and expenses of the Funds, the RBC Funds Board of Trustees determined to approve the continuation of the investment advisory agreements with the Advisor and sub-advisory agreements with the Sub-Advisors (the investment advisory and subadvisory agreements, collectively, being the “Agreements”) for an additional year for each Fund. Additionally, the RBC Funds Board of Trustees also determined to approve a new investment advisory agreement (“New Agreement”) with the Advisor for two proposed new Funds, the RBC BlueBay Core Plus Bond Fund and the RBC BlueBay Strategic Income Fund (the “New Funds”).
As part of their review of the Agreements and the New Agreement, the Trustees requested and considered information regarding the advisory services performed by the Advisor and Sub-Advisors; the staffing and qualifications of the personnel responsible for operating and managing the Funds; and the Funds’ performance, fees, and expenses. With respect to the continuation of the Agreements, the Trustees considered information provided at regular quarterly Board and Committee meetings throughout the year as well as information presented at both a special meeting held to review requested material related to the proposed renewals and a regular meeting at which the proposed renewals were considered. The information included material provided by the Advisor, as well as reports prepared by Broadridge Financial Solutions, Inc., an independent statistical compilation company providing comparative fee and expense information and comparative performance information for the Funds.
In connection with their deliberations, the independent Trustees were advised by independent legal counsel with regard to the materials and their responsibilities under relevant laws and regulations.
The Trustees met with representatives from the Advisor’s senior management team, as well as senior investment professionals, to discuss the information and the ongoing management of the Funds. The Trustees reviewed the nature, quality, and extent of the services provided to the Funds by the Advisor and Sub-Advisors, including information as to each Fund’s performance relative to appropriate index benchmarks as well as Morningstar fund peer group comparative information requested by the Board.
The Trustees also reviewed the nature, quality, and extent of the services expected to be provided to the New Funds by the Advisor, which included anticipated benefits from the integration of the global fixed income platform. It was noted that both the RBC BlueBay High Yield Bond Fund and the RBC BlueBay Emerging Market Debt Fund continued to show long term performance above the median of their respective peer groups. The Trustees indicated that they continue to have confidence in the portfolio management teams of the Advisor and Sub-Advisors and continue to be satisfied with the nature, extent, and quality of the advisory and other services provided to the Funds.
In considering the nature and quality of services provided to the Funds, as well as those expected to be provided to the New Funds, the Trustees discussed the Advisor’s and Sub-Advisors’ strong research, credit, and fundamental analysis capabilities and specialized expertise in the area of emerging market debt instruments and absolute return strategies. The Trustees also considered the extensive portfolio management experience of the Sub-Advisors’ staff as well as its operational and compliance structure and systems, and the Advisor’s expertise in coordinating the investment management and related operations of the Funds.
The Trustees reviewed the investment advisory fees payable to the Advisor and subadvisory fees payable to the Sub-Advisors, as well as the proposed investment advisory fees for the New Funds, and reviewed comparative fee and expense information for similarly situated funds. The Trustees evaluated profitability data for the Advisor and Sub-Advisors and considered information regarding other benefits the Advisor and its affiliates derived from their relationships with the Funds, including any fall-out benefits. The Trustees also considered the Advisor’s contractual agreement to subsidize Fund expenses at competitive levels through expense limitation agreements and reviewed reductions in the advisory fee for the RBC BlueBay High Yield Bond Fund and the advisory fees and operating expense limits for the RBC BlueBay Emerging Market Debt Fund. Based upon their review, the Trustees determined that
75
APPROVAL OF INVESTMENT ADVISORY AGREEMENT (UNAUDITED)
|
the advisory fees proposed to be payable to the Advisor and Sub-Advisors were fair and reasonable in light of the level and quality of the services provided under all the circumstances and were within the range of what might have been negotiated at arms’ length.
Based upon their review, the Trustees determined that the nature and quality of the services provided by both the Advisor and Sub-Advisors were of a high quality and it is in the interests of the Funds and their shareholders for the Trustees to approve the Agreements and expense limitation arrangements for each Fund for an additional year as well as the New Agreement with respect to the New Funds. In arriving at their collective decision to approve the renewal of the Agreements as well as the initial approval of the New Agreement, the Trustees did not assign relative weights to the factors discussed above or deem any one or group of them to be controlling in and of itself.
76
|
This Page Intentionally Left Blank
77
|
This Page Intentionally Left Blank
78
|
This Page Intentionally Left Blank
79
|
This Page Intentionally Left Blank
80
|
RBC Funds
P.O. Box 701
Milwaukee, WI 53201-0701
800-422-2766
www.rbcgam.com
Performance data represents past performance and does not guarantee future results. The principal value of an investment and investment return will fluctuate so that an investor’s shares, when redeemed, may be worth more or less than their original cost.
This report and the financial statements contained herein are provided for the information of RBC Funds shareholders. This report is not authorized for distribution to prospective investors unless preceded or accompanied by a current prospectus, which contains information concerning investment objectives, risks, charges and expenses of the funds. Please read the prospectus carefully before investing.
This report and the financial statements contained herein are not intended to be a forecast of future events, a guarantee of future results, or investment advice. There is no assurance that certain securities will remain in or out of each fund’s portfolio. The views expressed in this report reflect those of the portfolio managers through the year ended September 30, 2021.
NOT FDIC INSURED • NO BANK GUARANTEE • MAY LOSE VALUE
RBC Global Asset Management (U.S.) Inc. serves as investment advisor for the RBC Funds. RBC Funds are distributed by Quasar Distributors LLC.
The RBC Funds are pleased to offer shareholder reports printed entirely on Forest Stewardship Council® certified paper. FSC® certification ensures that the paper used in this report contains fiber from well-managed and responsibly harvested forests that meet strict environmental and socioeconomic standards.
81
Annual Report For the year ended September 30, 2021 RBC SMID Cap Growth Fund RBC Enterprise Fund RBC Small Cap Core Fund RBC Microcap Value Fund RBC Small Cap Value Fund
|
| |||||||||
RBC Funds
| ||||||||||
About your Annual Report | This annual report includes detailed information about your Fund including financial statements, performance, and a complete list of its holdings.
The RBC Funds compare their performance against various indices. Each of these indices is a widely recognized measure of return for the underlying category of securities. However, the indices are unmanaged, do not include fees, and cannot be invested in directly. | |||||||||
| We hope the financial information presented will help you evaluate your investment in the RBC Funds. We also encourage you to read your Fund’s prospectus for further detail as to your Fund’s investment policies and risk profile. RBC Funds prospectuses and performance information subsequent to the date of this report are available on our website at www.rbcgam.com. |
| |||||||||
| A description of the policies and procedures that your Fund uses to determine how to vote proxies relating to portfolio securities is available (i) without charge, upon request, by calling 1-800-422-2766; (ii) on the Fund’s website at www.rbcgam.com; and (iii) on the Securities and Exchange Commission’s (the “Commission”) website at http://www.sec.gov. |
| |||||||||
| Each year the Trust files its proxy voting record for the twelve-month period ended June 30 with the SEC on Form N-PX no later than August 31. The records can be obtained on the SEC’s website at www.sec.gov and without charge by calling the Funds at 1-800-422-2766. |
| |||||||||
A schedule of each Fund’s portfolio holdings is filed with the Commission for the first and third quarters of each fiscal year on Form N-PORT. This information is available on the Commission’s website at http://www.sec.gov and on the Funds’ website at www.rbcgam.com.
|
| |||||||||
Table of |
| 1 | ||||||||
| Contents | 5 | |||||||||
| 7 | ||||||||||
| 12 | ||||||||||
| 14 | ||||||||||
| 16 | ||||||||||
| 18 | ||||||||||
| 20 | ||||||||||
| 22 | ||||||||||
| 45 | ||||||||||
| 49 | ||||||||||
| 51 | ||||||||||
| 56 | ||||||||||
| 66 | ||||||||||
| 80 | ||||||||||
| 81 | ||||||||||
| 83 | ||||||||||
| 86 | ||||||||||
| 87 | ||||||||||
| 89 | ||||||||||
1
LETTER FROM THE PORTFOLIO MANAGERS |
| |||||||||||||
Fund and Return (Class I, %) | Benchmark and Return (%) | |||||||||||||
RBC Microcap Value Fund | 59.69% | Russell Microcap Value Index | 76.83% | |||||||||||
RBC Enterprise Fund | 50.67 | Russell Microcap Index | 61.07 | |||||||||||
RBC Small Cap Value Fund | 43.48 | Russell 2000 Value Index | 63.92 | |||||||||||
| RBC Small Cap Core Fund | 43.46 | Russell 2000 Index | 47.68 | ||||||||||
RBC SMID Cap Growth Fund | 39.23 | Russell 2500 Growth Index | 31.98 | |||||||||||
As it had in the prior year, the economic backdrop provided significant support for equity markets and remains a significant factor in what we believe will support the next leg of the bull market. With the business cycle still fairly young we expect several additional years of economic expansion ahead. Notably on a top-line basis economic growth remains quite fast outside of when compared to the searing clip of the prior 12 months and to this end second quarter GDP growth – reported mid-way through the quarter in August – came in at a robust 6.7%. Underlying data also continued to support further economic expansion, and ultimately market advancement. The August ISM Manufacturing and Non-Manufacturing Report came in at 59.9% and 61.7% respectively, both indicative of further expected economic expansion on the horizon. From a labor market perspective, the economy added an average of 750,000 jobs per month in June, July, and August (though the August reading dropped markedly to just 235,000 new jobs) bringing the unemployment rate to 5.2%, its lowest level in more than a year and near economic “full” employment – defined as an unemployment rate of 5% or less. Along similar lines, consumers, the lynchpin of US economic growth (75% of GDP growth is driven by consumer spending) are in fantastic position to keep driving economic growth ahead as individual net worth’s are at all-time highs and fixed spending obligations (e.g. mortgage, car payment, etc) as a percentage of disposable income is at its lowest level in four decades. This confluence of consumer based factors has supported consumer confidence at close to its highest levels in the last twenty years. Adding to the positive market impact of economic growth, the corresponding surge in corporate profits, far surpassing pre-pandemic peaks, has added further fuel to the bull market of the past twelve months and is expected to continue.
Despite the clear green shoots for markets there are a host of risks that create potential headwinds going forward. At the forefront remains the ongoing impact of the COVID pandemic and potential for future flare-ups. While an increased wave of infections is unlikely to do as much damage as prior one’s the extremely contagious Delta variant coupled with vaccine resistance that will leave the US far short of herd immunity, makes the Coronavirus a risk that will remain front and center for quite some time. COVID concerns aside, the economy is slowing, albeit modestly, though this outcome was somewhat inevitable as the pace of growth over the last year has been nothing short of remarkable. That said, the additional impact of the potential early stages of withdrawal of monetary and fiscal policy support has investors fearing that the economic slowdown could be more severe than anticipated. Layer on top of this continued discord in Washington surrounding the pending debt ceiling and potential infrastructure spending bills and it’s not hard to see where a more pronounced economic slowdown could emerge. These broader headwinds, coupled with stock valuations at pretty lofty levels, make the potential for increased volatility nearly certain and deeper pullbacks imminently possible. That said, we continue to believe that on the back of continued company profit gains – the S&P 500 is on track for the most rapid profit recovery on record and expected to grow at an above average pace the
|
| |||||||||||||
2
LETTER FROM THE PORTFOLIO MANAGERS
| ||||
| next couple of years – and continued above average economic growth, a continuation of the bull market and significant market gains are attainable in both the near and longer term. As we have regularly noted in recent letters, this type of market volatility is challenging for even the most seasoned investors to stomach, let alone profit. While we believe that investors should not expect short-term forward returns to compound at the level seen in recent years, we continue to think that for those with a patient and well-considered investment plan, meaningful gains may be attained in the future. | ||||
| As always, thank you for your continued confidence and trust in the RBC Funds. | ||||
| Lance F. James | ||||
| Managing Director, Senior Portfolio Manager | ||||
| RBC Global Asset Management (U.S.) Inc. | ||||
| Kenneth A. Tyszko, CPA, CFA | ||||
| Managing Director, Senior Portfolio Manager | ||||
| RBC Global Asset Management (U.S.) Inc. | ||||
| Diversification does not assure a profit or protect against a loss in a declining market. | ||||
| Past performance is not a guarantee of future results. | ||||
| Mutual fund investing involves risk. Principal loss is possible. | ||||
| The S&P 500 is a market capitalization-weighted index that includes 500 leading companies and captures approximately 80% of available market capitalization. Its performance is widely regarded as representative of the U.S. equities market as a whole. | ||||
| The Russell 3000 Index is a market capitalization-weighted index that measures the performance of the 3,000 largest U.S. stocks and represents about 98% of the U.S. equity market. | ||||
| The Russell 1000 Index measures the performance of approximately 1,000 of the largest U.S. stocks and represents more than 90% of the U.S. equity market. | ||||
| The Russell 2000 Index measures the performance of the small capitalization segment of the U.S. equity market. It comprises approximately 2,000 small capitalization companies in the Russell 3000 Index. | ||||
| The Russell Midcap Index measures the performance of the mid capitalization segment of the U.S. equity market and includes the 800 smallest companies in the Russell 1000 Index. | ||||
| The Russell Microcap Index measures the performance of the micro capitalization segment of the U.S. equity market. It comprises the smallest 1,000 companies in the Russell 2000 Index plus 1,000 smaller U.S. equities. | ||||
| The Russell Microcap Growth Index includes those companies in the Russell Microcap Index that exhibit growth characteristics. | ||||
| The Russell 2000 Value Index measures the performance of the small capitalization value segment of the U.S. equity market. It includes those companies with lower price-to-book ratios and lower forecasted growth rates in the Russell 2000 Index. | ||||
| The Russell Microcap Value Index measures the performance of the micro capitalization value segment of the U.S. equity market. It includes those | ||||
3
LETTER FROM THE PORTFOLIO MANAGERS
| ||||||
| companies with lower price-to-book ratios and lower forecasted growth rates in the Russell Microcap Index. | ||||||
| The Russell 2500 Growth Index measures the performance of the small and mid capitalization growth segment of the U.S. equity market. It includes those companies with higher price-to-book ratios and higher forecasted growth rates in the Russell 2500 Index. | ||||||
| Institute of Supply Management (ISM) Manufacturing Index measures manufacturing production level changes on a month to month basis. | ||||||
Institute of Supply Management (ISM) Non-Manufacturing Index measures non-manufacturing production level changes on a month to month basis.
You cannot invest directly in an index. | ||||||
4
| ||||||
RBC Global Asset Management (U.S.) Inc. (“RBC GAM-US”) serves as the investment advisor to the RBC Funds. RBC GAM-US employs a team approach to the management of the Funds, with no individual team member being solely responsible for the investment decisions. | ||||||
Lance F. James Managing Director, Senior Portfolio Manager Lance James heads the team responsible for the Microcap Core/Enterprise, Small Cap Core, Small Cap Value and Mid Cap Value strategies at RBC GAM-US and is responsible for portfolio management of the RBC Small Cap Core Fund, RBC Enterprise Fund, RBC Microcap Value Fund, and RBC Small Cap Value Fund. Prior to joining RBC GAM-US in 2006, Lance was a research analyst and portfolio manager for OFI Institutional and Babson Capital Management, affiliated companies of Mass Mutual Life Insurance Company. During his tenure he served as head of the firm’s small/mid cap value investment team. Prior to joining Babson Capital in 1986, Lance worked at Rockwell International Corporation, EBF Associates of Boston and Hewitt Associates. Lance began his career in the investment industry in 1980. He received an AB in Economics from Princeton University and an MBA in Finance from the Wharton School of Business at the University of Pennsylvania. |
Lance F. James
| |||||
Kenneth A. Tyszko, CPA, CFA Managing Director, Senior Portfolio Manager Ken Tyszko is responsible for portfolio management of the RBC SMID Cap Growth Fund, and provides fundamental research and portfolio management for small, SMID and mid cap growth strategies at RBC GAM-US. Ken has been in the investment industry since 1984 and has been managing small cap growth and SMID cap growth portfolios since 1988. He joined RBC GAM-US in 2001. Ken previously served as a portfolio manager for Oberweis Asset Management, ABN AMRO Asset Management (USA) Inc., ABN AMRO Incorporated, and Sears Investment Management Company. His background also includes experience at Main Hurdman, an international accounting and consulting firm. Ken earned a BS in Accountancy from the University of Illinois. He is a CFA charterholder. Ken is a member of the Illinois CPA Society, the CFA Society of Chicago, and the CFA Institute. He has been a guest on Bloomberg Television, Bloomberg Radio, CNBC, and WebFN. |
Kenneth A. Tyszko, CPA, CFA
| |||||
Richard Drage, CPA, CFA Portfolio Manager Rich Drage serves as a portfolio manager for the RBC SMID Cap Growth Fund and provides fundamental research and portfolio management for the Small, SMID and Mid Cap Growth strategies at RBC GAM-US. Rich joined RBC GAM-US in 2009 from Susquehanna International Group, where he was a senior research analyst. Before that, he was a senior equity analyst at Neuberger Berman. Rich’s previous experience also includes various research and portfolio management responsibilities at Highbar Capital Management, Whitebox Advisors, Fasciano Company and First Analysis Corporation. He began his career in the investment industry in 1994. Rich earned a BA in Economics from Northwestern University and an MS in Accountancy from DePaul University. He is a CFA charterholder and member of the CFA Society of Chicago and the CFA Institute. |
Richard Drage, CPA, CFA
|


5
PORTFOLIO MANAGERS
| ||||||||
Eric Autio | Eric Autio Senior Equity Analyst/Portfolio Manager Eric Autio serves as a co-portfolio manager for the RBC Small Cap Value Fund and provides research and analysis for the Microcap Core, Small Cap Core, Small Cap Value and Mid Cap Value strategies at RBC GAM-US. Prior to joining RBC GAM-US in 2014, he was Senior Equity Analyst and Partner at Buckhead Capital Management where he served as an industry generalist on the small and SMID cap value team. Previously, Eric was Research Analyst and Vice President at SunTrust Robinson Humphrey covering a diverse range of sectors including retail, industrials and business services. He also served as Director with Carolinas Real Data, managing the company’s North Carolina commercial real estate research and software products portfolio, and worked in the Capital Management Group at Wells Fargo. Eric holds a B.A. from Davidson College and an M.B.A. from the Kellogg School of Management at Northwestern University. | |||||||

6
PERFORMANCE SUMMARY (UNAUDITED)
|
| 1 Year | 3 Year | 5 Year | 10 Year | Since Inception | Net Expense Ratio(a)(b) | Gross Expense Ratio(a)(b) | ||||||||||||||||||||||
Average Annual Total Returns as of September 30, 2021 (Unaudited) |
| |||||||||||||||||||||||||||
RBC SMID Cap Growth Fund(c)(d) |
| |||||||||||||||||||||||||||
Class A | ||||||||||||||||||||||||||||
- Including Max Sales Charge of 5.75% | 30.95 | % | 11.31 | % | 14.08 | % | 14.22 | % | 11.34 | % | ||||||||||||||||||
- At Net Asset Value | 38.95 | % | 13.54 | % | 15.44 | % | 14.90 | % | 11.56 | % | 1.07 | % | 1.26 | % | ||||||||||||||
Class I | ||||||||||||||||||||||||||||
- At Net Asset Value | 39.23 | % | 13.83 | % | 15.73 | % | 15.19 | % | 11.87 | % | 0.82 | % | 0.99 | % | ||||||||||||||
Class R6 | ||||||||||||||||||||||||||||
- At Net Asset Value | 39.36 | % | 13.88 | % | 15.79 | % | 15.31 | % | 12.11 | % | 0.77 | % | 19.28 | % | ||||||||||||||
Russell 2500 Growth Index(h) | 31.98 | % | 16.01 | % | 18.21 | % | 17.20 | % | 11.38 | % | ||||||||||||||||||
RBC Enterprise Fund(e)(f) | ||||||||||||||||||||||||||||
Class A(g) | ||||||||||||||||||||||||||||
- Including Max Sales Charge of 5.75% | 41.66 | % | 3.76 | % | 8.52 | % | 10.91 | % | 9.90 | % | ||||||||||||||||||
- At Net Asset Value | 50.27 | % | 5.83 | % | 9.81 | % | 11.57 | % | 10.07 | % | 1.33 | % | 2.15 | % | ||||||||||||||
Class I(g) | ||||||||||||||||||||||||||||
- At Net Asset Value | 50.67 | % | 6.08 | % | 10.09 | % | 11.84 | % | 10.34 | % | 1.08 | % | 1.25 | % | ||||||||||||||
Russell Microcap Index(h) | 61.07 | % | 12.23 | % | 14.47 | % | 15.42 | % | N/A | |||||||||||||||||||
RBC Small Cap Core Fund(i)(j) | ||||||||||||||||||||||||||||
Class A | ||||||||||||||||||||||||||||
- Including Max Sales Charge of 5.75% | 34.83 | % | 2.74 | % | 5.86 | % | 10.57 | % | 9.64 | % | ||||||||||||||||||
- At Net Asset Value | 43.04 | % | 4.79 | % | 7.13 | % | 11.22 | % | 9.86 | % | 1.15 | % | 1.52 | % | ||||||||||||||
Class I | ||||||||||||||||||||||||||||
- At Net Asset Value | 43.46 | % | 5.07 | % | 7.40 | % | 11.50 | % | 10.03 | % | 0.90 | % | 1.16 | % | ||||||||||||||
Class R6 | ||||||||||||||||||||||||||||
- At Net Asset Value | 43.52 | % | 5.05 | % | 7.40 | % | 11.54 | % | 10.39 | % | 0.87 | % | 1.25 | % | ||||||||||||||
Russell 2000 Index(h) | 47.68 | % | 10.54 | % | 13.45 | % | 14.63 | % | 10.30 | % | ||||||||||||||||||
RBC Microcap Value Fund(k)(l) | ||||||||||||||||||||||||||||
Class A | ||||||||||||||||||||||||||||
- Including Max Sales Charge of 5.75% | 50.15 | % | 6.03 | % | 8.79 | % | 12.63 | % | 9.14 | % | ||||||||||||||||||
- At Net Asset Value | 59.29 | % | 8.14 | % | 10.08 | % | 13.30 | % | 9.33 | % | 1.32 | % | 1.62 | % | ||||||||||||||
Class I | ||||||||||||||||||||||||||||
- At Net Asset Value | 59.69 | % | 8.41 | % | 10.36 | % | 13.58 | % | 9.61 | % | 1.07 | % | 1.19 | % | ||||||||||||||
Russell Microcap Value Index(h) | 76.83 | % | 11.43 | % | 14.34 | % | 15.41 | % | N/A | |||||||||||||||||||
7
PERFORMANCE SUMMARY (UNAUDITED)
| ||||||||||||||
| 1 Year | 3 Year | 5 Year | 10 Year | Since Inception | Net Expense Ratio(a)(b) | Gross Expense Ratio(a)(b) | ||||||||||||||||||||||
Average Annual Total Returns as of September 30, 2021 (Unaudited) |
| |||||||||||||||||||||||||||
RBC Small Cap Value Fund(m) |
| |||||||||||||||||||||||||||
Class A | ||||||||||||||||||||||||||||
- Including Max Sales Charge of 5.75% | 34.93 | % | 0.57 | % | 5.07 | % | N/A | 5.99 | % | |||||||||||||||||||
- At Net Asset Value | 43.15 | % | 2.57 | % | 6.32 | % | N/A | 6.91 | % | 1.10 | % | 37.36 | % | |||||||||||||||
Class I | ||||||||||||||||||||||||||||
- At Net Asset Value | 43.48 | % | 2.82 | % | 6.53 | % | N/A | 7.10 | % | 0.85 | % | 1.09 | % | |||||||||||||||
Class R6 | ||||||||||||||||||||||||||||
- At Net Asset Value | 43.64 | % | 2.89 | % | 6.61 | % | N/A | 7.17 | % | 0.80 | % | 1.03 | % | |||||||||||||||
Russell 2000 Value Index(h) | 63.92 | % | 8.58 | % | 11.03 | % | 13.22 | % | 9.44 | % | ||||||||||||||||||
Performance data quoted represents past performance. Past performance is no guarantee of future results. Investment return and principal value of an investment will fluctuate so that an investor’s shares, when redeemed, may be worth more or less than their original cost. Current performance may be lower or higher than performance quoted. Performance shown reflects contractual fee waivers, without such fee waivers total returns would be reduced. Performance information does not reflect the 2% fee on shares redeemed or exchanged within 30 days of purchase. If such redemption fee was included, performance would be reduced. For performance data current to the most recent month-end go to www.rbcgam.com. Please see footnotes below.
| (a) | The advisor has contractually agreed to waive fees and/or make payments in order to keep total operating expenses at annual ratios of 1.07% for Class A, 0.82% for Class I and 0.77% for Class R6 of SMID Cap Growth Fund; 1.33% for Class A and 1.08% for Class I of Enterprise Fund; 1.15% for Class A, 0.90% for Class I and 0.87% for Class R6 of Small Cap Core Fund; 1.32% for Class A and 1.07% for Class I of Microcap Value Fund; and 1.10% for Class A, 0.85% for Class I and 0.80% for Class R6 of Small Cap Value Fund until January 31, 2023. |
| (b) | The Funds’ expenses reflect the most recent fiscal year ended September 30, 2021. |
| (c) | The performance in the table for the period from June 1, 1994 to April 19, 2004 reflects the performance of RBC Mid Cap Equity Fund, the predecessor to RBC SMID Cap Growth Fund. The performance of the Fund also includes the performance of a common trust fund (“CTF”) account advised by RBC GAM-US (including its predecessor) and managed the same as the Fund in all material respects for the period from December 31, 1990 to June 1, 1994, as adjusted to reflect the full contractual rate of expenses associated with the Fund at its inception. The CTF account was not registered with the SEC under the 1940 Act and therefore was not subject to the investment restrictions imposed by law on registered mutual funds. If the CTF account had been registered, the CTF account’s performance may have been adversely affected. Fund performance reflects applicable fee waivers/expense reimbursements (which, if excluded, would cause performance to be lower). |
| (d) | The since inception date (commencement of operations) of the Fund is December 31, 1990 for Class I and Class A shares and November 21, 2016 for Class R6 shares. The performance in the table for the Class R6 shares prior to November 21, 2016 reflects the performance of the Class I shares since the Fund’s inception. |
| (e) | The performance in the table for the period from December 2, 1983 to April 19, 2004 reflects the performance of Babson Enterprise Fund, the predecessor to RBC Enterprise Fund. Fund performance reflects applicable fee waivers/expense reimbursements (which, if excluded, would cause performance to be lower). |
8
PERFORMANCE SUMMARY (UNAUDITED)
|
| (f) | The since inception date (commencement of operations) of the Fund is December 2, 1983. The performance of the index since inception of the Fund is calculated from November 30, 1983. |
| (g) | Performance shown for periods prior to the inception date of Class A (April 19, 2004) and Class I (September 30, 2004) is based on the performance of a class of shares that is no longer offered, adjusted to reflect the fees and expenses and any applicable sales charges of the applicable class. The inception date of the Fund and the prior class of shares is December 2, 1983. |
| (h) | Each of the comparative indices is a widely recognized market value weighted measure of the return of securities, but do not include sales fees or operating expenses. You cannot invest directly in indices. |
| (i) | The performance in the table for the period from August 5, 1991 to April 19, 2004 reflects the performance of Babson Enterprise Fund II, the predecessor to RBC Small Cap Core Fund. Fund performance reflects applicable fee waivers/expense reimbursements (which, if excluded, would cause performance to be lower). |
| (j) | The since inception date (commencement of operations) of the Fund is August 5, 1991 for Class I and Class A shares and November 21, 2016 for Class R6 shares. The performance in the table for the Class R6 shares prior to November 21, 2016 reflects the performance of the Class I shares since the Fund’s inception. The performance of the index since inception of the Fund is calculated from July 31, 1991. |
| (k) | The performance in the table for the period from September 10, 1987 to April 19, 2004 reflects the performance of Shadow Stock Fund, the predecessor to RBC Microcap Value Fund. Fund performance reflects applicable fee waivers/expense reimbursements (which, if excluded, would cause performance to be lower). |
| (l) | The since inception date (commencement of operations) of the Fund is September 10, 1987. The performance of the index since inception of the Fund is calculated from August 31, 1987. |
| (m) | The since inception date (commencement of operations) of the Fund is December 3, 2014 for Class I shares, November 21, 2016 for Class R6 shares and January 28, 2021 for Class A shares. The performance in the table for the Class R6 shares prior to November 21, 2016 and for Class A shares prior to January 28, 2021 reflects the performance of the Class I shares since the Fund’s inception. The performance of the index since inception of the Fund is calculated from December 3, 2014. |
9
PERFORMANCE SUMMARY (UNAUDITED)
|
The Russell 2000 Index measures the performance of the small capitalization segment of the U.S. equity market. It comprises approximately 2,000 small capitalization companies in the Russell 3000® Index. You cannot invest directly in an index.
The Russell 2000 Value Index measures the performance of the small capitalization value segment of the U.S. equity market. It includes those companies with lower price-to-book ratios and lower forecasted growth rates in the Russell 2000® Index.
The Russell Microcap Index measures the performance of the micro capitalization segment of the U.S. equity market. It comprises the smallest 1,000 companies in the Russell 2000 Index plus 1,000 smaller U.S. equities.
The Russell Microcap Value Index measures the performance of the micro capitalization value segment of the U.S. equity market. It includes those companies with lower price-to-book ratios and lower forecasted growth rates in the Russell Microcap® Index.
The Russell 2500 Growth Index measures the performance of the small and mid capitalization growth segment of the U.S. equity market. It includes those companies with higher price-to-book ratios and higher forecasted growth rates in the Russell 2500™ Index, which comprises the smallest 2,500 companies in the Russell 3000® Index.
You cannot invest directly in an index.
10
|
This Page Intentionally Left Blank
11
12
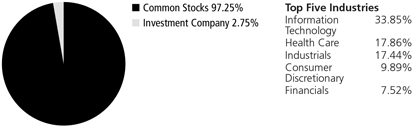

13
MANAGEMENT DISCUSSION AND ANALYSIS (UNAUDITED)
| ||||||||
| ||||||||
Investment Strategy | The Fund seeks to provide long-term growth of capital. It invests in profitable, established small companies that are dominant in their industries. By selecting undervalued companies with small market capitalizations, this Fund strives to achieve growth with greater price stability than many other small stock funds.
| |||||||
| Performance | For the twelve-month period ended September 30, 2021, the Fund had an annualized total return of 50.67% (Class I). That compares to an annualized total return of 61.07% for the Russell Microcap Index, the Fund’s primary benchmark.
| |||||||
Factors That Made Positive Contributions
| • An underweight relative to the index in the Health Care sector was the most positive performance factor for the Fund during the period.
• Favorable stock selection in the Energy sector was also a positive performance factor.
| |||||||
Factors That Detracted From Relative Returns | • Adverse stock selection in the Information Technology sector was the most important detractor from Fund relative performance over the period.
• Stock selection among Industrials stocks also hurt relative performance.
• A sector underweight compared to the index in Energy was the Fund’s most unfavorable sector allocation factor.
| |||||||
| Mutual fund investing involves risk. Principal loss is possible. The Fund invests in small and micro capitalization companies, which involve greater risks such as more volatility and less liquidity than larger companies. These risks are more fully described in the prospectus. | ||||||||
| The Russell Microcap Index measures the performance of the micro capitalization segment of the U.S. equity market. It comprises the smallest 1,000 companies in the Russell 2000 Index plus 1,000 smaller U.S. equities. You cannot invest directly in an index. | ||||||||
| Past performance is not a guarantee of future results. | ||||||||
| Fund holdings and/or sector allocations are subject to change and should not be considered a recommendation to buy or sell any security. Current and future holdings are subject to risk. For a complete list of Fund holdings please refer to the Schedule of Portfolio Investments included in this report. | ||||||||
14
MANAGEMENT DISCUSSION AND ANALYSIS (UNAUDITED)
| ||||||||||||||
RBC Enterprise Fund
| ||||||||||||||
Long-term growth of capital and income. | Investment | |||||||||||||
Objective
| ||||||||||||||
Russell Microcap Index
|
Benchmark | |||||||||||||
| Asset Allocation as of 9/30/21 (% of Fund’s investments) & Top Five Industries (as of 9/30/21) (% of Fund’s net assets) | |||||||||||||
Compass Diversified Holdings LP Columbus McKinnon Corp. Ducommun, Inc. Patrick Industries, Inc. ACCO Brands Corp. |
4.66% 4.62% 4.37% 4.37% 3.59% |
Malibu Boats, Inc. Delta Apparel, Inc. Universal Electronics, Inc. Gray Television, Inc. Magnolia Oil & Gas Corp. |
|
3.07% 2.98% 2.87% 2.86% 2.45% |
| Top Ten Holdings (excluding investment companies) (as of 9/30/21) (% of Fund’s net assets) | ||||||||
*A listing of all portfolio holdings can be found beginning on page 25
| ||||||||||||||
|
| Growth of $250,000 Initial Investment Over 10 Years | ||||||||||||
| The graph reflects an initial investment of $250,000 over 10 year period and is based on Class I shares. The Fund’s total return includes reinvested dividends and capital gains. The Fund’s total return also includes operating expenses that reduce return, while the total return of the index does not. The graph does not reflect the deduction of taxes that a shareholder would pay on fund distributions or redemption of fund shares. Performance of other classes will vary due to differences in fee structures. |
| |||||||||||||
| ||||||||||||||
| ||||||||||||||
| ||||||||||||||
| ||||||||||||||
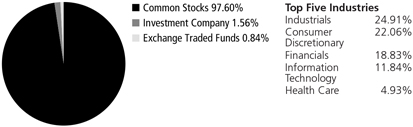
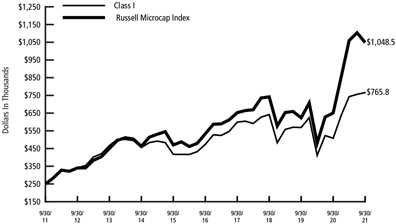
15
MANAGEMENT DISCUSSION AND ANALYSIS (UNAUDITED)
| ||||||||
| ||||||||
Investment Strategy | The Fund seeks to provide long-term growth of capital. It invests in profitable, established small companies that are dominant in their industries. By selecting undervalued growth companies with small to mid-size market capitalizations, this Fund strives to achieve growth with greater price stability than many other small stock funds.
| |||||||
| Performance | For the twelve-month period ended September 30, 2021, the Fund had an annualized total return of 43.46% (Class I). That compares to an annualized total return of 47.68% for the Russell 2000 Index, the Fund’s primary benchmark. | |||||||
Factors That Made Positive Contributions | • A sector underweight compared to the index in Health Care was the Fund’s most favorable sector allocation factor.
• Stock selection in the Industrials sector was also an important positive performance factor
| |||||||
Factors That Detracted From Relative Returns | • Adverse stock selection in the Consumer Discretionary sector was the most important detractor from Fund relative performance over the period.
• Stock selection among materials stocks, particularly chemical companies, also hurt relative performance.
• A sector underweight compared to the index in Energy was the Fund’s most unfavorable sector allocation factor.
| |||||||
| Mutual fund investing involves risk. Principal loss is possible. The fund invests in small capitalization companies, which involve greater risks such as more volatility and less liquidity than larger companies. These risks are more fully described in the prospectus. | ||||||||
| The Russell 2000 Index measures the performance of the small capitalization segment of the U.S. equity market. It comprises approximately 2,000 small capitalization companies in the Russell 3000® Index. You cannot invest directly in an index. | ||||||||
| Past performance is not a guarantee of future results. | ||||||||
| Fund holdings and/or sector allocations are subject to change and should not be considered a recommendation to buy or sell any security. Current and future holdings are subject to risk. For a complete list of Fund holdings please refer to the Schedule of Portfolio Investments included in this report. | ||||||||
16
MANAGEMENT DISCUSSION AND ANALYSIS (UNAUDITED)
| ||||||||||||||
RBC Small Cap Core Fund
| ||||||||||||||
Long-term growth of capital and income. | Investment | |||||||||||||
Objective
| ||||||||||||||
Russell 2000 Index
|
Benchmark | |||||||||||||
| Asset Allocation as of 9/30/21 (% of Fund’s investments) & Top Five Industries (as of 9/30/21) (% of Fund’s net assets) | |||||||||||||
Columbus McKinnon Corp. Compass Diversified Holdings LP SPDR S&P Biotech Atkore, Inc. Nexstar Media Group, Inc. | 4.17% 4.05% 3.44% 3.44% 3.35% | Magnolia Oil & Gas Corp. Patrick Industries, Inc. Malibu Boats, Inc. Ducommun, Inc. Greenbrier Cos., Inc. (The) | | 3.15% 3.15% 2.57% 2.34% 2.17% |
| Top Ten Holdings (excluding investment companies) (as of 9/30/21) (% of Fund’s net assets) | ||||||||
*A listing of all portfolio holdings can be found beginning on page 28
|
| |||||||||||||
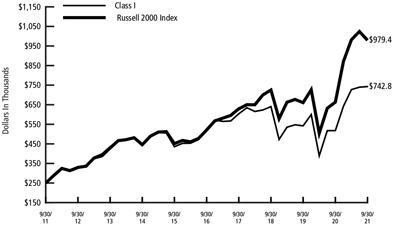 | Growth of $250,000 Initial Investment Over 10 Years | |||||||||||||
The graph reflects an initial investment of $250,000 over 10 year period and is based on Class I shares. The Fund’s total return includes reinvested dividends and capital gains. The Fund’s total return also includes operating expenses that reduce return, while the total return of the index does not. The graph does not reflect the deduction of taxes that a shareholder would pay on fund distributions or redemption of fund shares. Performance of other classes will vary due to differences in fee structures.
|
| |||||||||||||

17
MANAGEMENT DISCUSSION AND ANALYSIS (UNAUDITED)
| ||||||||
| ||||||||
Investment Strategy | The Fund seeks long-term growth of capital. It invests in a diversified portfolio of the smallest companies that have been neglected by institutional shareholders. Using a quantitative process to identify value-oriented investments, the Fund strives to achieve long-term growth while seeking to minimize the effects of market declines and fluctuations. | |||||||
| Performance | For the twelve-month period ended September 30, 2021, the Fund had an annualized total return of 59.69% (Class I). That compares to an annualized total return of 76.83% for the Russell Microcap Value Index, the Fund’s primary benchmark. | |||||||
Factors That Made Positive Contributions | • An underweight in the Health Care sector compared to the index was the most favorable relative performance factor over the period.
• Favorable stock selection in the Utilities sector also boosted performance.
| |||||||
Factors That Detracted From Relative Returns | • Adverse stock selection in the Consumer Discretionary sector was the most important detractor from Fund relative performance over the period.
• Stock selection among Materials stocks also hurt relative Fund performance.
• A sector overweight compared to the index in Utilities was the Fund’s most unfavorable sector allocation factor.
| |||||||
| Mutual fund investing involves risk. Principal loss is possible. The Fund invests in small and micro capitalization companies, which involve greater risks such as more volatility and less liquidity than larger companies. These risks are more fully described in the prospectus. | ||||||||
| The Russell Microcap Value Index measures the performance of the micro capitalization value segment of the U.S. equity market. It includes those companies with lower price-to-book ratios and lower forecasted growth rates in the Russell Microcap® Index, which comprises the smallest 1,000 companies in the Russell 2000® Index plus 1,000 smaller U.S. equities. You cannot invest directly in an index. | ||||||||
| Past performance is not a guarantee of future results. | ||||||||
| Fund holdings and/or sector allocations are subject to change and should not be considered a recommendation to buy or sell any security. Current and future holdings are subject to risk. For a complete list of Fund holdings please refer to the Schedule of Portfolio Investments included in this report. | ||||||||
18
MANAGEMENT DISCUSSION AND ANALYSIS (UNAUDITED)
| ||||||||||||||
RBC Microcap Value Fund
| ||||||||||||||
Long-term growth of capital.
| Investment Objective | |||||||||||||
Russell Microcap Value Index
| Benchmark
| |||||||||||||
|
| Asset Allocation as of 9/30/21 (% of Fund’s investments) & Top Five Industries (as of 9/30/21) (% of Fund’s net assets) | ||||||||||||
iShares Russell Microcap Index Fund Ducommun, Inc. Premier Financial Corp. Ameresco, Inc. CAI International, Inc. | 2.72% 1.10% 1.09% 1.04% 0.94% | HCI Group, Inc. Federal Agricultural Mortgage Corp. Lydall, Inc. MarineMax, Inc. Regional Management Corp. | | 0.93% 0.90% 0.85% 0.85% 0.84% |
| Top Ten Holdings (excluding investment companies) (as of 9/30/21) (% of Fund’s net assets) | ||||||||
*A listing of all portfolio holdings can be found beginning on page 31
|
| |||||||||||||
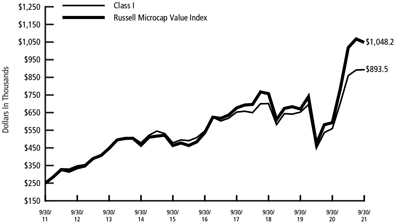 |
| Growth of $250,000 Initial Investment Over 10 Years | ||||||||||||
| The graph reflects an initial investment of $250,000 over 10 year period and is based on Class I shares. The Fund’s total return includes reinvested dividends and capital gains. The Fund’s total return also includes operating expenses that reduce return, while the total return of the index does not. The graph does not reflect the deduction of taxes that a shareholder would pay on fund distributions or redemption of fund shares. Performance of other classes will vary due to differences in fee structures. |
| |||||||||||||
| ||||||||||||||
| ||||||||||||||
| ||||||||||||||
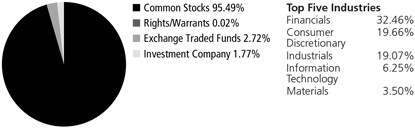
19
MANAGEMENT DISCUSSION AND ANALYSIS (UNAUDITED)
| ||||||||
| ||||||||
Investment Strategy | The Fund seeks long-term capital appreciation. It normally invests at least 80% of its assets in common stocks of small companies that are considered to be undervalued in relation to earnings, dividends and/or assets. Small companies are defined by the Fund as companies that fall within the market capitalization range of the Russell 2000 Value Index at the time of purchase.
| |||||||
| Performance | For the twelve-month period ended September 30, 2021, the Fund had an annualized total return of 43.48% (Class I). That compares to an annualized total return of 63.92% for the Russell 2000 Value Index, the Fund’s primary benchmark.
| |||||||
Factors That Made Positive Contributions
| • Favorable stock selection in the Financial sector contributed positively to Fund performance during the period.
• A sector underweight compared to the index in Health Care and Utilities also boosted relative Fund performance.
| |||||||
Factors That Detracted From Relative Returns | • Adverse stock selection in the Consumer Discretionary sector was the most important detractor from Fund relative performance over the period.
• Unfavorable Industrials stock selection also hurt relative performance.
• A sector underweight compared to the index in Energy was the Fund’s most unfavorable sector allocation factor.
| |||||||
| Mutual fund investing involves risk. Principal loss is possible. The Fund invests in small capitalization companies, which involve greater risks such as more volatility and less liquidity than larger companies. The Fund invests in value stocks, which may not increase in price as anticipated by the Adviser if they fall out of favor with investors or the markets favor faster growing companies. These risks are described more fully in the prospectus. | ||||||||
| The Russell 2000 Value Index measures the performance of the small capitalization value segment of the U.S. equity market. It includes those companies with lower price-to-book ratios and lower forecasted growth rates in the Russell 2000® Index, which comprises approximately 2,000 small capitalization companies in the Russell 3000® Index. You cannot invest directly in an index. | ||||||||
| Past performance is not a guarantee of future results. | ||||||||
| Fund holdings and/or sector allocations are subject to change and should not be considered a recommendation to buy or sell any security. Current and future holdings are subject to risk. For a complete list of Fund holdings please refer to the Schedule of Portfolio Investments included in this report. | ||||||||
20
MANAGEMENT DISCUSSION AND ANALYSIS (UNAUDITED)
| ||||||||||||||||
RBC Small Cap Value Fund
| ||||||||||||||||
Long-term capital appreciation. | Investment | |||||||||||||||
Objective
| ||||||||||||||||
Russell 2000 Value Index
|
Benchmark | |||||||||||||||
|
| Asset Allocation as of 9/30/21 (% of Fund’s investments) & Top Five Industries (as of 9/30/21) (% of Fund’s net assets) | ||||||||||||||
United Community Banks, Inc. Atkore, Inc. Builders FirstSource, Inc. Compass Diversified Holdings LP Columbus McKinnon Corp. | | 3.51% 3.10% 3.06% 2.93% 2.89% |
| Magnolia Oil & Gas Corp. Nexstar Media Group, Inc. ACCO Brands Corp. DiamondRock Hospitality Co. Patrick Industries, Inc. | | 2.78% 2.40% 2.39% 2.33% 2.07% |
| Top Ten Holdings (excluding investment companies) (as of 9/30/21) (% of | ||||||||
| *A listing of all portfolio holdings can be found beginning on page 42 | Fund’s net assets)
| |||||||||||||||
|
| Growth of $100,000 Initial Investment Since Inception (12/3/14) | ||||||||||||||
The graph reflects an initial investment of $100,000 over the period from December 3, 2014 (commencement of operations) to September 30, 2021 and is based on Class I shares. The Fund’s total return includes reinvested dividends and capital gains. The Fund’s total return also includes operating expenses that reduce return, while the total return of the index does not. The graph does not reflect the deduction of taxes that a shareholder would pay on fund distributions or redemption of fund shares. Performance of other classes will vary due to differences in fee structures.
|
| |||||||||||||||
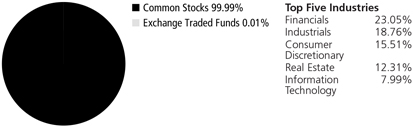
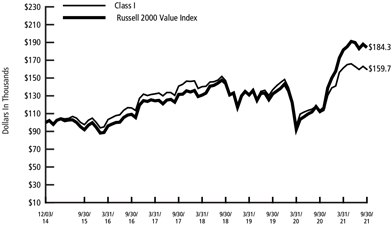
21
SCHEDULE OF PORTFOLIO INVESTMENTS
|
RBC SMID Cap Growth Fund
September 30, 2021
| Shares | Value | |||||
Common Stocks — 98.78% | ||||||
Communication Services — 2.79% | ||||||
| 10,497 | Nexstar Media Group, Inc., Class A | $ | 1,595,124 | |||
| 40,518 | PubMatic, Inc., Class A* | 1,067,649 | ||||
|
| |||||
| 2,662,773 | ||||||
|
| |||||
Consumer Discretionary — 9.89% | ||||||
| 12,369 | Columbia Sportswear Co. | 1,185,445 | ||||
| 13,222 | Dorman Products, Inc.* | 1,251,727 | ||||
| 17,199 | Gentherm, Inc.* | 1,391,915 | ||||
| 41,425 | G-III Apparel Group Ltd.* | 1,172,328 | ||||
| 11,386 | Installed Building Products, Inc. | 1,220,010 | ||||
| 9,618 | LCI Industries | 1,294,871 | ||||
| 13,210 | Ollie’s Bargain Outlet Holdings, Inc.* | 796,299 | ||||
| 12,540 | Texas Roadhouse, Inc. | 1,145,278 | ||||
|
| |||||
| 9,457,873 | ||||||
|
| |||||
Consumer Staples — 2.20% | ||||||
| 7,435 | Casey’s General Stores, Inc. | 1,401,126 | ||||
| 15,051 | Performance Food Group Co.* | 699,269 | ||||
|
| |||||
| 2,100,395 | ||||||
|
| |||||
Financials — 7.52% | ||||||
| 15,342 | Eagle Bancorp, Inc. | 882,165 | ||||
| 13,486 | FirstCash, Inc. | 1,180,025 | ||||
| 7,757 | Kinsale Capital Group, Inc. | 1,254,307 | ||||
| 23,355 | PRA Group, Inc.* | 984,180 | ||||
| 22,258 | Raymond James Financial, Inc. | 2,053,922 | ||||
| 8,349 | RLI Corp. | 837,154 | ||||
|
| |||||
| 7,191,753 | ||||||
|
| |||||
Health Care — 17.86% | ||||||
| 5,420 | Bio-Techne Corp. | 2,626,369 | ||||
| 14,977 | Haemonetics Corp.* | 1,057,227 | ||||
| 17,504 | HealthEquity, Inc.* | 1,133,559 | ||||
| 17,150 | Henry Schein, Inc.* | 1,306,144 | ||||
| 40,781 | Inovalon Holdings, Inc., Class A* | 1,643,067 | ||||
| 13,400 | Integer Holdings Corp.* | 1,197,156 | ||||
| 20,145 | Integra LifeSciences Holdings Corp.* | 1,379,530 | ||||
| 29,758 | Merit Medical Systems, Inc.* | 2,136,624 | ||||
| 18,767 | NuVasive, Inc.* | 1,123,205 | ||||
| 7,380 | Omnicell, Inc.* | 1,095,413 | ||||
| 21,842 | Prestige Consumer Healthcare, Inc.* | 1,225,555 | ||||
| 9,580 | Tandem Diabetes Care, Inc.* | 1,143,660 | ||||
|
| |||||
| 17,067,509 | ||||||
|
| |||||
Industrials — 17.44% | ||||||
| 28,254 | Ameresco, Inc., Class A* | 1,650,881 | ||||
| 15,183 | Applied Industrial Technologies, Inc. | 1,368,444 | ||||
| 11,070 | ASGN, Inc.* | 1,252,460 | ||||
22
SCHEDULE OF PORTFOLIO INVESTMENTS
|
RBC SMID Cap Growth Fund (cont.)
September 30, 2021
| Shares | Value | |||||
| 4,800 | CACI International, Inc., Class A* | $ | 1,258,080 | |||
| 10,979 | ESCO Technologies, Inc. | 845,383 | ||||
| 12,239 | Helios Technologies, Inc. | 1,004,944 | ||||
| 21,943 | IAA, Inc.* | 1,197,430 | ||||
| 14,922 | ICF International, Inc. | 1,332,385 | ||||
| 7,737 | Landstar System, Inc. | 1,221,053 | ||||
| 22,254 | Mercury Systems, Inc.* | 1,055,285 | ||||
| 10,401 | MSC Industrial Direct Co., Inc., Class A | 834,056 | ||||
| 26,415 | TriMas Corp.* | 854,789 | ||||
| 14,319 | Westinghouse Air Brake Technologies Corp. | 1,234,441 | ||||
| 13,759 | Woodward, Inc. | 1,557,519 | ||||
|
| |||||
| 16,667,150 | ||||||
|
| |||||
Information Technology — 33.85% | ||||||
| 16,167 | Altair Engineering, Inc., Class A* | 1,114,553 | ||||
| 11,723 | Badger Meter, Inc. | 1,185,664 | ||||
| 12,679 | Bottomline Technologies (DE), Inc.* | 498,031 | ||||
| 18,081 | Brooks Automation, Inc. | 1,850,590 | ||||
| 11,390 | Cerence, Inc.* | 1,094,693 | ||||
| 26,996 | Cohu, Inc.* | 862,252 | ||||
| 8,799 | CyberArk Software Ltd.* | 1,388,658 | ||||
| 20,269 | Diodes, Inc.* | 1,836,169 | ||||
| 17,441 | Envestnet, Inc.* | 1,399,466 | ||||
| 13,304 | ePlus, Inc.* | 1,365,124 | ||||
| 42,804 | Evo Payments, Inc., Class A* | 1,013,599 | ||||
| 14,675 | ExlService Holdings, Inc.* | 1,806,786 | ||||
| 4,255 | F5 Networks, Inc.* | 845,809 | ||||
| 6,536 | Globant SA* | 1,836,681 | ||||
| 8,162 | Jack Henry & Associates, Inc. | 1,339,058 | ||||
| 4,878 | Littelfuse, Inc. | 1,333,011 | ||||
| 9,723 | Manhattan Associates, Inc.* | 1,487,911 | ||||
| 19,417 | Mimecast Ltd.* | 1,234,921 | ||||
| 11,736 | Novanta, Inc.* | 1,813,212 | ||||
| 14,060 | Onto Innovation, Inc.* | 1,015,835 | ||||
| 14,050 | Plexus Corp.* | 1,256,211 | ||||
| 8,470 | Silicon Laboratories, Inc.* | 1,187,155 | ||||
| 13,552 | SPS Commerce, Inc.* | 2,186,073 | ||||
| 7,973 | WEX, Inc.* | 1,404,364 | ||||
|
| |||||
| 32,355,826 | ||||||
|
| |||||
Materials — 5.11% | ||||||
| 9,435 | AptarGroup, Inc. | 1,126,067 | ||||
| 8,888 | Balchem Corp. | 1,289,382 | ||||
| 19,763 | HB Fuller Co. | 1,275,900 | ||||
| 8,362 | Reliance Steel & Aluminum Co. | 1,190,916 | ||||
|
| |||||
| 4,882,265 | ||||||
|
| |||||
23
SCHEDULE OF PORTFOLIO INVESTMENTS
|
RBC SMID Cap Growth Fund (cont.)
September 30, 2021
| Shares | Value | |||||
Real Estate — 2.12% | ||||||
| 5,469 | CoreSite Realty Corp., REIT | $ | 757,675 | |||
| 11,144 | Lamar Advertising Co., REIT, Class A | 1,264,287 | ||||
|
| |||||
| 2,021,962 | ||||||
|
| |||||
Total Common Stocks | 94,407,506 | |||||
|
| |||||
(Cost $68,121,399) | ||||||
Investment Company — 2.79% | ||||||
| 2,671,799 | U.S. Government Money Market Fund, RBC Institutional Class 1(a) | 2,671,799 | ||||
|
| |||||
Total Investment Company | 2,671,799 | |||||
|
| |||||
(Cost $2,671,799) | ||||||
Total Investments | $ | 97,079,305 | ||||
(Cost $70,793,198)(b) — 101.57% | ||||||
Liabilities in excess of other assets — (1.57)% | (1,501,680) | |||||
|
| |||||
NET ASSETS — 100.00% | $ | 95,577,625 | ||||
|
| |||||
| * | Non-income producing security. |
| (a) | Affiliated investment. |
| (b) | See Notes to Schedules of Portfolio Investments for the tax cost of securities and the breakdown of unrealized appreciation (depreciation). |
Abbreviations used are defined below:
REIT - Real Estate Investment Trust
See Notes to the Financial Statements.
24
SCHEDULE OF PORTFOLIO INVESTMENTS
|
RBC Enterprise Fund
September 30, 2021
| Shares | Value | |||||
Common Stocks — 97.73% | ||||||
Communication Services — 2.86% | ||||||
| 93,662 | Gray Television, Inc. | $ | 2,137,367 | |||
|
| |||||
Consumer Discretionary — 22.06% | ||||||
| 81,667 | Delta Apparel, Inc.* | 2,230,326 | ||||
| 201,530 | Destination XL Group, Inc.* | 1,233,363 | ||||
| 28,800 | G-III Apparel Group Ltd.* | 815,040 | ||||
| 5,300 | Grand Canyon Education, Inc.* | 466,188 | ||||
| 39,853 | Lakeland Industries, Inc.* | 836,913 | ||||
| 46,880 | Lazydays Holdings, Inc.* | 1,000,419 | ||||
| 32,764 | Malibu Boats, Inc., Class A* | 2,292,825 | ||||
| 78,700 | ONE Group Hospitality, Inc. (The)* | 841,303 | ||||
| 39,213 | Patrick Industries, Inc. | 3,266,443 | ||||
| 24,760 | Ruth’s Hospitality Group, Inc.* | 512,780 | ||||
| 61,320 | Tilly’s, Inc., Class A | 859,093 | ||||
| 43,550 | Universal Electronics, Inc.* | 2,144,837 | ||||
|
| |||||
| 16,499,530 | ||||||
|
| |||||
Consumer Staples — 2.04% | ||||||
| 9,280 | John B Sanfilippo & Son, Inc. | 758,362 | ||||
| 11,770 | MGP Ingredients, Inc. | 766,227 | ||||
|
| |||||
| 1,524,589 | ||||||
|
| |||||
Energy — 3.61% | ||||||
| 103,170 | Magnolia Oil & Gas Corp., Class A | 1,835,394 | ||||
| 55,040 | Par Pacific Holdings, Inc.* | 865,229 | ||||
|
| |||||
| 2,700,623 | ||||||
|
| |||||
Financials — 18.83% | ||||||
| 30,140 | Allegiance Bancshares, Inc. | 1,149,841 | ||||
| 26,400 | Amerisafe, Inc. | 1,482,624 | ||||
| 123,778 | Compass Diversified Holdings LP | 3,486,826 | ||||
| 20,770 | First Bancorp/Southern Pines, NC | 893,318 | ||||
| 33,650 | German American Bancorp, Inc. | 1,299,900 | ||||
| 16,000 | Heritage Financial Corp., WA | 408,000 | ||||
| 23,766 | Mercantile Bank Corp. | 761,225 | ||||
| 27,630 | Northrim BanCorp, Inc. | 1,174,551 | ||||
| 17,080 | Preferred Bank/Los Angeles, CA | 1,138,894 | ||||
| 23,110 | Stock Yards Bancorp, Inc. | 1,355,401 | ||||
| 9,320 | Triumph Bancorp, Inc.* | 933,212 | ||||
|
| |||||
| 14,083,792 | ||||||
|
| |||||
Health Care — 4.93% | ||||||
| 41,060 | Inotiv, Inc.* | 1,200,595 | ||||
| 39,690 | Invacare Corp.* | 188,924 | ||||
25
SCHEDULE OF PORTFOLIO INVESTMENTS
|
RBC Enterprise Fund (cont.)
September 30, 2021
| Shares | Value | |||||
| 48,840 | Lantheus Holdings, Inc.* | $ | 1,254,211 | |||
| 18,830 | Surmodics, Inc.* | 1,046,948 | ||||
|
| |||||
| 3,690,678 | ||||||
|
| |||||
Industrials — 24.91% | ||||||
| 312,210 | ACCO Brands Corp. | 2,681,884 | ||||
| 13,245 | Allied Motion Technologies, Inc. | 414,304 | ||||
| 13,630 | Barrett Business Services, Inc. | 1,039,424 | ||||
| 8,248 | Casella Waste Systems, Inc.* | 626,353 | ||||
| 28,880 | CBIZ, Inc.* | 933,979 | ||||
| 71,542 | Columbus McKinnon Corp. | 3,459,056 | ||||
| 64,888 | Ducommun, Inc.* | 3,267,111 | ||||
| 31,496 | Greenbrier Cos., Inc. (The) | 1,354,013 | ||||
| 42,920 | Insteel Industries, Inc. | 1,633,106 | ||||
| 16,099 | Marten Transport Ltd. | 252,593 | ||||
| 14,000 | Miller Industries, Inc. | 476,560 | ||||
| 10,780 | Northwest Pipe Co.* | 255,486 | ||||
| 14,503 | NV5 Global, Inc.* | 1,429,561 | ||||
| 4,000 | Standex International Corp. | 395,640 | ||||
| 11,599 | Willdan Group, Inc.* | 412,808 | ||||
|
| |||||
| 18,631,878 | ||||||
|
| |||||
Information Technology — 11.84% | ||||||
| 80,830 | AXT, Inc.* | 673,314 | ||||
| 35,310 | Cohu, Inc.* | 1,127,801 | ||||
| 64,270 | Mitek Systems, Inc.* | 1,188,995 | ||||
| 13,400 | Model N, Inc.* | 448,900 | ||||
| 36,700 | Napco Security Technologies, Inc.* | 1,581,036 | ||||
| 8,913 | Novanta, Inc.* | 1,377,058 | ||||
| 8,662 | PC Connection, Inc. | 381,388 | ||||
| 40,226 | Sapiens International Corp. NV | 1,157,704 | ||||
| 26,515 | Vishay Precision Group, Inc.* | 921,927 | ||||
|
| |||||
| 8,858,123 | ||||||
|
| |||||
Materials — 3.69% | ||||||
| 77,149 | FutureFuel Corp. | 550,072 | ||||
| 32,837 | Koppers Holdings, Inc.* | 1,026,485 | ||||
| 16,510 | UFP Technologies, Inc.* | 1,016,851 | ||||
| 15,878 | Universal Stainless & Alloy Products, Inc.* | 164,496 | ||||
|
| |||||
| 2,757,904 | ||||||
|
| |||||
Real Estate — 2.55% | ||||||
| 11,200 | Community Healthcare Trust, Inc., REIT | 506,128 | ||||
| 61,200 | UMH Properties, Inc., REIT | 1,401,480 | ||||
|
| |||||
| 1,907,608 | ||||||
|
| |||||
26
SCHEDULE OF PORTFOLIO INVESTMENTS
|
RBC Enterprise Fund (cont.)
September 30, 2021
| Shares | Value | |||||
Utilities — 0.41% | ||||||
| 7,110 | Unitil Corp. | $ | 304,166 | |||
|
| |||||
Total Common Stocks | 73,096,258 | |||||
|
| |||||
(Cost $39,640,453) | ||||||
Exchange Traded Funds — 0.84% | ||||||
| 3,900 | iShares Biotechnology | 630,552 | ||||
|
| |||||
Total Exchange Traded Funds | 630,552 | |||||
|
| |||||
(Cost $424,100) | ||||||
Investment Company — 1.56% | ||||||
| 1,166,286 | U.S. Government Money Market Fund, RBC Institutional Class 1(a) | 1,166,286 | ||||
|
| |||||
Total Investment Company | 1,166,286 | |||||
|
| |||||
(Cost $1,166,286) | ||||||
Total Investments | $ | 74,893,096 | ||||
(Cost $41,230,839)(b) — 100.13% | ||||||
Liabilities in excess of other assets — (0.13)% | (94,104) | |||||
|
| |||||
NET ASSETS — 100.00% | $ | 74,798,992 | ||||
|
| |||||
| * | Non-income producing security. |
| (a) | Affiliated investment. |
| (b) | See Notes to Schedules of Portfolio Investments for the tax cost of securities and the breakdown of unrealized appreciation (depreciation). |
Abbreviations used are defined below:
REIT - Real Estate Investment Trust
See Notes to the Financial Statements.
27
SCHEDULE OF PORTFOLIO INVESTMENTS
|
RBC Small Cap Core Fund
September 30, 2021
| Shares | Value | |||||
Common Stocks — 95.36% | ||||||
Communication Services — 3.35% | ||||||
| 14,574 | Nexstar Media Group, Inc., Class A | $ | 2,214,665 | |||
|
| |||||
Consumer Discretionary — 20.67% | ||||||
| 30,760 | 1-800-Flowers.com, Inc., Class A* | 938,488 | ||||
| 37,776 | Callaway Golf Co.* | 1,043,751 | ||||
| 1,761 | Deckers Outdoor Corp.* | 634,312 | ||||
| 5,830 | Fox Factory Holding Corp.* | 842,668 | ||||
| 22,183 | G-III Apparel Group Ltd.* | 627,779 | ||||
| 5,022 | Grand Canyon Education, Inc.* | 441,735 | ||||
| 3,480 | Helen of Troy Ltd.* | 781,887 | ||||
| 5,972 | LCI Industries | 804,010 | ||||
| 24,232 | Malibu Boats, Inc., Class A* | 1,695,756 | ||||
| 24,954 | Patrick Industries, Inc. | 2,078,668 | ||||
| 46,697 | Ruth’s Hospitality Group, Inc.* | 967,095 | ||||
| 37,440 | Taylor Morrison Home Corp.* | 965,203 | ||||
| 64,529 | Tilly’s, Inc., Class A | 904,051 | ||||
| 18,885 | Universal Electronics, Inc.* | 930,086 | ||||
|
| |||||
| 13,655,489 | ||||||
|
| |||||
Consumer Staples — 2.27% | ||||||
| 44,748 | Hostess Brands, Inc.* | 777,273 | ||||
| 3,747 | Medifast, Inc. | 721,822 | ||||
|
| |||||
| 1,499,095 | ||||||
|
| |||||
Energy — 4.16% | ||||||
| 117,086 | Magnolia Oil & Gas Corp., Class A | 2,082,960 | ||||
| 42,189 | Par Pacific Holdings, Inc.* | 663,211 | ||||
|
| |||||
| 2,746,171 | ||||||
|
| |||||
Financials — 13.10% | ||||||
| 11,301 | Amerisafe, Inc. | 634,664 | ||||
| 94,981 | Compass Diversified Holdings LP | 2,675,615 | ||||
| 28,700 | Heritage Financial Corp., WA | 731,850 | ||||
| 9,590 | Pinnacle Financial Partners, Inc. | 902,227 | ||||
| 14,274 | Preferred Bank/Los Angeles, CA | 951,790 | ||||
| 15,997 | TriCo Bancshares | 694,270 | ||||
| 31,146 | United Community Banks, Inc. | 1,022,212 | ||||
| 26,532 | Veritex Holdings, Inc. | 1,044,299 | ||||
|
| |||||
| 8,656,927 | ||||||
|
| |||||
Health Care — 11.25% | ||||||
| 8,351 | Apollo Medical Holdings, Inc.* | 760,359 | ||||
| 13,895 | Emergent BioSolutions, Inc.* | 695,723 | ||||
| 13,184 | Globus Medical, Inc., Class A* | 1,010,158 | ||||
| 30,600 | Inotiv, Inc.* | 894,744 | ||||
| 55,406 | Lantheus Holdings, Inc.* | 1,422,826 | ||||
| 2,413 | Masimo Corp.* | 653,223 | ||||
28
SCHEDULE OF PORTFOLIO INVESTMENTS
|
RBC Small Cap Core Fund (cont.)
September 30, 2021
| Shares | Value | |||||
| 5,221 | Omnicell, Inc.* | $ | 774,953 | |||
| 2,871 | West Pharmaceutical Services, Inc. | 1,218,854 | ||||
|
| |||||
| 7,430,840 | ||||||
|
| |||||
Industrials — 20.55% | ||||||
| 165,125 | ACCO Brands Corp. | 1,418,424 | ||||
| 11,969 | Arcosa, Inc. | 600,485 | ||||
| 26,156 | Atkore, Inc.* | 2,273,480 | ||||
| 23,166 | CBIZ, Inc.* | 749,188 | ||||
| 56,947 | Columbus McKinnon Corp. | 2,753,387 | ||||
| 30,761 | Ducommun, Inc.* | 1,548,816 | ||||
| 9,703 | EnerSys | 722,291 | ||||
| 33,365 | Greenbrier Cos., Inc. (The) | 1,434,361 | ||||
| 29,250 | Insteel Industries, Inc. | 1,112,963 | ||||
| 9,828 | NV5 Global, Inc.* | 968,746 | ||||
|
| |||||
| 13,582,141 | ||||||
|
| |||||
Information Technology — 13.99% | ||||||
| 6,413 | Ambarella, Inc.* | 998,761 | ||||
| 85,802 | AXT, Inc.* | 714,731 | ||||
| 31,130 | Cohu, Inc.* | 994,292 | ||||
| 6,664 | MKS Instruments, Inc. | 1,005,664 | ||||
| 25,309 | Model N, Inc.* | 847,851 | ||||
| 5,786 | Novanta, Inc.* | 893,937 | ||||
| 13,601 | Onto Innovation, Inc.* | 982,672 | ||||
| 15,179 | SailPoint Technologies Holdings, Inc.* | 650,876 | ||||
| 26,059 | Sapiens International Corp. NV | 749,978 | ||||
| 87,130 | Vonage Holdings Corp.* | 1,404,536 | ||||
|
| |||||
| 9,243,298 | ||||||
|
| |||||
Materials — 3.35% | ||||||
| 73,906 | FutureFuel Corp. | 526,950 | ||||
| 9,413 | Ingevity Corp.* | 671,806 | ||||
| 32,581 | Koppers Holdings, Inc.* | 1,018,482 | ||||
|
| |||||
| 2,217,238 | ||||||
|
| |||||
Real Estate — 2.67% | ||||||
| 24,068 | STAG Industrial, Inc., REIT | 944,669 | ||||
| 35,899 | UMH Properties, Inc., REIT | 822,087 | ||||
| 1,766,756 | ||||||
|
| |||||
Total Common Stocks | 63,012,620 | |||||
|
| |||||
(Cost $34,967,503) | ||||||
Exchange Traded Funds — 3.51% | ||||||
| 188 | iShares Russell 2000 Index Fund | 41,125 | ||||
29
SCHEDULE OF PORTFOLIO INVESTMENTS
|
RBC Small Cap Core Fund (cont.)
September 30, 2021
| Shares | Value | |||||
| 18,100 | SPDR S&P Biotech | $ | 2,275,351 | |||
|
| |||||
Total Exchange Traded Funds | 2,316,476 | |||||
|
| |||||
(Cost $2,318,274) | ||||||
Investment Company — 1.06% | ||||||
| 700,072 | U.S. Government Money Market Fund, RBC Institutional Class 1(a) | 700,072 | ||||
|
| |||||
Total Investment Company | 700,072 | |||||
|
| |||||
(Cost $700,072) | ||||||
Total Investments | $ | 66,029,168 | ||||
(Cost $37,985,849)(b) — 99.93% | ||||||
Other assets in excess of liabilities — 0.07% | 46,619 | |||||
|
| |||||
NET ASSETS — 100.00% | $ | 66,075,787 | ||||
|
| |||||
| * | Non-income producing security. |
| (a) | Affiliated investment. |
| (b) | See Notes to Schedules of Portfolio Investments for the tax cost of securities and the breakdown of unrealized appreciation (depreciation). |
Abbreviations used are defined below:
REIT - Real Estate Investment Trust
See Notes to the Financial Statements.
30
SCHEDULE OF PORTFOLIO INVESTMENTS
|
RBC Microcap Value Fund
September 30, 2021
| Shares | Value | |||||
Common Stocks — 95.33% | ||||||
Communication Services — 1.88% | ||||||
| 7,200 | Cumulus Media, Inc., Class A* | $ | 88,200 | |||
| 44,050 | DHI Group, Inc.* | 209,678 | ||||
| 23,600 | Entravision Communications Corp., Class A | 167,560 | ||||
| 22,043 | EW Scripps Co. (The), Class A | 398,097 | ||||
| 1,668 | Madison Square Garden Entertainment Corp.* | 121,214 | ||||
| 11,800 | Marcus Corp. (The)* | 205,910 | ||||
| 119,400 | Point.360*,(a),(b),(c) | 0 | ||||
| 12,600 | Saga Communications, Inc., Class A | 286,650 | ||||
| 39,150 | Salem Media Group, Inc.* | 145,246 | ||||
| 22,600 | Spok Holdings, Inc. | 230,972 | ||||
| 35,000 | Townsquare Media, Inc., Class A* | 457,450 | ||||
|
| |||||
| 2,310,977 | ||||||
|
| |||||
Consumer Discretionary — 19.66% | ||||||
| 4,500 | American Public Education, Inc.* | 115,245 | ||||
| 6,100 | America’s Car-Mart, Inc.* | 712,358 | ||||
| 21,300 | Anemostat Door Products(a),(b),(c) | 0 | ||||
| 21,300 | Anemostat, Inc.(a),(b),(c) | 0 | ||||
| 7,900 | Bassett Furniture Industries, Inc. | 143,069 | ||||
| 28,600 | Beazer Homes USA, Inc.* | 493,350 | ||||
| 12,300 | Big 5 Sporting Goods Corp. | 283,392 | ||||
| 3 | Biglari Holdings, Inc., Class B* | 515 | ||||
| 3,420 | Bluegreen Vacations Holding Corp.* | 88,236 | ||||
| 5,200 | Boot Barn Holdings, Inc.* | 462,124 | ||||
| 14,730 | Build-A-Bear Workshop, Inc.* | 249,526 | ||||
| 3,200 | Caleres, Inc. | 71,104 | ||||
| 22,850 | Carriage Services, Inc. | 1,018,882 | ||||
| 6,000 | Cato Corp. (The), Class A | 99,240 | ||||
| 15,000 | Century Casinos, Inc.* | 202,050 | ||||
| 14,423 | Century Communities, Inc. | 886,293 | ||||
| 4,200 | Chuy’s Holdings, Inc.* | 132,426 | ||||
| 5,700 | Citi Trends, Inc.* | 415,872 | ||||
| 9,742 | Clarus Corp. | 249,688 | ||||
| 60,730 | Container Store Group, Inc. (The)* | 578,150 | ||||
| 2,100 | Cooper-Standard Holdings, Inc.* | 46,011 | ||||
| 26,200 | Crown Crafts, Inc. | 193,880 | ||||
| 16,230 | Culp, Inc. | 209,042 | ||||
| 16,100 | Del Taco Restaurants, Inc. | 140,553 | ||||
| 29,400 | Delta Apparel, Inc.* | 802,914 | ||||
| 13,200 | Duluth Holdings, Inc., Class B* | 179,916 | ||||
| 9,900 | Ethan Allen Interiors, Inc. | 234,630 | ||||
| 6,500 | Flexsteel Industries, Inc. | 200,720 | ||||
| 8,000 | Funko, Inc., Class A* | 145,680 | ||||
| 2,700 | Genesco, Inc.* | 155,871 | ||||
| 18,490 | Haverty Furniture Cos., Inc. | 623,298 | ||||
| 10,400 | hhgregg, Inc.* | 1 | ||||
31
SCHEDULE OF PORTFOLIO INVESTMENTS
|
RBC Microcap Value Fund (cont.)
September 30, 2021
| Shares | Value | |||||
| 4,000 | Hibbett Sports, Inc. | $ | 282,960 | |||
| 16,900 | Hooker Furniture Corp. | 456,131 | ||||
| 6,440 | Johnson Outdoors, Inc., Class A | 681,352 | ||||
| 23,500 | Kid Brands, Inc.*,(b) | 48 | ||||
| 28,820 | Lakeland Industries, Inc.* | 605,220 | ||||
| 9,500 | Lands’ End, Inc.* | 223,630 | ||||
| 95,270 | Lazare Kaplan International, Inc.*,(a),(b),(c) | 0 | ||||
| 7,000 | La-Z-Boy, Inc. | 225,610 | ||||
| 11,100 | Legacy Housing Corp.* | 199,467 | ||||
| 13,200 | Lifetime Brands, Inc. | 240,108 | ||||
| 14,000 | M/I Homes, Inc.* | 809,200 | ||||
| 21,540 | MarineMax, Inc.* | 1,045,121 | ||||
| 7,500 | McRae Industries, Inc., Class A | 249,750 | ||||
| 2,285 | Mecklermedia Corp.*,(a),(b),(c) | 0 | ||||
| 20,000 | Mestek, Inc.* | 605,000 | ||||
| 9,600 | Modine Manufacturing Co.* | 108,768 | ||||
| 16,400 | Movado Group, Inc. | 516,436 | ||||
| 2,400 | Nathan’s Famous, Inc. | 146,808 | ||||
| 4,200 | Nautilus, Inc.* | 39,102 | ||||
| 9,500 | Nobility Homes, Inc. | 318,250 | ||||
| 4,600 | OneWater Marine, Inc., Class A | 184,966 | ||||
| 41,000 | Orleans Homebuilders, Inc.*,(a),(b),(c) | 0 | ||||
| 10,275 | Patrick Industries, Inc. | 855,908 | ||||
| 6,400 | RCI Hospitality Holdings, Inc. | 438,464 | ||||
| 19,400 | Rocky Brands, Inc. | 923,634 | ||||
| 12,000 | Sonic Automotive, Inc., Class A | 630,480 | ||||
| 12,500 | Standard Motor Products, Inc. | 546,375 | ||||
| 2,100 | Stoneridge, Inc.* | 42,819 | ||||
| 10,730 | Strattec Security Corp.* | 417,397 | ||||
| 27,100 | Stride, Inc.* | 973,974 | ||||
| 27,189 | Superior Group of Cos, Inc. | 633,232 | ||||
| 32,500 | Superior Industries International, Inc.* | 229,125 | ||||
| 10,840 | Taylor Morrison Home Corp.* | 279,455 | ||||
| 24,800 | Tilly’s, Inc., Class A | 347,448 | ||||
| 8,760 | TravelCenters of America, Inc.* | 436,160 | ||||
| 12,000 | Tupperware Brands Corp.* | 253,440 | ||||
| 22,400 | Unifi, Inc.* | 491,232 | ||||
| 30,000 | Universal Travel Group*,(a),(b),(c) | 0 | ||||
| 17,600 | Vera Bradley, Inc.* | 165,616 | ||||
| 11,600 | VOXX International Corp.* | 132,820 | ||||
| 1,397 | Walking Co. Holdings, Inc. (The)*,(a),(b),(c) | 0 | ||||
| 11,000 | Weyco Group, Inc. | 249,260 | ||||
| 11,500 | Zovio, Inc.* | 27,485 | ||||
|
| |||||
| 24,146,287 | ||||||
|
| |||||
Consumer Staples — 3.23% | ||||||
| 5,400 | Alico, Inc. | 184,896 | ||||
| 7,350 | Andersons, Inc. (The) | 226,601 | ||||
| 14,615 | Central Garden & Pet Co.* | 701,520 | ||||
32
SCHEDULE OF PORTFOLIO INVESTMENTS
|
RBC Microcap Value Fund (cont.)
September 30, 2021
| Shares | Value | |||||
| 4,100 | e.l.f. Beauty, Inc.* | $ | 119,105 | |||
| 36 | Hawaiian Macadamia Nut Orchards L.P.*,(b) | 36,000 | ||||
| 12,400 | Ingles Markets, Inc., Class A | 818,772 | ||||
| 35,400 | Natural Grocers by Vitamin Cottage, Inc. | 397,188 | ||||
| 17,400 | Oil-Dri Corp. of America | 609,000 | ||||
| 1,892 | Performance Food Group Co.* | 87,902 | ||||
| 2,700 | Seneca Foods Corp., Class A* | 130,194 | ||||
| 23,140 | SpartanNash Co. | 506,766 | ||||
| 6,600 | Village Super Market, Inc., Class A | 143,088 | ||||
|
| |||||
| 3,961,032 | ||||||
|
| |||||
Energy — 2.53% | ||||||
| 45,500 | Aegean Marine Petroleum Network, Inc.*,(a),(b),(c) | 0 | ||||
| 13,900 | Ardmore Shipping Corp.* | 57,685 | ||||
| 7,400 | Bonanza Creek Energy, Inc. | 354,460 | ||||
| 1,240 | Bristow Group, Inc.* | 39,469 | ||||
| 1,254 | Callon Petroleum Co.* | 61,546 | ||||
| 9,200 | CONSOL Energy, Inc.* | 239,384 | ||||
| 8,200 | Dorian LPG Ltd. | 101,762 | ||||
| 23,000 | Evolution Petroleum Corp. | 130,640 | ||||
| 18,500 | Falcon Minerals Corp. | 86,950 | ||||
| 7,100 | Global Partners LP | 150,378 | ||||
| 6,200 | Goodrich Petroleum Corp.* | 146,692 | ||||
| 2,950 | Harvest Natural Resources, Inc.*,(a),(b),(c) | 0 | ||||
| 6,628 | Natural Gas Services Group, Inc.* | 68,799 | ||||
| 50,600 | North American Construction Group Ltd. | 744,832 | ||||
| 4,700 | Penn Virginia Corp.* | 125,349 | ||||
| 4,010 | REX American Resources Corp.* | 320,279 | ||||
| 15,400 | Solaris Oilfield Infrastructure, Inc., Class A | 128,436 | ||||
| 42,908 | Southwestern Energy Co.* | 237,710 | ||||
| 2,200 | Teekay Tankers Ltd., Class A* | 31,966 | ||||
| 18,880 | W&T Offshore, Inc.* | 70,234 | ||||
| 289 | Whiting Petroleum Corp.* | 16,880 | ||||
|
| |||||
| 3,113,451 | ||||||
|
| |||||
Financials — 32.46% | ||||||
| 4,500 | ACNB Corp. | 126,000 | ||||
| 39,150 | Affirmative Insurance Holdings, Inc.*,(a),(b),(c) | 0 | ||||
| 8,600 | Amalgamated Financial Corp. | 136,052 | ||||
| 8,500 | Amerant Bancorp, Inc.* | 210,290 | ||||
| 5,300 | American National Bankshares, Inc. | 175,112 | ||||
| 6,800 | Ames National Corp. | 158,168 | ||||
| 5,968 | Apollo Commercial Real Estate Finance, Inc., REIT | 88,505 | ||||
| 44,976 | Arbor Realty Trust, Inc., REIT | 833,405 | ||||
| 48,100 | Ares Commercial Real Estate Corp., REIT | 725,348 | ||||
| 2,200 | Arlington Asset Investment Corp., Class A* | 8,140 | ||||
| 101 | Ashford, Inc.* | 1,470 | ||||
| 10,100 | Atlantic Capital Bancshares, Inc.* | 267,549 | ||||
| 28,500 | Banc of California, Inc. | 526,965 | ||||
33
SCHEDULE OF PORTFOLIO INVESTMENTS
|
RBC Microcap Value Fund (cont.)
September 30, 2021
| Shares | Value | |||||
| 12,400 | Banco Latinoamericano de Comercio Exterior SA, Class E | $ | 217,496 | |||
| 23,400 | Bancorp, Inc. (The)* | 595,530 | ||||
| 1,700 | Bank First Corp. | 120,479 | ||||
| 4,542 | Bank of Marin Bancorp | 171,460 | ||||
| 4,100 | Bankwell Financial Group, Inc. | 120,663 | ||||
| 4,928 | Banner Corp. | 272,075 | ||||
| 6,800 | Bar Harbor Bankshares | 190,740 | ||||
| 5,300 | Baycom Corp.* | 98,580 | ||||
| 100,000 | Beverly Hills Bancorp, Inc.*,(a),(b),(c) | 0 | ||||
| 13,800 | Blucora, Inc.* | 215,142 | ||||
| 14,300 | Bridgewater Bancshares, Inc.* | 250,393 | ||||
| 5,500 | Business First Bancshares, Inc. | 128,645 | ||||
| 33,600 | California First National Bancorp | 608,160 | ||||
| 1,500 | Cambridge Bancorp | 132,000 | ||||
| 6,200 | Capital City Bank Group, Inc. | 153,388 | ||||
| 38,000 | Capitol Bancorp Ltd.*,(a),(b),(c) | 0 | ||||
| 6,900 | Capstar Financial Holdings, Inc. | 146,556 | ||||
| 5,700 | Central Valley Community Bancorp | 122,550 | ||||
| 1,900 | Century Bancorp, Inc., Class A | 218,956 | ||||
| 20,497 | Cherry Hill Mortgage Investment Corp., REIT | 182,013 | ||||
| 7,600 | Citizens & Northern Corp. | 191,976 | ||||
| 36,250 | Citizens, Inc.* | 225,112 | ||||
| 8,900 | Civista Bancshares, Inc. | 206,747 | ||||
| 6,700 | CNB Financial Corp. | 163,078 | ||||
| 5,700 | Coastal Financial Corp.* | 181,602 | ||||
| 17,000 | Community Bankers Trust Corp. | 193,290 | ||||
| 93,383 | Consumer Portfolio Services, Inc.* | 546,291 | ||||
| 2,189 | Cowen Inc., Class A | 75,105 | ||||
| 800 | Diamond Hill Investment Group, Inc. | 140,528 | ||||
| 10,448 | Dime Community Bancshares, Inc. | 341,232 | ||||
| 17,277 | Donegal Group, Inc., Class A | 250,344 | ||||
| 3,944 | Donegal Group, Inc., Class B | 53,323 | ||||
| 11,900 | Donnelley Financial Solutions, Inc.* | 411,978 | ||||
| 12,446 | Dynex Capital, Inc., REIT | 215,067 | ||||
| 33,700 | Ellington Residential Mortgage, REIT | 376,092 | ||||
| 26,680 | Enova International, Inc.* | 921,794 | ||||
| 6,000 | Enterprise Bancorp, Inc. | 215,700 | ||||
| 5,678 | Enterprise Financial Services Corp. | 257,100 | ||||
| 4,100 | Equity Bancshares, Inc., Class A | 136,858 | ||||
| 4,800 | Esquire Financial Holdings, Inc.* | 137,568 | ||||
| 6,800 | ESSA Bancorp, Inc. | 112,880 | ||||
| 4,200 | Evans Bancorp, Inc. | 160,860 | ||||
| 12,000 | Farmers National Banc Corp. | 188,520 | ||||
| 15,717 | FB Financial Corp. | 673,945 | ||||
| 10,140 | Federal Agricultural Mortgage Corp., Class C | 1,100,393 | ||||
| 5,500 | Financial Institutions, Inc. | 168,575 | ||||
| 4,200 | First Bancorp, Inc. | 122,388 | ||||
| 7,400 | First Business Financial Services, Inc. | 212,454 | ||||
| 1,800 | First Capital, Inc. | 73,404 | ||||
34
SCHEDULE OF PORTFOLIO INVESTMENTS
|
RBC Microcap Value Fund (cont.)
September 30, 2021
| Shares | Value | |||||
| 6,500 | First Community Bankshares, Inc. | $ | 206,180 | |||
| 9,400 | First Financial Corp. | 395,270 | ||||
| 7,200 | First Internet Bancorp | 224,496 | ||||
| 6,100 | First Merchants Corp. | 255,224 | ||||
| 6,200 | First of Long Island Corp. (The) | 127,720 | ||||
| 38,000 | First Place Financial Corp.(a),(b),(c) | 0 | ||||
| 8,100 | Flushing Financial Corp. | 183,060 | ||||
| 6,000 | FS Bancorp, Inc. | 207,660 | ||||
| 6,900 | FVCBankcorp, Inc.* | 137,931 | ||||
| 35,428 | Great Ajax Corp., REIT | 477,924 | ||||
| 1,426 | Great Western Bancorp, Inc. | 46,687 | ||||
| 6,050 | Guaranty Bancshares, Inc. | 216,892 | ||||
| 10,700 | Hanmi Financial Corp. | 214,642 | ||||
| 8,100 | HBT Financial, Inc. | 125,955 | ||||
| 10,340 | HCI Group, Inc. | 1,145,362 | ||||
| 30,470 | Heritage Insurance Holdings, Inc. | 207,501 | ||||
| 600 | Hingham Institution for Savings, FOR | 202,020 | ||||
| 3,100 | Home Bancorp, Inc. | 119,908 | ||||
| 8,940 | HomeTrust Bancshares, Inc. | 250,141 | ||||
| 8,300 | Independent Bank Corp. | 178,284 | ||||
| 955 | Independent Bank Group, Inc. | 67,843 | ||||
| 8,100 | Investar Holding Corp. | 178,362 | ||||
| 3,704 | Investors Title Co. | 676,350 | ||||
| 20,000 | JMP Group LLC* | 149,400 | ||||
| 14,800 | Kansas City Life Insurance Co. | 615,680 | ||||
| 6,400 | LCNB Corp. | 112,896 | ||||
| 18,200 | Macatawa Bank Corp. | 146,146 | ||||
| 5,100 | Malvern Bancorp, Inc.* | 86,649 | ||||
| 62,200 | Manning & Napier, Inc. | 567,886 | ||||
| 14,790 | Marlin Business Services Corp. | 328,782 | ||||
| 4,700 | Mercantile Bank Corp. | 150,541 | ||||
| 6,500 | Merchants Bancorp | 256,555 | ||||
| 5,900 | Meridian Corp. | 169,153 | ||||
| 7,500 | Metrocity Bankshares, Inc. | 157,275 | ||||
| 6,300 | Metropolitan Bank Holding Corp.* | 531,090 | ||||
| 6,100 | Midland States Bancorp, Inc. | 150,853 | ||||
| 4,500 | MidWestOne Financial Group, Inc. | 135,720 | ||||
| 5,500 | MVB Financial Corp. | 235,565 | ||||
| 4,100 | National Bankshares, Inc. | 148,871 | ||||
| 2,600 | National Western Life Group, Inc., Class A | 547,534 | ||||
| 11,567 | Nicholas Financial, Inc.* | 142,274 | ||||
| 4,900 | Northeast Bank | 165,228 | ||||
| 3,300 | Northrim BanCorp, Inc. | 140,283 | ||||
| 43,470 | Northwest Bancshares, Inc. | 577,282 | ||||
| 1,915 | OceanFirst Financial Corp. | 41,000 | ||||
| 26,710 | OFG Bancorp. | 673,626 | ||||
| 14,600 | Old Second Bancorp, Inc. | 190,676 | ||||
| 11,900 | Oppenheimer Holdings, Inc., Class A | 538,951 | ||||
35
SCHEDULE OF PORTFOLIO INVESTMENTS
|
RBC Microcap Value Fund (cont.)
September 30, 2021
| Shares | Value | |||||
| 15,700 | Orchid Island Capital, Inc., REIT | $ | 76,773 | |||
| 6,900 | Orrstown Financial Services, Inc. | 161,460 | ||||
| 7,900 | Pacific Mercantile Bancorp* | 72,759 | ||||
| 9,000 | Parke Bancorp, Inc. | 197,370 | ||||
| 9,100 | PCSB Financial Corp. | 167,804 | ||||
| 5,100 | Peapack-Gladstone Financial Corp. | 170,136 | ||||
| 9,100 | PennyMac Financial Services, Inc. | 556,283 | ||||
| 19,968 | Peoples Bancorp, Inc. | 631,188 | ||||
| 2,400 | Peoples Financial Services Corp. | 109,368 | ||||
| 4,930 | Piper Sandler Cos. | 682,608 | ||||
| 41,894 | Premier Financial Corp. | 1,333,905 | ||||
| 12,600 | Primis Financial Corp. | 182,196 | ||||
| 14,300 | Provident Financial Holdings, Inc. | 244,244 | ||||
| 6,920 | Provident Financial Services, Inc. | 162,412 | ||||
| 6,500 | Randolph Bancorp, Inc.* | 140,270 | ||||
| 9,500 | RBB Bancorp | 239,495 | ||||
| 15,781 | Ready Capital Corp., REIT | 227,720 | ||||
| 2,100 | Red River Bancshares, Inc. | 104,685 | ||||
| 17,760 | Regional Management Corp. | 1,033,277 | ||||
| 6,000 | Reliant Bancorp, Inc. | 189,540 | ||||
| 3,050 | S&T Bancorp, Inc. | 89,883 | ||||
| 7,300 | Safety Insurance Group, Inc. | 578,525 | ||||
| 6,000 | SB Financial Group, Inc. | 108,600 | ||||
| 7,100 | Shore Bancshares, Inc. | 125,883 | ||||
| 7,000 | Sierra Bancorp | 169,960 | ||||
| 5,100 | Silvergate Capital Corp., Class A* | 589,050 | ||||
| 3,626 | Simmons First National Corp., Class A | 107,185 | ||||
| 8,600 | SmartFinancial, Inc. | 222,310 | ||||
| 9,300 | South Plains Financial, Inc. | 226,734 | ||||
| 4,600 | Southern First Bancshares, Inc.* | 246,100 | ||||
| 5,200 | Southern Missouri Bancorp, Inc. | 233,428 | ||||
| 8,900 | Spirit of Texas Bancshares, Inc. | 215,380 | ||||
| 9,400 | Stewart Information Services Corp. | 594,644 | ||||
| 3,800 | Territorial Bancorp, Inc. | 96,444 | ||||
| 6,600 | Timberland Bancorp, Inc. | 191,070 | ||||
| 7,100 | TriState Capital Holdings, Inc.* | 150,165 | ||||
| 19,000 | United Western Bancorp, Inc.*,(a),(b),(c) | 0 | ||||
| 5,050 | Walker & Dunlop, Inc. | 573,175 | ||||
| 6,300 | Waterstone Financial, Inc. | 129,087 | ||||
| 7,500 | West BanCorp Inc. | 225,225 | ||||
| 17,400 | Western New England Bancorp, Inc. | 148,422 | ||||
| 5,200 | Westwood Holdings Group, Inc. | 98,800 | ||||
|
| |||||
| 39,864,925 | ||||||
|
| |||||
Health Care — 1.73% | ||||||
| 30,600 | Adeptus Health, Inc., Class A*,(a),(b),(c) | 0 | ||||
| 11,000 | American Shared Hospital Services* | 30,360 | ||||
| 9,100 | AngioDynamics, Inc.* | 236,054 | ||||
| 4,300 | Computer Programs and Systems, Inc. | 152,478 | ||||
36
SCHEDULE OF PORTFOLIO INVESTMENTS
|
RBC Microcap Value Fund (cont.)
September 30, 2021
| Shares | Value | |||||
| 3,000 | Cross Country Healthcare, Inc.* | $ | 63,720 | |||
| 11,850 | CryoLife, Inc.* | 264,136 | ||||
| 5,500 | FONAR Corp.* | 85,030 | ||||
| 12,300 | Meridian Bioscience, Inc.* | 236,652 | ||||
| 5,365 | Option Care Health, Inc.* | 130,155 | ||||
| 7,300 | OraSure Technologies, Inc.* | 82,563 | ||||
| 24,010 | Triple-S Management Corp.* | 849,234 | ||||
|
| |||||
| 2,130,382 | ||||||
|
| |||||
Industrials — 19.07% | ||||||
| 5,200 | Acme United Corp. | 170,248 | ||||
| 5,680 | Alamo Group, Inc. | 792,530 | ||||
| 5,824 | Allied Motion Technologies, Inc. | 182,175 | ||||
| 21,790 | Ameresco, Inc., Class A* | 1,273,190 | ||||
| 8,100 | AMREP Corp.* | 127,170 | ||||
| 66,000 | ARC Document Solutions, Inc. | 194,700 | ||||
| 1,200 | Argan, Inc. | 52,404 | ||||
| 9,800 | BGSF, Inc. | 125,342 | ||||
| 7,100 | Blue Bird Corp.* | 148,106 | ||||
| 4,700 | BlueLinx Holdings, Inc.* | 229,736 | ||||
| 20,600 | CAI International, Inc. | 1,151,746 | ||||
| 24,450 | CBIZ, Inc.* | 790,713 | ||||
| 15,674 | CECO Environmental Corp.* | 110,345 | ||||
| 10,678 | Cenveo, Inc.*,(a),(b),(c) | 0 | ||||
| 2,400 | Chicago Rivet & Machine Co. | 64,488 | ||||
| 660 | Comfort Systems USA, Inc. | 47,071 | ||||
| 8,200 | Commercial Vehicle Group, Inc.* | 77,572 | ||||
| 26,678 | CompX International, Inc. | 554,369 | ||||
| 36,000 | Costamare, Inc. | 557,640 | ||||
| 8,800 | Covenant Logistics Group, Inc.* | 243,320 | ||||
| 3,300 | CRA International, Inc. | 327,822 | ||||
| 26,840 | Ducommun, Inc.* | 1,351,394 | ||||
| 12,000 | Eastern Co. (The) | 301,920 | ||||
| 9,200 | Encore Wire Corp. | 872,436 | ||||
| 31,340 | Ennis, Inc. | 590,759 | ||||
| 1,300 | EnPro Industries, Inc. | 113,256 | ||||
| 17,490 | Espey Mfg. & Electronics Corp. | 254,480 | ||||
| 10,300 | Federal Signal Corp. | 397,786 | ||||
| 414 | Genco Shipping & Trading Ltd. | 8,334 | ||||
| 5,680 | Gibraltar Industries, Inc.* | 395,612 | ||||
| 21,361 | GP Strategies Corp.* | 442,173 | ||||
| 13,000 | Graham Corp. | 161,200 | ||||
| 10,610 | Greenbrier Cos., Inc. (The) | 456,124 | ||||
| 25,700 | Griffon Corp. | 632,220 | ||||
| 3,400 | Hurco Cos., Inc. | 109,684 | ||||
| 5,500 | Insteel Industries, Inc. | 209,275 | ||||
| 930 | Kadant, Inc. | 189,813 | ||||
| 5,800 | Kimball International, Inc., Class B | 64,960 | ||||
37
SCHEDULE OF PORTFOLIO INVESTMENTS
|
RBC Microcap Value Fund (cont.)
September 30, 2021
| Shares | Value | |||||
| 7,400 | L B Foster Co., Class A* | $ | 114,626 | |||
| 16,200 | LS Starrett Co. (The), Class A* | 202,338 | ||||
| 48,150 | LSI Industries, Inc. | 373,162 | ||||
| 16,900 | Lydall, Inc.* | 1,049,321 | ||||
| 34,300 | Marten Transport Ltd. | 538,167 | ||||
| 16,700 | Mesa Air Group, Inc.* | 127,922 | ||||
| 20,379 | Miller Industries, Inc. | 693,701 | ||||
| 16,000 | Mistras Group, Inc.* | 162,560 | ||||
| 3,500 | National Presto Industries, Inc. | 287,280 | ||||
| 5,500 | Northwest Pipe Co.* | 130,350 | ||||
| 8,800 | Orion Group Holdings, Inc.* | 47,872 | ||||
| 4,000 | PAM Transportation Services, Inc.* | 179,920 | ||||
| 33,000 | Park Aerospace Corp. | 451,440 | ||||
| 3,700 | Park-Ohio Holdings Corp. | 94,424 | ||||
| 4,200 | Powell Industries, Inc. | 103,194 | ||||
| 1,700 | Preformed Line Products Co. | 110,568 | ||||
| 12,100 | Quanex Building Products Corp. | 259,061 | ||||
| 23,000 | Radiant Logistics, Inc.* | 146,970 | ||||
| 25,000 | RCM Technologies, Inc.* | 152,000 | ||||
| 12,700 | Resources Connection, Inc. | 200,406 | ||||
| 15,100 | Rush Enterprises, Inc., Class A | 681,916 | ||||
| 22,000 | Safe Bulkers, Inc.* | 113,740 | ||||
| 2,900 | Standex International Corp. | 286,839 | ||||
| 10,700 | Sterling Construction Co., Inc.* | 242,569 | ||||
| 24,100 | Textainer Group Holdings Ltd.* | 841,331 | ||||
| 9,600 | Titan Machinery, Inc.* | 248,736 | ||||
| 7,400 | USA Truck, Inc.* | 113,072 | ||||
| 10,230 | Vectrus, Inc.* | 514,364 | ||||
| 12,300 | Vidler Water Resouces, Inc.* | 139,974 | ||||
| 3,000 | VSE Corp. | 144,510 | ||||
| 3,900 | Willdan Group, Inc.* | 138,801 | ||||
| 20,238 | Willis Lease Finance Corp.* | 752,651 | ||||
|
| |||||
| 23,415,898 | ||||||
|
| |||||
Information Technology — 6.25% | ||||||
| 7,300 | Bel Fuse, Inc., Class B | 90,739 | ||||
| 4,700 | Clearfield, Inc.* | 207,505 | ||||
| 6,200 | Comtech Telecommunications Corp. | 158,782 | ||||
| 16,130 | CTS Corp. | 498,578 | ||||
| 6,900 | CyberOptics Corp.* | 245,502 | ||||
| 22,500 | Digi International, Inc.* | 472,950 | ||||
| 3,540 | ePlus, Inc.* | 363,239 | ||||
| 17,400 | Everi Holdings, Inc.* | 420,732 | ||||
| 1,100 | Fabrinet* | 112,761 | ||||
| 4,600 | Insight Enterprises, Inc.* | 414,368 | ||||
| 5,800 | JinkoSolar Holding Co. Ltd., ADR* | 265,698 | ||||
| 25,100 | Kimball Electronics, Inc.* | 646,827 | ||||
| 8,600 | LGL Group, Inc. (The)* | 118,594 | ||||
| 9,200 | Magal Security Systems Ltd. | 36,432 | ||||
38
SCHEDULE OF PORTFOLIO INVESTMENTS
|
RBC Microcap Value Fund (cont.)
September 30, 2021
| Shares | Value | |||||
| 15,700 | Methode Electronics, Inc. | $ | 660,185 | |||
| 8,883 | Onto Innovation, Inc.* | 641,797 | ||||
| 13,550 | PC Connection, Inc. | 596,607 | ||||
| 17,500 | PCTEL, Inc. | 108,850 | ||||
| 28,730 | Photronics, Inc.* | 391,590 | ||||
| 5,300 | Richardson Electronics Ltd. | 51,357 | ||||
| 54,100 | SigmaTron International, Inc.* | 480,408 | ||||
| 13,100 | TESSCO Technologies, Inc.* | 73,098 | ||||
| 17,740 | Vishay Precision Group, Inc.* | 616,820 | ||||
|
| |||||
| 7,673,419 | ||||||
|
| |||||
Materials — 3.50% | ||||||
| 8,600 | Alpha Metallurgical Resources, Inc.* | 428,194 | ||||
| 35,740 | American Vanguard Corp. | 537,887 | ||||
| 37,000 | Blue Earth Refineries, Inc.*,(a),(b),(c) | 0 | ||||
| 8,000 | Clearwater Paper Corp.* | 306,640 | ||||
| 40,990 | FutureFuel Corp. | 292,259 | ||||
| 8,200 | Hawkins, Inc. | 286,016 | ||||
| 5,800 | Haynes International, Inc. | 216,050 | ||||
| 2,600 | Innospec, Inc. | 218,972 | ||||
| 7,400 | Materion Corp. | 507,936 | ||||
| 8,000 | Olympic Steel, Inc. | 194,880 | ||||
| 8,100 | Rayonier Advanced Materials, Inc.* | 60,750 | ||||
| 4,900 | Ryerson Holding Corp. | 109,123 | ||||
| 15,000 | Tecnoglass, Inc. | 325,950 | ||||
| 45,800 | Trecora Resources* | 374,644 | ||||
| 22,900 | Tredegar Corp. | 278,922 | ||||
| 2,600 | UFP Technologies, Inc.* | 160,134 | ||||
|
| |||||
| 4,298,357 | ||||||
|
| |||||
Real Estate — 3.10% | ||||||
| 7,200 | Alpine Income Property Trust, Inc., REIT | 132,264 | ||||
| 6,820 | BBX Capital, Inc.* | 65,267 | ||||
| 5,621 | Cedar Realty Trust, Inc., REIT | 121,920 | ||||
| 4,600 | Community Healthcare Trust, Inc., REIT | 207,874 | ||||
| 2,225 | CTO Realty Growth, Inc. | 119,616 | ||||
| 18,200 | Farmland Partners, Inc., REIT | 218,218 | ||||
| 921 | Forestar Group, Inc.* | 17,158 | ||||
| 3,600 | FRP Holdings, Inc.* | 201,312 | ||||
| 10,242 | Getty Realty Corp., REIT | 300,193 | ||||
| 8,800 | Global Medical REIT, Inc., REIT | 129,360 | ||||
| 15,780 | Monmouth Real Estate Investment Corp., REIT | 294,297 | ||||
| 25,562 | One Liberty Properties, Inc., REIT | 779,385 | ||||
| 1,900 | Rafael Holdings, Inc., Class B* | 58,387 | ||||
| 7,200 | RE/MAX Holdings, Inc., Class A | 224,352 | ||||
| 17,400 | RPT Realty, REIT | 222,024 | ||||
39
SCHEDULE OF PORTFOLIO INVESTMENTS
|
RBC Microcap Value Fund (cont.)
September 30, 2021
| Shares | Value | |||||
| 12,300 | Urstadt Biddle Properties, Inc., REIT, Class A | $ | 232,839 | |||
| 49,010 | Whitestone, REIT | 479,318 | ||||
|
| |||||
| 3,803,784 | ||||||
|
| |||||
Utilities — 1.92% | ||||||
| 3,200 | Artesian Resources Corp., Class A | 122,144 | ||||
| 5,585 | Chesapeake Utilities Corp. | 670,479 | ||||
| 5,200 | Middlesex Water Co. | 534,456 | ||||
| 7,400 | SJW Group | 488,844 | ||||
| 12,756 | Unitil Corp. | 545,702 | ||||
|
| |||||
| 2,361,625 | ||||||
|
| |||||
Total Common Stocks | 117,080,137 | |||||
|
| |||||
(Cost $72,607,807) | ||||||
Exchange Traded Funds — 2.72% | ||||||
| 23,150 | iShares Russell Microcap Index Fund
|
| 3,341,008
|
| ||
|
| |||||
Total Exchange Traded Funds | 3,341,008 | |||||
|
| |||||
(Cost $3,308,818) | ||||||
Rights/Warrants — 0.02% | ||||||
| 444 | Basic Energy Services, Inc., Warrants, Expire 12/23/23*,(b) | 11 | ||||
| 724 | Eagle Bulk Shipping, Inc., Warrants, Expire 10/15/21* | 25 | ||||
| 8,600 | LGL Group, Inc. (The), Warrants, Expire 11/16/25* | 6,579 | ||||
| 6,100 | Media General, Inc. Rights, Expire 12/31/21*,(b),(c) | 0 | ||||
| 2,627 | PHI Group, Inc., Warrants, Expire 9/4/22*,(b),(c) | 0 | ||||
| 1,136 | Whiting Petroleum Corp., Warrants, Expire 12/31/25* | 8,123 | ||||
| 568 | Whiting Petroleum Corp., Warrants, Expire 12/31/25*
|
| 4,101
|
| ||
|
| |||||
Total Rights/Warrants | 18,839 | |||||
|
| |||||
(Cost $169,109) | ||||||
Principal Amount | ||||||
Corporate Bonds — 0.00% | ||||||
Financial — 0.00% | ||||||
| $1,947 | Trenwick America Corp., 0.00%, (a),(b),(c) | 0 | ||||
| 1,098 | Trenwick America Corp., 0.00%, (a),(b),(c) | 0 | ||||
| 0 | ||||||
Total Corporate Bonds | 0 | |||||
(Cost $0) | ||||||
40
SCHEDULE OF PORTFOLIO INVESTMENTS
|
RBC Microcap Value Fund (cont.)
September 30, 2021
| Shares | Value | |||||
Investment Company — 1.77% | ||||||
| 2,175,298 | U.S. Government Money Market Fund, RBC Institutional Class 1(d) | $ | 2,175,298 | |||
|
| |||||
Total Investment Company | 2,175,298 | |||||
|
| |||||
(Cost $2,175,298) | ||||||
Total Investments | $ | 122,615,282 | ||||
(Cost $78,261,032)(e) — 99.84% | ||||||
Other assets in excess of liabilities — 0.16% | 196,375 | |||||
|
| |||||
NET ASSETS — 100.00% | $ | 122,811,657 | ||||
|
| |||||
| * | Non-income producing security. |
| (a) | Security delisted or issuer in bankruptcy. |
| (b) | The Pricing Committee has fair valued this security under procedures established by the Fund’s Board of Trustees. |
| (c) | Security is valued using significant unobservable inputs and is classified as Level 3 in the fair value hierarchy. |
| (d) | Affiliated investment. |
| (e) | See Notes to Schedules of Portfolio Investments for the tax cost of securities and the breakdown of unrealized appreciation (depreciation). |
Abbreviations used are defined below:
ADR - American Depositary Receipt
FOR - Foreign Ownership Receipt
REIT - Real Estate Investment Trust
See Notes to the Financial Statements.
41
SCHEDULE OF PORTFOLIO INVESTMENTS
|
RBC Small Cap Value Fund
September 30, 2021
| Shares | Value | |||||
Common Stocks — 101.24% | ||||||
Communication Services — 4.33% | ||||||
| 70,907 | Gray Television, Inc. | $ | 1,618,098 | |||
| 13,270 | Nexstar Media Group, Inc., Class A | 2,016,509 | ||||
|
| |||||
| 3,634,607 | ||||||
|
| |||||
Consumer Discretionary — 15.51% | ||||||
| 63,400 | Dana, Inc. | 1,410,016 | ||||
| 46,060 | G-III Apparel Group Ltd.* | 1,303,498 | ||||
| 16,360 | Malibu Boats, Inc., Class A* | 1,144,873 | ||||
| 14,870 | Oxford Industries, Inc. | 1,340,828 | ||||
| 20,870 | Patrick Industries, Inc. | 1,738,471 | ||||
| 60,850 | Ruth’s Hospitality Group, Inc.* | 1,260,203 | ||||
| 26,405 | Steven Madden Ltd. | 1,060,425 | ||||
| 50,480 | Taylor Morrison Home Corp.* | 1,301,374 | ||||
| 99,694 | Tilly’s, Inc., Class A | 1,396,713 | ||||
| 21,690 | Universal Electronics, Inc.* | 1,068,233 | ||||
|
| |||||
| 13,024,634 | ||||||
|
| |||||
Consumer Staples — 2.01% | ||||||
| 62,180 | Hostess Brands, Inc.* | 1,080,066 | ||||
| 7,430 | John B Sanfilippo & Son, Inc. | 607,180 | ||||
|
| |||||
| 1,687,246 | ||||||
|
| |||||
Energy — 5.22% | ||||||
| 44,650 | Delek US Holdings, Inc. | 802,361 | ||||
| 131,060 | Magnolia Oil & Gas Corp., Class A | 2,331,557 | ||||
| 79,310 | Par Pacific Holdings, Inc.* | 1,246,753 | ||||
|
| |||||
| 4,380,671 | ||||||
|
| |||||
Financials — 23.05% | ||||||
| 6,620 | American Financial Group, Inc. | 832,995 | ||||
| 16,680 | Amerisafe, Inc. | 936,749 | ||||
| 31,020 | Columbia Banking System, Inc. | 1,178,450 | ||||
| 87,202 | Compass Diversified Holdings LP | 2,456,480 | ||||
| 29,090 | Heritage Financial Corp., WA | 741,795 | ||||
| 15,640 | Independent Bank Group, Inc. | 1,111,066 | ||||
| 30,140 | Mercantile Bank Corp. | 965,384 | ||||
| 25,695 | Pacific Premier Bancorp, Inc. | 1,064,801 | ||||
| 13,090 | Pinnacle Financial Partners, Inc. | 1,231,507 | ||||
| 15,170 | Reinsurance Group of America, Inc. | 1,687,814 | ||||
| 17,370 | Stock Yards Bancorp, Inc. | 1,018,750 | ||||
| 25,060 | TriCo Bancshares | 1,087,604 | ||||
| 89,730 | United Community Banks, Inc. | 2,944,939 | ||||
| 35,040 | Veritex Holdings, Inc. | 1,379,174 | ||||
| 14,010 | WSFS Financial Corp. | 718,853 | ||||
|
| |||||
| 19,356,361 | ||||||
|
| |||||
42
SCHEDULE OF PORTFOLIO INVESTMENTS
|
RBC Small Cap Value Fund (cont.)
September 30, 2021
| Shares | Value | |||||
Health Care — 6.96% | ||||||
| 17,322 | Emergent BioSolutions, Inc.* | $ | 867,312 | |||
| 17,110 | Globus Medical, Inc., Class A* | 1,310,968 | ||||
| 25,499 | Inotiv, Inc.* | 745,591 | ||||
| 98,450 | Invacare Corp.* | 468,622 | ||||
| 63,160 | Lantheus Holdings, Inc.* | 1,621,949 | ||||
| 5,570 | Omnicell, Inc.* | 826,755 | ||||
|
| |||||
| 5,841,197 | ||||||
|
| |||||
Industrials — 18.76% | ||||||
| 233,209 | ACCO Brands Corp. | 2,003,265 | ||||
| 29,915 | Atkore, Inc.* | 2,600,212 | ||||
| 17,050 | Barrett Business Services, Inc. | 1,300,233 | ||||
| 49,584 | Builders FirstSource, Inc.* | 2,565,476 | ||||
| 50,270 | Columbus McKinnon Corp. | 2,430,555 | ||||
| 32,289 | Ducommun, Inc.* | 1,625,751 | ||||
| 7,830 | EnerSys | 582,865 | ||||
| 38,258 | Greenbrier Cos., Inc. (The) | 1,644,712 | ||||
| 26,160 | Insteel Industries, Inc. | 995,388 | ||||
|
| |||||
| 15,748,457 | ||||||
|
| |||||
Information Technology — 7.99% | ||||||
| 39,420 | Cohu, Inc.* | 1,259,075 | ||||
| 6,980 | MKS Instruments, Inc. | 1,053,352 | ||||
| 37,350 | Model N, Inc.* | 1,251,225 | ||||
| 5,580 | Novanta, Inc.* | 862,110 | ||||
| 16,980 | Onto Innovation, Inc.* | 1,226,805 | ||||
| 66,830 | Viavi Solutions, Inc.* | 1,051,904 | ||||
|
| |||||
| 6,704,471 | ||||||
|
| |||||
Materials — 3.59% | ||||||
| 10,900 | Kaiser Aluminum Corp. | 1,187,664 | ||||
| 19,039 | Koppers Holdings, Inc.* | 595,159 | ||||
| 8,650 | Reliance Steel & Aluminum Co. | 1,231,933 | ||||
|
| |||||
| 3,014,756 | ||||||
|
| |||||
Real Estate — 12.31% | ||||||
| 58,420 | Apple Hospitality REIT, Inc. | 918,947 | ||||
| 121,230 | Braemar Hotels & Resorts, Inc., REIT* | 587,966 | ||||
| 18,899 | Community Healthcare Trust, Inc., REIT | 854,046 | ||||
| 15,510 | CubeSmart, REIT | 751,459 | ||||
| 206,960 | DiamondRock Hospitality Co., REIT* | 1,955,772 | ||||
| 4,580 | EastGroup Properties, Inc., REIT | 763,165 | ||||
| 18,064 | National Storage Affiliates Trust, REIT | 953,599 | ||||
| 61,020 | Physicians Realty Trust, REIT | 1,075,172 | ||||
| 33,450 | STAG Industrial, Inc., REIT | 1,312,912 | ||||
| 50,871 | UMH Properties, Inc., REIT | 1,164,946 | ||||
|
| |||||
| 10,337,984 | ||||||
|
| |||||
43
SCHEDULE OF PORTFOLIO INVESTMENTS
|
RBC Small Cap Value Fund (cont.)
September 30, 2021
| Shares | Value | |||||
Utilities — 1.51% |
| |||||
| 19,000 | Southwest Gas Holdings, Inc. | $ | 1,270,720 | |||
|
| |||||
Total Common Stocks (Cost $72,890,918) | 85,001,104 | |||||
|
| |||||
Exchange Traded Funds — 0.01% |
| |||||
| 50 | iShares Russell 2000 Value ETF | 8,012 | ||||
|
| |||||
Total Exchange Traded Funds | 8,012 | |||||
|
| |||||
(Cost $8,079) | ||||||
Total Investments (Cost $72,898,997)(a) — 101.25% | $
| 85,009,116
|
| |||
Liabilities in excess of other assets — (1.25)% | (1,049,683 | ) | ||||
|
| |||||
NET ASSETS — 100.00% | $ | 83,959,433 | ||||
|
| |||||
| * | Non-income producing security. |
| (a) | See Notes to Schedules of Portfolio Investments for the tax cost of securities and the breakdown of unrealized appreciation (depreciation). |
Abbreviations used are defined below:
REIT - Real Estate Investment Trust
See Notes to the Financial Statements.
44
|
Statements of Assets and Liabilities
| September 30, 2021 |
| RBC SMID Cap Growth Fund | RBC Enterprise Fund | RBC Small Cap Core Fund | |||||||||||||
Assets: | |||||||||||||||
Investments in securities, at value: | |||||||||||||||
Unaffiliated investments (cost $68,121,399, $40,064,553 and $37,285,777, respectively) | $94,407,506 | $73,726,810 | $65,329,096 | ||||||||||||
Affiliated investments (cost $2,671,799, $1,166,286 and $700,072, respectively) | 2,671,799 | 1,166,286 | 700,072 | ||||||||||||
Cash | 13,798 | 109 | 782 | ||||||||||||
Interest and dividend receivable | 15,349 | 19,343 | 14,477 | ||||||||||||
Receivable for capital shares issued | 150 | 100 | 3,508 | ||||||||||||
Receivable for investments sold | — | — | 142,423 | ||||||||||||
Prepaid expenses and other assets | 22,145 | 15,669 | 20,391 | ||||||||||||
|
|
|
|
|
| ||||||||||
Total Assets | 97,130,747 | 74,928,317 | 66,210,749 | ||||||||||||
|
|
|
|
|
| ||||||||||
Liabilities: | |||||||||||||||
Foreign withholding tax payable | 6,268 | 6,301 | 6,487 | ||||||||||||
Payable for capital shares redeemed | 32,651 | — | 3,057 | ||||||||||||
Payable for investments purchased | 1,328,743 | — | — | ||||||||||||
Accrued expenses and other payables: | |||||||||||||||
Investment advisory fees | 49,710 | 61,974 | 53,070 | ||||||||||||
Accounting fees | 4,903 | 4,727 | 4,657 | ||||||||||||
Audit fees | 29,700 | 29,700 | 25,900 | ||||||||||||
Trustees’ fees | 221 | 174 | 444 | ||||||||||||
Distribution fees | 39,762 | 226 | 2,564 | ||||||||||||
Custodian fees | 326 | 457 | 1,202 | ||||||||||||
Shareholder reports | 8,931 | 10,045 | 10,039 | ||||||||||||
Transfer agent fees | 44,497 | 8,854 | 14,147 | ||||||||||||
Other | 7,410 | 6,867 | 13,395 | ||||||||||||
|
|
|
|
|
| ||||||||||
Total Liabilities | 1,553,122 | 129,325 | 134,962 | ||||||||||||
|
|
|
|
|
| ||||||||||
Net Assets | $95,577,625 | $74,798,992 | $66,075,787 | ||||||||||||
|
|
|
|
|
| ||||||||||
Net Assets Consists of: | |||||||||||||||
Capital | $49,417,014 | $34,827,657 | $19,115,140 | ||||||||||||
Accumulated earnings | 46,160,611 | 39,971,335 | 46,960,647 | ||||||||||||
|
|
|
|
|
| ||||||||||
Net Assets | $95,577,625 | $74,798,992 | $66,075,787 | ||||||||||||
|
|
|
|
|
| ||||||||||
45
FINANCIAL STATEMENTS
|
Statements of Assets and Liabilities (cont.)
| September 30, 2021 |
| RBC SMID Cap Growth Fund | RBC Enterprise Fund | RBC Small Cap Core Fund | ||||||||||
Net Assets | ||||||||||||
Class A | $ | 14,317,835 | $ | 802,971 | $ | 7,691,583 | ||||||
Class I | 81,239,060 | 73,996,021 | 53,689,251 | |||||||||
Class R6 | 20,730 | N/A | 4,694,953 | |||||||||
|
|
|
|
|
| |||||||
Total | $ | 95,577,625 | $ | 74,798,992 | $ | 66,075,787 | ||||||
|
|
|
|
|
| |||||||
Shares Outstanding (Unlimited number of shares authorized, no par value): | ||||||||||||
Class A | 843,241 | 40,075 | 244,705 | |||||||||
Class I | 4,066,618 | 3,467,445 | 1,595,303 | |||||||||
Class R6 | 1,034 | N/A | 139,328 | |||||||||
|
|
|
|
|
| |||||||
Total | 4,910,893 | 3,507,520 | 1,979,336 | |||||||||
|
|
|
|
|
| |||||||
Net Asset Values and Redemption Prices Per Share: | ||||||||||||
Class A(a) | $ | 16.98 | $ | 20.04 | $ | 31.43 | ||||||
|
|
|
|
|
| |||||||
Class I | $ | 19.98 | $ | 21.34 | $ | 33.65 | ||||||
|
|
|
|
|
| |||||||
Class R6 | $ | 20.04 | $ | N/A | $ | 33.70 | ||||||
|
|
|
|
|
| |||||||
Maximum Offering Price Per Share: | ||||||||||||
Class A | $ | 18.02 | $ | 21.26 | $ | 33.35 | ||||||
|
|
|
|
|
| |||||||
Maximum Sales Charge - Class A | 5.75 | % | 5.75 | % | 5.75 | % | ||||||
|
|
|
|
|
| |||||||
| (a) | For Class A shares, redemption price per share will be reduced by 1.00% for sales of shares within 12 months of purchase (only applicable on purchases of $1 million or more on which no initial sales charge was paid). Such reduction is not reflected in the net asset value and the redemption price per share. |
46
FINANCIAL STATEMENTS
|
Statements of Assets and Liabilities (cont.)
| September 30, 2021 | ||||||||||
| RBC Microcap Value Fund | RBC Small Cap Value Fund | |||||||||
Assets: | ||||||||||
Investments in securities, at value: | ||||||||||
Unaffiliated investments (cost $76,085,734 and $72,898,997, respectively) | $ | 120,439,984 | $ | 85,009,116 | ||||||
Affiliated investments (cost $2,175,298 and $0, respectively) | 2,175,298 | — | ||||||||
Cash | 74 | 75,829 | ||||||||
Interest and dividend receivable | 124,343 | 88,108 | ||||||||
Receivable for capital shares issued | 19,239 | 33,833 | ||||||||
Receivable for investments sold | 235,200 | 1,771,536 | ||||||||
Prepaid expenses and other assets | 13,201 | 25,111 | ||||||||
|
|
|
| |||||||
Total Assets | 123,007,339 | 87,003,533 | ||||||||
|
|
|
| |||||||
Liabilities: | ||||||||||
Foreign withholding tax payable | 5,516 | 6,316 | ||||||||
Payable for capital shares redeemed | 250 | 2,948,154 | ||||||||
Accrued expenses and other payables: | ||||||||||
Investment advisory fees | 100,070 | 24,735 | ||||||||
Accounting fees | 5,116 | 4,832 | ||||||||
Audit fees | 29,700 | 29,700 | ||||||||
Trustees’ fees | 283 | 300 | ||||||||
Distribution fees | 3,412 | 18 | ||||||||
Custodian fees | 254 | 428 | ||||||||
Shareholder reports | 14,846 | 7,613 | ||||||||
Transfer agent fees | 23,681 | 15,303 | ||||||||
Other | 12,554 | 6,701 | ||||||||
|
|
|
| |||||||
Total Liabilities | 195,682 | 3,044,100 | ||||||||
|
|
|
| |||||||
Net Assets | $ | 122,811,657 | $ | 83,959,433 | ||||||
|
|
|
| |||||||
Net Assets Consists of: | ||||||||||
Capital | $ | 71,653,012 | $ | 85,448,762 | ||||||
Accumulated earnings | 51,158,645 | (1,489,329 | ) | |||||||
|
|
|
| |||||||
Net Assets | $ | 122,811,657 | $ | 83,959,433 | ||||||
|
|
|
| |||||||
47
FINANCIAL STATEMENTS
|
Statements of Assets and Liabilities (cont.)
| September 30, 2021 | ||||||||
| RBC Microcap Value Fund | RBC Small Cap Value Fund | |||||||
Net Assets | ||||||||
Class A | $ | 3,419,780 | $ | 11,038 | ||||
Class I | 119,391,877 | 77,582,189 | ||||||
Class R6 | N/A | 6,366,206 | ||||||
|
|
|
| |||||
Total | $ | 122,811,657 | $ | 83,959,433 | ||||
|
|
|
| |||||
Shares Outstanding (Unlimited number of shares authorized, no par value): | ||||||||
Class A | 106,911 | 791 | ||||||
Class I | 3,729,701 | 5,547,948 | ||||||
Class R6 | N/A | 452,516 | ||||||
|
|
|
| |||||
Total | 3,836,612 | 6,001,255 | ||||||
|
|
|
| |||||
Net Asset Values and Redemption Prices Per Share: | ||||||||
Class A(a) | $ | 31.99 | $ | 13.96 | ||||
|
|
|
| |||||
Class I | $ | 32.01 | $ | 13.98 | ||||
|
|
|
| |||||
Class R6 | $ | N/A | $ | 14.07 | ||||
|
|
|
| |||||
Maximum Offering Price Per Share: | ||||||||
Class A | $ | 33.94 | $ | 14.81 | ||||
|
|
|
| |||||
Maximum Sales Charge - Class A | 5.75 | % | 5.75 | % | ||||
|
|
|
| |||||
| (a) | For Class A shares, redemption price per share will be reduced by 1.00% for sales of shares within 12 months of purchase (only applicable on purchases of $1 million or more on which no initial sales charge was paid). Such reduction is not reflected in the net asset value and the redemption price per share. |
See Notes to the Financial Statements.
48
FINANCIAL STATEMENTS
|
| For the Year Ended September 30, 2021 | ||||||||||||
| RBC SMID Cap Growth Fund | RBC Enterprise Fund | RBC Small Cap Core Fund | ||||||||||
Investment Income: | ||||||||||||
Interest income | $ | — | $ | — | $ | 22,898 | ||||||
Dividend income - unaffiliated | 553,085 | 1,090,597 | 1,066,755 | |||||||||
Dividend income - affiliated | 413 | 268 | 250 | |||||||||
Foreign tax withholding | (740 | ) | (4,857 | ) | (2,632 | ) | ||||||
|
|
|
|
|
| |||||||
Total Investment Income | 552,758 | 1,086,008 | 1,087,271 | |||||||||
Expenses: | ||||||||||||
Investment advisory fees | 735,154 | 666,828 | 712,124 | |||||||||
Distribution fees–Class A | 34,530 | 1,868 | 20,196 | |||||||||
Accounting fees | 34,981 | 32,723 | 33,762 | |||||||||
Audit fees | 37,253 | 37,253 | 37,253 | |||||||||
Custodian fees | 1,818 | 2,741 | 7,712 | |||||||||
Insurance fees | 3,248 | 3,248 | 3,251 | |||||||||
Legal fees | 723 | — | — | |||||||||
Registrations and filing fees | 63,729 | 44,356 | 63,341 | |||||||||
Shareholder reports | 36,642 | 36,811 | 32,888 | |||||||||
Transfer agent fees–Class A | 17,164 | 5,403 | 14,614 | |||||||||
Transfer agent fees–Class I | 95,453 | 51,467 | 62,813 | |||||||||
Transfer agent fees–Class R6 | 3,535 | — | 3,572 | |||||||||
Trustees’ fees and expenses | 3,772 | 2,418 | 3,098 | |||||||||
Tax expense | 4,221 | 4,220 | 4,222 | |||||||||
Other fees | 5,753 | 4,742 | 6,409 | |||||||||
|
|
|
|
|
| |||||||
Total expenses before fee waiver/reimbursement | 1,077,976 | 894,078 | 1,005,255 | |||||||||
Expenses waived/reimbursed by: | ||||||||||||
Advisor | (182,276 | ) | (128,016 | ) | (231,791 | ) | ||||||
|
|
|
|
|
| |||||||
Net expenses | 895,700 | 766,062 | 773,464 | |||||||||
|
|
|
|
|
| |||||||
Net Investment Income (Loss) | (342,942 | ) | 319,946 | 313,807 | ||||||||
|
|
|
|
|
| |||||||
Realized/Unrealized Gains/(Losses): | ||||||||||||
Net realized gains from investment transactions | 33,153,385(a | ) | 8,053,943 | 28,330,487(a | ) | |||||||
Net change in unrealized appreciation on investments | 3,026,416 | 18,176,726 | 6,098,731 | |||||||||
|
|
|
|
|
| |||||||
Net realized/unrealized gains | 36,179,801 | 26,230,669 | 34,429,218 | |||||||||
|
|
|
|
|
| |||||||
Change in net assets resulting from operations | $ | 35,836,859 | $ | 26,550,615 | $ | 34,743,025 | ||||||
|
|
|
|
|
| |||||||
| (a) | Includes net realized gains/(losses) from in-kind redemptions in the amount of $12,602,278 and $5,412,107 for SMID Cap Growth Fund and Small Cap Core Fund, respectively (See Note 2). |
49
FINANCIAL STATEMENTS
|
Statements of Operations (cont.)
| For the Year Ended September 30, 2021 | ||||||||
| RBC Microcap Value Fund | RBC Small Cap Value Fund | |||||||
Investment Income: | ||||||||
Interest income | $ | 4,957 | $ | — | ||||
Dividend income - unaffiliated | 2,416,836 | 1,595,882 | ||||||
Dividend income - affiliated | 338 | 418 | ||||||
Foreign tax withholding | (8,553 | ) | (1,566 | ) | ||||
|
|
|
| |||||
Total Investment Income | 2,413,578 | 1,594,734 | ||||||
Expenses: | ||||||||
Investment advisory fees | 1,049,289 | 553,770 | ||||||
Distribution fees–Class A | 8,011 | 18 | ||||||
Accounting fees | 52,944 | 33,868 | ||||||
Audit fees | 37,253 | 37,253 | ||||||
Custodian fees | 4,662 | 3,543 | ||||||
Insurance fees | 3,251 | 3,265 | ||||||
Legal fees | — | 25,817 | ||||||
Registrations and filing fees | 51,987 | 63,277 | ||||||
Shareholder reports | 44,588 | 34,670 | ||||||
Transfer agent fees–Class A | 9,273 | 2,638 | ||||||
Transfer agent fees–Class I | 126,866 | 88,453 | ||||||
Transfer agent fees–Class R6 | — | 3,562 | ||||||
Trustees’ fees and expenses | 4,053 | 2,709 | ||||||
Tax expense | 4,402 | 4,221 | ||||||
Other fees | 5,295 | 5,765 | ||||||
|
|
|
| |||||
Total expenses before fee waiver/reimbursement | 1,401,874 | 862,829 | ||||||
Expenses waived/reimbursed by: | ||||||||
Advisor | (146,375 | ) | (193,390 | ) | ||||
|
|
|
| |||||
Net expenses | 1,255,499 | 669,439 | ||||||
|
|
|
| |||||
Net Investment Income | 1,158,079 | 925,295 | ||||||
|
|
|
| |||||
Realized/Unrealized Gains/(Losses): | ||||||||
Net realized gains from investment transactions | 6,606,449 | 3,219,538 | ||||||
Net change in unrealized appreciation/ (depreciation) on: | ||||||||
Investments | 43,762,749 | 20,703,358 | ||||||
Foreign currency | (5 | ) | — | |||||
|
|
|
| |||||
Net unrealized gains | 43,762,744 | 20,703,358 | ||||||
|
|
|
| |||||
Net realized/unrealized gains | 50,369,193 | 23,922,896 | ||||||
|
|
|
| |||||
Change in net assets resulting from operations | $ | 51,527,272 | $ | 24,848,191 | ||||
|
|
|
| |||||
See Notes to the Financial Statements.
50
FINANCIAL STATEMENTS
|
Statements of Changes in Net Assets
| RBC SMID Cap Growth Fund | ||||||||||||||
| For the Year Ended September 30, 2021 | For the Year Ended September 30, 2020 | |||||||||||||
From Investment Activities | ||||||||||||||
Operations: | ||||||||||||||
Net investment loss | $ | (342,942 | ) | $ | (220,265 | ) | ||||||||
Net realized gains from investments | 33,153,385 | 2,935,567 | ||||||||||||
Net change in unrealized appreciation on investments | 3,026,416 | 1,270,637 | ||||||||||||
|
|
|
| |||||||||||
Change in net assets resulting from operations | 35,836,859 | 3,985,939 | ||||||||||||
|
|
|
| |||||||||||
Distributions to Shareholders: | ||||||||||||||
Class A | (400,344 | ) | (997,220 | ) | ||||||||||
Class I | (2,566,042 | ) | (6,014,675 | ) | ||||||||||
Class R6 | (468 | ) | (1,031 | ) | ||||||||||
|
|
|
| |||||||||||
Change in net assets resulting from shareholder distributions | (2,966,854 | ) | (7,012,926 | ) | ||||||||||
|
|
|
| |||||||||||
Capital Transactions: | ||||||||||||||
Proceeds from shares issued | 30,983,661 | 36,761,501 | ||||||||||||
Distributions reinvested | 2,961,348 | 6,994,739 | ||||||||||||
Cost of shares redeemed | (66,015,497 | ) | (39,217,661 | ) | ||||||||||
|
|
|
| |||||||||||
Change in net assets resulting from capital transactions | (32,070,488 | ) | 4,538,579 | |||||||||||
|
|
|
| |||||||||||
Net increase in net assets | 799,517 | 1,511,592 | ||||||||||||
Net Assets: | ||||||||||||||
Beginning of year | 94,778,108 | 93,266,516 | ||||||||||||
|
|
|
| |||||||||||
End of year | $ | 95,577,625 | $ | 94,778,108 | ||||||||||
|
|
|
| |||||||||||
Share Transactions: | ||||||||||||||
Issued | 1,672,721 | 2,607,265 | ||||||||||||
Reinvested | 173,005 | 478,884 | ||||||||||||
Redeemed | (3,503,007 | ) | (2,850,825 | ) | ||||||||||
|
|
|
| |||||||||||
Change in shares resulting from capital transactions | (1,657,281 | ) | 235,324 | |||||||||||
|
|
|
| |||||||||||
See Notes to the Financial Statements.
51
FINANCIAL STATEMENTS
|
Statements of Changes in Net Assets
| RBC Enterprise Fund | ||||||||||||||
| For the Year Ended September 30, 2021 | For the Year Ended September 30, 2020 | |||||||||||||
From Investment Activities | ||||||||||||||
Operations: | ||||||||||||||
Net investment income | $ | 319,946 | $ | 264,491 | ||||||||||
Net realized gains from investments | 8,053,943 | 5,037,188 | ||||||||||||
Net change in unrealized appreciation/(depreciation) on investments | 18,176,726 | (12,123,140 | ) | |||||||||||
|
|
|
| |||||||||||
Change in net assets resulting from operations | 26,550,615 | (6,821,461 | ) | |||||||||||
|
|
|
| |||||||||||
Distributions to Shareholders: | ||||||||||||||
Class A | (61,771 | ) | (51,458 | ) | ||||||||||
Class I | (5,635,775 | ) | (4,545,146 | ) | ||||||||||
|
|
|
| |||||||||||
Change in net assets resulting from shareholder distributions | (5,697,546 | ) | (4,596,604 | ) | ||||||||||
|
|
|
| |||||||||||
Capital Transactions: | ||||||||||||||
Proceeds from shares issued | 267,020 | 539,427 | ||||||||||||
Distributions reinvested | 5,338,948 | 4,204,758 | ||||||||||||
Cost of shares redeemed | (5,592,626 | ) | (8,302,754 | ) | ||||||||||
|
|
|
| |||||||||||
Change in net assets resulting from capital transactions | 13,342 | (3,558,569 | ) | |||||||||||
|
|
|
| |||||||||||
Net increase/(decrease) in net assets | 20,866,411 | (14,976,634 | ) | |||||||||||
Net Assets: | ||||||||||||||
Beginning of year | 53,932,581 | 68,909,215 | ||||||||||||
|
|
|
| |||||||||||
End of year | $ | 74,798,992 | $ | 53,932,581 | ||||||||||
|
|
|
| |||||||||||
Share Transactions: | ||||||||||||||
Issued | 12,840 | 35,940 | ||||||||||||
Reinvested | 303,383 | 220,635 | ||||||||||||
Redeemed | (287,924 | ) | (500,160 | ) | ||||||||||
|
|
|
| |||||||||||
Change in shares resulting from capital transactions | 28,299 | (243,585 | ) | |||||||||||
|
|
|
| |||||||||||
See Notes to the Financial Statements.
52
FINANCIAL STATEMENTS
|
Statements of Changes in Net Assets
| RBC Small Cap Core Fund | ||||||||||||||
| For the Year Ended September 30, 2021 | For the Year Ended September 30, 2020 | |||||||||||||
From Investment Activities | ||||||||||||||
Operations: | ||||||||||||||
Net investment income | $ | 313,807 | $ | 584,164 | ||||||||||
Net realized gains from investments | 28,330,487 | 24,432,805 | ||||||||||||
Net change in unrealized appreciation/(depreciation) on investments | 6,098,731 | (26,257,538 | ) | |||||||||||
|
|
|
| |||||||||||
Change in net assets resulting from operations | 34,743,025 | (1,240,569 | ) | |||||||||||
|
|
|
| |||||||||||
Distributions to Shareholders: | ||||||||||||||
Class A | (1,280,130 | ) | (371,626 | ) | ||||||||||
Class I | (18,388,491 | ) | (6,238,305 | ) | ||||||||||
Class R6 | (8,645 | ) | (1,783 | ) | ||||||||||
|
|
|
| |||||||||||
Change in net assets resulting from shareholder distributions | (19,677,266 | ) | (6,611,714 | ) | ||||||||||
|
|
|
| |||||||||||
Capital Transactions: | ||||||||||||||
Proceeds from shares issued | 43,371,432 | 11,184,277 | ||||||||||||
Distributions reinvested | 14,774,401 | 6,458,914 | ||||||||||||
Cost of shares redeemed | (82,232,425 | ) | (77,805,407 | ) | ||||||||||
|
|
|
| |||||||||||
Change in net assets resulting from capital transactions | (24,086,592 | ) | (60,162,216 | ) | ||||||||||
|
|
|
| |||||||||||
Net decrease in net assets | (9,020,833 | ) | (68,014,499 | ) | ||||||||||
Net Assets: | ||||||||||||||
Beginning of year | 75,096,620 | 143,111,119 | ||||||||||||
|
|
|
| |||||||||||
End of year | $ | 66,075,787 | $ | 75,096,620 | ||||||||||
|
|
|
| |||||||||||
Share Transactions: | ||||||||||||||
Issued | 1,274,925 | 385,723 | ||||||||||||
Reinvested | 509,657 | 199,802 | ||||||||||||
Redeemed | (2,502,601 | ) | (2,561,921 | ) | ||||||||||
|
|
|
| |||||||||||
Change in shares resulting from capital transactions | (718,019 | ) | (1,976,396 | ) | ||||||||||
|
|
|
| |||||||||||
See Notes to the Financial Statements.
53
FINANCIAL STATEMENTS
|
Statements of Changes in Net Assets
| RBC Microcap Value Fund | ||||||||||||||
| For the Year Ended September 30, 2021 | For the Year Ended September 30, 2020 | |||||||||||||
From Investment Activities | ||||||||||||||
Operations: | ||||||||||||||
Net investment income | $ | 1,158,079 | $ | 889,088 | ||||||||||
Net realized gains from investments | 6,606,449 | 6,854,265 | ||||||||||||
Net change in unrealized appreciation/(depreciation) on investments and foreign currency | 43,762,744 | (24,578,156 | ) | |||||||||||
|
|
|
| |||||||||||
Change in net assets resulting from operations | 51,527,272 | (16,834,803 | ) | |||||||||||
|
|
|
| |||||||||||
Distributions to Shareholders: | ||||||||||||||
Class A | (168,044 | ) | (216,383 | ) | ||||||||||
Class I | (6,936,894 | ) | (7,334,605 | ) | ||||||||||
|
|
|
| |||||||||||
Change in net assets resulting from shareholder distributions | (7,104,938 | ) | (7,550,988 | ) | ||||||||||
|
|
|
| |||||||||||
Capital Transactions: | ||||||||||||||
Proceeds from shares issued | 10,227,046 | 17,583,191 | ||||||||||||
Distributions reinvested | 6,539,860 | 6,833,581 | ||||||||||||
Cost of shares redeemed | (33,556,716 | ) | (21,368,994 | ) | ||||||||||
|
|
|
| |||||||||||
Change in net assets resulting from capital transactions | (16,789,810 | ) | 3,047,778 | |||||||||||
|
|
|
| |||||||||||
Net increase/(decrease) in net assets | 27,632,524 | (21,338,013 | ) | |||||||||||
Net Assets: | ||||||||||||||
Beginning of year | 95,179,133 | 116,517,146 | ||||||||||||
|
|
|
| |||||||||||
End of year | $ | 122,811,657 | $ | 95,179,133 | ||||||||||
|
|
|
| |||||||||||
Share Transactions: | ||||||||||||||
Issued | 351,797 | 809,719 | ||||||||||||
Reinvested | 261,482 | 257,668 | ||||||||||||
Redeemed | (1,234,923 | ) | (998,463 | ) | ||||||||||
|
|
|
| |||||||||||
Change in shares resulting from capital transactions | (621,644 | ) | 68,924 | |||||||||||
|
|
|
| |||||||||||
See Notes to the Financial Statements.
54
FINANCIAL STATEMENTS
|
Statements of Changes in Net Assets
| RBC Small Cap Value Fund | ||||||||||||||
| For the Year Ended September 30, 2021 | For the Year Ended September 30, 2020 | |||||||||||||
From Investment Activities | ||||||||||||||
Operations: | ||||||||||||||
Net investment income | $ | 925,295 | $ | 809,428 | ||||||||||
Net realized gains/(losses) from investments | 3,219,538 | (5,517,143 | ) | |||||||||||
Net change in unrealized appreciation/(depreciation) on investments | 20,703,358 | (9,796,038 | ) | |||||||||||
|
|
|
| |||||||||||
Change in net assets resulting from operations | 24,848,191 | (14,503,753 | ) | |||||||||||
|
|
|
| |||||||||||
Distributions to Shareholders: | ||||||||||||||
Class I | (653,215 | ) | (767,953 | ) | ||||||||||
Class R6 | (57,516 | ) | (98,525 | ) | ||||||||||
|
|
|
| |||||||||||
Change in net assets resulting from shareholder distributions | (710,731 | ) | (866,478 | ) | ||||||||||
|
|
|
| |||||||||||
Capital Transactions: | ||||||||||||||
Proceeds from shares issued | 24,517,896 | 30,112,909 | ||||||||||||
Distributions reinvested | 280,578 | 385,721 | ||||||||||||
Cost of shares redeemed | (21,895,071 | ) | (21,174,055 | ) | ||||||||||
|
|
|
| |||||||||||
Change in net assets resulting from capital transactions | 2,903,403 | 9,324,575 | ||||||||||||
|
|
|
| |||||||||||
Net increase/(decrease) in net assets | 27,040,863 | (6,045,656 | ) | |||||||||||
Net Assets: | ||||||||||||||
Beginning of year | 56,918,570 | 62,964,226 | ||||||||||||
|
|
|
| |||||||||||
End of year | $ | 83,959,433 | $ | 56,918,570 | ||||||||||
|
|
|
| |||||||||||
Share Transactions: | ||||||||||||||
Issued | 1,846,099 | 2,734,159 | ||||||||||||
Reinvested | 23,393 | 29,182 | ||||||||||||
Redeemed | (1,649,370 | ) | (2,124,251 | ) | ||||||||||
|
|
|
| |||||||||||
Change in shares resulting from capital transactions | 220,122 | 639,090 | ||||||||||||
|
|
|
| |||||||||||
See Notes to the Financial Statements.
55
|
RBC SMID Cap Growth Fund
(Selected data for a share outstanding throughout the periods indicated)
| Investment Activities | Distributions | |||||||||||||||||||||||||||||||||||
| Net Asset Value, Beginning of Year | Net Investment Loss(a) | Net Realized and Unrealized Gains (Losses) on Investments | Redemption Fees | Total from Investment Activities | Net Investment Income | Net Realized Gains | Total Distributions | Net Asset Value, End of Year | ||||||||||||||||||||||||||||
Class A | ||||||||||||||||||||||||||||||||||||
Year Ended 9/30/21 | $12.60 | (0.09 | ) | 4.93 | —(b | ) | 4.84 | — | (0.46 | ) | (0.46 | ) | $16.98 | |||||||||||||||||||||||
Year Ended 9/30/20 | 13.04 | (0.06 | ) | 0.72 | —(b | ) | 0.66 | — | (1.10 | ) | (1.10 | ) | 12.60 | |||||||||||||||||||||||
Year Ended 9/30/19 | 14.39 | (0.06 | ) | (0.18 | ) | —(b | ) | (0.24 | ) | — | (1.11 | ) | (1.11 | ) | 13.04 | |||||||||||||||||||||
Year Ended 9/30/18 | 14.72 | (0.07 | ) | 2.85 | —(b | ) | 2.78 | — | (3.11 | ) | (3.11 | ) | 14.39 | |||||||||||||||||||||||
Year Ended 9/30/17 | 13.92 | (0.07 | ) | 1.91 | —(b | ) | 1.84 | — | (1.04 | ) | (1.04 | ) | 14.72 | |||||||||||||||||||||||
Class I | ||||||||||||||||||||||||||||||||||||
Year Ended 9/30/21 | $14.73 | (0.05 | ) | 5.76 | —(b | ) | 5.71 | — | (0.46 | ) | (0.46 | ) | $19.98 | |||||||||||||||||||||||
Year Ended 9/30/20 | 15.02 | (0.03 | ) | 0.84 | —(b | ) | 0.81 | — | (1.10 | ) | (1.10 | ) | 14.73 | |||||||||||||||||||||||
Year Ended 9/30/19 | 16.33 | (0.04 | ) | (0.16 | ) | — | (0.20 | ) | — | (1.11 | ) | (1.11 | ) | 15.02 | ||||||||||||||||||||||
Year Ended 9/30/18 | 16.26 | (0.04 | ) | 3.22 | —(b | ) | 3.18 | — | (3.11 | ) | (3.11 | ) | 16.33 | |||||||||||||||||||||||
Year Ended 9/30/17 | 15.24 | (0.04 | ) | 2.10 | —(b | ) | 2.06 | — | (1.04 | ) | (1.04 | ) | 16.26 | |||||||||||||||||||||||
Class R6 | ||||||||||||||||||||||||||||||||||||
Year Ended 9/30/21 | $14.76 | (0.05 | ) | 5.79 | — | 5.74 | — | (0.46 | ) | (0.46 | ) | $20.04 | ||||||||||||||||||||||||
Year Ended 9/30/20 | 15.05 | (0.02 | ) | 0.83 | — | 0.81 | — | (1.10 | ) | (1.10 | ) | 14.76 | ||||||||||||||||||||||||
Year Ended 9/30/19 | 16.35 | (0.03 | ) | (0.16 | ) | — | (0.19 | ) | — | (1.11 | ) | (1.11 | ) | 15.05 | ||||||||||||||||||||||
Year Ended 9/30/18 | 16.27 | (0.04 | ) | 3.23 | — | 3.19 | — | (3.11 | ) | (3.11 | ) | 16.35 | ||||||||||||||||||||||||
Period Ended 9/30/17(c) | 15.30 | (0.03 | ) | 2.04 | — | 2.01 | — | (1.04 | ) | (1.04 | ) | 16.27 | ||||||||||||||||||||||||
| (a) | Per share net investment income (loss) has been calculated using the average daily shares method. |
| (b) | Less than $0.01 or $(0.01) per share. |
| (c) | For the period from November 21, 2016 (commencement of operations) to September 30, 2017. |
56
FINANCIAL HIGHLIGHTS
|
RBC SMID Cap Growth Fund
(Selected data for a share outstanding throughout the periods indicated)
| Ratios/Supplemental Data | ||||||||||||||||||||||||||||||
| Total Return(a)(b) | Net Assets, End of Year (000’s) | Ratio of Net Expenses to Average Net Assets | Ratio of Net Investment Income (Loss) to Average Net Assets | Ratio of Expenses to Average Net Assets* | Portfolio Turnover Rate** | |||||||||||||||||||||||||
Class A | ||||||||||||||||||||||||||||||
Year Ended 9/30/21 | 38.95% | $ 14,318 | 1.07 | % | (0.54 | )% | 1.26 | % | 28 | %(c) | ||||||||||||||||||||
Year Ended 9/30/20 | 4.90% | 11,553 | 1.07 | % | (0.45 | )% | 1.37 | % | 15 | % | ||||||||||||||||||||
Year Ended 9/30/19 | 0.41% | 12,059 | 1.07 | % | (0.51 | )% | 1.38 | % | 17 | % | ||||||||||||||||||||
Year Ended 9/30/18 | 22.67% | 12,966 | 1.07 | % | (0.53 | )% | 1.40 | % | 22 | % | ||||||||||||||||||||
Year Ended 9/30/17 | 14.18% | 11,600 | 1.10 | % | (0.50 | )% | 1.50 | % | 18 | % | ||||||||||||||||||||
Class I | ||||||||||||||||||||||||||||||
Year Ended 9/30/21 | 39.23% | $ 81,239 | 0.82 | % | (0.29 | )% | 0.99 | % | 28 | %(c) | ||||||||||||||||||||
Year Ended 9/30/20 | 5.27% | 83,211 | 0.82 | % | (0.20 | )% | 1.03 | % | 15 | % | ||||||||||||||||||||
Year Ended 9/30/19 | 0.62% | 81,193 | 0.82 | % | (0.26 | )% | 0.99 | % | 17 | % | ||||||||||||||||||||
Year Ended 9/30/18 | 23.04% | 83,437 | 0.82 | % | (0.28 | )% | 0.98 | % | 22 | % | ||||||||||||||||||||
Year Ended 9/30/17 | 14.40% | 65,463 | 0.85 | % | (0.26 | )% | 1.07 | % | 18 | % | ||||||||||||||||||||
Class R6 | ||||||||||||||||||||||||||||||
Year Ended 9/30/21 | 39.36% | $ 21 | 0.77 | % | (0.25 | )% | 19.28 | % | 28 | %(c) | ||||||||||||||||||||
Year Ended 9/30/20 | 5.26% | 15 | 0.77 | % | (0.16 | )% | 25.69 | % | 15 | % | ||||||||||||||||||||
Year Ended 9/30/19 | 0.69% | 14 | 0.77 | % | (0.21 | )% | 27.43 | % | 17 | % | ||||||||||||||||||||
Year Ended 9/30/18 | 23.09% | 14 | 0.77 | % | (0.23 | )% | 29.30 | % | 22 | % | ||||||||||||||||||||
Period Ended 9/30/17(d) | 14.03%(e) | 11 | 0.80 | %(f) | (0.22 | )%(f) | 50.53 | %(f) | 18 | % | ||||||||||||||||||||
| * | During the period, certain fees were contractually or voluntarily reduced and/or reimbursed. If such contractual/voluntary fee reductions and reimbursements had not occurred, the ratio would have been as indicated. |
| ** | Portfolio turnover rate is calculated on the basis of the Fund as a whole without distinguishing between the classes of shares issued. |
| (a) | Excludes sales charge. |
| (b) | Assumes investment at net asset value at the beginning of the period, reinvestment of all dividends and distributions, and a complete redemption of the investment at net asset value at the end of the period. |
| (c) | Portfolio turnover rate excludes in-kind transactions. |
| (d) | For the period from November 21, 2016 (commencement of operations) to September 30, 2017. |
| (e) | Not annualized. |
| (f) | Annualized. |
See Notes to the Financial Statements.
57
FINANCIAL HIGHLIGHTS
|
RBC Enterprise Fund
(Selected data for a share outstanding throughout the periods indicated)
| Investment Activities | Distributions | |||||||||||||||||||||||||||||||||
| Net Asset Value, Beginning of Year | Net Investment Income/ (Loss)(a) | Net Realized and Unrealized Gains (Losses) on Investments | Redemption Fees | Total from Investment Activities | Net Investment Income | Net Realized Gains | Total Distributions | Net Asset Value, End of Year | ||||||||||||||||||||||||||
Class A | ||||||||||||||||||||||||||||||||||
Year Ended 9/30/21 | $14.65 | 0.04 | 6.98 | —(b) | 7.02 | —(b) | (1.63 | ) | (1.63 | ) | $20.04 | |||||||||||||||||||||||
Year Ended 9/30/20 | 17.59 | 0.03 | (1.70 | ) | —(b) | (1.67 | ) | — | (1.27 | ) | (1.27 | ) | 14.65 | |||||||||||||||||||||
Year Ended 9/30/19 | 23.38 | (0.05 | ) | (3.17 | ) | — | (3.22 | ) | — | (2.57 | ) | (2.57 | ) | 17.59 | ||||||||||||||||||||
Year Ended 9/30/18 | 26.86 | (0.13 | ) | 1.70 | —(b) | 1.57 | — | (5.05 | ) | (5.05 | ) | 23.38 | ||||||||||||||||||||||
Year Ended 9/30/17 | 21.49 | (0.09 | ) | 5.68 | —(b) | 5.59 | (0.01 | ) | (0.21 | ) | (0.22 | ) | 26.86 | |||||||||||||||||||||
Class I | ||||||||||||||||||||||||||||||||||
Year Ended 9/30/21 | $15.51 | 0.09 | 7.41 | —(b) | 7.50 | (0.04 | ) | (1.63 | ) | (1.67 | ) | $21.34 | ||||||||||||||||||||||
Year Ended 9/30/20 | 18.52 | 0.07 | (1.79 | ) | —(b) | (1.72 | ) | (0.01 | ) | (1.28 | ) | (1.29 | ) | 15.51 | ||||||||||||||||||||
Year Ended 9/30/19 | 24.39 | (0.01 | ) | (3.29 | ) | —(b) | (3.30 | ) | — | (2.57 | ) | (2.57 | ) | 18.52 | ||||||||||||||||||||
Year Ended 9/30/18 | 27.74 | (0.07 | ) | 1.77 | —(b) | 1.70 | — | (5.05 | ) | (5.05 | ) | 24.39 | ||||||||||||||||||||||
Year Ended 9/30/17 | 22.17 | (0.03 | ) | 5.87 | —(b) | 5.84 | (0.06 | ) | (0.21 | ) | (0.27 | ) | 27.74 | |||||||||||||||||||||
| (a) | Per share net investment income (loss) has been calculated using the average daily shares method. |
| (b) | Less than $0.01 or $(0.01) per share. |
58
FINANCIAL HIGHLIGHTS
|
RBC Enterprise Fund
(Selected data for a share outstanding throughout the periods indicated)
| Ratios/Supplemental Data | ||||||||||||||||||||||||
| Total Return(a)(b) | Net Assets, End of Year (000’s) | Ratio of Net Expenses to Average Net Assets | Ratio of Net Investment Income (Loss) to Average Net Assets | Ratio of Expenses to Average Net Assets* | Portfolio Turnover Rate** | |||||||||||||||||||
Class A | ||||||||||||||||||||||||
Year Ended 9/30/21 | 50.27% | $ 803 | 1.33% | 0.21% | 2.15% | 19% | ||||||||||||||||||
Year Ended 9/30/20 | (10.85)% | 553 | 1.33% | 0.19% | 2.35% | 25% | ||||||||||||||||||
Year Ended 9/30/19 | (11.52)% | 787 | 1.33% | (0.28)% | 2.13% | 20% | ||||||||||||||||||
Year Ended 9/30/18 | 6.79% | 963 | 1.33% | (0.54)% | 1.95% | 15% | ||||||||||||||||||
Year Ended 9/30/17 | 26.15% | 1,445 | 1.33% | (0.39)% | 1.96% | 26% | ||||||||||||||||||
Class I | ||||||||||||||||||||||||
Year Ended 9/30/21 | 50.67% | $ 73,996 | 1.08% | 0.45% | 1.25% | 19% | ||||||||||||||||||
Year Ended 9/30/20 | (10.64)% | 53,380 | 1.08% | 0.44% | 1.38% | 25% | ||||||||||||||||||
Year Ended 9/30/19 | (11.35)% | 68,122 | 1.08% | (0.05)% | 1.30% | 20% | ||||||||||||||||||
Year Ended 9/30/18 | 7.08% | 85,550 | 1.08% | (0.30)% | 1.23% | 15% | ||||||||||||||||||
Year Ended 9/30/17 | 26.51% | 89,379 | 1.08% | (0.11)% | 1.28% | 26% | ||||||||||||||||||
| * | During the period, certain fees were contractually or voluntarily reduced and/or reimbursed. If such contractual/voluntary fee reductions and reimbursements had not occurred, the ratio would have been as indicated. |
| ** | Portfolio turnover rate is calculated on the basis of the Fund as a whole without distinguishing between the classes of shares issued. |
| (a) | Excludes sales charge. |
| (b) | Assumes investment at net asset value at the beginning of the period, reinvestment of all dividends and distributions, and a complete redemption of the investment at net asset value at the end of the period. |
See Notes to the Financial Statements.
59
FINANCIAL HIGHLIGHTS
|
RBC Small Cap Core Fund
(Selected data for a share outstanding throughout the periods indicated)
| Investment Activities | Distributions | |||||||||||||||||||||||||||||||||||
| Net Asset Value, Beginning of Year | Net Investment Income/ (Loss)(a) | Net Realized and Unrealized Gains (Losses) on Investments | Redemption Fees | Total from Investment Activities | Net Investment Income | Net Realized Gains | Total Distributions | Net Asset Value, End of Year | ||||||||||||||||||||||||||||
Class A | ||||||||||||||||||||||||||||||||||||
Year Ended 9/30/21 | $26.44 | 0.07 | 10.46 | 0.01 | 10.54 | (0.01 | ) | (5.54 | ) | (5.55 | ) | $31.43 | ||||||||||||||||||||||||
Year Ended 9/30/20 | 29.14 | 0.11 | (1.27 | ) | — | (1.16 | ) | — | (1.54 | ) | (1.54 | ) | 26.44 | |||||||||||||||||||||||
Year Ended 9/30/19 | 39.96 | (0.05 | ) | (6.83 | ) | —(b) | (6.88 | ) | — | (3.94 | ) | (3.94 | ) | 29.14 | ||||||||||||||||||||||
Year Ended 9/30/18 | 38.85 | (0.12 | ) | 2.38 | — | 2.26 | — | (1.15 | ) | (1.15 | ) | 39.96 | ||||||||||||||||||||||||
Year Ended 9/30/17 | 33.53 | (0.04 | ) | 5.36 | —(b) | 5.32 | — | — | — | 38.85 | ||||||||||||||||||||||||||
Class I | ||||||||||||||||||||||||||||||||||||
Year Ended 9/30/21 | $27.97 | 0.12 | 11.16 | 0.01 | 11.29 | (0.07 | ) | (5.54 | ) | (5.61 | ) | $33.65 | ||||||||||||||||||||||||
Year Ended 9/30/20 | 30.70 | 0.17 | (1.34 | ) | —(b) | (1.17 | ) | (0.02 | ) | (1.54 | ) | (1.56 | ) | 27.97 | ||||||||||||||||||||||
Year Ended 9/30/19 | 41.71 | 0.03 | (7.10 | ) | —(b) | (7.07 | ) | — | (3.94 | ) | (3.94 | ) | 30.70 | |||||||||||||||||||||||
Year Ended 9/30/18 | 40.42 | (0.02 | ) | 2.48 | — | 2.46 | (0.01 | ) | (1.16 | ) | (1.17 | ) | 41.71 | |||||||||||||||||||||||
Year Ended 9/30/17 | 34.85 | 0.04 | 5.59 | —(b) | 5.63 | (0.06 | ) | — | (0.06 | ) | 40.42 | |||||||||||||||||||||||||
Class R6 | ||||||||||||||||||||||||||||||||||||
Year Ended 9/30/21 | $28.01 | 0.21 | 11.11 | — | 11.32 | (0.09 | ) | (5.54 | ) | (5.63 | ) | $33.70 | ||||||||||||||||||||||||
Year Ended 9/30/20 | 30.72 | 0.15 | (1.31 | ) | — | (1.16 | ) | (0.01 | ) | (1.54 | ) | (1.55 | ) | 28.01 | ||||||||||||||||||||||
Year Ended 9/30/19 | 41.78 | 0.08 | (7.20 | ) | — | (7.12 | ) | — | (3.94 | ) | (3.94 | ) | 30.72 | |||||||||||||||||||||||
Year Ended 9/30/18 | 40.46 | —(b | ) | 2.47 | — | 2.47 | — | (1.15 | ) | (1.15 | ) | 41.78 | ||||||||||||||||||||||||
Period Ended 9/30/17(c) | 37.08 | (0.11 | ) | 3.52 | — | 3.41 | (0.03 | ) | — | (0.03 | ) | 40.46 | ||||||||||||||||||||||||
| (a) | Per share net investment income (loss) has been calculated using the average daily shares method. |
| (b) | Less than $0.01 or $(0.01) per share. |
| (c) | For the period from November 21, 2016 (commencement of operations) to September 30, 2017. |
60
FINANCIAL HIGHLIGHTS
|
RBC Small Cap Core Fund
(Selected data for a share outstanding throughout the periods indicated)
| Ratios/Supplemental Data | ||||||||||||||||||||||||
| Total Return(a)(b) | Net Assets, End of Year (000’s) | Ratio of Net Expenses to Average Net Assets | Ratio of Net Investment Income (Loss) to Average Net Assets | Ratio of Expenses to Average Net Assets* | Portfolio Turnover Rate** | |||||||||||||||||||
Class A | ||||||||||||||||||||||||
Year Ended 9/30/21 | 43.04% | $ 7,692 | 1.15% | 0.24% | 1.52% | 81%(c) | ||||||||||||||||||
Year Ended 9/30/20 | (4.71)% | 6,200 | 1.15% | 0.40% | 1.55% | 40% | ||||||||||||||||||
Year Ended 9/30/19 | (15.57)% | 7,004 | 1.15% | (0.16)% | 1.46% | 28% | ||||||||||||||||||
Year Ended 9/30/18 | 5.80% | 12,012 | 1.15% | (0.29)% | 1.37% | 24% | ||||||||||||||||||
Year Ended 9/30/17 | 15.87% | 14,574 | 1.15% | (0.11)% | 1.47% | 29% | ||||||||||||||||||
Class I | ||||||||||||||||||||||||
Year Ended 9/30/21 | 43.46% | $ 53,689 | 0.90% | 0.38% | 1.16% | 81%(c) | ||||||||||||||||||
Year Ended 9/30/20 | (4.49)% | 68,845 | 0.90% | 0.59% | 1.18% | 40% | ||||||||||||||||||
Year Ended 9/30/19 | (15.35)% | 136,072 | 0.90% | 0.10% | 1.11% | 28% | ||||||||||||||||||
Year Ended 9/30/18 | 6.06% | 249,678 | 0.90% | (0.05)% | 1.05% | 24% | ||||||||||||||||||
Year Ended 9/30/17 | 16.18% | 274,434 | 0.90% | 0.10% | 1.15% | 29% | ||||||||||||||||||
Class R6 | ||||||||||||||||||||||||
Year Ended 9/30/21 | 43.52% | $ 4,695 | 0.87% | 0.61% | 1.25% | 81%(c) | ||||||||||||||||||
Year Ended 9/30/20 | (4.46)% | 52 | 0.87% | 0.52% | 10.94% | 40% | ||||||||||||||||||
Year Ended 9/30/19 | (15.46)% | 35 | 0.87% | 0.25% | 11.85% | 28% | ||||||||||||||||||
Year Ended 9/30/18 | 6.10% | 92 | 0.87% | (0.01)% | 1.30% | 24% | ||||||||||||||||||
Period Ended 9/30/17(d) | 9.21%(e | ) | 1,041 | 0.87%(f) | (0.33)%(f) | 6.88%(f) | 29% | |||||||||||||||||
| * | During the period, certain fees were contractually or voluntarily reduced and/or reimbursed. If such contractual/voluntary fee reductions and reimbursements had not occurred, the ratio would have been as indicated. |
| ** | Portfolio turnover rate is calculated on the basis of the Fund as a whole without distinguishing between the classes of shares issued. |
| (a) | Excludes sales charge. |
| (b) | Assumes investment at net asset value at the beginning of the period, reinvestment of all dividends and distributions, and a complete redemption of the investment at net asset value at the end of the period. |
| (c) | Portfolio turnover rate excludes in-kind transactions. |
| (d) | For the period from November 21, 2016 (commencement of operations) to September 30, 2017. |
| (e) | Not annualized. |
| (f) | Annualized. |
See Notes to the Financial Statements.
61
FINANCIAL HIGHLIGHTS
|
RBC Microcap Value Fund
(Selected data for a share outstanding throughout the periods indicated)
| Investment Activities | Distributions | |||||||||||||||||||||||||||||||||||
| Net Asset Value, Beginning of Year | Net Investment Income(a) | Net Realized and Unrealized Gains (Losses) on Investments | Redemption Fees | Total from Investment Activities | Net Investment Income | Net Realized Gains | Total Distributions | Net Asset Value, End of Year | ||||||||||||||||||||||||||||
Class A | ||||||||||||||||||||||||||||||||||||
Year Ended 9/30/21 | $21.34 | 0.20 | 12.02 | —(b) | 12.22 | (0.20) | (1.37) | (1.57) | $31.99 | |||||||||||||||||||||||||||
Year Ended 9/30/20 | 26.52 | 0.14 | (3.65 | ) | —(b) | (3.51 | ) | (0.23) | (1.44) | (1.67) | 21.34 | |||||||||||||||||||||||||
Year Ended 9/30/19 | 31.95 | 0.23 | (2.89 | ) | —(b) | (2.66 | ) | (0.21) | (2.56) | (2.77) | 26.52 | |||||||||||||||||||||||||
Year Ended 9/30/18 | 32.91 | 0.16 | 2.01 | —(b) | 2.17 | (0.08) | (3.05) | (3.13) | 31.95 | |||||||||||||||||||||||||||
Year Ended 9/30/17 | 29.05 | 0.09 | 5.45 | —(b) | 5.54 | (0.07) | (1.61) | (1.68) | 32.91 | |||||||||||||||||||||||||||
Class I | ||||||||||||||||||||||||||||||||||||
Year Ended 9/30/21 | $21.35 | 0.29 | 12.00 | —(b) | 12.29 | (0.26) | (1.37) | (1.63) | $32.01 | |||||||||||||||||||||||||||
Year Ended 9/30/20 | 26.55 | 0.20 | (3.65 | ) | —(b) | (3.45 | ) | (0.31) | (1.44) | (1.75) | 21.35 | |||||||||||||||||||||||||
Year Ended 9/30/19 | 32.01 | 0.30 | (2.91 | ) | — | (2.61 | ) | (0.29) | (2.56) | (2.85) | 26.55 | |||||||||||||||||||||||||
Year Ended 9/30/18 | 32.97 | 0.23 | 2.03 | —(b) | 2.26 | (0.17) | (3.05) | (3.22) | 32.01 | |||||||||||||||||||||||||||
Year Ended 9/30/17 | 29.10 | 0.17 | 5.46 | —(b) | 5.63 | (0.15) | (1.61) | (1.76) | 32.97 | |||||||||||||||||||||||||||
| (a) | Per share net investment income (loss) has been calculated using the average daily shares method. |
| (b) | Less than $0.01 or $(0.01) per share. |
62
FINANCIAL HIGHLIGHTS
|
RBC Microcap Value Fund
(Selected data for a share outstanding throughout the periods indicated)
| Ratios/Supplemental Data | ||||||||||||||||||||||||
| Total Return(a)(b) | Net Assets, End of Year (000’s) | Ratio of Net Expenses to Average Net Assets | Ratio of Net Investment Income (Loss) to Average Net Assets | Ratio of Expenses to Average Net Assets* | Portfolio Turnover Rate** | |||||||||||||||||||
Class A | ||||||||||||||||||||||||
Year Ended 9/30/21 | 59.29% | $ 3,420 | 1.32% | 0.70% | 1.62% | 11% | ||||||||||||||||||
Year Ended 9/30/20 | (14.48)% | 2,293 | 1.32% | 0.60% | 1.80% | 20% | ||||||||||||||||||
Year Ended 9/30/19 | (7.16)% | 3,597 | 1.32% | 0.86% | 1.68% | 9% | ||||||||||||||||||
Year Ended 9/30/18 | 7.12% | 6,477 | 1.32% | 0.50% | 1.64% | 5% | ||||||||||||||||||
Year Ended 9/30/17 | 19.32% | 7,276 | 1.32% | 0.31% | 1.75% | 9% | ||||||||||||||||||
Class I | ||||||||||||||||||||||||
Year Ended 9/30/21 | 59.69% | $119,392 | 1.07% | 1.00% | 1.19% | 11% | ||||||||||||||||||
Year Ended 9/30/20 | (14.29)% | 92,886 | 1.07% | 0.87% | 1.27% | 20% | ||||||||||||||||||
Year Ended 9/30/19 | (6.92)% | 112,921 | 1.07% | 1.12% | 1.20% | 9% | ||||||||||||||||||
Year Ended 9/30/18 | 7.41% | 130,155 | 1.07% | 0.74% | 1.18% | 5% | ||||||||||||||||||
Year Ended 9/30/17 | 19.62% | 139,635 | 1.07% | 0.56% | 1.25% | 9% | ||||||||||||||||||
| * | During the period, certain fees were contractually or voluntarily reduced and/or reimbursed. If such contractual/voluntary fee reductions and reimbursements had not occurred, the ratio would have been as indicated. |
| ** | Portfolio turnover rate is calculated on the basis of the Fund as a whole without distinguishing between the classes of shares issued. |
| (a) | Excludes sales charge. |
| (b) | Assumes investment at net asset value at the beginning of the period, reinvestment of all dividends and distributions, and a complete redemption of the investment at net asset value at the end of the period. |
See Notes to the Financial Statements.
63
FINANCIAL HIGHLIGHTS
|
RBC Small Cap Value Fund
(Selected data for a share outstanding throughout the periods indicated)
| Investment Activities | Distributions | |||||||||||||||||||||||||||||||||||
| Net Asset Value, Beginning of Year | Net Investment Income(a) | Net Realized and Unrealized Gains (Losses) on Investments | Redemption Fees | Total from Investment Activities | Net Investment Income | Net Realized Gains | Total Distributions | Net Asset Value, End of Year | ||||||||||||||||||||||||||||
Class A | ||||||||||||||||||||||||||||||||||||
Period Ended 9/30/21(b) | $12.61 | 0.09 | 1.26 | — | 1.35 | — | — | — | $13.96 | |||||||||||||||||||||||||||
Class I | ||||||||||||||||||||||||||||||||||||
Year Ended 9/30/21 | $ 9.84 | 0.15 | 4.11 | — | 4.26 | (0.12 | ) | — | (0.12 | ) | $13.98 | |||||||||||||||||||||||||
Year Ended 9/30/20 | 12.24 | 0.15 | (2.39 | ) | —(c) | (2.24 | ) | (0.16 | ) | — | (0.16 | ) | 9.84 | |||||||||||||||||||||||
Year Ended 9/30/19 | 13.63 | 0.11 | (1.13 | ) | —(c) | (1.02 | ) | (0.09 | ) | (0.28 | ) | (0.37 | ) | 12.24 | ||||||||||||||||||||||
Year Ended 9/30/18 | 13.43 | 0.10 | 0.47 | —(c) | 0.57 | (0.08 | ) | (0.29 | ) | (0.37 | ) | 13.63 | ||||||||||||||||||||||||
Year Ended 9/30/17 | 11.33 | 0.06 | 2.31 | —(c) | 2.37 | (0.05 | ) | (0.22 | ) | (0.27 | ) | 13.43 | ||||||||||||||||||||||||
Class R6 | ||||||||||||||||||||||||||||||||||||
Year Ended 9/30/21 | $ 9.90 | 0.16 | 4.14 | — | 4.30 | (0.13 | ) | — | (0.13 | ) | $14.07 | |||||||||||||||||||||||||
Year Ended 9/30/20 | 12.31 | 0.16 | (2.40 | ) | — | (2.24 | ) | (0.17 | ) | — | (0.17 | ) | 9.90 | |||||||||||||||||||||||
Year Ended 9/30/19 | 13.71 | 0.13 | (1.15 | ) | — | (1.02 | ) | (0.10 | ) | (0.28 | ) | (0.38 | ) | 12.31 | ||||||||||||||||||||||
Year Ended 9/30/18 | 13.51 | 0.11 | 0.46 | — | 0.57 | (0.08 | ) | (0.29 | ) | (0.37 | ) | 13.71 | ||||||||||||||||||||||||
Period Ended 9/30/17(d) | 12.26 | 0.06 | 1.41 | — | 1.47 | — | (0.22 | ) | (0.22 | ) | 13.51 | |||||||||||||||||||||||||
| (a) | Per share net investment income (loss) has been calculated using the average daily shares method. |
| (b) | For the period from January 28, 2021 (commencement of operations) to September 30, 2021. |
| (c) | Less than $0.01 or $(0.01) per share. |
| (d) | For the period from November 21, 2016 (commencement of operations) to September 30, 2017. |
64
FINANCIAL HIGHLIGHTS
|
RBC Small Cap Value Fund
(Selected data for a share outstanding throughout the periods indicated)
| Ratios/Supplemental Data | ||||||||||||||||||||||||
| Total Return(a)(b) | Net Assets, End of Year (000’s) | Ratio of Net Expenses to Average Net Assets | Ratio of Net Investment Income (Loss) to Average Net Assets | Ratio of Expenses to Average Net Assets* | Portfolio Turnover Rate** | |||||||||||||||||||
Class A | ||||||||||||||||||||||||
Period Ended 9/30/21(c) | 10.71%(d) | $ 11 | 1.10%(e) | 1.01%(e) | 37.36%(e) | 61% | ||||||||||||||||||
Class I | ||||||||||||||||||||||||
Year Ended 9/30/21 | 43.48% | $ 77,582 | 0.85% | 1.17% | 1.09% | 61% | ||||||||||||||||||
Year Ended 9/30/20 | (18.62)% | 52,496 | 0.85% | 1.34% | 1.15% | 77% | ||||||||||||||||||
Year Ended 9/30/19 | (6.91)% | 55,686 | 0.85% | 0.95% | 0.98% | 52% | ||||||||||||||||||
Year Ended 9/30/18 | 4.24% | 144,979 | 0.91%(f) | 0.75% | 0.99% | 29% | ||||||||||||||||||
Year Ended 9/30/17 | 21.10% | 72,852 | 1.00% | 0.48% | 1.19% | 35% | ||||||||||||||||||
Class R6 | ||||||||||||||||||||||||
Year Ended 9/30/21 | 43.64% | $ 6,366 | 0.80% | 1.21% | 1.03% | 61% | ||||||||||||||||||
Year Ended 9/30/20 | (18.56)% | 4,423 | 0.80% | 1.40% | 1.07% | 77% | ||||||||||||||||||
Year Ended 9/30/19 | (6.89)% | 7,278 | 0.80% | 1.07% | 0.95% | 52% | ||||||||||||||||||
Year Ended 9/30/18 | 4.22% | 8,242 | 0.87%(f) | 0.83% | 0.98% | 29% | ||||||||||||||||||
Period Ended 9/30/17(g) | 12.10%(d) | 5,956 | 0.95%(e) | 0.56%(e) | 1.31%(e) | 35% | ||||||||||||||||||
| * | During the period, certain fees were contractually or voluntarily reduced and/or reimbursed. If such contractual/voluntary fee reductions and reimbursements had not occurred, the ratio would have been as indicated. |
| ** | Portfolio turnover rate is calculated on the basis of the Fund as a whole without distinguishing between the classes of shares issued. |
| (a) | Excludes sales charge. |
| (b) | Assumes investment at net asset value at the beginning of the period, reinvestment of all dividends and distributions, and a complete redemption of the investment at net asset value at the end of the period. |
| (c) | For the period from January 28, 2021 (commencement of operations) to September 30, 2021. |
| (d) | Not annualized. |
| (e) | Annualized. |
| (f) | Beginning July 2, 2018, the net operating expenses were contractually limited to 0.85% and 0.80% of average daily net assets for Class I and Class R6, respectively. The ratio of net expenses to average net assets represents a blended percentage for the period ended September 30, 2018. |
| (g) | For the period from November 21, 2016 (commencement of operations) to September 30, 2017. |
See Notes to the Financial Statements.
65
|
September 30, 2021
1. Organization:
RBC Funds Trust (the “Trust”) is registered under the Investment Company Act of 1940 (as amended) as an open-end management investment company. The Trust was organized as a Delaware statutory trust on December 16, 2003 and currently consists of 16 portfolios. Overall responsibility for the management of the Trust is vested in its Board of Trustees (the “Board”). Predecessor funds to the Trust were reorganized as portfolios of the Trust effective April 16, 2004. This report includes the following five investment portfolios (each a “Fund” and collectively, the “Funds”):
- RBC SMID Cap Growth Fund (“SMID Cap Growth Fund”)
- RBC Enterprise Fund (“Enterprise Fund”)
- RBC Small Cap Core Fund (“Small Cap Core Fund”)
- RBC Microcap Value Fund (“Microcap Value Fund”)
- RBC Small Cap Value Fund (“Small Cap Value Fund”)
The SMID Cap Growth, Small Cap Core and Small Cap Value Funds offer three share classes: Class A, Class R6 and Class I shares. The Enterprise and Microcap Value Funds offer two share classes: Class A and Class I shares. Class A shares are offered with a 5.75% maximum front-end sales charge and a 1.00% contingent deferred sales charge (“CDSC”) for redemption within 12 months of a $1 million or greater purchase on which no front-end sales charge was paid. Class I and Class R6 shares (intended for investors meeting certain investment minimum thresholds) are not subject to either a front-end sales charge or a CDSC.
RBC Global Asset Management (U.S.) Inc. (”RBC GAM-US“ or ”Advisor“ or ”Co-Administrator“) acts as the investment advisor for the Funds. The officers of the Trust (“Fund Management”) are also employees of RBC GAM-US.
2. Significant Accounting Policies
Each Fund is an investment company that follows accounting and reporting guidance under the Financial Accounting Standards Board. Summarized below are the significant accounting policies of the Funds. These policies conform to accounting principles generally accepted in the United States of America (“U.S. GAAP”). Fund Management follows these policies when preparing financial statements. Fund Management may also be required to make estimates and assumptions that affect the reported amounts of assets and liabilities at the date of the financial statements and the reported amounts of income and expenses for the period. Actual results could differ from those estimates. The financial statements are as of the close of regular trading on the New York Stock Exchange (“NYSE”).
Security Valuation:
The Board has adopted pricing and valuation procedures for determining the fair value of each Fund’s investments. Fair value of a security is considered to be the price that a fund might reasonably expect to receive upon its current sale in an orderly transaction between market participants.
Equity securities are generally valued on the basis of prices furnished by third-party pricing services approved by the Board. Equity securities listed on one or more exchanges shall be valued at the last available quoted sale price on the primary trading exchange as of the regularly scheduled closing time of the exchange and are categorized as Level 1 in the fair value hierarchy. (See “Fair Value Measurements” below for additional information). An equity security not listed on an exchange but listed on NASDAQ shall be valued at the NASDAQ official closing price and is also categorized as Level 1. If there was no sale on the primary exchange on the day the net asset value is calculated or a NASDAQ official closing price is not available, the most recent bid quotation generally will be used and such securities will generally be categorized as Level 2. Investments in open-end investment companies (mutual funds) are valued at net asset value and are categorized as Level 1 in the fair value hierarchy.
Fixed income securities, including to-be-announced (“TBA”) commitments and municipal bonds, are generally valued based on evaluated prices received from third-party pricing services or from broker-dealers who make markets in the securities and are generally categorized as Level 2 in the fair
66
NOTES TO FINANCIAL STATEMENTS |
value hierarchy (see “Fair Value Measurements” below for additional information). The pricing services utilize both dealer-supplied valuations and electronic data processing techniques that take into account multiple appropriate factors such as institutional-size trading in similar groups of securities, market spreads, interest rates, and fundamental security analytical data including yield, quality, coupon rate, maturity and type of issue.
Foreign securities valued in non-U.S. dollars are valued in the foreign currency and then converted into the U.S. dollar equivalent using the foreign exchange rate in effect at the close of NYSE on the day the security’s value is determined. The value of securities traded in markets outside the United States may be affected on a day that the NYSE is closed and an investor is not able to purchase, exchange or redeem shares of the Funds.
The Board has delegated to the Funds’ Pricing Committee (“Pricing Committee”) the responsibility for implementing the pricing and valuation procedures, including responsibility for determining the fair value of the Funds’ securities or other assets and liabilities. The Pricing Committee includes representatives of the Funds’ Advisor, and Co-Administrator, including personnel from accounting and operations, investment management, trading, risk management and compliance. The Pricing Committee meets at least quarterly to review and approve Fund valuation matters, including a review of the Funds’ pricing activity and operations, fair value measurements, pricing vendors, policies and procedures, and related controls. At least a quorum of the Pricing Committee shall meet more frequently, as needed, to consider and approve time-sensitive fair valuation matters. The Pricing Committee reports to the Valuation, Portfolio Management and Performance Committee (“Valuation Committee”) of the Board. Members of the Pricing Committee meet with the Valuation Committee and the Board at each of their regularly scheduled meetings to discuss valuation matters and actions taken during the period.
The Board has adopted procedures to determine the fair value of a security when a price is not available from a pricing service or broker- dealer or Fund Management determines that a price provided by a pricing service or broker-dealer does not approximate fair value. Fair valuation may also be used when a significant valuation event affecting the value of a security or market sector is determined to have occurred between the time when a security’s market closes and the time the Fund’s net asset value is calculated. The fair value of the security will be determined in good faith by the Pricing Committee in accordance with procedures and methodologies adopted by the Board. General factors used in determining the fair value of securities include, but are not limited to, fundamental analytical data relating to the security, the issuer and the market, such as duration, prepayment and default rates; general level of interest rates and changes in interest rates; information from broker-dealers; trading in similar securities; any restrictions on disposition of the security; and an evaluation of the forces that influence the market in which the investments are traded. These securities are either categorized as Level 2 or 3 in the fair value hierarchy, depending on the relevant inputs used.
When the Funds utilize fair valuation methods that use significant unobservable inputs to determine a security’s value, such securities will be categorized as Level 3 of the fair value hierarchy. These methods may require subjective determinations about the value of a security. While the Funds’ policy is intended to result in a calculation of a Fund’s net asset value that fairly reflects security values as of the time of pricing, the Funds cannot guarantee that values determined by the Board or persons acting at their direction would accurately reflect the price that the Funds could obtain for a security if they were to dispose of it as of the time of pricing (for instance, in a forced or distressed sale). The prices used by the Funds may differ from the value that would be realized if the securities were sold.
The Funds’ Pricing Committee employs various methods for calibrating the valuation approach related to securities categorized within Level 2 and Level 3 of the fair value hierarchy. These methods may include regular due diligence of the Funds’ pricing vendors, a regular review of key inputs and assumptions, transaction back-testing or disposition analysis to compare unrealized gains and losses to realized gains and losses, reviews of missing and stale prices and large movements in market value, and reviews of any market related activities. Additionally, the pricing of all fair value holdings is subsequently reported to the Valuation Committee and Board.
67
NOTES TO FINANCIAL STATEMENTS |
Fair Value Measurements:
The Funds disclose the fair value of their investments in a hierarchy that categorizes investments based on the inputs to valuation techniques used to measure fair value. The three levels of the fair value hierarchy are as follows:
• Level 1 - Inputs that reflect unadjusted quoted prices in active markets for identical assets or liabilities that the Funds have the ability to access at the measurement date.
• Level 2 - Significant inputs other than quoted prices that are observable for the asset or liability either directly or indirectly, including inputs in markets that are not considered to be active. Observable inputs may include quoted prices for similar securities, interest rates, spreads, prepayment spreads, etc.
• Level 3 - Significant unobservable inputs based on the best information available in the circumstances, to the extent observable inputs are not available (including the Fund’s own assumptions in determining the fair value of investments).
The inputs or methodology used for valuing investments are not necessarily an indication of the risk associated with investing in those securities.
Inputs used in determining fair value of an investment may include, but are not limited to, price information, volatility statistics, credit and market data, and other factors, all of which may be either observable or unobservable. Inputs can vary among investments and will be impacted by the investment type and volume of activity for the particular security or similar securities in the market. Investments in the Level 3 category are generally supported by transactions and quoted prices from dealers participating in the market for those investments. Investments may be included in the Level 3 category due to a lack of market activity or transparency. Internal valuation models may also be used as a pricing source for Level 3 investments. Internal valuation models may rely on one or more unobservable inputs, such as estimated cash flows, financial statement analysis and discount rates. The summary of inputs used to determine the fair value of the Funds’ investments as of September 30, 2021 is as follows:
| Funds | Level 1 Quoted Prices | Level 2 Significant Observable Inputs | Level 3 Significant Unobservable Inputs | Total | ||||||||||||
Assets: | ||||||||||||||||
Investments in Securities | ||||||||||||||||
SMID Cap Growth Fund | $ 97,079,305 | (a) | $ — | $— | $ 97,079,305 | |||||||||||
Enterprise Fund | 74,893,096 | (a) | — | — | 74,893,096 | |||||||||||
Small Cap Core Fund | 66,029,168 | (a) | — | — | 66,029,168 | |||||||||||
Microcap Value Fund | 122,329,447 | (a) | 285,835 | (b) | — | (c) | 122,615,282 | |||||||||
Small Cap Value Fund | 85,009,116 | (a) | — | — | 85,009,116 | |||||||||||
| (a) | The breakdown of the Fund’s investments into major categories is disclosed in the Schedule of Portfolio Investments. |
| (b) | Represents securities in the Consumer Discretionary ($249,799), Consumer Staples ($36,000) and Rights/Warrants ($36) sections of the Schedule of Portfolio Investments. |
| (c) | Includes securities fair valued at zero. |
The Fund’s assets assigned to the Level 3 category were valued using the valuation methodology and technique deemed most appropriate in the circumstances. The significant unobservable inputs used may include assumptions regarding the particular security’s cash flow profile and potential defaults which may not be generally observable for either the security or for assets of a similar type. Significant changes in any of these assumptions may result in a lower or higher fair value.
Repurchase Agreements:
The Funds, except SMID Cap Growth Fund, may enter into repurchase agreements with counterparties whom the Advisor has deemed creditworthy, including primary dealers that report to the Federal Reserve Bank of New York or other large U.S. commercial banks or broker-dealers. These repurchase
68
NOTES TO FINANCIAL STATEMENTS |
agreements are subject to the seller’s agreement to repurchase such securities at a mutually agreed upon date and price. The repurchase price generally equals the price paid by the Funds plus interest negotiated on the basis of current short-term rates.
Securities pledged by the dealers as collateral for repurchase agreements are held by a custodian bank until maturity of the repurchase agreement. The Funds have procedures to monitor additional collateral, if needed, to ensure that the daily market value of the collateral remains in excess of the market value of the repurchase agreement in the event of a default.
There were no repurchase agreements held during the year ended September 30, 2021.
Affiliated Investments:
The Funds invest in another Fund of the Trust (an “Affiliated Fund”), U.S. Government Money Market Fund-RBC Institutional Class 1, as a cash sweep vehicle. The income earned by the Funds from the Affiliated Fund for the period is disclosed in the Statement of Operations. The table below details the transactions of the Funds in the Affiliated Fund.
| Value September 30, 2020 | Purchases | Sales | Value September 30, 2021 | Dividends | ||||||||||||||||
Investments in U.S. Government Money Market Fund —RBC Institutional Class 1 |
| |||||||||||||||||||
SMID Cap Growth Fund | $ 967,416 | $32,280,774 | $30,576,391 | $2,671,799 | $413 | |||||||||||||||
Enterprise Fund | 262,212 | 11,616,456 | 10,712,382 | 1,166,286 | 268 | |||||||||||||||
Small Cap Core Fund | 602,717 | 49,570,881 | 49,473,526 | 700,072 | 250 | |||||||||||||||
Microcap Value Fund | 813,949 | 18,366,488 | 17,005,139 | 2,175,298 | 338 | |||||||||||||||
Small Cap Value Fund | 1,053,910 | 25,457,557 | 26,511,467 | — | 418 | |||||||||||||||
Investment Transactions and Income:
Investment transactions are recorded on trade date. Dividend income is recorded on the ex-dividend date. Non-cash dividends, if any, are recorded on the ex-dividend date at fair value. Realized gains and losses from investment transactions are calculated based on the cost of the specific security (also known as identified cost basis). Interest income is recognized on the accrual basis and includes, where applicable, the amortization or accretion of premium or discount using the effective yield method.
Expense, Investment Income and Gain/Loss Allocation:
Each Fund pays the expenses that are directly related to its operations, such as custodian fees or advisory fees. Expenses incurred by the Trust, such as trustee or legal fees, are allocated among each of the Funds in the Trust either proportionately based upon each Fund’s relative net assets or using another reasonable basis such as equally across all Funds in the Trust, depending on the nature of the expense. Individual share classes within a Fund are charged expenses specific to that class, such as distribution fees and transfer agent fees. Within a Fund, expenses other than class specific expenses are allocated daily to each class based upon the proportion of relative net assets. Investment income and realized and unrealized gains or losses are allocated to each class of shares based on relative net assets.
Real Estate Investment Trusts:
The Funds may own shares of real estate investment trusts (”REITs“) which report information on the source of their distributions annually. Dividends paid by a REIT, other than capital gain distributions, will be taxable as ordinary income up to the amount of the REIT’s current and accumulated earnings and
69
NOTES TO FINANCIAL STATEMENTS |
profits. Capital gain dividends paid by a REIT to a Fund will be treated as long term capital gains by the Fund and, in turn, may be distributed by the Fund to its shareholders as a capital gain distribution. Distributions received from a REIT in excess of its income are recorded as a return of capital and a reduction to the cost basis of the REIT.
Distributions to Shareholders:
Each Fund pays out any income that it receives, less expenses, in the form of dividends and capital gain distributions to its shareholders. Income dividends and capital gain distributions for each Fund are declared and paid at least annually. Distributions to shareholders are recorded on the ex-dividend date. The amount of dividends and distributions are calculated based on federal income tax regulations, which may differ from US GAAP. These “book/tax” differences may be either temporary or permanent in nature. To the extent these differences are determined, as of the end of the tax year, to be permanent (e.g., net operating loss, redesignation of distributions, basis adjustments on investments in passive foreign investment companies (PFICs) and partnerships, and gains/losses realized on redemption-in-kind transactions), they are reclassified within a Fund’s capital accounts based on their federal tax basis treatment.
| Increase/(Decrease) Paid in Capital | Increase/(Decrease) Accumulated Earnings | |||||||
SMID Cap Growth Fund | $12,532,377 | $(12,532,377 | ) | |||||
Small Cap Core Fund | 5,357,969 | (5,357,969 | ) | |||||
In-Kind Redemption Transactions:
SMID Cap Growth Fund and Small Cap Core Fund transferred securities and cash to shareholders in connection with in-kind redemption transactions. For financial reporting purposes, these transactions were treated as a sale of securities and the resulting gains and losses were recognized based on the market value of the securities on the date of the redemption. For the year ended September 30, 2021, SMID Cap Growth Fund and Small Cap Core Fund had in-kind redemptions with total proceeds in the amount of $29,788,308 and $12,292,212, respectively. Net gains and losses resulting from such in-kind redemptions are shown in the Statements of Operations. Each of these in-kind redemptions was redeemed by an affiliate of the Advisor and was recorded at values each Fund might reasonably expect to receive in an arm’s-length transaction. For tax purposes, no gains or losses were recognized.
3. Agreements and Other Transactions with Affiliates:
The Trust has entered into an investment advisory agreement with RBC GAM-US under which RBC GAM-US manages each Fund’s assets and furnishes related office facilities, equipment, research and personnel. The agreement requires each Fund to pay RBC GAM-US a monthly fee based upon average daily net assets. Under the terms of the agreement, RBC GAM-US is entitled to receive fees based on a percentage of the average daily net assets of each of the Funds as follows:
| Average Daily Net Assets of Fund | Annual Rate | |||||
SMID Cap Growth Fund | All Net Assets | 0.70% | ||||
Enterprise Fund | Up to $30 Million | 1.00% | ||||
| Over $30 Million | 0.90% | |||||
Small Cap Core Fund | All Net Assets | 0.85% | ||||
Microcap Value Fund | All Net Assets | 0.90% | ||||
Small Cap Value Fund | All Net Assets | 0.70% | ||||
RBC GAM-US has contractually agreed to waive fees and/or make payments in order to keep total operating expenses (excluding certain fees such as interest, taxes and acquired fund fees and expenses) of the Funds to the following levels pursuant to an expense limitation agreement.
70
NOTES TO FINANCIAL STATEMENTS |
| Class A Annual Rate | Class I Annual Rate | Class R6 Annual Rate | ||||||||||
SMID Cap Growth Fund | 1.07% | 0.82% | 0.77% | |||||||||
Enterprise Fund | 1.33% | 1.08% | N/A | |||||||||
Small Cap Core Fund | 1.15% | 0.90% | 0.87% | |||||||||
Microcap Value Fund | 1.32% | 1.07% | N/A | |||||||||
Small Cap Value Fund | 1.10% | 0.85% | 0.80% | |||||||||
This expense limitation agreement is in place until January 31, 2023, and may not be terminated by RBC GAM-US prior to that date. The agreement shall continue for additional one-year terms unless terminated or revised by the Board at any time or by RBC GAM-US at the expiration of any one-year period. The Advisor is entitled to recoup from the Fund or class the fees and/or operating expenses waived or reimbursed during any of the previous 12 months (3 years for the Small Cap Value Fund), provided the Fund is able to do so and remain in compliance with the expense limitation in place at the time the fees were waived or expenses paid.
At September 30, 2021, the amounts subject to possible recoupment under the expense limitation agreement were:
| FYE 9/30/19 | FYE 9/30/20 | FYE 9/30/21 | Total | |||||||||||||
SMID Cap Growth Fund | $ | — | $ | — | $179,588 | $179,588 | ||||||||||
Enterprise Fund | — | — | 126,372 | 126,372 | ||||||||||||
Small Cap Core Fund | — | — | 229,762 | 229,762 | ||||||||||||
Microcap Value Fund | — | — | 144,195 | 144,195 | ||||||||||||
Small Cap Value Fund | 147,091 | 174,505 | 190,586 | 512,182 | ||||||||||||
There was no recoupment of expense reimbursements/waivers during the year. Amounts from years prior to those shown are no longer subject to recoupment.
RBC GAM-US may also voluntarily waive and/or reimburse operating expenses of any Fund from time to time. Any such voluntary program may be changed or eliminated at any time without notice, and expenses waived under such program are not subject to recoupment.
RBC GAM-US voluntarily agreed to waive its investment advisory fees by the amount of investment advisory fees the Funds pay to RBC GAM-US indirectly through its investment in an affiliated money market fund. For the year ended September 30, 2021, the amount waived was $2,688, $1,644, $2,029, $2,180 and $2,804 for the SMID Cap Growth Fund, Enterprise Fund, Small Cap Core Fund, Microcap Value Fund and Small Cap Value Fund, respectively, and is included in expenses waived/reimbursed by Advisor in the Statements of Operations.
RBC GAM-US serves as co-administrator to the Funds. BNY Mellon serves as co-administrator and fund accounting agent. Services provided under the administrative services contract include providing day-to-day administration of matters related to the Funds, maintenance of their records and the preparation of reports. Under the terms of the administrative services agreement, RBC GAM-US does not receive an administrative services fee. BNY Mellon receives a fee for its services payable by each Fund based in part on each Funds’ average net assets. BNY Mellon’s fee is included with ”Accounting fees“ in the Statements of Operations.
Certain officers and trustees of the Trust are affiliated with the Advisor or the Co-Administrator. Such Officers and Trustees receive no compensation from the Funds for serving in their respective roles. The Trust currently pays each of the independent trustees (trustees of the Trust who are not directors, officers or employees of the Advisor, either Co-Administrator or Distributor) an annual retainer of $68,000. The Board Chairperson and Audit Committee Chairperson each receive an additional retainer of $2,500 annually, and all other trustees serving as Chair of a Board committee each receive an additional retainer of $1,000 annually. In addition, independent trustees receive a quarterly meeting fee of $6,500 for each in-person Board meeting attended, a meeting fee of $1,500 for each telephonic
71
NOTES TO FINANCIAL STATEMENTS |
or special board meeting attended, a $1,500 fee for each Board committee meeting attended, and are reimbursed for all out-of-pocket expenses relating to attendance at such meetings. These amounts are included in the Statement of Operations in “Trustees’ fees”.
In conjunction with the launch of the Class A shares of Small Cap Value Fund and Class R6 Shares, the Advisor invested seed capital to provide the share class its initial investment assets. The table below shows, as of September 30, 2021, the Fund’s net assets, the shares of the Fund held by the Advisor, and the percent of total net assets represented by the Advisor’s investment.
| Net Assets | Shares held by Advisor | % of Fund Net Assets | ||||||||||
SMID Cap Growth Fund | $95,577,625 | 1,034 | 0.0% | |||||||||
Small Cap Value Fund | $83,959,433 | 791 | 0.0% | |||||||||
4. Fund Distribution:
Each of the Funds that offers Class A shares has adopted a Master Distribution 12b-1 Plan (the “Plan”) in which Quasar Distributors LLC (the “Distributor”) acts as the Funds’ distributor. The Plan permits each Fund to make payments for, or to reimburse the Distributor for, distribution-related costs and expenses of marketing shares of Class A covered under the Plan, and/or for providing shareholder services. The Plan does not apply to Class I and Class R6. The following chart shows the current Plan fee rate for Class A.
| Class A | ||||
12b-1 Plan Fee | 0.25%* | |||
* Under the 12b-1 plan, the maximum fee rate for Class A shares is 0.50%. Currently the Board has approved an annual limit of 0.25%.
Plan fees are based on average daily net assets of Class A. Up to 0.25% of each Plan fee may be designated as a service fee, as defined by the applicable rules of the Financial Industry Regulatory Authority. The Distributor, subject to applicable legal requirements, may waive the Plan fee voluntarily, in whole or in part. For the year ended September 30, 2021, there were no fees waived by the Distributor.
For the year ended September 30, 2021, the Distributor received commissions of $1,874 front-end sales charges of Class A shares, of the Funds, of which $12 was paid to affiliated broker-dealers, and the remainder was either paid to unaffiliated broker-dealers or retained by the Distributor.
The Distributor did not receive any CDSC fees from Class A shares of the Funds during the year ended September 30, 2021.
5. Securities Transactions:
The cost of securities purchased and proceeds from securities sold (excluding securities maturing less than one year from acquisition) for the year ended September 30, 2021 were as follows:
| Purchases | Sales | |||||||
SMID Cap Growth Fund | $ | 28,764,359 | $ | 35,963,968 | (a) | |||
Enterprise Fund | 12,805,278 | 18,619,693 | ||||||
Small Cap Core Fund | 65,290,566 | 96,520,452 | (a) | |||||
Microcap Value Fund | 12,325,055 | 35,952,323 | ||||||
Small Cap Value Fund | 51,460,127 | 45,818,703 | ||||||
| (a) | Portfolio turnover rate excludes in-kind transactions. |
Within the guidelines established by the Funds to always seek best execution when entering into portfolio transactions, the Funds participate in a “commission recapture” program under which brokerage transactions are directed to Cowen and Company, LLC and its correspondent brokers. A portion of the commissions paid under this program are reimbursed to the Funds and are recorded as net realized gains from investment transactions in the financial statements.
72
NOTES TO FINANCIAL STATEMENTS |
6. Capital Share Transactions:
The Trust is authorized to issue an unlimited number of shares of beneficial interest (“shares outstanding”) without par value. Transactions in capital stock of the Funds are summarized on the following pages:
| SMID Cap Growth Fund | Enterprise Fund | |||||||||||||||
| For the Year Ended September 30, 2021 | For the Year Ended September 30, 2020 | For the Year Ended September 30, 2021 | For the Year Ended September 30, 2020 | |||||||||||||
CAPITAL TRANSACTIONS: | ||||||||||||||||
Class A | ||||||||||||||||
Proceeds from shares issued | $ | 230,117 | $ | 117,477 | $ | 5,660 | $ | 3,154 | ||||||||
Distributions reinvested | 400,053 | 990,664 | 58,005 | 48,391 | ||||||||||||
Cost of shares redeemed | (1,750,225 | ) | (1,172,769 | ) | (28,182 | ) | (157,042 | ) | ||||||||
|
|
|
|
|
|
|
| |||||||||
Change in Class A | $ | (1,120,055 | ) | $ | (64,628 | ) | $ | 35,483 | $ | (105,497 | ) | |||||
|
|
|
|
|
|
|
| |||||||||
Class I | ||||||||||||||||
Proceeds from shares issued | $ | 30,753,544 | $ | 36,644,024 | $ | 261,360 | $ | 536,273 | ||||||||
Distributions reinvested | 2,560,828 | 6,003,044 | 5,280,943 | 4,156,367 | ||||||||||||
Cost of shares redeemed | (64,265,272 | ) | (38,044,892 | ) | (5,564,444 | ) | (8,145,712 | ) | ||||||||
|
|
|
|
|
|
|
| |||||||||
Change in Class I | $ | (30,950,900 | ) | $ | 4,602,176 | $ | (22,141 | ) | $ | (3,453,072 | ) | |||||
|
|
|
|
|
|
|
| |||||||||
Class R6 | ||||||||||||||||
Distributions reinvested | $ | 467 | $ | 1,031 | $ | — | $ | — | ||||||||
|
|
|
|
|
|
|
| |||||||||
Change in Class R6 | $ | 467 | $ | 1,031 | $ | — | $ | — | ||||||||
|
|
|
|
|
|
|
| |||||||||
Change in net assets resulting from capital transactions | $ | (32,070,488 | ) | $ | 4,538,579 | $ | 13,342 | $ | (3,558,569 | ) | ||||||
|
|
|
|
|
|
|
| |||||||||
SHARE TRANSACTIONS: | ||||||||||||||||
Class A | ||||||||||||||||
Issued | 14,380 | 9,371 | 307 | 210 | ||||||||||||
Reinvested | 26,813 | 77,274 | 3,500 | 2,682 | ||||||||||||
Redeemed | (114,539 | ) | (95,161 | ) | (1,474 | ) | (9,926 | ) | ||||||||
|
|
|
|
|
|
|
| |||||||||
Change in Class A | (73,346 | ) | (8,516 | ) | 2,333 | (7,034 | ) | |||||||||
|
|
|
|
|
|
|
| |||||||||
Class I | ||||||||||||||||
Issued | 1,658,341 | 2,597,894 | 12,533 | 35,730 | ||||||||||||
Reinvested | 146,166 | 401,541 | 299,883 | 217,953 | ||||||||||||
Redeemed | (3,388,468 | ) | (2,755,664 | ) | (286,450 | ) | (490,234 | ) | ||||||||
|
|
|
|
|
|
|
| |||||||||
Change in Class I | (1,583,961 | ) | 243,771 | 25,966 | (236,551 | ) | ||||||||||
|
|
|
|
|
|
|
| |||||||||
Class R6 | ||||||||||||||||
Reinvested | 26 | 69 | — | — | ||||||||||||
|
|
|
|
|
|
|
| |||||||||
Change in Class R6 | 26 | 69 | — | — | ||||||||||||
|
|
|
|
|
|
|
| |||||||||
Change in shares resulting from capital transactions | (1,657,281 | ) | 235,324 | 28,299 | (243,585 | ) | ||||||||||
|
|
|
|
|
|
|
| |||||||||
73
NOTES TO FINANCIAL STATEMENTS |
| Small Cap Core Fund | Microcap Value Fund | |||||||||||||||
| For the Year Ended September 30, 2021 | For the Year Ended September 30, 2020 | For the Year Ended September 30, 2021 | For the Year Ended September 30, 2020 | |||||||||||||
CAPITAL TRANSACTIONS: | ||||||||||||||||
Class A | ||||||||||||||||
Proceeds from shares issued | $ | 2,147,558 | $ | 1,520,675 | $ | 231,111 | $ | 105,292 | ||||||||
Distributions reinvested | 1,280,130 | 371,626 | 160,328 | 202,889 | ||||||||||||
Cost of shares redeemed | (3,276,245 | ) | (2,098,190 | ) | (442,434 | ) | (865,885 | ) | ||||||||
|
|
|
|
|
|
|
| |||||||||
Change in Class A | $ | 151,443 | $ | (205,889 | ) | $ | (50,995 | ) | $ | (557,704 | ) | |||||
|
|
|
|
|
|
|
| |||||||||
Class I | ||||||||||||||||
Proceeds from shares issued | $ | 36,074,520 | $ | 9,625,709 | $ | 9,995,935 | $ | 17,477,899 | ||||||||
Distributions reinvested | 13,485,626 | 6,085,505 | 6,379,532 | 6,630,692 | ||||||||||||
Cost of shares redeemed | (78,524,816 | ) | (75,683,812 | ) | (33,114,282 | ) | (20,503,109 | ) | ||||||||
|
|
|
|
|
|
|
| |||||||||
Change in Class I | $ | (28,964,670 | ) | $ | (59,972,598 | ) | $ | (16,738,815 | ) | $ | 3,605,482 | |||||
|
|
|
|
|
|
|
| |||||||||
Class R6 | ||||||||||||||||
Proceeds from shares issued | $ | 5,149,354 | $ | 37,893 | $ | — | $ | — | ||||||||
Distributions reinvested | 8,645 | 1,783 | — | — | ||||||||||||
Cost of shares redeemed | (431,364 | ) | (23,405 | ) | — | — | ||||||||||
|
|
|
|
|
|
|
| |||||||||
Change in Class R6 | $ | 4,726,635 | $ | 16,271 | $ | — | $ | — | ||||||||
|
|
|
|
|
|
|
| |||||||||
Change in net assets resulting from capital transactions | $ | (24,086,592 | ) | $ | (60,162,216 | ) | $ | (16,789,810 | ) | $ | 3,047,778 | |||||
|
|
|
|
|
|
|
| |||||||||
SHARE TRANSACTIONS: | ||||||||||||||||
Class A | ||||||||||||||||
Issued | 71,844 | 59,759 | 7,806 | 4,786 | ||||||||||||
Reinvested | 46,891 | 12,097 | 6,403 | 7,642 | ||||||||||||
Redeemed | (108,521 | ) | (77,677 | ) | (14,749 | ) | (40,588 | ) | ||||||||
|
|
|
|
|
|
|
| |||||||||
Change in Class A | 10,214 | (5,821 | ) | (540 | ) | (28,160 | ) | |||||||||
|
|
|
|
|
|
|
| |||||||||
Class I | ||||||||||||||||
Issued | 1,052,891 | 324,554 | 343,991 | 804,933 | ||||||||||||
Reinvested | 462,470 | 187,650 | 255,079 | 250,026 | ||||||||||||
Redeemed | (2,381,067 | ) | (2,483,489 | ) | (1,220,174 | ) | (957,875 | ) | ||||||||
|
|
|
|
|
|
|
| |||||||||
Change in Class I | (865,706 | ) | (1,971,285 | ) | (621,104 | ) | 97,084 | |||||||||
|
|
|
|
|
|
|
| |||||||||
Class R6 | ||||||||||||||||
Issued | 150,190 | 1,410 | — | — | ||||||||||||
Reinvested | 296 | 55 | — | — | ||||||||||||
Redeemed | (13,013 | ) | (755 | ) | — | — | ||||||||||
|
|
|
|
|
|
|
| |||||||||
Change in Class R6 | 137,473 | 710 | — | — | ||||||||||||
|
|
|
|
|
|
|
| |||||||||
Change in shares resulting from capital transactions | (718,019 | ) | (1,976,396 | ) | (621,644 | ) | 68,924 | |||||||||
|
|
|
|
|
|
|
| |||||||||
74
NOTES TO FINANCIAL STATEMENTS |
| Small Cap Value Fund | ||||||||
| For the Year Ended September 30, 2021 | For the Year Ended September 30, 2020 | |||||||
CAPITAL TRANSACTIONS: | ||||||||
Class A | ||||||||
Proceeds from shares issued | $ | 10,000 | $ | — | ||||
|
|
|
| |||||
Change in Class A | $ | 10,000 | $ | — | ||||
|
|
|
| |||||
Class I | ||||||||
Proceeds from shares issued | $ | 24,444,767 | $ | 29,841,772 | ||||
Distributions reinvested | 223,063 | 287,196 | ||||||
Cost of shares redeemed | (21,849,883 | ) | (19,325,040 | ) | ||||
|
|
|
| |||||
Change in Class I | $ | 2,817,947 | $ | 10,803,928 | ||||
|
|
|
| |||||
Class R6 | ||||||||
Proceeds from shares issued | $ | 63,129 | $ | 271,137 | ||||
Distributions reinvested | 57,515 | 98,525 | ||||||
Cost of shares redeemed | (45,188 | ) | (1,849,015 | ) | ||||
|
|
|
| |||||
Change in Class R6 | $ | 75,456 | $ | (1,479,353 | ) | |||
|
|
|
| |||||
Change in net assets resulting from capital transactions | $ | 2,903,403 | $ | 9,324,575 | ||||
|
|
|
| |||||
SHARE TRANSACTIONS: | ||||||||
Class A | ||||||||
Issued | 791 | — | ||||||
|
|
|
| |||||
Change in Class A | 791 | — | ||||||
|
|
|
| |||||
Class I | ||||||||
Issued | 1,840,890 | 2,705,995 | ||||||
Reinvested | 18,620 | 21,757 | ||||||
Redeemed | (1,646,128 | ) | (1,944,121 | ) | ||||
|
|
|
| |||||
Change in Class I | 213,382 | 783,631 | ||||||
|
|
|
| |||||
Class R6 | ||||||||
Issued | 4,418 | 28,164 | ||||||
Reinvested | 4,773 | 7,425 | ||||||
Redeemed | (3,242 | ) | (180,130 | ) | ||||
|
|
|
| |||||
Change in Class R6 | 5,949 | (144,541 | ) | |||||
|
|
|
| |||||
Change in shares resulting from capital transactions | 220,122 | 639,090 | ||||||
|
|
|
| |||||
7. Federal Income Taxes:
It is the policy of each Fund to continue to qualify as a regulated investment company by complying with the provisions available to certain investment companies, as defined under Subchapter M of the Internal Revenue Code, and to distribute substantially all of its net investment income and net realized capital gains. Therefore, no federal tax liability is recorded in the financial statements of each Fund.
For all open tax years and all major taxing jurisdictions, management of the Funds has concluded that there are no significant uncertain tax positions that would require recognition in the financial statements. Open tax years are those that are open for examination by taxing authorities (i.e., generally
75
NOTES TO FINANCIAL STATEMENTS |
the last three tax year ends and the interim tax period since then). Furthermore, management of the Funds is also not aware of any tax positions for which it is reasonably possible that the total amounts of unrecognized tax benefits will significantly change in the next twelve months.
As of September 30, 2021, the tax cost of investments and the breakdown of unrealized appreciation (depreciation) for each Fund was as follows:
| Tax Cost Of Investments | Unrealized Appreciation | Unrealized Depreciation | Net Unrealized Appreciation/ (Depreciation) | |||||||||||||
SMID Cap Growth Fund | $ | 70,925,685 | $ | 29,070,023 | $ | (2,916,403 | ) | $26,153,620 | ||||||||
Enterprise Fund | 42,654,420 | 34,900,010 | (2,661,334 | ) | 32,238,676 | |||||||||||
Small Cap Core Fund | 41,718,710 | 28,562,341 | (4,251,883 | ) | 24,310,458 | |||||||||||
Microcap Value Fund | 78,434,563 | 57,002,366 | (12,821,652 | ) | 44,180,714 | |||||||||||
Small Cap Value Fund | 75,533,719 | 13,714,475 | (4,239,078 | ) | 9,475,397 | |||||||||||
The difference between book basis and tax basis unrealized appreciation/depreciation is attributable primarily to the tax deferral of losses on wash sales, Passive Foreign Investment Companies (PFICs) mark to market adjustment, and cumulative partnership basis adjustment.
The tax character of distributions during the year ended September 30, 2021 were as follows:
| Distributions Paid From | ||||||||||||||||
| Ordinary Income | Net Long Term Capital Gains | Total Taxable Distributions | Total Distributions Paid | |||||||||||||
SMID Cap Growth Fund | $ — | $ 2,966,854 | $ 2,966,854 | $ 2,966,854 | ||||||||||||
Enterprise Fund | 144,264 | 5,553,282 | 5,697,546 | 5,697,546 | ||||||||||||
Small Cap Core Fund | 763,198 | 18,914,068 | 19,677,266 | 19,677,266 | ||||||||||||
Microcap Value Fund | 1,507,907 | 5,597,031 | 7,104,938 | 7,104,938 | ||||||||||||
Small Cap Value Fund | 710,731 | — | 710,731 | 710,731 | ||||||||||||
The tax character of distributions during the year ended September 30, 2020 were as follows:
| Distributions Paid From | ||||||||||||||||
| Ordinary Income | Net Long Term Capital Gains | Total Taxable Distributions | Total Distributions Paid | |||||||||||||
SMID Cap Growth Fund | $ — | $7,012,926 | $7,012,926 | $7,012,926 | ||||||||||||
Enterprise Fund | 53,057 | 4,543,547 | 4,596,604 | 4,596,604 | ||||||||||||
Small Cap Core Fund | 91,801 | 6,519,913 | 6,611,714 | 6,611,714 | ||||||||||||
Microcap Value Fund | 1,332,269 | 6,218,719 | 7,550,988 | 7,550,988 | ||||||||||||
Small Cap Value Fund | 866,478 | — | 866,478 | 866,478 | ||||||||||||
76
NOTES TO FINANCIAL STATEMENTS |
As of September 30, 2021, the components of accumulated earnings/(losses) on a tax basis were as follows:
| SMID Cap Growth Fund | Enterprise Fund | Small Cap Core Fund | Microcap Value Fund | Small Cap Value Fund | ||||||||||||||||
Undistributed ordinary income | $ | — | $ | 756,366 | $ | 5,027,363 | $ | 689,383 | $ | 588,646 | ||||||||||
Undistributed long term gain | 20,243,242 | 6,976,293 | 17,622,826 | 6,288,548 | — | |||||||||||||||
|
|
|
|
|
|
|
|
|
| |||||||||||
Accumulated earnings | 20,243,242 | 7,732,659 | 22,650,189 | 6,977,931 | 588,646 | |||||||||||||||
Accumulated capital loss carryforwards | — | — | — | — | (11,553,372 | ) | ||||||||||||||
Unrealized appreciation | 26,153,620 | 32,238,676 | 24,310,458 | 44,180,714 | 9,475,397 | |||||||||||||||
|
|
|
|
|
|
|
|
|
| |||||||||||
Total Accumulated Earnings/(Losses) | $ | 46,396,862 | $ | 39,971,335 | $ | 46,960,647 | $ | 51,158,645 | $ | (1,489,329 | ) | |||||||||
|
|
|
|
|
|
|
|
|
| |||||||||||
During the year ended September 30, 2021, the Small Cap Value Fund Fund utilized $1,201,542 of capital losses As of September 30, 2021, the Small Cap Value Fund had a short-term capital loss carryforward of $5,689,749 and a long-term capital loss carryforward of $5,863,623 available to offset future realized capital gains in accordance with the Regulated Investment Company Modernization Act of 2010. These capital loss carryforwards are not subject to expiration and must first be utilized to offset future realized gains of the same character.
Under current tax law, Post-October Capital Losses and Late-Year Ordinary Losses may be deferred and treated as occurring on the first business day of the following fiscal year for tax purposes. The SMID Cap Growth Fund had deferred qualified late-year ordinary losses of $236,251 which will be treated as arising on the first business day of the fiscal year ending September 30, 2022.
8. Market Timing:
The Trust strongly discourages attempts at market timing by Fund shareholders. Prior to June 11, 2021, each Fund charged a redemption fee of 2% of the value of the shares redeemed or exchanged within 30 days of purchase. In addition, the Trust may limit the number of exchanges that may be made between Funds to five (5) per calendar year. When assessed, the redemption fee was deducted from the redemption proceeds and retained by the Fund, not by the Advisor. This redemption fee was not charged in cases where, for example, the redemption resulted from an automatic reinvestment or asset re-allocation not specifically directed by the shareholder. The Trust also reserves the right to reject any Fund purchase order made by persons deemed to be market timers. The Funds’ prospectus contains a full description of the Trust’s policies on market timing and/or excessive trading. The redemption fee is recorded as a credit to capital and is included in the capital transactions on the Statements of Changes in Net Assets.
During the year ended September 30, 2021, the redemption fees collected by the Funds which are offset in the cost of shares redeemed on the Statements of Changes in Net Assets are as follows:
| Redemption Fees | ||||
SMID Cap Growth Fund | $ 18 | |||
Enterprise Fund | 6 | |||
Small Cap Core Fund | 30,084 | |||
Microcap Value Fund | 628 | |||
Small Cap Value Fund | 6,859 | |||
77
NOTES TO FINANCIAL STATEMENTS |
9. Soft Dollars:
Soft dollar arrangements and commission sharing arrangements (CSAs) are arrangements under which RBC GAM-US directs client brokerage transactions to a broker-dealer and obtains other products and services, such as research, in addition to trade execution. Federal securities laws permit a fund advisor to incur commission charges on behalf of a fund that are higher than another broker-dealer would have charged if the advisor believes the charges are reasonable in relation to the brokerage and research services received. RBC GAM-US has a fiduciary duty to the shareholders of the Funds to seek the best execution for all of the Funds’ securities transactions. Fund Management believes that using soft dollars to purchase brokerage and research services may, in certain cases, be in a Fund’s best interest. During the year ended September 30, 2021, the Funds used soft dollar and commission sharing arrangements. Fund Management continues to closely monitor its current use of soft dollars, in addition to regulatory developments in this area for any possible impact on Fund policies.
10. Line of Credit
The Funds are participants in an uncommitted, secured $500,000,000 line of credit with U.S. Bank, N.A. (the “Bank”), the Funds’ custodian, to be used to fund shareholder redemption requests and for other short-term temporary or emergency general business purposes. The line of credit has a scheduled termination date of July 30, 2022. Interest is charged on borrowings under this line of credit at the Bank’s prime lending rate per annum. Since each Fund participates in this line of credit, there is no assurance that an individual fund will have access to all or any part of the $500,000,000 at any particular time. There were no loans outstanding pursuant to this line of credit at September 30, 2021. During the year ended September 30, 2021, the Funds did not utilize this line of credit.
11. Significant Risks
Shareholder concentration risk:
As of September 30, 2021, the following Funds had omnibus accounts which each owned more than 10% of a Fund’s outstanding shares as shown below:
| # of Omnibus Accounts | % of Fund | |||||||
SMID Cap Growth Fund | 2 | 78.0% | ||||||
Microcap Value Fund | 1 | 20.8% | ||||||
Small Cap Value Fund | 1 | 17.7% | ||||||
In addition, two unaffiliated shareholders owned in aggregate 25.3% of Small Cap Core Fund as of September 30, 2021. Significant transactions by these shareholders may impact the Fund’s performance.
Market risk:
One or more markets in which a Fund invests may go down in value, sometimes sharply and unpredictably, and the value of a Fund’s portfolio securities may fall or fail to rise. Market risk may affect a single issuer, sector of the economy, industry or the market as a whole. In addition, global economies and financial markets are becoming increasingly interconnected, and political, economic and other conditions and events (including, but not limited to, natural disasters, pandemics, epidemics, and social unrest) in one country, region, or financial market may adversely impact issuers in a different country, region or financial market. Furthermore, the occurrence of, among other events, natural or man-made disasters, severe weather or geological events, fires, floods, earthquakes, outbreaks of disease (such as COVID-19, avian influenza or H1N1/09), epidemics, pandemics, malicious acts, cyber-attacks, terrorist acts or the occurrence of climate change, may also adversely impact the performance of a Fund. Such events could adversely impact issuers, markets and economies over the short- and long-term, including in ways that cannot necessarily be foreseen. A Fund could be negatively impacted if the value of a portfolio holding were harmed by such political or economic conditions or events. Moreover, such negative political and economic conditions and events could disrupt the processes necessary for a Fund’s operations.
78
NOTES TO FINANCIAL STATEMENTS |
Industry and sector focus risk:
At times the Funds may increase the relative emphasis of its investments in a particular industry or sector. The prices of securities of issuers in a particular industry or sector may be more susceptible to fluctuations due to changes in economic or business conditions, government regulations, availability of basic resources or supplies, or other events affect that industry or sector more than securities of issuers in other industries and sectors. To the extent that the Fund increases the relative emphasis of its investments in a particular industry or sector, its shares’ values may fluctuate in response to events affecting that industry or sector.
12. Subsequent Events:
Fund Management’s evaluation of the impact of all subsequent events on the Funds’ financial statements was completed through the date the financial statements were issued, and the following item was noted:
Following the period end, shareholders of Small Cap Value Fund redeemed $24,530,896, which represented approximately 29.2% of the Fund’s net assets as of September 30, 2021.
79
|
To the Board of Trustees of RBC Funds Trust and Shareholders of RBC SMID Cap Growth Fund, RBC Enterprise Fund, RBC Small Cap Core Fund, RBC Microcap Value Fund, and RBC Small Cap Value Fund
Opinions on the Financial Statements
We have audited the accompanying statements of assets and liabilities, including the schedules of portfolio investments, of RBC SMID Cap Growth Fund, RBC Enterprise Fund, RBC Small Cap Core Fund, RBC Microcap Value Fund, and RBC Small Cap Value Fund (five of the funds constituting RBC Funds Trust, hereafter collectively referred to as the “Funds”) as of September 30, 2021, the related statements of operations for the year ended September 30, 2021, the statements of changes in net assets for each of the two years in the period ended September 30, 2021, including the related notes, and the financial highlights for each of the periods indicated therein (collectively referred to as the “financial statements”). In our opinion, the financial statements present fairly, in all material respects, the financial position of each of the Funds as of September 30, 2021, the results of each of their operations for the year then ended, the changes in each of their net assets for each of the two years in the period ended September 30, 2021 and each of the financial highlights for each of the periods indicated therein in conformity with accounting principles generally accepted in the United States of America.
Basis for Opinions
These financial statements are the responsibility of the Funds’ management. Our responsibility is to express an opinion on the Funds’ financial statements based on our audits. We are a public accounting firm registered with the Public Company Accounting Oversight Board (United States) (PCAOB) and are required to be independent with respect to the Funds in accordance with the U.S. federal securities laws and the applicable rules and regulations of the Securities and Exchange Commission and the PCAOB.
We conducted our audits of these financial statements in accordance with the standards of the PCAOB. Those standards require that we plan and perform the audit to obtain reasonable assurance about whether the financial statements are free of material misstatement, whether due to error or fraud.
Our audits included performing procedures to assess the risks of material misstatement of the financial statements, whether due to error or fraud, and performing procedures that respond to those risks. Such procedures included examining, on a test basis, evidence regarding the amounts and disclosures in the financial statements. Our audits also included evaluating the accounting principles used and significant estimates made by management, as well as evaluating the overall presentation of the financial statements. Our procedures included confirmation of securities owned as of September 30, 2021 by correspondence with the custodian and brokers. We believe that our audits provide a reasonable basis for our opinions.
/s/PricewaterhouseCoopers LLP
Minneapolis, Minnesota
November 23, 2021
We have served as the auditor of one or more investment companies in the RBC Funds since 2016.
80
|
For the fiscal year ended September 30, 2021, certain dividends paid by the Funds may be subject to a maximum tax rate of 15% as provided for by the Jobs and Growth Tax Reconciliation Act of 2003. The Funds intend to report the maximum amount allowable as taxed at a maximum rate of 15%.
Complete information will be reported in conjunction with your 2020 Form 1099-DIV.
All reportings are based on financial information available as of the date of this annual report and, accordingly, are subject to change. For each item above, it is the intention of the Funds to report the maximum amount permitted under the Internal Revenue Code and the regulations thereunder.
For the year ended September 30, 2021, the following Funds had a qualified dividend income percentage of:
| Qualified Dividend Income | ||||
Enterprise Fund | 100.00% | |||
Small Cap Core Fund | 89.21% | |||
Microcap Value Fund | 100.00% | |||
Small Cap Value Fund | 100.00% | |||
For corporate shareholders, the following percentage of the total ordinary income distributions paid during the fiscal year ended September 30, 2021 qualify for the corporate dividends received deduction:
| Dividends Received Deduction | ||||
Enterprise Fund | 100.00% | |||
Small Cap Core Fund | 89.32% | |||
Microcap Value Fund | 100.00% | |||
Small Cap Value Fund | 100.00% | |||
For the year ended September 30, 2021, the following Funds had a qualified interest income percentage of:
| Qualified Interest Income | ||||
Enterprise Fund | 1.31% | |||
Small Cap Core Fund | 4.00% | |||
Microcap Value Fund | 1.59% | |||
Small Cap Value Fund | 1.07% | |||
81
OTHER FEDERAL INCOME TAX INFORMATION (UNAUDITED) |
For the year ended September 30, 2021, the following Funds had a qualified short term gains percentage of :
| Qualified Short-Term Gains | ||||
Enterprise Fund | 100.00% | |||
Small Cap Core Fund | 100.00% | |||
Microcap Value Fund | 27.63% | |||
Pursuant to Internal Revenue Code Section 852(b)(3), SMID Cap Growth Fund, Enterprise Fund, Small Cap Core Fund and Microcap Value Fund reported $20,243,300, $7,217,312, $18,914,068 and $6,288,553 respectively as long-term capital gain distributions for the year ended September 30, 2021.
All reportings are based on financial information available as of the date of this annual report and, accordingly, are subject to change. For each item above, it is the intention of the Funds to report the maximum amount permitted under the Internal Revenue Code and the regulations thereunder.
82
|
Independent Trustees(1)(2)
Lucy Hancock Bode (70)
Position, Term of Office and Length of Time Served with the Trust: Trustee since January 2004
Principal Occupation(s) During Past 5 Years: Healthcare consultant (self-employed) (1986 to present)
Number of Portfolios in Fund Complex Overseen by Trustee: 18
Other Director/Trustee Positions Held by Trustee During Past 5 Years: Franklin Street Partners (2014 to present); BioSignia (2006 to 2010).
Leslie H. Garner Jr. (71)
Position, Term of Office and Length of Time Served with the Trust: Trustee since January 2004
Principal Occupation(s) During Past 5 Years: President and Chief Executive Officer, The Greater Cedar Rapids Community Foundation (2010 to present); President, Cornell College (1994 to 2010)
Number of Portfolios in Fund Complex Overseen by Trustee: 18
Other Director/Trustee Positions Held by Trustee During Past 5 Years: None
Phillip G. Goff. (58)
Position, Term of Office and Length of Time Served with the Trust: Trustee since January 2020
Principal Occupation(s) During Past 5 Years: Senior Vice President/Corporate Controller and Funds Treasurer, TIAA (October 2006-August 2017)
Number of Portfolios in Fund Complex Overseen by Trustee: 18
Other Director/Trustee Positions Held by Trustee During Past 5 Years: None
Ronald James (70)
Position, Term of Office and Length of Time Served with the Trust: Trustee since January 2004
Principal Occupation(s) During Past 5 Years: Faculty member (part time), University of St. Thomas (2004 to present), President and Chief Executive Officer, Center for Ethical Business Cultures (2000 to January 2017)
Number of Portfolios in Fund Complex Overseen by Trustee: 18
Other Director/Trustee Positions Held by Trustee During Past 5 Years: Bremer Financial Corporation (2004 to present); Greater Twin Cities United Way (2012 to 2020); Best Buy Co. Inc. (2004 to 2013)
John A. MacDonald (72)
Position, Term of Office and Length of Time Served with the Trust: Trustee since January 2004
Principal Occupation(s) During Past 5 Years: Vice President and Treasurer, Hall Family Foundation (1988 to 2020); Chief Investment Officer, Chinquapin Trust Company (1999 to 2020)
Number of Portfolios in Fund Complex Overseen by Trustee: 18
Other Director/Trustee Positions Held by Trustee During Past 5 Years: None
83
MANAGEMENT (UNAUDITED) |
Independent Trustees(1)(2)
James R. Seward, CFA (69)
Position, Term of Office and Length of Time Served with the Trust: Chairman of the Board and Trustee since January 2004
Principal Occupation(s) During Past 5 Years: Private investor (2000 to present)
Number of Portfolios in Fund Complex Overseen by Trustee: 18
Other Director/Trustee Positions Held by Trustee During Past 5 Years: Sooner Holdings (formerly Syntroleum Corporation) (1988 to 2015); Brookdale Senior Living Inc. (2008 to 2019)
Interested Trustees(1)(2)(3)
Kathleen A. Gorman (57)(5)
Position, Term of Office and Length of Time Served with the Trust: Trustee since September 2012
Principal Occupation(s) During Past 5 Years: President and Chief Executive Officer, RBC Funds (2012 to present); Assistant Secretary (March 2018 to present); Chief Compliance Officer, RBC Funds (2006 to 2012)
Number of Portfolios in Fund Complex Overseen by Trustee: 18
Other Director/Trustee Positions Held by Trustee During Past 5 Years: None
84
MANAGEMENT (UNAUDITED) |
Executive Officers(1)(3)(4)
Kathleen A. Gorman (57)
Position, Term of Office and Length of Time Served with the Trust: President and Chief Executive Officer since September 2012 and Assistant Secretary, (March 2018 to present)
Principal Occupation(s) During Past 5 Years: President and Chief Executive Officer, RBC Funds (2012 to present); Assistant Secretary, RBC Funds (March 2018 to present); Chief Compliance Officer, RBC Funds (2006 to 2012)
Kathleen A. Hegna (54)
Position, Term of Office and Length of Time Served with the Trust: Chief Financial Officer and Principal Accounting Officer since May 2009 and Treasurer since March 2014
Principal Occupation(s) During Past 5 Years: Associate Vice President and Director, Mutual Fund Services, RBC Global Asset Management (U.S.) Inc. (2009 to present)
Christina M. Weber (53)
Position, Term of Office and Length of Time Served with the Trust: Chief Compliance Officer since December 2012 and Secretary since September 2017
Principal Occupation(s) During Past 5 Years: Chief Compliance Officer, RBC Global Asset Management (U.S.) Inc. (June 2018 to present); Chief Compliance Officer, RBC Funds (2012 to present); Assistant Secretary, RBC Funds (2013 to 2017); Senior Compliance Officer, RBC Funds (March 2012 to December 2012)
| (1) | Except as otherwise noted, the address of each Trustee/Officer is RBC Funds Trust, 50 South Sixth Street, Suite 2350, Minneapolis, Minnesota 55402. |
| (2) | All Trustees must retire on or before December 31 of the year in which they reach age 75. The Board may temporarily waive this requirement when necessary to avoid depriving the Board of a Trustee with critical skills. |
| (3) | On December 31, 2009, Voyageur Asset Management Inc. changed its name to RBC Global Asset Management (U.S.) Inc. Any references to RBC Global Asset Management (U.S.) Inc. for prior periods are deemed to be references to the prior entity. |
| (4) | Each officer serves in such capacity for an indefinite period of time until his or her removal, resignation or retirement. |
| (5) | Kathleen A. Gorman has been determined to be an interested Trustee by virtue of her position with the Advisor. |
The Fund’s Statement of Additional Information includes information about the Funds’ Trustees. To receive your free copy of the Statement of Additional Information, call toll free: 1-800-422-2766.
85
|
The RBC Equity Funds offer three share classes. These three share classes are the A, R6 and I classes.
Class A
Class A shares, offered by all Funds are available for purchase primarily through investment advisors, broker-dealers, banks and other financial services intermediaries. Class A shares of the Funds are currently subject to a maximum up-front sales charge of 5.75% and a 1.00% CDSC for redemption within 12 months of a $1 million or greater purchase. Class A shares currently include a 0.25% (25 bps) annual 12b-1 service and distribution fee.
Class I
Class I shares are available in all of the Funds. This share class is intended for investors meeting certain minimum investment thresholds. This share class does not have an up-front sales charge (load) or a 12b-1 service and distribution fee.
Class R6
Class R6 shares are available in SMID Cap Growth Fund, Small Cap Core Fund and Small Cap Value Fund. This share class is intended for investors meeting certain minimum investment thresholds. This share class does not have an up-front sales charge (load) or a 12b-1 service and distribution fee.
86
SUPPLEMENTAL INFORMATION (UNAUDITED)
|
Shareholder Expense Examples
As a shareholder of the RBC Funds, you incur two types of costs: (1) transaction costs and (2) ongoing costs, including management fees; and other Fund expenses. This example is intended to help you understand your ongoing costs (in dollars) of investing in the RBC Funds and to compare these costs with the ongoing costs of investing in other mutual funds.
The example is based on an investment of $1,000 invested at the beginning of the period and held for the entire period from April 1, 2021 through September 30, 2021.
Actual Expenses
The table below provides information about actual account values and actual expenses. You may use the information below, together with the amount you invested, to estimate the expenses that you paid over the period. Simply divide your account value by $1,000 (for example, an $8,600 account value divided by $1,000 = 8.6), then multiply the result by the number in the table under the heading entitled “Expenses Paid During Period” to estimate the expenses you paid on your account during this period.
| Beginning Account Value 4/1/21 | Ending Account Value 9/30/21 | Expenses Paid During Period* 4/1/21–9/30/21 | Annualized Expense Ratio During Period 4/1/21–9/30/21 | |||||||||||||||||
SMID Cap Growth Fund | ||||||||||||||||||||
| Class A | $1,000.00 | $1,057.90 | $5.52 | 1.07% | ||||||||||||||||
| Class I | 1,000.00 | 1,059.40 | 4.23 | 0.82% | ||||||||||||||||
| Class R6 | 1,000.00 | 1,059.20 | 3.97 | 0.77% | ||||||||||||||||
Enterprise Fund | ||||||||||||||||||||
| Class A | 1,000.00 | 1,029.80 | 6.77 | 1.33% | ||||||||||||||||
| Class I | 1,000.00 | 1,030.90 | 5.50 | 1.08% | ||||||||||||||||
Small Cap Core Fund | ||||||||||||||||||||
| Class A | 1,000.00 | 1,020.50 | 5.82 | 1.15% | ||||||||||||||||
| Class I | 1,000.00 | 1,021.60 | 4.56 | 0.90% | ||||||||||||||||
| Class R6 | 1,000.00 | 1,022.20 | 4.41 | 0.87% | ||||||||||||||||
Microcap Value Fund | ||||||||||||||||||||
| Class A | 1,000.00 | 1,038.30 | 6.74 | 1.32% | ||||||||||||||||
| Class I | 1,000.00 | 1,039.30 | 5.47 | 1.07% | ||||||||||||||||
Small Cap Value Fund | ||||||||||||||||||||
| Class A | 1,000.00 | 988.70 | 5.53 | 1.11% | ||||||||||||||||
| Class I | 1,000.00 | 990.10 | 4.24 | 0.85% | ||||||||||||||||
| Class R6 | 1,000.00 | 990.80 | 3.99 | 0.80% | ||||||||||||||||
| *Expenses | are equal to the average account value times the Fund’s annualized expense ratio multiplied by 183/365 (to reflect one half year period). |
87
SUPPLEMENTAL INFORMATION (UNAUDITED)
|
Hypothetical Example for Comparison Purposes
The table below provides information about hypothetical account values and hypothetical expenses based on each RBC Funds’ actual expense ratio and an assumed rate of return of 5% per year before expenses, which is not the Fund’s actual return. The hypothetical account values and expenses may not be used to estimate the actual ending account balance or expenses you paid for the period. You may use this information to compare this 5% hypothetical example with the 5% hypothetical examples that appear in the shareholder reports of other funds.
Please note that the expenses shown in the table are meant to highlight your ongoing costs only and do not reflect any transactional costs, such as sales charges (loads), redemption fees, or exchange fees. Therefore, the table is useful in comparing ongoing costs only, and will not help you determine the relative total costs of owning different funds. In addition, if these transactional costs were included, your costs would have been higher.
| Beginning Account Value 4/1/21 | Ending Account Value 9/30/21 | Expenses Paid During Period* 4/1/21-9/30/21 | Annualized Expense Ratio During Period 4/1/21-9/30/21 | |||||||||||||||
SMID Cap Growth Fund | ||||||||||||||||||
| Class A | $1,000.00 | $1,019.70 | $5.42 | 1.07% | ||||||||||||||
| Class I | 1,000.00 | 1,020.96 | 4.15 | 0.82% | ||||||||||||||
| Class R6 | 1,000.00 | 1,021.21 | 3.90 | 0.77% | ||||||||||||||
Enterprise Fund | ||||||||||||||||||
| Class A | 1,000.00 | 1,018.40 | 6.73 | 1.33% | ||||||||||||||
| Class I | 1,000.00 | 1,019.65 | 5.47 | 1.08% | ||||||||||||||
Small Cap Core Fund | ||||||||||||||||||
| Class A | 1,000.00 | 1,019.30 | 5.82 | 1.15% | ||||||||||||||
| Class I | 1,000.00 | 1,020.56 | 4.56 | 0.90% | ||||||||||||||
| Class R6 | 1,000.00 | 1,020.71 | 4.41 | 0.87% | ||||||||||||||
Microcap Value Fund | ||||||||||||||||||
| Class A | 1,000.00 | 1,018.45 | 6.68 | 1.32% | ||||||||||||||
| Class I | 1,000.00 | 1,019.70 | 5.42 | 1.07% | ||||||||||||||
Small Cap Value Fund | ||||||||||||||||||
| Class A | 1,000.00 | 1,019.50 | 5.62 | 1.11% | ||||||||||||||
| Class I | 1,000.00 | 1,020.81 | 4.31 | 0.85% | ||||||||||||||
| Class R6 | 1,000.00 | 1,021.06 | 4.05 | 0.80% | ||||||||||||||
| *Expenses | are equal to the average account value times the Fund’s annualized expense ratio multiplied by 183/365 (to reflect one half year period). |
88
APPROVAL OF INVESTMENT ADVISORY AGREEMENT (UNAUDITED)
|
Information Regarding the Approval of Investment Advisory Agreements
In September 2021, after evaluating the services provided by RBC Global Asset Management (U.S.) Inc. (the “Advisor”) and reviewing the performance, fees, and expenses of the Funds, the RBC Funds Board of Trustees determined to approve the continuation of the investment advisory agreements (“Agreements”) with the Advisor for each Fund for an additional year.
As part of their review of the Agreements, the Trustees requested and considered information regarding the advisory services performed by the Advisor; the staffing and qualifications of the personnel responsible for operating and managing the Funds; and the Funds’ performance, fees, and expenses. The Trustees considered information provided at regular quarterly Board and Committee meetings throughout the year as well as information presented at both a special meeting held to review requested material related to the proposed renewals and a regular meeting at which the proposed renewals were considered. The information included material provided by the Advisor, as well as reports prepared by Broadridge Financial Solutions, Inc., an independent statistical compilation company providing comparative fee and expense information and comparative performance information for the Funds. In connection with their deliberations, the independent Trustees were advised by independent legal counsel with regard to the materials and their responsibilities under relevant laws and regulations.
The Trustees met with representatives from the Advisor’s senior management team, as well as senior investment professionals, to discuss the information and the Advisor’s ongoing management of the Funds. The Trustees reviewed the nature, quality, and extent of the services provided to the Funds by the Advisor, including information as to each Fund’s performance relative to appropriate index benchmarks as well as their respective Morningstar categories. For several of the Funds, the Board also reviewed comparative information with respect to custom peer groups designed to align more closely with the Funds’ specific investment strategies.
The Trustees recognized the strong research and fundamental analysis capabilities of the Advisor’s investment teams and their extensive portfolio management experience, as well as the Advisor’s effective trading, operational, and compliance structure and systems. The Trustees also reviewed information on the Advisor’s response to the COVID-19 pandemic and the measures taken to ensure that the services provided to the Funds were not impacted.
The Board then reviewed the performance of each Fund vs. relevant securities benchmarks and fund peer groups. It was noted that in most cases where a Fund had underperformed in comparison to its Morningstar category, the unfavorable performance comparison was generally the result of a Fund’s style characteristics not being in alignment with its assigned category.
The Trustees reviewed comparative advisory fee and expense information for each Fund, together with information regarding the Advisor’s contractual agreement to subsidize Fund expenses at competitive levels through expense limitation agreements. The Trustees noted that advisory fees and expense ratios were competitive and, in particular, that none of the Funds had total net expenses below the median of its peer group.
The Trustees also reviewed reports from the Advisor regarding its management of other investment client accounts with similar strategies, including the advisory fees paid and the reasons for differences in fees, which included liquidity management and matters related to mutual fund operations. The Trustees reviewed profitability data—including year-over-year variances—for the Advisor and considered information regarding other benefits the Advisor and its affiliates derived from their relationships with the Funds, including soft dollar research. It was also noted that the Advisor does not receive any additional fee for its administrative services to the Funds.
Based upon their review, the Trustees determined that the advisory fees proposed to be payable to the Advisor were fair and reasonable in light of the nature and quality of services provided under all of the circumstances and were within the range of what might have been negotiated at arms’ length. The Trustees concluded that it was in the interests of the Funds and their shareholders for the Trustees to approve the continuation of the Agreements and the expense limitation agreements for the Funds for
89
APPROVAL OF INVESTMENT ADVISORY AGREEMENT (UNAUDITED)
|
an additional year. In arriving at their collective decision to approve the renewal of the Agreements, the Trustees did not assign relative weights to the factors discussed above or deem any one or group of them to be controlling in and of itself.
90
|
This Page Intentionally Left Blank
91
|
This Page Intentionally Left Blank
92
|
This Page Intentionally Left Blank
93
RBC Funds
P.O. Box 701
Milwaukee, WI 53201-0701
800-422-2766
www.rbcgam.com
Performance data represents past performance and does not guarantee future results. The principal value of an investment and investment return will fluctuate so that an investor’s shares, when redeemed, may be worth more or less than their original cost.
This report and the financial statements contained herein are provided for the information of RBC Funds shareholders. This report is not authorized for distribution to prospective investors unless preceded or accompanied by a current prospectus, which contains information concerning investment objectives, risks, charges and expenses of the funds. Please read the prospectus carefully before investing.
This report and the financial statements contained herein are not intended to be a forecast of future events, a guarantee of future results, or investment advice. There is no assurance that certain securities will remain in or out of each fund’s portfolio. The views expressed in this report reflect those of the portfolio managers through the year ended September 30, 2021.
NOT FDIC INSURED • NO BANK GUARANTEE • MAY LOSE VALUE
RBC Global Asset Management (U.S.) Inc. serves as investment advisor for the RBC Funds.
RBC Funds are distributed by Quasar Distributors LLC.
The RBC Funds are pleased to offer shareholder reports printed entirely on Forest Stewardship Council® certified paper. FSC® certification ensures that the paper used in this report contains fiber from well-managed and responsibly harvested forests that meet strict environmental and socioeconomic standards.
RBCF-EQ AR 09-21
Annual Report For the year ended September 30, 2021 U.S. Government Money Market Fund RBC®
| ||||||||||
RBC Funds | ||||||||||
About your Annual Report |
This annual report includes detailed information about your Fund including financial statements, performance, and a complete list of its holdings. | |||||||||
| We hope the financial information presented will help you evaluate your investment in the RBC Funds. We also encourage you to read your Fund’s prospectus for further detail as to your Fund’s investment policies and risk profile. RBC Funds prospectuses and performance information subsequent to the date of this report are available on our website at www.rbcgam.com. | ||||||||||
A description of the policies and procedures that your Fund uses to determine how to vote proxies relating to portfolio securities is available (i) without charge, upon request, by calling 1-800-422-2766; (ii) on the Fund’s website at www.rbcgam.com; and (iii) on the Securities and Exchange Commission’s (the “Commission”) website at http://www.sec.gov. | ||||||||||
Each year the Trust files its proxy voting record for the twelve-month period ended June 30 with the SEC on Form N-PX no later than August 31. The records can be obtained on the SEC’s website at www.sec.gov and without charge by calling the Funds at 1-800-422-2766. | ||||||||||
| Table of | 1 | |||||||||
| Contents | 3 | |||||||||
| 4 | ||||||||||
| 6 | ||||||||||
| 21 | ||||||||||
| 23 | ||||||||||
| 24 | ||||||||||
| 25 | ||||||||||
| 27 | ||||||||||
| 35 | ||||||||||
| 36 | ||||||||||
| 37 | ||||||||||
| 40 | ||||||||||
| 42 | ||||||||||
| 1 |
LETTER FROM THE PORTFOLIO MANAGERS
|
| |||||||||
Past performance does not guarantee future results.
Opinions expressed are subject to change, not guaranteed, and not recommendations to buy or sell any security.
A basis point is a unit of measure equal to one one-hundredth of a percent.
The U.S. Treasury yield curve represents the yield of a U.S. Treasury bond at different maturities. A U.S. Treasury bond is theoretically considered to be free of default risk, and represents the minimum yield investors are prepared to accept for bonds of different maturities.
You could lose money by investing in the Fund. Although the Fund seeks to preserve the value of your investment at $1.00 per share, it cannot guarantee it will do so.
An investment in the Fund is not insured or guaranteed by the Federal Deposit Insurance Corporation or any other government agency. The Fund’s sponsor has no legal obligation to provide financial support to the Fund, and you should not expect that the sponsor will provide financial support to the Fund at any time. |
| |||||||||
|
| |||||||||
|
| |||||||||
|
| |||||||||
2 |
| ||||||
RBC Global Asset Management (U.S.) Inc. (“RBC GAM-US”), serves as the investment advisor to the Fund. RBC GAM-US employs a team approach to the management of the U.S. Government Money Market Fund, with no individual team member being solely responsible for the investment decisions. The Fund’s management team has access to RBC GAM-US’s investment research and other money management resources.
| ||||||
Brandon T. Swensen, CFA
Vice President, Senior Portfolio Manager
Brandon Swensen oversees RBC GAM-US’s fixed income research, portfolio management and trading. In addition to shaping the firm’s overall fixed income philosophy and process, he is a portfolio manager for the Funds and several cash management and core solutions. Brandon joined RBC GAM-US in 2000 and most recently was a portfolio manager on the mortgage and government team before being promoted to his current position. He also held research analyst positions covering asset-backed securities and credit and served as a financial analyst for the firm. Brandon earned a BS in finance from St. Cloud State University and an MBA in finance from the University of St. Thomas. He is a CFA charterholder and member of the CFA Society of Minnesota.
|
Brandon T. Swensen, CFA | |||||
Brian Svendahl, CFA
Managing Director, Senior Portfolio Manager
Brian Svendahl oversees the fixed income research, portfolio management and trading at RBC GAM-US. In addition to shaping the firm’s overall fixed income philosophy and process, he is a portfolio manager for the Funds and many of RBC GAM-US’s government mandates. Brian joined RBC GAM-US in 2005 and most recently led the mortgage and government team before being promoted to his current position. Prior to joining RBC GAM-US, he held several risk management, research and trading positions at Wells Fargo. Brian’s experience also includes liability management and implementing balance sheet hedging strategies. He first started in the investment industry in 1992. He earned a BS in economics from the University of Minnesota and a BBA in finance and an MBA from the University of Minnesota Carlson School of Management. Brian is a CFA charterholder.
|
Brian Svendahl, CFA | |||||


| 3 |
4 |
PERFORMANCE SUMMARY (UNAUDITED)
| ||||||||||||
| Money Market Maturity Schedule | Asset Allocation | |||||||||||
| As a percentage of value of investments based on effective maturity as of September 30, 2021. | ||||||||||||
| U.S. Government Money Market Fund | ||||||||||||
Less than 8 days | 83.5% | |||||||||||
8 to 14 days | 0.3% | |||||||||||
15 to 30 days | 1.8% | |||||||||||
31 to 180 days | 7.1% | |||||||||||
Over 180 days | 7.3% | |||||||||||
| 5 |
SCHEDULE OF PORTFOLIO INVESTMENTS
|
U.S. Government Money Market Fund
September 30, 2021
| Principal Amount | Value | |||||||||||
U.S. Government Agency Backed Mortgages — 24.93% | ||||||||||||
Fannie Mae — 5.46% | ||||||||||||
| $ | 132,557,000 | 2.63%, 1/11/22 | $ | 133,496,997 | ||||||||
| 161,917,000 | 2.00%, 1/5/22 | 162,733,488 | ||||||||||
| 62,750,000 | 1.88%, 4/5/22 | 63,334,750 | ||||||||||
| 200,000,000 | (SOFR RATE + 0.190%), 0.24%, 5/27/22(a) | 200,000,000 | ||||||||||
| 175,000,000 | (SOFR RATE + 0.200%), 0.25%, 6/15/22(a) | 175,000,000 | ||||||||||
| 75,000,000 | (SOFR RATE + 0.200%), 0.25%, 5/9/22(a) | 75,000,000 | ||||||||||
| 75,000,000 | (SOFR RATE + 0.220%), 0.27%, 3/16/22(a) | 75,000,000 | ||||||||||
| 150,000,000 | (SOFR RATE + 0.230%), 0.28%, 5/6/22(a) | 150,027,256 | ||||||||||
| 75,000,000 | (SOFR RATE + 0.300%), 0.35%, 1/7/22(a) | 75,000,000 | ||||||||||
|
| |||||||||||
| 1,109,592,491 | ||||||||||||
|
| |||||||||||
Federal Farm Credit — 10.84% | ||||||||||||
| 33,000,000 | 0.00%, 10/21/21(b) | 32,997,617 | ||||||||||
| 65,000,000 | 0.00%, 11/9/21(b) | 64,995,775 | ||||||||||
| 105,000,000 | 0.00%, 12/8/21(b) | 104,988,100 | ||||||||||
| 10,000,000 | 1.60%, 12/28/21 | 10,037,374 | ||||||||||
| 35,000,000 | (LIBOR USD 1-Month + 0.020%), 0.11%, 11/26/21(a) | 35,000,000 | ||||||||||
| 25,000,000 | (LIBOR USD 1-Month + 0.090%), 0.18%, 11/18/21(a) | 25,000,000 | ||||||||||
| 50,000,000 | (LIBOR USD 1-Month + 0.100%), 0.18%, 10/22/21(a) | 50,000,000 | ||||||||||
| 50,000,000 | (LIBOR USD 1-Month + 0.110%), 0.19%, 11/12/21(a) | 50,000,000 | ||||||||||
| 50,000,000 | (LIBOR USD 1-Month + 0.130%), 0.21%, 11/5/21(a) | 50,000,000 | ||||||||||
| 30,000,000 | (LIBOR USD 1-Month + 0.160%), 0.24%, 10/4/21(a) | 30,000,000 | ||||||||||
| 75,000,000 | (SOFR RATE + 0.020%), 0.07%, 4/10/23(a) | 74,997,674 | ||||||||||
| 270,000,000 | (SOFR RATE + 0.025%), 0.08%, 8/28/23(a) | 270,000,000 | ||||||||||
| 91,000,000 | (SOFR RATE + 0.025%), 0.08%, 9/8/23(a) | 91,000,000 | ||||||||||
| 48,000,000 | (SOFR RATE + 0.025%), 0.08%, 9/27/23(a) | 48,000,000 | ||||||||||
| 90,000,000 | (SOFR RATE + 0.025%), 0.08%, 8/4/23(a) | 90,000,000 | ||||||||||
| 90,000,000 | (SOFR RATE + 0.025%), 0.08%, 8/10/23(a) | 90,000,000 | ||||||||||
| 84,000,000 | (SOFR RATE + 0.030%), 0.08%, 6/14/23(a) | 84,000,000 | ||||||||||
| 95,000,000 | (SOFR RATE + 0.030%), 0.08%, 10/12/22(a) | 95,009,919 | ||||||||||
| 250,000,000 | (SOFR RATE + 0.035%), 0.09%, 3/17/23(a) | 250,000,000 | ||||||||||
| 108,000,000 | (SOFR RATE + 0.035%), 0.09%, 4/21/23(a) | 108,000,000 | ||||||||||
| 20,000,000 | (SOFR RATE + 0.035%), 0.09%, 5/12/23(a) | 20,000,000 | ||||||||||
| 42,000,000 | (SOFR RATE + 0.040%), 0.09%, 3/10/23(a) | 42,000,000 | ||||||||||
| 31,000,000 | (SOFR RATE + 0.050%), 0.10%, 2/17/23(a) | 31,000,000 | ||||||||||
| 38,000,000 | (SOFR RATE + 0.060%), 0.11%, 1/13/23(a) | 38,000,000 | ||||||||||
| 51,220,000 | (SOFR RATE + 0.075%), 0.13%, 11/3/22(a) | 51,223,586 | ||||||||||
| 14,000,000 | (SOFR RATE + 0.080%), 0.13%, 3/10/22(a) | 14,000,000 | ||||||||||
| 40,000,000 | (SOFR RATE + 0.080%), 0.13%, 10/14/22(a) | 40,000,000 | ||||||||||
| 25,000,000 | (SOFR RATE + 0.090%), 0.14%, 9/23/22(a) | 25,000,000 | ||||||||||
| 10,000,000 | (SOFR RATE + 0.145%), 0.20%, 7/28/22(a) | 10,000,000 | ||||||||||
| 16,700,000 | (SOFR RATE + 0.190%), 0.24%, 10/15/21(a) | 16,700,062 | ||||||||||
| 15,000,000 | (SOFR RATE + 0.210%), 0.26%, 10/28/21(a) | 15,000,000 | ||||||||||
| 150,000,000 | (SOFR RATE + 0.280%), 0.33%, 10/1/21(a) | 150,000,000 | ||||||||||
| 100,000,000 | (SOFR RATE + 0.350%), 0.40%, 4/7/22(a) | 100,000,000 | ||||||||||
|
| |||||||||||
| 2,206,950,107 | ||||||||||||
|
| |||||||||||
6 |
SCHEDULE OF PORTFOLIO INVESTMENTS
|
U.S. Government Money Market Fund (cont.)
September 30, 2021
| Principal Amount | Value | |||||||||||
Federal Home Loan Banks — 6.76% | ||||||||||||
| $ | 58,225,000 | 3.00%, 10/12/21 | $ | 58,276,771 | ||||||||
| 50,000,000 | 0.06%, 10/15/21 | 49,999,978 | ||||||||||
| 10,000,000 | 1.63%, 11/19/21 | 10,021,103 | ||||||||||
| 128,765,000 | 0.06%, 3/29/22 | 128,760,084 | ||||||||||
| 50,000,000 | 0.04%, 11/29/21 | 49,999,740 | ||||||||||
| 75,000,000 | 0.03%, 10/29/21 | 74,999,796 | ||||||||||
| 100,000,000 | 0.04%, 11/12/21 | 99,999,899 | ||||||||||
| 100,000,000 | 0.02%, 10/15/21 | 99,999,891 | ||||||||||
| 100,000,000 | 0.03%, 12/3/21 | 99,999,126 | ||||||||||
| 141,500,000 | 0.05%, 3/17/22 | 141,493,079 | ||||||||||
| 150,000,000 | (SOFR RATE + 0.010%), 0.06%, 7/25/22(a) | 150,000,000 | ||||||||||
| 75,000,000 | (SOFR RATE + 0.010%), 0.06%, 8/1/22(a) | 75,000,000 | ||||||||||
| 100,000,000 | (SOFR RATE + 0.020%), 0.07%, 2/3/23(a) | 100,000,000 | ||||||||||
| 40,000,000 | (SOFR RATE + 0.035%), 0.09%, 5/19/23(a) | 40,000,000 | ||||||||||
| 18,500,000 | (SOFR RATE + 0.055%), 0.11%, 2/3/23(a) | 18,506,280 | ||||||||||
| 30,000,000 | (SOFR RATE + 0.065%), 0.12%, 12/21/21(a) | 30,000,000 | ||||||||||
| 75,000,000 | (SOFR RATE + 0.080%), 0.13%, 10/26/22(a) | 75,000,000 | ||||||||||
| 75,000,000 | (SOFR RATE + 0.150%), 0.20%, 11/15/21(a) | 75,000,000 | ||||||||||
|
| |||||||||||
| 1,377,055,747 | ||||||||||||
|
| |||||||||||
Freddie Mac — 1.87% | ||||||||||||
| 4,715,000 | (SOFR RATE + 0.065%), 0.12%, 11/10/22(a) | 4,716,853 | ||||||||||
| 150,000,000 | (SOFR RATE + 0.140%), 0.19%, 12/10/21(a) | 150,000,000 | ||||||||||
| 75,000,000 | (SOFR RATE + 0.150%), 0.20%, 3/4/22(a) | 74,993,511 | ||||||||||
| 150,000,000 | (SOFR RATE + 0.190%), 0.24%, 6/2/22(a) | 150,000,000 | ||||||||||
|
| |||||||||||
| 379,710,364 | ||||||||||||
|
| |||||||||||
Total U.S. Government Agency Backed Mortgages | 5,073,308,709 | |||||||||||
|
| |||||||||||
(Cost $5,073,308,709) | ||||||||||||
U.S. Treasury Obligations — 8.89% | ||||||||||||
U.S. Treasury Bill — 1.23% | ||||||||||||
| 50,000,000 | 0.00%, 10/7/21(b) | 49,998,950 | ||||||||||
| 200,000,000 | 0.00%, 11/26/21(b) | 199,992,222 | ||||||||||
|
| |||||||||||
| 249,991,172 | ||||||||||||
|
| |||||||||||
U.S. Treasury Notes — 7.66% | ||||||||||||
| 150,000,000 | 0.13%, 4/30/22 | 150,051,267 | ||||||||||
| 200,000,000 | 0.13%, 5/31/22 | 200,085,271 | ||||||||||
| 250,000,000 | 0.13%, 9/30/22 | 250,096,726 | ||||||||||
| 75,000,000 | 1.50%, 8/15/22 | 75,927,726 | ||||||||||
| 150,000,000 | 1.50%, 10/31/21 | 150,167,325 | ||||||||||
| 200,000,000 | 1.63%, 8/15/22 | 202,694,114 | ||||||||||
| 150,000,000 | 1.75%, 3/31/22 | 151,247,547 | ||||||||||
| 100,000,000 | 1.75%, 6/30/22 | 101,254,168 | ||||||||||
| 7 |
SCHEDULE OF PORTFOLIO INVESTMENTS
|
U.S. Government Money Market Fund (cont.)
September 30, 2021
| Principal Amount | Value | |||||||||||
| $ | 200,000,000 | 1.75%, 6/15/22 | $ | 202,380,594 | ||||||||
| 75,000,000 | 1.88%, 8/31/22 | 76,229,444 | ||||||||||
|
| |||||||||||
| 1,560,134,182 | ||||||||||||
|
| |||||||||||
Total U.S. Treasury Obligations | 1,810,125,354 | |||||||||||
|
| |||||||||||
(Cost $1,810,125,354) | ||||||||||||
U.S. Government Agency Obligations — 7.30% | ||||||||||||
Freddie Mac — 1.46% | ||||||||||||
| 14,290,000 | 0.06%, 9/15/38(c),(d) | 14,290,000 | ||||||||||
| 11,860,000 | 0.06%, 9/15/38(c),(d) | 11,860,000 | ||||||||||
| 270,475,000 | 0.06%, 9/15/50(c),(d) | 270,475,000 | ||||||||||
|
| |||||||||||
| 296,625,000 | ||||||||||||
|
| |||||||||||
U.S. International Development Finance Corp. — 5.84% | ||||||||||||
| 2,860,000 | 0.00%, 10/23/21(b) | 2,861,510 | ||||||||||
| 32,000,000 | 0.00%, 1/26/22(b) | 32,048,005 | ||||||||||
| 2,000,000 | 0.00%, 4/9/22(b) | 2,001,625 | ||||||||||
| 3,900,000 | 0.00%, 7/23/22(b) | 3,901,122 | ||||||||||
| 3,730,000 | 0.00%, 7/23/22(b) | 3,731,073 | ||||||||||
| 8,333,333 | (US Treasury Bill Yield 3-Month + 0.000%), 0.03%, 3/20/24(a) | 8,333,333 | ||||||||||
| 2,000,000 | (US Treasury Bill Yield 3-Month + 0.000%), 0.06%, 7/5/38(a) | 2,000,000 | ||||||||||
| 8,333,333 | (US Treasury Bill Yield 3-Month + 0.000%), 0.08%, 3/20/24(a) | 8,333,333 | ||||||||||
| 7,500,000 | (US Treasury Bill Yield 3-Month + 0.000%), 0.08%, 6/15/25(a) | 7,500,000 | ||||||||||
| 12,025,263 | (US Treasury Bill Yield 3-Month + 0.000%), 0.08%, 9/15/25(a) | 12,025,263 | ||||||||||
| 6,093,030 | (US Treasury Bill Yield 3-Month + 0.000%), 0.08%, 8/15/26(a) | 6,093,030 | ||||||||||
| 13,200,000 | (US Treasury Bill Yield 3-Month + 0.000%), 0.08%, 9/15/26(a) | 13,200,000 | ||||||||||
| 8,333,333 | (US Treasury Bill Yield 3-Month + 0.000%), 0.08%, 9/15/26(a) | 8,333,333 | ||||||||||
| 32,083,333 | (US Treasury Bill Yield 3-Month + 0.000%), 0.08%, 1/20/27(a) | 32,083,333 | ||||||||||
| 14,100,000 | (US Treasury Bill Yield 3-Month + 0.000%), 0.08%, 8/13/27(a) | 14,100,000 | ||||||||||
| 4,500,000 | (US Treasury Bill Yield 3-Month + 0.000%), 0.08%, 8/13/27(a) | 4,500,000 | ||||||||||
| 8,650,000 | (US Treasury Bill Yield 3-Month + 0.000%), 0.08%, 9/30/27(a) | 8,650,000 | ||||||||||
| 74,753,611 | (US Treasury Bill Yield 3-Month + 0.000%), 0.08%, 2/15/28(a) | 74,753,611 | ||||||||||
| 4,935,441 | (US Treasury Bill Yield 3-Month + 0.000%), 0.08%, 2/15/28(a) | 4,935,441 | ||||||||||
| 22,900,000 | (US Treasury Bill Yield 3-Month + 0.000%), 0.08%, 6/20/28(a) | 22,900,000 | ||||||||||
| 9,886,364 | (US Treasury Bill Yield 3-Month + 0.000%), 0.08%, 11/15/28(a) | 9,886,364 | ||||||||||
| 29,777,778 | (US Treasury Bill Yield 3-Month + 0.070%), 0.08%, 8/15/29(a) | 29,777,778 | ||||||||||
| 9,900,000 | (US Treasury Bill Yield 3-Month + 0.000%), 0.08%, 8/15/29(a) | 9,900,000 | ||||||||||
| 53,550,000 | (US Treasury Bill Yield 3-Month + 0.000%), 0.08%, 3/15/30(a) | 53,550,000 | ||||||||||
| 13,000,000 | (US Treasury Bill Yield 3-Month + 0.000%), 0.08%, 10/15/30(a) | 13,000,000 | ||||||||||
| 20,000,000 | (US Treasury Bill Yield 3-Month + 0.000%), 0.08%, 8/15/31(a) | 20,000,000 | ||||||||||
| 1,176,511 | (US Treasury Bill Yield 3-Month + 0.000%), 0.08%, 12/15/33(a) | 1,176,511 | ||||||||||
| 23,107,200 | (US Treasury Bill Yield 3-Month + 0.000%), 0.08%, 1/20/35(a) | 23,107,200 | ||||||||||
| 18,389,480 | (US Treasury Bill Yield 3-Month + 0.000%), 0.08%, 1/20/35(a) | 18,389,480 | ||||||||||
| 17,908,080 | (US Treasury Bill Yield 3-Month + 0.000%), 0.08%, 1/20/35(a) | 17,908,080 | ||||||||||
| 17,330,400 | (US Treasury Bill Yield 3-Month + 0.000%), 0.08%, 1/20/35(a) | 17,330,400 | ||||||||||
| 13,479,200 | (US Treasury Bill Yield 3-Month + 0.000%), 0.08%, 1/20/35(a) | 13,479,178 | ||||||||||
| 8,087,520 | (US Treasury Bill Yield 3-Month + 0.000%), 0.08%, 1/20/35(a) | 8,087,520 | ||||||||||
8 |
SCHEDULE OF PORTFOLIO INVESTMENTS
|
U.S. Government Money Market Fund (cont.)
September 30, 2021
| Principal Amount | Value | |||||||||||
| $ | 7,606,120 | (US Treasury Bill Yield 3-Month + 0.000%), 0.08%, 1/20/35(a) | $ | 7,606,120 | ||||||||
| 4,814,000 | (US Treasury Bill Yield 3-Month + 0.000%), 0.08%, 1/20/35(a) | 4,814,000 | ||||||||||
| 1,540,480 | (US Treasury Bill Yield 3-Month + 0.000%), 0.08%, 1/20/35(a) | 1,540,480 | ||||||||||
| 24,277,500 | (US Treasury Bill Yield 3-Month + 0.000%), 0.08%, 4/20/35(a) | 24,277,500 | ||||||||||
| 20,198,880 | (US Treasury Bill Yield 3-Month + 0.000%), 0.08%, 4/20/35(a) | 20,198,880 | ||||||||||
| 20,004,660 | (US Treasury Bill Yield 3-Month + 0.000%), 0.08%, 4/20/35(a) | 20,004,660 | ||||||||||
| 15,052,050 | (US Treasury Bill Yield 3-Month + 0.000%), 0.08%, 4/20/35(a) | 15,052,050 | ||||||||||
| 14,760,720 | (US Treasury Bill Yield 3-Month + 0.000%), 0.08%, 4/20/35(a) | 14,760,720 | ||||||||||
| 9,128,340 | (US Treasury Bill Yield 3-Month + 0.000%), 0.08%, 4/20/35(a) | 9,128,340 | ||||||||||
| 8,448,570 | (US Treasury Bill Yield 3-Month + 0.000%), 0.08%, 4/20/35(a) | 8,448,570 | ||||||||||
| 7,963,020 | (US Treasury Bill Yield 3-Month + 0.000%), 0.08%, 4/20/35(a) | 7,963,020 | ||||||||||
| 7,089,030 | (US Treasury Bill Yield 3-Month + 0.000%), 0.08%, 4/20/35(a) | 7,089,030 | ||||||||||
| 4,855,500 | (US Treasury Bill Yield 3-Month + 0.000%), 0.08%, 4/20/35(a) | 4,855,500 | ||||||||||
| 5,804,800 | (US Treasury Bill Yield 3-Month + 0.000%), 0.08%, 3/30/37(a) | 5,804,800 | ||||||||||
| 7,900,000 | (US Treasury Bill Yield 3-Month + 0.000%), 0.08%, 7/5/38(a) | 7,900,000 | ||||||||||
| 4,300,000 | (US Treasury Bill Yield 3-Month + 0.000%), 0.08%, 7/5/38(a) | 4,300,000 | ||||||||||
| 2,800,000 | (US Treasury Bill Yield 3-Month + 0.000%), 0.08%, 7/5/38(a) | 2,800,000 | ||||||||||
| 6,750,000 | (US Treasury Bill Yield 3-Month + 0.000%), 0.09%, 11/15/22(a) | 6,750,000 | ||||||||||
| 5,578,947 | (US Treasury Bill Yield 3-Month + 0.000%), 0.09%, 3/15/24(a) | 5,578,947 | ||||||||||
| 2,750,000 | (US Treasury Bill Yield 3-Month + 0.000%), 0.09%, 5/15/24(a) | 2,750,000 | ||||||||||
| 2,538,461 | (US Treasury Bill Yield 3-Month + 0.000%), 0.09%, 5/15/24(a) | 2,538,461 | ||||||||||
| 2,500,000 | (US Treasury Bill Yield 3-Month + 0.000%), 0.09%, 5/15/24(a) | 2,500,000 | ||||||||||
| 2,291,667 | (US Treasury Bill Yield 3-Month + 0.000%), 0.09%, 5/15/24(a) | 2,291,667 | ||||||||||
| 8,380,952 | (US Treasury Bill Yield 3-Month + 0.000%), 0.09%, 8/15/25(a) | 8,380,952 | ||||||||||
| 8,000,000 | (US Treasury Bill Yield 3-Month + 0.000%), 0.09%, 8/15/25(a) | 8,000,000 | ||||||||||
| 7,652,174 | (US Treasury Bill Yield 3-Month + 0.000%), 0.09%, 8/15/25(a) | 7,652,174 | ||||||||||
| 6,666,667 | (US Treasury Bill Yield 3-Month + 0.000%), 0.09%, 8/15/25(a) | 6,666,667 | ||||||||||
| 17,961,000 | (US Treasury Bill Yield 3-Month + 0.000%), 0.09%, 10/10/25(a) | 17,961,000 | ||||||||||
| 7,711,256 | (US Treasury Bill Yield 3-Month + 0.000%), 0.09%, 10/10/25(a) | 7,711,256 | ||||||||||
| 2,179,268 | (US Treasury Bill Yield 3-Month + 0.000%), 0.09%, 10/10/25(a) | 2,179,268 | ||||||||||
| 5,500,000 | (US Treasury Bill Yield 3-Month + 0.000%), 0.09%, 5/15/26(a) | 5,500,000 | ||||||||||
| 4,000,000 | (US Treasury Bill Yield 3-Month + 0.000%), 0.09%, 5/15/26(a) | 4,000,000 | ||||||||||
| 2,090,000 | (US Treasury Bill Yield 3-Month + 0.000%), 0.09%, 5/15/26(a) | 2,090,000 | ||||||||||
| 16,786,440 | (US Treasury Bill Yield 3-Month + 0.000%), 0.09%, 6/20/27(a) | 16,786,440 | ||||||||||
| 8,625,001 | (US Treasury Bill Yield 3-Month + 0.000%), 0.09%, 6/20/27(a) | 8,625,001 | ||||||||||
| 6,133,334 | (US Treasury Bill Yield 3-Month + 0.000%), 0.09%, 6/20/27(a) | 6,133,334 | ||||||||||
| 5,328,334 | (US Treasury Bill Yield 3-Month + 0.000%), 0.09%, 6/20/27(a) | 5,328,334 | ||||||||||
| 5,060,001 | (US Treasury Bill Yield 3-Month + 0.000%), 0.09%, 6/20/27(a) | 5,060,001 | ||||||||||
| 4,600,001 | (US Treasury Bill Yield 3-Month + 0.000%), 0.09%, 6/20/27(a) | 4,600,001 | ||||||||||
| 3,833,334 | (US Treasury Bill Yield 3-Month + 0.000%), 0.09%, 6/20/27(a) | 3,833,334 | ||||||||||
| 16,928,571 | (US Treasury Bill Yield 3-Month + 0.000%), 0.09%, 9/20/27(a) | 16,928,571 | ||||||||||
| 10,167,640 | (US Treasury Bill Yield 3-Month + 0.000%), 0.09%, 2/15/28(a) | 10,167,640 | ||||||||||
| 7,262,600 | (US Treasury Bill Yield 3-Month + 0.000%), 0.09%, 2/15/28(a) | 7,262,600 | ||||||||||
| 5,519,576 | (US Treasury Bill Yield 3-Month + 0.000%), 0.09%, 2/15/28(a) | 5,519,576 | ||||||||||
| 4,720,690 | (US Treasury Bill Yield 3-Month + 0.000%), 0.09%, 2/15/28(a) | 4,720,690 | ||||||||||
| 3,631,300 | (US Treasury Bill Yield 3-Month + 0.000%), 0.09%, 2/15/28(a) | 3,631,300 | ||||||||||
| 8,133,545 | (US Treasury Bill Yield 3-Month + 0.000%), 0.09%, 6/15/28(a) | 8,133,546 | ||||||||||
| 9 |
SCHEDULE OF PORTFOLIO INVESTMENTS
|
U.S. Government Money Market Fund (cont.)
September 30, 2021
| Principal Amount | Value | |||||||||||
| $ | 5,457,273 | (US Treasury Bill Yield 3-Month + 0.000%), 0.09%, 6/15/28(a) | $ | 5,457,273 | ||||||||
| 18,026,415 | (US Treasury Bill Yield 3-Month + 0.000%), 0.09%, 1/15/30(a) | 18,026,415 | ||||||||||
| 18,000,000 | (US Treasury Bill Yield 3-Month + 0.000%), 0.09%, 3/15/30(a) | 18,000,000 | ||||||||||
| 7,839,000 | (US Treasury Bill Yield 3-Month + 0.000%), 0.09%, 5/15/30(a) | 7,839,000 | ||||||||||
| 34,443,750 | (US Treasury Bill Yield 3-Month + 0.000%), 0.09%, 9/20/32(a) | 34,443,750 | ||||||||||
| 8,525,641 | (US Treasury Bill Yield 3-Month + 0.000%), 0.09%, 10/15/32(a) | 8,525,641 | ||||||||||
| 4,679,487 | (US Treasury Bill Yield 3-Month + 0.000%), 0.09%, 11/15/33(a) | 4,679,487 | ||||||||||
| 10,416,659 | (US Treasury Bill Yield 3-Month + 0.000%), 0.09%, 6/15/34(a) | 10,416,659 | ||||||||||
| 9,807,692 | (US Treasury Bill Yield 3-Month + 0.000%), 0.09%, 6/15/34(a) | 9,807,693 | ||||||||||
| 7,401,870 | (US Treasury Bill Yield 3-Month + 0.000%), 0.09%, 6/15/34(a) | 7,401,870 | ||||||||||
| 11,827,500 | (US Treasury Bill Yield 3-Month + 0.000%), 0.09%, 10/15/39(a) | 11,827,500 | ||||||||||
| 4,850,000 | (US Treasury Bill Yield 3-Month + 0.000%), 0.09%, 10/15/39(a) | 4,850,000 | ||||||||||
| 4,657,185 | (US Treasury Bill Yield 3-Month + 0.000%), 0.09%, 10/15/39(a) | 4,657,185 | ||||||||||
| 4,000,000 | (US Treasury Bill Yield 3-Month + 0.000%), 0.09%, 10/15/39(a) | 4,000,000 | ||||||||||
| 2,027,550 | (US Treasury Bill Yield 3-Month + 0.000%), 0.09%, 10/15/39(a) | 2,027,550 | ||||||||||
| 23,568,950 | (US Treasury Bill Yield 3-Month + 0.000%), 0.09%, 7/7/40(a) | 23,568,950 | ||||||||||
| 14,141,370 | (US Treasury Bill Yield 3-Month + 0.000%), 0.09%, 7/7/40(a) | 14,141,370 | ||||||||||
| 13,905,681 | (US Treasury Bill Yield 3-Month + 0.000%), 0.09%, 7/7/40(a) | 13,905,681 | ||||||||||
| 13,481,439 | (US Treasury Bill Yield 3-Month + 0.000%), 0.09%, 7/7/40(a) | 13,481,439 | ||||||||||
| 9,894,245 | (US Treasury Bill Yield 3-Month + 0.000%), 0.09%, 7/7/40(a) | 9,894,245 | ||||||||||
| 6,434,097 | (US Treasury Bill Yield 3-Month + 0.000%), 0.09%, 7/7/40(a) | 6,434,097 | ||||||||||
| 4,242,411 | (US Treasury Bill Yield 3-Month + 0.000%), 0.09%, 7/7/40(a) | 4,242,411 | ||||||||||
| 18,925,000 | (US Treasury Bill Yield 3-Month + 0.000%), 0.09%, 10/15/40(a) | 18,925,000 | ||||||||||
| 13,030,000 | (US Treasury Bill Yield 3-Month + 0.000%), 0.09%, 10/15/40(a) | 13,030,000 | ||||||||||
| 11,500,000 | (US Treasury Bill Yield 3-Month + 0.000%), 0.09%, 10/15/40(a) | 11,500,000 | ||||||||||
| 8,205,000 | (US Treasury Bill Yield 3-Month + 0.000%), 0.09%, 10/15/40(a) | 8,205,000 | ||||||||||
| 7,190,000 | (US Treasury Bill Yield 3-Month + 0.000%), 0.09%, 10/15/40(a) | 7,190,000 | ||||||||||
| 7,095,000 | (US Treasury Bill Yield 3-Month + 0.000%), 0.09%, 10/15/40(a) | 7,095,000 | ||||||||||
| 6,665,000 | (US Treasury Bill Yield 3-Month + 0.000%), 0.09%, 10/15/40(a) | 6,665,000 | ||||||||||
| 5,200,000 | (US Treasury Bill Yield 3-Month + 0.000%), 0.09%, 10/15/40(a) | 5,200,000 | ||||||||||
|
| |||||||||||
| 1,189,139,169 | ||||||||||||
|
| |||||||||||
Total U.S. Government Agency Obligations | 1,485,764,169 | |||||||||||
|
| |||||||||||
(Cost $1,485,764,169) | ||||||||||||
10 |
SCHEDULE OF PORTFOLIO INVESTMENTS
|
U.S. Government Money Market Fund (cont.)
September 30, 2021
| Principal Amount | Value | |||||||||||
Variable Rate Demand Note — 8.29% | ||||||||||||
Municipal Bonds — 8.29% | ||||||||||||
Arizona — 0.13% | ||||||||||||
| $ | 14,020,000 | Maricopa County Industrial Development Authority San Miguel Apartments Project Revenue, 0.06%, 6/15/36, (Credit Support: Fannie Mae)(d) | $ | 14,020,000 | ||||||||
| 13,000,000 | Maricopa County Industrial Development Authority San Lucas Apartments Project Revenue, 0.06%, 10/15/36, (Credit Support: Fannie Mae), Callable 10/15/21 @ 100(d) | 13,000,000 | ||||||||||
|
| |||||||||||
| 27,020,000 | ||||||||||||
|
| |||||||||||
California — 1.18% | ||||||||||||
| 7,605,000 | California Statewide Communities Development Authority Harmony Court Apartments Revenue, Series E, 0.06%, 1/15/37, (Credit Support: Fannie Mae), Callable 10/15/21 @ 100(d) | 7,605,000 | ||||||||||
| 3,900,000 | California Statewide Communities Development Authority Salvation Army Revenue, 0.09%, 6/15/37, (Credit Support: Fannie Mae), Callable 10/15/21 @ 100(d) | 3,900,000 | ||||||||||
| 26,100,000 | California Statewide Communities Development Authority Fairway Family Apartments Revenue, 0.06%, 12/15/37, (Credit Support: Fannie Mae), Callable 10/15/21 @ 100(d) | 26,100,000 | ||||||||||
| 7,000,000 | California Statewide Communities Development Authority Fairway Family Apartments Revenue, Series H, 0.06%, 12/15/37, (Credit Support: Fannie Mae), Callable 10/15/21 @ 100(d) | 7,000,000 | ||||||||||
| 14,130,000 | California Statewide Communities Development Authority Crossing Phase II Revenue, 0.06%, 7/15/40, (Credit Support: Fannie Mae), Callable 10/15/21 @ 100(d) | 14,130,000 | ||||||||||
| 4,825,000 | California Statewide Communities Development Authority Kelvin Courts Revenue, Series B, 0.10%, 6/15/51, (Credit Support: Fannie Mae), Callable 10/15/21 @ 100(d) | 4,825,000 | ||||||||||
| 11,800,000 | City of Chula Vista Teresina Apartments Revenue, Series A, 0.06%, 5/15/36, (Credit Support: Fannie Mae), Callable 10/15/21 @ 100(d) | 11,800,000 | ||||||||||
| 6,875,000 | City of San Jose Kennedy Apartment Homes Revenue, Series K, 0.06%, 12/15/35, (Credit Support: Fannie Mae), Callable 10/15/21 @ 100(d) | 6,875,000 | ||||||||||
| 60,000,000 | County of Contra Costa Park Regency Revenue, Series F, 0.06%, 10/15/33, (Credit Support: Fannie Mae), Callable 10/15/21 @ 100(d) | 60,000,000 | ||||||||||
| 16,000,000 | County of Orange Wood Canyon Villas Revenue, 0.06%, 8/15/31, (Credit Support: Fannie Mae), Callable 10/15/21 @ 100(d) | 16,000,000 | ||||||||||
| 10,265,000 | Sacramento Housing Authority Hurley Creek Senior Apartments Revenue, Series E, 0.06%, 8/1/39, (Credit Support: Federal Home Loan Mortgage), Callable 9/30/21 @ 100(d) | 10,265,000 | ||||||||||
| 71,050,000 | San Francisco City & County Redevelopment Agency Successor Agency 3rd Mission Revenue, Series C, 0.06%, 6/15/34, (Credit Support: Fannie Mae), Callable 10/15/21 @ 100(d) | 71,050,000 | ||||||||||
|
| |||||||||||
| 239,550,000 | ||||||||||||
|
| |||||||||||
| 11 |
SCHEDULE OF PORTFOLIO INVESTMENTS
|
U.S. Government Money Market Fund (cont.)
September 30, 2021
| Principal Amount | Value | |||||||||||
Florida — 0.01% | ||||||||||||
| $ | 2,170,000 | Collier County Housing Finance Authority Brittany Bay Apartments Project Revenue, Series A, 0.08%, 7/15/34, (Credit Support: Fannie Mae), Callable 10/15/21 @ 100(d) | $ | 2,170,000 | ||||||||
|
| |||||||||||
Georgia — 0.03% | ||||||||||||
| 5,500,000 | Atlanta Urban Residential Finance Authority West End Housing Development Project Revenue, 0.20%, 9/1/27, (Credit Support: Fannie Mae)(d) | 5,500,000 | ||||||||||
|
| |||||||||||
Illinois — 0.02% | ||||||||||||
| 4,090,000 | Illinois Housing Development Authority Foxview I & II Apartments Revenue, 0.06%, 1/1/41, (Credit Support: Freddie Mac), Callable 9/30/21 @ 100(d) | 4,090,000 | ||||||||||
|
| |||||||||||
Kentucky — 0.00% | ||||||||||||
| 390,000 | Kentucky Housing Corp. Overlook Terraces Apartments Revenue, Series B, 0.17%, 11/15/40, (Credit Support: Fannie Mae), Callable 10/15/21 @ 100(d) | 390,000 | ||||||||||
|
| |||||||||||
Louisiana — 0.04% | ||||||||||||
| 7,770,000 | Louisiana Housing Corp. Belmont Village Apartments Project Revenue, 0.11%, 5/1/44, (Credit Support: Fannie Mae), Callable 9/30/21 @ 100(d) | 7,770,000 | ||||||||||
|
| |||||||||||
Nevada — 0.18% | ||||||||||||
| 11,100,000 | Nevada Housing Division Multi Unit Housing Apache Project Revenue, Series A, 0.07%, 10/15/32, (Credit Support: Fannie Mae), Callable 10/15/21 @ 100(d) | 11,100,000 | ||||||||||
| 9,165,000 | Nevada Housing Division Multi Unit Housing Sierra Project Revenue, 0.07%, 4/15/38, (Credit Support: Fannie Mae), Callable 10/15/21 @ 100(d) | 9,165,000 | ||||||||||
| 16,300,000 | Nevada Housing Division Multi Unit Sonoma Palms Revenue, 0.07%, 4/15/39, (Credit Support: Fannie Mae), Callable 10/15/21 @ 100(d) | 16,300,000 | ||||||||||
|
| |||||||||||
| 36,565,000 | ||||||||||||
|
| |||||||||||
New York — 5.54% | ||||||||||||
| 48,600,000 | New York City Housing Development Corp. Brittany Development Revenue, Series A, 0.06%, 6/15/29, (Credit Support: Fannie Mae), Callable 10/15/21 @ 100(d) | 48,600,000 | ||||||||||
| 36,100,000 | New York City Housing Development Corp. West 89th Street Development Revenue, Series A, 0.08%, 11/15/29, (Credit Support: Fannie Mae), Callable 10/15/21 @ 100(d) | 36,100,000 | ||||||||||
| 39,700,000 | New York City Housing Development Corp. Lyric Development Revenue, Series A, 0.06%, 11/15/31, (Credit Support: Fannie Mae), Callable 10/15/21 @ 100(d) | 39,700,000 | ||||||||||
| 55,100,000 | New York City Housing Development Corp. Revenue, Series A, 0.06%, 8/15/32, (Credit Support: Fannie Mae), Callable 10/15/21 @ 100(d) | 55,100,000 | ||||||||||
| 54,000,000 | New York City Housing Development Corp. Westport Development Revenue, Series A, 0.06%, 6/15/34, (Credit Support: Fannie Mae), Callable 10/6/21 @ 100(d) | 54,000,000 | ||||||||||
12 |
SCHEDULE OF PORTFOLIO INVESTMENTS
|
U.S. Government Money Market Fund (cont.)
September 30, 2021
| Principal Amount | Value | |||||||||||
| $ | 57,700,000 | New York City Housing Development Corp. Atlantic Court Apartments Revenue, Series A, 0.06%, 12/1/35, (Credit Support: Freddie Mac), Callable 9/30/21 @ 100(d) | $ | 57,700,000 | ||||||||
| 40,000,000 | New York City Housing Development Corp. Rivereast Apartments Revenue, Series A, 0.07%, 12/1/36, (Credit Support: Freddie Mac), Callable 9/30/21 @ 100(d) | 40,000,000 | ||||||||||
| 35,200,000 | New York City Housing Development Corp. Renaissance Revenue, Series A, 0.07%, 6/1/37, (Credit Support: Freddie Mac), Callable 9/30/21 @ 100(d) | 35,200,000 | ||||||||||
| 6,100,000 | New York City Housing Development Corp. 155 West 21st Street Revenue, Series B, 0.08%, 11/15/37, (Credit Support: Fannie Mae), Callable 9/30/21 @ 100(d) | 6,100,000 | ||||||||||
| 4,700,000 | New York City Housing Development Corp. White Plains Apartments Revenue, Series A, 0.06%, 3/1/38, (Credit Support: Freddie Mac), Callable 9/30/21 @ 100(d) | 4,700,000 | ||||||||||
| 5,975,000 | New York City Housing Development Corp. Reverend Ruben Diaz Revenue, Series A, 0.07%, 11/1/38, (Credit Support: Freddie Mac), Callable 9/30/21 @ 100(d) | 5,975,000 | ||||||||||
| 44,775,000 | New York City Housing Development Corp. 89 Murray Street Revenue, Series A, 0.06%, 6/15/39, (Credit Support: Fannie Mae), Callable 9/30/21 @ 100(d) | 44,775,000 | ||||||||||
| 16,000,000 | New York City Housing Development Corp. Markham Gardens Apartments Revenue, Series A, 0.06%, 1/1/40, (Credit Support: Freddie Mac), Callable 9/30/21 @ 100(d) | 16,000,000 | ||||||||||
| 8,445,000 | New York City Housing Development Corp. Ocean Gate Revenue, Series A, 0.07%, 8/1/40, (Credit Support: Freddie Mac), Callable 10/1/21 @ 100(d) | 8,445,000 | ||||||||||
| 21,480,000 | New York City Housing Development Corp. Linden Plaza Revenue, Series A, 0.07%, 4/1/43, (Credit Support: Freddie Mac), Callable 10/1/21 @ 100(d) | 21,480,000 | ||||||||||
| 39,700,000 | New York State Housing Finance Agency Revenue, Series A, 0.06%, 5/1/29, (Credit Support: Fannie Mae), Callable 9/30/21 @ 100(d) | 39,700,000 | ||||||||||
| 96,400,000 | New York State Housing Finance Agency 240 East 39th Street Housing Revenue, 0.06%, 5/15/30, (Credit Support: Fannie Mae), Callable 9/30/21 @ 100(d) | 96,400,000 | ||||||||||
| 15,400,000 | New York State Housing Finance Agency 363 West 30th Street Revenue, Series A, 0.06%, 11/1/32, (Credit Support: Federal Home Loan Mortgage), Callable 9/30/21 @ 100(d) | 15,400,000 | ||||||||||
| 15,000,000 | New York State Housing Finance Agency West 23rd Street Revenue, Series A, 0.06%, 5/15/33, (Credit Support: Fannie Mae), Callable 9/30/21 @ 100(d) | 15,000,000 | ||||||||||
| 42,200,000 | New York State Housing Finance Agency 400 East 84th Street Association Revenue, 0.06%, 5/15/33, (Credit Support: Fannie Mae), Callable 9/30/21 @ 100(d) | 42,200,000 | ||||||||||
| 28,875,000 | New York State Housing Finance Agency Revenue, Series A, 0.07%, 5/15/33, (Credit Support: Fannie Mae), Callable 9/30/21 @ 100(d) | 28,875,000 | ||||||||||
| 25,150,000 | New York State Housing Finance Agency Revenue, Series A, 0.07%, 5/15/33, (Credit Support: Fannie Mae), Callable 9/30/21 @ 100(d) | 25,150,000 | ||||||||||
| 13 |
SCHEDULE OF PORTFOLIO INVESTMENTS
|
U.S. Government Money Market Fund (cont.)
September 30, 2021
| Principal Amount | Value | |||||||||||
| $ | 33,400,000 | New York State Housing Finance Agency Worth Street Revenue, Series A, 0.08%, 5/15/33, (Credit Support: Fannie Mae), Callable 9/30/21 @ 100(d) | $ | 33,400,000 | ||||||||
| 1,560,000 | New York State Housing Finance Agency Revenue, Series B, 0.09%, 5/15/33, (Credit Support: Fannie Mae), Callable 9/30/21 @ 100(d) | 1,560,000 | ||||||||||
| 25,400,000 | New York State Housing Finance Agency 360 West 43rd Street Revenue, Series A, 0.08%, 11/15/33, (Credit Support: Fannie Mae), Callable 9/30/21 @ 100(d) | 25,400,000 | ||||||||||
| 59,800,000 | New York State Housing Finance Agency 900 8th Avenue Revenue, Series A, 0.07%, 5/15/35, (Credit Support: Fannie Mae), Callable 10/6/21 @ 100(d) | 59,800,000 | ||||||||||
| 54,300,000 | New York State Housing Finance Agency Helena Housing Revenue, Series A, 0.07%, 5/15/36, (Credit Support: Fannie Mae), Callable 9/30/21 @ 100(d) | 54,300,000 | ||||||||||
| 42,000,000 | New York State Housing Finance Agency Helena Housing Revenue, Series A, 0.07%, 5/15/36, (Credit Support: Fannie Mae), Callable 9/30/21 @ 100(d) | 42,000,000 | ||||||||||
| 6,200,000 | New York State Housing Finance Agency McCarthy Manor Apartments Revenue, Series A, 0.07%, 5/15/37, (Credit Support: Fannie Mae), Callable 9/30/21 @ 100(d) | 6,200,000 | ||||||||||
| 84,000,000 | New York State Housing Finance Agency 55 West 25th Street Housing Revenue, Series A, 0.06%, 11/15/38, (Credit Support: Fannie Mae), Callable 10/6/21 @ 100(d) | 84,000,000 | ||||||||||
| 44,480,000 | New York State Housing Finance Agency 600 West 42nd Street Revenue, 0.07%, 5/15/41, (Credit Support: Fannie Mae), Callable 9/30/21 @ 100(d) | 44,480,000 | ||||||||||
| 6,900,000 | New York State Housing Finance Agency 316 11th Avenue Housing Revenue, Series B, 0.08%, 5/15/41, (Credit Support: Fannie Mae), Callable 9/30/21 @ 100(d) | 6,900,000 | ||||||||||
| 33,650,000 | New York State Housing Finance Agency 42nd & 10th Street Revenue, Series A, 0.07%, 11/1/41, (Credit Support: Freddie Mac), Callable 9/30/21 @ 100(d) | 33,650,000 | ||||||||||
|
| |||||||||||
| 1,128,290,000 | ||||||||||||
|
| |||||||||||
Texas — 0.56% | ||||||||||||
| 6,115,000 | Harris County Housing Finance Corp. Cornerstone Apartments Revenue, 0.06%, 8/15/37, (Credit Support: Fannie Mae), Callable 10/12/21 @ 100(d) | 6,115,000 | ||||||||||
| 9,800,000 | Houston Housing Finance Corp. Little Nell Apartments Revenue, 0.06%, 1/15/37, (Credit Support: Fannie Mae), Callable 10/15/21 @ 100(d) | 9,800,000 | ||||||||||
| 8,000,000 | Houston Housing Finance Corp. Mayfair Park Apartments Revenue, 0.06%, 4/15/37, (Credit Support: Fannie Mae), Callable 10/15/21 @ 100(d) | 8,000,000 | ||||||||||
| 7,470,000 | Montgomery County Housing Finance Corp. Conroe Lodge Silverdale Revenue, 0.07%, 5/1/39, (Credit Support: Freddie Mac), Callable 10/1/21 @ 100(d) | 7,470,000 | ||||||||||
| 11,835,000 | Southeast Texas Housing Finance Corp. Piedmont Apartments Revenue, 0.06%, 8/15/39, (Credit Support: Fannie Mae), Callable 10/15/21 @ 100(d) | 11,835,000 | ||||||||||
14 |
SCHEDULE OF PORTFOLIO INVESTMENTS
|
U.S. Government Money Market Fund (cont.)
September 30, 2021
| Principal Amount | Value | |||||||||||
| $ | 5,300,000 | Southeast Texas Housing Finance Corp. Wyndham Park Aparments Revenue, 0.06%, 7/15/41, (Credit Support: Fannie Mae), Callable 10/15/21 @ 100(d) | $ | 5,300,000 | ||||||||
| 8,800,000 | Texas Department of Housing & Community Affairs Chisholm Trails Apartments Revenue, 0.06%, 4/15/37, (Credit Support: Fannie Mae), Callable 10/15/21 @ 100(d) | 8,800,000 | ||||||||||
| 10,400,000 | Texas Department of Housing & Community Affairs Bristol Apartments Revenue, 0.06%, 6/15/37, (Credit Support: Fannie Mae), Callable 10/15/21 @ 100(d) | 10,400,000 | ||||||||||
| 11,965,000 | Texas Department of Housing & Community Affairs Pinnacle Apartments Revenue, 0.06%, 6/15/37, (Credit Support: Fannie Mae), Callable 10/15/21 @ 100(d) | 11,965,000 | ||||||||||
| 11,090,000 | Texas Department of Housing & Community Affairs Idlewilde Apartments Revenue, 0.06%, 6/15/40, (Credit Support: Fannie Mae), Callable 10/15/21 @ 100(d) | 11,090,000 | ||||||||||
| 12,080,000 | Texas Department of Housing & Community Affairs Lancaster Apartments Revenue, 0.06%, 7/15/40, (Credit Support: Fannie Mae), Callable 10/15/21 @ 100(d) | 12,080,000 | ||||||||||
| 11,075,000 | Texas Department of Housing & Community Affairs West Oaks Senior Apartments Revenue, 0.06%, 7/1/41, (Credit Support: Freddie Mac), Callable 9/30/21 @ 100(d) | 11,075,000 | ||||||||||
|
| |||||||||||
| 113,930,000 | ||||||||||||
|
| |||||||||||
Washington — 0.54% | ||||||||||||
| 805,000 | Washington State Housing Finance Commission Rainier Court Project Revenue, Series B, 0.08%, 12/15/36, (Credit Support: Fannie Mae), Callable 10/15/21 @ 100(d) | 805,000 | ||||||||||
| 17,180,000 | Washington State Housing Finance Commission Queen Anne Project Revenue, Series A, 0.06%, 9/1/38, (Credit Support: Fannie Mae), Callable 10/1/21 @ 100(d) | 17,180,000 | ||||||||||
| 17,970,000 | Washington State Housing Finance Commission Echo Lake Senior Apartments Project Revenue, 0.06%, 7/15/40, (Credit Support: Fannie Mae), Callable 10/15/21 @ 100(d) | 17,970,000 | ||||||||||
| 6,985,000 | Washington State Housing Finance Commission Barkley Ridge Apartments Revenue, Series A, 0.06%, 9/1/40, (Credit Support: Freddie Mac), Callable 9/30/21 @ 100(d) | 6,985,000 | ||||||||||
| 4,600,000 | Washington State Housing Finance Commission Fairwinds Redmon Revenue, 0.06%, 7/1/41, (Credit Support: Federal Home Loan Bank), Callable 9/30/21 @ 100(d) | 4,600,000 | ||||||||||
| 3,145,000 | Washington State Housing Finance Commission Fairwinds Project Revenue, Series B, 0.06%, 7/1/41, (Credit Support: Federal Home Loan Bank), Callable 9/30/21 @ 100(d) | 3,145,000 | ||||||||||
| 1,650,000 | Washington State Housing Finance Commission Fairwinds Redmon Project Revenue, Series A, 0.06%, 7/1/41, (Credit Support: Federal Home Loan Bank), Callable 9/30/21 @ 100(d) | 1,650,000 | ||||||||||
| 3,425,000 | Washington State Housing Finance Commission Lodge at Eagle Ridge Revenue, Series B, 0.06%, 8/1/41, (Credit Support: East West Bank), Callable 9/30/21 @ 100(d) | 3,425,000 | ||||||||||
| 9,485,000 | Washington State Housing Finance Commission Lodge at Eagle Ridge Revenue, Series A, 0.06%, 8/1/41, (Credit Support: East West Bank), Callable 9/30/21 @ 100(d) | 9,485,000 | ||||||||||
| 15 |
SCHEDULE OF PORTFOLIO INVESTMENTS
|
U.S. Government Money Market Fund (cont.)
September 30, 2021
| Principal Amount | Value | |||||||||||
| $ | 12,900,000 | Washington State Housing Finance Commission Ballard Land Revenue, Series B, 0.06%, 12/15/41, (Credit Support: East West Bank), Callable 9/30/21 @ 100(d) | $ | 12,899,884 | ||||||||
| 31,590,000 | Washington State Housing Finance Commission Ballard Land Revenue, Series A, 0.06%, 12/15/41, (Credit Support: East West Bank), Callable 9/30/21 @ 100(d) | 31,590,000 | ||||||||||
|
| |||||||||||
| 109,734,884 | ||||||||||||
|
| |||||||||||
Wisconsin — 0.06% | ||||||||||||
| 12,320,000 | Public Finance Authority Brannan Park Project Revenue, 0.06%, 1/1/48, (Credit Support: East West Bank), Callable 9/30/21 @ 100(d) | 12,320,000 | ||||||||||
|
| |||||||||||
| 1,687,329,884 | ||||||||||||
|
| |||||||||||
Total Variable Rate Demand Note | 1,687,329,884 | |||||||||||
|
| |||||||||||
(Cost $1,687,329,884) | ||||||||||||
Repurchase Agreements — 47.60% | ||||||||||||
| 300,000,000 | Bank of Montreal, dated 9/20/21; due 10/20/21 at 0.06% with maturity value of $300,013,750 (fully collateralized by Ginnie Mae and Fannie Mae securities with maturity dates ranging from 9/1/36 to 12/15/59 at rates ranging from 2.00% to 5.00%, aggregate original par and fair value of $336,403,646 and $306,000,001, respectively) | 300,000,000 | ||||||||||
| 225,000,000 | Bank of Montreal, dated 9/30/21; due 10/1/21 at 0.05% with maturity value of $225,000,313 (fully collateralized by Ginnie Mae, Fannie Mae, Freddie Mac and U.S. Treasury securities with maturity dates ranging from 10/21/21 to 7/20/71 at rates ranging from 0.00% to 7.63%, aggregate original par and fair value of $238,102,139 and $229,500,057, respectively) | 225,000,000 | ||||||||||
| ||||||||||||
Total Value of Bank of Montreal, (collateral value of $ 535,500,058) | 525,000,000 | |||||||||||
| ||||||||||||
| 40,000,000 | Barclays Capital, Inc., dated 9/30/21; due 10/1/21 at 0.05% with maturity value of $40,000,056 (fully collateralized by U.S. Treasury security with a maturity date of 5/15/41 at a rate of 4.38%, original par and fair value of $28,855,400 and $40,800,100, respectively) | 40,000,000 | ||||||||||
| ||||||||||||
Total Value of Barclays Capital, Inc., (collateral value of $ 40,800,100) | 40,000,000 | |||||||||||
| ||||||||||||
16 |
SCHEDULE OF PORTFOLIO INVESTMENTS
|
U.S. Government Money Market Fund (cont.)
September 30, 2021
| Principal Amount | Value | |||||||||||
| $ | 250,000,000 | Citigroup Global Markets, Inc., dated 9/30/21; due 10/1/21 at 0.05% with maturity value of $250,000,347 (fully collateralized by Fannie Mae, Federal Farm Credit Bank, Federal Home Loan Bank and Freddie Mac securities with maturity dates ranging from 10/4/21 to 4/1/39 at rates ranging from 0.00% to 6.75%, aggregate original par and fair value of $234,579,000 and $255,001,254, respectively) | $ | 250,000,000 | ||||||||
| 250,000,000 | Citigroup Global Markets, Inc., dated 9/30/21; due 10/1/21 at 0.06% with maturity value of $250,000,417 (fully collateralized by U.S. Treasury securities with maturity dates ranging from 6/30/28 to 8/31/28 at rates ranging from 1.13% to 1.25%, aggregate original par and fair value of $256,539,800 and $255,000,017, respectively) | 250,000,000 | ||||||||||
| 100,000,000 | Citigroup Global Markets, Inc., dated 9/30/21; due 10/1/21 at 0.05% with maturity value of $100,000,139 (fully collateralized by U.S. Treasury securities with maturity dates ranging from 1/15/31 to 7/15/31 at rates ranging from 0.13% to 5.38%, aggregate original par and fair value of $91,396,700 and $102,000,048, respectively) | 100,000,000 | ||||||||||
| 50,000,000 | Citigroup Global Markets, Inc., dated 9/30/21; due 10/7/21 at 0.05% with maturity value of $50,000,486 (fully collateralized by Fannie Mae, Federal Farm Credit Bank, Federal Home Loan Bank, Freddie Mac and U.S. Treasury securities with maturity dates ranging from 10/7/21 to 5/15/37 at rates ranging from 0.00% to 5.25%, aggregate original par and fair value of $55,754,752 and $51,000,012, respectively) | 50,000,000 | ||||||||||
| 50,000,000 | Citigroup Global Markets, Inc., dated 9/30/21; due 10/7/21 at 0.05% with maturity value of $50,000,486 (fully collateralized by U.S. Treasury securities with maturity dates ranging from 2/15/41 to 8/15/41 at rates ranging from 1.75% to 4.75%, aggregate original par and fair value of $53,033,800 and $51,000,174, respectively) | 50,000,000 | ||||||||||
| 35,000,000 | Citigroup Global Markets, Inc., dated 9/28/21; due 10/5/21 at 0.05% with maturity value of $35,000,340 (fully collateralized by Fannie Mae, Federal Farm Credit Bank, Federal Home Loan Bank and Freddie Mac securities with maturity dates ranging from 3/17/23 to 9/8/23 at rates ranging from 0.13% to 3.25%, aggregate original par and fair value of $35,759,000 and $35,707,085, respectively) | 35,000,000 | ||||||||||
| 35,000,000 | Citigroup Global Markets, Inc., dated 9/28/21; due 10/5/21 at 0.05% with maturity value of $35,000,340 (fully collateralized by U.S. Treasury securities with maturity dates ranging from 1/15/31 to 7/15/31 at rates ranging from 0.13% to 5.38%, aggregate original par and fair value of $31,988,900 and $35,700,084, respectively) | 35,000,000 | ||||||||||
| ||||||||||||
Total Value of Citigroup Global Markets, Inc., (collateral value of $ 785,408,674) | 770,000,000 | |||||||||||
| ||||||||||||
| 17 |
SCHEDULE OF PORTFOLIO INVESTMENTS
|
U.S. Government Money Market Fund (cont.)
September 30, 2021
| Principal Amount | Value | |||||||||||
| $ | 200,000,000 | Credit Agricole Corporate and Investment Bank, dated 9/30/21; due 10/1/21 at 0.01% with maturity value of $200,000,056 (fully collateralized by U.S. Treasury securities with maturity dates ranging from 7/15/28 to 1/15/30 at rates ranging from 0.13% to 0.75%, aggregate original par and fair value of $173,651,800 and $204,000,056, respectively) | $ | 200,000,000 | ||||||||
| 130,000,000 | Credit Agricole Corporate and Investment Bank, dated 9/30/21; due 10/1/21 at 0.05% with maturity value of $130,000,181 (fully collateralized by U.S. Treasury security with a maturity date of 7/15/22 at a rate of 0.13%, original par and fair value of $109,069,500 and $132,600,074, respectively) | 130,000,000 | ||||||||||
| ||||||||||||
Total Value of Credit Agricole Corporate and Investment Bank, (collateral value of $ 336,600,130) | 330,000,000 | |||||||||||
| ||||||||||||
| 500,000,000 | Deutsche Bank Securities, dated 9/30/21; due 10/1/21 at 0.05% with maturity value of $500,000,694 (fully collateralized by Ginnie Mae and U.S. Treasury securities with maturity dates ranging from 7/15/22 to 7/20/51 at rates ranging from 0.00% to 5.00%, aggregate original par and fair value of $543,647,034 and $510,000,018, respectively) | 500,000,000 | ||||||||||
| ||||||||||||
Total Value of Deutsche Bank Securities, (collateral value of $ 510,000,018) | 500,000,000 | |||||||||||
| ||||||||||||
| 5,925,000,000 | Federal Reserve, dated 9/30/21; due 10/1/21 at 0.05% with maturity value of $5,925,008,229 (fully collateralized by U.S. Treasury securities with maturity dates ranging from 8/15/22 to 11/15/40 at rates ranging from 0.13% to 2.88%, aggregate original par and fair value of $5,960,069,800 and $5,925,008,272, respectively) | 5,925,000,000 | ||||||||||
| ||||||||||||
Total Value of Federal Reserve, (collateral value of $ 5,925,008,272) | 5,925,000,000 | |||||||||||
| ||||||||||||
| 100,000,000 | Goldman Sachs & Co., dated 9/30/21; due 10/1/21 at 0.05% with maturity value of $100,000,139 (fully collateralized by Ginnie Mae and Fannie Mae securities with maturity dates ranging from 4/1/24 to 9/20/51 at rates ranging from 2.50% to 6.50%, aggregate original par and fair value of $107,678,043 and $102,000,000, respectively) | 100,000,000 | ||||||||||
| ||||||||||||
Total Value of Goldman Sachs & Co., (collateral value of $ 102,000,000) | 100,000,000 | |||||||||||
| ||||||||||||
18 |
SCHEDULE OF PORTFOLIO INVESTMENTS
|
U.S. Government Money Market Fund (cont.)
September 30, 2021
| Principal Amount | Value | |||||||||||
| $ | 300,000,000 | ING Financial Markets LLC, dated 9/30/21; due 10/1/21 at 0.05% with maturity value of $300,000,417 (fully collateralized by Ginnie Mae, Fannie Mae and Freddie Mac securities with maturity dates ranging from 10/1/27 to 1/1/57 at rates ranging from 1.50% to 7.50%, aggregate original par and fair value of $577,072,853 and $306,000,000, respectively) | $ | 300,000,000 | ||||||||
| 200,000,000 | ING Financial Markets LLC, dated 9/30/21; due 10/1/21 at 0.05% with maturity value of $200,000,278 (fully collateralized by U.S. Treasury securities with maturity dates ranging from 8/15/24 to 5/15/40 at rates ranging from 2.38% to 4.38%, aggregate original par and fair value of $200,000,000 and $204,297,040, respectively) | 200,000,000 | ||||||||||
| ||||||||||||
Total Value of ING Financial Markets LLC, (collateral value of $ 510,297,040) | 500,000,000 | |||||||||||
| ||||||||||||
| 150,000,000 | Merrill Lynch, Pierce, Fenner, Smith, dated 9/30/21; due 10/1/21 at 0.05% with maturity value of $150,000,208 (fully collateralized by U.S. Treasury security with a maturity date of 6/30/23 at a rate of 2.63%, original par and fair value of $145,986,500 and $153,000,056, respectively) | 150,000,000 | ||||||||||
| 100,000,000 | Merrill Lynch, Pierce, Fenner, Smith, dated 9/30/21; due 10/1/21 at 0.05% with maturity value of $100,000,139 (fully collateralized by Federal Home Loan Bank securities with maturity dates ranging from 2/17/23 to 6/11/38 at rates ranging from 1.38% to 4.00%, aggregate original par and fair value of $87,235,000 and $102,002,766, respectively) | 100,000,000 | ||||||||||
| 50,000,000 | Merrill Lynch, Pierce, Fenner, Smith, dated 9/20/21; due 10/20/21 at 0.05% with maturity value of $50,002,083 (fully collateralized by U.S. Treasury security with a maturity date of 2/15/24 at a rate of 0.13%, original par and fair value of $51,300,900 and $51,000,084, respectively) | 50,000,000 | ||||||||||
| ||||||||||||
Total Value of Merrill Lynch, Pierce, Fenner, Smith, (collateral value of $ 306,002,906) | 300,000,000 | |||||||||||
| ||||||||||||
| 500,000,000 | National Australia Bank, dated 9/30/21; due 10/1/21 at 0.05% with maturity value of $500,000,694 (fully collateralized by U.S. Treasury securities with maturity dates ranging from 2/28/23 to 7/31/28 at rates ranging from 0.38% to 2.63%, aggregate original par and fair value of $500,000,000 and $510,261,482, respectively) | 500,000,000 | ||||||||||
| ||||||||||||
Total Value of National Australia Bank, (collateral value of $ 510,261,482) | 500,000,000 | |||||||||||
| ||||||||||||
| 19 |
SCHEDULE OF PORTFOLIO INVESTMENTS
|
U.S. Government Money Market Fund (cont.)
September 30, 2021
| Principal Amount | Value | |||||||||||
| $ | 200,000,000 | TD Securities (USA), dated 9/28/21; due 10/5/21 at 0.05% with maturity value of $200,001,944 (fully collateralized by Freddie Mac securities with maturity dates ranging from 3/1/51 to 10/1/51 at rates ranging from 2.00% to 3.00%, aggregate original par and fair value of $200,633,356 and $204,000,001, respectively) | $ | 200,000,000 | ||||||||
| ||||||||||||
Total Value of TD Securities (USA), (collateral value of $ 204,000,001) | 200,000,000 | |||||||||||
| ||||||||||||
Total Repurchase Agreements | 9,690,000,000 | |||||||||||
|
| |||||||||||
(Cost $9,690,000,000) | ||||||||||||
Total Investments | $ | 19,746,528,116 | ||||||||||
(Cost $19,746,528,116)(e) — 97.01% | ||||||||||||
Other assets in excess of liabilities — 2.99% | 608,069,977 | |||||||||||
|
| |||||||||||
NET ASSETS — 100.00% | $ | 20,354,598,093 | ||||||||||
|
| |||||||||||
| (a) | Floating rate note. Rate shown is as of report date. |
| (b) | Represents effective yield to maturity on date of purchase. |
| (c) | Security exempt from registration under Rule 144A or Section 4(2) of the Securities Act of 1933, as amended. These securities may be resold in transactions exempt from registration, normally to qualified institutional buyers. |
| (d) | Variable or floating rate security, which interest rate adjusts periodically based on changes in current interest rates and prepayments on the underlying pool of assets. Rate shown is the rate in effect as of period end. |
| (e) | Tax cost of securities is equal to book cost of securities. |
Abbreviations used are defined below:
LIBOR - London Interbank Offered Rate
SOFR - Secured Overnight Financing Rate
See Notes to the Financial Statements.
20 |
|
Statement of Assets and Liabilities
| September 30, 2021 | ||||
| U.S. Government Money Market Fund | ||||
Assets: | ||||
Investments, at value (cost $10,056,528,116) | $10,056,528,116 | |||
Repurchase agreements, at value (cost $9,690,000,000) | 9,690,000,000 | |||
Cash | 638,927,363 | |||
Interest and dividend receivable | 12,857,511 | |||
Prepaid expenses and other assets | 13,782 | |||
|
| |||
Total Assets | 20,398,326,772 | |||
|
| |||
Liabilities: | ||||
Foreign withholding tax payable | 6,190 | |||
Distributions payable | 85,645 | |||
Payable for investments purchased | 37,000,311 | |||
Accrued expenses and other payables: | ||||
Investment advisory fees | 1,618,624 | |||
Accounting fees | 159,879 | |||
Audit fees | 29,779 | |||
Trustees’ fees | 10,774 | |||
Distribution fees | 3,945,665 | |||
Custodian fees | 43,090 | |||
Shareholder reports | 123,546 | |||
Shareholder servicing fees | 440,787 | |||
Transfer agent fees | 16,224 | |||
Other | 248,165 | |||
|
| |||
Total Liabilities | 43,728,679 | |||
|
| |||
Net Assets | $20,354,598,093 | |||
|
| |||
Net Assets Consists of: | ||||
Capital | $20,354,554,099 | |||
Accumulated earnings | 43,994 | |||
|
| |||
Net Assets | $20,354,598,093 | |||
|
| |||
| 21 |
FINANCIAL STATEMENTS
|
Statement of Assets and Liabilities (cont.)
September 30, 2021
U.S. Government | ||||||
Net Assets |
| |||||
RBC Institutional Class 1 | $ | 11,201,104,629 | ||||
RBC Institutional Class 2 | 3,935,268,481 | |||||
RBC Investor Class | 5,218,224,983 | |||||
|
| |||||
Total | $ | 20,354,598,093 | ||||
|
| |||||
Shares Outstanding (Unlimited number of shares authorized, no par value): | ||||||
RBC Institutional Class 1 | 11,201,072,253 | |||||
RBC Institutional Class 2 | 3,935,186,375 | |||||
RBC Investor Class | 5,218,330,389 | |||||
|
| |||||
Total | 20,354,589,017 | |||||
|
| |||||
Net Asset Values and Redemption Prices Per Share: | ||||||
RBC Institutional Class 1 | $ | 1.00 | ||||
|
| |||||
RBC Institutional Class 2 | $ | 1.00 | ||||
|
| |||||
RBC Investor Class | $ | 1.00 | ||||
|
| |||||
See Notes to the Financial Statements.
22 |
|
Statement of Operations
For the Year Ended September 30, 2021
| U.S. Government Money Market Fund | ||||||||
Investment Income: | ||||||||
Interest income | $ | 17,154,276 | ||||||
|
| |||||||
Expenses: | ||||||||
Investment advisory fees | 15,923,620 | |||||||
Distribution fees–RBC Institutional Class 2 | 5,692,325 | |||||||
Distribution fees–RBC Investor Class | 36,923,512 | |||||||
Accounting fees | 976,986 | |||||||
Audit fees | 37,386 | |||||||
Custodian fees | 233,310 | |||||||
Insurance fees | 99,826 | |||||||
Legal fees | 394,022 | |||||||
Registrations and filing fees | 92,884 | |||||||
Shareholder reports | 400,995 | |||||||
Transfer agent fees–RBC Institutional Class 1 | 34,611 | |||||||
Transfer agent fees–RBC Institutional Class 2 | 5,818 | |||||||
Trustees’ fees and expenses | 531,044 | |||||||
Shareholder services administration fees–RBC Institutional Class 1 | 4,218,193 | |||||||
Tax expense | 4,220 | |||||||
Other fees | 271,481 | |||||||
|
| |||||||
Total expenses before fee waiver/reimbursement | 65,840,233 | |||||||
Expenses waived/reimbursed by: | ||||||||
Distributor - Class Specific | (41,798,392 | ) | ||||||
Shareholder Services Administrator - RBC Institutional Class 1 | (3,236,277 | ) | ||||||
Advisor | (7,117,273 | ) | ||||||
|
| |||||||
Net expenses | 13,688,291 | |||||||
|
| |||||||
Net Investment Income | 3,465,985 | |||||||
|
| |||||||
Realized/Unrealized Gains/(Losses): | ||||||||
Net realized gains from investment transactions | 770 | |||||||
|
| |||||||
Change in net assets resulting from operations | $ | 3,466,755 | ||||||
|
| |||||||
See Notes to the Financial Statements.
| 23 |
|
Statement of Changes in Net Assets
| U.S. Government Money Market Fund | ||||||||
| For the Year Ended September 30, 2021 | For the Year Ended September 30, 2020 | |||||||
From Investment Activities | ||||||||
Operations: | ||||||||
Net investment income | $ | 3,465,985 | $ | 63,900,919 | ||||
Net realized gains from investments | 770 | 35,240 | ||||||
|
|
|
| |||||
Change in net assets resulting from operations | 3,466,755 | 63,936,159 | ||||||
|
|
|
| |||||
Distributions to Shareholders: | ||||||||
RBC Institutional Class 1 | (1,938,778 | ) | (40,142,284 | ) | ||||
RBC Institutional Class 2 | (766,509 | ) | (19,933,913 | ) | ||||
RBC Investor Class | (788,003 | ) | (3,820,504 | ) | ||||
|
|
|
| |||||
Change in net assets resulting from shareholder distributions | (3,493,290 | ) | (63,896,701 | ) | ||||
|
|
|
| |||||
Capital Transactions: | ||||||||
Proceeds from shares issued | 78,751,513,282 | 93,301,079,952 | ||||||
Distributions reinvested | 2,621,376 | 45,165,935 | ||||||
Cost of shares redeemed | (74,972,087,943 | ) | (82,239,718,802 | ) | ||||
|
|
|
| |||||
Change in net assets resulting from capital transactions | 3,782,046,715 | 11,106,527,085 | ||||||
|
|
|
| |||||
Net increase in net assets | 3,782,020,180 | 11,106,566,543 | ||||||
Net Assets: | ||||||||
Beginning of year | 16,572,577,913 | 5,466,011,370 | ||||||
|
|
|
| |||||
End of year | $ | 20,354,598,093 | $ | 16,572,577,913 | ||||
|
|
|
| |||||
Share Transactions: | ||||||||
Issued | 78,751,513,282 | 93,301,079,952 | ||||||
Reinvested | 2,621,376 | 45,165,935 | ||||||
Redeemed | (74,972,087,943 | ) | (82,239,718,802 | ) | ||||
|
|
|
| |||||
Change in shares resulting from capital transactions | 3,782,046,715 | 11,106,527,085 | ||||||
|
|
|
| |||||
See Notes to the Financial Statements.
24 |
|
U.S. Government Money Market Fund
(Selected data for a share outstanding throughout the periods indicated)
| ||||||||||||||||||||||||||||
| Investment Activities | Distributions | |||||||||||||||||||||||||||
| Net Asset Value, Beginning of Year | Net Investment Income(a) | Net Realized and Unrealized Gains (Losses) on Investments | Total from Investment Activities | Net Investment Income | Total Distributions | Net Asset Value, End of Year | ||||||||||||||||||||||
RBC Institutional Class 1 | ||||||||||||||||||||||||||||
Year Ended 9/30/21 | $ 1.00 | —(b) | —(b) | —(b) | —(b) | —(b) | $ 1.00 | |||||||||||||||||||||
Year Ended 9/30/20 | 1.00 | 0.01 | —(b) | 0.01 | (0.01) | (0.01) | 1.00 | |||||||||||||||||||||
Year Ended 9/30/19 | 1.00 | 0.02 | —(b) | 0.02 | (0.02) | (0.02) | 1.00 | |||||||||||||||||||||
Year Ended 9/30/18 | 1.00 | 0.01 | —(b) | 0.01 | (0.01) | (0.01) | 1.00 | |||||||||||||||||||||
Year Ended 9/30/17 | 1.00 | —(b) | —(b) | —(b) | —(b) | —(b) | 1.00 | |||||||||||||||||||||
RBC Institutional Class 2 | ||||||||||||||||||||||||||||
Year Ended 9/30/21 | $ 1.00 | —(b) | —(b) | —(b) | —(b) | —(b) | $ 1.00 | |||||||||||||||||||||
Year Ended 9/30/20 | 1.00 | 0.01 | —(b) | 0.01 | (0.01) | (0.01) | 1.00 | |||||||||||||||||||||
Year Ended 9/30/19 | 1.00 | 0.02 | —(b) | 0.02 | (0.02) | (0.02) | 1.00 | |||||||||||||||||||||
Year Ended 9/30/18 | 1.00 | 0.01 | —(b) | 0.01 | (0.01) | (0.01) | 1.00 | |||||||||||||||||||||
Year Ended 9/30/17 | 1.00 | —(b) | —(b) | —(b) | —(b) | —(b) | 1.00 | |||||||||||||||||||||
RBC Investor Class | ||||||||||||||||||||||||||||
Year Ended 9/30/21 | $ 1.00 | —(b) | —(b) | —(b) | —(b) | —(b) | $ 1.00 | |||||||||||||||||||||
Year Ended 9/30/20 | 1.00 | —(b) | —(b) | —(b) | —(b) | —(b) | 1.00 | |||||||||||||||||||||
Year Ended 9/30/19 | 1.00 | 0.01 | —(b) | 0.01 | (0.01) | (0.01) | 1.00 | |||||||||||||||||||||
Year Ended 9/30/18 | 1.00 | 0.01 | —(b) | 0.01 | (0.01) | (0.01) | 1.00 | |||||||||||||||||||||
Year Ended 9/30/17 | 1.00 | —(b) | —(b) | —(b) | —(b) | —(b) | 1.00 | |||||||||||||||||||||
(a) Per share net investment income (loss) has been calculated using the average daily shares method.
(b) Less than $0.01 or $(0.01) per share.
| 25 |
FINANCIAL HIGHLIGHTS
|
U.S. Government Money Market Fund
(Selected data for a share outstanding throughout the periods indicated)
| ||||||||||||||||||||
| Ratios/Supplemental Data | ||||||||||||||||||||
| Total Return(a) | Net Assets, End of Year (millions) | Ratio of Net Expenses to Average Net Assets | Ratio of Net Investment Income (Loss) to Average Net Assets | Ratio of Expenses to Average Net Assets* | ||||||||||||||||
RBC Institutional Class 1 | ||||||||||||||||||||
Year Ended 9/30/21 | 0.02% | $ 11,201 | 0.09% | 0.02% | 0.17% | |||||||||||||||
Year Ended 9/30/20 | 0.83% | 10,821 | 0.16% | 0.43% | 0.17% | |||||||||||||||
Year Ended 9/30/19 | 2.19% | 1,916 | 0.19% | 2.17% | 0.19% | |||||||||||||||
Year Ended 9/30/18 | 1.41% | 2,106 | 0.18% | 1.35% | 0.19% | |||||||||||||||
Year Ended 9/30/17 | 0.60% | 2,210 | 0.18% | 0.55% | 0.18% | |||||||||||||||
RBC Institutional Class 2 | ||||||||||||||||||||
Year Ended 9/30/21 | 0.02% | $ 3,935 | 0.09% | 0.02% | 0.27% | |||||||||||||||
Year Ended 9/30/20 | 0.71% | 3,358 | 0.26% | 0.62% | 0.27% | |||||||||||||||
Year Ended 9/30/19 | 2.09% | 2,510 | 0.29% | 2.08% | 0.29% | |||||||||||||||
Year Ended 9/30/18 | 1.31% | 1,720 | 0.29% | 1.34% | 0.29% | |||||||||||||||
Year Ended 9/30/17 | 0.50% | 1,224 | 0.29% | 0.54% | 0.29% | |||||||||||||||
RBC Investor Class | ||||||||||||||||||||
Year Ended 9/30/21 | 0.02% | $ 5,218 | 0.08% | 0.02% | 1.12% | |||||||||||||||
Year Ended 9/30/20 | 0.34% | 2,394 | 0.54% | 0.25% | 1.12% | |||||||||||||||
Year Ended 9/30/19 | 1.37% | 1,040 | 1.00% | 1.36% | 1.14% | |||||||||||||||
Year Ended 9/30/18 | 0.59% | 1,107 | 1.00% | 0.50% | 1.13% | |||||||||||||||
Year Ended 9/30/17 | 0.02% | 2,158 | 0.87% | 0.01% | 1.15% | |||||||||||||||
| * | During the period, certain fees were contractually or voluntarily reduced and/or reimbursed. If such contractual/voluntary fee reductions and reimbursements had not occurred, the ratio would have been as indicated. |
| (a) | Assumes investment at net asset value at the beginning of the period, reinvestment of all dividends and distributions, and a complete redemption of the investment at net asset value at the end of the period. |
See Notes to the Financial Statements.
26 |
|
September 30, 2021
1. Organization:
RBC Funds Trust (the “Trust”) is registered under the Investment Company Act of 1940 (as amended) as an open-end management investment company. The Trust was organized as a Delaware statutory trust on December 16, 2003 and currently consists of 16 portfolios. Overall responsibility for the management of the Trust is vested in its Board of Trustees (the “Board”).Predecessor funds to the Trust were reorganized as portfolios of the Trust effective April 16, 2004. This report includes the U.S. Government Money Market Fund (“Fund”).
The Fund offers three share classes: RBC Institutional Class 1, RBC Institutional Class 2 and RBC Investor Class. Prior to November 9, 2017, the Fund also offered shares in RBC Select Class and RBC Reserve Class.
RBC Global Asset Management (U.S.) Inc. (“RBC GAM-US” or “Advisor” or “Co-Administrator”) acts as the investment advisor for the Fund. The officers of the Trust (“Fund Management”) are also employees of RBC GAM-US.
2. Significant Accounting Policies
The Fund is an investment company that follows accounting and reporting guidance under the Financial Accounting Standards Board. Summarized below are the significant accounting policies of the Funds. These policies conform to accounting principles generally accepted in the United States of America (“U.S. GAAP”). Fund Management follows these policies when preparing financial statements. Fund Management may also be required to make estimates and assumptions that affect the reported amounts of assets and liabilities at the date of the financial statements and the reported amounts of income and expenses for the period. Actual results could differ from those estimates. The financial statements are as of the close of regular trading on the New York Stock Exchange (“NYSE”).
Security Valuation:
The Fund has elected to use the amortized cost method to value its securities (other than other investment companies) pursuant to Rule 2a-7 of the Investment Company Act of 1940, as amended, which the Board believes approximates fair market value. The amortized cost method involves valuing a security initially at its cost, and, thereafter, a constant proportionate accretion of discounts and amortization of premiums are recorded until the maturity of the security. Amortized cost approximates the current fair value of a security, but since the value is not obtained from a quoted price in an active market, securities valued at amortized cost are categorized as Level 2 in the fair value hierarchy (see “Fair Value Measurements” below for additional information). If amortized cost no longer approximates fair value due to credit or other impairments of an issuer, the Fund will determine the fair value of its securities by using pricing and valuation procedures approved by the Board. Investments in open-end investment companies (mutual funds) are valued at net asset value and are categorized as Level 1 in the fair value hierarchy.
The Board has delegated to the Fund’s Pricing Committee (“Pricing Committee”) the responsibility for implementing the pricing and valuation procedures, including responsibility for determining the fair value of the Fund’s securities or other assets and liabilities. The Pricing Committee includes representatives of the Fund’s Advisor, and Co-Administrator, including personnel from accounting and operations, investment management, trading, risk management and compliance. The Pricing Committee meets at least quarterly to review and approve Fund valuation matters, including a review of the Fund’s pricing activity and operations, fair value measurements, pricing vendors, policies and procedures, and related controls. At least a quorum of the Pricing Committee shall meet more frequently, as needed, to consider and approve time-sensitive fair valuation matters. The Pricing Committee reports to the Valuation, Portfolio Management and Performance Committee (“Valuation Committee”) of the Board. Members of the Pricing Committee meet with the Valuation Committee and the Board at each of their regularly scheduled meetings to discuss valuation matters and actions taken during the period.
| 27 |
NOTES TO FINANCIAL STATEMENTS
|
In accordance with Rule 2a-7, the fair values of the securities held in the Fund are determined at least once per week using evaluated prices supplied by third-party pricing vendors approved by the Board. The pricing services utilize both dealer-supplied valuations and electronic data processing techniques that take into account appropriate factors such as institutional-sized trading in similar groups of securities, yield, quality, coupon rate, maturity and type of issue. These security values are then compared to the securities’ amortized cost. If a security price is not available from a pricing service or broker-dealer, or Fund Management determines that a price provided by a pricing service or broker-dealer does not approximate fair value for purposes of this comparison, the security’s fair value will be determined in good faith by the Pricing Committee in accordance with procedures and methodologies adopted by the Board. General factors used in determining the fair value of securities include, but are not limited to, fundamental analytical data relating to the security, the issuer and the market, such as duration, prepayment and default rates; general level of interest rates and changes in interest rates; information from broker-dealers; trading in similar securities; any restrictions on disposition of the security; and an evaluation of the forces that influence the market in which the investments are traded.
Fair Value Measurements:
The Funds disclose the fair value of their investments in a hierarchy that categorizes investments based on the inputs to valuation techniques used to measure fair value. The three levels of the fair value hierarchy are as follows:
• Level 1 - Inputs that reflect unadjusted quoted prices in active markets for identical assets or liabilities that the Funds have the ability to access at the measurement date.
• Level 2 - Significant inputs other than quoted prices that are observable for the asset or liability either directly or indirectly, including inputs in markets that are not considered to be active. Observable inputs may include quoted prices for similar securities, interest rates, spreads, prepayment spreads, etc.
• Level 3 - Significant unobservable inputs based on the best information available in the circumstances, to the extent observable inputs are not available (including the Fund’s own assumptions in determining the fair value of investments).
The inputs or methodology used for valuing investments are not necessarily an indication of the risk associated with investing in those securities.
Inputs used in determining fair value of an investment may include, but are not limited to, price information, volatility statistics, credit and market data, and other factors, all of which may be either observable or unobservable. Inputs can vary among investments and will be impacted by the investment type and volume of activity for the particular security or similar securities in the market. Investments in the Level 3 category are generally supported by transactions and quoted prices from dealers participating in the market for those investments. Investments may be included in the Level 3 category due to a lack of market activity or transparency. Internal valuation models may also be used as a pricing source for Level 3 investments. Internal valuation models may rely on one or more unobservable inputs, such as estimated cash flows, financial statement analysis and discount rates.
28 |
NOTES TO FINANCIAL STATEMENTS
|
The summary of inputs used to determine the fair value of the Fund’s investments as of September 30, 2021 is as follows:
| Level 2 | Level 3 | |||||||||||||||
| Significant | Significant | |||||||||||||||
| Level 1 | Observable | Unobservable | ||||||||||||||
| Funds | Quoted Prices | Inputs | Inputs | Total | ||||||||||||
Assets: | ||||||||||||||||
Investments in Securities | ||||||||||||||||
U.S. Government Money Market Fund | $— | 19,746,528,116 | (a)(b) | $— | 19,746,528,116 | |||||||||||
| (a) | The breakdown of the Fund’s investments into major categories is disclosed in the Schedule of Portfolio Investments. |
| (b) | The breakdown of the Fund’s investments by state classification or political subdivision is disclosed in the Schedule of Portfolio Investments. |
Repurchase Agreements:
The Fund may enter into repurchase agreements with counterparties whom the Advisor has deemed creditworthy, including primary dealers that report to the Federal Reserve Bank of New York or other large U.S. commercial banks or broker-dealers. These repurchase agreements are subject to the seller’s agreement to repurchase such securities at a mutually agreed upon date and price. The repurchase price generally equals the price paid by the Fund plus interest negotiated on the basis of current short-term rates.
Securities pledged by the dealers as collateral for repurchase agreements are held by a custodian bank until maturity of the repurchase agreement. The Fund has procedures to monitor additional collateral, if needed, to ensure that the daily market value of the collateral remains in excess of the market value of the repurchase agreement in the event of a default.
Master Repurchase Agreements (“MRA”) permit the Fund, under certain circumstances, including an event of default (such as bankruptcy or insolvency), to offset payables and/or receivables under the MRA with collateral held and/or posted to the counterparty and create one single net payment due to or from the Fund. However, bankruptcy or insolvency laws of a particular jurisdiction may impose restrictions on or prohibitions against such a right of offset in the event of a MRA counterparty’s bankruptcy or insolvency. Pursuant to the terms of the MRA, the Fund receives securities as collateral with a market value in excess of the repurchase price to be received by the Fund upon the maturity of the repurchase transaction. Upon a bankruptcy or insolvency of the MRA counterparty, the Fund recognizes a liability with respect to such excess collateral to reflect the Fund’s obligation under bankruptcy law to return the excess to the counterparty. Details of the counterparties and collateral for repurchase agreements are shown on the Schedule of Portfolio Investments.
Credit Enhancement:
Certain obligations held by the Fund have credit enhancement or liquidity features that may, under certain circumstances, provide for repayment of principal and interest on the obligation upon demand date, interest rate reset date or final maturity. These enhancements may include: letters of credit; liquidity guarantees; security purchase agreements; tender option purchase agreements and third party insurance.
Investment Transactions and Income:
Investment transactions are accounted for on the date the security is bought or sold (“trade date”). Dividend income is recorded on the ex-dividend date. Realized gains and losses from investment transactions are calculated based on the cost of the specific security (also known as identified cost basis). Interest income is recognized on the accrual basis and includes, where applicable, the amortization or accretion of premium or discount.
Expense, Investment Income and Gain/Loss Allocation:
The Fund pays the expenses that are directly related to its operations, such as custodian fees or advisory fees. Expenses incurred by the Trust, such as trustee or legal fees, are allocated among each of the Funds in the Trust either proportionately based upon the Fund’s relative net assets or using another
| 29 |
NOTES TO FINANCIAL STATEMENTS
|
reasonable basis such as equally across all Funds in the Trust, depending on the nature of the expense. Individual share classes within the Fund are charged expenses specific to that class, such as distribution fees and transfer agent fees. Within the Fund, expenses other than class specific expenses are allocated daily to each class based upon the proportion of relative net assets. Investment income and realized and unrealized gains or losses are allocated to each class of shares based on relative net assets.
Distributions to Shareholders:
The Fund pays out any income that it receives, less expenses, in the form of dividends and capital gain distributions to its shareholders. Income dividends are declared daily and paid monthly. Dividends will also be paid at any time during the month upon total redemption of shares in an account. Capital gains, if any, are declared and paid at least annually. Distributions to shareholders are recorded on the ex-dividend date. The amount of dividends and distributions are calculated based on federal income tax regulations, which may differ from US GAAP. These “book/tax” differences may be either temporary or permanent in nature. To the extent these differences are determined, as of the end of the tax year, to be permanent (e.g. paydowns), they are reclassified within the Fund’s capital accounts based on their federal tax basis treatment.
When-Issued Transactions:
The Fund may engage in when-issued transactions. The Fund records when-issued securities on the trade date and maintains sufficient liquidity so that cash will be available to make payment for the securities purchased. Securities purchased on a when-issued basis are valued daily beginning on trade date and begin earning interest on the settlement date. As of September 30, 2021, the Fund held no when-issued securities.
3. Agreements and Other Transactions with Affiliates:
The Trust has entered into an investment advisory agreement with RBC GAM-US under which RBC GAM-US manages the Fund’s assets and furnishes related office facilities, equipment, research and personnel. The agreement requires the Fund to pay RBC GAM-US a monthly fee based upon average daily net assets. Under the terms of the agreement, RBC GAM-US is entitled to receive fees based on a percentage of the average daily net assets of the Fund as follows:
| Annual Rate | ||||
U.S. Government Money Market Fund | 0.10% | |||
RBC Institutional Class 1 of the Fund pays the Advisor an annual shareholder services administration fee of 0.05% of the average daily net assets attributable to RBC Institutional Class 1 shares that is used to compensate financial intermediaries for providing services to shareholders and maintaining shareholder accounts. This shareholder services administration fee is not paid pursuant to Rule 12b-1.
RBC GAM-US has contractually agreed to waive fees and/or reimburse expenses under an expense limitation agreement in order to maintain the net annual Fund operating expenses (excluding certain fees such as interest, taxes and acquired fund fees and expenses) at 0.20% for RBC Institutional Class 1 until January 31, 2023. During the year ended September 30, 2021, there were no fees waived under this agreement.
RBC GAM-US serves as co-administrator to the Fund. BNY Mellon serves as co-administrator and fund accounting agent. Services provided under the administrative services agreement include providing day-to-day administration of matters related to the Fund, maintenance of the records and the preparation of reports. Under the terms of the administrative services agreement, RBC GAM-US does not receive an administration services fee. BNY Mellon receives a fee for its services payable by the Fund based in part on the Fund’s average net assets. BNY Mellon’s fee is included with “Accounting fees” in the Statement of Operations.
Certain Officers and Trustees of the Trust are affiliated with the Advisor. Such Officers and Trustees receive no compensation from the Fund for serving in their respective roles.
The Trust currently pays each of the independent Trustees (Trustees of the Trust who are not directors, officers or employees of the Advisor, either Co-Administrator or Distributor) an annual retainer of
30 |
NOTES TO FINANCIAL STATEMENTS
|
$68,000. The Board Chairperson and Audit Committee Chairperson each receive an additional retainer of $2,500 annually, and all other Trustees serving as Chair of a Board committee each receive an additional retainer of $1,000 annually. In addition, independent Trustees receive a quarterly meeting fee of $6,500 for each in-person Board meeting attended, a meeting fee of $1,500 for each telephonic or special board meeting attended, a $1,500 fee for each Board committee meeting attended, and are reimbursed for all out-of-pocket expenses relating to attendance at such meetings. These amounts are included in the Statement of Operations in “Trustees’ fees”.
The Advisor has invested in and, as of September 30, 2021 owns 156,411,377 shares of the Fund, representing 0.8% of total Fund net assets.
4. Fund Distribution:
The Fund has adopted a Shareholder Account and Distribution Services (12b-1) Plan (the “Plan”) with respect to RBC Institutional Class 2 and RBC Investor Class, in which Quasar Distributors LLC (the “Distributor”) acts as the Fund’s distributor. The Plan permits the Fund to make payments for or to reimburse the Distributor or others, including RBC Capital Markets, LLC, monthly for distribution-related costs and expenses of marketing shares of each share class covered under the Plan, and/or for providing shareholder services. The following chart shows the current Plan fee rate for each class:
| RBC Institutional Class 2 | RBC Investor Class | |||||||
12b-1 Plan Fee | 0.15% | 1.00% | ||||||
Plan fees are based on average daily net assets of the applicable class. Up to 0.25% of each Plan fee may be designated as a service fee, as defined by the applicable rules of the Financial Industry Regulatory Authority.
Pursuant to a shareholder account and distribution services agreement between the Distributor and RBC Capital Markets, LLC, the Distributor has agreed to compensate RBC Capital Markets, LLC for certain shareholder account servicing support provided to the Fund. RBC Capital Markets, LLC has agreed to waive fees and/or reimburse expenses in order to maintain the net annual Fund operating expenses for each class listed below to the following amounts:
Share Class | Operating Expense Limit | |||
RBC Institutional Class 2 | 0.30 | % | ||
RBC Investor Class | 1.00 | % | ||
This expense limitation agreement is in place until January 31, 2023. The Fund will carry forward, for a period not to exceed 12 months from the date on which a waiver or reimbursement is made by RBC Capital Markets, LLC, any expenses in excess of the expense limitation and repay RBC Capital Markets, LLC such amounts, provided the Fund is able to effect such repayment and remain in compliance with the expense limitation. At September 30, 2021, the amount subject to possible recoupment under the expense limitation agreement is $4,405,443.
RBC Capital Markets, LLC and/or the Advisor may voluntarily waive and/or reimburse additional Fund operating expenses at any time, such as to maintain a minimum yield in the fund. Any such voluntary program may be modified or discontinued at any time without notice.
For the year ended September 30, 2021, the following distribution fees were waived either contractually or voluntarily:
Share Class | Distribution Fees Waived | |||
RBC Institutional Class 2 | $ | 5,206,761 | ||
RBC Investor Class | 36,591,631 | |||
| 31 |
NOTES TO FINANCIAL STATEMENTS
|
During the year ended September 30, 2021, shareholder servicing fees were voluntarily waived for RBC Institutional Class 1 in the amount of $3,236,277. In addition, the Advisor voluntarily waived fees or reimbursed expenses of $7,117,273 during the year.
5. Capital Share Transactions
The number of shares sold, reinvested and redeemed correspond to the net proceeds from sale of shares, reinvestments of dividends and cost of shares redeemed, respectively, since shares are issued, reinvested and redeemed at $1.00 per share.
Transactions for the period were as follows:
| U.S. Government Money Market Fund | ||||||||
| For the | For the | |||||||
| Year Ended | Year Ended | |||||||
| September 30, 2021 | September 30, 2020 | |||||||
CAPITAL TRANSACTIONS: | ||||||||
RBC Institutional Class 1 | ||||||||
Proceeds from shares issued | $ | 64,450,842,138 | $ | 81,200,748,861 | ||||
Distributions reinvested | 1,066,708 | 21,417,621 | ||||||
Cost of shares redeemed | (64,071,316,268 | ) | (72,317,690,087 | ) | ||||
|
|
|
| |||||
Change in RBC Institutional Class 1 | $ | 380,592,578 | $ | 8,904,476,395 | ||||
|
|
|
| |||||
RBC Institutional Class 2 | ||||||||
Proceeds from shares issued | $ | 6,011,486,368 | $ | 8,389,163,470 | ||||
Distributions reinvested | 766,586 | 19,927,797 | ||||||
Cost of shares redeemed | (5,434,544,434 | ) | (7,562,011,232 | ) | ||||
|
|
|
| |||||
Change in RBC Institutional Class 2 | $ | 577,708,520 | $ | 847,080,035 | ||||
|
|
|
| |||||
RBC Investor Class | ||||||||
Proceeds from shares issued | $ | 8,289,184,776 | $ | 3,711,167,621 | ||||
Distributions reinvested | 788,082 | 3,820,517 | ||||||
Cost of shares redeemed | (5,466,227,241 | ) | (2,360,017,483 | ) | ||||
|
|
|
| |||||
Change in RBC Investor Class | $ | 2,823,745,617 | $ | 1,354,970,655 | ||||
|
|
|
| |||||
Change in net assets resulting from capital transactions | $ | 3,782,046,715 | $ | 11,106,527,085 | ||||
|
|
|
| |||||
6. Federal Income Taxes:
It is the policy of the Fund to continue to qualify as a regulated investment company by complying with the provisions available to certain investment companies, as defined under Subchapter M of the Internal Revenue Code, and to distribute substantially all of its net investment income and net realized capital gains. Therefore, no federal tax liability is recorded in the financial statements of the Fund.
For all open tax years and all major taxing jurisdictions, management of the Funds has concluded that there are no significant uncertain tax positions that would require recognition in the financial statements. Open tax years are those that are open for examination by taxing authorities (i.e., generally the last three tax year ends and the interim tax period since then). Furthermore, management of the
32 |
NOTES TO FINANCIAL STATEMENTS
|
Funds is also not aware of any tax positions for which it is reasonably possible that the total amounts of unrecognized tax benefits will significantly change in the next twelve months.
The tax character of distributions during the year ended September 30, 2021 were as follows:
| Distributions Paid From | ||||||||||||||||
| Total | ||||||||||||||||
| Ordinary | Net Long Term | Total Taxable | Distributions | |||||||||||||
| Income | Capital Gains | Distributions | Paid | |||||||||||||
U.S. Government Money Market Fund | $3,452,863 | $1 | $3,452,864 | $3,452,864 | ||||||||||||
The tax character of distributions during the year ended September 30, 2020 were as follows:
|
| |||||||||||||||
| Distributions Paid From | ||||||||||||||||
| Ordinary Income | Total Taxable Distributions | Total Distributions Paid | ||||||||||||||
U.S. Government Money Market Fund | $70,688,663 | $70,688,663 | $70,688,663 | |||||||||||||
Total distributions paid may differ from the Statements of Changes in Net Assets because distributions are recognized when actually paid for tax purposes.
As of September 30, 2021, the components of accumulated earnings/(losses) on a tax basis were as follows:
| Undistributed Ordinary Income | Distributions Payable | Unrealized Appreciation | Other Temporary Differences | Total Accumulated Earnings | ||||||||||
| $443,074 | $(399,080) | $— | $— | $43,994 | ||||||||||
As of September 30, 2021, the Fund does not have any capital loss carryforward.
Under current tax law, Post-October Capital Losses and Late-Year Ordinary Losses may be deferred and treated as occurring on the first business day of the following fiscal year for tax purposes. The Fund did not have any Post-October Capital Losses or Late-Year Ordinary Losses for the year ending September 30, 2021.
7. Line of Credit
The Fund, along with other Funds within the Trust, participates in an uncommitted, secured $500,000,000 line of credit with U.S. Bank, N.A. (the “Bank”), the Funds’ custodian, to be used to fund shareholder redemption requests and for other short-term temporary or emergency general business purposes. The line of credit has a scheduled termination date of July 30, 2022. Interest is charged on borrowings under this line of credit at the Bank’s prime lending rate per annum. Since multiple funds within the Trust participate in this line of credit, there is no assurance that an individual fund will have access to all or any part of the $500,000,000 at any particular time. There were no loans outstanding pursuant to this line of credit at September 30, 2021 and there were no borrowings made by the Fund during the year.
8. Significant Risks
Shareholder concentration risk:
As of September 30, 2021, affiliated broker-dealer omnibus accounts owned 53.1% of the Fund’s outstanding shares. Significant transactions by these shareholders may impact the Fund’s performance.
| 33 |
NOTES TO FINANCIAL STATEMENTS
|
Market risk:
One or more markets in which a Fund invests may go down in value, sometimes sharply and unpredictably, and the value of a Fund’s portfolio securities may fall or fail to rise. Market risk may affect a single issuer, sector of the economy, industry or the market as a whole. In addition, global economies and financial markets are becoming increasingly interconnected, and political, economic and other conditions and events (including, but not limited to, natural disasters, pandemics, epidemics, and social unrest) in one country, region, or financial market may adversely impact issuers in a different country, region or financial market. Furthermore, the occurrence of, among other events, natural or man-made disasters, severe weather or geological events, fires, floods, earthquakes, outbreaks of disease (such as COVID-19, avian influenza or H1N1/09), epidemics, pandemics, malicious acts, cyber-attacks, terrorist acts or the occurrence of climate change, may also adversely impact the performance of a Fund. Such events could adversely impact issuers, markets and economies over the short- and long-term, including in ways that cannot necessarily be foreseen. A Fund could be negatively impacted if the value of a portfolio holding were harmed by such political or economic conditions or events. Moreover, such negative political and economic conditions and events could disrupt the processes necessary for a Fund’s operations.
In a negative interest rate environment, debt instruments may trade at negative yields, which means the purchaser of the instrument may receive at maturity less than the total amount invested. In addition, in a negative interest rate environment, if a bank charges negative interest rates, instead of receiving interest on deposits, a depositor must pay the bank fees to keep money with the bank. To the extent a Fund holds a debt instrument or has a bank deposit with a negative interest rate, the Fund would generate a negative return on that investment.
In light of current market conditions, interest rates and bond yields in the United States and many other countries are at or near historic lows, and in some cases, such rates and yields are negative. During periods of very low or negative interest rates, the Fund’s susceptibility to interest rate risk (i.e., the risks associated with changes in interest rates) may be magnified, its yield and income may be diminished and its performance may be adversely affected (e.g., during periods of very low or negative interest rates, the Fund may be unable to maintain positive returns). These levels of interest rates (or negative interest rates) may magnify the risks associated with rising interest rates. Changing interest rates, including rates that fall below zero, may have unpredictable effects on markets, including market volatility and reduced liquidity, and may adversely affect a Fund’s yield, income and performance.
9. Subsequent Events:
Fund Management has evaluated the impact of all subsequent events on the Fund and has determined that there were no subsequent events requiring recognition or disclosure in the financial statements.
34 |
REPORT OF INDEPENDENT REGISTERED PUBLIC ACCOUNTING FIRM
|
To the Board of Trustees of RBC Funds Trust and Shareholders of U.S. Government Money Market Fund
Opinion on the Financial Statements
We have audited the accompanying statement of assets and liabilities, including the schedule of portfolio investments, of U.S. Government Money Market Fund (one of the funds constituting RBC Funds Trust, hereafter referred to as the “Fund”) as of September 30, 2021, the related statement of operations for the year ended September 30, 2021, the statements of changes in net assets for each of the two years in the period ended September 30, 2021, including the related notes, and the financial highlights for each of the five years in the period ended September 30, 2021 (collectively referred to as the “financial statements”). In our opinion, the financial statements present fairly, in all material respects, the financial position of the Fund as of September 30, 2021, the results of its operations for the year then ended, the changes in its net assets for each of the two years in the period ended September 30, 2021 and the financial highlights for each of the five years in the period ended September 30, 2021 in conformity with accounting principles generally accepted in the United States of America.
Basis for Opinion
These financial statements are the responsibility of the Fund’s management. Our responsibility is to express an opinion on the Fund’s financial statements based on our audits. We are a public accounting firm registered with the Public Company Accounting Oversight Board (United States) (PCAOB) and are required to be independent with respect to the Fund in accordance with the U.S. federal securities laws and the applicable rules and regulations of the Securities and Exchange Commission and the PCAOB.
We conducted our audits of these financial statements in accordance with the standards of the PCAOB. Those standards require that we plan and perform the audit to obtain reasonable assurance about whether the financial statements are free of material misstatement, whether due to error or fraud.
Our audits included performing procedures to assess the risks of material misstatement of the financial statements, whether due to error or fraud, and performing procedures that respond to those risks. Such procedures included examining, on a test basis, evidence regarding the amounts and disclosures in the financial statements. Our audits also included evaluating the accounting principles used and significant estimates made by management, as well as evaluating the overall presentation of the financial statements. Our procedures included confirmation of securities owned as of September 30, 2021 by correspondence with the custodian and brokers; when replies were not received from brokers, we performed other auditing procedures. We believe that our audits provide a reasonable basis for our opinion.
/s/PricewaterhouseCoopers LLP
Minneapolis, Minnesota
November 23, 2021
We have served as the auditor of one or more investment companies in the RBC Funds since 2016.
| 35 |
OTHER FEDERAL INCOME TAX INFORMATION (UNAUDITED)
|
The Fund reports a portion of the income dividends distributed during the fiscal year ended September 30, 2021, as U.S. Government Income as 46.35%.
U. S. Government Income represents the amount of interest that was derived from direct U. S. Government obligations. Generally, such interest is exempt from state income tax. For residents of California, New York and Connecticut the statutory threshold requirements were satisfied. Due to the diversity in state and local tax law, it is recommended you consult a tax adviser as to the applicability of the information provided for your specific situation.
The Fund reports a portion of the income dividends distributed during the fiscal year ended September 30, 2021, as Qualified Interest Income as defined in the Internal Revenue Code as 100%.
For the year ended September 30, 2021, the Fund has a qualified short term gains percentage of 0.06%.
All reportings are based on financial information available as of the date of this annual report and, accordingly, are subject to change. For each item above, it is the intention of the Fund to report the maximum amount permitted under the Internal Revenue Code and the regulations thereunder.
36 |
|
Independent Trustees(1)(2)
Lucy Hancock Bode (70)
Position, Term of Office and Length of Time Served with the Trust: Trustee since January 2004
Principal Occupation(s) During Past 5 Years: Healthcare consultant (self-employed) (1986 to present)
Number of Portfolios in Fund Complex Overseen by Trustee: 18
Other Director/Trustee Positions Held by Trustee During Past 5 Years: Franklin Street Partners (2014 to present); BioSignia (2006 to 2010).
Leslie H. Garner Jr. (71)
Position, Term of Office and Length of Time Served with the Trust: Trustee since January 2004
Principal Occupation(s) During Past 5 Years: President and Chief Executive Officer, The Greater Cedar Rapids Community Foundation (2010 to present); President, Cornell College (1994 to 2010)
Number of Portfolios in Fund Complex Overseen by Trustee: 18
Other Director/Trustee Positions Held by Trustee During Past 5 Years: None
Phillip G. Goff. (58)
Position, Term of Office and Length of Time Served with the Trust: Trustee since January 2020
Principal Occupation(s) During Past 5 Years: Senior Vice President/Corporate Controller and Funds Treasurer, TIAA (October 2006-August 2017)
Number of Portfolios in Fund Complex Overseen by Trustee: 18
Other Director/Trustee Positions Held by Trustee During Past 5 Years: None
Ronald James (70)
Position, Term of Office and Length of Time Served with the Trust: Trustee since January 2004
Principal Occupation(s) During Past 5 Years: Faculty member (part time), University of St. Thomas (2004 to present), President and Chief Executive Officer, Center for Ethical Business Cultures (2000 to January 2017)
Number of Portfolios in Fund Complex Overseen by Trustee: 18
Other Director/Trustee Positions Held by Trustee During Past 5 Years: Bremer Financial Corporation (2004 to present); Greater Twin Cities United Way (2012 to 2020); Best Buy Co. Inc. (2004 to 2013)
John A. MacDonald (72)
Position, Term of Office and Length of Time Served with the Trust: Trustee since January 2004
Principal Occupation(s) During Past 5 Years: Vice President and Treasurer, Hall Family Foundation (1988 to 2020); Chief Investment Officer, Chinquapin Trust Company (1999 to 2020)
Number of Portfolios in Fund Complex Overseen by Trustee: 18
Other Director/Trustee Positions Held by Trustee During Past 5 Years: None
| 37 |
MANAGEMENT (UNAUDITED)
|
Independent Trustees(1)(2)
James R. Seward, CFA (69)
Position, Term of Office and Length of Time Served with the Trust: Chairman of the Board and Trustee since January 2004
Principal Occupation(s) During Past 5 Years: Private investor (2000 to present)
Number of Portfolios in Fund Complex Overseen by Trustee: 18
Other Director/Trustee Positions Held by Trustee During Past 5 Years: Sooner Holdings (formerly Syntroleum Corporation) (1988 to 2015); Brookdale Senior Living Inc. (2008 to 2019)
Interested Trustees(1)(2)(3)
Kathleen A. Gorman (57)(5)
Position, Term of Office and Length of Time Served with the Trust: Trustee since September 2012
Principal Occupation(s) During Past 5 Years: President and Chief Executive Officer, RBC Funds (2012 to present); Assistant Secretary (March 2018 to present); Chief Compliance Officer, RBC Funds (2006 to 2012)
Number of Portfolios in Fund Complex Overseen by Trustee: 18
Other Director/Trustee Positions Held by Trustee During Past 5 Years: None
38 |
MANAGEMENT (UNAUDITED)
|
Executive Officers(1)(3)(4)
Kathleen A. Gorman (57)
Position, Term of Office and Length of Time Served with the Trust: President and Chief Executive Officer since September 2012 and Assistant Secretary, (March 2018 to present)
Principal Occupation(s) During Past 5 Years: President and Chief Executive Officer, RBC Funds (2012 to present); Assistant Secretary, RBC Funds (March 2018 to present); Chief Compliance Officer, RBC Funds (2006 to 2012)
Kathleen A. Hegna (54)
Position, Term of Office and Length of Time Served with the Trust: Chief Financial Officer and Principal Accounting Officer since May 2009 and Treasurer since March 2014
Principal Occupation(s) During Past 5 Years: Associate Vice President and Director, Mutual Fund Services, RBC Global Asset Management (U.S.) Inc. (2009 to present)
Christina M. Weber (53)
Position, Term of Office and Length of Time Served with the Trust: Chief Compliance Officer since December 2012 and Secretary since September 2017
Principal Occupation(s) During Past 5 Years: Chief Compliance Officer, RBC Global Asset Management (U.S.) Inc. (June 2018 to present); Chief Compliance Officer, RBC Funds (2012 to present); Assistant Secretary, RBC Funds (2013 to 2017); Senior Compliance Officer, RBC Funds (March 2012 to December 2012)
| (1) | Except as otherwise noted, the address of each Trustee/Officer is RBC Funds Trust, 50 South Sixth Street, Suite 2350, Minneapolis, Minnesota 55402. |
| (2) | All Trustees must retire on or before December 31 of the year in which they reach age 75. The Board may temporarily waive this requirement when necessary to avoid depriving the Board of a Trustee with critical skills. |
| (3) | On December 31, 2009, Voyageur Asset Management Inc. changed its name to RBC Global Asset Management (U.S.) Inc. Any references to RBC Global Asset Management (U.S.) Inc. for prior periods are deemed to be references to the prior entity. |
| (4) | Each officer serves in such capacity for an indefinite period of time until his or her removal, resignation or retirement. |
| (5) | Kathleen A. Gorman has been determined to be an interested Trustee by virtue of her position with the Advisor. |
The Fund’s Statement of Additional Information includes information about the Funds’ Trustees. To receive your free copy of the Statement of Additional Information, call toll free: 1-800-422-2766.
| 39 |
SUPPLEMENTAL INFORMATION (UNAUDITED)
|
Shareholder Expense Examples
As a shareholder of the RBC Funds, you incur two types of costs: (1) transaction costs and (2) ongoing costs, including management fees; and other Fund expenses. This example is intended to help you understand your ongoing costs (in dollars) of investing in the RBC Funds and to compare these costs with the ongoing costs of investing in other mutual funds.
The example is based on an investment of $1,000 invested at the beginning of the period and held for the entire period from April 1, 2021 through September 30, 2021.
Actual Expenses
The table below provides information about actual account values and actual expenses. You may use the information below, together with the amount you invested, to estimate the expenses that you paid over the period. Simply divide your account value by $1,000 (for example, an $8,600 account value divided by $1,000 = 8.6), then multiply the result by the number in the table under the heading entitled “Expenses Paid During Period” to estimate the expenses you paid on your account during this period.
| Beginning Account Value 4/1/21 | Ending Account Value 9/30/21 | Expenses Paid During Period* 4/1/21–9/30/21 | Annualized Expense Ratio During Period 4/1/21–9/30/21 | |||||||||||||
U.S. Government Money Market Fund | ||||||||||||||||
RBC Institutional Class 1 | $1,000.00 | $1,000.10 | $0.25 | 0.05 | % | |||||||||||
RBC Institutional Class 2 | 1,000.00 | 1,000.10 | 0.25 | 0.05 | % | |||||||||||
RBC Investor Class | 1,000.00 | 1,000.10 | 0.25 | 0.05 | % | |||||||||||
*Expenses are equal to the average account value times the Fund’s annualized expense ratio multiplied by 183/365 (to reflect one half year period).
40 |
SUPPLEMENTAL INFORMATION (UNAUDITED)
|
Hypothetical Example for Comparison Purposes
The table below provides information about hypothetical account values and hypothetical expenses based on the Fund’s actual expense ratio and an assumed rate of return of 5% per year before expenses, which is not the Fund’s actual return. The hypothetical account values and expenses may not be used to estimate the actual ending account balance or expenses you paid for the period. You may use this information to compare this 5% hypothetical example with the 5% hypothetical examples that appear in the shareholder reports of other funds.
Please note that the expenses shown in the table are meant to highlight your ongoing costs only and do not reflect any transactional costs, such as sales charges (loads), redemption fees, or exchange fees. Therefore, the table is useful in comparing ongoing costs only, and will not help you determine the relative total costs of owning different funds. In addition, if these transactional costs were included, your costs would have been higher.
| Beginning Account Value 4/1/21 | Ending Account Value 9/30/21 | Expenses Paid During Period* 4/1/21-9/30/21 | Annualized Expense Ratio During Period 4/1/21-9/30/21 | |||||||||||||
U.S. Government Money Market Fund | ||||||||||||||||
RBC Institutional Class 1 | $1,000.00 | $1,024.82 | $0.25 | 0.05 | % | |||||||||||
RBC Institutional Class 2 | 1,000.00 | 1,024.82 | 0.25 | 0.05 | % | |||||||||||
RBC Investor Class | 1,000.00 | 1,024.82 | 0.25 | 0.05 | % | |||||||||||
*Expenses are equal to the average account value times the Fund’s annualized expense ratio multiplied by 183/365 (to reflect one half year period).
| 41 |
APPROVAL OF INVESTMENT ADVISORY AGREEMENT (UNAUDITED)
|
Information Regarding the Approval of Investment Advisory Agreement
In September 2021, after evaluating the services provided by RBC Global Asset Management (U.S.) Inc. (the “Advisor”) and reviewing the performance, fees, and expenses of the Fund, the RBC Funds Board of Trustees determined to approve the continuation of the investment advisory agreement (“Agreement”) with the Advisor for the Fund. Additionally, in July 2021, the RBC Funds Board of Trustees determined to approve a new investment advisory agreement (“New Agreement” and collectively with the Agreement, “Agreements”) with the Advisor for the Funds to take effect on or about November 1, 2021. The implementation of this new Agreement, which was approved by shareholders of the Fund on October 22, 2021, was intended to reflect certain structural changes anticipated as a result of the pending merger of the Advisor with one of its affiliates, BlueBay Asset Management USA LLC.
As part of their review of the Agreements, the Trustees requested and considered information regarding the advisory services performed by the Advisor, the staffing and qualifications of the personnel responsible for operating and managing the Fund, and the Fund’s performance and expenses. The Trustees considered information provided at regular quarterly Board and Committee meetings throughout the year as well as information presented at each of a special meeting held to review the proposed New Agreement, a special meeting held to review requested material related to the proposed renewals and a regular meeting at which the proposed renewals were considered. The information included material provided by the Advisor, as well as reports prepared by Broadridge Financial Solutions, Inc., an independent statistical compilation company providing comparative fee and expense information and comparative performance information for the Fund. In connection with their deliberations, the independent Trustees were advised by independent legal counsel with regard to the materials and their responsibilities under the relevant laws and regulations.
The Trustees met with representatives from the Advisor’s senior management team, as well as senior investment professionals, to discuss the information and the Advisor’s ongoing management of the Fund. The Trustees reviewed the nature, quality, and extent of the services provided to the Fund by the Advisor, including information as to the Fund’s performance.
The Trustees were provided with comparative Morningstar data for U.S. government money market funds. The Trustees were informed that the Fund had outperformed the median return of both its Morningstar category and its peers for recent periods and over the longer term and noted that the Fund’s performance was in the top 20% of its Morningstar category for the prior year. The Trustees were satisfied with the quality and capabilities of the money market fund portfolio management and analyst team and with the overall investment performance of the Fund.
The Trustees reviewed the investment advisory fees payable to the Advisor and reviewed comparative fee and expense information for similarly situated funds. The Trustees were informed that the Fund’s net expense ratio was within the top quartile of its peer group and the top half of its Morningstar category. The Trustees evaluated profitability data for the Advisor and considered information regarding other benefits the Advisor and its affiliates derived from their relationships with the Fund.
Based upon their review, the Trustees determined that the advisory fees proposed to be payable to the Advisor were reasonable and fair in light of the nature and quality of services provided under all the circumstances and were within the range of what might have been negotiated at arms’ length. The Trustees concluded that it is in the interests of the Fund and its shareholders for the Trustees to approve the Agreements as well as the continuation of the expense limitation agreement for the Fund for an additional year. In arriving at their collective decision to approve the Agreements, the Trustees did not assign relative weights to the factors discussed above or deem any one or group of them to be controlling in and of itself.
42 |
|
This Page Intentionally Left Blank
| 43 |
|
This Page Intentionally Left Blank
44 |
|
This Page Intentionally Left Blank
| 45 |
|
This Page Intentionally Left Blank
46 |
|
This Page Intentionally Left Blank
| 47 |
|
This Page Intentionally Left Blank
48 |
RBC Funds
P.O. Box 701
Milwaukee, WI 53201-0701
800-422-2766
www.rbcgam.com
Performance data represents past performance and does not guarantee future results. The principal value of an investment and investment return will fluctuate so that an investor’s shares, when redeemed, may be worth more or less than their original cost.
This report and the financial statements contained herein are provided for the information of RBC Funds shareholders. This report is not authorized for distribution to prospective investors unless preceded or accompanied by a current prospectus, which contains information concerning investment objectives, risks, charges and expenses of the funds. Please read the prospectus carefully before investing.
This report and the financial statements contained herein are not intended to be a forecast of future events, a guarantee of future results, or investment advice. There is no assurance that certain securities will remain in or out of each fund’s portfolio. The views expressed in this report reflect those of the portfolio managers through the year ended September 30, 2021.
NOT FDIC INSURED • NO BANK GUARANTEE • MAY LOSE VALUE
RBC Global Asset Management (U.S.) Inc. serves as investment advisor for the RBC Funds. RBC Funds are distributed by Quasar Distributors LLC.
The RBC Funds are pleased to offer shareholder reports printed entirely on Forest
Stewardship Council® certified paper. FSC® certification ensures that the paper
used in this report contains fiber from well-managed and responsibly harvested
forests that meet strict environmental and socioeconomic standards.
RBCF-MM AR 09-21
| (b) | Not applicable. |
Item 2. Code of Ethics.
| (a) | The registrant, as of the end of the period covered by this report, has adopted a code of ethics that applies to the registrant’s principal executive officer, principal financial officer, principal accounting officer or controller, or persons performing similar functions, regardless of whether these individuals are employed by the registrant or a third party. |
| (c) | There have been no amendments, during the period covered by this report, to a provision of the code of ethics that applies to the registrant’s principal executive officer, principal financial officer, principal accounting officer or controller, or persons performing similar functions, regardless of whether these individuals are employed by the registrant or a third party, and that relates to any element of the code of ethics description. |
| (d) | The registrant has not granted any waivers, including an implicit waiver, from a provision of the code of ethics that applies to the registrant’s principal executive officer, principal financial officer, principal accounting officer or controller, or persons performing similar functions, regardless of whether these individuals are employed by the registrant or a third party, that relates to one or more of the items set forth in paragraph (b) of this item’s instructions. |
Item 3. Audit Committee Financial Expert.
As of the end of the period covered by the report, the registrant’s board of directors has determined that Phillip G. Goff and James R. Seward are qualified to serve as an audit committee financial expert serving on its audit committee and that they are “independent,” as defined by Item 3 of Form N-CSR.
Item 4. Principal Accountant Fees and Services.
| ● | Registrant may incorporate the following information by reference, if this information has been disclosed in the registrant’s definitive proxy statement or definitive information statement. The proxy statement or information statement must be filed no later than 120 days after the end of the fiscal year covered by the Annual Report. |
Audit Fees
| (a) | The aggregate fees billed for each of the last two fiscal years for professional services rendered by the principal accountant for the audit of the registrant’s annual financial statements or services that are normally provided by the accountant in connection with statutory and regulatory filings or engagements for those fiscal years are $409,200 for 2021 and $449,600 for 2020. |
Audit-Related Fees
| (b) | The aggregate fees billed in each of the last two fiscal years for assurance and related services by the principal accountant that are reasonably related to the performance of the audit of the registrant’s financial statements and are not reported under paragraph (a) of this Item are $0 for 2021 and $0 for 2020. |
Tax Fees
| (c) | The aggregate fees billed in each of the last two fiscal years for professional services rendered by the principal accountant for tax compliance, tax advice, and tax planning are $46,860 for 2021 and $45,760 for 2020. |
Tax fees for both years relate to the review of the registrant’s tax returns. Amount requiring approval of the registrant’s audit committee is $0 and $0, respectively.
All Other Fees
| (d) | The aggregate fees billed in each of the last two fiscal years for products and services provided by the principal accountant, other than the services reported in paragraphs (a) through (c) of this Item are $0 for 2021 and $0 for 2020. |
| (e)(1) | Disclose the audit committee’s pre-approval policies and procedures described in paragraph (c)(7) of Rule 2-01 of Regulation S-X. |
The Audit Committee (“Committee”) will review and approve in advance any proposal (except as set forth in subsections (a) through (c) below) that the Trust employ the Funds’ auditor to render “permissible non-audit services” to the Funds. A “permissible non-audit service” is defined as a non-audit service that is not prohibited by Rule 2-01(c)(4) of Regulation S-X or other applicable law or regulation. Non-audit services that are prohibited by Rule 2-01(c)(4) include: (1) bookkeeping or other services related to accounting records or financial statements of the audit client; (2) financial information systems design and implementation; (3) appraisal or valuation services, fairness opinions, or contribution-in-kind reports; (4) actuarial services; (5) internal audit outsourcing services; (6) management functions; (7) human resources; (8) broker-dealer, investment adviser, or investment banking services; (9) legal services; and (10) expert services unrelated to the audit.
The Committee will also review and approve in advance any proposal (except as set forth in (a) through (c) below) that the Adviser, and any entity controlling, controlled by, or under common control with the Adviser that provides ongoing services to the Funds (an “Adviser-affiliated service provider”), employ the Funds’ auditor to render non-audit services, if such engagement would relate directly to the operations and financial reporting of the Funds. As a part of its review, the Committee shall consider whether the provision of such services is consistent with the auditor’s independence. (See also “Delegation” below.)
Pre-approval by the Committee of non-audit services is not required so long as:
(a) With respect to the Funds, the aggregate amount of all such permissible non-audit services provided to the Funds constitutes no more than 5% of the total amount of revenues paid to the auditor by the Funds during the fiscal year in which the services are provided; or
With respect to the Adviser and any Adviser-affiliated service provider, the aggregate amount of all such non-audit services provided constitutes no more than 5% of the total amount of revenues (of the type that would have to be pre-approved by the Committee) paid to the auditor by the Funds, the Adviser and any Adviser-affiliated service provider during the fiscal year in which the services are provided;
(b) Such services were not recognized by the Funds at the time of the engagement to be non-audit services; and
(c) Such services are promptly brought to the attention of the Committee and approved by the Committee or its delegate or delegates, as defined below, prior to the completion of the audit.
Delegation
The Committee may delegate to one or more of its members the authority to pre-approve the auditor’s provision of audit services or permissible non-audit services to the Funds, up to a predetermined amount. Any pre-approval determination made by a delegate will be presented to the full Committee at its next meeting. The Committee will communicate any pre-approval made by a delegate to the Trust’s fund accounting agent, which will ensure that the appropriate disclosure is made in the Funds’ periodic reports and other documents as required under the Federal securities laws.
| (e)(2) | The percentage of services described in each of paragraphs (b) through (d) of this Item that were approved by the audit committee pursuant to paragraph (c)(7)(i)(C) of Rule 2-01 of Regulation S-X are as follows: |
(b) N/A
(c) 100%
(d) N/A
| (f) | The percentage of hours expended on the principal accountant’s engagement to audit the registrant’s financial statements for the most recent fiscal year that were attributed to work performed by persons other than the principal accountant’s full-time, permanent employees was less than fifty percent. |
| (g) | The aggregate non-audit fees billed by the registrant’s accountant for services rendered to the registrant, and rendered to the registrant’s investment adviser (not including any sub-adviser whose role is primarily portfolio management and is subcontracted with or overseen by another investment adviser), and any entity controlling, controlled by, or under common control with the adviser that provides ongoing services to the registrant for each of the last two fiscal years of the registrant was $340,346 for 2021 and $296,763 for 2020. |
| (h) | The registrant’s audit committee of the board of directors has considered whether the provision of non-audit services that were rendered to the registrant’s investment adviser (not including any sub-adviser whose role is primarily portfolio management and is subcontracted with or overseen by another investment adviser), and any entity controlling, controlled by, or under common control with the investment adviser that provides ongoing services to the registrant that were not pre-approved pursuant to paragraph (c)(7)(ii) of Rule 2-01 of Regulation S-X is compatible with maintaining the principal accountant’s independence. |
Item 5. Audit Committee of Listed Registrants.
Not applicable.
Item 6. Investments.
| (a) | Schedule of Investments in securities of unaffiliated issuers as of the close of the reporting period is included as part of the report to shareholders filed under Item 1 of this form. |
| (b) | Not applicable. |
| Item 7. | Disclosure of Proxy Voting Policies and Procedures for Closed-End Management Investment Companies. |
Not applicable.
Item 8. Portfolio Managers of Closed-End Management Investment Companies.
Not applicable.
| Item 9. | Purchases of Equity Securities by Closed-End Management Investment Company and Affiliated Purchasers. |
Not applicable.
Item 10. Submission of Matters to a Vote of Security Holders.
There have been no material changes to the procedures by which the shareholders may recommend nominees to the registrant’s board of directors, where those changes were implemented after the registrant last provided disclosure in response to the requirements of Item 407(c)(2)(iv) of Regulation S-K (17 CFR 229.407) (as required by Item 22(b)(15) of Schedule 14A (17 CFR 240.14a-101)), or this Item.
Item 11. Controls and Procedures.
The registrant’s principal executive and principal financial officers, or persons performing similar functions, have concluded that the registrant’s disclosure controls and procedures (as defined in Rule 30a-3(c) under the Investment Company Act of 1940, as amended (the “1940 Act”) (17 CFR 270.30a-3(c))) are effective, as of a date within 90 days of the filing date of the report that includes the disclosure required by this paragraph, based on their evaluation of these controls and procedures required by Rule 30a-3(b) under the 1940 Act (17 CFR 270.30a-3(b)) and Rules 13a-15(b) or 15d-15(b) under the Securities Exchange Act of 1934, as amended (17 CFR 240.13a-15(b) or 240.15d-15(b)).
| (a) | There were no changes in the registrant’s internal control over financial reporting (as defined in Rule 30a-3(d) under the 1940 Act (17 CFR 270.30a-3(d))) that occurred during the period covered by this report that has materially affected, or is reasonably likely to materially affect, the registrant’s internal control over financial reporting. |
| Item 12. | Disclosure of Securities Lending Activities for Closed-End Management Investment Companies. |
Not applicable.
Item 13. Exhibits.
SIGNATURES
Pursuant to the requirements of the Securities Exchange Act of 1934 and the Investment Company Act of 1940, the registrant has duly caused this report to be signed on its behalf by the undersigned, thereunto duly authorized.
| (Registrant) RBC Funds Trust | ||
| By (Signature and Title)* /s/ Kathleen A. Gorman | ||
Kathleen A. Gorman, President and Chief Executive Officer (principal executive officer) | ||
| Date 12/1/2021 | ||
Pursuant to the requirements of the Securities Exchange Act of 1934 and the Investment Company Act of 1940, this report has been signed below by the following persons on behalf of the registrant and in the capacities and on the dates indicated.
| By (Signature and Title)* /s/ Kathleen A. Gorman | ||
Kathleen A. Gorman, President and Chief Executive Officer (principal executive officer) | ||
| Date 12/1/2021 | ||
| By (Signature and Title)* /s/ Kathleen A. Hegna | ||
Kathleen A. Hegna, Treasurer and Chief Financial Officer (principal financial officer) | ||
| Date 12/1/2021 | ||
* Print the name and title of each signing officer under his or her signature.