
New York Mortgage Trust 2021 Third Quarter Financial Summary
2See Glossary and End Notes in the Appendix. This presentation contains forward-looking statements within the meaning of the safe harbor provisions of the Private Securities Litigation Reform Act of 1995. Forward- looking statements are based on our beliefs, assumptions and expectations of our future performance, taking into account all information currently available to us. These beliefs, assumptions and expectations are subject to risks and uncertainties and can change as a result of many possible events or factors, not all of which are known to us. If a change occurs, our business, financial condition, liquidity and results of operations may vary materially from those expressed or implied in our forward-looking statements. The following factors are examples of those that could cause actual results to vary from our forward-looking statements: changes in our business and investment strategy; changes in interest rates and the fair market value of our assets, including negative changes resulting in margin calls relating to the financing of our assets; changes in credit spreads; changes in the long-term credit ratings of the U.S., Fannie Mae, Freddie Mac, and Ginnie Mae; general volatility of the markets in which we invest; changes in prepayment rates on the loans we own or that underlie our investment securities; increased rates of default or delinquency and/or decreased recovery rates on our assets; our ability to identify and acquire our targeted assets, including assets in our investment pipeline; changes in our relationships with our financing counterparties and our ability to borrow to finance our assets and the terms thereof; our ability to predict and control costs; changes in laws, regulations or policies affecting our business, including actions that may be taken to contain or address the impact of the COVID-19 pandemic; our ability to make distributions to our stockholders in the future; our ability to maintain our qualification as a REIT for federal tax purposes; our ability to maintain our exemption from registration under the Investment Company Act of 1940, as amended; risks associated with investing in real estate assets, including changes in business conditions and the general economy, the availability of investment opportunities and the conditions in the market for Agency RMBS, non-Agency RMBS, ABS and CMBS securities, residential loans, structured multi-family investments and other mortgage-, residential housing- and credit-related assets, including changes resulting from the ongoing spread and economic effects of COVID-19; and the impact of COVID-19 on us, our operations and our personnel. These and other risks, uncertainties and factors, including the risk factors described in our most recent Annual Report on Form 10-K, as updated and supplemented from time to time, and our subsequent Quarterly Reports on Form 10-Q and other information that we file from time to time with the U.S. Securities and Exchange Commission (“SEC”) under the Securities Exchange Act of 1934, as amended (the “Exchange Act”), could cause our actual results to differ materially from those projected in any forward-looking statements we make. All forward-looking statements speak only as of the date on which they are made. New risks and uncertainties arise over time and it is not possible to predict those events or how they may affect us. Except as required by law, we are not obligated to, and do not intend to, update or revise any forward-looking statements, whether as a result of new information, future events or otherwise. This presentation may not contain all of the information that is important to you. As a result, the information in this presentation should be read together with the information included in our most recent Annual Report on Form 10-K, as updated and supplemented from time to time, and our subsequent Quarterly Reports on Form 10-Q and other information that we file under the Exchange Act. References to “the Company,” “NYMT,” “we,” “us,” or “our” refer to New York Mortgage Trust, Inc., together with its consolidated subsidiaries, unless we specifically state otherwise or the context indicates otherwise. See glossary of defined terms and detailed end notes for additional important disclosures included at the end of this presentation. Third quarter 2021 Financial Tables and related information can be viewed in the Company’s press release dated November 2, 2021 posted on the Company’s website at http://www.nymtrust.com under the “Investors — Events & Presentations” section. Forward Looking Statements

3 To Our Stockholders Management Update "The Company continued to deliver solid results in the third quarter, generating GAAP earnings per share of $0.10 and comprehensive earnings per share of $0.08. The numbers for the quarter were negatively impacted by nonrecurring, one-time charges, including $3.4 million in expenses related to the early redemption of our 7.875% Series C preferred stock, which was refinanced into a 6.875% Series F preferred stock, lowering our cost of capital by 100 basis points. Additionally, in August, we called a 2020 residential securitization trust that resulted in the acceleration of $1.6 million of deferred debt issuance costs. The loan pool was refinanced into a new securitization issued in August, lowering our cost of debt by approximately 210 basis points. We expect to continue to reduce the Company’s cost of funds with subsequent structured transactions. This trend will have a positive impact on earnings going forward." – Steven Mumma, Chairman and Chief Executive Officer "We continue to be diligent with our portfolio growth by focusing on investments where higher asset returns are available due to operational complexities. With these competitive barriers, we can deploy the Company’s substantial liquidity to build our portfolio with low utilization of leverage. In this approach, we believe this is an exceptional time for the Company to drive earnings while protecting book value." – Jason Serrano, President

Company Overview Financial Summary Market & Strategy Update Quarterly Comparative Financial Information Appendix Glossary End Notes Capital Allocation Reconciliation of Net Interest Income Reconciliation of Joint Venture Equity Investments Table of Contents

Company Overview
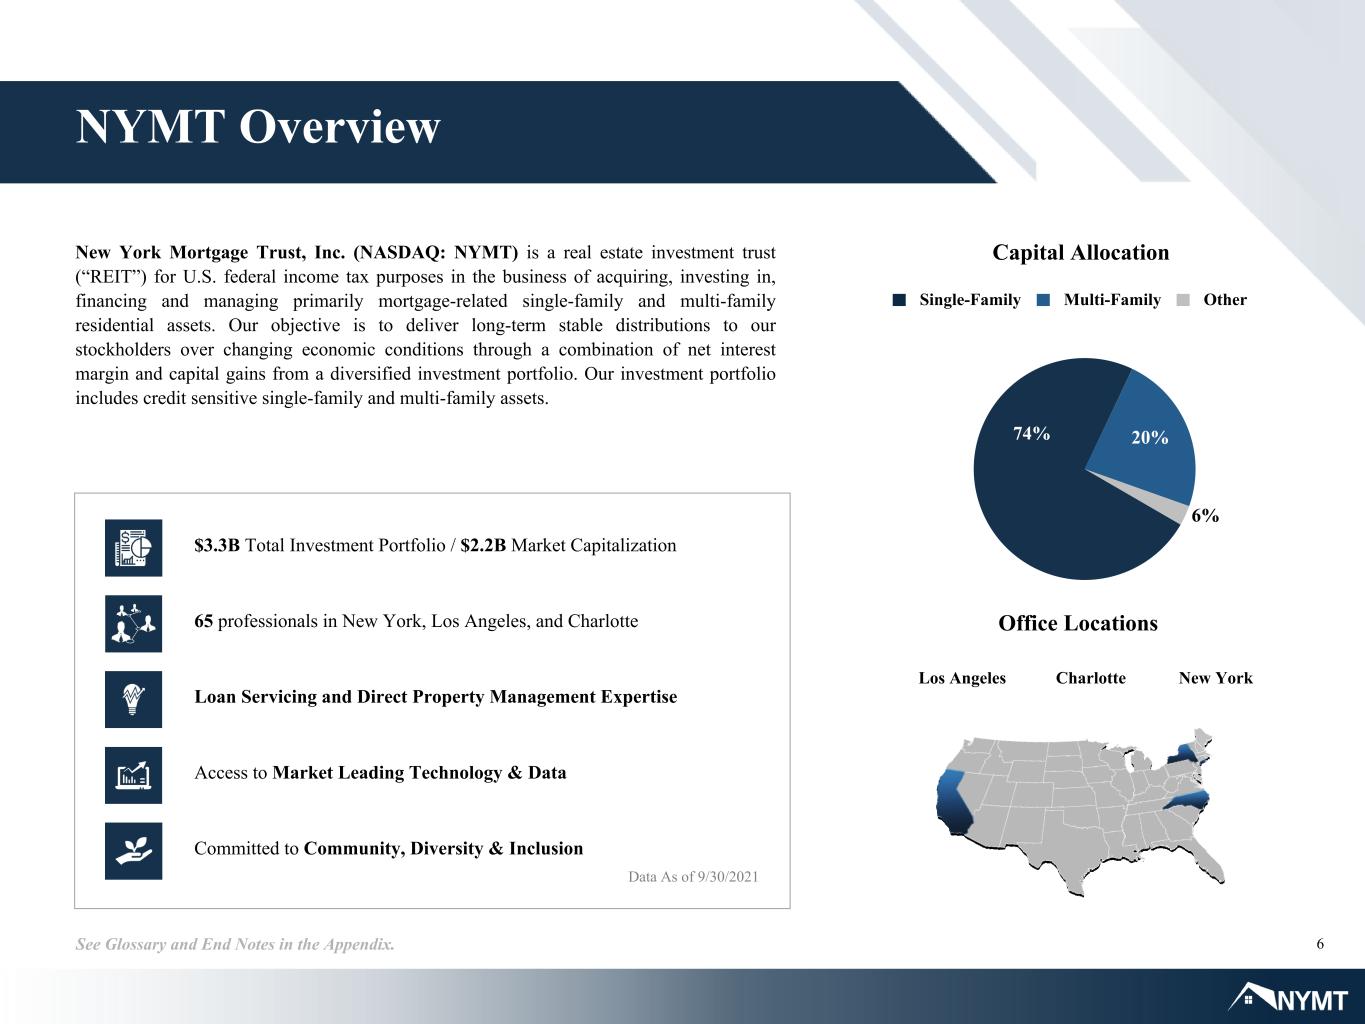
6See Glossary and End Notes in the Appendix. New York Mortgage Trust, Inc. (NASDAQ: NYMT) is a real estate investment trust (“REIT”) for U.S. federal income tax purposes in the business of acquiring, investing in, financing and managing primarily mortgage-related single-family and multi-family residential assets. Our objective is to deliver long-term stable distributions to our stockholders over changing economic conditions through a combination of net interest margin and capital gains from a diversified investment portfolio. Our investment portfolio includes credit sensitive single-family and multi-family assets. Data As of 9/30/2021 65 professionals in New York, Los Angeles, and Charlotte Access to Market Leading Technology & Data Committed to Community, Diversity & Inclusion Loan Servicing and Direct Property Management Expertise $3.3B Total Investment Portfolio / $2.2B Market Capitalization NYMT Overview Charlotte New YorkLos Angeles Office Locations Capital Allocation Single-Family Multi-Family Other 74% 20% 6%
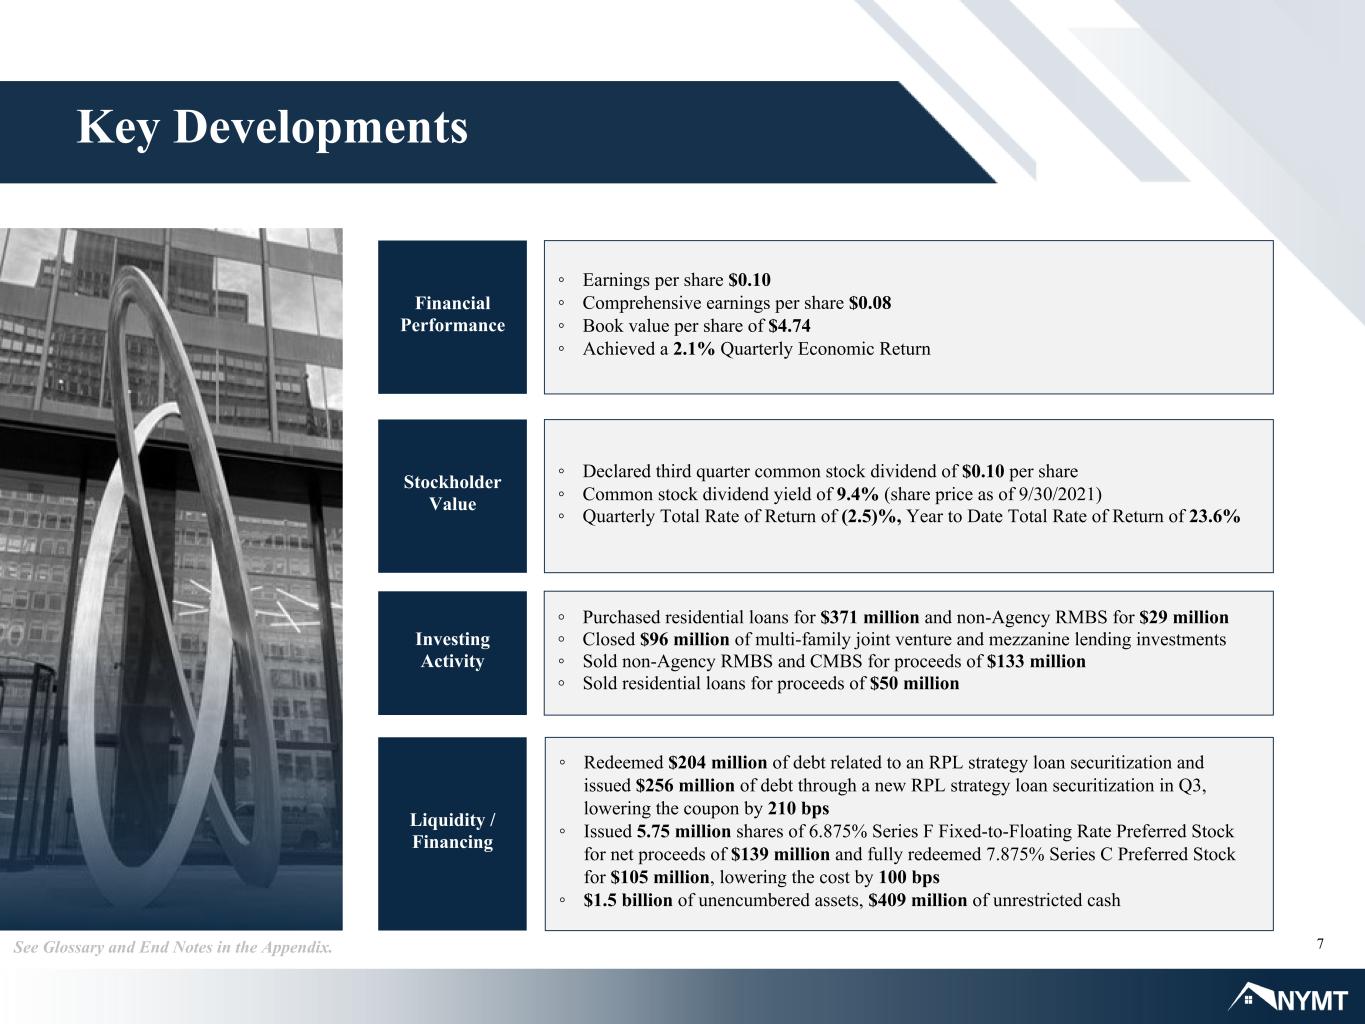
7 Key Developments See Glossary and End Notes in the Appendix. Financial Performance ◦ Earnings per share $0.10 ◦ Comprehensive earnings per share $0.08 ◦ Book value per share of $4.74 ◦ Achieved a 2.1% Quarterly Economic Return Stockholder Value ◦ Declared third quarter common stock dividend of $0.10 per share ◦ Common stock dividend yield of 9.4% (share price as of 9/30/2021) ◦ Quarterly Total Rate of Return of (2.5)%, Year to Date Total Rate of Return of 23.6% Liquidity / Financing ◦ Purchased residential loans for $371 million and non-Agency RMBS for $29 million ◦ Closed $96 million of multi-family joint venture and mezzanine lending investments ◦ Sold non-Agency RMBS and CMBS for proceeds of $133 million ◦ Sold residential loans for proceeds of $50 million ◦ Redeemed $204 million of debt related to an RPL strategy loan securitization and issued $256 million of debt through a new RPL strategy loan securitization in Q3, lowering the coupon by 210 bps ◦ Issued 5.75 million shares of 6.875% Series F Fixed-to-Floating Rate Preferred Stock for net proceeds of $139 million and fully redeemed 7.875% Series C Preferred Stock for $105 million, lowering the cost by 100 bps ◦ $1.5 billion of unencumbered assets, $409 million of unrestricted cash Investing Activity

Financial Summary Third Quarter 2021

9See Glossary and End Notes in the Appendix. Financial Snapshot Earnings & Book Value Net Interest MarginEarnings Per Share Price to Book Market Price $4.26 Investment Portfolio Yield on Avg. Interest Earning AssetsTotal Portfolio Size Total Investment Portfolio $3.3B Financing Dividend Per Share Economic Return on Book Value Avg. Portfolio Financing CostPortfolio Leverage Ratio $0.1B $0.5B $2.7B Investment Allocation SF Credit 59% MF Credit 25% 0.3x Book Value $4.74 Price/Book 0.90 3 Months Ended 2.1% Q3 Dividend $0.10 Comprehensive $0.08 Basic $0.10 SF 83% MF 15% Other 2% Total Leverage Ratio 1.5x 0.8x 0.5x 0.4x 0.3x SF MF Other 3Q 2020 4Q 2020 1Q 2021 2Q 2021 3Q 20213Q 2020 4Q 2020 1Q 2021 2Q 2021 3Q 2021 3Q 2020 4Q 2020 1Q 2021 2Q 2021 3Q 2021 3.33% 3.75% 3.61% 3.34% 3.14% 3Q 2020 4Q 2020 1Q 2021 2Q 2021 3Q 2021 0.3x 0.2x 0.2x 0.1x 0.1x0.3x 0.3x 0.3x 0.3x 0.4x 5.51% 6.05% 6.03% 6.31% 6.39% 3Q 2020 4Q 2020 1Q 2021 2Q 2021 3Q 2021 2.18% 2.30% 2.42% 2.97% 3.25%
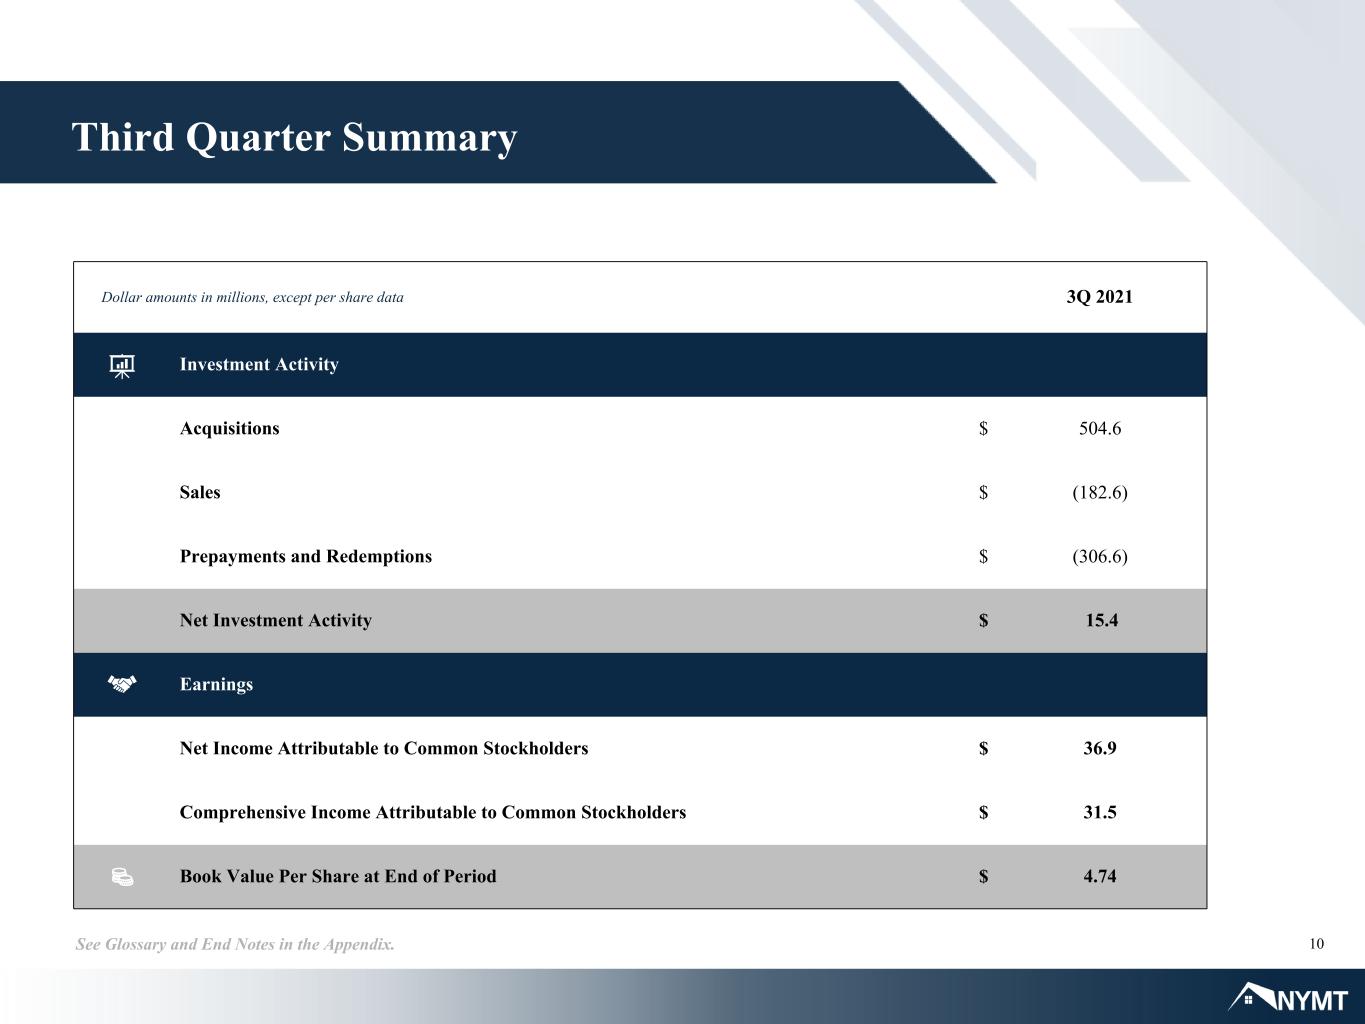
10See Glossary and End Notes in the Appendix. Third Quarter Summary Dollar amounts in millions, except per share data 3Q 2021 Investment Activity Acquisitions $ 504.6 Sales $ (182.6) Prepayments and Redemptions $ (306.6) Net Investment Activity $ 15.4 Earnings Net Income Attributable to Common Stockholders $ 36.9 Comprehensive Income Attributable to Common Stockholders $ 31.5 Book Value Per Share at End of Period $ 4.74
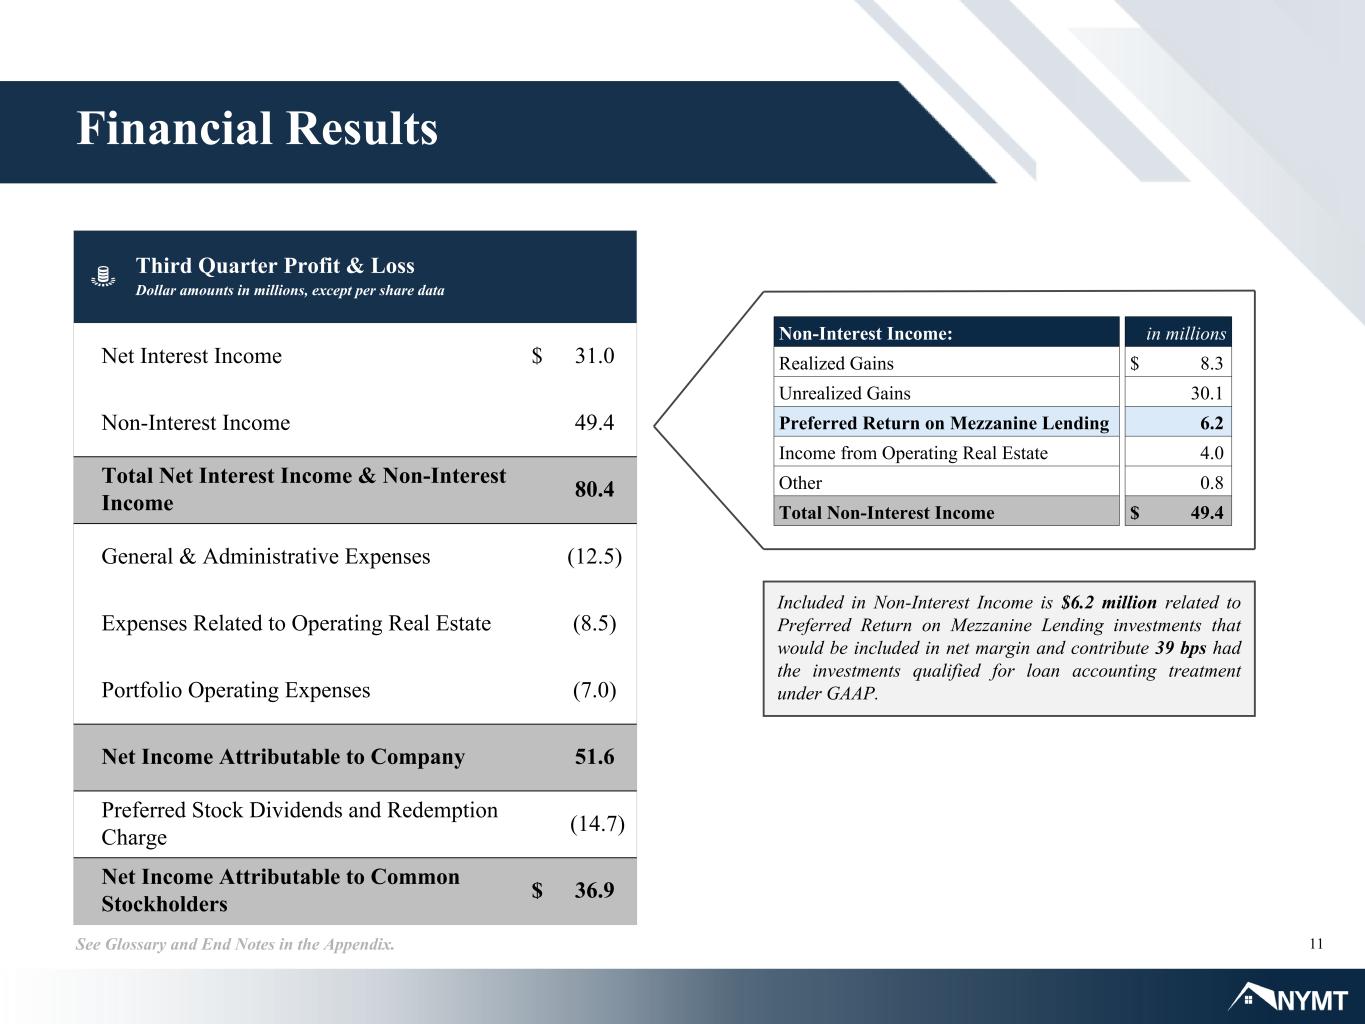
11See Glossary and End Notes in the Appendix. Financial Results Third Quarter Profit & Loss Dollar amounts in millions, except per share data Net Interest Income $ 31.0 Non-Interest Income 49.4 Total Net Interest Income & Non-Interest Income 80.4 General & Administrative Expenses (12.5) Expenses Related to Operating Real Estate (8.5) Portfolio Operating Expenses (7.0) Net Income Attributable to Company 51.6 Preferred Stock Dividends and Redemption Charge (14.7) Net Income Attributable to Common Stockholders $ 36.9 $4.58 Included in Non-Interest Income is $6.2 million related to Preferred Return on Mezzanine Lending investments that would be included in net margin and contribute 39 bps had the investments qualified for loan accounting treatment under GAAP. Non-Interest Income: in millions Realized Gains $ 8.3 Unrealized Gains 30.1 Preferred Return on Mezzanine Lending 6.2 Income from Operating Real Estate 4.0 Other 0.8 Total Non-Interest Income $ 49.4

Market & Strategy Update
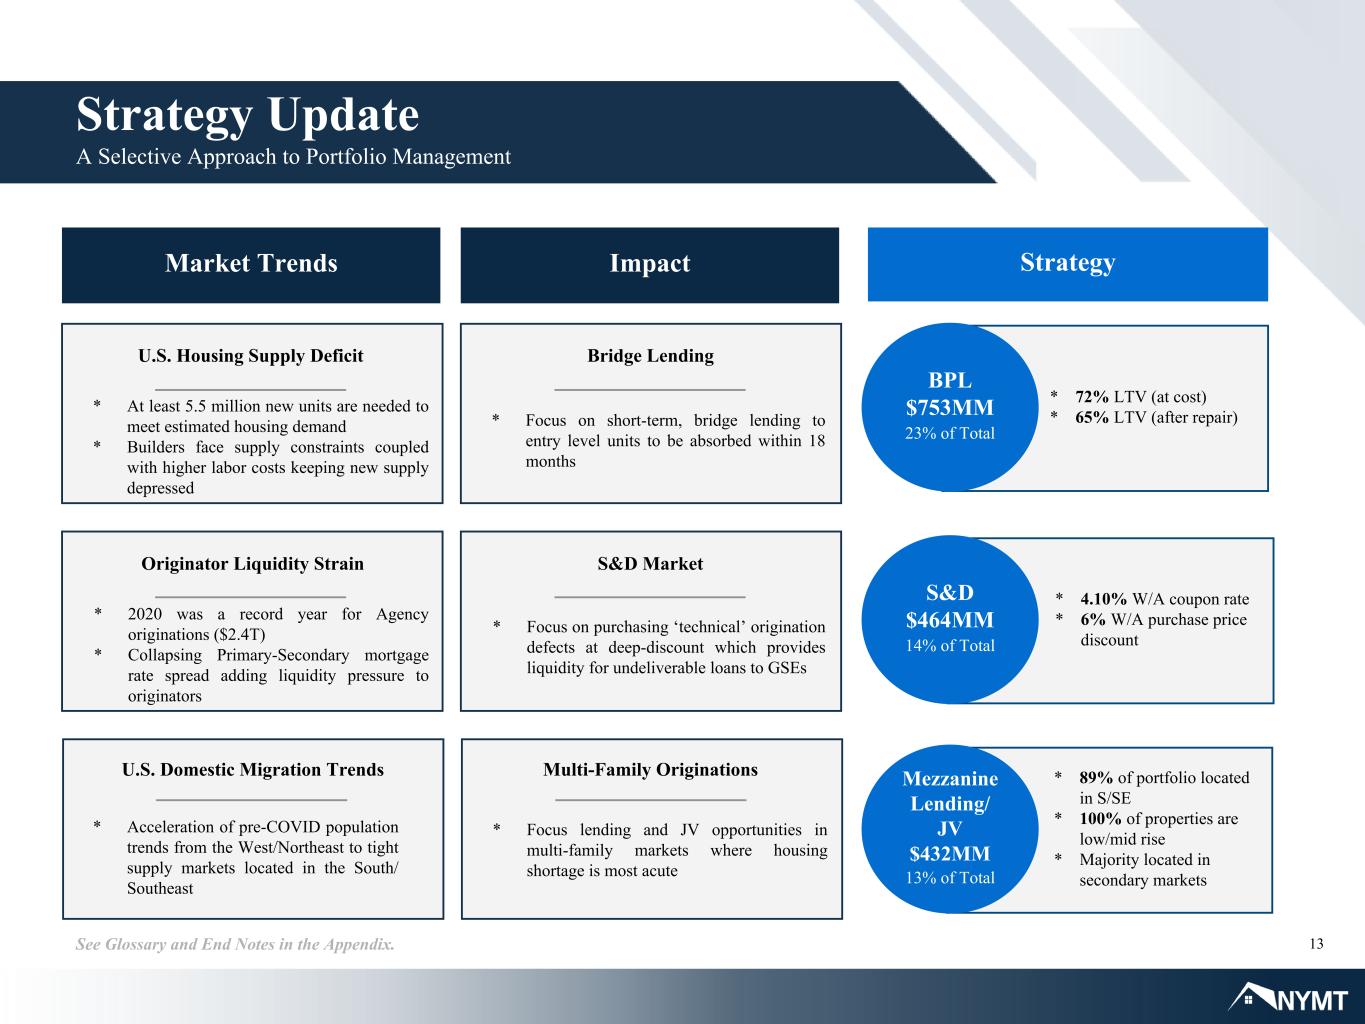
13See Glossary and End Notes in the Appendix. Strategy Update A Selective Approach to Portfolio Management Market Trends Impact Strategy U.S. Housing Supply Deficit * At least 5.5 million new units are needed to meet estimated housing demand * Builders face supply constraints coupled with higher labor costs keeping new supply depressed Originator Liquidity Strain * 2020 was a record year for Agency originations ($2.4T) * Collapsing Primary-Secondary mortgage rate spread adding liquidity pressure to originators U.S. Domestic Migration Trends * Acceleration of pre-COVID population trends from the West/Northeast to tight supply markets located in the South/ Southeast Bridge Lending * Focus on short-term, bridge lending to entry level units to be absorbed within 18 months S&D Market * Focus on purchasing ‘technical’ origination defects at deep-discount which provides liquidity for undeliverable loans to GSEs Multi-Family Originations * Focus lending and JV opportunities in multi-family markets where housing shortage is most acute * 72% LTV (at cost) * 65% LTV (after repair) BPL $753MM 23% of Total * 4.10% W/A coupon rate * 6% W/A purchase price discount S&D $464MM 14% of Total * 89% of portfolio located in S/SE * 100% of properties are low/mid rise * Majority located in secondary markets Mezzanine Lending/ JV $432MM 13% of Total

14See Glossary and End Notes in the Appendix. Strategy For Sustainable Earnings Growth NYMT Investment Strategy Focus NYMT seeks investment opportunities in markets where the Company finds a competitive advantage due to operational barriers to entry. Safety NYMT focuses on markets where compelling risk- adjusted asset returns are available through an unlevered holding strategy or through sustainable non-mark-to- market financing arrangements. Execution NYMT executes a low-levered credit strategy within the multi-family and single-family sectors by building portfolios through proprietary flow and bulk purchases where mid-teens returns are achievable on capital deployed. Portfolio Acquisitions (Dollar amounts in millions) Performing LoansBPL MF Loans/JV $60 $268 $292 $165 $273 $33 $52 $55 $93 $98 $19 $31 $96$139 $38 Q3 2020 Q4 2020 Q1 2021 Q2 2021 Q3 2021 Securities & Other $6 $11 $19 $13 $490 $364 $290 $505 $112

15See Glossary and End Notes in the Appendix. Strategy for Sustainable Financing NYMT Continues to Enhance Debt Structure Strategy Continue to primarily focus on investments away from CUSIP securities that do not rely on short-term callable mark-to-market leverage to generate attractive returns. Growth NYMT pursues a proprietary asset sourcing approach to lock-in investment pipelines with proven counterparties within the multi-family and single-family credit sectors. Alongside the unencumbered portfolio and unrestricted cash, NYMT can organically grow the balance sheet. Leverage Reduced MTM repo by 90% since 12/31/2019 by focusing on securitization financing. Quarterly Portfolio Financing Exposure (Dollar amounts in millions) MTM Repo Securitization FinancingNon-MTM Repo Unencumbered Cash 9/30/2020 12/31/2020 3/31/2021 6/30/2021 9/30/2021 Portfolio Leverage Ratio 0.2x 0.2x 0.1x0.1x0.3x $47 $50 $45 $921 $209 $650 $1,343 $1,390 $1,512$1,566 $409 $293 $291 $325 $714$569 $537 $688 $319$357 $330 $297 $626 $17 $358
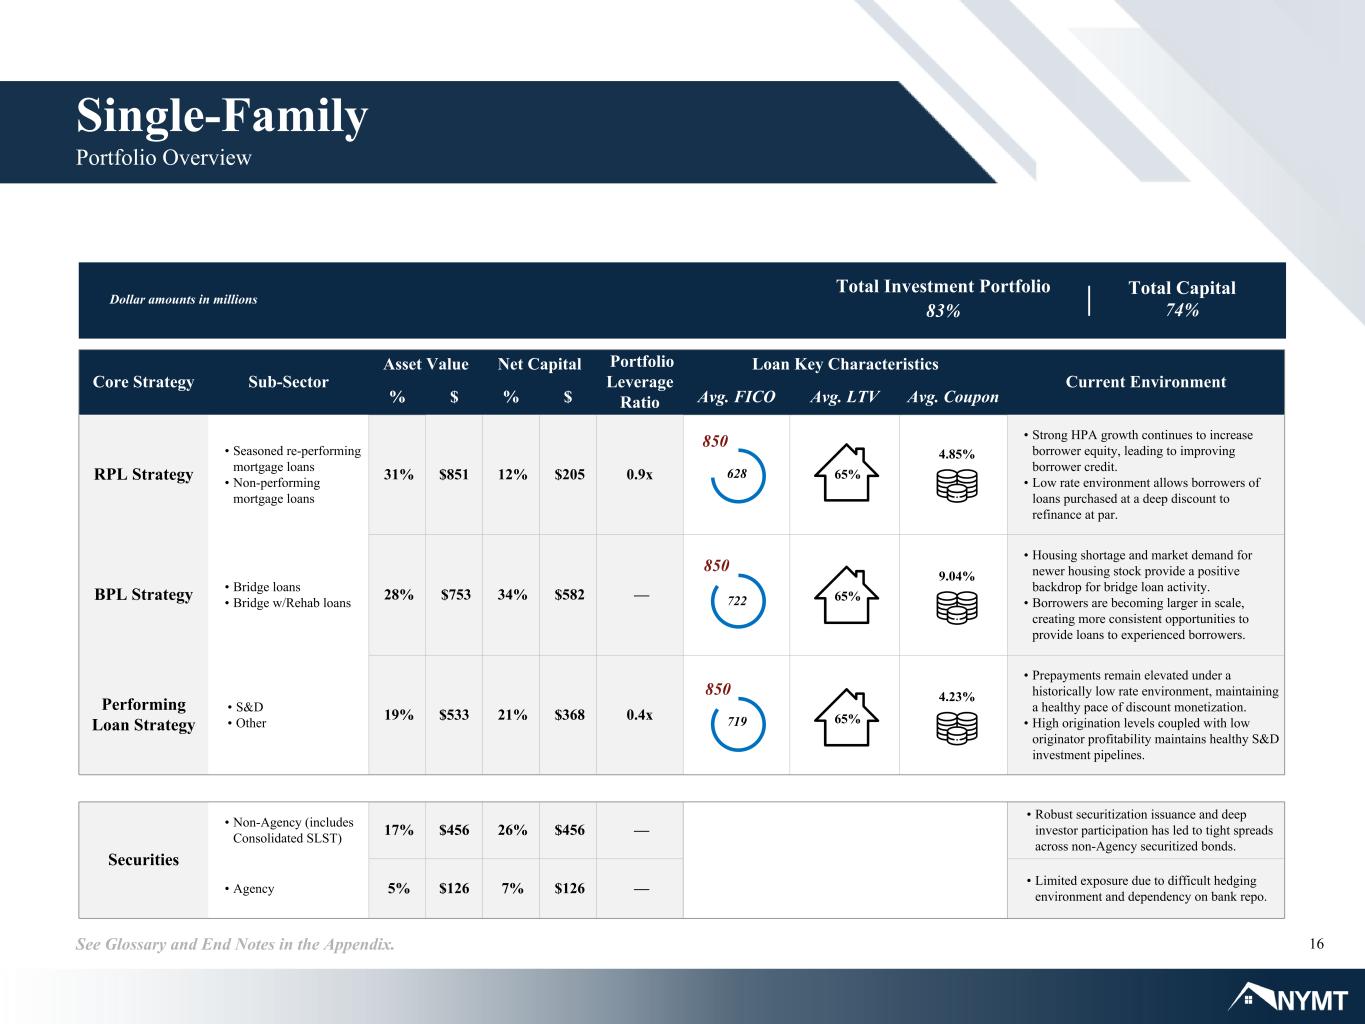
16See Glossary and End Notes in the Appendix. Single-Family Portfolio Overview Core Strategy Sub-Sector Asset Value Net Capital Portfolio Leverage Ratio Loan Key Characteristics Current Environment % $ % $ Avg. FICO Avg. LTV Avg. Coupon RPL Strategy • Seasoned re-performing mortgage loans • Non-performing mortgage loans 31% $851 12% $205 0.9x • Strong HPA growth continues to increase borrower equity, leading to improving borrower credit. • Low rate environment allows borrowers of loans purchased at a deep discount to refinance at par. BPL Strategy • Bridge loans • Bridge w/Rehab loans 28% $753 34% $582 — • Housing shortage and market demand for newer housing stock provide a positive backdrop for bridge loan activity. • Borrowers are becoming larger in scale, creating more consistent opportunities to provide loans to experienced borrowers. Performing Loan Strategy • S&D • Other 19% $533 21% $368 0.4x • Prepayments remain elevated under a historically low rate environment, maintaining a healthy pace of discount monetization. • High origination levels coupled with low originator profitability maintains healthy S&D investment pipelines. Securities • Non-Agency (includes Consolidated SLST) 17% $456 26% $456 — • Robust securitization issuance and deep investor participation has led to tight spreads across non-Agency securitized bonds. • Agency 5% $126 7% $126 — • Limited exposure due to difficult hedging environment and dependency on bank repo. Dollar amounts in millions Total Investment Portfolio 83% Total Capital 74% 1/5 Underlying Collateral Allocation Dollar amounts in millions 8 5 0 6 6 % 2 . 8 9 % 7 6 6 628 850 722 850 719 850 65% 65% 65% 4.23% 9.04% 4.85%
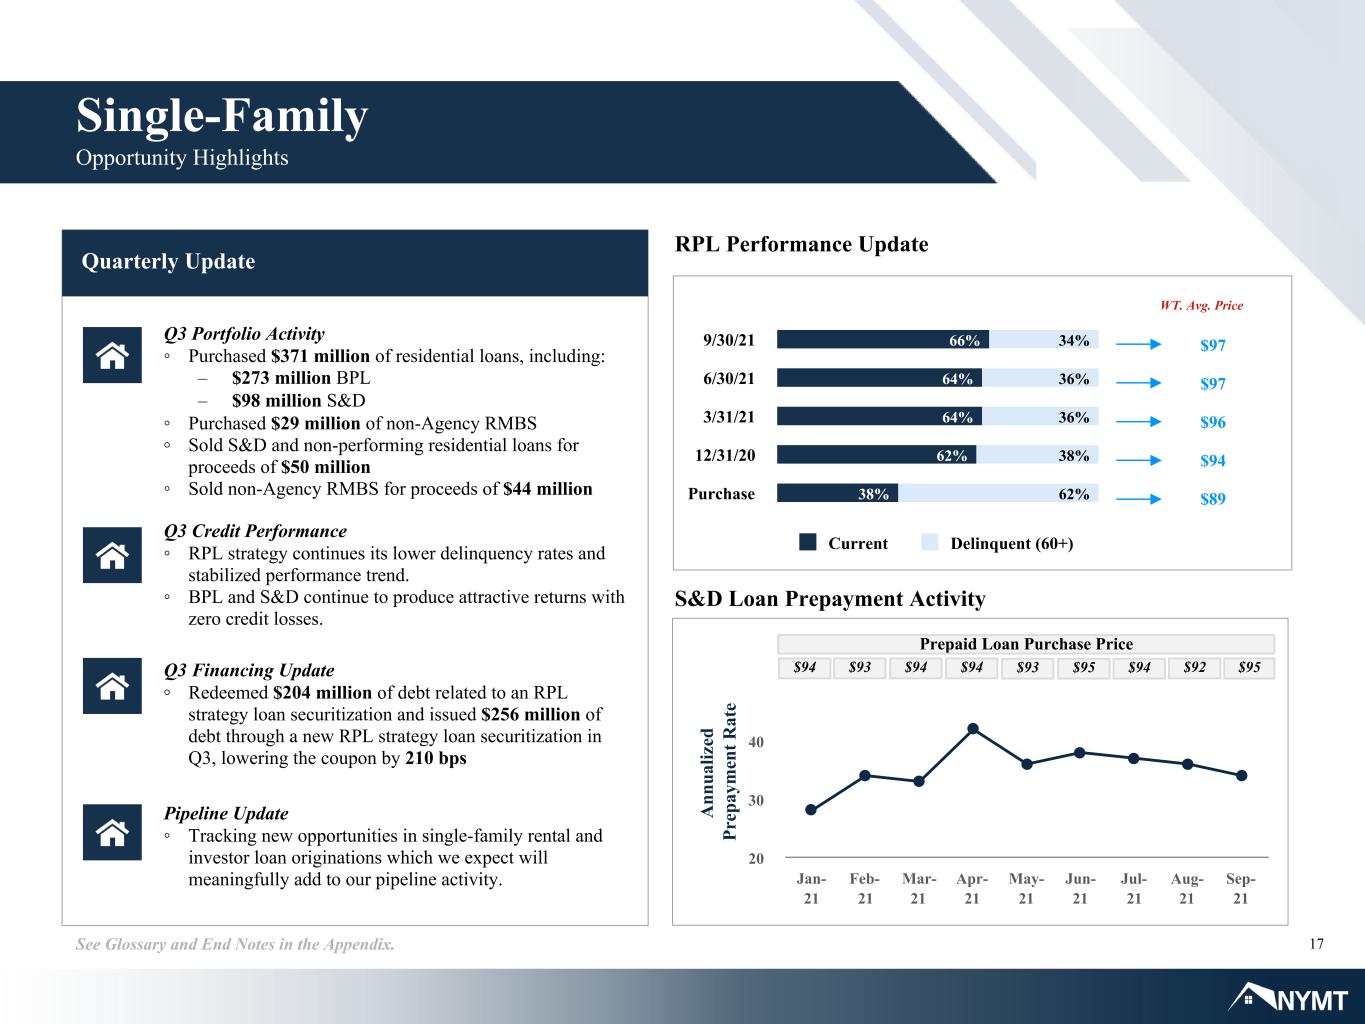
17See Glossary and End Notes in the Appendix. Single-Family Opportunity Highlights S&D Loan Prepayment Activity Quarterly Update Q3 Credit Performance ◦ RPL strategy continues its lower delinquency rates and stabilized performance trend. ◦ BPL and S&D continue to produce attractive returns with zero credit losses. Q3 Financing Update ◦ Redeemed $204 million of debt related to an RPL strategy loan securitization and issued $256 million of debt through a new RPL strategy loan securitization in Q3, lowering the coupon by 210 bps Q3 Portfolio Activity ◦ Purchased $371 million of residential loans, including: – $273 million BPL – $98 million S&D ◦ Purchased $29 million of non-Agency RMBS ◦ Sold S&D and non-performing residential loans for proceeds of $50 million ◦ Sold non-Agency RMBS for proceeds of $44 million $94 $89 $96 $97 $97 WT. Avg. Price 66% 64% 64% 62% 38% 34% 36% 36% 38% 62% Current Delinquent (60+) 9/30/21 6/30/21 3/31/21 12/31/20 Purchase Pipeline Update ◦ Tracking new opportunities in single-family rental and investor loan originations which we expect will meaningfully add to our pipeline activity. RPL Performance Update A nn ua liz ed Pr ep ay m en t R at e Jan- 21 Feb- 21 Mar- 21 Apr- 21 May- 21 Jun- 21 Jul- 21 Aug- 21 Sep- 21 20 30 40 Prepaid Loan Purchase Price $94 $93 $94 $94 $93 $95 $94 $92 $95

18See Glossary and End Notes in the Appendix. Single-Family Business Purpose Loan Strategy NYMT Expertise Expertise & Background ◦ Deep experience managing different whole loan strategies across the credit spectrum. ◦ Managed rehabilitation and sale of real estate-owned assets for over 10 years. ◦ Started slowly investing in business purpose loans in 2019 and significantly ramped up effort in the latter part of 2020. ◦ Added new production pipelines in 2021. NYMT Differentiation ◦ Source business purpose loans through flow and bulk trades with multiple originator, asset manager and broker-dealer relationships. ◦ We are eager to compete on process, not price, to gain market share in the BPL sector by leveraging technology to expedite loan funding timelines. ◦ We contribute to partner sourcing by uncovering new borrower relationships for our originator partners. Strategy & Initiatives ◦ Focus: – Markets with acute housing shortages – Borrowers with proven business plans – Low LTV – Low rehab requirements Loan Key Characteristics Avg. FICO Avg. Coupon Avg. LTARV Avg. LTC Loan Count: 1,780 UPB ($MM): $754 Borrower Experience DQ 60+ Maturity (months) 6.7 projects 3.0% 13.6 722 850 9.04% % o f B PL P or tf ol io Distribution of Project Rehab Costs 24% 21% 18% 11% 7% 4% 15% —% >0%-15% 16%-30% 31%-45% 46%-60% 61%-75% >75% 72%65% % of Initial Cost
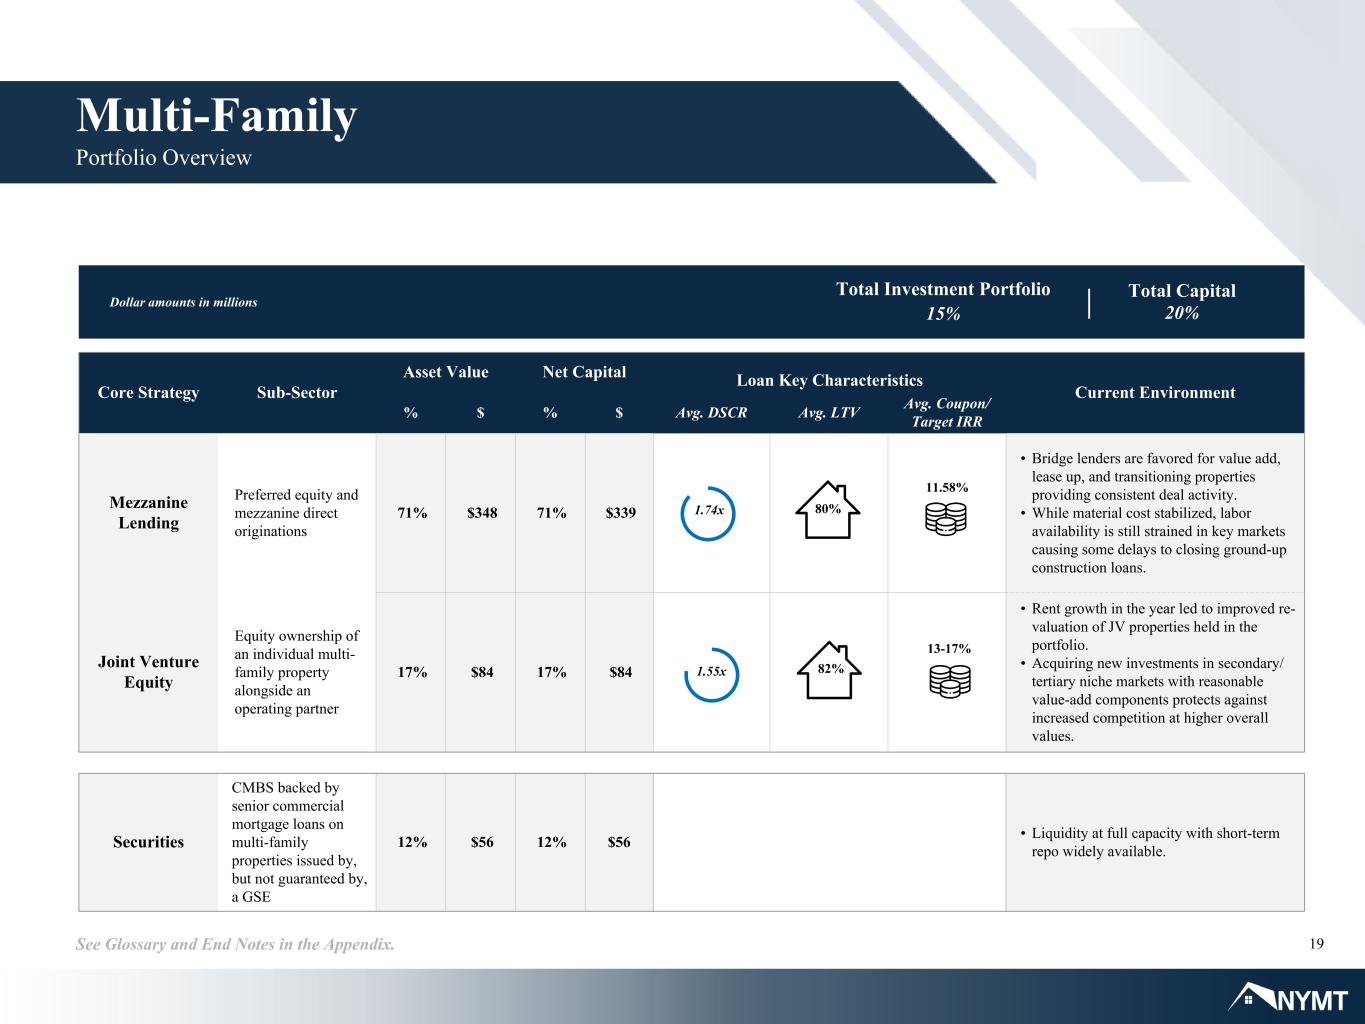
19See Glossary and End Notes in the Appendix. Multi-Family Portfolio Overview Core Strategy Sub-Sector Asset Value Net Capital Loan Key Characteristics Current Environment % $ % $ Avg. DSCR Avg. LTV Avg. Coupon/ Target IRR Mezzanine Lending Preferred equity and mezzanine direct originations 71% $348 71% $339 • Bridge lenders are favored for value add, lease up, and transitioning properties providing consistent deal activity. • While material cost stabilized, labor availability is still strained in key markets causing some delays to closing ground-up construction loans. Joint Venture Equity Equity ownership of an individual multi- family property alongside an operating partner 17% $84 17% $84 • Rent growth in the year led to improved re- valuation of JV properties held in the portfolio. • Acquiring new investments in secondary/ tertiary niche markets with reasonable value-add components protects against increased competition at higher overall values. Securities CMBS backed by senior commercial mortgage loans on multi-family properties issued by, but not guaranteed by, a GSE 12% $56 12% $56 • Liquidity at full capacity with short-term repo widely available. Dollar amounts in millions Total Investment Portfolio 15% Total Capital 20% 1.74x 1.55x 82% 80% 13-17% 11.58%

20See Glossary and End Notes in the Appendix. Quarterly Update Loan Performance Update ◦ Loans with outstanding UPB of $16 million paid off in the quarter at an average lifetime IRR of 12.6% (1.37x multiple) including any applicable minimum return multiple. ◦ As of 9/30/21, only one loan equaling 0.9% of the total portfolio was delinquent – $3 million delinquent loan expected to payoff at par after change of control and sale of property. NYMT Differentiation ◦ Equity investment expansion improved originations flow across our partner base. Long-term presence and stability in the multi-family space attributed to the acceptance and strength of the program. – Q4 origination pipeline is at the highest level since inception of the mezzanine lending program in 2011. Multi-Family Opportunity Highlights Count Balance 9/30/2021 12/31/2020 Performing 39 $ 342 99.1 % 96.0 % Delinquent 1 $ 3 0.9 % 1.0 % Forbearance 0 $ — — 3.0 % Total 40 $ 345 100.0 % 100.0 % Property Operating Update ◦ Portfolio located primarily in the South and Southeast of the U.S. ◦ Portfolio occupancy rate improved to an average of 94.7% in September 2021 from an average of 94.3% in June 2021. Loan Portfolio Characteristics as of 9/30/2021 (Dollar amounts in millions) State (Top 10) Count Balance % Total Coupon LTV DSCR TX 13 $ 114 33.1 % 11.4 % 81 % 1.61x FL 5 $ 60 17.4 % 11.7 % 71 % 2.05x AL 3 $ 38 11.1 % 12.2 % 72 % 2.29x OH 3 $ 28 8.2 % 11.6 % 88 % 1.80x TN 2 $ 20 5.9 % 11.1 % 90 % 2.11x NC 3 $ 19 5.5 % 12.0 % 74 % 1.45x SC 3 $ 17 4.8 % 11.5 % 85 % 1.97x KY 1 $ 13 3.7 % 11.3 % 88 % 0.77x GA 1 $ 9 2.5 % 11.0 % 85 % 1.35x Other 6 $ 27 7.8 % 11.7 % 82 % 1.65x Total 40 $ 345 100.0 % 11.6 % 80 % 1.74x

21 Current Focus New York Mortgage Trust 90 Park Avenue New York, New York 10016 Utilize a Strong Balance Sheet to Capture Superior Market Opportunities ◦ Invest across capital structures and sectors to locate compelling risk-adjusted returns ◦ Continue to grow pipeline of targeted assets with existing relationships under a flexible, low operating cost structure ◦ Continue to generate attractive returns with minimal Portfolio Leverage to protect book value The Company continues to focus on asset growth through proprietary channels and prudent liability management to increase our profitability.
Quarterly Comparative Financial Information

23See Glossary and End Notes in the Appendix. Portfolio Yields by Strategy Quarter over Quarter Comparison Portfolio Net Interest Margin (3Q’21 vs 2Q’21) Portfolio net interest margin for the third quarter was 3.25%, an increase from the prior quarter primarily due to 1) higher yield on average interest earning assets due to our continued investment in higher-yielding business purpose loans and 2) decreased borrowing cost due to our redemption of a 2020 RPL strategy loan securitization and completion of a new RPL strategy loan securitization in the third quarter, lowering our interest cost by 210 bps. In addition, we recognized the full quarter impact of 58 bps in interest cost savings related to our BPL securitization that closed in the latter part of the second quarter. Dollar Amounts in Thousands 3Q'21 2Q'21 1Q'21 4Q'20 3Q'20 Single-Family Avg. Interest Earning Assets $ 2,608,604 $ 2,535,085 $ 2,504,777 $ 2,173,016 $ 2,279,813 Yield on Avg. Interest Earning Assets 6.00 % 5.91 % 5.63 % 5.53 % 5.03 % Average Financing Cost (3.14) % (3.34) % (3.61) % (3.75) % (3.33) % Single-Family Net Interest Margin 2.86 % 2.57 % 2.02 % 1.78 % 1.70 % Multi-Family Avg. Interest Earning Assets $ 195,431 $ 288,889 $ 310,347 $ 357,281 $ 417,102 Yield on Avg. Interest Earning Assets 8.69 % 7.94 % 7.93 % 7.87 % 7.52 % Average Financing Cost — % — % — % — % — % Multi-Family Net Interest Margin 8.69 % 7.94 % 7.93 % 7.87 % 7.52 % Portfolio Total Avg. Interest Earning Assets $ 2,830,503 $ 2,854,627 $ 2,846,776 $ 2,566,145 $ 2,738,455 Yield on Avg. Interest Earning Assets 6.39 % 6.31 % 6.03 % 6.05 % 5.51 % Average Financing Cost (3.14) % (3.34) % (3.61) % (3.75) % (3.33) % Portfolio Net Interest Margin 3.25 % 2.97 % 2.42 % 2.30 % 2.18 %
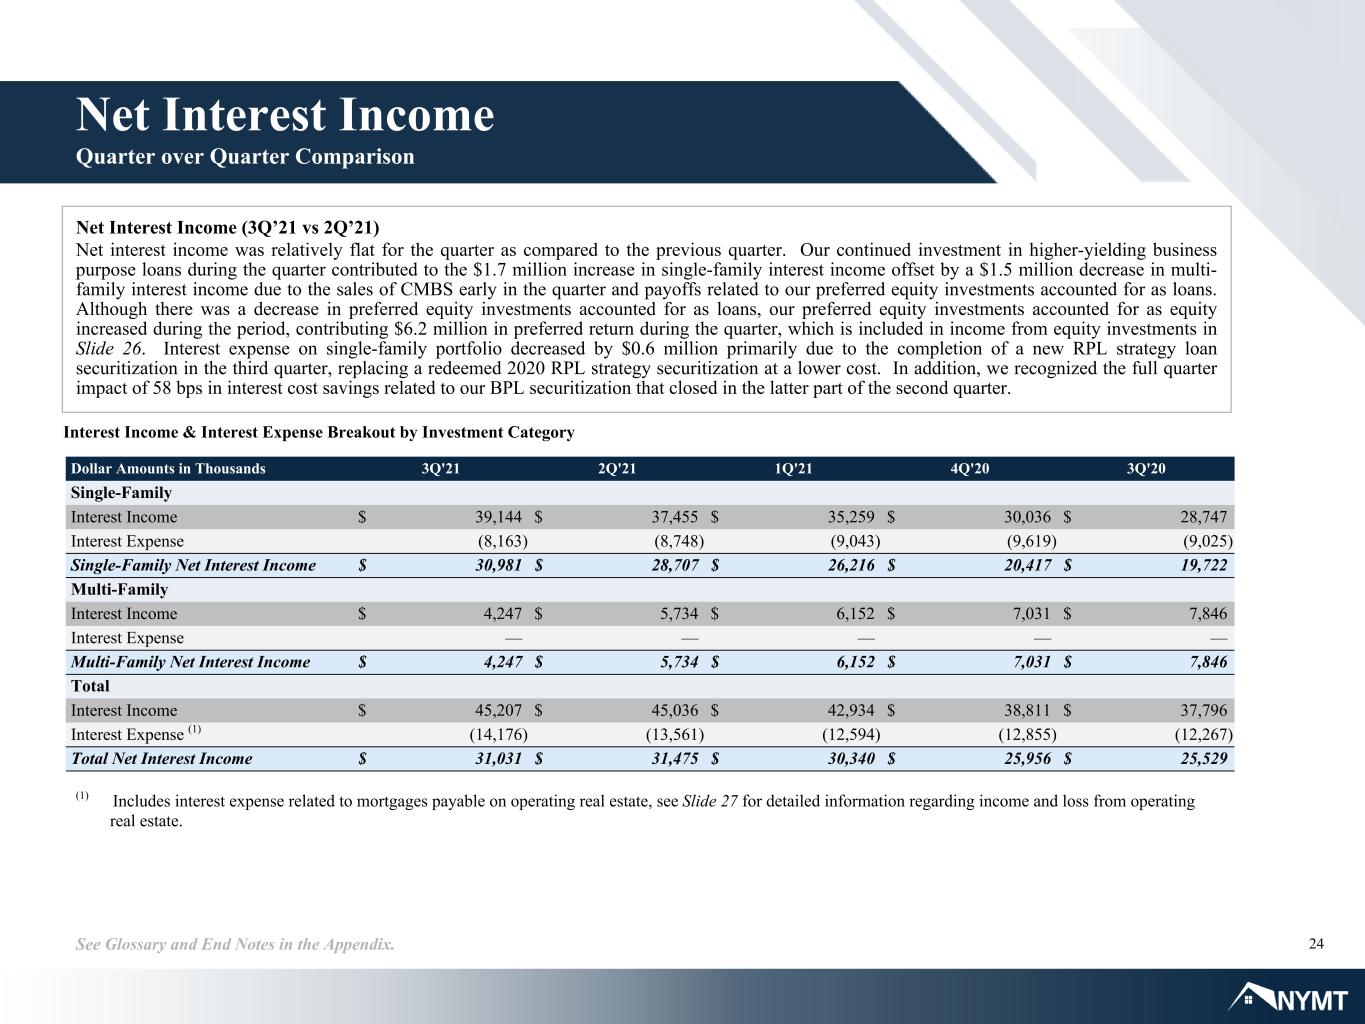
24See Glossary and End Notes in the Appendix. Net Interest Income (3Q’21 vs 2Q’21) Net interest income was relatively flat for the quarter as compared to the previous quarter. Our continued investment in higher-yielding business purpose loans during the quarter contributed to the $1.7 million increase in single-family interest income offset by a $1.5 million decrease in multi- family interest income due to the sales of CMBS early in the quarter and payoffs related to our preferred equity investments accounted for as loans. Although there was a decrease in preferred equity investments accounted for as loans, our preferred equity investments accounted for as equity increased during the period, contributing $6.2 million in preferred return during the quarter, which is included in income from equity investments in Slide 26. Interest expense on single-family portfolio decreased by $0.6 million primarily due to the completion of a new RPL strategy loan securitization in the third quarter, replacing a redeemed 2020 RPL strategy securitization at a lower cost. In addition, we recognized the full quarter impact of 58 bps in interest cost savings related to our BPL securitization that closed in the latter part of the second quarter. Interest Income & Interest Expense Breakout by Investment Category Net Interest Income Quarter over Quarter Comparison Dollar Amounts in Thousands 3Q'21 2Q'21 1Q'21 4Q'20 3Q'20 Single-Family Interest Income $ 39,144 $ 37,455 $ 35,259 $ 30,036 $ 28,747 Interest Expense (8,163) (8,748) (9,043) (9,619) (9,025) Single-Family Net Interest Income $ 30,981 $ 28,707 $ 26,216 $ 20,417 $ 19,722 Multi-Family Interest Income $ 4,247 $ 5,734 $ 6,152 $ 7,031 $ 7,846 Interest Expense — — — — — Multi-Family Net Interest Income $ 4,247 $ 5,734 $ 6,152 $ 7,031 $ 7,846 Total Interest Income $ 45,207 $ 45,036 $ 42,934 $ 38,811 $ 37,796 Interest Expense (1) (14,176) (13,561) (12,594) (12,855) (12,267) Total Net Interest Income $ 31,031 $ 31,475 $ 30,340 $ 25,956 $ 25,529 (1) Includes interest expense related to mortgages payable on operating real estate, see Slide 27 for detailed information regarding income and loss from operating real estate.
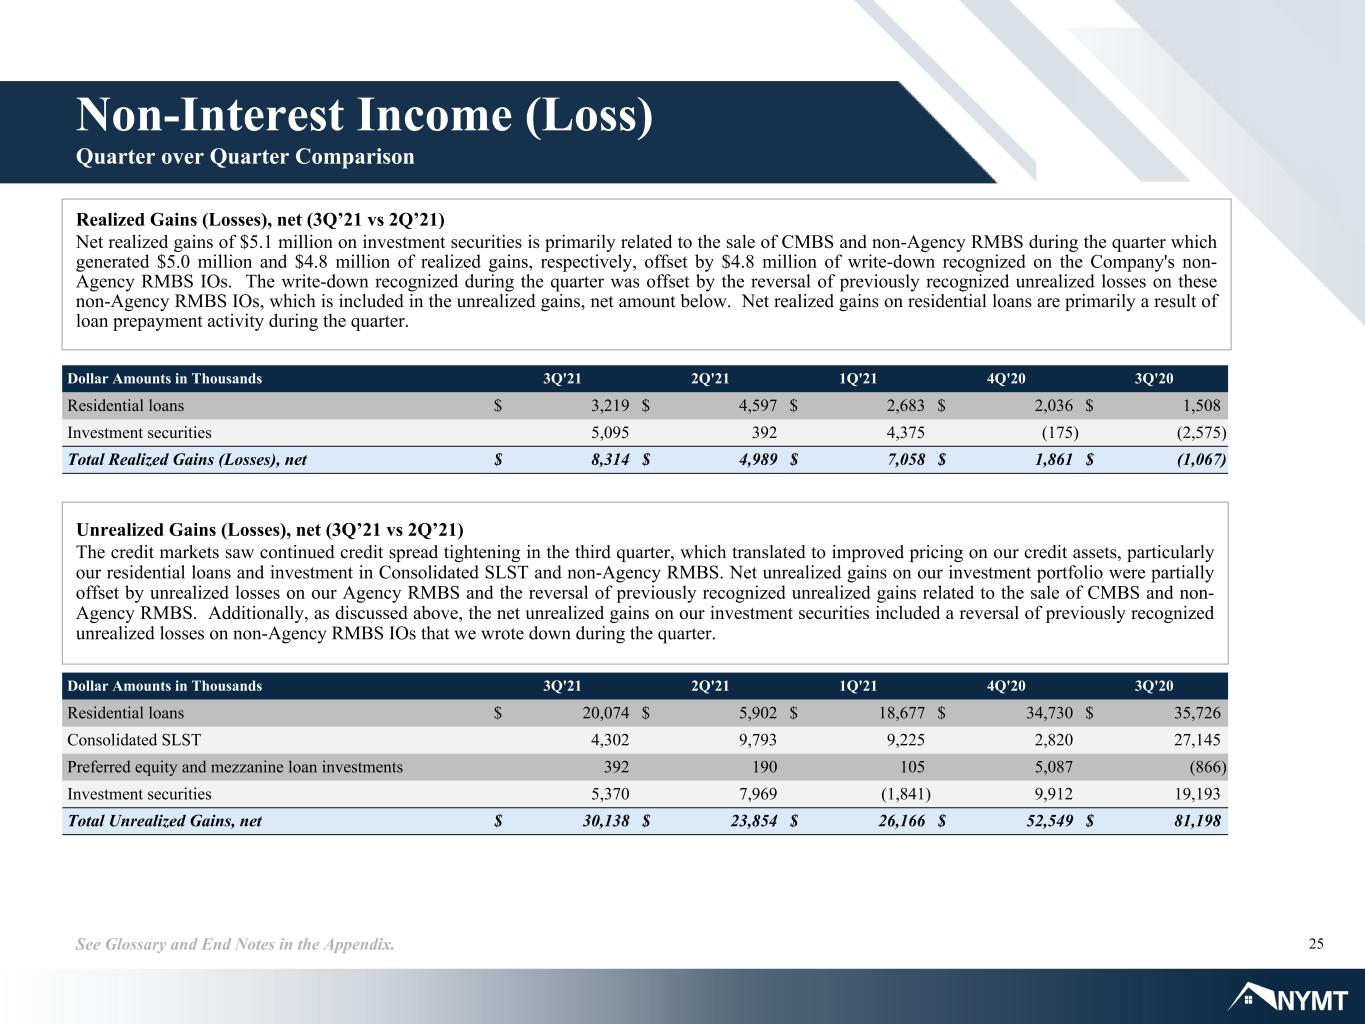
25See Glossary and End Notes in the Appendix. Non-Interest Income (Loss) Quarter over Quarter Comparison Realized Gains (Losses), net (3Q’21 vs 2Q’21) Net realized gains of $5.1 million on investment securities is primarily related to the sale of CMBS and non-Agency RMBS during the quarter which generated $5.0 million and $4.8 million of realized gains, respectively, offset by $4.8 million of write-down recognized on the Company's non- Agency RMBS IOs. The write-down recognized during the quarter was offset by the reversal of previously recognized unrealized losses on these non-Agency RMBS IOs, which is included in the unrealized gains, net amount below. Net realized gains on residential loans are primarily a result of loan prepayment activity during the quarter. Unrealized Gains (Losses), net (3Q’21 vs 2Q’21) The credit markets saw continued credit spread tightening in the third quarter, which translated to improved pricing on our credit assets, particularly our residential loans and investment in Consolidated SLST and non-Agency RMBS. Net unrealized gains on our investment portfolio were partially offset by unrealized losses on our Agency RMBS and the reversal of previously recognized unrealized gains related to the sale of CMBS and non- Agency RMBS. Additionally, as discussed above, the net unrealized gains on our investment securities included a reversal of previously recognized unrealized losses on non-Agency RMBS IOs that we wrote down during the quarter. Dollar Amounts in Thousands 3Q'21 2Q'21 1Q'21 4Q'20 3Q'20 Residential loans $ 3,219 $ 4,597 $ 2,683 $ 2,036 $ 1,508 Investment securities 5,095 392 4,375 (175) (2,575) Total Realized Gains (Losses), net $ 8,314 $ 4,989 $ 7,058 $ 1,861 $ (1,067) Dollar Amounts in Thousands 3Q'21 2Q'21 1Q'21 4Q'20 3Q'20 Residential loans $ 20,074 $ 5,902 $ 18,677 $ 34,730 $ 35,726 Consolidated SLST 4,302 9,793 9,225 2,820 27,145 Preferred equity and mezzanine loan investments 392 190 105 5,087 (866) Investment securities 5,370 7,969 (1,841) 9,912 19,193 Total Unrealized Gains, net $ 30,138 $ 23,854 $ 26,166 $ 52,549 $ 81,198
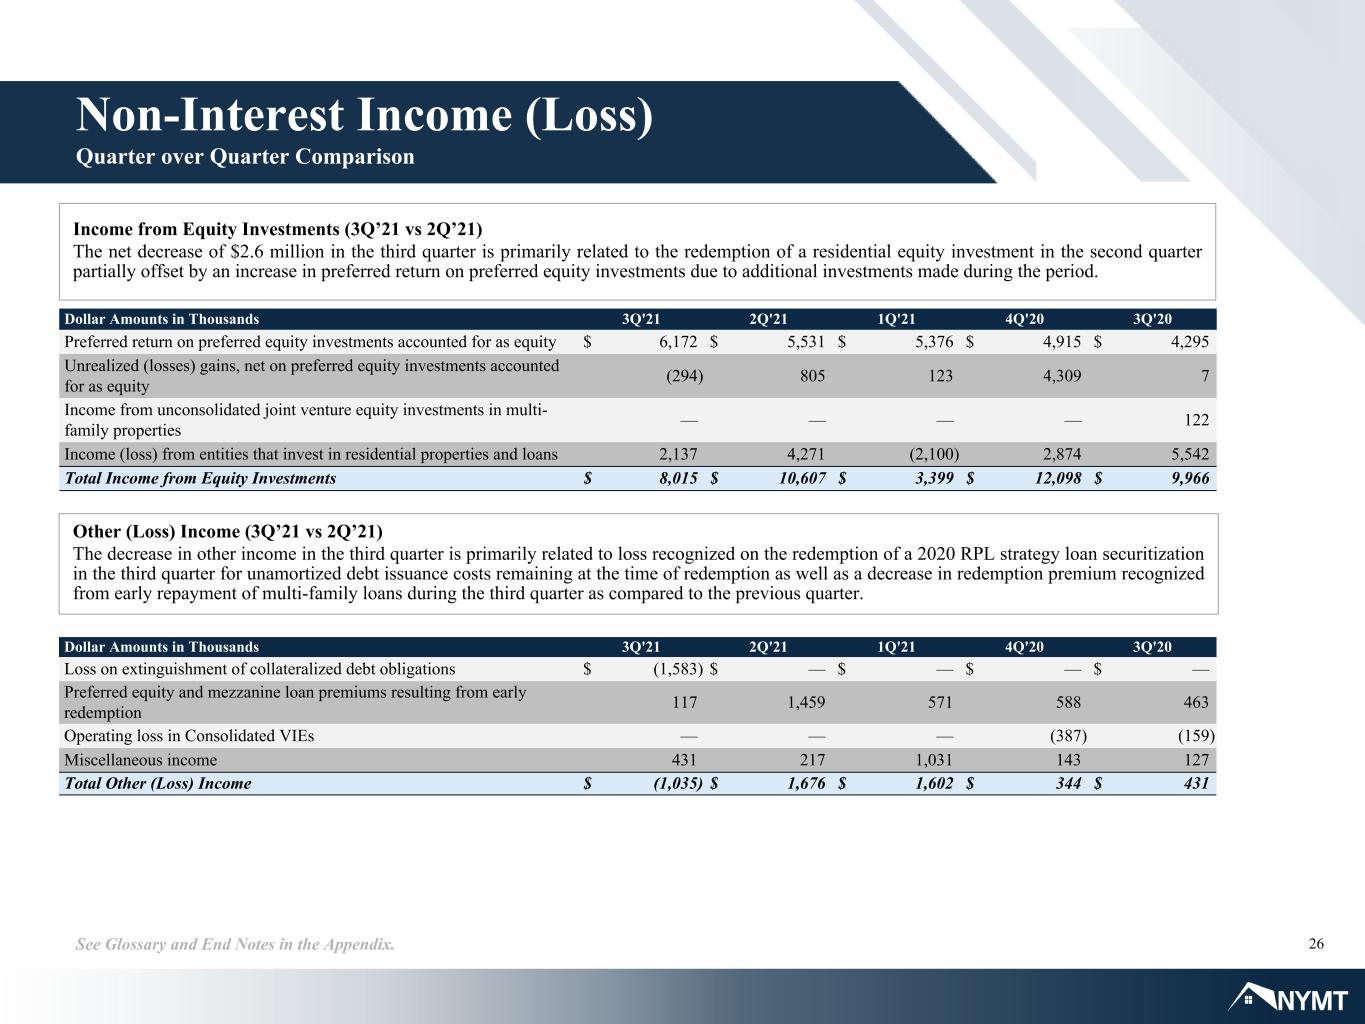
26See Glossary and End Notes in the Appendix. Non-Interest Income (Loss) Quarter over Quarter Comparison Income from Equity Investments (3Q’21 vs 2Q’21) The net decrease of $2.6 million in the third quarter is primarily related to the redemption of a residential equity investment in the second quarter partially offset by an increase in preferred return on preferred equity investments due to additional investments made during the period. Dollar Amounts in Thousands 3Q'21 2Q'21 1Q'21 4Q'20 3Q'20 Preferred return on preferred equity investments accounted for as equity $ 6,172 $ 5,531 $ 5,376 $ 4,915 $ 4,295 Unrealized (losses) gains, net on preferred equity investments accounted for as equity (294) 805 123 4,309 7 Income from unconsolidated joint venture equity investments in multi- family properties — — — — 122 Income (loss) from entities that invest in residential properties and loans 2,137 4,271 (2,100) 2,874 5,542 Total Income from Equity Investments $ 8,015 $ 10,607 $ 3,399 $ 12,098 $ 9,966 Dollar Amounts in Thousands 3Q'21 2Q'21 1Q'21 4Q'20 3Q'20 Loss on extinguishment of collateralized debt obligations $ (1,583) $ — $ — $ — $ — Preferred equity and mezzanine loan premiums resulting from early redemption 117 1,459 571 588 463 Operating loss in Consolidated VIEs — — — (387) (159) Miscellaneous income 431 217 1,031 143 127 Total Other (Loss) Income $ (1,035) $ 1,676 $ 1,602 $ 344 $ 431 Other (Loss) Income (3Q’21 vs 2Q’21) The decrease in other income in the third quarter is primarily related to loss recognized on the redemption of a 2020 RPL strategy loan securitization in the third quarter for unamortized debt issuance costs remaining at the time of redemption as well as a decrease in redemption premium recognized from early repayment of multi-family loans during the third quarter as compared to the previous quarter.

27See Glossary and End Notes in the Appendix. Net Loss from Operating Real Estate Quarter over Quarter Comparison Dollar Amounts in Thousands 3Q'21 2Q'21 1Q'21 4Q'20 3Q'20 Income from operating real estate $ 3,980 $ 2,150 $ 1,495 $ 419 $ — Interest expense, mortgages payable on operating real estate (1) (1,147) (430) (310) — — Expenses related to operating real estate (8,549) (3,913) (2,924) (763) — Net Loss from Operating Real Estate $ (5,716) $ (2,193) $ (1,739) $ (344) $ — Net loss attributable to non-controlling interest 394 1,625 1,409 437 — Net (Loss) Income from Operating Real Estate Attributable to the Company $ (5,322) $ (568) $ (330) $ 93 $ — Net Loss from Operating Real Estate (3Q’21 vs 2Q’21) The increase in both income from and expenses related to operating real estate in the third quarter is primarily related to additional consolidated joint venture multi-family investments made during the quarter. These multi-family joint venture investments are consolidated in the Company's financial statements in accordance with GAAP and a significant portion of the net loss is attributable to the $5.7 million of depreciation expense and amortization of lease intangibles related to the operating real estate. (1) Included in interest expense in the Company's consolidated statements of operations.

28See Glossary and End Notes in the Appendix. Expense Analysis Quarter over Quarter Comparison General and Administrative Expenses (3Q’21 vs 2Q’21) Decrease in compensation expenses is largely related to decreases in stock based compensation expense and bonus accruals during the third quarter. Increase in other general and administration is primarily attributable to additional state capital tax accruals during the quarter. Portfolio Operating Expenses (3Q’21 vs 2Q’21) Portfolio operating expenses increased by $0.3 million primarily due to the continued growth of the business purpose loan portfolio. Dollar Amounts in Thousands 3Q'21 2Q'21 1Q'21 4Q'20 3Q'20 Portfolio Operating Expenses $ 7,039 $ 6,688 $ 4,830 $ 2,761 $ 3,265 Dollar Amounts in Thousands 3Q'21 2Q'21 1Q'21 4Q'20 3Q'20 Salaries, benefits and directors' compensation $ 8,612 $ 9,797 $ 8,796 $ 6,744 $ 7,247 Other general and administrative expenses 3,846 2,723 2,645 2,912 2,912 Total General and Administrative Expenses $ 12,458 $ 12,520 $ 11,441 $ 9,656 $ 10,159

29See Glossary and End Notes in the Appendix. Other Comprehensive Income (Loss) Other Comprehensive Income (Loss) (3Q’21 vs 2Q’21) The change in other comprehensive income is primarily due to previously recognized unrealized gains reported in other comprehensive income that were reclassified to net realized gains in relation to the sale of certain investment securities during the third quarter. Dollar Amounts in Thousands 3Q'21 2Q'21 1Q'21 4Q'20 3Q'20 NET INCOME ATTRIBUTABLE TO COMPANY'S COMMON STOCKHOLDERS $ 36,861 $ 42,944 $ 41,911 $ 70,123 $ 91,344 OTHER COMPREHENSIVE (LOSS) INCOME Increase in fair value of investment securities available for sale 637 3,788 638 12,755 12,645 Reclassification adjustment for net (gain) loss included in net income (6,045) (213) 2,242 177 9,845 TOTAL OTHER COMPREHENSIVE (LOSS) INCOME (5,408) 3,575 2,880 12,932 22,490 COMPREHENSIVE INCOME ATTRIBUTABLE TO COMPANY'S COMMON STOCKHOLDERS $ 31,453 $ 46,519 $ 44,791 $ 83,055 $ 113,834
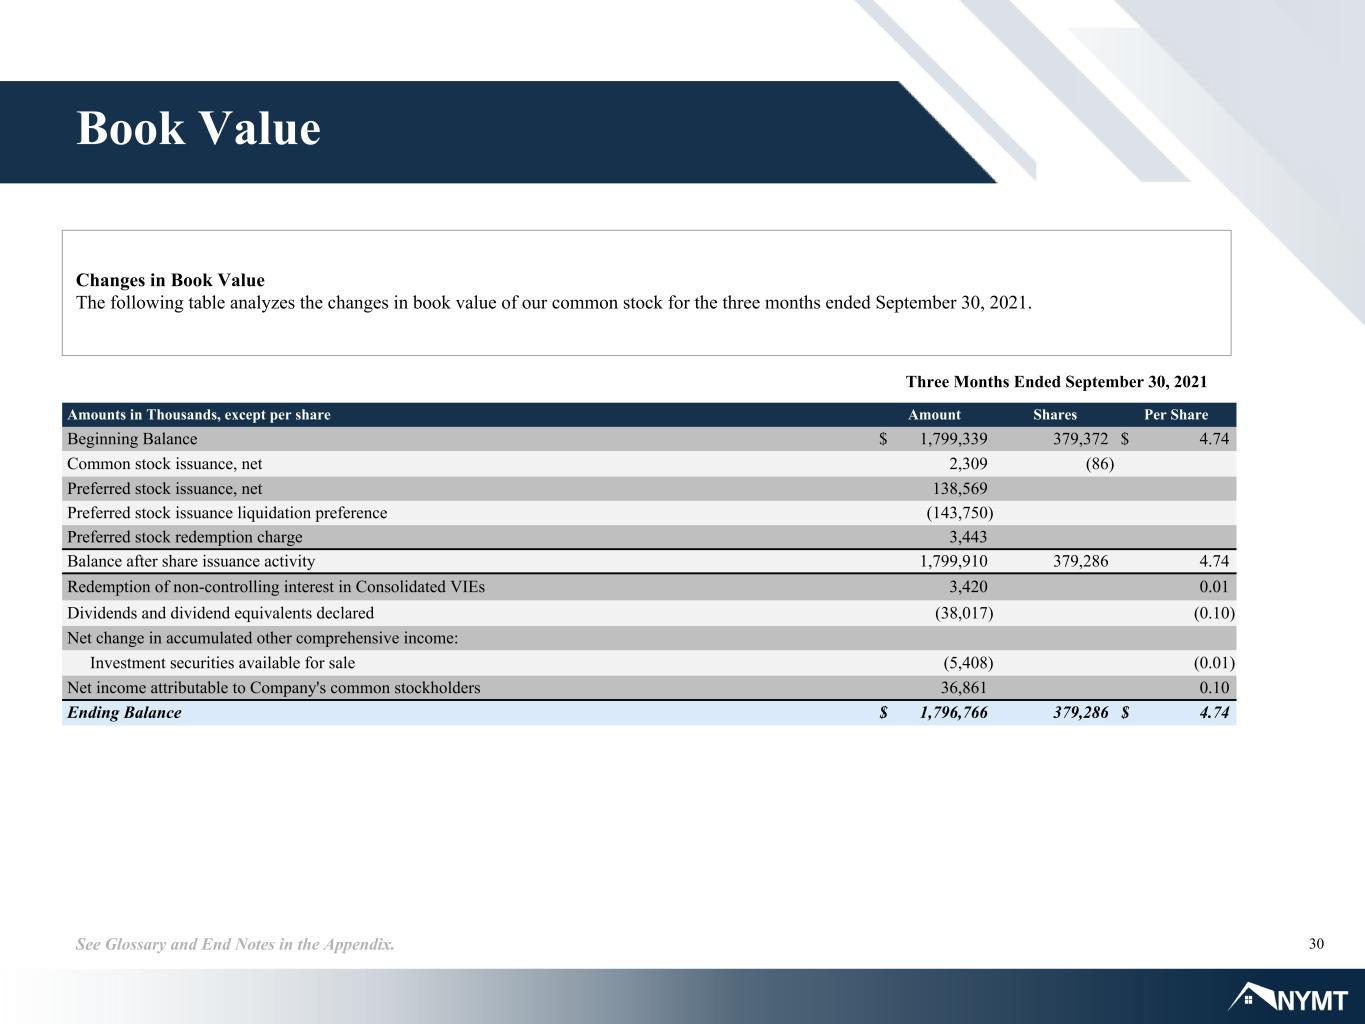
30See Glossary and End Notes in the Appendix. Book Value Changes in Book Value The following table analyzes the changes in book value of our common stock for the three months ended September 30, 2021. Amounts in Thousands, except per share Amount Shares Per Share Beginning Balance $ 1,799,339 379,372 $ 4.74 Common stock issuance, net 2,309 (86) Preferred stock issuance, net 138,569 Preferred stock issuance liquidation preference (143,750) Preferred stock redemption charge 3,443 Balance after share issuance activity 1,799,910 379,286 4.74 Redemption of non-controlling interest in Consolidated VIEs 3,420 0.01 Dividends and dividend equivalents declared (38,017) (0.10) Net change in accumulated other comprehensive income: Investment securities available for sale (5,408) (0.01) Net income attributable to Company's common stockholders 36,861 0.10 Ending Balance $ 1,796,766 379,286 $ 4.74 Three Months Ended September 30, 2021
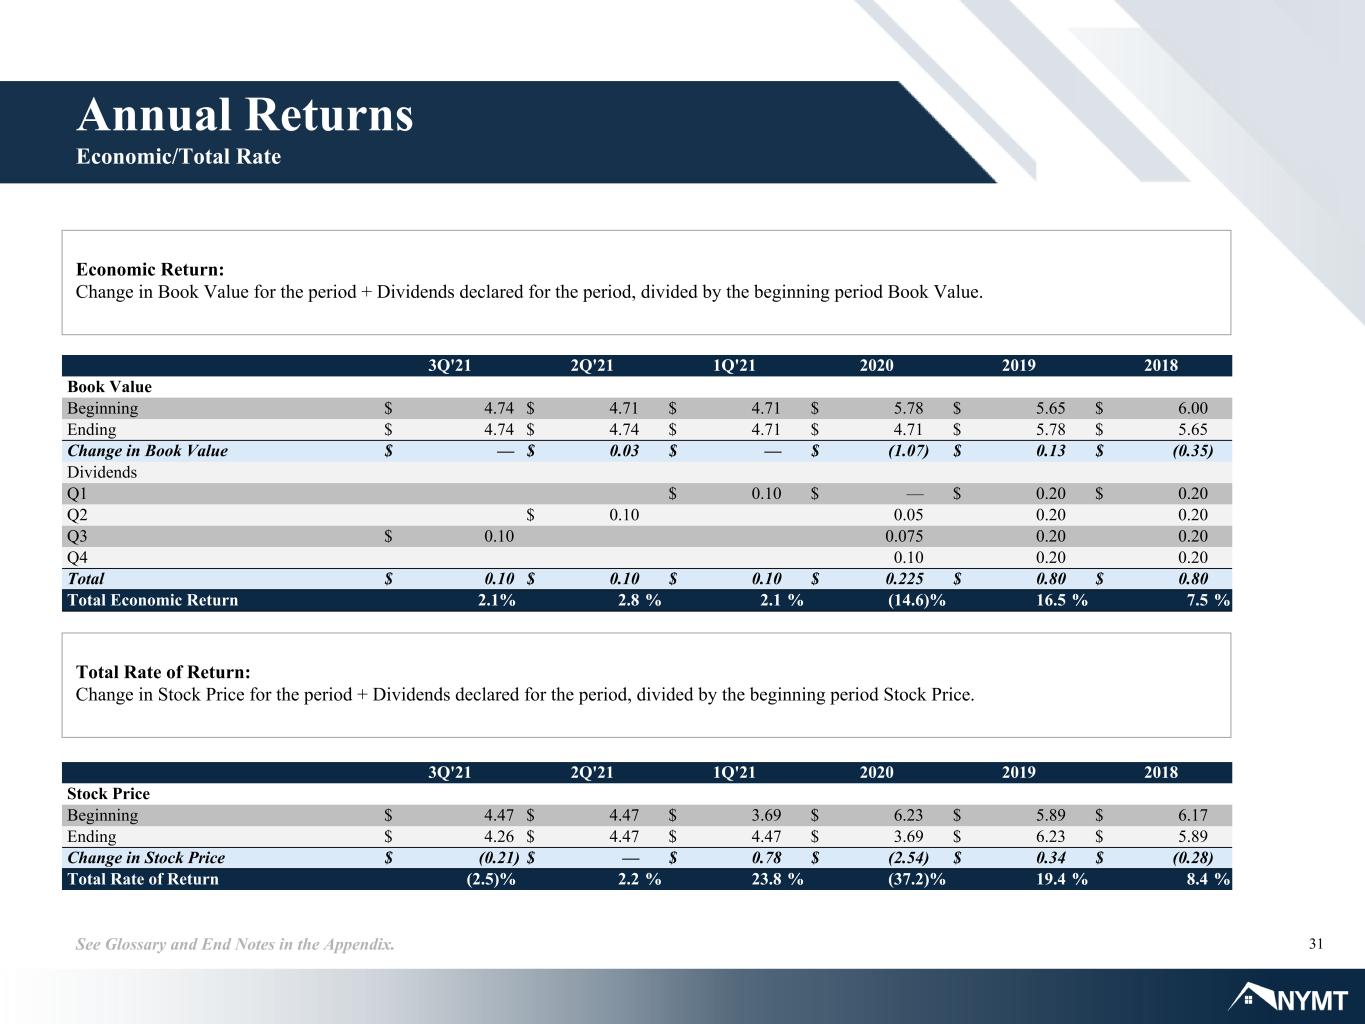
31See Glossary and End Notes in the Appendix. Economic Return: Change in Book Value for the period + Dividends declared for the period, divided by the beginning period Book Value. Total Rate of Return: Change in Stock Price for the period + Dividends declared for the period, divided by the beginning period Stock Price. Annual Returns Economic/Total Rate 3Q'21 2Q'21 1Q'21 2020 2019 2018 Book Value Beginning $ 4.74 $ 4.71 $ 4.71 $ 5.78 $ 5.65 $ 6.00 Ending $ 4.74 $ 4.74 $ 4.71 $ 4.71 $ 5.78 $ 5.65 Change in Book Value $ — $ 0.03 $ — $ (1.07) $ 0.13 $ (0.35) Dividends Q1 $ 0.10 $ — $ 0.20 $ 0.20 Q2 $ 0.10 0.05 0.20 0.20 Q3 $ 0.10 0.075 0.20 0.20 Q4 0.10 0.20 0.20 Total $ 0.10 $ 0.10 $ 0.10 $ 0.225 $ 0.80 $ 0.80 Total Economic Return 2.1% 2.8 % 2.1 % (14.6) % 16.5 % 7.5 % 3Q'21 2Q'21 1Q'21 2020 2019 2018 Stock Price Beginning $ 4.47 $ 4.47 $ 3.69 $ 6.23 $ 5.89 $ 6.17 Ending $ 4.26 $ 4.47 $ 4.47 $ 3.69 $ 6.23 $ 5.89 Change in Stock Price $ (0.21) $ — $ 0.78 $ (2.54) $ 0.34 $ (0.28) Total Rate of Return (2.5)% 2.2 % 23.8 % (37.2) % 19.4 % 8.4 %
Appendix
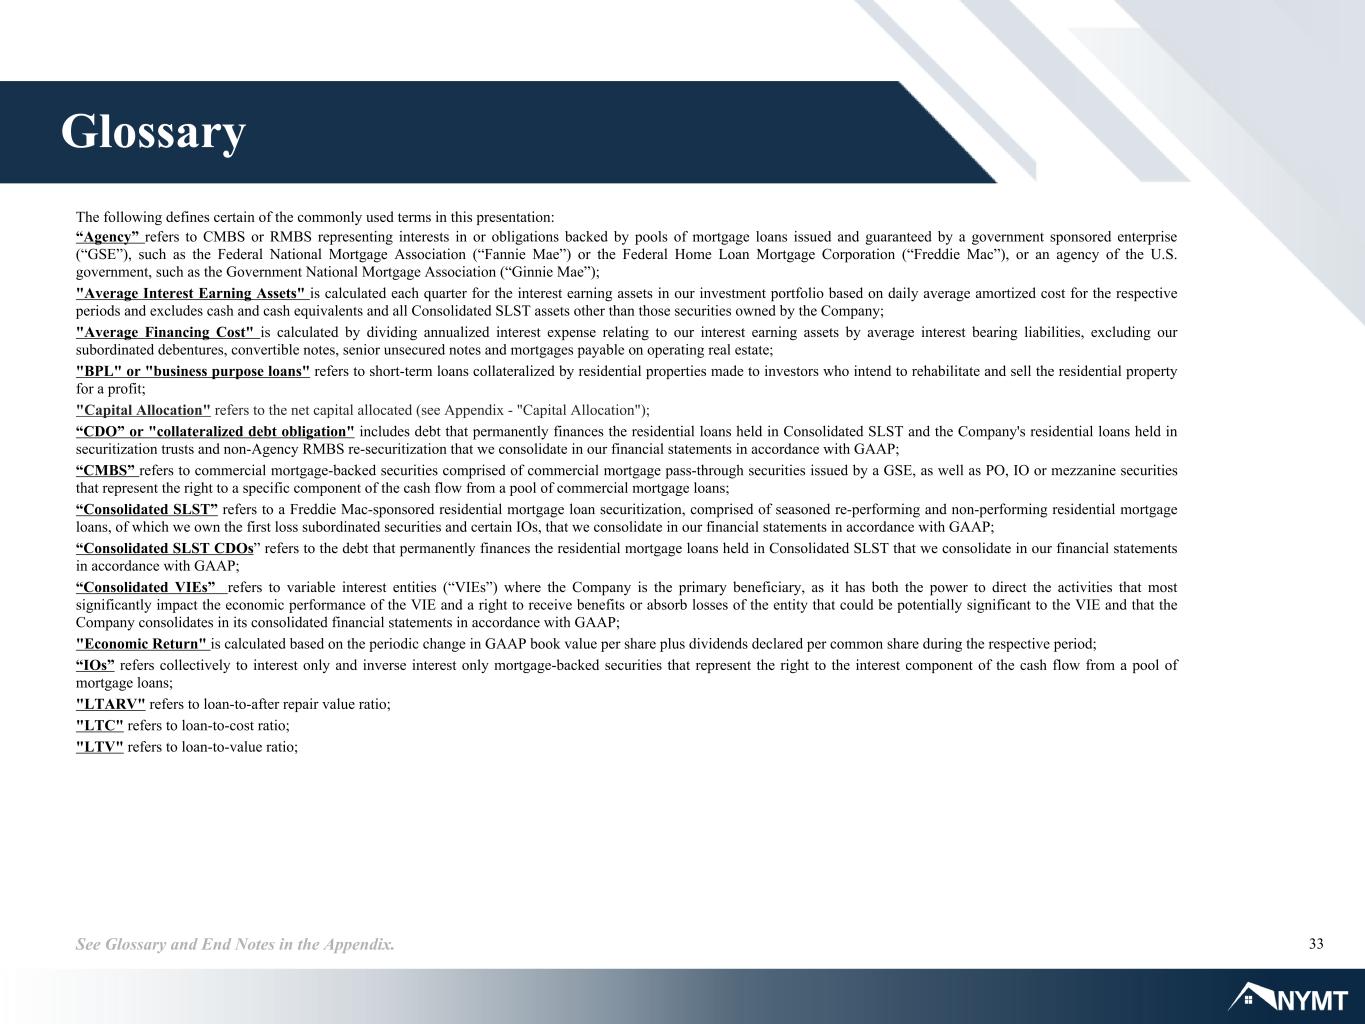
33See Glossary and End Notes in the Appendix. The following defines certain of the commonly used terms in this presentation: “Agency” refers to CMBS or RMBS representing interests in or obligations backed by pools of mortgage loans issued and guaranteed by a government sponsored enterprise (“GSE”), such as the Federal National Mortgage Association (“Fannie Mae”) or the Federal Home Loan Mortgage Corporation (“Freddie Mac”), or an agency of the U.S. government, such as the Government National Mortgage Association (“Ginnie Mae”); "Average Interest Earning Assets" is calculated each quarter for the interest earning assets in our investment portfolio based on daily average amortized cost for the respective periods and excludes cash and cash equivalents and all Consolidated SLST assets other than those securities owned by the Company; "Average Financing Cost" is calculated by dividing annualized interest expense relating to our interest earning assets by average interest bearing liabilities, excluding our subordinated debentures, convertible notes, senior unsecured notes and mortgages payable on operating real estate; "BPL" or "business purpose loans" refers to short-term loans collateralized by residential properties made to investors who intend to rehabilitate and sell the residential property for a profit; "Capital Allocation" refers to the net capital allocated (see Appendix - "Capital Allocation"); “CDO” or "collateralized debt obligation" includes debt that permanently finances the residential loans held in Consolidated SLST and the Company's residential loans held in securitization trusts and non-Agency RMBS re-securitization that we consolidate in our financial statements in accordance with GAAP; “CMBS” refers to commercial mortgage-backed securities comprised of commercial mortgage pass-through securities issued by a GSE, as well as PO, IO or mezzanine securities that represent the right to a specific component of the cash flow from a pool of commercial mortgage loans; “Consolidated SLST” refers to a Freddie Mac-sponsored residential mortgage loan securitization, comprised of seasoned re-performing and non-performing residential mortgage loans, of which we own the first loss subordinated securities and certain IOs, that we consolidate in our financial statements in accordance with GAAP; “Consolidated SLST CDOs” refers to the debt that permanently finances the residential mortgage loans held in Consolidated SLST that we consolidate in our financial statements in accordance with GAAP; “Consolidated VIEs” refers to variable interest entities (“VIEs”) where the Company is the primary beneficiary, as it has both the power to direct the activities that most significantly impact the economic performance of the VIE and a right to receive benefits or absorb losses of the entity that could be potentially significant to the VIE and that the Company consolidates in its consolidated financial statements in accordance with GAAP; "Economic Return" is calculated based on the periodic change in GAAP book value per share plus dividends declared per common share during the respective period; “IOs” refers collectively to interest only and inverse interest only mortgage-backed securities that represent the right to the interest component of the cash flow from a pool of mortgage loans; "LTARV" refers to loan-to-after repair value ratio; "LTC" refers to loan-to-cost ratio; "LTV" refers to loan-to-value ratio; Glossary

34See Glossary and End Notes in the Appendix. “Market Capitalization” is the outstanding shares of common stock and preferred stock multiplied by closing common stock and preferred stock market price as of the date indicated; "Mezzanine Lending" refers to the Company's preferred equity in, and mezzanine loans to, entities that have multi-family real estate assets; "MF" refers to multi-family; "MTM" refers to mark-to-market; "Net Interest Margin" is the difference between the Yield on Average Interest Earning Assets and the Average Financing Cost; "non-Agency RMBS" refers to RMBS that are not guaranteed by any agency of the U.S. Government or GSE; “POs” refers to mortgage-backed securities that represent the right to the principal component of the cash flow from a pool of mortgage loans; “Portfolio Leverage Ratio” represents outstanding repurchase agreement financing divided by the Company's total stockholders' equity; “RMBS” refers to residential mortgage-backed securities backed by adjustable-rate, hybrid adjustable-rate, or fixed-rate residential loans; "RPL" refers to pools of seasoned re-performing, non-performing and other delinquent mortgage loans secured by first liens on one- to four-family properties; "S&D" refers to scratch and dent mortgage loans secured by a mortgage lien on a one- to four- family residential property intended by the originator to conform with Fannie Mae, Freddie Mac or other conduit standards but did not meet the originally intended origination guidelines due to errors in relevant documentation, credit underwriting of the borrower, consumer disclosures or other applicable requirements; "SF" refers to single-family; "Total Investment Portfolio" refers to the carrying value of investments actually owned by the Company (see Appendix – “Capital Allocation”); “Total Leverage Ratio” represents total outstanding repurchase agreement financing plus subordinated debentures, convertible notes and senior unsecured notes divided by the Company's total stockholders' equity. Does not include collateralized debt obligations and mortgages payable on operating real estate as they are non-recourse debt to the Company; "Total Rate of Return" is calculated based on the change in price of the Company's common stock plus dividends declared per common share during the respective period; "W/A" refers to weighted average; and "Yield on Average Interest Earning Assets" is calculated by dividing annualized interest income relating to interest earning assets by Average Interest Earning Assets for the respective periods. Glossary

35See Glossary and End Notes in the Appendix. End Notes Slide 1 • Image(s) used under license from Shutterstock.com. Slide 3 • Image(s) used under license from Shutterstock.com. Slide 6 • Refer to Appendix - "Capital Allocation" for a detailed breakout of Capital Allocation and Total Investment Portfolio. Slide 7 • Image(s) used under license from Shutterstock.com. • Unencumbered assets represents investment securities and residential loans. Slide 9 • Market Price is the closing price per share of the Company's common stock on September 30, 2021. • Price to Book is calculated by dividing the Market Price by the book value per share of the Company as of September 30, 2021. • Total Portfolio Size and Investment Allocation of the investment portfolio represent balances as of September 30, 2021 (see Appendix – “Capital Allocation”). Slide 13 • Estimated housing units needed to meet demand sourced from report entitled "Housing is Critical Infrastructure: Social and Economic Benefits of Building More Housing" published by Rosen Consulting Group in June 2021. • 2020 Agency originations sourced from "Housing Finance at a Glance" report for February 2021 published by the Hosing Finance Policy Center of the Urban Institute. • BPL, S&D and Multi-Family Direct/JV amounts represent the fair value of the assets as of September 30, 2021. • BPL, S&D and Multi-Family Direct/JV percentages represent the percentage of the Total Investment Portfolio as of September 30, 2021 (see Appendix - "Capital Allocation"). • LTV (at cost) represents the weighted average loan-to-cost calculated using the initial loan amount at origination (exclusive of any debt service, rehab escrows and other escrows or other amounts not funded to the borrower at closing) and initial cost basis. Initial cost basis is calculated as the purchase cost for non-re-financed loans or the as-is-value for re- financed loans. • LTV (after repair) represents the weighted average loan-to-value calculated using the maximum loan amount and original after-repair value per the appraisal or broker price opinion obtained for the mortgage loan (only applicable for loans with rehab component). Slide 14 • Portfolio acquisitions represent the cost of assets acquired by the Company during the periods presented. Slide 15 • MTM Repo includes MTM repurchase agreement financing. • Non-MTM Repo includes non-MTM repurchase agreement financing. • Securitization Financing includes residential loan securitizations and non- Agency RMBS re-securitization. • Unencumbered represents investment securities and residential loans. Slide 16 • As of September 30, 2021. Refer to Appendix - "Capital Allocation" for a detailed breakout of Total Investment Portfolio, Total Capital, and Net Capital. • Asset Value and Net Capital for Non-Agency Securities include Consolidated SLST securities owned by the Company with a fair value of $231M and other non-Agency RMBS with a fair value of $225M.
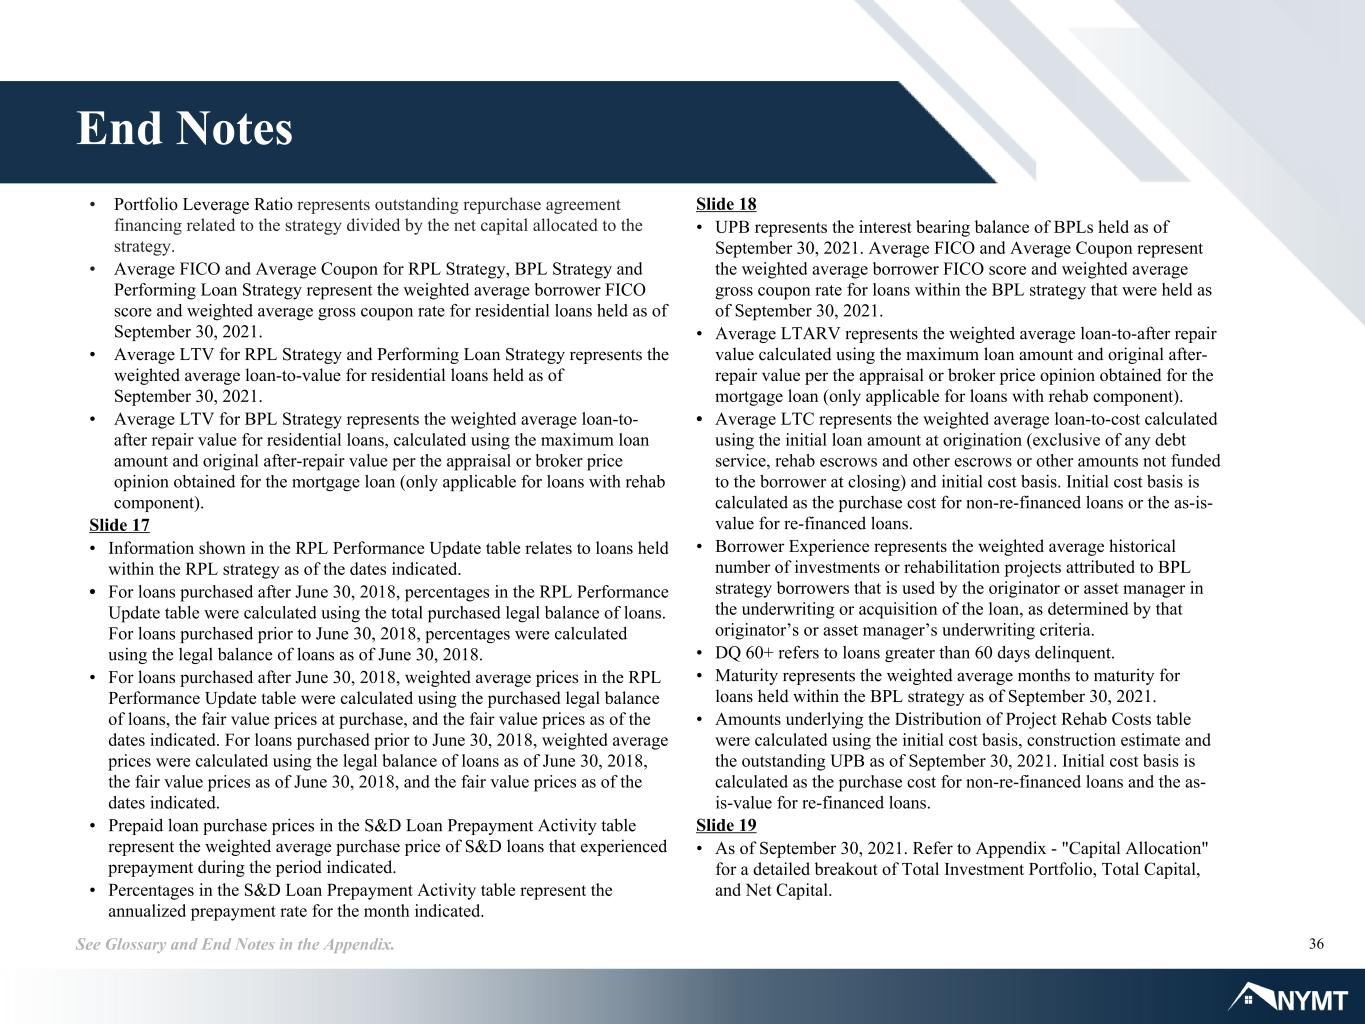
36See Glossary and End Notes in the Appendix. End Notes • Portfolio Leverage Ratio represents outstanding repurchase agreement financing related to the strategy divided by the net capital allocated to the strategy. • Average FICO and Average Coupon for RPL Strategy, BPL Strategy and Performing Loan Strategy represent the weighted average borrower FICO score and weighted average gross coupon rate for residential loans held as of September 30, 2021. • Average LTV for RPL Strategy and Performing Loan Strategy represents the weighted average loan-to-value for residential loans held as of September 30, 2021. • Average LTV for BPL Strategy represents the weighted average loan-to- after repair value for residential loans, calculated using the maximum loan amount and original after-repair value per the appraisal or broker price opinion obtained for the mortgage loan (only applicable for loans with rehab component). Slide 17 • Information shown in the RPL Performance Update table relates to loans held within the RPL strategy as of the dates indicated. • For loans purchased after June 30, 2018, percentages in the RPL Performance Update table were calculated using the total purchased legal balance of loans. For loans purchased prior to June 30, 2018, percentages were calculated using the legal balance of loans as of June 30, 2018. • For loans purchased after June 30, 2018, weighted average prices in the RPL Performance Update table were calculated using the purchased legal balance of loans, the fair value prices at purchase, and the fair value prices as of the dates indicated. For loans purchased prior to June 30, 2018, weighted average prices were calculated using the legal balance of loans as of June 30, 2018, the fair value prices as of June 30, 2018, and the fair value prices as of the dates indicated. • Prepaid loan purchase prices in the S&D Loan Prepayment Activity table represent the weighted average purchase price of S&D loans that experienced prepayment during the period indicated. • Percentages in the S&D Loan Prepayment Activity table represent the annualized prepayment rate for the month indicated. Slide 18 • UPB represents the interest bearing balance of BPLs held as of September 30, 2021. Average FICO and Average Coupon represent the weighted average borrower FICO score and weighted average gross coupon rate for loans within the BPL strategy that were held as of September 30, 2021. • Average LTARV represents the weighted average loan-to-after repair value calculated using the maximum loan amount and original after- repair value per the appraisal or broker price opinion obtained for the mortgage loan (only applicable for loans with rehab component). • Average LTC represents the weighted average loan-to-cost calculated using the initial loan amount at origination (exclusive of any debt service, rehab escrows and other escrows or other amounts not funded to the borrower at closing) and initial cost basis. Initial cost basis is calculated as the purchase cost for non-re-financed loans or the as-is- value for re-financed loans. • Borrower Experience represents the weighted average historical number of investments or rehabilitation projects attributed to BPL strategy borrowers that is used by the originator or asset manager in the underwriting or acquisition of the loan, as determined by that originator’s or asset manager’s underwriting criteria. • DQ 60+ refers to loans greater than 60 days delinquent. • Maturity represents the weighted average months to maturity for loans held within the BPL strategy as of September 30, 2021. • Amounts underlying the Distribution of Project Rehab Costs table were calculated using the initial cost basis, construction estimate and the outstanding UPB as of September 30, 2021. Initial cost basis is calculated as the purchase cost for non-re-financed loans and the as- is-value for re-financed loans. Slide 19 • As of September 30, 2021. Refer to Appendix - "Capital Allocation" for a detailed breakout of Total Investment Portfolio, Total Capital, and Net Capital.
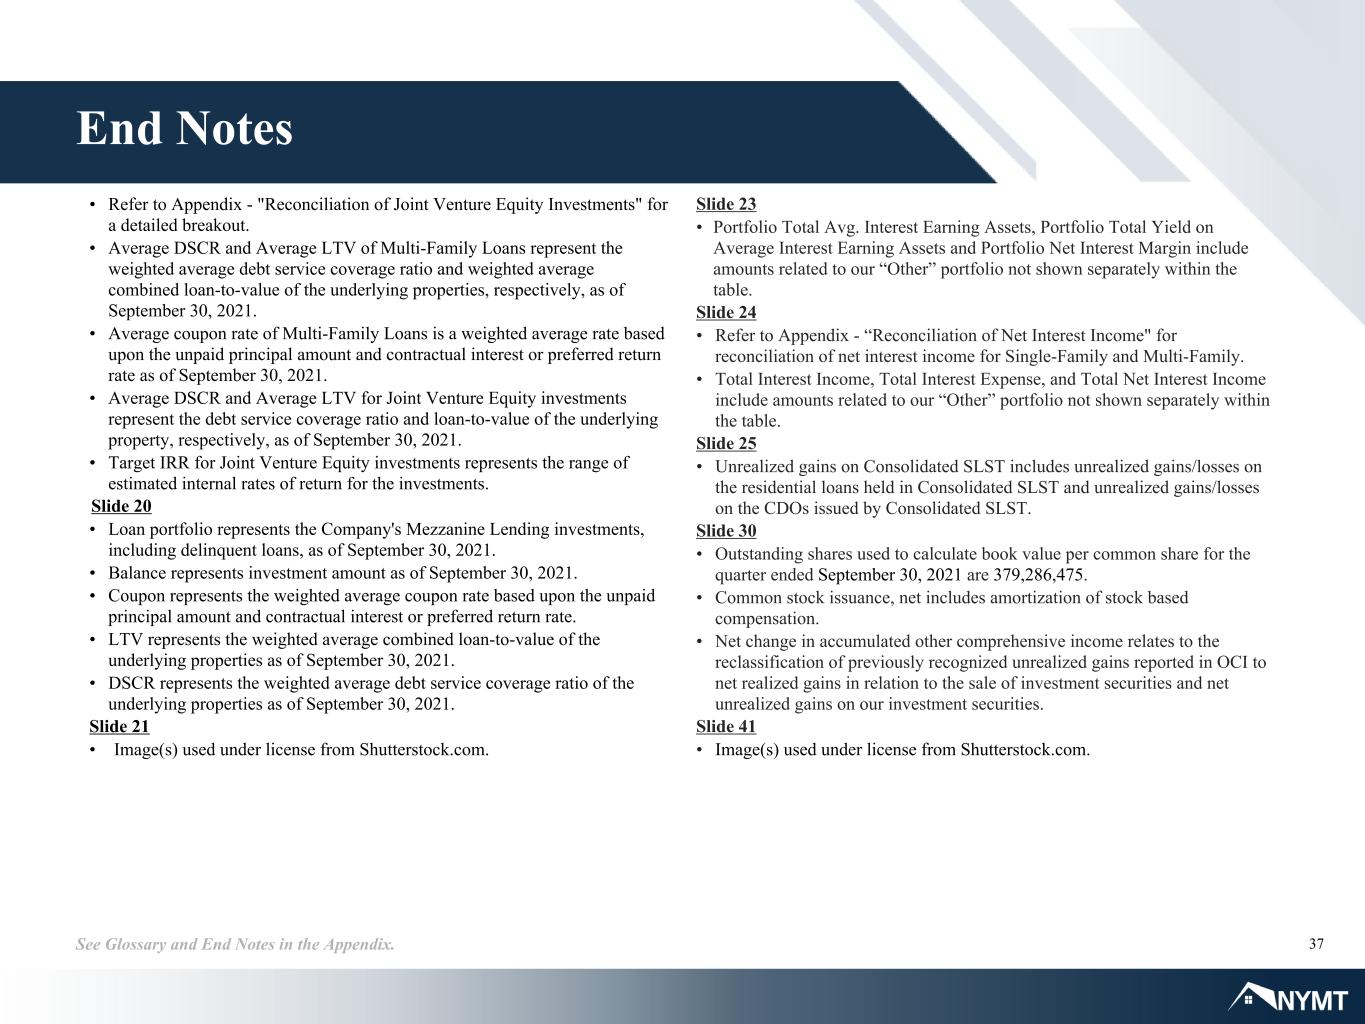
37See Glossary and End Notes in the Appendix. End Notes • Refer to Appendix - "Reconciliation of Joint Venture Equity Investments" for a detailed breakout. • Average DSCR and Average LTV of Multi-Family Loans represent the weighted average debt service coverage ratio and weighted average combined loan-to-value of the underlying properties, respectively, as of September 30, 2021. • Average coupon rate of Multi-Family Loans is a weighted average rate based upon the unpaid principal amount and contractual interest or preferred return rate as of September 30, 2021. • Average DSCR and Average LTV for Joint Venture Equity investments represent the debt service coverage ratio and loan-to-value of the underlying property, respectively, as of September 30, 2021. • Target IRR for Joint Venture Equity investments represents the range of estimated internal rates of return for the investments. Slide 20 • Loan portfolio represents the Company's Mezzanine Lending investments, including delinquent loans, as of September 30, 2021. • Balance represents investment amount as of September 30, 2021. • Coupon represents the weighted average coupon rate based upon the unpaid principal amount and contractual interest or preferred return rate. • LTV represents the weighted average combined loan-to-value of the underlying properties as of September 30, 2021. • DSCR represents the weighted average debt service coverage ratio of the underlying properties as of September 30, 2021. Slide 21 • Image(s) used under license from Shutterstock.com. Slide 23 • Portfolio Total Avg. Interest Earning Assets, Portfolio Total Yield on Average Interest Earning Assets and Portfolio Net Interest Margin include amounts related to our “Other” portfolio not shown separately within the table. Slide 24 • Refer to Appendix - “Reconciliation of Net Interest Income" for reconciliation of net interest income for Single-Family and Multi-Family. • Total Interest Income, Total Interest Expense, and Total Net Interest Income include amounts related to our “Other” portfolio not shown separately within the table. Slide 25 • Unrealized gains on Consolidated SLST includes unrealized gains/losses on the residential loans held in Consolidated SLST and unrealized gains/losses on the CDOs issued by Consolidated SLST. Slide 30 • Outstanding shares used to calculate book value per common share for the quarter ended September 30, 2021 are 379,286,475. • Common stock issuance, net includes amortization of stock based compensation. • Net change in accumulated other comprehensive income relates to the reclassification of previously recognized unrealized gains reported in OCI to net realized gains in relation to the sale of investment securities and net unrealized gains on our investment securities. Slide 41 • Image(s) used under license from Shutterstock.com.

38See Glossary and End Notes in the Appendix. (1) The Company, through its ownership of certain securities, has determined it is the primary beneficiary of Consolidated SLST and has consolidated the assets and liabilities of Consolidated SLST in the Company’s consolidated financial statements. Consolidated SLST is presented on our consolidated balance sheets as residential loans, at fair value and collateralized debt obligations, at fair value. Our investment in Consolidated SLST as of September 30, 2021 was limited to the RMBS comprised of first loss subordinated securities and IOs issued by the securitization with an aggregate net carrying value of $231.1 million. (2) Agency RMBS with a fair value of $125.6 million are included in Single-Family. (3) Represents the Company's single-family rental properties and equity investments in consolidated multi-family apartment communities. (4) Excludes cash amounting to $3.9 million held in the Company's equity investments in consolidated multi-family apartment communities. Restricted cash is included in the Company’s consolidated balance sheets in other assets. (5) Represents total outstanding repurchase agreement financing, subordinated debentures, convertible notes and senior unsecured notes divided by the Company's total stockholders' equity. Does not include Consolidated SLST CDOs amounting to $905.0 million, residential loan securitization CDOs amounting to $710.1 million and mortgages payable on operating real estate amounting to $200.7 million as they are non-recourse debt for which the Company has no obligation. (6) Represents outstanding repurchase agreement financing divided by the Company's total stockholders' equity. Capital Allocation At September 30, 2021 (Dollar amounts in thousands) Single-Family (1) Multi-Family Other Total Residential loans $ 3,273,807 $ — $ — $ 3,273,807 Consolidated SLST CDOs (904,976) — — (904,976) Multi-family loans — 119,812 — 119,812 Investment securities available for sale (2) 350,365 56,243 41,485 448,093 Equity investments — 237,925 17,089 255,014 Other investments (3) 9,428 73,335 — 82,763 Total investment portfolio carrying value $ 2,728,624 $ 487,315 $ 58,574 $ 3,274,513 Repurchase agreements $ (334,556) $ — $ — $ (334,556) Residential loan securitization CDOs (710,102) — — (710,102) Convertible notes — — (137,240) (137,240) Senior unsecured notes — — (96,540) (96,540) Subordinated debentures — — (45,000) (45,000) Cash, cash equivalents and restricted cash (4) 21,091 — 405,686 426,777 Other 41,885 (7,909) (54,035) (20,059) Net Company capital allocated $ 1,746,942 $ 479,406 $ 131,445 $ 2,357,793 Total Leverage Ratio (5) 0.3x Portfolio Leverage Ratio (6) 0.1x

39See Glossary and End Notes in the Appendix. Reconciliation of Net Interest Income Dollar amounts in thousands 3Q'21 2Q'21 1Q'21 4Q'20 3Q'20 Single-Family Interest income, residential loans $ 31,488 $ 30,088 $ 27,630 $ 21,899 $ 19,808 Interest income, investment securities available for sale 4,527 4,039 4,415 4,892 5,605 Interest income, Consolidated SLST 10,245 10,479 10,318 10,653 10,896 Interest expense, Consolidated SLST CDOs (7,116) (7,151) (7,104) (7,408) (7,562) Interest income, Single-Family, net 39,144 37,455 35,259 30,036 28,747 Interest expense, repurchase agreements (3,110) (3,733) (4,040) (3,882) (5,341) Interest expense, residential loan securitizations (5,053) (5,015) (4,720) (4,440) (2,160) Interest expense, non-Agency RMBS re-securitization — — (283) (1,297) (1,524) Net Interest Income, Single-Family $ 30,981 $ 28,707 $ 26,216 $ 20,417 $ 19,722 Multi-Family Interest income, investment securities available for sale $ 798 $ 1,604 $ 1,751 $ 2,007 $ 2,546 Interest income, preferred equity and mezzanine loan investments 3,449 4,130 4,401 5,024 5,300 Net Interest Income, Multi-Family $ 4,247 $ 5,734 $ 6,152 $ 7,031 $ 7,846

40See Glossary and End Notes in the Appendix. Reconciliation of Joint Venture Equity Investments Dollar amounts in thousands At September 30, 2021 Cash and cash equivalents $ 3,905 Operating real estate, net 261,178 Equity investments 10,290 Lease intangible, net (a) 7,975 Other assets 11,620 Total assets $ 294,968 Mortgages payable on operating real estate, net $ 200,720 Other liabilities 5,997 Total liabilities 206,717 Non-controlling interest in consolidated variable interest entities 4,626 Company's Net Equity Investment (b) $ 83,625 (a) Included in other assets in the Company's consolidated balance sheets. (b) Represents the Company's net equity investment in multi-family apartment communities.

Thank You From all of us at NYMT


