New York Mortgage Trust 2022 Second Quarter Financial Summary

2See Glossary and End Notes in the Appendix. This presentation contains forward-looking statements within the meaning of the safe harbor provisions of the Private Securities Litigation Reform Act of 1995. Forward-looking statements are based on our beliefs, assumptions and expectations of our future performance, taking into account all information currently available to us. These beliefs, assumptions and expectations are subject to risks and uncertainties and can change as a result of many possible events or factors, not all of which are known to us. If a change occurs, our business, financial condition, liquidity and results of operations may vary materially from those expressed or implied in our forward-looking statements. The following factors are examples of those that could cause actual results to vary from our forward-looking statements: changes in our business and investment strategy; changes in interest rates and the fair market value of our assets, including negative changes resulting in margin calls relating to the financing of our assets; changes in credit spreads; changes in the long-term credit ratings of the U.S., Fannie Mae, Freddie Mac, and Ginnie Mae; general volatility of the markets in which we invest; changes in prepayment rates on the loans we own or that underlie our investment securities; increased rates of default, delinquency or vacancy and/or decreased recovery rates on or at our assets; our ability to identify and acquire our targeted assets, including assets in our investment pipeline; changes in our relationships with our financing counterparties and our ability to borrow to finance our assets and the terms thereof; changes in our relationships with and/or the performance of our operating partners; our ability to predict and control costs; changes in laws, regulations or policies affecting our business, including actions that may be taken to contain or address the impact of the COVID-19 pandemic; our ability to make distributions to our stockholders in the future; our ability to maintain our qualification as a REIT for federal tax purposes; our ability to maintain our exemption from registration under the Investment Company Act of 1940, as amended; risks associated with investing in real estate assets, including changes in business conditions and the general economy, the availability of investment opportunities and the conditions in the market for Agency RMBS, non-Agency RMBS, ABS and CMBS securities, residential loans, structured multi- family investments and other mortgage-, residential housing- and credit-related assets; and the impact of COVID-19 on us, our operations and our personnel. These and other risks, uncertainties and factors, including the risk factors described in our most recent Annual Report on Form 10-K, as updated and supplemented from time to time, and our subsequent Quarterly Reports on Form 10-Q and other information that we file from time to time with the U.S. Securities and Exchange Commission (“SEC”) under the Securities Exchange Act of 1934, as amended (the “Exchange Act”), could cause our actual results to differ materially from those projected in any forward-looking statements we make. All forward-looking statements speak only as of the date on which they are made. New risks and uncertainties arise over time and it is not possible to predict those events or how they may affect us. Except as required by law, we are not obligated to, and do not intend to, update or revise any forward-looking statements, whether as a result of new information, future events or otherwise. This presentation may not contain all of the information that is important to you. As a result, the information in this presentation should be read together with the information included in our most recent Annual Report on Form 10-K, as updated and supplemented from time to time, and our subsequent Quarterly Reports on Form 10-Q and other information that we file under the Exchange Act. References to “the Company,” “NYMT,” “we,” “us,” or “our” refer to New York Mortgage Trust, Inc., together with its consolidated subsidiaries, unless we specifically state otherwise or the context indicates otherwise. See glossary of defined terms and detailed end notes for additional important disclosures included at the end of this presentation. Second quarter 2022 Financial Tables and related information can be viewed in the Company’s press release dated August 2, 2022 posted on the Company’s website at http://www.nymtrust.com under the “Investors — Events & Presentations” section. Forward Looking Statements

3 To Our Stockholders Management Update "Despite historical levels of volatility that challenged the markets in the second quarter, the Company was able to limit the decline in its undepreciated book value to 4.7%. The bid for duration remains thin as buyers seemed to wait out the market as spreads moved wider each month during the quarter. Our increasing allocation to BPL bridge loans over the past year and a half combined with our holding recourse leverage below 1x has enabled our balance sheet to demonstrate resiliency through a rapidly rising interest rate environment. Against conforming mortgage rates, which ended the second quarter just below 6%, housing fundamentals have exhibited continued strength after several months of historic price and rent growth, particularly in southern markets. However, the market is clearly undergoing a seismic opportunity shift ushering in a new paradigm. The premium priced loan markets that we saw earlier in the year, largely due to remarkably efficient financing, are no longer the norm. Today’s inefficient securitization financing markets combined with markedly reduced loan demand will provide new opportunities to take advantage of wider spreads. We have patiently positioned the Company’s balance sheet for high asset rotation and largely avoided vertical integration asset strategies that depend on consistent financing availability. Because of this, we are able to focus on secondary market investments without concern for the uncertainty of managing operating costs associated with an origination business. We believe there is an extraordinary opportunity for us in the current environment to create long- term value for our stockholders and we are energized to unlock that value behind our highly experienced asset management team." — Jason Serrano, Chief Executive Officer and President

Company Overview Financial Summary Market & Strategy Update Quarterly Comparative Financial Information Appendix Non-GAAP Financial Measures Glossary End Notes Capital Allocation Reconciliation of Single-Family Portfolio Net Interest Income Reconciliation of Joint Venture Equity Investments Table of Contents

Company Overview
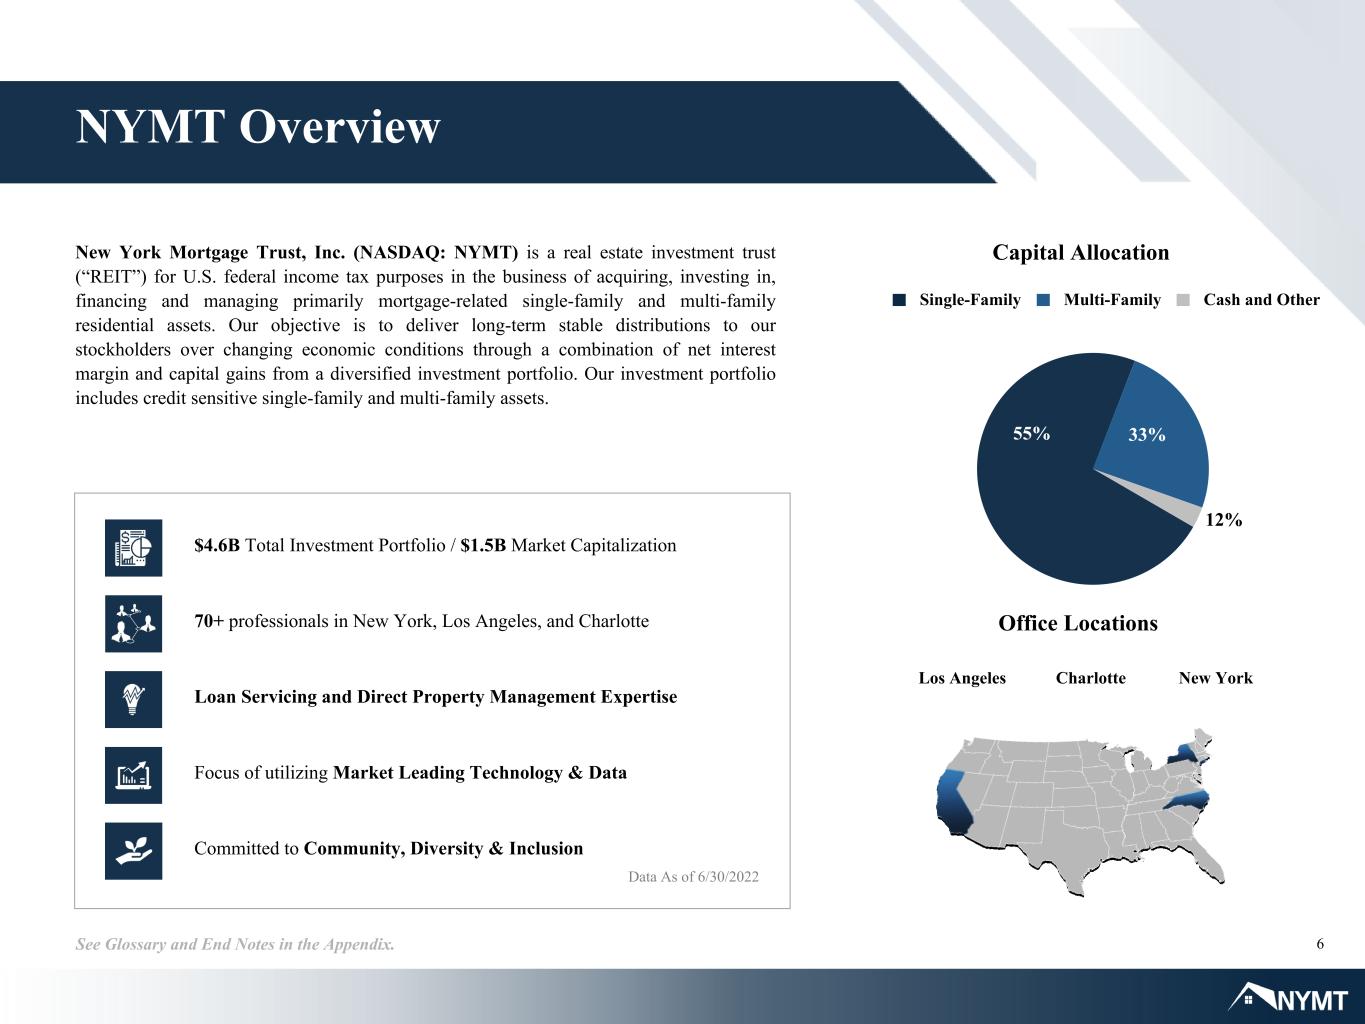
6See Glossary and End Notes in the Appendix. New York Mortgage Trust, Inc. (NASDAQ: NYMT) is a real estate investment trust (“REIT”) for U.S. federal income tax purposes in the business of acquiring, investing in, financing and managing primarily mortgage-related single-family and multi-family residential assets. Our objective is to deliver long-term stable distributions to our stockholders over changing economic conditions through a combination of net interest margin and capital gains from a diversified investment portfolio. Our investment portfolio includes credit sensitive single-family and multi-family assets. Data As of 6/30/2022 70+ professionals in New York, Los Angeles, and Charlotte Focus of utilizing Market Leading Technology & Data Committed to Community, Diversity & Inclusion Loan Servicing and Direct Property Management Expertise $4.6B Total Investment Portfolio / $1.5B Market Capitalization NYMT Overview Charlotte New YorkLos Angeles Office Locations Capital Allocation Single-Family Multi-Family Cash and Other 55% 33% 12%

7 Key Developments See Glossary and End Notes in the Appendix. *Represents a non-GAAP financial measure. See Non-GAAP Financial Measures in the Appendix. Financial Performance ◦ Loss per share of $(0.22), Comprehensive loss per share of $(0.22) ◦ Undepreciated loss per share of $(0.13)* ◦ Book value per share of $4.06 ◦ Undepreciated book value per share of $4.24* (-4.7% change QoQ) ◦ (4.6)% Quarterly Economic Return ◦ (2.5)% Quarterly Economic Return on Undepreciated Book Value* Stockholder Value ◦ Declared second quarter common stock dividend of $0.10 per share ◦ Repurchased 2.8 million shares of common stock at average repurchase price of $2.69 per share through June 30, 2022 ◦ Subsequent to quarter-end, repurchased an additional 0.9 million shares of common stock at average repurchase price of $2.73 per share ◦ Common stock dividend yield of 14.5% (share price as of 6/30/2022) Liquidity / Financing ◦ Acquired $890 million in portfolio investments ▪ $833 million in single-family investments ▪ $57 million in multi-family investments ◦ Continue to consider opportunities to monetize appreciated value in joint venture equity portfolio with a property under purchase and sale agreement, expected to close in September ◦ Obtained an additional $876 million of financing (77% of which is non-MTM) for residential loans through recourse and non-recourse repurchase agreements with new and existing counterparties ◦ Company Recourse Leverage Ratio of 0.7x ◦ Portfolio Recourse Leverage Ratio of 0.6x ◦ $383 million of available cash equal to 41% of Company's mark-to-market debt Investing Activity
Financial Summary Second Quarter 2022

9See Glossary and End Notes in the Appendix. *Represents a non-GAAP financial measure. See Non-GAAP Financial Measures in the Appendix. Financial Snapshot Earnings & Book Value Portfolio Net Interest MarginLoss Per Share Undepreciated Loss Per Share* $(0.13) Investment Portfolio Yield on Avg. Interest Earning AssetsTotal Portfolio Size Total Investment Portfolio $4.6B Financing Dividend Per Share Economic Return on Undepreciated Book Value* Avg. Portfolio Financing CostPortfolio Recourse Leverage Ratio $0.1B $0.7B $3.8B Investment Allocation SF Credit 59% MF Credit 25% 0.3x 3 Months Ended (2.5)% Q2 Dividend $0.10 Comprehensive $(0.22) Basic $(0.22) SF 83% MF 15% Other 2% Company Recourse Leverage Ratio 1.5x 0.8x 0.5x 0.4x 0.3x SF MF Other 2Q 2021 3Q 2021 4Q 2021 1Q 2022 2Q 2022 2Q 2021 3Q 2021 4Q 2021 1Q 2022 2Q 2022 2Q 2021 3Q 2021 4Q 2021 1Q 2022 2Q 2022 2Q 2021 3Q 2021 4Q 2021 1Q 2022 2Q 2022 0.1x 0.1x 0.2x 0.4x 0.6x 0.7x 0.3x 2Q 2021 3Q 2021 4Q 2021 1Q 2022 2Q 2022 3.48% 2.97% 3.25% 3.63% 3.87% 0.3x 0.4x 0.5x Undepreciated Book Value* $4.24 6.69% 6.31% 6.39% 6.57% 6.80% 3.21%3.34% 3.14% 2.93%2.94%

10See Glossary and End Notes in the Appendix. *Represents a non-GAAP financial measure. See Non-GAAP Financial Measures in the Appendix. Financial Results Second Quarter Profit & Loss Dollar amounts in millions, except per share data Net Interest Income $ 26.1 Non-Interest Loss (20.2) Total Net Interest Income & Non-Interest Loss 5.9 General & Administrative Expenses (13.2) Expenses Related to Real Estate (70.8) Portfolio Operating Expenses (12.7) Net Loss Attributable to Company (71.9) Preferred Stock Dividends (10.5) Net Loss Attributable to Common Stockholders $ (82.4) Add back: Depreciation expense on operating real estate 10.3 Add back: Amortization of lease intangibles related to operating real estate 22.9 Undepreciated Loss* $ (49.2) $4.58 Included in Non-Interest Loss is $5.7 million of income related to Preferred Return on Mezzanine Lending investments that would be included in net interest income and portfolio net interest margin and would have contributed 28 bps had the investments qualified for loan accounting treatment under GAAP. Non-Interest Income (Loss): in millions Realized Gains $ 2.4 Unrealized Losses (67.7) Preferred Return on Mezzanine Lending 5.7 Income from Real Estate 35.9 Other 3.5 Total Non-Interest Loss $ (20.2) $ (0.22) Basic loss per common share 0.03 0.06 $ (0.13) Undepreciated loss per common share* Net Interest Income: in millions Portfolio Net Interest Income* $ 41.5 Interest Expense: Corporate debt (2.2) Interest Expense: Mortgages payable on real estate (13.2) Total Net Interest Income $ 26.1

Market & Strategy Update

12See Glossary and End Notes in the Appendix. Strategy Update A Cautious Approach to Growth Despite continued strong fundamentals in U.S. housing underpinned by a multi-decade low of U.S. units available for sale, the market is undergoing a seismic shift: Flexibility afforded with a low-cost, high-turnover strategy: • With a strategic focus of optimizing portfolio flexibility, we avoided high-cost entanglements of operating businesses and significantly reduced portfolio duration. Capital management objectives: • Prudent capital management to preserve book value is an essential element of our strategy. In this current environment, we favor maintaining elevated levels of cash on balance sheet with low leverage. Timing: • We believe utilizing a patient approach will allow us to seize on significant long-term value at deeper market discounts than offered today. Execution Risk: • Key to unlocking value will be the ability to utilize strong asset management capabilities required to price and manage acquisitions. 2021 - Q1 '22 Q2 '22 - Q4 '22 2023 NYMT Market Outlook NYMT Approach Par + / Efficient Financing Discount / Inefficient Financing Selective Deep Discount / No Financing Required Cautious Aggressive
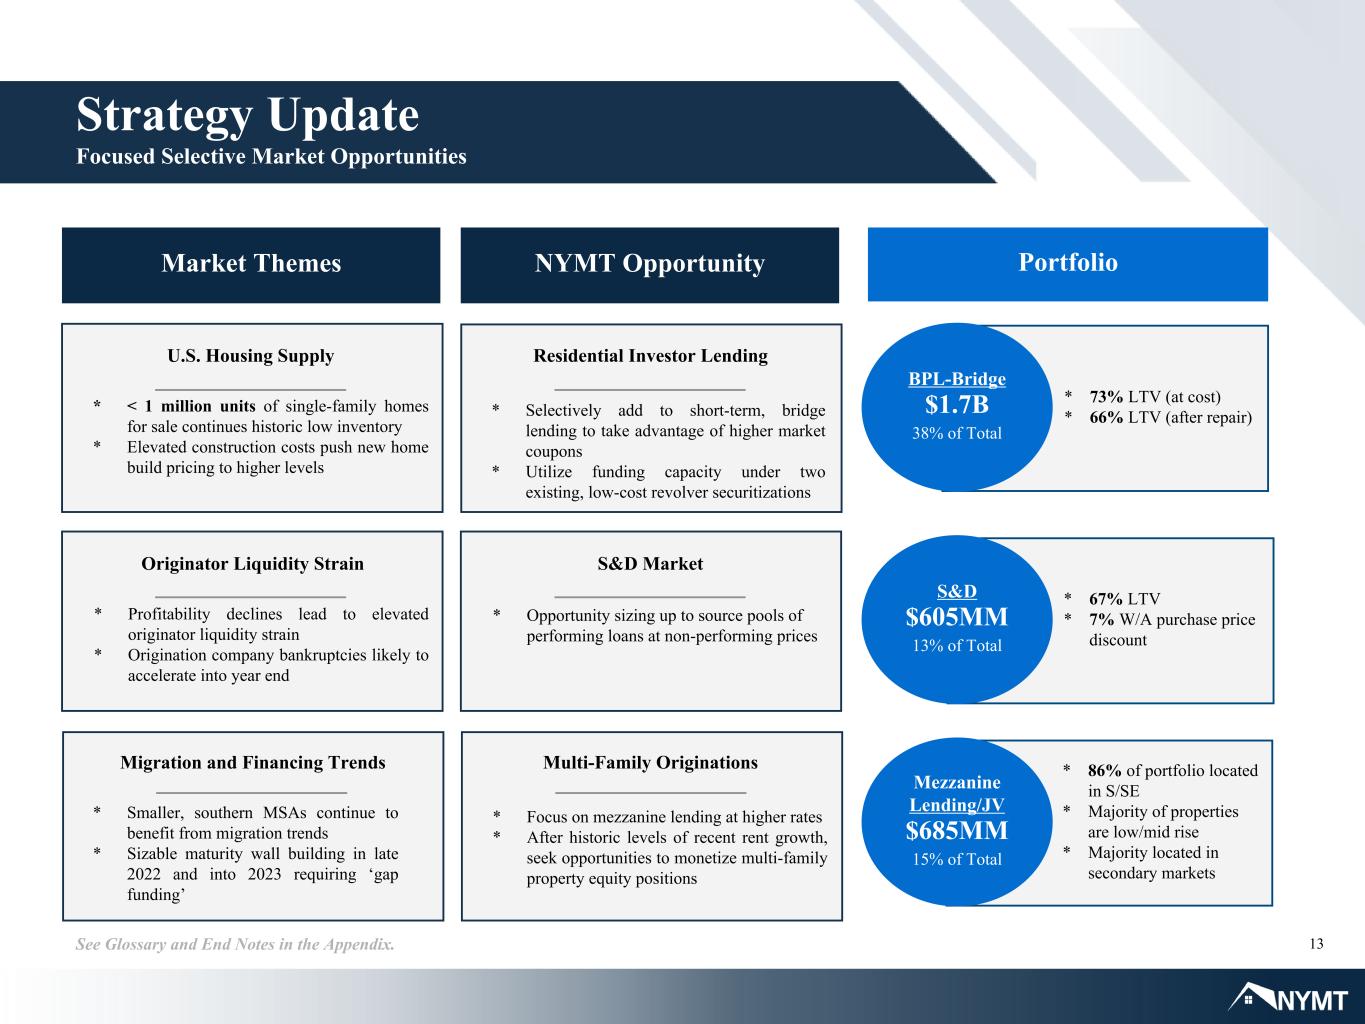
13See Glossary and End Notes in the Appendix. Strategy Update Focused Selective Market Opportunities Market Themes NYMT Opportunity Portfolio U.S. Housing Supply * < 1 million units of single-family homes for sale continues historic low inventory * Elevated construction costs push new home build pricing to higher levels Originator Liquidity Strain * Profitability declines lead to elevated originator liquidity strain * Origination company bankruptcies likely to accelerate into year end Migration and Financing Trends * Smaller, southern MSAs continue to benefit from migration trends * Sizable maturity wall building in late 2022 and into 2023 requiring ‘gap funding’ Residential Investor Lending * Selectively add to short-term, bridge lending to take advantage of higher market coupons * Utilize funding capacity under two existing, low-cost revolver securitizations S&D Market * Opportunity sizing up to source pools of performing loans at non-performing prices Multi-Family Originations * Focus on mezzanine lending at higher rates * After historic levels of recent rent growth, seek opportunities to monetize multi-family property equity positions * 73% LTV (at cost) * 66% LTV (after repair) BPL-Bridge $1.7B 38% of Total * 67% LTV * 7% W/A purchase price discount S&D $605MM 13% of Total * 86% of portfolio located in S/SE * Majority of properties are low/mid rise * Majority located in secondary markets Mezzanine Lending/JV $685MM 15% of Total

14See Glossary and End Notes in the Appendix. Strategy For Sustainable Earnings Growth NYMT Investment Strategy Focus NYMT seeks investment opportunities in markets where the Company finds a competitive advantage due to operational barriers to entry. Safety NYMT focuses on markets where compelling risk- adjusted asset returns are available through an unlevered holding strategy or through sustainable non-mark-to- market financing arrangements. Execution NYMT executes a low-levered credit strategy within the multi-family and single-family sectors by building portfolios through proprietary flow and bulk purchases where mid-teens returns are achievable on capital deployed. Portfolio Acquisitions (Dollar amounts in millions) Performing LoansBPL - Bridge/ Rental MF Loans/JV $165 $273 $473 $715 $682 $93 $98 $133 $68 $91 $96 $189 $157 $57 $38 $56 $45 $60 Q2 2021 Q3 2021 Q4 2021 Q1 2022 Q2 2022 Securities, SFR & Other $19 $13 $290 $505 $985 $851 $890 Investment Activity Q2 2021 Q3 2021 Q4 2021 Q1 2022 Q2 2022 Acquisitions $ 289.9 $ 504.6 $ 851.0 $ 984.6 $ 890.2 Sales (15.1) (182.6) (193.8) (24.7) — Prepayments and Redemptions (309.1) (306.6) (332.5) (315.1) (304.4) Net Investment Activity $ (34.3) $ 15.4 $ 324.7 $ 644.8 $ 585.8
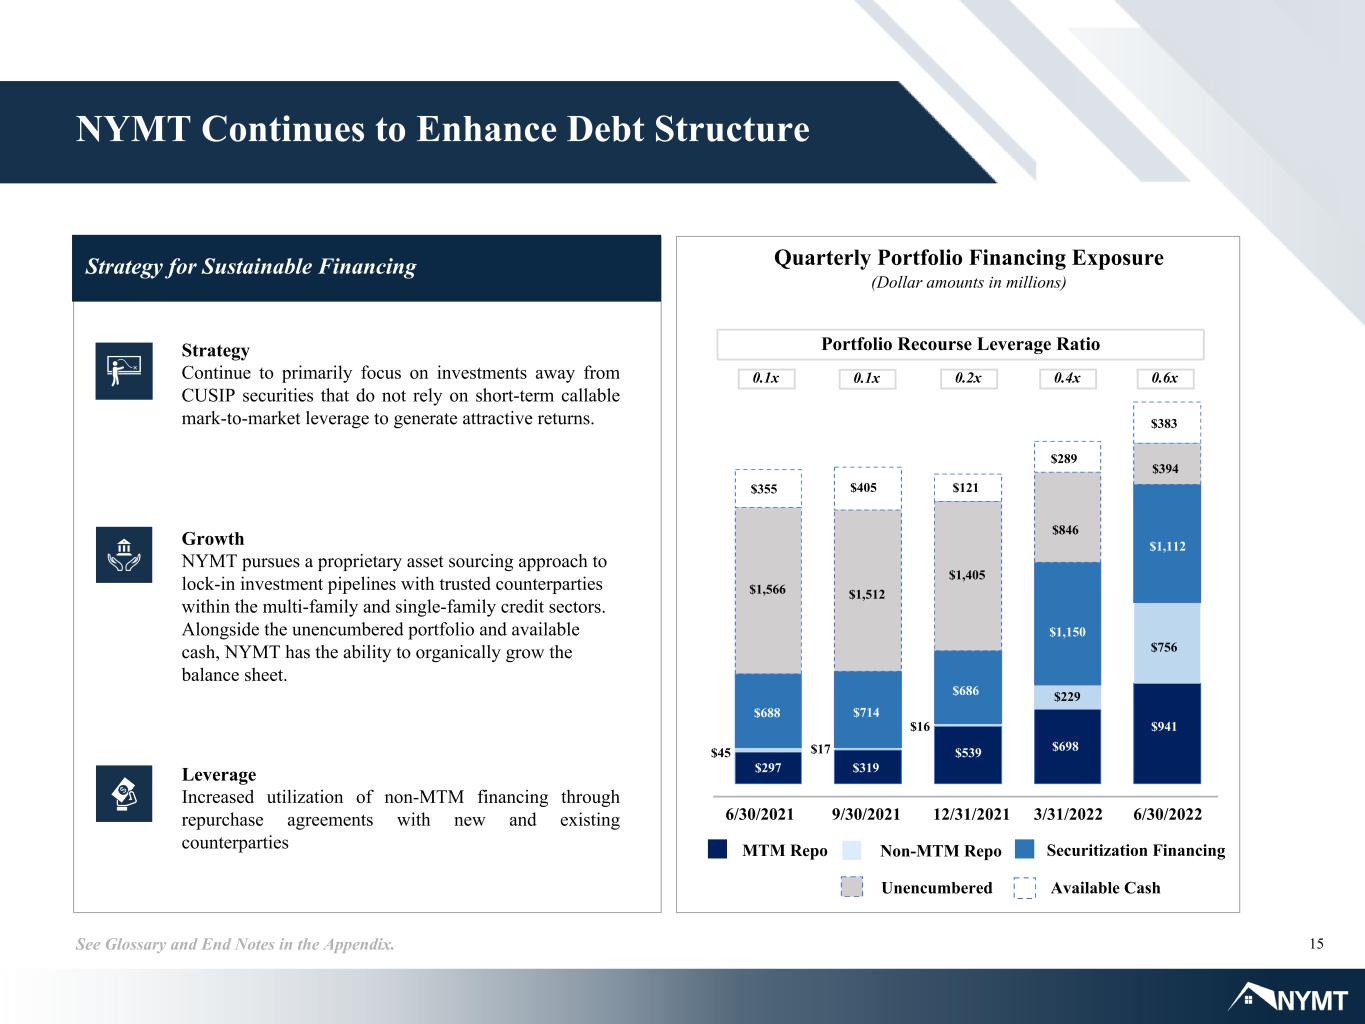
15See Glossary and End Notes in the Appendix. Strategy for Sustainable Financing NYMT Continues to Enhance Debt Structure Strategy Continue to primarily focus on investments away from CUSIP securities that do not rely on short-term callable mark-to-market leverage to generate attractive returns. Growth NYMT pursues a proprietary asset sourcing approach to lock-in investment pipelines with trusted counterparties within the multi-family and single-family credit sectors. Alongside the unencumbered portfolio and available cash, NYMT has the ability to organically grow the balance sheet. Leverage Increased utilization of non-MTM financing through repurchase agreements with new and existing counterparties Quarterly Portfolio Financing Exposure (Dollar amounts in millions) MTM Repo Securitization FinancingNon-MTM Repo Unencumbered Available Cash 6/30/2021 9/30/2021 12/31/2021 3/31/2022 6/30/2022 Portfolio Recourse Leverage Ratio 0.1x 0.2x 0.6x0.4x0.1x $756 $45 $16 $394 $383 $1,566 $1,512 $846 $289 $1,405 $355 $405 $121 $1,150 $688 $714 $686 $698 $297 $319 $539 $941 $229 $1,112 $17
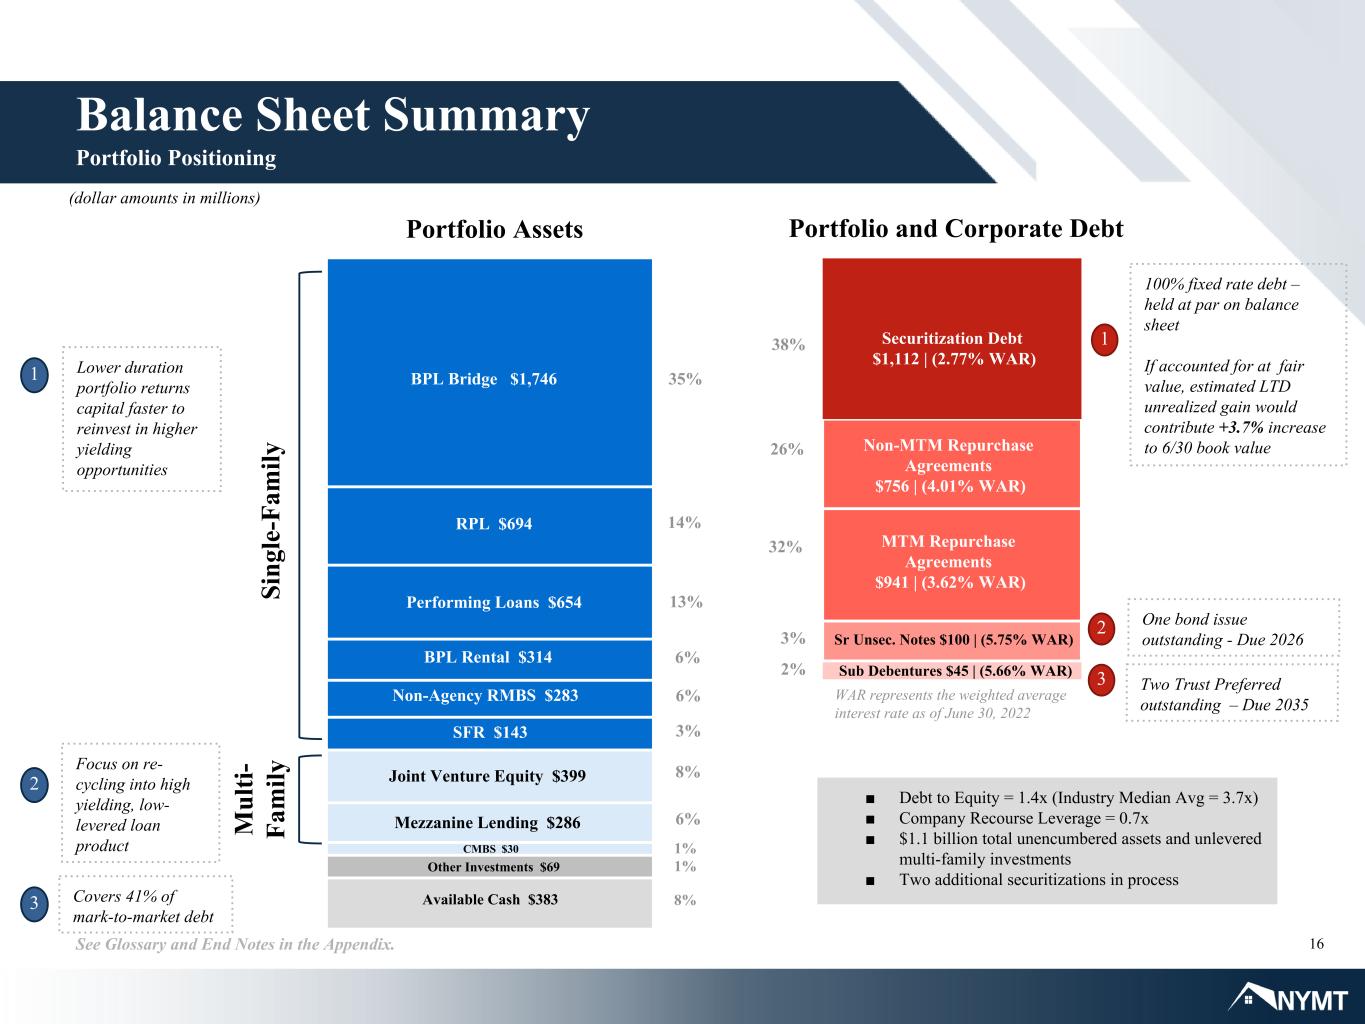
16See Glossary and End Notes in the Appendix. BPL Bridge $1,746 Joint Venture Equity $399 RPL $694 Performing Loans $654 CMBS $30 35% Non-Agency RMBS $283 Mezzanine Lending $286 Si ng le -F am ily BPL Rental $314 SFR $143 Portfolio Assets Portfolio and Corporate Debt M ul ti- Fa m ily (dollar amounts in millions) Balance Sheet Summary Portfolio Positioning Other Investments $69 Available Cash $383 14% 13% 6% 6% 3% 8% 6% 1% 1% 8% 1 Lower duration portfolio returns capital faster to reinvest in higher yielding opportunities Focus on re- cycling into high yielding, low- levered loan product Covers 41% of mark-to-market debt 100% fixed rate debt – held at par on balance sheet If accounted for at fair value, estimated LTD unrealized gain would contribute +3.7% increase to 6/30 book value 38% Securitization Debt $1,112 | (2.77% WAR) 32% Sr Unsec. Notes $100 | (5.75% WAR)3% 2% Sub Debentures $45 | (5.66% WAR) 2 One bond issue outstanding - Due 2026 Two Trust Preferred outstanding – Due 2035 Non-MTM Repurchase Agreements $756 | (4.01% WAR) MTM Repurchase Agreements $941 | (3.62% WAR) 26% ■ Debt to Equity = 1.4x (Industry Median Avg = 3.7x) ■ Company Recourse Leverage = 0.7x ■ $1.1 billion total unencumbered assets and unlevered multi-family investments ■ Two additional securitizations in process 3 1 2 3 WAR represents the weighted average interest rate as of June 30, 2022

17See Glossary and End Notes in the Appendix. Single-Family Portfolio Overview Core Strategy Sub-Sector Asset Value Net Capital Portfolio Recourse Leverage Ratio Total Portfolio Leverage Ratio Loan Key Characteristics Current Environment % $ % $ Avg. FICO Avg. LTV Avg. Coupon BPL - Bridge • Bridge loans • Bridge w/Rehab loans 46% $1,746 50% $569 0.8x 2.2x • Short duration bridge loan market repricing to higher coupons was delayed in Q2 versus other loan-sub- sectors. New origination coupons are approximately 2% higher than previous quarter, which we believe provides an attractive risk-adjusted return under the current volatile market environment. BPL - Rental • DSCR 8% $314 4% $44 6.2x 6.2x • DSCR originators are trying to adjust new origination pipeline coupons higher in line with recent rate moves, albeit at lower volumes. • Securitization financing of pre-Q1 2022 production remains expensive. Performing Loan • S&D • Other 17% $654 12% $138 3.2x 3.8x • Originators will likely take more drastic liquidity measures against slowing volumes. • S&D supply expected to increase as originators seek to relieve warehouse lines of aged collateral. RPL • Seasoned re- performing mortgage loans • Non-performing mortgage loans 18% $694 7% $83 0.3x 7.7x • RPL loans are starting to trade at deeper discount to par given investor demand for higher yields. • Cost of financing across repo and securitizations remains elevated. NYMT had previously securitized 96% of the RPL portfolio. Securities • Non-Agency (includes Consolidated SLST - $209MM) 7% $283 15% $171 0.7x 0.7x • Securitization market demand continues to have thin activity and wide yield, with buyers such as money managers preserving liquidity for potential redemptions. Dollar amounts in millions Total Investment Portfolio 83% Total Capital 55% Dollar amounts in millions 733 850 748 850 726 850 66% 70% 66% 3.87% 5.04% 8.41% 62% 4.78% 630 850 Target ROE 12-15%
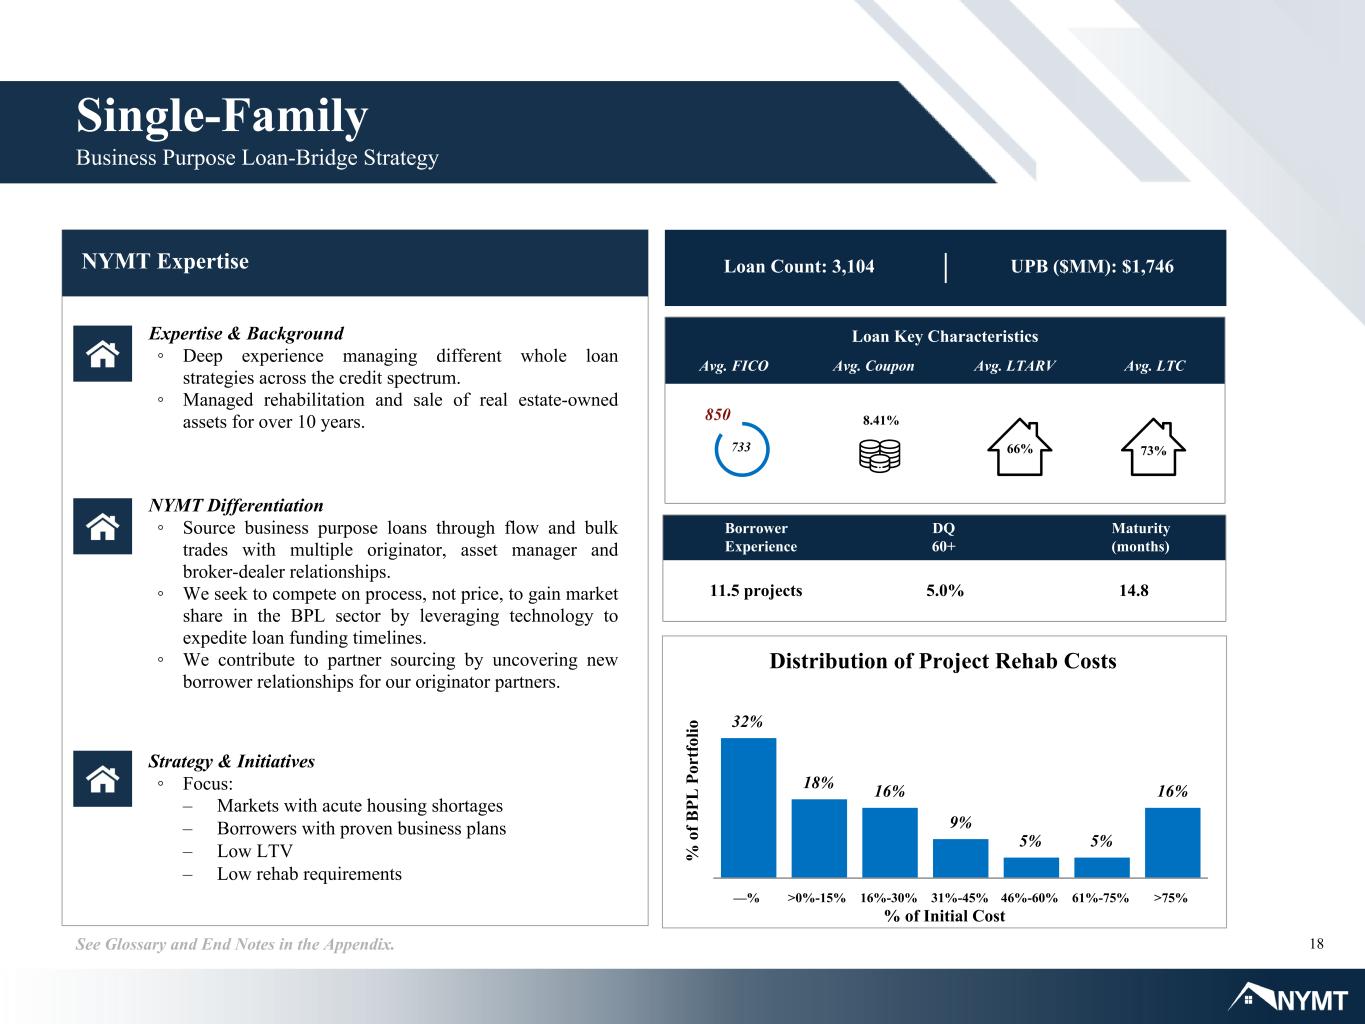
18See Glossary and End Notes in the Appendix. Single-Family Business Purpose Loan-Bridge Strategy NYMT Expertise Expertise & Background ◦ Deep experience managing different whole loan strategies across the credit spectrum. ◦ Managed rehabilitation and sale of real estate-owned assets for over 10 years. NYMT Differentiation ◦ Source business purpose loans through flow and bulk trades with multiple originator, asset manager and broker-dealer relationships. ◦ We seek to compete on process, not price, to gain market share in the BPL sector by leveraging technology to expedite loan funding timelines. ◦ We contribute to partner sourcing by uncovering new borrower relationships for our originator partners. Strategy & Initiatives ◦ Focus: – Markets with acute housing shortages – Borrowers with proven business plans – Low LTV – Low rehab requirements Loan Key Characteristics Avg. FICO Avg. Coupon Avg. LTARV Avg. LTC Loan Count: 3,104 UPB ($MM): $1,746 Borrower Experience DQ 60+ Maturity (months) 11.5 projects 5.0% 14.8 733 850 8.41% % o f B PL P or tf ol io Distribution of Project Rehab Costs 32% 18% 16% 9% 5% 5% 16% —% >0%-15% 16%-30% 31%-45% 46%-60% 61%-75% >75% 73%66% % of Initial Cost

19See Glossary and End Notes in the Appendix. Multi-Family Portfolio Overview Core Strategy Sub-Sector Asset Value Net Capital Loan Key Characteristics Current Environment % $ % $ Avg. DSCR Avg. LTV Avg. Coupon/ Target IRR Mezzanine Lending Preferred equity and mezzanine direct originations 40% $286 40% $279 • Sentiment shifted from 2-3 year asset bridge financing to longer, fixed 7 and 10 year financing. • With increased sponsor utilization of senior fixed rate loans at lower LTVs,, mezzanine lending opportunities (i.e. "Gap Funding") are expected to increase. Joint Venture Equity Equity ownership of an individual multi- family property alongside an operating partner (includes combined mezzanine lending and common equity JV transaction totaling $143MM ) 56% $399 58% $399 • Despite credit market financing turbulence, we forecast ample availability of senior fixed rate financing, as Agency lending is far from reaching multi-family origination caps and continues to stabilize property valuation. Dollar amounts in millions Total Investment Portfolio 15% Total Capital 33% 2.28x 1.56x 83% 78% 13-17% 11.84% Target ROE 12-17%
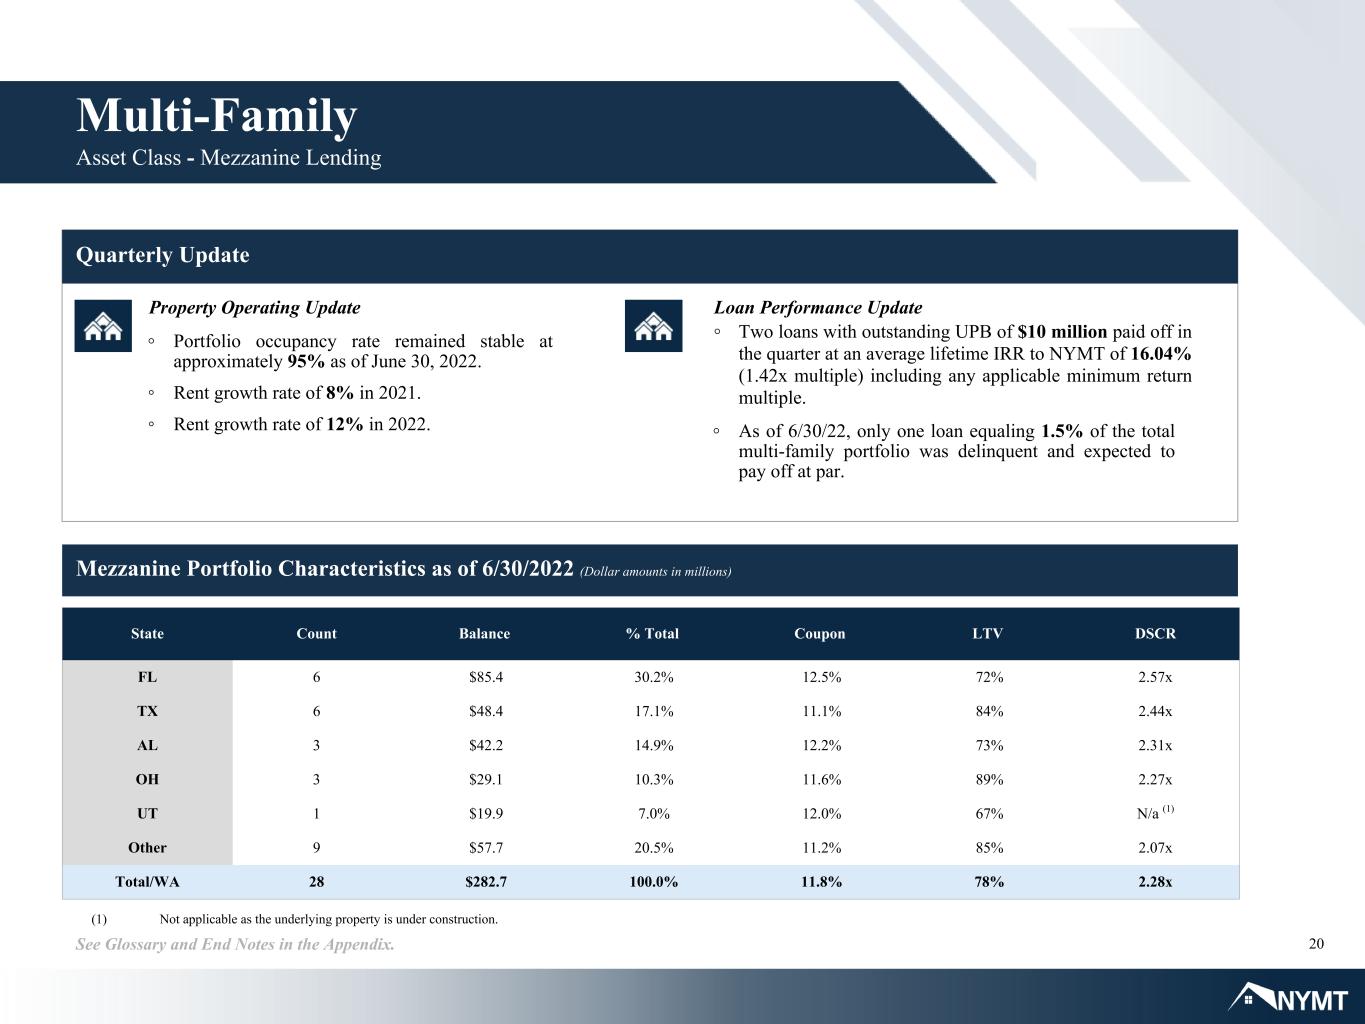
20See Glossary and End Notes in the Appendix. Quarterly Update Loan Performance Update ◦ Two loans with outstanding UPB of $10 million paid off in the quarter at an average lifetime IRR to NYMT of 16.04% (1.42x multiple) including any applicable minimum return multiple. ◦ As of 6/30/22, only one loan equaling 1.5% of the total multi-family portfolio was delinquent and expected to pay off at par. Property Operating Update ◦ Portfolio occupancy rate remained stable at approximately 95% as of June 30, 2022. ◦ Rent growth rate of 8% in 2021. ◦ Rent growth rate of 12% in 2022. Mezzanine Portfolio Characteristics as of 6/30/2022 (Dollar amounts in millions) State Count Balance % Total Coupon LTV DSCR FL 6 $85.4 30.2% 12.5% 72% 2.57x TX 6 $48.4 17.1% 11.1% 84% 2.44x AL 3 $42.2 14.9% 12.2% 73% 2.31x OH 3 $29.1 10.3% 11.6% 89% 2.27x UT 1 $19.9 7.0% 12.0% 67% N/a (1) Other 9 $57.7 20.5% 11.2% 85% 2.07x Total/WA 28 $282.7 100.0% 11.8% 78% 2.28x Multi-Family Asset Class - Mezzanine Lending (1) Not applicable as the underlying property is under construction.
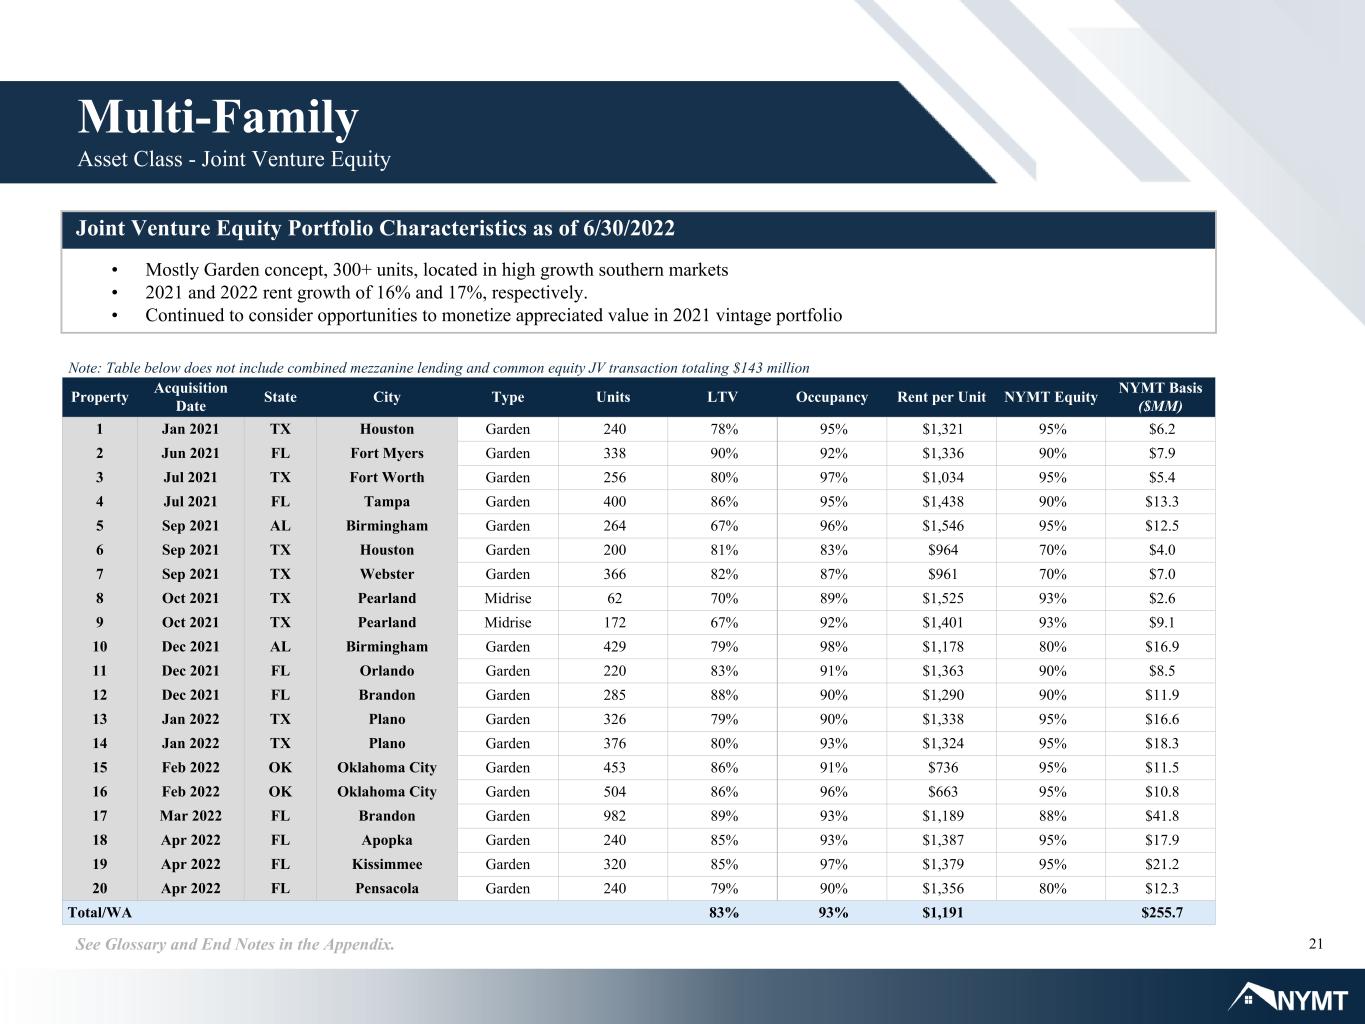
21See Glossary and End Notes in the Appendix. Joint Venture Equity Portfolio Characteristics as of 6/30/2022 Property Acquisition Date State City Type Units LTV Occupancy Rent per Unit NYMT Equity NYMT Basis ($MM) 1 Jan 2021 TX Houston Garden 240 78% 95% $1,321 95% $6.2 2 Jun 2021 FL Fort Myers Garden 338 90% 92% $1,336 90% $7.9 3 Jul 2021 TX Fort Worth Garden 256 80% 97% $1,034 95% $5.4 4 Jul 2021 FL Tampa Garden 400 86% 95% $1,438 90% $13.3 5 Sep 2021 AL Birmingham Garden 264 67% 96% $1,546 95% $12.5 6 Sep 2021 TX Houston Garden 200 81% 83% $964 70% $4.0 7 Sep 2021 TX Webster Garden 366 82% 87% $961 70% $7.0 8 Oct 2021 TX Pearland Midrise 62 70% 89% $1,525 93% $2.6 9 Oct 2021 TX Pearland Midrise 172 67% 92% $1,401 93% $9.1 10 Dec 2021 AL Birmingham Garden 429 79% 98% $1,178 80% $16.9 11 Dec 2021 FL Orlando Garden 220 83% 91% $1,363 90% $8.5 12 Dec 2021 FL Brandon Garden 285 88% 90% $1,290 90% $11.9 13 Jan 2022 TX Plano Garden 326 79% 90% $1,338 95% $16.6 14 Jan 2022 TX Plano Garden 376 80% 93% $1,324 95% $18.3 15 Feb 2022 OK Oklahoma City Garden 453 86% 91% $736 95% $11.5 16 Feb 2022 OK Oklahoma City Garden 504 86% 96% $663 95% $10.8 17 Mar 2022 FL Brandon Garden 982 89% 93% $1,189 88% $41.8 18 Apr 2022 FL Apopka Garden 240 85% 93% $1,387 95% $17.9 19 Apr 2022 FL Kissimmee Garden 320 85% 97% $1,379 95% $21.2 20 Apr 2022 FL Pensacola Garden 240 79% 90% $1,356 80% $12.3 Total/WA 83% 93% $1,191 $255.7 Multi-Family Asset Class - Joint Venture Equity • Mostly Garden concept, 300+ units, located in high growth southern markets • 2021 and 2022 rent growth of 16% and 17%, respectively. • Continued to consider opportunities to monetize appreciated value in 2021 vintage portfolio Note: Table below does not include combined mezzanine lending and common equity JV transaction totaling $143 million
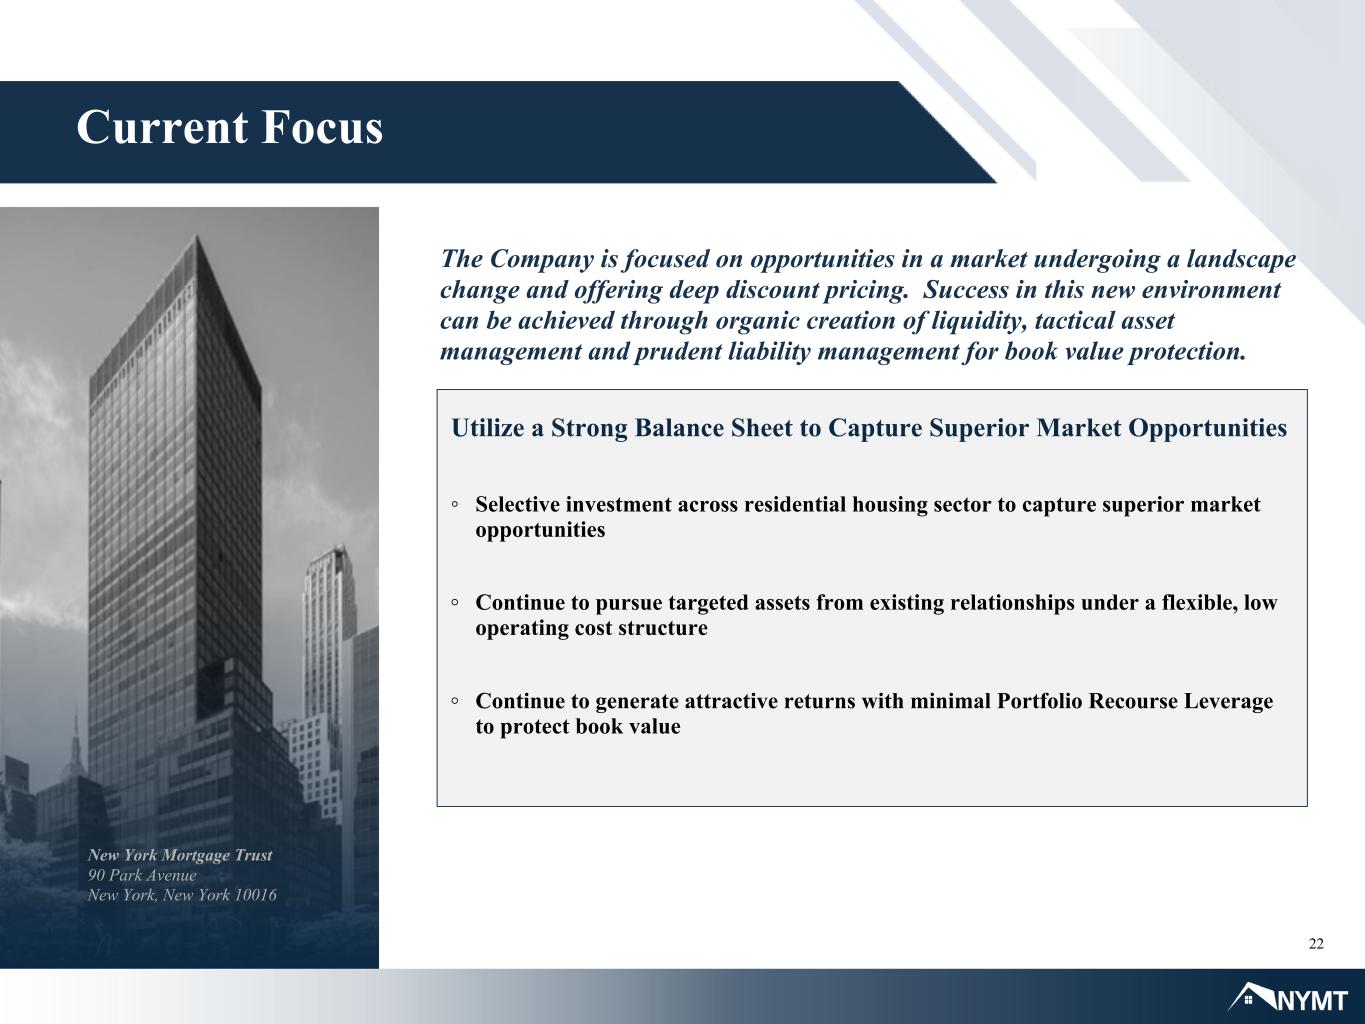
22 Current Focus New York Mortgage Trust 90 Park Avenue New York, New York 10016 Utilize a Strong Balance Sheet to Capture Superior Market Opportunities ◦ Selective investment across residential housing sector to capture superior market opportunities ◦ Continue to pursue targeted assets from existing relationships under a flexible, low operating cost structure ◦ Continue to generate attractive returns with minimal Portfolio Recourse Leverage to protect book value The Company is focused on opportunities in a market undergoing a landscape change and offering deep discount pricing. Success in this new environment can be achieved through organic creation of liquidity, tactical asset management and prudent liability management for book value protection.

Quarterly Comparative Financial Information
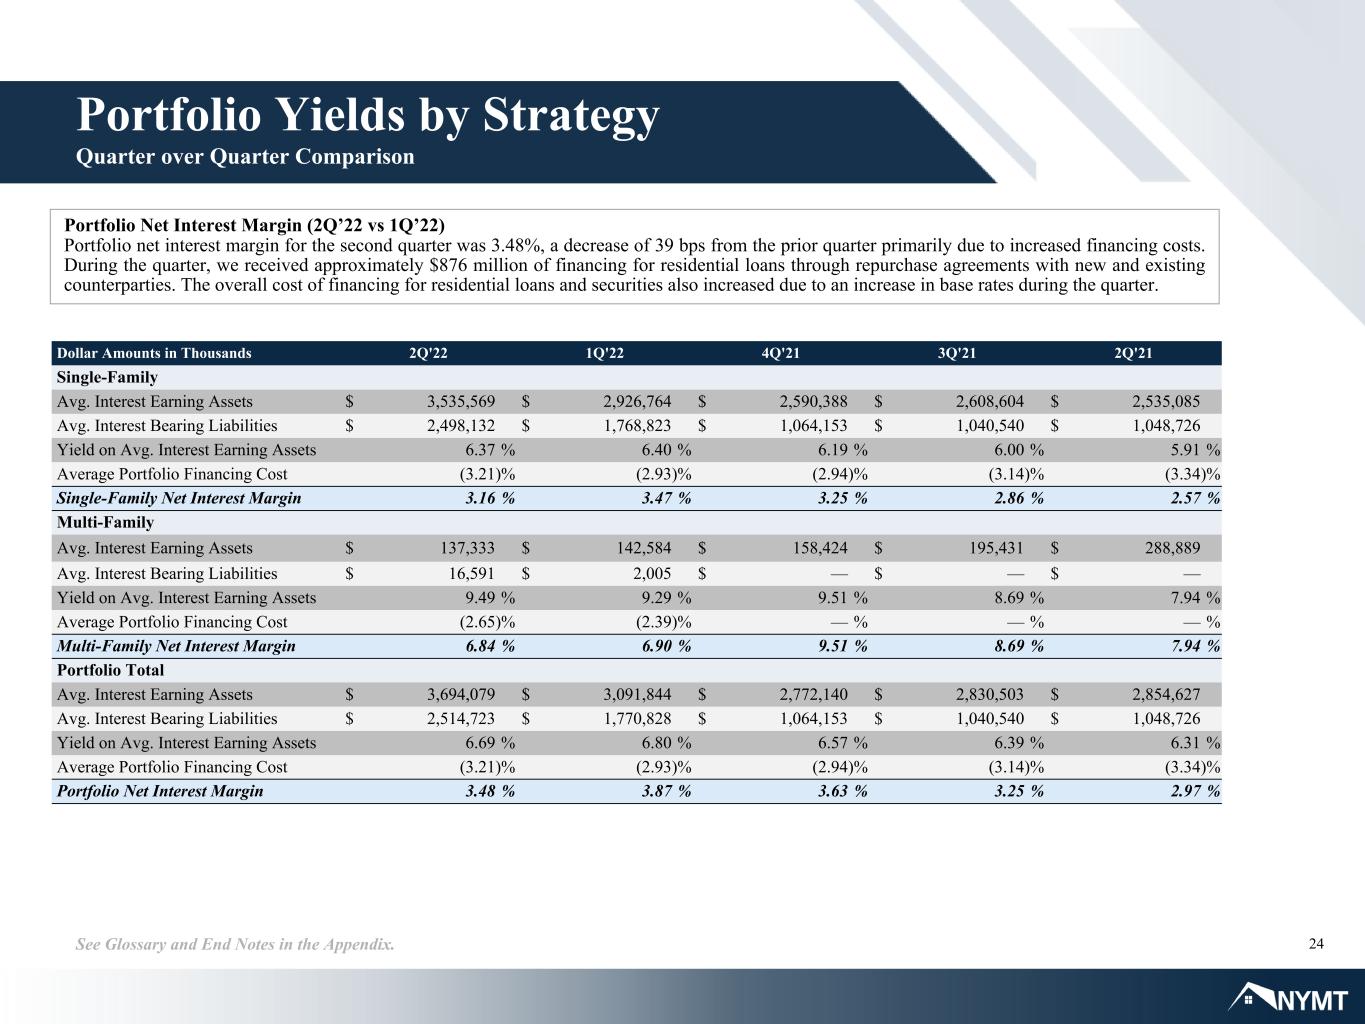
24See Glossary and End Notes in the Appendix. Portfolio Yields by Strategy Quarter over Quarter Comparison Portfolio Net Interest Margin (2Q’22 vs 1Q’22) Portfolio net interest margin for the second quarter was 3.48%, a decrease of 39 bps from the prior quarter primarily due to increased financing costs. During the quarter, we received approximately $876 million of financing for residential loans through repurchase agreements with new and existing counterparties. The overall cost of financing for residential loans and securities also increased due to an increase in base rates during the quarter. Dollar Amounts in Thousands 2Q'22 1Q'22 4Q'21 3Q'21 2Q'21 Single-Family Avg. Interest Earning Assets $ 3,535,569 $ 2,926,764 $ 2,590,388 $ 2,608,604 $ 2,535,085 Avg. Interest Bearing Liabilities $ 2,498,132 $ 1,768,823 $ 1,064,153 $ 1,040,540 $ 1,048,726 Yield on Avg. Interest Earning Assets 6.37 % 6.40 % 6.19 % 6.00 % 5.91 % Average Portfolio Financing Cost (3.21) % (2.93) % (2.94) % (3.14) % (3.34) % Single-Family Net Interest Margin 3.16 % 3.47 % 3.25 % 2.86 % 2.57 % Multi-Family Avg. Interest Earning Assets $ 137,333 $ 142,584 $ 158,424 $ 195,431 $ 288,889 Avg. Interest Bearing Liabilities $ 16,591 $ 2,005 $ — $ — $ — Yield on Avg. Interest Earning Assets 9.49 % 9.29 % 9.51 % 8.69 % 7.94 % Average Portfolio Financing Cost (2.65) % (2.39) % — % — % — % Multi-Family Net Interest Margin 6.84 % 6.90 % 9.51 % 8.69 % 7.94 % Portfolio Total Avg. Interest Earning Assets $ 3,694,079 $ 3,091,844 $ 2,772,140 $ 2,830,503 $ 2,854,627 Avg. Interest Bearing Liabilities $ 2,514,723 $ 1,770,828 $ 1,064,153 $ 1,040,540 $ 1,048,726 Yield on Avg. Interest Earning Assets 6.69 % 6.80 % 6.57 % 6.39 % 6.31 % Average Portfolio Financing Cost (3.21) % (2.93) % (2.94) % (3.14) % (3.34) % Portfolio Net Interest Margin 3.48 % 3.87 % 3.63 % 3.25 % 2.97 %

25See Glossary and End Notes in the Appendix. *Represents a non-GAAP financial measure. See Non-GAAP Financial Measures in the Appendix. Portfolio Net Interest Income (2Q’22 vs 1Q’22) Portfolio net interest income increased in the second quarter as compared to the previous quarter, primarily due to our continued investment in higher- yielding business purpose loans. The increase in single-family portfolio net interest income was partially offset by an increase in financing costs during the quarter as a result of additional borrowings to fund the purchase of residential loans as well as an increase in base interest rates. Total net interest income includes interest expense related to our subordinated debentures, convertible notes, senior unsecured notes and mortgages payable on real estate. Interest expense related to mortgages payable on real estate increased by $6.0 million from the previous quarter as a result of the full quarter impact of multi-family joint venture investments consolidated in the previous quarter as well as additional multi-family joint venture investments entered into and consolidated in the current quarter. Portfolio Interest Income & Portfolio Interest Expense Breakout by Investment Category Portfolio Net Interest Income Quarter over Quarter Comparison Dollar Amounts in Thousands 2Q'22 1Q'22 4Q'21 3Q'21 2Q'21 Single-Family Portfolio Interest Income* $ 56,260 $ 46,823 $ 40,073 $ 39,144 $ 37,455 Portfolio Interest Expense* (20,264) (12,975) (7,832) (8,163) (8,747) Single-Family Portfolio Net Interest Income* $ 35,996 $ 33,848 $ 32,241 $ 30,981 $ 28,708 Multi-Family Portfolio Interest Income* $ 3,258 $ 3,312 $ 3,767 $ 4,247 $ 5,734 Portfolio Interest Expense* (111) (12) — — — Multi-Family Portfolio Net Interest Income* $ 3,147 $ 3,300 $ 3,767 $ 4,247 $ 5,734 Portfolio Interest Income* $ 61,812 $ 52,523 $ 45,554 $ 45,207 $ 45,035 Portfolio Interest Expense* (20,375) (12,987) (7,832) (8,163) (8,747) Total Portfolio Net Interest Income* $ 41,437 $ 39,536 $ 37,722 $ 37,044 $ 36,288 Non-Portfolio Interest Expense Corporate Debt $ (2,157) $ (2,500) $ (4,872) $ (4,866) $ (4,383) Mortgages payable on real estate (13,151) (7,157) (2,078) (1,147) (430) Total Net Interest Income $ 26,129 $ 29,879 $ 30,772 $ 31,031 $ 31,475
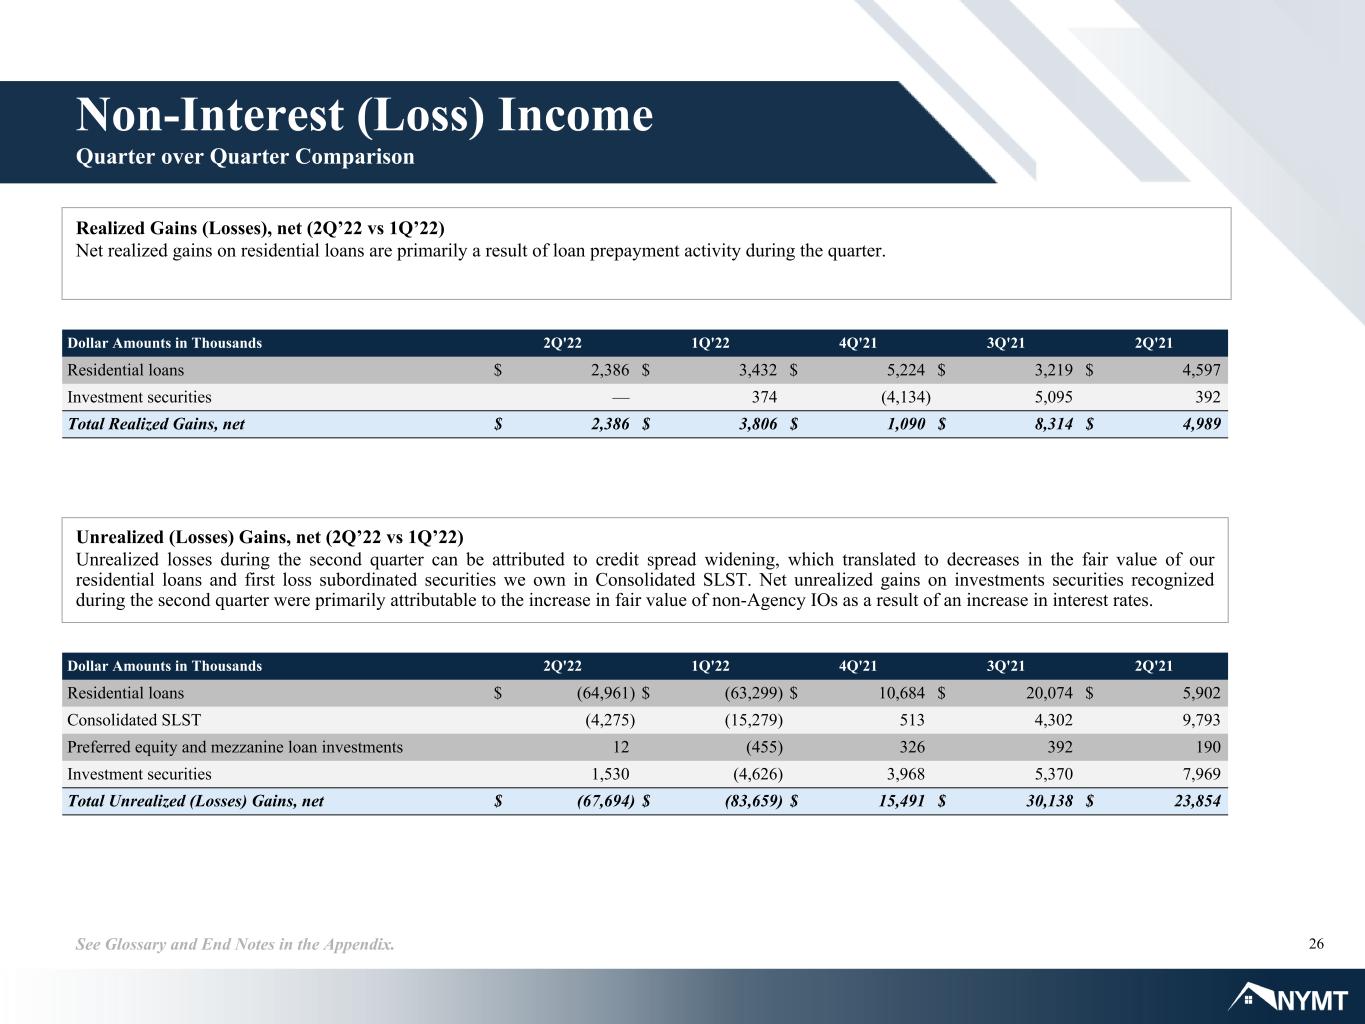
26See Glossary and End Notes in the Appendix. Non-Interest (Loss) Income Quarter over Quarter Comparison Realized Gains (Losses), net (2Q’22 vs 1Q’22) Net realized gains on residential loans are primarily a result of loan prepayment activity during the quarter. Unrealized (Losses) Gains, net (2Q’22 vs 1Q’22) Unrealized losses during the second quarter can be attributed to credit spread widening, which translated to decreases in the fair value of our residential loans and first loss subordinated securities we own in Consolidated SLST. Net unrealized gains on investments securities recognized during the second quarter were primarily attributable to the increase in fair value of non-Agency IOs as a result of an increase in interest rates. Dollar Amounts in Thousands 2Q'22 1Q'22 4Q'21 3Q'21 2Q'21 Residential loans $ 2,386 $ 3,432 $ 5,224 $ 3,219 $ 4,597 Investment securities — 374 (4,134) 5,095 392 Total Realized Gains, net $ 2,386 $ 3,806 $ 1,090 $ 8,314 $ 4,989 Dollar Amounts in Thousands 2Q'22 1Q'22 4Q'21 3Q'21 2Q'21 Residential loans $ (64,961) $ (63,299) $ 10,684 $ 20,074 $ 5,902 Consolidated SLST (4,275) (15,279) 513 4,302 9,793 Preferred equity and mezzanine loan investments 12 (455) 326 392 190 Investment securities 1,530 (4,626) 3,968 5,370 7,969 Total Unrealized (Losses) Gains, net $ (67,694) $ (83,659) $ 15,491 $ 30,138 $ 23,854

27See Glossary and End Notes in the Appendix. Non-Interest (Loss) Income Quarter over Quarter Comparison Income from Equity Investments (2Q’22 vs 1Q’22) The increase in income from equity investments in the second quarter is primarily related to unrealized gain recognized on an investment in an entity that originates residential loans. Dollar Amounts in Thousands 2Q'22 1Q'22 4Q'21 3Q'21 2Q'21 Preferred return on preferred equity investments accounted for as equity $ 5,703 $ 5,662 $ 7,177 $ 6,172 $ 5,531 Unrealized gains (losses), net on preferred equity investments accounted for as equity 326 113 (256) (294) 805 Income from unconsolidated joint venture equity investments in multi- family properties 299 250 150 — — Income from entities that invest in or originate residential properties and loans 1,772 28 4,804 2,137 4,271 Total Income from Equity Investments $ 8,100 $ 6,053 $ 11,875 $ 8,015 $ 10,607 Dollar Amounts in Thousands 2Q'22 1Q'22 4Q'21 3Q'21 2Q'21 Preferred equity and mezzanine loan premiums resulting from early redemption $ 980 $ 1,503 $ 3,147 $ 117 $ 1,459 Gain on sale of real estate held for sale 4 370 — — — Loss on extinguishment of debt — (603) — (1,583) — Miscellaneous income 121 157 125 431 217 Total Other Income (Loss) $ 1,105 $ 1,427 $ 3,272 $ (1,035) $ 1,676 Other Income (Loss) (2Q’22 vs 1Q’22) The decrease in other income in the second quarter is primarily related to a decrease in redemption premium recognized from early repayment of preferred equity investments during the quarter as compared to the previous quarter. In the prior quarter, the Company also recognized loss on the extinguishment of a mortgage payable in connection with the sale of a real estate investment during the quarter, which was partially offset by a realized gain on sale of the related assets.
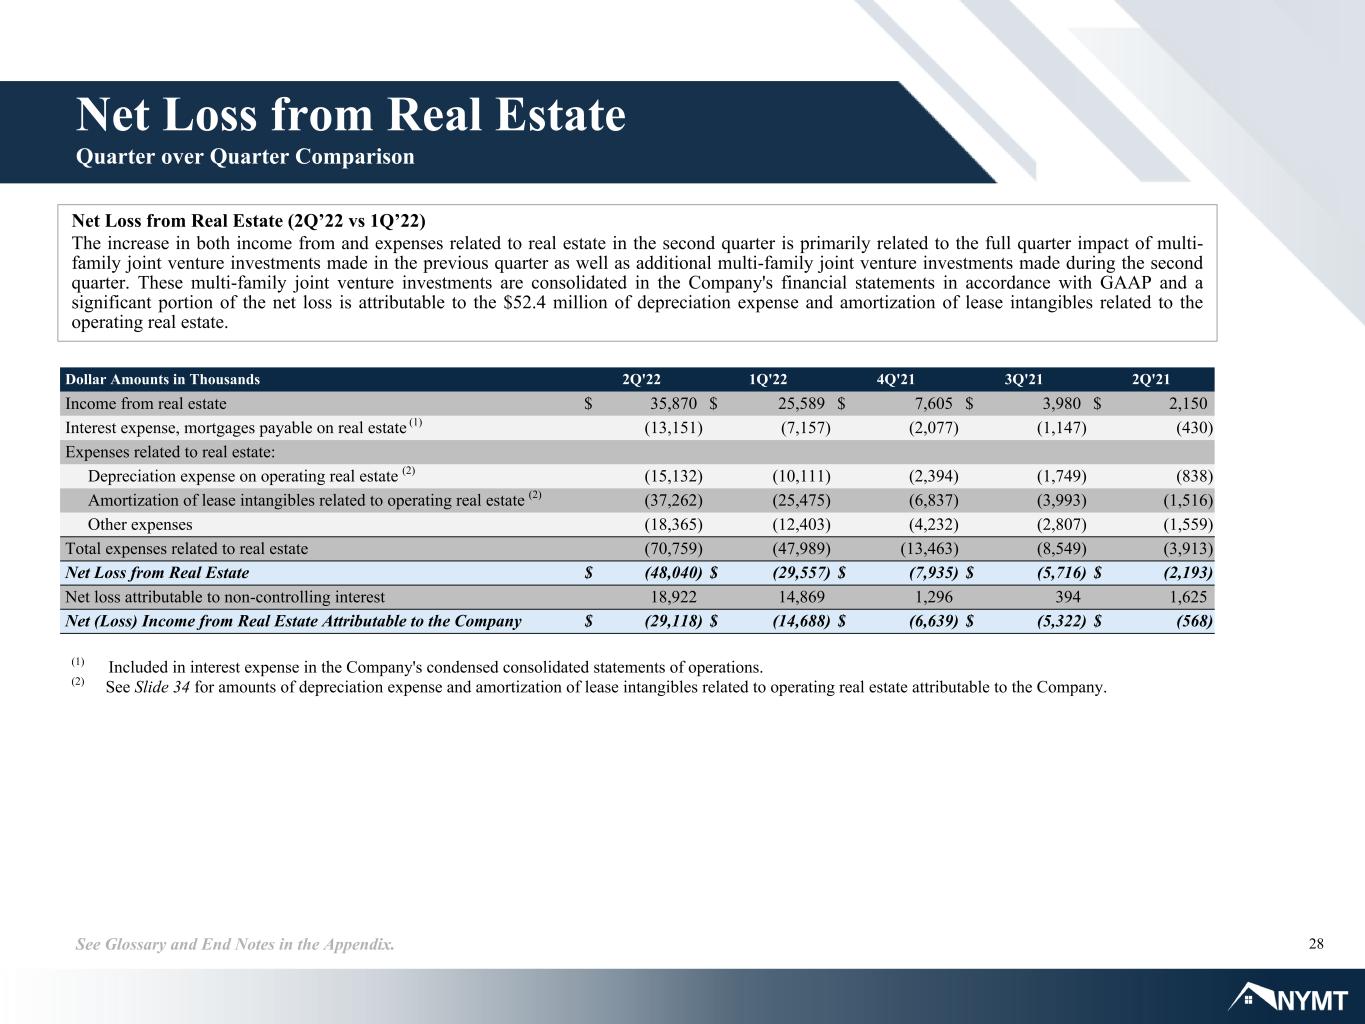
28See Glossary and End Notes in the Appendix. Net Loss from Real Estate Quarter over Quarter Comparison Dollar Amounts in Thousands 2Q'22 1Q'22 4Q'21 3Q'21 2Q'21 Income from real estate $ 35,870 $ 25,589 $ 7,605 $ 3,980 $ 2,150 Interest expense, mortgages payable on real estate (1) (13,151) (7,157) (2,077) (1,147) (430) Expenses related to real estate: Depreciation expense on operating real estate (2) (15,132) (10,111) (2,394) (1,749) (838) Amortization of lease intangibles related to operating real estate (2) (37,262) (25,475) (6,837) (3,993) (1,516) Other expenses (18,365) (12,403) (4,232) (2,807) (1,559) Total expenses related to real estate (70,759) (47,989) (13,463) (8,549) (3,913) Net Loss from Real Estate $ (48,040) $ (29,557) $ (7,935) $ (5,716) $ (2,193) Net loss attributable to non-controlling interest 18,922 14,869 1,296 394 1,625 Net (Loss) Income from Real Estate Attributable to the Company $ (29,118) $ (14,688) $ (6,639) $ (5,322) $ (568) Net Loss from Real Estate (2Q’22 vs 1Q’22) The increase in both income from and expenses related to real estate in the second quarter is primarily related to the full quarter impact of multi- family joint venture investments made in the previous quarter as well as additional multi-family joint venture investments made during the second quarter. These multi-family joint venture investments are consolidated in the Company's financial statements in accordance with GAAP and a significant portion of the net loss is attributable to the $52.4 million of depreciation expense and amortization of lease intangibles related to the operating real estate. (1) Included in interest expense in the Company's condensed consolidated statements of operations. (2) See Slide 34 for amounts of depreciation expense and amortization of lease intangibles related to operating real estate attributable to the Company.
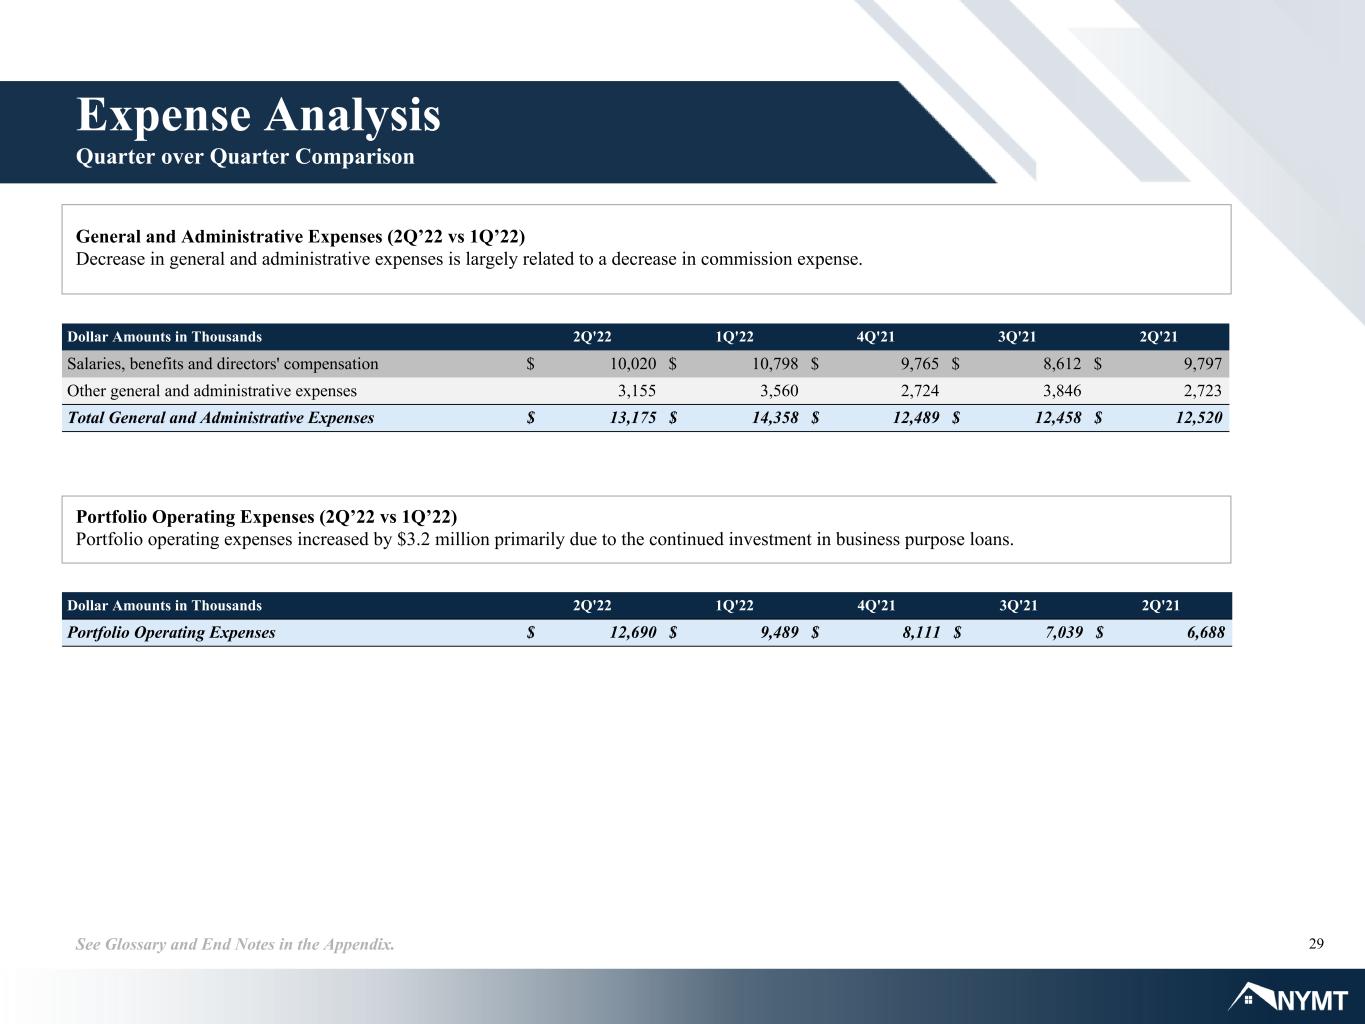
29See Glossary and End Notes in the Appendix. Expense Analysis Quarter over Quarter Comparison General and Administrative Expenses (2Q’22 vs 1Q’22) Decrease in general and administrative expenses is largely related to a decrease in commission expense. Portfolio Operating Expenses (2Q’22 vs 1Q’22) Portfolio operating expenses increased by $3.2 million primarily due to the continued investment in business purpose loans. Dollar Amounts in Thousands 2Q'22 1Q'22 4Q'21 3Q'21 2Q'21 Portfolio Operating Expenses $ 12,690 $ 9,489 $ 8,111 $ 7,039 $ 6,688 Dollar Amounts in Thousands 2Q'22 1Q'22 4Q'21 3Q'21 2Q'21 Salaries, benefits and directors' compensation $ 10,020 $ 10,798 $ 9,765 $ 8,612 $ 9,797 Other general and administrative expenses 3,155 3,560 2,724 3,846 2,723 Total General and Administrative Expenses $ 13,175 $ 14,358 $ 12,489 $ 12,458 $ 12,520
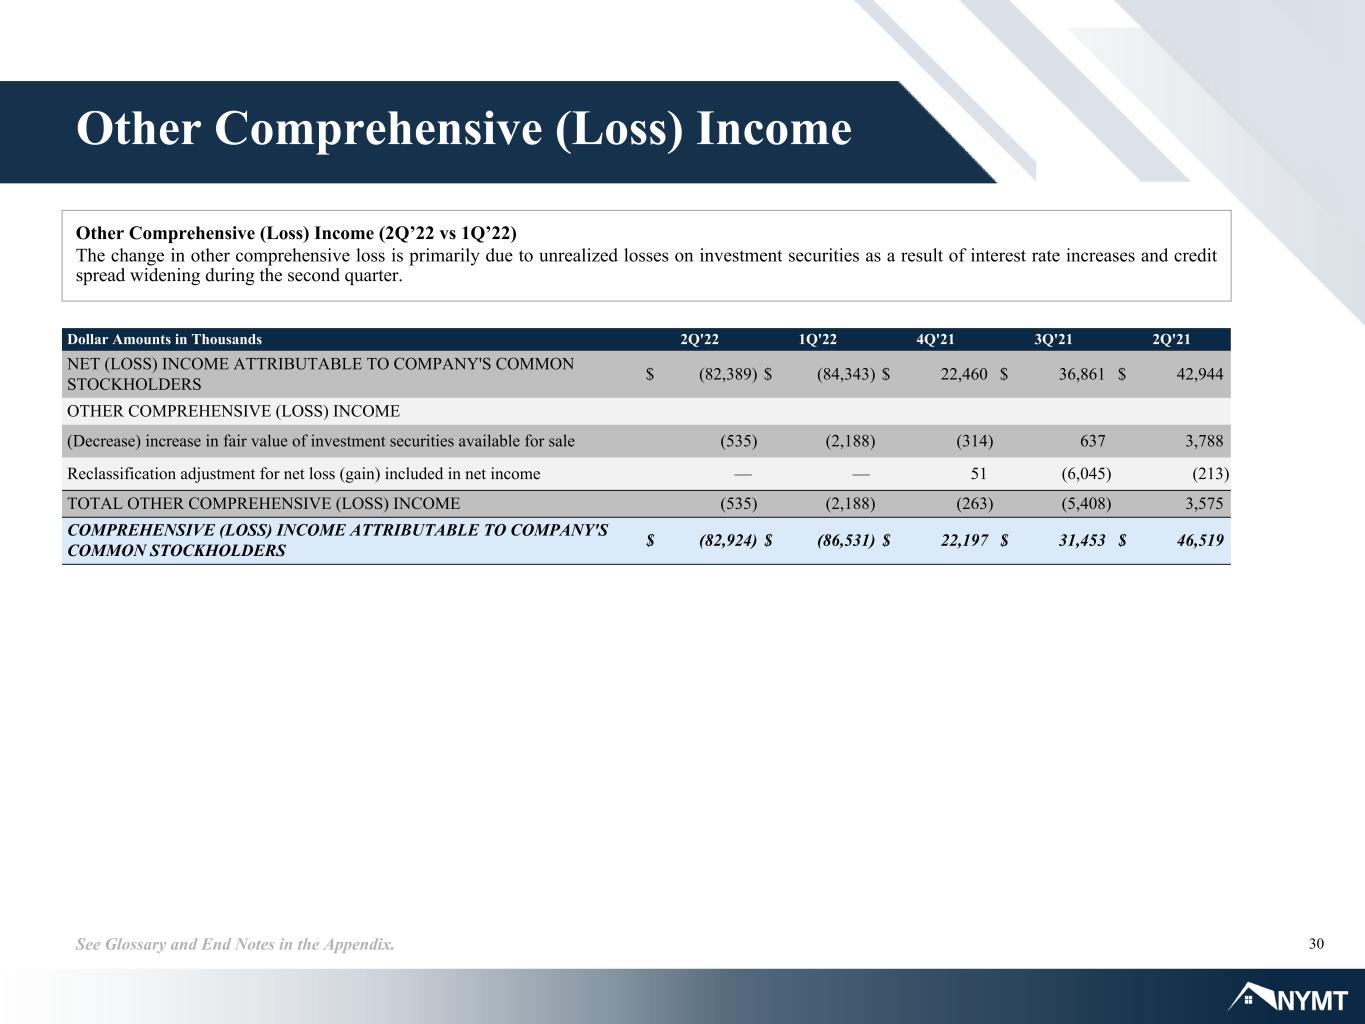
30See Glossary and End Notes in the Appendix. Other Comprehensive (Loss) Income Other Comprehensive (Loss) Income (2Q’22 vs 1Q’22) The change in other comprehensive loss is primarily due to unrealized losses on investment securities as a result of interest rate increases and credit spread widening during the second quarter. Dollar Amounts in Thousands 2Q'22 1Q'22 4Q'21 3Q'21 2Q'21 NET (LOSS) INCOME ATTRIBUTABLE TO COMPANY'S COMMON STOCKHOLDERS $ (82,389) $ (84,343) $ 22,460 $ 36,861 $ 42,944 OTHER COMPREHENSIVE (LOSS) INCOME (Decrease) increase in fair value of investment securities available for sale (535) (2,188) (314) 637 3,788 Reclassification adjustment for net loss (gain) included in net income — — 51 (6,045) (213) TOTAL OTHER COMPREHENSIVE (LOSS) INCOME (535) (2,188) (263) (5,408) 3,575 COMPREHENSIVE (LOSS) INCOME ATTRIBUTABLE TO COMPANY'S COMMON STOCKHOLDERS $ (82,924) $ (86,531) $ 22,197 $ 31,453 $ 46,519
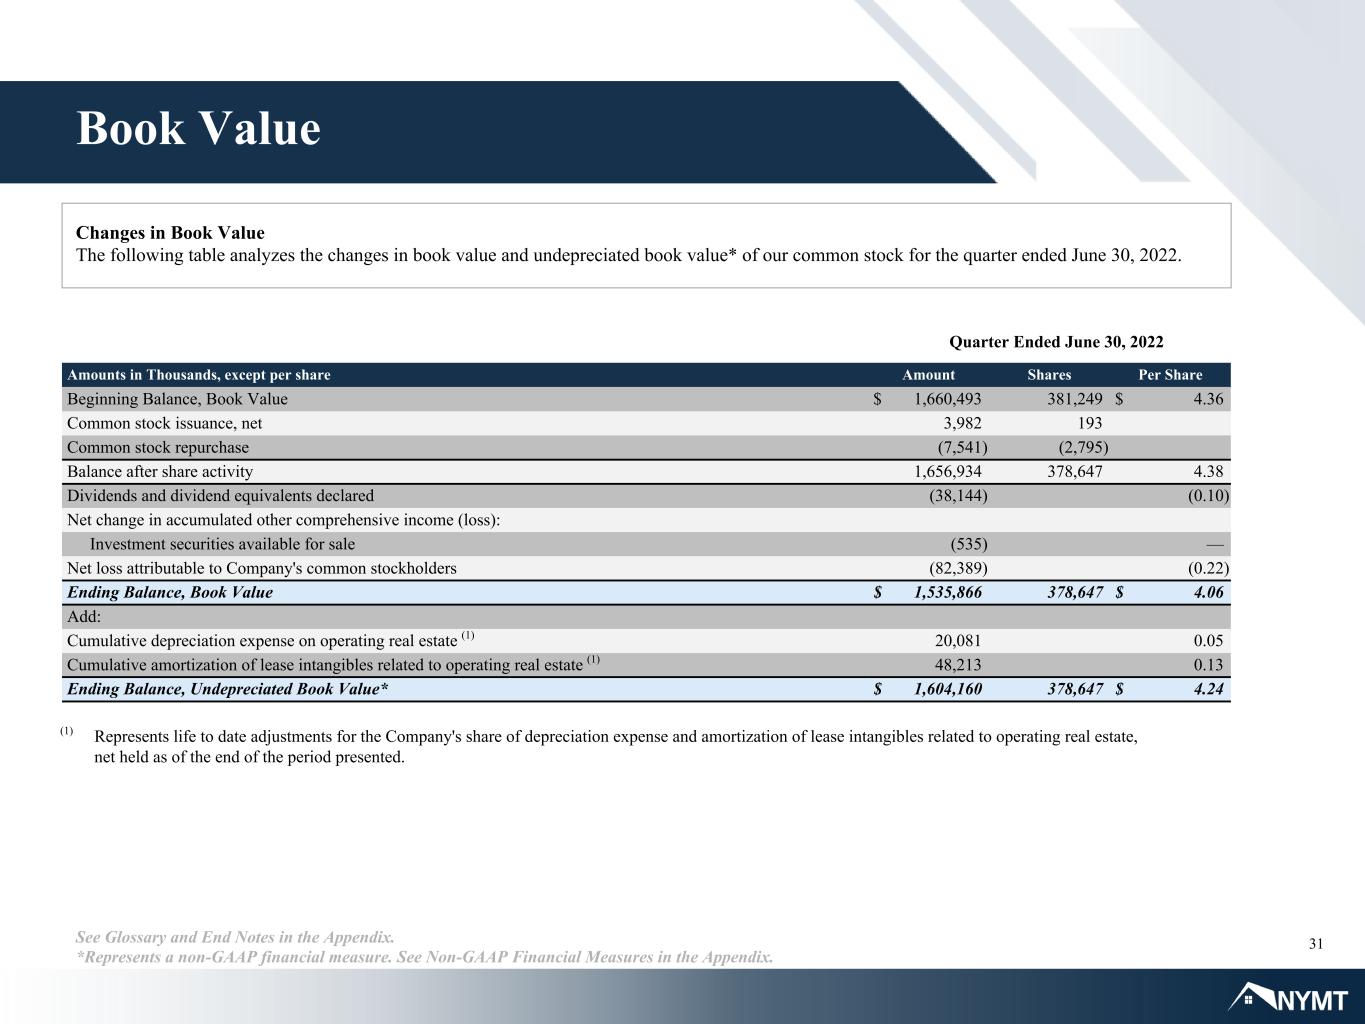
31See Glossary and End Notes in the Appendix. *Represents a non-GAAP financial measure. See Non-GAAP Financial Measures in the Appendix. Book Value Changes in Book Value The following table analyzes the changes in book value and undepreciated book value* of our common stock for the quarter ended June 30, 2022. Amounts in Thousands, except per share Amount Shares Per Share Beginning Balance, Book Value $ 1,660,493 381,249 $ 4.36 Common stock issuance, net 3,982 193 Common stock repurchase (7,541) (2,795) Balance after share activity 1,656,934 378,647 4.38 Dividends and dividend equivalents declared (38,144) (0.10) Net change in accumulated other comprehensive income (loss): Investment securities available for sale (535) — Net loss attributable to Company's common stockholders (82,389) (0.22) Ending Balance, Book Value $ 1,535,866 378,647 $ 4.06 Add: Cumulative depreciation expense on operating real estate (1) 20,081 0.05 Cumulative amortization of lease intangibles related to operating real estate (1) 48,213 0.13 Ending Balance, Undepreciated Book Value* $ 1,604,160 378,647 $ 4.24 Quarter Ended June 30, 2022 (1) Represents life to date adjustments for the Company's share of depreciation expense and amortization of lease intangibles related to operating real estate, net held as of the end of the period presented.
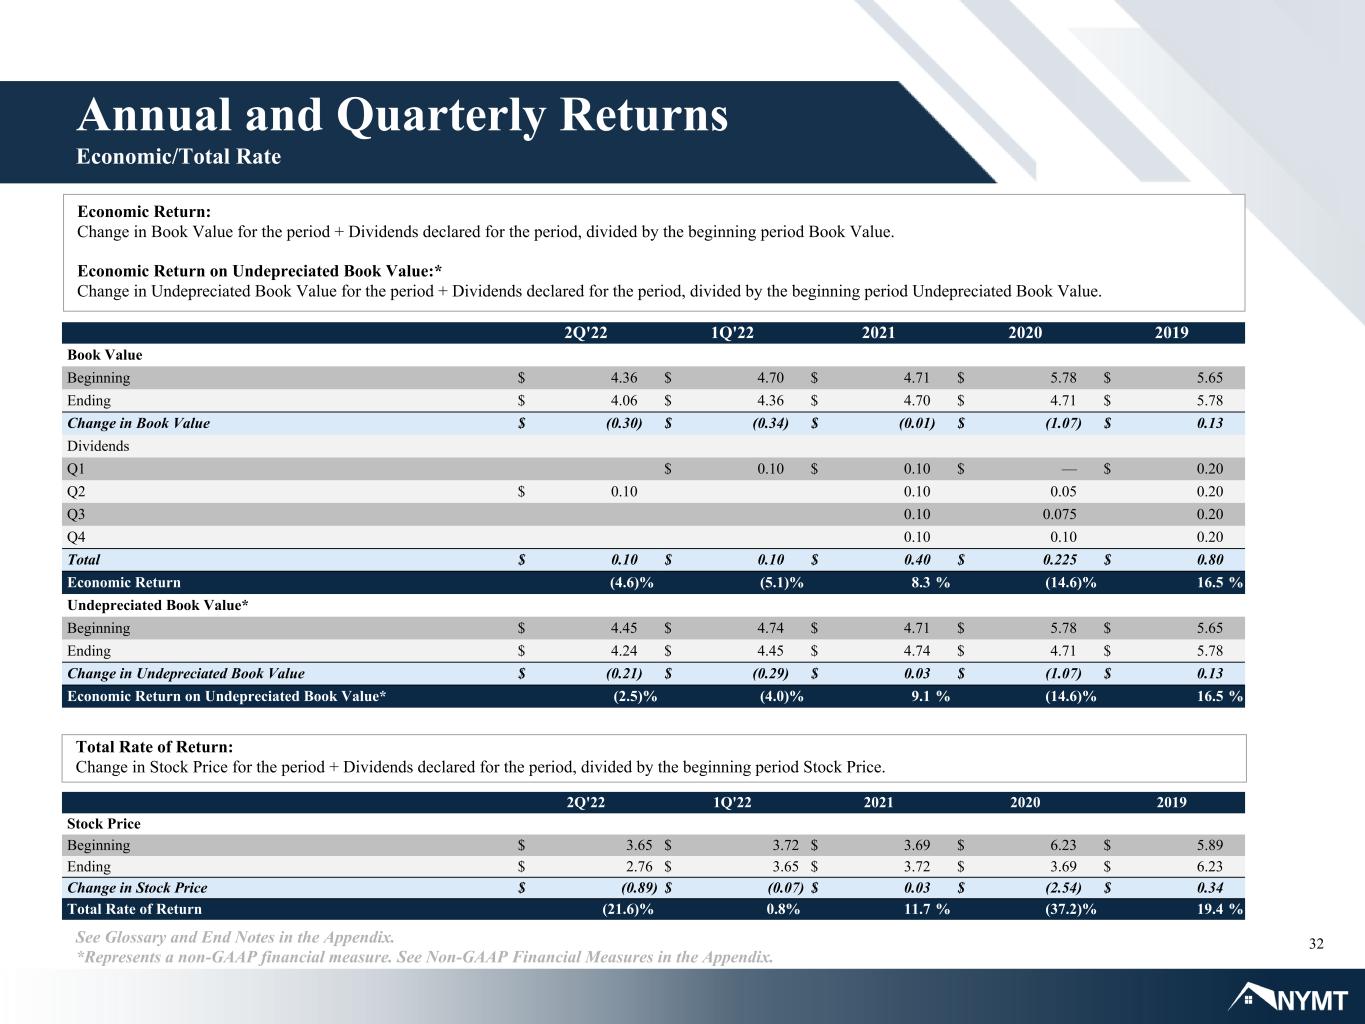
32See Glossary and End Notes in the Appendix. *Represents a non-GAAP financial measure. See Non-GAAP Financial Measures in the Appendix. Economic Return: Change in Book Value for the period + Dividends declared for the period, divided by the beginning period Book Value. Economic Return on Undepreciated Book Value:* Change in Undepreciated Book Value for the period + Dividends declared for the period, divided by the beginning period Undepreciated Book Value. Total Rate of Return: Change in Stock Price for the period + Dividends declared for the period, divided by the beginning period Stock Price. Annual and Quarterly Returns Economic/Total Rate 2Q'22 1Q'22 2021 2020 2019 Book Value Beginning $ 4.36 $ 4.70 $ 4.71 $ 5.78 $ 5.65 Ending $ 4.06 $ 4.36 $ 4.70 $ 4.71 $ 5.78 Change in Book Value $ (0.30) $ (0.34) $ (0.01) $ (1.07) $ 0.13 Dividends Q1 $ 0.10 $ 0.10 $ — $ 0.20 Q2 $ 0.10 0.10 0.05 0.20 Q3 0.10 0.075 0.20 Q4 0.10 0.10 0.20 Total $ 0.10 $ 0.10 $ 0.40 $ 0.225 $ 0.80 Economic Return (4.6)% (5.1) % 8.3 % (14.6) % 16.5 % Undepreciated Book Value* Beginning $ 4.45 $ 4.74 $ 4.71 $ 5.78 $ 5.65 Ending $ 4.24 $ 4.45 $ 4.74 $ 4.71 $ 5.78 Change in Undepreciated Book Value $ (0.21) $ (0.29) $ 0.03 $ (1.07) $ 0.13 Economic Return on Undepreciated Book Value* (2.5) % (4.0) % 9.1 % (14.6) % 16.5 % 2Q'22 1Q'22 2021 2020 2019 Stock Price Beginning $ 3.65 $ 3.72 $ 3.69 $ 6.23 $ 5.89 Ending $ 2.76 $ 3.65 $ 3.72 $ 3.69 $ 6.23 Change in Stock Price $ (0.89) $ (0.07) $ 0.03 $ (2.54) $ 0.34 Total Rate of Return (21.6)% 0.8% 11.7 % (37.2) % 19.4 %
Appendix

34See Glossary and End Notes in the Appendix. Non-GAAP Financial Measures Undepreciated (Loss) Earnings / Undepreciated Book Value Per Common Share Dollar Amounts in Thousands 2Q'22 1Q'22 4Q'21 3Q'21 2Q'21 Net (loss) income attributable to Company's common stockholders $ (82,389) $ (84,343) $ 22,460 $ 36,861 $ 42,944 Add: Depreciation expense on operating real estate 10,309 6,159 2,237 1,655 296 Amortization of lease intangibles related to operating real estate 22,910 13,979 6,348 3,674 781 Undepreciated (loss) earnings $ (49,170) $ (64,205) $ 31,045 $ 42,190 $ 44,021 Weighted average shares outstanding - basic 381,200 380,795 379,346 379,395 379,299 Undepreciated (loss) earnings per common share $ (0.13) $ (0.17) $ 0.08 $ 0.11 $ 0.12 Dollar Amounts in Thousands 2Q'22 1Q'22 4Q'21 3Q'21 2Q'21 Company's stockholders' equity $ 2,092,991 $ 2,217,618 $ 2,341,031 $ 2,357,793 $ 2,321,161 Preferred stock liquidation preference (557,125) (557,125) (557,125) (561,027) (521,822) GAAP Book Value 1,535,866 1,660,493 1,783,906 1,796,766 1,799,339 Add: Cumulative depreciation expense on operating real estate 20,081 9,772 4,381 2,144 489 Cumulative amortization of lease intangibles related to operating real estate 48,213 25,303 11,324 4,976 1,302 Undepreciated book value $ 1,604,160 $ 1,695,568 $ 1,799,611 $ 1,803,886 $ 1,801,130 Common shares outstanding 378,647 381,249 379,405 379,286 379,372 GAAP book value per common share $ 4.06 $ 4.36 $ 4.70 $ 4.74 $ 4.74 Undepreciated book value per common share $ 4.24 $ 4.45 $ 4.74 $ 4.76 $ 4.75 Undepreciated (Loss) Earnings Undepreciated Book Value Per Common Share In addition to the results presented in accordance with GAAP, this supplemental presentation includes certain non-GAAP financial measures, including undepreciated earnings, undepreciated book value per common share, portfolio interest income, portfolio interest expense and portfolio net interest income. Our management team believes that these non-GAAP financial measures, when considered with our GAAP financial statements, provide supplemental information useful for investors as it enables them to evaluate our current performance and trends using the same metrics that management uses to operate our business. Our presentation of non-GAAP financial measures may not be comparable to similarly-titled measures of other companies, who may use different calculations. Because these measures are not calculated in accordance with GAAP, they should not be considered a substitute for, or superior to, the financial measures calculated in accordance with GAAP. Our GAAP financial results and the reconciliations of the non-GAAP financial measures included in this supplemental presentation and our press release dated August 2, 2022 to the most directly comparable financial measures prepared in accordance with GAAP should be carefully evaluated.
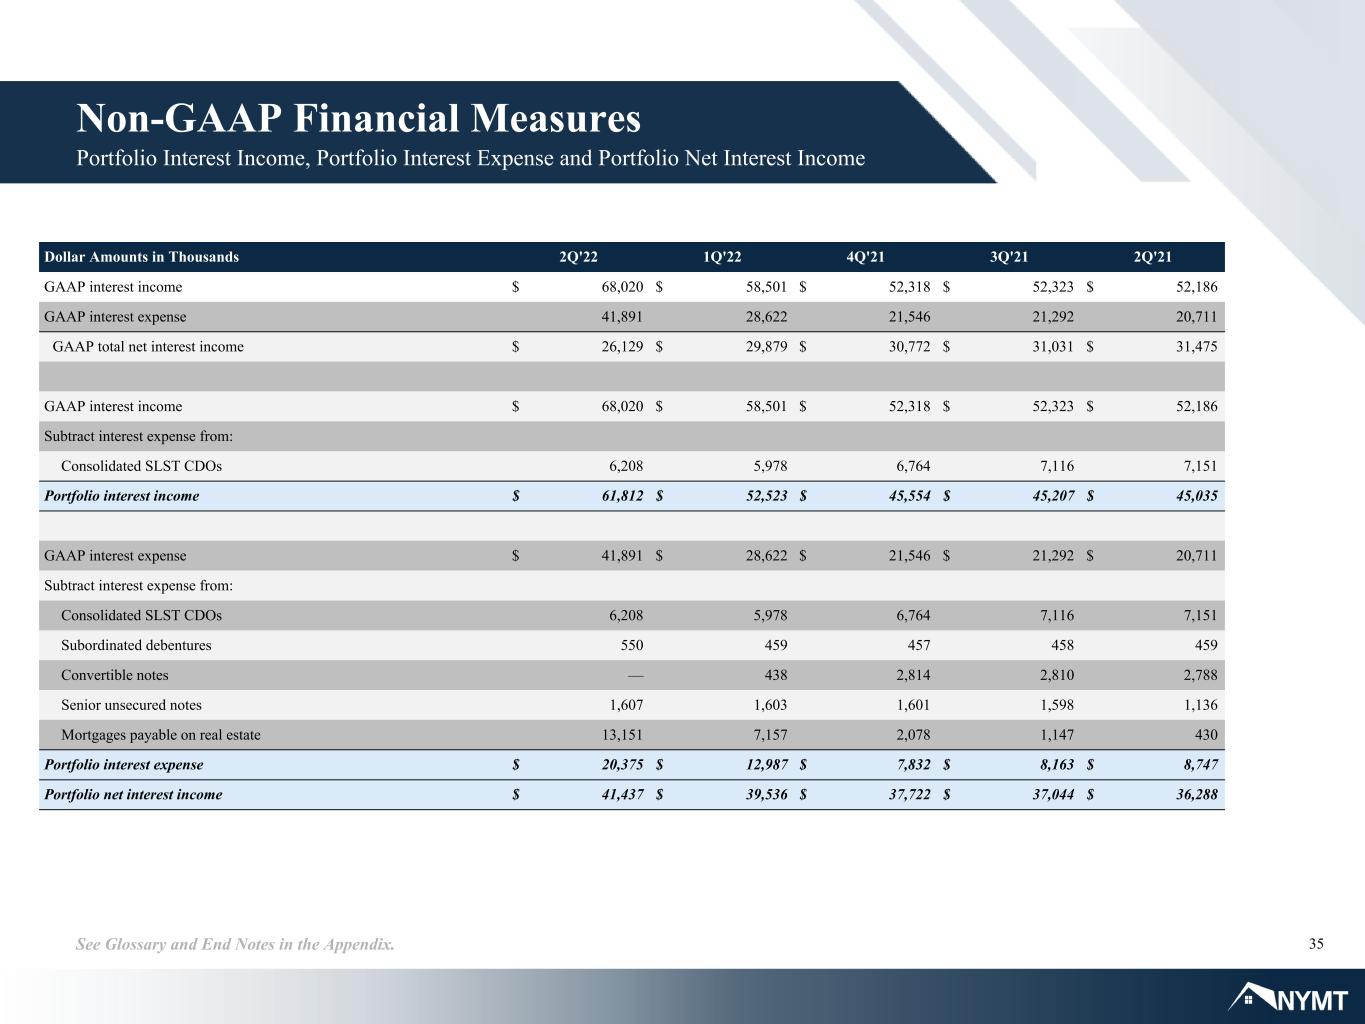
35See Glossary and End Notes in the Appendix. Non-GAAP Financial Measures Portfolio Interest Income, Portfolio Interest Expense and Portfolio Net Interest Income Dollar Amounts in Thousands 2Q'22 1Q'22 4Q'21 3Q'21 2Q'21 GAAP interest income $ 68,020 $ 58,501 $ 52,318 $ 52,323 $ 52,186 GAAP interest expense 41,891 28,622 21,546 21,292 20,711 GAAP total net interest income $ 26,129 $ 29,879 $ 30,772 $ 31,031 $ 31,475 GAAP interest income $ 68,020 $ 58,501 $ 52,318 $ 52,323 $ 52,186 Subtract interest expense from: Consolidated SLST CDOs 6,208 5,978 6,764 7,116 7,151 Portfolio interest income $ 61,812 $ 52,523 $ 45,554 $ 45,207 $ 45,035 GAAP interest expense $ 41,891 $ 28,622 $ 21,546 $ 21,292 $ 20,711 Subtract interest expense from: Consolidated SLST CDOs 6,208 5,978 6,764 7,116 7,151 Subordinated debentures 550 459 457 458 459 Convertible notes — 438 2,814 2,810 2,788 Senior unsecured notes 1,607 1,603 1,601 1,598 1,136 Mortgages payable on real estate 13,151 7,157 2,078 1,147 430 Portfolio interest expense $ 20,375 $ 12,987 $ 7,832 $ 8,163 $ 8,747 Portfolio net interest income $ 41,437 $ 39,536 $ 37,722 $ 37,044 $ 36,288
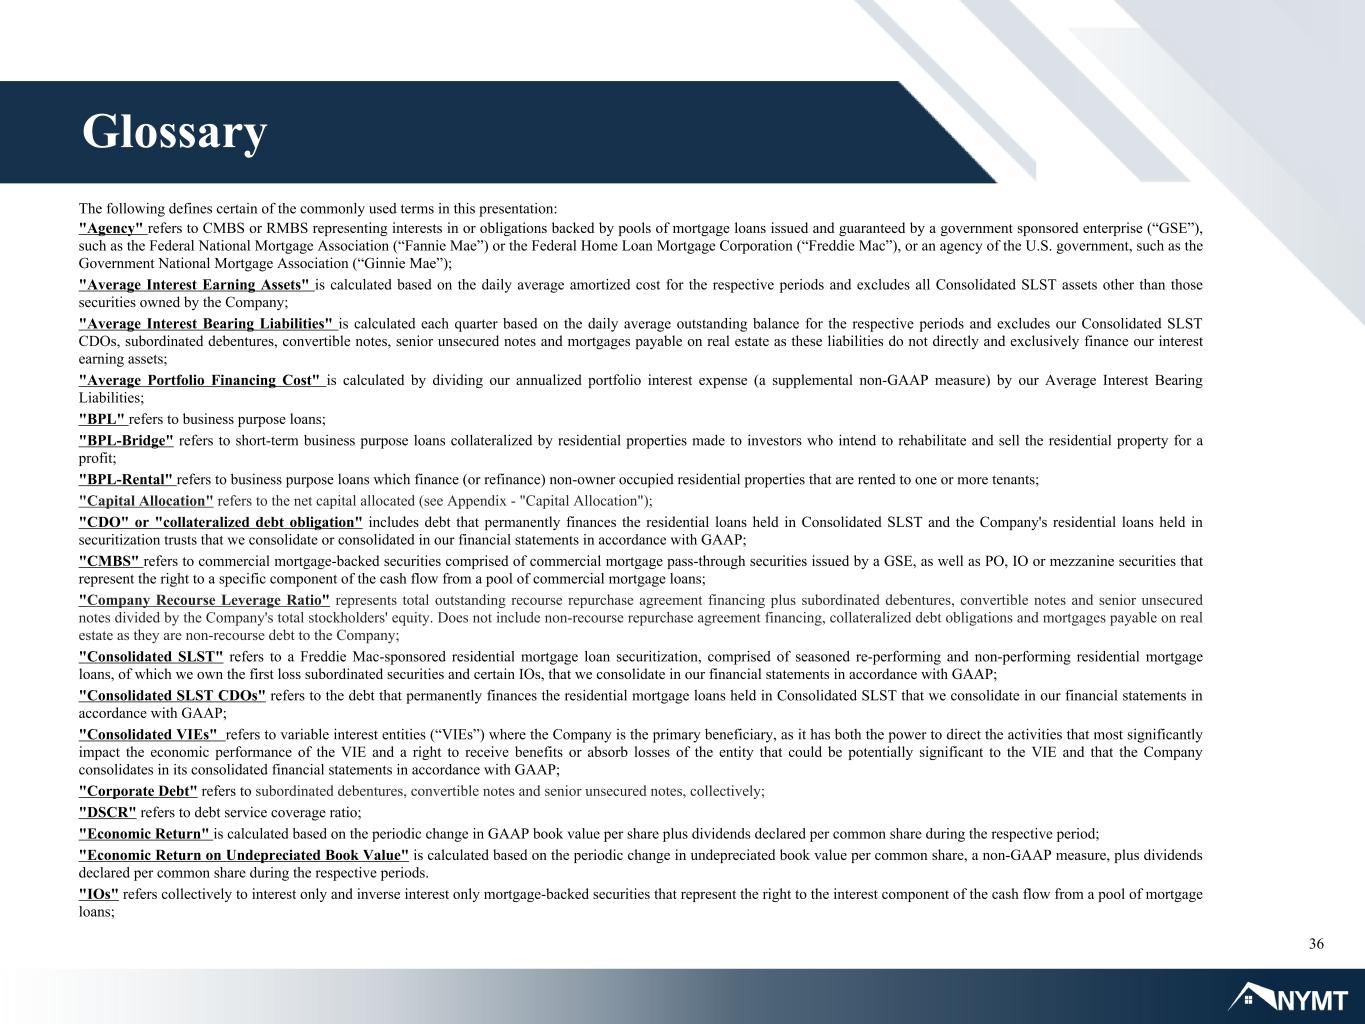
36 The following defines certain of the commonly used terms in this presentation: "Agency" refers to CMBS or RMBS representing interests in or obligations backed by pools of mortgage loans issued and guaranteed by a government sponsored enterprise (“GSE”), such as the Federal National Mortgage Association (“Fannie Mae”) or the Federal Home Loan Mortgage Corporation (“Freddie Mac”), or an agency of the U.S. government, such as the Government National Mortgage Association (“Ginnie Mae”); "Average Interest Earning Assets" is calculated based on the daily average amortized cost for the respective periods and excludes all Consolidated SLST assets other than those securities owned by the Company; "Average Interest Bearing Liabilities" is calculated each quarter based on the daily average outstanding balance for the respective periods and excludes our Consolidated SLST CDOs, subordinated debentures, convertible notes, senior unsecured notes and mortgages payable on real estate as these liabilities do not directly and exclusively finance our interest earning assets; "Average Portfolio Financing Cost" is calculated by dividing our annualized portfolio interest expense (a supplemental non-GAAP measure) by our Average Interest Bearing Liabilities; "BPL" refers to business purpose loans; "BPL-Bridge" refers to short-term business purpose loans collateralized by residential properties made to investors who intend to rehabilitate and sell the residential property for a profit; "BPL-Rental" refers to business purpose loans which finance (or refinance) non-owner occupied residential properties that are rented to one or more tenants; "Capital Allocation" refers to the net capital allocated (see Appendix - "Capital Allocation"); "CDO" or "collateralized debt obligation" includes debt that permanently finances the residential loans held in Consolidated SLST and the Company's residential loans held in securitization trusts that we consolidate or consolidated in our financial statements in accordance with GAAP; "CMBS" refers to commercial mortgage-backed securities comprised of commercial mortgage pass-through securities issued by a GSE, as well as PO, IO or mezzanine securities that represent the right to a specific component of the cash flow from a pool of commercial mortgage loans; "Company Recourse Leverage Ratio" represents total outstanding recourse repurchase agreement financing plus subordinated debentures, convertible notes and senior unsecured notes divided by the Company's total stockholders' equity. Does not include non-recourse repurchase agreement financing, collateralized debt obligations and mortgages payable on real estate as they are non-recourse debt to the Company; "Consolidated SLST" refers to a Freddie Mac-sponsored residential mortgage loan securitization, comprised of seasoned re-performing and non-performing residential mortgage loans, of which we own the first loss subordinated securities and certain IOs, that we consolidate in our financial statements in accordance with GAAP; "Consolidated SLST CDOs" refers to the debt that permanently finances the residential mortgage loans held in Consolidated SLST that we consolidate in our financial statements in accordance with GAAP; "Consolidated VIEs" refers to variable interest entities (“VIEs”) where the Company is the primary beneficiary, as it has both the power to direct the activities that most significantly impact the economic performance of the VIE and a right to receive benefits or absorb losses of the entity that could be potentially significant to the VIE and that the Company consolidates in its consolidated financial statements in accordance with GAAP; "Corporate Debt" refers to subordinated debentures, convertible notes and senior unsecured notes, collectively; "DSCR" refers to debt service coverage ratio; "Economic Return" is calculated based on the periodic change in GAAP book value per share plus dividends declared per common share during the respective period; "Economic Return on Undepreciated Book Value" is calculated based on the periodic change in undepreciated book value per common share, a non-GAAP measure, plus dividends declared per common share during the respective periods. "IOs" refers collectively to interest only and inverse interest only mortgage-backed securities that represent the right to the interest component of the cash flow from a pool of mortgage loans; Glossary
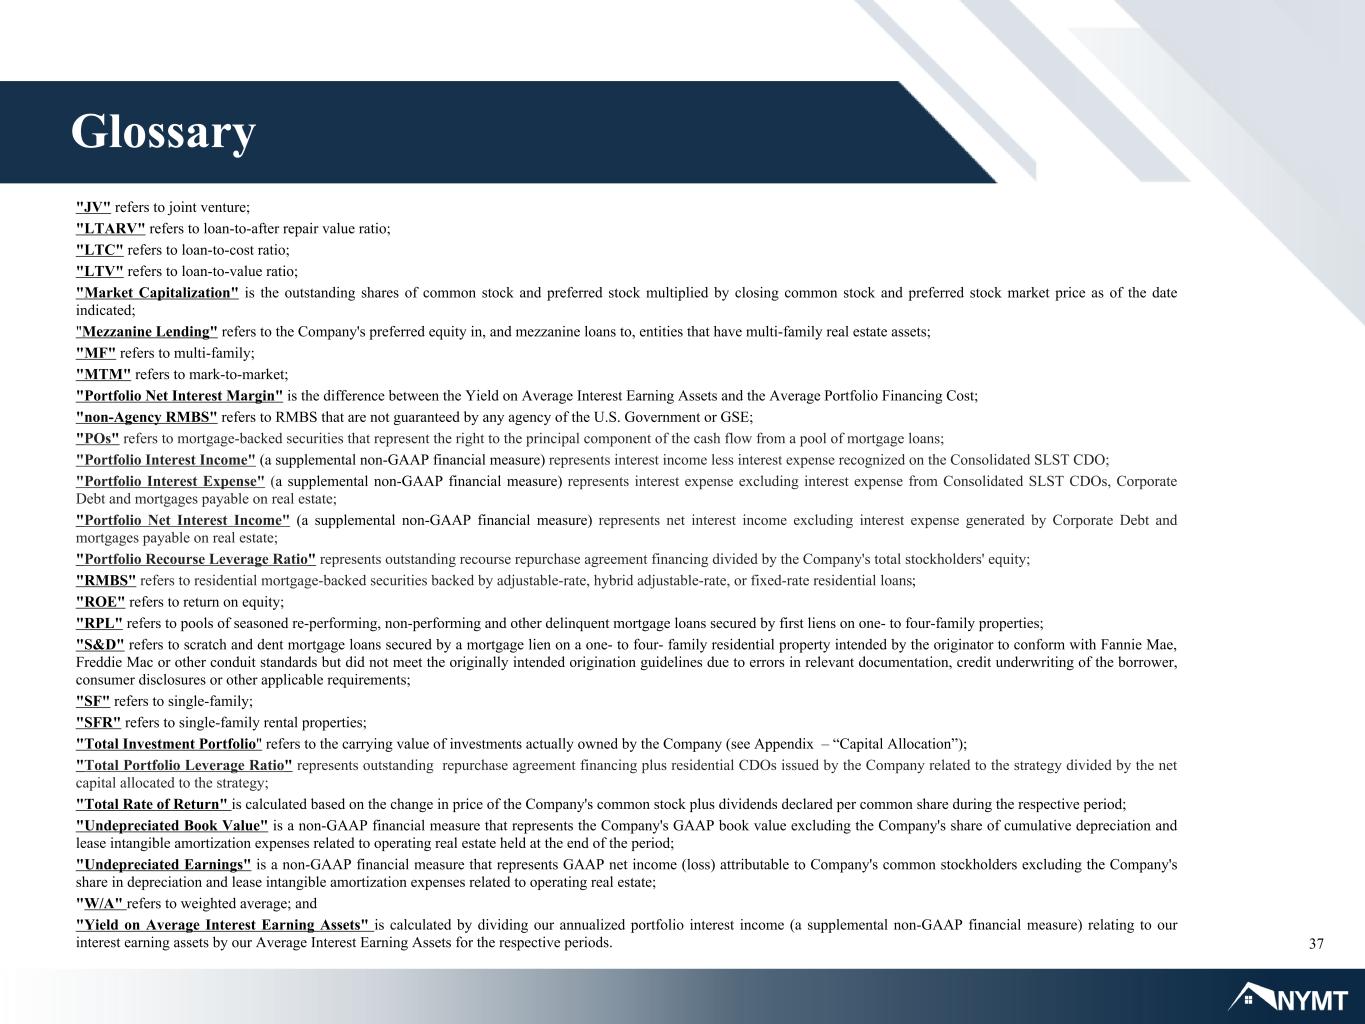
37 "JV" refers to joint venture; "LTARV" refers to loan-to-after repair value ratio; "LTC" refers to loan-to-cost ratio; "LTV" refers to loan-to-value ratio; "Market Capitalization" is the outstanding shares of common stock and preferred stock multiplied by closing common stock and preferred stock market price as of the date indicated; "Mezzanine Lending" refers to the Company's preferred equity in, and mezzanine loans to, entities that have multi-family real estate assets; "MF" refers to multi-family; "MTM" refers to mark-to-market; "Portfolio Net Interest Margin" is the difference between the Yield on Average Interest Earning Assets and the Average Portfolio Financing Cost; "non-Agency RMBS" refers to RMBS that are not guaranteed by any agency of the U.S. Government or GSE; "POs" refers to mortgage-backed securities that represent the right to the principal component of the cash flow from a pool of mortgage loans; "Portfolio Interest Income" (a supplemental non-GAAP financial measure) represents interest income less interest expense recognized on the Consolidated SLST CDO; "Portfolio Interest Expense" (a supplemental non-GAAP financial measure) represents interest expense excluding interest expense from Consolidated SLST CDOs, Corporate Debt and mortgages payable on real estate; "Portfolio Net Interest Income" (a supplemental non-GAAP financial measure) represents net interest income excluding interest expense generated by Corporate Debt and mortgages payable on real estate; "Portfolio Recourse Leverage Ratio" represents outstanding recourse repurchase agreement financing divided by the Company's total stockholders' equity; "RMBS" refers to residential mortgage-backed securities backed by adjustable-rate, hybrid adjustable-rate, or fixed-rate residential loans; "ROE" refers to return on equity; "RPL" refers to pools of seasoned re-performing, non-performing and other delinquent mortgage loans secured by first liens on one- to four-family properties; "S&D" refers to scratch and dent mortgage loans secured by a mortgage lien on a one- to four- family residential property intended by the originator to conform with Fannie Mae, Freddie Mac or other conduit standards but did not meet the originally intended origination guidelines due to errors in relevant documentation, credit underwriting of the borrower, consumer disclosures or other applicable requirements; "SF" refers to single-family; "SFR" refers to single-family rental properties; "Total Investment Portfolio" refers to the carrying value of investments actually owned by the Company (see Appendix – “Capital Allocation”); "Total Portfolio Leverage Ratio" represents outstanding repurchase agreement financing plus residential CDOs issued by the Company related to the strategy divided by the net capital allocated to the strategy; "Total Rate of Return" is calculated based on the change in price of the Company's common stock plus dividends declared per common share during the respective period; "Undepreciated Book Value" is a non-GAAP financial measure that represents the Company's GAAP book value excluding the Company's share of cumulative depreciation and lease intangible amortization expenses related to operating real estate held at the end of the period; "Undepreciated Earnings" is a non-GAAP financial measure that represents GAAP net income (loss) attributable to Company's common stockholders excluding the Company's share in depreciation and lease intangible amortization expenses related to operating real estate; "W/A" refers to weighted average; and "Yield on Average Interest Earning Assets" is calculated by dividing our annualized portfolio interest income (a supplemental non-GAAP financial measure) relating to our interest earning assets by our Average Interest Earning Assets for the respective periods. Glossary

38 End Notes Slide 1 • Image(s) used under license from Shutterstock.com. Slide 3 • Image(s) used under license from Shutterstock.com. Slide 6 • Refer to Appendix - "Capital Allocation" for a detailed breakout of Capital Allocation and Total Investment Portfolio. Slide 7 • Image(s) used under license from Shutterstock.com. • Available cash is calculated as unrestricted cash of $407 million less $38 million of cash held by the Company's consolidated multi-family properties plus $14 million of restricted cash held by the Company's BPL revolver securitizations. • Mark-to-market debt includes MTM repurchase agreement financing subject to margin calls. Slide 9 • Total Portfolio Size and Investment Allocation of the investment portfolio represent investment portfolio carrying value as of June 30, 2022 (see Appendix – “Capital Allocation”). Slide 13 • Units of single-family homes for sale sourced from the National Association of Realtors. • BPL-Bridge, S&D and Mezzanine Lending amounts represent the fair value of the assets as of June 30, 2022. • JV amounts represent the net equity investment in consolidated and unconsolidated multi-family apartment properties. • BPL-Bridge, S&D and Mezzanine Lending/JV percentages represent the percentage of the total investment portfolio carrying value as of June 30, 2022 (see Appendix - "Capital Allocation"). • LTV (at cost) represents the weighted average loan-to-cost calculated using the initial loan amount at origination (exclusive of any debt service, rehab escrows and other escrows or other amounts not funded to the borrower at closing) and initial cost basis. Initial cost basis is calculated as the purchase cost for non-re-financed loans or the as-is-value for re-financed loans. • LTV (after repair) represents the weighted average loan-to-value calculated using the maximum loan amount and original after-repair value per the appraisal or broker price opinion obtained for the mortgage loan (only applicable for loans with rehab component). • LTV for the S&D portfolio is calculated using the most current property value available. Slide 14 • Portfolio Acquisitions represent the cost of assets acquired by the Company during the periods presented. • Acquisitions, Prepayments and Redemptions for the 4Q 2021 period presented exclude previously held mezzanine lending investments that were recapitalized as joint venture equity investments in the fourth quarter of 2021. Slide 15 • MTM Repo includes MTM repurchase agreement financing subject to margin calls. • Non-MTM Repo includes non-MTM repurchase agreement financing. • Securitization Financing includes residential loan securitizations. • MTM Repo, Non-MTM Repo and Securitization Financing amounts represent the outstanding loan amount or note balance. • Unencumbered includes investment securities and residential loans. • Available Cash represents cash and cash equivalents at quarter-end for each of the periods indicated plus restricted cash held by the Company's BPL revolver securitizations and less: a) cash required to redeem corporate debt maturing within the next 30 days and b) cash held by the Company's consolidated multi- family properties. Slide 16 • Other Investments include asset-backed securities, an equity investment in an entity that originates residential loans, and an equity investment in an entity that invests in residential properties. • Portfolio Asset amounts for BPL Bridge, RPL, Performing Loans, BPL Rental, Non-Agency RMBS, Mezzanine Lending, CMBS and Other Investments represent the fair value of the assets as of June 30, 2022. • Portfolio Asset amount for SFR represents the net depreciated value of the real estate assets as of June 30, 2022.

39 End Notes • Joint Venture Equity Portfolio amount represents the Company's net equity investment in consolidated and unconsolidated multi-family apartment properties as of June 30, 2022. Refer to Appendix - "Reconciliation of Joint Venture Equity Investments" for a detailed breakout. • Available Cash is calculated as unrestricted cash of $407 million less $38 million of cash held by the Company's consolidated multi-family properties plus $14 million of restricted cash held by the Company's BPL revolver securitizations. • Portfolio and Corporate Debt amounts represent the outstanding loan amount or note balance of the instruments as of June 30, 2022. • Mark-to-market debt includes MTM repurchase agreement financing subject to margin calls. • Debt to Equity ratio is calculated using the Portfolio and Corporate Debt amounts referenced above and the Company's stockholders' equity as of June 30, 2022 . • Industry Median Avg. debt to equity ratio is sourced from the "Weekly Mortgage Sector Market Update" report published by Keefe, Bruyette & Woods in August 2022. • Unlevered multi-family investments include Joint Venture Equity and Mezzanine Lending amounts referenced above. Slide 17 • Total Investment Portfolio, Total Capital, and Net Capital represent amounts derived from the investment portfolio carrying value and net Company capital allocated as of June 30, 2022. Refer to Appendix - "Capital Allocation" for a detailed breakout of Total Investment Portfolio, Total Capital, and Net Capital. • Asset Value represents the fair value of the assets as of June 30, 2022. • Asset Value and Net Capital for Securities include Consolidated SLST securities owned by the Company with a fair value of $209 million and other non-Agency RMBS with a fair value of $75 million. • Portfolio Recourse Leverage Ratio represents outstanding recourse repurchase agreement financing related to the strategy divided by the net capital allocated to the strategy. • Total Portfolio Leverage Ratio represents outstanding repurchase agreement financing plus residential CDOs issued by the Company related to the strategy divided by the net capital allocated to the strategy. • Average FICO and Average Coupon for RPL Strategy, BPL-Bridge Strategy , BPL-Rental Strategy and Performing Loan Strategy represent the weighted average borrower FICO score and weighted average gross coupon rate for residential loans held as of June 30, 2022. • Average LTV for RPL Strategy, BPL-Rental Strategy and Performing Loan Strategy represents the weighted average loan-to- value for residential loans held as of June 30, 2022. LTV for these strategies is calculated using the most current property value available. • Average LTV for BPL-Bridge Strategy represents the weighted average loan-to-after repair value for residential loans, calculated using the maximum loan amount and original after-repair value per the appraisal or broker price opinion obtained for the mortgage loan (only applicable for loans with rehab component). Slide 18 • UPB represents the interest bearing balance of the BPL-Bridge strategy portfolio as of June 30, 2022. Average FICO and Average Coupon represent the weighted average borrower FICO score and weighted average gross coupon rate for loans within the BPL-Bridge strategy that were held as of June 30, 2022. Average LTARV represents the weighted average loan-to-after repair value calculated using the maximum loan amount and original after-repair value per the appraisal or broker price opinion obtained for the mortgage loan (only applicable for loans with rehab component). • Average LTC represents the weighted average loan-to-cost calculated using the initial loan amount at origination (exclusive of any debt service, rehab escrows and other escrows or other amounts not funded to the borrower at closing) and initial cost basis. Initial cost basis is calculated as the purchase cost for non-re-financed loans or the as-is- value for re-financed loans.
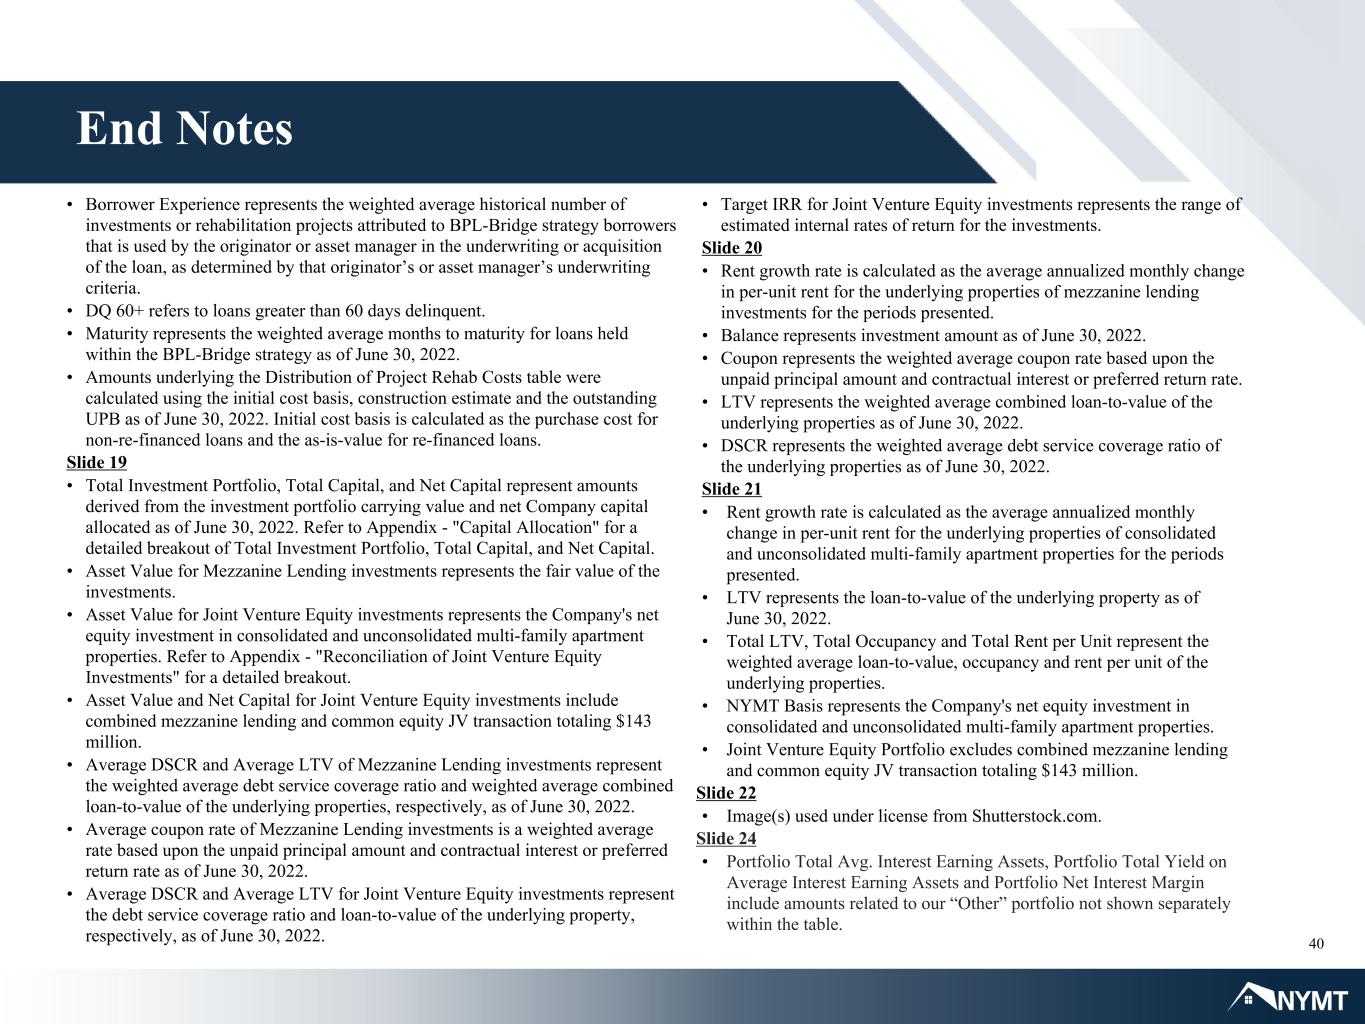
40 End Notes • Borrower Experience represents the weighted average historical number of investments or rehabilitation projects attributed to BPL-Bridge strategy borrowers that is used by the originator or asset manager in the underwriting or acquisition of the loan, as determined by that originator’s or asset manager’s underwriting criteria. • DQ 60+ refers to loans greater than 60 days delinquent. • Maturity represents the weighted average months to maturity for loans held within the BPL-Bridge strategy as of June 30, 2022. • Amounts underlying the Distribution of Project Rehab Costs table were calculated using the initial cost basis, construction estimate and the outstanding UPB as of June 30, 2022. Initial cost basis is calculated as the purchase cost for non-re-financed loans and the as-is-value for re-financed loans. Slide 19 • Total Investment Portfolio, Total Capital, and Net Capital represent amounts derived from the investment portfolio carrying value and net Company capital allocated as of June 30, 2022. Refer to Appendix - "Capital Allocation" for a detailed breakout of Total Investment Portfolio, Total Capital, and Net Capital. • Asset Value for Mezzanine Lending investments represents the fair value of the investments. • Asset Value for Joint Venture Equity investments represents the Company's net equity investment in consolidated and unconsolidated multi-family apartment properties. Refer to Appendix - "Reconciliation of Joint Venture Equity Investments" for a detailed breakout. • Asset Value and Net Capital for Joint Venture Equity investments include combined mezzanine lending and common equity JV transaction totaling $143 million. • Average DSCR and Average LTV of Mezzanine Lending investments represent the weighted average debt service coverage ratio and weighted average combined loan-to-value of the underlying properties, respectively, as of June 30, 2022. • Average coupon rate of Mezzanine Lending investments is a weighted average rate based upon the unpaid principal amount and contractual interest or preferred return rate as of June 30, 2022. • Average DSCR and Average LTV for Joint Venture Equity investments represent the debt service coverage ratio and loan-to-value of the underlying property, respectively, as of June 30, 2022. • Target IRR for Joint Venture Equity investments represents the range of estimated internal rates of return for the investments. Slide 20 • Rent growth rate is calculated as the average annualized monthly change in per-unit rent for the underlying properties of mezzanine lending investments for the periods presented. • Balance represents investment amount as of June 30, 2022. • Coupon represents the weighted average coupon rate based upon the unpaid principal amount and contractual interest or preferred return rate. • LTV represents the weighted average combined loan-to-value of the underlying properties as of June 30, 2022. • DSCR represents the weighted average debt service coverage ratio of the underlying properties as of June 30, 2022. Slide 21 • Rent growth rate is calculated as the average annualized monthly change in per-unit rent for the underlying properties of consolidated and unconsolidated multi-family apartment properties for the periods presented. • LTV represents the loan-to-value of the underlying property as of June 30, 2022. • Total LTV, Total Occupancy and Total Rent per Unit represent the weighted average loan-to-value, occupancy and rent per unit of the underlying properties. • NYMT Basis represents the Company's net equity investment in consolidated and unconsolidated multi-family apartment properties. • Joint Venture Equity Portfolio excludes combined mezzanine lending and common equity JV transaction totaling $143 million. Slide 22 • Image(s) used under license from Shutterstock.com. Slide 24 • Portfolio Total Avg. Interest Earning Assets, Portfolio Total Yield on Average Interest Earning Assets and Portfolio Net Interest Margin include amounts related to our “Other” portfolio not shown separately within the table.

41 End Notes Slide 25 • Refer to Appendix - “Reconciliation of Portfolio Net Interest Income" for reconciliation of Portfolio Net Interest Income for Single-Family. • Total Portfolio Interest Income, Total Portfolio Net Interest Income and Total Net Interest Income include amounts related to our “Other” portfolio not shown separately within the table. Slide 26 • Unrealized gains/losses on Consolidated SLST includes unrealized gains/losses on the residential loans held in Consolidated SLST and unrealized gains/losses on the CDOs issued by Consolidated SLST. Slide 31 • Outstanding shares used to calculate book value per common share and undepreciated book value per common share for the quarter ended June 30, 2022 are 378,647,371. • Common stock issuance, net includes amortization of stock based compensation. • Net change in accumulated other comprehensive income (loss) may relate to the reclassification of previously recognized unrealized gains/losses reported in other comprehensive income to net realized gains/losses in relation to the sale of investment securities and net unrealized gains/losses on our investment securities. Slide 45 • Image(s) used under license from Shutterstock.com.
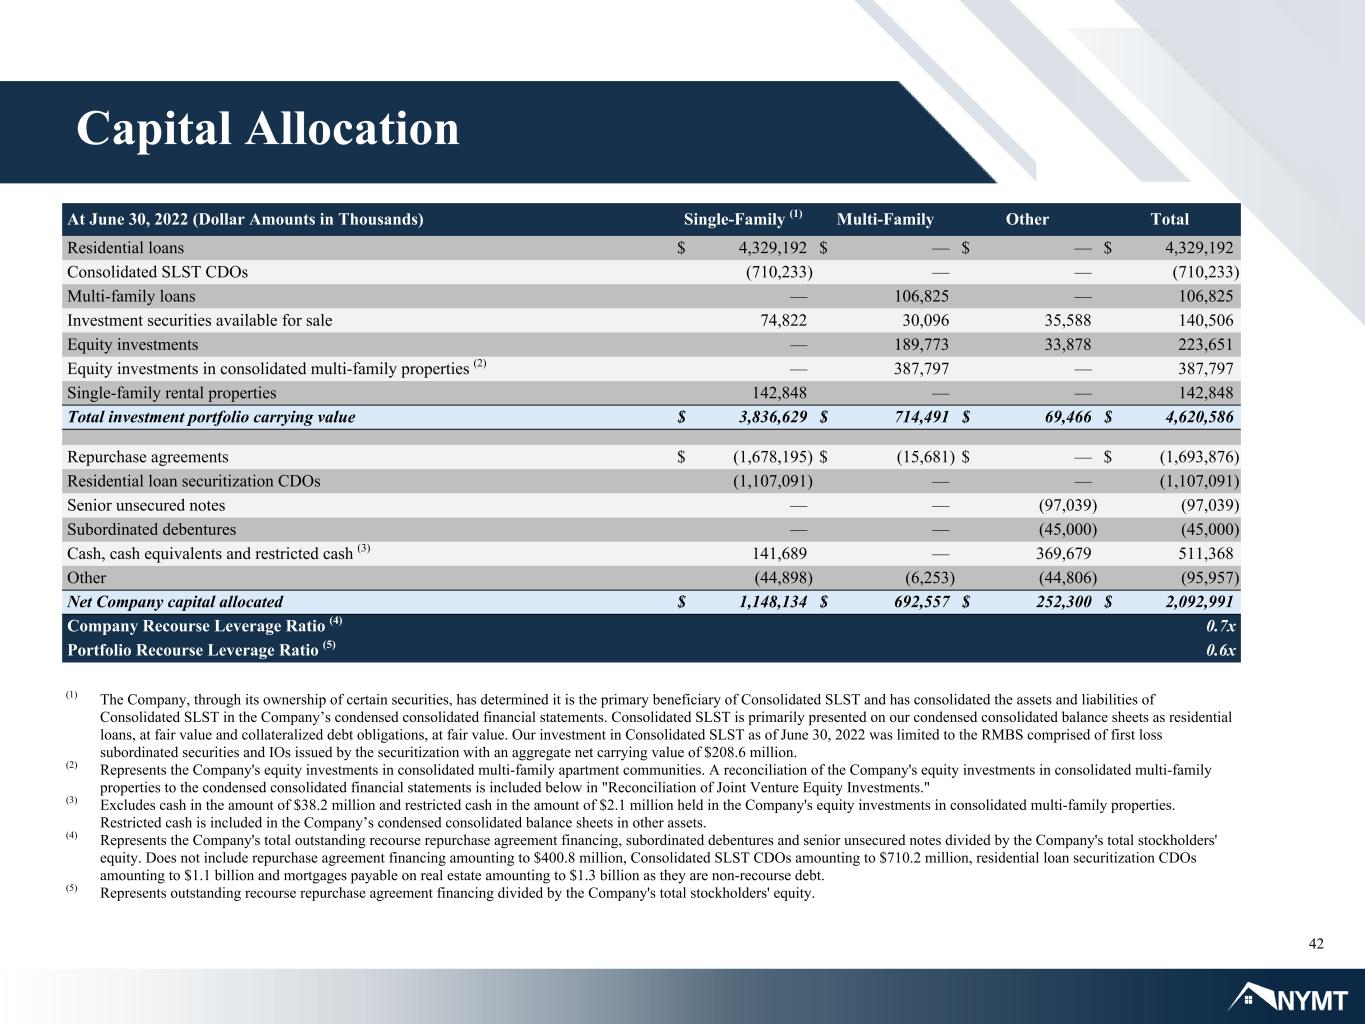
42 (1) The Company, through its ownership of certain securities, has determined it is the primary beneficiary of Consolidated SLST and has consolidated the assets and liabilities of Consolidated SLST in the Company’s condensed consolidated financial statements. Consolidated SLST is primarily presented on our condensed consolidated balance sheets as residential loans, at fair value and collateralized debt obligations, at fair value. Our investment in Consolidated SLST as of June 30, 2022 was limited to the RMBS comprised of first loss subordinated securities and IOs issued by the securitization with an aggregate net carrying value of $208.6 million. (2) Represents the Company's equity investments in consolidated multi-family apartment communities. A reconciliation of the Company's equity investments in consolidated multi-family properties to the condensed consolidated financial statements is included below in "Reconciliation of Joint Venture Equity Investments." (3) Excludes cash in the amount of $38.2 million and restricted cash in the amount of $2.1 million held in the Company's equity investments in consolidated multi-family properties. Restricted cash is included in the Company’s condensed consolidated balance sheets in other assets. (4) Represents the Company's total outstanding recourse repurchase agreement financing, subordinated debentures and senior unsecured notes divided by the Company's total stockholders' equity. Does not include repurchase agreement financing amounting to $400.8 million, Consolidated SLST CDOs amounting to $710.2 million, residential loan securitization CDOs amounting to $1.1 billion and mortgages payable on real estate amounting to $1.3 billion as they are non-recourse debt. (5) Represents outstanding recourse repurchase agreement financing divided by the Company's total stockholders' equity. Capital Allocation At June 30, 2022 (Dollar Amounts in Thousands) Single-Family (1) Multi-Family Other Total Residential loans $ 4,329,192 $ — $ — $ 4,329,192 Consolidated SLST CDOs (710,233) — — (710,233) Multi-family loans — 106,825 — 106,825 Investment securities available for sale 74,822 30,096 35,588 140,506 Equity investments — 189,773 33,878 223,651 Equity investments in consolidated multi-family properties (2) — 387,797 — 387,797 Single-family rental properties 142,848 — — 142,848 Total investment portfolio carrying value $ 3,836,629 $ 714,491 $ 69,466 $ 4,620,586 Repurchase agreements $ (1,678,195) $ (15,681) $ — $ (1,693,876) Residential loan securitization CDOs (1,107,091) — — (1,107,091) Senior unsecured notes — — (97,039) (97,039) Subordinated debentures — — (45,000) (45,000) Cash, cash equivalents and restricted cash (3) 141,689 — 369,679 511,368 Other (44,898) (6,253) (44,806) (95,957) Net Company capital allocated $ 1,148,134 $ 692,557 $ 252,300 $ 2,092,991 Company Recourse Leverage Ratio (4) 0.7x Portfolio Recourse Leverage Ratio (5) 0.6x
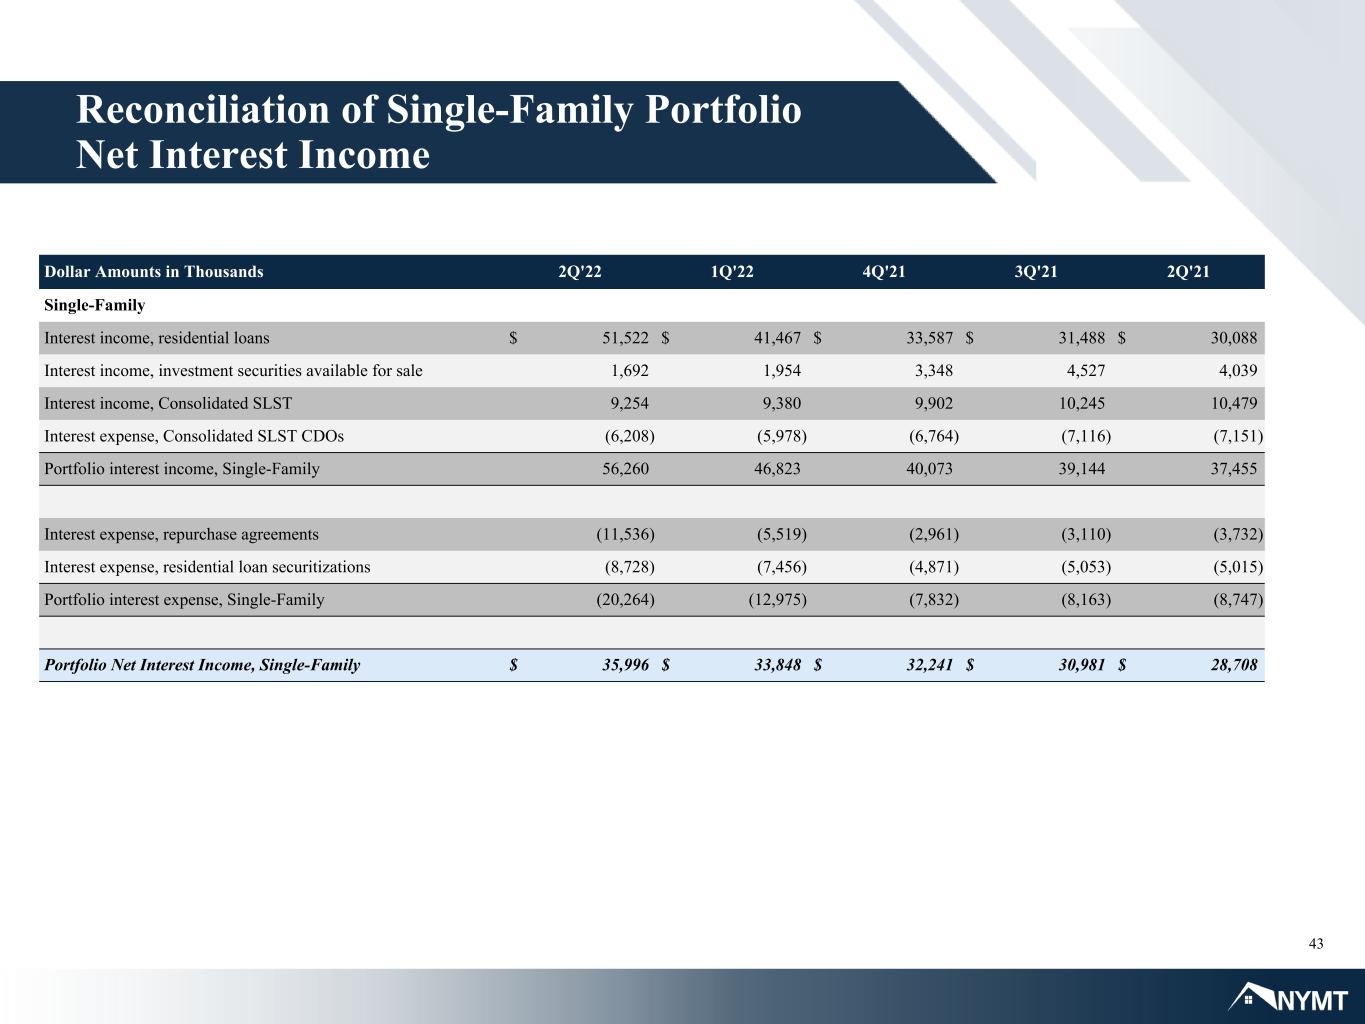
43 Reconciliation of Single-Family Portfolio Net Interest Income Dollar Amounts in Thousands 2Q'22 1Q'22 4Q'21 3Q'21 2Q'21 Single-Family Interest income, residential loans $ 51,522 $ 41,467 $ 33,587 $ 31,488 $ 30,088 Interest income, investment securities available for sale 1,692 1,954 3,348 4,527 4,039 Interest income, Consolidated SLST 9,254 9,380 9,902 10,245 10,479 Interest expense, Consolidated SLST CDOs (6,208) (5,978) (6,764) (7,116) (7,151) Portfolio interest income, Single-Family 56,260 46,823 40,073 39,144 37,455 Interest expense, repurchase agreements (11,536) (5,519) (2,961) (3,110) (3,732) Interest expense, residential loan securitizations (8,728) (7,456) (4,871) (5,053) (5,015) Portfolio interest expense, Single-Family (20,264) (12,975) (7,832) (8,163) (8,747) Portfolio Net Interest Income, Single-Family $ 35,996 $ 33,848 $ 32,241 $ 30,981 $ 28,708
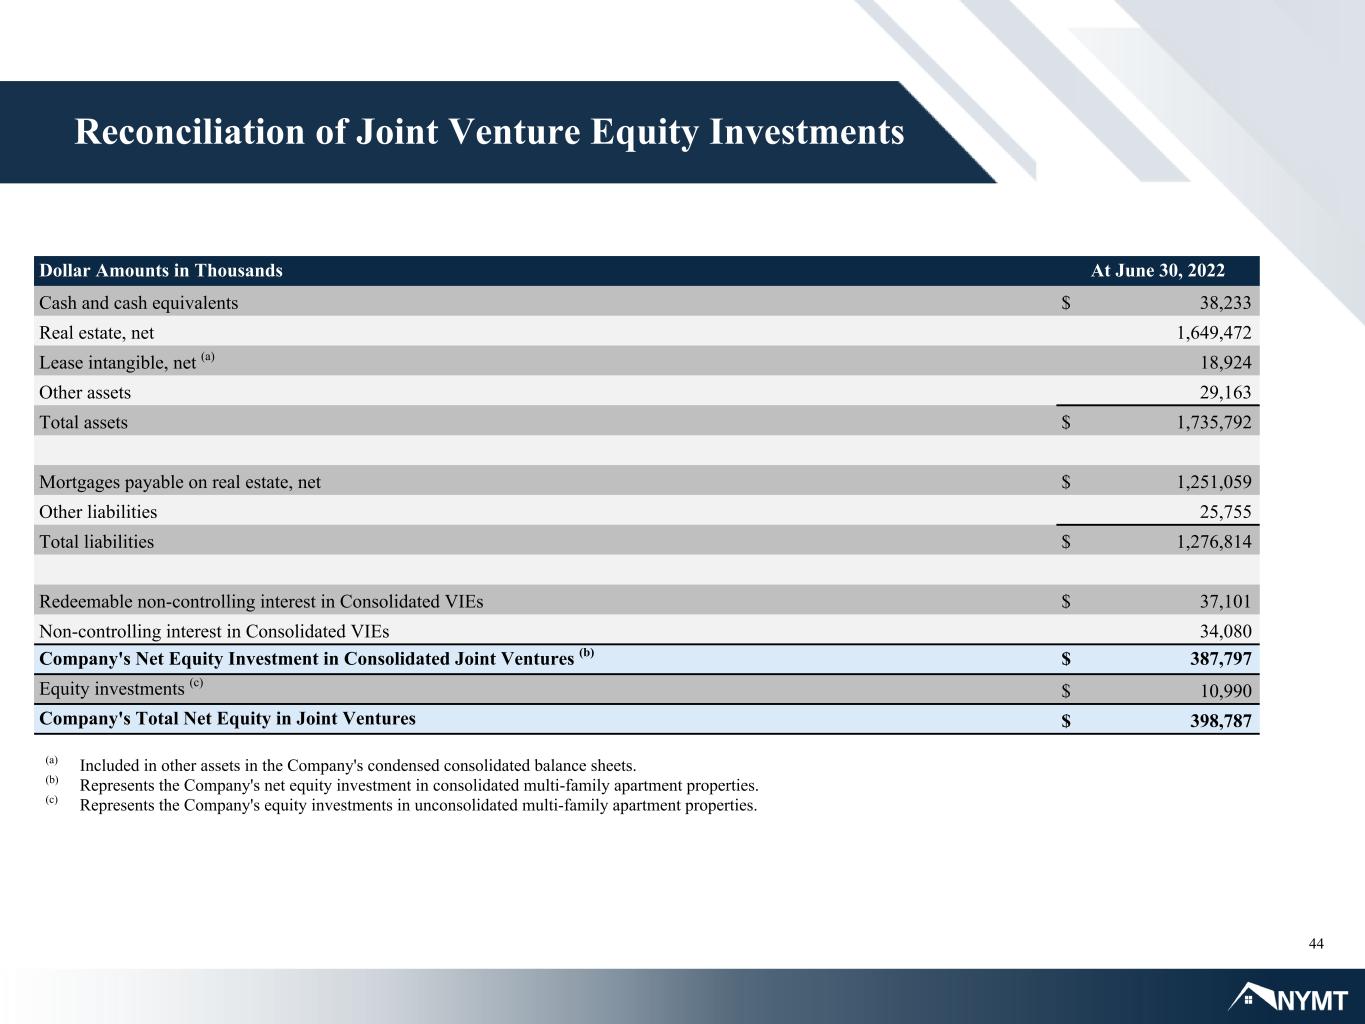
44 Reconciliation of Joint Venture Equity Investments Dollar Amounts in Thousands At June 30, 2022 Cash and cash equivalents $ 38,233 Real estate, net 1,649,472 Lease intangible, net (a) 18,924 Other assets 29,163 Total assets $ 1,735,792 Mortgages payable on real estate, net $ 1,251,059 Other liabilities 25,755 Total liabilities $ 1,276,814 Redeemable non-controlling interest in Consolidated VIEs $ 37,101 Non-controlling interest in Consolidated VIEs 34,080 Company's Net Equity Investment in Consolidated Joint Ventures (b) $ 387,797 Equity investments (c) $ 10,990 Company's Total Net Equity in Joint Ventures $ 398,787 (a) Included in other assets in the Company's condensed consolidated balance sheets. (b) Represents the Company's net equity investment in consolidated multi-family apartment properties. (c) Represents the Company's equity investments in unconsolidated multi-family apartment properties.

Thank You From all of us at NYMT


