Table of Contents
UNITED STATES
SECURITIES AND EXCHANGE COMMISSION
Washington, D.C. 20549
FORM 10-K
| | |
| (Mark One) | | |
ý |
|
ANNUAL REPORT PURSUANT TO SECTION 13 OR 15(d) OF THE
SECURITIES EXCHANGE ACT OF 1934 |
For the fiscal year ended December 31, 2011 |
or |
o |
|
TRANSITION REPORT PURSUANT TO SECTION 13 OR 15(d) OF THE
SECURITIES EXCHANGE ACT OF 1934 |
For the transition period from to
|
Commission File Number: 001-32330
NorthStar Realty Finance Corp.
(Exact Name of Registrant as Specified in its Charter)
| | |
Maryland
(State or Other Jurisdiction of
Incorporation or Organization) | | 11-3707493
(IRS Employer
Identification No.) |
399 Park Avenue, 18th Floor New York, NY 10022
(Address of Principal Executive Offices, Including Zip Code) |
(212) 547-2600
(Registrant's Telephone Number, Including Area Code)
|
Securities registered pursuant to Section 12(b) of the Act:
| | |
| Title of Class | | Name of Each Exchange on Which Registered |
|---|
| Common Stock, $0.01 par value | | New York Stock Exchange |
| Preferred Stock, 8.75% Series A Cumulative Redeemable, $0.01 par value | | New York Stock Exchange |
| Preferred Stock, 8.25% Series B Cumulative Redeemable, $0.01 par value | | New York Stock Exchange |
Securities registered pursuant to Section 12(g) of the Act:None
Indicate by check mark if the registrant is a well-known seasoned issuer, as defined in Rule 405 of the Securities Act. Yes o No ý
Indicate by check mark if the registrant is not required to file reports pursuant to Section 13 or 15(d) of the Act. Yes o No ý
Indicate by check mark whether the registrant (1) has filed all reports required to be filed by Section 13 or 15(d) of the Securities Exchange Act of 1934 during the preceding 12 months (or for such shorter period that the registrant was required to file such reports), and (2) has been subject to such filing requirements for the past 90 days. Yes ý No o
Indicate by check mark whether the registrant has submitted electronically and posted on its corporate Web site, if any, every Interactive Data File required to be submitted and posted pursuant to Rule 405 of Regulation S-T during the preceding 12 months (or for such shorter period that the registrant was required to submit and post such files). Yes ý No o
Indicate by check mark if disclosure of delinquent filers pursuant to Item 405 of Regulation S-K is not contained herein, and will not be contained, to the best of registrant's knowledge, in definitive proxy or information statements incorporated by reference in Part III of this Form 10-K or any amendment to this Form 10-K. ý
Indicate by check mark whether the registrant is a large accelerated filer, an accelerated filer, a non-accelerated filer, or a smaller reporting company. See the definition of "large accelerated filer," "accelerate filer" and "smaller reporting company" in Rule 12b-2 of the Exchange Act.
| | | | | | |
| Large accelerated filero | | Accelerated filerý | | Non-accelerated filero
(Do not check if a
smaller reporting company) | | Smaller reporting companyo |
Indicate by check mark whether the registrant is a shell company (as defined in Rule 12b-2 of the Act). Yes o No ý
The aggregate market value of the registrant's voting and non-voting common equity held by non-affiliates of the registrant as of June 30, 2011, was $385,112,245. As of February 14, 2012, the registrant had issued and outstanding 96,083,488 shares of common stock, par value $0.01 per share.
DOCUMENTS INCORPORATED BY REFERENCE
Portions of the definitive proxy statement for the registrant's 2012 Annual Meeting of Stockholders to be filed within 120 days after the end of the registrant's fiscal year ending December 31, 2011, are incorporated by reference into this Annual Report on Form 10-K in response to Part III, Items 10, 11, 12, 13 and 14.
INDEX
| | | | |
| |
| | Page |
|---|
PART I |
Item 1. | | Business | | 5 |
Item 1A. | | Risk Factors | | 18 |
Item 1B. | | Unresolved Staff Comments | | 65 |
Item 2. | | Properties | | 66 |
Item 3. | | Legal Proceedings | | 68 |
PART II |
Item 4. | | Mine Safety Disclosures | | 69 |
Item 5. | | Market for Registrant's Common Equity, Related Stockholder Matters and Issuer Purchases of Equity Securities | | 69 |
Item 6. | | Selected Financial Data | | 70 |
Item 7. | | Management's Discussion and Analysis of Financial Condition and Results of Operations | | 73 |
Item 7A. | | Quantitative and Qualitative Disclosures About Market Risk | | 99 |
Item 8. | | Financial Statements and Supplementary Data | | 103 |
Item 9. | | Changes in and Disagreements with Accountants on Accounting and Financial Disclosure | | 182 |
Item 9A. | | Controls and Procedures | | 182 |
Item 9B. | | Other Information | | 183 |
PART III |
Item 10. | | Directors, Executive Officers and Corporate Governance | | 184 |
Item 11. | | Executive Compensation | | 184 |
Item 12. | | Security Ownership of Certain Beneficial Owners and Management and Related Stockholder Matters | | 184 |
Item 13. | | Certain Relationships and Related Transactions and Directors Independence | | 184 |
Item 14. | | Principal Accountant Fees and Services | | 184 |
PART IV |
Item 15. | | Exhibits and Financial Statement Schedules | | 185 |
2
Table of Contents
FORWARD LOOKING STATEMENTS
This Annual Report on Form 10-K contains certain "forward-looking statements" within the meaning of the Private Securities Litigation Reform Act of 1995, Section 27A of the Securities Act of 1933, as amended, or Securities Act, and Section 21E of the Securities Exchange Act of 1934, as amended, or Exchange Act. Forward-looking statements are generally identifiable by use of forward-looking terminology such as "may," "will," "should," "potential," "intend," "expect," "seek," "anticipate," "estimate," "believe," "could," "project," "predict," "continue," "future" or other similar words or expressions. Forward-looking statements are not guarantees of performance and are based on certain assumptions, discuss future expectations, describe plans and strategies, contain projections of results of operations or of financial condition or state other forward-looking information. Such statements include, but are not limited to, those relating to the operating performance of our investments, our financing needs, the effects of our current strategies, loan and securities activities, our ability to manage our collateralized debt obligations, or CDOs, and our ability to raise capital. Our ability to predict results or the actual effect of plans or strategies is inherently uncertain, particularly given the economic environment. Although we believe that the expectations reflected in such forward-looking statements are based on reasonable assumptions, our actual results and performance could differ materially from those set forth in the forward-looking statements and you should not unduly rely on these statements. These forward-looking statements involve risks, uncertainties and other factors that may cause our actual results in future periods to differ materially from those forward looking statements. These factors include, but are not limited to:
- •
- adverse economic conditions and the impact on the commercial real estate finance industry;
- •
- access to debt and equity capital and our liquidity;
- •
- our use of leverage;
- •
- our ability to meet various coverage tests with respect to our CDOs;
- •
- our ability to obtain mortgage financing on our net lease properties;
- •
- the affect of economic conditions on the valuations of our investments;
- •
- the impact of economic conditions on the borrowers of the commercial real estate debt we originate and the commercial mortgage loans underlying the commercial mortgage backed securities in which we invest;
- •
- any failure in our due diligence to identify all relevant facts in our underwriting process or otherwise;
- •
- credit rating downgrades;
- •
- tenant or borrower defaults or bankruptcy;
- •
- illiquidity of properties in our portfolio;
- •
- environmental compliance costs and liabilities;
- •
- effect of regulatory actions, litigation and contractual claims against us and our affiliates, including the potential settlement and litigation of such claims;
- •
- competition for investment opportunities;
- •
- regulatory requirements with respect to our business and the related cost of compliance;
- •
- the impact of any conflicts arising from our asset management business;
- •
- the ability to raise capital for the non-listed real estate investment trusts, or REITs, we sponsor;
3
Table of Contents
- •
- changes in laws or regulations governing various aspects of our business;
- •
- the loss of our exemption from the definition of "investment company" under the Investment Company Act of 1940, as amended;
- •
- competition for qualified personnel and our ability to retain key personnel;
- •
- the effectiveness of our risk management systems;
- •
- failure to maintain effective internal controls;
- •
- compliance with the rules governing REITs; and
- •
- the factors described in Item 1A. of this Annual Report on Form 10-K under the heading "Risk Factors."
The foregoing list of factors is not exhaustive. All forward-looking statements included in this Annual Report on Form 10-K are based upon information available to us on the date hereof and we are under no duty to update any of the forward-looking statements after the date of this report to conform these statements to actual results.
Factors that could have a material adverse effect on our operations and future prospects are set forth in "Risk Factors" in this Annual Report on Form 10-K beginning on page 18. The factors set forth in the Risk Factors section could cause our actual results to differ significantly from those contained in any forward-looking statement contained in this report.
4
Table of Contents
PART I
Item 1. Business
References to "we," "us" or "our" refer to NorthStar Realty Finance Corp. and its subsidiaries unless context specifically requires otherwise.
Overview
We are an internally managed real estate finance company formed in October 2003 that originates, acquires and manages portfolios of commercial real estate debt, commercial real estate securities and net lease properties. In addition, we engage in asset management and other activities related to real estate and real estate finance.
Our primary business objectives are to make real estate-related investments in order to produce attractive risk-adjusted returns, generate stable cash flows for distribution to our stockholders and build long-term franchise value. We believe that the combination of our commercial real estate, or CRE, credit underwriting and capital markets expertise provides us with a competitive advantage in the marketplace. Our businesses are complementary to each other due to their overlapping sources of investment opportunities, common reliance on CRE fundamentals and application of similar asset management skills to maximize value and to protect capital.
We use asset-level financing as part of our strategy and we seek to match-fund our assets and liabilities by having similar maturities and like-kind interest rate benchmarks (fixed or floating) to manage refinancing and interest rate risk. Our CRE debt and securities portfolios are predominantly financed through long-term, non-recourse collateralized debt obligations, or CDOs, while our net lease properties are predominantly financed with non-recourse mortgage notes.
We seek to meet our objectives by actively managing portfolio credit to preserve capital, generating and recycling liquidity from existing assets and prudently accessing new debt and equity capital for our businesses. We also explore other opportunistic investments such as repurchasing our own CDO bonds at a discount to par.
The capital and equity markets have been negatively impacted by the liquidity and credit crisis which began with the collapse of the residential real estate sector in 2007. Despite some improvement in 2011, the U.S. economy is continuing to experience high unemployment and slow growth compared to historical periods. Additionally, disruptions in the global economy, whether as a result of the Euro-zone debt crisis or otherwise, may also have a negative impact on the CRE market domestically. We expect the commercial real estate finance markets to continue to be challenged in 2012. However, despite the difficult U.S. and global economic conditions, investor interest has been returning to commercial real estate especially in urban areas having high concentrations of institutional quality real estate, and especially in certain asset types such as apartments. In response to these conditions, beginning in 2007, most of our new investment activities were funded using proceeds from repayments and sales of investments within our portfolio. When liquidity became available in the first half of 2011, we raised $232 million including $69 million net proceeds of equity capital and $163 million of exchangeable senior notes due March 2016. Then, in the fourth quarter 2011, we, through two wholly-owned subsidiaries, entered into two new $100 million term credit facilities to finance loan originations and make investments in commercial mortgage backed securities, or CMBS, respectively.
We are also focused on building our asset management business by raising and managing capital on a fee basis from alternate sources, such as the non-listed real estate investment trust sector, which we refer to as our Sponsored REITs. Currently, we are raising capital for NorthStar Real Estate Income Trust, Inc., or NSREIT, our CRE debt-oriented Sponsored REIT. In addition, we have a healthcare debt and equity investment focused product in registration, NorthStar Senior Care Trust, Inc., or Senior Care. During 2011, our capital raising efforts in NSREIT picked up significant
5
Table of Contents
momentum and we believe that our unique investment strategy and expertise are the principal drivers of that momentum. If we can successfully raise capital for our Sponsored REITs, we believe that we could generate substantial incremental cash flows to our stockholders without any significant capital at risk. We also believe our strategy of raising and managing capital on a fee basis in the non-listed REIT sector makes us less reliant on the traditional public equity markets to grow our business.
Our stock is traded on the New York Stock Exchange under the symbol "NRF." We conduct our operations so as to qualify as a real estate investment trust, or REIT, for federal income tax purposes.
Our Investments
The following describes the major CRE asset classes in which we invest and continue to actively manage to maximize stockholder value and to preserve our capital. For financial information regarding our reportable segments, refer to Note 17, Segment Reporting, in our accompanying Consolidated Financial Statements for the year ended December 31, 2011 included in Part II, Item 8. "Financial Statements and Supplementary Data."
The following table represents our assets under management as of December 31, 2011 based on principal amount of CRE debt and security investments and the cost basis of net lease properties (amounts in thousands):
| | | | | | | |
| | Amount | | Percentage | |
|---|
CRE Debt | | | | | | | |
First mortgage loans | | $ | 1,552,066 | | | 22.1 | % |
Mezzanine loans | | | 426,709 | | | 6.1 | % |
Credit tenant and term loans | | | 216,868 | | | 3.1 | % |
Subordinate mortgage interests | | | 159,289 | | | 2.3 | % |
Other(1) | | | 298,693 | | | 4.3 | % |
| | | | | | |
Total CRE debt | | | 2,653,625 | | | 37.9 | % |
CRE Securities | | | | | | | |
CMBS | | | 2,767,828 | | | 39.5 | % |
Third-party CDO notes | | | 269,081 | | | 3.8 | % |
Other securities | | | 197,236 | | | 2.8 | % |
| | | | | | |
Total CRE securities | | | 3,234,145 | | | 46.1 | % |
Net Lease | | | | | | | |
Core net lease | | | 404,427 | | | 5.8 | % |
Healthcare net lease | | | 552,415 | | | 7.9 | % |
| | | | | | |
Total net lease | | | 956,842 | | | 13.7 | % |
| | | | | | |
Subtotal NorthStar | | | 6,844,612 | | | 97.7 | % |
| | | | | | |
Sponsored REITs | | | | | | | |
NSREIT(2) | | | 169,365 | | | 2.3 | % |
| | | | | | |
Grand total | | $ | 7,013,977 | | | 100.0 | % |
| | | | | | |
- (1)
- Primarily relates to real estate owned (either directly or through a joint venture) as a result of foreclosure, presented at the principal amount of such loan at time of foreclosure.
- (2)
- Based on consolidated total assets.
6
Table of Contents
Commercial Real Estate Debt
Overview
Our CRE debt business is focused on originating, structuring, acquiring and managing senior and subordinate debt investments secured primarily by commercial and multifamily properties, including first mortgage loans, subordinate mortgage interests, mezzanine loans, credit tenant loans and other loans, including preferred equity interests in borrowers who own such properties. The collateral underlying our CRE debt investments consists primarily of income-producing real estate assets, properties that require some capital investment to increase cash flows or assets undergoing repositionings or conversions. We generally hold these instruments for investment, however, from time-to-time, we may syndicate or sell portions of loans to maximize risk adjusted returns, manage credit exposure and generate liquidity.
We emphasize direct origination of our debt investments as this allows us a greater degree of control over how they are underwritten and structured and it provides us the opportunity to syndicate senior or subordinate interests in the loan, if desired. Further, it allows us to maintain a more direct relationship with our borrowers which helps us maintain a robust pipeline, provides an opportunity for us to earn origination and other fees and offers us an important advantage when considering any potential future modifications or restructurings. We directly underwrote and originated approximately 77% of our current CRE debt investments (excluding our CRE debt investments in the CSE RE 2006-A CDO, or CSE CDO, and CapLease 2005-1 CDO, or CapLease CDO).
We believe that the continued limited availability of debt capital for commercial real estate along with the challenging U.S. and global economic conditions present opportunities for us to obtain attractive terms for both new directly-originated loans and from pre-existing loans acquired from third-party originators, who may be motivated to sell due to liquidity needs or who are exiting the business.
We believe we have built a franchise with a reputation for providing capital to high-quality real estate owners who want a responsive and flexible balance sheet lender. Given that we are a lender who does not generally seek to sell or syndicate the full amount of the loans we originate, we are able to maintain flexibility in how we structure loans to meet the needs of our borrowers. Typical CMBS and other capital markets driven lenders generally could not provide these types of loans due to constraints within their funding structures and because of their requirement to sell the entire loan to third parties and relinquish all control. Our centralized investment organization has enabled senior management to review potential new loans early in the origination process which, unlike many large institutional lenders with several levels of approval required to commit to a loan, allows us to respond quickly and provide a high degree of certainty to our borrowers that we would close a loan on terms substantially similar to those initially proposed. We believe that this level of service has enhanced our reputation in the marketplace. In addition, we believe the early and active role of senior management in our investment and risk management process has been key to maximizing recoveries of invested capital from our investments and our ability to be responsive to changing market conditions.
Underwriting Process
We use a rigorous investment and underwriting process that has been developed and utilized by our senior management team leveraging their extensive commercial real estate expertise over many years and focuses on the following factors designed to ensure each investment is being evaluated appropriately: (i) macroeconomic conditions that may influence operating performance; (ii) fundamental analysis of the underlying real estate collateral, including tenant rosters, lease terms, zoning, operating costs and the asset's overall competitive position in its market; (iii) real estate market factors that may influence the economic performance of the collateral including leasing conditions; (iv) the operating expertise and financial strength of the sponsor or borrower; (v) the cash flow in place and projected to be in place over the term of the loan; (vi) the appropriateness of estimated costs
7
Table of Contents
associated with rehabilitation; (vii) a valuation of the property, our investment basis relative to its value and the ability to liquidate an investment through a sale or refinancing of the underlying asset; (viii) review of third-party reports including appraisals, engineering and environmental reports; (ix) physical inspections of properties and markets; (x) the overall legal structure of the investment, contractual implications and the lenders' rights; and (xi) the tax and accounting impact.
Our Portfolio
As of December 31, 2011, $2.7 billion, or 37.9%, of our assets under management were invested in CRE debt, which includes $299 million principal amount of loans related to certain investments accounted for as joint ventures and real estate owned. Our CRE debt portfolio, excluding amounts related to joint ventures and real estate owned, was comprised of the following (amounts in thousands):
| | | | | | | | | | | | | | | | | | | | | | |
| |
| |
| |
| |
| | Weighted Average | |
|---|
Asset Type: | | Number | | Principal
Amount | | Carrying
Value(1) | | Allocation by
Investment
Type(2) | | Fixed Rate | | Spread
Over | | Spread
Over Prime | |
|---|
First mortgage loans | | | 75 | | $ | 1,552,066 | | $ | 1,094,957 | | | 65.9 | % | | 4.77 | % | | 2.72 | % | | 3.30 | % |
Mezzanine loans | | | 17 | | | 426,709 | | | 334,317 | | | 18.1 | % | | 6.43 | % | | 2.21 | % | | — | |
Subordinate mortgage interests | | | 9 | | | 159,289 | | | 96,565 | | | 6.8 | % | | 6.40 | % | | 3.51 | % | | — | |
Credit tenant loans | | | 55 | | | 147,426 | | | 140,342 | | | 6.3 | % | | 6.49 | % | | — | | | — | |
Term loans | | | 6 | | | 69,442 | | | 44,401 | | | 2.9 | % | | 7.75 | % | | 3.50 | % | | — | |
| | | | | | | | | | | | | | | | |
Total/Weighted average | | | 162 | | $ | 2,354,932 | | $ | 1,710,582 | | | 100.0 | % | | 6.21 | % | | 2.70 | % | | 3.30 | % |
| | | | | | | | | | | | | | | | |
- (1)
- $1.6 billion in carrying value served as collateral for our consolidated CDO financing transactions and the remainder is unleveraged.
- (2)
- Based on principal amount.
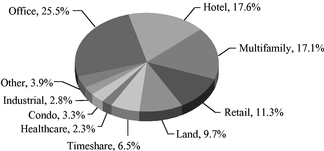
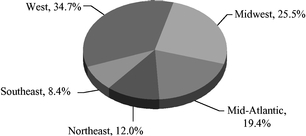
As of December 31, 2011, our $2.4 billion CRE debt portfolio consisted of 162 investments with an average investment size of $14 million.
The portfolio's diversity across property type and geographic location is summarized as follows, based on outstanding principal amount:
| | |
| |
|
|---|
Loan Portfolio by Property Type | | Loan Portfolio by Geographic Location |
| |

|
Commercial Real Estate Securities
Overview
Our CRE securities business is focused on investing in and managing a wide range of CRE securities, including CMBS, unsecured REIT debt and CDO notes backed primarily by CRE securities and debt. Substantially all of our securities have explicit credit ratings assigned by at least one of the
8
Table of Contents
major rating agencies (Moody's Investors Services, Standard & Poor's, Fitch Ratings, Morningstar, DBRS and Kroll, generally referred to as rating agencies) and were typically originally rated investment grade.
We seek to mitigate credit risk through fundamental CRE credit analysis, subordination and diversification. CMBS investments financed with our credit facility are AAA-rated while most of our other CMBS investments are generally junior in right of payment of interest and principal to one or more senior classes but benefit from the support of one or more subordinate classes of securities or other forms of credit support within a securitization transaction. Further, to the extent we become controlling classholder in the future for a CMBS investment, we may appoint ourselves special servicer which would enable us more control over restructurings and fees. The senior unsecured REIT debt we invest in carry similar credit ratings and reflect comparable credit risk. While the expected yield on our securities is sensitive to the performance of the underlying assets, the more subordinated securities, in the case of CMBS, and the REIT issuer's underlying equity, in the case of REIT debt, are designed to bear the first risk of default and loss. In addition to diversification by issuer and security within our CRE securities portfolio, the underlying real estate portfolio represented by each such security are further diversified by number of properties, property type, geographic location and tenant composition.
A summary of the various types of CRE securities we invest in is as follows.
CMBS: CMBS are commercial mortgages pooled in a trust and are principally secured by real property or interests therein having a multifamily or commercial use and located in the United States. Underlying property types include regional malls, neighborhood shopping centers, office buildings, industrial or warehouse properties, hotels, multifamily, self-storage and healthcare facilities.
Unsecured REIT Debt: Substantially all of our unsecured REIT debt consists of non-amortizing senior unsecured notes issued by equity REITs. REITs own a variety of property types with a large number of companies focused on the office, retail, multifamily, industrial, healthcare and hotel sectors. Unsecured REIT debt typically incorporates protective financial covenants and has credit ratings issued by one or more rating agencies. We may also invest in junior unsecured debt or preferred equity of REITs.
CDO Notes: CDO notes are typically collateralized by a combination of CMBS and unsecured REIT debt and may also include CRE first mortgage loans, subordinate mortgage interests and other asset-backed securities as part of their underlying collateral. These assets are held within a special-purpose vehicle that issues rated securities and equity in private securities offerings.
Underwriting Process
Our underwriting process for CRE securities is focused on evaluating both the real estate risk of the underlying assets and the structural protections available to the particular class of securities in which we are investing. We believe that even when a security such as CMBS or REIT debt is backed by a diverse pool of properties, risk cannot be evaluated purely by statistical or quantitative means but must include a fundamental real estate analysis as well. Properties backing loans with identical debt service coverage ratios or loan-to-value ratios can have very different risk characteristics depending on their age, location, lease structure, physical condition and other factors. Our underwriting process seeks to identify those factors that may lead to an increase or decrease in credit quality over time.
When evaluating a CMBS backed by a large number of loans, we combine real estate analysis on individual loans with stress testing of the portfolio under various sets of default and loss assumptions. Unsecured REIT debt is generally evaluated based on the quality, type and location of the property portfolio, the capital structure, debt covenants, financial ratios of the company and management's track record, operating expertise and strategy. Our investment decisions are based on the REIT's ability to withstand financial stress, as well as more subjective criteria related to the quality of management and
9
Table of Contents
of the property portfolio. We use a consistent methodology to evaluate the underlying collateral in a CDO note investment.
Our Portfolio
As of December 31, 2011, $3.2 billion, or 46.1%, of our assets under management were invested in a portfolio of CRE securities. Our CRE securities portfolio consisted of 693 investments with an average investment size of $5 million. As of December 31, 2011, we held the following CRE security investments (amounts in thousands):
| | | | | | | | | | | | | | | | | | | |
Asset Type: | | Number | | Principal
Amount | | Amortized
Cost | | Fair
Value(1) | | Allocation by
Type(2) | | Weighted
Average
Coupon | |
|---|
CMBS | | | 618 | | $ | 2,767,828 | | $ | 1,964,843 | | $ | 1,272,736 | | | 85.6 | % | | 4.42 | % |
Third-party CDO notes | | | 44 | | | 269,081 | | | 210,080 | | | 63,567 | | | 8.3 | % | | 0.86 | % |
Unsecured REIT debt | | | 22 | | | 94,236 | | | 88,870 | | | 94,298 | | | 2.9 | % | | 5.99 | % |
Trust preferred securities | | | 5 | | | 40,000 | | | 35,105 | | | 19,145 | | | 1.2 | % | | 2.47 | % |
Agency debentures | | | 4 | | | 63,000 | | | 16,659 | | | 23,559 | | | 2.0 | % | | NA | |
| | | | | | | | | | | | | | |
Total | | | 693 | | $ | 3,234,145 | | $ | 2,315,557 | | $ | 1,473,305 | | | 100.0 | % | | 4.06 | % |
| | | | | | | | | | | | | | |
- (1)
- $1,358 million in fair value served as collateral for our consolidated CDO financing transactions and $73 million served as collateral for our credit facility as of December 31, 2011. The remainder is either financed under other borrowing facilities or unleveraged.
- (2)
- Based on principal amount.
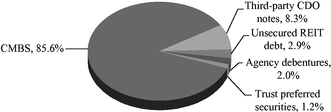
CMBS represents $2.8 billion, or 85.6%, of our CRE securities portfolio. The CMBS portfolio had an average credit rating of B-/B3.
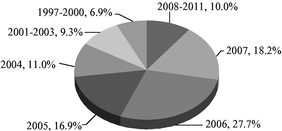
The following charts display our CRE securities by type and CMBS by vintage, based on outstanding principal amount:
| | |
| |
|
|---|
Securities by Type | | CMBS by Vintage |
| |
|
Net Lease Properties
Overview
Our net lease property strategy involves investing primarily in office, industrial, retail and healthcare-related properties across the United States that are net leased to corporate tenants and healthcare operators. Net lease properties are typically leased to a single tenant who agrees to pay basic rent, plus all taxes, insurance, capital and operating expenses arising from the use of the leased property generally leaving us, as owner, with minimal ongoing operational or expense obligations. We may also invest in properties that are leased to tenants for which we are responsible for some of the operating expenses and capital costs. At the end of the lease term, the tenant typically has a right to
10
Table of Contents
renew the lease at market rates or to vacate the property with no further ongoing obligation. Accordingly, we target properties that are located in primary or secondary markets with strong demand fundamentals and that have a property design and location that make them suitable and attractive for alternative tenants.
Underwriting Process
Our core net lease property investments are underwritten utilizing our skills in evaluating real estate market and property fundamentals, real estate residual values and tenant credit. At inception and throughout the life of our ownership, we conduct detailed tenant credit analyses to assess, among other things, the potential for credit deterioration and lease default risk. This analysis is also used to measure the adequacy of landlord protection mechanisms incorporated into the underlying lease. Our process includes sub-market and property-level due diligence in order to understand downside investment risks, including quantifying the costs associated with tenant defaults and re-leasing scenarios. We typically perform physical inspections of the properties, review the environmental reports, evaluate title and undertake other due diligence procedures. We also evaluate stress scenarios to understand refinancing risk.
Our healthcare net lease property investments are underwritten utilizing a comprehensive analysis of the profitability of a targeted business or facility, its cash flow, occupancy, patient and payer mix (public versus private), financial trends in revenues and expenses, barriers to competition, the need in the market for the type of healthcare services provided by the business or the facility, the strength of the location and the underlying value of the business or the facility, as well as the financial strength and experience of the operator of the business or the facility.
Our Portfolio
As of December 31, 2011, we held the following net lease investments (amounts in thousands):
| | | | | | | | | | | | | |
Type of Property | | Number | | Cost
Basis(1)(2) | | % of Cost | | Rental
Cash Flow(3) | |
|---|
Core net lease(4) | | | | | | | | | | | | | |
Office | | | 12 | | $ | 310,620 | | | 76.8 | % | $ | 23,388 | |
Retail | | | 11 | | | 67,794 | | | 16.8 | % | | 6,212 | |
Industrial | | | 1 | | | 26,013 | | | 6.4 | % | | 868 | |
| | | | | | | | | | |
Subtotal | | | 24 | | | 404,427 | | | 100.0 | % | | 30,468 | |
Healthcare net lease | | | | | | | | | | | | | |
Assisted living facilities (ALF) | | | 42 | | | 305,522 | | | 55.3 | % | | 21,325 | |
Skilled nursing facilities (SNF) | | | 31 | | | 179,680 | | | 32.5 | % | | 17,393 | |
Life science buildings (LSB) | | | 3 | | | 45,475 | | | 8.2 | % | | 3,708 | |
Independent living facilities (ILF) | | | 5 | | | 16,955 | | | 3.1 | % | | 3,164 | |
Medical office building (MOB) | | | 1 | | | 4,783 | | | 0.9 | % | | 192 | |
| | | | | | | | | | |
Subtotal | | | 82 | | | 552,415 | | | 100.0 | % | | 45,782 | |
| | | | | | | | | | | |
Total | | | 106 | | $ | 956,842 | | | | | $ | 76,250 | |
| | | | | | | | | | | |
- (1)
- Represents our cost basis, including net purchase price allocations of $42 million related to intangible assets.
- (2)
- Excludes certain real estate owned of $320 million as the result of foreclosure, of which the principal amount of such loans at the time of foreclosure was $119 million.
- (3)
- Represents contractual base rent, excluding the effects of straight-line rent annualized based on fourth quarter 2011 amounts.
- (4)
- Includes a $28 million property owned through a joint venture investment.
11
Table of Contents
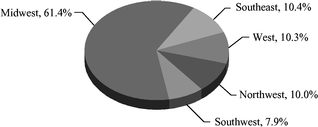
Core Net Lease Properties
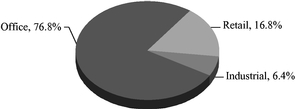
As of December 31, 2011, $404 million, or 5.8%, of our total assets under management were invested in our core net lease properties, consisting of a portfolio of office, retail and industrial facilities totaling 3.2 million square feet. As of December 31, 2011, our core net lease properties had a weighted average remaining lease term of 6.4 years and were 94% leased. The following summarizes our core net lease portfolio's diversity across property type and geographic location as of December 31, 2011, based on purchase price, or cost.
| | |
| |
|
|---|
Core Net Lease by Property Type | | Core Net Lease by Geographic Location |
| |
|
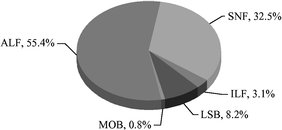
Healthcare Net Lease Properties
As of December 31, 2011, $552 million, or 7.9%, of our assets under management were invested in our healthcare net lease properties, with a focus on the senior housing sector which includes assisted living, skilled nursing and independent living facilities. Our portfolio was comprised of 42 assisted living facilities (ALF), 31 skilled nursing facilities (SNF), three life science buildings (LSB), five independent living facilities (ILF) and one medical office building (MOB). As of December 31, 2011, 100% of our net lease healthcare portfolio was leased to third-party operators with weighted average lease coverage of 1.4x and a 7.7 year weighted average remaining lease term. The following summarizes our healthcare portfolio by property type and geographic location as of December 31, 2011, based on purchase price.
| | |
| |
|
|---|
Healthcare Net Lease by Property Type | | Healthcare Net Lease by Geographic Location |
| |
|
Asset Management and Other
Our asset management and other activities are focused on:
- •
- Managing CDO financing transactions on a fee basis.
We manage eleven CDOs representing $6.1 billion of assets based on principal amount, nine of which were sponsored by us, or the N-Star CDOs. In addition, we have acquired the equity interests of two CDOs that have been integrated into our platform, the CSE CDO and the CapLease CDO, which we herein collectively refer to as our acquired CDOs. In the case of the CSE CDO, we were delegated the collateral management and special servicing rights and for the
12
Table of Contents
CapLease CDO, we acquired the collateral management rights. Five of the CDOs are primarily collateralized by CRE debt and six are primarily collateralized by CRE securities.
We consolidate these CDO financing transactions under accounting principles generally accepted in the United States, or U.S. GAAP. As a result, the collateral management fees we earn and receive in cash are eliminated in the consolidated statements of operations.
- •
- Sponsoring and advising on a fee basis, our Sponsored REITs.
In connection with our current Sponsored REIT, we manage the day-to-day affairs including identifying, originating, acquiring and managing investments on its behalf, and we earn advisory and other fees for these services, which vary based on the amount of assets under management, investment activity and investment performance.
In addition, NorthStar Realty Securities, LLC (formerly known as NRF Capital Markets, LLC), or NorthStar Realty Securities, our wholly-owned broker-dealer subsidiary, distributes equity for our Sponsored REITs. NorthStar Realty Securities is currently raising equity capital for NSREIT and we expect that NorthStar Realty Securities will assist us in the future in accessing diverse sources of capital for other companies that may be sponsored and managed by us.
- •
- Acting as special servicer for our owned (and potentially third-party owned) CMBS.
We are a rated special servicer by Standard & Poor's and Fitch Ratings and have been approved by Moody's Investor Services in connection with a recent transaction. We currently own over 600 CMBS investments. To the extent we become the controlling classholder in the future for our CMBS investments, we may appoint ourselves special servicer, which would, among other things, provide us more control over restructurings and special servicing fees.
Other Opportunistic Investments
We also pursue other opportunistic investments that we expect will generate attractive risk-adjusted returns, such as repurchasing our CDO bonds at a significant discount to principal amount. These CDO bonds typically have significant credit support and, when we repurchase a CDO bond, we generally expect the CDO bonds will be repaid at par.
As of December 31, 2011, we owned $555 million principal amount of our CDO bonds unleveraged, of which $376 million were repurchased with a weighted average original rating of AA/Aa3 and an average price of 31%. Because our CDO financing transactions are consolidated under U.S. GAAP, these CDO bonds are not presented as an investment but rather are eliminated in our consolidated financial statements. We will generate cash flows in future periods through the interest payable on these bonds, as well as realizing (in cash) the discount when the bonds repay. This realization of the discount will not be reported as a gain under U.S. GAAP.
Financing Strategy
We seek to access a wide range of secured and unsecured debt and public and private equity capital sources to fund our investment activities and asset growth. Since our IPO in 2004, we have completed preferred and common equity offerings raising approximately $1.0 billion of aggregate net proceeds. We have also raised $286 million of long-term, subordinated debt capital that is equity-like in nature due to its 30-year term (at the time of issuance) and relatively few covenants. In addition, we have raised $425 million of unsecured exchangeable senior notes, of which $229 million is outstanding as of December 31, 2011.
We use asset-level financing as part of our strategy and we seek to match-fund our assets and liabilities by having similar maturities and like-kind interest rate benchmarks (fixed or floating) to manage refinancing and interest rate risk. We seek access to diverse sources of short and long-term
13
Table of Contents
financing to enable us to prudently leverage our assets and deliver attractive risk-adjusted returns to our stockholders.
Our CRE debt and security portfolios are predominantly financed through long-term, non-recourse CDOs. We currently use secured term credit facilities provided by major financial institutions to fund new investments until permanent financing is available. However, we believe the terms of these facilities are flexible enough to provide sufficient term financing to match the underlying assets to the extent the securitization market remains inaccessible.
In our N-Star CDOs, rated CDO bonds are issued and backed by pools of collateral originated or acquired by us. The CDO bonds are non-recourse and the collateral is used to service the interest payments on the rated CDO bonds. After a reinvestment period, which is typically five years, principal from collateral payoffs is used to amortize the CDO bonds, so there is no maturity risk. We typically have sold all of the investment-grade rated CDO bonds and retained the non-investment grade subordinate classes and equity notes which we refer to as our retained equity interest in the CDO. CDO financings provided low-cost borrowing because the majority of the liabilities we issued were the most senior bond classes which were rated "AAA/Aaa" by the rating agencies, and therefore had the lowest cost of funds.
Our net lease properties are typically financed with non-recourse mortgages. We seek to match the term of the financing with the remaining lease term of the properties.
Given the nature of our financing arrangements, we expect to maintain our borrowings at or near our current levels for our existing investments. Borrowing levels may change for new investments depending upon the nature of the assets and the related financing. Our financing strategy for current or future investments is dependent on our ability to obtain the match-funded borrowings at rates that provide a positive net funding spread. Match-funded borrowing was difficult to obtain during the credit crisis. During that time, we focused on using our existing CDO structures to fund future investment activity when repayment or sale proceeds became available within the CDOs or we acquired investments that generated attractive returns without leverage.
We actively seek financing for our businesses of originating loans and acquiring CRE securities. As a result, in the fourth quarter of 2011, we, through two wholly-owned subsidiaries, entered into two new credit facilities with Wells Fargo Bank N.A., or Wells Fargo, a $100 million credit facility to finance the origination of CRE loans and a $100 million credit facility to finance the acquisition of AAA-rated CMBS.
Hedging Strategy
We use derivative instruments primarily to manage interest rate risk exposure. These derivatives are typically in the form of interest rate swap agreements and the primary objective is to manage the interest rate risks associated with our investing and financing activities. The counterparties to these arrangements are major financial institutions with which we may also have other financial relationships.
Creating an effective strategy for dealing with interest rate movements is complex and no strategy can completely insulate us from risks associated with such fluctuations. There can be no assurance that our hedging activities will have the intended impact on our results. A more detailed discussion of our hedging policy is provided in Item 7. "Management's Discussion and Analysis of Financial Condition and Results of Operations—Liquidity and Capital Resources."
Risk Management
We use many methods to actively manage our asset base to preserve our income and capital. For CRE debt and net lease assets, frequent dialogue with borrowers/tenants and inspections of our collateral and owned properties have proven to be an effective process for identifying issues early. For
14
Table of Contents
our healthcare net lease assets, we also consider the impact of regulatory changes on operator performance and property values. Many of our debt investments also require borrowers to replenish cash reserves for items such as taxes, insurance and future debt service costs. Late replenishments of cash reserves also may be an early indicator there could be a problem with the borrower or collateral property. We also may negotiate modifications to debt terms if we believe such modification improves our ability to maximize principal recovery. Modifications may include changes to contractual interest rates, maturity dates and other borrower obligations. When we make a concession, such as reducing an interest rate or extending a maturity date, we may seek to obtain additional collateral, fees and/or upside participation in any value creation of the property in return for the modification, although in a challenging real estate market, obtaining additional collateral from struggling borrowers is difficult. As part of our risk management process, we evaluate the best alternatives for our loans which in some cases, may result in us issuing default notices and beginning foreclosure proceedings when the borrower is not complying with the debt terms where we believe taking control of the collateral as real estate owned, or REO, is the best course of action to protect our capital.
In certain circumstances, we may pursue a debt sale or payoff at a discount to our carrying value. We may agree to a discounted sale or payoff where we believe there is an economic benefit from monetizing the asset in advance of its contractual maturity date. When evaluating a sale or payoff at a discount to carrying value, we also consider the impact such transaction may have on our financing structures, corporate borrowing covenants and income.
Securities generally have a more liquid market than debt and net lease properties, but we typically have very little control over restructuring decisions when there are problems with the underlying collateral. We are a rated special servicer by Standard & Poor's and Fitch Ratings and have been approved by Moody's Investor Services in connection with a recent transaction. We may appoint ourselves as special servicer in CMBS transactions where we become the controlling class holder which will, among other things, provide us more control over restructurings. We manage risk in the securities portfolio by selling assets when we can obtain a price that is attractive relative to its risk. In certain situations, we may sell an asset because there is an opportunity to reinvest the capital into a new asset with a more attractive risk/return profile.
We maintain a comprehensive risk management process that generally includes day-to-day oversight by the portfolio management team, weekly management meetings and a quarterly credit review process. These processes are designed to enable management to evaluate and proactively manage asset-specific credit issues and identify credit trends on a portfolio-wide basis. Nevertheless, we cannot be certain that our review will identify all issues within our portfolio due to, among other things, adverse economic conditions or events adversely affecting specific assets; therefore, potential future losses may also stem from investments that are not identified by our credit reviews. During the quarterly reviews, or more frequently as necessary, investments are put on highly-monitored status and identified for possible impairment based upon several factors, including missed or late contractual payments, significant declines in collateral performance and other data which may indicate a potential issue in our ability to recover our capital from the investment.
Many of our debt investments were made to borrowers who had a business plan to improve the collateral property and who therefore needed a flexible balance sheet lender. Property cash flows are generally lower today than was projected by the borrower for many of our debt investments when they were originated. As a result, some real estate owners are having trouble refinancing their assets at maturity or selling their properties to recoup their capital. Other owners are having trouble achieving their business plans to the extent they acquired a property to reposition it or otherwise invest capital to increase the property's cash flows.
We generally required the borrowers, at the time of origination and/or as required by property performance during the loan term, to pre-fund reserves to cover interest and operating expenses until
15
Table of Contents
the property cash flows increased sufficiently to cover debt service costs. We also generally required the borrower to refill these reserves if they became deficient due to underperformance and if the borrower wanted to exercise an extension option under the loan as some of the borrowers had a recourse obligation to do so. Despite low interest rates and improving real estate fundamentals, we expect that in the future some of our borrowers may still have difficulty servicing our debt.
Each of our debt investments, while primarily backed by CRE collateral, is unique and requires customized risk management strategies for dealing with potential credit situations. The complexity of each situation depends on many factors, including the number of collateral properties, the type of property, macro and local market conditions impacting supply/demand, cash flow and collateral, and the financial condition of our borrowers and their willingness to support our collateral properties.
Our risk management process may lead us to the determination that extending and working out debt, rather than pursuing foreclosure, is the best course of action to maximize total and long-term value. Our impairment analysis often requires that we make assumptions regarding collateral value and the timing with regards to when we receive debt service payments, including principal recovery, and as a result, our analysis can be highly subjective and uncertain.
Our CRE debt and security investments are predominantly financed in CDOs. We consolidate the CDO financing transactions under U.S. GAAP regardless of whether we retained the equity interests for our sponsored CDOs or acquired the equity interests of other CDOs. When we refer to equity interests in a CDO, we are collectively referring to subordinate CDO bonds, preferred shares and equity notes. The CDOs require that we meet tests in order to receive regular cash flow distributions on our subordinate CDO bonds and equity notes. Our risk management process is also focused on actively monitoring and managing our CDO financing transactions. A more detailed discussion of our CDO financing structures are provided in Item 7. "Management's Discussion and Analysis of Financial Condition and Results of Operations—Liquidity and Capital Resources."
Regulation
We are subject, in certain instances, to supervision and regulation by state and federal governmental authorities and may be subject to various laws and judicial and administrative decisions imposing various requirements and restrictions, which, among other things: (1) regulate credit granting activities; (2) require disclosures to customers; (3) govern secured transactions; and (4) set collection, foreclosure, repossession and claims-handling procedures and other trade practices. Although most states do not regulate commercial finance, certain states impose limitations on interest rates and other charges and on certain collection practices and creditor remedies and require licensing of lenders and financiers and adequate disclosure of certain contract terms. We are also required to comply with certain provisions of the Equal Credit Opportunity Act that are applicable to CRE loans.
We believe that we are not, and intend to conduct our operations so as not to become regulated as an investment company under the Investment Company Act of 1940, as amended, or the Investment Company Act. We have relied, and intend to continue to rely on current interpretations of the staff of the Securities and Exchange Commission, or the SEC, in an effort to continue to qualify for an exemption from registration under the Investment Company Act. For more information on the exemptions that we utilize refer to Item 1A. "Risk Factors—Maintenance of our Investment Company Act exemption imposes limits on our operations."
We do not believe we or our subsidiaries are required to register as an investment advisor under the Investment Advisors Act of 1940. Such registration could result in us being supervised by the SEC and require our compliance with numerous obligations, including record-keeping requirements, operational procedures and disclosure obligations.
16
Table of Contents
We have elected and expect to continue to make an election to be taxed as a REIT under Section 856 through 860 of the Internal Revenue Code of 1986, as amended, or the Code. As a REIT, we must currently distribute, at a minimum, an amount equal to 90% of our taxable income. In addition, we must distribute 100% of our taxable income to avoid paying corporate federal income taxes. REITs are also subject to a number of organizational and operational requirements in order to elect and maintain REIT status. These requirements include specific share ownership tests and assets and gross income composition tests. If we fail to qualify as a REIT in any taxable year, we will be subject to federal income tax (including any applicable alternative minimum tax) on our taxable income at regular corporate tax rates. Even if we qualify for taxation as a REIT, we may be subject to state and local income taxes and to federal income tax and excise tax on our undistributed income.
On April 20, 2010, NorthStar Realty Securities became registered with the SEC and a member of the Financial Industry Regulatory Authority, or FINRA. Much of the regulation of broker-dealers has been delegated to self-regulatory organizations, or SROs, principally FINRA, that adopt and amend rules, subject to approval by the SEC, which govern their members and conduct periodic examinations of member firms' operations. The SEC, SROs and state securities commissions may conduct administrative proceedings that can result in censure, fine, suspension or expulsion of a broker-dealer, its officers or employees. Such administrative proceedings, whether or not resulting in adverse findings, can require substantial expenditures and can have an adverse impact on the reputation of a broker-dealer.
As a registered broker-dealer, NorthStar Realty Securities is required by federal law to belong to the Securities Investor Protection Corporation, or SIPC. When the SIPC fund falls below a certain amount, members are required to pay annual assessments to replenish the reserves. Our broker-dealer subsidiary will be required to pay 0.25% of net operating revenues as a special assessment. As of December 31, 2011, we have incurred an immaterial amount of special assessment charges. The SIPC fund provides protection for securities held in customer accounts up to $500,000 per customer, with a limitation of $100,000 on claims for cash balances, although NorthStar Realty Securities does not hold any customer accounts.
In addition, as a registered broker-dealer and member of FINRA, NorthStar Realty Securities is subject to the SEC's Uniform Net Capital Rule 15c3-1, which is designed to measure the general financial integrity and liquidity of a broker-dealer and requires the maintenance of minimum net capital. Net capital is defined as the net worth of a broker-dealer subject to certain adjustments. In computing net capital, various adjustments are made to net worth that exclude assets not readily convertible into cash. Additionally, the regulations require that certain assets, such as a broker-dealer's position in securities, be valued in a conservative manner so as to avoid over-inflation of the broker-dealer's net capital. We believe the net capital requirement is immaterial.
We own and manage a portfolio of healthcare net lease properties, with a focus on the senior housing sector. As such, we or our operators, as the case may be, are subject to numerous federal, state and local laws and regulation that are subject to frequent and substantial changes (sometimes applied retroactively) resulting from legislation, adoption of rules and regulations and administrative and judicial interpretations of existing laws.
We are also subject to regulation with respect to certain of our loan servicing activities, such as Regulation AB.
In the judgment of management, existing statutes and regulations have not had a material adverse effect on our business. However, it is not possible to forecast the nature of future legislation, regulations, judicial decisions, orders or interpretations, nor their impact upon our future business, financial condition, results of operations or prospects.
17
Table of Contents
Competition
We have in the past been subject to significant competition in seeking real estate investments. Historically, we have competed with many third parties engaged in real estate investment activities including other REITs, specialty finance companies, savings and loan associations, banks, mortgage bankers, insurance companies, mutual funds, private institutional funds, hedge funds, private opportunity funds, investment banking firms, governmental bodies and other entities. Some of these competitors, including other REITs and private real estate companies and funds, have substantially greater financial resources than we do. They may also enjoy significant competitive advantages that result from, among other things, a lower cost of capital and enhanced operating efficiencies.
Although the current environment is less competitive compared to historical periods, future competition from new market entrants may limit the number of suitable investment opportunities offered to us. It may also result in higher prices, lower yields and a narrower spread of yields over our borrowing costs, making it more difficult for us to acquire new investments on attractive terms.
Employees
As of December 31, 2011, we had 107 employees. Management believes that a major strength of NorthStar is the quality and dedication of our people. We maintain a work environment that fosters professionalism, excellence, diversity and cooperation among our employees.
Corporate Governance and Internet Address
We emphasize the importance of professional business conduct and ethics through our corporate governance initiatives. Our board of directors consists of a majority of independent directors; the audit, nominating and corporate governance and compensation committees of our board of directors are composed exclusively of independent directors. We have adopted corporate governance guidelines and a code of business conduct and ethics, which delineate our standards for our officers, directors and employees.
Our internet address iswww.nrfc.com. The information on our website is not incorporated by reference in this Annual Report on Form 10-K. We make available, free of charge through a link on our site, our annual reports on Form 10-K, quarterly reports on Form 10-Q, current reports on Form 8-K, and amendments to such reports, if any, as filed or furnished with the SEC, as soon as reasonably practicable after such filing or furnishing. Our site also contains our code of business conduct and ethics, code of ethics for senior financial officers, corporate governance guidelines and the charters of our audit committee, nominating and corporate governance committee and compensation committee of our board of directors. Within the time period required by the rules of the SEC and the New York Stock Exchange, or NYSE, we will post on our website any amendment to our code of business conduct and ethics and our code of ethics for senior financial officers as defined in the code.
Item 1A. Risk Factors
The following risk factors and other information included in this Annual Report on Form 10-K should be carefully considered. The risks and uncertainties described below are not the only ones we face. Additional risks and uncertainties not presently known to us or that we currently deem immaterial also may adversely impact our business. If any of the following risks occur, our business, financial condition, operating results, cash flows and liquidity could be materially adversely affected.
18
Table of Contents
Risks Related to Our Businesses
The CRE finance industry has been and may continue to be adversely affected by economic conditions in the U.S. and global financial markets generally.
Our business and operations is dependent on the CRE finance industry generally, which in turn is dependent upon broad economic conditions in the U.S. and abroad. Despite some recent improvements, the U.S. economy is continuing to experience relatively high unemployment and slow growth. A worsening of economic conditions would likely have a negative impact on the CRE finance industry generally and on our business and operations specifically. Additionally, disruptions in the global economy, whether as a result of the Euro-zone debt crisis, regional conflict or otherwise, may also have a negative impact on the CRE market domestically. Adverse conditions in the CRE finance industry could harm our business and financial condition by, among other factors, reducing the value of our existing assets, limiting our access to debt and equity capital, harming our ability to originate new CRE debt and otherwise negatively impacting our operations.
Liquidity is essential to our businesses and we rely on outside sources of capital that have been negatively impacted by U.S. and global economic conditions.
We require significant outside capital to fund and grow our businesses. A primary source of liquidity for us has been the equity and debt capital markets, including issuances of common equity, preferred equity, trust preferred securities and exchangeable senior notes. Access to the capital markets and other sources of liquidity was severely disrupted during the relatively recent credit crisis and, despite some improvements in 2011, the markets could suffer another severe downturn and another liquidity crisis could emerge. If we are unable to obtain sufficient capital on acceptable terms, our business, ability to operate and liquidity could be severely impacted. For information about our available sources of funds, refer to Part II Item 7. "Management's Discussion and Analysis of Financial Condition and Results of Operations—Liquidity and Capital Resources" and the notes to the consolidated financial statements located in Part II Item 8. of this Annual Report on Form 10-K.
Our CDO bonds payable have certain coverage tests that are required to be met in order for payments to be made to our retained equity interests in the CDO. Failing coverage tests could significantly impact our cash flow and overall liquidity position.
Our CDO bonds payable generally require that the underlying collateral and cash flow generated by the collateral be in excess of ratios stipulated in the related indentures. These overcollateralization, or OC, and interest coverage, or IC, tests are used primarily to determine whether and to what extent principal and interest proceeds on the underlying collateral may be used to pay principal of, and interest on, our retained equity interests in the CDOs. Our CDOs are collateralized by CRE debt and securities, with a majority of our equity invested in our real estate debt CDOs. Uncured defaults on CRE debt and rating agency downgrades on CMBS are the primary causes for decreases in the OC and IC tests. In the event these tests are not met, cash flow that would normally be distributed to us would be used to amortize the senior CDO bonds until the CDO is back in compliance with the tests. Even if we have control because we may have originated a loan and even when we may be able to appoint ourselves as special servicer in connection with a CMBS investment, we may be unable to prevent adverse conditions that could negatively affect our cash flow and overall liquidity position.
As of December 31, 2011, all of our real estate debt CDOs were in compliance with their OC and IC tests. Four of our N-Star securities CDOs (I, II, V and VII) were out of compliance with their respective OC tests and we expect that complying with OC and IC tests will continue to be difficult. Weaker than expected economic conditions, deterioration of the CRE market and credit rating downgrades of real estate securities will make complying with OC and IC tests more difficult or even
19
Table of Contents
impossible in the future. Our failure to satisfy the coverage tests could adversely affect our operating results, liquidity and cash flows.
The reinvestment period for three of our CDOs will expire in 2012 and the reinvestment periods for our other CDOs expired prior to December 31, 2011.
During the reinvestment period of our CDOs, we are allowed to reinvest principal payments on the underlying assets into qualifying replacement collateral. The reinvestment period for two of our CDO's (CSE CDO and N-Star CDO VIII) just ended in January 2012 and February 2012, respectively, while the reinvestment period for N-Star CDO IX ends in June 2012. Because we will be unable to reinvest principal in these CDOs after the reinvestment period ends, principal repayments after the reinvestment period ends will pay down the senior bonds, which will delever the CDO and negatively impact our cash flow. Additionally, our ability to reinvest has been instrumental in maintaining OC and IC ratios under our CDOs. Following the end of the reinvestment period in our CDOs, our ability to maintain the OC and IC ratios will be negatively impacted, which could adversely affect our cash flow and results of operation.
We retain the equity interests in our CDOs, which entails certain risks, including that these interests are the most junior interests and receive distributions only if the CDO generates enough cash flow to pay all of the other senior CDO bonds.
Our retained equity interests in the CDOs represent leveraged investments in the underlying assets. The senior CDO bonds participate in the cash flow in CDOs and distributions on equity interests are generally made only after payment of interest on, and principal of, the senior CDO bonds. Although generally there is no interest or principal due on the equity notes, distributions may be made to us as holders of the equity interests on each payment date only after all of the other required payments are made. There will be little or no cash flow available to our equity interests if there are defaults by the obligors under the underlying collateral and those defaults exceed a certain amount. In that event, the value of our investment in our CDOs could decrease quickly and substantially. There can be no assurance that after making required payments on the senior CDO bonds there will be any remaining funds available to pay us. Accordingly, our equity interests may not be paid in full and we may be subject to a loss of all or part of our interest in the event that payments are not made on the underlying assets or losses are incurred with respect to the underlying assets, which could have a material adverse effect on us.
A payment default on our CDO bonds could have a compounding effect on our other CDOs.
Certain of our CDOs have invested in CDO bonds issued by other CDOs that we sponsored and/or acquired. Such investments expose us to increased risk, as defaults in any particular CDO would also affect another CDO that owns bonds in the CDO that experiences defaults. Defaults across certain of our CDOs could, therefore, have a material impact on the cash flow of other CDOs that we own that may not have otherwise experienced such an impact.
We are unable to complete additional CDOs due to the decreased liquidity in the CRE finance market.
We historically accessed the securitization markets to finance our CRE debt and security investments with non-recourse, long-term liabilities which were structured as CDOs. Issuing long-term financing, such as CDO bonds, has historically been an important part of our overall business plan. Despite improvements in market liquidity, we currently believe structured CDO financing may not be available for the foreseeable future, if ever.
20
Table of Contents
The documentation governing our CDOs is complex and contains certain ambiguities that are subject to interpretation.
Each of our CDOs is governed by an indenture, collateral management agreement and other documentation. The documents are complex and collectively describe the conditions upon which we can sell assets and reinvest principal proceeds and set forth covenants and other provisions to which we and the CDOs are subject. In certain circumstances, the performance of the underlying CDO collateral has raised ambiguities in our CDO documentation. Although we have as a general matter been able to reach agreement with our CDO trustees as to how the CDO documentation should be interpreted, it is possible that we and our CDO trustees may not be able to reach agreement on important CDO documentation provisions in the future. To the extent we and our CDO trustees are unable to resolve any differences in the interpretation of CDO documentation, or if third parties, such as bondholders or other parties, do not agree with conclusions that are reached by us and/or the CDO trustees, our ability to manage the underlying collateral, and thus maintain the IC and OC ratios and otherwise optimize the performance of our CDOs, may be adversely affected. We could take a position, inadvertently or otherwise, that a court ultimately determines constitutes a breach of the underlying agreements and the results of such a determination could have a material adverse affect on our business and financial condition.
Challenging economic and financial market conditions could significantly reduce the amount of income we earn on our CRE debt investments and further reduce the values of our investments.
Challenging economic and financial market conditions have caused us to experience an increase in the number of CRE debt investments that result in delinquencies, foreclosures and non-performing assets and a decrease in the value of the property or other collateral which secures our CRE loans, all of that could adversely affect our results of operations. Loan defaults result in a decrease in interest income and may require the establishment of, or an increase in, provision for loan losses. The decrease in interest income resulting from a loan default may continue for a prolonged period of time as we seek to recover, primarily through legal proceedings, the outstanding principal amount, accrued interest and default interest due on a defaulted CRE debt investment. Legal proceedings, which may include foreclosure actions and bankruptcy proceedings, are expensive and time consuming and we may still never recover all or a portion of our principal. The decrease in interest income and the costs involved in pursuing our legal remedies will reduce the amount of cash available to meet our expenses and adversely impact our liquidity and operating results.
Real estate debt restructurings may reduce our net interest income.
Although the CRE market has exhibited signs of recovery, we may continue to need to restructure our real estate debt investments. In order to preserve long-term value, we are often required to lower the interest rate on our loans in connection with a restructuring, which will have an adverse impact on our net interest margin. We may also determine to extend the time to maturity on our real estate debt investments and make other concessions with the goal of increasing overall value but there is no assurance that the results of our restructurings will be favorable to us.
We may be unable to restructure loans in a manner that we believe maximizes value, particularly if we are one of multiple creditors in large capital structures.
In the current environment, in order to maximize value we may be more likely to extend and work out a loan, rather than pursue foreclosure. However, in situations where there are multiple creditors in large capital structures, it can be particularly difficult to assess the most likely course of action that a lender group or the borrower may take and it may also be difficult to achieve consensus among the lender group as to major decisions. Consequently, there could be a wide range of potential principal recovery outcomes, the timing of which can be unpredictable, based on the strategy pursued by a
21
Table of Contents
lender group and/or by a borrower. These multiple creditor situations tend to be associated with our larger loans. We, as one of a group of lenders, are often a lender on a subordinated basis, and may not independently control the decision making. Consequently, we may be unable to restructure a loan in a manner that we believe would maximize value. Risks associated with our largest multiple creditor loans are described in more detail in Item 7. "Management's Discussion and Analysis of Financial Condition and Results of Operations—Risk Management."
We have restructured certain CRE investments in the past in an effort to maximize the value of our investment, however, there is no assurance that our restructurings will be successful and we may still lose some or all of our investment.
Examples of CRE investments we have restructured include our:
- •
- $110 million (22%) equity interest in Meadowlands Two, LLC, which holds 100% of Meadowlands One, LLC, or Meadowlands One, which is secured by a retail/entertainment complex located in East Rutherford, New Jersey, or the NJ Property. During the third quarter 2010, Meadowlands One took effective ownership of the NJ Property. Meadowlands One is in the process of seeking to recapitalize the NJ Property. While Meadowlands One has entered into an agreement with a developer, who is covering the majority of costs of operating the asset, there is no assurance that a recapitalization will be completed or that a recapitalization will be completed on terms acceptable to us. As of December 31, 2011, our carrying value in the NJ Property is $66 million.
- •
- $89 million mezzanine loan, or the NV Loan, that is secured by the Hard Rock Hotel and Casino in Las Vegas, Nevada, or Hard Rock. We, along with certain of the other lenders, and the borrower and its affiliates under the NV Loan, have completed a long-term restructuring of the NV Loan. As part of the restructuring, Brookfield took ownership of Hard Rock and entered into a seven-year loan with the existing senior lender, subject to achieving certain tests, and we retained our $89 million mezzanine loan (or its economic equivalent), as well as an equity participation in Hard Rock. There is no assurance that the restructured NV Loan will be successful over time. As of December 31, 2011, our carrying value in the NV Loan is $45 million.
- •
- €43 million participation in a mezzanine loan that is collateralized by a German retail portfolio that is net leased to a single tenant that filed for bankruptcy in Germany, or the German Loan. The German Loan was restructured in 2010 and since restructuring, the loan has been performing. However, there can be no assurance that the German Loan will not default in the future, including at maturity which is July 2014. As of December 31, 2011, our carrying value in the €43 million participation is $56 million.
We may lose a portion or all of our restructured investments, which could have a material adverse effect on our business and operations.
Our borrowers may be unable to achieve their business plans due to the difficult U.S. and global economic conditions, which could cause incremental stress in our CRE debt portfolio.
Many of our CRE debt investments were made to borrowers who had business plans to improve occupancy and cash flows that have not been accomplished due to the challenging economic conditions. U.S. economic conditions, including high unemployment and slow growth, along with overall financial uncertainty, have resulted in lower occupancy rates and lower lease rates across many property types and created obstacles for our borrowers attempting to achieve their business plans. If our borrowers are unable to achieve their business plans, the related CRE loans could go into default and severely impact our operating results and cash flows.
22
Table of Contents
Many of our CRE debt investments are funded with interest reserves and our borrowers may be unable to replenish those interest reserves once they run out.
Given the transitional nature of many of our CRE loans, we generally required borrowers to pre-fund reserves to cover interest and operating expenses until the property cash flows increased sufficiently to cover debt service costs. We also generally required the borrower to refill these reserves if they became deficient due to underperformance and if the borrower wanted to exercise extension options under the loan. Despite low interest rates and improving real estate fundamentals, we expect that in the future our borrowers may still have difficulty servicing our debt. Many of our borrowers have only been able to meet their obligations to us because of the reserves we set up at the origination of our loans. We expect that in the future, many of the reserves will run out and some of our borrowers will have difficulty servicing our debt and will not have sufficient capital to replenish reserves, which could have a significant impact on our operating results and cash flow.
Our investments have been and may continue to be adversely affected by widening credit spreads.
Our investments in CRE debt and securities are subject to changes in credit spreads. When credit spreads widen as they did in 2008 and early 2009, the economic value of our existing investments decrease. Although credit spreads are tighter now than in 2008 and early 2009, if we originated or acquired a new investment today, such investment would likely still carry a greater credit spread than that attributable to our existing investments. Even though such investment may be performing in accordance with its terms and the underlying collateral has not changed, the economic value of our CRE debt and security portfolios have been negatively impacted, and may continue to be negatively impacted, by recent and any further credit spread widening.
Additionally, in the past, a source of liquidity for us was the voluntary repayment of loans. A result of the credit crisis has been a severe shortage of debt capital and/or an increased cost of capital for those borrowers needing to refinance maturing loans. If borrowers are not able to refinance loans at their maturity, the loans could go into default and the liquidity that we would receive from such repayments will not be available. Furthermore, given the reduced availability and higher cost of capital in the CRE finance market, borrowers that are performing on their loans will most likely extend such loans if they have that right, which will further delay our ability to access liquidity through repayments.
Higher provision for loan losses are expected if economic conditions do not improve significantly.
If the U.S. economy does not improve significantly, we will likely continue to experience significant defaults resulting in provision for loan losses and asset impairment charges in 2012. Borrowers may also be less able to pay principal amounts and interest on loans if the economy does not continue to strengthen and they continue to experience financial stress. Declines in real property values also increase loan-to-value ratios on our loans and, therefore, weaken our collateral coverage and increase the likelihood of higher provision for loan losses. Even if our cash flow remains relatively stable, we could suffer significant losses in accordance with U.S. GAAP which could adversely affect our stock price.
Provision for loan losses are difficult to estimate in a challenging economic environment.
Our provision for loan losses is evaluated on a quarterly basis. Our determination of provision for loan losses requires us to make certain estimates and judgments, which have been, and may continue to be, difficult to determine given the challenges arising from the U.S. economic conditions and recent disruptions in the global markets. While CRE fundamentals have begun to improve, our estimates and judgments are based on a number of factors, including projected cash flows from the collateral securing our CRE debt, structure, including the availability of reserves and recourse guarantees, likelihood of repayment in full at the maturity of a loan, potential for refinancing and expected market discount
23
Table of Contents
rates for varying property types, all of which remain uncertain. Our estimates and judgments may not be correct and, therefore, our results of operations and financial condition could be severely impacted.
The CRE debt we originate and the commercial mortgage loans underlying the CMBS we invest in are subject to risks of delinquency, foreclosure, loss and bankruptcy of the borrower under the loan. If the borrower defaults, it may result in losses to us.
Mortgage loans are secured by real estate and are subject to risks of delinquency, foreclosure, loss and bankruptcy of the borrower, all of which are and will continue to be prevalent if the overall economic environment does not continue to improve. The ability of a borrower to repay a loan secured by real estate is typically dependent primarily upon the successful operation of such property rather than upon the existence of independent income or assets of the borrower. If the net operating income of the property is reduced or is not increased, depending on the borrower's business plan, the borrower's ability to repay the loan may be impaired. Net operating income of a property can be affected by, among other things:
- •
- macroeconomic and local economic conditions;
- •
- tenant mix;
- •
- success of tenant businesses;
- •
- property management decisions;
- •
- property location and condition;
- •
- property operating costs, including insurance premiums, real estate taxes and maintenance costs;
- •
- competition from comparable types of properties;
- •
- changes in governmental rules, regulations and fiscal policies, including environmental legislation;
- •
- changes in laws that increase operating expenses or limit rents that may be charged;
- •
- any need to address environmental contamination at the property;
- •
- the occurrence of any uninsured casualty at the property;
- •
- changes in national, regional or local economic conditions and/or specific industry segments;
- •
- declines in regional or local real estate values;
- •
- branding, marketing and operational strategies;
- •
- declines in regional or local rental or occupancy rates;
- •
- increases in interest rates;
- •
- real estate tax rates and other operating expenses;
- •
- acts of God;
- •
- social unrest and civil disturbances;
- •
- terrorism; and
- •
- increases in costs associated with renovation and/or construction.
Any one or a combination of these factors may cause a borrower to default on a loan or to declare bankruptcy. If a default or bankruptcy occurs and the underlying asset value is less than the loan amount, we will suffer a loss.
24
Table of Contents
Additionally, we may suffer losses for a number of reasons, including the following, which could have a material adverse effect on our financial performance.
- •
- If the value of real property or other assets securing our CRE debt deteriorates. The majority of our CRE debt portfolio is fully or substantially non-recourse, although a large amount of our CRE debt provides for interest reserve replenishments which are recourse. In the event of a default by a borrower on a non-recourse loan, we will only have recourse to the real estate-related assets (including escrowed funds and reserves, if any) collateralizing the debt. For this purpose, we consider CRE debt made to special purpose entities formed solely for the purpose of holding and financing particular assets to be non-recourse. We sometimes also originate CRE debt that is secured by equity interests in the borrowing entities or by investing directly in the owner of the property. There can be no assurance that the value of the assets securing our CRE debt portfolio will not deteriorate over time due to factors beyond our control, as was the case during the credit crisis and as a result of the recent economic recession. Mezzanine loans are subject to the additional risk that senior lenders may be directly secured by the real estate assets of the borrowing entity, whereas the mezzanine loans may be secured by ownership interests in the borrower.
- •
- If a borrower or guarantor defaults on recourse obligations under a CRE debt investment. We sometimes obtain personal or corporate guarantees, which are not secured, from borrowers or their affiliates. These guarantees are often triggered only upon the occurrence of certain trigger events. In cases where guarantees are not fully or partially secured, we typically rely on financial covenants from borrowers and guarantors which are designed to require the borrower or guarantor to maintain certain levels of creditworthiness. As a result of the recent economic recession and persisting market conditions, many borrowers and guarantors faced, and continue to face, financial difficulties and were unable, and may continue to be unable, to comply with their financial covenants. If the economy does not strengthen, our borrowers could experience additional financial stress. Where we do not have recourse to specific collateral pledged to satisfy such guarantees or recourse loans, we will only have recourse as an unsecured creditor to the general assets of the borrower or guarantor, some or all of which may be pledged to satisfy other lenders. There can be no assurance that a borrower or guarantor will comply with its financial covenants or that sufficient assets will be available to pay amounts owed to us under our CRE debt and related guarantees.
- •
- Our due diligence may not reveal all of a borrower's liabilities and may not reveal other weaknesses in its business. Before making a CRE loan to a borrower, we assess the strength and skills of an entity's management and other factors that we believe are material to the performance of the investment. This underwriting process is particularly important and subjective with respect to newly-organized entities because there may be little or no information publicly available about the entities. In making the assessment and otherwise conducting customary due diligence, we rely on the resources available to us and, in some cases, an investigation by third parties. There can be no assurance that our due diligence processes will uncover all relevant facts or that any investment will be successful. Furthermore, historic performance evaluated in connection with our underwriting process may not be indicative of future performance.
- •
- In the event of a default or bankruptcy of a borrower, particularly in cases where the borrower has incurred debt that is senior to our CRE debt. If a borrower defaults on our CRE debt and the mortgaged real estate or other borrower assets collateralizing our CRE debt are insufficient to satisfy our CRE debt, we may suffer a loss of principal or interest. In the event of a borrower bankruptcy, we may not have full recourse to the assets of the borrower or the assets of the borrower may not be sufficient to satisfy our CRE debt. In addition, certain of our CRE debt investments are subordinate to other debt of the borrower. If a borrower defaults on our CRE debt or on debt senior to our CRE debt or in the event of a borrower bankruptcy, our CRE
25
Table of Contents
debt will be satisfied only after the senior debt, if any. Bankruptcy and borrower litigation can significantly increase the time needed for us to acquire underlying collateral in the event of a default, during which time the collateral may decline in value. In addition, there are significant monetary costs and delays associated with the foreclosure process. Borrower bankruptcies and litigation relating to our assets have increased appreciably as a result of the recent economic recession, which has required, and continues to require, us to spend significant amounts of money and devote significant senior management resources in order to protect our interests. If the economic markets do not continue to improve, we will continue to experience such costs and delays.
- •
- In the event provisions of our CRE debt agreements are adjudicated to be unenforceable. Our rights and obligations with respect to our CRE debt investments are governed by loan agreements and related documentation. It is possible that a court could determine that one or more provisions of a loan agreement or related documentation are unenforceable, such as a loan prepayment provision or the provisions protecting our security interest in the underlying collateral.
The subordinate debt we originate and invest in may be subject to risks relating to the structure and terms of the related transactions, as well as subordination in bankruptcy, and there may not be sufficient funds or assets remaining to satisfy our investments, which may result in losses to us.
We originate, structure and acquire subordinate debt investments secured primarily by commercial properties, including subordinate mortgage loans, mezzanine loans and preferred equity interests in borrowers who own such properties. These investments may be subordinate to other debt on commercial property and are secured by subordinate rights to the commercial property or by equity interests in the borrower. If a borrower defaults or declares bankruptcy, after senior obligations are met, there may not be sufficient funds or assets remaining to satisfy our subordinate interests. Because each transaction is privately negotiated, subordinate investments can vary in their structural characteristics and lender rights. Our rights to control the default or bankruptcy process following a default will vary from transaction to transaction. The subordinate investments that we originate and invest in may not give us the right to demand foreclosure as a subordinate real estate debt holder. Furthermore, the presence of intercreditor agreements may limit our ability to amend our loan documents, assign our loans, accept prepayments, exercise our remedies and control decisions made in bankruptcy proceedings relating to borrowers. Similarly, a majority of the participating lenders may be able to take actions to which we object, but by which we will be bound. Even if we have control, we may be unable to prevent a default or bankruptcy and we could suffer substantial losses. Certain transactions that we have originated and invested in could be particularly difficult, time consuming and costly to workout because of their complicated structure and the diverging interests of all the various classes of debt in the capital structure of a given asset.
Our control over management for the debt underlying the CSE CDO is governed by contractual agreements with CapitalSource Inc., which may limit our control of certain loans.
In certain circumstances under the CSE CDO, we are required to seek approval from CapitalSource, Inc. prior to taking actions with respect to the loans comprising the CSE CDO, which may hinder our ability to enforce the loan or to foreclose upon the collateral securing the loan or otherwise exercise remedies that we believe are appropriate.
We are subject to risks associated with future advance obligations, such as declining real estate values and operating performance.
Our CRE debt portfolio may include loans that require us to advance future funds. Future funding obligations subject us to significant risks that the property may have declined in value, projects to be completed with the additional funds may have cost overruns and the borrower may be unable to
26
Table of Contents
generate enough cash flow, or sell or refinance the property, in order to repay our CRE loan due. We could determine that we need to fund more money than we originally anticipated in order to maximize the value of our investment even though there is no assurance additional funding would be the best course of action.
We invest in CMBS, including subordinate securities, which entails certain risks.
We invest in a variety of CMBS, including subordinate securities that are subject to the first risk of loss if any losses are realized on the underlying mortgage loans. CMBS entitle the holders thereof to receive payments that depend primarily on the cash flow from a specified pool of commercial or multifamily mortgage loans. Consequently, CMBS will be adversely affected by payment defaults, delinquencies and losses on the underlying CRE loans, which began to increase significantly toward the end of 2008 and are expected to continue into 2012. Furthermore, if the rental and leasing markets do not continue to improve, including by increasing occupancy rates and increasing market rental rates, it could reduce cash flow from the loan pools underlying our CMBS investments. The CMBS market is dependent upon liquidity for refinancing and will be negatively impacted by a lack of such liquidity.
Additionally, CMBS is subject to particular risks, including lack of standardized terms and payment of all or substantially all of the principal only at maturity rather than regular amortization of principal. Additional risks may be presented by the type and use of a particular commercial property. Commercial property values and net operating income are subject to volatility, which may result in net operating income becoming insufficient to cover debt service on the related CRE loan. The repayment of loans secured by income-producing properties is typically dependent upon the successful operation of the related real estate project rather than upon the liquidation value of the underlying real estate. Furthermore, the net operating income from and value of any commercial property are subject to various risks. The exercise of remedies and successful realization of liquidation proceeds relating to CMBS may be highly dependent upon the performance of the servicer or special servicer. Expenses of enforcing the underlying CRE loans (including litigation expenses) and expenses of protecting the properties securing the CRE loans may be substantial. Consequently, in the event of a default or loss on one or more CRE loans contained in a securitization, we may not recover our investment.
The CMBS in which we invest are subject to the risks of the mortgage securities market as a whole and risks of the securitization process.
The value of CMBS may change due to shifts in the market's perception of issuers and regulatory or tax changes adversely affecting the mortgage securities market as a whole. Due to our investment in subordinate CMBS, we are also subject to several risks created through the securitization process. Our subordinate CMBS are paid interest only to the extent that there are funds available to make payments after payment of all senior classes. To the extent the collateral pool includes delinquent loans, there is a risk that the interest payment on our subordinate CMBS will not be fully paid, if paid at all. Our subordinate CMBS are also subject to greater credit risk than those CMBS that are more highly rated.
Interest shortfalls on our CMBS could have an adverse impact on the cash flow in our security CDOs.
Our CMBS are subject to the risk of interest payment shortfalls that may arise from underlying loan defaults, appraisal reductions, special servicer workout fees and realized losses on liquidation of foreclosed properties. As a result of the recent economic crisis and resulting negative effects on the CRE market, certain of the CMBS underlying our CDOs have experienced interest payment shortfalls. We attempt to mitigate these losses by purchasing CMBS with sufficient credit enhancement to avoid such shortfalls. However, there can be no assurance that such interest shortfalls will not continue to persist or increase in the future.
27
Table of Contents
We may not control the special servicing of the mortgage loans underlying the CMBS in which we invest and, in such cases, the special servicer may take actions that could adversely affect our interests.
Overall control over the special servicing of the underlying mortgage loans of our CMBS may be held by a directing certificate holder that is appointed by the holders of the most subordinate class of such CMBS. We ordinarily do not have the right to appoint the directing certificate holder. In connection with the servicing of the specially serviced loans, the related special servicer may, at the direction of the directing certificate holder, take actions that could adversely affect our interests.
The CMBS market was severely impacted by the credit crisis, which had a negative impact on the CMBS that we own.
Because the CMBS markets were virtually closed and other participants in the CRE lending market drastically curtailed lending activity during the recent economic recession, real estate owners had difficulty refinancing their assets. Property values also decreased in recent years because of scarcity of financing, which, if available, had terms generally at much lower leverage and higher cost than available in prior years. The U.S. and global markets remain challenged and uncertainty regarding future economic conditions continue to impact CRE values. These conditions, together with widespread downgrades of CMBS by the rating agencies, higher risk premiums required by investors and uncertainty surrounding CRE generally, have had, and may continue to have, a negative impact on CMBS and have significantly decreased the value of most of the CMBS that we own from the time we purchased the CMBS, other than, for the most part, CMBS we purchased in 2010 and 2011.
Credit ratings assigned to our investments are subject to ongoing evaluations and we cannot assure you that the ratings currently assigned to our investments will not be downgraded.
Substantially all of our securities have explicit credit ratings by at least one of the major rating agencies (Moody's Investors Service, Standard & Poor's, Fitch Ratings, Morningstar, DBRS and/or Kroll). The rating agencies have changed their ratings methodologies for all securitized asset classes, including CRE. Their reviews have resulted in, and may continue to result in, large amounts of ratings downgrade actions for CMBS, negatively impacting market values of CMBS and in many cases negatively impacting our CDOs. If rating agencies assign a lower-than-expected rating or reduce, or indicate that they may reduce, their ratings of our investments in the future, the value of these investments could significantly decline, which may negatively impact our ability to comply with the OC test under our CDOs. This could redirect cash distributions to the senior bondholders that would have otherwise been distributed to our CDO retained equity interests, and therefore have an adverse affect on our financial condition.
Market conditions resulting from the credit crisis in 2008 and early 2009 have caused and may continue to cause uncertainty in valuing our CRE securities.
The market volatility and the lack of liquidity in 2008 and 2009 made the valuation process pertaining to certain of our assets extremely difficult, particularly our CMBS assets for which there was limited market activity. Historically, our estimate of the value of these investments was primarily based on active issuances and the secondary trading market of such securities as compiled and reported by independent pricing agencies. Although the current market environment has improved with some new issuances and increased secondary trading of CMBS compared to 2008 and early 2009, there continues to be uncertainty in the CMBS market. Therefore, our estimate of fair value, which is based on the notion of orderly market transactions, requires significant judgment and consideration of other indicators of value such as current interest rates, relevant market indices, broker quotes, expected cash flows and other relevant market and security-specific data as appropriate. The amount that we could obtain if we were forced to liquidate our securities portfolio into the current market could be materially different than management's best estimate of fair value.
28
Table of Contents
Our exchangeable senior notes and our repurchase credit facilities are recourse obligations to us.
As of December 31, 2011, $229 million of our exchangeable senior notes were outstanding, of which $20 million is due in June 2012, $36 million is due in June 2013 and $173 million is due March 2016. These amounts are full recourse obligations of our Company. If we are not able to extend, refinance or repurchase these borrowings, we may not have the ability to repay these amounts when they come due. Our inability to repay any of our exchangeable senior notes could cause the acceleration of our borrowings, which would have a material adverse effect on our business.
In 2011, we, through two wholly-owned subsidiaries, obtained two $100 million repurchase credit facilities. In connection with those credit facilities, we executed guaranty agreements with our lender, Wells Fargo, pursuant to which we guaranteed the obligations of the borrowers. Certain events of default under the credit facilities could cause us to become liable to repay the borrowings under the repurchase credit facilities, which could have a material adverse effect on our business.
Our exchangeable senior notes contain cross-default provisions.
Our indentures governing our exchangeable senior notes contain cross-default provisions whereby a default under one agreement could result in a default and acceleration of borrowings under other agreements. If a cross-default occurred, we may not be able to pay our liabilities or access capital from external sources in order to refinance our borrowings. If some or all of our borrowings default and it causes a default under other borrowings, our business, financial condition and results of operations could be materially and adversely affected.
Our investments in unsecured REIT debt are subject to risks relating to the particular REIT issuer and to the general risks of investing in senior unsecured CRE securities, which may result in losses to us.
In addition to general economic and market risks, our investments in unsecured REIT debt involve special risks relating to the particular issuer of the securities, including the financial condition and business outlook of the issuer. REITs generally are required to substantially invest in real estate or real estate-related assets and are subject to the inherent risks associated with real estate-related investments.
Our investments in unsecured REIT debt and other senior unsecured debt are also subject to the risks described above with respect to CRE loans and CMBS and similar risks, including risks of delinquency and foreclosure, the dependence upon the successful operation of, and income from, real property, risks generally related to interests in real property, and risks that may be presented by the type and use of a particular commercial property.
REIT debt is generally unsecured and may also be subordinate to other obligations of the issuer. We may also invest in securities that are rated below investment grade. As a result, investments in REIT debt are also subject to risks of:
- •
- limited liquidity in the secondary trading market;
- •
- substantial market price volatility resulting from changes in prevailing interest rates and real estate values;
- •
- subordination to the prior claims of banks and other senior lenders to the REIT;
- •
- the operation of mandatory sinking fund or redemption provisions during periods of declining interest rates that could cause the issuer to reinvest redemption proceeds in lower yielding assets;
- •
- the possibility that earnings of the REIT may be insufficient to meet its debt service and distribution obligations;
29
Table of Contents
- •
- the declining creditworthiness and potential for insolvency of the issuer during periods of rising interest rates, declining real estate values and economic downturns;
- •
- rating agency credit rating downgrades negatively impacting value of securities; and
- •
- covenants not being sufficient to protect investors from the adverse credit impact of merger and acquisition transactions and increased leverage of the REIT.
These risks may adversely affect the value of outstanding REIT debt we hold and the ability of the issuers thereof to repay principal and interest or make distributions.
Investments in net lease properties may generate losses.
The value of our investments and the income from our net lease properties may be significantly adversely affected by a number of factors, including:
- •
- national, state and local economic conditions;
- •
- real estate conditions, such as an oversupply of or a reduction in demand for real estate space in an area;
- •
- the perceptions of tenants or operators and prospective tenants or operators of the quality, convenience, attractiveness and safety of our properties;
- •
- competition from comparable properties;
- •
- the occupancy rate of, and the rental rates charged at, our properties;
- •
- the ability to collect on a timely basis all rent from tenants or operators;
- •
- the effects of any bankruptcies or insolvencies of tenants or operators;
- •
- the expense of re-leasing space;
- •
- changes in interest rates and in the availability, cost and terms of mortgage financing;
- •
- the ability to refinance debt related to our net lease properties on favorable terms, if at all;
- •
- the impact of present or future environmental legislation and compliance with environmental laws;
- •
- cost of compliance with the Americans with Disabilities Act of 1990, or ADA;
- •
- adverse changes in governmental rules and fiscal policies;
- •
- civil unrest;
- •
- acts of nature, including earthquakes, hurricanes and other natural disasters (which may result in uninsured losses);
- •
- adverse changes in zoning laws; and
- •
- other factors which are beyond our control.
We may obtain only limited warranties when we purchase a property, which will increase the risk that we may lose some or all of our invested capital in the property or rental income from the property which, in turn, could materially adversely affect our business, financial condition and results from operations and our ability to pay distributions to our stockholders.
The seller of a property often sells such property in an "as is" condition on a "where is" basis and "with all faults," without any warranties of merchantability or fitness for a particular use or purpose. In addition, the related real estate purchase and sale agreements may contain only limited warranties,
30
Table of Contents
representations and indemnifications that will only survive for a limited period after the closing. The purchase of properties with limited warranties increases the risk that we may lose some or all of our invested capital in the property, as well as the loss of rental income from that property if an issue should arise that decreases the value of that property and is not covered by the limited warranties. If any of these results occur, it may have a material adverse effect on our business, financial condition and results of operations and our ability to pay distributions to our stockholders.
Our investments in net lease properties and a substantial portion of our healthcare net lease properties are dependent upon tenants or operators successfully operating their businesses and their failure to do so could have a material adverse effect on our business, financial condition and results of operations and our ability to make distributions to our stockholders.
We depend on our tenants or operators to manage the day-to-day operations of our net lease properties and our healthcare facilities in a manner that generates revenues sufficient to allow them to meet their obligations to us, including their obligations to pay rent, maintain certain insurance coverage, pay real estate taxes and maintain the facilities under their operational control in a manner that does not jeopardize their operating licenses or regulatory status. The ability of our tenants or operators to fulfill their obligations to us may depend, in part, upon the overall profitability of their operations, including any other facilities, properties or businesses they may acquire or operate. The cash flow generated by the operation of our facilities may not be sufficient for a tenant or operator to meet its obligations to us. Our financial position could be weakened and our ability to fulfill our obligations under our net lease borrowings could be limited if our tenants or operators are unable to meet their obligations to us or we fail to renew or extend our contractual relationship with any of our tenants or operators. Any of these results could have a material adverse effect on our business, financial condition and results of operations and our ability to make distributions to our stockholders.
We are subject to risks associated with obtaining mortgage financing on our net lease properties, which could materially adversely affect our business, financial condition and results of operations and our ability to make distributions to our stockholders.
As of December 31, 2011, our net lease property portfolio had total borrowings of $555 million. Financing for new investments and our maturing borrowings for our net lease property portfolio may be provided by credit facilities, private or public debt offerings, assumption of secured borrowings, mortgage financing on a portion of our owned portfolio or through joint ventures. We are subject to risks normally associated with financing, including the risks that our cash flow will be insufficient to make timely payments of interest or principal, that we will be unable to refinance existing borrowings or support collateral obligations and that the terms of refinancing will not be as favorable as the terms of existing borrowing. If we are unable to refinance or extend principal payments due at maturity or pay them with proceeds from other capital transactions or the sale of the underlying property, our cash flow may not be sufficient in all years to pay distributions to our stockholders and to repay all maturing borrowings. Furthermore, if prevailing interest rates or other factors at the time of refinancing result in higher interest rates upon refinancing, the interest expense relating to that refinanced borrowing would increase, which could reduce our profitability and the amount of distributions we are able to pay. Moreover, additional financing increases the amount of our leverage, which could negatively affect our ability to obtain additional financing in the future or make us more vulnerable in a downturn in our results of operations or the economy generally.
The bankruptcy, insolvency or financial deterioration of any of our tenants or operators could significantly delay our ability to collect unpaid rents or require us to find new tenants or operators.
Our financial position and our ability to make distributions to our stockholders may be adversely affected by financial difficulties experienced by any of our major operators, including bankruptcy,
31
Table of Contents
insolvency or a general downturn in the business, or in the event any of our major tenants or operators do not renew or extend their relationship with us as their lease terms expire.
We are exposed to the risk that our tenants or operators may not be able to meet their obligations to us or other third parties, which may result in their bankruptcy or insolvency. Although our leases and loans permit us to evict a tenant or operator, demand immediate repayment and pursue other remedies, the bankruptcy laws afford certain rights to a party that has filed for bankruptcy or reorganization. A tenant or operator in bankruptcy may be able to restrict our ability to collect unpaid rents or interest during the bankruptcy proceeding. Furthermore, dealing with a tenant's bankruptcy or other default may divert management's attention and cause us to incur substantial legal and other costs.
Bankruptcy laws provide that a debtor has the option to assume or reject an unexpired lease within a certain period of time of filing for bankruptcy, but generally requires such assumption or rejection to be made in its entirety. Thus, a debtor cannot choose to keep the beneficial provisions of a contract while rejecting the burdensome ones; the contract must be assumed or rejected as a whole. Most of our healthcare properties are and will continue to be net leased to an operator operating multiple facilities pursuant to a single master lease. If one or more of our healthcare property operators files for bankruptcy relief, it is possible that in bankruptcy the debtor may be required to assume or reject the master lease in its entirety, rather than making the decision on a property-by-property basis, thereby preventing the debtor from assuming the better performing properties and terminating the master lease with respect to the poorer performing properties. However, where under applicable law a contract (even though it is contained in a single document) is determined to be divisible or severable into different agreements, or similarly, where a collection of documents is determined to constitute separate agreements instead of a single, integrated contract, then in those circumstances a debtor/trustee may be allowed to assume some of the divisible or separate agreements while rejecting the others. If the debtor has the ability, and chooses, to assume some of the divisible agreement while rejecting the other divisible agreements, or if a non-debtor tenant is unable to comply with the terms of an agreement, we may be forced to modify the agreements in ways that are unfavorable to us.
Because real estate investments and our REO are relatively illiquid, our ability to promptly sell properties in our portfolio is limited.
The real estate market is affected by many factors that are beyond our control, such as general economic conditions, availability of financing, interest rates and supply and demand. We cannot predict whether we will be able to sell any property for the price or on the terms set by us or whether any price or other terms offered by a prospective purchaser would be acceptable to us. We also cannot predict the length of time needed to find a willing purchaser and to close the sale of a property. Additionally, our healthcare properties are special purpose properties that could not be readily converted to general residential, retail or office use. Transfers of operations of healthcare properties are subject to regulatory approvals not required for transfers of other types of commercial operations and real estate. To the extent we are unable to sell any property for its book value or at all, we may be required to take a non-cash impairment charge or loss on the sale, either of which would reduce our earnings.
We may be required to expend cash to correct defects or to make improvements before a property can be sold. We cannot assure you that we will have cash available to correct those defects or to make those improvements. We may agree to transfer restrictions that materially restrict us from selling that property for a period of time or impose other restrictions, such as a limitation on the amount of financing that can be placed or repaid on that property. These transfer restrictions would impede our ability to sell a property even if we deem it necessary or appropriate. These facts and any others that would impede our ability to respond to adverse changes in the performance of our properties may have
32
Table of Contents
a material adverse effect on our business, financial condition and results of operations and our ability to make cash distributions to our stockholders.
We may not be able to relet or renew leases at the properties held by us on terms favorable to us.
Our net lease assets have been negatively impacted as a result of the recent economic conditions and will continue to be pressured if economic conditions and rental markets do not continue to show improvement. For example, upon expiration or earlier termination of leases for space located at our properties, the space may not be relet or, if relet, the terms of the renewal or reletting (including the cost of required renovations or concessions to tenants or operators) may be less favorable than current lease terms. Poor economic conditions would likely reduce tenants' or operators' ability to make rent payments in accordance with the contractual terms of their leases and lead to early termination of leases. Furthermore, corporate space needs may contract, resulting in lower lease renewal rates and longer releasing periods when leases are not renewed. Any of these situations may result in extended periods where there is a significant decline in revenues or no revenues generated by a property. Additionally, to the extent that market rental rates are reduced, property-level cash flows would likely be negatively affected as existing leases renew at lower rates. If we are unable to relet or renew leases for all or substantially all of the space at these properties, if the rental rates upon such renewal or reletting are significantly lower than expected, or if our reserves for these purposes prove inadequate, we will experience a reduction in net income and may be required to reduce or eliminate cash distributions to our stockholders.
We may become responsible for capital improvements. To the extent such capital improvements are not undertaken, the ability of our tenants or operators to manage our facilities effectively and on favorable terms may be affected, which in turn could materially adversely affect our business, financial conditions and results of operations and our ability to make distributions to our stockholders.
Although under our typical triple net lease structure our tenants or operators are generally responsible for capital improvement expenditures, it is possible that a tenant or operator may not be able to fulfill its obligations to keep the facility in good operating condition. To the extent capital improvements are not undertaken or are deferred, occupancy rates and the amount of rental and reimbursement income generated by the facility may decline, which would negatively impact the overall value of the affected facility. Any of these results could have a material adverse effect on our business, financial condition and results of operations and our ability to make distributions to our stockholders.
Compliance with the Americans with Disabilities Act of 1990, Fair Housing Act and fire, safety and other regulations may require us, our borrowers or our tenants and operators to make unanticipated expenditures which could adversely affect our business, financial condition and results of operations and our ability to make distributions to our stockholders.
Our facilities and properties are required to comply with the ADA, which generally requires that buildings be made accessible to people with disabilities. We must also comply with the Fair Housing Act, which prohibits us and our tenants or operators from discriminating against individuals on certain bases in any of our practices if it would cause such individuals to face barriers in gaining residency in any of our facilities. In addition, our facilities and properties are required to operate in compliance with applicable fire and safety regulations, building codes and other land use regulations and licensing or certification requirements as they may be adopted by governmental agencies and bodies from time-to-time. We may be required to make substantial expenditures to comply with those requirements. Changes in labor laws could also impact us, our borrowers and our tenants or operators. The Employee Free Choice Act, or EFCA, was previously considered by the U.S. Congress. EFCA, also referred to as the "card check" bill, if passed as previously proposed or in similar form, or changes to other labor-
33
Table of Contents
related statutes or regulations could significantly impact the cost of labor in the workforce, which would increase the costs faced by our borrowers and tenants or operators.
Lease defaults, terminations or landlord-tenant/operator disputes may adversely reduce our income from our net lease property portfolio.
The creditworthiness of our tenants or operators in our net lease property investments may have been, or could become, negatively impacted as a result of the challenging economic conditions or otherwise, which could result in their inability to meet the terms of their leases. Lease defaults or terminations by one or more tenants or operators may reduce our revenues unless a default is cured or a suitable replacement tenant or operator is found promptly. In addition, disputes may arise between the landlord and tenant or operator that result in the tenant or operator withholding rent payments, possibly for an extended period. These disputes may lead to litigation or other legal procedures to secure payment of the rent withheld or to evict the tenant or operator. Any of these situations may result in extended periods during which there is a significant decline in revenues or no revenues generated by a property. If this occurred, it could adversely affect our results of operations. Furthermore, two of our healthcare operators account for 29% of our total rental and escalation income and while no tenant currently accounts for in excess of 10% of our rental and escalation income, failure or inability of a tenant or operator contributing to a significant percentage of our contractual rental revenue to meet its obligations to us could materially reduce our rental revenue and net income, which could in turn reduce the amount of distributions we pay and cause our stock price to decline.
A significant portion of our leases may expire in the same year.
A significant portion of the leases that we have entered may expire in the same year, which may coincide with the maturities on the borrowing for the properties subject to such leases. As a result, we could be subject to a sudden and material change in value of our net lease and/or our healthcare portfolio and available cash flow from our net lease and/or our healthcare investments in the event that these leases are not renewed or in the event that we are not able to extend or refinance the loans on the properties that are subject to these leases.
Environmental compliance costs and liabilities associated with our properties or our real estate related investments may materially impair the value of our investments.
Under various federal, state and local environmental laws, ordinances and regulations, a current or previous owner or operator of real property, such as us and our tenants or operators, may be liable in certain circumstances for the costs of investigation, removal or remediation of, or related releases of, certain hazardous or toxic substances, including materials containing asbestos, at, under or disposed of in connection with such property, as well as certain other potential costs relating to hazardous or toxic substances, including government fines and damages for injuries to persons and adjacent property. In addition, some environmental laws create a lien on the contaminated site in favor of the government for damages and the costs it incurs in connection with the contamination. These laws often impose liability without regard to whether the owner knew of, or was responsible for, the presence or disposal of such substances and liability may be imposed on the owner in connection with the activities of a tenant or operator at the property. The presence of contamination or the failure to remediate contamination may adversely affect our or our tenants' or operators' ability to sell or lease real estate, or to borrow using the real estate as collateral. We, or our tenants or operators, as owner or operator of a site, may be liable under common law to third parties for damages and injuries resulting from environmental contamination emanating from the site. The cost of any required investigation, remediation, removal, fines or personal or property damages and our or our tenants' or operators' liability could exceed the value of the property. In addition, the presence of such substances, or the
34
Table of Contents
failure to properly dispose of or remediate such substances, may adversely affect our or our tenants' or operators' ability to attract additional residents, ability to sell or rent such property or to borrow using such property as collateral which, in turn, could reduce our revenues.
The scope of the indemnifications our tenants or operators have agreed to provide us may be limited. For instance, some of our agreements with our tenants or operators do not require them to indemnify us for environmental liabilities arising before the tenant or operator took possession of the premises. Further, we cannot assure you that any such tenant or operator would be able to fulfill its indemnification obligations. If we were deemed liable for any such environmental liabilities and were unable to seek recovery against our tenant or operator, our business, financial condition and results of operations could be materially and adversely affected.
Furthermore, we may invest in real estate, or mortgage loans secured by real estate, with environmental problems that materially impair the value of the real estate. Even as a lender, if we foreclose upon a property with environmental problems or if other circumstances arise, we could be subject to environmental liability. There are substantial risks associated with such an investment.
Uninsured losses or losses in excess of our, or our tenants' or operators' insurance coverage could adversely affect our financial condition and our cash flows.
Although we believe our net lease property investments, including our healthcare properties, and properties collateralizing our CRE loan and security investments are adequately covered by insurance, there are certain types of losses, generally of a catastrophic nature, such as earthquakes, floods, hurricanes, terrorism or acts of war that may be uninsurable or not economically insurable. Inflation, changes in building codes and ordinances, environmental considerations and other factors, including terrorism or acts of war, also might make the insurance proceeds insufficient to repair or replace a property if it is damaged or destroyed. Under such circumstances, the insurance proceeds received might not be adequate to restore our economic position with respect to the affected real property. Any uninsured loss could result in both loss of cash flow from, and the asset value of, the affected property. In addition, the CRE loans secured by certain of our properties contain customary covenants, including covenants that require us to maintain property insurance in an amount equal to the replacement cost of the properties, which may increase the cost of obtaining the required insurance.
We are named as a defendant in a lawsuit and the adverse resolution of this matter could have a material adverse effect on our financial condition and results of operations.
One of our net lease investments was comprised of three office buildings totaling 257,000 square feet located in Chatsworth, California and was 100% leased to Washington Mutual Bank, FA, or WaMu. The tenant vacated the buildings as of March 23, 2009 and the leases, or the WaMu Leases, were disaffirmed by the Federal Deposit Insurance Corporation, or FDIC. In the third quarter 2009, the lender, GECCMC 2005-CI Plummer Office Limited Partnership, or GECCMC, foreclosed on the property. On August 10, 2009, GECCMC filed a complaint against NRFC NNN Holdings, Inc., or NNN, and NRFC Sub Investor IV, LLC, or NRFC Sub Investor IV, which are our wholly-owned subsidiaries, in the Superior Court of the State of California, County of Los Angeles. In the complaint, GECCMC alleged, among other things, that the loan provided by GECCMC to NRFC Sub Investor IV was a recourse obligation of NNN due to the FDIC's disaffirmance of the WaMu Leases. The judge presiding over the lawsuit has entered a judgment against NNN in the amount of approximately $46 million plus costs, attorneys' fees and prejudgment interests. NNN has posted an appeal bond, which is currently collateralized by $26 million of cash, and is in the process of vigorously appealing the decision. An adverse result on appeal could have a material adverse effect on our liquidity and financial condition.
35
Table of Contents
Many of our investments are illiquid, and we may not be able to vary our portfolio in response to further changes in economic and other conditions, which may result in losses to us.
Many of our investments are illiquid. As a result, our ability to sell properties, securities or CRE debt in response to changes in economic and other conditions could be limited, except at distressed prices. The Internal Revenue Code also places limits on our ability to sell certain properties held for fewer than two years. These considerations could make it difficult for us to dispose of any of our assets even if a disposition was in the best interests of our stockholders. As a result, our ability to vary our portfolio in response to further changes in economic and other conditions may be relatively limited, which may result in losses to us.
We may make investments in assets with lower credit quality, which will increase our risk of losses.
Most of our securities have explicit ratings assigned by at least one of the three leading nationally-recognized statistical rating agencies. However, we may invest in unrated securities, enter into net leases with unrated tenants or operators or participate in unrated or distressed mortgage loans. Because the ability of obligors of net lease properties and mortgages, including mortgage loans underlying CMBS, to make rent or principal and interest payments may be impaired during an economic downtown, as we recently experienced, prices of lower credit quality investments and securities may decline. The existing credit support in the securitization structure may be insufficient to protect us against loss of our principal on these investments and securities. We have not established and do not currently plan to establish any investment criteria to limit our exposure to these risks for future investments.
We have no established investment criteria limiting the geographic concentration of our investments in CRE debt, CRE securities or net lease properties. If our investments are concentrated in an area that experiences adverse economic conditions, our investments may lose value and we may experience losses.
Certain CRE debt and securities in which we invest may be secured by a single property or properties in one geographic location. Additionally, net lease properties that we may acquire may also be located in a geographic cluster. These current and future investments carry the risks associated with significant geographical concentration. We have not established and do not plan to establish any investment criteria to limit our exposure to these risks for future investments. As a result, properties underlying our investments may be overly concentrated in certain geographic areas, and we may experience losses as a result. A worsening of economic conditions in the geographic area in which our investments may be concentrated could have an adverse effect on our business, including reducing the demand for new financings, limiting the ability of borrowers to pay financed amounts and impairing the value of our collateral.
Our portfolio is highly leveraged, which may adversely affect our return on our investments and may reduce cash available for distribution.
We leverage our portfolio generally through the use of credit facilities, mortgage notes, securitizations, including the CDOs and other borrowings. The type and percentage of financing varies depending on our ability to obtain credit and the lender's estimate of the stability of the portfolio's cash flow. However, we do not restrict the amount of borrowings that we may incur. High leverage can, particularly during difficult economic times, increase our risk of loss and harm our liquidity. Moreover, we may have to incur more recourse borrowings in order to obtain financing for our business.
36
Table of Contents
We utilize short-term borrowings to finance our CRE debt and security investments, which may expose us to increased risks associated with decreases in the fair value of the underlying collateral and which could cause an adverse impact on our results of operations.
Short-term borrowing through repurchase agreements, credit facilities and other borrowings may put our assets and financial condition at risk. In 2011, we, through two of our wholly-owned subsidiaries, obtained two $100 million repurchase credit facilities. Repurchase agreements economically resemble short-term, floating-rate financing and our repurchase credit facilities require the maintenance of specific loan-to-collateral value ratios. If the fair value of the assets subject to our repurchase credit facilities decline, we may be required to provide additional collateral or make cash payments to maintain the loan-to-collateral value ratio. If we are unable to provide such collateral or cash repayments, we may lose our economic interest in the underlying assets. Further, such borrowings may require us to maintain a certain amount of cash reserves or to set aside unleveraged assets sufficient to maintain a specified liquidity position that would allow us to satisfy our collateral obligations. Our repurchase credit facilities provide for an unrestricted cash covenant of $45 million. In addition, such short-term borrowing facilities may limit the length of time that any given asset may be used as eligible collateral. As a result, we may not be able to leverage our assets as fully as we would choose, which could reduce our income generated on such assets. In the event that we are unable to meet the collateral obligations in our short-term financing arrangements, our financial condition could deteriorate rapidly.
Our joint venture partners could take actions that decrease the value of an investment to us and lower our overall return.
We currently have and may in the future enter into joint ventures with third parties to make investments. We may also make investments in partnerships or other co-ownership arrangements or participations. Such investments may involve risks not otherwise present with other methods of investment, including, for example, the following risks:
- •
- that our co-venturer or partner in an investment could become insolvent or bankrupt;
- •
- that such co-venturer or partner may at any time have economic or business interests or goals that are or that become in conflict with our business interests or goals; or
- •
- that such co-venturer or partner may be in a position to take action contrary to our instructions or requests or contrary to our policies or objectives.
Any of the above might subject us to liabilities and thus reduce our returns on our investment with that co-venturer or partner.
We are subject to risks associated with owning residential land investments, including in connection with our LandCap joint venture.
We are subject to risks associated with owning residential land, for example, in late 2007, we entered into a joint venture with Whitehall Street Global Real Estate Limited Partnership 2007, or Whitehall, to form LandCap Partners and LandCap LoanCo., which we collectively refer to as LandCap. LandCap was established to opportunistically invest in single-family residential land through land loans, lot option agreements and select land purchases. The joint venture is currently managed by a third-party management group which has extensive experience in the single family housing sector. These investments like other residential land investments, are expected to generate very little current cash flow and to be held for several years prior to liquidation. We and Whitehall agreed to provide no additional new investment capital in the LandCap joint venture. The venture will continue to manage existing investments and we do not expect the venture to return capital to us for several years.
37
Table of Contents
Interest rate fluctuations may reduce the spread we earn on our interest-earning investments and may reduce our earnings.
Although we seek to match-fund our assets and mitigate the risk associated with future interest rate volatility, we are primarily subject to interest rate risk because we do not hedge our retained equity interest in our floating-rate CDOs. If a CDO has floating-rate assets, our earnings will generally increase with increases in floating rates to the extent such increases do not cause distress for borrowers and our underlying assets are able to provide sufficient cash to pay such higher rates. Conversely, our earnings will generally decrease with declines in floating rates. Interest rates are highly sensitive to many factors, including governmental monetary and tax policies, domestic and international economic and political considerations and other factors beyond our control.
Our interest rate risk sensitive assets, liabilities and related derivative positions are generally held for non-trading purposes. As of December 31, 2011, a hypothetical 100 basis point increase in interest rates applied to our variable rate assets would increase our annual interest income by approximately $26 million offset by an increase in our interest expense of approximately $22 million on our variable rate liabilities. Similarly, a hypothetical 100 basis point decrease in interest rates would impact our annual interest income and expense by the same net amount.
While we seek to align the maturities of our liabilities with the maturities on our assets, we may not be successful in that regard which could harm our operating results and financial condition.
Our general financing strategy has focused on the use of "match-funded" structures. This means that we seek to align the maturities of our liabilities with the maturities on our assets in order to manage the risks of being forced to refinance our liabilities prior to the maturities of our assets. In addition, we match interest rates on our assets with like-kind borrowings, so fixed-rate assets are financed with fixed-rate borrowings and floating-rate assets are financed with floating-rate borrowings, directly or indirectly through the use of interest rate swaps, caps and other financial instruments or through a combination of these strategies. We may fail to appropriately employ match-funded structures on favorable terms, or at all. We may also determine not to pursue a match-funded structure with respect to a portion of our financings for a variety of reasons. If we fail to appropriately employ match-funded structures, our exposure to interest rate volatility and exposure to matching liabilities prior to the maturity of the corresponding asset may increase substantially which could harm our operating results, liquidity and financial condition.
Our hedging transactions may limit our gains and could result in losses.
To limit the effects of changes in interest rates on our operations, we may employ hedging strategies, including engaging in interest rate swaps, caps, floors and other interest rate contracts as well as engaging in short sales of securities or of future contracts. The use of these types of derivatives to hedge our assets and liabilities carries certain risks, including the risks that:
- •
- losses on a hedge position will reduce the cash available for distribution to stockholders;
- •
- losses may exceed the amount invested in such instruments;
- •
- a hedge may not perform its intended use of offsetting losses on an investment;
- •
- the counterparties with which we trade may cease making markets and quoting prices in such instruments, which may render us unable to enter into an offsetting transaction with respect to an open position; and
- •
- the counterparties with which we trade may experience business failures, which would most likely result in a default. Default by such counterparty may result in the loss of unrealized profits, which were expected to offset losses on our assets. Such defaults may also result in a loss of
38
Table of Contents
Our results of operations may be adversely affected during any period as a result of the use of derivatives. If we anticipate that the income from any such hedging transaction will not be qualifying income for REIT income test purposes, we may conduct some or all of our hedging activities through a corporate subsidiary that would be subject to corporate level taxation.
We may change our investment strategy without stockholder consent and make riskier investments.
We may change our investment strategy at any time without the consent of our stockholders, which could result in our making investments that are different from and possibly riskier than, the investments described in this Annual Report on Form 10-K. A change in our investment strategy may increase our exposure to interest rate and real estate market fluctuations.
We have been, and may in the future be, subject to significant competition, and we may not be able to compete successfully for investments.
We have been, and may in the future be, subject to significant competition for attractive investment opportunities from other real estate investors, some of which have greater financial resources than us, including publicly-traded REITs, private REITs, investment banking firms, private institutional funds, hedge funds and private equity funds. We may not be able to compete successfully for investments.
We are subject to substantial regulation, numerous contractual obligations and extensive internal policies and failure to comply with these matters could have a material adverse effect on our business, financial condition and results of operations.
We and our subsidiaries are subject to substantial regulation, numerous contractual obligations and extensive internal policies. Given our lines of business and organizational structure, we are subject to regulation by the SEC, NYSE, FINRA, the internal revenue service, or IRS, and other federal, state and local governmental bodies and agencies. These regulations are extensive, complex and require substantial management time and attention. If we fail to comply with any of the regulations that apply to our business, we could be subjected to substantial penalties and our business and operations could be materially adversely affected. We also have numerous contractual obligations that we must adhere to on a continuous basis to operate our business, the default of which could have a material adverse effect on our business and financial condition. We have also established internal policies designed to ensure that we manage our business in accordance with applicable law and regulation and in accordance with our contractual obligations. While we have designed policies to appropriately operate our business, these policies may not be effective in all regards and, further, if we fail to comply with our internal policies, we could be subjected to additional risk and liability.
We act as a servicer and special servicer with respect to our CRE debt and security investments and certain of the mortgage loans underlying the CMBS in which we invest and we may make decisions that subject us to loss and expose us to liability from third parties.
We act as a servicer and special servicer with respect to our CRE debt and security investments and certain of the mortgage loans underlying the CMBS in which we invest. When acting in that capacity, we are responsible for servicing the subject assets in accordance with applicable industry standards, laws, regulations and contractual obligations. As a servicer or special servicer, we are responsible for critical functions that can have a significant effect on the value of the underlying assets. If we fail to adhere to applicable industry standards, laws, regulations or contractual obligations, or if we make decisions that are not effective, we could suffer significant losses and expose ourselves to substantial liability from third parties who were relying on our servicing function.
39
Table of Contents
Risks Related to Investments in Healthcare Assets
The healthcare industry is highly competitive and we expect it to become more competitive.
We own and manage a portfolio of healthcare net lease properties, with a focus on the senior housing sector. A majority of our assets are assisted living, skilled nursing and independent living facilities. In addition, we filed a registration statement on Form S-11 for Senior Care, a non-listed REIT formed to originate, acquire and manage a diversified portfolio of debt and equity investments in the healthcare property sector. We expect that if the registration statement on Form S-11 for Senior Care is declared effective by the SEC and we successfully raise capital for that company, which may not be the case, it would also be managed by us through a subsidiary and we would earn management and other fees for our services.
The healthcare industry is highly competitive, and we expect that it may become more competitive in the future. The operators of the facilities we own or lend to compete with numerous other companies that provide long-term care alternatives such as home healthcare agencies, life care at home, facility-based service programs, retirement communities, convalescent centers and other independent living, assisted living and skilled nursing providers, including not-for-profit entities. In general, regulatory and other barriers to competitive entry in the assisted living and independent living segments of the healthcare industry are not substantial, although there are generally barriers to the development of skilled nursing facilities. Consequently, our operators may encounter increased competition that could limit their ability to attract new residents, raise resident fees or expand their businesses, which could adversely adverse effect our revenues and earnings.
Our failure or the failure of our operators to comply with licensing and certification requirements, the requirements of governmental reimbursement programs such as Medicare or Medicaid, fraud and abuse regulations or new legislative developments may materially adversely affect our business, financial condition and results of operations and our ability to make distributions to our stockholders.
We or our operators, as the case may be, are subject to numerous federal, state and local laws and regulations that are subject to frequent and substantial changes (sometimes applied retroactively) resulting from legislation, adoption of rules and regulations, and administrative and judicial interpretations of existing laws. The ultimate timing or effect of any changes in these laws and regulations cannot be predicted. With respect to our healthcare facilities held and operated through net lease transaction structures, we have no direct control over our operators' ability to meet the numerous federal, state and local regulatory requirements. Failure to comply with these laws, requirements and regulations may materially adversely affect our business, financial condition and results of operations and our ability to make distributions to our stockholders. In particular:
- •
- Licensing and Certification. We, our operators and our healthcare facilities are subject to regulatory and licensing requirements of federal, state and local authorities and are periodically surveyed by them to confirm compliance. Failure to obtain licensure or loss or suspension of licensure or certification may prevent a facility from operating or result in a suspension of reimbursement payments until all licensure or certification issues have been resolved and the necessary licenses or certification are obtained or reinstated. Our healthcare facilities may require governmental approval in the form of a certificate of need that generally varies by state and is subject to change, prior to the addition of new beds, the addition of service or certain capital expenditures. Facilities may also be affected by changes in accreditation standards or procedures of accrediting agencies that are recognized by governments in the certification process. State licensing laws require operators of healthcare facilities to comply with extensive standards governing operations. State agencies administering those laws regularly inspect such facilities and investigate complaints. Failure to meet all regulatory requirements could result in the loss of the ability to provide or bill and receive payment for healthcare services. In such
40
Table of Contents
41
Table of Contents
The healthcare industry is heavily regulated. New laws or regulations such as the healthcare reform law and related regulations, changes to existing laws or regulations, loss of licensure or failure to obtain licensure could result in the inability of our operators to make rent payments to us.
The healthcare industry is heavily regulated by federal, state and local governmental bodies. Healthcare facility operators generally are subject to laws and regulations covering, among other things, licensure, certification for participation in government programs, and relationships with physicians and other referral sources. Changes in these laws and regulations could negatively affect the ability of our operators to make lease payments to us and our ability to make distributions to our stockholders.
Many of our targeted properties and their operators may require a license or certificate of need, or CON, to operate. Failure to obtain a license or CON, or loss of a required license or CON would prevent a facility from operating in the manner intended by the operator. These events could materially adversely affect our operators' ability to make rent payments to us. State and local laws also may regulate expansion, including the addition of new beds or services or acquisition of medical equipment, and the construction of healthcare-related facilities, by requiring a CON or other similar approval. State CON laws are not uniform throughout the U.S. and are subject to change. We cannot predict the impact of state CON laws on our development of facilities or the operations of our operators.
In addition, state CON laws often materially impact the ability of competitors to enter into the marketplace of our facilities. The repeal of CON laws could allow competitors to freely operate in previously closed markets. This could negatively affect our operators' abilities to make rent payments to us.
In limited circumstances, loss of state licensure or certification or closure of a facility could ultimately result in loss of authority to operate the facility and require new CON authorization to re-institute operations. As a result, a portion of the value of the facility may be reduced, which would adversely impact our business, financial condition and results of operations and our ability to make distributions to our stockholders.
Recently enacted comprehensive healthcare reform legislation could materially and adversely affect our business, financial condition and results of operations and our ability to pay distributions to stockholders.
On March 23, 2010, the President signed into law the Patient Protection and Affordable Care Act of 2010, or PPACA, and on March 30, 2010, the President signed into law the Health Care and Education Reconciliation Act of 2010, or the Reconciliation Act, which in part modified PPACA. Together, the two laws serve as the primary vehicle for comprehensive healthcare reform in the U.S. and will become effective through a phased approach, which began in 2010 and will conclude in 2018. The laws are intended to reduce the number of individuals in the U.S. without health insurance and significantly change the means by which healthcare is organized, delivered and reimbursed. PPACA includes program integrity provisions that both create new authorities and expand existing authorities for federal and state governments to address fraud, waste and abuse in federal health programs. In addition, PPACA expands reporting requirements and responsibilities related to facility ownership and management, patient safety and care quality. In the ordinary course of their businesses, our operators may be regularly subjected to inquiries, investigations and audits by federal and state agencies that oversee these laws and regulations. If they do not comply with the additional reporting requirements and responsibilities, our operators' ability to participate in federal health programs may be adversely affected. Moreover, there may be other aspects of the comprehensive healthcare reform legislation for which regulations have not yet been adopted, which, depending on how they are implemented, could materially and adversely affect our operators, and therefore our business, financial condition, results of operations and ability to pay distributions to you. These laws have been the subject of multiple constitutional challenges and the U.S. Supreme Court has scheduled hearings in March 2012 to review the constitutionality of PPACA and its requirement for an individual to purchase health insurance,
42
Table of Contents
thereby creating uncertainty about whether such laws will remain in effect with respect to that aspect of the laws or at all.
State law may limit the availability of certain types of healthcare facilities for our acquisition or development and may limit our ability to replace obsolete properties.
Certificate of Need laws may impose investment barriers for us. Some states regulate the supply of some types of healthcare facilities, such as skilled nursing facilities or assisted living facilities, through CON laws. A CON typically is a written statement issued by a state regulatory agency evidencing a community's need for a new, converted, expanded or otherwise significantly modified healthcare facility or service which is regulated pursuant to the state's statutes. These restrictions may create barriers to entry or expansion and may limit the availability of properties for our acquisition or development. In addition, we may invest in properties which cannot be replaced if they become obsolete unless such replacement is approved or exempt under a CON law.
Our operators are faced with increased litigation and rising insurance costs that may affect their ability to make their lease or mortgage payments.
In some states, advocacy groups have been created to monitor the quality of care at healthcare facilities, and these groups have brought litigation against operators. Also, in several instances, private litigation by patients has succeeded in winning very large damage awards for alleged abuses. The effect of this litigation and potential litigation has been to materially increase the costs incurred by our operators for monitoring and reporting quality of care compliance. In addition, the cost of liability and medical malpractice insurance has increased and may continue to increase so long as the present litigation environment affecting the operations of healthcare facilities continues. Continued cost increases could cause our operators to be unable to make their lease or mortgage payments, potentially decreasing our revenue and increasing our collection and litigation costs. Moreover, to the extent we are required to take back the affected facilities, our revenue from those facilities could be reduced or eliminated for an extended period of time.
Economic downturns, weakness in the housing and equity markets, lowered consumer confidence and other events could adversely affect the ability of seniors to afford the entrance fees or monthly resident fees for our healthcare facilities and, in turn, materially adversely affect our business, financial condition and results of operations and our ability to make distributions to our stockholders.
Costs to seniors associated with independent and assisted living services are generally not reimbursable under government reimbursement programs such as Medicaid and Medicare. Only seniors with income or assets meeting or exceeding the comparable median in the regions where our facilities are located typically will be able to afford to pay our entrance fees and monthly resident fees. Economic downturns, softness in the housing market, lower levels of consumer confidence, reductions or declining growth of government entitlement programs (such as social security benefits), stock market volatility, changes in demographics and other events could adversely affect the ability of seniors to afford the entrance fees or monthly resident fees for our healthcare facilities. If our operators are unable to retain and attract seniors with sufficient income, assets or other resources required to pay the fees associated with independent and assisted living services and other services provided by our operators at our healthcare facilities, our occupancy rates could decline, which could, in turn, materially adversely affect our business, results of operations and financial condition and our ability to make distributions to our stockholders.
43
Table of Contents
The inability of seniors to sell real estate may delay their moving into our facilities which could materially adversely affect our occupancy rates and our business, financial condition and results of operations and our ability to make distributions to our stockholders.
Housing price declines and reductions in residential mortgage availability have negatively affected the U.S. housing market, with certain geographic areas experiencing more acute deterioration than others. Downturns in the U.S. housing market could adversely affect the ability (or perceived ability) of seniors to afford entrance fees and monthly resident fees at our healthcare facilities, as potential residents frequently use the proceeds from the sale of their homes to cover the costs of these fees. Specifically, if seniors have a difficult time selling their homes, these difficulties could impact their ability to relocate into our facilities or finance their stays at our facilities. This could cause the amount of our revenues generated by private payment sources to decline. If the recent volatility in the U.S. housing market continues for a protracted period, it could materially adversely affect our business, financial condition and results of operations and our ability to make distributions to our stockholders.
Government budget deficits could lead to a reduction in Medicaid and Medicare reimbursement.
The slowdown in the U.S. economy has negatively affected state budgets, which may put pressure on states to decrease reimbursement rates with the goal of decreasing state expenditures under state Medicaid programs. The need to control Medicaid expenditures may be exacerbated by the potential for increased enrollment in state Medicaid programs due to unemployment, declines in family incomes and eligibility expansions required by the recently enacted PPACA. These potential reductions could be compounded by the potential for federal cost-cutting efforts that could lead to reductions in reimbursement rates under the federal Medicare program, state Medicaid programs and other healthcare related programs. Potential reductions in reimbursements under these programs could negatively impact the ability of our operators and their ability to meet their obligations to us.
Possible changes in the acuity profile of our residents as well as payor mix and payment methodologies may materially adversely affect our business, financial condition and results of operations and our ability to make distributions to our stockholders.
The sources and amounts of our revenues from our healthcare property portfolio are determined by a number of factors, including licensed bed capacity, occupancy, the acuity profile of residents and the rate of reimbursement. Changes in the acuity profile of the residents as well as payor mix among private pay, Medicare and Medicaid may materially adversely affect our business, financial condition and results of operations and our ability to make distributions to our stockholders.
Because of the unique and specific improvements required for healthcare properties, we may be required to incur substantial renovation costs to make certain of our properties suitable for other operators, which could materially adversely affect our business, financial condition and results of operations and our ability to pay distributions to our stockholders.
Healthcare properties are typically highly customized and may not be easily adapted to non-healthcare-related uses. The improvements generally required to conform a property to healthcare use, such as upgrading electrical, gas and plumbing infrastructure, are costly and often times operator-specific. A new or replacement operator may require different features in a property, depending on that operator's particular operations. If a current operator is unable to pay rent and vacates a property, we may incur substantial expenditures to modify a property for a new operator, or for multiple operators with varying infrastructure requirements, before we are able to release the space. Consequently, our healthcare properties may not be suitable for lease to traditional office or other operators without significant expenditures or renovations, which costs may materially adversely affect our business, financial condition and results of operations and our ability to pay distributions to our stockholders.
44
Table of Contents
If our operators fail to cultivate new or maintain existing relationships with residents in the markets in which they operate, our operators' occupancy percentage, payor mix and resident rates may deteriorate which could have a material adverse effect on our business, financial condition and results of operations and our ability to make distributions to our stockholders.
The ability of our operators to improve the overall occupancy percentage, payor mix and resident rates at our healthcare facilities, depends on our operators' reputation in the communities they serve and our operators' ability to successfully market our facilities to potential residents. A large part of our operators' marketing and sales effort is directed towards cultivating and maintaining relationships with key community organizations that work with seniors, physicians and other healthcare providers in the communities where our facilities are located, whose referral practices significantly affect the choices seniors make with respect to their long-term care needs. If our operators are unable to successfully cultivate and maintain strong relationships with these community organizations, physicians and other healthcare providers, occupancy rates at our facilities could decline, which could materially adversely affect our business, financial condition and results of operations and our ability to make distributions to our stockholders.
We may not be able to compete effectively in those markets where overbuilding exists and our inability to compete in those markets may have a material adverse effect on our business, financial condition and results of operations and our ability to make distributions to our stockholders.
Overbuilding in the healthcare segment in the late 1990s reduced occupancy and revenue rates at healthcare facilities. This, combined with unsustainable levels of borrowings, forced several operators into bankruptcy. The occurrence of another period of overbuilding could adversely affect our future occupancy and resident fee rates, which in turn could materially adversely affect our business, financial condition and results of operations and our ability to make distributions to our stockholders.
Our operators may be subject to significant legal actions that could subject them to increased operating costs and substantial uninsured liabilities, which may affect their ability to meet their obligations to us.
Our operators may be subject to claims that their services have resulted in resident injury or other adverse effects. The insurance coverage maintained by our operators, whether through commercial insurance or self-insurance, may not cover all claims made against them or continue to be available at a reasonable cost, if at all. In some states, insurance coverage for the risk of punitive damages arising from professional liability and general liability claims and litigation may not, in certain cases, be available to our operators due to state law prohibitions or limitations of availability. As a result, our operators operating in these states may be liable for punitive damage awards that are either not covered or are in excess of their insurance policy limits. From time-to-time, there may also be increases in government investigations of long-term care providers, particularly in the area of Medicare/Medicaid false claims and resident care, as well as increases in enforcement actions resulting from these investigations. Insurance is not available to cover such losses. Any adverse determination in a legal proceeding or government investigation, whether currently asserted or arising in the future, could lead to potential termination from government programs, large penalties and fines and otherwise have a material adverse effect on a healthcare operator's financial condition. If a healthcare operator is unable to obtain or maintain insurance coverage, if judgments are obtained in excess of the insurance coverage, if a healthcare operator is required to pay uninsured punitive damages, or if a healthcare operator is subject to an uninsurable government enforcement action, the healthcare operator could be exposed to substantial additional liabilities, which could result in its bankruptcy or insolvency or have a material adverse effect on the healthcare operator's business and its ability to meet its obligations to us.
Moreover, advocacy groups that monitor the quality of care at healthcare facilities have sued healthcare facility operators and called upon state and federal legislators to enhance their oversight of trends in healthcare facility ownership and quality of care. In response, the recently enacted PPACA
45
Table of Contents
imposes additional reporting requirements and responsibilities for healthcare facility operators. Patients have also sued healthcare facility operators and have, in certain cases, succeeded in winning very large damage awards for alleged abuses. This litigation and potential future litigation has materially increased the costs incurred by our operators for monitoring and reporting quality of care compliance. In addition, the cost of medical malpractice and liability insurance has increased and may continue to increase so long as the present litigation environment affecting the operations of healthcare facilities continues. Compliance with the requirements in PPACA could increase costs as well. Increased costs could limit our operators' ability to meet their obligations to us, potentially decreasing our revenue and increasing our collection and litigation costs. To the extent we are required to remove or replace an operator, our revenue from the affected property could be reduced or eliminated for an extended period of time.
Delays in our operators' collection of their accounts receivable could adversely affect their cash flows and financial condition and their ability to meet their obligations to us.
Prompt billing and collection are important factors in the liquidity of our operators. Billing and collection of accounts receivable are subject to the complex regulations that govern Medicare and Medicaid reimbursement and rules imposed by non-government payors. The inability of our operators to bill and collect on a timely basis pursuant to these regulations and rules could subject them to payment delays that could negatively impact their cash flows and ultimately their financial condition and their ability to meet their obligations to us.
We are facing increasing competition for the acquisition of healthcare properties which may impede our ability to make future acquisitions or may increase the cost of these acquisitions which, in turn, could materially adversely affect our business, financial condition and results of operations and our ability to make distributions to our stockholders.
We compete with many other businesses engaged in real estate investment activities for the acquisition of healthcare properties, including local, regional and national operators and acquirers and developers of healthcare real estate. The competition for healthcare properties may significantly increase the price we might pay for a facility or property we seek to acquire and our competitors may succeed in acquiring those facilities or properties themselves. In addition, operators with whom we attempt to do business may find our competitors to be more attractive because they may have greater resources, may be willing to pay more for the properties or may have a more compatible operating philosophy. In particular, larger healthcare REITs may enjoy significant competitive advantages that result from, among other things, a lower cost of capital and enhanced operating efficiencies. In addition, the number of entities and the amount of funds competing for suitable investment properties may increase. This competition may result in increased demand for these assets and therefore increased prices paid for them. If we pay higher prices for healthcare properties, our business, financial condition and results of operations and our ability to make distributions to our stockholders may be materially adversely affected.
Risks Related to the Asset Management Business
The organization and management of NSREIT and Senior Care, and any future funds that we raise, may create conflicts of interest.
In addition to managing the assets of our CDOs, we sponsor and, through a majority-owned subsidiary, are the advisor of NSREIT, a non-listed REIT that is currently raising capital via a continuous offering. Additionally, we expect to sponsor Senior Care, a non-listed REIT that was formed to originate, acquire and manage a diversified portfolio of debt and equity investments in the healthcare sector. Senior Care has filed a registration statement on Form S-11 and we expect that if it
46
Table of Contents
is declared effective by the SEC and we successfully raise capital for that company, which may not be the case, it would also be managed by us through a subsidiary advisor.
Our Sponsored REITs, along with any new non-listed REITS or similar type entities we may manage, will acquire assets consistent with their business objectives and that are allocated to them in accordance with our investment allocation policy, which we adopted to ensure that investments are allocated fairly and appropriately among us and our Sponsored REITS. Our investment strategy may be very similar to that of our Sponsored REITs, and therefore many investment opportunities that are suitable for us may also be suitable for the Sponsored REITs, resulting in potential conflicts of interest, including between investors in these Sponsored REITs and our stockholders, and although we have adopted an investment allocation policy to reduce the conflicts of interest between us and our Sponsored REITs, there is no assurance that we will be successful in eliminating the conflicts arising from the allocation of investment opportunities.
We will earn a management and other fees for our services to our Sponsored REITs. Our executives and other real estate and debt finance professionals may face conflicts of interest in allocating their time among NorthStar and our Sponsored REITs. Although as a company we will seek to make these decisions in a manner that we believe is fair and consistent with the operative legal documents governing these investment vehicles, the transfer or allocation of these assets may give rise to investor dissatisfaction or litigation or regulatory enforcement actions. Appropriately dealing with conflicts of interest is complex and difficult and our reputation could be damaged if we fail, or appear to fail, to deal appropriately with one or more potential or actual conflicts of interest. Regulatory scrutiny of, or litigation in connection with, conflicts of interest would have a material adverse effect on our reputation which would materially adversely affect our business and our ability to attract investors for future vehicles.
Our ability to raise capital and attract investors in our Sponsored REITs is critical to their success.
Our Sponsored REITs depend upon our ability to attract purchasers of equity interests, which is highly dependent upon the efforts of the motivated sales force of our subsidiary, NorthStar Realty Securities. NorthStar Realty Securities is a FINRA member wholesale broker-dealer that is registered in the various jurisdictions in which our Sponsored REITs will do business. Our ability to grow our Sponsored REITs will be dependent on our ability to retain and motivate our sales force and other key personnel and to strategically recruit, retain and motivate new talent. However, we may not be successful in our efforts to recruit, retain and motivate the required personnel as the market for qualified professionals is extremely competitive. If we do not retain a motivated and effective sales force, or our sales professionals join competitors or form competing companies, it could result in the loss of significant investment opportunities and possibly existing investors, which would have a material impact on our Sponsored REITs.
There is no assurance NorthStar Realty Securities will be able to enter into third-party selling agreements on behalf of Senior Care or any other new entities we may sponsor or that NorthStar Realty Securities will be able to enter into additional third-party selling agreements on behalf of NSREIT and declines in asset value and reductions in distributions in our Sponsored REITs could cause the loss of such third-party selling agreements and limit our ability to sign future third-party selling agreements.
NorthStar Realty Securities has entered into, and we anticipate will enter into additional third-party selling agreements in order to raise capital for our Sponsored REITs. There is no assurance, however, that we will be able to enter into additional third-party selling agreements on favorable terms, or at all, which would hinder or even cease our ability to raise capital for our Sponsored REITs. Additionally, significant declines in asset value and reductions in distributions in our Sponsored REITs could cause us to lose third-party selling agreements and limit our ability to sign future third-party selling agreements.
47
Table of Contents
Misconduct by third-party selling broker-dealers or our sales force, could have a material adverse effect on our business.
We rely on selling broker-dealers and our broker-dealer sales force to properly offer our securities programs to customers in compliance with our selling agreements and with applicable regulatory requirements. While these persons are responsible for their activities as registered broker-dealers, their actions may nonetheless result in complaints or legal or regulatory action against us.
Our organization and management of the Sponsored REITs could distract our management and have a negative effect on our business.
The organization and management of our Sponsored REITs could divert our management team's attention from our existing business to form and manage the operations and personnel of the Sponsored REITs and implement the business initiatives. Our management team could be required to spend significant time and financial resources on the Sponsored REITs, which could distract and prevent them from furthering our core business activities, regardless of the outcome of the Sponsored REITs. Consequently, this could have a negative effect on our business.
Because there are numerous companies seeking to raise capital through non-listed REITs, it may be more difficult for us to do so, particularly as a relatively new sponsor.
The number of entrants in the non-listed REIT space has grown significantly over the last couple of years. We have invested significant capital into the organization and management of our Sponsored REITs, and may in the future invest additional capital in other non-listed REIT products. Based on publicly-available information, as of December 31, 2011, there were approximately 45 active non-listed REITs in the marketplace and 18 others have filed registration statements. As a result, we will be subject to significant competition from these and other companies seeking to raise capital in the non-listed REIT space. There can be no assurance that we will be able to compete successfully against current and future competitors and raise capital through our Sponsored REITs or recoup our invested capital.
The creation and management of our Sponsored REITs, CDOs and other vehicles could require us to register with the SEC as an investment adviser under the Investment Advisers Act and subject us to additional regulatory burdens and costs that we are not currently subject.
We are not currently required to register as an investment adviser under the Investment Advisers Act of 1940, as amended, or the Advisers Act. Given the changes mandated by the Dodd-Frank Wall Street Reform Act, or Dodd-Frank, many investment advisers that previously relied on the private adviser exemption under the Advisers Act which was repealed by Dodd-Frank, may need to register as an investment adviser with the SEC by March 30, 2012, or seek an exemption from registration. An investment adviser may be required to register with the SEC even if it has a single client, depending on the composition of the client's portfolio and other facts and circumstances. We intend to manage our sponsored vehicles in a manner that does not require registration under the Advisers Act. If we are required to register under the Advisers Act, our business may be negatively affected because we may, among other things, have to devote significant additional management time, may incur significant additional costs and/or may experience a reduction in revenue associated with compliance with the requirements of the Advisers Act.
Termination of management arrangements with one or more of our managed entities could harm our business.
We provide management services to our existing Sponsored REITs and CDOs, and may provide management services to additional entities in the future. Our management services can be terminated
48
Table of Contents
for reasons outside of our control. Upon any such termination, our management fees, after payment of any termination payments required, would cease, thereby reducing our expected revenues.
There are risks in using custodians.
Our asset management business may depend on the services of custodians to carry out certain transactions. In the event of the insolvency of a custodian, our managed entities might not be able to recover equivalent assets in full as they will rank among the custodian's unsecured creditors in relation to assets which the custodian borrows, lends or otherwise uses. In addition, the cash held by our managed entities with a custodian will not be segregated from the custodian's own cash, and such entities will therefore rank as unsecured creditors in relation thereto.
Our failure to maintain registration as a broker-dealer member in the various jurisdictions in which we will do business and other interruptions could have a material adverse effect on our business, financial condition, liquidity and results of operations.
NorthStar Realty Securities is a FINRA member wholesale broker-dealer that is registered in the various jurisdictions in which our Sponsored REITs do business. NorthStar Realty Securities must comply with various regulatory guidelines to maintain its FINRA membership and continue to operate as a wholesale broker-dealer. There is no guarantee that FINRA, the SEC or the states or territories in which NorthStar Realty Securities is registered will not take action against NorthStar Realty Securities to remove its membership and/or registrations. Even if we have complied with applicable rules, our broker-dealer could still be subjected to investigation and scrutiny that could distract our management, force us to incur substantial cost and harm our brand. If we have failed to comply with applicable rules, we could be subject to enforcement actions and other penalties that could disrupt our business. Accordingly, such events would delay or potentially hinder sales of our Sponsored REITs' securities.
Government and self-regulatory organization intervention may limit our ability to continue to implement certain strategies or manage certain risks.
Government and self-regulatory organizations have significant influence over the regulatory framework under which our Company operates. In the past, these organizations have also undertaken significant measures to influence market forces. For example, in order to address pervasive and fundamental disruptions in the global financial markets, the government adopted numerous measures, including the Emergency Economic Stabilization Act of 2008, in October 2008, giving the U.S. Treasury Secretary the authority to use up to $700 billion to, among other things, inject capital into financial institutions and establish a program to purchase from financial institutions residential or CRE loans and other securities in November 2008, which allowed the Federal Reserve Bank of New York to provide non-recourse loans to borrowers to fund their purchase of eligible assets, which initially included asset-backed securities but was later expanded to include CMBS and non-agency residential mortgage-based securities, and, more recently, Dodd-Frank, which outlined broad policies for the U.S. financial services industry.
Furthermore, in 2011, FINRA issued Regulatory Notice 11-44, which contained proposals that, if implemented without modification, may significantly affect the manner in which non-listed REITs, such as NSREIT, raise capital. The proposals contained in Regulatory Notice 11-44 may cause a reduction in capital raised by non-listed REITs, which may cause a negative impact on NSREIT's ability to achieve its business plan, our ability to launch new Sponsored REITs and may further result in a reduction of revenue we are able to earn from our Sponsored REITs.
Such intervention has also in certain cases been implemented on an "emergency" basis, suddenly and substantially eliminating market participants' ability to continue to implement certain strategies or manage the risk of their outstanding positions. It is impossible to predict what, if any, additional
49
Table of Contents
interim or permanent governmental restrictions may be imposed on the markets and the effect of such restrictions on us and our results of operations. There is a high likelihood of significantly increased regulation of the financial markets that could have an impact on our operating results and financial condition.
Risks Related to Our Company
Our ability to operate our business successfully would be harmed if key personnel terminate their employment with us.
Our future success depends, to a significant extent, upon the continued services of our key personnel, including our executive officers and our Chairman and Chief Executive Officer, David T. Hamamoto, and our Co-Presidents, Daniel R. Gilbert and Albert Tylis, in particular. For instance, the extent and nature of the experience of our executive officers and nature of the relationships they have developed with real estate developers and financial institutions are critical to the success of our business. Our executive officers have significant real estate investment experience. We cannot assure you of their continued employment with us. The loss of services of certain of our executive officers could harm our business and our prospects.
Our board of directors has and will likely in the future adopt certain incentive plans to create incentives that will allow us to retain and attract the services of key employees. These incentive plans may be tied to the performance of our common stock and as a result of the decline in our stock price, we may be unable to motivate and retain our management and these other employees. Our inability to motivate and retain these individuals could also harm our business and our prospects. Additionally, competition for experienced real estate professionals could require us to pay higher wages and provide additional benefits to attract qualified employees, which could result in higher compensation expenses to us.
If our ability to issue equity awards to employees is limited, it will require us to award greater cash compensation in relation to previous levels of cash compensation, which will reduce our liquidity and could impact our ability to retain key employees.
We have historically paid a substantial portion of our overall compensation in the form of equity awards. Currently, we do not have availability under our incentive plans to issue equity awards to our employees. We will seek stockholder approval for additional equity awards, but in the meantime, we will likely compensate our employees in a greater proportion of cash compared to equity awards. Because adjusted funds from operations, or AFFO, excludes equity-based compensation expense, payment of higher levels of cash relative to equity awards will have a negative impact on our AFFO and reduce our liquidity position. Additionally, the lack of availability of equity awards could impact our ability to retain employees as equity awards historically have been a significant component of our long-term incentives.
If our risk management systems are ineffective, we may be exposed to material unanticipated losses.
We continue to refine our risk management techniques, strategies and assessment methods. However, our risk management techniques and strategies may not fully mitigate the risk exposure of our operations in all economic or market environments, or against all types of risk, including risks that we might fail to identify or anticipate. Any failures in our risk management techniques and strategies to accurately quantify such risk exposure could limit our ability to manage risks in our operations or to seek adequate risk-adjusted returns. Refer to Item 7A. "Quantitative and Qualitative Disclosures About Market Risk."
50
Table of Contents
The use of estimates and valuations may be different from actual results, which could have a material effect on our consolidated financial statements.
We make various estimates that affect reported amounts and disclosures. Broadly, those estimates are used in measuring the fair value of certain financial instruments, establishing provisions for loan losses and potential litigation liability. Although the credit and equity markets have seen some signs of improvement, continued market volatility makes it extremely difficult to value certain of our real estate securities and CDO bonds payable. Subsequent valuations, in light of factors then prevailing, may result in significant changes in the values of these financial instruments in future periods. In addition, at the time of any sales and settlements of these securities, the price we ultimately realize will depend on the demand and liquidity in the market at that time and may be materially lower than our estimate of their current fair value. Estimates are based on available information and judgment. Therefore, actual values and results could differ from our estimates and that difference could have a material adverse effect on our consolidated financial statements.
We believe AFFO is an appropriate measure of our operating performance; however, in certain instances AFFO may not be reflective of actual economic results.
We utilize AFFO as a measure of our operating performance and believe that it is useful to investors because it facilitates an understanding of our operating performance after adjustment for certain non-cash expenses, such as equity-based compensation and unrealized gains (losses) from fair value adjustments. Additionally, we believe that AFFO serves as a good measure of our operating performance because it facilitates evaluation of our Company without the effects of selected items required in accordance U.S. GAAP that may not necessarily be indicative of current operating performance and that may not accurately compare our operating performance between periods. Nonetheless, in certain instances AFFO may not necessarily be reflective of our actual economic results. For example, if we purchase CMBS at par but its fair value is reduced in a given year, and then we sell the CMBS in the subsequent year at a price between par and the reduced fair value, we would report a gain for purposes of AFFO as the difference between the year-end fair value and the sales price even though we would have suffered an economic loss. Our book value would, however, accurately reflect the economic loss because the decrease in fair value of the CMBS in the year of purchase would have been recorded as an unrealized loss in our consolidated statement of operations. As a second example, if we repurchase one of our CDO bonds for 50% of par in a given year and its fair value at the end of the prior year was below 50% of par, we would recognize a realized loss on retirement of liabilities for AFFO purposes when we repurchase the CDO bond even though there is a positive economic impact to the retirement of the liability. Consistent with the first example, while our book value would properly reflect the economic benefit from the repurchase of our liability because the decrease in value of the liability would have been recorded as an unrealized gain in the prior year, the impact to AFFO would not be reflective of actual economic results.
Accounting for assets acquired subject to CDO financing may not be reflective of actual economic results.
U.S. GAAP requires that we record acquired assets and liabilities, including assets and liabilities related to the acquisition of a CDO, at their fair value as of the acquisition date. In July 2010, in connection with the CSE CDO, we were delegated the collateral management and special servicing rights, and acquired the original below-investment grade notes, of a $1.1 billion CRE debt CDO for $7 million. U.S. GAAP requires that we consolidate the assets and liabilities underlying the notes, and treat each asset and outstanding note as separate and distinct from each other. Such assets and liabilities were recorded at their then fair value, which was at a discount to their outstanding principal amounts. Going forward, the acquisition discount on the debt is accreted as non-cash interest income to the estimated recovery value of the debt.
51
Table of Contents
We elected the fair value option for the CSE CDO bonds payable assumed, therefore cash interest expense from the liabilities is recorded as interest expense, and interperiod changes in fair value is recorded as unrealized gains (losses). This results in our recognition of cash and non-cash interest income from the debt, and interest expense and unrealized gain (loss) on fair value adjustments of the liabilities in our consolidated statements of operations. This accounting may result in our recognition of net income from the CSE CDO in excess of the actual net interest margin generated, and our AFFO may be different than U.S. GAAP net income (loss) because AFFO excludes unrealized gains (losses) from fair value adjustments. Furthermore, while we may have significant U.S. GAAP net income (loss) and corresponding AFFO as well as operating cash flow, we may not be receiving any cash distributions from our retained interest in our CDO bonds. In addition, the portion of interest income recognized from accretion of the acquisition discount on the debt may never be realized because the principal amount of the CDO bonds payable may ultimately be greater than amounts recovered from the assets.
For 2011, we recognized $130 million of interest income ($40 million of contractual cash interest and $90 million of non-cash discount accretion), $6 million of cash interest expense and $42 million of unrealized losses on the change in fair value of securities, derivatives and bonds payable related to the CSE CDO.
We may finance assets that we hold on our balance sheet within our CDOs and such financings could expose us to additional risk.
We have in the past and may continue to finance assets that we hold on our balance sheet within our CDOs. For example, we financed a $75 million preferred equity position in our healthcare portfolio within one of our CDOs. While we believe such transactions are entered into on market terms, we could be subjected to additional scrutiny because we control both the CDOs and the assets being financed by the CDOs. If it was ever determined that we did not satisfy our obligations to a CDO in connection with such a financing, we could be subject to damages and costs that may adversely affect our business, operations and financial condition.
AFFO includes realized gains (losses) on items such as extinguishment of liabilities and sales of CRE securities, which we may not be able to replicate in the future.
For purposes of AFFO, we include realized gains (losses) from extinguishing our debt and CDO bonds and from the sales of CRE securities. Replicating these gains may not be possible, which could significantly impact our AFFO in the future. If we are unable to generate substantial gains in order to increase our AFFO, our stock price could be negatively impacted, which could have a material adverse effect on us.
U.S. GAAP requirements and our fair value adjustments of our liabilities do not necessarily provide a precise economic reflection of our stockholders' equity.
We have elected the fair value option for almost all of our CDO bonds payable, but we do not fair value the corresponding debt, which we hold at principal amount net of any related provisions for losses. Even if these loans are performing, because of a number of factors, including credit spread widening and concerns over CRE generally, a third-party may not be willing to pay par for such loans. Therefore, our carrying value for these loans is likely above their current economic value. Additionally, while we have liabilities that are valued below the principal amount that we owe on such liabilities, which correspondingly increases our stockholders' equity, absent repurchasing such liabilities at a discount we will be required to repay the full par amount of such liabilities at maturity or upon a liquidation of the underlying collateral or our Company. As a result of the foregoing, our stockholders' equity is not necessarily reflective of current economic or liquidation value.
52
Table of Contents
While we believe adjusted book value is a useful measure to report, it is subject to significant judgment and may not be reflective of actual economic value.
We have and may continue to report adjusted book value in our earnings releases and elsewhere, which is a non-GAAP measure. We believe adjusted book value is a useful measure to report to investors because it adjusts for certain unrealized adjustments, loan loss reserves and accumulated depreciation and amortization that may not necessarily be indicative of our actual economic book value. The adjustments, however, may not provide investors with a meaningful measure by which to evaluate our economic book value. Accordingly, investors are cautioned not to place undue reliance on it.
Our dividend policy is subject to change.
On a quarterly basis, our board of directors determines an appropriate common stock dividend based upon numerous factors, including REIT qualification requirements, the amount of cash flows provided by operating activities, availability of existing cash balances, borrowing capacity under existing credit agreements, access to cash in the capital markets and other financing sources, our view of our ability to realize gains in the future through appreciation in the value of our assets, general economic conditions and economic conditions that more specifically impact our business or prospects. Future dividend levels are subject to further adjustment based upon any one or more of the risk factors set forth in this Form 10-K, as well as other factors that our board of directors may, from time-to-time, deem relevant to consider when determining an appropriate common stock dividend.
We may not be able to make distributions in the future.
Our ability to generate income and to make distributions may be adversely affected by the risks described in this Form 10-K and any document we file with the SEC under the Securities Exchange Act of 1934, as amended, or the Exchange Act. All distributions will be made at the discretion of our board of directors, subject to applicable law, and will depend on our earnings, our financial condition, maintenance of our REIT qualification and such other factors as our board of directors may deem relevant from time-to-time. We may not be able to make distributions in the future.
Our ability to pay dividends is limited by the requirements of Maryland law.
Our ability to pay dividends on our common stock is limited by the laws of Maryland. Under applicable Maryland law, a Maryland corporation may not make a distribution if, after giving effect to the distribution, the corporation would not be able to pay its liabilities as the liabilities become due in the usual course of business, or generally if the corporation's total assets would be less than the sum of its total liabilities plus the amount that would be needed if the corporation were dissolved at the time of the distribution, to satisfy the preferential rights upon dissolution of the stockholders whose preferential rights are superior to those receiving the distribution. Accordingly, we may not make a distribution on our common stock if, after giving effect to the distribution, we would not be able to pay our liabilities as they become due in the usual course of business or generally if our total assets would be less than the sum of our total liabilities plus the amount that would be needed to satisfy the preferential rights upon dissolution of the holders of shares of any series of preferred stock then outstanding, if any, with preferences senior to those of our common stock.
We are highly dependent on information systems and systems failures could significantly disrupt our business.
As a CRE finance company, our business is highly dependent on communications and information systems, including systems provided by third parties for which we have no control. Any failure or interruption of our systems, whether as a result of human error or otherwise, could cause delays or
53
Table of Contents
other problems in our activities, which could have a material adverse effect on our financial performance.
Our platform may not be as scalable as we anticipate and we could face difficulties growing our business without significant new investment in our infrastructure.
While we believe our platform for operating our lines of business is highly scalable and can support significant growth without substantial new investment in our infrastructure, we may be wrong in that assessment. It is possible that if our business grows substantially, we will need to make significant new investment in our infrastructure to support that growth. We may be unable to make significant investments in our infrastructure on a timely basis or at reasonable costs and our failure in this regard could disrupt our business and operations.
We may not be effective originating and managing our debt investments.
We originate and generally manage our debt investments. Our origination capabilities depend on our ability to leverage our relationships in the market and deploy capital to borrowers that hold properties meeting our underwriting standards. Managing these debt investments requires significant resources, adherence to internal policies and attention to detail. Managing and special servicing may also require significant judgment and, despite our expectations, we may make decisions that result in losses. If we are unable to successfully originate debt investments on favorable terms, or at all, and if we are ineffective in managing those investments, our business, financial condition and results of operations could be materially adversely affected.
We may determine to grow our business through acquisitions of assets or other companies which entails substantial risk.
We may determine to grow our business through the acquisition of assets, including CDO or other companies. Such acquisitions entail substantial risk. During our due diligence of such acquisitions, we may not uncover all relevant liabilities and we may have limited, if any, recourse against the sellers. Further, we may not successfully integrate the assets or company that we acquire into our business and operations, which could have a material adverse effect on our financial results and condition.
Maintenance of our Investment Company Act exemption imposes limits on our operations.
We conduct our operations so that we are not required to register as an investment company under the Investment Company Act. Section 3(a)(1)(C) of the Investment Company Act defines as an investment company any issuer that is engaged or proposes to engage in the business of investing, reinvesting, owning, holding or trading in securities and owns or proposes to acquire investment securities having a value exceeding 40% of the value of the issuer's total assets (exclusive of government securities and cash items) on an unconsolidated basis. Excluded from the term "investment securities," among other things, are securities issued by majority owned subsidiaries that are not themselves investment companies and are not relying on the exception from the definition of investment company in Section 3(c)(1) or Section 3(c)(7) of the Investment Company Act. Because we are a holding company that conducts its businesses through subsidiaries, the securities issued by our subsidiaries that rely on the exception from the definition of "investment company" in Section 3(c)(1) or 3(c)(7) of the Investment Company Act, together with any other investment securities we may own directly, may not have a combined value in excess of 40% of the value of our total assets on an unconsolidated basis. This requirement limits the types of businesses in which we may engage through these subsidiaries.
We believe that neither our operating partnership nor our majority-owned private REIT subsidiary through which we hold the substantial majority of our investments are investment companies because
54
Table of Contents
each of them satisfy the 40% test of Section 3(a)(1)(C). We must monitor their holdings to ensure that the value of their investment securities does not exceed 40% of their respective total assets (exclusive of government securities and cash items) on an unconsolidated basis. Certain of our other subsidiaries do not satisfy the 40% test, but instead rely on exceptions and exemptions from registration as an investment company under the Investment Company Act that either limits the types of assets these subsidiaries may purchase or the manner in which these subsidiaries may acquire and sell assets. For instance, certain of our CDOs rely on the exemption from registration as an investment company under the Investment Company Act provided by Rule 3a-7 thereunder, which is available for certain structured financing vehicles. This exemption limits the ability of these CDOs to sell their assets and reinvest the proceeds from asset sales. Our subsidiary that invests in net lease properties relies on the exception from the definition of "investment company" provided by Sections 3(c)(6) and 3(c)(5)(C) of the Investment Company Act, and certain of our other CDOs similarly rely on the Section 3(c)(5)(C) exception from the definition of "investment company." These provisions exempt companies that primarily invest in real estate, mortgages and certain other qualifying real estate assets. When a CDO relies on the exception from the definition of "investment company" provided by 3(c)(5)(C) of the Investment Company Act, the CDO is limited in the types of real estate related assets that it could invest in. Our subsidiaries that engage in operating businesses and satisfy the 40% test are also not subject to the Investment Company Act.
The loss of our Investment Company Act exemption could require us to register as an investment company or substantially change the way we conduct our business, either of which may have an adverse effect on us and the market price of our common stock.
On August 31, 2011, the SEC published a concept release (Release No. 29778, File No. S7-34-11,Companies Engaged in the Business of Acquiring Mortgages and Mortgage Related Instruments), pursuant to which it is reviewing whether certain companies that invest in mortgage-backed securities and rely on the exemption from registration under Section 3(c)(5)(C) of the Investment Company Act, such as us, should continue to be allowed to rely on such an exemption from registration. If the SEC takes action with respect to this exemption, these changes could mean that certain of our CDOs and other subsidiaries could no longer rely on the Section 3(c)(5)(C) exemption, and would have to rely on Section 3(c)(1) or 3(c)(7), which would mean that our investment in those subsidiaries would be investment securities. This could result in our failure to maintain our exemption from registration as an investment company.
If we fail to maintain an exemption, exception or other exclusion from registration as an investment company, either because of SEC interpretational changes or otherwise, we could, among other things, be required either: (a) to substantially change the manner in which we conduct our operations to avoid being required to register as an investment company; or (b) to register as an investment company, either of which could have an adverse effect on us and the market price of our common stock. If we are required to register as an investment company under the Investment Company Act, we would become subject to substantial regulation with respect to our capital structure (including our ability to use leverage), management, operations, transactions with affiliated persons (as defined in the Investment Company Act), portfolio composition, including restrictions with respect to diversification and industry concentration and other matters.
Issuances of our common stock under our Dividend Reinvestment Plan and Stock Purchase Plan more than three years after the related registration statement became effective may give rise to a right of rescission.
Certain issuances of shares of our common stock under our Dividend Reinvestment Plan and Stock Purchase Plan, or DRPSPP, occurred more than three years after the related registration statement for those plans became effective. As a result, certain investors may have a rescission right. If a rescission right exists with respect to the issuances under our DRPSPP, it would apply to up to
55
Table of Contents
127,500 shares of our common stock issued for aggregate consideration of up to $513,500. In addition, the staff of the SEC has taken the position that an investor's right of rescission may survive a rescission offer.
Maryland takeover statutes may prevent a change of our control. This could depress our stock price.
Under Maryland law, "business combinations" between a Maryland corporation and an interested stockholder or an affiliate of an interested stockholder are prohibited for five years after the most recent date on which the interested stockholder becomes an interested stockholder. These business combinations include a merger, consolidation, share exchange, or, in circumstances specified in the statute, an asset transfer or issuance or reclassification of equity securities. An interested stockholder is defined as any person who beneficially owns 10% or more of the voting power of the corporation's outstanding voting stock or an affiliate or associate of the corporation who, at any time within the two-year period prior to the date in question, was the beneficial owner of 10% or more of the voting power of the then outstanding voting stock of the corporation. A person is not an interested stockholder under the statute if the board of directors approved in advance the transaction by which the person otherwise would have become an interested stockholder. However, in approving a transaction, the board of directors may provide that its approval is subject to compliance, at or after the time of approval, with any terms and conditions determined by the board.
After the five-year prohibition, any business combination between the Maryland corporation and an interested stockholder generally must be recommended by the board of directors of the corporation and approved by the affirmative vote of at least 80% of the votes entitled to be cast by holders of outstanding shares of voting stock of the corporation; and two-thirds of the votes entitled to be cast by holders of voting stock of the corporation other than shares held by the interested stockholder with whom or with whose affiliate the business combination is to be effected or held by an affiliate or associate of the interested stockholder.
These super-majority vote requirements do not apply if the corporation's common stockholders receive a minimum price, as defined under Maryland law, for their shares in the form of cash or other consideration in the same form as previously paid by the interested stockholder for its shares.
The business combination statute may discourage others from trying to acquire control of us and increase the difficulty of consummating any offer, including potential acquisitions that might involve a premium price for our common stock or otherwise be in the best interest of our stockholders. The statute permits various exemptions from its provisions, including business combinations that are exempted by the board of directors prior to the time that the interested stockholder becomes an interested stockholder. Pursuant to the statute, our board of directors has exempted any business combinations: (i) between us and NorthStar Capital Investment Corp. or any of its affiliates; and (ii) between us and any person, provided that any such business combination is first approved by our board of directors (including a majority of our directors who are not affiliates or associates of such person). Consequently, the five-year prohibition and the super-majority vote requirements do not apply to business combinations between us and any of them. As a result, such parties may be able to enter into business combinations with us that may not be in the best interest of our stockholders, without compliance with the supermajority vote requirements and the other provisions in the statute.
Our authorized but unissued common and preferred stock and other provisions of our charter and bylaws may prevent a change in our control.
Our charter authorizes us to issue additional authorized but unissued shares of our common stock or preferred stock and authorizes our board of directors, without stockholder approval, to amend our charter to increase or decrease the aggregate number of shares of stock or the number of shares of stock of any class or series that we have the authority to issue. In addition, our board of directors may
56
Table of Contents
classify or reclassify any unissued shares of common stock or preferred stock and may set the preferences, rights and other terms of the classified or reclassified shares. Our board of directors could establish a series of common stock or preferred stock that could delay or prevent a transaction or a change in control that might involve a premium price for the common stock or otherwise be in the best interest of our stockholders.
Our charter and bylaws also contain other provisions that may delay or prevent a transaction or a change in control that might involve a premium price for shares of our common stock or otherwise be in the best interest of our stockholders.
Maryland law also allows a corporation with a class of equity securities registered under the Exchange Act and at least three independent directors to elect to be subject, by provision in its charter or bylaws or a resolution of its board of directors and notwithstanding any contrary provision in its charter or bylaws, to a classified board, unless its charter prohibits such an election. Our charter contains a provision prohibiting such an election to classify our board under this provision of Maryland law. This may make us more vulnerable to a change in control. If our stockholders voted to amend this charter provision and to classify our board of directors, the staggered terms of our directors could reduce the possibility of a tender offer or an attempt at a change in control even though a tender offer or change in control might be in the best interests of our stockholders.
Risks Related to Our REIT Tax Status
Our failure to qualify as a REIT would subject us to federal income tax and reduce cash available for distribution to our stockholders.
We intend to continue to operate in a manner so as to qualify as a REIT for federal income tax purposes. Qualification as a REIT involves the application of highly technical and complex Internal Revenue Code provisions for which only a limited number of judicial and administrative interpretations exist. Even an inadvertent or technical mistake could jeopardize our REIT status. Our continued qualification as a REIT will depend on our satisfaction of certain asset, income, organizational, distribution, stockholder ownership and other requirements on a continuing basis.
Moreover, new tax legislation, administrative guidance or court decisions, in each instance potentially with retroactive effect, could make it more difficult or impossible for us to qualify as a REIT. If we fail to qualify as a REIT in any taxable year, we would be subject to federal income tax, including any applicable alternative minimum tax, on our taxable income at regular corporate rates, and distributions to stockholders would not be deductible by us in computing our taxable income. Any such corporate tax liability could be substantial and would reduce the amount of cash available for distribution to our stockholders, which in turn could have an adverse impact on the value of, and trading prices for, our stock.
We hold substantially all of our assets in a majority-owned subsidiary, which we refer to as our private REIT. Our private REIT is organized to qualify as a REIT for federal income tax purposes. Additionally, we have sponsored and manage, through our private REIT, additional entities that qualify or intend to qualify as REITs. Our private REIT and any REITs we sponsor and manage must also meet all of the REIT qualification tests under the Internal Revenue Code and are subject to all of the same risks as us. If our private REIT did not qualify as a REIT, it is likely that we would also not qualify as a REIT. If, for any reason, we failed to qualify as a REIT and we were not entitled to relief under certain Internal Revenue Code provisions, we would be unable to elect REIT status for the four taxable years following the year during which we ceased to so qualify.
57
Table of Contents
Complying with REIT requirements may force us to borrow funds to make distributions to stockholders or otherwise depend on external sources of capital to fund such distributions.
To qualify as a REIT, we are required to distribute annually at least 90% of our taxable income, subject to certain adjustments, to our stockholders. To the extent that we satisfy the distribution requirement, but distribute less than 100% of our taxable income, we will be subject to federal corporate income tax on our undistributed taxable income. In addition, we may elect to retain and pay income tax on our net long-term capital gain. In that case, a stockholder would be taxed on its proportionate share of our undistributed long-term gain and would receive a credit or refund for its proportionate share of the tax we paid. A stockholder, including a tax-exempt or foreign stockholder, would have to file a federal income tax return to claim that credit or refund. Furthermore, we will be subject to a 4% nondeductible excise tax if the actual amount that we distribute to our stockholders in a calendar year is less than a minimum amount specified under federal tax laws. We anticipate that distributions generally will be taxable as ordinary income, although a portion of such distributions may be designated by us as long-term capital gain to the extent attributable to capital gain income recognized by us, or may constitute a return of capital to the extent that such distribution exceeds our earnings and profits as determined for tax purposes.
From time-to-time, we may generate taxable income greater than our net income for U.S. GAAP, among other things, amortization of capitalized purchase premiums, fair value adjustments and reserves. In addition, our taxable income may be greater than our cash flow available for distribution to stockholders as a result of, among other things, repurchases of our outstanding debt at a discount and investments in assets that generate taxable income in advance of the corresponding cash flow from the assets (for example, if a borrower defers the payment of interest in cash pursuant to a contractual right or otherwise).
We believe that our operating partnership properly elected to defer, under section 108(i) of the Internal Revenue Code, the recognition of cancellation of indebtedness, or COD, income generated from repurchasing its debt at a discount. If the IRS successfully challenges our operating partnership's ability to make that election, we may be treated as having failed to pay sufficient dividends to satisfy the 90% distribution requirement and/or avoid the corporate income tax and the 4% nondeductible excise tax. We may be required to correct any failure to meet the 90% distribution requirement by paying deficiency dividends to our stockholders and an interest charge to the IRS in a later year.
If we do not have other funds available in the situations described in the preceding paragraphs, we could be required to borrow funds on unfavorable terms, sell investments at disadvantageous prices or find another alternative source of funds to make distributions sufficient to enable us to distribute enough of our taxable income to satisfy the REIT distribution requirement and to avoid corporate income tax and the 4% excise tax in a particular year. These alternatives could increase our costs or reduce our equity.
Because of the distribution requirement, it is unlikely that we will be able to fund all future capital needs, including capital needs in connection with investments, from cash retained from operations. As a result, to fund future capital needs, we likely will have to rely on third-party sources of capital, including both debt and equity financing, which may or may not be available on favorable terms or at all. Our access to third-party sources of capital will depend upon a number of factors, including the market's perception of our growth potential and our current and potential future earnings and cash distributions and the market price of our stock.
We could fail to qualify as a REIT if the IRS successfully challenges our treatment of our mezzanine loans and repurchase agreements.
We intend to continue to operate in a manner so as to qualify as a REIT for federal income tax purposes. However, qualification as a REIT involves the application of highly technical and complex
58
Table of Contents
Internal Revenue Code provisions for which only a limited number of judicial and administrative interpretations exist. If the IRS disagrees with the application of these provisions to our assets or transactions, including assets we have owned and past transactions, our REIT qualification could be jeopardized. For example, IRS Revenue Procedure 2003-65 provides a safe harbor pursuant to which a mezzanine loan, if it meets each of the requirements contained in Revenue Procedure 2003-65, will be treated by the IRS as a real estate asset for purposes of the REIT asset tests, and interest derived from it will be treated as qualifying mortgage interest for purposes of the REIT 75% income test. Although Revenue Procedure 2003-65 provides a safe harbor on which taxpayers may rely, it does not prescribe rules of substantive tax law. Moreover, our mezzanine loans typically do not meet all of the requirements for reliance on this safe harbor. We have invested, and will continue to invest, in mezzanine loans in a manner that we believe will enable us to continue to satisfy the REIT gross income and asset tests. In addition, we have entered into sale and repurchase agreements under which we nominally sold certain of our mortgage assets to a counterparty and simultaneously entered into an agreement to repurchase the sold assets. We believe that we will be treated for federal income tax purposes as the owner of the mortgage assets that are the subject of any such sale and repurchase agreement notwithstanding that we transferred record ownership of the assets to the counterparty during the term of the agreement. It is possible, however, that the IRS could assert that we did not own the mortgage assets during the term of the sale and repurchase agreement, in which case our ability to qualify as a REIT could be adversely affected. Even if the IRS were to disagree with one or more of our interpretations and we were treated as having failed to satisfy one of the REIT qualification requirements, we could maintain our REIT qualification if our failure was excused under certain statutory savings provisions. However, there can be no guarantee that we would be entitled to benefit from those statutory savings provisions if we failed to satisfy one of the REIT qualification requirements, and even if we were entitled to benefit from those statutory savings provisions, we could be required to pay a penalty tax.
Even if we remain qualified as a REIT, we may face other tax liabilities that reduce our cash flow.
Even if we remain qualified for taxation as a REIT, we may be subject to certain federal, state and local taxes on our income and assets, including taxes on any undistributed income, tax on income from certain activities conducted as a result of a foreclosure, the federal alternative minimum tax and state or local income, property and transfer taxes, such as mortgage recording taxes. Any of these taxes would decrease cash available for distribution to our stockholders. In addition, in order to meet the REIT qualification requirements, or to avert the imposition of a 100% tax that applies to certain gains derived by a REIT from dealer property or inventory, we may hold some of our assets through taxable REIT subsidiaries, or TRSs.
Complying with REIT requirements may cause us to forego otherwise attractive opportunities or liquidate otherwise attractive investments.
To qualify as a REIT for federal income tax purposes, we must continually satisfy tests concerning, among other things, the sources of our income, the nature and diversification of our assets, the amounts we distribute to our stockholders and the ownership of our stock. As discussed above, we may be required to make distributions to stockholders at disadvantageous times or when we do not have funds readily available for distribution. Additionally, we may be unable to pursue investments that would be otherwise attractive to us in order to satisfy the source of income requirements for qualifying as a REIT.
We must also ensure that at the end of each calendar quarter at least 75% of the value of our assets consists of cash, cash items, government securities and qualified real estate assets. The remainder of our investment in securities (other than government securities and qualified real estate assets) generally cannot include more than 10% of the outstanding voting securities of any one issuer or more
59
Table of Contents
than 10% of the total value of the outstanding securities of any one issuer. In addition, in general, no more than 5% of the value of our assets can consist of the securities of any one issuer (other than government securities and qualified real estate assets), and no more than 25% of the value of our total securities can be represented by securities of one or more TRSs. If we fail to comply with these requirements at the end of any calendar quarter, we must correct such failure within 30 days after the end of the calendar quarter to avoid losing our REIT status and suffering adverse tax consequences, unless certain relief provisions apply. As a result, compliance with the REIT requirements may hinder our ability to operate solely on the basis of profit maximization and may require us to liquidate or forego otherwise attractive investments. These actions could have the effect of reducing our income and amounts available for distribution to our stockholders.
Modifications of the terms of our real estate debt investments and the mortgage loans underlying our CMBS in conjunction with reductions in the value of the real property securing such loans could cause us to fail to qualify as a REIT.
Our CRE debt and CMBS investments have been and may continue to be materially affected by the weakened condition of the real estate market and the economy in general. As a result, many of the terms of our real estate debt and the loans supporting our CMBS have been modified to avoid foreclosure actions and for other reasons. Under the Internal Revenue Code, if the terms of a loan are modified in a manner constituting a "significant modification," such modification triggers a deemed exchange of the original loan for the modified loan. In general, under applicable Treasury Regulations, or the Loan-to-Value Regulation, if a loan is secured by real property and other property and the highest principal amount of the loan outstanding during a taxable year exceeds the fair market value of the real property securing the loan determined as of the date we agreed to acquire the loan or the date we significantly modified the loan, a portion of the interest income from such loan will not be qualifying income for purposes of the 75% gross income test, but will be qualifying income for purposes of the 95% gross income test. Although the law is not entirely clear, a portion of the loan will likely be a non-qualifying asset for purposes of the 75% asset test. The non-qualifying portion of such a loan would be subject to, among other requirements, the requirement that a REIT not hold securities possessing more than 10% of the total value of the outstanding securities of any one issuer, or the 10% Value Test.
IRS Revenue Procedure 2011-16 provides a safe harbor pursuant to which we will not be required to redetermine the fair market value of the real property securing a loan for purposes of the gross income and asset tests discussed above in connection with a loan modification that is: (1) occasioned by a borrower default; or (2) made at a time when we reasonably believe that the modification to the loan will substantially reduce a significant risk of default on the original loan. No assurance can be provided that all of our loan modifications have or will qualify for the safe harbor in Revenue Procedure 2011-16. To the extent we significantly modify loans in a manner that does not qualify for that safe harbor, we will be required to redetermine the value of the real property securing the loan at the time it was significantly modified. In determining the value of the real property securing such a loan, we generally will not obtain third-party appraisals, but rather will rely on internal valuations. No assurance can be provided that the IRS will not successfully challenge our internal valuations. If the terms of our mortgage loans, mezzanine loans and B-Notes and loans supporting our mortgage backed securities are "significantly modified" in a manner that does not qualify for the safe harbor in Revenue Procedure 2011-16 and the fair market value of the real property securing such loans has decreased significantly, we could fail the 75% gross income test, the 75% asset test and/or the 10% Value Test. Unless we qualified for relief under certain Internal Revenue Code cure provisions, such failures could cause us to fail to qualify as a REIT.
60
Table of Contents
Our ability to invest in distressed debt may be limited by our intention to maintain our qualification as a REIT.
We have and may in the future acquire distressed debt, including distressed first mortgage loans, subordinate mortgage interests, mezzanine loans and CMBS. In general, under the Loan-to-Value Regulation, if a loan is secured by real property and other property and the highest principal amount of the loan outstanding during a taxable year exceeds the fair market value of the real property securing the loan as of the date we agreed to acquire the loan or the date we significantly modified the loan, a portion of the interest income from such a loan will not be qualifying income for purposes of the 75% gross income test, but will be qualifying income for purposes of the 95% gross income test. Although the law is not entirely clear, a portion of the loan will also likely be a non-qualifying asset for purposes of the 75% asset test. The non-qualifying portion of such a loan would be subject to, among other requirements, the 10% Value Test. IRS Revenue Procedure 2011-16 provides a safe harbor under which the IRS has stated that it will not challenge a REIT's treatment of a loan as being, in part, a qualifying real estate asset in an amount equal to the lesser of: (1) the fair market value of the real property securing the loan determined as of the date the REIT committed to originate or acquire the loan; or (2) the fair market value of the loan on the date of the relevant quarterly REIT asset testing date. This safe harbor will help us comply with the REIT asset tests immediately following the acquisition of distressed debt. It will be less helpful as the value of the distressed debt increases. Under the safe harbor, when the value of a distressed debt exceeds the fair market value of the real property that secures the debt, determined as of the date we committed to acquire the debt, the excess will be treated as non-qualifying asset. Accordingly, an increasing portion of a distressed debt will be treated as a non-qualifying asset as the value of the distressed debt increases. Additionally, Revenue Procedure 2011-16 states that the IRS will treat a distressed debt as producing a significant amount of non-qualifying income for the 75% gross income test. Specifically, Revenue Procedure 2011-16 indicates that interest income on distressed debt will be treated as qualifying income based on the ratio of (1) fair market value of the real property securing the debt determined as of the date we committed to acquire the debt and (2) the face amount of the debt (and not the purchase price of the debt). The face amount of a distressed debt will typically exceed the fair market value of the real property securing the debt on the date we commit to acquire the debt. Because distressed debt may produce a significant amount of non-qualifying income for purposes of the 75% gross income test and a significant portion of a distressed debt may be treated as a non-qualifying asset for the REIT asset tests once the debt increases in value, we may be limited in our ability to invest in distressed debt and maintain our qualification as a REIT.
Our investments in distressed debt may produce "phantom income" that will increase the amount of taxable income we have to distribute to satisfy the REIT distribution requirement and may cause us to sell assets, borrow or make taxable distributions of debt or equity securities to satisfy that requirement.
Our acquisition of distressed debt may cause us to recognize "phantom income" (or non-cash income) for federal income tax purposes. For example, if we acquire non-publicly traded distressed debt and then significantly modify that debt, we would recognize gain on the resulting deemed exchange equal to the difference between the adjusted issue price of the distressed debt and our adjusted tax basis in the distressed debt. Because we typically acquire distressed debt at a significant discount, our adjusted tax basis in the distressed debt typically is significantly lower than the adjusted issue price of the distressed debt. Accordingly, if we significantly modify non-publicly traded distressed debt, we may recognize a substantial amount of taxable income without receiving any cash. That "phantom income" will increase the amount of taxable income we are required to distribute to satisfy the REIT distribution requirement. To satisfy that requirement, we may have sell assets or borrow funds at inopportune times or make taxable distributions of our debt or equity securities.
61
Table of Contents
Complying with REIT requirements may limit our ability to hedge effectively.
The REIT provisions of the Internal Revenue Code may limit our ability to hedge our operations effectively. Our aggregate gross income from non-qualifying hedges, fees and certain other non-qualifying sources cannot exceed 5% of our annual gross income. Additionally, our gross income from qualifying hedges entered into prior to July 31, 2008 constitutes non-qualifying income for purposes of the 75% gross income test. Consequently, our gross income from qualifying hedges entered into prior to July 31, 2008, along with other sources of non-qualifying income for purposes of the 75% gross income test, cannot exceed 25% of our annual gross income. As a result, we might have to limit our use of advantageous hedging techniques or implement those hedges through TRS. Any hedging income earned by a TRS would be subject to federal, state and local income tax at regular corporate rates. This could increase the cost of our hedging activities or expose us to greater risks associated interest rate or other changes than we would otherwise incur.
We may fail to qualify as a REIT as a result of our fee income from managing certain structured finance and investment vehicles and our income from active businesses.
We currently manage certain structured finance and investment vehicles that are treated as TRSs or REITs. Fee income and active business income that we generate directly (rather than through a TRS) constitute non-qualifying income for purposes of the 95% and 75% gross income tests. It is not possible to predict with complete accuracy the amount of gross income that we will generate in any taxable year due to, among other things, fluctuations in interest rates. Accordingly, our qualifying income for purposes of our gross income tests may be lower than we anticipate, and, conversely, our fee income and active business income may be higher than we anticipate. If our fee income and active business income, combined with other sources of non-qualifying income, such as income from non-qualifying hedges, exceed 5% of our gross income, we would fail to satisfy the 95% gross income test. Unless we qualified for certain Internal Revenue Code cure provisions, a failure of the 95% gross income test would cause us to fail to qualify as a REIT.
Liquidation of assets may jeopardize our REIT status.
To continue to qualify as a REIT, we must comply with requirements regarding our assets and our sources of income. If we are compelled to liquidate our mortgage, preferred equity or other investments to satisfy our obligations to our lenders, we may be unable to comply with these requirements, ultimately jeopardizing our status as a REIT.
Adverse legislative or regulatory tax changes could reduce the market price of our common stock.
At any time, the federal income tax laws governing REITs or the administrative interpretations of those laws may be amended. Any of those new laws or interpretations may take effect retroactively and could adversely affect us or you as a stockholder. For example, legislation enacted in 2003, 2006 and 2010 generally reduced the federal income tax rate on most dividends paid by corporations to investors taxed at individual rates to a maximum of 15% through the end of 2012. REIT dividends, with limited exceptions, do not benefit from the rate reduction, because a REITs income is generally not subject to corporate level tax. As such, this legislation could cause shares in non-REIT corporations to be a more attractive investment to investors taxed at individual rates than shares in REITs and could have an adverse effect on the value of our stock.
The prohibited transactions tax may limit our ability to engage in transactions, including dispositions of assets and certain methods of securitizing loans, that would be treated as sales for federal income tax purposes.
A REIT's net income from prohibited transactions is subject to a 100% tax. In general, prohibited transactions are sales or other dispositions of property, other than foreclosure property, but including
62
Table of Contents
loans, held primarily for sale to customers in the ordinary course of business. If we securitize loans in a manner that is, for federal income tax purposes, treated as a sale of the loans we may be subject to the prohibited transaction tax. Therefore, in order to avoid the prohibited transactions tax, we may choose not to engage in certain sales of loans and may limit the structures we utilize for our securitization transactions even though such sales or structures might otherwise be beneficial to us. Additionally, we may be subject to the prohibited transaction tax upon a disposition of real property. Although a safe-harbor to the characterization of the sale of real property by a REIT as a prohibited transaction is available, we cannot assure you that we can comply with the safe harbor or that we will avoid owning property that may be characterized as held primarily for sale to customers in the ordinary course of business. Consequently, we may choose not to engage in certain sales of real property or may conduct such sales through a TRS.
We may recognize substantial amounts of REIT taxable income, which we would be required to distribute to our stockholders, in a year in which we are not profitable under GAAP principles or other economic measures.
We may recognize substantial amounts of REIT taxable income in years in which we are not profitable under U.S. GAAP or other economic measures as a result of the differences between U.S. GAAP and tax accounting methods. For example, we may recognize substantial amounts of COD income for federal income tax purposes (but not for U.S. GAAP purposes) due to discount repurchases of our debt, which could cause our REIT taxable income to exceed our U.S. GAAP income. Additionally, we may deduct our capital losses only to the extent of our capital gains and not against our ordinary income, in computing our REIT taxable income for a given taxable year. Finally, certain of our assets and liabilities are marked-to-market for U.S. GAAP purposes but not for tax purposes, which could result in losses for U.S. GAAP purposes that are not recognized in computing our REIT taxable income. Consequently, we could recognize substantial amounts of REIT taxable income, and would be required to distribute such income to our stockholders, in a year in which we are not profitable under U.S. GAAP or other economic measures.
We may distribute our common stock in a taxable dividend, in which case stockholders may sell shares of our common stock to pay tax on such dividends, placing downward pressure on the market price of our common stock.
We may make taxable dividends that are payable in cash and common stock. The IRS has issued private letter rulings to other REITs treating certain distributions that are paid partly in cash and partly in stock as taxable dividends that would satisfy the REIT annual distribution requirement and qualify for the dividends paid deduction for federal income tax purposes. Those rulings may be relied upon only by taxpayers to whom they were issued, but we could request a similar ruling from the IRS. In addition, the IRS previously issued a revenue procedure authorizing publicly traded REITs to make elective cash/stock dividends, but that revenue procedure does not apply to our 2012 and future taxable years. Accordingly, it is unclear whether and to what extent we will be able to make taxable dividends payable in cash and common stock. If made a taxable dividend payable in cash and common stock, taxable stockholders receiving such dividends will be required to include the full amount of the dividend as ordinary income to the extent of our current and accumulated earnings and profits, as determined for federal income tax purposes. As a result, stockholders may be required to pay income tax with respect to such dividends in excess of the cash dividends received. If a U.S. stockholder sells the common stock that it receives as a dividend in order to pay this tax, the sales proceeds may be less than the amount recorded in earnings with respect to the dividend, depending on the market price of our common stock at the time of the sale. Furthermore, with respect to certain non-U.S. stockholders, we may be required to withhold U.S. federal income tax with respect to such dividends, including in respect of all or a portion of such dividend that is payable in common stock. If we made a taxable dividend payable in cash and our common stock and a significant number of our stockholders
63
Table of Contents
determine to sell shares of our common stock in order to pay taxes owed on dividends, it may put downward pressure on the trading price of our common stock.
We may lose our REIT status if the IRS successfully challenges our characterization of our income from our foreign taxable REIT subsidiaries.
We have elected to treat several Cayman Islands companies, including issuers in CDO transactions, as TRSs. We will likely be required to include in our income, even without the receipt of actual distributions, earnings from our investment in the foreign TRSs. Income inclusions from equity investments in foreign corporations are technically neither actual dividends nor any of the other enumerated categories of qualifying income for the 95% gross income test. However, the IRS has issued private letter rulings to other REITs holding that income inclusions from equity investments in foreign corporations would be treated as qualifying income for purposes of the 95% gross income test. Private letter rulings may be relied upon only by the taxpayers to whom they are issued and the IRS may revoke a private letter ruling. Based on those private letter rulings and advice of counsel, we intend to treat such income inclusions as qualifying income for purposes of the 95% gross income test. Nevertheless, no assurance can be provided that the IRS would not successfully challenge our treatment of such income as qualifying income. In the event that such income was determined not to qualify for the 95% gross income test, we could be subject to a penalty tax with respect to such income to the extent it exceeds 5% of our gross income or we could fail to qualify as a REIT.
If our foreign taxable REIT subsidiaries are subject to U.S. federal income tax at the entity level, it would greatly reduce the amounts those entities would have available to distribute to us and that they would have available to pay their creditors.
There is a specific exemption from federal income tax for non-U.S. corporations that restrict their activities in the U.S. to trading stock and securities (or any activity closely related thereto) for their own account whether such trading (or such other activity) is conducted by the corporation or its employees through a resident broker, commission agent, custodian or other agent. We intend that our foreign TRSs will rely on that exemption or otherwise operate in a manner so that they will not be subject to U.S. federal income tax on their net income at the entity level. If the IRS succeeded in challenging that tax treatment, it would greatly reduce the amount that those foreign TRSs would have available to pay to their creditors and to distribute to us.
The stock ownership restrictions of the Internal Revenue Code for REITs and the 9.8% stock ownership limit in our charter may inhibit market activity in our stock and restrict our business combination opportunities.
To qualify as a REIT, five or fewer individuals, as defined in the Internal Revenue Code, may not own, actually or constructively, more than 50% in value of our issued and outstanding stock at any time during the last half of a taxable year. Attribution rules in the Internal Revenue Code determine if any individual or entity actually or constructively owns our stock under this requirement. Additionally, at least 100 persons must beneficially own our stock during at least 335 days of a taxable year. To help insure that we meet these tests, our charter restricts the acquisition and ownership of shares of our stock.
Our charter, with certain exceptions, authorizes our directors to take such actions as are necessary and desirable to preserve our qualification as a REIT. Unless exempted by our board of directors, no person, including entities, may own more than 9.8% of the value of our outstanding shares of stock or more than 9.8% in value or number (whichever is more restrictive) of our outstanding shares of common stock. The board may not grant an exemption from these restrictions to any proposed transferee whose ownership in excess of 9.8% of the value of our outstanding shares would result in the termination of our status as a REIT. Despite these restrictions, it is possible that there will be five or fewer individuals who own more than 50% in value of our outstanding shares, which could cause us to
64
Table of Contents
fail to qualify as a REIT. These restrictions on transferability and ownership will not apply, however, if our board of directors determines that it is no longer in our best interest to continue to qualify as a REIT.
These ownership limits could delay or prevent a transaction or a change in control that might involve a premium price for our common stock or otherwise be in the best interest of the stockholders.
Our dividends that are attributable to excess inclusion income will likely increase the tax liability of our tax-exempt stockholders, foreign stockholders and stockholders with net operating losses.
In general, dividend income that a tax-exempt entity receives from us should not constitute unrelated business taxable income as defined in Section 512 of the Internal Revenue Code. If we realize excess inclusion income and allocate it to our stockholders, however, then this income would be fully taxable as unrelated business taxable income to a tax-exempt entity under Section 512 of the Internal Revenue Code. A foreign stockholder would generally be subject to U.S. federal income tax withholding on this income without reduction pursuant to any otherwise applicable income tax treaty. U.S. stockholders would not be able to offset such income with their net operating losses.
Although the law is not entirely clear, the IRS has taken the position that we are subject to tax at the highest corporate rate on the portion of our excess inclusion income equal to the percentage of our stock held in record name by "disqualified organizations" (generally tax-exempt investors, such as certain state pension plans and charitable remainder trusts, that are not subject to the tax on unrelated business taxable income). To the extent that our stock owned by "disqualified organizations" is held in street name by a broker-dealer or other nominee, the broker-dealer or nominee would be liable for a tax at the highest corporate rate on the portion of our excess inclusion income allocable to the stock held on behalf of the "disqualified organizations." A regulated investment company or other pass-through entity owning our stock may also be subject to tax at the highest corporate tax rate on any excess inclusion income allocated to their record name owners that are "disqualified organizations."
Excess inclusion income could result if a REIT held a residual interest in a real estate mortgage investment conduit, or REMIC. In addition, excess inclusion income also may be generated if a REIT issues liabilities with two or more maturities and the terms of the payments of these liabilities bear a relationship to the payments that the REIT received on mortgage loans or mortgage-backed securities securing those liabilities. Although we do not hold any REMIC residual interests, we anticipate that certain of the term financings conducted by our private REIT will produce excess inclusion income that will be allocated to our stockholders. Accordingly, we expect that a portion of our dividends may constitute excess inclusion income, which will likely increase the tax liability of tax-exempt stockholders, foreign stockholders, stockholders with net operating losses, regulated investment companies and other pass-through entities whose record name owners are disqualified organizations and brokers-dealers and other nominees who hold stock on behalf of disqualified organizations.
Item 1B. Unresolved Staff Comments
None.
65
Table of Contents
Item 2. Properties
Our operating real estate investments, which comprise our net lease properties business segment, are described under Item 1. "Business—Net Lease Properties." The following table sets forth certain information with respect to each of our net lease properties and REO, as of December 31, 2011 (dollar amounts in thousands):
Net Lease Portfolio: Property Information
| | | | | | | | | | | | | | | | | | | | | | | | | | | | | | | |
Location City, State | | Square
Footage | | Percentage
Leased | | Rent
per
Square
Foot(1) | | Number of
Properties | | Ownership
Interest | | Type | | Lease
Expiration
Date(2) | | Leasehold
Expiration
Date(2) | | Carrying
Value(3) | | Borrowings | | Rental
Cash
Flows(4) | |
|---|
Core Net Lease | | | | | | | | | | | | | | | | | | | | | | | | | | | | | | | |
Auburn Hills, MI | | | 105,692 | | | 100 | % | $ | 3.89 | | | 2 | | Fee | | Office | | | Sep-15 | | NA | | $ | 11,587 | | $ | 11,021 | | $ | 1,644 | |
Aurora, CO | | | 183,529 | | | 100 | % | | 4.61 | | | 1 | | Fee | | Office | | | Jun-15 | | NA | | | 38,459 | | | 32,159 | | | 3,384 | |
Camp Hill, PA | | | 214,150 | | | 100 | % | | 3.89 | | | 1 | | Fee | | Office | | | Sep-15 | | NA | | | 25,410 | | | 23,910 | | | 3,332 | |
Columbus, OH | | | 199,112 | | | 100 | % | | 2.93 | | | 1 | | Fee | | Office | | | Dec-17 | | NA | | | 33,559 | | | 22,937 | | | 2,328 | |
Fort Mill, SC | | | 165,000 | | | 100 | % | | 3.26 | | | 1 | | Fee | | Office | | | Oct-20 | | NA | | | 34,854 | | | 29,861 | | | 2,152 | |
Milpitas, CA | | | 178,213 | | | 100 | % | | 3.86 | | | 2 | | Fee | | Office | | | Feb-17 | | NA | | | 25,647 | | | 21,141 | | | 2,752 | |
Indianapolis, IN | | | 333,600 | | | 100 | % | | 1.91 | | | 1 | | Fee | | Office/Flex | | | Dec-25 | | NA | | | 33,976 | | | 27,416 | | | 2,552 | |
Rancho Cordova, CA | | | 68,000 | | | 100 | % | | 3.89 | | | 1 | | Fee | | Office | | | Sep-15 | | NA | | | 12,420 | | | 10,485 | | | 1,056 | |
Rockaway, NJ | | | 121,038 | | | 100 | % | | 3.86 | | | 1 | | Fee | | Office | | | Apr-17 | (6) | NA | | | 22,077 | | | 16,635 | | | 1,872 | |
Salt Lake City, UT | | | 117,553 | | | 100 | % | | 4.92 | | | 1 | | Fee | | Office | | | Apr-12 | | NA | | | 20,734 | | | 14,625 | | | 2,316 | |
| | | | | | | | | | | | | | | | | | | | | | | | | |
Subtotal Office | | | 1,685,887 | | | 100 | % | | 3.47 | | | 12 | | | | | | | | | | | | 258,723 | | | 210,190 | | | 23,388 | |
Bloomingdale, IL | | | 50,000 | | | 100 | % | | 2.75 | | | 1 | | Leasehold | | Retail | | | Jan-22 | | Jan-27 | | | 5,810 | | | 5,516 | | | 548 | |
Fort Wayne, IN | | | 50,000 | | | 100 | % | | 2.06 | | | 1 | | Leasehold | | Retail | | | Aug-24 | | Jan-25 | | | 3,642 | | | 3,221 | | | 412 | |
Keene, NH | | | 45,471 | | | 100 | % | | 4.01 | | | 1 | | Fee | | Retail | | | Oct-20 | | NA | | | 8,952 | | | 6,478 | | | 728 | |
Manchester, NH | | | 20,087 | | | 100 | % | | 3.05 | | | 1 | | Fee | | Retail | | | Jan-16 | | NA | | | 3,256 | | | 2,308 | | | 244 | |
Manchester, NH | | | 50,000 | | | 100 | % | | 3.05 | | | 1 | | Fee | | Retail | | | May-16 | | NA | | | 8,105 | | | 5,748 | | | 612 | |
Melville, NY | | | 46,533 | | | 100 | % | | 2.31 | | | 1 | | Leasehold | | Retail | | | Jan-22 | | Jan-22 | | | 3,187 | | | 4,278 | | | 432 | |
Millbury, MA | | | 54,175 | | | 100 | % | | 2.12 | | | 1 | | Leasehold | | Retail | | | Jan-24 | | Jan-24 | | | 5,994 | | | 4,548 | | | 460 | |
New York, NY | | | 7,500 | | | 100 | % | | 110.31 | (5) | | 1 | | Leasehold | | Retail | | | Dec-12 | | Dec-12 | | | 3,245 | | | — | | | 932 | |
North Attleboro, MA | | | 50,025 | | | 100 | % | | 2.15 | | | 1 | | Leasehold | | Retail | | | Jan-24 | | Jan-24 | | | 5,445 | | | 4,530 | | | 432 | |
South Portland, ME | | | 52,900 | | | 100 | % | | 3.92 | | | 1 | | Leasehold | | Retail | | | Sep-23 | | Jan-31 | | | 6,687 | | | 4,266 | | | 828 | |
Wichita, KS | | | 48,780 | | | 100 | % | | 3.00 | | | 1 | | Fee | | Retail | | | Mar-23 | | NA | | | 6,909 | | | 5,895 | | | 584 | |
| | | | | | | | | | | | | | | | | | | | | | | | | |
Subtotal Retail | | | 475,471 | | | 100 | % | | 3.27 | | | 11 | | | | | | | | | | | | 61,232 | | | 46,788 | | | 6,212 | |
Reading, PA | | | 609,000 | | | 69 | % | | 3.30 | | | 1 | | Fee | | Distribution Ctr | | | Oct-17 | (6) | NA | | | 25,603 | | | 18,367 | | | 868 | |
| | | | | | | | | | | | | | | | | | | | | | | | | |
Subtotal Other | | | 609,000 | | | 69 | % | | 3.30 | | | 1 | | | | | | | | | | | | 25,603 | | | 18,367 | | | 868 | |
| | | | | | | | | | | | | | | | | | | | | | | | | |
Total Core Net Lease(7) | | | 2,770,358 | | | 93 | % | | | | | 24 | | | | | | | Jul-18 | | | | | 345,558 | | | 275,345 | | | 30,468 | |
Healthcare Net Lease | | | | | | | | | | | | | | | | | | | | | | | | | | | | | | | |
Black Mountain, NC | | | 36,235 | | | 100 | % | | 20.06 | | | 1 | | Fee | | Healthcare | | | Mar-25 | | NA | | | 6,254 | | | 5,241 | | | 727 | |
Blountstown, FL | | | 33,722 | | | 100 | % | | 18.57 | | | 1 | | Fee | | Healthcare | | | Mar-25 | | NA | | | 5,447 | | | 3,831 | | | 626 | |
Bremerton, WA | | | 68,601 | | | 100 | % | | 6.98 | | | 1 | | Fee | | Healthcare | | | Mar-21 | | NA | | | 9,495 | | | 7,199 | | | 479 | |
Carrollton, GA | | | 49,000 | | | 100 | % | | 5.82 | | | 1 | | Fee | | Healthcare | | | Mar-21 | | NA | | | 5,593 | | | 2,924 | | | 285 | |
Castleton, IN | | | 46,026 | | | 100 | % | | 19.60 | | | 1 | | Fee | | Healthcare | | | Jun-17 | | NA | | | 8,754 | | | — | | | 902 | |
Charleston, IL | | | 39,393 | | | 100 | % | | 6.40 | | | 1 | | Fee | | Healthcare | | | Mar-21 | | NA | | | 6,953 | | | 5,793 | | | 252 | |
Chesterfield, IN | | | 19,062 | | | 100 | % | | 26.44 | | | 1 | | Fee | | Healthcare | | | Jun-17 | | NA | | | 5,019 | | | — | | | 504 | |
Cincinnati, OH | | | 69,806 | | | 100 | % | | 27.25 | | | 1 | | Fee | | Healthcare | | | Mar-21 | | NA | | | 18,598 | | | 11,293 | | | 1,902 | |
Clemmons, NC | | | 30,929 | | | 100 | % | | 21.76 | | | 1 | | Fee | | Healthcare | | | Mar-25 | | NA | | | 4,911 | | | 2,134 | | | 673 | |
Clinton, OK | | | 31,377 | | | 100 | % | | 0.39 | | | 1 | | Fee | | Healthcare | | | Mar-21 | | NA | | | 4,220 | | | 1,322 | | | 12 | |
Columbia City, IN | | | 30,462 | | | 100 | % | | 32.22 | | | 1 | | Fee | | Healthcare | | | Jun-17 | | NA | | | 7,424 | | | — | | | 982 | |
Daly City, CA | | | 78,482 | | | 100 | % | | 18.90 | | | 1 | | Leasehold | | Healthcare | | | Aug-21 | | Aug-21 | | | 12,321 | | | 11,126 | | | 1,483 | |
Daly City, CA | | | 26,262 | | | 100 | % | | 24.09 | | | 1 | | Fee | | Healthcare | | | Aug-21 | | NA | | | 5,169 | | | 4,746 | | | 633 | |
Dunkirk, IN | | | 19,140 | | | 100 | % | | 13.31 | | | 1 | | Fee | | Healthcare | | | Jun-17 | | NA | | | 2,609 | | | — | | | 255 | |
East Arlington, TX | | | 26,552 | | | 50 | % | | 7.23 | | | 1 | | Fee | | Healthcare/MOB | | | May-12 | (6) | NA | | | 4,520 | | | 3,305 | | | 192 | |
Effingham, IL | | | 7,808 | | | 100 | % | | 26.31 | | | 1 | | Fee | | Healthcare | | | Mar-21 | | NA | | | 1,368 | | | 542 | | | 205 | |
Effingham, IL | | | 39,393 | | | 100 | % | | 16.18 | | | 1 | | Fee | | Healthcare | | | Mar-21 | | NA | | | 5,383 | | | 4,558 | | | 637 | |
Elk City, OK | | | 51,989 | | | 100 | % | | 6.77 | | | 1 | | Fee | | Healthcare | | | Mar-21 | | NA | | | 7,267 | | | 4,302 | | | 352 | |
Fairfield, IL | | | 39,393 | | | 100 | % | | 16.28 | | | 1 | | Fee | | Healthcare | | | Mar-21 | | NA | | | 8,080 | | | 6,344 | | | 641 | |
Fort Wayne, IN | | | 31,500 | | | 100 | % | | 18.87 | | | 1 | | Fee | | Healthcare | | | Jun-17 | | NA | | | 5,887 | | | — | | | 594 | |
Fullerton, CA | | | 5,500 | | | 100 | % | | 1.73 | | | 1 | | Fee | | Healthcare | | | Mar-21 | | NA | | | 2,386 | | | 772 | | | 10 | |
Fullerton, CA | | | 26,200 | | | 100 | % | | 13.80 | | | 1 | | Fee | | Healthcare | | | Mar-21 | | NA | | | 12,888 | | | 7,506 | | | 361 | |
Garden Grove, CA | | | 26,500 | | | 100 | % | | 45.23 | | | 1 | | Fee | | Healthcare | | | Mar-21 | | NA | | | 13,176 | | | 11,067 | | | 1,199 | |
Grove City, OH | | | 20,672 | | | 100 | % | | 25.31 | | | 1 | | Fee | | Healthcare | | | Mar-21 | | NA | | | 7,703 | | | 4,393 | | | 523 | |
Harrisburg, IL | | | 36,393 | | | 100 | % | | 17.51 | | | 1 | | Fee | | Healthcare | | | Mar-21 | | NA | | | 5,260 | | | 3,645 | | | 637 | |
Hartford City, IN | | | 22,400 | | | 100 | % | | 3.79 | | | 1 | | Fee | | Healthcare | | | Jun-17 | | NA | | | 1,981 | | | — | | | 85 | |
Hillsboro, OR | | | 286,652 | | | 100 | % | | 12.93 | | | 3 | | Fee | | Healthcare | | | Dec-13 | | NA | | | 43,187 | | | 32,104 | | | 3,708 | |
Hobart, IN | | | 43,854 | | | 100 | % | | 15.73 | | | 1 | | Fee | | Healthcare | | | Jun-17 | | NA | | | 6,854 | | | — | | | 690 | |
Huntington, IN | | | NA | | | NA | | | NA | | | NA | | Fee | | Land | | | N/A | | NA | | $ | 120 | | $ | — | | $ | — | |
Huntington, IN | | | 58,742 | | | 100 | % | | 10.21 | | | 1 | | Fee | | Healthcare | | | Jun-17 | | NA | | | 5,563 | | | — | | | 600 | |
66
Table of Contents
| | | | | | | | | | | | | | | | | | | | | | | | | | | | | | | |
Location City, State | | Square
Footage | | Percentage
Leased | | Rent
per
Square
Foot(1) | | Number of
Properties | | Ownership
Interest | | Type | | Lease
Expiration
Date(2) | | Leasehold
Expiration
Date(2) | | Carrying
Value(3) | | Borrowings | | Rental
Cash
Flows(4) | |
|---|
Indianapolis, IN | | | 36,416 | | | 100 | % | | 7.29 | | | 1 | | Fee | | Healthcare | | | Jun-17 | | NA | | | 2,721 | | | — | | | 265 | |
Kingfisher, OK | | | 26,698 | | | 100 | % | | 9.80 | | | 1 | | Fee | | Healthcare | | | Mar-21 | | NA | | | 5,920 | | | 3,928 | | | 262 | |
La Vista, NE | | | 26,683 | | | 100 | % | | 11.59 | | | 1 | | Fee | | Healthcare | | | Mar-21 | | NA | | | 5,943 | | | 4,228 | | | 309 | |
LaGrange, IN | | | 46,539 | | | 100 | % | | 12.54 | | | 1 | | Fee | | Healthcare | | | Jun-17 | | NA | | | 5,940 | | | — | | | 584 | |
LaGrange, IN | | | 9,872 | | | 100 | % | | 4.30 | | | 1 | | Fee | | Healthcare | | | Jun-17 | | NA | | | 631 | | | — | | | 42 | |
Lancaster, OH | | | 21,666 | | | 100 | % | | 39.29 | | | 1 | | Fee | | Healthcare | | | Mar-21 | | NA | | | 6,717 | | | 6,694 | | | 851 | |
Mansfield, OH | | | 4,000 | | | 100 | % | | 23.54 | | | 1 | | Fee | | Healthcare | | | Dec-17 | | NA | | | 789 | | | — | | | 94 | |
Mansfield, OH | | | 13,209 | | | 100 | % | | 9.78 | | | 1 | | Fee | | Healthcare | | | Dec-17 | | NA | | | 1,085 | | | — | | | 129 | |
Mansfield, OH | | | 3,780 | | | 100 | % | | 10.26 | | | 1 | | Fee | | Healthcare | | | Dec-17 | | NA | | | 322 | | | — | | | 39 | |
Marysville, OH | | | 16,992 | | | 100 | % | | 34.15 | | | 1 | | Fee | | Healthcare | | | Mar-21 | | NA | | | 7,601 | | | 5,021 | | | 580 | |
Mattoon, IL | | | 39,393 | | | 100 | % | | 13.59 | | | 1 | | Fee | | Healthcare | | | Mar-21 | | NA | | | 7,099 | | | 5,610 | | | 536 | |
Mattoon, IL | | | 39,393 | | | 100 | % | | 18.47 | | | 1 | | Fee | | Healthcare | | | Mar-21 | | NA | | | 7,786 | | | 6,859 | | | 728 | |
Memphis, TN | | | 73,381 | | | 100 | % | | 27.25 | | | 1 | | Fee | | Healthcare | | | Mar-21 | | NA | | | 19,660 | | | 14,463 | | | 1,999 | |
Middletown, IN | | | NA | | | NA | | | NA | | | NA | | Fee | | Land | | | N/A | | NA | | | 52 | | | — | | | — | |
Middletown, IN | | | 18,500 | | | 100 | % | | 24.38 | | | 1 | | Fee | | Healthcare | | | Jun-17 | | NA | | | 4,882 | | | — | | | 451 | |
Mooresville, IN | | | 24,945 | | | 100 | % | | 20.21 | | | 1 | | Fee | | Healthcare | | | Jun-17 | | NA | | | 4,818 | | | — | | | 504 | |
Morris, IL | | | 94,719 | | | 100 | % | | 8.97 | | | 2 | | Fee | | Healthcare | | | Mar-25 | (6) | NA | | | 10,461 | | | 2,139 | | | 850 | |
Mt. Sterling, KY | | | 67,706 | | | 100 | % | | 20.70 | | | 1 | | Fee | | Healthcare | | | Mar-25 | | NA | | | 13,185 | | | 11,087 | | | 1,402 | |
Oklahoma City, OK | | | 45,187 | | | 100 | % | | 3.37 | | | 1 | | Fee | | Healthcare | | | Mar-21 | | NA | | | 6,296 | | | 4,376 | | | 152 | |
Olney, IL | | | 25,185 | | | 100 | % | | 11.86 | | | 1 | | Fee | | Healthcare | | | Mar-21 | | NA | | | 2,986 | | | 2,426 | | | 299 | |
Olney, IL | | | 39,393 | | | 100 | % | | 10.87 | | | 1 | | Fee | | Healthcare | | | Mar-21 | | NA | | | 5,602 | | | 4,189 | | | 428 | |
Paris, IL | | | 39,393 | | | 100 | % | | 17.41 | | | 1 | | Fee | | Healthcare | | | Mar-21 | | NA | | | 7,011 | | | 6,755 | | | 686 | |
Peru, IN | | | 36,861 | | | 100 | % | | 14.39 | | | 1 | | Fee | | Healthcare | | | Jun-17 | | NA | | | 7,637 | | | — | | | 531 | |
Peshtigo, WI | | | 19,380 | | | 100 | % | | 9.81 | | | 1 | | Fee | | Healthcare | | | Dec-17 | | NA | | | 1,603 | | | — | | | 190 | |
Plymouth, IN | | | 39,092 | | | 100 | % | | 10.45 | | | 1 | | Fee | | Healthcare | | | Jun-17 | | NA | | | 5,666 | | | — | | | 409 | |
Portage, IN | | | 38,205 | | | 100 | % | | 15.28 | | | 1 | | Fee | | Healthcare | | | Jun-17 | | NA | | | 9,426 | | | — | | | 584 | |
Rantoul, IL | | | 39,393 | | | 100 | % | | 14.01 | | | 1 | | Fee | | Healthcare | | | Mar-21 | | NA | | | 5,587 | | | 5,570 | | | 552 | |
Robinson, IL | | | 29,161 | | | 100 | % | | 18.27 | | | 1 | | Fee | | Healthcare | | | Mar-21 | | NA | | | 5,057 | | | 3,954 | | | 533 | |
Rockford, IL | | | 54,000 | | | 100 | % | | 10.66 | | | 1 | | Fee | | Healthcare | | | Mar-21 | | NA | | | 5,958 | | | 4,895 | | | 575 | |
Rockport, IN | | | NA | | | NA | | | NA | | | NA | | Fee | | Land | | | N/A | | NA | | | 366 | | | — | | | — | |
Rockport, IN | | | 26,000 | | | 100 | % | | 9.59 | | | 1 | | Fee | | Healthcare | | | Jun-17 | | NA | | | 2,345 | | | — | | | 249 | |
Rushville, IN | | | 35,304 | | | 100 | % | | 17.43 | | | 1 | | Fee | | Healthcare | | | Jun-17 | | NA | | | 6,168 | | | — | | | 616 | |
Rushville, IN | | | 13,318 | | | 100 | % | | 7.97 | | | 1 | | Fee | | Healthcare | | | Jun-17 | | NA | | | 1,239 | | | — | | | 106 | |
Santa Ana, CA | | | 24,500 | | | 100 | % | | 40.77 | | | 1 | | Fee | | Healthcare | | | Mar-21 | | NA | | | 9,564 | | | 7,802 | | | 999 | |
Stephenville, TX | | | 28,875 | | | 100 | % | | 21.38 | | | 1 | | Fee | | Healthcare | | | Mar-21 | | NA | | | 7,370 | | | 6,094 | | | 617 | |
Sterling, IL | | | 149,008 | | | 100 | % | | 5.70 | | | 2 | | Fee | | Healthcare | | | Mar-25 | (6) | NA | | | 6,908 | | | 2,322 | | | 850 | |
Sullivan, IN | | | 44,077 | | | 100 | % | | 15.05 | | | 1 | | Fee | | Healthcare | | | Jun-17 | | NA | | | 6,263 | | | — | | | 663 | |
Sullivan, IN | | | 18,415 | | | 100 | % | | 4.32 | | | 1 | | Fee | | Healthcare | | | Jun-17 | | NA | | | 543 | | | — | | | 80 | |
Sullivan, IN | | | NA | | | NA | | | NA | | | NA | | Fee | | Land | | | N/A | | NA | | | 494 | | | — | | | — | |
Sycamore, IL | | | 54,000 | | | 100 | % | | 14.97 | | | 1 | | Fee | | Healthcare | | | Mar-21 | | NA | | | 10,785 | | | 8,410 | | | 809 | |
Syracuse, IN | | | 57,980 | | | 100 | % | | 9.61 | | | 1 | | Fee | | Healthcare | | | Jun-17 | | NA | | | 4,689 | | | — | | | 557 | |
Tipton, IN | | | 62,139 | | | 100 | % | | 18.84 | | | 1 | | Fee | | Healthcare | | | Jun-17 | | NA | | | 11,911 | | | — | | | 1,171 | |
Tuscola, IL | | | 36,393 | | | 100 | % | | 14.35 | | | 1 | | Fee | | Healthcare | | | Mar-21 | | NA | | | 4,976 | | | 4,135 | | | 522 | |
Vandalia, IL | | | 39,393 | | | 100 | % | | 10.36 | | | 1 | | Fee | | Healthcare | | | Mar-21 | | NA | | | 8,059 | | | 7,262 | | | 408 | |
Wabash, IN | | | 35,374 | | | 100 | % | | 5.40 | | | 1 | | Fee | | Healthcare | | | Jun-17 | | NA | | | 1,930 | | | — | | | 191 | |
Wabash, IN | | | 70,746 | | | 100 | % | | 7.80 | | | 1 | | Fee | | Healthcare | | | Jun-17 | | NA | | | 5,605 | | | — | | | 552 | |
Wakarusa, IN | | | 48,000 | | | 100 | % | | 25.42 | | | 1 | | Fee | | Healthcare | | | Jun-17 | | NA | | | 13,709 | | | — | | | 1,220 | |
Wakarusa, IN | | | 89,828 | | | 100 | % | | 7.09 | | | 1 | | Fee | | Healthcare | | | Jun-17 | | NA | | | 7,264 | | | — | | | 637 | |
Warsaw, IN | | | NA | | | NA | | | NA | | | NA | | Fee | | Land | | | N/A | | NA | | | 77 | | | — | | | — | |
Warsaw, IN | | | 18,980 | | | 100 | % | | 15.38 | | | 1 | | Fee | | Healthcare | | | Jun-17 | | NA | | | 4,041 | | | — | | | 292 | |
Washington Court House, OH | | | 19,660 | | | 100 | % | | 29.03 | | | 1 | | Fee | | Healthcare | | | Mar-21 | | NA | | | 5,756 | | | 4,812 | | | 571 | |
Weatherford, OK | | | 53,000 | | | 100 | % | | 1.26 | | | 1 | | Fee | | Healthcare | | | Mar-21 | | NA | | | 6,205 | | | 4,443 | | | 67 | |
Wichita, KS | | | 81,810 | | | 100 | % | | 5.06 | | | 1 | | Fee | | Healthcare | | | Mar-21 | | NA | | | 12,780 | | | 7,766 | | | 414 | |
Windsor, NC | | | NA | | | NA | | | NA | | | NA | | Fee | | Land | | | N/A | | NA | | | 397 | | | — | | | — | |
| | | | | | | | | | | | | | | | | | | | | | | | | |
Total Healthcare | | | 3,277,987 | | | 100 | % | | | | | 82 | | | | | | | Sep-19 | | | | | 542,275 | | | 279,387 | | | 46,304 | |
REO | | | | | | | | | | | | | | | | | | | | | | | | | | | | | | | |
Austin, TX | | | 115,532 | | | 93 | % | | 22.68 | | | 1 | | Fee | | Multifamily | | | Various | | NA | | | 22,535 | | | 16,525 | | | 2,620 | |
Buckhead, GA | | | NA | | | NA | | | NA | | | NA | | Fee | | Land | | | N/A | | NA | | | 24,332 | | | — | | | — | |
San Antonio, TX | | | 226,104 | | | 91 | % | | 8.76 | | | 35 | | Fee | | Multifamily | | | Various | | NA | | | 10,520 | | | — | | | 1,981 | |
Indianapolis, IN | | | 950,126 | | | 68 | % | | 9.14 | | | 32 | | Fee | | Office/Flex | | | Various | | NA | | | 52,611 | | | — | | | 7,237 | |
San Antonio, TX | | | 152,800 | | | 90 | % | | 9.60 | | | 6 | | Fee | | Multifamily | | | Various | | NA | | | 7,780 | | | — | | | 1,467 | |
Philadelphia, PA | | | 72,056 | | | 63 | % | | 10.41 | | | 1 | | Fee | | Office | | | Various | | NA | | | 5,153 | | | — | | | 750 | |
Phoenix, AZ | | | 1,565,448 | | | 68 | % | | 7.16 | | | 12 | | Fee | | Retail | | | Various | | NA | | | 196,755 | (8) | | 212,000 | | | 8,403 | |
| | | | | | | | | | | | | | | | | | | | | | | | | | |
Total REO | | | 3,082,066 | | | 72 | % | | | | | 87 | | | | | | | | | | | | 319,686 | | | 228,525 | | | 22,458 | |
| | | | | | | | | | | | | | | | | | | | | | | | | | | | | |
Grand Total | | | | | | | | | | | | | | | | | | | | | | | $ | 1,207,519 | | $ | 783,257 | | $ | 99,230 | |
| | | | | | | | | | | | | | | | | | | | | | | | | | | | | |
- (1)
- Based on contractual base rent divided by the percentage leased.
- (2)
- Based on initial term and represents the weighted average lease term if more than one lease.
67
Table of Contents
- (3)
- Represents operating real estate before accumulated depreciation as presented in our consolidated financial statements and excludes amounts related to intangibles. Refer to "Note 5. Operating Real Estate" of Item 8. "Financial Statements and Supplementary Data."
- (4)
- Represents contractual base rent, excluding the effects of straight-line rent, annualized based on fourth quarter 2011 amounts.
- (5)
- Based on percentage sales for the retail property.
- (6)
- Reflects the terms for new leases executed subsequent to December 31, 2011.
- (7)
- Our core net lease portfolio totals 3.2 million square feet, is 94% leased with a weighted average lease term of 6.4 years as of December 31, 2011, including a $28 million property owned through a joint venture.
- (8)
- Amount excludes purchase price allocations related to intangible assets of $22 million as of December 31, 2011.
As of December 31, 2011, we had no single property with a carrying value equal to or greater than 10% of our total assets. For the year ended December 31, 2011, we had no single property or operator with gross revenues equal to or greater than 10% of our total revenues. For the year ended December 31, 2011, two operators of our healthcare portfolio accounted for 29% of our total rental and escalation income.
Item 3. Legal Proceedings
WaMu Matter
One of our net lease investments was comprised of three office buildings totaling 257,000 square feet located in Chatsworth, California and was 100% leased to WaMu. The tenant vacated the buildings as of March 23, 2009 and the WaMu Leases were disaffirmed by the FDIC. In the third quarter 2009, GECCMC foreclosed on the property. On August 10, 2009, GECCMC filed a complaint against NNN and NRFC Sub Investor IV, in the Superior Court of the State of California, County of Los Angeles. In the complaint, GECCMC alleged, among other things, that the loan provided by GECCMC to NRFC Sub Investor IV, was a recourse obligation of NNN due to the FDIC's disaffirmance of the WaMu Leases. The judge presiding over the lawsuit has entered a judgment against NNN in the amount of approximately $46 million plus costs, attorneys' fees, prejudgment interests and accrued interest currently estimated to be approximately $6 million. NNN is vigorously pursuing an appeal of the decision.
In accordance with accounting for contingencies, an estimated loss from a contingency shall be accrued as a charge to income if two conditions are met. First, information available prior to the issuance of the financial statements indicates that it is probable that an asset had been impaired or a liability had been incurred at the date of the financial statements. It is implicit in this condition that it must be probable that one or more future events will occur confirming the facts of the loss. Second, the amount of the loss can be reasonably estimated. We believe it is not probable that the lawsuit will result in an unfavorable outcome; however, in the third quarter 2011, we engaged in settlement discussions with GECCMC and, accordingly, in that quarter we recorded a loss accrual related to the lawsuit of $20 million in other income (loss) in our consolidated statements of operations. If we were to settle the lawsuit for such amount, we would receive net proceeds of $6 million from the settlement through the return of our collateral under the Bond (as defined below). We continue to engage in settlement discussions, however, no assurances can be given that a settlement will be reached or the amount of such settlement.
In connection with filing for an appeal, pursuant to California law, NNN is required to post a bond in an amount equal to one and a half times the amount of the Judgment, or the Bond. Accordingly, we have entered into a standard General Agreement of Indemnity with an issuer of surety bonds, or the Surety Agreement. On January 7, 2011, as part of the Surety Agreement, in connection with the issuance of the Bond, we posted cash collateral of $26 million, equal to 38% of the amount of the Bond. In January 2012, we renewed the Bond with identical terms as currently exist.
68
Table of Contents
PART II
Item 4. Mine Safety Disclosures
None.
Item 5. Market for Registrant's Common Equity, Related Stockholder Matters and Issuer Purchases of Equity Securities
Market Information
Our common stock is listed on the NYSE under the symbol "NRF." The following table sets forth the high, low and last sales prices for our common stock, as reported on the NYSE, and dividends per share with respect to the periods indicated:
| | | | | | | | | | | | | |
Period | | High | | Low | | Close | | Dividends | |
|---|
2011 | | | | | | | | | | | | | |
First Quarter | | $ | 6.08 | | $ | 4.79 | | $ | 5.35 | | $ | 0.100 | |
Second Quarter | | $ | 5.31 | | $ | 3.83 | | $ | 4.03 | | $ | 0.100 | |
Third Quarter | | $ | 4.29 | | $ | 2.99 | | $ | 3.30 | | $ | 0.125 | |
Fourth Quarter | | $ | 4.94 | | $ | 3.09 | | $ | 4.77 | | $ | 0.135 | |
2010 | | | | | | | | | | | | | |
First Quarter | | $ | 5.09 | | $ | 3.55 | | $ | 4.21 | | $ | 0.100 | |
Second Quarter | | $ | 5.00 | | $ | 2.67 | | $ | 2.67 | | $ | 0.100 | |
Third Quarter | | $ | 3.81 | | $ | 2.67 | | $ | 3.74 | | $ | 0.100 | |
Fourth Quarter | | $ | 4.84 | | $ | 3.66 | | $ | 4.75 | | $ | 0.100 | |
The following table summarizes our dividends declared on common stock, on a per share basis, for the years ended 2011 and 2010:
| | | | | | | | |
Declaration Date | | Record
Date | | Payment
Date | | Common Stock
Dividend | |
|---|
2011 | | | | | | | | |
January 19 | | February 4 | | February 14 | | $ | 0.100 | |
May 4 | | May 18 | | May 25 | | $ | 0.100 | |
August 3 | | August 15 | | August 19 | | $ | 0.100 | |
November 2 | | November 14 | | November 18 | | $ | 0.125 | |
2010 | | | | | | | | |
January 19 | | February 5 | | February 12 | | $ | 0.100 | |
April 20 | | May 4 | | May 14 | | $ | 0.100 | |
July 21 | | August 5 | | August 14 | | $ | 0.100 | |
October 19 | | November 5 | | November 15 | | $ | 0.100 | |
On October 8, 2008, our board of directors authorized a share repurchase program of up to 10,000,000 shares of our outstanding common stock, or approximately 16% of our outstanding common stock. Stock repurchases under this program may be made from time-to-time through the open market or in privately negotiated transactions. The timing and actual number of shares repurchased will depend on a variety of factors including price, corporate and regulatory requirements, market conditions, and other corporate liquidity requirements and priorities. For the year ended December 31, 2011, we did not purchase any shares pursuant to the share repurchase program. On February 15, 2012, our board of directors voted to terminate the October 8, 2008 share repurchase program such that additional repurchases must be re-authorized by our board of directors.
On February 14, 2012, the closing sales price for our common stock, as reported on the NYSE, was $5.45. As of February 14, 2012, there were 196 record holders of our common stock and 96,083,488 shares outstanding. This figure does not reflect the beneficial ownership of shares held in nominee name.
69
Table of Contents
Recent Sales of Unregistered Securities: Use of Proceeds from Registered Securities
We issued shares of our common stock under our Dividend Reinvestment and Stock Purchase Plan, or DRSPP, more than three years after the related registration statement for those plans became effective. See "Risk Factors—Issuances of our common stock under our Dividend Reinvestment and Stock Purchase Plan more than three years after the related registration statement became effective may give rise to a right of rescission."
Item 6. Selected Financial Data
The information below should be read in conjunction with "Forward Looking Statements" on page 3, Item 1A. "Risk Factors," Item 7. "Management's Discussion and Analysis of Financial Condition and Results of Operations" and our consolidated financial statements and notes thereto included in Item 8. "Financial Statements and Supplementary Data," included in this Form 10-K.
The selected historical consolidated information presented for the years ended December 31, 2011, 2010, 2009, 2008 and 2007 relates to our operations and has been derived from our audited consolidated statement of operations included in this Annual Report on Form 10-K or our prior Annual Reports on Form 10-K, as amended (if applicable). In connection with this Annual Report on Form 10-K, we have reclassified certain historical audited consolidated financial statements principally related to certain properties classified as held for sale or sold during the period. As a result, we have reported revenue and expenses from these properties as discontinued operations for each period
70
Table of Contents
presented in our Annual Report on Form 10-K. These reclassifications had no effect on our reported net income (loss) or funds from operations.
| | | | | | | | | | | | | | | | |
| | Year Ended December 31, | |
|---|
Operating Data(1): | | 2011 | | 2010 | | 2009 | | 2008 | | 2007 | |
|---|
| | (In thousands, except share and per share amounts)
| |
|---|
Revenues | | | | | | | | | | | | | | | | |
Interest income | | $ | 398,483 | | $ | 318,792 | | $ | 142,213 | | $ | 212,432 | | $ | 292,131 | |
Rental and escalation income | | | 112,697 | | | 115,467 | | | 88,997 | | | 98,434 | | | 82,524 | |
Commission income | | | 12,024 | | | 2,476 | | | — | | | — | | | — | |
Other revenue | | | 4,602 | | | 7,221 | | | 25,438 | | | 43,850 | | | 27,387 | |
| | | | | | | | | | | | |
Total revenues | | | 527,806 | | | 443,956 | | | 256,648 | | | 354,716 | | | 402,042 | |
Expenses | | | | | | | | | | | | | | | | |
Interest expense | | | 142,220 | | | 126,210 | | | 116,133 | | | 185,368 | | | 236,238 | |
Real estate properties—operating expenses | | | 22,531 | | | 37,565 | | | 14,560 | | | 8,023 | | | 8,616 | |
Asset management expenses | | | 5,538 | | | 4,505 | | | 4,214 | | | 5,539 | | | 5,072 | |
Fund raising fees and other joint venture costs | | | — | | | — | | | — | | | 2,879 | | | 6,295 | |
Commission expense | | | 9,239 | | | 1,867 | | | — | | | — | | | — | |
Impairment on operating real estate | | | — | | | 5,249 | | | — | | | 5,580 | | | — | |
Provision for loan losses | | | 52,980 | | | 168,446 | | | 83,745 | | | 11,200 | | | — | |
Provision for loss on equity investment | | | 4,482 | | | — | | | — | | | — | | | — | |
General and administrative | | | | | | | | | | | | | | | | |
Salaries and equity-based compensation(2) | | | 67,708 | | | 54,828 | | | 47,213 | | | 53,269 | | | 36,148 | |
Auditing and professional fees | | | 9,437 | | | 10,503 | | | 9,186 | | | 6,213 | | | 6,017 | |
Other general and administrative | | | 18,238 | | | 19,543 | | | 13,028 | | | 14,286 | | | 13,455 | |
| | | | | | | | | | | | |
Total general and administrative | | | 95,383 | | | 84,874 | | | 69,427 | | | 73,768 | | | 55,620 | |
Depreciation and amortization | | | 44,258 | | | 31,466 | | | 39,074 | | | 38,308 | | | 29,188 | |
| | | | | | | | | | | | |
Total expenses | | | 376,631 | | | 460,182 | | | 327,153 | | | 330,665 | | | 341,029 | |
| | | | | | | | | | | | |
Income (loss) from operations | | | 151,175 | | | (16,226 | ) | | (70,505 | ) | | 24,051 | | | 61,013 | |
Equity in earnings (losses) of unconsolidated ventures | | | (2,738 | ) | | 2,550 | | | (1,524 | ) | | (11,789 | ) | | (11,659 | ) |
Other income (loss) | | | 4,162 | | | — | | | — | | | — | | | — | |
Unrealized gain (loss) on investments and other | | | (489,904 | ) | | (538,572 | ) | | (209,976 | ) | | 649,113 | | | (4,330 | ) |
Realized gain (loss) on investments and other | | | 78,782 | | | 145,722 | | | 128,461 | | | 37,699 | | | 3,559 | |
Gain from acquisitions | | | 89 | | | 15,363 | | | — | | | — | | | — | |
| | | | | | | | | | | | |
Income (loss) from continuing operations | | | (258,434 | ) | | (391,163 | ) | | (153,544 | ) | | 699,074 | | | 48,583 | |
Income (loss) from discontinued operations | | | (1,290 | ) | | (925 | ) | | 3,169 | | | 3,255 | | | 1,727 | |
Gain on sale from discontinued operations | | | 17,198 | | | 2,528 | | | 13,799 | | | — | | | — | |
| | | | | | | | | | | | |
Net income (loss) | | | (242,526 | ) | | (389,560 | ) | | (136,576 | ) | | 702,329 | | | 50,310 | |
Less: net (income) loss allocated to non-controlling interests | | | 5,615 | | | 15,019 | | | 6,293 | | | (72,172 | ) | | (3,276 | ) |
Preferred stock dividends | | | (20,925 | ) | | (20,925 | ) | | (20,925 | ) | | (20,925 | ) | | (16,533 | ) |
Contingently redeemable non-controlling interest accretion | | | (5,178 | ) | | — | | | — | | | — | | | — | |
| | | | | | | | | | | | |
Net income (loss) attributable to NorthStar Realty Finance Corp. common stockholders | | $ | (263,014 | ) | $ | (395,466 | ) | $ | (151,208 | ) | $ | 609,232 | | $ | 30,501 | |
| | | | | | | | | | | | |
Net income (loss) per share from continuing operations (basic/diluted) | | | (3.12 | ) | | (5.19 | ) | | (2.41 | ) | $ | 9.60 | | $ | 0.48 | |
Income (loss) per share from discontinued operations (basic/diluted) | | | (0.01 | ) | | (0.01 | ) | | 0.05 | | | 0.05 | | | 0.03 | |
Gain per share on sale of discontinued operations (basic/diluted) | | | 0.19 | | | 0.03 | | | 0.20 | | | — | | | — | |
| | | | | | | | | | | | |
Net income (loss) per common share attributable to NorthStar Realty Finance Corp. common stockholders (basic/diluted) | | $ | (2.94 | ) | $ | (5.17 | ) | $ | (2.16 | ) | $ | 9.65 | | $ | 0.51 | |
| | | | | | | | | | | | |
Weighted average number of shares of common stock: | | | | | | | | | | | | | | | | |
Basic | | | 89,348,670 | | | 76,552,702 | | | 69,869,717 | | | 63,135,608 | | | 61,510,951 | |
Diluted | | | 93,627,456 | | | 82,842,990 | | | 77,193,083 | | | 70,136,783 | | | 65,086,953 | |
Dividends declared per share of common stock | | $ | 0.46 | | $ | 0.40 | | $ | 0.40 | | $ | 1.33 | | $ | 1.44 | |
- (1)
- The years ended December 31, 2009, 2008 and 2007 do not include the revenues and expenses of N-Star CDOs I, II, III and V as these CDO financing transactions were unconsolidated prior to January 1, 2010.
71
Table of Contents
- (2)
- The years ended December 31, 2011, 2010, 2009, 2008 and 2007 include $11.7 million, $17.0 million, $20.5 million, $24.7 million and $16.0 million in equity-based compensation, respectively. Cash incentive compensation expense incurred but payable in future periods totaled $8.7 million, $4.6 million, $4.6 million, $2.2 million and $0 for the years ended December 31, 2011, 2010, 2009, 2008 and 2007, respectively. The year ended December 31, 2010 includes $3.5 million of cash compensation expense and $1.0 million of equity-based compensation expense relating to a separation and consulting agreement with a former executive.
| | | | | | | | | | | | | | | | |
| | December 31, | |
|---|
Balance Sheet Data: | | 2011 | | 2010 | | 2009 | | 2008 | | 2007 | |
|---|
| | (In thousands, except share and per share data)
| |
|---|
VIE Financing Structures | | | | | | | | | | | | | | | | |
Restricted cash | | $ | 261,295 | | $ | 263,314 | | $ | 74,453 | | $ | 106,115 | | $ | 144,453 | |
Operating real estate, net | | | 313,227 | | | — | | | — | | | — | | | — | |
Real estate securities, available for sale | | | 1,358,282 | | | 1,687,793 | | | 283,184 | | | 179,776 | | | 469,688 | |
Real estate debt investments, net | | | 1,631,856 | | | 1,668,188 | | | 1,350,684 | | | 1,300,816 | | | 1,325,287 | |
Real estate debt investments, held for sale | | | — | | | 18,661 | | | — | | | 57,029 | | | — | |
Investments in and advances to unconsolidated ventures | | | 60,352 | | | 72,536 | | | — | | | — | | | — | |
Assets of properties held for sale | | | 3,198 | | | 13,141 | | | — | | | — | | | — | |
Total assets | | | 3,721,435 | | | 3,765,153 | | | 1,723,984 | | | 1,660,694 | | | 2,017,737 | |
Total borrowings | | | 2,517,114 | | | 2,273,487 | | | 599,297 | | | 468,638 | | | 1,654,185 | |
Total liabilities | | | 2,867,016 | | | 2,549,096 | | | 661,818 | | | 551,771 | | | 1,743,234 | |
Non-VIE Financing Structures | | | | | | | | | | | | | | | | |
Cash and cash equivalents | | | 144,508 | | | 125,439 | | | 138,928 | | | 134,039 | | | 153,829 | |
Restricted cash | | | 37,069 | | | 46,070 | | | 54,727 | | | 57,042 | | | 57,842 | |
Operating real estate, net | | | 776,222 | | | 938,062 | | | 978,902 | | | 1,127,000 | | | 1,134,136 | |
Real estate securities, available for sale | | | 115,023 | | | 3,261 | | | 53,036 | | | 41,367 | | | 79,834 | |
Real estate debt investments, net | | | 78,726 | | | 153,576 | | | 585,798 | | | 676,048 | | | 681,735 | |
Real estate debt investments, held for sale | | | — | | | — | | | 611 | | | 13,577 | | | — | |
Investments in and advances to unconsolidated ventures | | | 33,205 | | | 27,456 | | | 38,299 | | | 101,507 | | | 29,385 | |
Total assets | | | 1,285,002 | | | 1,386,838 | | | 1,945,580 | | | 2,283,032 | | | 2,775,045 | |
Total borrowings | | | 992,012 | | | 1,143,452 | | | 1,443,125 | | | 1,662,298 | | | 1,371,123 | |
Total liabilities | | | 1,099,807 | | | 1,230,382 | | | 1,549,106 | | | 1,778,195 | | | 2,409,014 | |
Aggregate | | | | | | | | | | | | | | | | |
Total assets | | | 5,006,437 | | | 5,151,991 | | | 3,669,564 | | | 3,943,726 | | | 4,792,782 | |
Total borrowings | | | 3,509,126 | | | 3,416,939 | | | 2,042,422 | | | 2,130,936 | | | 3,025,308 | |
Total liabilities | | | 3,966,823 | | | 3,779,478 | | | 2,210,924 | | | 2,329,966 | | | 4,152,248 | |
Preferred stock | | | 241,372 | | | 241,372 | | | 241,372 | | | 241,372 | | | 241,372 | |
Non-controlling interests | | | 32,242 | | | 55,173 | | | 90,647 | | | 198,593 | | | 22,495 | |
Stockholders' equity | | | 1,007,372 | | | 1,222,518 | | | 1,273,171 | | | 1,216,574 | | | 595,544 | |
Total equity | | | 1,039,614 | | | 1,277,691 | | | 1,363,818 | | | 1,415,167 | | | 618,039 | |
Supplemental Balance Sheet Data | | | | | | | | | | | | | | | | |
Common shares outstanding | | | 96,044,383 | | | 78,104,753 | | | 74,882,600 | | | 62,906,693 | | | 61,719,469 | |
Common and OP Units outstanding | | | 100,252,219 | | | 82,394,029 | | | 82,205,910 | | | 70,973,904 | | | 67,402,586 | |
| | | | | | | | | | | | | | | | |
| | Year Ended December 31, | |
|---|
Other Data: | | 2011 | | 2010 | | 2009 | | 2008 | | 2007 | |
|---|
| | (In thousands)
| |
|---|
Adjusted funds from operations(1) | | $ | 149,369 | | $ | 51,503 | | $ | 82,543 | | $ | 89,737 | | $ | 95,683 | |
Cash flow from: | | | | | | | | | | | | | | | | |
Operating activities | | | 64,134 | | | 35,558 | | | 54,518 | | | 87,612 | | | 102,238 | |
Investing activities | | | 220,570 | | | 119,025 | | | 123,319 | | | (110,708 | ) | | (2,373,929 | ) |
Financing activities | | | (265,635 | ) | | (168,072 | ) | | (172,948 | ) | | 3,306 | | | 2,380,767 | |
- (1)
- Adjusted funds from operations, or AFFO, is a non-GAAP measure of the operating performance of a REIT and of us in particular. Refer to Item 7. "Management's Discussion and Analysis of Financial Condition and Results of Operations—Non-GAAP Financial Measures" for details on the calculation AFFO including a reconciliation of AFFO to income (loss) from continuing operations computed in accordance with U.S. GAAP.
72
Table of Contents
Item 7. Management's Discussion and Analysis of Financial Condition and Results of Operations
The following discussion should be read in conjunction with our consolidated financial statements and notes thereto included in Item 8. "Financial Statements and Supplementary Data," and Part I, Item 1A. "Risk Factors." References to "we," "us" or "our" refer to NorthStar Realty Finance Corp. and its subsidiaries unless context specifically requires otherwise.
Introduction
NorthStar Realty Finance Corp. is a real estate finance company that originates, acquires and manages portfolios of CRE debt, CRE securities and net lease properties. In addition, we engage in asset management and other activities related to real estate and real estate finance. We are organized as a REIT and were formed in October 2003 to continue and expand the CRE debt, CRE securities and net lease business of our predecessor. We conduct substantially all of our operations and make our investments through our operating partnership, NorthStar Realty Finance Limited Partnership, or our Operating Partnership, including its subsidiaries. Our primary business lines are as follows:
- •
- Commercial Real Estate Debt—Our CRE debt business is focused on originating, structuring, acquiring and managing senior and subordinate debt investments secured primarily by commercial and multifamily properties and includes first mortgage loans, subordinate mortgage interests, mezzanine loans, credit tenant loans and other loans, including preferred equity interests.
- •
- Commercial Real Estate Securities—Our CRE securities business is focused on investing in and managing a wide range of CRE securities, including CMBS, unsecured REIT debt and CDO notes backed primarily by CRE securities and CRE debt.
- •
- Net Lease Properties—Our net lease properties business is focused on acquiring CRE located throughout the United States that are typically leased under triple net leases to corporate tenants and healthcare operators. Our core net lease business invests primarily in office, industrial and retail properties. We also own, manage and invest in a portfolio of healthcare properties focused on mid-acuity facilities (i.e., skilled and assisted), with the highest concentration in assisted living facilities.
- •
- Asset Management and Other—Our asset management and other activities relate to real estate and real estate finance, including managing our CDO financing transactions on a fee basis, sponsoring and advising on a fee basis, our Sponsored REITs (i.e., NSREIT) and acting as a special servicer for our owned (and potentially third-party owned) CMBS.
We believe that these businesses are complementary to each other due to their overlapping sources of investment opportunities, common reliance on real estate fundamentals and ability to utilize secured borrowings to finance assets and enhance returns. We seek to match-fund our real estate debt and security investments primarily by issuing term debt and other forms of secured term financing.
Our financing strategy focuses on match-funding our assets and liabilities by having similar maturities and like-kind interest rate benchmarks (fixed or floating) to manage refinancing and interest rate risk. Our CRE debt and security portfolios are predominantly financed through long-term, non-recourse CDOs. Our net lease properties are predominantly financed with non-recourse mortgage notes. Given the nature of our current financing arrangements, we expect to maintain our borrowing at or near our current levels for our existing investments. Borrowing levels may change for new investments depending upon the nature of the assets and the related financing.
Liquidity and access to capital was beginning to return to the commercial real estate finance markets in the first half of 2011. During that time, we raised net proceeds of $69 million of equity capital and net proceeds of $163 million of exchangeable senior notes. In terms of new investment-level financing, we continue to pursue a variety of financing arrangements such as credit facilities, securitized arrangements and other term borrowings. The amount of our borrowings will depend upon the nature
73
Table of Contents
and credit quality of our assets, the structure of our financings and where possible, we will seek to limit our reliance on recourse borrowings. In the fourth quarter of 2011, we, through two wholly-owned subsidiaries, entered into two new $100 million term credit facilities to finance loan originations and make investments in CMBS, respectively.
We are also focused on raising capital in alternate channels. Beginning in the second half of 2011, we started to see capital raising velocity increase in NSREIT. Total capital raised for the year ended December 31, 2011 was $126 million, with $156 million raised from inception through December 31, 2011. NorthStar Realty Securities has executed selling agreements with broker-dealers covering more than 45,000 registered representatives as of December 31, 2011.
Sources of Operating Revenues and Cash Flows
We primarily generate revenues from interest income on our CRE debt and security portfolios, rental income from the net lease properties and fee income from the asset management and other related activities. Our income is primarily derived through the difference between revenues and the cost at which we are able to finance our assets. We may also acquire investments which generate attractive returns without any leverage.
Our CRE debt and security investments are predominantly financed in CDOs. We consolidate the CDO financing transactions under U.S. GAAP regardless of whether we retain the equity interests for our sponsored CDOs or acquire the equity interests of other CDOs. However, we generate cash flows based on the equity interests that we retain/acquired. As a result, the cash flows may be different from the income (loss) generated for U.S. GAAP purposes.
In this Annual Report on Form 10-K, we refer to certain CDOs, that we consolidate on our balance sheet as "our CDOs." Our CDOs are financing transactions that we consolidate on our balance sheet in accordance with U.S. GAAP, as we own the equity interests in such CDOs. We do not, however, own undivided interests in any of the assets within our CDOs and all senior and junior bondholders of the CDOs have economic interests that are senior to our equity interests. A more detailed discussion of our CDO Financing Transactions is provided in this section under "Liquidity and Capital Resources."
Profitability and Performance Metrics
We calculate several metrics to evaluate the profitability and performance of our business.
- •
- Adjusted funds from operations, or AFFO (see "Non-GAAP Financial Measures—Funds from Operations and Adjusted Funds from Operations" for a description of this metric).
- •
- Credit losses are a measure of performance and can be used to compare the credit performance of our assets to our competitors and other finance companies.
- •
- Assets under management, or AUM, growth is a driver of our ability to grow our income especially related to our Sponsored REITs, but is of lesser importance than other metrics such as AFFO.
Credit risk management is our ability to manage our assets in a manner that preserves principal and income and minimizes credit losses that would decrease income.
Availability and cost of capital will impact our profitability and earnings since we must raise new capital to fund a majority of our growth.
Outlook and Recent Trends
In the first half of 2011, liquidity began to return to the commercial real estate finance markets and corporate capital started to become available to the stronger sponsors. Wall Street and commercial banks began to more actively provide credit to real estate borrowers. A proxy of the easing of credit and restarting of the capital markets for commercial real estate debt is the approximately $30 billion in
74
Table of Contents
multi-borrower CMBS transactions that were completed during 2011. However, credit started to contract in mid-2011 as the European debt woes began to unfold resulting in severe market volatility.
We expect that the commercial real estate finance markets will continue to be challenged in 2012 by the U.S. economic slowdown and the euro-zone debt crisis, along with the risk of maturing CRE loans that will have difficulties refinancing. It is currently estimated that $1.0 trillion of CRE loans will mature through 2014 and $2.0 trillion will mature through 2017. Many of these loans will not be able to be refinanced, exacerbating slowing growth and contracting credit. With that, many industry experts are predicting $35 billion total CMBS issuance in 2012 even though actual issuance could fall significantly below expectations.
Virtually all commercial real estate property types were adversely impacted by the credit crisis, including core property types such as hotel, retail, office, industrial and multifamily properties. Land, condominium and other commercial property types were more severely impacted. As a result, cash flows and values associated with properties serving as collateral for our loans are generally weaker than expected when we originated the loans. During 2011, the U.S. economy was recovering but at a slow pace and continued to be challenged by various factors beyond our control, including high unemployment, a weak residential housing market, political atrophy and the euro-zone debt crisis. Despite the difficult U.S. and global economic conditions, investor interest has been returning to commercial real estate especially in urban areas having high concentrations of institutional quality real estate, and especially in certain asset types such as apartments. Into 2012, the degree to which commercial real estate values improve or erode in the markets in which our real estate collateral is located, will impact the performance of our asset base and the related level of loan losses.
Our CRE debt and securities are negatively impacted by weaker real estate market and economic conditions. Slow economic conditions reduce a tenant's ability to make rent payments in accordance with the terms of their leases and for companies to lease new space. To the extent that market rental and occupancy rates are reduced, property-level cash flows are negatively affected as existing leases renew at lower rates and over longer periods of time impact the value of underlying properties and the borrowers' ability to service their outstanding loans.
Many of our CRE debt investments bear interest based on a spread to one-month LIBOR, a floating-rate index based on rates that banks charge each other to borrow. One-month LIBOR as of December 31, 2011 was 0.30%, well below its 1.76% average over the past five years. Lower LIBOR means lower debt service costs for our borrowers. This dynamic has partially offset decreasing cash flows caused by the challenging economic conditions and may also result in extending the life of interest reserves for those debt investments that require interest reserves to service debt.
CRE security values are also influenced by credit ratings assigned by the rating agencies. Beginning in 2009 and continuing into late 2011, the rating agencies dramatically changed their ratings methodologies for all securitized asset classes, including commercial real estate. Combined with challenging economic conditions, their reviews have resulted in large amounts of rating downgrade actions for CMBS, negatively impacting market values of CMBS and in many cases negatively impacting the CDO financing structures used by us and others to finance these assets. To some extent, we took advantage of the rating agency downgrades by purchasing $1.2 billion of CMBS in our CDOs in 2009 and 2010 at a weighted average discount to par of approximately 60%.
Our net lease properties are also adversely impacted by a weaker economy. Corporate space needs contracted resulting in lower lease renewal rates and longer releasing periods when leases are not renewed. Poor economic conditions may negatively impact the creditworthiness of our tenants, which could result in their inability to meet the terms of their leases. Further, our healthcare net lease portfolio is also subject to impact from regulatory changes which are also impacted by a weak economy, such as changes to the Medicaid and Medicare programs that could negatively affect property values. Although we cannot make assurances that our cash flow will not be impacted by changes to these programs, a majority of our assets do not derive revenues from these government programs and we
75
Table of Contents
believe assets dependent on these programs have adequate lease coverage to support the rent of our operators.
Our Strategy
Our primary business objectives are to make commercial real estate-related investments in order to produce attractive risk-adjusted returns, generate stable cash flows for distribution to our stockholders and build long-term franchise value. When we observed deteriorating market conditions, we responded by decreasing investment activity and preserving capital. At the same time, we focused on raising capital in alternative channels, such as the non-listed REIT market.
As liquidity was becoming more available and commercial real estate fundamentals were beginning to stabilize in 2011, we took advantage of this dynamic in terms of both capital and investment activity. We raised $232 million of capital in the first half of 2011. In addition, we entered into two new term credit facilities in the fourth quarter 2011. During 2011, we returned to our loan origination business, which resulted in the origination of over $300 million principal amount of new real estate debt investments for us and on behalf of NSREIT in 2011. Our new loans were originated into our CDO financing transactions for those CDOs where the investment period was still open.
We currently anticipate that most of our investment activity and uses of available unrestricted cash liquidity will be focused on our businesses of originating new loans and investing in securities. We also remain focused on the growth of our asset management business and in particular, our Sponsored REITs. We will continue to explore other opportunistic investments such as discounted repurchases of our previously-issued CDO bonds.
We believe the supply/demand imbalance driven by the large amount of maturing CRE loans creates an opportunity for us. The relative lack of supply and high demand for capital is allowing investors with capital, such as us, to make investments with attractive risk/return profiles compared to historical levels.
Risk Management
A description of our portfolio management activities is described in detail in Part I, Item 1. "Business—Risk Management." Refer to Part I, Item 1A. "Risk Factors," for a discussion of our largest credit situations that we currently focus on as part of our ongoing portfolio management.
At December 31, 2011, we had four debt investments with an aggregate principal amount of $51 million on non-performing status, or NPL, three of which were non-performing due to interest and maturity defaults and the other related to an interest default. $49 million of our loan loss reserves were allocated to these four loans. There can be no assurance that there will be acceptable outcomes under our non-performing loans and accordingly, we may, in the future, determine that more reserves are required for these loans.
Critical Accounting Policies
Principles of Consolidation
The consolidated financial statements include the accounts of NorthStar Realty Finance Corp., and our subsidiaries, which are majority-owned, controlled by us or a variable interest entity, or VIE, where we are the primary beneficiary. All significant intercompany balances are eliminated in consolidation.
Our consolidated financial statements include VIEs where we are the primary beneficiary. A VIE is an entity that lacks one or more of the characteristics of a voting interest entity. We evaluate our investments and financings to determine if they are VIE's based on: (1) the sufficiency of the entity's equity investment at risk to finance its activities without additional subordinated financial support provided by any parties, including the equity holders; (2) whether as a group the holders of the equity investment at risk have (a) the power, through voting rights or similar rights, to direct the activities of a
76
Table of Contents
legal entity that most significantly impact the entity's economic performance, (b) the obligation to absorb the expected losses of the legal entity and (c) the right to receive the expected residual returns of the legal entity; and (3) whether the voting rights of these investors are proportional to their obligations to absorb the expected losses of the entity, their rights to receive the expected returns of their equity, or both, and whether substantially all of the entity's activities involve or are conducted on behalf of an investor that has disproportionately fewer voting rights. An investment that lacks one or more of the above three characteristics is considered to be a VIE. We reassess the initial evaluation of an entity as a VIE upon the occurrence of certain reconsideration events.
We are required to consolidate a VIE if we are deemed to be the VIE's primary beneficiary. The primary beneficiary is the party that: (i) has the power to direct the activities that most significantly impact the VIE's economic performance; and (ii) has the obligation to absorb the losses of the VIE or the right to receive the benefits from the VIE, which could be significant to the VIE.
We determine whether we are the primary beneficiary of a VIE by first performing a qualitative analysis to determine if we hold the power to direct the activities that most significantly impact the VIE's economic performance. This analysis includes: (i) assessing our variable interests (both implicit and explicit) and any other involvement in the VIE, as well as the involvement of other variable interest holders; (ii) consideration of the VIE's purpose and design, including the risks the VIE was designed to create and pass through to its variable interest holders; (iii) identifying the activities that most significantly affect the VIE's economic performance; (iv) determining whether our significant involvement in the design of an entity provided us with the opportunity to establish arrangements that result in us having the power to direct the VIE's most significant activities; and (v) determining whether our level of economic interest in a VIE is indicative of the amount of power we hold in situations where our stated power to direct the VIEs most significant activities is disproportionately less than our economic interest in the entity. We perform a quantitative analysis to determine if we have the obligation to absorb the losses of the VIE or the right to receive the benefits from the VIE, which could be significant to the VIE. For purposes of allocating a VIE's potential residual returns and losses to its variable interest holders, we calculate our share of the VIE's expected losses and expected residual returns using the specific cash flows that would be allocated to it, based on contractual arrangements and/or our position in the capital structure of the VIE, under various scenarios. We reassess the determination of whether we are the primary beneficiary of a VIE each reporting period.
Fair Value Option
The fair value option provides an election that allows companies to irrevocably elect fair value for financial assets and liabilities on an instrument-by-instrument basis at initial recognition. Changes in fair value for assets and liabilities for which the election is made will be recognized in earnings as they occur.
Real Estate Debt Investments
Real estate debt investments are generally intended to be held to maturity and, accordingly, are carried at cost, net of unamortized loan origination fees, discounts and unfunded commitments. Real estate debt investments that are deemed to be impaired are carried at amortized cost less loan loss reserves. Interest income is recorded on the accrual basis and related discounts, premiums, origination costs and fees are amortized over the life of the investment using the effective interest method. The amortization is reflected as an adjustment to interest income in our consolidated statements of operations. The accretion of discount or amortization of a premium is discontinued if such loan is reclassified to held for sale.
Loans acquired at a discount with deteriorated credit quality are accreted to expected recovery. The Company continues to estimate the amount of recovery over the life of such loans. A subsequent increase in expected future cash flows is recognized as an adjustment to the accretable yield
77
Table of Contents
prospectively over the remaining life of such loan. A subsequent decrease in expected future cash flows is recognized as a provision for loan loss.
Real Estate Securities
We classify our real estate securities as available for sale on the acquisition date. Available for sale securities are recorded at fair value. We have generally elected to apply the fair value option of accounting for our real estate securities portfolio. For those real estate securities for which the fair value option of accounting was elected, any unrealized gains (losses) from changes in fair value are recorded in unrealized gains (losses) on investments and other in the Company's consolidated statements of operations.
We may decide not elect the fair value option for certain real estate securities due to the nature of the particular instrument. For those real estate securities for which the fair value option of accounting was not elected, any unrealized gains (losses) from the change in fair value is reported as a component of accumulated other comprehensive income (loss) in our consolidated statements of equity, to the extent impairment losses are considered temporary.
Interest income on real estate securities is recognized using the effective interest method with any purchased premium or discount accreted through income based upon a comparison of actual and expected cash flows, through the expected maturity date of the security. Depending on the nature of the investment, changes to expected cash flows may result in a change to yield which is then applied prospectively to recognize interest income.
Operating Real Estate
Operating real estate is carried at historical cost less accumulated depreciation. Costs directly related to the acquisitions deemed to be business combinations subsequent to January 1, 2009 are expensed. Ordinary repairs and maintenance which are not reimbursed by the tenants are expensed as incurred. Major replacements and betterments which improve or extend the life of the asset are capitalized and depreciated over their useful life.
We follow the purchase method of accounting for acquisitions of operating real estate held for investment, where the purchase price of operating real estate is allocated to tangible assets such as land, building, tenant improvements and other identified intangibles.
We evaluate whether real estate acquired in connection with a foreclosure, UCC/deed in lieu of foreclosure or a consentual modification of a loan (herein collectively referred to as a foreclosure), or REO, constitutes a business and whether business combination accounting is relevant. Any excess upon foreclosure of a property between the carrying value of a loan over the estimated fair value of the property is charged to provision for loan losses.
Operating real estate, including REO, which has met the criteria to be classified held for sale, is separately presented in the consolidated balance sheets. Such operating real estate is reported at the lower of its carrying value or its estimated fair value less the cost to sell. Once a property is determined to be held for sale, depreciation is no longer recorded. In addition, the results of operations are reclassified to income (loss) from discontinued operations in the consolidated statements of operations. Other REO for which we intend to market for sale in the near term is recorded at estimated fair value.
Rental income from operating real estate is derived from leasing and sub-leasing of space to various types of corporate tenants and healthcare operators. The leases are for fixed terms of varying length and provide for annual rentals and expense reimbursements to be paid in monthly installments. Rental income from leases is recognized on a straight-line basis over the term of the respective leases. The excess of rents recognized over amounts contractually due pursuant to the underlying leases are included in unbilled rent receivable.
78
Table of Contents
Credit Losses and Impairment on Investments
We maintain a loan loss reserve on certain of our CRE debt investments. A provision is established when we believe a loan is impaired, which is when we deem it probable that we will not be able to collect principal and interest amounts due according to the contractual terms. Management assesses the credit quality of the portfolio and adequacy of loan loss reserves on a quarterly basis, or more frequently as necessary. Significant judgment of management is required in this analysis. Management considers the estimated net recoverable value of the loan as well as other factors, including but not limited to fair value of any collateral, the amount and the status of any senior debt, the prospects for the borrower and the economic and competitive situation of the region where the borrower does business. Because this determination is based upon projections of future economic events, which are inherently subjective, the amounts ultimately realized from these investments may differ materially from the carrying value as of the balance sheet date.
Income recognition is suspended for the loans at the earlier of the date at which payments become 90-days past due or when, in the opinion of management, a full recovery of income and principal becomes doubtful. Income is then recorded on the basis of cash received until accrual is resumed when the loan becomes contractually current and performance is demonstrated to be resumed. A loan is written off when it is no longer realizable and legally discharged.
CRE securities for which the fair value option is elected are not evaluated for other-than-temporary impairment, or OTTI, as changes in fair value are recorded in our consolidated statements of operations. Realized losses on such securities are reclassified to the realized gain (loss) on investments and other account as losses occur.
CRE securities for which the fair value option is not elected are periodically evaluated for OTTI. A security where the fair value is less than amortized cost is considered impaired. Impairment of a security is considered to be other-than-temporary when: (a) the holder has the intent to sell the impaired security; (b) it is more likely than not the holder will be required to sell the security; or (c) the holder does not expect to recover the entire amortized cost of the security. When a CRE security has been deemed to be other-than-temporarily impaired, the security is written down to its fair value. The amount of OTTI is then bifurcated into: (i) the amount related to expected credit losses; and (ii) the amount related to fair value adjustments in excess of expected credit losses. The portion of OTTI related to expected credit losses is recognized in the consolidated statements of operations. The remaining OTTI related to the valuation adjustment is recognized as a component of accumulated other comprehensive income (loss) in the consolidated statements of equity. The portion of OTTI recognized through earnings is accreted back to the amortized cost basis of the security through interest income, while amounts recognized through other comprehensive income (loss) are amortized over the life of the security with no impact on earnings.
Our real estate portfolio is reviewed on a quarterly basis, or more frequently as necessary, to assess whether there are any indicators that the value of our operating real estate may be impaired or that its carrying value may not be recoverable. A property's value is considered impaired if management's estimate of the aggregate future undiscounted cash flows to be generated by the property is less than the carrying value of the property. In conducting this review, management considers U.S. macroeconomic factors, including real estate sector conditions, together with asset specific and other factors. To the extent an impairment has occurred and is considered to be other than temporary, the loss will be measured as the excess of the carrying amount of the property over the calculated fair value of the property.
79
Table of Contents
Allowances for doubtful accounts for tenant receivables are established based on periodic review of aged receivables resulting from estimated losses due to the inability of tenants to make required rent and other payments contractually due. Additionally, we establish, on a current basis, an allowance for future tenant credit losses on billed and unbilled rents receivable based upon an evaluation of the collectability of such amounts.
Fair Value Measurements
We follow fair value guidance in accordance with U.S. GAAP to account for our financial instruments. We categorize our financial instruments, based on the priority of the inputs to the valuation technique, into a three-level fair value hierarchy. The fair value hierarchy gives the highest priority to quoted prices in active markets for identical assets or liabilities (Level 1) and the lowest priority to unobservable inputs (Level 3). If the inputs used to measure the financial instruments fall within different levels of the hierarchy, the categorization is based on the lowest level input that is significant to the fair value measurement of the instrument.
Financial assets and liabilities recorded at fair value on our consolidated balance sheets are categorized based on the inputs to the valuation techniques as follows:
| | | | |
| Level 1. | | Quoted prices for identical assets or liabilities in an active market. |
Level 2. |
|
Financial assets and liabilities whose values are based on the following: |
|
|
(a) |
|
Quoted prices for similar assets or liabilities in active markets. |
|
|
(b) |
|
Quoted prices for identical or similar assets or liabilities in non-active markets. |
|
|
(c) |
|
Pricing models whose inputs are observable for substantially the full term of the asset or liability. |
|
|
(d) |
|
Pricing models whose inputs are derived principally from or corroborated by observable market data for substantially the full term of the asset or liability. |
Level 3. |
|
Prices or valuation techniques based on inputs that are both unobservable and significant to the overall fair value measurement. |
Financial assets and liabilities recorded at fair value on a recurring basis are classified in their entirety based on the lowest level of input that is significant to the fair value measurement.
Financial assets and liabilities recorded at fair value on a recurring basis using Level 3 inputs was 29% and 90% of total assets and liabilities measured at fair value on a recurring basis, respectively, as of December 31, 2011. Our non-recurring financial measurements include the measurement of impairment on real estate debt and investments in unconsolidated ventures. These measurements are considered Level 3 fair value measurements.
Transfers in and out of Level 3 for CRE securities for the year ended December 31, 2011 totaled $469.2 million and $434.0 million, respectively, and principally related to the nature of the price used to estimate fair value (third-party pricing service or broker quotations) and the amount of available market data to corroborate such prices. We recognized net unrealized/realized gains and losses of $108.1 million and $216.9 million, respectively, related to transfers in and out of Level 3 in our consolidation statements of operations for the year ended December 31, 2011.
Management determines the prices are representative of fair value through a review of available data, including observable inputs, recent transactions as well as our knowledge and experience of the market.
80
Table of Contents
Determination of Fair Value
The following is a description of our valuation techniques used to measure fair value and the general classification of these instruments pursuant to the fair value hierarchy.
Real estate securities are generally valued using a third-party pricing service or broker quotations. These quotations are based on observable inputs that can be validated, and as such, are classified as Level 2 of the fair value hierarchy. Certain real estate securities are valued based on a single broker quote or an internal pricing model and have less observable pricing are classified as Level 3 of the fair value hierarchy. For real estate securities using an internal pricing model, inputs include assumptions related to the timing and amount of expected future cash flows, the discount rate, estimated prepayments and projected losses.
Derivative instruments are valued using a third-party pricing service. These quotations are generally based on valuation models with market observable inputs such as interest rates and contractual cash flows, and as such, are classified as Level 2 of the fair value hierarchy. Derivative instruments are also assessed for credit valuation adjustments due to the risk of our non-performance and the non-performance of our derivative counterparties. However, since the majority of our derivatives are held in non-recourse CDO financing structures where, by design, the derivative contracts are senior to all the CDO bonds payable, there is no material impact of a credit valuation adjustment.
CDO bonds payable are valued using quotations from nationally-recognized financial institutions that acted as underwriter for the transactions. These quotations are generally based on valuation models using market observable inputs for interest rates and other inputs for assumptions related to the timing and amount of expected future cash flows, the discount rate, estimated prepayments and projected losses. CDO bonds payable are classified as Level 3 of the fair value hierarchy.
Junior subordinated notes are valued using quotations from nationally-recognized financial institutions. These quotations are generally based on a valuation model using market observable inputs for interest rates and other inputs for assumptions related to the implied credit spread of our other borrowings and the timing and amount of expected future cash flows. Junior subordinated notes are classified as Level 3 of the fair value hierarchy.
Recent Accounting Pronouncements
In May 2011, the Financial Accounting Standards Board, or the FASB, issued an accounting update to amend existing guidance concerning fair value measurements and disclosures. The update is intended to achieve common fair value measurements and disclosure requirements under U.S. GAAP and International Financial Reporting Standards and is effective in the first quarter 2012. We are currently evaluating the impact of this accounting update and we do not expect it will have a material impact on the consolidated financial statements.
81
Table of Contents
In June 2011, the FASB issued an accounting update concerning the presentation of comprehensive income. The update requires either a single, continuous statement of comprehensive income be included on the statement of operations or an additional statement of comprehensive income immediately following the statement of operations. The update does not change the components of other comprehensive income that must be reported but it eliminates the option to present other comprehensive income in the statement of equity. In December 2011, the FASB issued an accounting update to defer the requirement to present the reclassification adjustments to other comprehensive income by component and are currently redeliberating this requirement. The remaining requirements of the accounting update are effective for the first quarter 2012, and should be applied retrospectively to all periods reported after the effective date. Early adoption is permitted. There is no impact on our consolidated financial statements as we currently comply with the update.
RESULTS OF OPERATIONS
Comparison of the Year Ended December 31, 2011 to the Year Ended December 31, 2010 (amounts in thousands):
| | | | | | | | | | | | | |
| | Year Ended December 31, | | Increase (decrease) | |
|---|
| | 2011 | | 2010 | | Amount | | % | |
|---|
Revenues | | | | | | | | | | | | | |
Interest income | | $ | 398,483 | | $ | 318,792 | | $ | 79,691 | | | 25.0 | % |
Rental and escalation income | | | 112,697 | | | 115,467 | | | (2,770 | ) | | (2.4 | )% |
Commission income | | | 12,024 | | | 2,476 | | | 9,548 | | | 385.6 | % |
Other revenue | | | 4,602 | | | 7,221 | | | (2,619 | ) | | (36.3 | )% |
| | | | | | | | | | |
Total revenues | | | 527,806 | | | 443,956 | | | 83,850 | | | 18.9 | % |
Expenses | | | | | | | | | | | | | |
Interest expense | | | 142,220 | | | 126,210 | | | 16,010 | | | 12.7 | % |
Real estate properties—operating expenses | | | 22,531 | | | 37,565 | | | (15,034 | ) | | (40.0 | )% |
Asset management expenses | | | 5,538 | | | 4,505 | | | 1,033 | | | 22.9 | % |
Commission expense | | | 9,239 | | | 1,867 | | | 7,372 | | | 394.9 | % |
Impairment on operating real estate | | | — | | | 5,249 | | | (5,249 | ) | | (100.0 | )% |
Provision for loan losses | | | 52,980 | | | 168,446 | | | (115,466 | ) | | (68.5 | )% |
Provision for loss on equity investment | | | 4,482 | | | — | | | 4,482 | | | NA | |
General and administrative | | | | | | | | | | | | | |
Salaries and equity-based compensation | | | 67,708 | | | 54,828 | | | 12,880 | | | 23.5 | % |
Auditing and professional fees | | | 9,437 | | | 10,503 | | | (1,066 | ) | | (10.1 | )% |
Other general and administrative | | | 18,238 | | | 19,543 | | | (1,305 | ) | | (6.7 | )% |
| | | | | | | | | | |
Total general and administrative | | | 95,383 | | | 84,874 | | | 10,509 | | | 12.4 | % |
Depreciation and amortization | | | 44,258 | | | 31,466 | | | 12,792 | | | 40.7 | % |
| | | | | | | | | | |
Total expenses | | | 376,631 | | | 460,182 | | | (83,551 | ) | | (18.2 | )% |
| | | | | | | | | | |
Income (loss) from operations | | | 151,175 | | | (16,226 | ) | | 167,401 | | | (1,031.7 | )% |
Equity in earnings (losses) of unconsolidated ventures | | | (2,738 | ) | | 2,550 | | | (5,288 | ) | | (207.4 | )% |
Other income (loss) | | | 4,162 | | | — | | | 4,162 | | | NA | |
Unrealized gain (loss) on investments and other | | | (489,904 | ) | | (538,572 | ) | | 48,668 | | | (9.0 | )% |
Realized gain on investments and other | | | 78,782 | | | 145,722 | | | (66,940 | ) | | (45.9 | )% |
Gain from acquisitions | | | 89 | | | 15,363 | | | (15,274 | ) | | (99.4 | )% |
| | | | | | | | | | |
Income (loss) from continuing operations | | | (258,434 | ) | | (391,163 | ) | | 132,729 | | | (33.9 | )% |
Income (loss) from discontinued operations | | | (1,290 | ) | | (925 | ) | | (365 | ) | | 39.5 | % |
Gain (loss) on sale from discontinued operations | | | 17,198 | | | 2,528 | | | 14,670 | | | 580.3 | % |
| | | | | | | | | | |
Net income (loss) | | $ | (242,526 | ) | $ | (389,560 | ) | $ | 147,034 | | | 37.7 | % |
| | | | | | | | | | |
82
Table of Contents
Revenues
Interest Income
Interest income increased $79.7 million, primarily attributable to additional interest income related to the CSE CDO ($63.1 million of which $33.1 million relates to discount accretion on debt investments fully repaid, $16.3 million of discount accretion and $13.7 million of contractual interest), N-Star CDO IX ($36.2 million) and the CapLease CDO ($4.4 million); offset by $23.9 million of lower interest income related to lower average interest rates on loan modifications, non-performing real estate debt investments and lower comparable asset balances.
Rental and Escalation Income
Rental and escalation income decreased $2.8 million, primarily attributable to lower income related to the deconsolidation of Midwest Care Holdco TRS I LLC, or Midwest Holdings, ($18.5 million) and a transfer of a property to a lender foreclosure ($2.9 million), offset by an increase related to 2011 real estate acquisitions (via foreclosure) ($18.7 million).
Commission Income
Commission income represents income earned by us for selling equity in NSREIT through our broker-dealer subsidiary. The increase of $9.5 million is attributable to increased capital raised in 2011 in the non-listed REIT market.
Other Revenue
Other revenue decreased $2.6 million primarily due to the consolidation of N-Star CDO IX in July 2010 and the related elimination of related party interest and advisory fees ($3.0 million) partially offset by increases in various other fees such as exit fees, lease termination fees, draw fees and late fees ($0.4 million).
Expenses
Interest Expense
Interest expense increased $16.0 million, primarily attributable to additional interest expense related to the CapLease CDO ($3.6 million), full year interest expense in 2011 related to CSE CDO ($2.2 million) and N-Star CDO IX ($2.2 million) and our March 2011 issuance of 7.50% exchangeable senior notes ($10.4 million), offset by lower interest expense due to a property transferred to a lender ($2.8 million).
Real Estate Properties—Operating Expenses
Real estate properties operating expenses decreased $15.0 million, primarily attributable to lower costs associated with our deconsolidation of Midwest Holdings ($21.6 million) and return of property to a lender ($1.2 million), offset by increased costs related to 2011 real estate acquisitions (via foreclosure) ($8.2 million).
Asset Management Expenses
Asset management expenses increased $1.0 million, and consisted of costs related to managing our investment portfolio, such as legal and consulting fees for loan modifications and restructurings, and acquisition costs related to new investments.
83
Table of Contents
Commission Expense
Commission expense represents the fees paid to broker-dealers with whom we have distribution agreements to raise capital in the non-listed REIT market. The increase of $7.4 million is the result of the increased capital raising velocity of NSREIT in 2011.
Impairment on Operating Real Estate
There was no impairment on operating real estate in 2011. Impairment on operating real estate for the year ended December 31, 2010 related to a partially vacant net lease property located in Cincinnati, Ohio.
Provision for Loan Losses
Provision for loan losses for the year ended December 31, 2011 decreased $115.5 million. Provision for loan losses of $53.0 million in 2011 related to 12 debt investments, and included $0.8 million for first mortgage loans, $22.9 million for subordinated mortgage interests and $29.3 million for mezzanine loans. Provision for loan losses for the year ended December 31, 2010 totaled $168.4 million for 19 debt investments, and included $25.2 million for first mortgage loans, $53.0 million for subordinated mortgage interests and $90.2 million for mezzanine loans.
Provision for Loss on Equity Investment
Provision for loss on equity investment for the year ended December 31, 2011 represented an impairment on our joint venture in a retail/entertainment complex located in East Rutherford, New Jersey, or NJ Property. There was no provision for loss on equity investment in 2010.
General and Administrative
General and administrative expenses increased by $10.5 million principally related to the following:
Compensation expense increased $12.9 million comprised of a $16.1 million increase resulting from higher staffing levels to accommodate our new investment activities, of which $2.5 million related to our broker-dealer, and a $5.6 million increase in equity compensation for the 2010 long-term incentive plan. This was offset by a decrease of $8.8 million primarily related to the equity compensation of the 2004 Omnibus Stock Incentive Plan becoming fully vested.
Auditing and professional fees decreased $1.1 million primarily related to legal fees for general corporate work.
Other general and administrative expenses decreased $1.3 million primarily due to lower corporate expenses.
Depreciation and Amortization
Depreciation and amortization expense increased $12.8 million, primarily related to 2011 real estate acquisitions (via foreclosure).
Equity in Earnings (Losses) of Unconsolidated Ventures
Equity in earnings (losses) decreased $5.3 million, primarily attributable to the gain on sale in 2010 of our corporate lending venture ($8.5 million) and the deconsolidation of Midwest Holdings ($2.0 million); partially offset by decrease in losses from our investments in LandCap ($1.0 million), the NorthStar Real Estate Securities Opportunity Fund, or Securities Fund ($3.9 million) and the NJ Property ($0.3 million).
84
Table of Contents
Other Income (Loss)
Other income (loss) increased $4.2 million, primarily comprised of $17.9 million related to the CSE CDO, $5.0 million related to N-Star CDO VII and $0.8 million related to the CapLease CDO; offset by a loss accrual of $20.0 million recorded in the third quarter 2011 related to a lawsuit as described in Liquidity and Capital Resources.
Unrealized Gain (Loss) on Investments and Other
The decrease in unrealized (losses) on investments and other for the year ended December 31, 2011 is primarily related to the non-cash change in fair value adjustments which represented a net unrealized loss of $387.3 million in 2011 versus a net unrealized loss of $431.9 million for the year ended December 31, 2010. The remaining difference is related net cash payments for interest rate swaps, which do not qualify for hedge accounting.
Realized Gain on Investments and Other
The realized gain of $78.8 million for the year ended December 31, 2011 consisted primarily of $117.4 million net realized gains from the sale of certain real estate debt investments and real estate securities and a net gain from the sale of timeshare units of $3.7 million; offset by $27.3 million loss on the repurchase of CDO debt; foreign currency remeasurement loss of $1.3 million, $2.8 million loss on interest rate swap terminations, $0.5 million loss on the deconsolidation of Midwest Holdings, $0.6 million loss on the forgiveness of debt and $9.8 million realized losses or write downs on certain real estate securities. The realized gain of $145.7 million for the year ended December 31, 2010 consisted primarily of $78.1 million net realized gains on the sale of certain CRE debt and security investments; $60.4 million realized gain from the repayment and extinguishment of our secured term loan; $7.5 million gain on the sale of our interest in our corporate lending venture; $0.4 million net realized gain on debt repurchases and a foreign currency remeasurement gain of $1.2 million; partially offset by realized losses of $0.3 million on interest rate swap terminations and $1.6 million related to realized losses or write downs on certain real estate securities.
Gain (Loss) from Acquisitions
Gain (loss) from acquisitions for the year ended December 31, 2011 relates to the CapLease CDO and the year ended December 31, 2010 relates to the CSE CDO.
Income (Loss) from Discontinued Operations
Income (loss) from discontinued operations represents the operations of properties sold or classified as held for sale during the period for which the majority generated net operating losses. For the year ended December 31, 2011, the loss from discontinued operations principally related to a land parcel in Florida and a portfolio of 18 healthcare net lease assisted living facilities located in Wisconsin. For the year ended December 31, 2010, the loss from discontinued operations principally related to two land parcels, a multifamily property, two office properties, a portfolio of 18 healthcare net lease assisted living facilities located in Wisconsin and the leasehold interest in retail space in New York.
Gain (Loss) on Sale from Discontinued Operations
Gain (loss) on sale from discontinued operations for the year ended December 31, 2011 is principally comprised of the sale of a healthcare portfolio located in Wisconsin to a third-party investor representing a gain of $9.4 million, the sale of a retail property located in New York representing a gain of $5.0 million and the sale of a multifamily property in Georgia representing a gain of $2.9 million. Gain (loss) on sale from discontinued operations for the year ended December 31, 2010 is related to the sale of a leasehold interest in retail space located in New York for a gain of $2.5 million.
85
Table of Contents
Comparison of the Year Ended December 31, 2010 to the Year Ended December 31, 2009 (amounts in thousands)
| | | | | | | | | | | | | |
| | Year Ended December 31, | | Increase (decrease) | |
|---|
| | 2010 | | 2009 | | Amount | | % | |
|---|
Revenues | | | | | | | | | | | | | |
Interest income | | $ | 318,792 | | $ | 142,213 | | $ | 176,579 | | | 124.2 | % |
Rental and escalation income | | | 115,467 | | | 88,997 | | | 26,470 | | | 29.7 | % |
Commission income | | | 2,476 | | | — | | | 2,476 | | | NA | |
Other revenue | | | 7,221 | | | 25,438 | | | (18,217 | ) | | (71.6 | )% |
| | | | | | | | | | |
Total revenues | | | 443,956 | | | 256,648 | | | 187,308 | | | 73.0 | % |
Expenses | | | | | | | | | | | | | |
Interest expense | | | 126,210 | | | 116,133 | | | 10,077 | | | 8.7 | % |
Real estate properties—operating expenses | | | 37,565 | | | 14,560 | | | 23,005 | | | 158.0 | % |
Asset management expenses | | | 4,505 | | | 4,214 | | | 291 | | | 6.9 | % |
Commission expense | | | 1,867 | | | — | | | 1,867 | | | NA | |
Impairment on operating real estate | | | 5,249 | | | — | | | 5,249 | | | NA | |
Provision for loan losses | | | 168,446 | | | 83,745 | | | 84,701 | | | 101.1 | % |
General and administrative | | | | | | | | | | | | | |
Salaries and equity-based compensation | | | 54,828 | | | 47,213 | | | 7,615 | | | 16.1 | % |
Auditing and professional fees | | | 10,503 | | | 9,186 | | | 1,317 | | | 14.3 | % |
Other general and administrative | | | 19,543 | | | 13,028 | | | 6,515 | | | 50.0 | % |
| | | | | | | | | | |
Total general and administrative | | | 84,874 | | | 69,427 | | | 15,447 | | | 22.2 | % |
Depreciation and amortization | | | 31,466 | | | 39,074 | | | (7,608 | ) | | (19.5 | )% |
| | | | | | | | | | |
Total expenses | | | 460,182 | | | 327,153 | | | 133,029 | | | 40.7 | % |
| | | | | | | | | | |
Income (loss) from operations | | | (16,226 | ) | | (70,505 | ) | | 54,279 | | | (77.0 | )% |
Equity in earnings (losses) of unconsolidated ventures | | | 2,550 | | | (1,524 | ) | | 4,074 | | | 267.3 | % |
Unrealized gain (loss) on investments and other | | | (538,572 | ) | | (209,976 | ) | | (328,596 | ) | | 156.5 | % |
Realized gain on investments and other | | | 145,722 | | | 128,461 | | | 17,261 | | | 13.4 | % |
Gain (loss) from acquisition | | | 15,363 | | | — | | | 15,363 | | | NA | |
| | | | | | | | | | |
Income (loss) from continuing operations | | | (391,163 | ) | | (153,544 | ) | | (237,619 | ) | | 154.8 | % |
Income (loss) from discontinued operations | | | (925 | ) | | 3,169 | | | (4,094 | ) | | (129.2 | )% |
Gain (loss) on sale from discontinued operations | | | 2,528 | | | 13,799 | | | (11,271 | ) | | (81.7 | )% |
| | | | | | | | | | |
Net income (loss) | | $ | (389,560 | ) | $ | (136,576 | ) | $ | (252,984 | ) | | 185.2 | % |
| | | | | | | | | | |
Revenues
Interest Income
Interest income increased $176.6 million, primarily attributable to additional interest income related to the consolidation of N-Star CDOs I, II, III, V and IX ($120.0 million), the CSE CDO ($67.2 million of which $26.7 million relates to contractual interest, $23.4 million of discount accretion on debt investments fully repaid and $17.1 million of discount accretion on remaining debt investments), offset by lower average interest rates on loan modifications and lower comparable asset balances ($10.6 million).
86
Table of Contents
Rental and Escalation Income
Rental and escalation income increased $26.5 million, primarily attributable to increases related to the consolidation of Midwest Holdings ($46.6 million) and increased occupancy on certain properties ($0.7 million); offset by the sale of a healthcare portfolio ($9.0 million), lease expiration of a healthcare net lease tenant ($6.0 million), lower rents ($5.3 million) and the return of a property to a lender in 2009 ($0.5 million).
Commission Income
Commission income represents income earned by us for selling equity in NSREIT through our broker-dealer subsidiary. We began raising capital in 2010 in the non-listed REIT market.
Other Revenue
Other revenue decreased $18.2 million, primarily attributable to interest and advisory fee income recorded prior to the consolidation of N-Star CDOs I, II, III, and V ($20.7 million) partially offset by increases in advisory fees and various other fees, such as exit fees, lease termination fees, draw fees and late fees ($2.5 million).
Expenses
Interest Expense
Interest expense increased $10.1 million, primarily attributable to additional interest expense related to the consolidation of N-Star CDOs I, II, III, V and IX ($21.7 million), the CSE CDO ($4.8 million) and additional interest related to the Term Asset-Backed Securities Loan Facility, or TALF, program debt ($1.4 million). This increase was partially offset by lower interest expense related to the repayment of certain borrowings ($13.9 million) and bond and note repurchases ($4.0 million).
Real Estate Properties—Operating Expenses
Real estate property operating expenses increased $23.0 million, primarily attributable to the consolidation of Midwest Holdings ($32.3 million) offset by decreases related to the restructure of a healthcare portfolio ($7.1 million), a reduced real estate tax assessment ($1.4 million), reduced occupancy ($0.5 million) and the return of a property to a lender in 2009 ($0.3 million).
Asset Management Expenses
Asset management expenses increased $0.3 million and consisted of costs related to managing our investment portfolio, such as legal and consulting fees for loan modifications and restructurings, and acquisition costs related to new investments.
Commission Expense
Commission expense represents the fees paid to broker-dealers with whom we have distribution agreements to raise capital in the non-listed REIT market. We began raising capital in 2010 in the non-listed REIT market.
Impairment on Operating Real Estate
Impairment on operating real estate for the year ended December 31, 2010 totaled $5.2 million which is related to a partially vacant net lease property located in Cincinnati, Ohio. There was no impairment on operating real estate in 2009.
87
Table of Contents
Provision for Loan Losses
Provision for loan losses for the year ended December 31, 2010 increased by $84.7 million. Provision for loan losses for the year ended December 31, 2010 totaled $168.4 million for 19 debt investments, and included $25.2 million for first mortgage loans, $52.9 million for subordinated mortgage interests and $90.3 million for mezzanine loans. Provision for loan losses for the year ended December 31, 2009 totaled $83.7 million for 15 debt investments and included $20.7 million for first mortgage loans, $16.0 million for subordinated mortgage interests and $47.0 million for mezzanine loans.
General and Administrative
General and administrative expenses increased $15.4 million primarily related to the following:
Compensation expense increased $7.6 million related to salaries and accrued cash incentive compensation resulting from higher staffing levels to accommodate our new investment activities, of which $3.0 million related to our broker-dealer, and accrued cash compensation related to our long-term incentive compensation plan ($11.1 million). This amount included a non-recurring expense of $3.5 million relating to the separation and consulting agreement with our former chief operating officer. In addition, equity-based compensation decreased $3.5 million related to awards issued under our 2004 Omnibus Stock Incentive Plan becoming fully vested.
Auditing and professional fees increased $1.3 million primarily attributable to legal fees for general corporate work.
Other general and administrative expenses increased $6.5 million primarily attributable to a surety bond fee on the Chatsworth, California property ($2.0 million); overhead costs for our Denver, Colorado and Bethesda, Maryland offices ($1.2 million); legal fees and other costs related to investment initiatives not consummated ($1.5 million); increased taxes related to Midwest Holdings ($0.8 million); increased costs relating to REO properties ($0.6 million) and costs associated with the CSE CDO ($0.4 million).
Depreciation and Amortization
Depreciation and amortization expense decreased $7.6 million primarily relating to the 2009 write-off of certain costs associated with the lease restructuring and termination of one operator in our healthcare portfolio.
Equity in Earnings (Losses) of Unconsolidated Ventures
Equity in earnings (losses) increased $4.1 million, primarily attributable to the gain on sale of assets in 2010 of our corporate lending venture ($8.5 million), a decrease in losses from our investments in LandCap ($1.2 million) and the Securities Fund ($2.4 million); partially offset by losses from our equity investments in the NJ Property ($2.9 million) and a decrease in earnings in Midwest Holdings as the result of its consolidation ($5.5 million).
Unrealized Gain (Loss) on Investments and Other
The increase in unrealized (losses) on investments and other for the year ended December 31, 2010 is primarily related to the non-cash change in fair value adjustments which represented a net unrealized loss of $431.9 million for the year ended December 31, 2010 versus a net unrealized loss of $152.4 million for the year ended December 31, 2009. The remaining difference is related to net cash payments for the interest rate swaps, which do not qualify for hedge accounting.
88
Table of Contents
Realized Gain on Investments and Other
The realized gains of $145.7 million for the year ended December 31, 2010 consisted primarily of $78.1 million net realized gains of on the sale of certain CRE debt and security investments; $60.4 million realized gain from the repayment and extinguishment of our secured term loan; $7.5 million gain on the sale of our interest in our corporate lending venture; $0.4 million net realized gain on debt repurchases and a foreign currency remeasurement gain of $1.2 million; partially offset by realized losses of $0.3 million on interest rate swap terminations and $1.6 million related to realized losses or write downs on certain real estate securities. The realized gain of $128.5 million for the year ended December 31, 2009 consisted primarily of $59.7 million realized gain from the repurchase of $111.9 million principal of our 7.25% exchangeable senior notes and $19.3 million principal of our 11.5% exchangeable senior notes and $70.2 million net realized gains on the sale of certain real estate debt investments and real estate securities; partially offset by losses of $0.7 million on the abandonment of CDO bonds payable and a foreign currency remeasurement loss of $0.7 million.
Gain from Acquisition
Gain from acquisition for the year ended December 31, 2010 related to the CSE CDO. There were no gains from acquisitions in 2009.
Income (Loss) from Discontinued Operations
Income (loss) from discontinued operations primarily represents the operations of properties sold or classified as held for sale during the period. For the year ended December 31, 2010, the loss from discontinued operations principally related to two land parcels, a multifamily property, two office properties, a portfolio of 18 healthcare net lease assisted living facilities located in Wisconsin and the leasehold interest in retail space located in New York. For the year ended December 31, 2009, the income from discontinued operations principally related to a portfolio of 18 healthcare net lease assisted living facilities located in North Carolina, a portfolio of 18 healthcare net lease assisted living facilities located in Wisconsin, an office property and a leasehold interest in retail space located in New York.
Gain on Sale from Discontinued Operations
In 2010, we sold a leasehold interest in retail space located in New York for a gain of $2.5 million. In 2009, we sold a portfolio of 18 healthcare net lease assisted living facilities for a gain of $13.8 million.
Liquidity and Capital Resources
We require significant capital to fund our investment activities and operating expenses. Our capital sources may include cash flow from operations, net proceeds from asset repayments and sales, borrowings under credit facilities, financings secured by our assets such as mortgage notes and CDO bonds, long-term senior and subordinate corporate capital such as senior term loans, senior notes exchangeable into common stock, trust preferred securities and perpetual preferred and common stock.
We seek to meet our long-term liquidity requirements, including the repayment of borrowings and our investment funding needs, through existing cash resources, opportunistic issuances of debt or equity capital, including exchangeable notes, our existing CDO financing transactions and the liquidation or refinancing of assets. Nonetheless, our ability to meet a long-term (beyond one year) liquidity requirement may be subject to obtaining additional debt and equity financing. Any decision by our lenders and investors to provide us with financing will depend upon a number of factors, such as our compliance with the terms of our existing credit arrangements, our financial performance, industry or market trends, the general availability of and rates applicable to financing transactions, such lenders'
89
Table of Contents
and investors' resources and policies concerning the terms under which they make capital commitments and the relative attractiveness of alternative investment or lending opportunities.
As a REIT, we are required to distribute at least 90% of our annual REIT taxable income to our stockholders, including taxable income where we do not receive corresponding cash, and we intend to distribute all or substantially all of our REIT taxable income in order to comply with the REIT distribution requirements of the Internal Revenue Code and to avoid federal income tax and the non-deductible excise tax. In the past, we have maintained high unrestricted cash balances relative to the historical difference between our distributions and cash provided by operating activities. On a quarterly basis, our board of directors determines an appropriate common stock dividend based upon numerous factors, including AFFO, REIT qualification requirements, the amount of cash flows provided by operating activities, availability of existing cash balances, borrowing capacity under existing credit agreements, access to cash in the capital markets and other financing sources, our view of our ability to realize gains in the future through appreciation in the value of our assets, general economic conditions and economic conditions that more specifically impact our business or prospects. Future dividend levels are subject to adjustment based upon our evaluation of the factors described above, as well as other factors that our board of directors may, from time-to-time, deem relevant to consider when determining an appropriate common stock dividend.
We currently believe that our existing sources of funds should be adequate for purposes of meeting our short-term liquidity needs. At December 31, 2011, we had $145 million of unrestricted cash. In addition, we had $71 million of uninvested and available funds in our CDO financing transactions, which is available only for reinvestment and future funding commitments.
The reinvestment period for two of our CDO's (CSE CDO and N-Star CDO VIII) just ended in January 2012 and February 2012, respectively, while the reinvestment period for N-Star CDO IX ends in June 2012. During the reinvestment period, we are allowed to reinvest principal proceeds from the underlying collateral into qualifying replacement collateral without having to repay the liabilities. $636 million of our debt investments have their initial maturity date during 2012; however, many of these CRE debt investments contain extension options of at least one year. We also expect that a majority of the $285 million of debt investments having final maturities during 2012 may have their maturities extended beyond 2012 with the expectation that future periods will have more attractive economic conditions and cheaper debt capital available for refinancings. It is therefore difficult to estimate how much capital for reinvestment, if any, will be generated in our CDO financing transactions from debt repayments in 2012. To the extent we receive principal proceeds from the underlying collateral after the completion of the reinvestment period, such amounts is used to amortize the senior CDO bonds.
Our CDO financing transactions require that the underlying assets meet a collateral value coverage test (as defined by the indenture) in order for us to receive regular cash flow distributions. Rating downgrades and defaults of CMBS and other securities can reduce the deemed value of the security in measuring the collateral coverage, depending upon the level of downgrade. Also, defaults in our CRE debt investments can reduce the OC test. Failing such tests means that cash flow that would normally be distributed to us would be used to amortize the senior CDO bonds until the tests are back in compliance. While we have devoted a significant amount of resources to managing our existing investments, a poor economic environment and additional credit rating downgrades will make maintaining compliance with the CDO financing transactions more difficult. For more details related to our CDO financing OC tests, see "CDO Financing Structures" below.
Principal proceeds received after the reinvestment period and diversion of cash flows from failing OC tests results in delevering of the CDO financing transactions and increasing the weighted average cost of borrowings.
90
Table of Contents
As set forth in our periodic reports filed with the SEC, one of our net lease investments was comprised of three office buildings totaling 257,000 square feet located in Chatsworth, California and was 100% leased to WaMu. The tenant vacated the buildings as of March 23, 2009 and the WaMu Leases were disaffirmed by the FDIC. In the third quarter of 2009, GECCMC, foreclosed on the property. On August 10, 2009, GECCMC filed a complaint against NNN and NRFC Sub Investor IV, which are our wholly-owned subsidiaries, in the Superior Court of the State of California, County of Los Angeles. In the complaint, GECCMC alleged, among other things, that the loan provided by GECCMC to NRFC Sub Investor IV, is a recourse obligation of NNN due to the FDIC's disaffirmance of the WaMu Leases. The judge presiding over the lawsuit has entered a judgment against NNN in the amount of approximately $46 million plus costs, attorneys' fees, prejudgment interests and accrued interest currently estimated to be approximately $6 million. NNN is vigorously pursuing an appeal of the decision. However, during the third quarter 2011 we engaged in settlement discussions with the GECCMC and, accordingly, in that quarter 2011 we have recorded a loss accrual related to the lawsuit in the amount of $20 million. If we were to settle the lawsuit for such amount, we would receive net proceeds of $6 million from the settlement through the return of its collateral under the Bond (as defined below). We continue to engage in settlement discussions, however, no assurances can be given that a settlement will be reached or the amount of such settlement. In connection with such appeal, pursuant to California law, NNN was required to post a bond in an amount equal to one and a half times the amount of the Judgment, or the Bond. Accordingly, we have entered into a standard General Agreement of Indemnity with an issuer of surety bonds. On January 7, 2011, as part of the Surety Agreement, in connection with the issuance of the Bond, we posted cash collateral equal to 38% of the amount of the Bond, or $26 million. In January 2012, we renewed the Bond with identical terms as currently exist.
On July 14, 2011, we repaid the $100 million preferred membership interest in NRF Healthcare, LLC, or NRF Healthcare, to Inland American Real Estate Trust, Inc. which had a 10.5% distribution rate. Such amount was funded using $25 million of proceeds generated from the sale of a healthcare net lease portfolio and $75 million of restricted cash from one of our CDOs.
We have committed to purchase up to $10 million of shares of NSREIT's common stock during the two-year period following commencement (concluding July 2012) of its continuous, public offering in the event that its distributions to stockholders exceeds its modified funds from operations. In connection with this commitment, we have purchased 253,202 shares for $2.3 million through December 31, 2011.
91
Table of Contents
CDO Financing Structures
The following is a summary of our CRE debt CDO financing transactions as of December 31, 2011 (amounts in thousands):
| | | | | | | | | | | | | | | | | | | |
Issue/Acquisition Date | | N-Star IV
Jun-05 | | N-Star VI
Mar-06 | | N-Star VIII
Dec-06 | | CSE
Jul-10 | | CapLease
Aug-11 | | Total | |
|---|
Balance sheet as of December 31, 2011(1) | | | | | | | | | | | | | | | | | | | |
Assets, principal amount(2) | | $ | 421,377 | | $ | 485,788 | | $ | 953,491 | | $ | 1,119,870 | | $ | 184,278 | | $ | 3,164,804 | |
CDO bonds, principal amount(3) | | | 283,720 | | | 324,740 | | | 585,050 | | | 895,381 | | | 164,908 | | | 2,253,799 | |
| | | | | | | | | | | | | | |
Net assets | | $ | 137,657 | | $ | 161,048 | | $ | 368,441 | | $ | 224,489 | | $ | 19,370 | | $ | 911,005 | |
Principal amount of | | | | | | | | | | | | | | | | | | | |
Original IG rated CDO bonds | | $ | 9,750 | | $ | 26,925 | | $ | 77,650 | | $ | 91,529 | | $ | — | | $ | 205,854 | |
Original below IG rated CDO bonds | | | — | | | 13,950 | | | 59,400 | | | 47,450 | | | — | | | 120,800 | |
| | | | | | | | | | | | | | |
Total CDO bonds | | $ | 9,750 | | $ | 40,875 | | $ | 137,050 | | $ | 138,979 | | $ | — | | $ | 326,654 | |
Weighted average original credit rating of original IG rated CDO bonds | | | | | | | | | | | | | | | | | | AA-/Aa3 | |
Weighted average purchase price of original IG rated CDO bonds | | | | | | | | | | | | | | | | | | 30 | % |
CDO quarterly cash distributions and coverage tests(4) | | | | | | | | | | | | | | | | | | | |
Equity notes and retained original below IG bonds | | $ | 1,786 | | $ | 1,071 | | $ | 5,303 | | $ | 8,725 | | $ | 475 | | $ | 17,360 | |
Collateral management fees | | | 335 | | | 312 | | | 974 | | | 552 | | | 124 | | | 2,297 | |
Interest coverage cushion(1) | | | 1,872 | | | 1,050 | | | 2,869 | | | 9,270 | | | 397 | | | | |
Overcollateralization cushion (shortfall)(1) | | | 68,293 | | | 56,847 | | | 119,657 | | | 72,495 | | | 8,179 | | | | |
At offering | | | 19,808 | | | 17,412 | | | 42,193 | | | (151,595 | )(5) | | 5,987 | | | | |
- (1)
- Based on remittance report issued on date nearest to December 31, 2011.
- (2)
- Includes investments in N-Star issued CDO bond payable that are eliminated in consolidation.
- (3)
- Includes CDO bonds payable to third parties or financed in N-Star CDOs.
- (4)
- IC and OC coverage to the most constrained class.
- (5)
- Based on trustee report as of June 24, 2010, closest to the date of acquisition.
92
Table of Contents
The following is a summary of our CRE security CDO financing transactions as of December 31, 2011 (amounts in thousands):
| | | | | | | | | | | | | | | | | | | | | | |
Issue Date/Acquisition Date | | N-Star I
Aug-03 | | N-Star II
Jul-04 | | N-Star III
Mar-05 | | N-Star V
Sep-05 | | N-Star VII
Jun-06 | | N-Star IX
Feb-07 | | Total | |
|---|
Balance sheet as of December 31, 2011(1) | | | | | | | | | | | | | | | | | | | | | | |
Assets, principal amount(2) | | $ | 210,182 | | $ | 203,638 | | $ | 402,083 | | $ | 494,060 | | $ | 679,366 | | $ | 1,026,009 | | $ | 3,015,338 | |
CDO bonds, principal amount(3) | | | 171,572 | | | 167,647 | | | 296,097 | | | 339,113 | | | 404,567 | | | 682,980 | | | 2,061,976 | |
| | | | | | | | | | | | | | | | |
Net assets | | $ | 38,610 | | $ | 35,991 | | $ | 105,986 | | $ | 154,947 | | $ | 274,799 | | $ | 343,029 | | $ | 953,362 | |
Principal amount of
Original IG rated CDO bonds | | $ | 9,000 | | $ | 3,500 | | $ | 14,187 | | $ | 24,201 | | $ | 43,113 | | $ | 75,980 | | $ | 169,981 | |
Original below IG rated CDO bonds | | | 14,000 | | | 15,000 | | | — | | | — | | | 16,200 | | | 13,040 | | | 58,240 | |
| | | | | | | | | | | | | | | | |
Total CDO bonds | | $ | 23,000 | | $ | 18,500 | | $ | 14,187 | | $ | 24,201 | | $ | 59,313 | | $ | 89,020 | | $ | 228,221 | |
Weighted average original credit rating of original IG rated CDO bonds | | | | | | | | | | | | | | | | | | | | | AA-/Aa3 | |
Weighted average purchase price of original IG rated CDO bonds | | | | | | | | | | | | | | | | | | | | | 33 | % |
CDO quarterly cash distributions and coverage tests(4) | | | | | | | | | | | | | | | | | | | | | | |
Equity notes and retained original below IG bonds | | $ | — | | $ | — | | $ | 1,878 | | $ | — | | $ | 805 | | $ | 2,629 | | $ | 5,312 | |
Collateral management fees | | | 75 | | | 68 | | | 330 | | | 135 | | | 324 | | | 781 | | | 1,713 | |
Interest coverage cushion (shortfall)(1) | | | (659 | ) | | (543 | ) | | 1,933 | | | (1,336 | ) | | (292 | ) | | 1,447 | | | | |
Overcollateralization cushion (shortfall)(1) | | | (22,580 | ) | | (26,832 | ) | | 4,089 | | | (63,614 | ) | | (19,409 | ) | | 23,603 | | | | |
At offering | | | 8,687 | | | 10,944 | | | 13,610 | | | 12,940 | | | 13,966 | | | 24,516 | | | | |
- (1)
- Based on remittance report issued on date nearest to December 31, 2011.
- (2)
- Includes investments in N-Star issued CDO bond payable that are eliminated in consolidation.
- (3)
- Includes CDO bonds payable to third parties or financed in N-Star CDOs.
- (4)
- IC and OC coverage to the most constrained class.
Currently, the reinvestment period for N-Star CDO IX, which remains open, ends in June 2012. At the end of the reinvestment period, our ability to maintain the OC and IC tests may be negatively impacted since we will not be able to reinvest principal in these CDOs. If the OC and IC tests are not met, periodic cash distributions would be diverted to amortize the senior bonds until the CDO is back in compliance with the tests. In such cases, this could decrease cash available to pay our dividend and affect compliance with REIT requirements.
Our CDOs are collateralized by CRE debt and securities, with a majority of our equity invested in our CRE debt CDOs. The CRE debt CDOs currently have larger OC cushions compared to the CRE securities CDOs. CRE debt investments are not subject to rating agency downgrades in calculating the OC tests, and as these investments were primarily directly originated by us, it provides for more control than a CMBS. However, we may have the ability to become the controlling class of a portion of our CMBS holdings in the future which will allow us to appoint ourselves special servicer of the underlying CMBS trust to earn additional fees and have more control over the outcome.
Currently, all of the N-Star CRE debt CDOs are in compliance with their OC and IC tests. Four of our N-Star securities CDOs (I, II, V and VII) are out of compliance with their respective OC tests and we expect that complying with OC and IC tests will continue to be difficult. However, we believe
93
Table of Contents
that certain of the CDOs currently out of compliance have the potential to return the original invested capital depending on the ultimate value of the collateral at the time of liquidation.
Exchangeable Senior Notes
In March 2011, our Operating Partnership issued $173 million of 7.50% exchangeable senior notes, or the 7.50% Notes. The 7.50% Notes were offered in a private offering exempt from registration in reliance on Rule 144A under the Securities Act of 1933, as amended. The 7.50% Notes pay interest semi-annually in arrears on March 15 and September 15, at a rate of 7.50% per annum, mature on March 15, 2031 and are redeemable, at our option, on and after March 15, 2016. The 7.50% Notes have an initial exchange rate representing an exchange price of $6.44 per share of our common stock, subject to adjustment under certain circumstances. The 7.50% Notes are senior unsecured obligations of our Operating Partnership and may be exchangeable at any time prior to the close of business on the second business day immediately preceding the maturity date for cash or common stock of ours, or a combination of cash and common stock of ours, at our option. We may be required to repurchase the 7.50% Notes upon the occurrence of certain events. The net proceeds from this offering were $163 million.
Debt Repurchases
During the year ended December 31, 2011, we repurchased $301 million principal amount of our N-Star CDO bonds payable with $112 million of unrestricted cash, including $77 million principal amount of our CDO bonds for $22 million of unrestricted cash which was previously financed in our N-Star CDOs. Additionally, during 2011, we repurchased $73 million principal amount of our exchangeable senior notes with $75 million of unrestricted cash. We realized a net loss associated with such repurchases of $27 million for the year ended December 31, 2011.
Settlement of Mortgage Note
We owned a partially vacant net lease property located in Cincinnati, Ohio. In November 2010, the mortgage lender declared a payment default and, in December 2010, began foreclosure proceedings on the property. In April 2011, we transferred the property to the lender. We paid the lender $3 million mainly for settlement of certain tenant improvements and leasing commission obligations, which was recorded in realized gain (loss) on investments or other in the consolidated statement of operations.
CMBS Facility
In October 2011, we, through one of our wholly-owned subsidiaries, entered into a master repurchase and securities contract, or the CMBS Facility, with Wells Fargo. The $100 million CMBS Facility finances the acquisition of AAA-rated CMBS and has an initial term of two years with a one-year extension option at our election subject to certain conditions. Borrowings accrue interest at a per annum pricing rate equal to 1.65%, subject to adjustment. We paid an upfront fee of 0.5% based on the total commitment and will not incur any unused fees.
As of December 31, 2011, we purchased $73 million principal amount of CMBS with a weighted average yield of 4.1% initially financed with $66 million at a weighted average financing cost over the expected life of 1.9%, resulting in an expected return on invested equity of over 20%.
CRE Debt Facility
In November 2011, we, through one of our wholly-owned subsidiaries, entered into a master repurchase and securities contract, or Loan Facility, with Wells Fargo. The $100 million Loan Facility will be used to finance the origination of CRE first mortgage loans and has an initial term of two years with two one-year extension option at our election. Borrowings accrue interest at a range of LIBOR
94
Table of Contents
plus 2.25% to 3.00% per annum with advance rates of up to 75%, depending on asset type and characteristics. We paid an upfront fee of 0.5% of the total commitment and will not incur any unused fees. We have no outstanding borrowings with respect to the Loan Facility as of December 31, 2011.
The Loan Facility and CMBS Facility contain a liquidity covenant that requires us to maintain an aggregate of $45 million of unrestricted cash to provide credit support for the borrowings.
Cash Flows
Year ended December 31, 2011 compared to year ended December 31, 2010
Net cash provided by operating activities was $64 million for the year ended December 31, 2011 compared to $36 million for the year ended December 31, 2010. The increase in net cash provided was primarily due to higher net cash received from CSE CDO and new investments made in 2011, partially offset by increased overhead related to our newly formed broker-dealer subsidiary.
Net cash provided by investing activities was $221 million for the year ended December 31, 2011 compared to $119 million for the year ended December 31, 2010. The primary sources of cash flow were the sale of real estate debt investments and repayments from real estate debt and securities and the proceeds from sales of operating real estate, partially offset by originations and acquisitions of real estate debt investments.
Net cash (used in) financing activities was $266 million for the year ended December 31, 2011 compared to $168 million for the year ended December 31, 2010. The primary uses in 2011 were the debt repurchases and repayments of $781 million, the repayment of the $100 million preferred membership interest in NRF Healthcare, swap settlement of $27 million, payment of dividends (common and preferred) of $60 million; offset by sources from the issuance of $173 million of the 7.5% exchangeable senior notes, $73 million from common stock offering, $165 million of borrowings on mortgage notes, credit facilities and CDO bonds payable and $273 million from other sources of financing. The primary source of cash flow (used in) financing activities in 2010 was the repayment of a secured term loan, and CDO bonds payable, partially offset by proceeds from the sale of exchangeable notes.
Year ended December 31, 2010 compared to year ended December 31, 2009
The net cash provided by operating activities was $36 million for the year ended December 31, 2010 compared to $55 million for the December 31, 2009. The decrease was primarily due to increased overhead in 2010 from our newly formed broker-dealer subsidiary, the deconsolidation of our healthcare management business, the maturity of a $500 million interest rate swap in the second half of 2009 under which we paid one-month LIBOR and received a 3.03% fixed rate and lower spreads on our CRE debt investments which decreased interest income generated from our asset base. The decrease was partially offset by interest income from the CSE CDO and the N-Star CDO IX.
The net cash flow provided by investing activities was $119 million for the year ended December 31, 2010 compared to $123 million for the year ended December 31, 2009. The primary source of cash flow in 2010 was proceeds from the sale of real estate debt investments, real estate debt repayments and the disposition of real estate securities. The primary sources of cash flow in 2009 were proceeds from the sale and repayments of real estate securities and real estate debt investments and proceeds from the sale of a portfolio of healthcare-related net lease properties.
The net cash flow used by financing activities was $168 million for the year ended December 31, 2010 compared to $173 million for the year ended December 31, 2009. The primary use of cash flow in 2010 was the repayment of our secured term loan and certain of our CDO bonds payable. The primary use of cash flow in 2009 was related to repayments on our secured term loan, mortgage notes and credit facilities and CDO bond repurchases and repayments.
95
Table of Contents
Contractual Obligations and Commitments
As of December 31, 2011, we had the following contractual obligations and commitments (amounts in thousands):
| | | | | | | | | | | | | | | | |
| | Payments Due by Period | |
|---|
| | Total | | 1 year or less | | 2-3 years | | 4-5 years | | After 5 years | |
|---|
Contractual Obligations: | | | | | | | | | | | | | | | | |
CDO bonds payable | | $ | 4,125,769 | | $ | — | | $ | — | | $ | — | | $ | 4,125,769 | |
Mortgage notes payable | | | 783,257 | | | 22,985 | | | 53,515 | | | 232,882 | | | 473,875 | |
Credit facility | | | 64,259 | | | | | | 64,259 | | | — | | | — | |
Secured term loans | | | 14,682 | | | — | | | 14,682 | | | — | | | — | |
Exchangeable senior notes(1) | | | 228,665 | | | 20,455 | | | 35,710 | | | 172,500 | | | — | |
Junior subordinated notes | | | 280,117 | | | — | | | — | | | — | | | 280,117 | |
Operating leases | | | 59,031 | | | 6,557 | | | 12,764 | | | 12,222 | | | 27,488 | |
Outstanding unfunded commitments(2) | | | 55,658 | | | 40,666 | | | 12,566 | | | 2,326 | | | 100 | |
Estimated interest payments(3) | | | 523,975 | | | 125,627 | | | 226,886 | | | 142,372 | | | 29,090 | |
| | | | | | | | | | | | |
Total contractual obligations | | $ | 6,135,413 | | $ | 216,290 | | $ | 420,382 | | $ | 562,302 | | $ | 4,936,439 | |
| | | | | | | | | | | | |
- (1)
- The 7.25% Notes and 7.50% Notes have a final maturity date of June 15, 2027 and March 15, 2031, respectively. The above table reflects the holders' repurchase rights which may require us to repurchase the 7.25% Notes and 7.50% Notes on June 15, 2012 and March 15, 2016, respectively.
- (2)
- Our future funding commitments, which are subject to certain conditions that borrowers must meet to qualify for such fundings, of which a minimum of $52 million will be funded within our existing CDOs. Fundings are categorized by estimated funding period. Assuming that all debt investments that have future fundings meet the terms to qualify for such funding, our equity requirement on the remaining future funding requirements would be $4 million over the next four years.
- (3)
- Estimated interest payments are based on the weighted average life of the borrowings. Applicable LIBOR convention plus the respective spread as of December 31, 2011 was used to estimate payments for our floating-rate debt.
We are currently in compliance with all covenants of our borrowing arrangements.
Off Balance Sheet Arrangements
We have the following arrangements which do not meet the definition of off-balance sheet arrangements, but do have some of the characteristics of off-balance sheet arrangements. We have made investments in various unconsolidated ventures. See "Note 8. Investment in and Advances to Unconsolidated Ventures" for a discussion of such unconsolidated ventures in our consolidated financial statements. In each case, our exposure to loss is limited to the carrying value of our investment.
Related Party Transactions
Advisory and Other Fees
We have agreements with each of our N-Star CDOs and the CSE and CapLease CDOs to perform certain advisory services. The advisory fee income related to all of the CDO financing transactions are eliminated as a result of the consolidation of the respective CDO financing transactions.
We have an agreement with NSREIT to manage its day-to-day affairs, including identifying, originating and acquiring investments on behalf of NSREIT. We earn fees for our advisory services. For
96
Table of Contents
the years ended December 31, 2011 and 2010, we earned $1 million and an immaterial amount of fees on these agreements, respectively. Additionally, we incur costs on behalf of NSREIT and Senior Care which are reimbursed subsequently to us by these managed entities. As of December 31, 2011, we had unreimbursed costs of $4 million from NSREIT and $2 million from Senior Care.
Legacy Fund
We have two real estate debt investments with a subsidiary of Legacy Partners Realty Fund I, LLC, or the Legacy Fund, as borrower. One loan of $15 million matures in April 2013 and has two one-year extension options. The total interest rate is LIBOR + 7.50%, of which LIBOR + 3.00% is current pay. The other loan of $19.2 million had an initial maturity of January 2012 and is in the process of being modified. One of our directors, Preston Butcher, is the chairman of the board of directors and chief executive officer and owns a significant interest in Legacy Partners Commercial, LLC, which indirectly owns an equity interest in, and owns the manager of, the Legacy Fund. In addition, we lease office space in Colorado with an affiliate of Legacy Fund under an operating lease through December 18, 2015. We have the option to renew the lease for an additional five years.
Hard Rock Hotel Loan
We own an $89 million mezzanine loan backed by the Hard Rock Hotel and Casino in Las Vegas, Nevada. Prior to a modification of the loan in March 2011, Morgans Hotel Group, or Morgans, was a minority partner in the joint venture owning the hotel. David Hamamoto, our chairman and chief executive officer, is the executive chairman of the board of Morgans. Morgans no longer has any interest in the hotel.
Recent Developments
Dividends
On February 15, 2012, we declared a dividend of $0.135 per share of common stock. The common stock dividend will be paid on March 2, 2012 to stockholders of record as of the close of business on February 27, 2012. On January 30, 2012, we declared a dividend of $0.54688 per share of Series A preferred stock and $0.51563 per share of Series B preferred stock. The Series A and Series B preferred dividends were paid on February 15, 2012, to the stockholders of record as of the close of business on February 9, 2012.
Inflation
We believe that most inflationary increases in expenses will be offset by the expense reimbursements and contractual rent increases described below assuming we maintain high occupancy. The tenant leases to our net lease properties are either:
- •
- net leases where the tenants are responsible for all or a significant portion of the real estate taxes, insurance and operating expenses and the leases provide for increases in rent either based on changes in the Consumer Price Index, or CPI, or pre-negotiated increases; or
- •
- operating leases which provide for separate escalations of real estate taxes and operating expenses over a base amount, and/or increases in the base rent based on changes in the CPI.
We believe that the risk associated with an increase in market interest rates on the floating-rate debt used to finance our assets in our CDO financing transactions and our direct investments in real estate debt, will be largely offset by our strategy of matching the terms of our assets with the terms of our liabilities and through our use of hedging instruments.
97
Table of Contents
Refer to "Quantitative and Qualitative Disclosures About Market Risk" in Item 7A. for additional details.
Non-GAAP Financial Measures
Funds from Operations and Adjusted Funds from Operations
Management believes that funds from operations, or FFO, and AFFO, each of which are non-GAAP measures, are additional appropriate measures of the operating performance of a REIT and of us in particular. We compute FFO in accordance with the standards established by the National Association of Real Estate Investment Trusts, or NAREIT, as net income or loss (computed in accordance with generally accepted accounting principles), excluding gains or losses from sales of depreciable properties, the cumulative effect of changes in accounting principles, real estate-related depreciation and amortization, and after adjustments for unconsolidated ventures. NAREIT recently clarified its computation of FFO to exclude impairment charges on depreciable property owned directly or indirectly. FFO, as defined by NAREIT, is a computation made by analysts and investors to measure a real estate company's cash flow generated by operations.
We calculate AFFO by subtracting from (or adding to) FFO:
- •
- normalized recurring expenditures that are capitalized by us and then amortized, but which are necessary to maintain our properties and revenue stream, e.g., leasing commissions and tenant improvement allowances;
- •
- an adjustment to reverse the effects of the straight-lining of rent income and expense and fair value lease revenue;
- •
- the amortization or accrual of various deferred costs including intangible assets and equity-based compensation;
- •
- an adjustment to reverse the effects of unrealized gains (losses); and
- •
- an adjustment to reverse the effects of acquisition gains or losses.
Our calculation of AFFO differs from the methodology used for calculating AFFO by certain other REITs and, accordingly, our AFFO may not be comparable to AFFO reported by other REITs. Our management utilizes FFO and AFFO as measures of our operating performance, and believes they are also useful to investors, because they facilitate an understanding of our operating performance after adjustment for certain non-cash expenses, such as real estate depreciation, which assumes that the value of real estate assets diminishes predictably over time and, in the case of AFFO, equity-based compensation. Additionally, FFO and AFFO serve as measures of our operating performance because they facilitate evaluation of our company without the effects of selected items required in accordance with U.S. GAAP that may not necessarily be indicative of current operating performance and that may not accurately compare our operating performance between periods. Furthermore, although FFO, AFFO and other supplemental performance measures are defined in various ways throughout the REIT industry, we also believe that FFO and AFFO may provide us and our investors with an additional useful measure to compare our financial performance to certain other REITs.
Neither FFO nor AFFO is equivalent to net income or cash generated from operating activities determined in accordance with U.S. GAAP. Furthermore, FFO and AFFO do not represent amounts available for management's discretionary use because of needed capital replacement or expansion, debt service obligations or other commitments or uncertainties. Neither FFO nor AFFO should be considered as an alternative to net income as an indicator of our operating performance or as an alternative to cash flow from operating activities as a measure of our liquidity.
98
Table of Contents
Set forth below is a reconciliation of FFO and AFFO to income (loss) from continuing operations before non-controlling interest in our Operating Partnership for years ended December 31, 2011, 2010 and 2009 (amounts in thousands):
| | | | | | | | | | |
| | Year Ended December 31, | |
|---|
| | 2011 | | 2010 | | 2009 | |
|---|
Funds from Operations: | | | | | | | | | | |
Income (loss) from continuing operations | | $ | (258,434 | ) | $ | (391,163 | ) | $ | (153,544 | ) |
Non-controlling interests(1) | | | (7,165 | ) | | (10,845 | ) | | (9,555 | ) |
| | | | | | | | |
Net income (loss) before non-controlling interest in Operating Partnership | | | (265,599 | ) | | (402,008 | ) | | (163,099 | ) |
Adjustments: | | | | | | | | | | |
Preferred stock dividends | | | (20,925 | ) | | (20,925 | ) | | (20,925 | ) |
Depreciation and amortization | | | 41,156 | | | 31,466 | | | 39,074 | |
Funds from discontinued operations | | | (499 | ) | | 1,759 | | | 7,988 | |
Real estate depreciation and amortization, unconsolidated ventures | | | 853 | | | 948 | | | 1,088 | |
| | | | | | | | |
Funds from Operations(2) | | | (245,014 | ) | | (388,760 | ) | | (135,874 | ) |
| | | | | | | | |
Adjusted Funds from Operations: | | | | | | | | | | |
Funds from Operations | | | (245,014 | ) | | (388,760 | ) | | (135,874 | ) |
Straight-line rental income, net | | | (2,762 | ) | | (1,427 | ) | | (2,276 | ) |
Straight-line rental income/expense and fair value lease revenue, unconsolidated ventures | | | 930 | | | (81 | ) | | (143 | ) |
Amortization of above/below market leases | | | (891 | ) | | (905 | ) | | (801 | ) |
Amortization of equity-based compensation | | | 11,682 | | | 16,991 | | | 20,474 | |
Unrealized (gain) loss from fair value adjustments | | | 385,513 | | | 437,691 | | | 188,887 | |
Unrealized loss from fair value adjustments, unconsolidated ventures | | | — | | | 3,357 | | | 12,276 | |
Gain from acquisitions | | | (89 | ) | | (15,363 | ) | | — | |
| | | | | | | | |
Adjusted Funds from Operations(2) | | $ | 149,369 | | $ | 51,503 | | $ | 82,543 | |
| | | | | | | | |
- (1)
- Amount excludes non-controlling limited partner interests in our Operating Partnership.
- (2)
- Pursuant to the recent change to FFO, when adding back impairment on depreciable real estate, FFO and AFFO would have been $(382.3) million and $57.9 million, respectively, for the year ended December 31, 2010.
Item 7A. Quantitative and Qualitative Disclosures About Market Risk
We are primarily subject to interest rate risk and credit risk. These risks are dependent on various factors beyond our control, including monetary and fiscal policies, domestic and international economic conditions and political considerations. Our market risk sensitive assets, liabilities and related derivative positions are held for investment and not for trading purposes.
Interest Rate Risk
Changes in interest rates affect our net interest income, which is the difference between the income earned on assets and the interest expense incurred in connection with our borrowings and hedges.
Our debt and security investments bear interest at either a floating or fixed-rate. The interest rates on our floating-rate assets typically float at a fixed spread over an index such as LIBOR, and typically
99
Table of Contents
reprice every 30 days based on LIBOR in effect at the time. Given the frequent and periodic repricing of our floating-rate assets, changes in benchmark interest rates are unlikely to materially affect the value of our floating-rate portfolio. Changes in short-term rates will, however, affect income from our investments.
Our general financing strategy has focused on the use of "match-funded" structures. This means that we seek to align the maturities of our liabilities with the maturities on our assets in order to manage the risks of being forced to refinance our liabilities prior to the maturities of our assets. Substantially all of our investments are financed with either CDO borrowings or non-recourse mortgage notes. In addition, we match interest rates on our assets with like-kind borrowings, so fixed-rate assets are financed with fixed-rate borrowings and floating-rate assets are financed with floating-rate borrowings, directly or indirectly through the use of interest rate swaps, caps and other financial instruments or through a combination of these strategies. We are subject to interest rate risk because on certain investments, we maintain a net floating-rate asset position, and therefore our income will increase with increases in interest rates, and decrease with declines in interest rates. As of December 31, 2011, a hypothetical 100 basis point increase in interest rates applied to our variable-rate assets would increase annual interest income by $26 million offset by an increase in interest expense of $22 million on our variable-rate liabilities.
Changes in interest rates could affect the value of our fixed-rate real estate debt and security investments and our net lease properties. For example, increasing interest rates would result in a higher required yield on investments, which would decrease the value on existing fixed-rate assets in order to adjust their yields to current market levels. In addition, the value of our net lease properties may be influenced by changes in interest rates and credit spreads (as discussed below) because value is typically derived by discounting expected future cash flows generated by the property using interest rates (such as the 10-year U.S. Treasury Note yield) plus a risk premium based on the property type and creditworthiness of the tenants. Lower risk-free rates generally result in lower discount rates and therefore higher valuations, and vice versa, although the scarcity of financing for net lease properties and investor concerns over commercial real estate generally have recently decreased commercial real estate valuations, including valuations for net lease properties.
Changes in interest rates and credit spreads may also impact our net book value as almost all of our investments in real estate securities are marked-to-market each quarter with changes in fair value reflected in unrealized gains (losses). Generally, as interest rates increase, the value of fixed-rate securities within our CDO financing transaction, such as CMBS, decreases and as interest rates decrease, the value of these securities will increase. Conversely, we mark our CDO borrowings and related interest rate swaps to market which may cause a partial offset to the income and balance sheet impact of marking the real estate securities to market. Additionally, changes in unrealized gains (losses) do not directly affect our operating cash flows or our ability to pay a dividend to stockholders. Changes in fair value of our real estate securities portfolio could impact our ability to realize gains on such securities.
We use derivative instruments primarily to manage interest rate exposure. These derivatives are typically in the form of interest rate swap agreements and the primary objective is to minimize interest rate risks associated with our investments and financing activities. The counterparties of these arrangements are major financial institutions with which we may also have other financial relationships. We are exposed to credit risk in the event of non-performance by these counterparties and we monitor their financial condition. As of December 31, 2011, our counterparties do not hold any cash margin as collateral against our swap contracts. As of December 31, 2011, all of our derivatives do not qualify for hedge accounting treatment, therefore, gains (losses) resulting from their fair value measurement at the end of each reporting period are recognized as an increase or decrease in unrealized gain (loss) on investments and other in our consolidated statements of operations. In addition, we are, and may in the future be, subject to additional expense based on the notional amount of the derivatives and a specified
100
Table of Contents
spread over LIBOR. Because the fair value of these instruments can vary significantly between periods, we may experience significant fluctuations in the amount of our unrealized gain (loss) in any given period. During the year ended December 31, 2011, we recognized $38 million of unrealized loss from derivative.
Credit Spread Risk
The value of our fixed and floating-rate investments also change with market credit spreads. This means that when market-demanded risk premiums, or credit spreads, increase, the value of our fixed and floating-rate assets decrease and vice versa. The fixed-rate securities, debt investments and net lease properties are valued based on a market credit spread over the rate payable on fixed rate U.S. Treasury of like maturity. This means that their value is dependent on the yield demanded on such assets by the market, based on their credit relative to U.S. Treasuries. The floating-rate security and debt investments are valued based on a market credit spread over LIBOR. Excessive supply of these investments combined with reduced demand will generally cause the market to require a higher yield on these investments, resulting in the use of a higher or "wider" spread over the benchmark rate (usually the applicable U.S. Treasury yield) to value these assets. Under these conditions, the value of our portfolio should decrease. Conversely, if the spread used to value these assets were to decrease or "tighten," the value of these assets should increase.
Market credit spreads are currently much wider than existed at the time we originated or acquired a majority of our investments. These market spreads imply that investment for which we did not elect fair value option, primarily our real estate debt and net lease investments, may be worth less than the amounts at which we carry these investments on our consolidated balance sheet. However, we typically financed these investments with borrowings priced in similar credit environment and intend to hold them to maturity, and therefore, we do not believe that intra- and inter-period changes in value caused by changing credit spreads materially impacts the economics associated with our investment.
Credit Risk
Credit risk in our real estate debt and security investments relates to each individual borrower's ability to make required interest and principal payments on scheduled due dates. We seek to manage credit risk through a comprehensive credit analysis prior to making an investment, actively monitoring our asset portfolio and the underlying credit quality of our holdings and subordination and diversification of our portfolio. Our analysis is based on a broad range of real estate, financial, economic and borrower-related factors which we believe are critical to the evaluation of credit risk inherent in a transaction.
CMBS investments financed with our credit facility are AAA-rated while most of our other CMBS investments are generally junior in right of payment of interest and principal to one or more senior classes, but benefit from the support of one or more subordinate classes of securities or other form of credit support within a securitization transaction. Further, to the extent we become the controlling classholder in the future for a CMBS investment, we expect that we would appoint ourselves special servicer which would enable us more control over restructuring of underlying collateral within a securitization. The senior unsecured REIT debt we invest in reflects comparable credit risk. The underlying real estate securities to our CDO note investments are diversified by asset type, industry, location and issuer. We further seek to minimize credit risk by monitoring the CDO note investments and the underlying credit quality of their holdings. Our debt investments are collateral dependent, meaning the principal source of repayment is from a sale or refinancing of the collateral securing our debt. In the event that a borrower cannot repay our debt, we may exercise our remedies under the debt agreements, which may include a foreclosure against the collateral. We describe many of the options available to us in this situation in "Risk Management" section of this 10-K. To the extent the value of our collateral exceeds the amount of our debt (including all debt senior to us) and the expense we
101
Table of Contents
incur in collecting the debt, we would collect 100% of our debt amount. To the extent the amount of our debt investments plus all senior debt to our position exceeds the realizable value to our collateral, then we would incur a loss.
We are subject to the credit risk of the corporate lessee of our net lease properties, including the operators of healthcare properties. We undertake a rigorous credit evaluation of each tenant and healthcare operator prior to acquiring net lease properties. This analysis includes an extensive due diligence investigation of the tenant's business as well as assessment of the strategic importance of the underlying real estate to the tenant's core business operations. Where appropriate, we may seek to augment the tenant's commitment to the facility by structuring various credit enhancement mechanisms into the underlying leases. These mechanisms could include security deposit requirements or guarantees from entities we deem creditworthy. In addition, we actively monitor lease coverage at each facility within our healthcare portfolio. However, a portion of our portfolio derives revenues from government sources, notably Medicaid or Medicare. Recently announced and potential future changes to these programs may have a material impact on the valuation and financial performance of this portion of our portfolio.
102
Table of Contents
Item 8. Financial Statements and Supplementary Data
The consolidated financial statements of NorthStar Realty Finance Corp. and the notes related to the foregoing consolidated financial statements, together with the independent registered public accounting firm's reports thereon are included in this Item 8.
INDEX TO CONSOLIDATED FINANCIAL STATEMENTS
NORTHSTAR REALTY FINANCE CORP. AND SUBSIDIARIES
| | |
| | Page |
|---|
Reports of Independent Registered Public Accounting Firm | | 104 |
Consolidated Balance Sheets as of December 31, 2011 and 2010 | | 106 |
Consolidated Statements of Operations for the years ended December 31, 2011, 2010 and 2009 | | 107 |
Consolidated Statements of Comprehensive Income (Loss) for the years ended December 31, 2011, 2010 and 2009 | | 108 |
Consolidated Statements of Equity for the years ended December 31, 2011, 2010 and 2009 | | 109 |
Consolidated Statements of Cash Flows for the years ended December 31, 2011, 2010 and 2009 | | 110 |
Notes to Consolidated Financial Statements | | 112 |
Schedule II—Valuation and Qualifying Accounts and Reserves | | 173 |
Schedule III—Real Estate and Accumulated Depreciation as of December 31, 2011 | | 174 |
Schedule IV—Mortgage Loans on Real Estate as of December 31, 2011 | | 180 |
103
Table of Contents
REPORT OF INDEPENDENT REGISTERED PUBLIC ACCOUNTING FIRM
Board of Directors and Stockholders
NorthStar Realty Finance Corp.
We have audited the accompanying consolidated balance sheets of NorthStar Realty Finance Corp. and subsidiaries (the "Company") as of December 31, 2011 and 2010, and the related consolidated statements of operations, equity, comprehensive income (loss) and cash flows for each of the three years in the period ended December 31, 2011. Our audits of the basic financial statements included the financial statement schedules, (Schedules II, III and IV) listed in the Index at Item 15 of the financial statements. These financial statements and financial statement schedules are the responsibility of the Company's management. Our responsibility is to express an opinion on these financial statements and financial statement schedules based on our audits.
We conducted our audits in accordance with the standards of the Public Company Accounting Oversight Board (United States). Those standards require that we plan and perform the audits to obtain reasonable assurance about whether the financial statements are free of material misstatement. An audit includes examining, on a test basis, evidence supporting the amounts and disclosures in the financial statements. An audit also includes assessing the accounting principles used and significant estimates made by management, as well as evaluating the overall financial statement presentation. We believe that our audits provide a reasonable basis for our opinion.
In our opinion, the consolidated financial statements referred to above present fairly, in all material respects, the financial position of NorthStar Realty Finance Corp. and subsidiaries as of December 31, 2011 and 2010, and the results of their operations and their cash flows for each of the three years in the period ended December 31, 2011, in conformity with accounting principles generally accepted in the United States of America. Also in our opinion, the related financial statement schedules, when considered in relation to the basic financial statements taken as a whole, present fairly, in all material respects, the information set forth therein.
We also have audited, in accordance with the standards of the Public Company Accounting Oversight Board (United States), the effectiveness of NorthStar Realty Finance Corp. and subsidiaries' internal control over financial reporting as of December 31, 2011, based on criteria established in Internal Control—Integrated Framework issued by the Committee of Sponsoring Organizations of the Treadway Commission and our report dated February 17, 2012 expressed an unqualified opinion thereon.
/s/ GRANT THORNTON LLP
New York, New York
February 17, 2012
104
Table of Contents
REPORT OF INDEPENDENT REGISTERED PUBLIC ACCOUNTING FIRM
Board of Directors and Stockholders
NorthStar Realty Finance Corp.
We have audited NorthStar Realty Finance Corp. and subsidiaries' (the "Company") internal control over financial reporting as of December 31, 2011, based on criteria established inInternal Control—Integrated Framework issued by the Committee of Sponsoring Organizations of the Treadway Commission (COSO). The Company's management is responsible for maintaining effective internal control over financial reporting and for its assessment of the effectiveness of internal control over financial reporting, included in the accompanying Management's Annual Report on Internal Control over Financial Reporting. Our responsibility is to express an opinion on the Company's internal control over financial reporting based on our audit.
We conducted our audit in accordance with the standards of the Public Company Accounting Oversight Board (United States). Those standards require that we plan and perform the audit to obtain reasonable assurance about whether effective internal control over financial reporting was maintained in all material respects. Our audit of internal control included obtaining an understanding of internal control over financial reporting, assessing the risk that a material weakness exists, testing and evaluating the design and operating effectiveness of internal control based on the assessed risk, and performing such other procedures as we considered necessary in the circumstances. We believe that our audit provides a reasonable basis for our opinion.
A company's internal control over financial reporting is a process designed to provide reasonable assurance regarding the reliability of financial reporting and the preparation of financial statements for external purposes in accordance with generally accepted accounting principles. A company's internal control over financial reporting includes those policies and procedures that (1) pertain to the maintenance of records that, in reasonable detail, accurately and fairly reflect the transactions and dispositions of the assets of the company; (2) provide reasonable assurance that transactions are recorded as necessary to permit preparation of financial statements in accordance with generally accepted accounting principles, and that receipts and expenditures of the company are being made only in accordance with authorizations of management and directors of the company; and (3) provide reasonable assurance regarding prevention or timely detection of unauthorized acquisition, use, or disposition of the company's assets that could have a material effect on the financial statements.
Because of its inherent limitations, internal control over financial reporting may not prevent or detect misstatements. Also, projections of any evaluation of effectiveness to future periods are subject to the risk that controls may become inadequate because of changes in conditions, or that the degree of compliance with the policies or procedures may deteriorate.
In our opinion, NorthStar Realty Finance Corp. and subsidiaries maintained, in all material respects, effective internal control over financial reporting as of December 31, 2011, based on criteria established inInternal Control—Integrated Framework issued by COSO.
We also have audited, in accordance with the standards of the Public Company Accounting Oversight Board (United States), the consolidated balance sheets of NorthStar Realty Finance Corp. and subsidiaries' as of December 31, 2011 and 2010 and the related consolidated statements of operations, equity, comprehensive income (loss) and cash flows for each of the three years in the period ended December 31, 2011, and our report dated February 17, 2012 expressed an unqualified opinion thereon.
/s/ GRANT THORNTON LLP
New York, New York
February 17, 2012
105
Table of Contents
NORTHSTAR REALTY FINANCE CORP. AND SUBSIDIARIES
CONSOLIDATED BALANCE SHEETS
(Amounts in Thousands, Except Share Data)
| | | | | | | |
| | December 31,
2011 | | December 31,
2010 | |
|---|
Assets | | | | | | | |
VIE Financing Structures | | | | | | | |
Restricted cash | | $ | 261,295 | | $ | 263,314 | |
Operating real estate, net | | | 313,227 | | | — | |
Real estate securities, available for sale | | | 1,358,282 | | | 1,687,793 | |
Real estate debt investments, net | | | 1,631,856 | | | 1,668,188 | |
Real estate debt investments, held for sale | | | — | | | 18,661 | |
Investments in and advances to unconsolidated ventures | | | 60,352 | | | 72,536 | |
Receivables, net of allowance of $1,179 in 2011 and $824 in 2010 | | | 22,530 | | | 26,419 | |
Derivative assets, at fair value | | | 61 | | | 42 | |
Deferred costs and intangible assets, net | | | 47,499 | | | — | |
Assets of properties held for sale | | | 3,198 | | | 13,141 | |
Other assets | | | 23,135 | | | 15,059 | |
| | | | | | |
| | | 3,721,435 | | | 3,765,153 | |
| | | | | | |
Non-VIE Financing Structures | | | | | | | |
Cash and cash equivalents | | | 144,508 | | | 125,439 | |
Restricted cash | | | 37,069 | | | 46,070 | |
Operating real estate, net | | | 776,222 | | | 938,062 | |
Real estate securities, available for sale | | | 115,023 | | | 3,261 | |
Real estate debt investments, net | | | 78,726 | | | 153,576 | |
Investments in and advances to unconsolidated ventures | | | 33,205 | | | 27,456 | |
Receivables, net of allowance of $0 in 2011 and $1,818 in 2010 | | | 8,958 | | | 5,910 | |
Receivables, related parties | | | 5,979 | | | 3,377 | |
Unbilled rent receivable | | | 11,891 | | | 10,404 | |
Derivative assets, at fair value | | | 5,674 | | | 17 | |
Deferred costs and intangible assets, net | | | 50,885 | | | 56,665 | |
Other assets | | | 16,862 | | | 16,601 | |
| | | | | | |
| | | 1,285,002 | | | 1,386,838 | |
| | | | | | |
Total assets | | $ | 5,006,437 | | $ | 5,151,991 | |
| | | | | | |
Liabilities | | | | | | | |
VIE Financing Structures | | | | | | | |
CDO bonds payable | | $ | 2,273,907 | | $ | 2,258,805 | |
Mortgage notes payable | | | 228,525 | | | — | |
Secured term loan | | | 14,682 | | | 14,682 | |
Accounts payable and accrued expenses | | | 15,754 | | | 15,668 | |
Escrow deposits payable | | | 52,660 | | | 60,163 | |
Derivative liabilities, at fair value | | | 226,481 | | | 190,993 | |
Liabilities of properties held for sale | | | — | | | 131 | |
Other liabilities | | | 55,007 | | | 8,654 | |
| | | | | | |
| | | 2,867,016 | | | 2,549,096 | |
| | | | | | |
Non-VIE Financing Structures | | | | | | | |
Mortgage notes payable | | | 554,732 | | | 803,114 | |
Credit facility | | | 64,259 | | | — | |
Secured term loan | | | — | | | 22,199 | |
Exchangeable senior notes | | | 215,853 | | | 126,889 | |
Junior subordinated notes, at fair value | | | 157,168 | | | 191,250 | |
Accounts payable and accrued expenses | | | 50,868 | | | 34,151 | |
Escrow deposits payable | | | 196 | | | 548 | |
Derivative liabilities, at fair value | | | 8,193 | | | 29,696 | |
Other liabilities | | | 48,538 | | | 22,535 | |
| | | | | | |
| | | 1,099,807 | | | 1,230,382 | |
| | | | | | |
Total liabilities | | | 3,966,823 | | | 3,779,478 | |
| | | | | | |
Contingently redeemable non-controlling interest | | | — | | | 94,822 | |
Commitments and contingencies (see Note 15) | | | | | | | |
Equity | | | | | | | |
NorthStar Realty Finance Corp. Stockholders' Equity | | | | | | | |
Preferred stock, $250,000 aggregate liquidation preference as of December 31, 2011 and 2010 | | | 241,372 | | | 241,372 | |
Common stock, $0.01 par value, 500,000,000 shares authorized, 96,044,383 and 78,104,753 shares issued and outstanding at December 31, 2011 and 2010, respectively | | | 960 | | | 781 | |
Additional paid-in capital | | | 809,826 | | | 723,102 | |
Retained earnings (accumulated deficit) | | | (8,626 | ) | | 293,382 | |
Accumulated other comprehensive income (loss) | | | (36,160 | ) | | (36,119 | ) |
| | | | | | |
Total NorthStar Realty Finance Corp. stockholders' equity | | | 1,007,372 | | | 1,222,518 | |
Non-controlling interests | | | 32,242 | | | 55,173 | |
| | | | | | |
Total equity | | | 1,039,614 | | | 1,277,691 | |
| | | | | | |
Total liabilities and equity | | $ | 5,006,437 | | $ | 5,151,991 | |
| | | | | | |
See accompanying notes to consolidated financial statements.
106
Table of Contents
NORTHSTAR REALTY FINANCE CORP. AND SUBSIDIARIES
CONSOLIDATED STATEMENTS OF OPERATIONS
(Amounts in Thousands, Except Share and Per Share Data)
| | | | | | | | | | |
| | Year Ended December 31, | |
|---|
| | 2011 | | 2010 | | 2009 | |
|---|
Revenues | | | | | | | | | | |
Interest income | | $ | 398,483 | | $ | 318,792 | | $ | 142,213 | |
Rental and escalation income | | | 112,697 | | | 115,467 | | | 88,997 | |
Commission income | | | 12,024 | | | 2,476 | | | — | |
Other revenue (see Note 10) | | | 4,602 | | | 7,221 | | | 25,438 | |
| | | | | | | | |
Total revenues | | | 527,806 | | | 443,956 | | | 256,648 | |
Expenses | | | | | | | | | | |
Interest expense | | | 142,220 | | | 126,210 | | | 116,133 | |
Real estate properties—operating expenses | | | 22,531 | | | 37,565 | | | 14,560 | |
Asset management expenses | | | 5,538 | | | 4,505 | | | 4,214 | |
Commission expense | | | 9,239 | | | 1,867 | | | — | |
Impairment on operating real estate | | | — | | | 5,249 | | | — | |
Provision for loan losses | | | 52,980 | | | 168,446 | | | 83,745 | |
Provision for loss on equity investment | | | 4,482 | | | — | | | — | |
General and administrative | | | | | | | | | | |
Salaries and equity-based compensation(1) | | | 67,708 | | | 54,828 | | | 47,213 | |
Auditing and professional fees | | | 9,437 | | | 10,503 | | | 9,186 | |
Other general and administrative | | | 18,238 | | | 19,543 | | | 13,028 | |
| | | | | | | | |
Total general and administrative | | | 95,383 | | | 84,874 | | | 69,427 | |
Depreciation and amortization | | | 44,258 | | | 31,466 | | | 39,074 | |
| | | | | | | | |
Total expenses | | | 376,631 | | | 460,182 | | | 327,153 | |
| | | | | | | | |
Income (loss) from operations | | | 151,175 | | | (16,226 | ) | | (70,505 | ) |
Equity in earnings (losses) of unconsolidated ventures | | | (2,738 | ) | | 2,550 | | | (1,524 | ) |
Other income (loss) | | | 4,162 | | | — | | | — | |
Unrealized gain (loss) on investments and other | | | (489,904 | ) | | (538,572 | ) | | (209,976 | ) |
Realized gain (loss) on investments and other | | | 78,782 | | | 145,722 | | | 128,461 | |
Gain from acquisitions | | | 89 | | | 15,363 | | | — | |
| | | | | | | | |
Income (loss) from continuing operations | | | (258,434 | ) | | (391,163 | ) | | (153,544 | ) |
Income (loss) from discontinued operations | | | (1,290 | ) | | (925 | ) | | 3,169 | |
Gain (loss) on sale from discontinued operations | | | 17,198 | | | 2,528 | | | 13,799 | |
| | | | | | | | |
Net income (loss) | | | (242,526 | ) | | (389,560 | ) | | (136,576 | ) |
Less: net (income) loss allocated to non-controlling interests | | | 5,615 | | | 15,019 | | | 6,293 | |
Preferred stock dividends | | | (20,925 | ) | | (20,925 | ) | | (20,925 | ) |
Contingently redeemable non-controlling interest accretion | | | (5,178 | ) | | — | | | — | |
| | | | | | | | |
Net income (loss) attributable to NorthStar Realty Finance Corp. common stockholders | | $ | (263,014 | ) | $ | (395,466 | ) | $ | (151,208 | ) |
| | | | | | | | |
Net income (loss) per share from continuing operations (basic/diluted) | | $ | (3.12 | ) | $ | (5.19 | ) | $ | (2.41 | ) |
Income (loss) per share from discontinued operations (basic/diluted) | | | (0.01 | ) | | (0.01 | ) | | 0.05 | |
Gain per share on sale of discontinued operations (basic/diluted) | | | 0.19 | | | 0.03 | | | 0.20 | |
| | | | | | | | |
Net income (loss) per common share attributable to NorthStar Realty Finance Corp. common stockholders (basic/diluted) | | $ | (2.94 | ) | $ | (5.17 | ) | $ | (2.16 | ) |
| | | | | | | | |
Weighted average number of shares of common stock: | | | | | | | | | | |
Basic | | | 89,348,670 | | | 76,552,702 | | | 69,869,717 | |
| | | | | | | | |
Diluted | | | 93,627,456 | | | 82,842,990 | | | 77,193,083 | |
| | | | | | | | |
- (1)
- The years ended December 31, 2011, 2010 and 2009 include $11.7 million, $17.0 million and $20.5 million, respectively, of equity-based compensation expense. The year ended December 31, 2010 includes $3.5 million of cash compensation expense and $1.0 million of equity-based compensation expense relating to a separation and consulting agreement with a former executive.
See accompanying notes to consolidated financial statements.
107
Table of Contents
NORTHSTAR REALTY FINANCE CORP. AND SUBSIDIARIES
CONSOLIDATED STATEMENTS OF COMPREHENSIVE INCOME (LOSS)
(Amounts in Thousands)
| | | | | | | | | | |
| | Year Ended December 31, | |
|---|
| | 2011 | | 2010 | | 2009 | |
|---|
Net income (loss) | | $ | (242,526 | ) | $ | (389,560 | ) | $ | (136,576 | ) |
Other comprehensive income (loss): | | | | | | | | | | |
Unrealized gain (loss) on real estate securities, available for sale | | | (7,506 | ) | | 13,352 | | | (9,949 | ) |
Change in fair value of derivative instruments | | | — | | | (3,448 | ) | | 6,232 | |
Reclassification adjustment for gains (losses) included in net income (loss) | | | 7,491 | | | 6,605 | | | 5,589 | |
| | | | | | | | |
Total other comprehensive income (loss) | | | (15 | ) | | 16,509 | | | 1,872 | |
Comprehensive income (loss) | | | (242,541 | ) | | (373,051 | ) | | (134,704 | ) |
Less: Comprehensive (income) loss attributable to non-controlling interests | | | 5,590 | | | 13,730 | | | 6,094 | |
| | | | | | | | |
Comprehensive income (loss) attributable to NorthStar Realty Finance Corp. | | $ | (236,951 | ) | $ | (359,321 | ) | $ | (128,610 | ) |
| | | | | | | | |
See accompanying notes to consolidated financial statements.
108
Table of Contents
NORTHSTAR REALTY FINANCE CORP. AND SUBSIDIARIES
CONSOLIDATED STATEMENTS OF EQUITY
(Amounts in Thousands)
| | | | | | | | | | | | | | | | | | | | | | | | | | | | | | | | | | |
| | Preferred Stock | | Common Stock | |
| |
| | Retained
Earnings
(Accumulated
Deficit) | | Accumulated
Other
Comprehensive
Income (Loss) | | Total
NorthStar
Stockholders'
Equity | |
| |
| |
|---|
| | Additional
Paid-in
Capital | | Treasury
Stock | | Non-controlling
Interests | | Total
Equity | |
|---|
| | Shares | | Amount | | Shares | | Amount | |
|---|
Balance at December 31, 2008 | | |
10,000 | |
$ |
241,372 | | |
62,907 | |
$ |
634 | |
$ |
620,028 | |
$ |
(1,384 |
) |
$ |
648,860 | |
$ |
(94,343 |
) |
$ |
1,415,167 | |
$ |
103,771 | |
$ |
1,518,938 | |
Dividend reinvestment and stock purchase plan | | | — | | | — | | | 80 | | | 1 | | | 276 | | | — | | | — | | | — | | | 277 | | | — | | | 277 | |
Stock awards/LTIP awards | | | — | | | — | | | 94 | | | 1 | | | 300 | | | — | | | — | | | — | | | 301 | | | 20,172 | | | 20,473 | |
Restricted share grant | | | — | | | — | | | 15 | | | — | | | 1 | | | — | | | — | | | — | | | 1 | | | — | | | 1 | |
Proceeds from equity distribution agreement | | | — | | | — | | | 7,327 | | | 69 | | | 23,998 | | | 1,384 | | | — | | | — | | | 25,451 | | | — | | | 25,451 | |
Equity component of warrants | | | — | | | — | | | — | | | — | | | 117 | | | — | | | — | | | — | | | 117 | | | — | | | 117 | |
Equity component of exchangeable notes | | | — | | | — | | | — | | | — | | | (4,321 | ) | | — | | | — | | | — | | | (4,321 | ) | | — | | | (4,321 | ) |
Other comprehensive income (loss) | | | — | | | — | | | — | | | — | | | — | | | — | | | — | | | 1,673 | | | 1,673 | | | 199 | | | 1,872 | |
Conversion of LTIP units | | | — | | | — | | | 744 | | | 7 | | | 12,013 | | | — | | | — | | | — | | | 12,020 | | | (12,020 | ) | | — | |
Stock dividends | | | — | | | — | | | 3,716 | | | 37 | | | 10,610 | | | — | | | (9,607 | ) | | — | | | 1,040 | | | (1,040 | ) | | — | |
Cash dividends on common stock | | | — | | | — | | | — | | | — | | | — | | | — | | | (27,133 | ) | | — | | | (27,133 | ) | | (15,957 | ) | | (43,090 | ) |
Cash dividends on preferred stock | | | — | | | — | | | — | | | — | | | — | | | — | | | (20,925 | ) | | — | | | (20,925 | ) | | — | | | (20,925 | ) |
Redemption of membership interest | | | — | | | — | | | — | | | — | | | (214 | ) | | — | | | — | | | — | | | (214 | ) | | — | | | (214 | ) |
Equity in unconsolidated ventures | | | — | | | — | | | — | | | — | | | — | | | — | | | — | | | — | | | — | | | 1,815 | | | 1,815 | |
Net income (loss) | | | — | | | — | | | | | | | | | | | | | | | (130,283 | ) | | — | | | (130,283 | ) | | (6,293 | ) | | (136,576 | ) |
| | | | | | | | | | | | | | | | | | | | | | | | |
Balance at December 31, 2009 | | | 10,000 | | $ | 241,372 | | | 74,883 | | $ | 749 | | $ | 662,808 | | $ | — | | $ | 460,912 | | $ | (92,670 | ) | $ | 1,273,171 | | $ | 90,647 | | $ | 1,363,818 | |
| | | | | | | | | | | | | | | | | | | | | | | | |
VIE consolidation beginning balance adjustments | | | — | | $ | — | | | — | | $ | — | | $ | — | | $ | — | | $ | 110,793 | | $ | 41,332 | | $ | 152,125 | | $ | 30,535 | | $ | 182,660 | |
Acquisition of N-Star IX | | | — | | | — | | | — | | | — | | | — | | | — | | | 147,626 | | | — | | | 147,626 | | | — | | | 147,626 | |
Amortization of equity-based compensation | | | — | | | — | | | — | | | — | | | 17 | | | — | | | — | | | — | | | 17 | | | 16,673 | | | 16,690 | |
Non-controlling interest contribution to joint venture | | | — | | | — | | | — | | | — | | | — | | | — | | | — | | | — | | | — | | | 11,336 | | | 11,336 | |
Dividend reinvestment and stock purchase plan | | | — | | | — | | | 92 | | | 1 | | | 282 | | | — | | | — | | | — | | | 283 | | | — | | | 283 | |
Stock awards/LTIP awards | | | — | | | — | | | 99 | | | 1 | | | 299 | | | — | | | — | | | — | | | 300 | | | — | | | 300 | |
Equity component of warrants | | | — | | | — | | | — | | | — | | | 61 | | | — | | | — | | | — | | | 61 | | | — | | | 61 | |
Other comprehensive income (loss) | | | — | | | — | | | — | | | — | | | — | | | — | | | — | | | 15,219 | | | 15,219 | | | 1,290 | | | 16,509 | |
Conversion of LTIP units | | | — | | | — | | | 3,031 | | | 30 | | | 61,445 | | | — | | | — | | | — | | | 61,475 | | | (61,475 | ) | | — | |
Cash dividends on common stock | | | — | | | — | | | — | | | — | | | — | | | — | | | (30,483 | ) | | — | | | (30,483 | ) | | (8,299 | ) | | (38,782 | ) |
Cash dividends on preferred stock | | | — | | | — | | | — | | | — | | | — | | | — | | | (20,925 | ) | | — | | | (20,925 | ) | | — | | | (20,925 | ) |
Redemption of membership interest | | | — | | | — | | | — | | | — | | | (1,810 | ) | | — | | | — | | | — | | | (1,810 | ) | | 1,800 | | | (10 | ) |
Equity in unconsolidated ventures | | | — | | | — | | | — | | | — | | | — | | | — | | | — | | | — | | | — | | | (1,815 | ) | | (1,815 | ) |
Net income (loss) | | | — | | | — | | | — | | | — | | | — | | | — | | | (374,541 | ) | | — | | | (374,541 | ) | | (25,519 | ) | | (400,060 | ) |
| | | | | | | | | | | | | | | | | | | | | | | | |
Balance at December 31, 2010 | | | 10,000 | | $ | 241,372 | | | 78,105 | | $ | 781 | | $ | 723,102 | | $ | — | | $ | 293,382 | | $ | (36,119 | ) | $ | 1,222,518 | | $ | 55,173 | | $ | 1,277,691 | |
| | | | | | | | | | | | | | | | | | | | | | | | |
Net proceeds from offering of common stock | | | — | | $ | — | | | 17,250 | | $ | 173 | | $ | 69,132 | | $ | — | | $ | — | | $ | — | | $ | 69,305 | | $ | — | | $ | 69,305 | |
Reclassification of equity compensation to liability | | | — | | | — | | | — | | | — | | | — | | | — | | | — | | | — | | | — | | | (2,136 | ) | | (2,136 | ) |
Non-controlling interest contribution to joint venture | | | — | | | — | | | — | | | — | | | — | | | — | | | — | | | — | | | — | | | 144 | | | 144 | |
Non-controlling interest distributions | | | — | | | — | | | — | | | — | | | — | | | — | | | — | | | — | | | — | | | (13,202 | ) | | (13,202 | ) |
Dividend reinvestment and stock purchase plan | | | — | | | — | | | 62 | | | — | | | 264 | | | — | | | — | | | — | | | 264 | | | — | | | 264 | |
Amortization of equity-based compensation | | | — | | | — | | | — | | | — | | | 17 | | | — | | | — | | | — | | | 17 | | | 11,665 | | | 11,682 | |
Contingently redeemable non-controlling interest accretion | | | — | | | — | | | — | | | — | | | — | | | — | | | (5,178 | ) | | — | | | (5,178 | ) | | — | | | (5,178 | ) |
Equity component of exchangeable notes | | | — | | | — | | | — | | | — | | | 10,971 | | | — | | | — | | | — | | | 10,971 | | | — | | | 10,971 | |
Other comprehensive income (loss) | | | — | | | — | | | — | | | — | | | — | | | — | | | — | | | (41 | ) | | (41 | ) | | 26 | | | (15 | ) |
Conversion of LTIP units | | | — | | | — | | | 628 | | | 6 | | | 6,340 | | | — | | | — | | | — | | | 6,346 | | | (6,346 | ) | | — | |
Cash dividends on common stock | | | — | | | — | | | — | | | — | | | — | | | — | | | (38,994 | ) | | — | | | (38,994 | ) | | (1,809 | ) | | (40,803 | ) |
Cash dividends on preferred stock | | | — | | | — | | | — | | | — | | | — | | | — | | | (20,925 | ) | | — | | | (20,925 | ) | | — | | | (20,925 | ) |
Net income (loss) | | | — | | | — | | | — | | | — | | | — | | | — | | | (236,911 | ) | | — | | | (236,911 | ) | | (11,273 | ) | | (248,184 | ) |
| | | | | | | | | | | | | | | | | | | | | | | | |
Balance at December 31, 2011 | | | 10,000 | | $ | 241,372 | | | 96,045 | | $ | 960 | | $ | 809,826 | | $ | — | | $ | (8,626 | ) | $ | (36,160 | ) | $ | 1,007,372 | | $ | 32,242 | | $ | 1,039,614 | |
| | | | | | | | | | | | | | | | | | | | | | | | |
See accompanying notes to consolidated financial statements.
109
Table of Contents
NORTHSTAR REALTY FINANCE CORP. AND SUBSIDIARIES
CONSOLIDATED STATEMENTS OF CASH FLOWS
(Amounts in Thousands)
| | | | | | | | | | |
| | Year Ended | |
|---|
| | 2011 | | 2010 | | 2009 | |
|---|
Cash flows from operating activities: | | | | | | | | | | |
Net income (loss) | | $ | (242,526 | ) | $ | (389,560 | ) | $ | (136,576 | ) |
Adjustments to reconcile net income (loss) to net cash provided by (used in) operating activities: | | | | | | | | | | |
Equity in (earnings) loss of unconsolidated ventures | | | 2,738 | | | (2,550 | ) | | 9,165 | |
Depreciation and amortization | | | 45,061 | | | 34,149 | | | 43,891 | |
Amortization of premium/discount on investments | | | (136,365 | ) | | (82,929 | ) | | (21,900 | ) |
Interest accretion on investments | | | (7,094 | ) | | (1,316 | ) | | (3,632 | ) |
Amortization of deferred financing costs | | | 4,995 | | | 6,096 | | | 5,498 | |
Equity-based compensation | | | 11,682 | | | 16,990 | | | 20,473 | |
Unrealized (gain) loss on investments and other | | | 387,325 | | | 438,585 | | | 188,887 | |
Realized gain on sale of investments and other | | | (95,980 | ) | | (148,459 | ) | | (142,290 | ) |
Gain from acquisitions | | | (89 | ) | | (15,363 | ) | | — | |
Operating real estate impairment | | | — | | | 6,429 | | | — | |
Distributions from unconsolidated ventures | | | 709 | | | 9,097 | | | 419 | |
Amortization of capitalized above/below market leases | | | (957 | ) | | (905 | ) | | (801 | ) |
Accrued loss | | | 20,000 | | | — | | | — | |
Unbilled rent receivable | | | (2,795 | ) | | (1,479 | ) | | (2,225 | ) |
Provision for loss on equity investment | | | 4,482 | | | — | | | — | |
Provision for loan losses | | | 52,980 | | | 168,446 | | | 83,745 | |
Allowance for uncollectable accounts | | | 445 | | | 1,451 | | | 1,554 | |
Changes in assets and liabilities: | | | | | | | | | | |
Restricted cash | | | (1,794 | ) | | (1,699 | ) | | (571 | ) |
Cash received from purchase of equity investment | | | — | | | 2,307 | | | — | |
Receivables | | | 78 | | | 3,882 | | | 5,288 | |
Other assets | | | (3,857 | ) | | 2,102 | | | 2,391 | |
Receivables from related parties | | | (2,510 | ) | | (2,733 | ) | | (1,060 | ) |
Accounts payable and accrued expenses | | | 15,041 | | | (909 | ) | | 2,546 | |
Real estate debt investment origination fees | | | 5,068 | | | 2,639 | | | 939 | |
Other liabilities | | | 7,497 | | | (8,713 | ) | | (1,223 | ) |
| | | | | | | | |
Net cash provided by (used in) operating activities | | | 64,134 | | | 35,558 | | | 54,518 | |
Cash flows from investing activities: | | | | | | | | | | |
Improvement of operating real estate | | | (4,028 | ) | | (1,498 | ) | | (3,597 | ) |
Acquisition of real estate securities, available for sale | | | (348,212 | ) | | (301,259 | ) | | (257,801 | ) |
Proceeds from sale of real estate securities, available for sale | | | 361,873 | | | 302,379 | | | 210,399 | |
Repayments on real estate securities, available for sale | | | 96,959 | | | 68,137 | | | 2,706 | |
Originations/acquisitions of real estate debt investments | | | (284,802 | ) | | (126,069 | ) | | (224,649 | ) |
Repayments on real estate debt investments | | | 306,498 | | | 313,199 | | | 114,536 | |
Proceeds from the sale of real estate debt investments | | | 208,748 | | | 143,665 | | | 140,753 | |
Net proceeds from disposition of operating real estate | | | 130,584 | | | 3,078 | | | 91,546 | |
Restricted cash provided by (used in) investment activities | | | (237,262 | ) | | (284,300 | ) | | 29,064 | |
Purchase of equity interest | | | (10,715 | ) | | (2,195 | ) | | — | |
Deferred costs and intangible assets | | | (1,820 | ) | | (7,495 | ) | | (157 | ) |
Other receivables | | | 4,340 | | | (1,082 | ) | | (2,240 | ) |
Acquisition deposits | | | — | | | — | | | (300 | ) |
Investment in and advances to unconsolidated ventures | | | (2,579 | ) | | (7,332 | ) | | (847 | ) |
Distributions from unconsolidated ventures | | | 986 | | | 19,797 | | | 23,906 | |
| | | | | | | | |
Net cash provided by (used in) investing activities | | | 220,570 | | | 119,025 | | | 123,319 | |
110
Table of Contents
NORTHSTAR REALTY FINANCE CORP. AND SUBSIDIARIES
CONSOLIDATED STATEMENTS OF CASH FLOWS (Continued)
(Amounts in Thousands)
| | | | | | | | | | |
| | Year Ended | |
|---|
| | 2011 | | 2010 | | 2009 | |
|---|
Cash flows from financing activities: | | | | | | | | | | |
Purchase of derivative instruments | | | (8,500 | ) | | (300 | ) | | — | |
Settlement of derivative instruments | | | (27,097 | ) | | (283 | ) | | — | |
Collateral held by derivative counterparties | | | 23,280 | | | 9,189 | | | 2,384 | |
Borrowings of mortgage notes | | | 37,445 | | | 78,200 | | | — | |
Repayments of mortgage notes | | | (221,931 | ) | | (66,267 | ) | | (62,638 | ) |
Borrowings under credit facilities | | | 65,566 | | | — | | | 1,912 | |
Repayments of credit facilities | | | (1,307 | ) | | — | | | (46,794 | ) |
Borrowings under repurchase obligations | | | — | | | — | | | 528 | |
Repayments of repurchase obligations | | | — | | | — | | | (703 | ) |
Proceeds from CDO bonds | | | 64,744 | | | 174,318 | | | 91,000 | |
Repayments of CDO bonds | | | (386,167 | ) | | (271,316 | ) | | (20,693 | ) |
Repurchases of CDO bonds | | | (75,314 | ) | | (17,653 | ) | | (55,567 | ) |
Borrowings under secured term loans | | | — | | | 24,739 | | | 39,570 | |
Repayments of secured term loans | | | (22,199 | ) | | (248,744 | ) | | (76,750 | ) |
Payment of deferred financing costs | | | (12,781 | ) | | (2,297 | ) | | (4,239 | ) |
Capital contributions by non-controlling interest | | | — | | | 4,686 | | | 1,815 | |
Restricted cash from financing activities | | | 312,331 | | | 212,975 | | | (3,861 | ) |
Proceeds from exchangeable senior notes | | | 172,500 | | | — | | | — | |
Repurchase exchangeable senior notes | | | (75,188 | ) | | — | | | — | |
Proceeds from common stock offerings | | | 73,313 | | | — | | | 26,253 | |
Proceeds from dividend reinvestment and stock purchase plan | | | 266 | | | 346 | | | 63 | |
Dividends (common and preferred) and distributions | | | (59,919 | ) | | (51,408 | ) | | (48,058 | ) |
Offering costs | | | (4,008 | ) | | (519 | ) | | (1,212 | ) |
Distribution/repayment to non-controlling interest | | | (120,669 | ) | | (13,738 | ) | | (15,958 | ) |
| | | | | | | | |
Net cash provided by (used in) financing activities | | | (265,635 | ) | | (168,072 | ) | | (172,948 | ) |
Net increase (decrease) in cash and cash equivalents | | | 19,069 | | | (13,489 | ) | | 4,889 | |
Cash and cash equivalents—beginning of period | | | 125,439 | | | 138,928 | | | 134,039 | |
| | | | | | | | |
Cash and cash equivalents—end of period | | $ | 144,508 | | $ | 125,439 | | $ | 138,928 | |
| | | | | | | | |
Supplemental disclosure of cash flow information: | | | | | | | | | | |
Cash paid for interest | | $ | 227,282 | | $ | 232,324 | | $ | 104,270 | |
| | | | | | | | |
See accompanying notes to consolidated financial statements.
111
Table of Contents
NORTHSTAR REALTY FINANCE CORP. AND SUBSIDIARIES
NOTES TO CONSOLIDATED FINANCIAL STATEMENTS
Amounts in Thousands, Except per Share Data
1. Formation and Organization
NorthStar Realty Finance Corp., a real estate finance company and Maryland corporation (the "Company" or "N-Star"), is an internally managed real estate investment trust ("REIT"), which was formed in October 2003 in order to continue and expand the commercial real estate ("CRE") debt, CRE securities and net lease businesses conducted by its predecessor. In addition, the Company engages in asset management and other activities related to real estate and real estate finance. Substantially all of the Company's assets, directly or indirectly, are held by, and the Company conducts its operations, directly or indirectly, through NorthStar Realty Finance Limited Partnership, a Delaware limited partnership and the operating partnership of the Company (the "Operating Partnership").
2. Summary of Significant Accounting Policies
Basis of Accounting
The accompanying consolidated financial statements and related notes of the Company have been prepared in accordance with accounting principles generally accepted in the United States ("U.S. GAAP"). In the opinion of management, all adjustments considered necessary for a fair presentation of the Company's financial position, results of operations and cash flows have been included and are of a normal and recurring nature.
Principles of Consolidation
The consolidated financial statements include the accounts of the Company, and its subsidiaries, which are majority-owned, controlled by the Company or a variable interest entity ("VIE") where the Company is the primary beneficiary. All significant intercompany balances have been eliminated in consolidation.
A VIE is an entity that lacks one or more of the characteristics of a voting interest entity. The Company evaluates its investments and financings to evaluate if it is a VIE based on: (1) the sufficiency of the entity's equity investment at risk to finance its activities without additional subordinated financial support provided by any parties, including the equity holders; (2) whether as a group the holders of the equity investment at risk have (a) the power, through voting rights or similar rights, to direct the activities of a legal entity that most significantly impacts the entity's economic performance, (b) the obligation to absorb the expected losses of the legal entity and (c) the right to receive the expected residual returns of the legal entity; and (3) whether the voting rights of these investors are proportional to their obligations to absorb the expected losses of the entity, their rights to receive the expected returns of their equity, or both, and whether substantially all of the entity's activities involve or are conducted on behalf of an investor that has disproportionately fewer voting rights. An investment that lacks one or more of the above three characteristics is considered to be a VIE. The Company reassesses its initial evaluation of an entity as a VIE upon the occurrence of certain reconsideration events.
The Company is required to consolidate a VIE if the Company is deemed to be the VIE's primary beneficiary. The primary beneficiary is the party that: (i) has the power to direct the activities that most significantly impact the VIE's economic performance; and (ii) has the obligation to absorb the losses of the VIE or the right to receive the benefits from the VIE, which could be significant to the VIE.
112
Table of Contents
NORTHSTAR REALTY FINANCE CORP. AND SUBSIDIARIES
NOTES TO CONSOLIDATED FINANCIAL STATEMENTS (Continued)
Amounts in Thousands, Except per Share Data
2. Summary of Significant Accounting Policies (Continued)
The Company determines whether it is the primary beneficiary of a VIE by first performing a qualitative analysis to determine if it holds the power to direct the activities that most significantly impact the VIE's economic performance. This analysis includes: (i) assessing the Company's variable interests (both implicit and explicit) and any other involvement in the VIE, as well as the involvement of other variable interest holders; (ii) consideration of the VIE's purpose and design, including the risks the VIE was designed to create and pass through to its variable interest holders; (iii) identifying the activities that most significantly affect the VIE's economic performance; (iv) determining whether the Company's significant involvement in the design of an entity provided the Company with the opportunity to establish arrangements that result in the Company having the power to direct the VIE's most significant activities; and (v) determining whether the Company's level of economic interest in a VIE is indicative of the amount of power the Company holds in situations where the Company's stated power to direct the VIEs most significant activities is disproportionately less than its economic interest in the entity. The Company performs a quantitative analysis to determine if it has the obligation to absorb the losses of the VIE or the right to receive the benefits from the VIE, which could be significant to the VIE. For purposes of allocating a VIE's potential residual returns and losses to its variable interest holders, the Company calculates its share of the VIE's expected losses and expected residual returns using the specific cash flows that would be allocated to it, based on contractual arrangements and/or the Company's position in the capital structure of the VIE, under various scenarios. The Company reassesses its determination of whether it is the primary beneficiary of a VIE each reporting period.
Estimates
The preparation of financial statements in conformity with U.S. GAAP requires management to make estimates and assumptions that could affect the amounts reported in the consolidated financial statements. Actual results could differ materially from these estimates.
Reclassifications
Certain prior period amounts have been reclassified to conform to the current period presentation, particularly with respect to amounts related to discontinued operations.
Comprehensive Income
The Company reports consolidated comprehensive income in separate statements following its consolidated statements of operations. Comprehensive income is defined as the change in equity resulting from net income (loss) and other comprehensive income (loss) ("OCI"). The Company's components of OCI principally include: (i) unrealized gain (loss) of securities available for sale for which the fair value option is not elected; and (ii) unrealized gain (loss) on derivative instruments that are or were deemed to be effective hedges.
Cash and Cash Equivalents
The Company considers all highly-liquid investments with a remaining maturity date of three months or less to be cash equivalents. Cash, including amounts restricted, may at times exceed the Federal Deposit Insurance Corporation deposit insurance limit of $250,000 per institution. The
113
Table of Contents
NORTHSTAR REALTY FINANCE CORP. AND SUBSIDIARIES
NOTES TO CONSOLIDATED FINANCIAL STATEMENTS (Continued)
Amounts in Thousands, Except per Share Data
2. Summary of Significant Accounting Policies (Continued)
Company mitigates credit risk by placing cash and cash equivalents with major financial institutions. To date, the Company has not experienced any losses on cash and cash equivalents.
Restricted Cash
Restricted cash consists of amounts related to operating real estate (escrows for taxes, insurance, capital expenditures, tenant security deposits, payments required under certain lease agreements), loan origination (escrow deposits) and the Company's CDO financing transactions. Restricted cash in CDO financing transactions represent proceeds from repayments and/or sales and is either used for reinvestment when the reinvestment period is open or is distributed in accordance with priority of cash flows set forth in the CDO's governing document upon completion of the reinvestment period.
Fair Value Option
The fair value option provides an election that allows companies to irrevocably elect fair value for certain financial assets and liabilities on an instrument-by-instrument basis at initial recognition. Changes in fair value for assets and liabilities for which the election is made will be recognized in earnings as they occur.
Real Estate Debt Investments
�� Real estate debt investments are generally intended to be held to maturity and, accordingly, are carried at cost, net of unamortized loan origination fees, discounts and unfunded commitments. Real estate debt investments that are deemed to be impaired are carried at amortized cost less a loan loss reserve. Interest income is recorded on the accrual basis and related discounts, premiums, origination costs and fees are amortized over the life of the investment using the effective interest method. The amortization is reflected as an adjustment to interest income in our consolidated statements of operations. The accretion of discount or amortization of a premium is discontinued if such loan is reclassified to held for sale.
Loans acquired at a discount with deteriorated credit quality are accreted to expected recovery. The Company continues to estimate the amount of recovery over the life of such loans. A subsequent increase in expected future cash flows is recognized as an adjustment to the accretable yield prospectively over the remaining life of such loan. A subsequent decrease in expected future cash flows is recognized as a provision for loan loss.
Real Estate Debt Investments, Held for Sale
Real estate debt investments held for sale are carried at the lower of cost or fair value using available market information including sales prices and other available market data.
Real Estate Securities
The Company classifies its real estate securities as available for sale on the acquisition date. Available for sale securities are recorded at fair value. The Company has generally elected to apply the fair value option of accounting for its real estate securities portfolio. For those real estate securities for which the fair value option of accounting was elected, any unrealized gains (losses) from changes in fair
114
Table of Contents
NORTHSTAR REALTY FINANCE CORP. AND SUBSIDIARIES
NOTES TO CONSOLIDATED FINANCIAL STATEMENTS (Continued)
Amounts in Thousands, Except per Share Data
2. Summary of Significant Accounting Policies (Continued)
value are recorded in unrealized gains (losses) on investments and other in the Company's consolidated statements of operations.
The Company may decide to not elect the fair value option for certain real estate securities due to the nature of the particular instrument. For those real estate securities for which the fair value option of accounting was not elected, any unrealized gains (losses) from the change in fair value is reported as a component of accumulated other comprehensive income (loss) in the Company's consolidated statements of equity, to the extent impairment losses are considered temporary.
Interest income on real estate securities is recognized using the effective interest method with any purchased premium or discount accreted through earnings based upon a comparison of actual and expected cash flows, through the expected maturity date of the security. Depending on the nature of the investment, changes to expected cash flows may result in a change to yield which is then applied prospectively to recognize interest income.
Operating Real Estate
Operating real estate is carried at historical cost less accumulated depreciation. Costs directly related to acquisitions deemed to be business combinations subsequent to January 1, 2009 are expensed. Ordinary repairs and maintenance which are not reimbursed by the tenants are expensed as incurred. Major replacements and betterments which improve or extend the life of the asset are capitalized and depreciated over their useful life.
Operating real estate is depreciated using the straight-line method over the estimated useful lives of the assets, summarized as follows:
| | |
Category | | Term |
|---|
Building (fee interest) | | 40 years |
Building improvements | | Lesser of the remaining life of building or useful life |
Building (leasehold interest) | | Lesser of 40 years or the remaining term of the lease |
Tenant improvements | | Lesser of the useful life or the remaining term of the lease |
The Company follows the purchase method of accounting for acquisitions of operating real estate held for investment, where the purchase price of operating real estate is allocated to tangible assets such as land, building, tenant improvements and other identified intangibles.
The Company evaluates whether real estate acquired in connection with a foreclosure, UCC/deed in lieu of foreclosure or a consentual modification of a loan (herein collectively referred to as a foreclosure) ("REO") constitutes a business and whether business combination accounting is relevant. Any excess upon foreclosure of a property between the carrying value of a loan over the estimated fair value of the property is charged to provision for loan losses.
Operating real estate, including REO, which has met the criteria to be classified as held for sale, is separately presented in the consolidated balance sheets. Such operating real estate is reported at the lower of its carrying value or its estimated fair value less the cost to sell. Once a property is determined
115
Table of Contents
NORTHSTAR REALTY FINANCE CORP. AND SUBSIDIARIES
NOTES TO CONSOLIDATED FINANCIAL STATEMENTS (Continued)
Amounts in Thousands, Except per Share Data
2. Summary of Significant Accounting Policies (Continued)
to be held for sale, depreciation is no longer recorded. In addition, the results of operations are reclassified to income (loss) from discontinued operations in the consolidated statements of operations. Other REO for which the Company intends to market for sale in the near term is recorded at estimated fair value.
Rental income from operating real estate is derived from leasing and sub-leasing of space to various types of corporate tenants and healthcare operators. The leases are for fixed terms of varying length and provide for annual rentals and expense reimbursements to be paid in monthly installments. Rental income from leases is recognized on a straight-line basis over the term of the respective leases. The excess of rents recognized over amounts contractually due pursuant to the underlying leases are included in unbilled rent receivable in the consolidated balance sheets.
The following is a schedule of future minimum rental income under leases at December 31, 2011:
| | | | |
Years Ending December 31: | |
| |
|---|
2012 | | $ | 99,188 | |
2013 | | | 91,756 | |
2014 | | | 86,074 | |
2015 | | | 79,815 | |
2016 | | | 71,982 | |
Thereafter | | | 148,743 | |
| | | | |
Total | | $ | 577,558 | |
| | | | |
Deferred Costs
Deferred costs include deferred financing costs and deferred lease costs. Deferred financing costs represent commitment fees, legal and other third-party costs associated with obtaining financing. These costs are amortized to interest expense over the term of the financing. Unamortized deferred financing costs are expensed when the associated borrowing is refinanced or repaid before maturity. Costs incurred in seeking financing transactions, which do not close, are expensed in the period such financing transaction was terminated. Deferred lease costs consist of fees incurred to initiate and renew operating leases, which are amortized on a straight-line basis over the remaining lease term and is recorded to depreciation and amortization in the consolidated statements of operations.
Identified Intangibles
The Company records acquired identified intangibles, which includes intangible assets (value of the above-market leases, in-place leases and other intangibles) and intangible liabilities (value of below-market leases), based on estimated fair value. The value allocated to the above or below-market leases is amortized over the remaining lease term as a net adjustment to rental income. Other intangible assets are amortized into depreciation and amortization expense on a straight-line basis over the remaining lease term. Identified intangible assets are recorded in deferred costs and intangible assets and identified intangible liabilities are recorded in other liabilities on the consolidated balance sheets.
116
Table of Contents
NORTHSTAR REALTY FINANCE CORP. AND SUBSIDIARIES
NOTES TO CONSOLIDATED FINANCIAL STATEMENTS (Continued)
Amounts in Thousands, Except per Share Data
2. Summary of Significant Accounting Policies (Continued)
The following summarizes identified intangibles as of December 31, 2011 and 2010 (amounts in thousands):
| | | | | | | | | | | | | | | | | | | |
| | December 31, 2011 | | December 31, 2010 | |
|---|
| | Intangible Assets | | Intangible
Liabilities | | Intangible Assets | | Intangible
Liabilities | |
|---|
| | Above-
market
Leases | | Other | | Below-
market
Leases | | Above-
market
Leases | | Other | | Below-
market
Leases | |
|---|
Gross amount | | $ | 23,012 | | $ | 100,844 | | $ | 44,041 | | $ | 7,834 | | $ | 74,867 | | $ | 21,524 | |
Accumulated amortization | | | (6,551 | ) | | (35,223 | ) | | (11,686 | ) | | (4,141 | ) | | (31,531 | ) | | (8,320 | ) |
| | | | | | | | | | | | | | |
Total | | $ | 16,461 | | $ | 65,621 | | $ | 32,355 | | $ | 3,693 | | $ | 43,336 | | $ | 13,204 | |
| | | | | | | | | | | | | | |
The Company recorded amortization of acquired above-market leases, net of acquired below-market leases, of $1.0 million, $0.9 million and $0.8 million for the years ended December 31, 2011, 2010 and 2009, respectively. Amortization of other intangible assets was $13.4 million, $6.8 million and $14.7 million for the years ended December 31, 2011, 2010 and 2009, respectively.
Estimated annual amortization of intangible assets and liabilities is as follows (amounts in thousands):
| | | | | | | |
| | Above and Below
Market Leases, Net(1) | | Other
Intangibles(1) | |
|---|
2012 | | $ | 1,386 | | $ | 13,326 | |
2013 | | | 1,585 | | | 11,376 | |
2014 | | | 1,688 | | | 9,767 | |
2015 | | | 1,777 | | | 8,223 | |
2016 | | | 882 | | | 6,242 | |
Thereafter(1) | | | 8,576 | | | 16,687 | |
| | | | | | |
Total | | $ | 15,894 | | $ | 65,621 | |
| | | | | | |
- (1)
- Identified intangibles will be amortized through periods ending December 2025.
Investments in and Advances to Unconsolidated Ventures
A non-controlling interest in a joint venture deemed to exert significant influence over the affairs of the joint venture follows the equity method of accounting where the investment is increased each period for additional capital contributions and a proportionate share of the entity's earnings and decreased for cash distributions and a proportionate share of the entity's losses.
Commission Income
Commission income represents income earned by us for selling equity in NorthStar Real Estate Income Trust, Inc. ("NSREIT") through the Company's broker-dealer subsidiary. Commission income is accrued on a trade date basis.
117
Table of Contents
NORTHSTAR REALTY FINANCE CORP. AND SUBSIDIARIES
NOTES TO CONSOLIDATED FINANCIAL STATEMENTS (Continued)
Amounts in Thousands, Except per Share Data
2. Summary of Significant Accounting Policies (Continued)
Credit Losses and Impairment on Investments
The Company maintains a loan loss reserve on certain of its CRE debt investments. A provision is established when the Company believes a loan is impaired, which is when it is deemed probable that the Company will not be able to collect principal and interest amounts due according to the contractual terms. Management assesses the credit quality of the portfolio and adequacy of loan loss reserves on a quarterly basis, or more frequently as necessary. Significant judgment of the Company is required in this analysis. The Company considers the estimated net recoverable value of the loan as well as other factors, including but not limited to fair value of any collateral, the amount and the status of any senior debt, the prospects for the borrower and the competitive situation of the region where the borrower does business. Because this determination is based upon projections of future economic events, which are inherently subjective, the amounts ultimately realized may differ materially from the carrying value as of the balance sheet date.
Income recognition is suspended for the loans at the earlier of the date at which payments become 90-days past due or when, in the opinion of the Company, a full recovery of income and principal becomes doubtful. Income is then recorded on a cash basis until an accrual is resumed when the loan becomes contractually current and performance is demonstrated to be resumed. A loan is written off when it is no longer realizable and legally discharged.
CRE securities for which the fair value option is elected are not evaluated for other-than-temporary impairment ("OTTI") as changes in fair value are recorded in the Company's consolidated statements of operations. Realized losses on such securities are reclassified to realized gain (loss) on investments and other as losses occur.
CRE securities for which the fair value option is not elected are quarterly evaluated for OTTI. A security where the fair value is less than amortized cost is considered impaired. Impairment of a security is considered to be other-than-temporary when: (a) the holder has the intent to sell the impaired security; (b) it is more likely than not the holder will be required to sell the security; or (c) the holder does not expect to recover the entire amortized cost of the security. When a CRE security has been deemed to be other-than-temporarily impaired, the security is written down to its fair value. The amount of OTTI is then bifurcated into: (i) the amount related to expected credit losses; and (ii) the amount related to fair value adjustments in excess of expected credit losses. The portion of OTTI related to expected credit losses is recognized in the consolidated statements of operations. The remaining OTTI related to the valuation adjustment is recognized as a component of accumulated other comprehensive income (loss) in the consolidated statements of equity. The portion of OTTI recognized through earnings is accreted back to the amortized cost basis of the security through interest income, while amounts recognized through other comprehensive income (loss) are amortized over the life of the security with no impact on earnings.
118
Table of Contents
NORTHSTAR REALTY FINANCE CORP. AND SUBSIDIARIES
NOTES TO CONSOLIDATED FINANCIAL STATEMENTS (Continued)
Amounts in Thousands, Except per Share Data
2. Summary of Significant Accounting Policies (Continued)
The Company's real estate portfolio is reviewed on a quarterly basis, or more frequently as necessary, to assess whether there are any indicators that the value of its operating real estate may be impaired or that its carrying value may not be recoverable. A property's value is considered impaired if the Company's estimate of the aggregate future undiscounted cash flows to be generated by the property is less than the carrying value of the property. In conducting this review, the Company considers U.S. macroeconomic factors, including real estate sector conditions, together with asset specific and other factors. To the extent an impairment has occurred and is considered to be other than temporary, the loss will be measured as the excess of the carrying amount of the property over the calculated fair value of the property.
Allowances for doubtful accounts for tenant receivables are established based on periodic review of aged receivables resulting from estimated losses due to the inability of tenants to make required rent and other payments contractually due. Additionally, the Company establishes, on a current basis, an allowance for future tenant credit losses on billed and unbilled rents receivable based upon an evaluation of the collectability of such amounts.
The Company reviews its equity investments in unconsolidated ventures on a quarterly basis, or more frequently as necessary, to assess whether there are any indicators that the value may be impaired or that its carrying value may not be recoverable. An investment is considered impaired if the projected net recoverable amount over the expected holding period is less than the carrying value. In conducting this review, the Company considers U.S. macroeconomic factors, including real estate sector conditions, together with asset specific and other factors. To the extent an impairment has occurred and is considered to be other than temporary, the loss will be measured as the excess of the carrying amount over the calculated fair value of the investment and is reported in provision for loss on equity investment in the consolidated statement of operations.
Troubled Debt Restructuring
Real estate debt investments modified in a troubled debt restructuring ("TDR") are modifications granting a concession to a borrower experiencing financial difficulties where a lender agrees to terms that are more favorable to the borrower than is otherwise available in the current market. Management judgment is necessary to determine whether a loan modification is considered a TDR. Troubled debt that is fully satisfied via foreclosure, repossession or other transfers of assets is included in the definition of TDR. Pools of loans acquired with deteriorated credit quality that have been modified are not considered a TDR.
Derivatives
Derivatives are used to manage the Company's exposure to interest rate movements and other identified risks. For derivatives that qualify as cash flow hedges, the effective portion of changes in the fair value of derivatives designated as a hedge is recorded in accumulated OCI and is subsequently reclassified into income in the period that the hedged item affects income. Amounts reported in OCI
119
Table of Contents
NORTHSTAR REALTY FINANCE CORP. AND SUBSIDIARIES
NOTES TO CONSOLIDATED FINANCIAL STATEMENTS (Continued)
Amounts in Thousands, Except per Share Data
2. Summary of Significant Accounting Policies (Continued)
relate to the hedge of the Company's variable-rate borrowings are reclassified to interest expense as interest payments are made on the Company's borrowings.
The change in fair value for derivatives that do not qualify as a hedge for U.S. GAAP is recorded in earnings. When the Company elected the fair value option for certain of its borrowings, any derivatives designated as a qualifying hedge at the time no longer qualified for hedge accounting given that the underlying borrowing will be remeasured with changes in the fair value recorded in earnings. For such derivatives, the unrealized gain (loss) at that time will remain in accumulated OCI and will be reclassified into income over the shorter of either the life of the derivative or the associated borrowing, with current changes in fair value recorded in earnings.
Exchangeable Senior Notes
The proceeds from exchangeable senior notes that may be settled in cash, including partial cash settlements, must be bifurcated between a liability component and an equity component associated with the embedded conversion option. The liability component is calculated based on the present value of the contractual cash flows discounted at a comparable market conventional borrowing rate at the date of issuance. The difference between the principal amount and the fair value of the liability component is reported as a discount on the exchangeable senior notes and is accreted as additional interest expense to the contractual maturity using the effective interest method. The equity component is calculated based on the difference between the proceeds received and the fair value of the liability component at the issuance date. The equity component is recorded in additional paid-in-capital, net of issuance costs, on our consolidated balance sheets. Issuance costs related to exchangeable senior notes is allocated between the liability and the equity components based on their relative values.
Equity-Based Compensation
The Company accounts for its equity-based compensation awards using the fair value method, which requires an estimate of fair value of the award at the time of grant. Awards may be based on a variety of measures such as time, performance, market or a combination thereof. For time-based awards the Company recognizes compensation expense over the vesting period, on a straight-line basis. For awards with performance or market measures, the Company recognizes compensation expense over the requisite service period, using the accelerated attribution expense method. For performance-based measures, compensation expense, net of estimated forfeitures, is recorded based on the Company's estimate of the probable achievement of such measures. For market-based measures, the Company recognizes compensation expense based on the initial estimate of the fair value of the award using a binomial model.
For awards with a combination of performance or market measures, the Company estimates the fair value as if it were two separate awards. First, the Company estimates the probability of achieving the performance measure. If it is not probable the performance condition will be met, the Company records the compensation expense based on the fair value of the market measure. This expense is recorded even if the market-based measure is never met. If the performance-based measure is subsequently estimated to be achieved, the Company records compensation expense based upon the performance-based measure. The Company would then record a cumulative catch-up adjustment for any additional compensation expense.
120
Table of Contents
NORTHSTAR REALTY FINANCE CORP. AND SUBSIDIARIES
NOTES TO CONSOLIDATED FINANCIAL STATEMENTS (Continued)
Amounts in Thousands, Except per Share Data
2. Summary of Significant Accounting Policies (Continued)
Foreign Currency Remeasurement
Assets and liabilities denominated in non-U.S. currencies are remeasured at rates of exchange prevailing on the reporting date and revenues and expenses are remeasured at average rates of exchange for the period. The Company's functional currency of its euro-dominated investment is the U.S. dollar, therefore, any gains or losses from the remeasurement of foreign currency to U.S. dollars are included in the consolidated statements of operations.
Earnings Per Share
The Company's basic earnings per share ("EPS") is computed by dividing net income (loss) attributable to common stockholders by the weighted average number of common shares outstanding. For purposes of calculating EPS, the Company considers all unvested restricted stock units which participate in the Company's dividends to be outstanding. Diluted EPS reflects the potential dilution that could occur if outstanding warrants or other contracts to issue common stock were exercised or converted to common stock (including limited partnership interests in the Operating Partnership), where such exercise or conversion would result in a lower EPS. The dilutive effect of partnership interests is computed assuming all units are converted to common stock.
Income Taxes
The Company and its wholly-owned subsidiary, NRFC Sub-REIT Corp. ("Sub-REIT"), have each elected to be taxed as a REIT and to comply with the Sections 856 through 859 of the Internal Revenue Code of 1986, as amended, the ("Code"). Accordingly, the Company generally will not be subject to U.S. federal income tax to the extent of its distributions to stockholders and as long as certain asset, income and share ownership tests are met. To maintain its qualification as a REIT, the Company must distribute at least 90% of its REIT taxable income to its stockholders and meet certain other requirements. The Company may also be subject to certain state, local and franchise taxes. Under certain circumstances, federal income and excise taxes may be due on its undistributed taxable income. If the Company were to fail to meet these requirements, it would be subject to U.S. federal income tax, which could have a material adverse impact on its results of operations and amounts available for distributions to its stockholders. The Company believes that all of the criteria to maintain the Company's and Sub-REIT's REIT qualification have been met for the applicable periods, but there can be no assurance that these criteria will continue to be met in subsequent periods.
The Company maintains various taxable REIT subsidiaries ("TRSs") which may be subject to U.S. federal, state and local income taxes and foreign taxes. In general, a TRS of the Company may perform non-customary services for tenants of the Company, hold assets that the Company cannot hold directly and may engage in any real estate or non-real estate related business. A TRS is subject to regular corporate income tax. The Company has established several TRSs in jurisdictions for which no taxes are assessed on corporate earnings. However, the Company must include earnings from these TRSs currently. Current and deferred taxes are provided on the portion of earnings (losses) recognized by the Company with respect to its interest in domestic TRSs. Deferred income tax assets and liabilities are computed based on temporary differences between the Company's U.S. GAAP consolidated financial statements and the federal and state income tax basis of assets and liabilities as of the consolidated balance sheet date. The Company evaluates the realizability of its deferred tax assets
121
Table of Contents
NORTHSTAR REALTY FINANCE CORP. AND SUBSIDIARIES
NOTES TO CONSOLIDATED FINANCIAL STATEMENTS (Continued)
Amounts in Thousands, Except per Share Data
2. Summary of Significant Accounting Policies (Continued)
(e.g., net operating loss and capital loss carryforwards) and recognizes a valuation allowance if, based on the available evidence, it is more likely than not that some portion or all of its deferred tax assets will not be realized. When evaluating the realizability of its deferred tax assets, the Company considers estimates of expected future taxable income, existing and projected book/tax differences, tax planning strategies available and the general and industry specific economic outlook. This realizability analysis is inherently subjective, as it requires the Company to forecast its business and general economic environment in future periods. Changes in estimate of deferred tax asset realizability, if any, are included in tax expense in the consolidated statements of operations. One of the Company's TRSs had net operating losses of $9.7 million, which can generally be used to offset future operating income for up to 20 years. As of December 31, 2011, the Company has a deferred tax asset of $3.8 million, principally as a result of net operating losses. The Company had concluded that it is more likely than not that the net operating losses will not be utilized during the carryforward period, and as such, the Company has established a valuation allowance against the deferred tax asset.
From time-to-time, the Company's TRSs generate taxable income from intercompany transactions. The TRS entities generate taxable revenue from fees for services provided to our various lines of business. Certain entities may be consolidated in the Company's financial statements. In consolidation, these fees are eliminated when the entity is included in the consolidated group. Nonetheless, all income taxes are accrued by the TRSs in the year in which the taxable revenue is received. These income taxes are not eliminated when the related revenue is eliminated in consolidation.
Certain TRS entities are domiciled in non-U.S. jurisdictions and, accordingly, taxable income generated by these entities may not be subject to local income taxation, but generally are included in the Company's taxable income on a current basis, whether or not distributed. Upon distribution of any previously included income, no incremental U.S. federal, state or local income taxes would be payable by the Company.
The TRS entities may be subject to tax laws that are complex and potentially subject to different interpretations by the taxpayer and the relevant governmental taxing authorities. In establishing a provision for income tax expense, the Company must make judgments and interpretations about the application of these inherently complex tax laws. Actual income taxes paid may vary from estimates depending upon changes in income tax laws, actual results of operations and the final audit of tax returns by taxing authorities. Tax assessments may arise several years after tax returns have been filed. The Company reviews the tax balances of its TRS entities quarterly and as new information becomes available, the balances are adjusted as appropriate.
The Company has assessed its tax positions for all open tax years, which includes 2008 to 2011 and concluded there were no material uncertainties to be recognized. The Company's accounting policy with respect to interest and penalties is to classify these amounts as interest expense. The Company has not recognized any such amounts related to uncertain tax positions for the years ended December 31, 2011, 2010 and 2009.
Recently Issued Pronouncements
In May 2011, the Financial Accounting Standards Board ("FASB") issued an accounting update to amend existing guidance concerning fair value measurements and disclosures. The update is intended to achieve common fair value measurements and disclosure requirements under U.S. GAAP and International Financial Reporting Standards and is effective for the Company in the first quarter 2012.
122
Table of Contents
NORTHSTAR REALTY FINANCE CORP. AND SUBSIDIARIES
NOTES TO CONSOLIDATED FINANCIAL STATEMENTS (Continued)
Amounts in Thousands, Except per Share Data
2. Summary of Significant Accounting Policies (Continued)
The Company is currently evaluating the impact of this accounting update and does not expect it will have a material impact on the consolidated financial statements.
In June 2011, the FASB issued an accounting update concerning the presentation of comprehensive income. The update requires either a single, continuous statement of comprehensive income be included on the statement of operations or an additional statement of comprehensive income immediately following the statement of operations. The update does not change the components of OCI that must be reported but it eliminates the option to present other comprehensive income in the statement of equity. In December 2011, the FASB issued an accounting update to defer the requirement to present the reclassification adjustments to OCI by component and are currently redeliberating this requirement. The remaining requirements of the accounting update are effective for the Company the first quarter of 2012 and should be applied retrospectively to all periods reported after the effective date. Early adoption is permitted. There is no impact on the consolidated financial statements as the Company currently complies with the update.
3. Variable Interest Entities
The Company has evaluated its CRE debt and security investments, investments in unconsolidated ventures, liabilities to subsidiary trusts issuing preferred securities ("junior subordinated notes") and its collateralized debt obligations ("CDOs") to determine whether they are a VIE. The Company monitors these investments and, to the extent it has determined that it potentially owns a majority of the current controlling class, analyzes them for potential consolidation. The Company will continue to analyze future investments and liabilities, as well as reconsideration events, including a modified loan deemed to be a troubled debt restructuring, pursuant to the VIE requirements. These analyses require considerable judgment in determining the primary beneficiary of a VIE since they involve estimated probability weighting of subjectively determined possible cash flow scenarios. This could result in the consolidation of an entity that would otherwise not have been consolidated or the non-consolidation of an entity that would have otherwise have been consolidated.
Consolidated VIEs (the Company is the primary beneficiary)
The Company has sponsored nine CDOs, which are referred to as the N-Star CDOs. In addition, the Company has acquired the equity interests of two CDOs, the CSE RE 2006-A CDO ("CSE CDO") and the CapLease 2005-1 CDO ("CapLease CDO"). In the case of the CSE CDO, the Company was delegated the collateral management and special servicing rights and for the CapLease CDO, the Company acquired the collateral management rights.
The CRE debt investments that serve as collateral for the CDO financing transactions include first mortgage loans, subordinate mortgage interests, mezzanine loans, credit tenant loans ("CTLs") and other loans. The CRE securities that serve as collateral for the CDO financing transactions include commercial mortgage-backed securities ("CMBS"), unsecured REIT debt and CDO notes backed primarily by CRE securities and CRE debt. By financing these assets with long-term borrowings through the issuance of CDO bonds, the Company seeks to generate attractive risk-adjusted equity returns and to match the term of its assets and liabilities. In connection with these financing transactions, the Company has various forms of significant ongoing involvement, which may include: (i) holding senior or subordinated interests in the CDOs; (ii) asset management; and (iii) entering into derivative contracts to manage interest rate risk. Each CDO transaction is considered a VIE. The
123
Table of Contents
NORTHSTAR REALTY FINANCE CORP. AND SUBSIDIARIES
NOTES TO CONSOLIDATED FINANCIAL STATEMENTS (Continued)
Amounts in Thousands, Except per Share Data
3. Variable Interest Entities (Continued)
Company has determined it is the primary beneficiary, and as a result, consolidates all of its CDO financing transactions, including the CSE CDO and CapLease CDO.
In connection with the CapLease CDO, on August 31, 2011, the Company invested $23.5 million to acquire the collateral management rights, and preferred equity notes and $14.3 million principal amount of originally investment grade CDO bonds. The investment was funded with $12.3 million of unrestricted cash and $11.2 million of CDO restricted cash. At acquisition, the principal amount of CRE debt investments was $145.4 million and the fair value was $138.2 million. As of December 31, 2011, the CapLease CDO had $184.3 million principal amount of collateral, of which $142.3 million was CRE debt investments and $128.7 million CDO bonds outstanding with third parties.
The following table displays the classification and carrying value of assets and liabilities of consolidated VIEs as of December 31, 2011 (amounts in thousands):
| | | | | | | | | | | | | | | | | | | | | | | | | | | | | | | | | | | | | |
| | Consolidated Variable Interest Entities | |
|---|
| | N-Star
I | | N-Star
II | | N-Star
III | | N-Star
IV | | N-Star
V | | N-Star
VI | | N-Star
VII | | N-Star
VIII | | N-Star
IX | | CSE
CDO | | CapLease
CDO | | Total | |
|---|
Assets of consolidated VIEs: | | | | | | | | | | | | | | | | | | | | | | | | | | | | | | | | | | | | | |
Restricted cash(1) | | $ | 1,787 | | $ | 512 | | $ | 3,659 | | $ | 13,009 | | $ | 868 | | $ | 30,075 | | $ | 571 | | $ | 45,212 | | $ | 50,465 | | $ | 110,484 | | $ | 4,653 | | $ | 261,295 | |
Operating real estate, net | | | — | | | — | | | — | | | 68,779 | | | — | | | — | | | — | | | 244,448 | | | — | | | — | | | — | | | 313,227 | |
Real estate securities, available for sale | | | 175,243 | | | 146,556 | | | 198,963 | | | 28,887 | | | 160,551 | | | 35,569 | | | 211,818 | | | 6,341 | | | 332,778 | | | 48,108 | | | 13,468 | | | 1,358,282 | |
Real estate debt investments, net | | | — | | | — | | | 30,054 | | | 259,525 | | | — | | | 301,355 | | | 21,146 | | | 471,593 | | | 20,013 | | | 392,937 | | | 135,233 | | | 1,631,856 | |
Investments in and advances to unconsolidated ventures | | | — | | | — | | | — | | | — | | | — | | | — | | | — | | | 60,352 | | | — | | | — | | | — | | | 60,352 | |
Receivables, net of allowance | | | 1,582 | | | 1,278 | | | 1,852 | | | 1,412 | | | 1,823 | | | 931 | | | 2,396 | | | 2,733 | | | 3,603 | | | 4,054 | | | 866 | | | 22,530 | |
Derivative assets, at fair value | | | — | | | — | | | — | | | — | | | — | | | 58 | | | 3 | | | — | | | — | | | — | | | — | | | 61 | |
Deferred costs and intangible assets, net | | | — | | | — | | | — | | | 4,034 | | | — | | | 113 | | | — | | | 43,352 | | | — | | | — | | | — | | | 47,499 | |
Assets of properties held for sale | | | — | | | — | | | — | | | — | | | — | | | — | | | — | | | — | | | — | | | 3,198 | | | — | | | 3,198 | |
Other assets | | | 67 | | | 41 | | | 21 | | | 381 | | | 43 | | | 2,616 | | | 5,157 | | | 3,523 | | | 243 | | | 11,031 | | | 12 | | | 23,135 | |
| | | | | | | | | | | | | | | | | | | | | | | | | | |
Total assets of consolidated VIEs(2) | | | 178,679 | | | 148,387 | | | 234,549 | | | 376,027 | | | 163,285 | | | 370,717 | | | 241,091 | | | 877,554 | | | 407,102 | | | 569,812 | | | 154,232 | | | 3,721,435 | |
Liabilities of consolidated VIEs: | | | | | | | | | | | | | | | | | | | | | | | | | | | | | | | | | | | | | |
CDO bonds payable | | | 154,110 | | | 103,475 | | | 129,537 | | | 157,862 | | | 126,251 | | | 184,552 | | | 180,155 | | | 353,684 | | | 228,704 | | | 526,909 | | | 128,668 | | | 2,273,907 | |
Mortgage notes payable | | | — | | | — | | | — | | | — | | | — | | | — | | | — | | | 228,525 | | | — | | | — | | | — | | | 228,525 | |
Secured term loan | | | — | | | — | | | — | | | — | | | — | | | 14,682 | | | — | | | — | | | — | | | — | | | — | | | 14,682 | |
Accounts payable and accrued expenses | | | 1,108 | | | 88 | | | 849 | | | 1,343 | | | 470 | | | 389 | | | 376 | | | 5,374 | | | 1,532 | | | 2,926 | | | 1,299 | | | 15,754 | |
Escrow deposits payable | | | — | | | — | | | — | | | 6,642 | | | — | | | 10,988 | | | — | | | 15,864 | | | 339 | | | 17,691 | | | 1,136 | | | 52,660 | |
Derivative liabilities, at fair value | | | 6,559 | | | 10,846 | | | 17,245 | | | — | | | 39,820 | | | 8,790 | | | 52,384 | | | 26,155 | | | 50,846 | | | 13,836 | | | — | | | 226,481 | |
Other liabilities | | | — | | | — | | | — | | | 1,342 | | | — | | | — | | | 254 | | | 20,672 | | | 30,624 | | | 2,115 | | | — | | | 55,007 | |
| | | | | | | | | | | | | | | | | | | | | | | | | | |
Total liabilities of consolidated VIEs(3) | | | 161,777 | | | 114,409 | | | 147,631 | | | 167,189 | | | 166,541 | | | 219,401 | | | 233,169 | | | 650,274 | | | 312,045 | | | 563,477 | | | 131,103 | | | 2,867,016 | |
| | | | | | | | | | | | | | | | | | | | | | | | | | |
Net assets | | $ | 16,902 | | $ | 33,978 | | $ | 86,918 | | $ | 208,838 | | $ | (3,256 | ) | $ | 151,316 | | $ | 7,922 | | $ | 227,280 | | $ | 95,057 | | $ | 6,335 | | $ | 23,129 | | $ | 854,419 | |
| | | | | | | | | | | | | | | | | | | | | | | | | | |
- (1)
- Includes $71 million available for re-investment in certain of the CDOs.
- (2)
- Assets of each of the consolidated VIEs may only be used to settle obligations of the respective VIE.
- (3)
- Creditors of each of the consolidated VIEs have no recourse to the general credit of the Company.
124
Table of Contents
NORTHSTAR REALTY FINANCE CORP. AND SUBSIDIARIES
NOTES TO CONSOLIDATED FINANCIAL STATEMENTS (Continued)
Amounts in Thousands, Except per Share Data
3. Variable Interest Entities (Continued)
The Company did not provide financial support to any of its consolidated VIEs for the years ended December 31, 2011 and 2010. At December 31, 2011, there were no explicit arrangements or implicit variable interests that could require the Company to provide financial support to any of its consolidated VIEs.
Unconsolidated VIEs (the Company is not the primary beneficiary, but has a variable interest)
Based on management's analysis, the Company is not the primary beneficiary of its identified VIEs since it does not have both the: (i) power to direct the activities that most significantly impact the VIE's economic performance; and (ii) obligation to absorb the losses of the VIE or the right to receive the benefits from the VIE, which could be significant to the VIE. Accordingly, these VIEs are not consolidated into the Company's financial statements as of December 31, 2011.
Real Estate Securities
The Company has identified six real estate securities with a fair value of $55.7 million as a variable interest in a VIE. The Company has determined that it is not the primary beneficiary, and as such, the VIE should not be consolidated in the Company's financial statements.
In 2011, in connection with three existing CMBS investments, the Company became the controlling class of a securitization the Company did not sponsor. The Company determined the securitization was a VIE. However, the Company has determined it does not currently or potentially hold a significant interest and therefore is not the primary beneficiary. As such, the VIEs are not consolidated.
In March 2011, in connection with existing investments of certain CMBS, the Company became the controlling class of a securitization that the Company did not sponsor. The Company determined it was the primary beneficiary due to ownership in more than 50% of the controlling class and the right to appoint the special servicer, which gave the Company the power to direct the activities that impact the economic performance of the VIE. However, the Company sold a significant portion of this investment, and as such, it was determined the Company was no longer the primary beneficiary.
In June 2011, the Company acquired the "B-piece" in a new $2.1 billion CMBS securitization. The Company is appointed as special servicer for the securitization. The Company has determined that the securitization is a VIE. However, the Company has determined that it does not currently or potentially hold a significant interest and therefore is not the primary beneficiary. As such, the VIE is not consolidated.
In August 2011, the Company invested in a securitization collateralized by originally investment grade rated N-Star CDO bonds. The investment had a $28.2 million carrying value at December 31, 2011. The Company has determined that the securitization is a VIE. However, the Company has determined that it does not have the power to direct the activities that most significantly impact the economic performance of the VIE and does not currently or potentially hold a significant interest and therefore is not the primary beneficiary. As such, the VIE is not consolidated.
NorthStar Realty Finance Trusts
The Company owns all of the common stock of NorthStar Realty Finance Trusts I through VIII (collectively, the "Trusts"). The Trusts were formed to issue trust preferred securities. The Company determined that the holders of the trust preferred securities were the primary beneficiaries of the Trusts. As a result, the Company did not consolidate the Trusts and has accounted for the investment in the common stock of the Trusts under the equity method of accounting.
125
Table of Contents
NORTHSTAR REALTY FINANCE CORP. AND SUBSIDIARIES
NOTES TO CONSOLIDATED FINANCIAL STATEMENTS (Continued)
Amounts in Thousands, Except per Share Data
3. Variable Interest Entities (Continued)
The following table displays the classification, carrying value and maximum exposure of unconsolidated VIEs as of December 31, 2011 (amounts in thousands):
| | | | | | | | | | | | | |
| | Unconsolidated Variable Interest Entities | |
| |
| |
|---|
| | Junior Subordinated
Notes, at
Fair Value | | Real Estate Securities,
Available for Sale | | Total | | Maximum Exposure
to Loss(1) | |
|---|
Real estate securities, available for sale | | | — | | | 55,695 | | | 55,695 | | | 55,695 | |
| | | | | | | | | | |
Total assets | | | — | | | 55,695 | | | 55,695 | | | 55,695 | |
Junior subordinated notes, at fair value | | | 157,168 | | | — | | | 157,168 | | | NA | |
| | | | | | | | | | |
Total liabilities | | | 157,168 | | | — | | | 157,168 | | | NA | |
| | | | | | | | | | |
Net asset (liability) | | $ | (157,168 | ) | $ | 55,695 | | $ | (101,473 | ) | | NA | |
| | | | | | | | | | |
- (1)
- The Company's maximum exposure to loss at December 31, 2011 would not exceed the carrying value of its investment.
The Company did not provide financial support to any of its unconsolidated VIEs during the years ended December 31, 2011 and 2010. At December 31, 2011, there were no explicit arrangements or implicit variable interests that could require the Company to provide financial support to any of its unconsolidated VIEs.
4. Fair Value
Fair Value Measurements
The Company follows fair value guidance in accordance with U.S. GAAP to account for its financial instruments. The Company categorizes its financial instruments, based on the priority of the inputs to the valuation technique, into a three-level fair value hierarchy. The fair value hierarchy gives the highest priority to quoted prices in active markets for identical assets or liabilities (Level 1) and the lowest priority to unobservable inputs (Level 3). If the inputs used to measure the financial instruments fall within different levels of the hierarchy, the categorization is based on the lowest level input that is significant to the fair value measurement of the instrument.
Financial assets and liabilities recorded at fair value on the consolidated balance sheets are categorized based on the inputs to the valuation techniques as follows:
| | | | |
| Level 1. | | Quoted prices for identical assets or liabilities in an active market. |
| Level 2. | | Financial assets and liabilities whose values are based on the following: |
| | | a) | | Quoted prices for similar assets or liabilities in active markets. |
| | | b) | | Quoted prices for identical or similar assets or liabilities in non-active markets. |
| | | c) | | Pricing models whose inputs are observable for substantially the full term of the asset or liability. |
| | | d) | | Pricing models whose inputs are derived principally from or corroborated by observable market data for substantially the full term of the asset or liability. |
| Level 3. | | Prices or valuation techniques based on inputs that are both unobservable and significant to the overall fair value measurement. |
126
Table of Contents
NORTHSTAR REALTY FINANCE CORP. AND SUBSIDIARIES
NOTES TO CONSOLIDATED FINANCIAL STATEMENTS (Continued)
Amounts in Thousands, Except per Share Data
4. Fair Value (Continued)
Determination of Fair Value
The following is a description of the valuation techniques used to measure fair value and the general classification of these instruments pursuant to the fair value hierarchy.
Real Estate Securities
Real estate securities are generally valued using a third-party pricing service or broker quotations. These quotations are based on observable inputs that can be validated, and as such, are classified as Level 2 of the fair value hierarchy. Certain real estate securities are valued based on a single broker quote or an internal pricing model and have less observable pricing are classified as Level 3 of the fair value hierarchy. For real estate securities using an internal pricing model, inputs include assumptions related to the timing and amount of expected future cash flows, the discount rate, estimated prepayments and projected losses.
Derivative Instruments
Derivative instruments are valued using a third-party pricing service. These quotations are generally based on valuation models with market observable inputs such as interest rates and contractual cash flows, and as such, are classified as Level 2 of the fair value hierarchy. Derivative instruments are also assessed for credit valuation adjustments due to the risk of non-performance by the Company and derivative counterparties. However, since the majority of the Company's derivatives are held in non-recourse CDO financing structures where, by design, the derivative contracts are senior to all the CDO bonds payable, there is no material impact of a credit valuation adjustment.
CDO Bonds Payable
CDO bonds payable are valued using quotations from nationally-recognized financial institutions that acted as underwriter for the transactions. These quotations are generally based on valuation models using market observable inputs for interest rates and other inputs for assumptions related to the timing and amount of expected future cash flows, the discount rate, estimated prepayments and projected losses. CDO bonds payable are classified as Level 3 of the fair value hierarchy.
Junior Subordinated Notes
Junior subordinated notes are valued using quotations from nationally-recognized financial institutions. These quotations are generally based on a valuation model using market observable inputs for interest rates and other inputs for assumptions related to the implied credit spread of the Company's other borrowings and the timing and amount of expected future cash flows. Junior subordinated notes are classified as Level 3 of the fair value hierarchy.
Fair Value Measurement
Financial assets and liabilities recorded at fair value on a recurring basis are classified in their entirety based on the lowest level of input that is significant to the fair value measurement.
127
Table of Contents
NORTHSTAR REALTY FINANCE CORP. AND SUBSIDIARIES
NOTES TO CONSOLIDATED FINANCIAL STATEMENTS (Continued)
Amounts in Thousands, Except per Share Data
4. Fair Value (Continued)
The following tables set forth the Company's financial assets and liabilities that were accounted for at fair value on a recurring basis as of December 31, 2011 and 2010 by level within the fair value hierarchy (amounts in thousands):
| | | | | | | | | | | | | |
| | December 31, 2011 | |
|---|
| | Level 1 | | Level 2 | | Level 3 | | Total | |
|---|
Assets: | | | | | | | | | | | | | |
Real estate securities, available for sale: | | | | | | | | | | | | | |
CMBS | | $ | — | | $ | 936,315 | | $ | 336,421 | | $ | 1,272,736 | |
Third-party CDO notes | | | — | | | — | | | 63,567 | | | 63,567 | |
Unsecured REIT debt | | | — | | | 90,824 | | | 3,474 | | | 94,298 | |
Trust preferred securities | | | — | | | — | | | 19,145 | | | 19,145 | |
Agency debentures | | | — | | | 23,559 | | | — | | | 23,559 | |
| | | | | | | | | | |
Subtotal real estate securities, available for sale | | | — | | | 1,050,698 | | | 422,607 | | | 1,473,305 | |
Derivative assets | | | — | | | 5,735 | | | — | | | 5,735 | |
| | | | | | | | | | |
Total assets | | $ | — | | $ | 1,056,433 | | $ | 422,607 | | $ | 1,479,040 | |
| | | | | | | | | | |
Liabilities: | | | | | | | | | | | | | |
CDO bonds payable(1) | | $ | — | | $ | — | | $ | 2,145,239 | | $ | 2,145,239 | |
Junior subordinated notes | | | — | | | — | | | 157,168 | | | 157,168 | |
Derivative liabilities | | | — | | | 234,674 | | | — | | | 234,674 | |
| | | | | | | | | | |
Total liabilities | | $ | — | | $ | 234,674 | | $ | 2,302,407 | | $ | 2,537,081 | |
| | | | | | | | | | |
- (1)
- Excludes CapLease CDO bonds payable for which the fair value option was not elected.
| | | | | | | | | | | | | |
| | December 31, 2010 | |
|---|
| | Level 1 | | Level 2 | | Level 3 | | Total | |
|---|
Assets: | | | | | | | | | | | | | |
Real estate securities, available for sale: | | | | | | | | | | | | | |
CMBS | | $ | — | | $ | 1,016,372 | | $ | 375,727 | | $ | 1,392,099 | |
Third-party CDO notes | | | — | | | — | | | 37,213 | | | 37,213 | |
Unsecured REIT debt | | | — | | | 182,106 | | | 54,852 | | | 236,958 | |
Trust preferred securities | | | — | | | — | | | 24,784 | | | 24,784 | |
| | | | | | | | | | |
Subtotal real estate securities, available for sale | | | — | | | 1,198,478 | | | 492,576 | | | 1,691,054 | |
Derivative assets | | | — | | | 59 | | | — | | | 59 | |
| | | | | | | | | | |
Total assets | | $ | — | | $ | 1,198,537 | | $ | 492,576 | | $ | 1,691,113 | |
| | | | | | | | | | |
Liabilities: | | | | | | | | | | | | | |
CDO bonds payable | | $ | — | | $ | — | | $ | 2,258,805 | | $ | 2,258,805 | |
Junior subordinated notes | | | — | | | — | | | 191,250 | | | 191,250 | |
Derivative liabilities | | | — | | | 220,689 | | | — | | | 220,689 | |
| | | | | | | | | | |
Total liabilities | | $ | — | | $ | 220,689 | | $ | 2,450,055 | | $ | 2,670,744 | |
| | | | | | | | | | |
The following table presents additional information about the Company's real estate securities, certain CDO bonds payable and junior subordinated notes which are measured at fair value on a
128
Table of Contents
NORTHSTAR REALTY FINANCE CORP. AND SUBSIDIARIES
NOTES TO CONSOLIDATED FINANCIAL STATEMENTS (Continued)
Amounts in Thousands, Except per Share Data
4. Fair Value (Continued)
recurring basis as of December 31, 2011 and 2010, for which the Company has utilized Level 3 inputs to determine fair value (amounts in thousands):
| | | | | | | | | | | | | | | | | | | |
| | December 31, 2011 | | December 31, 2010 | |
|---|
| | Real Estate
Securities | | CDO Bonds
Payable | | Junior
Subordinated
Notes | | Real Estate
Securities | | CDO Bonds
Payable | | Junior
Subordinated
Notes | |
|---|
Beginning balance: | | $ | 492,576 | | $ | 2,258,805 | | $ | 191,250 | | $ | 309,505 | | $ | 1,141,096 | | $ | 167,035 | |
Transfers into Level 3(1) | | | 469,209 | | | — | | | — | | | 537,955 | | | — | | | — | |
Transfers out of Level 3(1) | | | (434,036 | ) | | — | | | — | | | (446,674 | ) | | — | | | — | |
Purchases / borrowings | | | 146,152 | | | 65,199 | | | — | | | 274,517 | | | 737,691 | | | — | |
Sales | | | (111,437 | ) | | — | | | — | | | (191,623 | ) | | — | | | — | |
Paydowns | | | (23,361 | ) | | (325,989 | ) | | — | | | (18,697 | ) | | (271,316 | ) | | — | |
Repurchases | | | — | | | (75,316 | ) | | — | | | — | | | (16,231 | ) | | — | |
Losses (realized or unrealized) | | | | | | | | | | | | | | | | | | | |
Included in earnings | | | (216,939 | ) | | 225,186 | | | — | | | (132,851 | ) | | 667,974 | | | 24,215 | |
Included in other comprehensive income (loss) | | | (7,676 | ) | | — | | | — | | | — | | | — | | | — | |
Gains (realized or unrealized) | | | | | | | | | | | | | | | | | | | |
Included in earnings | | | 108,109 | | | (2,646 | ) | | (34,082 | ) | | 160,444 | | | (409 | ) | | — | |
Included in other comprehensive income (loss) | | | 10 | | | — | | | — | | | — | | | — | | | — | |
| | | | | | | | | | | | | | |
Ending balance: | | $ | 422,607 | | $ | 2,145,239 | | $ | 157,168 | | $ | 492,576 | | $ | 2,258,805 | | $ | 191,250 | |
| | | | | | | | | | | | | | |
Gains (losses) included in earnings attributable to the change in unrealized gains (losses) relating to assets or liabilities still held. | |
$ |
(121,258 |
) |
$ |
(197,053 |
) |
$ |
34,082 | |
$ |
27,593 | |
$ |
(667,974 |
) |
$ |
(24,215 |
) |
| | | | | | | | | | | | | | |
- (1)
- Transfers between Level 2 and Level 3 represent a fair value measurement from a third-party pricing service or a broker quotation that has become less observable during the period. Transfers are assumed to occur at the beginning of the period.
There were no transfers, other than those identified in the table above, during the years ended December 31, 2011 and 2010. The Company's non-recurring financial measurements include the measurement of impairment on real estate debt and investments in unconsolidated ventures. These measurements are considered Level 3 fair value measurements. Refer to Note 7 for a further discussion of impairment on our real estate debt and Note 8 for a discussion of impairment on investments in unconsolidated ventures.
Fair Value Option
The Company has generally elected to apply the fair value option of accounting to the following financial assets and liabilities existing at the time of adoption or at the time the Company recognizes the eligible item for the purpose of consistent accounting application: real estate securities; CDO bonds payable; and junior subordinated notes. The Company may decide not to elect the fair value option for certain of its financial assets or liabilities due to the nature of the instrument. As of December 31, 2011, the Company had ten real estate securities with a total carrying value of $96.4 million for which the fair value option was not elected and the CapLease CDO bonds payable with a carrying value of $128.7 million for which the fair value option was not elected.
129
Table of Contents
NORTHSTAR REALTY FINANCE CORP. AND SUBSIDIARIES
NOTES TO CONSOLIDATED FINANCIAL STATEMENTS (Continued)
Amounts in Thousands, Except per Share Data
4. Fair Value (Continued)
The following table sets forth the fair value of the Company's financial instruments for which the fair value option was elected (amounts in thousands):
| | | | | | | |
| | December 31, | |
|---|
| | 2011 | | 2010 | |
|---|
Assets: | | | | | | | |
Real estate securities, available for sale:(1) | | | | | | | |
CMBS | | $ | 1,199,660 | | $ | 1,392,099 | |
Third-party CDO notes | | | 40,231 | | | 37,213 | |
Unsecured REIT debt | | | 94,298 | | | 236,958 | |
Trust preferred securities | | | 19,145 | | | 24,784 | |
Agency debentures | | | 23,559 | | | — | |
| | | | | | |
Total assets | | $ | 1,376,893 | | $ | 1,691,054 | |
| | | | | | |
Liabilities: | | | | | | | |
CDO bonds payable(2) | | $ | 2,145,239 | | $ | 2,258,805 | |
Junior subordinated notes | | | 157,168 | | | 191,250 | |
| | | | | | |
Total liabilities | | $ | 2,302,407 | | $ | 2,450,055 | |
| | | | | | |
- (1)
- December 31, 2011 excludes ten securities with a carrying value of $96.4 million for which the fair value option was not elected.
- (2)
- December 31, 2011 excludes CapLease CDO bonds payable with a carrying value of $128.7 million for which the fair value option was not elected.
The following table presents the difference between the fair value and the aggregate principal amount of assets and liabilities, for which the fair value option has been elected (amounts in thousands):
| | | | | | | | | | |
| | Fair Value at
December 31,
2011 | | Amount
Due Upon
Maturity | | Difference | |
|---|
Assets: | | | | | | | | | | |
Real estate securities, available for sale: | | | | | | | | | | |
CMBS(1)(2) | | $ | 1,199,660 | | $ | 2,696,091 | | $ | (1,496,431 | ) |
Third-party CDO notes | | | 40,231 | | | 226,117 | | | (185,886 | ) |
Unsecured REIT debt | | | 94,298 | | | 94,236 | | | 62 | |
Trust preferred securities | | | 19,145 | | | 40,000 | | | (20,855 | ) |
Agency debentures | | | 23,559 | | | 63,000 | | | (39,441 | ) |
| | | | | | | | |
Total assets | | $ | 1,376,893 | | $ | 3,119,444 | | $ | (1,742,551 | ) |
| | | | | | | | |
Liabilities: | | | | | | | | | | |
CDO bonds payable(3) | | $ | 2,145,239 | | $ | 3,975,176 | | $ | (1,829,937 | ) |
Junior subordinated notes | | | 157,168 | | | 280,117 | | | (122,949 | ) |
| | | | | | | | |
Total liabilities | | $ | 2,302,407 | | $ | 4,255,293 | | $ | (1,952,886 | ) |
| | | | | | | | |
- (1)
- Excludes ten securities for which the fair value option was not elected.
- (2)
- Includes interest-only CMBS with carrying values totaling $2.5 million that have no amounts due upon maturity but have notional amounts upon which cash flows are paid and received as interest only.
- (3)
- Excludes the CapLease CDO bonds payable for which the fair value option was not elected.
130
Table of Contents
NORTHSTAR REALTY FINANCE CORP. AND SUBSIDIARIES
NOTES TO CONSOLIDATED FINANCIAL STATEMENTS (Continued)
Amounts in Thousands, Except per Share Data
4. Fair Value (Continued)
For the years ended December 31, 2011, 2010 and 2009, the Company recognized a net loss of $349.1 million, $397.9 million and $156.8 million, respectively, related to assets and liabilities for which the fair value option was elected. These amounts are recorded as unrealized gain (loss) on investments and other in the Company's consolidated statements of operations. The net loss for the year ended December 31, 2009 does not include amounts related to N-Star CDOs I, II, III and V, as these CDO financing transactions were unconsolidated prior to January 1, 2010.
The impact of changes in instrument-specific credit spreads on CDO bonds payable and junior subordinated notes for which the fair value option was elected was a net loss of $163.0 million, $692.2 million and $148.5 million, for the years ended December 31, 2011, 2010 and 2009, respectively. The Company attributes changes in the fair value of floating-rate liabilities to changes in instrument-specific credit spreads. For fixed-rate liabilities, the Company attributes changes in fair value to interest rate-related and instrument-specific credit spread changes.
Fair Value of Financial Instruments
In addition to the above disclosures regarding assets or liabilities which are recorded at fair value, U.S. GAAP requires disclosure of fair value about all financial instruments. Estimated fair value of financial instruments was determined by the Company, using available market information and appropriate valuation methodologies. Considerable judgment is necessary to interpret market data and develop estimated fair values. Accordingly, the estimates presented herein are not necessarily indicative of the amounts the Company could realize on disposition of the financial instruments. The use of different market assumptions and/or estimation methodologies may have a material effect on estimated fair value.
131
Table of Contents
NORTHSTAR REALTY FINANCE CORP. AND SUBSIDIARIES
NOTES TO CONSOLIDATED FINANCIAL STATEMENTS (Continued)
Amounts in Thousands, Except per Share Data
4. Fair Value (Continued)
The following table summarizes the estimated fair value for all financial assets and liabilities as of December 31, 2011 (amounts in thousands):
| | | | | | | | | | |
| | Principal/Notional
Amount | | Carrying
Value | | Fair
Value | |
|---|
Financial assets: | | | | | | | | | | |
Cash and cash equivalents(1) | | $ | 144,508 | | $ | 144,508 | | $ | 144,508 | |
Restricted cash(1) | | | 298,364 | | | 298,364 | | | 298,364 | |
Real estate securities, available for sale(2) | | | 3,234,145 | | | 1,473,305 | | | 1,473,305 | |
Real estate debt investments, net | | | 2,354,932 | | | 1,710,582 | | | 1,609,517 | |
Receivables, net of allowance(1) | | | 31,488 | | | 31,488 | | | 31,488 | |
Receivables, related parties(1) | | | 5,979 | | | 5,979 | | | 5,979 | |
Derivative assets(2)(3) | | | 468,500 | | | 5,735 | | | 5,735 | |
Financial liabilities: | | | | | | | | | | |
CDO bonds payable(2) | | $ | 4,125,769 | | $ | 2,273,907 | | $ | 2,273,253 | |
Mortgage notes payable | | | 783,257 | | | 783,257 | | | 801,710 | |
Credit facility | | | 64,259 | | | 64,259 | | | 64,259 | |
Secured term loan | | | 14,682 | | | 14,682 | | | 15,443 | |
Exchangeable senior notes | | | 228,665 | | | 215,853 | | | 221,948 | |
Junior subordinated notes(2) | | | 280,117 | | | 157,168 | | | 157,168 | |
Accounts payable and accrued expenses(1) | | | 66,622 | | | 66,622 | | | 66,622 | |
Escrow deposits payable(1) | | | 52,856 | | | 52,856 | | | 52,856 | |
Derivative liabilities(2)(3) | | | 1,836,972 | | | 234,674 | | | 234,674 | |
- (1)
- Carrying value approximates fair value due to the short-term maturities of these items.
- (2)
- Refer to the "Determination of Fair Value" above for a discussion of methodologies used to determine fair value.
- (3)
- Derivative assets and liabilities exclude timing swaps with a notional amount of $288.8 million.
Disclosure about fair value of financial instruments is based on pertinent information available to management as of December 31, 2011. Although management is not aware of any factors that would significantly affect fair value, such amounts have not been comprehensively revalued for purposes of these consolidated financial statements since that date and current estimates of fair value may differ significantly from the amounts presented herein.
Real Estate Debt Investments
For real estate debt investments, fair value of the fixed and floating-rate investments was approximated by comparing yields at which the investments are held to estimated yields at which loans originated with similar credit risk or market yields at which a third party might require to purchase the investment by discounting future cash flows at such market yields. Prices were calculated assuming fully-extended maturities regardless of structural or economic tests required to achieve such extended
132
Table of Contents
NORTHSTAR REALTY FINANCE CORP. AND SUBSIDIARIES
NOTES TO CONSOLIDATED FINANCIAL STATEMENTS (Continued)
Amounts in Thousands, Except per Share Data
4. Fair Value (Continued)
maturities. For any real estate debt investments that are deemed impaired, carrying value approximates fair value.
Mortgage Notes Payable
For fixed-rate mortgage notes payable, the Company uses rates currently available with similar terms and remaining maturities to estimate their fair value.
Credit Facility
The Company entered into two term credit facilities in the fourth quarter 2011 that bear floating rates of interest. As of December 31, 2011, the Company had an amount outstanding under one of the facilities and believes the carrying value approximates fair value.
Exchangeable Senior Notes
For the exchangeable senior notes, the Company uses available market information, which includes quoted market prices or recent transactions, if available, to estimate their fair value.
The following table summarizes the exchangeable senior notes at December 31, 2011 (amounts in thousands):
| | | | | | | | | | |
| | Principal
Amount | | Carrying
Value | | Fair
Value | |
|---|
7.25% Notes | | $ | 20,455 | | $ | 20,396 | | $ | 20,328 | |
11.50% Notes | | | 35,710 | | | 35,389 | | | 38,435 | |
7.50% Notes | | | 172,500 | | | 160,068 | | | 163,185 | |
| | | | | | | | |
Total | | $ | 228,665 | | $ | 215,853 | | $ | 221,948 | |
| | | | | | | | |
Secured Term Loans
Secured term loans include the Company's Term Asset-Backed Securities Loan Facility ("TALF") borrowing. The estimated fair value is based on interest rates available for issuance of debt with similar terms and remaining maturities.
133
Table of Contents
NORTHSTAR REALTY FINANCE CORP. AND SUBSIDIARIES
NOTES TO CONSOLIDATED FINANCIAL STATEMENTS (Continued)
Amounts in Thousands, Except per Share Data
5. Operating Real Estate
At December 31, 2011 and 2010, operating real estate, net consists of the following (amounts in thousands):
| | | | | | | |
| | December 31, | |
|---|
| | 2011 | | 2010 | |
|---|
Land | | $ | 215,073 | | $ | 146,780 | |
Buildings and improvements | | | 903,250 | | | 838,539 | |
Leasehold interests | | | 15,568 | | | 18,288 | |
Tenant improvements | | | 67,074 | | | 33,351 | |
Furniture and fixtures | | | 6,554 | | | 7,698 | |
Capital leases | | | — | | | 1,836 | |
| | | | | | |
Subtotal(1) | | | 1,207,519 | | | 1,046,492 | |
Less: Accumulated depreciation | | | (118,070 | ) | | (108,430 | ) |
| | | | | | |
Operating real estate, net(2) | | $ | 1,089,449 | | $ | 938,062 | |
| | | | | | |
- (1)
- As of December 31, 2011, includes $319.7 million of REO. There was no REO as of December 31, 2010.
- (2)
- As of December 31, 2011 and 2010, operating real estate was subject to $783.3 million and $803.1 million of mortgage notes payable, respectively.
For the years ended December 31, 2011, 2010 and 2009, depreciation expense was $29.7 million, $26.1 million and $28.3 million, respectively.
REO Held for Investment
For the year ended December 31, 2011, the Company acquired the following real estate in connection with a foreclosure (amounts in thousands):
| | | | | | | | |
| Date | | Type | | Location | | Carrying
Value of Loan
At Time of REO | |
|---|
March 2011 | | 32 Office/Flex Park | | Indianapolis, IN | | $ | 20,934 | |
April 2011 | | 12 Shopping Centers | | Phoenix, AZ | | | 13,452 | |
December 2011 | | Multifamily | | San Antonio, TX | | | 19,500 | |
December 2011 | | Multifamily | | Austin, TX | | | 23,207 | (1) |
| | | | | | | | |
Total | | | | | | $ | 77,093 | |
| | | | | | | | |
- (1)
- Includes a $16.5 million mortgage note payable that was refinanced with a third party contemporaneously with the foreclosure.
The Company has estimated the fair value of the assets and liabilities acquired at the date of acquisition. The final allocation of the purchase price is subject to refinement upon receipt of all
134
Table of Contents
NORTHSTAR REALTY FINANCE CORP. AND SUBSIDIARIES
NOTES TO CONSOLIDATED FINANCIAL STATEMENTS (Continued)
Amounts in Thousands, Except per Share Data
5. Operating Real Estate (Continued)
information requested related to the properties. In connection with such acquisitions, the Company recorded $53.7 million of intangible assets and $22.5 million of intangible liabilities.
The following summarizes the assets and liabilities in its consolidated balance sheets and rental income and net income (loss) in the consolidated statements of operations related to these acquisitions (amounts in thousands):
| | | | |
Assets: | | | | |
Restricted cash | | $ | 11,292 | |
Operating real estate, net | | | 288,770 | |
Deferred costs and intangible assets | | | 53,686 | |
Other assets | | | 1,298 | |
| | | | |
Total assets | | $ | 355,046 | |
| | | | |
Liabilities: | | | | |
Mortgage notes payable | | $ | 248,252 | |
Accounts payable and accrued expenses | | | 5,404 | |
Other liabilities | | | 24,297 | |
| | | | |
Total liabilities | | | 277,953 | |
Total equity | | | 77,093 | |
| | | | |
Total liabilities and equity | | $ | 355,046 | |
| | | | |
Amounts recognized since acquisition: | | | | |
Rental income | | $ | 18,627 | |
| | | | |
Net income (loss) | | $ | (9,887 | ) |
| | | | |
The supplemental unaudited pro forma financial information set forth below is based upon the Company's historical consolidated statements of operations for the years ended December 31, 2011, 2010 and 2009, adjusted to give effect of the above transactions as of January 1, 2009 (amounts in thousands, except per share data).
| | | | | | | | | | |
| | Year Ended December 31, | |
|---|
| | 2011 | | 2010 | | 2009 | |
|---|
Pro forma revenues | | $ | 539,184 | | $ | 472,501 | | $ | 284,899 | |
Pro forma net income (loss) | | | (260,419 | ) | | (391,430 | ) | | (148,821 | ) |
Pro forma net income (loss) per common share—basic/diluted | | | (2.91 | ) | | (5.11 | ) | | (2.13 | ) |
The supplemental pro forma financial information is presented for informational purposes only and may not be indicative of what actual results of operations would have been had the transaction occurred January 1, 2009, nor does it purport to represent the results of future operations.
135
Table of Contents
NORTHSTAR REALTY FINANCE CORP. AND SUBSIDIARIES
NOTES TO CONSOLIDATED FINANCIAL STATEMENTS (Continued)
Amounts in Thousands, Except per Share Data
5. Operating Real Estate (Continued)
Other REO Acquisitions
The Company acquired the following other REO in connection with a foreclosure during 2011 (amounts in thousands):
| | | | | | | | | | | |
Date | | Type | | Location | | Original
Loan
Balance | | Initial
REO
Value | |
|---|
May 2011 | | Timeshare | | Siesta Key, FL(1) | | $ | 37,878 | | $ | 8,461 | |
May 2011 | | Land | | Aventura, FL | | | 13,961 | | | 2,301 | |
August 2011 | | Office | | Newark, CA | | | 9,326 | | | 9,018 | |
December 2011 | | Land | | Buckhead, GA | | | 24,152 | | | 24,332 | |
December 2011 | | Office | | Philadelphia, PA | | | 5,735 | | | 5,153 | |
| | | | | | | | | | |
Total | | | | | | $ | 91,052 | | $ | 49,265 | |
| | | | | | | | | | |
- (1)
- Upon acquisition, the asset was recorded net of $6.2 million of restricted cash received from the borrower in connection with its guaranty obligation under the loan terms.
The timeshare property is classified in other assets. REO acquired in May 2011 is classified in assets held for sale as of December 31, 2011, and was sold in January 2012. REO acquired in August 2011 was sold in November 2011. The remaining two REO acquired in December 2011 are classified in operating real estate, net as of December 31, 2011.
Operating Real Estate Sales
The Company completed the following sales of operating real estate for the years ended December 31, 2011, 2010 and 2009 (amounts in thousands):
| | | | | | | | | | | |
Date | | Type | | Location | | Sales
Proceeds | | Realized
Gain (Loss) | |
|---|
April 2011 | | Healthcare | | Various—WI | | $ | 99,569 | | $ | 9,416 | |
March 2011 | | Retail | | New York, NY | | | 6,889 | | | 4,981 | |
August 2011 | | Multifamily | | Norcross, GA | | | 7,122 | | | 2,918 | |
Other | | Office | | Various | | | 17,004 | | | (117 | ) |
| | | | | | | | | | |
Total 2011 | | | | | | $ | 130,584 | | $ | 17,198 | |
| | | | | | | | | | |
May 2010 | | Retail | | New York, NY | | $ | 3,078 | | $ | 2,528 | |
| | | | | | | | | | |
December 2009 | | Healthcare | | Various—NC | | $ | 91,546 | | $ | 13,799 | |
| | | | | | | | | | |
In addition, the Company sold 15 timeshare units in 2011 for total sales proceeds of $7.0 million, including seller financing of $2.2 million, resulting in a realized gain of $3.7 million. The Company defers gain on sale to the extent of its continuing involvement in the asset being sold.
136
Table of Contents
NORTHSTAR REALTY FINANCE CORP. AND SUBSIDIARIES
NOTES TO CONSOLIDATED FINANCIAL STATEMENTS (Continued)
Amounts in Thousands, Except per Share Data
5. Operating Real Estate (Continued)
Discontinued Operations
The following table sets forth the major classes of assets and liabilities of properties classified as held for sale at December 31, 2011 and December 31, 2010 (amounts in thousands):
| | | | | | | |
| | December 31, | |
|---|
| | 2011 | | 2010 | |
|---|
Assets | | | | | | | |
Operating real estate, net | | $ | 3,198 | | $ | 13,141 | |
| | | | | | |
Assets of properties held for sale | | $ | 3,198 | | $ | 13,141 | |
| | | | | | |
Liabilities | | | | | | | |
Accounts payable and accrued expenses | | $ | — | | $ | 131 | |
| | | | | | |
Liabilities of properties held for sale | | $ | — | | $ | 131 | |
| | | | | | |
The following table summarizes income from discontinued operations and related gain on sale of discontinued operations for the years ended December 31, 2011, 2010 and 2009 (amounts in thousands):
| | | | | | | | | | |
| | Year Ended December 31, | |
|---|
| | 2011 | | 2010 | | 2009 | |
|---|
Revenue: | | | | | | | | | | |
Rental and escalation income | | $ | 4,909 | | $ | 10,428 | | $ | 17,856 | |
Interest and other income | | | 219 | | | 148 | | | 4 | |
| | | | | | | | |
Total revenue | | | 5,128 | | | 10,576 | | | 17,860 | |
| | | | | | | | |
Expenses: | | | | | | | | | | |
Property operating expenses | | | 1,372 | | | 905 | | | 214 | |
Interest expense | | | 2,177 | | | 5,185 | | | 9,343 | |
Auditing and professional fees | | | 61 | | | 106 | | | 31 | |
Other general and administrative expenses | | | 2,016 | | | 1,442 | | | 285 | |
Impairment on operating real estate | | | — | | | 1,180 | | | — | |
Depreciation and amortization | | | 792 | | | 2,683 | | | 4,818 | |
| | | | | | | | |
Total expenses | | | 6,418 | | | 11,501 | | | 14,691 | |
| | | | | | | | |
Income (loss) from discontinued operations | | | (1,290 | ) | | (925 | ) | | 3,169 | |
Gain on disposition of discontinued operations | | | 17,198 | | | 2,528 | | | 13,799 | |
| | | | | | | | |
Total income from discontinued operations | | $ | 15,908 | | $ | 1,603 | | $ | 16,968 | |
| | | | | | | | |
Midwest Holdings
On March 31, 2011, the Company sold its 100% common membership interest in Midwest Care Holdco TRS I LLC ("Midwest Holdings") and assigned all of its rights, title, obligations and other interests in Midwest Holdings to the purchaser and contemporaneously entered into a new lease
137
Table of Contents
NORTHSTAR REALTY FINANCE CORP. AND SUBSIDIARIES
NOTES TO CONSOLIDATED FINANCIAL STATEMENTS (Continued)
Amounts in Thousands, Except per Share Data
5. Operating Real Estate (Continued)
agreement with an affiliate of the purchaser. As of March 31, 2011, the operations of Midwest Holdings were deconsolidated. The Company recognized a realized loss of $0.5 million in connection with the sale and deconsolidation of its common membership interest, which is included in realized gain (loss) on investments and other in the consolidated statements of operations.
6. Real Estate Securities, Available for Sale
At December 31, 2011, the Company held the following real estate securities (amounts in thousands):
| | | | | | | | | | | | | | | | | | | | | | |
Asset Type:
| | Number | | Principal
Amount | | Amortized
Cost | | Cumulative
Unrealized
(Loss) Gain on
Investments(1) | | Fair
Value(2) | | Weighted
Average
Coupon | | Weighted
Average
Yield(3) | |
|---|
CMBS | | | 618 | | $ | 2,767,828 | | $ | 1,964,843 | | $ | (692,107 | ) | $ | 1,272,736 | | | 4.42 | % | | 9.72 | % |
Third-party CDO notes | | | 44 | | | 269,081 | | | 210,080 | | | (146,513 | ) | | 63,567 | | | 0.86 | % | | 10.80 | % |
Unsecured REIT debt | | | 22 | | | 94,236 | | | 88,870 | | | 5,428 | | | 94,298 | | | 5.99 | % | | 2.75 | % |
Trust preferred securities | | | 5 | | | 40,000 | | | 35,105 | | | (15,960 | ) | | 19,145 | | | 2.47 | % | | 10.06 | % |
Agency debentures | | | 4 | | | 63,000 | | | 16,659 | | | 6,900 | | | 23,559 | | | NA | | | 3.84 | % |
| | | | | | | | | | | | | | | | |
Total | | | 693 | | $ | 3,234,145 | | $ | 2,315,557 | | $ | (842,252 | ) | $ | 1,473,305 | | | 4.06 | % | | 9.50 | % |
| | | | | | | | | | | | | | | | |
- (1)
- Includes ten securities for which the fair value option was not elected, representing $7.5 million net unrealized losses included in other comprehensive income (loss).
- (2)
- $1,358.3 million in fair value served as collateral for the Company's consolidated CDO financing transactions and $73.1 million served as collateral under the Company's CMBS Facility (refer to Note 9) as of December 31, 2011. The remainder is either financed under other borrowing arrangements or unleveraged.
- (3)
- Based on expected maturity and for floating-rate securities, calculated using LIBOR as of December 31, 2011.
The CMBS portfolio at December 31, 2011 is comprised of 618 assets that are predominantly conduit CMBS, meaning each asset is a pool backed by a large number of commercial real estate loans. As a result, the portfolio is typically well-diversified by collateral type and geography. At December 31, 2011, contractual maturities of the CRE securities portfolio ranged from six months to 44 years and the weighted average expected maturity of the CRE securities was 4.3 years.
138
Table of Contents
NORTHSTAR REALTY FINANCE CORP. AND SUBSIDIARIES
NOTES TO CONSOLIDATED FINANCIAL STATEMENTS (Continued)
Amounts in Thousands, Except per Share Data
6. Real Estate Securities, Available for Sale (Continued)
At December 31, 2010, the Company held the following real estate securities (amounts in thousands):
| | | | | | | | | | | | | | | | | | | | | | |
Asset Type:
| | Number | | Principal
Amount | | Amortized
Cost | | Cumulative
Unrealized
(Loss) Gain on
Investments | | Fair
Value(1) | | Weighted
Average
Coupon | | Weighted
Average
Yield(2) | |
|---|
CMBS | | | 638 | | $ | 2,844,090 | | $ | 2,040,582 | | $ | (648,483 | ) | $ | 1,392,099 | | | 4.20 | % | | 9.34 | % |
Third-party CDO notes | | | 40 | | | 206,620 | | | 174,537 | | | (137,324 | ) | | 37,213 | | | 1.13 | % | | 13.15 | % |
Unsecured REIT debt | | | 51 | | | 224,366 | | | 222,112 | | | 14,846 | | | 236,958 | | | 6.30 | % | | 4.52 | % |
Trust preferred securities | | | 5 | | | 40,000 | | | 34,917 | | | (10,133 | ) | | 24,784 | | | 2.28 | % | | 10.30 | % |
| | | | | | | | | | | | | | | | |
Total | | | 734 | | $ | 3,315,076 | | $ | 2,472,148 | | $ | (781,094 | ) | $ | 1,691,054 | | | 4.13 | % | | 9.26 | % |
| | | | | | | | | | | | | | | | |
- (1)
- $1.7 billion in fair value served as collateral for the Company's consolidated CDO financing transactions as of December 31, 2010. The remainder is either financed under other borrowing facilities or unleveraged.
- (2)
- Based on expected maturity and for floating-rate securities, calculated using LIBOR as of December 31, 2010.
During the years ended December 31, 2011, 2010 and 2009, proceeds from the sale and redemption of real estate securities and the related realized gain (loss) is summarized as follows (amounts in thousands):
| | | | | | | | | | |
| | Number | | Sale
Proceeds | | Realized
Gain (Loss) | |
|---|
2011 | | | 102 | | $ | 361,873 | | $ | 33,153 | |
2010 | | | 85 | | | 302,379 | | | 75,799 | |
2009(1) | | | 105 | | | 210,399 | | | 73,963 | |
- (1)
- Proceeds and realized gains from the sale of CRE securities for the year ended December 31, 2009 does not include the activity of N-Star CDOs I, II, III and V as these CDO financing transactions were not consolidated prior to January 1, 2010.
The Company's securities portfolio includes ten securities for which the fair value option was not elected. As of December 31, 2011, the carrying value of these securities was $96.4 million representing a $7.5 million net unrealized loss included in other comprehensive income (loss). For securities with an unrealized loss as of December 31, 2011, such unrealized loss was for a period of less than 12 months. Based on management's quarterly evaluation, no OTTI was identified related to these securities. The Company does not intend to sell these securities and it is more likely than not that the Company will not be required to sell these securities prior to recovery of its amortized cost basis, which may be at maturity. As of December 31, 2010, there were no securities for which the fair value option was not elected.
139
Table of Contents
NORTHSTAR REALTY FINANCE CORP. AND SUBSIDIARIES
NOTES TO CONSOLIDATED FINANCIAL STATEMENTS (Continued)
Amounts in Thousands, Except per Share Data
7. Real Estate Debt Investments
At December 31, 2011, the Company held the following real estate debt investments (amounts in thousands):
| | | | | | | | | | | | | | | | | | | | | | | | | | | | |
| |
| |
| |
| |
| | Weighted Average | |
| |
|---|
Asset Type:
| | Number | | Principal
Amount | | Carrying
Value(1)(2) | | Allocation by
Investment
Type(3) | | Fixed
Rate | | Spread Over
LIBOR(4) | | Spread Over
Prime | | Yield(5) | | Floating Rate as
% of Principal
Amount | |
|---|
First mortgage loans | | | 75 | | $ | 1,552,066 | | $ | 1,094,957 | | | 65.9 | % | | 4.77 | % | | 2.72 | % | | 3.30 | % | | 5.27 | % | | 92.4 | % |
Mezzanine loans | | | 17 | | | 426,709 | | | 334,317 | | | 18.1 | % | | 6.43 | % | | 2.21 | % | | — | | | 3.96 | % | | 62.6 | % |
Subordinate mortgage interests | | | 9 | | | 159,289 | | | 96,565 | | | 6.8 | % | | 6.40 | % | | 3.51 | % | | — | | | 5.63 | % | | 81.4 | % |
Credit tenant loans(6) | | | 55 | | | 147,426 | | | 140,342 | | | 6.3 | % | | 6.49 | % | | — | | | — | | | 6.95 | % | | 0.0 | % |
Term loans | | | 6 | | | 69,442 | | | 44,401 | | | 2.9 | % | | 7.75 | % | | 3.50 | % | | — | | | 5.05 | % | | 15.4 | % |
| | | | | | | | | | | | | | | | | | | | |
Total/Weighted average | | | 162 | | $ | 2,354,932 | | $ | 1,710,582 | | | 100.0 | % | | 6.21 | % | | 2.70 | % | | 3.30 | % | | 5.17 | % | | 78.2 | % |
| | | | | | | | | | | | | | | | | | | | |
- (1)
- $1.6 billion in carrying value served as collateral for the Company's consolidated CDO financing transactions and the remainder is unleveraged. The Company has future funding commitments, which are subject to certain conditions that borrowers must meet to qualify for such fundings, totaling $55.7 million. The Company expects that $51.7 million of these commitments will be funded from the Company's CDO financing transactions and require no additional capital from the Company. Assuming that all loans that have future fundings meet the terms to qualify for such funding, the Company's cash requirement on future fundings would be $4.0 million.
- (2)
- Includes 15 loans with a $92.3 million carrying value on non-accrual status, which were primarily first mortgage loans. Four of these loans are classified as non-performing.
- (3)
- Based on principal amount.
- (4)
- $241.1 million principal amount of the Company's real estate debt investments have a weighted average LIBOR floor of 3.02%.
- (5)
- Based on initial maturity and for floating-rate debt, calculated using LIBOR as of December 31, 2011, and for debt with a LIBOR floor, using such floor.
- (6)
- Includes 23 corporate credit notes with $12.8 million principal amount and $12.7 million carrying value.
At December 31, 2010, the Company held the following real estate debt investments (amounts in thousands):
| | | | | | | | | | | | | | | | | | | | | | | | | | | | |
| |
| |
| |
| |
| | Weighted Average | |
| |
|---|
Asset Type:
| | Number | | Principal
Amount | | Carrying
Value(1)(2) | | Allocation by
Investment
Type(3) | | Fixed Rate | | Spread Over
LIBOR(4) | | Spread Over
Prime | | Yield(5) | | Floating Rate as
% of Principal
Amount | |
|---|
First mortgage loans | | | 94 | | $ | 1,845,464 | | $ | 1,161,298 | | | 67.8 | % | | 5.74 | % | | 2.79 | % | | 3.32 | % | | 6.15 | % | | 88.8 | % |
Mezzanine loans | | | 24 | | | 551,591 | | | 458,904 | | | 20.3 | % | | 5.56 | % | | 2.81 | % | | — | | | 3.91 | % | | 73.4 | % |
Subordinate mortgage interests | | | 13 | | | 249,337 | | | 168,200 | | | 9.1 | % | | 7.25 | % | | 3.06 | % | | — | | | 4.46 | % | | 88.4 | % |
Credit tenant loans | | | 6 | | | 5,732 | | | 5,732 | | | 0.2 | % | | 6.74 | % | | — | | | — | | | 6.74 | % | | 0.0 | % |
Term loans | | | 5 | | | 70,750 | | | 46,291 | | | 2.6 | % | | 7.75 | % | | 2.50 | % | | — | | | 8.13 | % | | 16.2 | % |
| | | | | | | | | | | | | | | | | | | | |
Total/Weighted average | | | 142 | | $ | 2,722,874 | | $ | 1,840,425 | | | 100.0 | % | | 6.06 | % | | 2.82 | % | | 3.32 | % | | 5.60 | % | | 83.6 | % |
| | | | | | | | | | | | | | | | | | | | |
- (1)
- $1.7 billion carrying value served as collateral for the Company's consolidated CDO financing transactions, $44.0 million was financed under a borrowing facility and the remainder was unleveraged.
- (2)
- Includes five loans with an $18.7 million carrying value in real estate debt investments, held for sale and 17 loans with a $76.1 million carrying value on non-accrual status, which were primarily first mortgage loans.
- (3)
- Based on principal amount.
140
Table of Contents
NORTHSTAR REALTY FINANCE CORP. AND SUBSIDIARIES
NOTES TO CONSOLIDATED FINANCIAL STATEMENTS (Continued)
Amounts in Thousands, Except per Share Data
7. Real Estate Debt Investments (Continued)
- (4)
- $525.2 million principal amount of the Company's real estate debt investments had a weighted average LIBOR floor of 2.08%.
- (5)
- Based on initial maturity and for floating-rate debt, calculated using LIBOR as of December 31, 2010, and for debt with a LIBOR floor, using such floor.
During 2011, the Company sold 11 loans for a net realized gain of $84.3 million, which is included in realized gain (loss) on investments and other in the consolidated statements of operations.
Maturities of principal amounts of real estate debt investments at December 31, 2011 are as follows (amounts in thousands):
| | | | | | | |
Years Ending December 31:
| | Initial
Maturity | | Maturity
Including
Extensions(1) | |
|---|
Delinquent | | $ | 50,962 | | $ | 50,962 | |
2012 | | | 635,989 | | | 285,211 | |
2013 | | | 210,473 | | | 184,255 | |
2014 | | | 531,496 | | | 260,921 | |
2015 | | | 284,731 | | | 622,375 | |
2016 | | | 231,766 | | | 382,761 | |
Thereafter | | | 409,515 | | | 568,447 | |
| | | | | | |
Total | | $ | 2,354,932 | | $ | 2,354,932 | |
| | | | | | |
- (1)
- Reflects modifications executed subsequent to December 31, 2011.
The aggregate carrying value of maturity-defaulted loans was $2.2 million as of December 31, 2011. The weighted average contractual maturity including extensions of the real estate debt investments is 4.1 years.
Actual maturities may differ from contractual maturities because certain borrowers have the right to prepay with or without prepayment penalties, and the Company may also extend contractual maturities in connection with loan modifications. The contractual amounts differ from the carrying values due to unamortized origination fees and costs, unamortized premiums and discounts and loan loss reserves being reported as part of the carrying value of the investment. At December 31, 2011, the Company had $452.1 million of unamortized discounts ($406.8 million related to the CSE CDO) and $4.6 million related to unamortized origination fees. Maturity Including Extensions assumes that all debt with extension options will qualify for extension at initial maturity according to the conditions stipulated in the related debt agreements.
In July 2010, in connection with the acquisition of the equity interests in the CSE CDO, we consolidated certain real estate debt investments with deteriorated credit quality. As of December 31, 2011, such debt had a principal amount of $411.0 million and a carrying value of $78.3 million, of which $56.9 million of the discount will be accreted. As of December 31, 2010, such debt had a principal amount of $857.6 million and a carrying value of $244.2 million, of which $72.3 million of the discount was expected to be accreted at that time. The change in the accreted amount during 2011 was due to loan sales and payoffs, foreclosures and changes to estimated recoverable amounts.
141
Table of Contents
NORTHSTAR REALTY FINANCE CORP. AND SUBSIDIARIES
NOTES TO CONSOLIDATED FINANCIAL STATEMENTS (Continued)
Amounts in Thousands, Except per Share Data
7. Real Estate Debt Investments (Continued)
The following table summarizes the status of the Company's performing and non-performing loans (amounts in thousands):
| | | | | | | | | | | | | | | | | | | | | | | | | | | | | | | |
| | Carrying Value as of December 31, 2011 | | Carrying Value as of December 31, 2010 | |
|---|
| | Loan
Count | | Performing
Loans | | Loan
Count | | Non-
Performing
Loans | | Total(1) | | Loan
Count | | Performing
Loans | | Loan
Count | | Non-
Performing
Loans | | Total(1) | |
|---|
Real Estate Debt Investments: | | | | | | | | | | | | | | | | | | | | | | | | | | | | | | | |
First mortgage loans | | | 73 | | $ | 1,103,839 | | | 2 | | $ | 12,500 | | $ | 1,116,339 | | | 90 | | $ | 1,145,297 | | | 10 | | $ | 42,716 | | $ | 1,188,013 | |
Mezzanine loans | | | 17 | | | 426,742 | | | — | | | — | | | 426,742 | | | 24 | | | 556,973 | | | — | | | — | | | 556,973 | |
Subordinate mortgage interests | | | 7 | | | 116,663 | | | 2 | | | 38,462 | | | 155,125 | | | 10 | | | 185,007 | | | 3 | | | 51,988 | | | 236,995 | |
Credit tenant loans | | | 55 | | | 140,342 | | | — | | | — | | | 140,342 | | | — | | | — | | | — | | | — | | | — | |
Term loans | | | 6 | | | 59,818 | | | — | | | — | | | 59,818 | | | 5 | | | 55,644 | | | — | | | — | | | 55,644 | |
| | | | | | | | | | | | | | | | | | | | | | |
Total real estate debt investments | | | 158 | | | 1,847,404 | | | 4 | | | 50,962 | | | 1,898,366 | | | 129 | | | 1,942,921 | | | 13 | | | 94,704 | | | 2,037,625 | |
Loan loss reserves | | | 15 | | | (139,001 | ) | | 3 | | | (48,783 | ) | | (187,784 | ) | | 13 | | | (158,418 | ) | | 2 | | | (38,782 | ) | | (197,200 | ) |
| | | | | | | | | | | | | | | | | | | | | | | | | | |
Total real estate debt investments, net | | | | | $ | 1,708,403 | | | | | $ | 2,179 | | $ | 1,710,582 | | | | | $ | 1,784,503 | | | | | $ | 55,922 | | $ | 1,840,425 | |
| | | | | | | | | | | | | | | | | | | | | | | | | | |
- (1)
- Includes five real estate debt investments classified as held for sale of $18.7 million as of December 31, 2010.
The Company's maximum additional exposure to loss related to the non-performing loans at December 31, 2011 is $2.2 million.
Provision for Loan Losses
For the year ended December 31, 2011, the Company recorded $53.0 million of provision for loan losses related to 12 loans. For the year ended December 31, 2010, the Company recorded $168.4 million of provision for loan losses related to 19 loans. For the year ended December 31, 2009, the Company recorded $83.7 million of provision for loan losses related to 15 loans.
Activity in loan loss reserves on real estate debt investments for the years ended December 31, 2011, 2010 and 2009, is as follows (amounts in thousands):
| | | | | | | | | | |
| | Year Ended December 31, | |
|---|
| | 2011 | | 2010 | | 2009 | |
|---|
Beginning balance | | $ | 197,200 | | $ | 77,400 | | $ | 11,200 | |
Provision for loan losses | | | 52,980 | | | 168,446 | | | 83,745 | |
N-Star CDO IX consolidation | | | — | | | 25,679 | | | — | |
Transfers to REO | | | (29,260 | ) | | (31,940 | ) | | (12,962 | ) |
Write-off and sales | | | (33,136 | ) | | (42,385 | ) | | (4,583 | ) |
| | | | | | | | |
Ending balance | | $ | 187,784 | | $ | 197,200 | | $ | 77,400 | |
| | | | | | | | |
142
Table of Contents
NORTHSTAR REALTY FINANCE CORP. AND SUBSIDIARIES
NOTES TO CONSOLIDATED FINANCIAL STATEMENTS (Continued)
Amounts in Thousands, Except per Share Data
7. Real Estate Debt Investments (Continued)
At December 31, 2011 and 2010, loan loss reserves are comprised of the following (amounts in thousands):
| | | | | | | | | | | | | | | | | | | | | | | | | |
| | December 31, 2011 | | December 31, 2010 | |
|---|
| Class of Debt: | | Number
of Loans | | Principal
Amount(1) | | Carrying Value(1) | | Loan Loss
Reserve | | Number
of Loans | | Principal
Amount(1) | | Carrying
Value(1) | | Loan Loss
Reserve | |
|---|
First mortgage loans | | | 3 | | $ | 70,690 | | $ | 49,132 | | $ | 21,383 | | | 3 | | $ | 68,320 | | $ | 47,165 | | $ | 20,984 | |
Subordinate mortgage interests | | | 4 | | | 60,562 | | | 2,002 | | | 58,560 | | | 3 | | | 73,697 | | | 4,835 | | | 68,795 | |
Mezzanine loans | | | 9 | | | 270,982 | | | 178,530 | | | 92,424 | | | 7 | | | 171,531 | | | 79,311 | | | 92,004 | |
Term loans | | | 2 | | | 51,613 | | | 27,154 | | | 15,417 | | | 2 | | | 51,613 | | | 27,154 | | | 15,417 | |
| | | | | | | | | | | | | | | | | | |
Total | | | 18 | | $ | 453,847 | | $ | 256,818 | | $ | 187,784 | | | 15 | | $ | 365,161 | | $ | 158,465 | | $ | 197,200 | |
| | | | | | | | | | | | | | | | | | |
- (1)
- Principal amount differs from carrying value due to unamortized origination fees and costs, unamortized premium/discount and loan loss reserves included in the carrying value of the investment. Excludes one non-performing loan with a principal amount of $0.9 million and two non-performing loans with a principal amount of $23.5 million that do not have a loan loss reserve as of December 31, 2011 and 2010, respectively.
Credit Quality Monitoring
The Company's CRE debt investments are typically secured by liens on real estate properties or by interests in entities that directly own real estate properties, which serve as the primary source of cash for the payment of principal and interest. The Company differentiates the relative credit quality of its debt investments principally based upon whether the collateral is currently paying contractual debt service and whether the Company believes it will be able to do so in the future, as well as the Company's expectations as to the ultimate recovery of principal at maturity. Those debt investments for which the Company expects to receive full payment of contractual principal and interest payments are categorized as "performing." The Company groups weaker credit quality debt investments that are currently performing, but for which it believes there is an impairment such that future collection of all principal and interest is in doubt, in a category called "performing with a credit reserve." The Company's weakest credit quality debt investments are generally non-performing loans ("NPL"). The Company categorizes a debt investment as an NPL if it is in maturity default and/or is past due at least 90 days on its contractual debt service payments.
143
Table of Contents
NORTHSTAR REALTY FINANCE CORP. AND SUBSIDIARIES
NOTES TO CONSOLIDATED FINANCIAL STATEMENTS (Continued)
Amounts in Thousands, Except per Share Data
7. Real Estate Debt Investments (Continued)
The following table is a summary of the carrying value of the real estate debt investments, by credit quality indicator, as of each applicable balance sheet date (amounts in thousands):
| | | | | | | |
| | December 31, | |
|---|
Credit Quality Indicator: | | 2011 | | 2010 | |
|---|
Non-performing loans: | | | | | | | |
First mortgage loans | | $ | 2,177 | | $ | 32,393 | |
Subordinate mortgage interests | | | 2 | | | 23,529 | |
| | | | | | |
Subtotal | | | 2,179 | | | 55,922 | |
Performing loans with a credit reserve: | | | | | | | |
First mortgage loans | | | 46,954 | | | 44,988 | |
Subordinate mortgage interests | | | 2,000 | | | 4,833 | |
Mezzanine loans | | | 178,531 | | | 79,311 | |
Term loans | | | 27,154 | | | 27,154 | |
| | | | | | |
Subtotal | | | 254,639 | | | 156,286 | |
Performing loans: | | | | | | | |
First mortgage loans | | | 1,045,825 | | | 1,083,918 | |
Subordinate mortgage interests | | | 94,563 | | | 139,838 | |
Mezzanine loans | | | 155,787 | | | 379,593 | |
Credit tenant loans | | | 140,342 | | | 5,732 | |
Term loans | | | 17,247 | | | 19,136 | |
| | | | | | |
Subtotal | | | 1,453,764 | | | 1,628,217 | |
| | | | | | |
Total | | $ | 1,710,582 | | $ | 1,840,425 | |
| | | | | | |
The following table summarizes the Company's average carrying value of impaired loans by type and the income recorded on such loans subsequent to their impairment during the years ended December 31, 2011, 2010 and 2009 (amounts in thousands):
| | | | | | | | | | | | | | | | | | | | | | | | | | | | |
| | December 31, | |
|---|
| | 2011 | | 2010 | | 2009 | |
|---|
Class of Debt:
| | Number
of Loans | | Average
Carrying
Value | | For the
Year
Ended
Income | | Number
of Loans | | Average
Carrying
Value | | For the
Year
Ended
Income | | Number
of Loans | | Average
Carrying
Value | | For the
Year
Ended
Income | |
|---|
First mortgage loans | | | 3 | | $ | 48,148 | | $ | 635 | | | 3 | | $ | 46,210 | | $ | 405 | | | 8 | | $ | 100,245 | | $ | 2,643 | |
Subordinate mortgage interests | | | 4 | | | 13,309 | | | 684 | | | 3 | | | 31,623 | | | 430 | | | 1 | | | 20,462 | | | 21 | |
Mezzanine loans | | | 9 | | | 188,740 | | | 10,410 | | | 7 | | | 111,836 | | | 2,745 | | | 4 | | | 59,338 | | | 2,532 | |
Term loans | | | 2 | | | 27,154 | | | 3,099 | | | 2 | | | 13,577 | | | 1,507 | | | — | | | — | | | — | |
| | | | | | | | | | | | | | | | | | | | |
Total/weighted average | | | 18 | | $ | 277,351 | | $ | 14,828 | | | 15 | | $ | 203,246 | | $ | 5,087 | | | 13 | | $ | 180,045 | | $ | 5,196 | |
| | | | | | | | | | | | | | | | | | | | |
144
Table of Contents
NORTHSTAR REALTY FINANCE CORP. AND SUBSIDIARIES
NOTES TO CONSOLIDATED FINANCIAL STATEMENTS (Continued)
Amounts in Thousands, Except per Share Data
7. Real Estate Debt Investments (Continued)
At December 31, 2011, the Company's loan portfolio principal and interest aging was an immaterial amount as it relates to receivables past due 1 to 90 days and $2.2 million regarding receivables past due greater than 90 days (inclusive of its NPLs).
Troubled Debt Restructurings
The following table summarizes real estate debt investments modified that are considered a troubled debt restructuring for the year ended December 31, 2011 (amounts in thousands):
| | | | | | | | | | | | | | | | | | | | | | |
Class of Debt:(1)
| | Number
of Loans | | Principal
Amount | | Carrying
Value | | Loan Loss
Reserves(2) | | Future
Commitments | | Original
WA Interest Rate | | Modified
WA Interest Rate | |
|---|
First mortgage loans(3) | | | 2 | | $ | 69,202 | | $ | 63,203 | | $ | 5,800 | | $ | 4,000 | | | 4.76 | % | | 0.34 | % |
Subordinate mortgage interests(4) | | | 1 | | | 10,000 | | | 2,000 | | | 8,000 | | | — | | | 3.00 | % | | 1.00 | % |
Mezzanine loans(3)(4) | | | 4 | | | 101,525 | | | 44,627 | | | 56,898 | | | — | | | 4.03 | % | | 0.24 | % |
REO(5) | | | 7 | | | NA | | | 115,596 | | | NA | | | NA | | | NA | | | NA | |
| | | | | | | | | | | | | | | | |
Total/weighted average | | | 14 | | $ | 180,727 | | $ | 225,426 | | $ | 70,698 | | $ | 4,000 | | | 4.25 | % | | 0.32 | % |
| | | | | | | | | | | | | | | | |
- (1)
- Excludes certain modifications associated with the CSE CDO.
- (2)
- Loans are included as impaired loans in the tables above.
- (3)
- Includes multiple loans to a single borrower related to mostly contiguous collateral.
- (4)
- One loan experienced an interest payment default prior to modification in 2011. Subsequent to modification, the loan is current on interest payments.
- (5)
- Represents the carrying value of the loans at the time of foreclosure. Refer to Note 5 for more details.
For the year ended December 31, 2011, all loans modified in a TDR generally provided interest rate concessions to the borrower or deferral of principal repayments. The Company recorded $6.3 million in provision for loan losses during the year ended December 31, 2011 related to TDR modifications.
8. Investment in and Advances to Unconsolidated Ventures
The Company has non-controlling, unconsolidated ownership interests in entities that are accounted for using the equity method. Capital contributions, distributions and profits and losses of the real estate entities are allocated in accordance with the terms of the applicable partnership and limited liability company agreements. Such allocations may differ from the stated percentage interests, if any, in such entities as a result of preferred returns and allocation formulas as described in such agreements.
The Company has no investments in unconsolidated subsidiaries accounted for under the equity method that have assets, either individually or in the aggregate, greater than 10% of total consolidated assets or income (loss) greater than 10% of net income (loss) from continuing operations.
145
Table of Contents
NORTHSTAR REALTY FINANCE CORP. AND SUBSIDIARIES
NOTES TO CONSOLIDATED FINANCIAL STATEMENTS (Continued)
Amounts in Thousands, Except per Share Data
8. Investment in and Advances to Unconsolidated Ventures (Continued)
Meadowlands
The Company owns a $109.7 million interest in Meadowlands Two, LLC, which holds 100% of Meadowlands One, LLC, which is secured by a retail/entertainment complex located in East Rutherford, New Jersey (the "NJ Property"). During the third quarter 2010, the lender group took effective ownership of the NJ Property. The Company accounts for its 22% equity interest in the investment under the equity method of accounting. At December 31, 2011 and 2010, the carrying value of the Company's investment was $65.5 million and $72.5 million, respectively. For the year ended December 31, 2011, the Company recognized a provision for loss on equity investment of $4.5 million and equity in losses of $2.5 million. For the year ended December 31, 2010, the Company recognized equity in losses of $2.9 million.
LandCap Partners
On October 5, 2007, the Company entered into a joint venture with Whitehall Street Global Real Estate Limited Partnership 2007 ("Whitehall"), to form LandCap Partners and LandCap LoanCo. (collectively referred to as "LandCap"). LandCap was established to opportunistically invest in single-family residential land through land loans, lot option agreements and select land purchases. The joint venture is managed by a third-party management group which has extensive experience in the single family housing sector. The Company and Whitehall agreed to provide no additional new investment capital in the LandCap joint venture. At December 31, 2011 and 2010, the Company's 49% interest in LandCap was $14.3 million and $15.0 million, respectively. At December 31, 2011 and 2010, LandCap had investments totaling $34.0 million and $34.9 million, respectively. For the years ended December 31, 2011, 2010 and 2009, the Company recognized equity in losses of $1.0 million, $2.2 million and $3.4 million, respectively.
CS Federal Drive, LLC
In February 2006, the Company, through a joint venture with an institutional investor, CS Federal Drive, LLC ("CS/Federal"), acquired a portfolio of three adjacent class A office/flex buildings located in Colorado Springs, Colorado for $54.3 million. The joint venture financed the transaction with two non-recourse, first mortgage loans totaling $38.0 million and the remainder in cash. The borrowings mature on February 11, 2016 and bear fixed interest rates of 5.51% and 5.46%. The Company contributed $8.4 million for a 50% interest in the joint venture and incurred $0.3 million in costs related to its acquisition, which are capitalized to the investment. These costs are amortized over the useful lives of the assets held by the joint venture. At December 31, 2011 and 2010, the Company had an investment in CS/Federal of $5.7 million and $6.2 million, respectively. The Company recognized equity in earnings of $0.7 million, $0.5 million and $0.4 million for the years ended December 31, 2011, 2010 and 2009, respectively.
NorthStar Real Estate Securities Opportunity Fund
A subsidiary of the Company, as general partner of NorthStar Real Estate Securities Opportunity Fund ("Securities Fund"), liquidated the Securities Fund in 2011. The Company owned a 34.3% interest in Securities Fund. For the years ended December 31, 2011, 2010 and 2009, the Company recognized an immaterial amount, $3.9 million and $6.3 million of equity in losses, respectively.
146
Table of Contents
NORTHSTAR REALTY FINANCE CORP. AND SUBSIDIARIES
NOTES TO CONSOLIDATED FINANCIAL STATEMENTS (Continued)
Amounts in Thousands, Except per Share Data
8. Investment in and Advances to Unconsolidated Ventures (Continued)
NorthStar Real Estate Income Trust, Inc.
As of December 31, 2011, the Company owns 2.9% of the common stock in NSREIT, a CRE debt-oriented REIT sponsored by the Company, with a commitment to purchase up to $10 million of shares of NSREIT's common stock during the two-year period following the July 12, 2010 commencement of its continuous public offering, in the event that its distributions to stockholders exceed its modified funds from operations. In connection with this commitment, the Company has purchased 253,202 shares for $2.3 million for the year ended December 31, 2011. At December 31, 2011 and 2010, the Company had an investment in NSREIT of $4.0 million and $1.8 million, respectively. For the years ended December 31, 2011 and 2010, the Company recognized immaterial amounts in earnings.
G-NRF, LTD
The Company owned a non-controlling interest in Monroe Capital, a venture engaged in the corporate lending business. For the year ended December 31, 2010, the Company received distributions of $17.4 million which reduced the Company's basis in the joint venture to zero and recorded $8.5 million as equity in earnings. In addition, upon sale of the Company's interest to the joint venture partner, the Company recorded a realized gain of $7.5 million.
147
Table of Contents
NORTHSTAR REALTY FINANCE CORP. AND SUBSIDIARIES
NOTES TO CONSOLIDATED FINANCIAL STATEMENTS (Continued)
Amounts in Thousands, Except per Share Data
9. Borrowings
The Company's outstanding borrowings as of December 31, 2011 and 2010 are as follows (amounts in thousands):
| | | | | | | | | | | | | | | | | | | | | |
| |
| |
| |
| | December 31, 2011 | | December 31, 2010 | |
|---|
| | Recourse vs.
Non-Recourse | | Final
Stated
Maturity | | Contractual
Interest
Rate(1) | | Principal
Amount | | Carrying
Value(2) | | Principal
Amount | | Carrying
Value(2) | |
|---|
CDO bonds payable: | | | | | | | | | | | | | | | | | | | | | |
N-Star I | | Non-recourse | | | Aug-38 | | | LIBOR + 2.08%(3) | | $ | 171,178 | | $ | 154,110 | | $ | 225,701 | | $ | 193,242 | |
N-Star II | | Non-recourse | | | Jun-39 | | | LIBOR + 1.46%(3) | | | 149,438 | | | 103,475 | | | 197,212 | | | 139,922 | |
N-Star III | | Non-recourse | | | Jun-40 | | | LIBOR + 0.59%(3) | | | 274,454 | | | 129,537 | | | 313,907 | | | 156,107 | |
N-Star IV | | Non-recourse | | | Jul-40 | | | LIBOR + 0.58%(3) | | | 232,749 | | | 157,862 | | | 258,769 | | | 164,315 | |
N-Star V | | Non-recourse | | | Sep-45 | | | LIBOR + 0.62%(3) | | | 327,463 | | | 126,251 | | | 434,633 | | | 233,892 | |
N-Star VI | | Non-recourse | | | Jun-41 | | | LIBOR + 0.51%(3) | | | 278,049 | | | 184,552 | | | 271,698 | | | 180,813 | |
N-Star VII | | Non-recourse | | | Jun-51 | | | LIBOR + 0.35%(3) | | | 425,580 | | | 180,155 | | | 499,200 | | | 322,431 | |
N-Star VIII | | Non-recourse | | | Feb-41 | | | LIBOR + 0.44%(3) | | | 583,050 | | | 353,684 | | | 586,460 | | | 170,358 | |
N-Star IX | | Non-recourse | | | Aug-52 | | | LIBOR + 0.40%(3) | | | 682,980 | | | 228,704 | | | 744,960 | | | 207,136 | |
CSE CDO | | Non-recourse | | | Jan-37 | | | LIBOR + 0.39%(3) | | | 850,235 | | | 526,909 | | | 916,005 | | | 490,589 | |
CapLease CDO | | Non-recourse | | | Jan-40 | | | 4.94%(4) | | | 150,593 | | | 128,668 | | | — | | | — | |
| | | | | | | | | | | | | | | | | | |
Subtotal CDO bonds payable | | | | | | | | | | | 4,125,769 | | | 2,273,907 | | | 4,448,545 | | | 2,258,805 | |
| | | | | | | | | | | | | | | | | | |
Mortgage notes payable:(5) | | | | | | | | | | | | | | | | | | | | | |
Core net lease | | | | | | | | | | | | | | | | | | | | | |
Salt Lake City, UT | | Non-recourse | | | Sep-12 | | | 5.16% | | | 14,625 | | | 14,625 | | | 15,059 | | | 15,059 | |
South Portland, ME | | Non-recourse | | | Jun-14 | | | 7.34% | | | 4,266 | | | 4,266 | | | 4,466 | | | 4,466 | |
Fort Wayne, IN | | Non-recourse | | | Jan-15 | | | 6.41% | | | 3,221 | | | 3,221 | | | 3,313 | | | 3,313 | |
Reading, PA | | Non-recourse | | | Jan-15 | | | 5.58% | | | 13,366 | | | 13,366 | | | 13,643 | | | 13,643 | |
Reading, PA | | Non-recourse | | | Jan-15 | | | 6.00% | | | 5,000 | | | 5,000 | | | 5,000 | | | 5,000 | |
EDS Portfolio | | Non-recourse | | | Oct-15 | | | 5.37% | | | 45,416 | | | 45,416 | | | 46,218 | | | 46,218 | |
Keene, NH | | Non-recourse | | | Feb-16 | | | 5.85% | | | 6,478 | | | 6,478 | | | 6,588 | | | 6,588 | |
Green Pond, NJ | | Non-recourse | | | Apr-16 | | | 5.68% | | | 16,635 | | | 16,635 | | | 16,884 | | | 16,884 | |
Aurora, CO | | Non-recourse | | | Jul-16 | | | 6.22% | | | 32,159 | | | 32,159 | | | 32,583 | | | 32,583 | |
DSG Portfolio | | Non-recourse | | | Oct-16 | | | 6.17% | | | 32,823 | | | 32,823 | | | 33,325 | | | 33,325 | |
Indianapolis, IN | | Non-recourse | | | Feb-17 | | | 6.06% | | | 27,416 | | | 27,416 | | | 27,789 | | | 27,789 | |
Milpitas, CA | | Non-recourse | | | Mar-17 | | | 5.95% | | | 21,141 | | | 21,141 | | | 21,639 | | | 21,639 | |
Fort Mill, SC | | Non-recourse | | | Apr-17 | | | 5.63% | | | 27,700 | | | 27,700 | | | 27,700 | | | 27,700 | |
Fort Mill, SC | | Non-recourse | | | Apr-17 | | | 6.21% | | | 2,162 | | | 2,162 | | | 2,482 | | | 2,482 | |
Columbus, OH | | Non-recourse | | | Dec-17 | | | 6.48% | | | 22,937 | | | 22,937 | | | 23,239 | | | 23,239 | |
Cincinnati, OH | | Non-recourse | | | NA | | | 5.85% | | | — | | | — | | | 51,480 | | | 51,480 | |
| | | | | | | | | | | | | | | | | | |
Subtotal Core net lease | | | | | | | | | | | 275,345 | | | 275,345 | | | 331,408 | | | 331,408 | |
| | | | | | | | | | | | | | | | | | |
Healthcare net lease | | | | | | | | | | | | | | | | | | | | | |
Hillsboro, OR | | Non-recourse | | | Jan-14 | | | 5.94% | | | 32,104 | | | 32,104 | | | 32,537 | | | 32,537 | |
WF Portfolio | | Non-recourse | | | May-15 | | | LIBOR + 5.95%(6) | | | 57,589 | | | 57,589 | | | 58,200 | | | 58,200 | |
Ohio Portfolio | | Non-recourse | | | Mar-16 | | | 6.00% | | | 20,921 | | | 20,921 | | | 19,936 | | | 19,936 | |
Wilkinson Portfolio | | Non-recourse | | | Jan-17 | | | 6.99% | | | 157,688 | | | 157,688 | | | 159,135 | | | 159,135 | |
Tuscola/Harrisburg | | Non-recourse | | | Jan-17 | | | 7.09% | | | 7,781 | | | 7,781 | | | 7,842 | | | 7,842 | |
East Arlington, TX | | Non-recourse | | | May-17 | | | 5.89% | | | 3,304 | | | 3,304 | | | 3,349 | | | 3,349 | |
Miller Portfolio | | Non-recourse | | | NA | | | 7.04% | | | — | | | — | | | 116,807 | | | 116,807 | |
Harmony Portfolio | | Non-recourse | | | NA | | | 6.39% | | | — | | | — | | | 73,900 | | | 73,900 | |
| | | | | | | | | | | | | | | | | | |
Subtotal Healthcare net lease | | | | | | | | | | | 279,387 | | | 279,387 | | | 471,706 | | | 471,706 | |
| | | | | | | | | | | | | | | | | | |
Real estate owned | | | | | | | | | | | | | | | | | | | | | |
Phoenix, AZ | | Non-recourse | | | May-17 | | | 4.25% | | | 212,000 | | | 212,000 | | | — | | | — | |
San Antonio, TX(7) | | Non-recourse | | | Jan-19 | | | 4.44% | | | 16,525 | | | 16,525 | | | — | | | — | |
| | | | | | | | | | | | | | | | | | |
Subtotal Real estate owned | | | | | | | | | | | 228,525 | | | 228,525 | | | — | | | — | |
| | | | | | | | | | | | | | | | | | |
Subtotal Mortgage notes payable | | | | | | | | | | | 783,257 | | | 783,257 | | | 803,114 | | | 803,114 | |
| | | | | | | | | | | | | | | | | | |
148
Table of Contents
NORTHSTAR REALTY FINANCE CORP. AND SUBSIDIARIES
NOTES TO CONSOLIDATED FINANCIAL STATEMENTS (Continued)
Amounts in Thousands, Except per Share Data
9. Borrowings (Continued)
| | | | | | | | | | | | | | | | | | | | | |
| |
| |
| |
| | December 31, 2011 | | December 31, 2010 | |
|---|
| | Recourse vs.
Non-Recourse | | Final
Stated
Maturity | | Contractual
Interest
Rate(1) | | Principal
Amount | | Carrying
Value(2) | | Principal
Amount | | Carrying
Value(2) | |
|---|
Credit facility: | | | | | | | | | | | | | | | | | | | | | |
CMBS Facility | | Non-recourse | | | Oct-14 | (8) | | 1.65% | | | 64,259 | | | 64,259 | | | — | | | — | |
| | | | | | | | | | | | | | | | | | |
Subtotal Credit facility | | | | | | | | | | | 64,259 | | | 64,259 | | | — | | | — | |
| | | | | | | | | | | | | | | | | | |
Secured term loans: | | | | | | | | | | | | | | | | | | | | | |
Term Asset-Backed Securities Loan Facility | | Non-recourse | | | Oct-14 | | | 2.64% | | | 14,682 | | | 14,682 | | | 14,682 | | | 14,682 | |
Term Loan | | Recourse | | | NA | | | LIBOR + 1.50 | % | | — | | | — | | | 22,199 | | | 22,199 | |
| | | | | | | | | | | | | | | | | | |
Subtotal Secured term loans | | | | | | | | | | | 14,682 | | | 14,682 | | | 36,881 | | | 36,881 | |
| | | | | | | | | | | | | | | | | | |
Exchangeable senior notes:(9) | | | | | | | | | | | | | | | | | | | | | |
7.25% Notes | | Recourse | | | Jun-27 | (10) | | 7.25% | | | 20,455 | | | 20,396 | | | 68,165 | | | 67,443 | |
11.50% Notes | | Recourse | | | Jun-13 | | | 11.50% | | | 35,710 | | | 35,389 | | | 60,750 | | | 59,446 | |
7.50% Notes | | Recourse | | | Mar-31 | (11) | | 7.50% | | | 172,500 | | | 160,068 | | | — | | | — | |
| | | | | | | | | | | | | | | | | | |
Subtotal Exchangeable senior notes | | | | | | | | | | | 228,665 | | | 215,853 | | | 128,915 | | | 126,889 | |
| | | | | | | | | | | | | | | | | | |
Junior subordinated notes:(2)(12) | | | | | | | | | | | | | | | | | | | | | |
Trust I | | Recourse | | | Mar-35 | | | 8.15% | | | 41,240 | | | 25,569 | | | 41,240 | | | 30,173 | |
Trust II | | Recourse | | | Jun-35 | | | 7.74% | | | 25,780 | | | 15,984 | | | 25,780 | | | 18,531 | |
Trust III | | Recourse | | | Jan-36 | | | 7.81% | | | 41,238 | | | 25,155 | | | 41,238 | | | 28,825 | |
Trust IV | | Recourse | | | Jun-36 | | | 7.95% | | | 50,100 | | | 30,561 | | | 50,100 | | | 38,349 | |
Trust V | | Recourse | | | Sep-36 | | | LIBOR + 2.70 | % | | 30,100 | | | 14,749 | | | 30,100 | | | 18,830 | |
Trust VI | | Recourse | | | Dec-36 | | | LIBOR + 2.90 | % | | 25,100 | | | 12,676 | | | 25,100 | | | 15,568 | |
Trust VII | | Recourse | | | Apr-37 | | | LIBOR + 2.50 | % | | 31,459 | | | 15,100 | | | 31,475 | | | 19,080 | |
Trust VIII | | Recourse | | | Jul-37 | | | LIBOR + 2.70 | % | | 35,100 | | | 17,374 | | | 35,100 | | | 21,894 | |
| | | | | | | | | | | | | | | | | | |
Subtotal Junior subordinated notes | | | | | | | | | | | 280,117 | | | 157,168 | | | 280,133 | | | 191,250 | |
| | | | | | | | | | | | | | | | | | |
Grand Total | | | | | | | | | | $ | 5,496,749 | | $ | 3,509,126 | | $ | 5,697,588 | | $ | 3,416,939 | |
| | | | | | | | | | | | | | | | | | |
- (1)
- Refer to Note 14 regarding the Company's derivative instruments which are used to manage interest rate exposure.
- (2)
- Carrying value represents fair value with respect to the CDO bonds payable (excluding CapLease CDO bonds payable for which the fair value option was not elected) and junior subordinated notes due to the election of the fair value option (see Note 4) and amortized cost with regards to the other borrowings.
- (3)
- Represents a weighted average spread. N-Star CDOs I and VI and CSE CDO are based on three-month LIBOR whereas all others are based on one-month LIBOR.
- (4)
- Represents a weighted average coupon.
- (5)
- Mortgage notes payable are subject to customary non-recourse covenants.
- (6)
- Contractual interest rate is based on three-month LIBOR with a 1.0% LIBOR floor.
- (7)
- In connection with this borrowing, the borrower is a special purpose entity separate from the Company and its affiliates, and as a result, the borrower's assets and credit are not available to satisfy the debts and the obligations of the Company or any of its other affiliates.
- (8)
- The initial maturity date is October 28, 2013, subject to a one-year extension at the option of the Company, which may be exercised upon the satisfaction of certain conditions set forth in the agreement.
- (9)
- Principal amount differs from carrying value on the consolidated balance sheet due to the equity component of the debt.
- (10)
- The holders have repurchase rights which may require the Company to repurchase the notes on June 15, 2012.
- (11)
- The holders have repurchase rights which may require the Company to repurchase the notes on March 15, 2016.
- (12)
- Junior subordinate notes Trusts I, II, III and IV have a fixed interest rate for the first ten years after which the interest rate will float and reset quarterly at rates ranging from three-month LIBOR + 2.70% to 3.25%. The Company entered into an interest rate swap agreement on Trust VIII which fixes the interest rate for ten years at 8.29%.
149
Table of Contents
NORTHSTAR REALTY FINANCE CORP. AND SUBSIDIARIES
NOTES TO CONSOLIDATED FINANCIAL STATEMENTS (Continued)
Amounts in Thousands, Except per Share Data
9. Borrowings (Continued)
Scheduled principal on the Company's borrowings, based on stated maturity, is as follows as of December 31, 2011 (amounts in thousands):
| | | | | | | | | | | | | | | | | | | | | | |
| | Total | | CDO Bonds
Payable | | Mortgage
Notes Payable | | Credit
Facility | | Secured Term
Loan | | Exchangeable
Senior Notes(1) | | Junior Subordinated
Notes | |
|---|
2012 | | $ | 43,440 | | $ | — | | $ | 22,985 | | $ | — | | $ | — | | $ | 20,455 | | $ | — | |
2013 | | | 45,037 | | | — | | | 9,327 | | | — | | | — | | | 35,710 | | | — | |
2014 | | | 123,129 | | | — | | | 44,188 | | | 64,259 | | | 14,682 | | | — | | | — | |
2015 | | | 125,113 | | | — | | | 125,113 | | | — | | | — | | | — | | | — | |
2016 | | | 280,269 | | | — | | | 107,769 | | | — | | | — | | | 172,500 | | | — | |
Thereafter | | | 4,879,761 | | | 4,125,769 | | | 473,875 | | | — | | | — | | | — | | | 280,117 | |
| | | | | | | | | | | | | | | | |
Total | | $ | 5,496,749 | | $ | 4,125,769 | | $ | 783,257 | | $ | 64,259 | | $ | 14,682 | | $ | 228,665 | | $ | 280,117 | |
| | | | | | | | | | | | | | | | |
- (1)
- The 7.25% Notes and 7.50% Notes have a final maturity date of June 15, 2027 and March 15, 2031, respectively. The above table reflects the holders' repurchase rights which may require the Company to repurchase the 7.25% Notes and 7.50% Notes on June 15, 2012 and March 15, 2016, respectively.
As of December 31, 2011, the Company was in compliance with all covenants under its outstanding borrowings.
Exchangeable Senior Notes
In June 2007, the Operating Partnership issued $172.5 million of 7.25% exchangeable senior notes ("7.25% Notes") which were offered in accordance with Rule 144A under the Securities Act of 1933, as amended ("Rule 144A"), of which $20.5 million remains outstanding as of December 31, 2011. The 7.25% Notes are senior unsecured obligations of the Operating Partnership. The 7.25% Notes have an initial exchange rate representing an exchange price of $16.89 per share of the Company's common stock, subject to adjustment under certain circumstances, and may be exchangeable upon the occurrence of specified events, and at any time on or after March 15, 2027, and prior to the close of business on the second business day immediately preceding the maturity date, into cash or common stock of the Company, or a combination thereof, if any, at the Company's option.
In May 2008, NRFC NNN Holdings, LLC ("NNN Holdings"), a wholly-owned subsidiary of the Company, issued $80.0 million of 11.50% exchangeable senior notes ("11.50% Notes") which were offered in accordance with Rule 144A, of which $35.7 million remains outstanding as of December 31, 2011. The 11.50% Notes are senior unsecured obligations of NNN Holdings. The 11.50% Notes have an initial exchange rate representing an exchange price of $12.00 per share of the Company's common stock, subject to adjustment under certain circumstances may be exchangeable upon the occurrence of specified events, and at any time on or after March 15, 2013, and prior to the close of business on the second business day immediately preceding the maturity date, into cash or common stock of the Company, or a combination thereof, if any, at the Company's option.
In March 2011, the Operating Partnership issued $172.5 million of 7.50% exchangeable senior notes ("7.50% Notes") due in 2031. The 7.50% Notes were offered in a private offering exempt from registration in accordance with Rule 144A. The 7.50% Notes are senior unsecured obligations of the
150
Table of Contents
NORTHSTAR REALTY FINANCE CORP. AND SUBSIDIARIES
NOTES TO CONSOLIDATED FINANCIAL STATEMENTS (Continued)
Amounts in Thousands, Except per Share Data
9. Borrowings (Continued)
Operating Partnership. The 7.50% Notes have an initial exchange rate representing an exchange price of $6.44 per share of the Company's common stock, subject to adjustment under certain circumstances and may be exchangeable at any time prior to the close of business on the second business day immediately preceding the maturity date for cash or common stock of the Company, or a combination thereof, at the Company's option. The net proceeds from the offering were $163.0 million.
The 7.25% Notes, 11.50% Notes and 7.50% Notes are redeemable, at the Company's option, on and after June 15, 2014, June 15, 2011 and March 15, 2016, respectively. The Company may be required to repurchase each issuance of exchangeable senior notes at certain dates and upon the occurrence of certain designated events.
The components of the Company's outstanding exchangeable senior notes are summarized as follows as of December 31, 2011 and 2010 (amounts in thousands):
| | | | | | | | | | | | | | | | | | | |
| | December 31, 2011 | | December 31, 2010 | |
|---|
| | Principal
Amount | | Unamortized
Discount(1) | | Carrying
Value | | Principal
Amount | | Unamortized
Discount | | Carrying
Value | |
|---|
7.25% Notes | | $ | 20,455 | | $ | (59 | ) | $ | 20,396 | | $ | 68,165 | | $ | (722 | ) | $ | 67,443 | |
11.50% Notes | | | 35,710 | | | (321 | ) | | 35,389 | | | 60,750 | | | (1,304 | ) | | 59,446 | |
7.50% Notes | | | 172,500 | | | (12,432 | ) | | 160,068 | | | — | | | — | | | — | |
| | | | | | | | | | | | | | |
Total | | $ | 228,665 | | $ | (12,812 | ) | $ | 215,853 | | $ | 128,915 | | $ | (2,026 | ) | $ | 126,889 | |
| | | | | | | | | | | | | | |
- (1)
- The remaining amortization period for the 7.25% Notes, 11.50% Notes and 7.50% Notes is 6.5 months, 1.5 years and 4.3 years, respectively.
As of December 31, 2011 and 2010, the carrying value of the equity components of the exchangeable senior notes is $15.7 million and $4.9 million, respectively, which is recorded as a component of additional paid-in capital.
The components of interest expense related to outstanding exchangeable senior notes for the years ended December 31, 2011, 2010 and 2009 are summarized as follows (amounts in thousands):
| | | | | | | | | | |
Year Ended | | Interest
Expense | | Amortization
Expense(1) | | Total
Interest
Expense | |
|---|
2011 | | $ | 18,872 | | $ | 4,490 | | $ | 23,362 | |
2010 | | | 11,928 | | | 1,892 | | | 13,820 | |
2009 | | | 14,542 | | | 2,267 | | | 16,809 | |
- (1)
- The effective interest rate of the 7.25% Notes, 11.50% Notes and 7.50% Notes was 7.9%, 12.2% and 9.6% for the year ended December 31, 2011, respectively.
151
Table of Contents
NORTHSTAR REALTY FINANCE CORP. AND SUBSIDIARIES
NOTES TO CONSOLIDATED FINANCIAL STATEMENTS (Continued)
Amounts in Thousands, Except per Share Data
9. Borrowings (Continued)
Debt Repurchases
The following summarizes the Company's total debt repurchases for the year ended December 31, 2011 (amounts in thousands):
| | | | | | | |
| | Principal
Amount | | Repurchase
Price | |
|---|
CDO Bonds | | $ | 212,578 | | $ | 75,316 | |
Exchangeable Senior Notes | | $ | 72,750 | | $ | 75,188 | |
The Company did not repurchase any outstanding CDO bonds or exchangeable senior notes during 2010. The Company recorded a net realized loss of $27.3 million in connection with the repurchase of its exchangeable senior notes and CDO bonds for year ended December 31, 2011.
Settlement of Mortgage Note
The Company previously owned a partially vacant net lease property located in Cincinnati, Ohio. In November 2010, the mortgage lender declared a payment default and, in December 2010, began foreclosure proceedings on the property. In 2010, the Company recorded a $5.2 million impairment related to this property and in April 2011, the Company transferred the property to the lender via a foreclosure. The Company paid the lender $2.5 million mainly for settlement of certain tenant improvements and leasing commission obligations, which was included in realized gain (loss) and other in the consolidated statement of operations.
CDO Bonds Payable
On August 31, 2011, the Company invested $23.5 million to acquire the collateral management rights, preferred equity notes and $14.3 million in principal of originally investment grade bonds of the CapLease CDO, which is consolidated under U.S. GAAP.
CMBS Facility
In October 2011, a subsidiary of the Company entered into a master repurchase and securities contract ("CMBS Facility") with Wells Fargo Bank N.A. (or "Wells Fargo"). The $100.0 million CMBS Facility finances the acquisition of AAA-rated CMBS investments and has an initial term of two years with a one-year extension option at the Company's election subject to certain conditions. Borrowings accrue interest at a per annum pricing rate equal to 1.65%, subject to adjustment. The Company paid an upfront fee of 0.5% based on the total commitment and will not incur any unused fees.
In connection with the CMBS Facility, the Company, together with the Operating Partnership and Sub-REIT (collectively, the "CMBS Guarantors"), provided a guaranty agreement under which the CMBS Guarantors guaranty the obligations under the CMBS Facility.
As of December 31, 2011, the Company purchased $73.2 million principal amount of CMBS with a weighted average yield of 4.1%, initially financed with $65.7 million at a weighted average cost of 1.9%, resulting in an expected return on invested equity of over 21%.
152
Table of Contents
NORTHSTAR REALTY FINANCE CORP. AND SUBSIDIARIES
NOTES TO CONSOLIDATED FINANCIAL STATEMENTS (Continued)
Amounts in Thousands, Except per Share Data
9. Borrowings (Continued)
CRE Debt Facility
In November 2011, NRFC WF Loan, LLC ("NRFC WF"), a wholly-owned subsidiary of the Company, entered into a master repurchase and securities contract ("Loan Facility") with Wells Fargo. The $100.0 million Loan Facility will be used to finance the origination of CRE first mortgage loans and has an initial term of two years with two one-year extension option at the Company's election which is subject to certain conditions. Borrowings under the Loan Facility accrue interest at a range of LIBOR plus 2.25% to 3.00% per annum with advance rates of up to 75%, depending on asset type and characteristics. The Company paid an upfront fee of 0.5% of the total commitment and will not incur any unused fees.
In connection with the Loan Facility, the Company, together with the Operating Partnership entered into a guarantee arrangement, under which the Company and the Operating Partnership guaranty the obligations under the Loan Facility. Additionally, in connection with the Loan Facility the Sub-REIT provided a pledge and security agreement over its interests in NRFC WF. The Company has no outstanding borrowings with respect to the Loan Facility as of December 31, 2011.
The Loan Facility and CMBS Facility contain a liquidity covenant that requires the Company to maintain an aggregate of $45 million of unrestricted cash to provide credit support for the borrowings.
As of December 31, 2011, the Company was in compliance with this covenant.
10. Related Party Transactions
Advisory and Other Fees
The Company has agreements with each of its N-Star CDOs and the CSE and CapLease CDOs to perform certain advisory services. The advisory fee income related to all of the CDO financing transactions are eliminated as a result of the consolidation of the respective CDO financing transaction. For such time certain CDO financing transactions were not consolidated, the Company earned total fees of $3.2 million and $7.3 million for the years ended December 31, 2010 and 2009, respectively, which is recorded in other revenue in the consolidated statement of operations.
The Company has an agreement with NSREIT to manage its day-to-day affairs, including identifying, originating and acquiring investments on behalf of NSREIT. The Company earns fees for its advisory services. For the years ended December 31, 2011 and 2010, the Company earned $1.0 million and an immaterial amount of fees on these agreements, respectively. Additionally, the Company incurs costs on behalf of NSREIT and NorthStar Senior Care Trust, Inc. ("Senior Care") which are reimbursed subsequently to the Company by these managed entities. As of December 31, 2011, the Company had unreimbursed costs of $4.3 million from NSREIT and $1.6 million from Senior Care. These amounts are recorded as receivables, related parties on the Company's consolidated balance sheets.
Legacy Fund
The Company has two real estate debt investments with a subsidiary of Legacy Partners Realty Fund I, LLC (the "Legacy Fund"), as borrower. One loan of $15.2 million matures in April 2013 and has two one-year extension options. The total interest rate is LIBOR + 7.50%, of which
153
Table of Contents
NORTHSTAR REALTY FINANCE CORP. AND SUBSIDIARIES
NOTES TO CONSOLIDATED FINANCIAL STATEMENTS (Continued)
Amounts in Thousands, Except per Share Data
10. Related Party Transactions (Continued)
LIBOR + 3.00% is current pay. The other loan of $19.2 million had an initial maturity of January 2012 and is in the process of being modified. One of the Company's directors, Preston Butcher, is the chairman of the board of directors and chief executive officer and owns a significant interest in Legacy Partners Commercial, LLC, which indirectly owns an equity interest in, and owns the manager of, the Legacy Fund. In addition, the Company leases office space in Colorado with an affiliate of Legacy Fund under an operating lease through December 18, 2015. The Company has the option to renew the lease for an additional five years.
Hard Rock Hotel Loan
The Company owns a $89.3 million mezzanine loan backed by the Hard Rock Hotel and Casino in Las Vegas, Nevada. Prior to a modification of the loan in March 2011, Morgans Hotel Group ("Morgans") was a minority partner in the joint venture owning the hotel. David Hamamoto, the Company's chairman and chief executive officer, is the executive chairman of the board of Morgans. Morgans no longer has any interest in the hotel.
11. Equity-Based Compensation
Omnibus Stock Incentive Plan
On September 14, 2004, the board of directors of the Company adopted the NorthStar Realty Finance Corp. 2004 Omnibus Stock Incentive Plan (the "Stock Incentive Plan"). The Stock Incentive Plan provides for the issuance of stock-based incentive awards, including incentive stock options, non-qualified stock options, stock appreciation rights, shares of common stock of the Company, including restricted shares, and other equity-based awards, including OP Units which are structured as profits interests ("LTIP Units") or any combination of the foregoing. The eligible participants in the Stock Incentive Plan include directors, officers and employees of the Company and, prior to October 29, 2005, employees pursuant to the shared facilities and services agreement.
An aggregate of 8,933,038 shares of common stock of the Company are currently reserved and authorized for issuance under the Stock Incentive Plan, subject to equitable adjustment upon the occurrence of certain corporate events. As of December 31, 2010, the Company has issued an aggregate of 8,313,260 LTIP Units, net of forfeitures of 147,640 LTIP Units. An aggregate of 4,735,877 LTIP Units were converted to common stock and 581,669 shares of common stock were issued pursuant to the Stock Incentive Plan. Of the 8,313,260 LTIP Units, 6,901,585 were subject to vesting of which 26,833 remain unvested, 701,058 cliff vested on December 31, 2010 and 267,793 had no vesting requirements. The Company accelerated the vesting of 442,824 LTIP Units as part of the termination agreements provided to employees. In addition, the LTIP Unit holders are entitled to dividends on the entire grant beginning on the date of the grant.
The Company has recognized equity-based compensation expense of $4.7 million, $14.3 million and $19.7 million for the years ended December 31, 2011, 2010 and 2009, respectively. As of December 31, 2011, there were 26,833 unvested LTIP Units. During the year ended December 31, 2011, 84,349 LTIP Units were forfeited. The related compensation expense to be recognized over the remaining vesting period of the Stock Incentive Plan LTIP Unit grants is $0.1 million, provided there are no forfeitures.
154
Table of Contents
NORTHSTAR REALTY FINANCE CORP. AND SUBSIDIARIES
NOTES TO CONSOLIDATED FINANCIAL STATEMENTS (Continued)
Amounts in Thousands, Except per Share Data
11. Equity-Based Compensation (Continued)
Additional Grants
In February 2011 and April 2011, the Company granted 370,370 and 143,129 LTIP Units, respectively, to certain officers and employees of the Company. In April 2011 and May 2011, the Company granted 20,204 and 96,992 LTIP Units to directors related to two new directors and annual grants. The 96,992 grant of LTIP Units is not subject to vesting. All of the other LTIP Units vest to the recipient at a rate of one-twelfth of the total amount granted as of the end of each quarter, beginning on April 29, 2011. The Company has recognized $1.3 million in equity-based compensation expense related to these LTIP Units for the year ended December 31, 2011.
The status of all of the LTIP Unit grants as of December 31, 2011 and 2010 is as follows (in thousands):
| | | | | | | | | | | | | |
| | December 31, 2011 | | December 31, 2010 | |
|---|
| | LTIP
Grants | | Weighted
Average
Grant Price | | LTIP
Grants | | Weighted
Average
Grant Price | |
|---|
Beginning balance(1) | | | 4,289 | | $ | 7.92 | | | 7,323 | | $ | 9.85 | |
Granted | | | 630 | | | 5.03 | | | — | | | — | |
Converted to common stock | | | (628 | ) | | 7.41 | | | (3,031 | ) | | 12.59 | |
Forfeited | | | (84 | ) | | 10.67 | | | (3 | ) | | 8.55 | |
| | | | | | | | | | |
Ending Balance/Weighted Average | | | 4,207 | | $ | 7.53 | | | 4,289 | | $ | 7.92 | |
| | | | | | | | | | |
- (1)
- Reflects balance at January 1, 2011 and 2010 for the periods ended December 31, 2011 and 2010, respectively.
Incentive Compensation Plan
On July 21, 2009, the compensation committee of the board of directors (the "Committee") of the Company approved the material terms of a new Incentive Compensation Plan for the Company's executive officers and other employees (the "Plan"). Under the Plan, a potential incentive compensation pool is expected to be established each calendar year. The size of the incentive pool will be calculated as the sum of: (a) 1.75% of the Company's "adjusted equity capital;" and (b) 25% of the Company's adjusted funds from operations, as adjusted ("AFFO"), above a 9% return hurdle on adjusted equity capital. Payout from the incentive pool is subject to achievement of additional performance goals summarized below.
The incentive pool is expected to be divided into the following three separate incentive compensation components: (1) an annual cash bonus, tied to annual performance of the Company and paid after year end at or around completion of the year-end audit ("Annual Bonus"); (2) a deferred cash bonus, determined based on the same year's performance, but paid 50% following the close of each of the first and second years after such incentive pool is determined, subject to the participant's continued employment through each payment date ("Deferred Cash Bonus"); and (3) a long-term incentive, paid at the end of a three or four-year period based on the Company's achievement of cumulative performance goals for such period, subject to the participant's continued employment
155
Table of Contents
NORTHSTAR REALTY FINANCE CORP. AND SUBSIDIARIES
NOTES TO CONSOLIDATED FINANCIAL STATEMENTS (Continued)
Amounts in Thousands, Except per Share Data
11. Equity-Based Compensation (Continued)
through the payment date. The Committee evaluates the Plan on an annual basis and considers alternatives to the foregoing as the Committee deems appropriate and in the best interests of the Company. Performance goals for each component will be set by the Committee at the beginning of each subsequent calendar year for each new cycle. The goals will generally be divided into ranges of performance, each of which will correspond to a payout level equal to a percentage of a participant's pool allocation for such component.
Restricted stock units ("RSUs") are allocated to executive officers of the Company under the long-term incentive component of the Plan. An aggregate of 3,147,454 and 2,209,998 of RSUs were granted in connection with the 2009 Plan and 2010 Plan, respectively. The RSUs are subject to the Company achieving cumulative performance hurdles or target stock prices established by the Committee for the three-year periods ending December 31, 2011 and 2012, respectively. Upon the conclusion of the applicable performance period, each executive officer will receive a payout, if any, equal to the value of one share of common stock at the time of such payout, inclusive of the dividends paid with respect to a share of common stock following the first year of the applicable performance period, for each RSU actually earned (the "Long-Term Amount Value"). The Long-Term Amount Value, if any, will be paid in the form of shares of common stock or LTIP Units to the extent available under the Company's equity compensation plans or, if all or a portion of such shares or LTIP Units are not available, in cash; provided, that the amount of cash paid to any executive officer with respect to the Long-Term Amount shall not exceed certain maximum amounts set forth in the Plan (the "Long Term Amount Payout").
For RSUs granted in connection with the 2009 Plan, the Company determined in 2011 that the performance hurdle established for the period ending December 31, 2011 was reached which entitles the recipients to 100% of the RSUs granted. In 2010, the Company recorded $2.1 million of equity-based compensation expense relating to these RSUs based upon the fair value of the target stock price component of the Plan on the dates that the RSUs were initially allocated to the executive officers. Because the Company did not have a sufficient amount of common stock or LTIP Units to settle these RSUs they will be settled in cash in February 2012. The Company remeasured its compensation expense based upon the December 31, 2011 stock price and the recipient receiving 100% of the award and recorded cash compensation expense of $13.9 million for the year ended December 31, 2011.
For RSUs granted in connection with the 2010 Plan, the Company believes that it will meet the performance hurdle established for the period ending December 31, 2012 that would entitle the recipient to 100% of the RSUs granted. The target stock price component of the 2010 Plan has been fair valued and the Company has recognized equity-based compensation of $5.6 million for the year ended December 31, 2011. To the extent earned, the Company expects to settle these RSUs in common stock or LTIP Units.
2011 Plan
In February 2012, the Company issued 1,525,798 RSUs to executive officers in connection with the 2011 Plan. The RSUs are subject to the Company achieving target stock prices established by the Committee for the four-year period ending December 31, 2014. Upon the conclusion of the applicable performance period, each executive officer will receive the Long Term Amount Payout (if earned). At the same time, the Company granted 1,525,798 LTIP Units to executive officers which vest to the
156
Table of Contents
NORTHSTAR REALTY FINANCE CORP. AND SUBSIDIARIES
NOTES TO CONSOLIDATED FINANCIAL STATEMENTS (Continued)
Amounts in Thousands, Except per Share Data
11. Equity-Based Compensation (Continued)
recipient at a rate of four annual installments ending December 31, 2014. In addition, the Company granted $3.1 million of LTIP Units to certain non-executive employees which will vest quarterly over three years beginning April 2012. For the year ended December 31, 2011, the Company recorded compensation expense of $22.4 million comprised of the Annual Bonus of $15.6 million and the Deferred Cash Bonus of $6.8 million.
2006 Outperformance Plan
In January 2006, the compensation committee of the board of directors approved the NorthStar Realty Finance Corp. 2006 Outperformance Plan (the "2006 Plan"), a long-term compensation program to further align the interests of the Company's stockholders and management. The Company did not meet the performance hurdles under the 2006 Plan at its conclusion on December 31, 2008. The Company recorded $0.2 million and $0.5 million of compensation expense for the years ended December 31, 2010 and 2009, respectively. The Company did not record any compensation expense for the year ended December 31, 2011.
12. Stockholders' Equity
Common Stock
On May 17, 2011, the Company completed the sale of 17.25 million shares of its common stock at a price of $4.25 per share, which includes the full over-allotment option exercised by the underwriters of the offering. The net proceeds to the Company were $69.3 million.
Preferred Stock
The Company has issued and outstanding the following cumulative redeemable preferred stock as of December 31, 2011 (in thousands except share and per share data):
| | | | | | | | | |
| | Issue
Date | | Number of
Shares(1) | | Net
Proceeds | |
|---|
Series A 8.75% | | September 2006 | | | 2,400,000 | | $ | 57,867 | |
Series B 8.25% | | February 2007 | | | 6,200,000 | | | 149,887 | |
Series B 8.25% | | May 2007 | | | 1,400,000 | | | 33,618 | |
| | | | | | | | | |
Total | | | | | | | $ | 241,372 | |
| | | | | | | | | |
- (1)
- 250 million shares have been authorized, and all shares have a $0.01 par value and $25 per share liquidation preference.
All shares were completed in a public offering and remain issued and outstanding as of December 31, 2011 and 2010, respectively. The preferred stock is currently redeemable by the Company at a redemption price of $25 per share.
157
Table of Contents
NORTHSTAR REALTY FINANCE CORP. AND SUBSIDIARIES
NOTES TO CONSOLIDATED FINANCIAL STATEMENTS (Continued)
Amounts in Thousands, Except per Share Data
12. Stockholders' Equity (Continued)
Dividend Reinvestment and Stock Purchase Plan
In April 2007, the Company implemented a Dividend Reinvestment and Stock Purchase Plan (the "DRSPP"), pursuant to which it registered with the SEC and reserved for issuance 15,000,000 shares of its common stock. Under the terms of the DRSPP, stockholders who participated in the DRSPP were able to purchase shares of the Company's common stock directly from it, in cash investments up to $10,000. At the Company's sole discretion, it could accept optional cash investments in excess of $10,000 per month, which may qualify for a discount from the market price of 0% to 5%. DRSPP participants were also able to automatically reinvest all or a portion of their dividends for additional shares of the Company's stock. The Company has expected to use the proceeds from any dividend reinvestments or stock purchases for general corporate purposes.
For the year ended December 31, 2011, the Company issued a total of 61,846 common shares pursuant to the DRSPP for a gross sales price of $0.3 million. For the year ended December 31, 2010, the Company issued a total of 92,362 of common shares pursuant to the DRSPP for a gross sales price of $0.3 million.
Certain issuances of share of the Company's common stock under the DRSPP occurred more than three years after the related registration statement for those plans became effective. As a result, certain investors may have a rescission right. If a rescission right exists with respect to this issuances under the DRSPP, it would apply to up to 127,500 of shares of the Company's common stock issued for an aggregate consideration of up to $513,500. The Company terminated the stock purchase component of the DRSPP effective January 1, 2012.
Warrants Outstanding
The Company has issued and outstanding the following warrants to purchase shares of the Company's common stock:
| | | | | | | | | |
Issue Date | | Expiration
Date | | Number | | Exercise
Price | |
|---|
October 2009(1) | | October 2019 | | | 500,000 | | $ | 7.50 | |
October 2009(1) | | October 2020 | | | 250,000 | | | 8.60 | |
October 2009(1) | | October 2021 | | | 250,000 | | | 10.75 | |
June 2010(2) | | June 2020 | | | 2,000,000 | | | 7.60 | |
| | | | | | | | | |
Total | | | | | 3,000,000 | | | | |
| | | | | | | | | |
- (1)
- Issued in connection with an amendment to a secured term loan with Wachovia Bank, NA.
- (2)
- Issued in connection with the repayment and extinguishment of a secured term loan with Wachovia Bank, NA.
The exercise price of all outstanding warrants may be paid in cash or by cashless exercise and the exercise price and number of shares of common stock issuable are subject to anti-dilution requirements. All warrants are currently exercisable and have a one-to-one conversion to common stock.
158
Table of Contents
NORTHSTAR REALTY FINANCE CORP. AND SUBSIDIARIES
NOTES TO CONSOLIDATED FINANCIAL STATEMENTS (Continued)
Amounts in Thousands, Except per Share Data
12. Stockholders' Equity (Continued)
Dividends
The Company declared the following dividends (on a per share basis) for the years ended December 31, 2011, 2010 and 2009:
| | | | | | | | | | |
| |
| | Preferred Stock Dividend | |
|---|
| | Common Stock
Dividend | |
|---|
Declaration Date | | Series A | | Series B | |
|---|
2011 | | | | | | | | | | |
January 19 | | $ | 0.100 | | $ | 0.54688 | | $ | 0.51563 | |
May 4 | | $ | 0.100 | | $ | 0.54688 | | $ | 0.51563 | |
August 3 | | $ | 0.100 | | $ | 0.54688 | | $ | 0.51563 | |
November 2 | | $ | 0.125 | | $ | 0.54688 | | $ | 0.51563 | |
2010 | | | | | | | | | | |
January 19 | | $ | 0.100 | | $ | 0.54688 | | $ | 0.51563 | |
April 20 | | $ | 0.100 | | $ | 0.54688 | | $ | 0.51563 | |
July 20 | | $ | 0.100 | | $ | 0.54688 | | $ | 0.51563 | |
October 19 | | $ | 0.100 | | $ | 0.54688 | | $ | 0.51563 | |
2009 | | | | | | | | | | |
January 20(1) | | $ | 0.250 | | $ | 0.54688 | | $ | 0.51563 | |
April 21 | | $ | 0.100 | | $ | 0.54688 | | $ | 0.51563 | |
July 21 | | $ | 0.100 | | $ | 0.54688 | | $ | 0.51563 | |
October 20 | | $ | 0.100 | | $ | 0.54688 | | $ | 0.51563 | |
- (1)
- The dividends were paid in combination of 40% cash and 60% common stock which totaled 3,715,869 shares of common stock.
159
Table of Contents
NORTHSTAR REALTY FINANCE CORP. AND SUBSIDIARIES
NOTES TO CONSOLIDATED FINANCIAL STATEMENTS (Continued)
Amounts in Thousands, Except per Share Data
12. Stockholders' Equity (Continued)
Earnings Per Share
Earnings per share for the years ended December 31, 2011, 2010 and 2009 is computed as follows (amounts in thousands, except per share data):
| | | | | | | | | | |
| | Year Ended December 31, | |
|---|
| | 2011 | | 2010 | | 2009 | |
|---|
Numerator: | | | | | | | | | | |
Net income (loss) attributable to NorthStar Realty Finance Corp. common stockholders | | $ | (263,014 | ) | $ | (395,466 | ) | $ | (151,208 | ) |
Effect of dilutive securities: | | | | | | | | | | |
Income (loss) allocated to Operating Partnership non-controlling interest | | | (12,780 | ) | | (25,864 | ) | | (15,848 | ) |
| | | | | | | | |
Dilutive net income (loss) available to stockholders | | $ | (275,794 | ) | $ | (421,330 | ) | $ | (167,056 | ) |
| | | | | | | | |
Denominator: | | | | | | | | | | |
Shares available to common stockholders | | | 89,349 | | | 76,553 | | | 69,870 | |
Effect of dilutive securities(1): | | | | | | | | | | |
OP/LTIP units | | | 4,278 | | | 6,290 | | | 7,323 | |
| | | | | | | | |
Weighted Average Dilutive Shares | | | 93,627 | | | 82,843 | | | 77,193 | |
| | | | | | | | |
Net income (loss) per share attributable to NorthStar Realty Finance Corp. common stockholders—Basic/Diluted | | $ | (2.94 | ) | $ | (5.17 | )(2) | $ | (2.16 | ) |
| | | | | | | | |
- (1)
- Excludes the effect of convertible debt and warrants outstanding and exercisable of 3,000,000, 2,750,000 and 500,000 as of December 31, 2011, 2010 and 2009, respectively, that were not dilutive for the respective periods. These instruments could potentially impact diluted EPS in future periods, depending on changes in the Company's stock price.
- (2)
- Depending on the timing and amount of LTIP Units converted, the weighting of the common shares may result in an anti-dilutive effect on earnings per share. This amount reflects the non-anti-dilutive earnings per share amount as it appears on the statement of operations.
The EPS calculation takes into account the conversion of LTIP Units into common shares which convert on a one-for-one basis into common shares and share equally in the Company's income (loss).
13. Non-controlling Interests
Operating Partnership
Non-controlling interests includes the aggregate limited partnership interests or OP Units in the Operating Partnership held by limited partners (the "Unit Holders"). Income allocated to the non-controlling interest is based on the Unit Holders' ownership percentage of the Operating Partnership. The ownership percentage is determined by dividing the number of OP Units held by the Unit Holders by the total number of dilutive shares. The issuance of additional shares of beneficial interest (the "Common Shares" or "Shares") or OP Units changes the percentage ownership of both
160
Table of Contents
NORTHSTAR REALTY FINANCE CORP. AND SUBSIDIARIES
NOTES TO CONSOLIDATED FINANCIAL STATEMENTS (Continued)
Amounts in Thousands, Except per Share Data
13. Non-controlling Interests (Continued)
the Unit Holders and the Company. Since a unit is generally redeemable for cash or Shares at the option of the Company, it is deemed to be equivalent to a Share. Therefore, such transactions are treated as capital transactions and result in an allocation between stockholders' equity and non-controlling interests in the accompanying consolidated balance sheets to account for the change in the ownership of the underlying equity in the Operating Partnership. As of December 31, 2011 and 2010, non-controlling interests related to the aggregate limited partnership units of 4,207,836 and 4,289,276, represented a 4.20% and 5.21% interest in the Operating Partnership, respectively. Income (loss) allocated to the Operating Partnership non-controlling interest for the years ended December 31, 2011, 2010 and 2009 was a loss of $12.8 million, $25.9 million and $15.8 million, respectively.
Contingently Redeemable Non-controlling Interest
On July 14, 2011, the Company repaid the $100.0 million preferred membership interest in NRF Healthcare, LLC to Inland American Real Estate Trust, Inc. ("Inland American"), which had a 10.5% distribution rate. Income allocated to Inland American's non-controlling interest for the years ended December 31, 2011, 2010 and 2009 was $5.7 million, $10.5 million and $10.5 million, respectively.
Other
Other non-controlling interests include third-party interests of 16.7% of the equity notes of N-Star CDO I, third-party interests in six assets in the CSE CDO and one REO with a 22.6% non-controlling interest. Income (loss) allocated to the other non-controlling interests for the years ended December 31, 2011, 2010 and 2009 was $1.5 million, $0.3 million and ($0.9 million), respectively.
14. Risk Management and Derivative Activities
Derivatives
The Company uses derivative instruments primarily to manage interest rate risk exposure and such derivatives are not considered speculative. These derivative instruments are typically in the form of interest rate swap agreements and the primary objective is to minimize interest rate risks associated with the Company's investment and financing activities. The counterparties of these arrangements are major financial institutions with which the Company may also have other financial relationships. The Company is exposed to credit risk in the event of non-performance by these counterparties and it monitors their financial condition; however, the Company currently does not anticipate that any of the counterparties will fail to meet their obligations.
161
Table of Contents
NORTHSTAR REALTY FINANCE CORP. AND SUBSIDIARIES
NOTES TO CONSOLIDATED FINANCIAL STATEMENTS (Continued)
Amounts in Thousands, Except per Share Data
14. Risk Management and Derivative Activities (Continued)
The following tables summarize the Company's derivative instruments that were not designated as hedges under U.S. GAAP as of December 31, 2011 and 2010 (amounts in thousands):
| | | | | | | | | | | | | |
As of December 31, 2011: | | Number | | Notional
Amount(1) | | Fair Value
Net Asset
(Liability) | | Range of
Fixed LIBOR | | Range of Maturity |
|---|
Interest rate swaps | | | 38 | | $ | 1,836,972 | | $ | (234,616 | )(2) | 4.55%-5.63% | | September 2012-October 2019 |
Interest rate caps/floors | | | 5 | | | 468,500 | | | 5,677 | | 1.64%-7.00% | | May 2012-October 2014 |
| | | | | | | | | | | |
Total | | | 43 | | $ | 2,305,472 | | $ | (228,939 | ) | | | |
| | | | | | | | | | | |
As of December 31, 2010 | | | | | | | | | | | | | |
Interest rate swaps | | | 52 | | $ | 2,380,484 | | $ | (220,683 | ) | 4.55%-5.63% | | February 2011-October 2019 |
Interest rate caps/floors | | | 4 | | | 78,568 | | | 52 | | 1.00%-7.00% | | February 2011-October 2014 |
| | | | | | | | | | | |
Total | | | 56 | | $ | 2,459,052 | | $ | (220,631 | ) | | | |
| | | | | | | | | | | |
- (1)
- Interest rate swaps excludes timing swaps with a notional amount of $288.8 million and $353.4 million as of December 31, 2011 and 2010, respectively.
- (2)
- An aggregate of $1.8 billion notional amount of interest rate swaps were liabilities at period end and are only subject to the credit risks of the respective CDO structures. As the interest rate swaps are senior to all the liabilities of the respective CDOs and the fair value of each of the CDO's investments exceeded the fair value of the CDO's derivative liabilities, a credit valuation adjustment is no longer recorded.
During the second quarter 2011, the Company terminated $163.0 million notional amount of interest rate swaps which resulted in a payment of $27.1 million already held by the counterparty for the settlement. As of December 31, 2011 and 2010, the amounts in accumulated other comprehensive loss related to derivatives was $37.3 million and $44.8 million, respectively. In July 2011, the Company purchased an interest rate floor with a $450.0 million notional amount and a strike price of 1.64% above one-month LIBOR. The floor has a maturity date of January 2013. The remaining change from December 31, 2010 relates to contractual notional amortization. The Company had no derivative financial instruments that were designated as hedges in qualifying hedging relationships as of December 31, 2011 and 2010.
162
Table of Contents
NORTHSTAR REALTY FINANCE CORP. AND SUBSIDIARIES
NOTES TO CONSOLIDATED FINANCIAL STATEMENTS (Continued)
Amounts in Thousands, Except per Share Data
14. Risk Management and Derivative Activities (Continued)
The following table presents the fair value of the Company's derivative instruments as well as their classification on its consolidated balance sheets as of December 31, 2011 and 2010 (amounts in thousands):
| | | | | | | |
| | December 31, | |
|---|
Derivative assets | | 2011 | | 2010 | |
|---|
Interest rate derivatives, designated as hedges | | $ | — | | $ | — | |
Interest rate derivatives, not designated as hedges | | | 5,735 | | | 59 | |
| | | | | | |
| | $ | 5,735 | | $ | 59 | |
| | | | | | |
Derivative liabilities | | | | | | | |
Interest rate derivatives, designated as hedges | | $ | — | | $ | — | |
Interest rate derivatives, not designated as hedges | | | 234,674 | | | 220,689 | |
| | | | | | |
| | $ | 234,674 | | $ | 220,689 | |
| | | | | | |
The following tables present the effect of the Company's derivative instruments on its consolidated statements of operations for the years ended December 31, 2011, 2010 and 2009 (amounts in thousands):
| | | | | | | | | | | | |
| |
| | Year Ended December 31, | |
|---|
| | Income Statement
Location | |
|---|
| | 2011 | | 2010 | | 2009(1) | |
|---|
Cash flow hedges | | | | | | | | | | | | |
Amount of gain (loss) in OCI on derivative (effective portion) | | NA | | $ | — | | $ | (3,448 | ) | $ | 2,115 | |
Amount of gain (loss) reclassified from OCI into income (loss) related to effective portion | | Interest Expense | | $ | — | | $ | 30 | | $ | 28 | |
Non-hedge derivatives | | | | | | | | | | | | |
Amount of gain (loss) recognized in income | | Unrealized gain (loss) on investment and other | | $ | (38,312 | ) | $ | (34,047 | ) | $ | 4,424 | |
Amount of gain (loss) reclassified from OCI into income (loss) | | Unrealized gain (loss) on investment and other | | $ | (7,491 | ) | $ | (6,635 | ) | $ | (5,618 | ) |
- (1)
- The year ended December 31, 2009 does not include gains (losses) from transactions reclassified from accumulated OCI into income for N-Star CDOs I, II, III and V, as these CDO financings were unconsolidated prior to January 1, 2010.
The Company's counterparties held no cash margin as collateral against the Company's derivative contracts as of December 31, 2011 and one counterparty held $26.7 million of cash margin as collateral against a swap contract as of December 31, 2010.
163
Table of Contents
NORTHSTAR REALTY FINANCE CORP. AND SUBSIDIARIES
NOTES TO CONSOLIDATED FINANCIAL STATEMENTS (Continued)
Amounts in Thousands, Except per Share Data
14. Risk Management and Derivative Activities (Continued)
Credit Risk Concentrations
Concentrations of credit risk arise when a number of borrowers, tenants, operators or issuers related to the Company's investments are engaged in similar business activities or located in the same geographic location to be similarly affected by changes in economic conditions. The Company monitors its portfolio to identify potential concentrations of credit risks. The Company has no one borrower, tenant or operator that generates 10% or more of its total revenue. However, 29% of the Company's rental and escalation income for the year ended December 31, 2011 is generated from two operators in the Company's healthcare net lease portfolio. The Company believes the remainder of its net lease portfolio is reasonably well diversified and does not contain any unusual concentration of credit risks.
15. Commitments and Contingencies
Obligations Under Lease Agreements
The Company is the lessee of four offices located in New York, New York, Dallas, Texas, Englewood, Colorado and Bethesda, Maryland. In addition, the Company is lessee for eight ground leases treated as operating leases (seven are paid directly by the tenants or operators).
The minimum future rental payments under these contractual lease obligations as of December 31, 2011, is as follows (amounts in thousands):
| | | | |
Years Ending December 31: | |
| |
|---|
2012 | | $ | 6,557 | |
2013 | | | 6,404 | |
2014 | | | 6,360 | |
2015 | | | 6,169 | |
2016 | | | 6,053 | |
Thereafter | | | 27,488 | |
| | | | |
Total minimum lease payments | | $ | 59,031 | |
| | | | |
The Company recognized $2.6 million, $2.9 million and $2.6 million in rental expense for its offices for the years ended December 31, 2011, 2010 and 2009, respectively.
WaMu Matter
One of the Company's net lease investments was comprised of three office buildings totaling 257,000 square feet located in Chatsworth, California and was 100% leased to Washington Mutual Bank, FA ("WaMu"). The tenant vacated the buildings as of March 23, 2009 and the leases ("WaMu Leases') were disaffirmed by the Federal Deposit Insurance Corporation ("FDIC"). In the third quarter 2009, the lender, GECCMC 2005-CI Plummer Office Limited Partnership (or "GECCMC") foreclosed on the property. On August 10, 2009, GECCMC filed a complaint against NNN Holdings and NRFC Sub Investor IV, LLC (or "NRFC Sub Investor IV") which are wholly-owned subsidiaries of the Company, in the Superior Court of the State of California, County of Los Angeles. In the complaint, GECCMC alleged, among other things, that the loan provided by GECCMC to NRFC Sub Investor IV, was a recourse obligation of NNN Holdings due to the FDIC's disaffirmance of the WaMu
164
Table of Contents
NORTHSTAR REALTY FINANCE CORP. AND SUBSIDIARIES
NOTES TO CONSOLIDATED FINANCIAL STATEMENTS (Continued)
Amounts in Thousands, Except per Share Data
15. Commitments and Contingencies (Continued)
Leases. The judge presiding over the lawsuit has entered a judgment against NNN Holdings in the amount of approximately $46 million (the "Judgment") plus costs, attorneys' fees, prejudgment interests and accrued interest, currently estimated to be approximately $6 million. NNN Holdings is vigorously pursuing an appeal of the decision.
In accordance with accounting for contingencies, an estimated loss from a contingency shall be accrued by a charge to income if two conditions are met. First, information available prior to the issuance of the financial statements indicates that it is probable that an asset had been impaired or a liability had been incurred at the date of the financial statements. It is implicit in this condition that it must be probable that one or more future events will occur confirming the facts of the loss. Second, the amount of the loss can be reasonably estimated. The Company believes it is not probable that the lawsuit will result in an unfavorable outcome; however, in the third quarter 2011, the Company engaged in settlement discussions with GECCMC and, accordingly, in that quarter the Company recorded a loss accrual related to the Lawsuit in the amount of $20 million in other income (loss) in the consolidated statements of operations. If the Company were to settle the lawsuit for such amount, the Company would receive net proceeds of $6.1 million from the settlement through the return of its collateral under the Bond (as defined below). The Company continues to engage in settlement discussions, however, no assurances can be given that a settlement will be reached or the amount of such settlement.
In connection with filing for an appeal, pursuant to California law NNN Holdings was required to post a bond in an amount equal to one and a half times the amount of the Judgment (the "Bond"). Accordingly, the Company has entered into a standard General Agreement of Indemnity with an issuer of surety bonds (the "Surety Agreement"). On January 7, 2011, as part of the Surety Agreement and in connection with the issuance of the Bond, the Company posted cash collateral of $26.1 million, equal to 38% of the amount of the Bond. In January 2012, the Company renewed the Bond with identical terms as currently exist.
Other
Effective January 1, 2005, the Company adopted the NorthStar Realty Limited Partnership 401(k) Retirement Plan (the "401(k) Plan") for its employees. Eligible employees under the 401(k) Plan may begin participation on the first day of the month after they have completed 30 days of employment. The Company's matching contribution is calculated as 100% of the first 3% and 50% of the next 2%, of participant's eligible earnings contributed (utilizing earnings that are not in excess of the amount established by the Internal Revenue Service). The Company's aggregate matching contribution for the years ended December 31, 2011, 2010 and 2009 was $0.6 million, $0.5 million and $0.3 million, respectively.
165
Table of Contents
NORTHSTAR REALTY FINANCE CORP. AND SUBSIDIARIES
NOTES TO CONSOLIDATED FINANCIAL STATEMENTS (Continued)
Amounts in Thousands, Except per Share Data
16. Quarterly Financial Information (Unaudited)
The following reflects the Company's selected quarterly information, which reflects prior period reclassifications related to discontinued operations, for the years ended December 31, 2011 and 2010:
| | | | | | | | | | | | | |
| | Three Months Ended | |
|---|
2011 | | December 31,
2011 | | September 30,
2011 | | June 30,
2011 | | March 31,
2011 | |
|---|
Total revenues | | $ | 124,919 | | $ | 131,020 | | $ | 140,049 | | $ | 131,818 | |
Income (loss) from continuing operations | | | (80,631 | ) | | (24,011 | ) | | (47,335 | ) | | (106,457 | ) |
Income (loss) from discontinued operations | | | (261 | ) | | (391 | ) | | (1,047 | ) | | 409 | |
Gain on sale from discontinued operations | | | (782 | ) | | 3,533 | | | 9,416 | | | 5,031 | |
Net income (loss) | | | (81,674 | ) | | (20,869 | ) | | (38,966 | ) | | (101,017 | ) |
Net income (loss) attributable to NorthStar Realty Finance Corp. common stockholders | | | (82,685 | ) | | (24,553 | ) | | (51,983 | ) | | (103,793 | ) |
Net income (loss) per common share attributable to NorthStar Realty Finance Corp. common stockholders (basic/diluted) | | $ | (0.86 | ) | $ | (0.26 | ) | $ | (0.60 | ) | $ | (1.33 | ) |
Weighted average number of shares of common stock: | | | | | | | | | | | | | |
Basic | | | 96,006,344 | | | 95,957,333 | | | 86,966,645 | | | 78,196,016 | |
Diluted | | | 100,244,453 | | | 100,229,735 | | | 91,233,904 | | | 82,534,563 | |
| | | | | | | | | | | | | |
| | Three Months Ended | |
|---|
2010 | | December 31,
2010 | | September 30,
2010 | | June 30,
2010 | | March 31,
2010 | |
|---|
Total revenues | | $ | 146,876 | | $ | 124,344 | | $ | 93,514 | | $ | 79,222 | |
Income (loss) from continuing operations | | | (267,298 | ) | | (147,001 | ) | | 43,397 | | | (20,260 | ) |
Income (loss) from discontinued operations | | | 115 | | | 55 | | | (1,384 | ) | | 289 | |
Gain on sale from discontinued operations | | | — | | | — | | | 2,528 | | | — | |
Net income (loss) | | | (267,181 | ) | | (146,848 | ) | | 44,573 | | | (20,103 | ) |
Net income (loss) attributable to NorthStar Realty Finance Corp. common stockholders | | | (258,410 | ) | | (144,118 | ) | | 31,985 | | | (24,923 | ) |
Net income (loss) per common share attributable to NorthStar Realty Finance Corp. common stockholders (basic/diluted) | | $ | (3.33 | ) | $ | (1.87 | ) | $ | 0.42 | | $ | (0.33 | ) |
Weighted average number of shares of common stock: | | | | | | | | | | | | | |
Basic | | | 77,564,571 | | | 77,139,868 | | | 76,407,339 | | | 75,068,654 | |
Diluted | | | 82,383,931 | | | 82,364,109 | | | 82,279,682 | | | 82,217,223 | |
166
Table of Contents
NORTHSTAR REALTY FINANCE CORP. AND SUBSIDIARIES
NOTES TO CONSOLIDATED FINANCIAL STATEMENTS (Continued)
Amounts in Thousands, Except per Share Data
17. Segment Reporting
The Company conducts its business through the following segments:
- •
- The CRE debt business is focused on originating, structuring, acquiring and managing senior and subordinate debt investments secured primarily by commercial and multifamily properties and includes first mortgage loans, subordinate mortgage interests, mezzanine loans, credit tenant loans and other loans, including preferred equity interests.
- •
- The CRE securities business is focused on investing in and managing a wide range of CRE securities including, CMBS, unsecured REIT debt and CDO notes backed by CRE securities and CRE debt.
- •
- The net lease properties business is focused on acquiring CRE located throughout the United States that are typically leased under long-term triple net leases to corporate tenants and healthcare operators. The core net lease business invests primarily in office, industrial and retail properties. We also own, manage and invest in a portfolio of healthcare properties focused on mid-acuity facilities (i.e., skilled and assisted), with the highest concentration in assisted living facilities.
- •
- The asset management and other activities relate to real estate and real estate finance, including managing the CDO financing transactions on a fee basis, sponsoring and advising on a fee basis, non-listed REITs (i.e., NSREIT) and acting as a special servicer for the Company's owned (and potentially third-party owned) CMBS. The Company has also filed a registration statement on Form S-11 for Senior Care, a non-listed REIT that intends to invest in loans and real estate focused on the healthcare sector.
The Company primarily generates revenue from interest income on the CRE debt and security portfolios, rental income from the net lease properties and fee income from the asset management and other related activities. The Company's income is primarily derived through the difference between revenues and the cost at which the Company is able to finance its assets. The Company may also invest in assets that generate attractive returns without any leverage.
167
Table of Contents
NORTHSTAR REALTY FINANCE CORP. AND SUBSIDIARIES
NOTES TO CONSOLIDATED FINANCIAL STATEMENTS (Continued)
Amounts in Thousands, Except per Share Data
17. Segment Reporting (Continued)
The following summarizes segment reporting for the years ended December 31, 2011, 2010 and 2009 (amounts in thousands):
| | | | | | | | | | | | | | | | | | | |
Year ended December 31, 2011: | | Real
Estate
Debt | | Real
Estate
Securities | | Net Lease
Properties | | Asset
Management/
Other | | Unallocated(1) | | Consolidated
Total | |
|---|
Revenues and other income | | | | | | | | | | | | | | | | | | | |
Interest income | | $ | 200,043 | | $ | 197,943 | | $ | 130 | | $ | — | | $ | 367 | | $ | 398,483 | |
Rental and escalation income | | | 18,664 | | | — | | | 93,878 | | | — | | | 155 | | | 112,697 | |
Commission income | | | — | | | — | | | — | | | 12,024 | | | — | | | 12,024 | |
Other revenue | | | 1,007 | | | 105 | | | 103 | | | — | | | 3,387 | | | 4,602 | |
| | | | | | | | | | | | | | |
Total revenues | | | 219,714 | | | 198,048 | | | 94,111 | | | 12,024 | | | 3,909 | | | 527,806 | |
Expenses | | | | | | | | | | | | | | | | | | | |
Interest expense | | | 35,272 | | | 23,432 | | | 56,301 | | | — | | | 27,215 | | | 142,220 | |
Real estate properties—operating expenses | | | 8,276 | | | — | | | 14,154 | | | — | | | 101 | | | 22,531 | |
Asset management expense | | | 3,971 | | | 738 | | | 615 | | | — | | | 214 | | | 5,538 | |
Commission expense | | | — | | | — | | | — | | | 9,239 | | | | | | 9,239 | |
Provision for loan losses | | | 52,980 | | | — | | | — | | | — | | | — | | | 52,980 | |
Provision for loan losses on equity investment | | | 4,482 | | | — | | | — | | | — | | | — | | | 4,482 | |
General and administrative and other | | | 2,253 | | | 3,742 | | | 5,233 | | | 10,095 | | | 74,060 | | | 95,383 | |
Depreciation and amortization | | | 13,517 | | | — | | | 29,517 | | | 62 | | | 1,162 | | | 44,258 | |
| | | | | | | | | | | | | | |
Total expenses | | | 120,751 | | | 27,912 | | | 105,820 | | | 19,396 | | | 102,752 | | | 376,631 | |
| | | | | | | | | | | | | | |
Income (loss) from operations | | | 98,963 | | | 170,136 | | | (11,709 | ) | | (7,372 | ) | | (98,843 | ) | | 151,175 | |
Equity in earnings (losses) of unconsolidated venture | | | (3,662 | ) | | — | | | 671 | | | — | | | 253 | | | (2,738 | ) |
Other income (loss) | | | 18,703 | | | 5,000 | | | (19,541 | ) | | — | | | — | | | 4,162 | |
Unrealized gain (loss) on investments and other | | | (112,811 | ) | | (403,847 | ) | | — | | | — | | | 26,754 | | | (489,904 | ) |
Realized gain (loss) on investments and other | | | 71,867 | | | 11,684 | | | (2,238 | ) | | — | | | (2,531 | ) | | 78,782 | |
Gain from acquisitions | | | 89 | | | — | | | — | | | — | | | — | | | 89 | |
| | | | | | | | | | | | | | |
Income (loss) from continuing operations | | | 73,149 | | | (217,027 | ) | | (32,817 | ) | | (7,372 | ) | | (74,367 | ) | | (258,434 | ) |
| | | | | | | | | | | | | | |
Income from discontinued operations | | | (826 | ) | | — | | | (464 | ) | | — | | | — | | | (1,290 | ) |
Gain on sale of discontinued operations | | | 2,801 | | | — | | | 14,397 | | | — | | | — | | | 17,198 | |
| | | | | | | | | | | | | | |
Net income (loss) | | $ | 75,124 | | $ | (217,027 | ) | $ | (18,884 | ) | $ | (7,372 | ) | $ | (74,367 | ) | $ | (242,526 | ) |
| | | | | | | | | | | | | | |
Investments and advances to unconsolidated ventures | | $ | 79,885 | | $ | — | | $ | 5,691 | | $ | — | | $ | 7,981 | | $ | 93,557 | |
| | | | | | | | | | | | | | |
Total Assets as of December 31, 2011 | | $ | 2,449,323 | | $ | 1,520,650 | | $ | 862,411 | | $ | 2,479 | | $ | 171,574 | | $ | 5,006,437 | |
| | | | | | | | | | | | | | |
- (1)
- Unallocated includes corporate level investments, corporate level interest income, interest expense and unallocated general and administrative expenses.
168
Table of Contents
NORTHSTAR REALTY FINANCE CORP. AND SUBSIDIARIES
NOTES TO CONSOLIDATED FINANCIAL STATEMENTS (Continued)
Amounts in Thousands, Except per Share Data
17. Segment Reporting (Continued)
| | | | | | | | | | | | | | | | | | | |
Year ended December 31, 2010: | | Real
Estate
Debt | | Real
Estate
Securities | | Net Lease
Properties | | Asset
Management/
Other | | Unallocated(1) | | Consolidated
Total | |
|---|
Revenues and other income | | | | | | | | | | | | | | | | | | | |
Interest income | | $ | 149,043 | | $ | 169,422 | | $ | 267 | | $ | — | | $ | 60 | | $ | 318,792 | |
Rental and escalation income | | | — | | | — | | | 115,312 | | | — | | | 155 | | | 115,467 | |
Commission income | | | — | | | — | | | — | | | 2,476 | | | — | | | 2,476 | |
Other revenue | | | 1,587 | | | 4,143 | | | 200 | | | — | | | 1,291 | | | 7,221 | |
| | | | | | | | | | | | | | |
Total revenues | | | 150,630 | | | 173,565 | | | 115,779 | | | 2,476 | | | 1,506 | | | 443,956 | |
Expenses | | | | | | | | | | | | | | | | | | | |
Interest expense | | | 24,940 | | | 25,839 | | | 56,879 | | | — | | | 18,552 | | | 126,210 | |
Real estate properties—operating expenses | | | — | | | — | | | 37,511 | | | — | | | 54 | | | 37,565 | |
Asset management expense | | | 2,705 | | | 732 | | | 684 | | | — | | | 384 | | | 4,505 | |
Commission expense | | | — | | | — | | | — | | | 1,867 | | | — | | | 1,867 | |
Impairment on operating real estate | | | — | | | — | | | 5,249 | | | — | | | — | | | 5,249 | |
Provision for loan losses | | | 168,213 | | | 233 | | | — | | | — | | | — | | | 168,446 | |
General and administrative and other | | | 2,749 | | | 3,556 | | | 7,696 | | | 5,975 | | | 64,898 | | | 84,874 | |
Depreciation and amortization | | | 532 | | | — | | | 29,722 | | | 26 | | | 1,186 | | | 31,466 | |
| | | | | | | | | | | | | | |
Total expenses | | | 199,139 | | | 30,360 | | | 137,741 | | | 7,868 | | | 85,074 | | | 460,182 | |
| | | | | | | | | | | | | | |
Income (loss) from operations | | | (48,509 | ) | | 143,205 | | | (21,962 | ) | | (5,392 | ) | | (83,568 | ) | | (16,226 | ) |
Equity in earnings (losses) of unconsolidated venture | | | (5,093 | ) | | 8,488 | | | 2,534 | | | — | | | (3,379 | ) | | 2,550 | |
Unrealized gain (loss) on investments and other | | | (268,551 | ) | | (230,709 | ) | | — | | | — | | | (39,312 | ) | | (538,572 | ) |
Realized gain (loss) on investments and other | | | 72,317 | | | 73,583 | | | (494 | ) | | — | | | 316 | | | 145,722 | |
Gain from acquisitions | | | 15,363 | | | | | | | | | | | | | | | 15,363 | |
| | | | | | | | | | | | | | |
Income (loss) from continuing operations | | | (234,473 | ) | | (5,433 | ) | | (19,922 | ) | | (5,392 | ) | | (125,943 | ) | | (391,163 | ) |
| | | | | | | | | | | | | | |
Income from discontinued operations | | | (2,063 | ) | | — | | | 1,138 | | | — | | | — | | | (925 | ) |
Gain on sale of discontinued operations | | | — | | | — | | | 2,528 | | | — | | | — | | | 2,528 | |
| | | | | | | | | | | | | | |
Net income (loss) | | $ | (236,536 | ) | $ | (5,433 | ) | $ | (16,256 | ) | $ | (5,392 | ) | $ | (125,943 | ) | $ | (389,560 | ) |
| | | | | | | | | | | | | | |
Investments and advances to unconsolidated ventures | | $ | 86,868 | | $ | — | | $ | 6,157 | | | | | $ | 6,966 | | $ | 99,992 | |
| | | | | | | | | | | | | | |
Total Assets as of December 31, 2010 | | $ | 2,216,425 | | $ | 1,740,712 | | $ | 1,061,983 | | $ | 1,591 | | $ | 131,280 | | $ | 5,151,991 | |
| | | | | | | | | | | | | | |
- (1)
- Unallocated includes corporate level investments, corporate level interest income, interest expense and unallocated general and administrative expenses.
169
Table of Contents
NORTHSTAR REALTY FINANCE CORP. AND SUBSIDIARIES
NOTES TO CONSOLIDATED FINANCIAL STATEMENTS (Continued)
Amounts in Thousands, Except per Share Data
17. Segment Reporting (Continued)
| | | | | | | | | | | | | | | | | | | |
Year ended December 31, 2009: | | Real
Estate
Debt | | Real
Estate
Securities | | Net Lease
Properties | | Asset
Management/
Other | | Unallocated(1) | | Consolidated
Total | |
|---|
Revenues and other income | | | | | | | | | | | | | | | | | | | |
Interest income | | $ | 104,977 | | $ | 36,822 | | $ | 299 | | $ | — | | $ | 115 | | $ | 142,213 | |
Rental and escalation income | | | — | | | — | | | 88,856 | | | — | | | 141 | | | 88,997 | |
Other revenue | | | 2,523 | | | 21,951 | | | 3 | | | — | | | 961 | | | 25,438 | |
| | | | | | | | | | | | | | |
Total revenues | | | 107,500 | | | 58,773 | | | 89,158 | | | — | | | 1,217 | | | 256,648 | |
Expenses | | | | | | | | | | | | | | | | | | | |
Interest expense | | | 32,460 | | | 4,089 | | | 57,950 | | | — | | | 21,634 | | | 116,133 | |
Real estate properties—operating expenses | | | 1 | | | — | | | 14,547 | | | — | | | 12 | | | 14,560 | |
Asset management expense | | | 1,446 | | | 207 | | | 2,523 | | | — | | | 38 | | | 4,214 | |
Provision for loan losses | | | 83,745 | | | — | | | — | | | — | | | — | | | 83,745 | |
General and administrative and other | | | 1,328 | | | 1,761 | | | 5,947 | | | 1,268 | | | 59,123 | | | 69,427 | |
Depreciation and amortization | | | 14 | | | — | | | 38,469 | | | 1 | | | 590 | | | 39,074 | |
| | | | | | | | | | | | | | |
Total expenses | | | 118,994 | | | 6,057 | | | 119,436 | | | 1,269 | | | 81,397 | | | 327,153 | |
| | | | | | | | | | | | | | |
Income (loss) from operations | | | (11,494 | ) | | 52,716 | | | (30,278 | ) | | (1,269 | ) | | (80,180 | ) | | (70,505 | ) |
Equity in earnings (losses) of unconsolidated venture | | | (3,411 | ) | | — | | | 7,902 | | | — | | | (6,015 | ) | | (1,524 | ) |
Unrealized gain (loss) on investments and other | | | (95,624 | ) | | (21,924 | ) | | — | | | — | | | (92,428 | ) | | (209,976 | ) |
Realized gain (loss) on investments and other | | | (3,502 | ) | | 72,443 | | | 8,204 | | | — | | | 51,316 | | | 128,461 | |
| | | | | | | | | | | | | | |
Income (loss) from continuing operations | | | (114,031 | ) | | 103,235 | | | (14,172 | ) | | (1,269 | ) | | (127,307 | ) | | (153,544 | ) |
Income from discontinued operations | | | — | | | — | | | 3,169 | | | — | | | — | | | 3,169 | |
Gain on sale of discontinued operations | | | — | | | — | | | 13,799 | | | — | | | — | | | 13,799 | |
| | | | | | | | | | | | | | |
Net income (loss) | | $ | (114,031 | ) | $ | 103,235 | | $ | 2,796 | | $ | (1,269 | ) | $ | (127,307 | ) | $ | (136,576 | ) |
| | | | | | | | | | | | | | |
Investments and advances to unconsolidated ventures | | $ | 10,043 | | $ | 8,943 | | $ | 7,903 | | | | | $ | 11,410 | | $ | 38,299 | |
| | | | | | | | | | | | | | |
Total Assets as of December 31, 2009 | | $ | 2,139,259 | | $ | 334,901 | | $ | 1,085,806 | | $ | 956 | | $ | 108,642 | | $ | 3,669,564 | |
| | | | | | | | | | | | | | |
- (1)
- Unallocated includes corporate level investments, corporate level interest income, interest expense and unallocated general and administrative expenses.
170
Table of Contents
NORTHSTAR REALTY FINANCE CORP. AND SUBSIDIARIES
NOTES TO CONSOLIDATED FINANCIAL STATEMENTS (Continued)
Amounts in Thousands, Except per Share Data
18. Supplemental Disclosure of Non-Cash Investing and Financing Activities
A summary of non-cash investing and financing activities for the years ended December 31, 2011, 2010 and 2009 is as follows (amounts in thousands):
| | | | | | | | | | |
| | December 31, | |
|---|
| | 2011 | | 2010 | | 2009 | |
|---|
Real estate acquisition(1) | | $ | (318,386 | ) | $ | (76,389 | ) | $ | — | |
Assumption of mortgage(1) | | | 248,252 | | | — | | | — | |
Reduction of real estate debt investments(1) | | | 117,606 | | | — | | | — | |
Increase of restricted cash(1) | | | (12,275 | ) | | — | | | — | |
Foreclosure of timeshare interest(1) | | | (6,076 | ) | | — | | | — | |
Reduction of operating real estate via foreclosure | | | (50,029 | ) | | | | | | |
Timeshare seller financing | | | (2,307 | ) | | — | | | — | |
Elimination of mortgage notes payable upon acquisition of real estate debt investment | | | (36,252 | ) | | — | | | — | |
Reduction of mortgage notes payable due to foreclosure | | | 47,372 | | | — | | | — | |
Reclass from equity to liabilities for prior year accrued equity compensation | | | 2,136 | | | — | | | — | |
Equity component of 7.5% exchangeable senior note | | | (14,318 | ) | | — | | | — | |
Non-controlling interest contribution real estate debt investment at fair value | | | (144 | ) | | (6,650 | ) | | — | |
Repayments on real estate debt investment due from servicer | | | (4,080 | ) | | — | | | — | |
Redemption of operating partnership units for common stock | | | (8,481 | ) | | — | | | — | |
Escrow deposit payable related to real estate debt investment | | | 7,747 | | | 21,250 | | | 6,892 | |
Increase of restricted cash in connection with swap collateral | | | 22,389 | | | — | | | — | |
Assets of acquired CDO | | | (212,205 | ) | | (480,312 | ) | | — | |
Liabilities of acquired CDO | | | 201,409 | | | 464,656 | | | — | |
Consolidate assets of N-Star CDO financing transactions | | | — | | | (1,143,649 | ) | | — | |
Consolidate liabilities of N-Star CDO financing transactions | | | — | | | 798,706 | | | — | |
Consolidate non-controlling interest | | | — | | | 3,511 | | | — | |
General partner distribution of operating real estate to non-controlling interest | | | — | | | 9,525 | | | — | |
Distribution of mortgage notes payable to non-controlling interest | | | — | | | (4,734 | ) | | — | |
Deconsolidation of non-controlling interest | | | — | | | (1,815 | ) | | — | |
40% participation interest in principal proceeds of debt investment granted to lender in connection with repayment extinguishment of respective secured term loan | | | — | | | 35,287 | | | — | |
Elimination of available for sale securities | | | 11,205 | | | 1,342 | | | — | |
Elimination of bonds payable | | | — | | | 32,286 | | | — | |
Write-off of operating real estate and related deferred costs, capitalized costs and intangibles(1) | | | — | | | — | | | 54,741 | |
Reduction of mortgage notes payable due to foreclosure | | | — | | | — | | | (52,067 | ) |
Equity component of issued warrants | | | — | | | — | | | 117 | |
Stock dividend | | | — | | | — | | | 10,646 | |
171
Table of Contents
NORTHSTAR REALTY FINANCE CORP. AND SUBSIDIARIES
NOTES TO CONSOLIDATED FINANCIAL STATEMENTS (Continued)
Amounts in Thousands, Except per Share Data
18. Supplemental Disclosure of Non-Cash Investing and Financing Activities (Continued)
- (1)
- Non-cash activity occurred in connection with foreclosure.
19. Subsequent Events
Dividends
On February 15, 2012, the Company declared a dividend of $0.135 per share of common stock. The common stock dividend will be paid on March 2, 2012 to stockholders of record as of the close of business on February 27, 2012. On January 30, 2012, the Company declared a dividend of $0.54688 per share of Series A preferred stock and $0.51563 per share of Series B preferred stock. The Series A and Series B preferred stock dividends were paid on February 15, 2012, to stockholders of record as of the close of business on February 9, 2012.
172
Table of Contents
NORTHSTAR REALTY FINANCE CORP. AND SUBSIDIARIES
SCHEDULE II—VALUATION AND QUALIFYING ACCOUNTS AND RESERVES
(Amounts in Thousands)
| | | | | | | | | | | | | | | | |
| | Beginning
Balance | | Charged to
Costs and
Expenses | | Other
Charges | | Deductions | | Ending
Balance | |
|---|
For the Year Ended December 31, 2009 | | | | | | | | | | | | | | | | |
Reserve for loan loss | | $ | 11,200 | | $ | 83,745 | | $ | — | | $ | (17,545 | ) | $ | 77,400 | |
Allowance for doubtful accounts | | | 445 | | | 2,141 | | | — | | | (1,237 | ) | | 1,349 | |
| | | | | | | | | | | | |
| | $ | 11,645 | | $ | 85,886 | | $ | — | | $ | (18,782 | ) | $ | 78,749 | |
| | | | | | | | | | | | |
For the Year Ended December 31, 2010 | | | | | | | | | | | | | | | | |
Reserve for loan loss | | $ | 77,400 | | $ | 168,446 | | | — | | $ | (48,646 | ) | $ | 197,200 | |
Allowance for doubtful accounts | | | 1,349 | | | 1,293 | | | — | | | — | | | 2,642 | |
| | | | | | | | | | | | |
| | $ | 78,749 | | $ | 169,739 | | $ | — | | $ | (48,646 | ) | $ | 199,842 | |
| | | | | | | | | | | | |
For the Year Ended December 31, 2011 | | | | | | | | | | | | | | | | |
Reserve for loan loss | | $ | 197,200 | | $ | 52,980 | | $ | — | | $ | (62,396 | ) | $ | 187,784 | |
Allowance for doubtful accounts | | | 2,642 | | | 357 | | | | | | (1,820 | ) | | 1,179 | |
| | | | | | | | | | | | |
| | $ | 199,842 | | $ | 53,337 | | $ | — | | $ | (64,216 | ) | $ | 188,963 | |
| | | | | | | | | | | | |
173
Table of Contents
NORTHSTAR REALTY FINANCE CORP. AND SUBSIDIARIES
SCHEDULE III—REAL ESTATE AND ACCUMULATED DEPRECIATION
As of December 31, 2011
(Amounts in Thousands)
| | | | | | | | | | | | | | | | | | | | | | | | | | | | | | | | | | | | | |
| Column A | | Column B | | Column C
Initial Cost | | Column D
Cost Capitalized
Subsequent
To Acquisition | | Column E
Gross Amount Carried at
Close of Period | | Column F | | Column G | | Column H | |
|---|
Location
City, State | | Encumbrances | | Land | | Buildings &
Improvements | | Land | | Buildings &
Improvements | | Land | | Buildings &
Improvements | | Total | | Accumulated
Depreciation | | Total | | Date Acquired | | Life on Which
Depreciation is
Computed | |
|---|
Core Net Lease | | | | | | | | | | | | | | | | | | | | | | | | | | | | | | | | | | | | | |
Auburn Hills, MI | | $ | 11,021 | | $ | 2,980 | | $ | 8,607 | | $ | — | | $ | — | | $ | 2,980 | | $ | 8,607 | | $ | 11,587 | | $ | 2,475 | | $ | 9,112 | | | Sep-05 | | | 40 years | |
Aurora, CO | | | 32,159 | | | 2,650 | | | 35,786 | | | 23 | | | — | | | 2,673 | | | 35,786 | | | 38,459 | | | 5,276 | | | 33,183 | | | Jul-06 | | | 40 years | |
Camp Hill, PA | | | 23,910 | | | 5,900 | | | 19,510 | | | — | | | — | | | 5,900 | | | 19,510 | | | 25,410 | | | 5,090 | | | 20,320 | | | Sep-05 | | | 40 years | |
Columbus, OH | | | 22,937 | | | 4,375 | | | 29,184 | | | — | | | — | | | 4,375 | | | 29,184 | | | 33,559 | | | 3,629 | | | 29,930 | | | Nov-07 | | | 40 years | |
Fort Mill, SC | | | 29,861 | | | 3,300 | | | 31,554 | | | — | | | — | | | 3,300 | | | 31,554 | | | 34,854 | | | 4,302 | | | 30,552 | | | Mar-07 | | | 40 years | |
Milpitas, CA | | | 21,141 | | | 16,800 | | | 8,847 | | | — | | | — | | | 16,800 | | | 8,847 | | | 25,647 | | | 1,738 | | | 23,909 | | | Feb-07 | | | 40 years | |
Indianapolis, IN | | | 27,416 | | | 1,670 | | | 32,306 | | | — | | | — | | | 1,670 | | | 32,306 | | | 33,976 | | | 5,424 | | | 28,552 | | | Mar-06 | | | 40 years | |
Rancho Cordova, CA | | | 10,485 | | | 3,060 | | | 9,360 | | | — | | | — | | | 3,060 | | | 9,360 | | | 12,420 | | | 2,114 | | | 10,306 | | | Sep-05 | | | 40 years | |
Rockaway, NJ | | | 16,635 | | | 6,118 | | | 15,664 | | | — | | | 295 | | | 6,118 | | | 15,959 | | | 22,077 | | | 2,808 | | | 19,269 | | | Mar-06 | | | 40 years | |
Salt Lake City, UT | | | 14,625 | | | 672 | | | 19,739 | | | — | | | 323 | | | 672 | | | 20,062 | | | 20,734 | | | 4,616 | | | 16,118 | | | Aug-05 | | | 40 years | |
| | | | | | | | | | | | | | | | | | | | | | | | | | | | |
Subtotal Office | | | 210,190 | | | 47,525 | | | 210,557 | | | 23 | | | 618 | | | 47,548 | | | 211,175 | | | 258,723 | | | 37,472 | | | 221,251 | | | | | | | |
Bloomingdale, IL | | |
5,516 | | |
— | | |
5,810 | | |
— | | |
— | | |
— | | |
5,810 | | |
5,810 | | |
932 | | |
4,878 | | |
Sep-06 | | |
40 years | |
Manchester, NH | | | 8,056 | | | 2,145 | | | 9,216 | | | — | | | — | | | 2,145 | | | 9,216 | | | 11,361 | | | 1,504 | | | 9,857 | | | Sep-06 | | | 40 years | |
Fort Wayne, IN | | | 3,221 | | | — | | | 3,642 | | | — | | | — | | | — | | | 3,642 | | | 3,642 | | | 628 | | | 3,014 | | | Sep-06 | | | 40 years | |
Keene, NH | | | 6,478 | | | 3,033 | | | 5,919 | | | — | | | — | | | 3,033 | | | 5,919 | | | 8,952 | | | 938 | | | 8,014 | | | Sep-06 | | | 40 years | |
Melville, NY | | | 4,278 | | | — | | | 3,187 | | | — | | | — | | | — | | | 3,187 | | | 3,187 | | | 574 | | | 2,613 | | | Sep-06 | | | 40 years | |
Millbury, MA | | | 4,548 | | | — | | | 5,994 | | | — | | | — | | | — | | | 5,994 | | | 5,994 | | | 858 | | | 5,136 | | | Sep-06 | | | 40 years | |
New York, NY | | | — | | | — | | | 3,245 | | | — | | | — | | | — | | | 3,245 | | | 3,245 | | | 3,007 | | | 238 | | | Mar-99 | | | Various | |
North Attleboro, MA | | | 4,530 | | | — | | | 5,445 | | | — | | | — | | | — | | | 5,445 | | | 5,445 | | | 871 | | | 4,574 | | | Sep-06 | | | 40 years | |
South Portland, ME | | | 4,266 | | | — | | | 6,687 | | | — | | | — | | | — | | | 6,687 | | | 6,687 | | | 1,540 | | | 5,147 | | | Sep-06 | | | 24.4 years | |
Wichita, KS | | | 5,895 | | | 1,325 | | | 5,584 | | | — | | | — | | | 1,325 | | | 5,584 | | | 6,909 | | | 860 | | | 6,049 | | | Sep-06 | | | 40 years | |
| | | | | | | | | | | | | | | | | | | | | | | | | | | | |
Subtotal Retail | | | 46,788 | | | 6,503 | | | 54,729 | | | — | | | — | | | 6,503 | | | 54,729 | | | 61,232 | | | 11,712 | | | 49,520 | | | | | | | |
Reading, PA | | |
18,367 | | |
3,225 | | |
21,792 | | |
— | | |
586 | | |
3,225 | | |
22,378 | | |
25,603 | | |
2,521 | | |
23,082 | | |
Jun-07 | | |
40 years | |
| | | | | | | | | | | | | | | | | | | | | | | | | | | | |
Subtotal Other | | | 18,367 | | | 3,225 | | | 21,792 | | | — | | | 586 | | | 3,225 | | | 22,378 | | | 25,603 | | | 2,521 | | | 23,082 | | | | | | | |
| | | | | | | | | | | | | | | | | | | | | | | | | | | | |
Total Core Net Lease | | | 275,345 | | | 57,253 | | | 287,078 | | | 23 | | | 1,204 | | | 57,276 | | | 288,282 | | | 345,558 | | | 51,705 | | | 293,853 | | | | | | | |
174
Table of Contents
NORTHSTAR REALTY FINANCE CORP. AND SUBSIDIARIES
SHEDULE III—REAL ESTATE AND ACCUMULATED DEPRECIATION (Continued)
As of December 31, 2011
(Amounts in Thousands)
| | | | | | | | | | | | | | | | | | | | | | | | | | | | | | | | | | | | | |
| Column A | | Column B | | Column C
Initial Cost | | Column D
Cost Capitalized
Subsequent
To Acquisition | | Column E
Gross Amount Carried at
Close of Period | | Column F | | Column G | | Column H | |
|---|
Location
City, State | | Encumbrances | | Land | | Buildings &
Improvements | | Land | | Buildings &
Improvements | | Land | | Buildings &
Improvements | | Total | | Accumulated
Depreciation | | Total | | Date Acquired | | Life on Which
Depreciation is
Computed | |
|---|
Healthcare Net Lease | | | | | | | | | | | | | | | | | | | | | | | | | | | | | | | | | | | | | |
Black Mountain, NC | | $ | 5,241 | | $ | 468 | | $ | 5,786 | | $ | — | | $ | — | | $ | 468 | | $ | 5,786 | | $ | 6,254 | | $ | 790 | | $ | 5,464 | | | Jul-06 | | | 40 years | |
Blountstown, FL | | | 3,831 | | | 378 | | | 5,069 | | | — | | | — | | | 378 | | | 5,069 | | | 5,447 | | | 692 | | | 4,755 | | | Jul-06 | | | 40 years | |
Bremerton, WA | | | 7,199 | | | 964 | | | 8,171 | | | — | | | 360 | | | 964 | | | 8,531 | | | 9,495 | | | 1,090 | | | 8,405 | | | Dec-06 | | | 40 years | |
Carrollton, GA | | | 2,924 | | | 816 | | | 4,220 | | | — | | | 557 | | | 816 | | | 4,777 | | | 5,593 | | | 572 | | | 5,021 | | | Jan-07 | | | 40 years | |
Castleton, IN | | | — | | | 677 | | | 8,077 | | | — | | | — | | | 677 | | | 8,077 | | | 8,754 | | | 916 | | | 7,838 | | | Jun-07 | | | 40 years | |
Charleston, IL | | | 5,793 | | | 485 | | | 6,211 | | | — | | | 257 | | | 485 | | | 6,468 | | | 6,953 | | | 773 | | | 6,180 | | | Jan-07 | | | 40 years | |
Chesterfield, IN | | | — | | | 815 | | | 4,204 | | | — | | | — | | | 815 | | | 4,204 | | | 5,019 | | | 477 | | | 4,542 | | | Jun-07 | | | 40 years | |
Cincinnati, OH | | | 11,293 | | | 2,052 | | | 15,776 | | | — | | | 770 | | | 2,052 | | | 16,546 | | | 18,598 | | | 2,204 | | | 16,394 | | | Jan-07 | | | 40 years | |
Clemmons, NC | | | 2,134 | | | 337 | | | 4,541 | | | — | | | 33 | | | 337 | | | 4,574 | | | 4,911 | | | 475 | | | 4,436 | | | Apr-07 | | | 40 years | |
Clinton, OK | | | 1,322 | | | 225 | | | 3,513 | | | — | | | 482 | | | 225 | | | 3,995 | | | 4,220 | | | 593 | | | 3,627 | | | Jan-07 | | | 40 years | |
Columbia City, IN | | | — | | | 1,034 | | | 6,390 | | | — | | | — | | | 1,034 | | | 6,390 | | | 7,424 | | | 725 | | | 6,699 | | | Jun-07 | | | 40 years | |
Daly City, CA | | | 11,126 | | | — | | | — | | | — | | | 12,321 | | | — | | | 12,321 | | | 12,321 | | | 3,762 | | | 8,559 | | | Aug-07 | | | 40 years | |
Daly City, CA | | | 4,746 | | | 3,297 | | | 1,872 | | | — | | | — | | | 3,297 | | | 1,872 | | | 5,169 | | | 193 | | | 4,976 | | | Aug-07 | | | 40 years | |
Dunkirk, IN | | | — | | | 310 | | | 2,299 | | | — | | | — | | | 310 | | | 2,299 | | | 2,609 | | | 261 | | | 2,348 | | | Jun-07 | | | 40 years | |
East Arlington, TX | | | 3,305 | | | 3,619 | | | 901 | | | — | | | — | | | 3,619 | | | 901 | | | 4,520 | | | 101 | | | 4,419 | | | May-07 | | | 40 years | |
Effingham, IL | | | 542 | | | 211 | | | 1,145 | | | — | | | 12 | | | 211 | | | 1,157 | | | 1,368 | | | 145 | | | 1,223 | | | Jan-07 | | | 40 years | |
Effingham, IL | | | 4,558 | | | 340 | | | 4,994 | | | — | | | 49 | | | 340 | | | 5,043 | | | 5,383 | | | 629 | | | 4,754 | | | Jan-07 | | | 40 years | |
Elk City, OK | | | 4,302 | | | 143 | | | 6,721 | | | — | | | 403 | | | 143 | | | 7,124 | | | 7,267 | | | 979 | | | 6,288 | | | Jan-07 | | | 40 years | |
Fairfield, IL | | | 6,344 | | | 153 | | | 7,898 | | | — | | | 29 | | | 153 | | | 7,927 | | | 8,080 | | | 986 | | | 7,094 | | | Jan-07 | | | 40 years | |
Fort Wayne, IN | | | — | | | 1,478 | | | 4,409 | | | — | | | — | | | 1,478 | | | 4,409 | | | 5,887 | | | 501 | | | 5,386 | | | Jun-07 | | | 40 years | |
Fullerton, CA | | | 772 | | | 1,357 | | | 872 | | | — | | | 157 | | | 1,357 | | | 1,029 | | | 2,386 | | | 116 | | | 2,270 | | | Jan-07 | | | 40 years | |
Fullerton, CA | | | 7,506 | | | 4,065 | | | 8,564 | | | — | | | 259 | | | 4,065 | | | 8,823 | | | 12,888 | | | 1,119 | | | 11,769 | | | Jan-07 | | | 40 years | |
175
Table of Contents
NORTHSTAR REALTY FINANCE CORP. AND SUBSIDIARIES
SCHEDULE III—REAL ESTATE AND ACCUMULATED DEPRECIATION (Continued)
As of December 31, 2011
(Amounts in Thousands)
| | | | | | | | | | | | | | | | | | | | | | | | | | | | | | | | | | | | | |
| Column A | | Column B | | Column C
Initial Cost | | Column D
Cost Capitalized
Subsequent
To Acquisition | | Column E
Gross Amount Carried at
Close of Period | | Column F | | Column G | | Column H | |
|---|
Location
City, State | | Encumbrances | | Land | | Buildings &
Improvements | | Land | | Buildings &
Improvements | | Land | | Buildings &
Improvements | | Total | | Accumulated
Depreciation | | Total | | Date Acquired | | Life on Which
Depreciation is
Computed | |
|---|
Garden Grove, CA | | $ | 11,067 | | $ | 6,975 | | $ | 5,927 | | $ | — | | $ | 274 | | $ | 6,975 | | $ | 6,201 | | $ | 13,176 | | $ | 797 | | $ | 12,379 | | | Jan-07 | | | 40 years | |
Grove City, OH | | | 4,393 | | | 613 | | | 6,882 | | | — | | | 208 | | | 613 | | | 7,090 | | | 7,703 | | | 839 | | | 6,864 | | | Jun-07 | | | 40 years | |
Harrisburg, IL | | | 3,645 | | | 191 | | | 5,059 | | | — | | | 10 | | | 191 | | | 5,069 | | | 5,260 | | | 628 | | | 4,632 | | | Jun-07 | | | 40 years | |
Hartford City, IN | | | — | | | 199 | | | 1,782 | | | — | | | — | | | 199 | | | 1,782 | | | 1,981 | | | 202 | | | 1,779 | | | Jun-07 | | | 40 years | |
Hillsboro, OR | | | 32,104 | | | 3,954 | | | 39,233 | | | — | | | — | | | 3,954 | | | 39,233 | | | 43,187 | | | 4,945 | | | 38,242 | | | Dec-06 | | | 40 years | |
Hobart, IN | | | — | | | 1,835 | | | 5,019 | | | — | | | — | | | 1,835 | | | 5,019 | | | 6,854 | | | 570 | | | 6,284 | | | Jun-07 | | | 40 years | |
Huntington, IN | | | — | | | 120 | | | — | | | — | | | — | | | 120 | | | — | | | 120 | | | — | | | 120 | | | Jun-07 | | | 40 years | |
Huntington, IN | | | — | | | 526 | | | 5,037 | | | — | | | — | | | 526 | | | 5,037 | | | 5,563 | | | 572 | | | 4,991 | | | Jun-07 | | | 40 years | |
Indianapolis, IN | | | — | | | 210 | | | 2,511 | | | — | | | — | | | 210 | | | 2,511 | | | 2,721 | | | 285 | | | 2,436 | | | Jun-07 | | | 40 years | |
Kingfisher, OK | | | 3,928 | | | 128 | | | 5,497 | | | — | | | 295 | | | 128 | | | 5,792 | | | 5,920 | | | 782 | | | 5,138 | | | Jan-07 | | | 40 years | |
La Vista, NE | | | 4,228 | | | 562 | | | 4,966 | | | — | | | 415 | | | 562 | | | 5,381 | | | 5,943 | | | 644 | | | 5,299 | | | Jan-07 | | | 40 years | |
LaGrange, IN | | | — | | | 446 | | | 5,494 | | | — | | | — | | | 446 | | | 5,494 | | | 5,940 | | | 624 | | | 5,316 | | | Jun-07 | | | 40 years | |
LaGrange, IN | | | — | | | 47 | | | 584 | | | — | | | — | | | 47 | | | 584 | | | 631 | | | 66 | | | 565 | | | Jun-07 | | | 40 years | |
Lancaster, OH | | | 6,694 | | | 294 | | | 6,094 | | | — | | | 329 | | | 294 | | | 6,423 | | | 6,717 | | | 790 | | | 5,927 | | | Jun-07 | | | 40 years | |
Mansfield, OH | | | — | | | 42 | | | 747 | | | — | | | — | | | 42 | | | 747 | | | 789 | | | 74 | | | 715 | | | Jan-08 | | | 40 years | |
Mansfield, OH | | | — | | | 58 | | | 1,027 | | | — | | | — | | | 58 | | | 1,027 | | | 1,085 | | | 103 | | | 982 | | | Jan-08 | | | 40 years | |
Mansfield, OH | | | — | | | 73 | | | 249 | | | — | | | — | | | 73 | | | 249 | | | 322 | | | 25 | | | 297 | | | Jan-08 | | | 40 years | |
Marysville, OH | | | 5,021 | | | 2,218 | | | 5,015 | | | — | | | 368 | | | 2,218 | | | 5,383 | | | 7,601 | | | 658 | | | 6,943 | | | Jun-07 | | | 40 years | |
Mattoon, IL | | | 5,610 | | | 210 | | | 6,871 | | | — | | | 18 | | | 210 | | | 6,889 | | | 7,099 | | | 855 | | | 6,244 | | | Jan-07 | | | 40 years | |
Mattoon, IL | | | 6,859 | | | 227 | | | 7,534 | | | — | | | 25 | | | 227 | | | 7,559 | | | 7,786 | | | 939 | | | 6,847 | | | Jan-07 | | | 40 years | |
Memphis, TN | | | 14,463 | | | 4,770 | | | 14,305 | | | — | | | 585 | | | 4,770 | | | 14,890 | | | 19,660 | | | 1,921 | | | 17,739 | | | Jan-07 | | | 40 years | |
Middletown, IN | | | — | | | 52 | | | — | | | — | | | — | | | 52 | | | — | | | 52 | | | — | | | 52 | | | Jun-07 | | | 40 years | |
176
Table of Contents
NORTHSTAR REALTY FINANCE CORP. AND SUBSIDIARIES
SCHEDULE III—REAL ESTATE AND ACCUMULATED DEPRECIATION (Continued)
As of December 31, 2011
(Amounts in Thousands)
| | | | | | | | | | | | | | | | | | | | | | | | | | | | | | | | | | | | | |
| Column A | | Column B | | Column C
Initial Cost | | Column D
Cost Capitalized
Subsequent
To Acquisition | | Column E
Gross Amount Carried at
Close of Period | | Column F | | Column G | | Column H | |
|---|
Location
City, State | | Encumbrances | | Land | | Buildings &
Improvements | | Land | | Buildings &
Improvements | | Land | | Buildings &
Improvements | | Total | | Accumulated
Depreciation | | Total | | Date Acquired | | Life on Which
Depreciation is
Computed | |
|---|
Middletown, IN | | $ | — | | $ | 132 | | $ | 4,750 | | $ | — | | $ | — | | $ | 132 | | $ | 4,750 | | $ | 4,882 | | $ | 539 | | $ | 4,343 | | | Jun-07 | | | 40 years | |
Mooresville, IN | | | — | | | 631 | | | 4,187 | | | — | | | — | | | 631 | | | 4,187 | | | 4,818 | | | 475 | | | 4,343 | | | Jun-07 | | | 40 years | |
Morris, IL | | | 2,139 | | | 568 | | | 9,103 | | | — | | | 790 | | | 568 | | | 9,893 | | | 10,461 | | | 1,361 | | | 9,100 | | | May-06 | | | 40 years | |
Mt. Sterling, KY | | | 11,087 | | | 599 | | | 12,561 | | | — | | | 25 | | | 599 | | | 12,586 | | | 13,185 | | | 1,432 | | | 11,753 | | | Feb-07 | | | 40 years | |
Oklahoma City, OK | | | 4,376 | | | 757 | | | 5,184 | | | 3 | | | 352 | | | 760 | | | 5,536 | | | 6,296 | | | 766 | | | 5,530 | | | Jan-07 | | | 40 years | |
Olney, IL | | | 2,426 | | | 57 | | | 2,897 | | | — | | | 32 | | | 57 | | | 2,929 | | | 2,986 | | | 364 | | | 2,622 | | | Jan-07 | | | 40 years | |
Olney, IL | | | 4,189 | | | 109 | | | 5,419 | | | — | | | 74 | | | 109 | | | 5,493 | | | 5,602 | | | 687 | | | 4,915 | | | Jan-07 | | | 40 years | |
Paris, IL | | | 6,755 | | | 187 | | | 6,797 | | | — | | | 27 | | | 187 | | | 6,824 | | | 7,011 | | | 847 | | | 6,164 | | | Jan-07 | | | 40 years | |
Peru, IN | | | — | | | 502 | | | 7,135 | | | — | | | — | | | 502 | | | 7,135 | | | 7,637 | | | 810 | | | 6,827 | | | Jun-07 | | | 40 years | |
Peshtigo, WI | | | — | | | 244 | | | 1,359 | | | — | | | — | | | 244 | | | 1,359 | | | 1,603 | | | 134 | | | 1,469 | | | Jan-08 | | | 40 years | |
Plymouth, IN | | | — | | | 128 | | | 5,538 | | | — | | | — | | | 128 | | | 5,538 | | | 5,666 | | | 629 | | | 5,037 | | | Jun-07 | | | 40 years | |
Portage, IN | | | — | | | 1,438 | | | 7,988 | | | — | | | — | | | 1,438 | | | 7,988 | | | 9,426 | | | 907 | | | 8,519 | | | Jun-07 | | | 40 years | |
Rantoul, IL | | | 5,570 | | | 151 | | | 5,377 | | | — | | | 59 | | | 151 | | | 5,436 | | | 5,587 | | | 669 | | | 4,918 | | | Jan-07 | | | 40 years | |
Robinson, IL | | | 3,954 | | | 219 | | | 4,746 | | | — | | | 92 | | | 219 | | | 4,838 | | | 5,057 | | | 614 | | | 4,443 | | | Jan-07 | | | 40 years | |
Rockford, IL | | | 4,895 | | | 1,101 | | | 4,814 | | | — | | | 43 | | | 1,101 | | | 4,857 | | | 5,958 | | | 606 | | | 5,352 | | | Jan-07 | | | 40 years | |
Rockport, IN | | | — | | | 366 | | | — | | | — | | | — | | | 366 | | | — | | | 366 | | | — | | | 366 | | | Jun-07 | | | NA | |
Rockport, IN | | | — | | | 253 | | | 2,092 | | | — | | | — | | | 253 | | | 2,092 | | | 2,345 | | | 237 | | | 2,108 | | | Jun-07 | | | 40 years | |
Rushville, IN | | | — | | | 310 | | | 5,858 | | | — | | | — | | | 310 | | | 5,858 | | | 6,168 | | | 665 | | | 5,503 | | | Jun-07 | | | 40 years | |
Rushville, IN | | | — | | | 62 | | | 1,177 | | | — | | | — | | | 62 | | | 1,177 | | | 1,239 | | | 133 | | | 1,106 | | | Jun-07 | | | 40 years | |
Santa Ana, CA | | | 7,802 | | | 2,281 | | | 7,046 | | | — | | | 237 | | | 2,281 | | | 7,283 | | | 9,564 | | | 931 | | | 8,633 | | | Jan-07 | | | 40 years | |
Stephenville, TX | | | 6,094 | | | 507 | | | 6,459 | | | 13 | | | 391 | | | 520 | | | 6,850 | | | 7,370 | | | 829 | | | 6,541 | | | Jan-07 | | | 40 years | |
177
Table of Contents
NORTHSTAR REALTY FINANCE CORP. AND SUBSIDIARIES
SCHEDULE III—REAL ESTATE AND ACCUMULATED DEPRECIATION (Continued)
As of December 31, 2011
(Amounts in Thousands)
| | | | | | | | | | | | | | | | | | | | | | | | | | | | | | | | | | | | | |
| Column A | | Column B | | Column C
Initial Cost | | Column D
Cost Capitalized
Subsequent
To Acquisition | | Column E
Gross Amount Carried at
Close of Period | | Column F | | Column G | | Column H | |
|---|
Location
City, State | | Encumbrances | | Land | | Buildings &
Improvements | | Land | | Buildings &
Improvements | | Land | | Buildings &
Improvements | | Total | | Accumulated
Depreciation | | Total | | Date Acquired | | Life on Which
Depreciation is
Computed | |
|---|
Sterling, IL | | $ | 2,322 | | $ | 129 | | $ | 6,229 | | $ | — | | $ | 550 | | $ | 129 | | $ | 6,779 | | $ | 6,908 | | $ | 1,014 | | $ | 5,894 | | | May-06 | | | 40 years | |
Sullivan, IN | | | — | | | 1,794 | | | 4,469 | | | — | | | — | | | 1,794 | | | 4,469 | | | 6,263 | | | 507 | | | 5,756 | | | Jun-07 | | | 40 years | |
Sullivan, IN | | | — | | | 102 | | | 441 | | | — | | | — | | | 102 | | | 441 | | | 543 | | | 50 | | | 493 | | | Jun-07 | | | 40 years | |
Sullivan, IN | | | — | | | 494 | | | — | | | — | | | — | | | 494 | | | — | | | 494 | | | — | | | 494 | | | Jun-07 | | | NA | |
Sycamore, IL | | | 8,410 | | | 816 | | | 9,897 | | | — | | | 72 | | | 816 | | | 9,969 | | | 10,785 | | | 1,243 | | | 9,542 | | | Jan-07 | | | 40 years | |
Syracuse, IN | | | — | | | 125 | | | 4,564 | | | — | | | — | | | 125 | | | 4,564 | | | 4,689 | | | 518 | | | 4,171 | | | Jun-07 | | | 40 years | |
Tipton, IN | | | — | | | 1,102 | | | 10,836 | | | — | | | (27 | ) | | 1,102 | | | 10,809 | | | 11,911 | | | 1,049 | | | 10,862 | | | Jun-07 | | | 40 years | |
Tuscola, IL | | | 4,135 | | | 237 | | | 4,616 | | | — | | | 123 | | | 237 | | | 4,739 | | | 4,976 | | | 631 | | | 4,345 | | | Jan-07 | | | 40 years | |
Vandalia, IL | | | 7,262 | | | 82 | | | 7,969 | | | — | | | 8 | | | 82 | | | 7,977 | | | 8,059 | | | 989 | | | 7,070 | | | Jan-07 | | | 40 years | |
Wabash, IN | | | — | | | 1,060 | | | 870 | | | — | | | — | | | 1,060 | | | 870 | | | 1,930 | | | 99 | | | 1,831 | | | Jun-07 | | | 40 years | |
Wabash, IN | | | — | | | 1,451 | | | 4,154 | | | — | | | — | | | 1,451 | | | 4,154 | | | 5,605 | | | 471 | | | 5,134 | | | Jun-07 | | | 40 years | |
Wakarusa, IN | | | — | | | 289 | | | 13,420 | | | — | | | — | | | 289 | | | 13,420 | | | 13,709 | | | 1,523 | | | 12,186 | | | Jun-07 | | | 40 years | |
Wakarusa, IN | | | — | | | 153 | | | 7,111 | | | — | | | — | | | 153 | | | 7,111 | | | 7,264 | | | 807 | | | 6,457 | | | Jun-07 | | | 40 years | |
Warsaw, IN | | | — | | | 77 | | | — | | | — | | | — | | | 77 | | | — | | | 77 | | | — | | | 77 | | | Jun-07 | | | NA | |
Warsaw, IN | | | — | | | 319 | | | 3,722 | | | — | | | — | | | 319 | | | 3,722 | | | 4,041 | | | 422 | | | 3,619 | | | Jun-07 | | | 40 years | |
Washington Court House, OH | | | 4,812 | | | 341 | | | 5,169 | | | 13 | | | 233 | | | 354 | | | 5,402 | | | 5,756 | | | 651 | | | 5,105 | | | Jun-07 | | | 40 years | |
Weatherford, OK | | | 4,443 | | | 229 | | | 5,600 | | | — | | | 376 | | | 229 | | | 5,976 | | | 6,205 | | | 823 | | | 5,382 | | | Jan-07 | | | 40 years | |
Wichita, KS | | | 7,766 | | | 2,282 | | | 10,478 | | | — | | | 20 | | | 2,282 | | | 10,498 | | | 12,780 | | | 1,056 | | | 11,724 | | | Dec-07 | | | 40 years | |
Windsor, NC | | | — | | | 397 | | | — | | | — | | | — | | | 397 | | | — | | | 397 | | | — | | | 397 | | | Feb-07 | | | NA | |
| | | | | | | | | | | | | | | | | | | | | | | | | | | | |
Total Healthcare | | | 279,387 | | | 69,055 | | | 451,498 | | | 29 | | | 21,693 | | | 69,084 | | | 473,191 | | | 542,275 | | | 59,906 | | | 482,369 | | | | | | | |
REO | | | | | | | | | | | | | | | | | | | | | | | | | | | | | | | | | | | | | |
Austin, TX | | | 16,525 | | | 4,507 | | | 18,028 | | | — | | | — | | | 4,507 | | | 18,028 | | | 22,535 | | | — | | | 22,535 | | | Dec-11 | | | 40 years | |
Buckhead, GA | | | — | | | 24,332 | | | — | | | — | | | — | | | 24,332 | | | — | | | 24,332 | | | — | | | 24,332 | | | Dec-11 | | | N/A | |
San Antonio, TX | | | — | | | 1,368 | | | 9,152 | | | — | | | — | | | 1,368 | | | 9,152 | | | 10,520 | | | — | | | 10,520 | | | Dec-11 | | | 40 years | |
Indianapolis, IN | | | — | | | 8,990 | | | 42,910 | | | 162 | | | 549 | | | 9,152 | | | 43,459 | | | 52,611 | | | 2,133 | | | 50,478 | | | Mar-11 | | | 40 years | |
San Antonio, TX | | | — | | | 1,011 | | | 6,769 | | | — | | | — | | | 1,011 | | | 6,769 | | | 7,780 | | | — | | | 7,780 | | | Dec-11 | | | 40 years | |
Philadelphia, PA | | | — | | | 1,031 | | | 4,122 | | | — | | | — | | | 1,031 | | | 4,122 | | | 5,153 | | | — | | | 5,153 | | | Dec-11 | | | 40 years | |
Phoenix, AZ | | | 212,000 | | | 47,253 | | | 148,913 | | | 59 | | | 530 | | | 47,312 | | | 149,443 | | | 196,755 | | | 4,326 | | | 192,429 | | | Apr-11 | | | 40 years | |
| | | | | | | | | | | | | | | | | | | | | | | | | | | | |
Total REO | | | 228,525 | | | 88,492 | | | 229,894 | | | 221 | | | 1,079 | | | 88,713 | | | 230,973 | | | 319,686 | | | 6,459 | | | 313,227 | | | | | | | |
| | | | | | | | | | | | | | | | | | | | | | | | | | | | |
Grand Total | | $ | 783,257 | | $ | 214,800 | | $ | 968,470 | | $ | 273 | | $ | 23,976 | | $ | 215,073 | | $ | 992,446 | | $ | 1,207,519 | | $ | 118,070 | | $ | 1,089,449 | | | | | | | |
| | | | | | | | | | | | | | | | | | | | | | | | | | | | |
178
Table of Contents
NORTHSTAR REALTY FINANCE CORP. AND SUBSIDIARIES
SCHEDULE III—REAL ESTATE AND ACCUMULATED DEPRECIATION (Continued)
As of December 31, 2011
(Amounts in Thousands)
Changes in our operating real estate portfolio for the years ended December 31, 2011, 2010 and 2009 are as follows (amounts in thousands):
| | | | | | | | | | |
| | 2011 | | 2010 | | 2009 | |
|---|
Beginning balance | | $ | 1,046,492 | | $ | 1,062,915 | | $ | 1,194,469 | |
Property acquisitions | | | 320,687 | | | 13,602 | | | — | |
Transfers to held for sale | | | (2,302 | ) | | (13,480 | ) | | — | |
Improvements | | | 4,028 | | | 1,498 | | | 3,597 | |
Impairment | | | — | | | (5,249 | ) | | — | |
Retirements and disposals(1) | | | (161,386 | ) | | (12,794 | ) | | (135,151 | ) |
| | | | | | | | |
Ending balance | | $ | 1,207,519 | | $ | 1,046,492 | | $ | 1,062,915 | |
| | | | | | | | |
- (1)
- Includes $59.8 million and $55.3 million of write-offs related to foreclosures in 2011 and 2009, respectively. There were no such write-offs in 2010.
Changes in accumulated depreciation, exclusive of amounts relating to equipment and furniture and fixtures, for the years ended December 31, 2011, 2010 and 2009 are as follows (amounts in thousands):
| | | | | | | | | | |
| | 2011 | | 2010 | | 2009 | |
|---|
Beginning balance | | $ | 108,430 | | $ | 84,013 | | $ | 67,469 | |
Depreciation expense | | | 29,734 | | | 26,108 | | | 28,285 | |
Assets held for sale | | | — | | | — | | | — | |
Retirements and disposals(1) | | | (20,094 | ) | | (1,691 | ) | | (11,741 | ) |
| | | | | | | | |
Ending balance | | $ | 118,070 | | $ | 108,430 | | $ | 84,013 | |
| | | | | | | | |
- (1)
- Includes $9.8 million and $8.9 million in write-offs related to foreclosures in 2011 and 2009, respectively. There were no such write-offs in 2010.
179
Table of Contents
NORTHSTAR REALTY FINANCE CORP. AND SUBSIDIARIES
SCHEDULE IV—MORTGAGE LOANS ON REAL ESTATE
December 31, 2011
(Amounts in Thousands)
| | | | | | | | | | | | | | | | | | | | | | | | | | | | | |
| |
| |
| |
| |
| |
| |
| |
| |
| |
| |
| | Principal Amount
of Loans Subject
to Delinquent
Principal or
Interest | |
|---|
| |
| |
| |
| | Interest Rate | |
| |
| |
| |
| |
| |
|---|
| |
| |
| |
| | Maturity
Date(1) | | Periodic
Payment
Terms(2) | | Prior
Liens(3) | | Principal
Amount(4) | | Carrying
Value | |
|---|
Asset Type: | | Description | | Location | | Number | | Floating | | Fixed | |
|---|
First mortgage loans | | | | | | | | | | | | | | | | | | | | | | | | | | | | | |
First mortgage A(6) | | Multifamily | | Atlanta, GA | | | 1 | | L+1.60% | | N/A | | | 1/1/2016 | | P&I | | $ | — | | $ | 51,954 | | $ | — | | $ | — | |
First mortgage B(6) | | Condo | | New York, NY | | | 1 | | L+3.50% | | N/A | | | 1/8/2017 | | P&I | | | — | | | 53,445 | | | — | | | — | |
Other first mortgage loans(5) | | Various | | Various(7) | | | 73 | | L+0.50% to
9.25% | | 2.00% to
8.08% | | | 1/3/12-
5/1/23 | | P&I | | | — | | | 1,446,667 | | | 1,094,957 | | | 13,382 | |
| | | | | | | | | | | | | | | | | | | | | | | | | |
Subtotal first mortgage loans | | | | | | | 75 | | | | | | | | | | | | — | | | 1,552,066 | | | 1,094,957 | | | 13,382 | |
Subordinate mortgage interests(5) | | Various | | Various(7) | | | 9 | | L+1.00% to
6.50% | | 2.00% to
7.85% | | | 1/3/12 to
2/1/18 | | P&I | | | 727,086 | | | 159,289 | | | 96,565 | | | 38,462 | |
Mezzanine loans | | | | | | | | | | | | | | | | | | | | | | | | | | | | | |
Mezz loan A(6) | | Office | | Chicago, IL | | | 1 | | N/A | | 10.85% | | | 6/15/2016 | | P&I | | | 410,000 | | | 63,572 | | | 57,259 | | | — | |
Mezz loan B(6) | | Retail | | Various, Germany | | | 1 | | L+0.50% | | N/A | | | 7/20/2014 | | P&I | | | 2,225,152 | | | 56,148 | | | 56,148 | | | — | |
Other mezzanine loans(5) | | Various | | Various(7) | | | 15 | | L+2.00% to
4.50% | | 7.16% to
15.00% | | | 2/9/12 to
3/1/26 | | P&I | | | 3,336,838 | | | 306,989 | | | 220,910 | | | — | |
| | | | | | | | | | | | | | | | | | | | | | | | | |
Subtotal Mezzanine loans | | | | | | | 17 | | | | | | | | | | | | 5,971,990 | | | 426,709 | | | 334,317 | | | — | |
Credit tenant loans(5) | | Various | | Various(7) | | | 55 | | N/A | | 5.26% to
8.26% | | | 1/10/12 to
5/15/30 | | P&I | | | | | | 147,426 | | | 140,342 | | | | |
Term loans(5) | | Various | | Various(7) | | | 6 | | L+3.50% | | 6.65% to
8.91% | | | 5/1/15 to
12/5/19 | | P&I | | | 730,886 | | | 69,442 | | | 44,401 | | | — | |
| | | | | | | | | | | | | | | | | | | | | | | | | |
Total | | | | | | | 162 | | | | | | | | | | | $ | 7,429,962 | | $ | 2,354,932 | | $ | 1,710,582 | | $ | 51,844 | |
| | | | | | | | | | | | | | | | | | | | | | | | | |
- (1)
- Represents initial maturity and reflects modifications executed subsequent to December 31, 2011.
- (2)
- Principal and interest, or P&I; principal amount due in full at maturity.
- (3)
- Represents only third-party liens.
- (4)
- The principal amount of CRE debt that is delinquent with respect to principal or interest is $51.8 million related to four loans, which includes one loan with a principal amount of $0.9 million that is defaulted with respect to interest payments only.
- (5)
- Individual loans each have a carrying value less than 3% of total carrying value of the real estate debt portfolio.
- (6)
- Individual loans each have a carrying value greater than 3% of total carrying value of the real estate debt portfolio.
- (7)
- Description of property types include condo, healthcare, hotel, industrial, land, mixed-use, multifamily, office, retail timeshare and other.
180
Table of Contents
NORTHSTAR REALTY FINANCE CORP. AND SUBSIDIARIES
SCHEDULE IV—MORTGAGE LOANS ON REAL ESTATE (Continued)
December 31, 2011
(Amounts in Thousands)
Reconciliation of Carrying Value of Real Estate Debt:
| | | | | | | | | | |
| | 2011 | | 2010 | | 2009 | |
|---|
Beginning balance | | $ | 1,840,425 | | $ | 1,931,738 | | $ | 2,041,279 | |
Additions: | | | | | | | | | | |
Principal amount of new loans and additional funding on existing loans | | | 299,405 | | | 865,759 | | | 223,383 | |
Consolidation of CDOs(1) | | | 138,168 | | | 493,875 | | | — | |
Interest accretion | | | 7,682 | | | 718 | | | 1,078 | |
Acquisition cost (fees) on new loans | | | (5,068 | ) | | (2,639 | ) | | (939 | ) |
Premium (discount) on new loans | | | (50,857 | ) | | (739,912 | ) | | — | |
Amortization of acquisition costs, fees, premiums and discounts | | | 88,545 | | | 41,495 | | | 6,637 | |
Deductions: | | | | | | | | | | |
Collection of principal | | | 428,055 | | | 502,618 | | | 253,286 | |
Joint venture acquisition | | | — | | | — | | | 2,669 | |
Loan loss | | | 52,980 | | | 168,446 | | | 83,745 | |
Foreclosure | | | 126,683 | | | 79,545 | | | — | |
| | | | | | | | |
Ending balance(2) | | $ | 1,710,582 | | $ | 1,840,425 | | $ | 1,931,738 | |
| | | | | | | | |
- (1)
- Represents the consolidation of the CapLease CDO in 2011 and CSE CDO and N-Star CDO IX in 2010.
- (2)
- There are no loans held for sale as of December 31, 2011. As of December 31, 2010 and 2009, there were $18.7 million and $0.6 million of loans held for sale, respectively.
181
Table of Contents
Item 9. Changes in and Disagreements with Accountants on Accounting and Financial Disclosure
None.
Item 9A. Controls and Procedures
Attached as exhibits to this Form 10-K are certifications of the Company's Chief Executive Officer and Chief Financial Officer, which are required in accordance with Rule 13a-14 of the Securities Exchange Act of 1934, as amended (the "Exchange Act"). This "Controls and Procedures" section includes information concerning the controls and procedures evaluation referred to in the certifications. Part II, Item 8. of this Form 10-K sets forth the report of Grant Thornton LLP, our independent registered public accounting firm, regarding its audit of the Company's internal control over financial reporting set forth below in this section. This section should be read in conjunction with the certifications and the Grant Thornton LLP report for a more complete understanding of the topics presented.
Disclosure Controls and Procedures
The management of the Company established and maintains disclosure controls and procedures that are designed to ensure that material information relating to the Company and its subsidiaries required to be disclosed in the reports that are filed or submitted under the 1934 Act are recorded, processed, summarized, and reported within the time periods specified in the SEC's rules and forms, and that such information is accumulated and communicated to management, including our Chief Executive Officer and Chief Financial Officer, as appropriate to allow timely decisions regarding required disclosures.
As of the end of the period covered by this report, the Company's management conducted an evaluation, under the supervision and with the participation of the Company's Chief Executive Officer and Chief Financial Officer, of the Company's disclosure controls and procedures (as defined in Rules 13a-15(e) and 15d-15(e) under the Exchange Act). Based on this evaluation, the Company's Chief Executive Officer and Chief Financial Officer concluded that, as of the end of the period covered by this report, the Company's disclosure controls and procedures are effective. Notwithstanding the foregoing, a control system, no matter how well designed and operated, can provide only reasonable, not absolute, assurance that it will detect or uncover failures within the Company to disclose material information otherwise required to be set forth in the Company's periodic reports.
Internal Control over Financial Reporting
(a) Management's annual report on internal control over financial reporting.
Management is responsible for establishing and maintaining adequate internal control over financial reporting. As defined in Exchange Act Rule 13a-15(f), internal control over financial reporting is a process designed by, or under the supervision of, the principal executive and principal financial officer and effected by the board of directors, management and other personnel, to provide reasonable assurance regarding the reliability of financial reporting and the preparation of financial statements for external purposes in accordance with generally accepted accounting principles and includes those policies and procedures that: (i) pertain to the maintenance of records that in reasonable detail accurately and fairly reflect the transactions and dispositions of the assets of the Company; (ii) provide reasonable assurance that transactions are recorded as necessary to permit preparation of financial statements in accordance with generally accepted accounting principles, and that receipts and expenditures of the Company are being made only in accordance with authorizations of management and directors of the Company; and (iii) provide reasonable assurance regarding prevention or timely detection of unauthorized acquisition, use or disposition of the Company's assets that could have a material effect on the financial statements.
182
Table of Contents
Under the supervision and with the participation of management, including the Chief Executive Officer and Chief Financial Officer, the Company carried out an evaluation of the effectiveness of its internal control over financial reporting as of December 31, 2011 based on the "Internal Control—Integrated Framework" issued by the Committee of Sponsoring Organizations of the Treadway Commission (COSO). Based upon this evaluation, management has concluded that the Company's internal control over financial reporting was effective as of December 31, 2011.
(b) Attestation report of the registered public accounting firm.
Our independent registered public accounting firm, Grant Thornton LLP, independently assessed the effectiveness of the Company's internal control over financial reporting as of December 31, 2011. Grant Thornton has issued an attestation report, which is included in Part II, Item 8. of this Form 10-K.
(c) Changes in internal control over financial reporting.
There have been no changes in the Company's internal control over financial reporting during the most recent quarter ended December 31, 2011 that have materially affected, or are reasonably likely to affect, internal controls over financial reporting.
Inherent Limitations on Effectiveness of Controls
The Company's management, including the Chief Executive Officer and Chief Financial Officer, does not expect that our disclosure controls and procedures or our internal control over financial reporting will prevent or detect all error and all fraud. A control system, no matter how well designed and operated, can provide only reasonable, not absolute, assurance that the control system's objectives will be met. The design of a control system must reflect the fact that there are resource constraints, and the benefits of controls must be considered relative to their costs.
Item 9B. Other Information
None.
183
Table of Contents
PART III
Item 10. Directors and Executive Officers and Corporate Governance*
Certain information relating to our code of business conduct and ethics and code of ethics for senior financial officers (as defined in the code) is included in Part I, Item 1. of this Annual Report on Form 10-K.
Item 11. Executive Compensation*
Item 12. Security Ownership of Certain Beneficial Owners and Management and Related Stockholder Matters*
Equity Compensation Plan Information
The following table summarizes information, as of December 31, 2011, relating to our equity compensation plans pursuant to which grants of securities may be made from time-to-time. Refer to "Note 11. Equity-Based Compensation" of Item 8. "Financial Statements and Supplementary Data" for additional information surrounding our equity compensation plans.
| | | | | | | | | |
Plan Category | | Number of Securities
to Be Issued
Upon Exercise of
Outstanding Options,
Warrants and Rights(1) | | Weighted-Average
Exercise Price of
Outstanding Options,
Warrants and Rights | | Number of Securities
Available for
Future Issuance | |
|---|
Approved by Security Holders: | | | | | | | | | |
2004 Omnibus Stock Incentive Plan | | | 4,091,004 | | NA | | | — | |
2004 Long-Term Incentive Plan | | | 116,831 | | NA | | | — | |
| | | | | | | | |
Total | | | 4,207,835 | | | | | — | |
| | | | | | | | |
- (1)
- Represents units of partnership interest which are structured as profits interest, or LTIP Units, in our operating partnership. Conditioned on minimum allocation to the capital accounts of the LTIP Unit for federal income tax purposes, each LTIP Unit may be converted, at the election of the holder, into one common unit of limited partnership interest in our operating partnership, or OP Units. Each of the OP Units underlying these LTIP Units are redeemable at the election of the OP Unit holder, at our option in its capacity as general partner of our operating partnership, for: (i) cash equal to the then fair value of one share of our common stock; or (ii) one share of our common stock.
Item 13. Certain Relationships and Related Transactions and Directors Independence*
Item 14. Principal Accountant Fees and Services*
- *
- The information that is required by Items 10, 11, 12, 13 and 14 (other than the information included in this Annual Report on Form 10-K) is incorporated herein by reference from the definitive proxy statement relating to the 2012 Annual Meeting of Stockholders of the Company, which is to be filed with the Securities and Exchange Commission pursuant to Regulation 14A under the Securities Exchange Act of 1934, as amended, no later than 120 days after the end of the Company's fiscal year ending December 31, 2011.
184
Table of Contents
PART IV
Item 15. Exhibits and Financial Statement Schedules
(a)1. Consolidated Financial statements and (a)2. Financial Statement Schedules are included in Part II, Item 8. "Financial Statements and Supplementary Data" of this report:
| | |
Reports of Independent Registered Public Accounting Firm | | 104 |
Consolidated Balance Sheets as of December 31, 2011 and 2010 | | 106 |
Consolidated Statements of Operations for the years ended December 31, 2011, 2010 and 2009 | | 107 |
Consolidated Statements of Comprehensive Income (Loss) for the years ended December 31, 2011, 2010 and 2009 | | 108 |
Consolidated Statements of Equity for the years ended December 31, 2011, 2010 and 2009 | | 109 |
Consolidated Statements of Cash Flows for the years ended December 31, 2011, 2010 and 2009 | | 110 |
Notes to the Consolidated Financial Statements | | 112 |
Schedule II—Valuation and Qualifying Accounts and Reserves | | 173 |
Schedule III—Real Estate and Accumulated Depreciation as of December 31, 2011 | | 174 |
Schedule IV—Mortgage Loans on Real Estate as of December 31, 2011 | | 180 |
(a)3. Exhibit Index:
| | | |
Exhibit
Number | | Description of Exhibit |
|---|
| | 3.1 | | Articles of Amendment and Restatement of NorthStar Realty Finance Corp., as filed with the State Department of Assessments and Taxation of Maryland on October 20, 2004 (incorporated by reference to Exhibit 3.1 to the NorthStar Realty Finance Corp. Registration Statement on Form S-11 (File No. 333-114675)) |
|
3.2 |
|
Amended and Restated Bylaws of NorthStar Realty Finance Corp. (incorporated by reference to Exhibit 3.2 to NorthStar Realty Finance Corp.'s Quarterly Report on Form 10-Q for the quarter ended June 30, 2011) |
|
3.3 |
|
Articles Supplementary Classifying NorthStar Realty Finance Corp.'s 8.75% Series A Preferred Stock, liquidation preference $25.00 per share (incorporated by reference to Exhibit 3.2 to NorthStar Realty Finance Corp.'s Registration Statement on Form 8-A, dated September 14, 2006) |
|
3.4 |
|
Articles Supplementary Classifying NorthStar Realty Finance Corp.'s 8.25% Series B Preferred Stock, liquidation preference $25.00 per share (incorporated by reference to Exhibit 3.2 to NorthStar Realty Finance Corp.'s Registration Statement on Form 8-A, dated February 7, 2007) |
|
3.5 |
|
Articles Supplementary Classifying and Designating Additional Shares of NorthStar Realty Finance Corp.'s 8.25% Series B Preferred Stock, liquidation preference $25.00 per share (incorporated by reference to Exhibit 3.6 to NorthStar Realty Finance Corp.'s Quarterly Report on Form 10-Q for the quarter ended June 30, 2007) |
|
4.1 |
|
Registration Rights Agreement relating to the 7.25% Exchangeable Senior Notes due 2027 of NorthStar Realty Finance Limited Partnership, dated June 18, 2007 (incorporated by reference to Exhibit 4.2 to the NorthStar Realty Finance Corp. Registration Statement on Form S-3 (File No. 333-146679)) |
|
4.2 |
|
Indenture dated as of June 18, 2007, among NorthStar Realty Finance Limited Partnership, as Issuer, NorthStar Realty Finance Corp., as Guarantor, and Wilmington Trust Company, as Trustee (incorporated by reference to Exhibit 4.1 to the NorthStar Realty Finance Corp. Current Report on Form 8-K filed on June 22, 2007) |
185
Table of Contents
| | | |
Exhibit
Number | | Description of Exhibit |
|---|
| | 4.3 | | Registration Rights Agreement relating to the 11.50% Exchangeable Senior Notes due 2013 of NRFC NNN Holdings, LLC, dated May 28, 2008 (incorporated by reference to Exhibit 4.2 to the NorthStar Realty Finance Corp. Registration Statement on Form S-3 (File No. 333-152545)) |
|
4.4 |
|
Indenture dated as of May 28, 2008, among NRFC NNN Holdings, LLC, as Issuer, NorthStar Realty Finance Corp., NorthStar Realty Finance Limited Partnership, and NRFC Sub-REIT Corp., as Guarantors, and Wilmington Trust Company, as Trustee (incorporated by reference to Exhibit 4.1 to the NorthStar Realty Finance Corp. Current Report on Form 8-K filed on May 28, 2008) |
|
4.5 |
|
Registration Rights Agreement relating to the 7.50% Exchangeable Senior Notes due 2031 of NorthStar Realty Finance Limited Partnership dated as of March 9, 2011, (incorporated by reference to Exhibit 4.4 to the NorthStar Realty Finance Corp. Current Report on Form 8-K filed March 9, 2011) |
|
4.6 |
|
Indenture dated as of March 9, 2011, among NorthStar Realty Finance Limited Partnership, as Issuer, NorthStar Realty Finance Corp. and NRFC Sub-REIT Corp., as Guarantors, and Wilmington Trust FSB, as Trustee (incorporated by reference to Exhibit 4.1 to the NorthStar Realty Finance Corp. Current Report on Form 8-K filed March 9, 2011) |
|
10.1 |
|
Agreement of Limited Partnership of NorthStar Realty Finance Limited Partnership, dated as of October 19, 2004, by and among NorthStar Realty Finance Corp., as sole general partner and initial limited partner and the other limited partners a party thereto from time-to-time (incorporated by reference to Exhibit 10.1 to the NorthStar Realty Finance Corp. Quarterly Report on Form 10-Q for the quarter ended September 30, 2004) |
|
10.2 |
|
NorthStar Realty Finance Corp. 2004 Omnibus Stock Incentive Plan (incorporated by reference to Exhibit 10.9 to the NorthStar Realty Finance Corp. Quarterly Report on Form 10-Q for the quarter ended September 30, 2004) |
|
10.3 |
|
NorthStar Realty Finance Corp. 2004 Long-Term Incentive Bonus Plan (incorporated by reference to Exhibit 10.13 to the NorthStar Realty Finance Corp. Quarterly Report on Form 10-Q for the quarter ended September 30, 2004) |
|
10.4 |
|
Amendment No. 1 to Agreement of Limited Partnership of NorthStar Realty Finance Limited Partnership, dated as of March 14, 2006, by and among NorthStar Realty Finance Corp., as sole general partner and initial limited partner and the other limited partners a party thereto from time-to-time (incorporated by reference to Exhibit 10.34 to NorthStar Realty Finance Corp.'s Annual Report on Form 10-K for the year ended December 31, 2005) |
|
10.5 |
|
Second Amendment to the Agreement of Limited Partnership of NorthStar Realty Finance Limited Partnership, dated as of September 14, 2006 (incorporated by reference to Exhibit 3.2 to the NorthStar Realty Finance Corp. Current Report on Form 8-K filed September 14, 2006) |
|
10.6 |
|
Third Amendment to the Agreement of Limited Partnership of NorthStar Realty Finance Limited Partnership, dated as of February 7, 2007 (incorporated by reference to Exhibit 3.2 to the NorthStar Realty Finance Corp. Current Report on Form 8-K filed February 9, 2007) |
|
10.7 |
+ |
Amendment No. 1 to NorthStar Realty Finance Corp. 2004 Omnibus Stock Incentive Plan (incorporated by reference to Exhibit 99.2 to the NorthStar Realty Finance Corp. Post-Effective Amendment No. 2 to Form S-8 filed on April 13, 2007) |
186
Table of Contents
| | | |
Exhibit
Number | | Description of Exhibit |
|---|
| | 10.8 | + | Amendment No. 2 to NorthStar Realty Finance Corp. 2004 Omnibus Stock Incentive Plan (incorporated by reference to Exhibit 99.3 to the NorthStar Realty Finance Corp. Post-Effective Amendment No. 3 to Form S-8 filed on June 6, 2007) |
|
10.9 |
|
Fourth Amendment to the Agreement of Limited Partnership of NorthStar Realty Finance Limited Partnership, dated as of May 24, 2007 (incorporated by reference to Exhibit 3.3 to the NorthStar Realty Finance Corp. Current Report on Form 8-K filed May 29, 2007) |
|
10.10 |
+ |
Executive Employment and Non-Competition Agreement, dated as of October 4, 2007, between NorthStar Realty Finance Corp. and David T. Hamamoto (incorporated by reference to Exhibit 99.1 to the NorthStar Realty Finance Corp. Current Report on Form 8-K filed October 5, 2007) |
|
10.11 |
+ |
Executive Employment and Non-Competition Agreement, dated as of October 4, 2007, between NorthStar Realty Finance Corp. and Daniel R. Gilbert (incorporated by reference to Exhibit 99.3 to the NorthStar Realty Finance Corp. Current Report on Form 8-K filed October 5, 2007) |
|
10.12 |
+ |
Executive Employment and Non-Competition Agreement, dated as of October 4, 2007, between NorthStar Realty Finance Corp. and Albert Tylis (incorporated by reference to Exhibit 99.1 to the NorthStar Realty Finance Corp. Current Report on Form 8-K filed July 27, 2009) |
|
10.13 |
|
Fifth Amendment to the Agreement of Limited Partnership of NorthStar Realty Finance Limited Partnership, dated as of May 29, 2008 (incorporated by reference to Exhibit 10.37 to NorthStar Realty Finance Corp.'s Quarterly Report on Form 10-Q for the quarter ended June 30, 2008) |
|
10.14 |
+ |
NorthStar Realty Finance Corp. Executive Incentive Bonus Plan (incorporated by reference to Exhibit 10.31 to NorthStar Realty Finance Corp.'s Quarterly Report on Form 10-Q for the quarter ended September 30, 2009) |
|
10.15 |
|
Common Stock Purchase Warrant, Certificate No. W-1, dated October 28, 2009, issued to Wachovia Bank, National Association (incorporated by reference to Exhibit 10.36 to NorthStar Realty Finance Corp.'s Quarterly Report on Form 10-Q for the quarter ended September 30, 2009) |
|
10.16 |
|
Common Stock Purchase Warrant, Certificate No. W-2, dated October 28, 2009, issued to Wachovia Bank, National Association (incorporated by reference to Exhibit 10.37 to NorthStar Realty Finance Corp.'s Quarterly Report on Form 10-Q for the quarter ended September 30, 2009) |
|
10.17 |
|
Common Stock Purchase Warrant, Certificate No. W-3, dated October 28, 2009, issued to Wachovia Bank, National Association (incorporated by reference to Exhibit 10.38 to NorthStar Realty Finance Corp.'s Quarterly Report on Form 10-Q for the quarter ended September 30, 2009) |
|
10.18 |
|
Common Stock Purchase Warrant, Certificate No. W-4, dated June 30, 2010, issued to Wells Fargo Bank, National Association (incorporated by reference to Exhibit 10.30 to NorthStar Realty Finance Corp.'s Quarterly Report on Form 10-Q for the quarter ended June 30, 2010) |
|
10.19 |
+ |
Amendment to the NorthStar Realty Finance Corp. Executive Incentive Bonus Plan (incorporated by reference to Exhibit 10.26 to NorthStar Realty Finance Corp.'s Quarterly Report on Form 10-Q for the quarter ended March 31, 2011) |
187
Table of Contents
| | | |
Exhibit
Number | | Description of Exhibit |
|---|
| | 10.20 | + | Form of Amended and Restated Indemnification Agreement for directors and officers of NorthStar Realty Finance Corp. (incorporated by reference to Exhibit 10.25 to NorthStar Realty Finance Corp.'s Quarterly Report on Form 10-Q for the quarter ended June 30, 2011) |
|
10.21 |
+ |
Executive Employment Agreement, dated as of April 29, 2011, between NorthStar Realty Finance Corp. and Debra A. Hess (incorporated by reference to Exhibit 10.26 to NorthStar Realty Finance Corp.'s Quarterly Report on Form 10-Q for the quarter ended June 30, 2011) |
|
10.22 |
* |
Master Repurchase and Securities Contract, dated as of October 28, 2011, by and between NRFC WF CMBS, LLC, and Wells Fargo Bank, National Association |
|
10.23 |
* |
Guaranty Agreement, made as of October 28, 2011, by NorthStar Realty Finance Corp., NorthStar Realty Finance Limited Partnership and NRFC Sub-REIT Corp. in favor of Wells Fargo Bank, National Association |
|
10.24 |
* |
Master Repurchase and Securities Contract, dated as of November 22, 2011, by and between NRFC WF Loan, LLC, and Wells Fargo Bank, National Association |
|
10.25 |
* |
Limited Guaranty, made as of November 22, 2011, by NorthStar Realty Finance Corp. and NorthStar Realty Finance Limited Partnership for the benefit of Wells Fargo Bank, National Association |
|
12.1 |
* |
Ratio of Earnings to Combined Fixed Charges and Preference Dividends |
|
21.1 |
* |
Significant Subsidiaries of the Registrant |
|
23.1 |
* |
Consent of Grant Thornton LLP |
|
24.1 |
* |
Power of Attorney (see the Power of Attorney in the signature page hereto) |
|
31.1 |
* |
Certification by the Chief Executive Officer pursuant to 17 CFR 240.13a-14(a)/15(d)-14(a), as adopted pursuant to Section 302 of the Sarbanes-Oxley Act of 2002 |
|
31.2 |
* |
Certification by the Chief Financial Officer pursuant to 17 CFR 240.13a-14(a)/15(d)-14(a), as adopted pursuant to Section 302 of the Sarbanes-Oxley Act of 2002 |
|
32.1 |
* |
Certification by the Chief Executive Officer pursuant to Rule 13a-14(b) under the Securities Exchange Act of 1934 and 18 U.S.C. Section 1350, as adopted pursuant to Section 906 of the Sarbanes-Oxley Act of 2002 |
|
32.2 |
* |
Certification by the Chief Financial Officer pursuant to Rule 13a-14(b) under the Securities Exchange Act of 1934 and 18 U.S.C. Section 1350, as adopted pursuant to Section 906 of the Sarbanes-Oxley Act of 2002 |
|
101 |
** |
The following materials from the NorthStar Realty Finance Corp. Annual Report on Form 10-K for the year ended December 31, 2011, formatted in XBRL (eXtensible Business Reporting Language): (i) Consolidated Balance Sheets at December 31, 2011 and December 31, 2010; (ii) Consolidated Statements of Operations for the years ended December 31, 2011, 2010 and 2009; (iii) Consolidated Statements of Comprehensive Income (Loss) for the years ended December 31, 2011, 2010 and 2009; (iv) Consolidated Statements of Equity as of December 31, 2011 and December 31, 2010; (v) Consolidated Statements of Cash Flows for the years ended December 31, 2011, 2010 and 2009; and (vi) Notes to Consolidated Financial Statements |
188
Table of Contents
- **
- Pursuant to Rule 406T of Regulation S-T, the Interactive Data Files on Exhibit 101 hereto are deemed not filed or part of a registration statement or prospectus for purposes of Sections 11 or 12 of the Securities Act of 1933, as amended, are deemed not filed for purposes of Section 18 of the Securities and Exchange Act of 1934, as amended, and otherwise are not subject to liability under those sections.
- +
- Denotes management contract or compensatory plan or arrangement required to be filed as an exhibit hereto.
189
Table of Contents
SIGNATURES
Pursuant to the requirements of Section 13 or 15(d) of the Securities Exchange Act of 1934, the Registrant has duly caused this report to be signed on its behalf by the undersigned thereunto duly authorized on February 17, 2012.
| | | | | | |
| | | NORTHSTAR REALTY FINANCE CORP. |
|
|
By: |
|
/s/ DAVID T. HAMAMOTO
|
| | | | | Name: | | David T. Hamamoto |
| | | | | Title: | | Chairman and Chief Executive Officer |
POWER OF ATTORNEY
KNOW ALL PERSONS BY THESE PRESENTS, that each person whose signature appears below constitutes and appoints Debra A. Hess and Ronald Lieberman and each of them severally, her or his true and lawful attorney-in-fact with power of substitution and re-substitution to sign in her or his name, place and stead, in any and all capacities, to do any and all things and execute any and all instruments that such attorney may deem necessary or advisable under the Securities Exchange Act of 1934 and any rules, regulations and requirements of the U.S. Securities and Exchange Commission in connection with this Annual Report on Form 10-K and any and all amendments hereto, as fully for all intents and purposes as she or he might or could do in person, and hereby ratifies and confirms all said attorneys-in-fact and agents, each acting alone, and her or his substitute or substitutes, may lawfully do or cause to be done by virtue hereof. Pursuant to the requirements of Section 13 or 15(d) of the Securities Exchange Act of 1934, this report has been signed below on behalf of the Registrant in the capacities and on the dates indicated.
| | | | |
Signature | | Title | | Date |
|---|
|
|
|
|
|
/s/ DAVID T. HAMAMOTO
David T. Hamamoto | | Chairman and Chief Executive Officer
(Principal Executive Officer) | | February 17, 2012 |
/s/ DEBRA A. HESS
Debra A. Hess |
|
Chief Financial Officer
(Principal Financial Officer and Principal Accounting Officer) |
|
February 17, 2012 |
/s/ PRESTON BUTCHER
Preston Butcher |
|
Director |
|
February 17, 2012 |
/s/ STEPHEN E. CUMMINGS
Stephen E. Cummings |
|
Director |
|
February 17, 2012 |
/s/ JUDITH A. HANNAWAY
Judith A. Hannaway |
|
Director |
|
February 17, 2012 |
190
Table of Contents
| | | | |
Signature | | Title | | Date |
|---|
|
|
|
|
|
/s/ OSCAR JUNQUERA
Oscar Junquera | | Director | | February 17, 2012 |
/s/ WESLEY D. MINAMI
Wesley D. Minami |
|
Director |
|
February 17, 2012 |
/s/ LOUIS J. PAGLIA
Louis J. Paglia |
|
Director |
|
February 17, 2012 |
/s/ SRIDHAR SAMBAMURTHY
Sridhar Sambamurthy |
|
Director |
|
February 17, 2012 |
191