UNITED STATES
SECURITIES AND EXCHANGE COMMISSION
Washington, D.C. 20549
FORM 10-K
|
| |
| (Mark One) | |
x | ANNUAL REPORT PURSUANT TO SECTION 13 OR 15(d) OF THE SECURITIES EXCHANGE ACT OF 1934 |
| For the fiscal year ended December 31, 2014 |
| or |
o | TRANSITION REPORT PURSUANT TO SECTION 13 OR 15(d) OF THE SECURITIES EXCHANGE ACT OF 1934 |
| For the transition period from to |
Commission File Number: 001-32330
NORTHSTAR REALTY FINANCE CORP.
(Exact Name of Registrant as Specified in its Charter) |
| |
Maryland (State or Other Jurisdiction of Incorporation or Organization) | 02-0732285 (IRS Employer Identification No.) |
399 Park Avenue, 18th Floor, New York, NY 10022
(Address of Principal Executive Offices, Including Zip Code)
(212) 547-2600
(Registrant’s Telephone Number, Including Area Code)
Securities registered pursuant to Section 12(b) of the Act: |
| | |
| Title of Class | | Name of Each Exchange on Which Registered |
| Common Stock, $0.01 par value | | New York Stock Exchange |
| Preferred Stock, 8.75% Series A Cumulative Redeemable, $0.01 par value | | New York Stock Exchange |
| Preferred Stock, 8.25% Series B Cumulative Redeemable, $0.01 par value | | New York Stock Exchange |
| Preferred Stock, 8.875% Series C Cumulative Redeemable, $0.01 par value | | New York Stock Exchange |
| Preferred Stock, 8.50% Series D Cumulative Redeemable, $0.01 par value | | New York Stock Exchange |
| Preferred Stock, 8.75% Series E Cumulative Redeemable, $0.01 par value | | New York Stock Exchange |
Securities registered pursuant to Section 12(g) of the Act: None
Indicate by check mark if the registrant is a well-known seasoned issuer, as defined in Rule 405 of the Securities Act. Yes x No o
Indicate by check mark if the registrant is not required to file reports pursuant to Section 13 or 15(d) of the Act. Yes o No x
Indicate by check mark whether the registrant (1) has filed all reports required to be filed by Section 13 or 15(d) of the Securities Exchange Act of 1934 during the preceding 12 months (or for such shorter period that the registrant was required to file such reports), and (2) has been subject to such filing requirements for the past 90 days. Yes x No o
Indicate by check mark whether the registrant has submitted electronically and posted on its corporate Web site, if any, every Interactive Data File required to be submitted and posted pursuant to Rule 405 of Regulation S-T (§232.405 of this chapter) during the preceding 12 months (or for such shorter period that the registrant was required to submit and post such files). Yes x No o
Indicate by check mark if disclosure of delinquent filers pursuant to Item 405 of Regulation S-K is not contained herein and will not be contained, to the best of registrant’s knowledge, in definitive proxy or information statements incorporated by reference in Part III of this Annual Report on Form 10-K or any amendment to this Annual Report on Form 10-K. x
Indicate by check mark whether the registrant is a large accelerated filer, an accelerated filer, a non-accelerated filer, or a smaller reporting company. See the definitions of “large accelerated filer,” “accelerated filer” and “smaller reporting company” in Rule 12b-2 of the Exchange Act. (Check one):
|
| | | | | | | | |
| Large accelerated filer | x | | Accelerated filer | o | | Non-accelerated filer o (Do not check if a smaller reporting company) | | Smaller reporting company o |
Indicate by check mark whether the registrant is a shell company (as defined in Rule 12b-2 of the Exchange Act). Yes o No x
The aggregate market value of the registrant’s voting and non-voting common equity held by non-affiliates of the registrant as of June 30, 2014, was $5,713,205,219, which does not reflect our market value after the spin-off which occurred after market close on June 30, 2014. As of February 26, 2015, the registrant had issued and outstanding 309,474,099 shares of common stock, $0.01 par value per share.
DOCUMENTS INCORPORATED BY REFERENCE
Portions of the definitive proxy statement for the registrant’s 2015 Annual Meeting of Stockholders to be filed within 120 days after the end of the registrant’s fiscal year ended December 31, 2014 are incorporated by reference into this Annual Report on Form 10-K in response to Part III, Items 10, 11, 12, 13 and 14.
NORTHSTAR REALTY FINANCE CORP.
FORM 10-K
TABLE OF CONTENTS
FORWARD-LOOKING STATEMENTS
This Annual Report on Form 10-K contains certain “forward-looking statements” within the meaning of the Private Securities Litigation Reform Act of 1995, Section 27A of the Securities Act of 1933, as amended, or Securities Act, and Section 21E of the Securities Exchange Act of 1934, as amended, or Exchange Act. Forward-looking statements are generally identifiable by use of forward-looking terminology such as “may,” “will,” “should,” “potential,” “intend,” “expect,” “seek,” “anticipate,” “estimate,” “believe,” “could,” “project,” “predict,” “continue,” “future” or other similar words or expressions. Forward-looking statements are not guarantees of performance and are based on certain assumptions, discuss future expectations, describe plans and strategies, contain projections of results of operations or of financial condition or state other forward-looking information. Such statements include, but are not limited to, those relating to the operating performance of our investments, our liquidity and financing needs, the effects of our current strategies and investment activities, our ability to grow following the spin-off of our asset management business and the entry into a long-term management contract with an affiliate of NorthStar Asset Management Group Inc., or NSAM, and our ability to raise and effectively deploy capital. Our ability to predict results or the actual effect of plans or strategies is inherently uncertain, particularly given the economic environment. Although we believe that the expectations reflected in such forward-looking statements are based on reasonable assumptions, our actual results and performance could differ materially from those set forth in the forward-looking statements and you should not unduly rely on these statements. These forward-looking statements involve risks, uncertainties and other factors that may cause our actual results in future periods to differ materially from those forward-looking statements. These factors include, but are not limited to:
| |
| • | the merger of Griffin-American Healthcare REIT II, Inc. and acquisition of its healthcare real estate portfolio may not have the full strategic and financial benefits that we expect; |
| |
| • | adverse domestic or international economic conditions and the impact of the commercial real estate industry; |
| |
| • | access to debt and equity capital and our liquidity; |
| |
| • | our use of leverage and our ability to comply with the terms of our borrowing arrangements; |
| |
| • | our ability to obtain mortgage financing on our real estate portfolio on favorable terms or at all; |
| |
| • | the effect of economic conditions on the valuation of our investments; |
| |
| • | our ability to acquire attractive investment opportunities; |
| |
| • | the spin-off of our asset management business may not have the full or any strategic and financial benefits that we expect; |
| |
| • | our performance pursuant to a long-term management contract with an affiliate of NSAM, as our manager, and the effects of becoming an externally-managed company, including our reliance on NSAM and its affiliates and sub-advisors/co-venturers in providing management services to us, the payment of substantial base and potential incentive fees to our manager, the allocation of investments by our manager among us and the manager’s other managed companies and strategic vehicles and various conflicts of interest in our relationship with NSAM; |
| |
| • | our ability to close on the recent commitments to acquire real estate investments, including the agreements to acquire approximately $1.9 billion of real estate in Europe, and engage in joint venture transactions, each on the terms contemplated or at all; |
| |
| • | the impact of adverse conditions effecting a specific asset class in which we have investments, such as healthcare, hotel, manufactured housing, multi-tenant office and limited partnership interests in real estate private equity funds; |
| |
| • | the impact of our growth outside of the United States and pending exit from Europe through the proposed spin-off of our European real estate business; |
| |
| • | the proposed spin-off of our European real estate business may not have the full or any strategic and financial benefits that we expect or such benefits may be delayed or may not materialize at all; |
| |
| • | performance of our investments relative to our expectations and the impact on our actual return on invested equity, as well as the cash provided by these investments and available for distribution; |
| |
| • | the impact of economic conditions on the tenants/operators/residents/guests of the real property that we own as well as on the borrowers of the commercial real estate debt we originate and acquire and the commercial mortgage loans underlying the commercial mortgage backed securities in which we invest; |
| |
| • | tenant/operator or borrower defaults or bankruptcy; |
| |
| • | illiquidity of properties in our portfolio; |
| |
| • | our ability to grow and profit from our commercial real estate origination activities; |
| |
| • | our ability to realize the value of the bonds and equity we purchased and/or retained in our collateralized debt obligations, or CDO, financing transactions and other securitization financing transactions and our ability to complete securitization financing transactions on terms that are acceptable to us, if at all; |
| |
| • | our ability to meet various coverage tests with respect to our CDO financing transactions; |
| |
| • | our ability to realize current and expected return over the life of our investments; |
| |
| • | any failure in our due diligence to identify all relevant facts in our underwriting process or otherwise; |
| |
| • | the impact of credit rating downgrades; |
| |
| • | our ability to manage our costs in line with our expectations and the impact on our cash available for distribution; |
| |
| • | environmental compliance costs and liabilities; |
| |
| • | effect of regulatory actions, litigation and contractual claims against us and our affiliates, including the potential settlement and litigation of such claims; |
| |
| • | competition for investment opportunities; |
| |
| • | the possibility that the net asset value of interests in certain real estate private equity funds we acquired do not necessarily reflect the fair value of such fund interests or that the actual amount of our future capital commitments underlying such fund interests varies materially from our expectations; |
| |
| • | regulatory requirements with respect to our business and the related cost of compliance; |
| |
| • | changes in domestic or international laws or regulations governing various aspects of our business; |
| |
| • | the loss of our exemption from the definition of an “investment company” under the Investment Company Act of 1940, as amended; |
| |
| • | competition for qualified personnel and our ability to retain key personnel; |
| |
| • | the effectiveness of our portfolio management techniques and strategies; |
| |
| • | the impact of damage to our brand and reputation resulting from internal or external causes; |
| |
| • | failure to maintain effective internal controls and disclosure controls and procedures; and |
| |
| • | compliance with the rules governing real estate investment trusts. |
The foregoing list of factors is not exhaustive. All forward-looking statements included in this Annual Report on Form 10-K are based on information available to us on the date hereof and we are under no duty to update any of the forward-looking statements after the date of this report to conform these statements to actual results.
Factors that could have a material adverse effect on our operations and future prospects are set forth in “Risk Factors” in this Annual Report on Form 10-K beginning on page 21. The risk factors set forth in our filings with the Securities and Exchange Commission could cause our actual results to differ significantly from those contained in any forward-looking statement contained in this report.
PART I
Item 1. Business
References to “we,” “us” or “our” refer to NorthStar Realty Finance Corp. and its subsidiaries unless the context specifically requires otherwise.
Overview
We are a diversified commercial real estate company with 82% of our total assets invested in real estate, of which 74% is invested in direct real estate investments. We generated 70% of our revenue from our real estate portfolio for the year ended December 31, 2014. Substantially all of our assets are invested in and revenues are generated from our real estate portfolio, excluding our European Portfolio (as defined below). Excluding our European Portfolio, 79% of our total assets are invested in real estate, generating 70% of our revenue for the year ended December 31, 2014. We invest in multiple asset classes across commercial real estate, or CRE, that we expect will generate attractive risk-adjusted returns and may take the form of acquiring real estate, originating or acquiring senior or subordinate loans, as well as pursuing opportunistic CRE investments, both in the United States and internationally, with a current focus on Europe. We seek to generate stable cash flow for distribution to our stockholders through our diversified portfolio of global commercial real estate assets and in turn build long-term franchise value. Effective June 30, 2014, we are externally managed and advised by an affiliate of NorthStar Asset Management Group Inc. (NYSE: NSAM), which together with its affiliates is referred to as NSAM. We are a Maryland corporation and completed our initial public offering in October 2004. We conduct our operations so as to continue to qualify as a real estate investment trust, or REIT, for U.S. federal income tax purposes.
Significant Developments
Proposed Spin-off of European Real Estate Business
On February 26, 2015, we announced that our board of directors unanimously approved a plan to spin-off our European real estate business, or the Proposed European Spin, into a newly-formed publicly-traded REIT, NorthStar Realty Europe Corp., or NRE, expected to be listed on the New York Stock Exchange, or NYSE, and potentially in Europe. Currently, we acquired or committed to acquire $2 billion of European real estate comprised of 50 properties spanning across some of Europe’s top markets, or our European Portfolio, that will be contributed to NRE upon the completion of the Proposed European Spin. NSAM will manage NRE pursuant to a long-term management agreement, on substantially similar terms as our management agreement with NSAM. The Proposed European Spin is expected to be completed in the second half of 2015.
Griffin-American Healthcare REIT II, Inc.
On December 3, 2014, we completed our previously announced merger of Griffin-American Healthcare REIT II, Inc., or Griffin-American, where we acquired all of the outstanding shares of Griffin-American in a stock and cash transaction valued at $4 billion. Griffin-American was a public REIT focused on medical office buildings, senior housing and other healthcare-related facilities and was co-sponsored by American Healthcare Investors LLC, or AHI, and Griffin Capital Corporation. Additionally, NorthStar Healthcare acquired a 14.3% equity interest in the Griffin-American portfolio for $187 million in cash, including its share of transaction costs. The European healthcare properties that we acquired from Griffin-American will not be contributed to NRE in the Proposed European Spin.
Spin-off of Asset Management Business
On June 30, 2014, we completed the spin-off of our asset management business into a separate publicly-traded company, NSAM, in the form of a tax-free distribution, or the NSAM Spin-off or Distribution. In connection with the NSAM Spin-off, each of our common stockholders received shares of NSAM’s common stock on a one-for-one basis, after giving effect to a one-for-two reverse stock split of our common stock, or Reverse Split. Upon completion of the NSAM Spin-off, our asset management business is owned and operated by NSAM and we are externally managed by an affiliate of NSAM through a management contract with an initial term of 20 years. Subsequent to the NSAM Spin-off, we continue to operate our CRE debt origination business. Most of our employees at the time of the NSAM Spin-off became employees of NSAM and executive officers, employees engaged in our loan origination business at the time of the spin-off and certain other employees became co-employees of both us and NSAM. Affiliates of NSAM also manage our previously sponsored non-traded REITs: NorthStar Real Estate Income Trust, Inc., or NorthStar Income, NorthStar Healthcare Income, Inc., or NorthStar Healthcare, and NorthStar Real Estate Income II, Inc., or NorthStar Income II, and together with any new sponsored companies, herein collectively referred to as the NSAM Sponsored Companies. In addition, NSAM owns NorthStar Realty Securities, LLC, or NorthStar Securities, our previously owned captive broker-dealer platform, which raises capital in the retail market for NSAM’s Sponsored Companies.
Prior to the Distribution, we completed an internal corporate reorganization whereby we collapsed our three tier holding company structure into a single tier. We previously conducted substantially all of our operations and made our investments through NorthStar Realty Finance Limited Partnership, or the Operating Partnership. In addition, following the reorganization
but prior to the Distribution, we completed a Reverse Split where every two shares of our issued and outstanding common stock were combined into one issued and outstanding share of our common stock.
Our Investments
The following table presents our investments as of December 31, 2014, adjusted for acquisitions and commitments to purchase real estate through February 24, 2015 (refer to the below and Recent Developments in Part II, Item 7. “Management’s Discussion and Analysis of Financial Condition and Results of Operations” for further discussion) (dollars in thousands):
|
| | | | | | | | |
| | | Amount(1) | | % |
| Real Estate | | | | |
Healthcare(2) | | $ | 5,833,771 |
| | 31.5 | % |
| Hotel | | 3,050,383 |
| | 16.5 | % |
European(3) | | 1,984,230 |
| | 10.7 | % |
| Manufactured housing communities | | 1,593,618 |
| | 8.6 | % |
| Net lease | | 781,554 |
| | 4.2 | % |
| Multifamily | | 372,011 |
| | 2.0 | % |
| Multi-tenant office | | 133,421 |
| | 0.7 | % |
| Subtotal | | 13,748,988 |
| | 74.2 | % |
| Private equity fund investments | | 1,248,300 |
| | 6.7 | % |
Corporate investments(4) | | 157,380 |
| | 0.9 | % |
| Total real estate | | 15,154,668 |
| | 81.8 | % |
| CRE Debt | | | | |
| First mortgage loans | | 434,671 |
| | 2.4 | % |
| Mezzanine loans | | 149,816 |
| | 0.8 | % |
| Subordinate interests | | 201,564 |
| | 1.1 | % |
| Corporate loans | | 360,343 |
| | 1.9 | % |
| Subtotal | | 1,146,394 |
| | 6.2 | % |
| CRE debt of consolidated N-Star CDOs | | 40,922 |
| | 0.2 | % |
| Other | | 37,030 |
| | 0.2 | % |
| Total CRE debt | | 1,224,346 |
| | 6.6 | % |
| CRE Securities | | | | |
N-Star CDO bonds(5) | | 569,885 |
| | 3.1 | % |
| N-Star CDO equity | | 137,143 |
| | 0.7 | % |
| Other securities | | 119,089 |
| | 0.7 | % |
| Total CRE securities | | 826,117 |
| | 4.5 | % |
| Subtotal | | 17,205,131 |
| | 92.9 | % |
Assets underlying deconsolidated CRE Debt CDOs(6) | | 1,291,055 |
| | 7.1 | % |
| Grand total | | $ | 18,496,186 |
| | 100.0 | % |
____________________________________________________________
| |
| (1) | Based on cost for real estate investments which includes net purchase price allocation related to net intangibles, deferred costs and other assets, if any, fair value for our investments (directly or indirectly in joint ventures) owning limited partnership interests in real estate private equity funds, or PE Investments, and includes the deferred purchase price for PE Investment II, principal amount for our CRE debt and securities investments and amortized cost for N-Star CDO equity. Represents 100% of all real estate assets in consolidated joint ventures. |
| |
| (2) | Includes $498 million of Sterling denominated real estate in the United Kingdom owned in connection with the acquisition of the Griffin-American Portfolio. |
| |
| (3) | Includes $1.9 billion of commitments to purchase European assets through February 24, 2015. |
| |
| (4) | Represents our investments in RXR Realty LLC, or RXR Realty, Aerium Group, or Aerium, and Legacy Partners Commercial LLC, or Legacy Commercial. |
| |
| (5) | Includes N-Star CDO bonds with a principal amount of $108 million related to CRE securities CDOs that are eliminated in consolidation. |
| |
| (6) | Includes assets of deconsolidated CRE debt CDOs, referred to as N-Star CDOs. Based on the remittance report issued on date nearest to December 31, 2014. This amount excludes $599 million of aggregate N-Star CDO equity and N-Star CDO bonds included in CRE securities. |
We have the ability to invest in a broad spectrum of global commercial real estate assets and seek to provide attractive risk-adjusted returns to our stockholders. As a result, we pursue opportunistic investments across all our business lines including CRE equity and debt investments.
For financial information regarding our reportable segments, refer to Note 19. “Segment Reporting” in our accompanying consolidated financial statements included in Part II, Item 8. “Financial Statements and Supplementary Data.”
Underwriting Process
We use a rigorous investment and underwriting process that has been developed and utilized by our senior management team leveraging their extensive commercial real estate expertise over many years and real estate cycles which focuses on some or all of the following factors designed to ensure each investment is evaluated appropriately: (i) macroeconomic conditions that may influence operating performance; (ii) fundamental analysis of underlying real estate, including tenant rosters, lease terms,
zoning, necessary licensing, operating costs and the asset’s overall competitive position in its market; (iii) real estate market factors that may influence the economic performance of the investment, including leasing conditions and overall competition; (iv) the operating expertise and financial strength and reputation of a tenant, operator, partner or borrower; (v) the cash flow in place and projected to be in place over the term of the investment and potential return; (vi) the appropriateness of the business plan and estimated costs associated with tenant buildout, repositioning or capital improvements; (vii) an internal and third-party valuation of a property, investment basis relative to the competitive set and the ability to liquidate an investment through a sale or refinancing; (viii) review of third-party reports including appraisals, engineering and environmental reports; (ix) physical inspections of properties and markets; (x) the overall legal structure of the investment, contractual implications and the lenders’ rights; and (xi) the tax and accounting impact.
Real Estate
Overview
As part of our real estate strategy, we explore a variety of real estate investments, both directly and through joint ventures. Opportunities to purchase real estate have been bolstered by attractive long-term, non-recourse, non mark-to-market financing available through commercial mortgage-backed securities, or CMBS, and agency financing markets. Our portfolio is primarily comprised of healthcare, hotel, manufactured housing communities, net lease, multifamily properties and international real estate, with a current focus on Europe. We also invest in other opportunistic real estate investments such as indirect interests in real estate through real estate private equity funds. We also acquire hotel and certain healthcare properties through structures permitted by the REIT Investment Diversification and Empowerment Act of 2007, or RIDEA, where we participate directly in the operational cash flow of a property. Our real estate equity investments that operate under the RIDEA structure generate resident and hotel guest related income from short-term residential agreements and incur customary related operating expenses.
Our Portfolio
As of December 31, 2014, adjusted for acquisitions and commitments to purchase through February 24, 2015, $15.2 billion, or 81.8%, of our assets were invested directly in real estate properties and indirectly through our PE Investments and our corporate interests. The following table presents our direct investments in real estate properties as of December 31, 2014, adjusted for acquisitions and commitments to purchase through February 24, 2015 (refer to Recent Developments in Part II, Item 7. “Management’s Discussion and Analysis of Financial Condition and Results of Operations” for further discussion) (dollars in thousands):
|
| | | | | | | | | | | | | | | |
| Type | | Number | | Amount(1) | | % | | Capacity | | Primary Locations |
| Healthcare | | | | | | | | | | | |
| Medical office buildings (MOB) | | 147 | | $ | 2,144,134 |
| | 15.6 | % | | 6.0 million |
| square feet | | IN, TX, GA, CO, IL |
Skilled nursing facilities (SNF)(2) | | 108 | | 1,332,988 |
| | 9.7 | % | | 12,700 |
| beds | | FL, PA, IL, IN, VA |
| Assisted living facilities - RIDEA (ALF-RIDEA) | | 109 | | 1,203,444 |
| | 8.8 | % | | 6,300 |
| units | | IL, OR, OH, TX, MA, WA |
| Assisted living facilities - Net lease (ALF-Net Lease) | | 83 | | 867,935 |
| | 6.3 | % | | 4,300 |
| units | | UK, NC, OR, MN, IN |
| Hospital (HOS) | | 14 | | 285,270 |
| | 2.1 | % | | 800 |
| beds | | CA, MO, TX |
| Subtotal | | 461 | | 5,833,771 |
| | 42.5 | % | | | | | |
| Hotel | | 155 | | 3,050,383 |
| | 22.2 | % | | 20,250 |
| rooms | | VA, NJ, CA, TX |
European(3) | | 50 | | 1,984,230 |
| | 14.4 | % | | 466,000 |
| square meters | | UK, France, Germany |
| Manufactured housing communities | | 123 | | 1,593,618 |
| | 11.6 | % | | 29,036 |
| pad sites | | CO, UT, FL, TX, WY, NY |
| Net lease | | | | | | | | | | | |
| Industrial | | 35 | | 378,225 |
| | 2.8 | % | | 6.1 million |
| square feet | | CA, IL, FL, GA, MI |
Office(4) | | 19 | | 338,826 |
| | 2.5 | % | | 2.3 million |
| square feet | | CA, FL, NJ, UT |
| Retail | | 10 | | 64,503 |
| | 0.5 | % | | 467,971 |
| square feet | | NH, MA, ME |
| Subtotal | | 64 | | 781,554 |
| | 5.8 | % | | | | | |
Multifamily(4) | | 12 | | 372,011 |
| | 2.6 | % | | 4,514 |
| units | | TN, GA, FL |
| Multi-tenant office | | 12 | | 133,421 |
| | 0.9 | % | | 864,000 |
| square feet | | CO, TX, CA |
| Total | | 877 | | $ | 13,748,988 |
| | 100.0 | % | | | | | |
___________________________________________________________
| |
| (1) | Represents cost, which includes net purchase price allocation of $697 million related to net intangibles. Additionally, includes $27 million of manufactured homes, $48 million of notes receivable and $339 million of escrows and other assets. |
| |
| (2) | Includes three properties with a cost of $14 million owned pursuant to the RIDEA structure. |
| |
| (3) | Includes $1.9 billion of commitments to purchase European assets through February 24, 2015. |
| |
| (4) | Includes our interest in joint ventures that own a net lease property and multifamily property of $27 million and $37 million, respectively. |
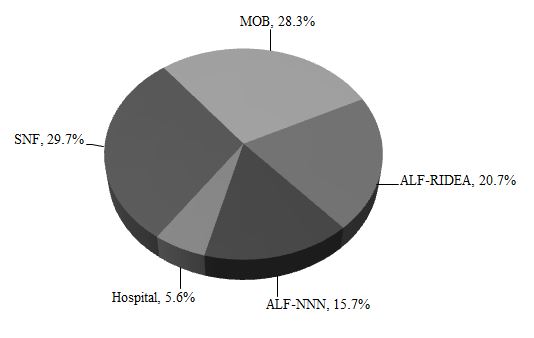
Healthcare Properties
Our healthcare properties are comprised of a diverse portfolio of medical office buildings and other properties typically leased under net leases to healthcare operators with a focus on mid-acuity facilities (i.e., skilled nursing and assisted living), with the highest concentration in private-pay assisted living facilities which we believe have the most advantageous underlying
demographic trends and fundamentals. In addition, we own healthcare properties that operate under a RIDEA structure generating resident income from short-term residential agreements and incur customary related operating expenses. For our RIDEA properties, which are primarily assisted living facilities, we are the licensed operator via a taxable REIT subsidiary, or TRS. However, as required under RIDEA, we enter into management agreements with independent third party operators to manage and operate the RIDEA facilities.
As of December 31, 2014, $5.8 billion, or 31.5%, of our assets were invested in healthcare properties. The following presents a summary of our healthcare portfolio and diversity across property type based on net cash flow:
|
| | | | |
| | | | Healthcare by Property Type |
| Total Healthcare Portfolio | $5.8 billion |
| | |
| Number of facilities | 461 |
| |
Number of units/beds(1) | 24,100 |
| |
| | | |
| Weighted average occupancy | 95 | % | |
| Weighted average lease coverage | 1.6x |
| |
| Weighted average lease term | 8.8 years |
| |
| | | |
| Net cash flow related to: | | |
| Medical office buildings/net lease/hospitals | 79 | % | |
| RIDEA | 21 | % | |
___________________________________
(1)Represents number of units for ALF/ILF property types and number of beds for SNF property types.
Hotel Portfolio
Our hotel portfolio is a geographically diverse portfolio primarily comprised of extended stay hotels and premium branded select service hotels primarily located in major metropolitan markets with the majority affiliated with top hotel brands.
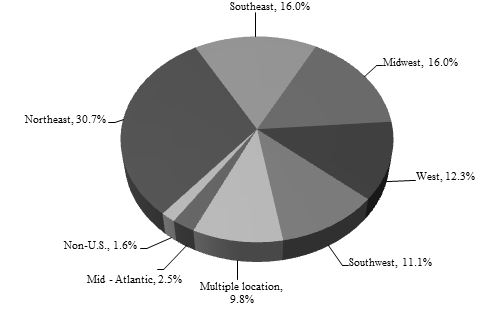
As of December 31, 2014, $3.1 billion, or 16.5%, of our assets were invested in hotel properties. The following presents a summary of our hotel portfolio and diversity across geographic location based on number of rooms:
|
| | | | |
| | | | Hotel by Geographic Location |
| Total Hotel Portfolio | $3.1 billion |
| |
| Number of hotels | 155 |
|
| Number of rooms | 20,250 |
|
Weighted average occupancy(1) | 74 | % |
| | |
| Rooms by brand: | |
| Marriott | 74 | % |
| Hilton | 16 | % |
| Starwood | 4 | % |
| Hyatt | 4 | % | |
| Intercontinental | 2 | % | |
___________________________________
(1)Represents projected weighted average occupancy for 2015.
European
We are expanding outside the United States, with a current focus on Europe, and seek to invest in various types of commercial real estate assets. As of December 31, 2014, $2.0 billion, or 10.7%, of our assets were invested in our European Portfolio.
The following presents a summary of our European Portfolio and diversity across geographic location based on purchase price:
|
| | | | |
| | | | European by Geographic Location |
| Total European Portfolio | $2.0 billion |
| |
| Number of properties | 50 |
|
| Number of countries | 9 |
|
| Total square meters | 466,000 |
|
| | |
| Weighted average occupancy | 92 | % |
| Weighted average lease term | 5.0 years |
|
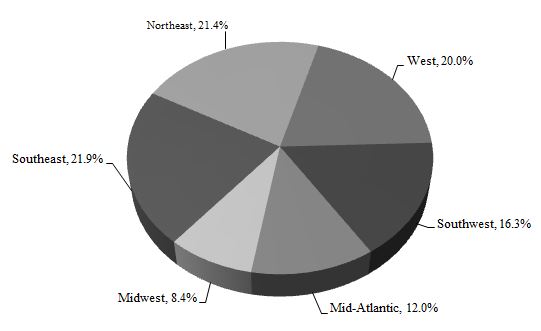
Manufactured Housing Communities
Our manufactured housing portfolio consists of communities that lease pad rental sites for placement of factory built homes located throughout the United States. The manufactured housing industry has traditionally demonstrated low cash flow volatility and steady annual rent increases, although there is no assurance that will continue to be the case.
As of December 31, 2014, $1.6 billion, or 8.6%, of our assets were invested in manufactured housing communities. The following presents a summary of our manufactured housing communities portfolio and diversity across geographic location based on net cash flow:
|
| | | | |
|
|
| Manufactured Housing Communities by Geographic Location |
| Total Manufactured Housing Portfolio | $1.6 billion |
| |
| Number of communities | 123 |
|
| Number of pad rental sites | 29,036 |
|
Number of manufactured homes(1) | 3,400 |
|
| Number of states | 12 |
|
| Weighted average occupancy | 88 | % |
| | |
| Net cash flow related to: |
|
|
| Pad rental sites | 89 | % |
| Other | 11 | % |
___________________________________
(1)Represents manufactured houses available for sale or rent.
Net Lease Properties
Our real estate that is net leased to corporate tenants is primarily comprised of industrial, office and retail properties. These net lease properties are typically leased to a single tenant who agrees to pay basic rent, plus all taxes, insurance, capital and operating expenses arising from the use of the leased property generally leaving us, as owner, with minimal ongoing operational or expense obligations. We may also invest in properties that are leased to tenants for which we are responsible for some of the operating expenses and capital costs. At the end of the lease term, the tenant typically has a right to renew the lease at market rates or to vacate the property with no further ongoing obligation.
As of December 31, 2014, $782 million, or 4.2%, of our assets were invested in net lease properties, including one property owned through an unconsolidated joint venture. The following presents a summary of our net lease portfolio and diversity across geographic location based on number of properties:
|
| | | | |
| | | | Net Lease by Geographic Location |
| Total Net Lease Portfolio | $782 million |
| |
| Number of properties | 64 |
|
| Number of states | 23 |
|
| Total square feet | 8.8 million |
|
| Weighted average occupancy | 99 | % |
| Weighted average lease term | 9.7 years |
|
| | |
| Net cash flow related to: | |
| Industrial | 49 | % |
| Office | 43 | % |
| Retail | 8 | % |
Multifamily Properties
Our multifamily portfolio primarily focuses on properties located in suburban markets that we believe are well suited to capture the formation of new households.
As of December 31, 2014, $372 million, or 2.0%, of our assets were invested in multifamily properties, including one property owned through an unconsolidated joint venture. The following presents a summary of our multifamily portfolio and diversity across geographic location based on net cash flow:
|
| | | | |
| | | | Multifamily by Geographic Location |
| Total Multifamily Portfolio | $372 million |
| |
| Number of properties | 12 |
|
| Number of states | 6 |
|
| Number of units | 4,514 |
|
| | |
| Weighted average occupancy | 94 | % |
Multi-tenant Office
We, through a joint venture with Legacy Commercial, are focused on acquiring multi-tenant office properties in the western United States.
As of December 31, 2014, $133 million, or 0.7%, of our assets were invested in multi-tenant office properties, including an acquisition that occurred in February 2015. The following presents a summary of our multi-tenant office portfolio and diversity across geographic location based on cost:
|
| | | | |
| | | | Multi-tenant Office by Geographic Location |
| Total Multi-tenant Office Portfolio | $133 million |
| |
| Number of properties | 12 |
|
| Number of states | 3 |
|
| Total square feet | 864,000 |
|
| | |
| Weighted average occupancy | 90 | % |
PE Investments
Our PE Investments own limited partnership interests in real estate private equity funds acquired in the secondary market and managed by institutional-quality sponsors, which we refer to as fund interests.
As of December 31, 2014, $1.2 billion, or 6.7%, of our assets were invested in PE Investments through unconsolidated ventures or direct investments. The following table presents our indirect investment in real estate through PE Investments as of December 31, 2014 (dollars in thousands):
|
| | | | | | | | | |
| | | Portfolios | | Amount(1) | | % |
| PE Investment I | | 1 | | $ | 218,564 |
| | 17.5 | % |
| PE Investment II | | 1 | | 517,895 |
| | 41.5 | % |
| Other PE Investments | | 8 | | 511,841 |
| | 41.0 | % |
| Total | | 10 | | $ | 1,248,300 |
| | 100.0 | % |
___________________________________________________________
| |
| (1) | Represents fair value and includes the deferred purchase price for PE Investment II. |
The following tables present a summary of our PE Investments (dollars in millions):
|
| | | | | | | | | | | | | | | | | | | | | | | | |
PE Investment (1) | | Number of Funds | | Number of General Partners | | Initial NAV | | Closing NAV as a Percentage of Cost (2) | | Reported NAV Growth (3) | | Underlying Assets, at Cost | | Implied Leverage (4) | | Expected Future Contributions (5) |
PE Investment I(6) | | 49 | | 26 | | $ | 802.4 |
| | 66.2 | % | | 22.9 | % | | $ | 21,800 |
| | 51.0% | | $ | 7 |
|
PE Investment II(7) | | 24 | | 15 | | 910.0 |
| (8) | 73.5 | % | | 15.6 | % | | 23,400 |
| | 32.9% | | 4 |
|
Other PE Investments:(9) | | | | | | | | | | | | | | | | |
| PE Investment III | | 8 | | 4 | | 80.3 |
| (8) | 119.0 | % | | 8.0 | % | | 2,900 |
| | 49.4% | | 1 |
|
| PE Investment IV | | 1 | | 1 | | 8.8 |
| | 113.4 | % | | 16.1 | % | | 500 |
| | 46.4% | | — |
|
| PE Investment V | | 3 | | 1 | | 23.0 |
| | 57.8 | % | | 9.9 | % | | 900 |
| | 59.1% | | — |
|
| PE Investment VI | | 20 | | 12 | | 98.3 |
| | 77.5 | % | | 5.3 | % | | 9,400 |
| | 47.6% | | 2 |
|
| PE Investment VII | | 15 | | 13 | | 65.7 |
| | 79.2 | % | | 7.8 | % | | 1,100 |
| | 41.8% | | 1 |
|
| PE Investment IX | | 11 | | 7 | | 232.8 |
| | 135.3 | % | | 4.7 | % | | 20,600 |
| | 32.5% | | 2 |
|
| PE Investment X | | 13 | | 8 | | 160.4 |
| | 108.1 | % | | (3.7 | )% | | 6,300 |
| | 53.3% | | — |
|
| Total | | 144 | (10) | 87 | (10) | $ | 2,381.7 |
| | | | | | $ | 86,900 |
| | | | $ | 17 |
|
| |
| (1) | Based on financial data reported by the underlying funds as of September 30, 2014, which is the most recent financial information from the underlying funds, except as otherwise noted. |
| |
| (2) | Net cost represents total funded capital less distributions received. For PE Investment I, excludes any distributions in excess of contributions for funds, which represented 4% of reported net asset value, or NAV. |
| |
| (3) | The reported NAV growth is measured from the agreed upon reported NAV at date of acquisition, or Initial NAV. The reported NAV growth for PE Investments owned for less than twelve months is annualized based on actual reported income from the Initial NAV through September 30, 2014. |
| |
| (4) | Represents implied leverage for funds with investment-level financing, calculated as the underlying borrowing divided by assets at fair value. |
| |
| (5) | Represents the estimated amount of expected future contributions to funds as of December 31, 2014. |
| |
| (6) | We, together with NorthStar Income, have an ownership interest in PE Investment I of 51%, of which we own 70.5% and NorthStar Income owns 29.5%. |
| |
| (7) | We, NorthStar Income and funds managed by Goldman Sachs Asset Management each have an ownership interest in PE Investment II of 70%, 15% and 15%, respectively. PE Investment II paid an initial amount of $505 million and will pay the remaining $411 million, or 45% of the purchase price, or the Deferred Amount, by the last day of the fiscal quarter after the four year anniversary of the applicable closing date of each fund interest. As of December 31, 2014, our share of the Deferred Amount was $286 million. |
| |
| (8) | Includes the deferred purchase price for PE Investment II and PE Investment III. |
| |
| (9) | On August 19, 2014, we, through a subsidiary, entered into a joint venture with a third party to source and invest in real estate private equity funds, or PE Investment VIII. As of December 31, 2014, PE Investment VIII has not made any investments. |
| |
| (10) | Includes 14 funds and eight general partners held across multiple PE Investments. |
|
| | | | | | | | | | | | | | | | | | | | |
| | | Our Proportionate Share of PE Investments |
| | | Income | | Return of Capital | | Total Distributions (2) | | Contributions | | Net |
| PE Investment I | | | | | | | | | | |
| Year ended December 31, 2014 | | $ | 55.6 |
| | $ | 41.6 |
| | $ | 97.2 |
| | $ | 1.1 |
| | $ | 96.1 |
|
February 15, 2013 to December 31, 2014 (1) | | $ | 109.3 |
| | $ | 118.0 |
| | $ | 227.3 |
| | $ | 21.9 |
| | $ | 205.4 |
|
| | | | | | | | | | | |
| PE Investment II | | | | | | | | | | |
| Year ended December 31, 2014 | | $ | 52.6 |
| | $ | 63.3 |
| | $ | 115.9 |
| | $ | 6.0 |
| | $ | 109.9 |
|
July 3, 2013 to December 31, 2014 (1) | | $ | 81.6 |
| | $ | 139.3 |
| | $ | 220.9 |
| | $ | 17.6 |
| | $ | 203.3 |
|
| | | | | | | | | | | |
| Other PE Investments | | | | | | | | | | |
| Year ended December 31, 2014 | | $ | 25.8 |
| | $ | 100.8 |
| | $ | 126.6 |
| | $ | 6.7 |
| | $ | 119.9 |
|
Various to December 31, 2014 (1) | | $ | 25.8 |
| | $ | 109.7 |
| | $ | 135.5 |
| | $ | 6.9 |
| | $ | 128.6 |
|
| |
| (1) | Represents activity from the respective initial closing date through December 31, 2014. |
| |
| (2) | Net of a $21 million reserve for taxes in the aggregate for all PE Investments. |
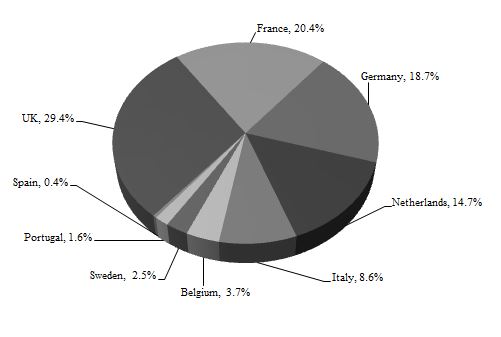
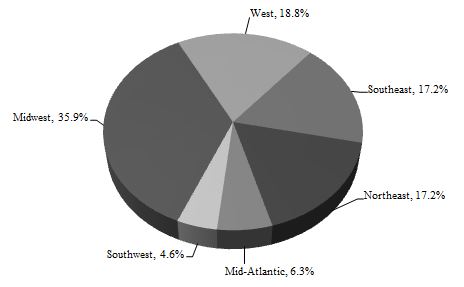
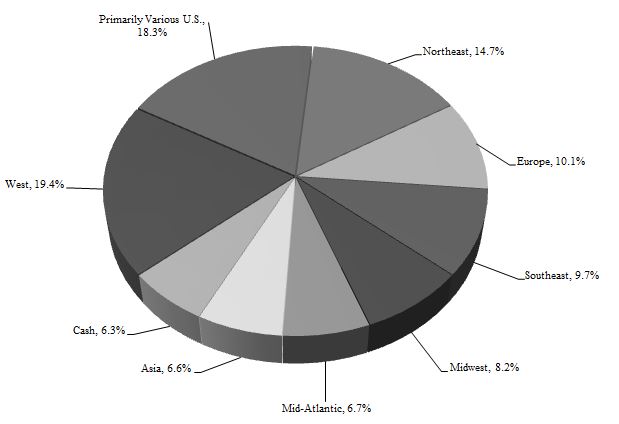
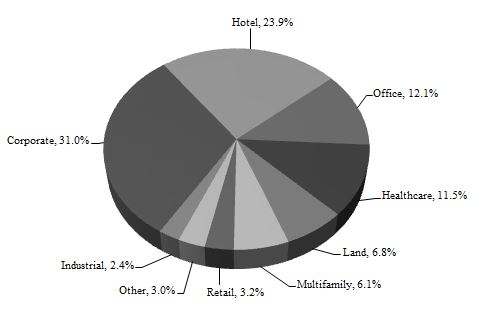
The following presents the underlying fund interests in our PE Investments by investment type and geographic location based on NAV as of September 30, 2014:
|
| | |
PE Investments by Underlying Investment Type(1) | | PE Investments by Underlying Geographic Location(1) |
| | |
____________________________________________________________
| |
| (1) | Based on individual fund financial statements. |
Corporate Investments
RXR Realty
In December 2013, we entered into a strategic transaction with RXR Realty, a leading real estate owner, developer and investment management company focused on high-quality real estate investments in the New York Tri-State area. The investment includes an approximate 30% equity interest in RXR Realty, representing $90 million as of December 31, 2014.
Aerium
In June 2014, we acquired a 15% interest in Aerium, a pan-European real estate investment manager specializing in commercial real estate properties, headquartered in Luxembourg with additional offices in London, Paris, Istanbul, Geneva, Düsseldorf and Bahrain. As of December 31, 2014, Aerium managed approximately €6.1 billion of real estate assets across 12 countries and employed over 200 professionals, some of whom provide services to NSAM.
Legacy Commercial
In September 2014, we entered into a debt and equity investment with Legacy Commercial, comprised of a 40% interest in the common equity of certain entities affiliated with Legacy Commercial. Legacy Commercial is a leading real estate investment manager, owner and operator with a portfolio of commercial assets focused in key markets in the western United States.
Commercial Real Estate Debt
Overview
Our CRE debt investment strategy is focused on originating, acquiring and asset managing CRE debt investments, including first mortgage loans, subordinate mortgage and mezzanine loans and participations in such loans and preferred equity interests.
We emphasize direct origination of our debt investments as this allows us a greater degree of control over how they are underwritten and structured and it provides us the opportunity to syndicate senior or subordinate interests in the loan to maximize returns, if desired. Further, it facilitates a more direct relationship with our borrowers which helps us maintain a robust pipeline, provides an opportunity for us to earn origination and other fees and offers us an important advantage when considering any potential future modifications or restructurings.
We believe the supply/demand imbalance driven by the large amount of maturing CRE loans creates an opportunity for us. Even with some increased supply by lenders, demand for debt capital is allowing investors with capital and real estate expertise, such as us, the opportunity to make investments with attractive risk/return profiles.
We believe we have built a franchise with a reputation for providing capital to high-quality real estate owners who want a responsive and flexible balance sheet lender. Given that we are a lender who generally retains control of the loans we originate, we are able to maintain flexibility in how we structure loans to meet the needs of our borrowers. Typical CMBS and other capital markets driven lenders generally cannot provide these types of loans due to constraints within their funding structures and because of their requirement to sell the entire loan to third parties and relinquish all control. Even when we finance our investments through securitizations, we maintain a significant capital investment in our loans. Our centralized investment organization has enabled senior management to review potential new loans early in the origination process which, unlike many large institutional lenders with several levels of approval required to commit to a loan, allows us to respond quickly and provide a high degree of certainty to our borrowers that we would close a loan on terms substantially similar to those initially proposed. We believe that this level of service has enhanced our reputation in the marketplace. In addition, we believe the early and active role of senior management in our portfolio management process has been key to maximizing recoveries of invested capital from our investments and our ability to be responsive to changing market conditions.
Our Portfolio
As of December 31, 2014, $1.1 billion, or 6.2%, of assets were invested in CRE debt, excluding CRE debt financed in consolidated N-Star CDOs and other CRE debt accounted for as joint ventures, consisting of 37 loans with an average investment size of $31 million and weighted average extended maturity of 5.0 years. We directly originated approximately 96% of our current portfolio of CRE debt investments (excluding debt investments purchased in connection with Griffin-American). The following table presents a summary of our CRE debt investments as of December 31, 2014 (dollars in thousands):
|
| | | | | | | | | | | | | | | | | | | | | | | | | | |
| | | | | | | | | | | Weighted Average(4) | | Floating Rate
as % of
Principal Amount(4) |
| | Number(2) | | Principal Amount | | Carrying Value | | Allocation by Investment Type(3) | | Fixed Rate | | Spread Over LIBOR | | Yield | |
| Asset Type: | | | | | | | |
|
| | | | | | | | |
| First mortgage loans | 13 |
| | | $ | 434,671 |
| | $ | 313,590 |
| | 37.9 | % | | 9.51 | % | | 6.66 | % | | 9.34 | % | | 57.2 | % |
| Mezzanine loans | 8 |
| | | 149,816 |
| | 146,088 |
| | 13.2 | % | | 13.79 | % | | 13.83 | % | | 14.05 | % | | 53.3 | % |
| Subordinate interests | 8 |
| | | 201,564 |
| | 200,237 |
| | 17.6 | % | | 13.11 | % | | 12.33 | % | | 13.01 | % | | 40.7 | % |
Corporate loans(1) | 8 |
| | | 360,343 |
| | 382,427 |
| | 31.3 | % | | 12.37 | % | | — |
| | 12.99 | % | | — |
|
| Total/Weighted average | 37 |
| | | $ | 1,146,394 |
| | $ | 1,042,342 |
| | 100.0 | % | | 11.89 | % | | 9.15 | % | | 12.00 | % | | 35.6 | % |
____________________________________________________________
| |
| (1) | Includes four revolving loans, of which $61 million is outstanding as of December 31, 2014. |
| |
| (2) | Excludes amounts related to joint ventures and CRE debt underlying our CDOs. |
| |
| (3) | Based on principal amount. |
| |
| (4) | Excludes three CRE debt investments with an aggregate principal amount of $11 million that were originated prior to 2008. |
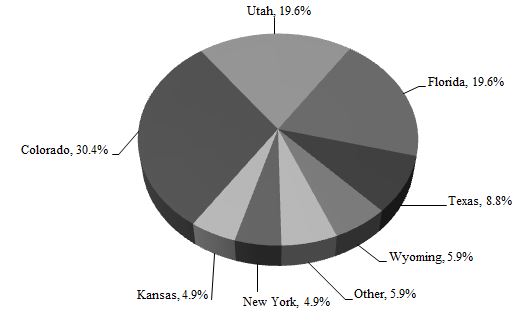
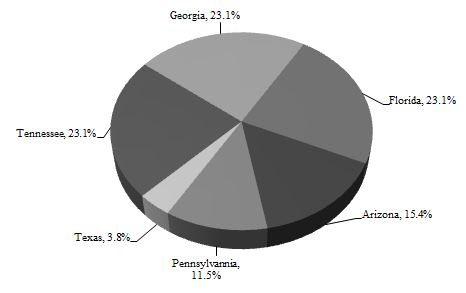
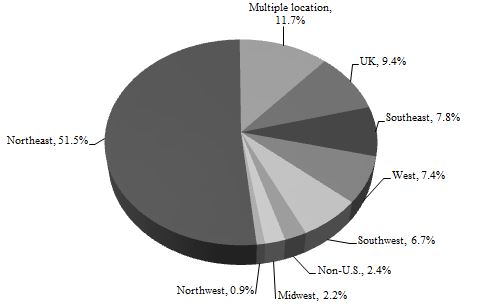
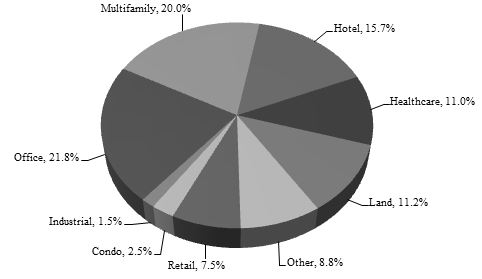
The following presents our $1.1 billion CRE debt portfolio’s diversity across property type and geographic location based on principal amount.
|
| | |
| Debt Investments by Property Type | | Debt Investments by Geographic Location |
| | |
CRE Securities
We historically originated or acquired CRE debt and securities investments that were predominately financed through permanent, non-recourse CDOs. We sponsored nine CDOs, three of which were primarily collateralized by CRE debt and six of which were primarily collateralized by CRE securities. In addition, we acquired the equity interests of two CRE debt focused CDOs, the CSE CDO and the CapLease CDO. We refer to those CRE debt and securities investments that serve as collateral for N-Star CDO financing transactions as legacy CRE debt and securities, respectively. At the time of issuance of the N-Star CDOs, we retained the below investment grade bonds, which are referred to as subordinate bonds, and preferred shares and equity notes, which are referred to as equity interests. In addition, since the initial issuance of the N-Star CDOs, we repurchased CDO bonds originally issued to third parties at discounts to par. These repurchased CDO bonds and retained subordinate bonds are herein collectively referred to as N-Star CDO bonds. We own the equity interests in all of our N-Star CDO financing transactions whether or not we consolidate these transactions on our balance sheet. Substantially all of our N-Star CDO equity is invested in our CRE debt CDOs. In fact, our CRE debt CDOs have distributed regular cash flow since their inception. We do not, however, own undivided interests in any of the assets within our N-Star CDOs and all senior and junior bondholders of the CDOs have economic interests that are senior to our equity interests.
We historically consolidated these CDO financing transactions under accounting principles generally accepted in the United States, or U.S. GAAP. Our legacy CDO business is winding down, resulting in liquidation and deconsolidation of certain of our N-Star CDOs. Repurchased N-Star CDO bonds that are consolidated are not presented as an investment but rather are eliminated in our consolidated financial statements and, as a result, the interest and realization of any discount will generally not be recorded as income in our consolidated statements of operations under U.S. GAAP. All of our CRE debt CDOs were deconsolidated in 2013 and currently only N-Star securities CDOs I and IX continue to be consolidated. All N-Star CDOs are past their reinvestment period and given the nature of these transactions, these CDOs are amortizing over time as the underlying assets paydown or are sold.
Our CRE securities portfolio is predominately comprised of N-Star CDO bonds and N-Star CDO equity of our deconsolidated N-Star CDOs and includes other securities, mostly conduit CMBS, meaning each asset is a pool backed by a large number of commercial real estate loans. We also invest in opportunistic CRE securities such as an investment in a “B-piece” CMBS.
The following table presents our interest in the N-Star CDOs as of December 31, 2014 (dollars in thousands):
|
| | | | | |
| | Number | | Amount(1) |
N-Star CDO bonds(2)(3) | | | |
| AAA | 2 | | $ | 74,500 |
|
| AA through BBB | 29 | | 334,938 |
|
| Below investment grade | 10 | | 160,447 |
|
| | 41 | | 569,885 |
|
N-Star CDO equity(4) | 5 | | 137,143 |
|
| Total | 46 | | $ | 707,028 |
|
_______________________________________________________
| |
| (1) | Based on principal amount for N-Star CDO bonds and amortized cost for N-Star CDO equity. There is no assurance we will receive the maximum amount of principal proceeds. |
| |
| (2) | Based on original credit rating. Includes nine N-Star CDO bonds with a principal amount of $108 million related to our securities CDOs that are eliminated in consolidation. |
| |
| (3) | Unencumbered N-Star CDO bonds are owned by us, of which $421 million of principal amount were repurchased at a discount to par at a weighted average original credit rating of A / A2 and a weighted average purchase price of 33%. |
| |
| (4) | Represents our equity interests in the deconsolidated CRE debt N-Star CDOs. |
The following table presents a summary of our deconsolidated N-Star CRE debt CDOs as of December 31, 2014 (dollars in thousands):
|
| | | | | | | | | | | | | | | | | | | | | | | |
| Issue/Acquisition Date | N-Star IV Jun-05 | | N-Star VI Mar-06 | | N-Star VIII Dec-06 | | CapLease Aug-11 | | CSE Jul-10 | | Total |
Balance sheet as of December 31, 2014(1) | | | | | | | | | | | |
| Assets, principal amount | $ | 240,018 |
| | $ | 348,706 |
| | $ | 808,338 |
| | $ | 134,611 |
| | $ | 594,038 |
| | $ | 2,125,711 |
|
CDO bonds, principal amount(2) | 128,120 |
| | 280,137 |
| | 627,749 |
| | 120,516 |
| | 532,203 |
| | 1,688,725 |
|
| Net assets | $ | 111,898 |
| | $ | 68,569 |
| | $ | 180,589 |
| | $ | 14,095 |
| | $ | 61,835 |
| | $ | 436,986 |
|
| | | | | | | | | | | | |
CDO quarterly cash distributions and coverage tests(3) | | | | | | | | | | | |
| Equity notes and subordinate bonds | $ | 434 |
| | $ | 2,847 |
| | $ | 4,032 |
| | $ | 665 |
| | $ | 5,398 |
| | $ | 13,376 |
|
| Collateral management and other fees | 169 |
| | 335 |
| | 725 |
| | 36 |
| | 302 |
| | 1,567 |
|
Interest coverage cushion (IC)(1) | 148 |
| | 1,174 |
| | 3,574 |
| | 411 |
| | 3,903 |
| | |
|
Overcollateralization cushion (OC)(1) | 60,767 |
| | 35,471 |
| | 104,566 |
| | 9,412 |
| | 85,047 |
| | |
|
| At offering | 19,808 |
| | 17,412 |
| | 42,193 |
| | 5,987 |
| (4) | (151,595 | ) | (5) | |
| |
| (1) | Based on remittance report issued on date nearest to December 31, 2014. |
| |
| (2) | Includes all outstanding CDO bonds payable to third parties and all CDO bonds owned by us. |
| |
| (3) | IC and OC coverage to the most constrained class. |
| |
| (4) | Based on trustee report as of August 31, 2011, closest to the date of acquisition. |
| |
| (5) | Based on trustee report as of June 24, 2010, closest to the date of acquisition. |
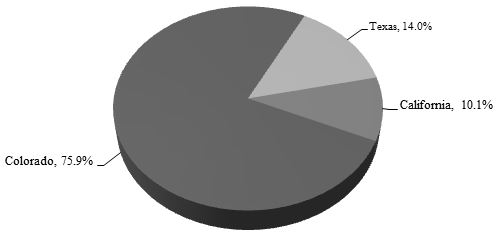
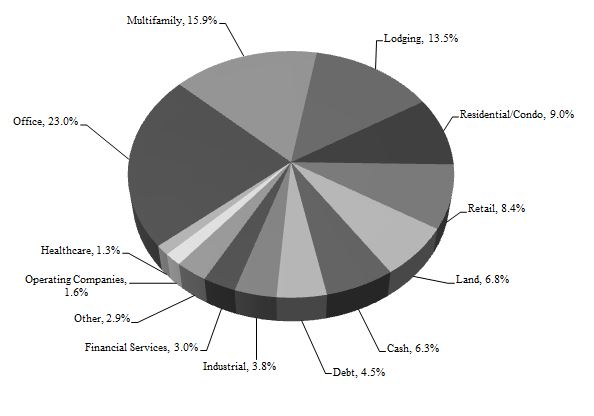
The following presents the diversity across property type and geographic location of all CRE debt in N-Star CDOs based on principal amount:
|
| | |
| CRE Debt in N-Star CDOs by Property Type | | CRE Debt in N-Star CDOs by Geographic Location |
| | |
Financing Strategy
We seek to access a wide range of secured and unsecured debt and public and private equity capital sources to fund our investment activities and asset growth.
We predominantly use investment-level financing as part of our strategy to prudently leverage our investments and deliver attractive risk-adjusted returns to our stockholders. We pursue a variety of financing arrangements such as mortgage notes from the CMBS market, government-sponsored agencies, finance companies and European banks and securitization financing transactions. In addition, we use corporate-level financing such as credit facilities and other term borrowings. We generally seek to limit our reliance on recourse borrowings. Borrowing levels for our CRE investments may be dependent upon the nature of the assets and the related financing that is available.
The current availability of attractive long-term, non-recourse, non mark-to-market assignable financing through the CMBS and agency financing markets has bolstered opportunities to acquire real estate. For longer duration, stable investment cash flow such as those derived from net lease assets, we tend to use fixed rate financing. For investment cash flow with greater growth potential such as hotels and healthcare under a RIDEA structure, we tend to use floating rate financing which provides prepayment flexibility and may provide a better match between underlying cash flow and potential increases in interest rates.
Our financing strategy for debt investments is to obtain match-funded borrowing at rates that provide a positive net spread. In late 2011, we began using secured term credit facilities provided by major financial institutions to partially finance CRE debt, which currently provide for an aggregate of up to $240 million. Then, in November 2012 and August 2013, we, and on behalf of NorthStar Income, entered into securitized financing transactions to provide permanent, non-recourse, non-mark-to-market financing for newly-originated CRE debt investments. We will continue to seek to use the capital markets to finance our debt investments. As of December 31, 2014, we had $42 million issued as part of Securitization 2012-1 and $93 million outstanding with $147 million available borrowing under our loan facilities.
With respect to corporate-level financing, in August 2014, we entered into a corporate revolving credit facility with certain commercial bank lenders, with a total commitment amount of $500 million for a three-year term. In September 2014, we entered into a corporate term facility with a commercial bank lender with respect to the establishment of term borrowings with an aggregate principal amount of up to $500 million. As of February 24, 2015, $305 million of financing remains undrawn under our corporate revolving credit facility and $75 million of financing remains undrawn under our corporate term credit facility, subject to entering into additional term loans under such facility.
Historically, we used CDOs to finance legacy CRE debt and securities investments. Our legacy CDO business is winding down as we invest in a broader, more diverse range of CRE assets. As a result, such legacy business is a significantly smaller portion of our business today than in the past.
Portfolio Management
Subsequent to the spin-off, NSAM performs portfolio management on our behalf. The comprehensive portfolio management process generally includes day-to-day oversight by the portfolio management and servicing team, regular management meetings and an exhaustive quarterly credit review process. These processes are designed to enable management to evaluate and proactively identify asset-specific credit issues and trends on a portfolio-wide basis. Nevertheless, we cannot be certain that such review will identify all issues within our portfolio due to, among other things, adverse economic conditions or events adversely affecting specific assets; therefore, potential future losses may also stem from investments that are not identified during these credit reviews. The portfolio management team, under the direction of the Investment Committee, uses many methods to actively manage our asset base to preserve our income and capital. Credit risk management is the ability to manage our assets in a manner that preserves principal/cost and income and minimizes credit losses that could decrease income and portfolio value. For CRE equity and debt investments, frequent re-underwriting and dialogue with borrowers/tenants/operators/partners and regular inspections of our collateral and owned properties have proven to be an effective process for identifying issues early. With respect to our healthcare properties, we consider the impact of regulatory changes on operator performance and property values. During the quarterly credit review, or more frequently as necessary, investments are put on highly-monitored status and identified for possible asset impairment/loan loss reserves, as appropriate, based upon several factors, including missed or late contractual payments, significant declines in collateral performance and other data which may indicate a potential issue in our ability to recover our invested capital from an investment. The portfolio management process related to CRE debt and securities underlying our deconsolidated CDOs is limited to monitoring the CDO bonds and equity interests in such CDO financing transactions.
Regulation
We are subject, in certain circumstances, to supervision and regulation by state, federal and international governmental authorities and are subject to various laws and judicial and administrative decisions imposing various requirements and restrictions, which, among other things:
| |
| • | regulate our public disclosures, reporting obligations and capital raising activity; |
| |
| • | require compliance with applicable REIT rules; |
| |
| • | regulate credit granting activities; |
| |
| • | require disclosures to customers; |
| |
| • | govern secured transactions; |
| |
| • | set collection, taking title to collateral, repossession and claims-handling procedures and other trade practices; |
| |
| • | regulate land use and zoning; |
| |
| • | regulate the foreign ownership or management of real property or mortgages; |
| |
| • | regulate the ability of foreign persons or corporations to remove profits earned from activities within the country to the person’s or corporation’s country of origin; |
| |
| • | regulate tax treatment and accounting standards; and |
| |
| • | regulate use of derivative instruments and our ability to hedge our risks related to fluctuations in interest rates and exchange rates. |
We have elected, qualified and expect to continue to qualify to be taxed as a REIT under Section 856 through 860 of the Internal Revenue Code of 1986, as amended, or the Internal Revenue Code. As a REIT, we must currently distribute, at a minimum, an amount equal to 90% of our taxable income. In addition, we must distribute 100% of our taxable income to avoid paying corporate federal income taxes. REITs are also subject to a number of organizational and operational requirements in order to elect and maintain REIT status. These requirements include specific share ownership tests and assets and gross income composition tests. If we fail to continue to qualify as a REIT in any taxable year, we will be subject to federal income tax (including any applicable alternative minimum tax) on our taxable income at regular corporate tax rates. Even if we qualify for taxation as a REIT, we may be subject to state and local income taxes and to federal income tax and excise tax on our undistributed income. In addition, we have healthcare and hotels owned through structures permitted by RIDEA, where we participate directly in the operational cash flow of a property.
We believe that we are not, and intend to conduct our operations so as not to become regulated as, an investment company under the Investment Company Act of 1940, as amended, or the Investment Company Act. We have relied, and intend to continue to rely on current interpretations of the staff of the Securities and Exchange Commission, or SEC, in an effort to continue to qualify for an exemption from registration under the Investment Company Act. For more information on the exemptions that we use refer to Item 1A. “Risk Factors - Maintenance of our Investment Company Act exemption imposes limits on our operations.”
Real estate properties owned by us and the operations of such properties are subject to various international, federal, state and local laws and regulations concerning the protection of the environment, including air and water quality, hazardous or toxic substances and health and safety. In addition, such properties are required to comply with the Americans with Disabilities Act of 1990, or the ADA, the Fair Housing Act, applicable fire and safety regulations, building codes and other land use regulations. For further information regarding environmental matters and the ADA, refer to “Environmental Matters” and “ADA” below.
We also own and manage healthcare properties. As such, we or our operators, as the case may be, are subject to numerous international, federal, state and local healthcare laws and regulations that are subject to frequent and substantial changes (sometimes applied retroactively) resulting from legislation, adoption of rules and regulations and administrative and judicial interpretations of existing laws. Refer to “Healthcare Regulation” below.
In addition, we own hotels, which are subject to various covenants, laws, ordinances and regulations, including regulations relating to common areas. We believe each of our hotels has the necessary permits and approvals to operate its business.
We are also subject to regulation governing mortgage lending. Although most states do not regulate commercial real estate finance, certain states impose limitations on interest rates and other charges and on certain collection practices and creditor remedies and require licensing of lenders and financiers and adequate disclosure of certain contract terms. We are also required to comply with certain provisions of the Equal Credit Opportunity Act that are applicable to CRE loans.
We are also subject to regulation with respect to certain of our loan servicing activities, such as Regulation AB, which requires certain disclosures regarding our servicing activities and compliance with servicing criteria and also requires that we deliver compliance statements.
In the judgment of management, while we do incur significant expense complying with the various regulations to which we are subject, existing statutes and regulations have not had a material adverse effect on our business. However, it is not possible to forecast the nature of future legislation, regulations, judicial decisions, orders or interpretations, nor their impact upon our future business, financial condition, results of operations or prospects.
Environmental Matters
A wide variety of federal, state and local environmental and occupational health and safety laws and regulations affect our properties. These complex federal and state statutes, and their enforcement, involve a myriad of regulations, many of which involve strict liability on the part of the potential offender. Some of these federal and state statutes may directly impact us. Under various federal, state and local environmental laws, ordinances and regulations, an owner of real property or a secured lender, such as us, may be liable for the costs of removal or remediation of hazardous or toxic substances at, under or disposed of in connection with such property, as well as other potential costs relating to hazardous or toxic substances (including government fines and damages for injuries to persons and adjacent property). The cost of any required remediation, removal, fines or personal or property damages and the owner's or secured lender's liability therefore could exceed or impair the value of the property, and/or the assets of the owner or secured lender. In addition, the presence of such substances, or the failure to properly dispose of or remediate such substances, may adversely affect the owner's ability to sell or rent such property or to borrow using such property as collateral which, in turn, could reduce our revenues.
ADA
Our properties must comply with the ADA and any similar state or local laws to the extent that such properties are “public accommodations” as defined in those statutes. The ADA may require removal of barriers to access by persons with disabilities in certain public areas of our properties where such removal is readily achievable. To date, we have not received any notices of noncompliance with the ADA that have caused us to incur substantial capital expenditures to address ADA concerns. Should barriers to access by persons with disabilities be discovered at any of our properties, we may be directly or indirectly responsible for additional costs that may be required to make facilities ADA-compliant. Noncompliance with the ADA could result in the imposition of fines or an award of damages to private litigants. The obligation to make readily achievable accommodations pursuant to the ADA is an ongoing one and we continue to assess our properties and make modifications as appropriate in this respect.
Healthcare Regulation
Overview
Assisted living, memory care, independent living, hospitals, skilled nursing facilities and other healthcare providers that operate healthcare properties in our portfolio are subject to extensive federal, state and local laws, regulations and industry standards governing their operations. Failure to comply with any of these, and other, laws could result in loss of licensure; loss of certification or accreditation; denial of reimbursement; imposition of fines; suspension or exclusion from federal and state healthcare programs; or closure of the facility. Although the properties within our portfolio may be subject to varying levels of governmental scrutiny, we expect that the healthcare industry, in general, will continue to face increased regulation and pressure in the areas of fraud and abuse, cost control and management of the provision of services, among others. We also expect that efforts by third-party payors, such as the federal Medicare program, state Medicaid programs and private insurers, to impose greater and more stringent cost controls upon operators will intensify and continue. Changes in laws, regulations, reimbursement, and enforcement activity can all have a significant effect on the operations and financial condition of our tenants, managers and operators, which in turn may adversely impact us, as set forth below and under Item 1A. “Risk Factors” in this report.
Fraud and Abuse Enforcement
Healthcare providers, including, but not limited to skilled nursing facilities and hospitals (and some senior housing facilities), are subject to federal and state laws and regulations that govern the operations and financial and other arrangements that may be entered into by healthcare providers, and prohibiting fraudulent and abusive practices by such providers. These laws include: (i) laws requiring providers to furnish only medically necessary services and submit to the government valid and accurate statements for each service; (ii) state anti-kickback laws and the Federal Anti-Kickback Statute, which generally prohibit persons from offering, providing, soliciting, or receiving remuneration to induce either the referral of an individual or the furnishing of a good or service for which payment may be made under a government healthcare program, such as Medicare or Medicaid; (iii) the federal physician self-referral law (commonly known as the Stark Law), which generally prohibits the submission of claims to Medicare for payment that were the result of a referral by a physician who has a financial relationship with the health service provider and analogous state laws; and (iv) the Civil Monetary Penalties Act and the Federal False
Claims Act including its “whistleblower” provisions, which prohibits, among other things, the knowing presentation of a false or fraudulent claim for certain healthcare services. Additionally, certain laws, including HIPAA and the Health Reform Laws (both defined and discussed further below) have broadened the federal fraud and abuse laws to enhance both the scope (e.g. private payers) and the penalties for non-compliance with the laws.
Enforcement of healthcare fraud has increased due in large part to amendments to the Federal False Claims Act that encourages private individuals to sue on behalf of the government. Sanctions for violations of these laws, regulations, and other applicable guidance may include, but are not limited to, criminal and/or civil penalties and fines, loss of licensure, immediate termination of government payments and exclusion from government healthcare programs, any of which could have a material adverse effect on the ability of an operator to meet its financial obligations to us.
Reimbursement
Federal, state and private managed care payor reimbursement methodologies applied to healthcare providers continue to evolve. Federal and state authorities have considered and may seek to implement new or modified reimbursement methodologies that may negatively impact healthcare property operations. The impact of any such changes, if implemented, may result in a material adverse effect on our healthcare property operations.
Skilled Nursing Facilities and Hospitals. Skilled nursing facilities and hospitals typically receive most of their revenues from the Medicare and Medicaid programs, with the balance representing reimbursement payments from private managed care payors, including private insurers and self-pay patients. Skilled nursing facilities and hospitals are subject to periodic pre- and post-payment reviews, and other audits by federal and state authorities. A review or audit of a property operator’s claims could result in recoupments, denials or delay of payments in the future, each of which could have a significant negative consequence.
Medicare Reimbursement. Medicare, a federal program, is a significant payor source for our skilled nursing facilities and hospitals. Skilled nursing facilities are reimbursed under the Medicare Skilled Nursing Facility Prospective Payment System, or SNF PPS. Hospitals are reimbursed by Medicare under prospective payment systems which vary based upon the type of hospital, geographic location and service furnished. For skilled nursing facilities and hospitals, there are risks that costs will exceed the fixed payments, and payments will be insufficient as compared to actual costs of delivering care, which could result in financial difficulties for the facilities. Recent attention on billing practices and payments and/or ongoing government pressure to reduce spending by government healthcare programs, could result in lower payments to skilled nursing facilities and/or hospitals and, as a result, may impair an operator’s ability to meet its financial obligations to us.
Medicaid Reimbursement. Medicaid is also a significant payor source for our skilled nursing facilities and hospitals. The federal and state governments share responsibility for financing Medicaid. The percentage of Medicaid dollars used for long-term care varies from state to state, due in part to different ratios of elderly population and eligibility requirements. Within certain federal guidelines, states have a fairly wide range of discretion to determine eligibility and reimbursement methodology. Many states reimburse long-term care facilities using fixed daily rates, which are applied prospectively based on patient acuity and the historical costs incurred in providing patient care. Certain states are attempting to slow the rate of growth in Medicaid expenditures by freezing rates or restricting eligibility and benefits. In addition, federal budgetary proposals could have lower federal spending for Medicaid, potentially impacting provider Medicaid reimbursement rates. Finally, certain states have elected not to expand their Medicaid eligibility criteria pursuant to recent healthcare reform laws, as described further below. In these states, there may be fewer individuals receiving insurance through state Medicaid programs and healthcare providers may continue to have a population of uninsured patients that require treatment. Other states that have opted to expand Medicaid may later choose to discontinue or modify that expansion. Reductions in Medicaid reimbursement rates or patient eligibility could materially affect revenues of our facilities.
Senior Housing Facilities (assisted living, independent living and memory care facilities, excluding skilled nursing facilities). While the majority of revenues received by the operators of our senior housing facilities are from private pay sources, a small portion of their revenue is received from Medicaid reimbursement. There can be no guarantee that a state Medicaid program will continue to reimburse for services at current levels or continue to be available to our residents. Rates generated at facilities will vary by payor mix, market conditions and resident acuity. Rates paid by self-pay residents are set by the facilities and are determined by local market conditions and operating costs.
Licensure, Certification and CON
Hospitals, skilled nursing, senior housing facilities and other healthcare providers that operate healthcare properties in our portfolio are subject to extensive state licensing and registration laws. The failure of our operators and tenants to maintain or renew any required license, certification, accreditation or regulatory approval could prevent a facility from operating in the manner intended by the operators or tenants.
Certain of our healthcare facilities are subject to a variety of state certificate of need, or CON, laws and regulations, which may restrict the ability of operators to add new properties or expand an existing facility’s size or services. In addition, CON laws may constrain the ability of an operator to transfer responsibility for operating a particular facility to a new operator.
Healthcare Reform
The Patient Protection and Affordable Care Act of 2010, or PPCA, and the Healthcare and Education Reconciliation Act of 2010, which amends PPCA, collectively, the Health Reform Laws, and certain follow-on laws (e.g., the Improving Medicare Post-Acute Transformation, or IMPACT, Act of 2014) serve as the primary vehicle for comprehensive healthcare reform in the United States and are becoming effective through a phased approach, which began in 2010 and will conclude in 2018. The laws are intended to reduce the number of individuals in the United States without health insurance and significantly change the means by which healthcare is organized delivered and reimbursed. Healthcare reform legislation includes: (i) program integrity provisions that both create new authorities and expand existing authorities for federal and state governments to address fraud, waste and abuse in federal health programs; (ii) expanded reporting requirements and responsibilities related to property ownership and management, patient safety and care quality; and (iii) new initiatives to strengthen post-acute care services and promote relationships between acute and post-acute care providers. The inability or failure to comply with these reform laws could impact the ability of our operators to participate in federal health programs, causing revenues to decline and ultimately impact their ability to meet their financial obligations to us.
Information Privacy and Security
Healthcare providers are subject to a myriad of state and federal laws which protect the privacy and security of information. The Health Insurance Portability and Accountability Act of 1996, or HIPAA, provides for communication of health information through standard electronic transaction formats and for the privacy and security of health information. Operators also may face significant financial exposure if they fail to maintain the privacy and security of medical records and other personal health information about individuals. The Health Information Technology for Economic and Clinical Health, or HITECH Act, strengthened the HHS Secretary’s authority to impose civil monetary penalties for HIPAA violations.
For additional information regarding regulations applicable to us, refer to Item 1A. “Risk Factors.”
Competition
We are subject to increased competition in seeking CRE investments. We compete with many third parties engaged in real estate investment activities including publicly-traded REITs, non-traded REITs, insurance companies, commercial and investment banking firms, private equity funds and other investors. Some of these competitors, including other REITs and private real estate companies and funds, have substantially greater financial resources than we do. Such competitors may also enjoy significant competitive advantages that result from, among other things, a lower cost of capital and enhanced operating efficiencies.
Future competition from new market entrants may limit the number of suitable investment opportunities offered to us. It may also result in higher prices, lower yields and a narrower spread over our borrowing costs, making it more difficult for us to originate or acquire new investments on attractive terms.
Employees
As of December 31, 2014, we had 24 co-employees with NSAM. Most of our employees at the time of the spin-off became employees of NSAM and executive officers, employees engaged in our loan origination business at the time of the spin-off and certain other employees became co-employees of both us and NSAM. As of December 31, 2014, NSAM had 202 employees, domestic and internationally.
Corporate Governance and Internet Address
We emphasize the importance of professional business conduct and ethics through our corporate governance initiatives. Our board of directors consists of a majority of independent directors; the audit, nominating and corporate governance and compensation committees of our board of directors are composed exclusively of independent directors. We have adopted corporate governance guidelines and a code of business conduct and ethics, which delineate our standards for our officers, directors and employees.
Our internet address is www.nrfc.com. The information on our website is not incorporated by reference in this Annual Report on Form 10-K. We make available, free of charge through a link on our website, our annual reports on Form 10-K, quarterly reports on Form 10-Q, current reports on Form 8-K, and amendments to such reports, if any, as filed or furnished with the SEC, as soon as reasonably practicable after such filing or furnishing. We also post corporate presentations on our website from time-to-time. Our website further contains our code of business conduct and ethics, code of ethics for senior financial officers, corporate governance guidelines and the charters of our audit committee, nominating and corporate governance committee and compensation committee of our board of directors. Within the time period required by the rules of the SEC and the NYSE we will post on our website any amendment to our code of business conduct and ethics and our code of ethics for senior financial officers as defined in the code.
Item 1A. Risk Factors
The following risk factors and other information included in this Annual Report on Form 10-K should be carefully considered. The risks and uncertainties described below are not the only ones we face. Additional risks and uncertainties not presently known to us, that we currently deem immaterial or that generally apply to all businesses also may adversely impact our business. If any of the following risks occur, our business, financial condition, operating results, cash flow and liquidity could be materially adversely affected.
Risks Related to Our Business
The CRE industry has been and may continue to be adversely affected by economic conditions in the U.S. and global financial markets generally.
Our business and operations are dependent on the CRE industry generally, which in turn is dependent upon broad economic conditions in the United States, Europe and elsewhere. Despite improvements in the U.S. economy, significant challenges still remain due to the uncertainty surrounding a low inflation rate in the United States, a stronger U.S. dollar, slow global growth and international market volatility. Global economic and political headwinds, along with global market instability and the risk of maturing commercial real estate debt that may have difficulties being refinanced, may continue to cause periodic volatility in the CRE market for some time. Adverse conditions in the CRE industry could harm our business and financial condition by, among other factors, reducing the value of our existing assets, limiting our access to debt and equity capital, harming our ability to originate new CRE investments and otherwise negatively impacting our operations.
Challenging economic and financial market conditions could significantly reduce the amount of income we earn on our CRE investments and further reduce the value of our investments.
Challenging economic and financial market conditions may cause us to experience an increase in the number of CRE investments that result in losses, including delinquencies, non-performing assets and taking title to collateral and a decrease in the value of the property or other collateral which secures our investments, all of which could adversely affect our results of operations. We may incur substantial losses and need to establish significant provision for losses or impairment. Our revenue from our properties could diminish significantly.
Risks Related to our Manager
Our ability to achieve our investment objectives and to pay distributions depends in substantial part upon the performance of our manager.
We rely upon NSAM to manage our day-to-day operations and our investments. Our ability to achieve our investment objectives and grow our business, other than our CRE debt origination business, is dependent upon the performance of NSAM in the acquisition of investments, the determination of financing arrangements and the management of our assets and operation of our day-to-day activities under the supervision of, and subject to the policies and guidelines established by, our board of directors. If our manager performs poorly and as a result is unable to originate, acquire and manage our investments successfully, we may be unable to achieve our investment objectives or to pay distributions to stockholders at presently contemplated levels, if at all.
Any adverse changes in NSAM’s financial health, the public perception of NSAM or our relationship with NSAM could hinder our operating performance and adversely affect our financial condition and results of operations.
Because NSAM is publicly-traded, any negative reaction by the stock market reflected in its stock price or deterioration in the public perception of NSAM could result in an adverse effect on our ability to acquire assets and obtain financing from third parties on favorable terms or at all. In addition, NSAM depends upon the management and other fees and reimbursement of costs that it receives from us and NSAM’s other managed companies, including the NSAM Sponsored Companies, in connection with the acquisition, management and sale of assets to conduct its operations. Any adverse changes in the financial condition of NSAM, or our relationship with NSAM, could hinder NSAM’s ability to successfully support our business and growth, which could have a material adverse effect on our financial condition and results of operations.
NSAM’s platform may not be as scalable as we anticipate and we could face difficulties growing our business without significant new investment in personnel and infrastructure by NSAM.
While we believe NSAM’s platform for operating our business is highly scalable and can support significant growth in our business without substantial new investment in personnel, expertise and infrastructure on a relative basis, we may be wrong in that assessment. Our business has grown substantially over the course of the past several years, both in volume and in scope as we have invested across diverse areas, including healthcare, manufactured housing communities, hotels, private equity investments, internationally and more. This expansion has placed significant additional demands on management and other personnel, as well as our support infrastructure. For example, our total assets increased $9 billion for the year ended December 31, 2014, with significant expansion in healthcare properties, hotels and international properties. It is possible that if our
business continues to grow substantially or the business of the other companies managed by NSAM, including the NSAM Sponsored Companies, continues to grow, NSAM will need to make significant investments in personnel, infrastructure and expertise to support that growth. NSAM may be unable to make significant investments on a timely basis or at reasonable costs and its failure in this regard could disrupt our business and operations.
Failure of NSAM to effectively perform its obligations under the various agreements entered into with them, including the long-term management agreement and the services agreement, could have an adverse effect on our business and performance.
We engaged NSAM to provide asset management and other services to us pursuant to a long-term management agreement and other ancillary agreements. Our ability to achieve our investment objectives and to make distributions to stockholders will depend in substantial part upon the performance of NSAM and its ability to provide us with asset management and other services. We are also dependent on other third party service providers to whom NSAM may delegate various responsibilities. If for any reason NSAM or any other service provider is unable to perform such services at the level we anticipate, alternate service providers may not be readily available on acceptable terms or at all, which could adversely affect our performance and materially harm our ability to execute our business plan.
In addition, the management agreement with NSAM is only terminable by us for cause. We cannot terminate the management agreement for any other reason, including if NSAM performs poorly or is unable to acquire and manage our investments successfully. The term “cause” is limited to specific circumstances laid out in the management agreement, including NSAM’s breach of the management agreement or gross negligence that has a materially adverse effect on us. Termination for unsatisfactory financial performance does not constitute “cause” under the management agreement. In addition, we are contractually committed to NSAM’s management for an initial term of 20 years beginning June 30, 2014, with automatic renewal terms thereafter. These provisions increase our risk that NSAM may not perform well and our business could suffer. If NSAM’s performance as our manager does not meet our or our stockholders’ expectations, and we are unable to terminate the management agreement, the market price of our common stock could suffer.
Moreover, pursuant to the management agreement, we agreed to provide NSAM with all investment opportunities for the acquisition or origination of CRE debt assets that are presented to our employees or of which any of our employees become aware. NSAM agreed to use commercially reasonable efforts to fairly allocate such investment opportunities among us and its other managed companies, including the NSAM Sponsored Companies, in accordance with an investment allocation policy; however, investment allocations will be determined by NSAM in its sole discretion and there can be no assurance that we will be allocated our fair share of the attractive investment opportunities we source. If NSAM fails to effectively allocate investments to us, we may be unable to achieve our investment objectives, which could have an adverse effect on our business and performance.
Certain fees payable to NSAM are payable regardless of the performance of our portfolio and may fail to appropriately incentivize NSAM when managing our portfolio.
We pay NSAM an annual base management fee regardless of the performance of our portfolio. Consequently, we may be required to pay NSAM significant base management fees in a particular quarter despite experiencing a net loss or a decline in the value of our portfolio during that quarter. This in turn could hurt both our ability to make distributions to our stockholders and the market price of our common stock.
NSAM’s entitlement to compensation regardless of our performance might reduce its incentive to devote its time and effort to seeking assets that provide attractive risk-adjusted returns for our portfolio, particularly if other management agreements to which NSAM is a party have a performance-based fee structure. In addition, NSAM has the ability to earn incentive fees each quarter based on our cash available for distribution, or CAD, which may create an incentive for NSAM to invest in assets with higher yield potential, which are generally riskier or more speculative, or sell an asset prematurely for a gain and pay down borrowings, in an effort to increase our short-term net income and thereby increase the incentive fees to which it is entitled. Furthermore, the compensation payable to NSAM will increase as a result of future issuances of our equity securities, even if the issuances are dilutive to existing stockholders. If our interests and those of NSAM are not aligned, the execution of our business plan and our results of operations could be adversely affected, which could materially and adversely affect our ability to make distributions to our stockholders and the market price of our common stock.
The fees we pay to NSAM in connection with the origination, acquisition and management of our investments pursuant to the management agreement were not determined on an arm’s length basis; therefore, we do not have the benefit of arm’s length negotiations of the type normally conducted between unrelated parties.
The fees we pay to NSAM for services it provides for us pursuant to the management agreement were negotiated when we still owned NSAM and thus not determined on an arm’s length basis. As a result, the fees were determined without the benefit of arm’s length negotiations of the type normally conducted between unrelated parties and may be in excess of amounts that we
would otherwise pay to third parties for such services; however, the final terms of the management agreement were approved by our board of directors, including a majority of the independent members thereof.
In addition to the management fees we pay to our manager, we reimburse our manager for costs and expenses incurred on our behalf, including indirect personnel and employment costs of our manager and its affiliates and these costs and expenses may be substantial.
We pay our manager substantial fees for the services it provides to us and we also have an obligation to reimburse our manager for costs and expenses it incurs and pays on our behalf. Subject to certain limitations and exceptions, we reimburse our manager for both direct expenses as well as indirect costs, including personnel and employment costs of our manager. The costs and expenses our manager incurs on our behalf, including the compensatory costs incurred by our manager and its affiliates, can be substantial. There are conflicts of interest that arise when our manager makes allocation determinations. For the year ended 2014, our manager allocated $5 million in costs and expenses to us. Our manager could allocate costs and expenses to us in excess of what we anticipate and such costs and expenses could have an adverse effect on our financial performance and ability to make cash distributions to our stockholders.
There are conflicts of interest in our relationship with NSAM that could result in less attractive investment opportunities and higher fees.
We are subject to conflicts of interest arising out of our relationship with NSAM, its affiliates, managed entities and strategic ventures. In particular, we expect to compete for investment opportunities directly with other companies and/or accounts that NSAM or its strategic or joint venture partners manage, including with respect to origination opportunities that we source and make available to NSAM pursuant to the management agreement. Certain of NSAM’s managed companies, along with companies, funds and vehicles that are subject to a strategic relationship between NSAM and its strategic or joint venture partners (which we refer to collectively as strategic vehicles) have investment mandates and objectives that target the same investments as us. In addition, NSAM may have additional managed companies or strategic vehicles that compete directly with us for investment opportunities in the future. We have adopted an investment allocation policy with NSAM that is intended to ensure that investments are allocated fairly and appropriately among us and the other NSAM managed companies or strategic vehicles over time, but there is no assurance that NSAM will be successful in eliminating the conflicts arising from the allocation of investment opportunities. When determining the entity for which an investment opportunity would be the most suitable, the factors that NSAM may consider include, among other factors, the following:
| |
| • | investment objectives, strategy and criteria; |
| |
| • | cash requirements and amount of funds available; |
| |
| • | effect of the investment on the diversification of the portfolio, including by geography, size of investment, type of investment and risk of investment; |
| |
| • | leverage policy and the availability of financing for the investment by each entity; |
| |
| • | anticipated cash flow of the asset to be acquired; |
| |
| • | income tax effects of the purchase; |
| |
| • | the size of the investment; |
| |
| • | targeted distribution rates; |
| |
| • | anticipated future pipeline of suitable investments; |
| |
| • | the expected holding period of the investment and the remaining term of the NSAM managed company, if applicable; |
| |
| • | affiliate and/or related party considerations; and |
| |
| • | whether a strategic vehicle has received a special allocation (as defined in the investment allocation policy). |
If, after consideration of the relevant factors, NSAM determines that an investment is equally suitable for us and one of its managed companies or strategic vehicles, the investment will be allocated among each of the applicable entities, including us, on a rotating basis. If, after an investment has been allocated to us or another entity, a subsequent event or development, such as delays in structuring or closing on the investment, makes it, in the opinion of NSAM, more appropriate for a different entity to fund the investment, NSAM may determine to place the investment with the more appropriate entity while still giving credit to the original allocation. In certain situations, NSAM may determine to allow more than one investment vehicle, including us, to co-invest in a particular investment.
There is no assurance this policy will remain in place during the entire period we are seeking investment opportunities. In addition, NSAM may sponsor additional managed companies or strategic vehicles in the future and, in connection with the creation of such managed companies or strategic vehicles, may revise these allocation procedures. The result of a revision to the allocation procedures may, among other things, be to increase the number of parties who have the right to participate in investment opportunities sourced by NSAM or us, thereby reducing the number of investment opportunities available to us.
In addition, under this policy, NSAM investment professionals may consider the investment objectives and anticipated pipeline of future investments of its managed companies or strategic vehicles. The decision of how any potential investment should be allocated among us and one of NSAM’s managed companies or strategic vehicles for which such investment may be suitable may, in many cases, be a matter of subjective judgment which will be made by NSAM. Pursuant to the investment allocation policy, NSAM may choose to allocate favorable investments to its other managed companies instead of to us. Our investment allocation policy with NSAM could produce unfavorable results for us that could harm our business.
NSAM also has and may in the future acquire additional interests in third parties, such as management firms which manage certain of our properties, which may cause its interests to differ from ours. NSAM may also encourage our use of third parties for which we pay a fee. If our interests and NSAM’s interests are not aligned, we may face conflicts of interest that result in action or inaction that is detrimental to us.
Our executive officers and our manager’s professionals who perform services for us face competing demands relating to their time and conflicts of interests relating to performing services on our behalf, which may cause our operations and stockholders’ investment to suffer.
We rely on NSAM’s executive officers and investment professionals to perform services for us, including Messrs. Hamamoto, Tylis, Gilbert and Lieberman and Ms. Hess for the day-to-day operation of our business. Messrs. Hamamoto, Tylis, Gilbert and Lieberman and Ms. Hess are also executive officers of us and other managed companies, including the NSAM Sponsored Companies. As a result of their interests in NSAM, other managed companies and the fact that they engage in other business activities on behalf of others, these individuals face conflicts of interest in allocating their time among us, NSAM and other managed companies, including the NSAM Sponsored Companies, and other business activities in which they are involved. In addition, our executive officers and certain management personnel performing services for NSAM own equity interests in NSAM and NSAM may grant additional equity interests in NSAM to such persons in connection with their continued services. These conflicts of interest, as well as the loyalties of these individuals to other entities and investors, could result in action or inaction that is detrimental to our business, which could harm the implementation of our business strategy, our investment opportunities and the returns on our investments. If we do not successfully implement our business strategy, we may be unable to generate the cash needed to make distributions to stockholders and to maintain or increase the value of our assets.
Further, at times when there are turbulent conditions in the real estate markets or distress in the credit markets or other times when we will need focused support and assistance from NSAM, NSAM’s other managed companies may likewise require greater focus and attention, placing NSAM’s resources in high demand. In such situations, we may not receive the level of support and assistance that we may receive if we were internally managed or if NSAM did not act as a manager for other entities.
We may not realize the anticipated benefits of our manager’s strategic partnerships and joint ventures.
NSAM may enter into strategic partnerships and joint ventures. For example, in January 2014, NSAM entered into a partnership with James F. Flaherty III, former chairman and chief executive officer of HCP, Inc. (NYSE: HCP), focused on building a preeminent healthcare real estate business. In addition, NSAM entered into joint ventures with American Healthcare Investors LLC, or AHI, a healthcare-focused real estate investment management firm which manages the Griffin-American Portfolio, and Island Hospitality Group Inc., or Island, a hospitality focused real estate management firm that currently manages 143 hotel properties, representing $4 billion, of which 101 hotel properties are owned by us.
NSAM may not be able to realize the anticipated benefits of these strategic partnerships and joint ventures. These strategic partnerships and/or joint ventures may also subject us to additional risks and uncertainties, as we may be dependent upon, and subject to, liability, losses or reputational damage relating to systems, control and personnel that are not under NSAM’s control. In addition, where NSAM does not have a controlling interest, such as in AHI and Island, it may not be able to take actions which are in our best interests due to a lack of full control. Furthermore, to the extent that NSAM’s partners provide services to us, such as with AHI and Island, certain conflicts of interests will exist. Moreover, disagreements or disputes between NSAM and its partners could result in litigation, which could potentially distract NSAM from our business.
Certain of our strategic partners and joint ventures may have overlapping interests. For example, Mr. Flaherty also acquired an interest in AHI. Any such overlapping interests may exacerbate potential conflicts or disputes.
NSAM manages our portfolio pursuant to very broad investment guidelines and our board of directors does not approve each investment and financing decision made by NSAM unless required by our investment guidelines.
NSAM is authorized to follow very broad investment guidelines established by our board of directors. Our board of directors periodically reviews our investment guidelines and our portfolio of assets but does not, and is not required to, review all of our proposed investments, except in limited circumstances as set forth in our investment guidelines. Our board of directors may also make modifications to our investment guidelines from time to time as it deems appropriate. In addition, in conducting periodic reviews or modifying our investment guidelines, our board of directors may rely primarily on information provided to them by NSAM. Furthermore, transactions entered into by NSAM on our behalf may be costly, difficult or impossible to unwind by the time they are reviewed by our board of directors. NSAM has flexibility within the broad parameters of our investment guidelines in determining the types and amounts of assets in which to invest on our behalf, including making investments that may result in returns that are substantially below expectations or result in losses, which could materially and adversely affect our business and results of operations, or may otherwise not be in the best interests of our stockholders.
NSAM’s liability is limited under the management agreement and we have agreed to indemnify NSAM against all liabilities and obligations attributable to periods prior to the NSAM Spin-off.
In connection with the NSAM Spin-off, we entered into the management agreement and various other agreements with NSAM. These agreements govern our relationship with NSAM and also provide that all liabilities and obligations attributable to periods prior to the NSAM Spin-off remain with us. NSAM maintains a fiduciary relationship with us. Under the terms of the management agreement, and subject to applicable law, NSAM, its directors, officers, employees, partners, managers, members, controlling persons and any other person or entity affiliated with NSAM are not liable to us or our subsidiaries for acts taken or omitted to be taken in accordance with and pursuant to the management agreement, except those resulting from acts of willful misfeasance or bad faith in the performance of NSAM’s duties under the management agreement. In addition, subject to applicable law, we agreed to indemnify NSAM and each of its directors, officers, employees, partners, managers, members, controlling persons and any other person or entity affiliated with NSAM from and against any claims or liabilities, including reasonable legal fees and other expenses reasonably incurred, arising out of or in connection with NSAM’s performance of its duties or obligations under the management agreement or otherwise as our manager, except where attributable to acts of willful misfeasance or bad faith in the performance of NSAM’s duties under the management agreement.
NSAM is subject to extensive regulation, including as an investment adviser in the Unites States and as a fund services business in the Bailiwick of Jersey, which could adversely affect its ability to manage our business.
Certain of NSAM’s affiliates, including our manager, are subject to regulation as investment advisers and/or fund managers by various regulatory authorities that are charged with protecting the interests of NSAM’s managed companies, including us. Instances of criminal activity and fraud by participants in the investment management industry and disclosures of trading and other abuses by participants in the financial services industry have led the U.S. government and regulators in foreign jurisdictions to consider increasing the rules and regulations governing, and oversight of, the financial system. This activity is expected to result in continued changes to the laws and regulations governing the investment management industry and more aggressive enforcement of the existing laws and regulations. NSAM could be subject to civil liability, criminal liability, or sanction, including revocation of its registration as an investment adviser in the United States or its registration as a fund services business in the Bailiwick of Jersey, revocation of the licenses of its employees, censures, fines or temporary suspension or permanent bar from conducting business if it is found to have violated any of these laws or regulations. Any such liability or sanction could adversely affect its ability to manage our business.
NSAM must continually address conflicts between its interests and those of its managed companies, including us. In addition, the SEC, the Jersey Financial Services Commission and other regulators have increased their scrutiny of potential conflicts of interest. However, appropriately dealing with conflicts of interest is complex and difficult and if NSAM fails, or appears to fail, to deal appropriately with conflicts of interest, it could face litigation or regulatory proceedings or penalties, any of which could adversely affect its ability to manage our business.
NSAM could undergo a change of control, which could result in a change of management at our manager and its affiliates and cause a disruption to our business and operations.
NSAM could undergo a change of control, which could result in a change to the management of our manager and its affiliates as well as a change to the board of directors at NSAM. Consequently, we could be managed by an entity and personnel that do not have the experience and track record that resides within NSAM and suitable alternatives may not be available. New management and personnel could change the manner in which they provide services to us and may not be effective. Any such fundamental change to NSAM could be disruptive to our business and operations and could have a material adverse effect on our performance.
Risks Related to Our Investments
General
Our CRE equity, debt and mortgage loans underlying our CRE securities investments are subject to the risks typically associated with CRE.
Our CRE equity, debt and securities investments are subject to the risks typically associated with real estate, including:
| |
| • | local, state, national or international economic conditions; |
| |
| • | real estate conditions, such as an oversupply of or a reduction in demand for real estate space in an area; |
| |
| • | tenant/operator mix and the success of the tenant/operator business; |
| |
| • | property management decisions; |
| |
| • | property location and conditions; |
| |
| • | property operating costs, including insurance premiums, real estate taxes and maintenance costs; |
| |
| • | the perceptions of the quality, convenience, attractiveness and safety of the properties; |
| |
| • | branding, marketing and operational strategies; |
| |
| • | competition from comparable properties; |
| |
| • | the occupancy rate of, and the rental rates charged at, the properties; |
| |
| • | the ability to collect on a timely basis all rent; |
| |
| • | the effects of any bankruptcies or insolvencies; |
| |
| • | the expense of leasing, renovation or construction; |
| |
| • | changes in interest rates and in the availability, cost and terms of mortgage financing; |
| |
| • | unknown liens being placed on the properties; |
| |
| • | bad acts of third parties; |
| |
| • | the ability to refinance mortgage notes payable related to the real estate on favorable terms, if at all; |
| |
| • | changes in governmental rules, regulations and fiscal policies; |
| |
| • | changes in laws, including laws that increase operating expenses or limit rents that may be charged; |
| |
| • | the impact of present or future environmental legislation and compliance with environmental laws, including costs of remediation and liabilities associated with environmental conditions affecting properties; |
| |
| • | cost of compliance with the ADA; |
| |
| • | adverse changes in governmental rules and fiscal policies; |
| |
| • | social unrest and civil disturbances; |
| |
| • | acts of nature, including earthquakes, hurricanes and other natural disasters; |
| |
| • | the potential for uninsured or underinsured property losses; |
| |
| • | adverse changes in state and local laws, including zoning laws; and |
| |
| • | other factors which are beyond our control. |
The value of each property is affected significantly by its ability to generate cash flow and net income, which in turn depends on the amount of rental or other income that can be generated net of expenses required to be incurred with respect to the property. Many expenses associated with properties (such as operating expenses and capital expenses) cannot be reduced when there is a reduction in income from the properties.
These factors may have a material adverse effect on the ability of our borrowers to pay their loans and the ability of the borrowers on the underlying loans securing our securities to pay their loans, as well as on the value and the return that we can realize from assets we acquire.
A prolonged economic slowdown, a lengthy or severe recession or declining real estate values could harm our investments.
Many of our investments may be susceptible to economic slowdowns or recessions, which could lead to financial losses and a decrease in revenues, earnings and assets. We have expanded, and may continue to expand, our CRE portfolio by acquiring properties outside the United States, which increases our exposure to global economic slowdowns and recessions. An economic slowdown or recession, in addition to other non-economic factors such as an excess supply of properties, could have a material negative impact on the values of our investments. Declining real estate values will reduce the value of our properties, as well as our ability to refinance our properties and use the value of our existing properties to support the purchase or investment in additional properties. Slower than expected economic growth pressured by a strained labor market, along with overall financial uncertainty, could result in lower occupancy rates and lower lease rates across many property types and may create obstacles for us to achieve our business plans. We may also be less able to pay principal and interest on our borrowings, which could cause us to lose title to properties securing our borrowings. Our CRE debt investments would be similarly impacted. Our level of new loan originations would also likely decline. In addition, borrowers may be less likely to achieve their business plans and less able to pay principal and interest on our CRE debt investments. Further, declining real estate values significantly increase the likelihood that we will incur losses on our debt investments in the event of a default because the value of our collateral may be insufficient to cover our cost. Any sustained period of increased payment delinquencies, taking title to collateral or losses could adversely affect both our CRE investments as well as our ability to originate, sell and securitize loans, which would significantly harm our revenues, results of operations, financial condition, business prospects and our ability to make distributions to stockholders.
We are subject to significant competition and we may not be able to compete successfully for investments.
We are subject to significant competition for attractive investment opportunities from other real estate investors, some of which have greater financial resources than us, including publicly-traded REITs, non-traded REITs, insurance companies, commercial and investment banking firms, private institutional funds, hedge funds, private equity funds and other investors. We have observed increased competition in 2014 and expect that to continue into 2015. We may not be able to compete successfully for investments. In addition, the number of entities and the amount of funds competing for suitable investments may increase. If we pay higher prices for investments or originate loans on less advantageous terms to us, our returns may be lower and the value of our assets may not increase or may decrease significantly below the amount we paid for such assets. If such events occur, we may experience lower returns on our investments.
We have no established investment criteria limiting the geographic concentration of our investments. If our investments are concentrated in an area or asset class that experiences adverse economic conditions, our investments may lose value and we may experience losses.
Properties that we may acquire may be concentrated in a geographic location or in a particular asset class. Additionally, certain of our investments may be secured by a single property or properties in one geographic location. These current and future investments carry the risks associated with significant geographical concentration. We have not established and do not plan to establish any investment criteria to limit our exposure to these risks for future investments. As a result, properties underlying our investments may be overly concentrated in certain geographic areas and we may experience losses as a result. A worsening of economic conditions, a natural disaster or civil disruptions in a geographic area in which our investments may be concentrated, or economic upheaval with respect to a particular asset class, could have an adverse effect on our business, including reducing the demand for new financings, limiting the ability of borrowers to pay financed amounts and impairing the value of our properties or collateral.
We are subject to additional risks due to our international investments.
In the past year, we have acquired or committed to acquire approximately $2 billion of real estate in Europe, including properties located in the United Kingdom, France, Germany, Italy, Belgium, the Netherlands and Sweden. We may pursue additional expansion opportunities outside the United States and we may acquire or originate senior or subordinate loans made to borrowers located outside of the United States or secured by properties located outside of the United States.
Most of our expertise to date is in the United States and neither we nor NSAM have extensive expertise in international markets. Our international investments may be affected by factors peculiar to the laws of the jurisdiction in which the borrower or the property is located and these laws may expose us to risks that are different from and/or in addition to those commonly found in the United States. We anticipate paying additional fees to third parties to help manage these portfolios, but there is no assurance this will reduce our risk. We and NSAM may not be as familiar with the potential risks to our investments outside of the United States and we may incur losses as a result. These risks include:
| |
| • | governmental laws, rules and policies, including laws relating to the foreign ownership of real property or mortgages and laws relating to the ability of foreign persons or corporations to remove profits earned from activities within the country to the person's or corporation's country of origin; |
| |
| • | translation and transaction risks related to fluctuations in foreign currency exchange rates; |
| |
| • | adverse market conditions caused by inflation or other changes in national or local political and economic conditions; |
| |
| • | challenges of complying with a wide variety of foreign laws, including corporate governance, operations, taxes and litigation; |
| |
| • | changes in relative interest rates; |
| |
| • | the potential for significant U.S. tax liability upon repatriation of profits earned in foreign jurisdictions, which could result in us keeping such earnings in foreign jurisdictions, thereby limiting our liquidity; |
| |
| • | changes in the availability, cost and terms of borrowings resulting from varying national economic policies; |
| |
| • | changes in real estate and other tax rates, the tax treatment of transaction structures and other changes in operating expenses in a particular country where we have an investment; |
| |
| • | our REIT tax status not being respected under foreign laws, in which case any income or gains from foreign sources would likely be subject to foreign taxes, withholding taxes, transfer taxes and value added taxes; |
| |
| • | lack of uniform accounting standards (including availability of information in accordance with U.S. GAAP); |
| |
| • | changes in land use and zoning laws; |
| |
| • | more stringent environmental laws or changes in such laws; |
| |
| • | changes in the social stability or other political, economic or diplomatic developments in or affecting a country where we have an investment; |
| |
| • | changes in applicable laws and regulations in the United States that affect foreign operations; and |
| |
| • | legal and logistical barriers to enforcing our contractual rights in other countries, including insolvency regimes, landlord/tenant rights and ability to take possession of the collateral. |
Certain of these risks may be greater in emerging markets and less developed countries. Each of these risks might adversely affect our performance and impair our ability to make distributions to our stockholders required to maintain our REIT qualification. In addition, there is generally less publicly available information about foreign companies and a lack of uniform financial accounting standards and practices (including the availability of information in accordance with U.S. GAAP) which could impair our ability to analyze transactions and receive timely and accurate financial information from tenants or borrowers necessary to meet our reporting obligations to financial institutions or governmental or regulatory agencies.
Our joint venture partners could take actions that decrease the value of an investment to us and lower our overall return.
We currently have, and may in the future enter into, joint ventures with third parties to make investments. We may also make investments in partnerships or other co-ownership arrangements or participations. For example, we currently have joint ventures with Chatham Lodging Trust with respect to hotel portfolios, RHP Properties with respect to all of our manufactured housing communities, Formation Capital and NorthStar Healthcare with respect to the Formation Portfolio and NorthStar Healthcare with respect to the Griffin-American Portfolio. Such investments may involve risks not otherwise present with other methods of investment, including, for example, the following risks:
| |
| • | our joint venture partner in an investment could become insolvent or bankrupt; |
| |
| • | fraud or other misconduct by our joint venture partners; |
| |
| • | we may share decision-making authority with our joint venture partner regarding certain major decisions affecting the ownership of the joint venture and the joint venture property, such as the sale of the property or the making of additional capital contributions for the benefit of the property, which may prevent us from taking actions that are opposed by our joint venture partner; |
| |
| • | such joint venture partner may at any time have economic or business interests or goals that are or that become in conflict with our business interests or goals, including for example the operation of the properties; |
| |
| • | such joint venture partner may be in a position to take action contrary to our instructions or requests or contrary to our policies or objectives; and |
| |
| • | the terms of our joint ventures could restrict our ability to sell or transfer our interest to a third party when we desire on advantageous terms, which could result in reduced liquidity. |
Any of the above might subject us to liabilities and thus reduce our returns on our investment with that joint venture partner. In addition, disagreements or disputes between us and our joint venture partner could result in litigation, which could increase our expenses and potentially limit the time and effort our officers and directors are able to devote to our business.
Because real estate investments are relatively illiquid, we may not be able to vary our portfolio in response to changes in economic and other conditions, which may result in losses to us.
Many of our investments are illiquid. A variety of factors could make it difficult for us to dispose of any of our assets on acceptable terms even if a disposition is in the best interests of stockholders. We cannot predict whether we will be able to sell any property for the price or on the terms set by us or whether any price or other terms offered by a prospective purchaser would be acceptable to us. We also cannot predict the length of time needed to find a willing purchaser and to close the sale of a property. Certain of our properties, such as our healthcare properties, are special purpose properties that could not be readily converted to general residential, retail or office use. Additionally, transfers of operations of healthcare properties are subject to regulatory approvals not required for transfers of other types of commercial operations and real estate. Certain properties may also be subject to transfer restrictions that materially restrict us from selling that property for a period of time or impose other restrictions, such as a limitation on the amount of financing that can be placed or repaid on that property. We may be required to expend cash to correct defects or to make improvements before a property can be sold, and we cannot assure that we will have cash available to correct those defects or to make those improvements. The Internal Revenue Code also places limits on our ability to sell certain properties held for fewer than two years.
We may also determine to give our tenants a right of first refusal or similar options. Similarly, borrowers under certain of our CRE debt investments may give their tenants or other persons similar rights with respect to the collateral. Such rights could negatively affect the residual value or marketability of the property and impede our ability to sell the property or collateral.
As a result, our ability to sell investments in response to changes in economic and other conditions could be limited. To the extent we are unable to sell any property for its book value or at all, we may be required to take a non-cash impairment charge or loss on the sale, either of which would reduce our earnings. Limitations on our ability to respond to adverse changes in the performance of our properties may have a material adverse effect on our business, financial condition and results of operations and our ability to make distributions to stockholders.
We are subject to risks associated with future advance or capital expenditure obligations, such as declining real estate values and operating performance.
We may need to fund capital expenditures and other significant expenses for our real estate property investments. In addition, our CRE debt investments may require us to advance future funds. Future funding obligations subject us to significant risks, such as a decline in value of the property, cost overruns and the borrower and tenant/operator may be unable to generate enough cash flow and execute its business plan, or sell or refinance the property, in order to repay its obligations to us. We could determine that we need to fund more money than we originally anticipated in order to maximize the value of our investment even though there is no assurance additional funding would be the best course of action. Further, future funding obligations may require us to maintain higher liquidity than we might otherwise maintain and this could reduce the overall return on our investments. We could also find ourselves in a position with insufficient liquidity to fund future obligations.
We may obtain only limited warranties when we purchase a property, which will increase the risk that we may lose some or all of our invested capital in the property or rental income from the property which, in turn, could materially adversely affect our business, financial condition and results from operations and our ability to make distributions to stockholders.
The seller of a property often sells such property in an “as is” condition on a “where is” basis and “with all faults,” without any warranties of merchantability or fitness for a particular use or purpose. In addition, the related real estate purchase and sale agreements may contain only limited warranties, representations and indemnifications that will only survive for a limited period after the closing. Despite our efforts, we may fail to uncover all material risks during our diligence process. The purchase of properties with limited warranties increases the risk that we may lose some or all of our invested capital in the property, as well as the loss of rental income from that property if an issue should arise that decreases the value of that property and is not covered by the limited warranties. If any of these results occur, it may have a material adverse effect on our business, financial condition and results of operations and our ability to make distributions to stockholders.
The price we pay for acquisitions of real property and the terms of our CRE debt investments will be based on our projections of market demand, occupancy and rental income, as well as on market factors, and our return on our investment may be lower than expected if any of our projections are inaccurate.
The price we pay for real property investments and the terms of our debt investments will be based on our projections of market demand, occupancy levels, rental income, the costs of any development, redevelopment or renovation of a property, borrower expertise and other factors. In addition, as the real estate market continues to strengthen with the improvement of the U.S. and certain foreign economies, we will face increased competition, which may drive up prices for real estate assets or make loan origination terms less favorable to us. If any of our projections are inaccurate or we ascribe a higher value to assets and their value subsequently drops or fails to rise because of market factors, returns on our investment may be lower than expected and could experience losses.
Our lease or management transactions may not result in market rates over time.
We expect substantially all of our rental and fee income to come from lease or management transactions, which may have longer terms than standard arrangements or renewal options that specify maximum rate increases. If we do not accurately judge the potential for increases in market rates, rental and fee increases under the terms may fail to result in fair market rates over time. Further, we may have no ability to terminate our lease or management transactions or adjust the rent and fees to then-prevailing market rates. For example, our triple net leases in connection with the properties acquired in the Griffin-American merger contain rent escalation provisions, which may not reflect market rates over time. As a result, our income and distributions to stockholders could be lower than they would otherwise be if we did not enter into such lease or management agreements.
A significant portion of our leases may expire in the same year.
A significant portion of the leases for our real estate investments may expire in the same year. For certain of our properties, such as manufactured housing and multifamily leases are short term in nature and therefore subject to heightened lease turnover risk. Additionally, for certain of our properties which are primarily leased to one tenant/operator, such as our net lease and certain healthcare properties, lease expirations may coincide with the maturities on the borrowing for such properties subject to such leases. As a result, we could be subject to a sudden and material change in value of our portfolio and available cash flow from such investments in the event that these leases are not renewed or in the event that we are not able to extend or refinance the mortgage notes payable on the properties that are subject to these leases.
We may not be able to relet or renew leases at the properties held by us or the properties underlying CRE debt investments on favorable terms, or at all.
Certain of our real estate investments and properties underlying CRE real estate debt investments were negatively impacted by the more recent challenging economic conditions and all of our investments in real estate will continue to be pressured if economic conditions and rental markets continue to be challenging. For example, upon expiration or earlier termination of leases for space located at our properties, the space may not be relet or, if relet, the terms of the renewal or reletting (including the cost of required renovations or concessions to tenants/operators) may be less favorable than current lease terms. We may be receiving above market rental rates which will decrease upon renewal, which will adversely impact our income and could harm our ability to service our debt and operate successfully. Weak economic conditions would likely reduce tenants’/operators’ ability to make rent payments in accordance with the contractual terms of their leases and lead to early termination of leases. Furthermore, commercial space needs may contract, resulting in lower lease renewal rates and longer releasing periods when leases are not renewed. Any of these situations may result in extended periods where there is a significant decline in revenues or no revenues generated by a property. Additionally, to the extent that market rental rates are reduced, property-level cash flow would likely be negatively affected as existing leases renew at lower rates. If we are unable to relet or renew leases for all or substantially all of the space at these properties, if the rental rates upon such renewal or reletting are significantly lower than expected, or if our reserves for these purposes prove inadequate, we will experience a reduction in net income and may be required to reduce or eliminate cash distributions to stockholders.
Many of our investments are dependent upon tenants/operators successfully operating their businesses and their failure to do so could have a material adverse effect on our business, financial condition and results of operations and our ability to make distributions to stockholders.
We depend on our tenants/operators to manage the day-to-day operations of our real estate properties in a manner that generates revenues sufficient to allow them to meet their obligations to us, including their obligations to pay rent, maintain certain insurance coverage, pay real estate taxes and maintain the properties under their operational control in a manner that does not jeopardize their operating licenses or regulatory status. The ability of our tenants/operators to fulfill their obligations to us may depend, in part, upon the overall profitability of their operations, including any other facilities, properties or businesses they may acquire or operate. The cash flow generated by the operation of our properties may not be sufficient for a tenant/operator to meet its obligations to us. In several cases, a single operator operates several of our properties and the failure of one operator could materially adversely affect many properties. Tenants/operators who are having trouble with their cash flow are more likely to expose us to unknown liens and other risks to our assets. Our financial position could be weakened and our ability to fulfill our obligations under our real estate borrowings could be limited if our tenants/operators are unable to meet their obligations to us or we fail to renew or extend our contractual relationship with any of our tenants/operators. Any of these results could have a material adverse effect on our business, financial condition and results of operations and our ability to make distributions to stockholders.
We may become responsible for capital improvements. To the extent such capital improvements are not undertaken, the ability of our tenants/operators to manage our properties effectively and on favorable terms may be affected, which in turn could materially adversely affect our business, financial conditions and results of operations and our ability to make distributions to stockholders.
Although under our typical net lease structure our tenants/operators are generally responsible for capital improvement expenditures, it is possible that a tenant/operator may not be able to fulfill its obligations to keep the facility in good operating condition. To the extent capital improvements are not undertaken or are deferred, occupancy rates and the amount of rental and reimbursement income generated by the facility may decline, which would negatively impact the overall value of the affected facility. We may be forced to incur unexpected significant expense to maintain our properties, even those that are net leased. Any of these results could have a material adverse effect on our business, financial condition and results of operations and our ability to make distributions to stockholders.
Lease defaults, terminations or landlord-tenant/operator disputes may reduce our income from our real estate investments.
The creditworthiness of our tenants/operators in our real estate investments has been, or could become, negatively impacted as a result of challenging economic conditions or otherwise, which could result in their inability to meet the terms of their leases. Lease defaults or terminations by one or more tenants/operators may reduce our revenues unless a default is cured or a suitable replacement tenant/operator is found promptly. In addition, disputes may arise between the landlord and tenant/operator that result in the tenant/operator withholding rent payments, possibly for an extended period. These disputes may lead to litigation or other legal procedures to secure payment of the rent withheld or to evict the tenant/operator. Upon a lease default, we may have limited remedies, be unable to accelerate lease payments and have limited or no recourse against a guarantor. Tenants/operators as well as guarantors may have limited or no ability to satisfy any judgments we may obtain. We may also have duties to mitigate our losses and we may not be successful in that regard. Any of these situations may result in extended periods during which there is a significant decline in revenues or no revenues generated by a property. If this occurred, it could adversely affect our results of operations.
The bankruptcy, insolvency or financial deterioration of any of our tenants/operators could significantly delay our ability to collect unpaid rents or require us to find new tenants/operators.
Our financial position and our ability to make distributions to stockholders may be adversely affected by financial difficulties experienced by any of our major tenants/operators, including bankruptcy, insolvency or a general downturn in the business, or in the event any of our major tenants/operators do not renew or extend their relationship with us as their lease terms expire.
We are exposed to the risk that our tenants/operators may not be able to meet their obligations to us or other third parties, which may result in their bankruptcy or insolvency. Although our leases and loans permit us to evict a tenant/operator, demand immediate repayment and pursue other remedies, bankruptcy laws afford certain rights to a party that has filed for bankruptcy or reorganization. A tenant/operator in bankruptcy may be able to restrict our ability to collect unpaid rents or interest during the bankruptcy proceeding. Furthermore, dealing with a tenant/operator’s bankruptcy or other default may divert management’s attention and cause us to incur substantial legal and other costs.
Bankruptcy laws provide that a debtor has the option to assume or reject an unexpired lease within a certain period of time of filing for bankruptcy, but generally requires such assumption or rejection to be made in its entirety. Thus, a debtor cannot choose to keep the beneficial provisions of a contract while rejecting the burdensome ones; the contract must be assumed or rejected as a whole. For example, many of our healthcare properties are currently net leased to an operator operating multiple facilities, some of which are pursuant to a single master lease. If one or more of our healthcare property operators files for bankruptcy relief, it is possible that in bankruptcy the debtor may be required to assume or reject the master lease in its entirety, rather than making the decision on a property-by-property basis, thereby preventing the debtor from assuming the better performing properties and terminating the master lease with respect to the poorer performing properties. However, where under applicable law a contract (even though it is contained in a single document) is determined to be divisible or severable into different agreements, or similarly, where a collection of documents is determined to constitute separate agreements instead of a single, integrated contract, then in those circumstances a debtor/trustee may be allowed to assume some of the divisible or separate agreements while rejecting the others. If the debtor has the ability, and chooses, to assume some of the divisible agreement while rejecting the other divisible agreements, or if a non-debtor tenant is unable to comply with the terms of an agreement, we may be forced to modify the agreements in ways that are unfavorable to us.
Both our tenants/operators’ and borrowers’ forms of entities may cause special risks or hinder our recovery.
Most of our tenants/operators in the real estate that we own, as well as the borrowers for our CRE debt investments and borrowers underlying our CRE securities, are legal entities rather than individuals. The obligations these entities owe us are typically non-recourse so we can only look to our collateral, and at times, the assets of the entity may not be sufficient to recover our investment. As a result, our risk of loss may be greater than for leases with or originators of loans made to individuals. Unlike individuals involved in bankruptcies, these legal entities will generally not have personal assets and
creditworthiness at stake. As a result, the default or bankruptcy of one of our tenants/operators or borrowers, or a general partner or managing member of that tenant or borrower, may impair our ability to enforce our rights and remedies under the terms of the lease agreement or the related mortgage, respectively.
Insurance may not cover all potential losses on CRE investments, which may impair the value of our assets.
We generally require that each of the borrowers under our CRE debt investments obtain comprehensive insurance covering the collateral, including liability, fire and extended coverage. We also generally obtain insurance directly on any property we acquire. We believe all of our properties are adequately insured. However, there are certain types of losses, generally of a catastrophic nature, such as earthquakes, floods and hurricanes that may be uninsurable or not economically insurable. We may not obtain, or require borrowers to obtain, certain types of insurance if it is deemed commercially unreasonable. Inflation, changes in building codes and ordinances, environmental considerations and other factors also might make it infeasible to use insurance proceeds to replace a property if it is damaged or destroyed. Under such circumstances, the insurance proceeds, if any, might not be adequate to restore the economic value of the property, which might decrease the value of the property and in turn impair our investment.
Compliance with the ADA, Fair Housing Act and fire, safety and other regulations may require us, our borrowers or our tenants/operators to make unanticipated expenditures which could adversely affect our business, financial condition and results of operations and our ability to make distributions to stockholders.
Our properties are required to comply with the ADA, which generally requires that buildings be made accessible to people with disabilities. We must also comply with the Fair Housing Act, which prohibits us and our tenants/operators from discriminating against individuals on certain bases in any of our practices if it would cause such individuals to face barriers in gaining residency in any of our facilities. In addition, our properties are required to operate in compliance with applicable fire and safety regulations, building codes and other land use regulations and licensing or certification requirements as they may be adopted by governmental agencies and bodies from time-to-time. We may be required to incur substantial costs to comply with those requirements. Changes in labor and other laws could also negatively impact us, our borrowers and our tenants/operators. For example, changes to labor-related statutes or regulations could significantly impact the cost of labor in the workforce, which would increase the costs faced by our borrowers and tenants/operators and increase their likelihood of default.
Environmental compliance costs and liabilities associated with our properties or our real estate-related investments may materially impair the value of our investments and expose us to liability.
Under various federal, state and local environmental laws, ordinances and regulations, a current or previous owner or operator of real property, such as us and our tenants/operators, may be liable in certain circumstances for the costs of investigation, removal or remediation of, or related releases of, certain hazardous or toxic substances, including materials containing asbestos, at, under or disposed of in connection with such property, as well as certain other potential costs relating to hazardous or toxic substances, including government fines and damages for injuries to persons and adjacent property. In addition, some environmental laws create a lien on the contaminated site in favor of the government for damages and the costs it incurs in connection with the contamination. These laws often impose liability without regard to whether the owner knew of, or was responsible for, the presence or disposal of such substances and liability may be imposed on the owner in connection with the activities of a tenant/operator at the property. The presence of contamination or the failure to remediate contamination may adversely affect our or our tenants’/operators’ ability to sell or lease real estate, or to borrow using the real estate as collateral, which, in turn, could reduce our revenues. We, or our tenants/operators, as owner or operator of a site, may be liable under common law or otherwise to third parties for damages and injuries resulting from environmental contamination emanating from the site. The cost of any required investigation, remediation, removal, fines or personal or property damages and our or our tenants’/operators’ liability could significantly exceed the value of the property without any limits.
The scope of the indemnification our tenants/operators have agreed to provide us may be limited. For instance, some of our agreements with our tenants/operators do not require them to indemnify us for environmental liabilities arising before the tenant/operator took possession of the premises. Further, we cannot assure stockholders that any such tenant/operator would be able to fulfill its indemnification obligations. If we were deemed liable for any such environmental liabilities and were unable to seek recovery against our tenant/operator, our business, financial condition and results of operations could be materially and adversely affected.
Furthermore, we may invest in real estate, or mortgage loans secured by real estate, with environmental problems that materially impair the value of the real estate. Even as a lender, if we take title to collateral with environmental problems or if other circumstances arise, we could be subject to environmental liability. There are substantial risks associated with such an investment.
Risks Related to Our Investments in Healthcare Assets
As of December 31, 2014, approximately 42% of our real estate investments are concentrated in medical office buildings and other healthcare-related facilities, which increases the risks related to owning healthcare real estate properties becoming more material to our business and results of operations.
Following the completion of the acquisition of the Griffin-American Portfolio, we significantly increased our ownership of healthcare real estate properties in our portfolio, which represent 42% of our real estate portfolio as of December 31, 2014. As a result of this increase in the concentration of healthcare real estate properties, our exposure to the risks inherent in investments in the healthcare sector has also increased, making us more vulnerable to a downturn or slowdown in the healthcare sector. A downturn in the healthcare industry could negatively affect our lessees’ ability to make lease payments to us and our ability to pay distributions to our stockholders. These adverse effects may be more pronounced than if our investments were more diversified.
We do not control the operations of our healthcare properties and we are dependent on the managers of our healthcare properties.
To maintain our status as a REIT, we are not permitted to operate any of our healthcare properties. As a result, we have entered into management agreements with third-party managers to operate our healthcare properties. For example, AHI manages all of the healthcare properties in the Griffin-American Portfolio. For this reason, we are unable to directly implement strategic business decisions with respect to the daily operation and marketing of our healthcare properties. Although we consult with our operators with respect to strategic business plans, the operators are under no obligation to implement any of our recommendations with respect to these matters. While we monitor the managers’ performance, we have limited recourse under our management agreements if we believe that the managers are not performing adequately.
From time to time, we may have differences with the managers of our healthcare properties over their performance and compliance with the terms of our management agreements. If we are unable to reach satisfactory results through discussions and negotiations, we may choose to litigate the dispute or submit the matter to third-party dispute resolution. Failure by our managers to fully perform the duties agreed to in our management agreements or the failure of our managers to adequately manage the risks associated with operations of healthcare properties, including cyber-security risks, could affect adversely our results of operations.
The healthcare industry is highly competitive and we expect it to become more competitive.
We own and manage a diversified portfolio of healthcare properties. Our tenants, operators and managers may encounter increased competition for residents and patients, including with respect to the scope and quality of care and services provided, reputation and financial condition, physical appearance of the properties, price and location. In general, regulatory and other barriers to competitive entry in the assisted living, independent living, and medical office building segments of the healthcare industry are not substantial, although there are often regulatory barriers to the development of hospitals and skilled nursing facilities. Medical office tenants are frequently dependent upon the success of the hospitals in their vicinity. Consequently, our tenants and operators may encounter increased competition which could adversely affect our revenues and earnings.
Healthcare laws and regulations are subject to frequent change and the failure of our tenants, operators or managers to comply with these laws and regulations may materially adversely affect our business, financial condition and results of operations and our ability to make distributions to stockholders.
Our tenants, operators and managers are subject to numerous federal, state and local laws and regulations that are subject to frequent and substantial changes. The ultimate timing or effect of any changes in these laws and regulations cannot be predicted. Refer to “Regulation - Healthcare Regulation” included in Item 1 of this Annual Report on Form 10-K for further discussion. Changes in these laws and regulations could negatively affect the ability of our tenants, operators or managers to satisfy their obligations to us and our ability to make distributions to stockholders. In addition, failure to comply with the laws, requirements and regulations may materially adversely affect our business, financial condition and results of operations and our ability to make distributions to stockholders.
We are exposed to operational risks at our properties that could adversely affect our revenue and operations.
We are exposed to various operational risks with respect to our properties that may be more prevalent in healthcare than other industry segments that may increase our costs or adversely affect our ability to generate revenues. These risks include: (i) fluctuations in occupancy, government and other third party reimbursement, private pay rates; (ii) economic conditions; (iii) competition; (iv) federal, state, local and industry-regulated licensure, certification and inspection laws, regulations and standards; (v) the availability and increases in cost of general and professional liability insurance coverage; (vi) state regulation and rights of residents related to entrance fees; and (vii) the availability and increases in the cost of labor (as a result of unionization or otherwise). Refer to “Regulation - Healthcare Regulation” included in Item 1 of this Annual Report on Form
10-K for further discussion. Any one or a combination of these factors may adversely affect our revenue and operations and our ability to make distributions to stockholders.
Our tenants, operators and managers are faced with increased litigation and rising insurance costs that may affect their ability to meet their obligations to us.
In some states, advocacy groups have been created to monitor the quality of care at healthcare facilities and these groups have brought litigation against operators. Also, in several instances, private litigation by patients has succeeded in winning very large damage awards for alleged abuses. The effect of this litigation and potential litigation has been to materially increase the costs of monitoring and reporting quality of care compliance. In addition, the cost of liability and medical malpractice insurance has increased and may continue to increase so long as the present litigation environment affecting the operations of healthcare facilities continues. Continued cost increases could cause our tenants, operators and managers to be unable to meet their obligations to us, potentially decreasing our revenue and increasing our collection and litigation costs. Moreover, to the extent we are required to take back the affected facilities, our revenue from those facilities could be reduced or eliminated for an extended period of time.
Failure to comply with certain healthcare laws and regulations could adversely affect the operations of our operators, tenants and managers, which could jeopardize our operators’, tenants’ and managers’ abilities to meet their obligations to us.
Our operators, tenants and managers generally are subject to varying levels of federal, state, local, and industry-regulated licensure, certification and inspection laws, regulations and standards. Our operators’, tenants’ or managers’ failure to comply with any of these laws, regulations or standards could result in loss of accreditation, denial of reimbursement, imposition of fines, suspension, decertification or exclusion from federal and state healthcare programs, loss of license or closure of the facility. Such actions may have an effect on our operators’ or tenants’ ability to make lease payments to us and, therefore, adversely impact us. Refer to “Regulation - Healthcare Regulation” included in Item 1 of this Annual Report on Form 10-K for further discussion.
Certain healthcare laws include criminal and civil penalties for violations that range from punitive sanctions, damage assessments, penalties, imprisonment, denial of Medicare and Medicaid payments and exclusion from the Medicare and Medicaid programs. They may also allow individuals to bring whistleblower actions on behalf of the government for violations thereof and for recovery of damages and fines. Refer to “Regulation - Healthcare Regulation” included in Item 1 of this Annual Report on Form 10-K for further discussion. Investigation by a federal or state governmental body for violation of fraud and abuse laws or imposition of penalties with respect to any of our tenants, operators or managers could result in a failure to meet its obligations to us, which may have a material adverse effect on our business, financial condition and results of operations and our ability to make distributions to stockholders.
Reimbursement rates from third-party payors have been reduced in the past and could be reduced again in the future, which would materially adversely affect our tenants and operators, which could materially and adversely affect our business, financial condition and results of operations and our ability to make distributions to stockholders.
Governmental and private reimbursement rates may decrease. Refer to “Regulation - Healthcare Regulation” included in Item 1 of this Annual Report on Form 10-K for further discussion. Our ability to generate revenue and income influences the underlying value of our healthcare facilities, which may decrease if third party reimbursement rates decrease.
License and Certificate of Need requirements affect our current operators and may delay our ability to replace an operator.
Many of our properties may require a license, registration and/or CON to operate. Failure to obtain a license, registration, or CON, or loss of a required license, registration or CON would prevent a facility from operating in the manner intended by the operators or tenants. These events could materially adversely affect our operators’ or tenants’ ability to meet their obligations to us. State and local laws also may regulate the expansion, including the addition of new beds or services or acquisition of medical equipment and the construction or renovation of healthcare facilities, by requiring a CON or other similar approval from a state agency. If we need to replace an operator, compliance with licensure and CON laws may delay the process. Refer to “Regulation - Healthcare Regulation” included in Item 1 of this Annual Report on Form 10-K for further discussion.
Economic downturns, weakness in the housing and equity markets, lowered consumer confidence and other events could adversely affect the ability of seniors to afford the entrance fees or monthly resident fees for our healthcare facilities and, in turn, materially adversely affect our business, financial condition and results of operations and our ability to make distributions to stockholders.
Costs to seniors associated with independent and assisted living services are generally not reimbursable under government reimbursement programs such as Medicare and Medicaid. Only seniors with income or assets meeting or exceeding the comparable median in the regions where our facilities are located typically will be able to afford to pay the entrance fees and monthly resident fees. Economic downturns, softness in the housing market, lower levels of consumer confidence, reductions
or declining growth of government entitlement programs (such as social security benefits), stock market volatility, changes in demographics and other events could adversely affect the ability of seniors to afford the entrance fees or monthly resident fees for our healthcare facilities. If our operators are unable to retain and attract seniors with sufficient income, assets or other resources required to pay the fees associated with independent and assisted living services and other services provided by our operators at our healthcare facilities, our occupancy rates could decline, which could, in turn, materially adversely affect our business, results of operations and financial condition and our ability to make distributions to stockholders.
Because of the unique and specific improvements required for healthcare properties, we may be required to incur substantial renovation costs to make certain of our properties suitable for other operators, which could materially adversely affect our business, financial condition and results of operations and our ability to make distributions to stockholders.
Healthcare properties are typically highly customized and may not be easily adapted to non-healthcare-related uses. The improvements generally required to conform a property to healthcare use, such as upgrading electrical, gas and plumbing infrastructure, are costly and often times operator-specific. A new or replacement operator may require different features in a property, depending on that operator’s particular operations. If a current operator is unable to pay rent and vacates a property, we may incur substantial costs to modify a property for a new operator, or for multiple operators with varying infrastructure requirements, before we are able to release the space. Consequently, our healthcare properties may not be suitable for lease to other operators or for alternative uses without significant costs or renovations, which costs may materially adversely affect our business, financial condition and results of operations and our ability to make distributions to stockholders.
If our tenants, operators or managers fail to maintain a positive reputation and cultivate new or maintain existing relationships with residents in the markets in which they operate, the occupancy percentage, payor mix and resident rates may deteriorate which could have a material adverse effect on our business, financial condition and results of operations and our ability to make distributions to stockholders.
The ability of our tenants, operators and managers to obtain and maintain the overall occupancy percentage, payor mix and resident rates at our healthcare facilities depends on our tenants’, operators’ and managers’ reputation in the communities they serve and their ability to successfully market our facilities to potential residents. A large part of our tenants’, operators’ and managers’ marketing and sales effort is directed towards cultivating and maintaining legally compliant relationships with key community organizations that work with seniors, physicians and other healthcare providers in the communities where our facilities are located, whose referral practices significantly affect the choices seniors make with respect to their long-term care needs. If our tenants, operators and managers are unable to successfully cultivate and maintain strong relationships with these community organizations, physicians and other healthcare providers, occupancy rates at our facilities could decline, which could materially adversely affect our business, financial condition and results of operations and our ability to make distributions to stockholders. Our tenants, operators and managers may mismanage our healthcare facilities, be subjected to governmental intervention, including shutting down of the facilities and be the subject of negative public news articles and other adverse attention. In such a case, our tenants’, operators’ and managers’ ability to continue functioning would be in severe jeopardy and our ability to realize value on our underlying assets could be materially adversely affected.
The hospitals on or near whose campuses many of our MOBs are located and their affiliated health systems could fail to remain competitive or financially viable, which could adversely impact their ability to attract physicians and physician groups to our MOBs.
Our MOB operations depend on the competitiveness and financial viability of the hospitals on or near whose campuses our MOBs are located and their ability to attract physicians and other healthcare-related clients to our MOBs. The viability of these hospitals, in turn, depends on factors such as the quality and mix of healthcare services provided, competition for patients, physicians and physician groups, demographic trends in the surrounding community, market position and growth potential. Because we rely on proximity to and affiliations with hospitals to create leasing demand in our MOBs, a hospital’s inability to remain competitive or financially viable, or to attract physicians and physician groups, could materially adversely affect our MOB operations and have a material adverse effect on us.
We may not be able to maintain or expand our relationships with our existing and future hospital and health system clients.
The success of our MOB operations depends, to a large extent, on past, current and future relationships with hospitals and their affiliated health systems. Significant amounts of time are spent in developing relationships with both new and existing clients. If our relationships with hospitals and their affiliated health systems deteriorate, or if a conflict of interest or non-compete arrangement prevents us from expanding these relationships, it may have a material adverse effect on us.
We may not be able to compete effectively in those markets where overbuilding exists and our inability to compete in those markets may have a material adverse effect on our business, financial condition and results of operations and our ability to make distributions to stockholders.
Overbuilding in the healthcare segment in the late 1990s reduced occupancy and revenue rates at healthcare properties. This, combined with unsustainable levels of borrowings, forced several operators into bankruptcy. The occurrence of another period
of overbuilding could adversely affect our future occupancy and resident fee rates, which in turn could materially adversely affect our business, financial condition and results of operations and our ability to make distributions to stockholders.
We face increasing competition for the acquisition of healthcare properties which may impede our ability to make acquisitions or may increase the cost of these acquisitions which, in turn, could materially adversely affect our business, financial condition and results of operations and our ability to make distributions to stockholders.
We compete with many other businesses engaged in real estate investment activities for the acquisition of healthcare properties, including local, regional and national operators and acquirers and developers of healthcare real estate. The competition for healthcare properties may significantly increase the price we might pay for a facility or property we seek to acquire and our competitors may succeed in acquiring those facilities or properties themselves. In addition, operators with whom we attempt to do business may find our competitors to be more attractive because they may have greater resources, may be willing to pay more for the properties or may have a more compatible operating philosophy. In particular, larger healthcare REITs may enjoy significant competitive advantages that result from, among other things, a lower cost of capital and enhanced operating efficiencies. In addition, the number of entities and the amount of funds competing for suitable investment properties may increase. This competition may result in increased demand for these assets and therefore increased prices paid for them. If we pay higher prices for healthcare properties, our business, financial condition and results of operations and our ability to make distributions to stockholders may be materially adversely affected.
Risks Related to Our Hotel Assets
As of December 31, 2014, approximately 22% of our real estate investments are concentrated in hotels, which increases our exposure to risks affecting the lodging industry.
We have significantly increased our ownership of hotel properties in our portfolio, which represent 22% of our real estate portfolio as of December 31, 2014. The lodging industry is subject to changes in the travel patterns of business and leisure travelers, both of which are affected by the strength of the economy, as well as other factors. The performance of the lodging industry has traditionally been closely linked with the performance of the general economy and, specifically, growth in gross domestic product. Changes in travel patterns of both business and leisure travelers, particularly during periods of economic contraction or low levels of economic growth, may create difficulties for the industry over the long-term and adversely affect our results. The majority of our hotels are classified as upscale extended stay and select service. In an economic downturn, these types of hotels may be more susceptible to a decrease in revenue, as compared to hotels in other categories that have lower room rates. This characteristic may result from the fact that these hotels generally target business and high-end leisure travelers. In periods of economic difficulties, business and leisure travelers may seek to reduce travel costs by limiting travel or seeking to reduce costs on their trips. Our results of operations and any forecast we make may be affected by, and can change based on, a variety of circumstances that affect the lodging industry, including:
| |
| • | changes in the international, national, regional and local economic climate; |
| |
| • | changes in business and leisure travel patterns; |
| |
| • | increases in energy costs or airline fares or terrorist incidents, which impact the propensity of people to travel and revenues from our lodging facilities because operating costs cannot be adjusted as quickly; |
| |
| • | supply growth in markets where we own hotels, which may adversely affect demand at our properties; |
| |
| • | the attractiveness of our hotels to consumers relative to competing hotels; |
| |
| • | the performance of the managers of our hotels; |
| |
| • | outbreaks of disease and the impact on travel of natural disasters and weather; |
| |
| • | physical damage to our hotels as a result of earthquakes, hurricanes or other natural disasters or the income lost as a result of the damage; |
| |
| • | changes in room rates and increases in operating costs due to inflation and other factors; and |
| |
| • | unionization of the labor force at our hotels. |
A reduction in our revenue or earnings as a result of the above risks may reduce our working capital, impact our long-term business strategy and impact the value of our assets and our ability to meet certain covenants in our existing debt agreements.
We are subject to risks associated with our ongoing need for renovations and capital improvements as well as financing these expenditures.
In order to remain competitive, our hotels have an ongoing need for renovations and other capital improvements, including replacements, from time to time, of furniture, fixtures and equipment. These capital improvements may give rise to the following risks:
| |
| • | construction cost overruns and delays; |
| |
| • | a possible shortage of liquidity to fund capital improvements and the related possibility that financing for these capital improvements may not be available to us on affordable terms; |
| |
| • | the renovation investment failing to produce the returns on investment that we expect; |
| |
| • | disruptions in the operations of the hotel as well as in demand for the hotel while capital improvements are underway; and |
| |
| • | disputes with franchisors or hotel managers regarding compliance with relevant management or franchise agreements. |
We may have insufficient liquidity to fund capital expenditures and, consequently, we may need to rely upon the availability of debt or equity capital to fund our investments and capital improvements. These sources of funds may not be available on reasonable terms and conditions or at all.
We do not control our hotel operations and we are dependent on the managers of our hotels.
To maintain our status as a REIT, we are not permitted to operate any of our hotels. As a result, we have entered into management agreements with third-party managers to operate our hotel properties. We currently rely upon Island to manage most of our hotels. For this reason, we are unable to directly implement strategic business decisions with respect to the daily operation and marketing of our hotels, such as decisions with respect to the setting of room rates, repositioning of a hotel, food and beverage pricing and certain similar matters. Although we consult with our hotel operators with respect to strategic business plans, the hotel operators are under no obligation to implement any of our recommendations with respect to these matters. While we monitor the hotel managers’ performance, we have limited recourse under our management agreements if we believe that the hotel managers are not performing adequately. The cash flow from our hotels may be affected adversely if our managers fail to provide quality services and amenities or if they or their affiliates fail to maintain a quality brand name. Because our management agreements are long term agreements, we also may not be able to terminate these agreements if we believe the manager is not performing adequately.
From time to time, we may have differences with the managers of our hotels over their performance and compliance with the terms of our management agreements. If we are unable to reach satisfactory results through discussions and negotiations, we may choose to litigate the dispute or submit the matter to third-party dispute resolution. Failure by our hotel managers to fully perform the duties agreed to in our management agreements or the failure of our managers to adequately manage the risks associated with hotel operations, including cyber-security risks, could affect adversely our results of operations.
In addition, our hotel managers or their affiliates manage, and in some cases own, have invested in, or provided credit support or operating guarantees to hotels that compete with our hotels, all of which may result in conflicts of interest. As a result, our hotel managers have in the past made, and may in the future make, decisions regarding competing lodging facilities that are not or would not be in our best interest.
Risks Related to Our Investments in CRE Debt and Securities
The CRE debt we originate and invest in and mortgage loans underlying the CRE securities we invest in are subject to risks of delinquency, taking title to collateral, loss and bankruptcy of the borrower under the loan. If the borrower defaults, it may result in losses to us.
Our CRE debt investments are secured by commercial real estate and are subject to risks of delinquency, loss, taking title to collateral and bankruptcy of the borrower. The ability of a borrower to repay a loan secured by commercial real estate is typically dependent primarily upon the successful operation of such property rather than upon the existence of independent income or assets of the borrower. If the net operating income of the property is reduced or is not increased, depending on the borrower’s business plan, the borrower’s ability to repay the loan may be impaired. If a borrower defaults or declares bankruptcy and the underlying asset value is less than the loan amount, we will suffer a loss. In this manner, real estate values could impact the value of our CRE debt and securities investments. Therefore, our CRE debt and securities will be subject to the risks typically associated with real estate.
Additionally, we may suffer losses for a number of reasons, including the following, which could have a material adverse effect on our financial performance:
| |
| • | If the value of real property or other assets securing our CRE debt deteriorates. The majority of our CRE debt investments are fully or substantially non-recourse. In the event of a default by a borrower on a non-recourse loan, we will only have recourse to the real estate-related assets (including escrowed funds and reserves, if any) collateralizing the debt. There can be no assurance that the value of the assets securing our CRE debt investments will not deteriorate over time due to factors beyond our control, as was the case during the credit crisis and as a result of the recent economic recession. Further, we may not know whether the value of these properties has declined below levels existing on the dates of origination. If the value of the properties drop, our risk will increase because of the lower |
value of the collateral and reduction in borrower equity associated with the related CRE debt. If a borrower defaults on our CRE debt and the mortgaged real estate or other borrower assets collateralizing our CRE debt are insufficient to satisfy the loan, we may suffer a loss of principal or interest.
| |
| • | If a borrower or guarantor defaults on recourse obligations under a CRE debt investment. We sometimes obtain personal or corporate guarantees from borrowers or their affiliates. These guarantees are often triggered only upon the occurrence of certain trigger, or “bad boy,” events. In cases where guarantees are not fully or partially secured, we will typically rely on financial covenants from borrowers and guarantors which are designed to require the borrower or guarantor to maintain certain levels of creditworthiness. As a result of challenging economic and market conditions, many borrowers and guarantors faced, and continue to face, financial difficulties and were unable, and may continue to be unable, to comply with their financial covenants. If the economy does not strengthen, our borrowers could experience additional financial stress. Where we do not have recourse to specific collateral pledged to satisfy such guarantees or recourse loans, we will only have recourse as an unsecured creditor to the general assets of the borrower or guarantor, some or all of which may be pledged to satisfy other lenders. There can be no assurance that a borrower or guarantor will comply with its financial covenants or that sufficient assets will be available to pay amounts owed to us under our CRE debt and related guarantees. |
| |
| • | Our due diligence may not reveal all of a borrower’s liabilities and may not reveal other weaknesses in its business. Before making a loan to a borrower, we assess the strength and skills of an entity’s management and other factors that we believe are material to the performance of the investment. This underwriting process is particularly important and subjective with respect to newly-organized entities because there may be little or no information publicly available about the entities. In making the assessment and otherwise conducting customary due diligence, we rely on the resources available to us and, in some cases, an investigation by third parties. There can be no assurance that our due diligence processes will uncover all relevant facts or that any investment will be successful. Furthermore, historic performance evaluated in connection with our underwriting process may not be indicative of future performance. |
| |
| • | Delays in liquidating defaulted CRE debt investments could reduce our investment returns. The occurrence of a default on a CRE debt investment could result in our taking title to collateral. However, we may not be able to take title to and sell the collateral securing the loan quickly. Taking title to collateral can be an expensive and lengthy process that could have a negative effect on the return on our investment. Borrowers often resist when we seek to take title to collateral by asserting numerous claims, counterclaims and defenses, including but not limited to lender liability claims, in an effort to prolong the foreclosure action. In some states, taking title to collateral can take several years or more to resolve. At any time during a foreclosure proceeding, for example, the borrower may file for bankruptcy, which would have the effect of staying the foreclosure action and further delaying the foreclosure process. The resulting time delay could reduce the value of our investment in the defaulted loans. Furthermore, an action to take title to collateral securing a loan is regulated by state statutes and regulations and is subject to the delays and expenses associated with lawsuits if the borrower raises defenses, counterclaims or files for bankruptcy. In the event of default by a borrower, these restrictions, among other things, may impede our ability to take title to and sell the collateral securing the loan or to obtain proceeds sufficient to repay all amounts due to us on the loan. In addition, we may be forced to operate any collateral for which we take title for a substantial period of time, which could be a distraction for our management team and may require us to pay significant costs associated with such collateral. We may not recover any of our investment even if we take title to collateral. |
CRE debt restructurings may reduce our net interest income.
While the U.S. economy is stronger today, a return to weak economic conditions in the future may cause our borrowers to be at increased risk of default and we, or a third party, may need to restructure loans if our borrowers are unable to meet their obligations to us and we believe restructuring is the best way to maximize value. In order to preserve long-term value, we may determine to lower the interest rate on loans in connection with a restructuring, which will have an adverse impact on our net interest income. We may also determine to extend the maturity and make other concessions with the goal of increasing overall value, however, there is no assurance that the results of our restructurings will be favorable to us. Restructuring an investment may ultimately result in us receiving less than had we not restructured the investment. We may lose some or all of our investment even if we restructure in an effort to increase value.
We may be unable to restructure our investments in a manner that we believe maximizes value, particularly if we are one of multiple creditors in large capital structures.
In order to maximize value, we may be more likely to extend and work out an investment rather than pursue other remedies such as taking title to collateral. However, in situations where there are multiple creditors in large capital structures, it can be particularly difficult to assess the most likely course of action that a lender group or the borrower may take and it may also be difficult to achieve consensus among the lender group as to major decisions. Consequently, there could be a wide range of potential principal recovery outcomes, the timing of which can be unpredictable, based on the strategy pursued by a lender group or other applicable parties. These multiple creditor situations tend to be associated with larger loans. If we are one of a group of lenders, we may not independently control the decision making. Consequently, we may be unable to restructure an investment in a manner that we believe would maximize value.
The subordinate CRE debt we originate and invest in may be subject to risks relating to the structure and terms of the related transactions, as well as subordination in bankruptcy, and there may not be sufficient funds or assets remaining to satisfy our investments, which may result in losses to us.
We originate, structure and acquire subordinate CRE debt investments secured primarily by commercial properties, which may include subordinate mortgage loans, mezzanine loans and participations in such loans and preferred equity interests in borrowers who own such properties. These investments may be subordinate to other debt on commercial property and are secured by subordinate rights to the commercial property or by equity interests in the borrower. In addition, real properties with subordinate debt may have higher loan-to-value ratios than conventional debt, resulting in less equity in the real property and increasing the risk of loss of principal and interest. If a borrower defaults or declares bankruptcy, after senior obligations are met, there may not be sufficient funds or assets remaining to satisfy our subordinate interests. Because each transaction is privately negotiated, subordinate investments can vary in their structural characteristics and lender rights. Our rights to control the default or bankruptcy process following a default will vary from transaction to transaction. The subordinate investments that we originate and invest in may not give us the right to demand taking title to collateral as a subordinate real estate debt holder. Furthermore, the presence of intercreditor agreements may limit our ability to amend our loan documents, assign our loans, accept prepayments, exercise our remedies and control decisions made in bankruptcy proceedings relating to borrowers. Similarly, a majority of the participating lenders may be able to take actions to which we object, but by which we will be bound. Even if we have control, we may be unable to prevent a default or bankruptcy and we could suffer substantial losses. Certain transactions that we originated and invested in could be particularly difficult, time consuming and costly to work out because of their complicated structure and the diverging interests of all the various classes of debt in the capital structure of a given asset.
Floating-rate CRE debt, which is often associated with transitional assets, may entail greater risks of default to us than fixed-rate CRE debt.
Floating-rate loans are often, but not always, associated with transitional properties as opposed to those with highly stabilized cash flow. Floating-rate CRE debt may have higher delinquency rates than fixed-rate loans. Borrowers with floating-rate loans may be exposed to increased monthly payments if the related interest rate adjusts upward from the initial fixed rate in effect during the initial period of the loan to the rate calculated in accordance with the applicable index and margin. Increases in a borrower’s monthly payment as a result of an increase in prevailing market interest rates may make it more difficult for the borrowers with floating-rate loans to repay the loan and could increase the risk of default of their obligations under the loan.
Investments in non-performing real estate assets involve greater risks than investments in stabilized, performing assets and make our future performance more difficult to predict.
We may make investments in non-performing real estate assets. Traditional performance metrics of real estate assets are generally not as reliable for non-performing real estate assets as they are for performing real estate assets. Non-performing properties, for example, do not have stabilized occupancy rates and may require significant capital for repositioning. Similarly, non-performing loans do not have a consistent stream of cash flow to support normalized debt service. In addition, for non-performing loans, often there is greater uncertainty as to the amount or timeliness of principal repayment. There are also a variety of strategies available to create value in a non-performing real estate investment, including development, redevelopment or lease-up of a property or negotiating a reduced payoff, restructuring the terms of the loan or enforcing rights as lender and taking title to collateral securing the loan with respect to CRE debt investments. None of these strategies may be successful. It is challenging to evaluate non-performing investments, which increases the risks associated with such investments.
We may be subject to risks associated with construction lending, such as declining real estate values, cost overruns and delays in completion.
Our CRE debt investments may include loans made to developers to construct prospective projects, which may include ground-up construction or repositioning an existing asset. The primary risks to us of construction loans are the potential for cost overruns, the developer’s failing to meet a project delivery schedule, market downturns and the inability of a developer to sell
or refinance the project at completion in accordance with its business plan and repay our CRE debt. These risks could cause us to have to fund more money than we originally anticipated in order to complete the project.
We invest in CRE securities, including CMBS and other subordinate securities, which entail certain heightened risks.
We invest in a variety of CRE securities that are subordinate securities subject to the first risk of loss if any losses are realized on the underlying mortgage loans. CMBS entitle the holders thereof to receive payments that depend primarily on the cash flow from a specified pool of commercial or multifamily mortgage loans. Consequently, CMBS and other CRE securities will be adversely affected by payment defaults, delinquencies and losses on the underlying mortgage loans, which increase during times of economic stress and uncertainty. Furthermore, if the rental and leasing markets deteriorate, including by decreasing occupancy rates and decreasing market rental rates, it could reduce cash flow from the mortgage loan pools underlying our CMBS investments. The market for CRE securities is dependent upon liquidity for refinancing and may be negatively impacted by a slowdown in new issuance.
Additionally, CRE securities such as CMBS may be subject to particular risks, including lack of standardized terms and payment of all or substantially all of the principal only at maturity rather than regular amortization of principal. The value of CRE securities may change due to shifts in the market’s perception of issuers and regulatory or tax changes adversely affecting the CRE debt market as a whole. Additional risks may be presented by the type and use of a particular commercial property, as well as the general risks relating to the net operating income from and value of any commercial property. The exercise of remedies and successful realization of liquidation proceeds relating to CRE securities may be highly dependent upon the performance of the servicer or special servicer. Expenses of enforcing the underlying mortgage loan (including litigation expenses) and expenses of protecting the properties securing the loan may be substantial. Consequently, in the event of a default or loss on one or more loans contained in a securitization, we may not recover a portion or all of our investment. Ratings for CRE securities can also adversely affect their value.
We may make investments in assets with lower credit quality, which will increase our risk of losses.
We may invest in unrated or non-investment grade CRE securities, enter into leases with unrated tenants/operators or participate in subordinate, unrated or distressed mortgage loans. The non-investment grade ratings for these assets typically result from the overall leverage of the loans, the lack of a strong operating history for the properties underlying the loans or securities, the borrowers’ credit history, the properties’ underlying cash flow or other factors. Because the ability of obligors of properties and mortgages, including mortgage loans underlying CMBS, to make rent or principal and interest payments may be impaired during an economic downtown, prices of lower credit quality investments and CRE securities may decline. As a result, these investments may have a higher risk of default and loss than investment grade rated assets. The existing credit support in the securitization structure may be insufficient to protect us against loss of our principal on these investments. Any loss we incur may be significant and may reduce distributions to stockholders and may adversely affect the value of our common stock.
We invest in CDO notes and such investments involve significant risks.
We repurchased N-Star CDO bonds originally issued to third parties at discounts to par and may invest in other third-party CDO notes. We may not realize the value we expect, if any, in connection with our repurchase of the N-Star CDO bonds. CDOs are multiple class securities secured by pools of assets, such as CMBS, mortgage loans, subordinate mortgage and mezzanine loans and REIT debt. Like typical securitization structures, in a CDO, the assets are pledged to a trustee for the benefit of the holders of the CDO bonds. Like CMBS, CDO notes are affected by payments, defaults, delinquencies and losses on the underlying loans or securities. To the extent we retain or invest the equity interests of a CDO, we are entitled to all of the income generated by the CDO after the CDO pays all of the interest due on the senior securities and its expenses. We own the equity interests in all of our N-Star CDO financing transactions whether or not we consolidate these transactions on our balance sheet. There may be little or no income or principal available to the holders of CDO equity interests if defaults or losses on the underlying collateral exceed a certain amount. In that event, the value of our investment in any equity interest of a CDO could decrease substantially. In addition, the equity interests of CDOs are illiquid and often must be held by a REIT and because they represent a leveraged investment in the CDO’s assets, the value of the equity interests will generally have greater fluctuations than the value of the underlying collateral. We could also be subject to litigation related to our legacy CDO business, which could be costly to defend and distracting to management and there is no assurance as to the outcome of any such litigation if it were to arise.
Some of our investments are carried at estimated fair value as determined by us and, as a result, there may be uncertainty as to the value of these investments.
Some of our investments are recorded at fair value but will have limited liquidity or will not be publicly traded. The fair value of these investments that have limited liquidity or are not publicly traded may not be readily determinable. We will estimate the fair value of these investments on a quarterly basis. Because such valuations are inherently uncertain, may fluctuate over short periods of time and may be based on numerous estimates and assumptions, our determinations of fair value may differ
materially from the values that would have been used if a readily available market for these securities existed. If our determination regarding the fair value of these investments are materially different than the values that we ultimately realize upon their disposal, this could have a material adverse effect on our business, financial condition and results of operations and our ability to make distributions to stockholders.
Higher provision for loan losses and asset impairment charges are expected if economic conditions do not continue to improve.
We could experience defaults resulting in provision for loan losses and asset impairment charges in the future. In challenging economic environments, borrowers, for a variety of reasons, may be unable to remain current with principal and interest on loans. Declines in real property values also increase loan-to-value ratios on our loans and, therefore, weaken our collateral coverage and increase the likelihood of higher provision for loan losses. Even if our cash flow remains relatively stable, we could suffer losses in accordance with U.S. GAAP, which could adversely affect our stock price, access to credit and ability to satisfy financing covenants.
Provision for loan losses are difficult to estimate, particularly in a challenging economic environment.
Our provision for loan losses is evaluated on a quarterly basis. Our determination of provision for loan losses requires us to make certain estimates and judgments, which may be difficult to determine, particularly in a challenging economic environment. While CRE fundamentals have improved, the U.S. and global economy and financial markets remain challenged. Our estimates and judgments are based on a number of factors, including projected cash flow from the collateral securing our CRE debt, structure, including the availability of reserves and recourse guarantees, likelihood of repayment in full at the maturity of a loan, potential for refinancing and expected market discount rates for varying property types, all of which remain uncertain and are subjective. Our estimates and judgments may not be correct, particularly during challenging economic environments, and therefore our results of operations and financial condition could be severely impacted.
Risks Relating to Other Investments
Our investment in manufactured housing communities may not be successful.
As of December 31, 2014, $1.6 billion of our assets were invested in manufactured housing communities comprised of 123 manufactured housing communities totaling approximately 29,000 pad rental sites. We are reliant, in substantial part, on the experience of a third-party operator to manage these assets on our behalf. Effectively managing these assets requires significant experience and there is no assurance that we or our third-party operator will be successful in maintaining or improving occupancy and otherwise preserving and increasing the value of these assets. Our investment in these assets may not generate the cash flow we anticipate or otherwise perform as expected. We could experience losses in these assets, which would negatively impact our operating performance and CAD.
We have significant investments in real estate private equity funds and there is no assurance these investments will achieve the returns expected upon initial execution of the respective investments.
As of December 31, 2014, $1.2 billion of our assets were invested in PE Investments. Our PE Investments may not achieve the anticipated returns we initially expected. Factors that could cause actual results to differ materially from our expectations include, but are not limited to, the possibility that: (i) the agreed upon NAV does not necessarily reflect the fair value of the fund interests on such date and the current fair value could be materially different; (ii) the actual amount of future capital commitments underlying all of the fund interests that will be called and funded by us could vary materially from our expectations; and (iii) because, among other matters, the sponsors of the private equity funds, rather than us, will control the investments in those funds, we could lose some or all of our investment. Furthermore, certain of our PE Investments are co-invested with NorthStar Income, which increases the likelihood that we could have conflicts of interest with that company.
We have in the past and expect to continue to make opportunistic investments that may involve asset classes and structures with which we have less familiarity, thereby increasing our risk of loss.
We have in the past and may in the future also determine to invest in residential real estate and other asset classes with which we have limited or no prior experience. When investing in asset classes with which we have limited or no prior experience, we may not be successful in our diligence and underwriting efforts. We may also be unsuccessful in preserving value, especially if conditions deteriorate, and we may expose ourselves to unknown substantial risks. Furthermore, these assets could require additional management time and attention relative to assets with which we are more familiar. All of these factors increase our risk of loss.
Risks Related to Our Financing Strategy
We may not be able to access financing sources on attractive terms, if at all, which could adversely affect our ability to execute our business plan.
We require outside capital to fund and grow our business. Our business may be adversely affected by disruptions in the debt and equity capital markets and institutional lending market, including the lack of access to capital or prohibitively high costs of obtaining or replacing capital, both domestically and abroad. A primary source of liquidity for us has been the debt and equity capital markets, including issuances, directly or indirectly, of common equity, preferred equity, trust preferred securities and exchangeable senior notes, as well as notes in securitization financing transactions. Access to the capital markets and other sources of liquidity were severely disrupted during the recession that began in 2008. Despite recent improvements, the markets could suffer another severe downturn and another liquidity crisis could emerge. Based on the current conditions, we do not know whether any sources of capital will be available to us in the future on terms that are acceptable to us, if at all. If we cannot obtain sufficient debt and equity capital on acceptable terms, our business and our ability to operate could be severely impacted. For information about our available sources of funds, refer to “Management’s Discussion and Analysis of Financial Condition and Results of Operations - Liquidity and Capital Resources” in Item 7 of Part II of this Annual Report on Form 10-K and the notes to our consolidated financial statements in Item 8 of Part II of this Annual Report on Form 10-K.
We may be unable to obtain financing required to acquire or originate investments as contemplated in our business plan, which could compel us to restructure or abandon a particular acquisition or origination and harm our ability to make distributions to stockholders.
We expect to fund a portion of our investments with financing. We cannot assure stockholders that financing will be available on acceptable terms, if at all, or that we will be able to satisfy the conditions precedent required to use our credit facilities, which could reduce the number, or alter the type, of investments that we would make otherwise. This may reduce our income. To the extent that financing proves to be unavailable when needed, we may be compelled to modify our investment strategy to optimize the performance of our portfolio. Any failure to obtain financing could have a material adverse effect on the continued development or growth of the target business and harm our ability to make distributions to stockholders.
We use significant leverage in connection with our investments, which increases the risk of loss associated with our investments.
We finance the acquisition and origination of a portion of our investments with mortgage notes, credit facilities, securitization financing transactions and other term borrowings, which may include repurchase agreements. We do not restrict the amount of borrowings that we may incur. As of December 31, 2014, we had $10 billion of borrowings outstanding. While a significant amount of our borrowings may be non-recourse, we are still subject to risk associated with more restrictive recourse borrowings. Although the use of leverage may enhance returns and increase the number of investments that we can make, it may increase our risk of loss, impact of our liquidity and restrict our ability to engage in certain activities.
Our substantial borrowings, among other things, may:
| |
| • | require us to dedicate a large portion of our cash flow to pay principal and interest on our borrowings, which will reduce the availability of cash flow to fund working capital, capital expenditures and other business activities; |
| |
| • | require us to maintain minimum unrestricted cash; |
| |
| • | increase our vulnerability to general adverse economic and industry conditions; |
| |
| • | require us to post additional reserves and other additional collateral to support our financing arrangements, which could reduce our liquidity and limit our ability to leverage our assets; |
| |
| • | subject us to maintaining various debt, operating income, net worth, cash flow and other covenants and financial ratios; |
| |
| • | limit our flexibility in planning for, or reacting to, changes in our business and the industry in which we operate; |
| |
| • | restrict our operating policies and ability to make strategic acquisitions, dispositions or exploit business opportunities; |
| |
| • | require us to maintain a borrowing base of assets; |
| |
| • | place us at a competitive disadvantage compared to our competitors that have fewer borrowings; |
| |
| • | put us in a position that necessitates raising equity capital at a time that is unfavorable to us and dilutive to our stockholders; |
| |
| • | limit our ability to borrow additional funds (even when necessary to maintain adequate liquidity), dispose of assets or make distributions to stockholders; and |
| |
| • | increase our cost of capital. |
Our ability to effectively execute our financing strategy depends on various conditions in the financing markets that are beyond our control, including liquidity and credit spreads. We may be unable to obtain additional financing on favorable terms or, with respect to our debt and other investments, on terms that parallel the maturities of the debt originated or acquired, if we are able to obtain additional financing at all. If our strategy is not viable, we will have to find alternative forms of long-term financing for our assets, as secured revolving credit facilities and repurchase agreements may not accommodate long-term financing. This could subject us to more restrictive recourse borrowings and the risk that debt service on less efficient forms of financing would require a larger portion of our cash flow, thereby reducing cash available for distribution to stockholders, for our operations and for future business opportunities. If alternative financing is not available on favorable terms, or at all, we may have to liquidate assets at unfavorable prices to pay off such financing. Our return on our investments and cash available for distribution to stockholders may be reduced to the extent that changes in market conditions cause the cost of our financing to increase relative to the earnings that we can derive from the assets we acquire or originate.
We may not successfully align the maturities of our liabilities with the maturities on our assets, which could harm our operating results and financial condition.
Our general financing strategy is focused on the use of “match-funded” structures. This means that we seek to align the maturities of our liabilities with the maturities on our assets in order to manage the risks of being forced to refinance our liabilities prior to the maturities of our assets. In addition, we plan to match interest rates on our assets with like-kind borrowings, so fixed-rate investments are financed with fixed-rate borrowings and floating-rate assets are financed with floating-rate borrowings, directly or indirectly through the use of interest rate swaps, caps and other financial instruments or through a combination of these strategies. We may fail to appropriately employ match-funded structures on favorable terms, or at all. We may also determine not to pursue a fully match-funded strategy with respect to a portion of our financings for a variety of reasons, including our financing of the Griffin-American merger. If we fail to appropriately employ match-funded strategies or determine not to pursue such a strategy, our exposure to interest rate volatility and exposure to matching liabilities prior to the maturity of the corresponding asset may increase substantially, which could harm our operating results, liquidity and financial condition.
We use short-term borrowings to finance our investments and we may need to use such borrowings for extended periods of time to the extent we are unable to access long-term financing. This may expose us to increased risks associated with decreases in the fair value of the underlying collateral, which could have an adverse impact on our results of operations.
While we expect to seek non-recourse, non-mark-to-market, long-term financing through securitization financing transactions or other structures, such financing may be unavailable to us on favorable terms or at all. Consequently, we may be dependent on short-term financing arrangements that are not matched in duration to our financial assets. Short-term borrowing through repurchase arrangements, credit facilities and other types of borrowings may put our assets and financial condition at risk. Any such short-term financing may also be recourse to us, which will increase the risk of our investments. In addition, the value of assets underlying any such short-term financing may be marked-to-market periodically by the lender, including on a daily basis. If the fair value of the assets subject to such financing arrangements decline, we may be required to provide additional collateral or make cash payments to maintain the loan-to-collateral value ratio. If we are unable to provide such collateral or cash repayments, we may lose our economic interest in the underlying assets. Further, such borrowings may require us to maintain a certain amount of cash reserves or to set aside unleveraged assets sufficient to maintain a specified liquidity position that would allow us to satisfy our collateral obligations. These facilities may be restricted to financing certain types of assets, such as first mortgage loans, which could impact our asset allocation. In addition, such short-term borrowing facilities may limit the length of time that any given asset may be used as eligible collateral. As a result, we may not be able to leverage our assets as fully as we would choose, which could reduce our income generated on such assets. In the event that we are unable to meet the collateral obligations for our short-term financing arrangements, our financial condition could deteriorate rapidly.
Our borrowings restrict our ability to engage in certain activities, which could materially adversely affect our growth prospects, financial condition and our ability to make distributions to our stockholders.
We have substantial borrowings, many of which contain covenants restricting our ability to engage in certain activities. In August 2014 and September 2014, respectively, we entered into: (i) a $500 million revolving credit facility for a three-year term guaranteed by substantially all of our material wholly-owned subsidiaries; and (ii) a $500 million term loan facility for a one-year term. As of December 31, 2014, we had $215 million outstanding under our revolving credit facility. The revolving credit facility and, as applicable, the term loan documentation contain various affirmative and negative covenants, including, among other things, obligations to maintain REIT status, limitations on debt, liens and dividends and other restricted payments, as well as financial covenants.
We also currently have two loan facilities that provide for an aggregate of up to $240 million to finance eligible loan originations. The instruments governing these credit facilities contain certain typical covenants, including liquidity, market capitalization and leverage covenants.
In addition, in connection with the Griffin-American merger, various of our indirect subsidiaries (either as borrowers or guarantors) entered into a mortgage loan agreement and three mezzanine loan agreements for an aggregate amount of $2.6 billion and a term loan facility agreement for an aggregate of £223.8 million, each of which contain customary affirmative and negative covenants.
We may also obtain additional facilities and increase our lines of credit on existing facilities in the future. If we cannot generate sufficient cash flow to service our borrowings, we may default, subject our assets to foreclosure and need to seek protection under bankruptcy laws.
Compliance with such covenants restrict our ability to engage in certain transactions, which could materially adversely affect our growth prospects, financial condition and our ability to make distributions to our stockholders. Furthermore, if we fail to comply with such covenants, our liquidity may be materially and adversely affected.
Our credit facilities permits us to make significant borrowings, which could require that we generate significant cash flow or access the capital markets to satisfy the payment and other obligations under our credit facilities.
We may make significant borrowings in connection with borrowings under our credit facilities. These borrowings may exceed our cash on hand and/or our cash flows from operating activities. Our ability to meet the payment and other obligations under our credit facilities depends on our ability to generate sufficient cash flow or access capital markets in the future. Our ability to generate cash flow or access capital markets, to some extent, is subject to general economic, financial, competitive, legislative and regulatory factors, as well as other factors that are beyond our control. We cannot assure you that our business will generate cash flow from operations, or that future borrowings will be available to us, in amounts sufficient to enable us to meet our payment obligations under our credit facilities. If we are not able to generate sufficient cash flow to service our credit facilities and other borrowing obligations, we may need to refinance or restructure our borrowings, reduce or delay capital investments, or seek to raise additional capital. There is no assurance we will be able to do any of the foregoing on favorable terms or at all. If we are unable to implement one or more of these alternatives, we may not be able to meet our payment obligations under our credit facilities, which could materially and adversely affect our liquidity.
We may not be able to borrow additional amounts under our credit facilities.
Certain of our borrowings may restrict our ability to incur additional indebtedness, such as our revolving credit facility, based on the value of certain investment assets that make up a borrowing base. Such investment assets may fluctuate in value. Decreases in value would reduce our borrowing base and could prevent us from borrowing. In addition, our revolving credit facility includes financial maintenance covenants and non-financial covenants. Breach of any such covenants would block additional borrowings under the facility. Our inability to borrow additional amounts could delay or prevent us from acquiring, financing, and completing desirable investments and could negatively affect our liquidity, which could materially and adversely affect our business. Inability to borrow could also prevent us from making distributions to our stockholders.
We are subject to risks associated with obtaining mortgage financing on our real estate, which could materially adversely affect our business, financial condition and results of operations and our ability to make distributions to stockholders.
As of December 31, 2014, our real estate portfolio had $8.5 billion of total mortgage financing. We are subject to risks normally associated with financing, including the risks that our cash flow is insufficient to make timely payments of interest or principal, that we may be unable to refinance existing borrowings or support collateral obligations and that the terms of refinancing may not be as favorable as the terms of existing borrowing. If we are unable to refinance or extend principal payments due at maturity or pay them with proceeds from other capital transactions or the sale of the underlying property, our cash flow may not be sufficient in all years to make distributions to stockholders and to repay all maturing borrowings. Furthermore, if prevailing interest rates or other factors at the time of refinancing result in higher interest rates upon refinancing, the interest expense relating to that refinanced borrowing would increase, which could reduce our profitability and the amount of distributions we are able to pay to stockholders. Moreover, additional financing increases the amount of our leverage, which could negatively affect our ability to obtain additional financing in the future or make us more vulnerable in a downturn in our results of operations or the economy generally.
Our performance can be negatively affected by fluctuations in interest rates and shifts in the yield curve may cause losses.
Our financial performance is influenced by changes in interest rates, in particular, as such changes may affect our CRE securities, floating-rate borrowings and CRE debt to the extent such debt does not float as a result of floors or otherwise. Changes in interest rates, including changes in expected interest rates or “yield curves,” affect our business in a number of ways. Changes in the general level of interest rates can affect our net interest income, which is the difference between the interest income earned on our interest-earning assets and the interest expense incurred in connection with our interest-bearing borrowings and hedges. Changes in the level of interest rates also can affect, among other things, our ability to acquire CRE securities, acquire or originate CRE debt at attractive prices and enter into hedging transactions. Interest rates are highly sensitive to many factors, including governmental monetary and tax policies, domestic and international economic and political conditions, and other factors beyond our control.
Interest rate changes may also impact our net book value as our CRE securities and hedge derivatives are marked to market each quarter. Generally, as interest rates increase, the value of our fixed rate securities decreases, which will decrease the book value of our equity.
Furthermore, shifts in the U.S. Treasury yield curve reflecting an increase in interest rates would also affect the yield required on our CRE securities and therefore their value. For example, increasing interest rates would reduce the value of the fixed rate assets we hold at the time because the higher yields required by increased interest rates result in lower market prices on existing fixed rate assets in order to adjust the yield upward to meet the market, and vice versa. This would have similar effects on our CRE securities portfolio and our financial position and operations as a change in interest rates generally.
In addition, a substantial portion of our existing borrowings and the new borrowings bear interest at variable rates. For example, the financing for the acquisition of the Griffin-American Portfolio includes U.S. and U.K.-based borrowings, with a floating rate component of $1.2 billion of borrowings outstanding as of December 31, 2014, with a weighted average interest rate of one month LIBOR plus 3.10% and three-month LIBOR plus 4.25%, respectively. Additionally, our revolving credit facility of $500 million bears interest at a floating rate equal to LIBOR plus 3.50%. If market interest rates increase, the interest rate on our variable rate borrowings will increase and will create higher debt service requirements, which would adversely affect our cash flow and could adversely impact our results of operations. While we may enter into agreements limiting our exposure to higher debt service requirements, any such agreements may not offer complete protection from this risk.
Our interest rate risk sensitive assets, liabilities and related derivative positions are generally held for non-trading purposes. As of December 31, 2014, a hypothetical 100 basis point increase in one-month LIBOR applied to our floating-rate assets and liabilities (including derivatives) would result in a decrease in net interest income of approximately $36 million annually, of which $26 million of the change is attributable to floating rate financing of hotel and healthcare operating real estate and does not reflect the potential increase in rental cash flow associated with economic growth that may be typical in a rising interest rate environment.
In a period of rising interest rates, our interest expense could increase while the interest we earn on our fixed-rate assets or LIBOR capped floating rate assets would not change, which would adversely affect our profitability.
Our operating results depend in large part on differences between the income from our assets less our operating costs, reduced by any credit losses and financing costs. Income from our assets may respond more slowly to interest rate fluctuations than the cost of our borrowings. Consequently, changes in interest rates, particularly short-term interest rates, may influence our net income. Increases in these rates may decrease our net income. Interest rate fluctuations resulting in our interest expense exceeding the income from our assets could result in losses for us and may limit our ability to make distributions to stockholders. In addition, if we need to repay existing borrowings during periods of rising interest rates, we could be required to liquidate one or more of our investments at times that may not permit realization of the maximum return on those investments, which would adversely affect our profitability.
Hedging against interest rate and currency exposure may adversely affect our earnings, limit our gains or result in losses, which could adversely affect cash available for distribution to stockholders.
We may enter into swap, cap or floor agreements or pursue other interest rate or currency hedging strategies. Our hedging activity will vary in scope based on interest rate levels, currency exposure, the type of investments held and other changing market conditions. Interest rate and/or currency hedging may fail to protect or could adversely affect us because, among other things:
| |
| • | interest rate and/or currency hedging can be expensive, particularly during periods of rising and volatile interest rates; |
| |
| • | available interest rate and/or currency hedging may not correspond directly with the risk for which protection is sought; |
| |
| • | the duration of the hedge may not match the duration of the related liability or asset; |
| |
| • | our hedging opportunities may be limited by the treatment of income from hedging transactions under the rules determining REIT qualification; |
| |
| • | the credit quality of the party owing money on the hedge may be downgraded to such an extent that it impairs our ability to sell or assign our side of the hedging transaction; |
| |
| • | the counterparties with which we trade may cease making markets and quoting prices in such instruments, which may render us unable to enter into an offsetting transaction with respect to an open position; |
| |
| • | the party owing money in the hedging transaction may default on its obligation to pay; and |
| |
| • | we may purchase a hedge that turns out not to be necessary, i.e., a hedge that is out of the money. |
Any hedging activity we engage in may adversely affect our earnings, which could adversely affect cash available for distribution to stockholders. Therefore, while we may enter into such transactions to seek to reduce interest rate and/or currency risks, unanticipated changes in interest rates or exchange rates may result in poorer overall investment performance than if we had not engaged in any such hedging transactions. In addition, the degree of correlation between price movements of the instruments used in a hedging strategy and price movements in the portfolio positions being hedged or liabilities being hedged may vary materially. Moreover, for a variety of reasons, we may not be able to establish a perfect correlation between hedging instruments and the investments being hedged. Any such imperfect correlation may prevent us from achieving the intended hedge and expose us to risk of loss. We may also be exposed to liquidity issues as a result of margin calls or settlement of derivative hedges.
Hedging instruments often are not traded on regulated exchanges, guaranteed by an exchange or its clearinghouse or regulated by any U.S. or foreign governmental authorities and involve risks and costs.
The cost of using hedging instruments increases as the period covered by the instrument lengthens and during periods of rising and volatile interest rates. We may increase our hedging activity and thus increase our hedging costs during periods when interest rates are volatile or rising and hedging costs have increased. In addition, hedging instruments involve risk since they often are not traded on regulated exchanges, guaranteed by an exchange or its clearing house, or regulated by any U.S. or foreign governmental authorities. Consequently, there are no regulatory or statutory requirements with respect to record keeping, financial responsibility or segregation of customer funds and positions. Furthermore, the enforceability of agreements underlying derivative transactions may depend on compliance with applicable statutory, commodity and other regulatory requirements and, depending on the identity of the counterparty, applicable international requirements. The business failure of a hedging counterparty with whom we enter into a hedging transaction will most likely result in a default. Default by a party with whom we enter into a hedging transaction may result in the loss of unrealized profits and force us to cover our resale commitments, if any, at the then current market price. It may not always be possible to dispose of or close out a hedging position without the consent of the hedging counterparty and we may not be able to enter into an offsetting contract in order to cover our risk. We cannot assure stockholders that a liquid secondary market will exist for hedging instruments purchased or sold, and we may be required to maintain a position until exercise or expiration, which could result in losses.
Refer to the below risk factor “The direct or indirect effects of the Dodd-Frank Act, enacted in July 2010 for the purpose of stabilizing or reforming the financial markets, may have an adverse effect on our interest rate hedging activities” for a discussion of how the Dodd-Frank Wall Street Reform Act, or the Dodd-Frank Act, may affect the use of hedging instruments.
Our CDO bonds payable have certain coverage tests that are required to be met in order for payments to be made to our equity interests in the N-Star CDOs. Failing coverage tests could significantly impact our cash flow and overall liquidity position.
Our CDO bonds payable generally require that the underlying collateral and cash flow generated by the collateral be in excess of the overcollateralization, or OC, and interest coverage, or IC, ratios stipulated in the related indentures. Uncured defaults or rating agency downgrades to underlying collateral will cause decreases in the OC and IC tests. In the event these tests are not met, cash flow that would normally be distributed to us would be used to amortize the senior CDO bonds until the CDO is back in compliance with the tests.
As of December 31, 2014, all of our CRE debt N-Star CDOs were in compliance with their OC and IC tests. Certain of our remaining N-Star securities CDOs were out of compliance with their respective OC tests and we expect that complying with OC and IC tests will continue to be difficult. We may be unable to prevent adverse conditions that could adversely affect our CDO coverage tests and our operating results, liquidity and cash flow.
The reinvestment period for all of our N-Star CDOs have expired, which could adversely affect our cash flow.
During the reinvestment period of our N-Star CDOs, we were permitted to reinvest principal payments on the underlying assets into qualifying replacement collateral. Because we are unable to reinvest principal in these N-Star CDOs after the reinvestment period ends, our ability to manage and maintain the OC and IC ratios is limited and principal repayments on investments are redirected to pay down the senior bonds, which delevers the CDO and negatively impacts our cash flow regardless of whether such N-Star CDOs are consolidated or have since been deconsolidated from our consolidated balance sheets. In addition, for certain N-Star CDOs although we have administrative responsibilities relating to the N-Star CDOs, the collateral management rights have been delegated to third parties and as a result, we do not have control over the investments made by such N-Star CDOs. Refer to “Management’s Discussion and Analysis of Financial Condition and Results of Operations - Liquidity and Capital Resources” in Item 7 of Part II of this Annual Report on Form 10-K for further discussion of our legacy CDO business.
A payment default on our N-Star CDO bonds could have a compounding effect on other N-Star CDOs.
Certain of our N-Star CDOs have invested in CDO bonds issued by other N-Star CDOs that we sponsored and/or acquired. Such investments expose us to increased risk, as defaults in any particular CDO would also affect another CDO that owns
bonds in the CDO that experiences defaults. Defaults across certain of our N-Star CDOs could, therefore, have a material impact on the cash flow of other N-Star CDOs that we own and would not have otherwise experienced such an impact.
The documentation governing our N-Star CDOs is complex and contains certain ambiguities that are subject to interpretation.
Each of our N-Star CDOs is governed by an indenture, collateral management agreement and other documentation. The documents are complex and collectively describe the conditions upon which we can sell assets and reinvest principal proceeds and set forth covenants and other provisions to which we and the CDOs are subject. In certain circumstances, the performance of the underlying CDO collateral has raised ambiguities in our CDO documentation. We could take a position, inadvertently or otherwise, that a court ultimately determines constitutes a breach of the underlying agreements and the results of such a determination could have a material adverse effect on our business and financial condition.
We may be unable to complete additional securitization financing transactions due to, among other things, a decrease in liquidity in the CRE market.
For CRE debt and securities investments originated or acquired prior to 2010, we accessed the securitization markets to obtain non-recourse, non-mark-to-market, permanent financing which were structured as CDOs. In November 2012 and in August 2013, we and on behalf of NorthStar Income, entered into two securitization financing transactions, however, we may be unable to complete similar transactions in the future due to several factors, including decreased liquidity in the CRE market. If we are unsuccessful in accessing this market, we may be exposed to less favorable financing terms, if any, which could adversely affect our business.
If we breach representations or warranties that we made in our securitization financing transactions, or if either we or NorthStar Income suffer a loss in our retained interests in that transaction, our financial condition could be harmed.
In November 2012, we closed a securitization financing transaction collateralized by $351 million of CRE debt directly originated by us and NorthStar Income. We, through our subsidiaries, contributed five CRE debt investments with a $152 million aggregate principal balance to the securitization financing transaction and NorthStar Income, through its subsidiaries, contributed nine CRE debt investments with a $199 million aggregate principal balance. This transaction involved the issuance and sale of a total of $228 million of investment-grade bonds. Affiliates of ours and NorthStar Income retained all of the below investment-grade bonds with an affiliate of ours retaining $54 million of a total of $124 million, representing our equity interest in the CRE debt we contributed to the securitization financing transaction. This is the first such financing transaction we had completed in several years.
In connection with the securitization financing transaction, certain of our subsidiaries made certain customary representations, warranties and covenants. If there is a breach of those representations and warranties or a defect in the documentation of any of the contributed assets, which breach or defect materially and adversely affects the value of the subject contributed asset, the value of the related mortgaged property or the interests of the trustee therein, then we will be required to either cure the breach, repurchase the affected contributed asset from the issuing entity, replace the affected contributed asset with another asset or make a loss of value payment, as the case may be. Any such loss could be material and have an adverse effect on our financial condition.
Further in connection with this transaction, since we and NorthStar Income both contributed assets into a single securitization, we entered into a partnership agreement with NorthStar Income that provides that both parties will receive the economic benefit and bear the economic risk associated with the assets each contributed into the securitization. In both cases, a portion of our and NorthStar Income’s respective retained interests will be subordinate to interests of the senior bondholders. In the event that we or NorthStar Income suffers a complete loss of a portion of the respective retained interests, any additional losses would be borne by the remaining retained interests held by us or NorthStar Income, as the case may be, prior to the senior bondholders.
We may enter into similar transactions in the future and those transactions could likely entail similar and other substantial risks.
Our exchangeable senior notes are recourse obligations to us.
As of December 31, 2014, $46 million of our exchangeable senior notes were outstanding, of which we may be required to repurchase $13 million, $1 million and $32 million in June 2017, June 2019 and June 2023, respectively. These amounts are full recourse obligations of our company. If we are not able to extend, refinance or repurchase these borrowings, we may not have the ability to repay these amounts when they come due. Our inability to repay any of our exchangeable senior notes could cause the acceleration of our borrowings, which would have a material adverse effect on our business.
Our exchangeable senior notes contain cross-default provisions.
The indenture agreements governing our exchangeable senior notes contain cross-default provisions whereby a default under one agreement could result in a default and acceleration of borrowings under other agreements. If a cross-default occurred, we
may not be able to pay our liabilities or access capital from external sources in order to refinance our borrowings. If some or all of our borrowings default and it causes a default under other borrowings, our business, financial condition and results of operations could be materially and adversely affected.
The holders of our exchangeable senior notes may elect to exchange those notes prior to maturity and we may be required to use common stock, cash or both to satisfy our exchange obligations.
Our exchangeable senior notes may be exchanged at any time prior to maturity at the option of the holder in accordance with the terms of the applicable indenture. In December 2013, we made a revocable election to satisfy our exchange obligations with shares of our common stock for the principal amount of the notes, as determined in accordance with the applicable indenture. We may change our election at any time in accordance with the terms of the applicable indentures and elect to satisfy all exchanges with a combination of cash and common stock, rather than only common stock. In 2015 to date, we exchanged an aggregate of $6 million principal amount of exchangeable senior notes and settled all such exchanges in shares of our common stock. These exchanges, as well as any additional exchanges we may effect in the future through settlement with shares of our common stock, will exacerbate the dilutive effects to our stockholders. If we determine to use only cash to exchange our notes rather than stock, our liquidity could be negatively impacted. If the price of our common stock continues to rise and our distributions continue to increase, the economic incentive to exchange our notes will likely increase.
Risks Related to Our Company
Our ability to operate our business successfully would be harmed if key personnel terminate their employment with us.
Our future success depends, to a significant extent, upon the continued services of our key personnel, including our executive officers, which include our Chairman and Chief Executive Officer, David T. Hamamoto, our President, Albert Tylis, and our Chief Investment and Operating Officer, Daniel R. Gilbert, in particular. For instance, the extent and nature of the experience of our executive officers and the nature of the relationships they have developed with real estate professionals and financial institutions are critical to the success of our business. We cannot assure stockholders of their continued employment with us. The loss of services of certain of our executive officers could harm our business and our prospects.
Our board of directors has adopted, and will likely in the future adopt, certain incentive plans to create incentives that will allow us to retain and attract the services of key employees. These incentive plans may be tied to the performance of our common stock and a decline in our stock price may result in us being unable to motivate and retain our management and these other employees. Our inability to motivate and retain these individuals could also harm our business and our prospects. Additionally, competition for experienced real estate professionals could require us to pay higher wages and provide additional benefits to attract qualified employees, which could result in higher compensation expenses to us.
If our ability to issue equity awards to employees is limited, it will require us to award greater cash compensation in relation to previous levels of cash compensation, which will reduce our liquidity and could impact our ability to retain key employees.
We have historically paid a substantial portion of our overall compensation in the form of equity awards. We may at times have limited availability under our incentive plans to issue equity awards to our employees. We may seek stockholder approval for additional equity awards and there is no assurance stockholders would grant such approval. In addition, we are required to issue equity awards to NSAM employees at NSAM’s request under the terms of our management agreement. To the extent we do not have sufficient equity awards available, we may have to compensate our employees in a greater proportion of cash relative to historical periods. Because CAD excludes equity-based compensation expense, payment of higher levels of cash relative to equity awards will have a negative impact on CAD and reduce our liquidity position. Additionally, the lack of availability of equity awards could impact our ability to retain employees as equity awards historically have been a significant component of our long-term incentives.
We are highly dependent on information systems and systems failures could significantly disrupt our business.
As a diversified CRE company, our business is highly dependent on information technology systems, including systems provided by NSAM and third parties for which we have no control. Various measures have been implemented to manage our risks related to the information technology systems, but any failure or interruption of our systems could cause delays or other problems in our activities, which could have a material adverse effect on our financial performance. Potential sources for disruption, damage or failure of our information technology systems include, without limitation, computer viruses, security breaches, human error, cyber attacks, natural disasters and defects in design.
Failure to implement effective information and cyber security policies, procedures and capabilities could disrupt our business and harm our results of operations.
We are dependent on the effectiveness of our information and cyber security policies, procedures and capabilities to protect our computer and telecommunications systems and the data that resides on or is transmitted through them. An externally caused information security incident, such as a hacker attack, virus or worm, or an internally caused issue, such as failure to control
access to sensitive systems, could materially interrupt business operations or cause disclosure or modification of sensitive or confidential information and could result in material financial loss, loss of competitive position, regulatory actions, breach of contracts, reputational harm or legal liability.
We have in the past and may continue to grow our business through acquisitions of assets or other companies which entails substantial risk.
We may determine to continue growing our business through the acquisition of assets or other companies. Such acquisitions entail substantial risk. During our due diligence of such acquisitions, we may not uncover all relevant liabilities and we may have limited, if any, recourse against the sellers. We may also incur significant transaction and integration costs in connection with acquisitions. Further, we may not successfully integrate the assets or company that we acquire into our business and operations, which could have a material adverse effect on our financial results and condition.
We may change our investment strategy without stockholder consent and make riskier investments.
We may change our investment strategy at any time without the consent of stockholders, which could result in our making investments that are different from and possibly riskier than the investments described in this Annual Report on Form 10-K. A change in our investment strategy may increase our exposure to interest rate and commercial real estate market fluctuations.
We may undergo future restructurings, including spin-offs of certain of our assets, which may not be successful.
We may in the future determine to restructure our organization and/or assets, including potentially spinning off certain of our assets as we did in 2014 with the NSAM Spin-off. Any such restructurings may not achieve the intended strategic and financial benefits or any benefits at all. In the event that any such restructuring does not achieve expected benefits, such restructuring could have a negative effect on our financial condition and our ability to make distributions to stockholders.
We believe CAD, a non-GAAP measure, provides a meaningful indicator of our operating performance; however, CAD should not be considered as an alternative to net income (loss) determined in accordance with U.S. GAAP as an indicator of operating performance.
Management uses CAD to evaluate our profitability and our board of directors will consider CAD in determining our quarterly cash distributions. CAD is a non-GAAP financial measure. We believe that CAD is useful because it adjusts net income (loss) for a variety of non-cash items. We calculate CAD by subtracting from or adding to net income (loss) attributable to common stockholders, non-controlling interests and the following items: depreciation and amortization items including depreciation and amortization, straight-line rental income or expense, amortization of above/below market leases, amortization of deferred financing costs, amortization of discount on financings and other and equity-based compensation; cash flow related to N-Star CDO equity interests; accretion of consolidated N-Star CDO bond discounts; non-cash net interest income in consolidated N-Star CDOs; unrealized gain (loss) from the change in fair value; realized gain (loss) on investments and other, excluding accelerated amortization related to sales of CDO bonds or other investments; provision for loan losses, net; impairment on depreciable property; bad debt expense; deferred tax benefit (expense); acquisition gains or losses; distributions and adjustments related to joint venture partners; transaction costs; foreign currency gains (losses); impairment on goodwill and other intangible assets; gains (losses) on sales; and one-time events pursuant to changes in U.S. GAAP and certain other non-recurring items. In future periods, such adjustments may include other one-time events pursuant to changes in U.S. GAAP and certain other non-recurring items. These items, if applicable, include any adjustments for unconsolidated ventures.
CAD should not be considered as an alternative to net income (loss), determined in accordance with U.S. GAAP, as an indicator of operating performance. In addition, our methodology for calculating CAD may differ from the methodologies used by other comparable companies, including other REITs, when calculating the same or similar supplemental financial measures and may not be comparable with these companies. For example, our calculation of CAD per share does not take into account any potential dilution from our exchangeable senior notes or warrants outstanding, or restricted stock units subject to performance metrics not yet achieved.
The use of estimates and valuations may be different from actual results, which could have a material effect on our consolidated financial statements.
We make various estimates that affect reported amounts and disclosures. Broadly, those estimates are used in measuring the fair value of certain financial instruments, establishing provision for loan losses and potential litigation liability. Market volatility may make it difficult to determine the fair value for certain of our assets and liabilities. Subsequent valuations, in light of factors then prevailing, may result in significant changes in the values of these financial instruments in future periods. In addition, at the time of any sales and settlements of these assets and liabilities, the price we ultimately realize will depend on the demand and liquidity in the market at that time for that particular type of asset and may be materially lower than our estimate of their current fair value. Estimates are based on available information and judgment. Therefore, actual values and results could differ from our estimates and that difference could have a material adverse effect on our consolidated financial statements.
Our distribution policy is subject to change.
Our board of directors determines an appropriate common stock distribution based upon numerous factors, including REIT qualification requirements, the amount of cash flow generated from operations, availability of existing cash balances, borrowing capacity under existing credit agreements, access to cash in the capital markets and other financing sources, our view of our ability to realize gains in the future through appreciation in the value of our assets, general economic conditions and economic conditions that more specifically impact our business or prospects. Our board of directors reviewed changes to our distribution policy on a quarterly basis in 2014 but may review such policy less frequently in the future. Future distribution levels are subject to further adjustment based upon any one or more of the risk factors set forth in this Annual Report on Form 10-K, as well as other factors that our board of directors may, from time-to-time, deem relevant to consider when determining an appropriate common stock distribution and our distribution level could remain flat or decline.
We may not be able to make distributions in the future.
Our ability to generate income and to make distributions may be adversely affected by the risks described in this Annual Report on Form 10-K and any document we file with the SEC. All distributions are made at the discretion of our board of directors, subject to applicable law, and depend on our earnings, our financial condition, maintenance of our REIT qualification and such other factors as our board of directors may deem relevant from time-to-time. We may not be able to make distributions in the future.
Our ability to make distributions is limited by the requirements of Maryland law.
Our ability to make distributions on our common stock is limited by the laws of Maryland. Under applicable Maryland law, a Maryland corporation may not make a distribution if, after giving effect to the distribution, the corporation would not be able to pay its liabilities as the liabilities become due in the usual course of business, or generally if the corporation’s total assets would be less than the sum of its total liabilities plus the amount that would be needed if the corporation were dissolved at the time of the distribution, to satisfy the preferential rights upon dissolution of the stockholders whose preferential rights are superior to those receiving the distribution. Accordingly, we may not make a distribution on our common stock if, after giving effect to the distribution, we would not be able to pay our liabilities as they become due in the usual course of business or generally if our total assets would be less than the sum of our total liabilities plus the amount that would be needed to satisfy the preferential rights upon dissolution of the holders of shares of any series of preferred stock then outstanding, if any, with preferences senior to those of our common stock.
Stockholders may experience substantial dilution.
We have in the past and may continue to undertake numerous and substantial offerings of our common stock and securities that are convertible into our common stock. If we continue to engage in such offerings, whether through the public markets or in private placements, our existing stockholders may experience immediate and substantial dilution in their percentage ownership of our outstanding common stock. Furthermore, stockholders may experience dilution in the value of their shares depending on the terms and pricing of any new issuances and the value of our assets at such time.
Stockholders have limited control over changes in our policies and operations, which increases the uncertainty and risks they face as stockholders.
Our board of directors determines our major policies, including our policies regarding growth, REIT qualification and distributions. Our board of directors may amend or revise these and other policies without a vote of the stockholders. We may change our investment policies without stockholder notice or consent, which could result in investments that are different than, or in different proportion than, those described in this Annual Report on Form 10-K. Under the Maryland General Corporation Law, or MGCL, and our charter, stockholders have a right to vote only on limited matters. Our board of directors’ broad discretion in setting policies and stockholders’ inability to exert control over those policies increases the uncertainty and risks stockholders face.
Risks Related to Regulatory Matters and Our REIT Tax Status
We are subject to substantial regulation, numerous contractual obligations and extensive internal policies and failure to comply with these matters could have a material adverse effect on our business, financial condition and results of operations.
We and our subsidiaries are subject to substantial regulation, numerous contractual obligations and extensive internal policies. Given our organizational structure, we are subject to regulation by the SEC, NYSE, IRS, and other federal, state and local governmental bodies and agencies. These regulations are extensive, complex and require substantial management time and attention. If we fail to comply with any of the regulations that apply to our business, we could be subjected to extensive investigations as well as substantial penalties and our business and operations could be materially adversely affected. Our lack of compliance with applicable law could result in, among other penalties, our ineligibility to contract with and receive revenue from the federal government or other governmental authorities and agencies. We also have numerous contractual obligations
that we must adhere to on a continuous basis to operate our business, the default of which could have a material adverse effect on our business and financial condition. We have also established internal policies designed to ensure that we manage our business in accordance with applicable law and regulation and in accordance with our contractual obligations. While we have designed policies to appropriately operate our business, these internal policies may not be effective in all regards and, further, if we fail to comply with our internal policies, we could be subjected to additional risk and liability.
The direct or indirect effects of the Dodd-Frank Act, enacted in July 2010 for the purpose of stabilizing or reforming the financial markets, may have an adverse effect on our interest rate hedging activities.
In July 2010, the Dodd-Frank Act became law in the United States. Title VII of the Dodd-Frank Act provides for significantly increased regulation of and restrictions on derivatives markets and transactions that could affect our interest rate hedging or other risk management activities, including: (i) regulatory reporting for swaps; (ii) mandated clearing through central counterparties and execution through regulated exchanges or electronic facilities for certain swaps; and (iii) margin and collateral requirements. Although the U.S. Commodity Futures Trading Commission has not yet finalized certain requirements, many other requirements have taken effect, such as swap reporting, the mandatory clearing of certain interest rate swaps and credit default swaps and the mandatory trading of certain swaps on swap execution facilities or exchanges. While the full impact of the Dodd-Frank Act on our interest rate hedging activities cannot be assessed until implementing rules and regulations are adopted and market practice develops, the requirements of Title VII may affect our ability to enter into hedging or other risk management transactions, may increase our costs in entering into such transactions and may result in us entering into such transactions on less favorable terms than prior to effectiveness of the Dodd-Frank Act and the rules promulgated thereunder. The occurrence of any of the foregoing events may have an adverse effect on our business.
Maintenance of our Investment Company Act exemption imposes limits on our operations.
Neither we nor any of our subsidiaries intend to register as an investment company under the Investment Company Act. We intend to make investments and conduct our operations so that we are not required to register as an investment company. If we were obligated to register as an investment company, we would have to comply with a variety of substantive requirements under the Investment Company Act that impose, among other things:
| |
| • | limitations on capital structure; |
| |
| • | restrictions on specified investments; |
| |
| • | prohibitions on transactions with affiliates; and |
| |
| • | compliance with reporting, recordkeeping, voting, proxy disclosure and other rules and regulations that would significantly increase our operating expenses. |
Section 3(a)(1)(A) of the Investment Company Act defines an investment company as any issuer that is or holds itself out as being engaged primarily in the business of investing, reinvesting or trading in securities. Section 3(a)(1)(C) of the Investment Company Act defines an investment company as any issuer that is engaged or proposes to engage in the business of investing, reinvesting, owning, holding or trading in securities and owns or proposes to acquire investment securities having a value exceeding 40% of the value of the issuer’s total assets (exclusive of U.S. government securities and cash) on an unconsolidated basis, which we refer to as the 40% test. Excluded from the term “investment securities,” among other things, are securities issued by majority-owned subsidiaries that are not themselves investment companies and are not relying on the exception from the definition of investment company in Section 3(c)(1) or Section 3(c)(7) of the Investment Company Act. Because we are a holding company that conducts its businesses through subsidiaries, the securities issued by our subsidiaries that rely on the exception from the definition of “investment company” in Section 3(c)(1) or 3(c)(7) of the Investment Company Act, together with any other investment securities we may own directly, may not have a combined value in excess of 40% of the value of our total assets on an unconsolidated basis. This requirement limits the types of businesses in which we may engage through these subsidiaries.
We must monitor our subsidiaries’ holdings to ensure that we satisfy the 40% test. Through our wholly-owned or majority-owned subsidiaries, we will be primarily engaged in the non-investment company businesses of these subsidiaries, namely the business of purchasing or otherwise acquiring mortgages and other interests in real estate.
Most of these subsidiaries will rely on the exception from the definition of an investment company under Section 3(c)(5)(C) of the Investment Company Act, which is available for entities “primarily engaged in the business of purchasing or otherwise acquiring mortgages and other liens on and interests in real estate.” This exemption generally requires that at least 55% of a subsidiary’s portfolio must be qualifying real estate assets and at least 80% of its portfolio must be qualifying real estate assets and real estate-related assets (and no more than 20% of miscellaneous assets). For purposes of the exclusions provided by Sections 3(c)(5)(C), we will classify our investments based in large measure on no-action letters issued by the SEC staff and other SEC interpretive guidance and, in the absence of SEC guidance, on our view of what constitutes a qualifying real estate asset and a real estate-related asset. These no-action positions were issued in accordance with factual situations that may be
substantially different from the factual situations we may face, and a number of these no-action positions were issued more than twenty years ago. In August 2011, the SEC issued a concept release in which it asked for comments on various aspects of Section 3(c)(5)(C), and, accordingly, the SEC or its staff may issue further guidance in the future. Future revisions to the Investment Company Act or further guidance from the SEC or its staff may force us to re-evaluate our portfolio and our investment strategy.
Certain of our other subsidiaries do not satisfy the 40% test, but instead rely on other exceptions and exemptions from registration as an investment company under the Investment Company Act that either limit the types of assets these subsidiaries may purchase or the manner in which these subsidiaries may acquire and sell assets. For instance, certain of our CDOs rely on the exemption from registration as an investment company under the Investment Company Act provided by Rule 3a-7 thereunder, which is available for certain structured financing vehicles. This exemption limits the ability of these CDOs to sell their assets and reinvest the proceeds from asset sales.
The loss of our Investment Company Act exemption could require us to register as an investment company or substantially change the way we conduct our business, either of which may have an adverse effect on us and the market price of our common stock.
On August 31, 2011, the SEC published a concept release (Release No. 29778, File No. S7-34-11, Companies Engaged in the Business of Acquiring Mortgages and Mortgage Related Instruments), pursuant to which it is reviewing whether certain companies that invest in mortgage-backed securities and rely on the exemption from registration under Section 3(c)(5)(C) of the Investment Company Act, such as us, should continue to be allowed to rely on such an exemption from registration. If the SEC takes action with respect to this exemption, these changes could mean that certain of our CDOs and other subsidiaries could no longer rely on the Section 3(c)(5)(C) exemption, and would have to rely on Section 3(c)(1) or 3(c)(7), which would mean that our investment in those subsidiaries would be investment securities. This could result in our failure to maintain our exemption from registration as an investment company.
If we fail to maintain an exemption, exception or other exclusion from registration as an investment company, either because of SEC interpretational changes or otherwise, we could, among other things, be required either: (i) to substantially change the manner in which we conduct our operations to avoid being required to register as an investment company; or (ii) to register as an investment company, either of which could have an adverse effect on us and the market price of our common stock. If we are required to register as an investment company under the Investment Company Act, we would become subject to substantial regulation with respect to our capital structure (including our ability to use leverage), management, operations, transactions with affiliated persons (as defined in the Investment Company Act), portfolio composition, including restrictions with respect to diversification and industry concentration and other matters.
Certain provisions of Maryland law may limit the ability of a third-party to acquire control of us. This could depress our stock price.
Certain provisions of the MGCL may have the effect of inhibiting a third-party from acquiring us or of impeding a change of control under circumstances that otherwise could provide our stockholders with the opportunity to realize a premium over the then-prevailing market price of such shares, including:
| |
| • | “business combination” provisions that, subject to limitations, prohibit certain business combinations between an “interested stockholder” (defined generally as any person who beneficially owns 10% or more of the voting power of our outstanding shares of voting stock or an affiliate or associate of the corporation who, at any time within the two-year period immediately prior to the date in question, was the beneficial owner of 10% or more of the voting power of the then outstanding stock of the corporation) or an affiliate of any interested stockholder and us for five years after the most recent date on which the stockholder becomes an interested stockholder, and thereafter imposes two super-majority stockholder voting requirements on these combinations; and |
| |
| • | “control share” provisions that provide that holders of “control shares” of our company (defined as voting shares of stock that, if aggregated with all other shares of stock owned or controlled by the acquirer, would entitle the acquirer to exercise one of three increasing ranges of voting power in electing directors) acquired in a “control share acquisition” (defined as the direct or indirect acquisition of issued and outstanding “control shares”) have no voting rights except to the extent approved by stockholders by the affirmative vote of at least two-thirds of all of the votes entitled to be cast on the matter, excluding all interested shares. |
Pursuant to the Maryland Business Combination Act, our board of directors has exempted any business combinations: (i) between us and NorthStar Capital Investment Corp. or any of its affiliates; and (ii) between us and any person, provided that any such business combination is first approved by our board of directors (including a majority of our directors who are not affiliates or associates of such person). Consequently, the five-year prohibition and the super-majority vote requirements do not apply to business combinations between us and any of them. As a result, such parties may be able to enter into business combinations with us that may not be in the best interest of stockholders, without compliance with the supermajority vote
requirements and the other provisions in the statute. Our bylaws contain a provision exempting from the Maryland Control Share Acquisition Act any and all acquisitions by any person of shares of our stock. There can be no assurance that these resolutions or exemptions will not be amended or eliminated at any time in the future.
Our authorized but unissued common and preferred stock and other provisions of our charter and bylaws may prevent a change in our control.
Our charter authorizes us to issue additional authorized but unissued shares of our common stock or preferred stock and authorizes our board of directors, without stockholder approval, to amend our charter to increase or decrease the aggregate number of shares of stock or the number of shares of stock of any class or series that we have the authority to issue. In addition, our board of directors may classify or reclassify any unissued shares of common stock or preferred stock and may set the preferences, rights and other terms of the classified or reclassified shares. Our board of directors could establish a series of common stock or preferred stock that could delay or prevent a transaction or a change in control that might involve a premium price for the common stock or otherwise be in the best interest of stockholders.
Our charter and bylaws also contain other provisions that may delay or prevent a transaction or a change in control that might involve a premium price for shares of our common stock or otherwise be in the best interest of stockholders.
Maryland law also allows a corporation with a class of equity securities registered under the Exchange Act and at least three independent directors to elect to be subject, by provision in its charter or bylaws or a resolution of its board of directors and notwithstanding any contrary provision in its charter or bylaws, to a classified board, unless its charter prohibits such an election. Our charter contains a provision prohibiting such an election to classify our board of directors under this provision of Maryland law. This may make us more vulnerable to a change in control. If stockholders voted to amend this charter provision and to classify our board of directors, the staggered terms of our directors could reduce the possibility of a tender offer or an attempt at a change in control even though a tender offer or change in control might be in the best interests of stockholders.
Our failure to continue to qualify as a REIT would subject us to federal income tax and reduce cash available for distribution to stockholders.
We intend to continue to operate in a manner so as to continue to qualify as a REIT for federal income tax purposes. Qualification as a REIT involves the application of highly technical and complex Internal Revenue Code provisions for which only a limited number of judicial and administrative interpretations exist. Even an inadvertent or technical mistake could jeopardize our REIT status. Our continued qualification as a REIT will depend on our satisfaction of certain asset, income, organizational, distribution, stockholder ownership and other requirements on a continuing basis.
Moreover, new tax legislation, administrative guidance or court decisions, in each instance potentially with retroactive effect, could make it more difficult or impossible for us to continue to qualify as a REIT. If we fail to continue to qualify as a REIT in any taxable year, we would be subject to federal and applicable state and local income tax on our taxable income at corporate rates. Losing our REIT status would reduce our net income available for investment or distribution to stockholders because of the additional tax liability. In addition, distributions to stockholders would no longer qualify for the dividends-paid deduction and we would no longer be required to make distributions. If this occurs, we might be required to borrow or liquidate some investments in order to pay the applicable tax.
If, for any reason, we failed to continue to qualify as a REIT and we were not entitled to relief under certain Internal Revenue Code provisions, we would be unable to elect REIT status for the four taxable years following the year during which we ceased to so qualify.
Complying with REIT requirements may force us to borrow funds to make distributions to stockholders or otherwise depend on external sources of capital to fund such distributions.
To continue to qualify as a REIT, we are required to distribute annually at least 90% of our taxable income, subject to certain adjustments, to stockholders. To the extent that we satisfy the distribution requirement, but distribute less than 100% of our taxable income, we will be subject to federal corporate income tax on our undistributed taxable income. In addition, we may elect to retain and pay income tax on our net long-term capital gain. In that case, a stockholder would be taxed on its proportionate share of our undistributed long-term gain and would receive a credit or refund for its proportionate share of the tax we paid. A stockholder, including a tax-exempt or foreign stockholder, would have to file a federal income tax return to claim that credit or refund. Furthermore, we will be subject to a 4% nondeductible excise tax if the actual amount that we distribute to stockholders in a calendar year is less than a minimum amount specified under federal tax laws. We anticipate that distributions generally will be taxable as ordinary income, although a portion of such distributions may be designated by us as long-term capital gain to the extent attributable to capital gain income recognized by us, or may constitute a return of capital to the extent that such distribution exceeds our earnings and profits as determined for tax purposes.
From time-to-time, we may generate taxable income greater than our net income (loss) for U.S. GAAP, due to among other things, amortization of capitalized purchase premiums, fair value adjustments and reserves. In addition, our taxable income
may be greater than our cash flow available for distribution to stockholders as a result of, among other things, repurchases of our outstanding debt at a discount and investments in assets that generate taxable income in advance of the corresponding cash flow from the assets (for example, if a borrower defers the payment of interest in cash pursuant to a contractual right or otherwise).
We believe that the former operating partnership of our predecessor properly elected to defer, under Section 108(i) of the Internal Revenue Code, the recognition of cancellation of indebtedness, or COD, income generated from repurchasing its debt at a discount. If the IRS successfully challenges that election, our predecessor may be treated as having failed to pay sufficient dividends to satisfy the 90% distribution requirement and/or avoid the corporate income tax and the 4% nondeductible excise tax. We may be required to correct any failure to meet the 90% distribution requirement by paying deficiency dividends to stockholders and an interest charge to the IRS in a later year.
If we do not have other funds available in the situations described in the preceding paragraphs, we could be required to borrow funds on unfavorable terms, sell investments at disadvantageous prices or find another alternative source of funds to make distributions sufficient to enable us to distribute enough of our taxable income to satisfy the REIT distribution requirement and to avoid corporate income tax and the 4% excise tax in a particular year. These alternatives could increase our costs or reduce our equity.
Because of the distribution requirement, it is unlikely that we will be able to fund all future capital needs, including capital needs in connection with investments, from cash retained from operations. As a result, to fund future capital needs, we likely will have to rely on third-party sources of capital, including both debt and equity financing, which may or may not be available on favorable terms or at all. Our access to third‑party sources of capital will depend upon a number of factors, including the market’s perception of our growth potential and our current and potential future earnings and cash distributions and the market price of our stock.
Our TRS structure increases our overall tax liability.
We have acquired interests in multiple portfolios of hotel and healthcare properties through joint ventures, the Griffin American merger and otherwise. Some of these properties are leased TRSs of ours, which, in turn, engage “eligible independent contractors” to operate such properties. Such an arrangement is referred to as a “RIDEA structure.” We refer to the TRS lessees in our RIDEA structures as our “TRS Lessees.” Our TRS Lessees are subject to federal, state and local income tax on their taxable income, which consists of the revenues from the hotel and healthcare properties leased by our TRS Lessees, net of the operating expenses for such properties and rent payments to us. Accordingly, although our ownership of our TRS Lessees allows us to participate in the operating income from our hotel and healthcare properties in addition to receiving rent, that operating income is fully subject to income tax. The after-tax net income of our TRS Lessees is available for distribution to us.
Our ownership of TRSs is limited and our transactions with our TRSs will cause us to be subject to a 100% penalty tax on certain income or deductions if those transactions are not conducted on arm’s-length terms.
A REIT may own up to 100% of the stock of one or more TRSs. A TRS may hold assets and earn income that would not be qualifying assets or income if held or earned directly by a REIT, including gross operating income from hotels and healthcare properties that are operated by eligible independent contractors pursuant to management agreements. Both the subsidiary and the REIT must jointly elect to treat the subsidiary as a TRS. A corporation of which a TRS directly or indirectly owns more than 35% of the voting power or value of the stock will automatically be treated as a TRS. Overall, no more than 25% of the value of a REIT's gross assets may consist of stock or securities of one or more TRSs. In addition, the TRS rules limit the deductibility of interest paid or accrued by a TRS to its parent REIT to assure that the TRS is subject to an appropriate level of corporate taxation. The rules also impose a 100% excise tax on certain transactions between a TRS and its parent REIT that are not conducted on an arm's-length basis.
Our TRSs are subject to federal, foreign, state and local income tax on their taxable income and their after-tax net income is available for distribution to us but is not required to be distributed to us. We believe that the aggregate value of the stock and securities of our TRSs is and will continue to be less than 25% of the value of our total gross assets (including our TRS stock and securities). Furthermore, we will monitor the value of our respective investments in our TRSs for the purpose of ensuring compliance with TRS ownership limitations. In addition, we will scrutinize all of our transactions with our TRSs to ensure that they are entered into on arm's-length terms to avoid incurring the 100% excise tax described above. There can be no assurance, however, that we will be able to comply with the 25% limitation discussed above or to avoid application of the 100% excise tax discussed above.
If our leases with our TRS Lessees are not respected as true leases for federal income tax purposes, we could fail to qualify as a REIT.
To qualify as a REIT, we are required to satisfy two gross income tests, pursuant to which specified percentages of our gross income must be passive income, such as rent. For the rent paid pursuant to the hotel and healthcare property leases with our TRS Lessees, which constitutes a significant portion of our gross income, to qualify for purposes of the gross income tests, the
leases must be respected as true leases for federal income tax purposes and must not be treated as service contracts, joint ventures or some other type of arrangement. We have structured our leases, and intend to structure any future leases, so that the leases will be respected as true leases for federal income tax purposes, but there can be no assurance that the IRS will agree with this characterization, not challenge this treatment or that a court would not sustain such a challenge. If the leases were not respected as true leases for federal income tax purposes, we could fail to satisfy either of the two gross income tests applicable to REITs and could fail to qualify for REIT status.
If our hotel and healthcare property managers do not qualify as “eligible independent contractors”, we could fail to qualify as a REIT.
Rent paid by a lessee that is a “related party tenant” of ours will not be qualifying income for purposes of the two gross income tests applicable to REITs. We lease all of our hotels and a substantial portion of our healthcare properties to our TRS Lessees. A TRS Lessee will not be treated as a “related party tenant” and will not be treated as directly operating a lodging facility to the extent the TRS Lessee leases properties from us that are managed by an “eligible independent contractor.” In addition, our TRS Lessees will fail to qualify as TRSs if they lease or own a lodging or healthcare facility that is not managed by an “eligible independent contractor.”
If our hotel and healthcare property managers do not qualify as “eligible independent contractors,” we would fail to qualify as a REIT. Each of the hotel and healthcare management companies that enters into a management contract with our TRS Lessees must qualify as an “eligible independent contractor” under the REIT rules in order for the rent paid to us by our TRS Lessees to be qualifying income for our REIT income test requirements and for our TRS Lessees to qualify as TRSs. Among other requirements, in order to qualify as an eligible independent contractor a manager must not own more than 35% of our outstanding shares (by value) and no person or group of persons can own more than 35% of our outstanding shares and the ownership interests of the manager, taking into account only owners of more than 5% of our shares and, with respect to ownership interests in such managers that are publicly traded, only holders of more than 5% of such ownership interests. Complex ownership attribution rules apply for purposes of these 35% thresholds. Although we intend to monitor ownership of our shares by our property managers and their owners, there can be no assurance that these ownership levels will not be exceeded.
If the NSAM Spin-off and related restructuring do not qualify as transactions that are generally tax-deferred for U.S. federal income tax purposes, we could fail to qualify as a REIT.
On June 30, 2014, we distributed to our common stockholders the common stock of NSAM, which owns our former asset management business, in the form of a tax-deferred distribution, or the Distribution. In connection with the Distribution, we received opinions of counsel to the effect that, among other things, the Distribution should be treated as a tax-deferred distribution under Section 355 of the Code. We did not seek or receive a private letter ruling from the IRS regarding the tax consequences of the Distribution. The opinions we received were based on our representations and certain assumptions. If the representations or assumptions were untrue or incomplete in any material respect, the Distribution may not be treated as a tax-deferred transaction. Moreover, the opinions we received were based on existing U.S. federal income tax law, which is subject to change, possibly on a retroactive basis, and are not binding on the IRS or any court. Accordingly, no assurance can be provided that the opinions we received will not be successfully challenged by the IRS.
If the Distribution did not qualify as a tax-deferred distribution for U.S. federal income tax purposes, we would recognize taxable gain equal to the excess of the fair market value of the NSAM common stock distributed over our adjusted tax basis in such stock. The gain from that taxable sale may cause us to fail to satisfy the 75% gross income test. Unless that failure qualifies for a statutory “REIT savings provision,” we would fail to qualify as a REIT for our 2014 taxable year and would be prohibited from electing REIT status for the following four taxable years.
Even if the Distribution otherwise qualifies as a tax-deferred distribution, it might be taxable to us under Section 355(e) of the Internal Revenue Code if 50% or more of either the total voting power or the total fair market value of our stock or the NSAM stock is acquired as part of a plan or series of related transactions that include the Distribution. If Section 355(e) of the Internal Revenue Code applies as a result of such an acquisition, we would recognize a taxable gain as described above.
We would incur adverse tax consequences if Griffin-American failed to qualify as a REIT for U.S. federal income tax purposes.
We recently completed the acquisition of Griffin-American via a merger. In connection with the closing of the merger, we received an opinion of counsel to the effect that Griffin-American qualified to be taxed as a REIT for U.S. federal income tax purposes through the closing date of the merger. In connection with the merger, Griffin-American ceased to exist as a separate REIT. However, if Griffin-American failed to qualify as a REIT prior to the merger, the combined company generally would succeed to or incur significant tax liabilities (including the significant tax liability that would result from the deemed sale of assets by Griffin-American pursuant to the merger). Additionally, the combined company could possibly lose its REIT qualification should the activities that disqualified Griffin-American continue after the merger.
For any taxable year that we fail to qualify as a REIT and are unable to avail ourselves of certain savings provisions set forth in the Internal Revenue Code, we would be subject to U.S. federal income tax at the regular corporate rates on all of our taxable income, whether or not we makes any distributions to our stockholders. Those taxes would reduce the amount of cash available for distribution to our stockholders or for reinvestment and would adversely affect our earnings. As a result, our failure to qualify as a REIT during any taxable year could have a material adverse effect upon us and our stockholders. Furthermore, unless certain relief provisions apply, we would not be eligible to elect REIT status again until the fifth taxable year that begins after the first year for which we failed to qualify.
We could fail to continue to qualify as a REIT and/or pay additional taxes if the IRS recharacterizes certain of our international investments.
We have recently made, and intend to continue to make, significant property investments in international jurisdictions. We have funded our equity in such investments through the use of instruments that we believe will be treated as equity for U.S. tax purposes. If the IRS disagreed with such characterization and was successful in recharacterizing the nature of our investments in international jurisdictions, we could fail to satisfy one or more of the asset and gross income tests applicable to REITs. Additionally, if the IRS recharacterized the nature of our investments and we were to take action to prevent such REIT test failures, the actions we would take could expose us to increased taxes both internationally and in the United States.
We could be subject to increased taxes if the tax authorities in various international jurisdictions were to modify tax rules and regulations on which we have relied in structuring our international investments.
We currently receive favorable tax treatment in various international jurisdictions through tax rules, regulations, tax authority rulings, and international tax treaties. Should changes occur to these rules, regulations, rulings or treaties, we may no longer receive such benefits, and consequently, the amount of taxes we pay with respect to our international investments may increase.
We could fail to continue to qualify as a REIT if the IRS successfully challenges our treatment of our mezzanine loans and repurchase agreements.
We intend to continue to operate in a manner so as to continue to qualify as a REIT for federal income tax purposes. However, qualification as a REIT involves the application of highly technical and complex Internal Revenue Code provisions for which only a limited number of judicial and administrative interpretations exist. If the IRS disagrees with the application of these provisions to our assets or transactions, including with respect to assets we have owned in past transactions, our REIT qualification could be jeopardized. For example, IRS Revenue Procedure 2003-65 provides a safe harbor pursuant to which a mezzanine loan, if it meets each of the requirements contained in Revenue Procedure 2003-65, will be treated by the IRS as a real estate asset for purposes of the REIT asset tests and interest derived from it will be treated as qualifying mortgage interest for purposes of the 75% income test. Although Revenue Procedure 2003-65 provides a safe harbor on which taxpayers may rely, it does not prescribe rules of substantive tax law. Moreover, our mezzanine loans typically do not meet all of the requirements for reliance on this safe harbor. We have invested, and will continue to invest, in mezzanine loans in a manner that we believe will enable us to continue to satisfy the REIT gross income and asset tests. In addition, we have entered into sale and repurchase agreements under which we nominally sold certain of our mortgage assets to a counterparty and simultaneously entered into an agreement to repurchase the sold assets. We believe that we will be treated for federal income tax purposes as the owner of the mortgage assets that are the subject of any such sale and repurchase agreement notwithstanding that we transferred record ownership of the assets to the counterparty during the term of the agreement. It is possible, however, that the IRS could assert that we did not own the mortgage assets during the term of the sale and repurchase agreement, in which case our ability to continue to qualify as a REIT could be adversely affected. Even if the IRS were to disagree with one or more of our interpretations and we were treated as having failed to satisfy one of the REIT qualification requirements, we could maintain our REIT qualification if our failure was excused under certain statutory savings provisions. However, there can be no guarantee that we would be entitled to benefit from those statutory savings provisions if we failed to satisfy one of the REIT qualification requirements, and even if we were entitled to benefit from those statutory savings provisions, we could be required to pay a penalty tax.
The failure of a mezzanine loan to qualify as a real estate asset could adversely affect our ability to continue to qualify as a REIT.
The IRS has issued Revenue Procedure 2003-65, which provides a safe harbor pursuant to which a mezzanine loan that is secured by interests in a pass-through entity will be treated by the IRS as a real estate asset for purposes of the REIT tests, and interest derived from such loan will be treated as qualifying mortgage interest for purposes of the REIT 75% gross income test. Although the Revenue Procedure provides a safe harbor on which taxpayers may rely, it does not prescribe rules of substantive tax law. We originated and acquired and will continue to originate and acquire mezzanine loans that do not satisfy all of the requirements for reliance on the safe harbor set forth in the Revenue Procedure. Consequently, there can be no assurance that the IRS will not challenge the tax treatment of such loans, which could jeopardize our ability to continue to qualify as a REIT.
Even if we remain qualified as a REIT, we may face other tax liabilities that reduce our cash flow.
Even if we remain qualified for taxation as a REIT, we may be subject to certain federal, state and local taxes on our income and assets, including taxes on any undistributed income, tax on income from certain activities conducted as a result of taking title to collateral, the federal alternative minimum tax and state or local income, property and transfer taxes, such as mortgage recording taxes. Any of these taxes would decrease cash available for distribution to stockholders. In addition, in order to meet the REIT qualification requirements, or to avert the imposition of a 100% tax that applies to certain gains derived by a REIT from dealer property or inventory, we may hold some of our assets through TRSs.
Complying with REIT requirements may cause us to forego otherwise attractive opportunities or liquidate otherwise attractive investments.
To continue to qualify as a REIT for federal income tax purposes, we must continually satisfy tests concerning, among other things, the sources of our income, the nature and diversification of our assets, the amounts we distribute to stockholders and the ownership of our stock. As discussed above, we may be required to make distributions to stockholders at disadvantageous times or when we do not have funds readily available for distribution. Additionally, we may be unable to pursue investments that would be otherwise attractive to us in order to satisfy the source of income requirements for qualifying as a REIT.
We must also ensure that, at the end of each calendar quarter, at least 75% of the value of our assets consists of cash, cash items, government securities and qualified real estate assets, including certain mortgage loans and mortgage-backed securities. The remainder of our investment in securities (other than government securities and qualified real estate assets) generally cannot include more than 10% of the outstanding voting securities of any one issuer or more than 10% of the total value of the outstanding securities of any one issuer. In addition, in general, no more than 5% of the value of our assets can consist of the securities of any one issuer (other than government securities and qualified real estate assets) and no more than 25% of the value of our total securities can be represented by securities of one or more TRSs.
If we fail to comply with these requirements at the end of any calendar quarter, we must correct such failure within 30 days after the end of the calendar quarter to avoid losing our REIT status and suffering adverse tax consequences, unless certain relief provisions apply. As a result, compliance with the REIT requirements may hinder our ability to operate solely on the basis of profit maximization and may require us to liquidate investments from our portfolio, or refrain from making, otherwise attractive investments. These actions could have the effect of reducing our income and amounts available for distribution to stockholders.
Modification of the terms of our CRE debt investments and mortgage loans underlying our CMBS in conjunction with reductions in the value of the real property securing such loans could cause us to fail to continue to qualify as a REIT.
Our CRE debt and securities investments have been and may continue to be materially affected by a weak real estate market and economy in general. As a result, many of the terms of our CRE debt and the mortgage loans underlying our CRE securities may be modified to avoid taking title to a property and for other reasons. Under the Internal Revenue Code, if the terms of a loan are modified in a manner constituting a “significant modification,” such modification triggers a deemed exchange of the original loan for the modified loan. In general, under applicable Treasury Regulations, or the Loan-to-Value Regulation, if a loan is secured by real property and other property and the highest principal amount of the loan outstanding during a taxable year exceeds the fair market value of the real property securing the loan determined as of the date we agreed to acquire the loan or the date we significantly modified the loan, a portion of the interest income from such loan will not be qualifying income for purposes of the 75% gross income test, but will be qualifying income for purposes of the 95% gross income test. Although the law is not entirely clear, a portion of the loan will likely be a non-qualifying asset for purposes of the 75% asset test. The non-qualifying portion of such a loan would be subject to, among other requirements, the requirement that a REIT not hold securities possessing more than 10% of the total value of the outstanding securities of any one issuer, or the 10% Value Test.
IRS Revenue Procedure 2014-51 provides a safe harbor pursuant to which we will not be required to redetermine the fair market value of the real property securing a loan for purposes of the gross income and asset tests discussed above in connection with a loan modification that is: (i) occasioned by a borrower default; or (ii) made at a time when we reasonably believe that the modification to the loan will substantially reduce a significant risk of default on the original loan. No assurance can be provided that all of our loan modifications have or will qualify for the safe harbor in Revenue Procedure 2014-51. To the extent we significantly modify loans in a manner that does not qualify for that safe harbor, we will be required to redetermine the value of the real property securing the loan at the time it was significantly modified. In determining the value of the real property securing such a loan, we generally will not obtain third-party appraisals, but rather will rely on internal valuations. No assurance can be provided that the IRS will not successfully challenge our internal valuations. If the terms of our CRE debt investments and mortgage loans underlying our CMBS are “significantly modified” in a manner that does not qualify for the safe harbor in Revenue Procedure 2014-51 and the fair market value of the real property securing such loans has decreased significantly, we could fail the 75% gross income test, the 75% asset test and/or the 10% Value Test. Unless we qualified for relief under certain Internal Revenue Code cure provisions, such failures could cause us to fail to continue to qualify as a REIT.
Our ability to invest in distressed debt may be limited by our intention to maintain our qualification as a REIT.
We have and may in the future acquire distressed debt, including distressed first mortgage loans, subordinate interests, mezzanine loans and CMBS. In general, under the Loan-to-Value Regulation, if a loan is secured by real property and other property and the highest principal amount of the loan outstanding during a taxable year exceeds the fair market value of the real property securing the loan as of the date we agreed to acquire the loan or the date we significantly modified the loan, a portion of the interest income from such a loan will not be qualifying income for purposes of the 75% gross income test, but will be qualifying income for purposes of the 95% gross income test. Although the law is not entirely clear, a portion of the loan will also likely be a non-qualifying asset for purposes of the 75% asset test. The non-qualifying portion of such a loan would be subject to, among other requirements, the 10% Value Test. IRS Revenue Procedure 2014-51 provides a safe harbor under which the IRS has stated that it will not challenge a REIT’s treatment of a loan as being, in part, a qualifying real estate asset in an amount equal to the lesser of: (i) the fair market value of the loan on the date of the relevant quarterly REIT asset testing date; or (ii) the greater of (a) the fair market value of the real property securing the loan determined as of the date the REIT committed to acquire or originate the loan; or (b) the current value of the real property securing the loan on the date of the relevant quarterly REIT testing date. Additionally, Revenue Procedure 2014-51 states that the IRS will treat a distressed debt as producing a significant amount of non-qualifying income for the 75% gross income test. Specifically, Revenue Procedure 2014-51 indicates that interest income on distressed debt will be treated as qualifying income based on the ratio of (i) fair market value of the real property securing the debt determined as of the date we committed to acquire the debt and (ii) the face amount of the debt (and not the purchase price of the debt). The face amount of a distressed debt will typically exceed the fair market value of the real property securing the debt on the date we commit to acquire the debt. Because distressed debt may produce a significant amount of non-qualifying income for purposes of the 75% gross income test and a significant portion of a distressed debt may be treated as a non-qualifying asset for the REIT asset tests once the debt increases in value, we may be limited in our ability to invest in distressed debt and maintain our qualification as a REIT.
Our investments in distressed debt may produce “phantom income” that will increase the amount of taxable income we have to distribute to satisfy the REIT distribution requirement and may cause us to sell assets, borrow or make taxable distributions of debt or equity securities to satisfy that requirement.
Our acquisition of distressed debt may cause us to recognize “phantom income” (or non-cash income) for federal income tax purposes. For example, if we acquire non-publicly traded distressed debt and then significantly modify that debt, we would recognize gain on the resulting deemed exchange equal to the difference between the adjusted issue price of the distressed debt and our adjusted tax basis in the distressed debt. Because we typically acquire distressed debt at a significant discount, our adjusted tax basis in the distressed debt typically is significantly lower than the adjusted issue price of the distressed debt. Accordingly, if we significantly modify non-publicly traded distressed debt, we may recognize a substantial amount of taxable income without receiving any cash. That “phantom income” will increase the amount of taxable income we are required to distribute to satisfy the REIT distribution requirement. To satisfy that requirement, we may have to sell assets or borrow funds at inopportune times or make taxable distributions of our debt or equity securities.
Our acquisition of CRE debt or securities investments may cause us to recognize income for federal income tax purposes even though no cash payments have been received on the debt investments.
We may acquire CRE debt or securities investments in the secondary market for less than their face amount. The amount of such discount will generally be treated as a “market discount’’ for federal income tax purposes. If these debt or securities investments provide for “payment-in-kind,’’ we may recognize “original issue discount,’’ or OID, for federal income tax purposes. Moreover, we may acquire distressed debt investments that are subsequently modified by agreement with the borrower. If the amendments to the outstanding debt constitute “significant modifications’’ under the applicable Treasury Regulations, the modified debt may be considered to have been reissued to us in a debt-for-debt exchange with the borrower. In that event, if the debt is considered to be “publicly-traded’’ for federal income tax purposes, the modified debt in our hands may be considered to have been issued with OID to the extent the fair market value of the modified debt is less than the principal amount of the outstanding debt. In the event the debt is not considered to be “publicly traded’’ for federal income tax purposes, we may be required to recognize taxable income to the extent that the principal amount of the modified debt exceeds our cost of purchasing it. Also, certain loans that we originate and certain previously modified debt we acquire in the secondary market may be considered to have been issued with the OID at the time it was modified.
In general, we will be required to accrue OID on a debt instrument as taxable income in accordance with applicable federal income tax rules even though no cash payments may be received on such debt instrument.
In the event a borrower with respect to a particular debt instrument encounters financial difficulty rendering it unable to pay stated interest as due, we may nonetheless be required to continue to recognize the unpaid interest as taxable income. Similarly, we may be required to accrue interest income with respect to subordinate mortgage-backed securities at the stated rate regardless of when their corresponding cash payments are received.
In order to meet the REIT distribution requirements, it might be necessary for us to arrange for short-term, or possibly long-term, borrowings, or to pay distributions in the form of our shares or other taxable in-kind distributions of property. We may need to borrow funds at times when the market conditions are unfavorable. Such borrowings could increase our costs and reduce the value of a stockholders’ investment. In the event in-kind distributions are made, a stockholder’s tax liabilities associated with an investment in our common stock for a given year may exceed the amount of cash we distribute to stockholders during such year.
Complying with REIT requirements may limit our ability to hedge effectively.
The REIT provisions of the Internal Revenue Code may limit our ability to hedge our operations effectively. Our aggregate gross income from non-qualifying hedges, fees and certain other non-qualifying sources cannot exceed 5% of our annual gross income. Additionally, our gross income from qualifying hedges entered into prior to July 31, 2008 constitutes non-qualifying income for purposes of the 75% gross income test. Consequently, our gross income from qualifying hedges entered into prior to July 31, 2008, along with other sources of non-qualifying income for purposes of the 75% gross income test, cannot exceed 25% of our annual gross income. As a result, we might have to limit our use of advantageous hedging techniques or implement those hedges through a TRS. Any hedging income earned by a TRS would be subject to federal, state and local income tax at regular corporate rates. This could increase the cost of our hedging activities or expose us to greater risks associated with interest rate or other changes than we would otherwise incur.
Liquidation of assets may jeopardize our REIT qualification.
To continue to qualify as a REIT, we must comply with requirements regarding our assets and our sources of income. If we are compelled to liquidate our investments to satisfy our obligations to our lenders, we may be unable to comply with these requirements, ultimately jeopardizing our qualification as a REIT, or we may be subject to a 100% prohibited transaction tax on any resulting gain if we sell assets that are treated as dealer property or inventory.
Legislative or regulatory tax changes could adversely affect us or stockholders.
At any time, the federal income tax laws can change. Laws and rules governing REITs or the administrative interpretations of those laws may be amended. Any of those new laws or interpretations may take effect retroactively and could adversely affect us or stockholders.
The prohibited transactions tax may limit our ability to engage in transactions, including disposition of assets and certain methods of securitizing loans, which would be treated as sales for federal income tax purposes.
A REIT’s net income from prohibited transactions is subject to a 100% tax. In general, prohibited transactions are sales or other dispositions of property, other than property that we took title to as a result of a default on a debt investment or lease and for which we make a foreclosure property election, but including loans, held primarily for sale to customers in the ordinary course of business. We might be subject to the prohibited transaction tax if we were to dispose of or securitize loans in a manner that is treated as a sale of the loans for federal income tax purposes. Therefore, in order to avoid the prohibited transactions tax, we may choose not to engage in certain sales of loans and may limit the structures we use for any securitization financing transactions even though such sales or structures might otherwise be beneficial to us. Additionally, we may be subject to the prohibited transaction tax upon a disposition of real property. Although a safe-harbor exception to prohibited transaction treatment is available, we cannot assure stockholders that we can comply with such safe harbor or that we will avoid owning property that may be characterized as held primarily for sale to customers in the ordinary course of our trade or business. Consequently, we may choose not to engage in certain sales of real property or may conduct such sales through a TRS.
It may be possible to reduce the impact of the prohibited transaction tax by conducting certain activities through a TRS. However, to the extent that we engage in such activities through a TRS, the income associated with such activities may be subject to a corporate income tax.
We also will not be able to use secured financing structures that would create taxable mortgage pools, other than in a TRS.
We may recognize substantial amounts of REIT taxable income, which we would be required to distribute to stockholders, in a year in which we are not profitable under U.S. GAAP principles or other economic measures.
We may recognize substantial amounts of REIT taxable income in years in which we are not profitable under U.S. GAAP or other economic measures as a result of the differences between U.S. GAAP and tax accounting methods. For example, we may recognize substantial amounts of COD income for federal income tax purposes (but not for U.S. GAAP purposes) due to discount repurchases of our liabilities, which could cause our REIT taxable income to exceed our U.S. GAAP income. Additionally, we may deduct our capital losses only to the extent of our capital gains and not against our ordinary income, in computing our REIT taxable income for a given taxable year. Finally, certain of our assets and liabilities are marked-to-market for U.S. GAAP purposes but not for tax purposes, which could result in losses for U.S. GAAP purposes that are not recognized in computing our REIT taxable income. Consequently, we could recognize substantial amounts of REIT taxable income and
would be required to distribute such income to stockholders in a year in which we are not profitable under U.S. GAAP or other economic measures.
We may distribute our common stock in a taxable distribution, in which case stockholders may sell shares of our common stock to pay tax on such distributions, placing downward pressure on the market price of our common stock.
We may make taxable distributions that are payable in cash and common stock. The IRS has issued private letter rulings to other REITs treating certain distributions that are paid partly in cash and partly in stock as taxable distributions that would satisfy the REIT annual distribution requirement and qualify for the dividends paid deduction for federal income tax purposes. Those rulings may be relied upon only by taxpayers to whom they were issued, but we could request a similar ruling from the IRS. In addition, the IRS issued a revenue procedure creating a temporary safe harbor that authorized publicly traded REITs to make elective cash/stock distributions, but that temporary safe harbor has expired. Accordingly, it is unclear whether and to what extent we will be able to make taxable distributions payable in cash and common stock. If we made a taxable dividend payable in cash and common stock, taxable stockholders receiving such distributions will be required to include the full amount of the dividend, which is treated as ordinary income to the extent of our current and accumulated earnings and profits, as determined for federal income tax purposes. As a result, stockholders may be required to pay income tax with respect to such distributions in excess of the cash distributions received. If a U.S. stockholder sells the common stock that it receives as a dividend in order to pay this tax, the sales proceeds may be less than the amount recorded in earnings with respect to the dividend, depending on the market price of our common stock at the time of the sale. Furthermore, with respect to certain non-U.S. stockholders, we may be required to withhold U.S. federal income tax with respect to such dividends, including in respect of all or a portion of such dividend that is payable in common stock. If we made a taxable dividend payable in cash and our common stock and a significant number of stockholders determine to sell shares of our common stock in order to pay taxes owed on dividends, it may put downward pressure on the trading price of our common stock.
We may lose our REIT status if the IRS successfully challenges our characterization of our income from our foreign TRSs.
We have elected to treat several Cayman Islands companies, including issuers in CDO transactions, as TRSs. We will likely be required to include in our income, even without the receipt of actual distributions, earnings from our investment in the foreign TRSs. Income inclusions from equity investments in foreign corporations are technically neither actual dividends nor any of the other enumerated categories of qualifying income for the 95% gross income test. However, the IRS has issued private letter rulings to other REITs holding that income inclusions from equity investments in foreign corporations would be treated as qualifying income for purposes of the 95% gross income test. Private letter rulings may be relied upon only by the taxpayers to whom they are issued and the IRS may revoke a private letter ruling. Based on those private letter rulings and advice of counsel, we intend to treat such income inclusions as qualifying income for purposes of the 95% gross income test. Nevertheless, no assurance can be provided that the IRS would not successfully challenge our treatment of such income as qualifying income. In the event that such income was determined not to qualify for the 95% gross income test, we could be subject to a penalty tax with respect to such income to the extent it exceeds 5% of our gross income or we could fail to continue to qualify as a REIT.
If our foreign TRSs are subject to U.S. federal income tax at the entity level, it would greatly reduce the amounts those entities would have available to distribute to us and that they would have available to pay their creditors.
There is a specific exemption from federal income tax for non-U.S. corporations that restrict their activities in the United States to trading stock and securities (or any activity closely related thereto) for their own account whether such trading (or such other activity) is conducted by the corporation or its employees through a resident broker, commission agent, custodian or other agent. We intend that our foreign TRSs will rely on that exemption or otherwise operate in a manner so that they will not be subject to U.S. federal income tax on their net income at the entity level. If the IRS succeeded in challenging that tax treatment, it would greatly reduce the amount that those foreign TRSs would have available to pay to their creditors and to distribute to us.
The stock ownership restrictions of the Internal Revenue Code for REITs and the 9.8% stock ownership limit in our charter may inhibit market activity in our stock and restrict our business combination opportunities.
To qualify as a REIT, five or fewer individuals, as defined in the Internal Revenue Code, may not own, actually or constructively, more than 50% in value of our issued and outstanding stock at any time during the last half of a taxable year. Attribution rules in the Internal Revenue Code determine if any individual or entity actually or constructively owns our stock under this requirement. Additionally, at least 100 persons must beneficially own our stock during at least 335 days of a taxable year. To help insure that we meet these tests, our charter restricts the acquisition and ownership of shares of our stock.
Our charter, with certain exceptions, authorizes our directors to take such actions as are necessary and desirable to preserve our qualification as a REIT. Unless exempted by our board of directors, no person, including entities, may own more than 9.8% of the value of our outstanding shares of stock of any class or series or more than 9.8% in value or number (whichever is more restrictive) of our outstanding shares of common stock. The board may not grant an exemption from these restrictions to any
proposed transferee whose ownership in excess of 9.8% of the value of our outstanding shares would result in the termination of our status as a REIT. Despite these restrictions, it is possible that there will be five or fewer individuals who own more than 50% in value of our outstanding shares, which could cause us to fail to continue to qualify as a REIT. These restrictions on transferability and ownership will not apply, however, if our board of directors determines that it is no longer in our best interest to continue to qualify as a REIT.
These ownership limits could delay or prevent a transaction or a change in control that might involve a premium price for our common stock or otherwise be in the best interest of the stockholders.
If any portion of our dividends is attributable to excess inclusion income, then the tax liability of our tax-exempt stockholders, foreign stockholders and stockholders with net operating losses will likely increase.
In general, dividend income that a tax-exempt entity receives from us should not constitute unrelated business taxable income, or UBTI, as defined in Section 512 of the Internal Revenue Code. If we realize excess inclusion income and allocate it to stockholders, however, then this income would be fully taxable as UBTI to a tax-exempt entity under Section 512 of the Internal Revenue Code. A foreign stockholder would generally be subject to U.S. federal income tax withholding on this income without reduction pursuant to any otherwise applicable income tax treaty. U.S. stockholders would not be able to offset such income with their net operating losses.
Although the law is not entirely clear, the IRS has taken the position that we are subject to tax at the highest corporate rate on the portion of our excess inclusion income equal to the percentage of our stock held in record name by “disqualified organizations” (generally tax-exempt investors, such as certain state pension plans and charitable remainder trusts, that are not subject to the tax on unrelated business taxable income). To the extent that our stock owned by “disqualified organizations” is held in street name by a broker-dealer or other nominee, the broker-dealer or nominee would be liable for a tax at the highest corporate rate on the portion of our excess inclusion income allocable to the stock held on behalf of the “disqualified organizations.” A regulated investment company or other pass-through entity owning our stock may also be subject to tax at the highest corporate tax rate on any excess inclusion income allocated to their record name owners that are “disqualified organizations.”
Excess inclusion income could result if a REIT held a residual interest in a real estate mortgage investment conduit, or REMIC. In addition, excess inclusion income also may be generated if a REIT issues liabilities with two or more maturities and the terms of the payments of these liabilities bear a relationship to the payments that the REIT received on mortgage loans or mortgage‑backed securities securing those liabilities. In May 2012, we adopted a policy that we would not acquire any assets or enter into any financing transactions that will produce excess inclusion income for stockholders. We also projected that our existing assets and financing transactions would not produce excess inclusion income for stockholders in 2012 or any future year. Accordingly, we expect that no portion of our dividends will constitute excess inclusion income. However, we could be wrong in our analysis of historic or new investments or we could affirmatively determine to modify our excess inclusion income policy in the future. If any portion of our dividends is attributable to excess inclusion income, then the tax liability of tax-exempt stockholders, foreign stockholders, stockholders with net operating losses, regulated investment companies and other pass-through entities whose record name owners are disqualified organizations and brokers-dealers and other nominees who hold stock on behalf of disqualified organizations will very likely increase.
Our qualification as a REIT could be jeopardized as a result of our interest in joint ventures or investment funds.
We currently own, and intend to continue to acquire, limited partner or non-managing member interests in partnerships and limited liability companies that are joint ventures or investment funds. If a partnership or limited liability company in which we own an interest takes or expects to take actions that could jeopardize our qualification as a REIT or require us to pay tax, we may be forced to dispose of our interest in such entity. In addition, it is possible that a partnership or limited liability company could take an action which could cause us to fail a REIT gross income or asset test, and that we would not become aware of such action in time to dispose of our interest in the partnership or limited liability company or take other corrective action on a timely basis. In that case, we could fail to continue to qualify as a REIT unless we are able to qualify for a statutory REIT “savings” provision, which may require us to pay a significant penalty tax to maintain our REIT qualification.
REIT distribution requirements could adversely affect our ability to execute our business plan.
We generally must distribute annually at least 90% of our REIT taxable income (which is determined without regard to the dividends paid deduction or net capital gain for this purpose) in order to continue to qualify as a REIT. We intend to make distributions to stockholders to comply with the REIT requirements of the Internal Revenue Code and to avoid corporate income tax and the 4% excise tax. We may be required to make distributions to stockholders at times when it would be more advantageous to reinvest cash in our business or when we do not have funds readily available for distribution. Thus, compliance with the REIT requirements may hinder our ability to operate solely on the basis of maximizing profits.
To maintain our REIT status, we may be forced to forgo otherwise attractive opportunities, which may delay or hinder our ability to meet our investment objectives and may reduce stockholders’ overall return.
To continue to qualify as a REIT, we must satisfy certain tests on an ongoing basis concerning, among other things, the sources of our income, nature of our assets and the amounts we distribute to stockholders. Compliance with the REIT requirements may hinder our ability to operate solely on the basis of maximizing profits and the value of a stockholders’ investment.
Distributions paid by REITs do not qualify for the reduced tax rates that apply to other corporate distributions.
The maximum tax rate for “qualified dividends” paid by corporations to individuals is 20%. Distributions paid by REITs, however, generally continue to be taxed at the normal ordinary income rate applicable to the individual recipient (subject to a maximum rate of 39.6%), rather than the preferential rate applicable to qualified dividends. The more favorable rates applicable to regular corporate distributions could cause potential investors who are individuals to perceive investments in REITs to be relatively less attractive than investments in the stocks of non-REIT corporations that pay qualified distributions, which could adversely affect the value of the stock of REITs, including our common stock.
We adopted a policy that we do not currently intend to generate excess inclusion income; however, there is no assurance that we will be able to avoid generating excess inclusion income, which could cause our common stock to become ineligible for inclusion in the Russell indices.
In May 2012, we reported that we changed our policy regarding the generation of excess inclusion income, which generally passes through to our tax-exempt stockholders as UBTI. Pursuant to this new policy, we do not intend to acquire any assets or enter into any financing transactions that will produce excess inclusion income for stockholders. We also projected that our existing assets and financing transactions would not generate excess inclusion income in 2012 or any future year. This policy change allowed our common stock to continue to be eligible for inclusion in the Russell indices, such as the Russell 2000 Index. Russell had indicated that it would remove from eligibility any security that has historically generated UBTI and where the issuer has not taken steps to prevent the future generation of such income. As a result of this policy, we may forgo investment opportunities that we would otherwise have considered to be attractive. Furthermore, we could be wrong in our analysis of historic or new investments or we could affirmatively determine to modify the policy in the future, thereby generating excess inclusion income, and, consequently, UBTI, for tax-exempt stockholders. If that is the case, certain of stockholders could suffer unanticipated adverse tax consequences. Furthermore, in such an event, our common stock could become ineligible for inclusion in the Russell indices, which could adversely affect demand for our common stock and its price.
Risks Related to the Spin-off of NorthStar Realty Europe Corp.
We may not be able to complete the spin-off on the terms anticipated or at all.
Our board of directors has unanimously approved a plan to spin-off a portfolio of approximately $2 billion of our European real estate properties into a separate publicly-traded REIT. The spin-off will be effected by means of a taxable pro rata special distribution of the outstanding shares of common stock of NRE, a newly formed company that will be a wholly owned subsidiary of ours, to the holders of our common stock on the record date for the distribution. NRE will be managed by NSAM pursuant to a long term management agreement, on similar terms as our management agreement with NSAM. NRE is expected to qualify as a REIT for federal income tax purposes. Although we expect the spin-off to be completed in the second half of 2015, there can be no assurance that the spin-off will be completed as anticipated or at all. Our ability to complete the spin-off is subject to, among other things, the registration statement on Form 10 to be filed becoming effective, the submission and approval of an application to list NRE’s common stock on the NYSE, obtaining all necessary consents and approvals, and the final approval and declaration of the distribution by our board of directors. A failure to complete the spin-off could negatively affect the price of our common stock. We have the right not to complete the spin-off if, at any time, our board of directors determines, in its sole discretion, that the spin-off is not in our best interests or that market conditions are such that it is not advisable to separate NRE from us. Stockholder approval is not required and will not be sought in connection with the contemplated spin-off.
The spin-off may not have the benefits we anticipate.
The spin-off of European real estate properties into a separate, public REIT may not have the full or any strategic and financial benefits that we expect or such benefits may be delayed or may not materialize at all. The anticipated benefits of the spin-off are based on a number of assumptions, which may prove incorrect. For example, we believe that investors and analysts will regard NRE’s focused European investment strategy more favorably as a separate company than as part of our existing portfolio and strategy and thus place a greater value on NRE as a standalone REIT than as a business that is a part of our company and may place a value on us after the spin-off that does not properly reflect our enterprise value after the spin-off. In the event that the spin-off does not have these and other expected benefits, the costs associated with the transaction, including aggregate fees payable to NSAM and an expected increase in general and administrative expenses, could have a negative effect on our financial condition and our and NRE’s ability to make distributions to the stockholders of each company.
The combined post-spin-off value of us and NRE common stock may not equal or exceed the pre-spin-off value of our common stock.
After the spin-off, our common stock will continue to be listed and traded on the NYSE. NRE’s common stock is expected to be listed on the NYSE under the symbol “NRE.” We cannot assure that the combined value of us and NRE after the spin-off, as adjusted for any changes for the combined capitalization of us or NRE, will be equal to or greater than the value of our common stock prior to the spin-off. Until the market has fully evaluated our business without NRE, the value of our common stock may fluctuate significantly. Similarly, until the market has fully evaluated the business of NRE, the value of its common stock may fluctuate significantly.
NRE may not be able to successfully implement its business strategy.
Assuming the spin-off is completed, there can be no assurance that NRE will be able to generate sufficient returns to pay its operating expenses and make satisfactory distributions to its stockholders, or any distributions at all, once it commences operations as an independent company. NRE’s financial condition, results of operations and cash flows will be affected by the expenses it will incur as a stand-alone public company, including fees paid to NSAM, as its manager, as well as legal, accounting, compliance and other costs associated with being a public company with equity securities traded on the NYSE. In addition, its results of operations and its ability to make or sustain distributions to its stockholders depend on, among other factors, the availability of opportunities to acquire attractive assets in Europe, the level and volatility of interest rates, the availability of adequate short- and long-term financing, conditions in the real estate market, the financial markets and economic conditions, particularly in Europe. Furthermore, most of our expertise to date is in the United States and neither we nor NSAM have owned or managed substantial assets over the long term in international markets. NRE’s ability to achieve its investment objectives and to make distributions to stockholders will depend in substantial part upon the performance of NSAM and its ability to provide NRE with asset management and other services. After the spin-off, we will not be required, and do not intend, to provide NRE with funds to finance its working capital or other cash requirements, so NRE would need to obtain additional financing from banks, through public offerings or private placements of debt or equity securities, strategic relationships or other arrangements.
Our agreements with NRE may not reflect terms that would have resulted from arm’s-length negotiations among unaffiliated third parties.
The terms of the agreements related to NRE’s separation from us, including a separation and distribution agreement and a management agreement between our manager and NRE, will not be negotiated exclusively among unaffiliated third parties. Such terms will be proposed by the officers and employees of us and our manager and are expected to be approved by our board of directors. As a result, these terms may be less favorable to us than the terms that would have resulted from arm’s-length negotiations among unaffiliated third parties, including the allocation of expenses and fees payable to NSAM by us and NRE following the spin-off.
For example, the terms of NRE’s management agreement with our manager will be substantially similar to the terms of our management agreement with NSAM. As a result, our manager will be entitled to earn a management fee from NRE and will be eligible to receive incentive compensation based in part upon NRE’s achievement of hurdles and without regard to our prior performance.
The distribution of NRE common stock will not qualify for tax-deferred treatment and may be taxable to you as a dividend; however, the tax impact will not be calculated until after the end of the 2015 calendar year.
The distribution of NRE common stock will not qualify for tax-deferred treatment. An amount equal to the fair market value of the shares of NRE common stock received by you on the distribution date (assuming you are a stockholder of us as of the applicable record date), including any fractional shares deemed to be received on the distribution date, will be treated as a taxable dividend to the extent of your share of any of our current or accumulated earnings and profits for the year of the distribution. Any fair market value in the excess of our current or accumulated earnings and profits will be treated first as a non-taxable return of capital to the extent of your tax adjusted basis in our common stock and then as capital gain. The distribution will not include a distribution of cash, except for certain cash in lieu of fractional shares of NRE common stock, and, thus, you will have to obtain cash from other sources to pay the income tax on this income. In addition, we or other applicable withholding agents may be required or permitted to withhold at the applicable rate on all or a portion of the distribution payable to non-U.S. stockholders, and any such withholding would be satisfied by us or such agent withholding by selling a portion of the NRE stock otherwise distributable to non-U.S. stockholders. Such non-U.S. stockholders may bear brokerage fees or other costs from this withholding procedure. Your adjusted tax basis in our shares held at the time of the distribution will be reduced (but not below zero) to the extent the fair market value of the shares of NRE common stock distributed by us to you in the distribution exceeds your share of our current and accumulated earnings and profits. Your holding period for your shares of our common stock will not be affected by the distribution. We will not be able to advise you of the amount of our earnings and profits until after the end of the 2015 calendar year.
Although we will be ascribing a value to NRE’s shares in the distribution for tax purposes, and will report that value to stockholders and the Internal Revenue Service (the “IRS”), this valuation is not binding on the IRS or any other taxing authority. These taxing authorities could ascribe a higher valuation to such shares, particularly if NRE’s stock trades at prices significantly above the value ascribed to such shares by us in the period following the distribution. Such a higher valuation may cause a larger reduction in the tax basis of your shares of us or may cause you to recognize additional dividend or capital gain income. You are urged to consult your tax advisor as to the particular tax consequences of the distribution to you.
The spin-off could result in increased competition for us for certain desirable European real estate properties.
In connection with the spin-off, NRE will participate as an additional managed company in the allocation of investment opportunities by NSAM. Following the spin-off, NRE’s business strategy will be focused on investing primarily on high quality real estate assets in major markets in the UK and Continental Europe. Our investment strategy to acquire diversified CRE assets across multiple asset classes that we expect will generate attractive risk-adjusted returns. Although NRE’s investment strategy is more targeted than ours, our target investments may overlap with those of NRE’s and other companies managed by NSAM. Therefore, investment opportunities that are suitable for us may also be suitable for NRE and other companies managed by NSAM, and may result in limiting our opportunities to invest in properties that could have a positive effect on our financial condition and operating results.
Item 1B. Unresolved Staff Comments
None.
Item 2. Properties
Our properties are part of our real estate segment, except for one REO included in our real estate debt segment, and are described under Item 1. “Business - Our Investments.” The following table presents information with respect to our real estate investments as of December 31, 2014 (dollars in thousands):
|
| | | | | | | | | | | | | | | | | |
| Location | | Capacity | | Percentage Leased/Occupied | | Number of Properties | | Lease Expiration Date (1) | | Gross Carrying Value (2) | | Borrowings |
| Healthcare | | | | | | | | | | | | |
| Medical Office Building | | Square Feet | | | | | | | | | | |
| Alabama | | 147,157 |
| | 90% | | 2 | | Various | | $ | 45,745 |
| | $ | 33,926 |
|
| Arkansas | | 121,205 |
| | 68% | | 5 | | Various | | 155,448 |
| | 15,481 |
|
| Arizona | | 59,808 |
| | 57% | | 1 | | Various | | 10,962 |
| | 8,088 |
|
| California | | 228,159 |
| | 88% | | 4 | | Various | | 60,882 |
| | 57,917 |
|
| Colorado | | 321,100 |
| | 91% | | 8 | | Various | | 60,939 |
| | 62,576 |
|
| Florida | | 200,870 |
| | 76% | | 5 | | Various | | 50,258 |
| | 41,132 |
|
| Georgia | | 372,744 |
| | 91% | | 13 | | Various | | 140,003 |
| | 79,407 |
|
| Hawaii | | 22,751 |
| | 91% | | 1 | | Jun-17 | | 6,204 |
| | 8,814 |
|
| Idaho | | 76,415 |
| | 100% | | 1 | | Various | | 6,876 |
| | 24,215 |
|
| Illinois | | 364,864 |
| | 89% | | 7 | | Various | | 83,459 |
| | 80,395 |
|
| Indiana | | 1,213,806 |
| | 94% | | 33 | | Various | | 426,485 |
| | 264,989 |
|
| Louisiana | | 203,886 |
| | 86% | | 4 | | Various | | 51,072 |
| | 35,393 |
|
| Michigan | | 137,486 |
| | 87% | | 3 | | Various | | 31,184 |
| | 33,971 |
|
| Minnesota | | 34,531 |
| | 100% | | 2 | | Mar-16 | | 6,861 |
| | 7,362 |
|
| Nevada | | 64,866 |
| | 98% | | 1 | | Various | | 8,969 |
| | 19,179 |
|
| New Jersey | | 67,537 |
| | 100% | | 1 | | Various | | 65,482 |
| | 31,771 |
|
| New Mexico | | 53,219 |
| | 100% | | 3 | | Nov-17 | | 19,628 |
| | 15,905 |
|
| New York | | 362,037 |
| | 100% | | 6 | | Dec-33 | | 102,344 |
| | 154,082 |
|
| North Carolina | | 121,939 |
| | 100% | | 2 | | Various | | 30,433 |
| | 36,877 |
|
| Ohio | | 272,392 |
| | 94% | | 5 | | Various | | 65,827 |
| | 28,332 |
|
| Oklahoma | | 62,383 |
| | 100% | | 2 | | Jul-23 | | 77,165 |
| | 11,944 |
|
| South Carolina | | 90,330 |
| | 77% | | 2 | | Various | | 10,458 |
| | 10,438 |
|
| Tennessee | | 263,658 |
| | 97% | | 5 | | Various | | 80,101 |
| | 78,860 |
|
| Texas | | 1,011,175 |
| | 91% | | 30 | | Various | | 288,245 |
| | 234,247 |
|
| Washington | | 95,670 |
| | 97% | | 1 | | Various | | 10,876 |
| | 22,548 |
|
| Total Medical Office Building | | 5,969,988 |
| | 91% | | 147 | | | | 1,895,906 |
| | 1,397,849 |
|
| | | | | | | | | | | | | |
Skilled Nursing Facilities(3) | | | | | | | | | | | | |
| Alabama | | 46,108 |
| | 100% | | 1 | | Jan-27 | | 9,925 |
| | 9,783 |
|
| Arizona | | 39,669 |
| | 100% | | 1 | | Apr-26 | | 18,429 |
| | 11,623 |
|
| California | | 139,012 |
| | 100% | | 5 | | Jul-24 | | 47,960 |
| | 39,956 |
|
| Florida | | 984,573 |
| | 100% | | 22 | | Dec-25 | | 271,662 |
| | 181,771 |
|
| Georgia | | 270,465 |
| | 100% | | 7 | | Jan-27 | | 131,504 |
| | 108,001 |
|
| Illinois | | 708,075 |
| | 100% | | 10 | | Apr-22 | | 140,349 |
| | 81,359 |
|
| Indiana | | 752,706 |
| | 100% | | 19 | | Jun-17 | | 115,708 |
| | 95,295 |
|
| Kentucky | | 67,706 |
| | 100% | | 1 | | Mar-25 | | 13,920 |
| | 10,056 |
|
| Louisiana | | 66,177 |
| | 100% | | 1 | | Jan-27 | | 24,234 |
| | 20,341 |
|
| Maryland | | 37,076 |
| | 100% | | 1 | | Dec-20 | | 10,922 |
| | 7,313 |
|
| Massachusetts | | 90,783 |
| | 100% | | 3 | | May-28 | | 13,438 |
| | 18,486 |
|
| Michigan | | 69,205 |
| | 100% | | 2 | | Dec-20 | | 12,944 |
| | 8,668 |
|
| North Carolina | | 67,164 |
| | 100% | | 2 | | Mar-25 | | 12,026 |
| | 7,692 |
|
| Oregon | | 119,206 |
| | 100% | | 6 | | May-26 | | 36,456 |
| | 28,238 |
|
| Pennsylvania | | 829,305 |
| | 100% | | 11 | | Mar-29 | | 230,881 |
| | 203,426 |
|
| Tennessee | | 146,132 |
| | 100% | | 4 | | Nov-24 | | 52,479 |
| | 43,808 |
|
| Virginia | | 332,199 |
| | 100% | | 9 | | Oct-23 | | 89,147 |
| | 61,730 |
|
| Washington | | 111,005 |
| | 100% | | 3 | | May-26 | | 16,689 |
| | 15,016 |
|
| Total Skilled Nursing Facilities | | 4,876,566 |
| | 100% | | 108 | | | | 1,248,673 |
| | 952,562 |
|
| | | | | | | | | | | | | |
| Assisted Living Facilities-RIDEA | | | | | | | | | | | | |
| Alabama | | 39,656 |
| | 93% | | 1 | | Dec-25 | | 7,393 |
| | 4,540 |
|
| Arizona | | 93,477 |
| | 84% | | 1 | | Dec-25 | | 12,588 |
| | 8,998 |
|
| California | | 172,760 |
| | 86% | | 6 | | Apr-23 | | 66,487 |
| | 34,463 |
|
| Colorado | | 388,035 |
| | 97% | | 2 | | Aug-31 | | 101,347 |
| | 109,904 |
|
| Georgia | | 63,693 |
| | 96% | | 1 | | Nov-19 | | 8,217 |
| | 7,050 |
|
| Illinois | | 1,158,558 |
| | 94% | | 22 | | Aug-26 | | 215,683 |
| | 183,379 |
|
| Kansas | | 81,810 |
| | 86% | | 1 | | Mar-21 | | 13,155 |
| | 5,428 |
|
| Massachussets | | 55,301 |
| | 88% | | 5 | | May-28 | | 12,198 |
| | 10,674 |
|
| Nebraska | | 26,683 |
| | 96% | | 1 | | Nov-19 | | 5,944 |
| | 2,609 |
|
| North Carolina | | 47,494 |
| | 89% | | 2 | | Dec-25 | | 17,426 |
| | 11,132 |
|
|
| | | | | | | | | | | | | | | | | |
| Location | | Capacity | | Percentage Leased/Occupied | | Number of Properties | | Lease Expiration Date (1) | | Gross Carrying Value (2) | | Borrowings |
| | | Square Feet | | | | | | | | | | |
| Ohio | | 949,312 |
| | 91% | | 30 | | Jun-30 | | $ | 217,803 |
| | $ | 202,061 |
|
| Oklahoma | | 208,251 |
| | 82% | | 5 | | Mar-21 | | 30,243 |
| | 9,658 |
|
| Oregon | | 590,159 |
| | 89% | | 15 | | Dec-25 | | 129,566 |
| | 101,278 |
|
| South Carolina | | 58,909 |
| | 93% | | 1 | | Dec-25 | | 21,137 |
| | 16,184 |
|
| Tennessee | | 103,490 |
| | 93% | | 2 | | Jun-21 | | 26,278 |
| | 15,914 |
|
| Texas | | 748,997 |
| | 92% | | 8 | | Oct-25 | | 156,907 |
| | 119,097 |
|
| Washington | | 233,879 |
| | 94% | | 6 | | Mar-25 | | 62,043 |
| | 43,892 |
|
| Total Assisted Living Facilities-RIDEA | | 5,020,464 |
| | 91% | | 109 | | | | 1,104,415 |
| | 886,261 |
|
| | | | | | | | | | | | | |
| Assisted Living Facilities | | | | | | | | | | | | |
| Illinois | | 55,498 |
| | 100% | | 1 | | Dec-21 | | 6,247 |
| | 6,106 |
|
| Indiana | | 289,071 |
| | 100% | | 9 | | Jun-17 | | 36,920 |
| | 25,835 |
|
| Florida | | 29,677 |
| | 100% | | 2 | | Dec-27 | | 550 |
| | 764 |
|
| Minnesota | | 215,428 |
| | 100% | | 11 | | Aug-24 | | 51,567 |
| | 37,800 |
|
| North Carolina | | 229,359 |
| | 100% | | 6 | | Dec-27 | | 123,586 |
| | 95,506 |
|
| Oregon | | 549,120 |
| | 100% | | 10 | | May-24 | | 102,137 |
| | 79,145 |
|
| United Kingdom | | 961,915 |
| | 100% | | 44 | | Sep-28 | | 449,812 |
| | 348,588 |
|
| Total Assisted Living Facilities | | 2,330,068 |
| | 100% | | 83 | | | | 770,819 |
| | 593,744 |
|
| | | | | | | | | | | | | |
| Hospitals | | | | | | | | | | | | |
| California | | 295,547 |
| | 100% | | 5 | | Sep-27 | | 115,751 |
| | 112,290 |
|
| Georgia | | 31,067 |
| | 100% | | 1 | | Sep-33 | | 19,435 |
| | 14,626 |
|
| Louisiana | | 26,423 |
| | 100% | | 1 | | Jan-26 | | 11,144 |
| | 12,931 |
|
| Missouri | | 83,858 |
| | 100% | | 3 | | Feb-32 | | 34,368 |
| | 33,708 |
|
| Oklahoma | | 37,466 |
| | 100% | | 1 | | Nov-21 | | 20,223 |
| | 12,398 |
|
| Texas | | 191,445 |
| | 100% | | 2 | | Various | | 35,103 |
| | 37,975 |
|
| Utah | | 34,897 |
| | 100% | | 1 | | Sep-33 | | 14,850 |
| | 15,595 |
|
| Total Hospitals | | 700,703 |
| | 100% | | 14 | | | | 250,874 |
| | 239,523 |
|
Total Healthcare(4) | | 18,897,789 |
| | 95% | | 461 | | | | 5,270,687 |
| | 4,069,939 |
|
| | | | | | | | | | | | | |
| Hotels | | | | | | | | | | | | |
| Marriott | | Rooms | | | | | | | | | | |
| Arizona | | 418 |
| | NA | | 3 | | NA | | 49,212 |
| | 37,976 |
|
| California | | 1,618 |
| | NA | | 12 | | NA | | 284,154 |
| | 252,705 |
|
| Colorado | | 287 |
| | NA | | 2 | | NA | | 50,978 |
| | 47,400 |
|
| Connecticut | | 447 |
| | NA | | 4 | | NA | | 44,429 |
| | 35,170 |
|
| Florida | | 812 |
| | NA | | 6 | | NA | | 88,232 |
| | 68,794 |
|
| Georgia | | 838 |
| | NA | | 6 | | NA | | 103,902 |
| | 73,569 |
|
| Illinois | | 339 |
| | NA | | 2 | | NA | | 47,569 |
| | 31,839 |
|
| Kentucky | | 176 |
| | NA | | 2 | | NA | | 19,153 |
| | 18,680 |
|
| Louisiana | | 225 |
| | NA | | 2 | | NA | | 32,093 |
| | 31,148 |
|
| Maryland | | 715 |
| | NA | | 5 | | NA | | 74,253 |
| | 66,280 |
|
| Maine | | 78 |
| | NA | | 1 | | NA | | 10,951 |
| | 10,000 |
|
| Michigan | | 809 |
| | NA | | 6 | | NA | | 109,294 |
| | 90,334 |
|
| New Jersey | | 1,402 |
| | NA | | 9 | | NA | | 206,256 |
| | 186,208 |
|
| New York | | 439 |
| | NA | | 4 | | NA | | 65,558 |
| | 53,614 |
|
| North Carolina | | 427 |
| | NA | | 3 | | NA | | 46,520 |
| | 33,049 |
|
| Ohio | | 441 |
| | NA | | 3 | | NA | | 50,622 |
| | 34,464 |
|
| Oklahoma | | 80 |
| | NA | | 1 | | NA | | 7,010 |
| | 7,377 |
|
| Pennsylvania | | 460 |
| | NA | | 4 | | NA | | 62,416 |
| | 52,254 |
|
| Tennessee | | 459 |
| | NA | | 3 | | NA | | 62,296 |
| | 50,919 |
|
| Texas | | 2,425 |
| | NA | | 20 | | NA | | 301,889 |
| | 261,838 |
|
| Virginia | | 1,473 |
| | NA | | 11 | | NA | | 152,810 |
| | 131,109 |
|
| Washington | | 664 |
| | NA | | 5 | | NA | | 136,601 |
| | 123,151 |
|
| Total Marriott | | 15,032 |
| | | | 114 | | | | 2,006,198 |
| | 1,697,878 |
|
| | | | | | | | | | | | | |
| Hilton | | | | | | | | | | | | |
| California | | 382 |
| | NA | | 4 | | NA | | 49,183 |
| | 43,237 |
|
| Colorado | | 281 |
| | NA | | 2 | | NA | | 30,700 |
| | 27,688 |
|
| Connecticut | | 157 |
| | NA | | 1 | | NA | | 18,896 |
| | 14,300 |
|
|
| | | | | | | | | | | | | | | | | |
| Location |
| Capacity |
| Percentage Leased/Occupied |
| Number of Properties | | Lease Expiration Date (1) |
| Gross Carrying Value (2) |
| Borrowings |
| | | Rooms | | | | | | | | | | |
| Florida | | 202 |
| | NA | | 2 | | NA | | $ | 28,473 |
| | $ | 25,435 |
|
| Georgia | | 136 |
| | NA | | 1 | | NA | | 12,175 |
| | 10,110 |
|
| Kentucky | | 173 |
| | NA | | 1 | | NA | | 36,147 |
| | 34,075 |
|
| Louisiana | | 115 |
| | NA | | 1 | | NA | | 14,527 |
| | 11,476 |
|
| Maryland | | 83 |
| | NA | | 1 | | NA | | 7,356 |
| | 5,800 |
|
| New Jersey | | 142 |
| | NA | | 1 | | NA | | 24,184 |
| | 18,216 |
|
| New Mexico | | 151 |
| | NA | | 1 | | NA | | 25,545 |
| | 19,582 |
|
| New York | | 571 |
| | NA | | 4 | | NA | | 108,678 |
| | 91,958 |
|
| North Carolina | | 424 |
| | NA | | 3 | | NA | | 67,562 |
| | 55,104 |
|
| Ohio | | 86 |
| | NA | | 1 | | NA | | 11,502 |
| | 8,835 |
|
| Pennsylvania | | 150 |
| | NA | | 1 | | NA | | 16,477 |
| | 15,450 |
|
| Texas | | 173 |
| | NA | | 2 | | NA | | 15,943 |
| | 14,140 |
|
| Total Hilton | | 3,226 |
| | | | 26 | | | | 467,348 |
| | 395,406 |
|
| | | | | | | | | | | | | |
| Starwood | | | | | | | | | | | | |
| Alabama | | 111 |
| | NA | | 1 | | NA | | 17,779 |
| | 16,850 |
|
| Florida | | 216 |
| | NA | | 1 | | NA | | 31,647 |
| | 30,550 |
|
| Maryland | | 153 |
| | NA | | 1 | | NA | | 10,869 |
| | 9,500 |
|
| New Jersey | | 224 |
| | NA | | 1 | | NA | | 39,308 |
| | 31,160 |
|
| North Carolina | | 130 |
| | NA | | 1 | | NA | | 20,264 |
| | 19,491 |
|
| Total Starwood | | 834 |
| | | | 5 | | | | 119,867 |
| | 107,551 |
|
| | | | | | | | | | | | | |
| Hyatt | | | | | | | | | | | | |
| California | | 254 |
| | NA | | 2 | | NA | | 81,147 |
| | 72,250 |
|
| Massachusetts | | 157 |
| | NA | | 1 | | NA | | 31,220 |
| | 29,055 |
|
| New Jersey | | 116 |
| | NA | | 1 | | NA | | 11,926 |
| | 7,680 |
|
| Texas | | 279 |
| | NA | | 2 | | NA | | 31,160 |
| | 28,850 |
|
| Total Hyatt | | 806 |
| | | | 6 | | | | 155,453 |
| | 137,835 |
|
| | | | | | | | | | | | |
| Intercontinental Hotel Group | | | | | | | | | | | | |
| Texas | | 352 |
| | NA | | 4 | | NA | | 38,276 |
| | 42,011 |
|
| Total Intercontinental Hotel Group | | 352 |
| |
| | 4 | | | | 38,276 |
| | 42,011 |
|
| Total Hotel | | 20,250 |
|
|
| | 155 | | | | 2,787,142 |
| | 2,380,681 |
|
| | | | | | | | | | | | | |
| Manufactured Housing | | Pad Rental Sites |
| | | | | | | | | | |
| Arkansas | | 356 |
| | 67% | | 2 | | NA | | 5,587 |
| | 2,612 |
|
| Arizona | | 535 |
| | 86% | | 2 | | NA | | 15,619 |
| | 11,166 |
|
| Colorado | | 6,064 |
| | 94% | | 23 | | NA | | 377,770 |
| | 307,923 |
|
| Florida | | 5,980 |
| | 88% | | 19 | | NA | | 256,720 |
| | 245,771 |
|
| Illinois | | 1,038 |
| | 65% | | 4 | | NA | | 21,042 |
| | 19,628 |
|
| Kansas | | 4,238 |
| | 71% | | 20 | | NA | | 99,440 |
| | 66,087 |
|
| Michigan | | 366 |
| | 74% | | 2 | | NA | | 12,368 |
| | 7,330 |
|
| Missouri | | 724 |
| | 85% | | 2 | | NA | | 29,860 |
| | 19,874 |
|
| New York | | 1,892 |
| | 82% | | 10 | | NA | | 92,001 |
| | 75,596 |
|
| Texas | | 2,213 |
| | 99% | | 6 | | NA | | 118,632 |
| | 113,176 |
|
| Utah | | 4,045 |
| | 98% | | 20 | | NA | | 328,465 |
| | 232,584 |
|
| Wyoming | | 1,585 |
| | 95% | | 13 | | NA | | 69,579 |
| | 72,490 |
|
| Total Manufactured Housing | | 29,036 |
| | 88% | | 123 | | | | 1,427,083 |
| | 1,174,237 |
|
| | | | | | | | | | | | | |
| Net Lease | | | | | | | | | | | | |
| Industrial | | Square Feet | | | | | | | | | | |
| Arizona | | 322,070 |
| | 100% | | 1 | | Mar-19 | | 21,461 |
| | 13,525 |
|
| California | | 793,562 |
| | 100% | | 2 | | May-28 | | 80,370 |
| | 48,012 |
|
| Colorado | | 57,966 |
| | 100% | | 1 | | Jun-27 | | 7,869 |
| | 4,951 |
|
| Florida | | 133,397 |
| | 100% | | 2 | | Aug-23 | | 5,098 |
| | 3,293 |
|
| Georgia | | 574,514 |
| | 100% | | 3 | | Jul-25 | | 31,513 |
| | 20,418 |
|
| Illinois | | 1,421,531 |
| | 100% | | 6 | | Aug-25 | | 58,765 |
| | 34,253 |
|
| Indiana | | 117,376 |
| | 100% | | 1 | | Apr-26 | | 2,841 |
| | 2,076 |
|
| Kentucky | | 274,002 |
| | 100% | | 2 | | Jan-26 | | 10,050 |
| | 7,453 |
|
| Michigan | | 483,227 |
| | 100% | | 4 | | Nov-24 | | 22,409 |
| | 18,624 |
|
| Minnesota | | 101,680 |
| | 100% | | 1 | | Dec-24 | | 6,116 |
| | 3,950 |
|
|
| | | | | | | | | | | | | | | | | |
| Location | | Capacity | | Percentage Leased/Occupied | | Number of Properties | | Lease Expiration Date (1) | | Gross Carrying Value (2) | | Borrowings |
| | | Square Feet | | | | | | | | | | |
| Missouri | | 144,786 |
| | 100% | | 1 | | Feb-31 | | $ | 3,709 |
| | $ | 2,471 |
|
| New Jersey | | 99,783 |
| | 100% | | 1 | | Aug-24 | | 5,952 |
| | 3,300 |
|
| New York | | 66,100 |
| | 100% | | 1 | | Jun-23 | | 6,139 |
| | 5,381 |
|
| North Carolina | | 437,911 |
| | 100% | | 1 | | Jul-30 | | 8,441 |
| | 8,323 |
|
| Ohio | | 464,466 |
| | 100% | | 3 | | Mar-25 | | 19,021 |
| | 13,635 |
|
| South Carolina | | 365,086 |
| | 100% | | 2 | | Dec-27 | | 14,440 |
| | 10,263 |
|
| Texas | | 222,061 |
| | 100% | | 3 | | Apr-30 | | 8,742 |
| | 5,902 |
|
| Total Industrial | | 6,079,518 |
| | 100% | | 35 | | | | 312,936 |
| | 205,830 |
|
| | | | | | | | | | | | | |
| Office | | | | | | | | | | | | |
| California | | 312,416 |
| | 100% | | 4 | | Mar-19 | | 49,615 |
| | 33,875 |
|
| Colorado | | 183,529 |
| | 100% | | 1 | | Jun-15 | | 38,459 |
| | 30,719 |
|
| Florida | | 68,723 |
| | 100% | | 2 | | May-27 | | 7,256 |
| | 4,309 |
|
| Georgia | | 54,284 |
| | 100% | | 1 | | Jun-27 | | 6,031 |
| | 4,070 |
|
| Indiana | | 333,600 |
| | 100% | | 1 | | Dec-25 | | 33,976 |
| | 26,152 |
|
| Michigan | | 105,692 |
| | 100% | | 2 | | Sep-15 | | 11,587 |
| | 11,646 |
|
| New Jersey | | 121,038 |
| | 100% | | 1 | | Jul-17 | | 22,077 |
| | 15,799 |
|
| Ohio | | 199,112 |
| | 100% | | 1 | | Dec-17 | | 33,559 |
| | 21,934 |
|
| Pennsylvania | | 214,150 |
| | 100% | | 1 | | Sep-15 | | 25,410 |
| | 23,598 |
|
| South Carolina | | 165,000 |
| | 100% | | 1 | | Oct-20 | | 34,854 |
| | 28,778 |
|
| Utah | | 117,553 |
| | 100% | | 1 | | Apr-17 | | 20,805 |
| | 13,181 |
|
Total Office(5) | | 1,875,097 |
| | 100% | | 16 | | | | 283,629 |
| | 214,061 |
|
| | | | | | | | | | | | | |
| Retail | | | | | | | | | | | | |
| Illinois | | 50,000 |
| | 100% | | 1 | | Jan-22 | | 5,810 |
| | 5,230 |
|
| Indiana | | 50,000 |
| | 100% | | 1 | | Aug-24 | | 3,642 |
| | 2,908 |
|
| Kansas | | 48,780 |
| | 100% | | 1 | | Mar-23 | | 6,909 |
| | 5,591 |
|
| Maine | | 52,900 |
| | 100% | | 1 | | Sep-23 | | 6,687 |
| | 3,597 |
|
| Massachusetts | | 104,200 |
| | 100% | | 2 | | Jan-24 | | 11,439 |
| | 8,607 |
|
| New Hampshire | | 115,558 |
| | 100% | | 3 | | Mar-18 | | 20,313 |
| | 13,745 |
|
| New York | | 46,533 |
| | 100% | | 1 | | Jan-22 | | 3,186 |
| | 4,060 |
|
| Total Retail | | 467,971 |
| | 100% | | 10 | | | | 57,986 |
| | 43,738 |
|
| Total Net Lease | | 8,422,586 |
| | 100% | | 61 | | | | 654,551 |
| | 463,629 |
|
| | | | | | | | | | | | | |
| Multifamily | | Units | | | | | | | | | | |
| Arizona | | 626 |
| | 94% | | 2 | | Various | | 63,659 |
| | 46,538 |
|
| Florida | | 928 |
| | 95% | | 3 | | Various | | 82,415 |
| | 64,010 |
|
| Georgia | | 956 |
| | 91% | | 3 | | Various | | 81,728 |
| | 60,757 |
|
| Tennessee | | 1,250 |
| | 95% | | 2 | | Various | | 76,003 |
| | 58,380 |
|
| Texas | | 256 |
| | 95% | | 1 | | Various | | 19,233 |
| | 14,870 |
|
Total Multifamily(6) | | 4,016 |
| | 94% | | 11 | |
| | 323,038 |
| | 244,555 |
|
| | | | | | | | | | | | |
| European Office | | Square Meters | | | | | | | | | | |
| Woking, UK | | 21,000 |
| | 98% | | 1 | | Dec-22 | | 89,809 |
| | 77,660 |
|
| Total European Office | | 21,000 |
| | 98% | | 1 | | | | 89,809 |
| | 77,660 |
|
| | | | | | | | | | | | |
| Multi-tenant Office | | Square Feet | | | | | | | | | | |
| California | | 71,016 |
| | 100% | | 1 | | May-19 | | 11,798 |
| | 8,584 |
|
| Colorado | | 251,253 |
| | 83% | | 4 | | Jul-18 | | 34,635 |
| | 25,094 |
|
| Texas | | 123,761 |
| | 88% | | 1 | | Feb-18 | | 18,075 |
| | 11,906 |
|
| Total Multi-tenant Office | | 446,030 |
| | 88% | | 6 | | | | 64,508 |
| | 45,584 |
|
| | | | | | | | | | | | |
| REO | | | | | | | | | | | | |
| Wisconsin | | 369,585 |
| | 85% | | 1 | | Various | | 7,337 |
| | — |
|
| Total REO | | 369,585 |
| | 85% | | 1 | | | | 7,337 |
| | — |
|
| Grand Total | | | | | | 819 | | | | $ | 10,624,155 |
| | $ | 8,456,285 |
|
______________________
| |
| (1) | Based on initial term and represents the weighted average lease term if more than one lease. For RIDEA facilities, the weighted average lease term of the operator is included. |
| |
| (2) | Represents operating real estate before accumulated depreciation as presented in our consolidated financial statements and excludes purchase price allocations related to net intangible and other assets and liabilities as of December 31, 2014. Refer to “Note 4. Operating Real Estate” of Part II, Item 8. “Financial Statements and Supplementary Data.” |
| |
| (3) | Includes three properties with a cost of $14 million owned pursuant to the RIDEA structure. |
| |
| (4) | Excludes portfolio level financing of $75 million as of December 31, 2014. |
| |
| (5) | Excludes a joint venture with three buildings with a carrying value of $27 million. Our net lease portfolio totals 8.8 million square feet and was 99% leased, with a weighted average lease term of 9.7 years, including such joint venture as of December 31, 2014. |
| |
| (6) | Excludes a joint venture investment with a carrying value of $37 million. Our multifamily portfolio totals 4,500 units and was 94% leased, including such joint venture as of December 31, 2014. |
Item 3. Legal Proceedings
We are involved in various litigation matters arising in the ordinary course of our business. Although we are unable to predict with certainty the eventual outcome of any litigation, in the opinion of management, our legal proceedings are not expected to have a material adverse effect on our financial position or results of operations. Refer to Note 17. “Commitments and Contingencies” in Part II, Item 8. “Financial Statements and Supplementary Data” for further disclosure regarding legal proceedings.
Item 4. Mine Safety Disclosures
None.
PART II
Item 5. Market for Registrant’s Common Equity, Related Stockholder Matters and Issuer Purchases of Equity Securities
Market Information
Our common stock is listed on the NYSE under the symbol “NRF.” The following table presents the high, low and last sales prices for our common stock, as reported on the NYSE, and dividends per share with respect to the periods indicated:
|
| | | | | | | | | | | | | | | | | |
| Period | | High | | Low | | Close | | Dividends | |
| 2014 | | | | | | | | | |
Fourth Quarter(1) | | $ | 18.71 |
| | $ | 16.78 |
| | $ | 17.58 |
| | $ | 0.40 |
| (2) |
| Third Quarter | | $ | 18.86 |
| | $ | 16.10 |
| | $ | 17.67 |
| | $ | 0.40 |
| (2) |
Second Quarter(3) | | $ | 35.28 |
| | $ | 29.34 |
| | $ | 34.76 |
| | $ | 0.50 |
| |
First Quarter(3) | | $ | 32.62 |
| | $ | 27.36 |
| | $ | 32.28 |
| | $ | 0.50 |
| |
| | | | | | | | | | |
2013 (3) | | | | | | | | | |
| Fourth Quarter | | $ | 26.90 |
| | $ | 18.30 |
| | $ | 26.90 |
| | $ | 0.50 |
| |
| Third Quarter | | $ | 20.04 |
| | $ | 17.22 |
| | $ | 18.56 |
| | $ | 0.42 |
| |
| Second Quarter | | $ | 20.32 |
| | $ | 16.60 |
| | $ | 18.20 |
| | $ | 0.40 |
| |
| First Quarter | | $ | 19.32 |
| | $ | 14.62 |
| | $ | 18.96 |
| | $ | 0.38 |
| |
_______________________________________________________
| |
| (1) | On February 25, 2015, we declared a dividend of $0.40 per share of common stock. This dividend will be paid on March 13, 2015 to stockholders of record as of the close of business on March 9, 2015. |
| |
| (2) | The dividend per share for the third and fourth quarter 2014 represents the dividends subsequent to the spin-off of NSAM. |
| |
| (3) | Adjusted for the Reverse Split effected on June 30, 2014. |
The following table presents our dividends declared on common stock, on a per share basis, for the years ended 2014 and 2013:
|
| | | | |
| Declaration Date | | Dividend |
| 2014 | | |
October 29(1) | | $ | 0.40 |
|
| August 6 | | $ | 0.50 |
|
May 7(2) | | $ | 0.50 |
|
February 26(2) | | $ | 0.50 |
|
| | | |
2013(2) | | |
| October 30 | | $ | 0.42 |
|
| July 31 | | $ | 0.40 |
|
| May 1 | | $ | 0.38 |
|
| February 13 | | $ | 0.36 |
|
_______________________________________________________
| |
| (1) | Represents the dividend subsequent to the spin-off of NSAM. |
| |
| (2) | Adjusted for the Reverse Split effected on June 30, 2014. |
Refer to Item 7. “Management’s Discussion and Analysis of Financial Condition and Results of Operations - Liquidity and Capital Resources” for a discussion of our dividend policy. On February 24, 2015, the closing sales price for our common
stock, as reported on the NYSE, was $18.79. As of February 26, 2015, there were 6,034 record holders of our common stock and 309,474,099 shares outstanding. This figure does not reflect the beneficial ownership of shares held in nominee name.
Recent Sales of Unregistered Securities
None.
Purchases of Equity Securities by the Issuer and Affiliated Purchasers
None.
Item 6. Selected Financial Data
The information below should be read in conjunction with “Forward-Looking Statements,” Part I, Item 1A. “Risk Factors,” Item 7. “Management’s Discussion and Analysis of Financial Condition and Results of Operations” and our consolidated financial statements and the related notes thereto included in Part II, Item 8. “Financial Statements and Supplementary Data,” included in this Annual Report on Form 10-K.
The selected historical consolidated information presented for the five years ended December 31, 2014 relates to our operations and has been derived from our audited consolidated statements of operations included in this Annual Report on Form 10-K or our prior Annual Reports on Form 10-K, as amended (if applicable). The consolidated financial statements for the year ended December 31, 2014 include: (i) our results of operations for the six months ended December 31, 2014 which represents our results of operations following the spin-off of our historical asset management business on June 30, 2014; and (ii) our results of operations for the six months ended June 30, 2014 which represents a carve-out of revenues and expenses attributable to NSAM recorded in discontinued operations. Our historical financial information for the four years ended December 31, 2013 were prepared on the same basis as the six months ended June 30, 2014. As a result, our results of operations for the year ended December 31, 2014 may not be comparative to our results of operations reported for the prior periods presented. In addition, we have reclassified certain amounts in our historical audited consolidated financial statements, including amounts related to certain properties reclassified as held for sale during the period. These reclassifications had no effect on our reported net income (loss) or CAD.
|
| | | | | | | | | | | | | | | | | | | |
| | Years Ended December 31, |
| | 2014 | | 2013 | | 2012 | | 2011 | | 2010 |
| Operating Data: | (Dollars in thousands, except per share data) |
| Total property and other revenues | $ | 681,146 |
| | $ | 240,847 |
| | $ | 114,308 |
| | $ | 109,402 |
| | $ | 115,974 |
|
| Net interest income on debt and securities | 297,247 |
| | 265,837 |
| | 335,496 |
| | 355,921 |
| | 273,727 |
|
| Total expenses | 1,099,444 |
| | 370,245 |
| | 240,076 |
| | 289,887 |
| | 391,708 |
|
| Equity in earnings (losses) of unconsolidated ventures | 148,290 |
| | 85,477 |
| | 88 |
| | (2,738 | ) | | 2,550 |
|
| Income (loss) from continuing operations | (312,958 | ) | | (79,149 | ) | | (257,718 | ) | | (234,173 | ) | | (376,944 | ) |
| Income (loss) from discontinued operations | (8,128 | ) | | (8,761 | ) | | (17,450 | ) | | (25,551 | ) | | (15,144 | ) |
| Net income (loss) | (321,086 | ) | | (87,910 | ) | | (273,089 | ) | | (242,526 | ) | | (389,560 | ) |
| Net income (loss) attributable to NorthStar Realty Finance Corp. common stockholders | (371,507 | ) | | (137,453 | ) | | (288,587 | ) | | (263,014 | ) | | (395,466 | ) |
| Earnings (loss) per share: | | | | | | | | | |
| Basic | $ | (1.89 | ) | | $ | (1.30 | ) | | $ | (4.61 | ) | | $ | (5.67 | ) | | $ | (9.99 | ) |
| Diluted | $ | (1.89 | ) | | $ | (1.30 | ) | | $ | (4.61 | ) | | $ | (5.67 | ) | | $ | (9.99 | ) |
Dividends per share of common stock(1)(2) | $ | 1.80 |
| | $ | 1.70 |
| | $ | 1.32 |
| | $ | 0.92 |
| | $ | 0.80 |
|
______________________
| |
| (1) | Adjusted for the Reverse Split completed on June 30, 2014. |
| |
| (2) | The dividend per share for the third and fourth quarter 2014 represents the dividends declared subsequent to the spin-off of NSAM. |
|
| | | | | | | | | | | | | | | | | | | | |
| | | As of December 31, |
| | | 2014 | | 2013 | | 2012 | | 2011 | | 2010 |
| Balance Sheet Data: | | (Dollars in thousands) |
| Cash and cash equivalents | | $ | 296,964 |
| | $ | 635,990 |
| | $ | 444,927 |
| | $ | 144,508 |
| | $ | 125,439 |
|
| Operating real estate, net | | 10,274,581 |
| | 2,370,183 |
| | 1,390,546 |
| | 1,089,449 |
| | 938,062 |
|
| Real estate debt investments, net | | 1,067,667 |
| | 1,031,078 |
| | 1,832,231 |
| | 1,710,582 |
| | 1,821,764 |
|
| Investments in private equity funds, at fair value | | 962,038 |
| | 586,018 |
| | — |
| | — |
| | — |
|
| Investments in unconsolidated ventures | | 207,777 |
| | 142,340 |
| | 111,025 |
| | 96,143 |
| | 99,992 |
|
| Real estate securities, available for sale | | 878,514 |
| | 1,052,320 |
| | 1,124,668 |
| | 1,473,305 |
| | 1,691,054 |
|
| Total assets | | 15,326,356 |
| | 6,360,050 |
| | 5,513,778 |
| | 5,006,437 |
| | 5,151,991 |
|
| Total borrowings | | 9,957,468 |
| | 3,342,071 |
| | 3,790,072 |
| | 3,509,126 |
| | 3,416,939 |
|
| Total liabilities | | 10,612,700 |
| | 3,662,587 |
| | 4,182,914 |
| | 3,966,823 |
| | 3,779,478 |
|
| Preferred stock | | 939,118 |
| | 697,352 |
| | 504,018 |
| | 241,372 |
| | 241,372 |
|
| Total equity | | 4,713,656 |
| | 2,697,463 |
| | 1,330,864 |
| | 1,039,614 |
| | 1,277,691 |
|
|
| | | | | | | | | | | | | | | | | | | | |
| | | Years Ended December 31, |
| | | 2014 | | 2013 | | 2012 | | 2011 | | 2010 |
| Other Data: | | (Dollars in thousands) |
| Cash flow provided by (used in): | | | | | | | | | | |
| Operating activities | | $ | 144,856 |
| | $ | 240,674 |
| | $ | 76,911 |
| | $ | 59,066 |
| | $ | 35,558 |
|
| Investing activities | | (7,054,227 | ) | | (2,285,153 | ) | | 51,901 |
| | 383,323 |
| | 403,325 |
|
| Financing activities | | 6,572,518 |
| | 2,235,542 |
| | 171,607 |
| | (423,320 | ) | | (452,372 | ) |
In 2013, we began using CAD as a non-GAAP measure of the operating performance of a REIT and of us in particular. CAD for the year ended December 31, 2014 was $392 million. Refer to Item 7. “Management’s Discussion and Analysis of Financial Condition and Results of Operations - Non-GAAP Financial Measure” for details on the calculation of CAD including a reconciliation of CAD to net income (loss) attributable to common stockholders calculated in accordance with U.S. GAAP.
Item 7. Management’s Discussion and Analysis of Financial Condition and Results of Operations
The following discussion should be read in conjunction with our consolidated financial statements and notes thereto included in Item 8. “Financial Statements and Supplementary Data” and risk factors in Part I, Item 1A. “Risk Factors” of this report. References to “N-Star,” “we,” “us” or “our” refer to NorthStar Realty Finance Corp. and its subsidiaries after the internal corporate restructuring and spin-off, as described further below, unless the context specifically requires otherwise.
Introduction
NorthStar Realty Finance Corp. is a diversified commercial real estate company with 82% of its total assets invested in real estate of which 74% is invested in direct real estate investments. We generated 70% of our revenue from our real estate portfolio for the year ended December 31, 2014. Substantially all of our assets are invested in and revenues are generated from our real estate portfolio, excluding our European Portfolio. Excluding our European Portfolio, 79% of our total assets are invested in real estate, generating 70% of our revenue for the year ended December 31, 2014. We invest in multiple asset classes across CRE that we expect will generate attractive risk-adjusted returns and may take the form of acquiring real estate, originating or acquiring senior or subordinate loans, as well as pursuing opportunistic CRE investments, both in the United States and internationally, with a current focus on Europe. We seek to generate stable cash flow for distribution to our stockholders through our diversified portfolio of global commercial real estate assets and in turn build long-term franchise value. We are a Maryland corporation and completed our initial public offering in October 2004. We conduct our operations so as to continue to qualify as a REIT for U.S. federal income tax purposes. Effective June 30, 2014, we completed our spin-off of our asset management business. Upon completion of the spin-off, our asset management business is owned and operated by NSAM and we are externally managed by an affiliate of NSAM through a management contract with an initial term of 20 years.
Summary of Business
Our primary business lines are as follows:
| |
| • | Real Estate - Our real estate business concentrates on various types of investments in commercial real estate located throughout the United States and internationally, with a current focus on Europe, that includes healthcare, hotel, manufactured housing communities, net lease, multifamily and multi-tenant office properties. In addition, it includes |
limited partnership interests in real estate private equity funds, or PE Investments, diversified by property type and geography.
| |
| • | Healthcare - Our healthcare properties are comprised of a diverse portfolio of medical office buildings and other properties typically leased under net leases to healthcare operators with a focus on mid-acuity facilities (i.e., skilled nursing and assisted living), with the highest concentration in private-pay assisted living facilities which we believe have the most advantageous underlying demographic trends and fundamentals. In addition, we own healthcare properties that operate under a RIDEA structure generating resident income from short-term residential agreements and incur customary related operating expenses. |
| |
| • | Hotel - Our hotel portfolio is a geographically diverse portfolio primarily comprised of extended stay hotels and premium branded select service hotels primarily located in major metropolitan markets with the majority affiliated with top hotel brands. |
| |
| • | European - We are expanding outside the United States, with a current focus on Europe, and seek to invest in various types of commercial real estate assets. On February 26, 2015, we announced that our board of directors unanimously approved the Proposed European Spin. Currently, we acquired or committed to acquire $2 billion of European real estate comprised of 50 properties spanning across some of Europe’s top markets that will be contributed to NRE upon the completion of the Proposed European Spin. Refer to “Recent Developments” for a further discussion. |
| |
| • | Manufactured Housing - Our manufactured housing portfolio consists of communities that lease pad rental sites for placement of factory built homes located throughout the United States. In addition, the portfolio includes manufactured homes for sale or rent and receivables related to the financing of homes sold to residents. |
| |
| • | Net Lease - Our net lease properties are primarily industrial, office and retail properties typically under net leases to corporate tenants. |
| |
| • | Multifamily - Our multifamily portfolio primarily focuses on properties located in suburban markets that are well suited to capture the formation of new households. |
| |
| • | Multi-tenant Office - We pursue other real estate opportunities such as our recent acquisition of multi-tenant office properties. |
| |
| • | PE Investments - Our real estate business also includes investments (directly or indirectly in joint ventures) owning PE Investments managed by institutional quality sponsors and diversified by property type and geography. |
| |
| • | Commercial Real Estate Debt - Our CRE debt business is focused on originating, acquiring and asset managing senior and subordinate debt investments secured primarily by commercial real estate and includes first mortgage loans, subordinate mortgage and mezzanine loans and participations in such loans and preferred equity interests. We may from time to time take title to collateral in connection with a CRE debt investment as REO which would be included in our CRE debt business. |
| |
| • | Commercial Real Estate Securities - Our CRE securities business is predominately comprised of N-Star CDO bonds and N-Star CDO equity of deconsolidated N-Star CDOs and includes other securities, mostly conduit CMBS, meaning each asset is a pool backed by a large number of commercial real estate loans. We also invest in opportunistic CRE securities such as an investment in a “B-piece” CMBS. |
We have the ability to invest in a broad spectrum of global commercial real estate assets and seek to provide attractive risk-adjusted returns. Our ability to invest across the CRE market creates complementary and overlapping sources of investment opportunities based upon common reliance on real estate fundamentals and application of similar portfolio management skills to maximize value and to protect capital. Additionally, we may pursue opportunistic investments across all our business lines including CRE equity and debt investments. Examples of opportunistic investments include PE Investments, strategic joint ventures and repurchasing our CDO bonds at a discount to their principal amount.
In 2014, we issued aggregate net capital of $2.6 billion, including $1.3 billion from the issuance of common equity (including the remaining shares issued under our forward sale agreement in February 2015 for net proceeds of $122 million), $1.1 billion as part of the consideration for the merger of Griffin-American and $242 million from the issuance of preferred equity. In 2013, we issued aggregate net capital of $1.9 billion, including $1.4 billion from the issuance of common equity, $193 million from the issuance of preferred stock and $335 million from the issuance of exchangeable senior notes.
We predominantly use investment-level financing as part of our strategy to prudently leverage our investments and deliver attractive risk-adjusted returns to our stockholders. We pursue a variety of financing arrangements such as mortgage notes from the CMBS market, government-sponsored agencies, finance companies and European banks and securitization financing transactions. In addition, we use corporate-level financing such as credit facilities and other term borrowings. We generally
seek to limit our reliance on recourse borrowings. Borrowing levels for our CRE investments may be dependent upon the nature of the assets and the related financing that is available.
The current availability of attractive long-term, non-recourse, non mark-to-market, assignable financing through the CMBS and agency financing markets has bolstered opportunities to acquire real estate. For longer duration, stable investment cash flow such as those derived from net lease assets, we tend to use fixed rate financing. For investment cash flows with greater growth potential such as hotels and healthcare under a RIDEA structure, we tend to use floating rate financing which provides prepayment flexibility and may provide a better match between underlying cash flow and potential increases in interest rates.
Our financing strategy for debt investments is to obtain match-funded borrowing at rates that provide a positive net spread. In late 2011, we began using secured term credit facilities provided by major financial institutions to partially finance CRE debt which currently provide for an aggregate of up to $240 million. Then, in November 2012 and August 2013, we, and on behalf of NorthStar Income, entered into securitization financing transactions, or Securitization 2012-1 and Securitization 2013-1, respectively, to provide permanent, non-recourse, non-mark-to-market financing for newly-originated CRE debt investments. We will continue to seek to use the capital markets to finance our debt investments.
With respect to corporate-level financing, in August 2014, we entered into a corporate revolving credit facility with certain commercial bank lenders, with a total commitment amount of $500 million for a three-year term. In September 2014, we entered into a corporate term facility with a commercial bank lender with respect to the establishment of term borrowings with an aggregate principal amount of up to $500 million. As of February 24, 2015, $305 million of financing remains undrawn under our corporate revolving credit facility and $75 million of financing remains undrawn under our corporate term credit facility, subject to entering into additional term loans under such facility.
We believe that we maintain a competitive advantage through a combination of deep industry relationships and access to market leading CRE credit underwriting and capital markets expertise which enables us to manage credit risk across our business lines as well as to structure and finance our assets efficiently. Our ability to invest across the spectrum of commercial real estate investments allows us to take advantage of complementary and overlapping sources of investment opportunities based on a common reliance on CRE fundamentals and application of similar underwriting and asset management skills as we seek to maximize stockholder value and to protect our capital.
Sources of Operating Revenues and Cash Flows
Since the spin-off of our asset management business, we primarily generate revenue from rental and other operating income from our real estate properties and net interest income on our CRE debt and securities portfolios. Additionally, we record equity in earnings of unconsolidated ventures, including from PE Investments. Our income is primarily derived through the difference between revenue and the cost at which we are able to finance our investments. We may also acquire investments which generate attractive returns without any leverage.
For financial information regarding our asset management segment prior to the spin-off, refer to Note 19. “Segment Reporting” in our accompanying consolidated financial statements included in Item 8. “Financial Statements and Supplementary Data.”
Profitability and Performance Metrics
We calculate several metrics to evaluate the profitability and performance of our business.
| |
| • | CAD (refer to “Non-GAAP Financial Measure—Cash Available for Distribution” for a description of this metric). |
| |
| • | Credit losses are a measure of performance and can be used to compare the credit performance of our assets to our competitors and other finance companies. |
| |
| • | Growth in total assets is a driver of our ability to grow our income. |
Outlook and Recent Trends
The Great Recession, which lasted from December 2007 to June 2009, began with the bursting of an $8 trillion housing bubble and had a dramatic negative impact globally on properly functioning capital markets and liquidity across all asset classes and markets. It was not until the beginning of 2012 that liquidity and capital started to become more available in the commercial real estate markets to stronger sponsors and both Wall Street and commercial banks began to more actively provide credit to real estate borrowers accelerating the pace of investment in real estate. In late 2012, in order to stimulate growth, several of the world’s largest central banks acted in a coordinated effort through massive injections of stimulus in the financial markets, which has facilitated keeping interest rates low since then.
A proxy for the liquidity in the commercial real estate market is non-agency CMBS issuance. Approximately $80 billion and $88 billion of non-agency CMBS was issued in 2013 and 2014, respectively, with industry experts currently predicting approximately $100 billion of non-agency CMBS issuance in 2015.
We believe the U.S. economy is on a healthy growth path and that the U.S. Federal Reserve is on track to begin raising rates in 2015. However, there are concerns about low inflation in the United States, a stronger U.S. dollar, slow global growth and international market volatility. Many other global central banks are easing monetary conditions to combat their own problems with low inflation and slow growth.
Valuations in the commercial real estate markets have generally improved since bottoming out in 2009. Robust investor demand in 2014 for commercial real estate increased transaction activity and prices as rent and vacancy fundamentals improved across most property sectors and are forecasted to continue to improve in 2015. However, global economic and political headwinds remain. For example, global market instability and the risk that maturing commercial real estate debt may have difficulties being refinanced, among other factors, may continue to cause periodic volatility in the CRE market for some time. It is currently estimated that approximately $1.4 trillion of commercial real estate debt will mature through 2018. While there is an increased supply of liquidity and improved fundamentals in the commercial real estate market, we still anticipate that certain of these loans will not be able to be refinanced, potentially inhibiting growth and contracting credit.
Virtually all commercial real estate property types were adversely impacted by the credit crisis and subsequent recession, while some such as land, condominium and other commercial property types were more severely impacted. Our commercial real estate equity, debt and securities investments could be negatively impacted by weak real estate markets and economic conditions. While the U.S. economy is stronger today, a return to weak economic conditions in the future could reduce a tenant’s/operator’s/resident’s/guest’s ability to make payments in accordance with the contractual terms and for companies to lease or occupy new space. To the extent that market rental and occupancy rates are reduced, property-level cash flow could be negatively affected.
Our Strategy
Our primary business objectives are to invest in global commercial real estate property and other real estate assets that we expect will generate attractive risk-adjusted returns and in turn will generate stable cash flow for distribution to our stockholders. We currently anticipate that most of our investment activity and uses of available cash liquidity will be focused on acquiring real estate, originating or acquiring loans, as well as pursuing opportunistic CRE investments across our businesses, both in the United States and internationally. Opportunistic investments may include investing in real estate private equity funds, strategic joint ventures and repurchasing our N-Star CDO bonds at discounts to par.
Availability and cost of capital will impact our profitability and earnings since we would be required to raise new capital to fund a majority of this growth.
We actively raise capital. We issued aggregate capital of $2.6 billion in 2014 (including the remaining shares issued under our forward sale agreement in February 2015 for net proceeds of $122 million). Further, we have access to other forms of corporate-level financing. In August 2014, we entered into a corporate revolving credit facility with certain commercial bank lenders, with a total commitment amount of $500 million for a three-year term. In September 2014, we entered into a corporate term facility with a commercial bank lender with respect to the establishment of term borrowings to be made to us with an aggregate principal amount of up to $500 million. The corporate term facility provides that we may enter into one or more credit agreements for term borrowings with varying amounts, borrowing dates, maturities and interest rates, from time to time until September 2015.
In addition, as of December 31, 2014, we have two loan facilities with an aggregate of $240 million to finance the origination of CRE first mortgage loans. Additionally, in November 2012 and August 2013, we, and on behalf of NorthStar Income, entered into securitization financing transactions to finance debt investments on a permanent, non-recourse, non-mark-to-market basis that were previously financed on credit facilities.
Critical Accounting Policies
Principles of Consolidation
Our consolidated financial statements include the accounts of NorthStar Realty Finance Corp. and its consolidated subsidiaries. We consolidate variable interest entities, or VIEs, where we are the primary beneficiary and voting interest entities which are generally majority owned or otherwise controlled by us. All significant intercompany balances are eliminated in consolidation.
Variable Interest Entities
A VIE is an entity that lacks one or more of the characteristics of a voting interest entity. A VIE is defined as an entity in which equity investors do not have the characteristics of a controlling financial interest or do not have sufficient equity at risk for the entity to finance its activities without additional subordinated financial support from other parties. The determination of whether an entity is a VIE includes both a qualitative and quantitative analysis. We base the qualitative analysis on our review of the design of the entity, its organizational structure including decision-making ability and relevant financial agreements and the quantitative analysis on the forecasted cash flow of the entity. We reassess the initial evaluation of an entity as a VIE upon the occurrence of certain reconsideration events.
A VIE must be consolidated only by its primary beneficiary, which is defined as the party who, along with its affiliates and agents has both the: (i) power to direct the activities that most significantly impact the VIE’s economic performance; and (ii) obligation to absorb the losses of the VIE or the right to receive the benefits from the VIE, which could be significant to the VIE. We determine whether we are the primary beneficiary of a VIE by considering qualitative and quantitative factors, including, but not limited to: which activities most significantly impact the VIE’s economic performance and which party controls such activities; the amount and characteristics of its investment; the obligation or likelihood for us or other interests to provide financial support; consideration of the VIE’s purpose and design, including the risks the VIE was designed to create and pass through to its variable interest holders and the similarity with and significance to our business activities and the other interests. We reassess the determination of whether we are the primary beneficiary of a VIE each reporting period. Significant judgments related to these determinations include estimates about the current and future fair value and performance of investments held by these VIEs and general market conditions.
We evaluate our CRE debt and securities, investments in unconsolidated ventures and securitization financing transactions, such as our CDOs and our liabilities to subsidiary trusts issuing preferred securities to determine whether they are a VIE. We analyze new investments and financings, as well as reconsideration events for existing investments and financings, which vary depending on type of investment or financing.
Voting Interest Entities
A voting interest entity is an entity in which the total equity investment at risk is sufficient to enable it to finance its activities independently and the equity holders have the power to direct the activities of the entity that most significantly impact its economic performance, the obligation to absorb the losses of the entity and the right to receive the residual returns of the entity. The usual condition for a controlling financial interest in a voting interest entity is ownership of a majority voting interest. If we have a majority voting interest in a voting interest entity, the entity will generally be consolidated. We do not consolidate a voting interest entity if there are substantive participating rights by other parties and/or kick-out rights by a single party.
We perform on-going reassessments of whether entities previously evaluated under the voting interest framework have become VIEs, based on certain events, and therefore subject to the VIE consolidation framework.
Investments in Unconsolidated Ventures
Non-controlling, unconsolidated ownership interests in an entity may be accounted for using the equity method, at fair value or the cost method.
Under the equity method, the investment is adjusted each period for capital contributions and distributions and its share of the entity’s net income (loss). Capital contributions, distributions and net income (loss) of such entities are recorded in accordance with the terms of the governing documents. An allocation of net income (loss) may differ from the stated ownership percentage interest in such entity as a result of preferred returns and allocation formulas, if any, as described in such governing documents.
We may account for an investment in an unconsolidated entity at fair value by electing the fair value option. We elected the fair value option for PE Investments and certain investments in unconsolidated ventures. PE Investments are recorded as investments in private equity funds, at fair value. We record the change in fair value for our share of the projected future cash flow of such investments from one period to another in equity in earnings (losses) from unconsolidated ventures in the consolidated statements of operations. Any change in fair value attributed to market related assumptions is considered unrealized gain (loss).
We may account for an investment that does not qualify for equity method accounting or for which the fair value option was not elected using the cost method if we determine the investment in the unconsolidated entity is insignificant. Under the cost method, equity in earnings is recorded as dividends are received to the extent they are not considered a return of capital, which is recorded as a reduction of cost of the investment.
Fair Value Option
The fair value option provides an election that allows a company to irrevocably elect fair value for certain financial assets and liabilities on an instrument-by-instrument basis at initial recognition. We may elect to apply the fair value option for certain investments due to the nature of the instrument. Any change in fair value for assets and liabilities for which the election is made is recognized in earnings.
Operating Real Estate
Operating real estate is carried at historical cost less accumulated depreciation. We follow the purchase method for an acquisition of operating real estate, where the purchase price is allocated to tangible assets such as land, building, tenant and land improvements and other identified intangibles, such as goodwill. Ordinary repairs and maintenance are expensed as incurred. Major replacements and betterments which improve or extend the life of the asset are capitalized and depreciated over their useful life. Operating real estate is depreciated using the straight-line method over the estimated useful lives of the assets. Costs directly related to an acquisition deemed to be a business combination are expensed and included in transaction costs in our consolidated statements of operations. We evaluate whether REO constitutes a business and whether business combination accounting is appropriate. Any excess upon taking title to collateral between the carrying value of a loan over the estimated fair value of the property is charged to provision for loan losses.
Operating real estate, including REO, which has met the criteria to be classified as held for sale, is separately presented on the consolidated balance sheets. Such operating real estate is recorded at the lower of its carrying value or its estimated fair value less the cost to sell. Once a property is determined to be held for sale, depreciation is no longer recorded.
Real Estate Debt Investments
CRE debt investments are generally intended to be held to maturity and, accordingly, are carried at cost, net of unamortized loan fees, premium, discount and unfunded commitments. CRE debt investments that are deemed to be impaired are carried at amortized cost less a loan loss reserve, if deemed appropriate, which approximates fair value. CRE debt investments where we do not have the intent to hold the loan for the foreseeable future or until its expected payoff are classified as held for sale and recorded at the lower of cost or estimated value.
Real Estate Securities
We classify our CRE securities investments as available for sale on the acquisition date, which are carried at fair value. We have historically elected to apply the fair value option for our CRE securities investments. For those CRE securities for which the fair value option was elected, any unrealized gains (losses) from the change in fair value is recorded in unrealized gains (losses) on investments and other in the consolidated statements of operations.
We may decide to not elect the fair value option for certain CRE securities due to the nature of the particular instrument. For those CRE securities for which the fair value option was not elected, any unrealized gain (loss) from the change in fair value is recorded as a component of accumulated other comprehensive income, or OCI, in the consolidated statements of equity, to the extent impairment losses are considered temporary.
Fair Value Measurement
The fair value of financial instruments is categorized based on the priority of the inputs to the valuation technique and categorized into a three-level fair value hierarchy. The fair value hierarchy gives the highest priority to quoted prices in active markets for identical assets or liabilities (Level 1) and the lowest priority to unobservable inputs (Level 3). If the inputs used to measure the financial instruments fall within different levels of the hierarchy, the categorization is based on the lowest level input that is significant to the fair value measurement of the instrument.
Financial assets and liabilities recorded at fair value on our consolidated balance sheets are categorized based on the inputs to the valuation techniques as follows:
Level 1. Quoted prices for identical assets or liabilities in an active market.
Level 2. Financial assets and liabilities whose values are based on the following:
(a)Quoted prices for similar assets or liabilities in active markets.
(b)Quoted prices for identical or similar assets or liabilities in non-active markets.
(c)Pricing models whose inputs are observable for substantially the full term of the asset or liability.
| |
| (d) | Pricing models whose inputs are derived principally from or corroborated by observable market data for substantially the full term of the asset or liability. |
Level 3. Prices or valuation techniques based on inputs that are both unobservable and significant to the overall fair
value measurement.
Financial assets and liabilities recorded at fair value on a recurring basis are classified in their entirety based on the lowest level of input that is significant to the fair value measurement. Financial assets and liabilities recorded at fair value on a recurring basis using Level 3 inputs was 11% and 6% of total assets and liabilities measured at fair value on a recurring basis, respectively, as of December 31, 2014. Our non-recurring financial measurements include the measurement of provision for loan losses on our CRE debt investments, impairment on operating real estate and provision for loss on equity investments, if any. These measurements are considered Level 3 fair value measurements.
Transfers into Level 3 for CRE securities for the year ended December 31, 2014 totaled $18 million and principally related to the nature of the price used to estimate fair value (third-party pricing service or broker quotations) and the amount of available market data to corroborate such prices. There were no transfers out of Level 3 for CRE securities for the year ended December 31, 2014. We recognized net unrealized/realized gains and losses of $8 million related to transfers out of Level 3 in our consolidated statements of operations for the year ended December 31, 2014.
Management determines the prices are representative of fair value through a review of available data, including observable inputs, recent transactions as well as our knowledge and experience of the market.
With respect to valuation for CRE securities, we generally obtain at least one quote from a pricing service or broker. Furthermore, we may use internal pricing models to establish arm’s length prices. Generally, the quote from the pricing service is used to determine fair value for the securities. The quotes are not adjusted. The pricing service uses market-based measurements based on valuation techniques that reflect market participants’ assumptions and maximize the use of relevant observable inputs including prices for similar assets, benchmark yield curves and market corroborated inputs such as contractual terms, discount rates for similar securities and credit (such as credit support and delinquency rates). We believe such broker quote is generally based on a market transaction of comparable securities.
To determine the fair value of CRE securities, we maintain a comprehensive quarterly process that includes a valuation committee comprised of senior members of the investment and accounting teams that is designed to enable management to ensure the prices used are representative of fair value and the instruments are properly classified pursuant to the fair value hierarchy.
Initially, a member of the investment team on the valuation committee reviews the prices at quarter end to ensure current market conditions are fairly presented. The investment team is able to assess these values because they are actively engaged in the market, reviewing bid lists, recent sales and frequently have discussions with various banks and other financial institutions regarding the state of the market. We then perform a variety of analyses to ensure the quotes are in a range which it believes to be representative of fair value and to validate the quotes obtained and used in determining the ultimate value used in the financial statements. At the portfolio level, we evaluate the overall change in fair value versus the overall change in the market. We review significant changes in fair value for individual instruments, both positive and negative, from the prior period. We perform back testing on any securities sold to validate the quotes used for the prior quarter. Where multiple quotes are available, we evaluate any large variance between the high and low price. We obtain any available market data that provides insight into the price through recent or comparable security trades, multiple broker bids and other pertinent information. This data may be available through the pricing service or based on data directly available to us. If as part of any of these processes, we are aware of data which we believe better supports the fair value, we challenge the quote provided by either the pricing service or broker. Any discrepancy identified from our processes are reviewed and resolved. The valuation committee approves the final prices. We believe these procedures are designed to enable us to estimate fair value.
Once we determine fair value of CRE securities, we review to ensure the instrument is properly classified pursuant to the fair value hierarchy consistent with U.S. GAAP through our understanding of the valuation methodologies used by the pricing service via discussion with representatives of the pricing service and review of any documentation describing its valuation methodology.
Generally, when fair value is based on the pricing service or multiple broker quotes, we believe, based on our analysis, such quotes are based on observable inputs and are therefore classified as Level 2. Where the price is based on either a single broker quote or an internal pricing model, we generally consider such price to be based on less observable data and therefore classify such instruments as Level 3.
Revenue Recognition
Operating Real Estate
Rental and escalation income from operating real estate is derived from leasing of space to various types of tenants and healthcare operators. The leases are for fixed terms of varying length and generally provide for annual rentals and expense reimbursements to be paid in monthly installments. Rental income from leases is recognized on a straight-line basis over the term of the respective leases. The excess of rents recognized over amounts contractually due pursuant to the underlying leases are included in unbilled rent receivable on our consolidated balance sheets. Escalation income represents revenue from tenant/operator leases which provide for the recovery of all or a portion of the operating expenses and real estate taxes paid by us on behalf of the respective property. This revenue is accrued in the same period as the expenses are incurred.
We generate operating income from healthcare and hotel properties under a RIDEA structure. Revenue related to healthcare properties includes resident room and care charges and other resident charges. Revenue related to operating hotel properties primarily consists of room and food and beverage sales. Revenue is recognized when such services are provided, generally defined as the date upon which a resident or guest occupies a room or uses the healthcare property or hotel services and is recorded in resident fee income for healthcare properties and hotel related income for hotel properties in the consolidated statements of operations.
Real Estate Debt Investments
Interest income is recognized on an accrual basis and any related premium, discount, origination costs and fees are amortized over the life of the investment using the effective interest method. The amortization is reflected as an adjustment to interest income in our consolidated statements of operations. The amortization of a premium or accretion of a discount is discontinued if such loan is reclassified to held for sale.
Real Estate Securities
Interest income is recognized using the effective interest method with any premium or discount amortized or accreted through earnings based on expected cash flow through the expected maturity date of the security. Changes to expected cash flow may result in a change to the yield which is then applied retrospectively for high-credit quality securities that cannot be prepaid or otherwise settled in such a way that the holder would not recover substantially all of the investment or prospectively for all other securities to recognize interest income.
Credit Losses and Impairment on Investments
Operating Real Estate
Our real estate portfolio is reviewed on a quarterly basis, or more frequently as necessary, to assess whether there are any indicators that the value of our operating real estate may be impaired or that its carrying value may not be recoverable. A property’s value is considered impaired if management’s estimate of the aggregate expected future undiscounted cash flow generated by the property is less than the carrying value. In conducting this review, management considers U.S. macroeconomic factors, real estate sector conditions and asset specific and other factors. To the extent an impairment has occurred, the loss is measured as the excess of the carrying value of the property over the estimated fair value and recorded in impairment on operating real estate in our consolidated statements of operations.
An allowance for a doubtful account for a tenant/operator receivable is established based on a periodic review of aged receivables resulting from estimated losses due to the inability of tenant/operator to make required rent and other payments contractually due. Additionally, we establish, on a current basis, an allowance for future tenant/operator/resident/guest credit losses on unbilled rent receivable based on an evaluation of the collectability of such amounts.
Real Estate Debt Investments
Loans are considered impaired when based on current information and events, it is probable that we will not be able to collect principal and interest amounts due according to the contractual terms. We assess the credit quality of the portfolio and adequacy of loan loss reserves on a quarterly basis or more frequently as necessary. Significant judgment of management is required in this analysis. We consider the estimated net recoverable value of the loan as well as other factors, including but not limited to the fair value of any collateral, the amount and the status of any senior debt, the quality and financial condition of the borrower and the competitive situation of the area where the underlying collateral is located. Because this determination is based on projections of future economic events, which are inherently subjective, the amount ultimately realized may differ materially from the carrying value as of the balance sheet date. If upon completion of the assessment, the estimated fair value of the underlying collateral is less than the net carrying value of the loan, a loan loss reserve is recorded with a corresponding charge to provision for loan losses. The loan loss reserve for each loan is maintained at a level that is determined to be adequate by management to absorb probable losses.
Income recognition is suspended for a loan at the earlier of the date at which payments become 90-days past due or when, in the opinion of management, a full recovery of income and principal becomes doubtful. When the ultimate collectability of the principal of an impaired loan is in doubt, all payments are applied to principal under the cost recovery method. When the ultimate collectability of the principal of an impaired loan is not in doubt, contractual interest is recorded as interest income when received, under the cash basis method until an accrual is resumed when the loan becomes contractually current and performance is demonstrated to be resumed. A loan is written off when it is no longer realizable and/or legally discharged.
Investments in Unconsolidated Ventures
We review our investments in unconsolidated ventures for which we did not elect the fair value option on a quarterly basis, or more frequently as necessary, to assess whether there are any indicators that the value may be impaired or that its carrying value may not be recoverable. An investment is considered impaired if the projected net recoverable amount over the expected holding period is less than the carrying value. In conducting this review, we consider U.S. macroeconomic factors, including real estate sector conditions, together with asset specific and other factors. To the extent an impairment has occurred and is considered to be other than temporary, the loss is measured as the excess of the carrying value of the investment over the estimated fair value and recorded in provision for loss on equity investment in our consolidated statements of operations.
Real Estate Securities
CRE securities for which the fair value option is elected are not evaluated for other-than-temporary impairment, or OTTI, as any change in fair value is recorded in our consolidated statements of operations. Realized losses on such securities are reclassified to realized gain (loss) on investments and other as losses occur.
CRE securities for which the fair value option is not elected are evaluated for OTTI quarterly. Impairment of a security is considered to be other-than-temporary when: (i) the holder has the intent to sell the impaired security; (ii) it is more likely than not the holder will be required to sell the security; or (iii) the holder does not expect to recover the entire amortized cost of the security. When a CRE security has been deemed to be other-than-temporarily impaired due to (i) or (ii), the security is written down to its fair value and an OTTI is recognized in the consolidated statements of operations. In the case of (iii), the security is written down to its fair value and the amount of OTTI is then bifurcated into: (a) the amount related to expected credit losses; and (b) the amount related to fair value adjustments in excess of expected credit losses. The portion of OTTI related to expected credit losses is recognized in our consolidated statements of operations. The remaining OTTI related to the valuation adjustment is recognized as a component of accumulated OCI in our consolidated statements of equity. The portion of OTTI recognized through earnings is accreted back to the amortized cost basis of the security through interest income, while amounts recognized through OCI are amortized over the life of the security with no impact on earnings. CRE securities which are not high-credit quality are considered to have an OTTI if the security has an unrealized loss and there has been an adverse change in expected cash flow. The amount of OTTI is then bifurcated as discussed above.
Determination of Fair Value
The following is a description of the valuation techniques used to measure fair value of assets and liabilities accounted for at fair value on a recurring basis and the general classification of these instruments pursuant to the fair value hierarchy.
Investments in Private Equity Funds
We account for PE Investments at fair value which is determined based on a valuation model using assumptions for the timing and amount of expected future cash flow for income and realization events for the underlying assets in the funds and discount rate. This fair value measurement is generally based on unobservable inputs and, as such, is classified as Level 3 of the fair value hierarchy. We are not using the NAV (practical expedient) of the underlying funds for purposes of determining fair value.
Investments in Unconsolidated Ventures
We account for certain investments in unconsolidated ventures at fair value determined based on a valuation model using assumptions for the timing and amount of expected future cash flow for income and realization events for the underlying assets and discount rate. Additionally, we account for certain CRE debt investments made in connection with certain investments in unconsolidated ventures at fair value, which is determined based on comparing the current yield to the estimated yield for newly originated loans with similar credit risk. These fair value measurements are generally based on unobservable inputs and, as such, are classified as Level 3 of the fair value hierarchy.
Real Estate Securities
N-Star CDO Bonds
The fair value of subordinate N-Star CDO bonds is determined using an internal price interpolated based on third party prices of the more senior N-Star CDO bonds of the respective CDO. For the remaining N-Star CDO bonds, fair value is determined using quotations from nationally recognized financial institutions that generally acted as underwriter for the transactions. These quotations are not adjusted and are generally based on a valuation model with observable inputs such as interest rate and other unobservable inputs for assumptions related to the timing and amount of expected future cash flow, discount rate, estimated prepayments and projected losses. All N-Star CDO bonds are classified as Level 3 of the fair value hierarchy.
N-Star CDO Equity
The fair value of N-Star CDO equity is determined based on a valuation model using assumptions for the timing and amount of expected future cash flow for income and realization events for the underlying collateral of these CDOs and discount rate. This fair value measurement is generally based on unobservable inputs and, as such, is classified as Level 3 of the fair value hierarchy.
Other CRE Securities
Other CRE securities are generally valued using a third-party pricing service or broker quotations. These quotations are not adjusted and are based on observable inputs that can be validated, and as such, are classified as Level 2 of the fair value hierarchy. Certain CRE securities may be valued based on a single broker quote or an internal price which may have less observable pricing, and as such, would be classified as Level 3 of the fair value hierarchy. Management determines the prices are representative of fair value through a review of available data, including observable inputs, recent transactions as well as its knowledge of and experience in the market.
Derivative Instruments
Derivative instruments are valued using a third-party pricing service. These quotations are not adjusted and are generally based on valuation models with observable inputs such as interest rates and contractual cash flow, and as such, are classified as Level 2 of the fair value hierarchy. Derivative instruments are also assessed for credit valuation adjustments due to the risk of non-performance by us and derivative counterparties. However, since the majority of derivatives are held in non-recourse CDO financing structures where, by design, the derivative contracts are senior to all the CDO bonds payable, there is no material impact of a credit valuation adjustment.
CDO Bonds Payable
CDO bonds payable are valued using quotations from nationally recognized financial institutions that generally acted as underwriter for the transactions. These quotations are not adjusted and are generally based on a valuation model with observable inputs such as interest rate and other unobservable inputs for assumptions related to the timing and amount of expected future cash flow, discount rate, estimated prepayments and projected losses. CDO bonds payable are classified as Level 3 of the fair value hierarchy.
Junior Subordinated Notes
Junior subordinated notes are valued using quotations from nationally recognized financial institutions. These quotations are not adjusted and are generally based on a valuation model with observable inputs such as interest rate and other unobservable inputs for assumptions related to the implied credit spread of our other borrowings and the timing and amount of expected future cash flow. Junior subordinated notes are classified as Level 3 of the fair value hierarchy.
Recent Accounting Pronouncements
In April 2014, the Financial Accounting Standards Board (“FASB”) issued an accounting update that changes the requirements for reporting discontinued operations. A discontinued operation may include a component of an entity or a group of components of an entity or a business. A disposal of a component of an entity or a group of components of an entity is required to be reported in discontinued operations if the disposal represents a strategic shift that has (or will have) a major effect on an entity’s operations and financial results. The requirements of this accounting update will be effective for us for the annual period beginning after December 15, 2014, however, early adoption is permitted but only for disposals or classifications as held for sale that have not been reported in financial statements previously issued or available for issue. We early adopted this accounting pronouncement effective January 1, 2014 and the update did not have a material impact on our consolidated financial statements.
In May 2014, the FASB issued an accounting update requiring a company to recognize as revenue the amount of consideration it expects to be entitled to in connection with the transfer of promised goods or services to customers. When it becomes effective on January 1, 2017, the accounting standard update will replace most of the existing revenue recognition guidance currently promulgated by U.S. GAAP. We are in the process of evaluating the impact, if any, of the update on our consolidated financial statements and related disclosures.
In February 2015, the FASB issued updated guidance that changes the rules regarding consolidation. The pronouncement eliminates specialized guidance for limited partnerships and similar legal entities and removes the indefinite deferral for certain investment funds. The new guidance is effective for annual periods and interim periods within those annual periods beginning after December 15, 2015, with early adoption permitted. We are currently assessing the impact of the guidance on the our consolidated financial position, results of operations and financial statement disclosures.
Results of Operations
Comparison of the Year Ended December 31, 2014 to December 31, 2013 (Dollars in Thousands):
The consolidated financial statements for the year ended December 31, 2014 include: (i) our results of operations for the six months ended December 31, 2014 which represents our results of operations following the spin-off of our historical asset management business on June 30, 2014; and (ii) our results of operations for the six months ended June 30, 2014 which represents a carve-out of revenues and expenses attributable to NSAM recorded in discontinued operations. Our historical financial information for the year ended December 31, 2013 was prepared on the same basis as the six months ended June 30, 2014. As a result, results of operations for the year ended December 31, 2014 may not be comparative to our results of operations reported for the prior period presented. The following table represents our results of operations for the years ended December 31, 2014 and 2013 (dollars in thousands):
|
| | | | | | | | | | | | | | |
| | Years Ended December 31, | | Increase (Decrease) |
| | 2014 | | 2013 | | Amount |
| % |
| Property and other revenues | | | | | | | |
| Rental and escalation income | $ | 351,558 |
| | $ | 235,124 |
| | $ | 116,434 |
| | 49.5 | % |
| Hotel related income | 237,039 |
| | — |
| | 237,039 |
| | NA |
|
| Resident fee income | 77,516 |
| | — |
| | 77,516 |
| | NA |
|
| Other revenue | 15,033 |
| | 5,723 |
| | 9,310 |
| | 162.7 | % |
| Total property and other revenues | 681,146 |
| | 240,847 |
| | 440,299 |
| | 182.8 | % |
| Net interest income | | | | | |
| |
| Interest income | 310,117 |
| | 303,989 |
| | 6,128 |
|
| 2.0 | % |
| Interest expense on debt and securities | 12,870 |
| | 38,152 |
| | (25,282 | ) | | (66.3 | )% |
| Net interest income on debt and securities | 297,247 |
| | 265,837 |
| | 31,410 |
| | 11.8 | % |
| Expenses | | | | | | | |
| Management fee, related party | 82,756 |
| | — |
| | 82,756 |
| | NA |
|
| Other interest expense | 231,181 |
| | 140,507 |
| | 90,674 |
| | 64.5 | % |
| Real estate properties—operating expenses | 325,753 |
| | 73,668 |
| | 252,085 |
| | 342.2 | % |
| Other expenses | 1,812 |
| | 4,558 |
| | (2,746 | ) | | (60.2 | )% |
| Transaction costs | 204,102 |
| | 12,464 |
| | 191,638 |
| | NM |
|
| Provision for (reversal of) loan losses, net | 3,769 |
| | (8,786 | ) | | 12,555 |
| | (142.9 | )% |
| General and administrative expenses | | | | | | | |
| Salaries and related expense | 26,481 |
| | 26,421 |
| | 60 |
| | 0.2 | % |
| Equity-based compensation expense | 24,885 |
| | 11,784 |
| | 13,101 |
| | 111.2 | % |
| Other general and administrative expenses | 13,483 |
| | 16,159 |
| | (2,676 | ) | | (16.6 | )% |
| Total general and administrative expenses | 64,849 |
| | 54,364 |
| | 10,485 |
| | 19.3 | % |
| Depreciation and amortization | 185,222 |
| | 93,470 |
| | 91,752 |
| | 98.2 | % |
| Total expenses | 1,099,444 |
| | 370,245 |
| | 729,199 |
| | 197.0 | % |
| Other income (loss) |
|
|
|
|
|
|
|
|
|
|
|
| Unrealized gain (loss) on investments and other | (231,697 | ) | | (32,677 | ) | | (199,020 | ) | | 609.1 | % |
| Realized gain (loss) on investments and other | (77,234 | ) | | 32,376 |
| | (109,610 | ) | | (338.6 | )% |
| Gain (loss) from deconsolidation of N-Star CDOs | (31,423 | ) | | (299,802 | ) | | 268,379 |
| | (89.5 | )% |
| Other income (loss) | — |
| | 38 |
| | (38 | ) | | (100.0 | )% |
| Income (loss) before equity in earnings (losses) of unconsolidated ventures and income tax benefit (expense) | (461,405 | ) |
| (163,626 | ) |
| (297,779 | ) |
| 182.0 | % |
| Equity in earnings (losses) of unconsolidated ventures | 148,290 |
| | 85,477 |
| | 62,813 |
| | 73.5 | % |
| Income tax benefit (expense) | 157 |
| | (1,000 | ) | | 1,157 |
| | (115.7 | )% |
| Income (loss) from continuing operations | (312,958 | ) | | (79,149 | ) | | (233,809 | ) | | 295.4 | % |
| Income (loss) from discontinued operations | (8,128 | ) | | (8,761 | ) | | 633 |
| | (7.2 | )% |
| Net income (loss) | $ | (321,086 | ) | | $ | (87,910 | ) | | $ | (233,176 | ) | | 265.2 | % |
Property and Other Revenues
Rental and Escalation Income
Rental and escalation income increased $116.4 million, primarily attributable to new acquisitions including manufactured housing, healthcare, industrial and multifamily investments in our real estate segment ($155.8 million), offset by lower income from our net lease and healthcare properties ($6.9 million) in our real estate segment and lower income related to REOs that were deconsolidated in the N-Star CDO CRE debt segment ($32.5 million).
Hotel Related Income
We generated hotel related income of $237.0 million related to new hotel acquisitions in 2014. We did not generate any hotel related income in 2013.
Resident Fee Income
We generated resident fee income of $77.5 million in 2014 primarily related to the RIDEA properties in the Formation Portfolio. We did not generate any resident fee income in 2013.
Other Revenue
Other revenue increased $9.3 million primarily due to increases in various fees such as administrative fees from our deconsolidated N-Star CDOs which were eliminated in consolidation in 2013 and other fees recorded in our real estate segment.
Net Interest Income
Net interest income is generated on our interest-earning assets less related interest-bearing liabilities and is recorded as part of our CRE debt and securities segments and our N-Star CDO segments. For assets financed in a CDO, also referred to as legacy investments, the N-Star CDO segments are based on the primary collateral of the CDO financing transaction and as such may include other types of investments.
The following table presents the average balance of interest-earning assets less related interest-bearing liabilities, associated interest income and expense and corresponding yield earned and incurred for the years ended December 31, 2014 and 2013. Amounts presented have been impacted by the timing of new investments and repayments during the periods (dollars in thousands):
|
| | | | | | | | | | | | | | | | | | | | | | |
| | Years Ended December 31, | |
| | 2014 | | 2013 | |
| | Average Carrying Value(2) | | Interest Income/ Expense(3) | | WA Yield/ Financing Cost(4) | | Average Carrying Value(2) | | Interest Income/ Expense(3) | | WA Yield/ Financing Cost(4) | |
Interest-earning assets:(1) | | | | | | | | | | | | |
| CRE debt investments | $ | 1,127,476 |
| | $ | 164,903 |
| | 14.63 | % | | $ | 1,547,091 |
| | $ | 145,427 |
| | 9.40 | % | |
| CRE securities investments | 1,109,896 |
| | 145,214 |
| | 13.08 | % | | 1,554,922 |
| | 158,562 |
| | 10.20 | % | |
| | $ | 2,237,372 |
|
| 310,117 |
| | 13.86 | % | | $ | 3,102,013 |
| | 303,989 |
| | 9.80 | % | |
Interest-bearing liabilities:(1) | | | | | | | | | | | | |
| CDO bonds payable | $ | 702,191 |
| | 5,893 |
| | 3.24 | % | (5) | $ | 2,275,986 |
| | 29,913 |
| | 3.63 | % | (5) |
| Securitization bonds payable | 74,248 |
| | 2,394 |
| | 3.22 | % | | 97,973 |
| | 3,058 |
| | 3.12 | % | |
| Credit facilities | 84,721 |
| | 4,583 |
| | 5.41 | % | | 69,869 |
| | 4,753 |
| | 6.80 | % | |
| Secured term loan | — |
| | — |
| | — |
| | 8,776 |
| | 428 |
| | 4.88 | % | |
| | $ | 861,160 |
|
| 12,870 |
| | 3.45 | % | | $ | 2,452,604 |
| | 38,152 |
| | 3.71 | % | |
| Net interest income | |
| | $ | 297,247 |
| | |
| | |
| | $ | 265,837 |
| | |
| |
____________________________________________________________
| |
| (1) | Excludes $5.3 million and $124.6 million average carrying value of REO and investments in unconsolidated ventures associated with N-Star CDOs, net of related financing as of December 31, 2014 and 2013, respectively. |
| |
| (2) | Based on amortized cost for CRE debt and securities investments, principal amount for N-Star CDOs, securitization bonds payable, credit facilities and secured term loan and carrying value for the CSE and CapLease CDOs. All amounts are calculated based on quarterly averages. |
| |
| (3) | Includes the effect of amortization of premium or accretion of discount and deferred fees and interest income earned on notes receivable from sales of manufactured homes. |
| |
| (4) | Calculated as interest income or expense divided by average carrying value. |
| |
| (5) | We use interest rate swaps in CDO financing transactions to manage interest rate risk. Weighted average financing cost includes $16.9 million and $52.7 million of net cash payments on interest rate swaps recorded in unrealized gain (loss) in our consolidated statements of operations for the years ended December 31, 2014 and 2013, respectively. |
Interest income increased $6.1 million, primarily attributable to increased income related to CRE debt and securities investments ($99.4 million) and investments in deconsolidated N-Star CDO bonds and equity notes ($44.5 million), offset by decreased interest income on CRE debt and securities investments in the N-Star CDOs segment primarily attributable to the deconsolidation of N-Star CDO bonds payable ($137.7 million).
Interest expense decreased $25.3 million, primarily attributable to the deconsolidation of N-Star CDO bonds payable ($23.0 million) and reduced interest on other borrowings in the CRE debt segment ($2.3 million).
Expenses
Management Fee, Related Party
For the six months ended December 31, 2014, we recorded $79.4 million related to the base management fee and $3.3 million related to the incentive fee to NSAM. The management contract with NSAM commenced on July 1, 2014, and as such, there were no management fees incurred for the six months ended June 30, 2014 and the year ended December 31, 2013.
Other Interest Expense
Other interest expense increased $90.7 million, primarily attributable to increased interest expense related to new mortgage notes payable associated with new property acquisitions in our real estate segment ($107.5 million) and interest expense on the new senior notes at the corporate level that were repaid at maturity ($7.2 million), offset by lower interest expense from mortgage notes on REO that were deconsolidated in our N-Star CDO CRE debt segment ($9.4 million) and lower interest expense at the corporate level primarily due to conversions of exchangeable senior notes ($14.6 million).
Real Estate Properties—Operating Expenses
Real estate properties operating expenses increased $252.1 million, primarily attributable to new acquisitions in 2014 comprised of healthcare, hotel, manufactured housing and industrial investments in our real estate segment ($267.9 million), offset by lower expense related to REO that were deconsolidated in our N-Star CDO CRE debt segment ($15.8 million).
Other Expenses
Other expenses decreased $2.7 million related to decreased expense from N-Star debt CDOs that were deconsolidated in 2013 and were recorded as part of the N-Star CDO segments. These amounts include legal and consulting fees for loan modifications and restructurings and other expenses associated with managing the N-Star CDOs.
Transaction Costs
Transaction costs represent costs such as professional fees associated with new investments and restructuring charges related to existing investments. For the year ended December 31, 2014, transaction costs of $204.1 million primarily related to real estate acquisitions and restructurings, which includes transaction costs related to the merger of Griffin-American ($72.9 million), incurred costs in connection with the pending acquisitions in our European Portfolio ($27.9 million), the acquisitions of our hotel portfolios ($53.8 million), acquisitions and restructurings related to our other healthcare portfolios ($30.2 million) and our other acquisitions, all in our real estate segment. For the year ended December 31, 2013, transaction costs of $12.5 million related to our acquisition of manufactured housing communities and PE Investments, both in our real estate segment.
Provision for (Reversal of) Loan Losses, Net
For the year ended December 31, 2014, provision for loan losses, net of $3.8 million related to a provision for loan loss for an existing mezzanine loan, an existing first mortgage loan and a provision on notes receivable related to our manufactured housing portfolio. For the year ended December 31, 2013, reversal of provision for loan losses, net of $8.8 million related to reversals of provision for loan loss of $15.1 million primarily associated with a loan loss on a mezzanine loan ($6.3 million), offset by a reversal of provision for loan loss for a mezzanine loan for which we contemporaneously took title to the collateral ($4.0 million) and a reversal of a provision for loan loss in September 2013 primarily related to a loan that paid off at par during the fourth quarter.
General and Administrative Expenses
General and administrative expenses are principally incurred at the corporate level. General and administrative expenses increased $10.5 million primarily attributable to the following:
Salaries and related expense increased $0.1 million primarily due to an increase for new employees due to increased investment activity during the six months ended June 30, 2014, offset by a decrease from most of our existing employees at the time of the spin-off becoming employees of NSAM.
Equity-based compensation expense for the year ended December 31, 2014 represents: (i) our expense for the six months ended December 31, 2014 following the spin-off; and (ii) the net amount of equity-based compensation expense for the six months ended June 30, 2014 after an allocation to NSAM related to our historical asset management business had it been run as an independent entity. Equity-based compensation expense for the year ended December 31, 2013 was prepared on the same basis as the six months ended June 30, 2014. The following table presents equity-based compensation expense for the years ended December 31, 2014 and 2013 (dollars in thousands):
|
| | | | | | | |
| | Years Ended December 31, |
| | 2014 | | 2013 |
| NorthStar Realty | $ | 24,885 |
| | $ | 11,784 |
|
Allocation to NSAM (1) | 13,745 |
| | 5,177 |
|
| Total | $ | 38,630 |
| (2) | $ | 16,961 |
|
___________________________________________________________
| |
| (1) | Allocation recorded in discontinued operations. The allocation to NSAM for the year ended December 31, 2014 is based on equity-based |
compensation expense for the six months ended June 30, 2014.
| |
| (2) | Represents $28.0 million related to the NorthStar Realty Equity Plans and $10.6 million related to the NSAM Stock Plan. |
Other general and administrative expenses decreased $2.7 million due to the spin-off of our historical asset management business.
Depreciation and Amortization
Depreciation and amortization expense increased $91.8 million, primarily related to new acquisitions in our real estate segment ($107.0 million), offset by lower expense related to REO that were deconsolidated in our N-Star CDO CRE debt segment ($14.6 million) and furniture, fixtures and equipment that were transferred to NSAM in connection with the spin-off ($0.5 million).
Other Income (Loss)
Unrealized Gain (Loss) on Investments and Other
Unrealized gain (loss) on investments and other is primarily related to the non-cash change in fair value adjustments and the remaining amount is related to net cash payments on interest rate swaps. The following table presents a summary of unrealized gain (loss) on investments and other by operating segment for the years ended December 31, 2014 and 2013 (dollars in thousands): |
| | | | | | | | | | | | | | | | | | | | | | | | |
| | | Year Ended December 31, 2014 |
| | | | | | | | | N-Star CDOs | | | | |
| | | Real Estate | | CRE
Debt | | CRE
Securities | | CRE
Securities | | Corporate | | Total |
| Change in fair value of: | | | | | | | | | | | | |
| Real estate securities, available for sale | | $ | — |
| | $ | — |
| | $ | (23,814 | ) | | $ | 11,490 |
| | $ | — |
| | $ | (12,324 | ) |
| PE Investments | | 32,621 |
| | — |
| | — |
| | — |
| | — |
| | 32,621 |
|
| CDO bonds payable, at fair value | | — |
| | — |
| | — |
| | (217,608 | ) | | — |
| | (217,608 | ) |
| Junior subordinated notes, at fair value | | — |
| | — |
| | — |
| | — |
| | (13,969 | ) | | (13,969 | ) |
| Derivatives, at fair value | | (2,898 | ) | | — |
| | — |
| | 11,082 |
| | — |
| | 8,184 |
|
Foreign currency remeasurement(1) | | (9,479 | ) | | (1,310 | ) | | — |
| | — |
| | (930 | ) | | (11,719 | ) |
| Net cash payments on interest rate swaps | | — |
| | — |
| | (232 | ) | | (16,650 | ) | | — |
| | (16,882 | ) |
| Total unrealized gain (loss) on investments and other | | $ | 20,244 |
| | $ | (1,310 | ) | | $ | (24,046 | ) | | $ | (211,686 | ) | | $ | (14,899 | ) | | $ | (231,697 | ) |
| |
| (1) | Primarily represents foreign currency remeasurement on an investment denominated in Euros. |
|
| | | | | | | | | | | | | | | | | | | | | | | | |
| | | Year Ended December 31, 2013 |
| | | | | | | N-Star CDOs | | | | |
| | | CRE
Debt | | CRE
Securities | | CRE
Debt | | CRE
Securities | | Corporate | | Total |
| Change in fair value of: | | | | | | | | | | | | |
| Real estate securities, available for sale | | $ | — |
|
| $ | — |
|
| $ | (2,407 | ) |
| $ | 97,083 |
|
| $ | — |
| | $ | 94,676 |
|
| CDO bonds payable, at fair value | | — |
|
| (2,356 | ) |
| — |
|
| (104,266 | ) |
| — |
| | (106,622 | ) |
| Junior subordinated notes, at fair value | | — |
|
| — |
|
| — |
|
| — |
|
| (4,030 | ) | | (4,030 | ) |
| Derivatives, at fair value | | — |
|
| — |
|
| — |
|
| 33,730 |
|
| — |
| | 33,730 |
|
Foreign currency remeasurement(1) | | 2,300 |
|
| — |
|
| — |
|
| — |
|
| — |
| | 2,300 |
|
| Net cash payments on interest rate swaps | | — |
|
| — |
|
| (10,285 | ) |
| (42,446 | ) |
| — |
| | (52,731 | ) |
| Total unrealized gain (loss) on investments and other | | $ | 2,300 |
| | $ | (2,356 | ) | | $ | (12,692 | ) | | $ | (15,899 | ) | | $ | (4,030 | ) | | $ | (32,677 | ) |
| |
| (1) | Primarily represents foreign currency remeasurement on an investment denominated in Euros. |
Realized Gain (Loss) on Investments and Other
Realized losses of $77.2 million for the year ended December 31, 2014 primarily related to losses on exchangeable senior notes ($65.8 million) in our corporate segment, losses on the sale of manufactured homes ($3.9 million) in our real estate segment and net losses from the sale of CRE securities, including N-Star CDO bonds ($1.7 million).
Realized gains of $32.4 million for the year ended December 31, 2013 primarily related to our N-Star CDO segments and included gains from the sale of CRE debt and securities investments ($11.5 million), gains from the liquidation of N-Star CDO II ($7.0 million), offset by losses related to certain CRE securities investments ($8.5 million) and repurchases of CDO bonds ($12.3 million). The remaining change related to gains from an investment in the CRE securities segment ($33.2 million) and gain from the sale of timeshare units ($12.2 million) in our real estate segment, offset by a loss on exchangeable senior notes ($10.9 million) in the corporate segment and a loss on the sale of manufactured homes ($0.9 million) in our real estate segment.
Equity in Earnings (Losses) of Unconsolidated Ventures and Income Tax Benefit (Expense)
Equity in Earnings (Losses) of Unconsolidated Ventures
Equity in earnings (losses) of unconsolidated ventures increased $62.8 million, primarily attributable to increased earnings from PE Investments ($51.4 million) and other indirect interests in real estate ($10.7 million).
Income Tax Benefit (Expense)
The income tax benefit for the year ended December 31, 2014 represents a net benefit of $0.2 million primarily related to the effect of net operating loss carryforward related to our hotel and healthcare portfolios operating under a RIDEA structure ($1.8 million), offset by a provision for income tax primarily related to various real estate investments ($1.6 million). The income tax expense for the year ended December 31, 2013 represents income tax of $1.0 million related to sales of timeshare units in our real estate segment.
Discontinued Operations
Gain (Loss) from Deconsolidation of N-Star CDOs
The loss of $31.4 million for the year ended December 31, 2014 is related to the deconsolidation of N-Star CDOs III and V. The loss of $299.8 million is related to the deconsolidation of N-Star CDOs IV, VI, VII and VIII, the CapLease CDO and the CSE CDO. All amounts were predominately due to the reversal of the unrealized gains on the CDO liabilities that were recorded in prior periods due to the election of the fair value option.
Income (Loss) from Discontinued Operations
The following table presents discontinued operations and excludes the effect of any fees that NSAM will earn in connection with the management agreement with us (dollars in thousands):
|
| | | | | | | | | | | | | | |
| | Years Ended December 31, | | Increase
(Decrease) |
| | 2014 | | 2013 | | Amount | | % |
| NSAM | | | | | | | |
| Total revenues | $ | 56,013 |
| | $ | 89,938 |
| | $ | (33,925 | ) | (1) | (37.7 | )% |
| Total expenses | 63,216 |
| | 90,343 |
| | (27,127 | ) | (1) | (30.0 | )% |
| NSAM income (loss) in discontinued operations | (7,203 | ) | | (405 | ) | | (6,798 | ) | | NM |
|
Income (loss) from operating real estate discontinued operations (2) | (925 | ) | | (8,356 | ) | | 7,431 |
| | (88.9 | )% |
| Total income (loss) from discontinued operations | $ | (8,128 | ) | | $ | (8,761 | ) | | $ | 633 |
| | (7.2 | )% |
___________________________________________________________
| |
| (1) | The decrease is a result of the year ended December 31, 2014 representing only six months of total revenues and expenses of NSAM included in discontinued operations prior to the spin-off on June 30, 2014, whereas 2013 is based on an allocation of revenue and expense for the year ended December 31, 2013. |
| |
| (2) | Income (loss) from operating real estate in discontinued operations primarily represents the operations of properties sold or classified as held for sale during the period. |
Comparison of the Year Ended December 31, 2013 to December 31, 2012 (Dollars in Thousands):
|
| | | | | | | | | | | | | | |
| | Years Ended December 31, | | Increase (Decrease) |
| | 2013 | | 2012 | | Amount | | % |
| Property and other revenues | | | | | | | |
| Rental and escalation income | $ | 235,124 |
| | $ | 112,496 |
| | $ | 122,628 |
| | 109.0 | % |
| Other revenue | 5,723 |
| | 1,812 |
| | 3,911 |
| | 215.8 | % |
| Total property and other revenues | 240,847 |
| | 114,308 |
| | 126,539 |
| | 110.7 | % |
| Net interest income | | | | | | | |
| Interest income | 303,989 |
| | 386,053 |
| | (82,064 | ) | | (21.3 | )% |
| Interest expense on debt and securities | 38,152 |
| | 50,557 |
| | (12,405 | ) | | (24.5 | )% |
| Net interest income on debt and securities | 265,837 |
| | 335,496 |
| | (69,659 | ) | | (20.8 | )% |
| Expenses | | | | | | | |
| Other interest expense | 140,507 |
| | 89,536 |
| | 50,971 |
| | 56.9 | % |
| Real estate properties—operating expenses | 73,668 |
| | 18,679 |
| | 54,989 |
| | 294.4 | % |
| Other expenses | 4,558 |
| | 6,358 |
| | (1,800 | ) | | (28.3 | )% |
| Transaction costs | 12,464 |
| | 2,571 |
| | 9,893 |
| | 384.8 | % |
| Provision for (reversal of) loan losses, net | (8,786 | ) | | 23,037 |
| | (31,823 | ) | | (138.1 | )% |
| General and administrative expenses | | | | | | | |
| Salaries and related expense | 26,421 |
| | 29,279 |
| | (2,858 | ) | | (9.8 | )% |
| Equity-based compensation expense | 11,784 |
| | 8,593 |
| | 3,191 |
| | 37.1 | % |
| Other general and administrative expenses | 16,159 |
| | 14,524 |
| | 1,635 |
| | 11.3 | % |
| Total general and administrative expenses | 54,364 |
| | 52,396 |
| | 1,968 |
| | 3.8 | % |
| Depreciation and amortization | 93,470 |
| | 47,499 |
| | 45,971 |
| | 96.8 | % |
| Total expenses | 370,245 |
| | 240,076 |
| | 130,169 |
| | 54.2 | % |
| Other income (loss) |
|
|
|
|
|
|
|
|
|
|
|
| Unrealized gain (loss) on investments and other | (32,677 | ) | | (547,132 | ) | | 514,455 |
| | (94.0 | )% |
| Realized gain (loss) on investments and other | 32,376 |
| | 59,340 |
| | (26,964 | ) | | (45.4 | )% |
| Gain (loss) from deconsolidation of N-Star CDOs | (299,802 | ) | | — |
| | (299,802 | ) | | NA |
|
| Other income (loss) | 38 |
| | 20,258 |
| | (20,220 | ) | | (99.8 | )% |
| Income (loss) before equity in earnings (losses) of unconsolidated ventures and income tax benefit (expense) | (163,626 | ) |
| (257,806 | ) |
| 94,180 |
|
| (36.5 | )% |
| Equity in earnings (losses) of unconsolidated ventures | 85,477 |
| | 88 |
| | 85,389 |
| | NM |
|
| Income tax benefit (expense) | (1,000 | ) | | — |
| | (1,000 | ) | | NA |
|
| Income (loss) from continuing operations | (79,149 | ) | | (257,718 | ) | | 178,569 |
| | (69.3 | )% |
| Income (loss) from discontinued operations | (8,761 | ) | | (17,450 | ) | | 8,689 |
| | (49.8 | )% |
| Gain (loss) on sale from discontinued operations | — |
| | 2,079 |
| | (2,079 | ) | | (100.0 | )% |
| Net income (loss) | $ | (87,910 | ) | | $ | (273,089 | ) | | $ | 185,179 |
| | (67.8 | )% |
Property and Other Revenues
Rental and Escalation Income
Rental and escalation income increased $122.6 million, primarily attributable to real estate acquisitions in 2013 ($117.8 million) and higher income from our net lease and healthcare properties ($2.5 million) in our real estate segment and higher income related to new REO in 2013 in our N-Star CDO CRE debt segment ($2.4 million).
Other Revenue
Other revenue increased $3.9 million due to increases in various fees such as special servicing fees, draw fees and late fees.
Net Interest Income
Net interest income is generated on our interest-earning assets less related interest-bearing liabilities and is recorded as part of our CRE debt and securities segments and our N-Star CDO segments. For assets financed in a CDO, also referred to as legacy investments, the N-Star CDO segments are based on the primary collateral of the CDO financing transaction and as such may include other types of investments.
The following table presents the average balance of interest-earning assets less related interest-bearing liabilities, associated interest income and expense and corresponding yield earned and incurred for the years ended December 31, 2013 and 2012. Amounts presented have been impacted by the timing of new investments and repayments during the period (dollars in thousands):
|
| | | | | | | | | | | | | | | | | | | | | | |
| | Years Ended December 31, | |
| | 2013 | | 2012 | |
| | Average Carrying Value(2) | | Interest Income/ Expense(3) | | WA Yield/ Financing Cost(4) | | Average Carrying Value(2) | | Interest Income/ Expense(3) | | WA Yield/ Financing Cost(4) | |
Interest-earning assets:(1) | | | | | | | | | | | | |
| CRE debt investments | $ | 1,547,091 |
|
| $ | 145,427 |
|
| 9.40 | % | | $ | 1,767,834 |
| | $ | 202,784 |
| | 11.47 | % | |
| CRE securities investments | 1,554,922 |
|
| 158,562 |
|
| 10.20 | % | | 2,076,941 |
| | 183,269 |
| | 8.82 | % | |
| | $ | 3,102,013 |
|
| 303,989 |
|
| 9.80 | % | | $ | 3,844,775 |
| | 386,053 |
| | 10.04 | % | |
Interest-bearing liabilities:(1) | |
| |
| | | | | | | | |
| CDO bonds payable | $ | 2,275,986 |
|
| 29,913 |
|
| 3.63 | % | (5) | $ | 3,447,411 |
| | 46,594 |
| | 3.63 | % | (5) |
| Securitization bonds payable | 97,973 |
|
| 3,058 |
|
| 3.12 | % | | 19,601 |
| | 345 |
| | 1.76 | % | |
| Credit facilities | 69,869 |
|
| 4,753 |
|
| 6.80 | % | | 95,527 |
| | 3,043 |
| | 3.19 | % | |
| Secured term loan | 8,776 |
|
| 428 |
|
| 4.88 | % | | 14,678 |
| | 575 |
| | 3.92 | % | |
| | $ | 2,452,604 |
|
| 38,152 |
|
| 3.71 | % | | $ | 3,577,217 |
| | 50,557 |
| | 3.61 | % | |
| Net interest income | |
|
| $ | 265,837 |
|
| |
| | |
| | $ | 335,496 |
| | |
| |
____________________________________________________________
| |
| (1) | Excludes $124.6 million and $174.4 million aggregate average carrying value of REO and investments in unconsolidated ventures associated with N-Star CDOs, net of related financing as of December 31, 2013 and 2012, respectively. |
| |
| (2) | Based on amortized cost for CRE debt and securities investments, principal amount for N-Star CDOs, securitization bonds payable, credit facilities and secured term loan and carrying value for the CSE and CapLease CDOs. All amounts are calculated based on quarterly averages. |
| |
| (3) | Includes the effect of amortization of premium or accretion of discount and deferred fees. |
| |
| (4) | Calculated as interest income or expense divided by average carrying value. |
| |
| (5) | We use interest rate swaps in CDO financing transactions to manage interest rate risk. Weighted average financing cost includes $52.7 million and $78.6 million of net cash payments on interest rate swaps recorded in unrealized gain (loss) in our consolidated statements of operations for the years ended December 31, 2013 and 2012, respectively. |
Interest income decreased $82.1 million, primarily attributable to decreased interest income in 2013 on CRE debt and securities investments in the CSE CDO ($81.7 million) and other N-Star CDOs ($60.7 million), offset by increased income associated with investments in our CDO bonds due to deconsolidation of N-Star CDOs ($21.7 million) and related to new CRE debt and securities investments in 2013 ($38.7 million).
Interest expense decreased $12.4 million, primarily attributable to lower interest expense related to repurchases and paydowns of CDO bonds payable ($16.0 million), offset by borrowings on investments made in 2013 through credit facilities and Securitization 2012-1 ($3.6 million).
Expenses
Other Interest Expense
Other interest expense increased $51.0 million, primarily attributable to increased interest expense related to mortgage notes payable associated with real estate acquisitions in 2013 in our real estate segment ($38.5 million) and exchangeable senior notes issued in 2013 at the corporate level ($12.5 million), offset by decreased interest expense from principal paydowns on other borrowings.
Real Estate Properties—Operating Expenses
Real estate properties operating expenses increased $55.0 million, primarily attributable to real estate acquisitions in 2013 in our real estate segment ($51.5 million), new REO in 2013 in our N-Star CDO CRE debt segment ($1.2 million) and higher expenses on our net lease and healthcare properties ($2.3 million) in our real estate segment.
Other Expenses
Other expenses decreased $1.8 million related to decreased expense from N-Star debt CDOs that were deconsolidated in 2013 and were recorded as part of the N-Star CDO segments. These amounts include legal and consulting fees for loan modifications and restructurings and other expenses associated with managing the N-Star CDOs.
Transaction Costs
Transaction costs represent costs such as professional fees associated with investments made in such year. For the year ended December 31, 2013, transaction costs of $12.5 million related to our acquisition of PE Investments and real estate properties in our real estate segment. For the year ended December 31, 2012, transaction costs of $2.6 million related to dead deal costs incurred at the corporate level ($2.9 million) and our acquisition of real estate properties in our real estate segment ($1.7 million), offset by a reversal of previously recorded surety bond costs expensed related to certain litigation in our real estate segment.
Provision for (Reversal of) Loan Losses, Net
Provision for (reversal of) loan losses, net on our CRE debt investments decreased $31.8 million. For the year ended December 31, 2013, reversal of provision for loan loss of $8.8 million primarily related to reversal of provision for loan loss of $15.1 million primarily associated with a loan that paid off at par during the fourth quarter ($10.6 million) and a reversal of provision for loan loss for a mezzanine loan for which we contemporaneously took title to the collateral ($4.0 million), offset by a provision for loan loss on a mezzanine loan ($6.3 million). For the year ended December 31, 2012, provision for loan losses, net of $23.0 million related to seven investments and included $25.2 million for mezzanine loans, $2.0 million for subordinated mortgage interests and $0.5 million for first mortgage loans, offset by a reversal of provision for loan losses of $4.7 million for a first mortgage loan.
General and Administrative Expenses
General and administrative expenses are principally incurred at the corporate level.
General and administrative expenses increased $2.0 million primarily attributable to the following:
Salaries and related expense decreased $2.9 million primarily due to an allocation to NSAM as a result of the spin-off of our historical asset management business which resulted in most of our existing employees at the time of the spin-off becoming employees of NSAM.
Equity-based compensation expense for the years ended December 31, 2013 and 2012 represents an allocation of expense to NSAM prepared on the same basis as the six months ended June 30, 2014. The following table presents equity-based compensation expense for the years ended December 31, 2013 and 2012 (dollars in thousands):
|
| | | | | | | |
| | Years Ended December 31, |
| | 2013 | | 2012 |
| NorthStar Realty | $ | 11,784 |
| | $ | 8,593 |
|
Allocation to NSAM (1) | 5,177 |
| | 4,224 |
|
| Total | $ | 16,961 |
| | $ | 12,817 |
|
____________________________________________________________
| |
| (1) | Allocation recorded in discontinued operations. |
Other general and administrative expenses increased $1.6 million at the corporate level primarily due to increased legal fees related to general corporate work.
Depreciation and Amortization
Depreciation and amortization expense increased $46.0 million, primarily related to acquisitions in 2013 in our real estate segment.
Other Income (Loss)
Unrealized Gain (Loss) on Investments and Other
Unrealized gain (loss) on investments and other is primarily related to the non-cash change in fair value adjustments and the remaining amount is related to net cash payments on interest rate swaps. The following table presents a summary of unrealized gain (loss) on investments and other by operating segment for the years ended December 31, 2013 and 2012 (dollars in thousands):
|
| | | | | | | | | | | | | | | | | | | | | | | |
| | Year Ended December 31, 2013 |
| | | | | | N-Star CDOs | | | | |
| | CRE
Debt | | CRE
Securities | | CRE
Debt | | CRE
Securities | | Corporate | | Total |
| Change in fair value of: | | | | | | | | | | | |
| Real estate securities, available for sale | $ | — |
| | $ | — |
| | $ | (2,407 | ) | | $ | 97,083 |
| | $ | — |
| | $ | 94,676 |
|
| CDO bonds payable, at fair value | — |
| | (2,356 | ) | | — |
| | (104,266 | ) | | — |
| | (106,622 | ) |
| Junior subordinated notes, at fair value | — |
| | — |
| | — |
| | — |
| | (4,030 | ) | | (4,030 | ) |
| Derivatives, at fair value | — |
| | — |
| | — |
| | 33,730 |
| | — |
| | 33,730 |
|
Foreign currency remeasurement(1) | 2,300 |
| | — |
| | — |
| | — |
| | — |
| | 2,300 |
|
| Net cash payments on interest rate swaps | — |
| | — |
| | (10,285 | ) | | (42,446 | ) | | — |
| | (52,731 | ) |
| Total unrealized gain (loss) on investments and other | $ | 2,300 |
| | $ | (2,356 | ) | | $ | (12,692 | ) | | $ | (15,899 | ) | | $ | (4,030 | ) | | $ | (32,677 | ) |
| |
| (1) | Primarily represents foreign currency remeasurement on an investment denominated in Euros. |
|
| | | | | | | | | | | | | | | | | | | |
| | Year Ended December 31, 2012 |
| | | | N-Star CDOs | | | | |
| | CRE
Debt | | CRE
Debt | | CRE
Securities | | Corporate | | Total |
| Change in fair value of: | | | | | | | | | |
| Real estate securities, available for sale | $ | — |
| | $ | 10,073 |
| | $ | 25,920 |
| | $ | — |
| | $ | 35,993 |
|
| CDO bonds payable, at fair value | — |
| | — |
| | (510,105 | ) | | — |
| | (510,105 | ) |
| Junior subordinated notes, at fair value | — |
| | — |
| | — |
| | (40,005 | ) | | (40,005 | ) |
| Derivatives, at fair value | — |
| | — |
| | 44,743 |
| | — |
| | 44,743 |
|
Foreign currency remeasurement(1) | 1,145 |
| | — |
| | — |
| | — |
| | 1,145 |
|
| Net cash payments on interest rate swaps | | | — |
| | (78,903 | ) | | — |
| | (78,903 | ) |
| Total unrealized gain (loss) on investments and other | $ | 1,145 |
| | $ | 10,073 |
| | $ | (518,345 | ) | | $ | (40,005 | ) | | $ | (547,132 | ) |
___________________________________________________________
| |
| (1) | Primarily represents foreign currency remeasurement on an investment denominated in Euros. |
Realized Gain (Loss) on Investments and Other
Realized gains of $32.4 million for the year ended December 31, 2013 primarily related to our N-Star CDO segments and included gains from the sale of CRE debt and securities investments ($11.5 million), gains from the liquidation of N-Star CDO II ($7.0 million), offset by losses related to certain CRE securities investments ($8.5 million) and repurchases of CDO bonds ($12.3 million). The remaining change related to gains from an investment in the CRE securities segment ($33.1 million) and gain from the sale of timeshare units ($12.2 million) in our real estate segment, offset by a loss on exchangeable senior notes ($10.9 million) in the corporate segment and a loss on the sale of manufactured homes ($0.9 million) in our real estate segment.
Realized gains of $59.3 million for the year ended December 31, 2012 primarily related to the N-Star CDO segments and included net gains from the sale of CRE debt and securities investments ($48.3 million), gains from the sale of two land parcels and a REO property ($9.3 million) and gains on the termination of an interest rate swap ($7.6 million), offset by net losses on repurchases of CDO bonds ($21.3 million) and losses related to certain CRE securities investments ($4.6 million). The remaining change related to gains from the sales of timeshare units ($20.9 million) in our real estate segment, offset by losses related to certain CRE securities investments in the CRE securities segment ($0.8 million).
Gain (Loss) from Deconsolidation of N-Star CDOs
The loss of $299.8 million is related to the deconsolidation of N-Star CDOs IV, VI, VII and VIII, the CapLease CDO and the CSE CDO, which was predominately due to the reversal of the unrealized gains on the CDO liabilities that were recorded in prior periods due to the election of the fair value option. There was no gain (loss) from deconsolidation of N-Star CDOs for the year ended December 31, 2012.
Other Income (Loss)
Other income (loss) for the year ended December 31, 2013 was primarily comprised of $10.0 million related to certain investments in our CRE securities segment, offset by a loss accrual of $10.0 million in our N-Star CDO securities segment. Other income (loss) of $20.3 million for the year ended December 31, 2012 was primarily comprised of a reversal of a loss accrual previously recorded related to certain litigation in our real estate segment.
Equity in Earnings (Losses) of Unconsolidated Ventures and Income Tax Benefit (Expense)
Equity in Earnings (Losses) of Unconsolidated Ventures
Equity in earnings (losses) of unconsolidated ventures increased $85.4 million, primarily attributable to PE Investment I ($53.7 million) and PE Investment II ($28.9 million), both in our real estate segment, earnings from the NSAM Sponsored Companies ($0.4 million) and earnings from other equity investments in our real estate segment ($2.5 million).
Income Tax Benefit (Expense)
The income tax expense for the year ended December 31, 2013 related to sales of timeshare units at a property in our real estate segment.
Discontinued Operations
Income (Loss) from Discontinued Operations
The following table presents discontinued operations and excludes the effect of any fees that NSAM will earn in connection with the management agreement with us (dollars in thousands):
|
| | | | | | | | | | | | | | |
| | Years Ended December 31, | | Increase
(Decrease) |
| | 2013 | | 2012 | | Amount | | % |
| NSAM | | | | | | | |
| Total revenues | $ | 89,938 |
| | $ | 50,761 |
| | $ | 39,177 |
| (1) | 77.2 | % |
| Total expenses | 90,343 |
| | 68,083 |
| | 22,260 |
| (1) | 32.7 | % |
| NSAM income (loss) in discontinued operations | (405 | ) | | (17,322 | ) | | 16,917 |
| | (97.7 | )% |
Income (loss) from operating real estate discontinued operations (2) | (8,356 | ) |
| (128 | ) | | (8,228 | ) | | NM |
|
| Total income (loss) from discontinued operations | $ | (8,761 | ) |
| $ | (17,450 | ) | | $ | 8,689 |
| | (49.8 | )% |
___________________________________________________________
| |
| (1) | The increase was driven by the growth of NSAM’s first Sponsored Company, NorthStar Income and the commencement of capital raising and in turn investments for NSAM’s second and third Sponsored Companies, NorthStar Healthcare and NorthStar Income II, respectively. |
| |
| (2) | Income (loss) from operating real estate in discontinued operations primarily represents the operations of properties sold or classified as held for sale during the period. For the years ended December 31, 2013 and 2012, income (loss) from discontinued operations of $8.4 million and $0.1 million, respectively, related to five healthcare properties classified as held for sale in our real estate segment and one multifamily property located in Texas that was sold in 2012 in our N-Star CDO CRE debt segment. |
Gain on Sale from Discontinued Operations
For the year ended December 31, 2013, there was no gain on sale from discontinued operations. Gain on sale from discontinued operations of $2.1 million for the year ended December 31, 2012 primarily related to the sale of an office property in Indiana ($0.3 million) and a multifamily property located in Texas ($1.8 million), both part of our N-Star CDO CRE debt segment.
Liquidity and Capital Resources
We require capital to fund our investment activities and operating expenses. Our capital sources may include cash flow from operations, net proceeds from asset repayments and sales, borrowings under credit facilities, financings secured by our assets such as mortgage notes, securitization financing transactions, long-term senior and subordinate corporate capital such as revolving credit facilities, senior term loans, senior notes, senior exchangeable notes, trust preferred securities, perpetual preferred stock and common stock.
We seek to meet our long-term liquidity requirements, including the repayment of borrowings and our investment funding needs, through existing cash resources, issuance of debt or equity capital, return of capital from investments and the liquidation or refinancing of assets. Nonetheless, our ability to meet a long-term (beyond one year) liquidity requirement may be subject to obtaining additional debt and equity financing. Any decision by our lenders and investors to provide us with financing will depend upon a number of factors, such as our compliance with the terms of our existing credit arrangements, our financial performance, industry or market trends, the general availability of and rates applicable to financing transactions, such lenders’
and investors’ resources and policies concerning the terms under which they make capital commitments and the relative attractiveness of alternative investment or lending opportunities.
As a REIT, we are required to distribute at least 90% of our annual REIT taxable income to our stockholders, including taxable income where we do not receive corresponding cash, and we intend to distribute all or substantially all of our REIT taxable income in order to comply with the REIT distribution requirements of the Internal Revenue Code and to avoid federal income tax and the non-deductible excise tax. On a quarterly basis, our board of directors determines an appropriate common stock dividend based upon numerous factors, including CAD, REIT qualification requirements, availability of existing cash balances, borrowing capacity under existing credit agreements, access to cash in the capital markets and other financing sources, our view of our ability to realize gains in the future through appreciation in the value of our assets, general economic conditions and economic conditions that more specifically impact our business or prospects. Future dividend levels are subject to adjustment based upon our evaluation of the factors described above, as well as other factors that our board of directors may, from time-to-time, deem relevant to consider when determining an appropriate common stock dividend.
We currently believe that our existing sources of funds should be adequate for purposes of meeting our short-term liquidity needs. Unrestricted cash as of February 24, 2015 was approximately $366 million. In addition, as of February 24, 2015, $305 million of financing remains undrawn under our corporate revolving credit facility and $75 million of financing remains undrawn under our corporate term credit facility, subject to entering into additional term loans under such facility. However, we may seek to raise additional capital in order to finance new acquisitions.
Capital Raise
For the year ended December 31, 2014, we issued aggregate net capital of $2.6 billion, including $1.3 billion from the issuance of common equity (including the remaining shares issued under our forward sale agreement in February 2015 for net proceeds of $122 million), $1.1 billion as part of the consideration for the merger of Griffin-American and $242 million from the issuance of preferred stock.
Securitization Financing Transactions
We, and on behalf of NorthStar Income, entered into two securitization financing transactions in 2012 and 2013 that provide permanent, non-recourse, non-mark-to-market financing for a portion of our CRE debt investments. We expect to execute similar transactions to finance our newly-originated debt investments that might initially be financed on our credit facilities.
Securitization 2012-1
In November 2012, we closed Securitization 2012-1, a $351 million securitization financing transaction which provides permanent, non-recourse, non-mark-to-market financing and is collateralized by CRE debt investments originated by us and on behalf of NorthStar Income. A total of $228 million of investment grade bonds were issued, $98 million of which was used to finance the assets we contributed, representing an advance rate of 65% and a weighted average coupon of LIBOR plus 1.63%. We used the proceeds to repay $95 million of borrowings on our loan facilities.
Securitization 2013-1
In August 2013, we bifurcated three first mortgage loans with an aggregate principal amount of $142 million into senior loans of $79 million and subordinate interests of $63 million to facilitate the financing of the senior loans in Securitization 2013-1, a securitization financing transaction entered into by NorthStar Income. We transferred the senior loans at cost to Securitization 2013-1. We did not retain any interest in such senior loans and retained the subordinate interests on an unleveraged basis.
Corporate Credit Facilities
Corporate Revolving Credit Facility
In August 2014, we entered into a corporate revolving credit facility with certain commercial bank lenders, with a total commitment amount of $500 million for a three year term. As of February 24, 2015, $305 million of financing remains undrawn under our revolving credit facility.
Corporate Term Facility
In September 2014, we entered into a corporate term facility with respect to the establishment of term borrowings with an aggregate principal amount of up to $500 million. As of February 24, 2015, $75 million of financing remains undrawn under our corporate term facility, subject to entering into additional term loans under such facility.
Loan Facilities
With respect to investment-level financing, we maintain two separate loan facilities that provide up to an aggregate of $240 million to finance the origination of first mortgage loans and senior loan participations secured by commercial real estate. The interest rate and advance rate depend on asset type and characteristic. Maturity dates for these facilities range from March 2015 to July 2015 and both have extensions available at our option, subject to the satisfaction of certain customary conditions, with maturity dates extending through July 2018.
Our loan facilities contain representations, warranties, covenants, conditions precedent to funding, events of default and indemnities that are customary for agreements of this type. We are currently in compliance with all of our financial covenants under our loan facilities.
Senior Notes and Exchangeable Senior Notes
In March 2014, $172.5 million principal amount of the 7.50% Notes were exchanged for $481 million principal amount of senior notes due September 30, 2014, or the Senior Notes. On September 30, 2014, we repaid the Senior Notes in cash, including interest, in the amount of $488 million.
For the year ended December 31, 2014, holders exchanged $316 million principal amount of our 5.375% Exchangeable Senior Notes and $12 million principal amount of our 8.875% Exchangeable Senior Notes for an aggregate 23.8 million shares of our common stock.
Cash Flows
The following presents a summary of our consolidated statements of cash flows for the years ended December 31, 2014, 2013 and 2012 (dollars in thousands):
|
| | | | | | | | | | | | |
| | | Years Ended December 31, |
| Cash flow provided by (used in): | | 2014 | | 2013 | | 2012 |
| Operating activities | | $ | 144,856 |
| | $ | 240,674 |
| | $ | 76,911 |
|
| Investing activities | | (7,054,227 | ) | | (2,285,153 | ) | | 51,901 |
|
| Financing activities | | 6,572,518 |
| | 2,235,542 |
| | 171,607 |
|
| Effect of foreign currency translation on cash and cash equivalents | | (2,173 | ) | | — |
| | — |
|
| Net increase (decrease) in cash and cash equivalents | | $ | (339,026 | ) | | $ | 191,063 |
| | $ | 300,419 |
|
Year Ended December 31, 2014 Compared to December 31, 2013
Net cash provided by operating activities was $145 million for the year ended December 31, 2014 compared to $241 million for the year ended December 31, 2013. The decrease was primarily due to an increase in transaction costs incurred related to new real estate acquisitions.
Net cash used in investing activities was $7.1 billion for the year ended December 31, 2014 compared to $2.3 billion for the year ended December 31, 2013. The increase in net cash used was primarily due to an increase of $4.8 billion of new acquisitions of operating real estate.
Net cash provided by financing activities was $6.6 billion for the year ended December 31, 2014 compared to $2.2 billion for the year ended December 31, 2013. The primary cash inflows for the year ended December 31, 2014 was $1.4 billion of net new capital, $6.2 billion of net new borrowings and $227 million of net contributions from non-controlling interests, offset by $438 million for the payment of dividends, $119 million distributed to NSAM in connection with the spin-off, $481 million for the repayment of Senior Notes and $80 million for net repurchase/repayment of CDO bonds. The primary cash inflows for the year ended December 31, 2013 was $1.8 billion of net new capital and $1.2 billion of net new borrowings, offset by $542 million for net repurchase/repayment of CDO bonds, $10 million for net swap activities and $227 million for the payment of dividends.
Year Ended December 31, 2013 Compared to December 31, 2012
Net cash provided by operating activities was $241 million for the year ended December 31, 2013 compared to $77 million for the year ended December 31, 2012. The increase was primarily due to increased investment activity in 2013.
Net cash used in investing activities was $2.3 billion for the year ended December 31, 2013 compared to net cash provided by investing activities of $52 million for the year ended December 31, 2012. Net cash used in 2013 was due to increased investment activity in 2013.
Net cash provided by financing activities was $2.2 billion for the year ended December 31, 2013 compared to $172 million for the year ended December 31, 2012. The primary cash inflows for the year ended December 31, 2013 was $1.8 billion of net new capital and $1.2 billion of net new borrowings, offset by $542 million for net repurchase/repayment of CDO bonds, $10 million for net swap activities and $227 million for the payment of dividends (common and preferred). The primary cash inflows for the year ended December 31, 2012 was $724 million of net new capital, $229 million of net new borrowings, $98 million from the issuance of our securitization financing transaction and $26 million from the return of the surety bond related to the WaMu litigation, offset by $734 million for net repurchase/repayment of CDO bonds, $20 million for net swap activities, $106 million for the payment of dividends (common and preferred), $13 million for distributions to non-controlling interests and $11 million of deferred financing costs.
Contractual Obligations and Commitments
The following table presents contractual obligations and commitments as of December 31, 2014 (dollars in thousands):
|
| | | | | | | | | | | | | | | | | | | | |
| | | Payments Due by Period |
| | | Total | | Less than 1 year | | 1-3 years | | 3-5 years | | More than 5 years |
| Mortgage and other notes payable | | $ | 8,531,285 |
| | $ | 116,376 |
| | $ | 463,338 |
| | $ | 3,104,141 |
| | $ | 4,847,430 |
|
| CDO bonds payable | | 560,959 |
| | — |
| | — |
| | — |
| | 560,959 |
|
| Securitization bonds payable | | 41,831 |
| | — |
| | — |
| | — |
| | 41,831 |
|
| Credit facilities | | 732,780 |
| | — |
| | 640,000 |
| | 92,780 |
| | — |
|
Exchangeable senior notes(1) | | 45,588 |
| | — |
| | — |
| | 12,955 |
| | 32,633 |
|
| Junior subordinated notes | | 280,117 |
| | — |
| | — |
| | — |
| | 280,117 |
|
Operating leases(2) | | 113,646 |
| | 4,739 |
| | 9,546 |
| | 9,753 |
| | 89,608 |
|
Outstanding unfunded commitments(3) | | 135,347 |
| | 21,911 |
| | 113,436 |
| | — |
| | — |
|
PE Investments(4) | | 56,759 |
| | 17,000 |
| | 39,759 |
| | — |
| | — |
|
Estimated interest payments(5) | | 1,984,426 |
| | 378,046 |
| | 708,489 |
| | 606,418 |
| | 291,473 |
|
| Total | | $ | 12,482,738 |
| | $ | 538,072 |
| | $ | 1,974,568 |
| | $ | 3,826,047 |
| | $ | 6,144,051 |
|
_____________________
| |
| (1) | The 7.25% Notes, 8.875% Notes and 5.375% Notes have a final maturity date of June 15, 2027, June 15, 2032 and June 15, 2033, respectively. The above table reflects the holders’ repurchase rights which may require us to repurchase the 7.25% Notes, 8.875% Notes and 5.375% Notes on June 15, 2017, June 15, 2019 and June 15, 2023, respectively. Each of these Notes may be exchanged at any time prior to maturity at the option of the respective holder in accordance with the terms of the applicable indenture. In 2015, through February 24, 2015, we exchanged an aggregate $6 million principal amount of exchangeable senior notes and settled all such exchanges in shares of our common stock. |
| |
| (2) | Represents ground leases on certain operating real estate. |
| |
| (3) | Our future funding commitments, which are subject to certain conditions that borrowers must meet to qualify for such fundings. Fundings are categorized by estimated funding period. Assuming that all debt and real estate investments that have future fundings meet the terms to qualify for such funding, represents our equity requirement on the remaining future funding requirements. |
| |
| (4) | Includes an estimated $17 million associated with future fundings. |
| |
| (5) | Estimated interest payments are based on the weighted average life of the borrowings. Applicable LIBOR benchmark plus the respective spread as of December 31, 2014 was used to estimate payments for our floating-rate liabilities. |
The table above does not include the amounts payable to NSAM under the management agreement. The annualized fee payable to NSAM is approximately $166 million as of December 31, 2014. In addition, the table above does not include: (i) the revolving credit agreement with NSAM pursuant to which we make available to NSAM, on an “as available basis,” up to $250 million of financing; and (ii) our commitment to purchase shares of NSAM’s Sponsored Companies’ common stock. Refer to “Related Party Arrangements” for a further discussion.
Off-Balance Sheet Arrangements
As of December 31, 2014, we had off-balance sheet arrangements with respect to retained interests in certain deconsolidated N-Star CDOs. Refer to Note 3. “Variable Interest Entities” in Item 8. “Financial Statements and Supplementary Data” for a discussion of such retained interests in such N-Star CDOs in our consolidated financial statements. In each case, our exposure to loss is limited to the carrying value of our investment.
Additionally, we have certain arrangements which do not meet the definition of off-balance sheet arrangements, but do have some of the characteristics of off-balance sheet arrangements. We have made investments in unconsolidated ventures. Refer to Note 6. “Investments in Private Equity Funds” and Note 7. “Investments in Unconsolidated Ventures” in Item 8. “Financial Statements and Supplementary Data” for a discussion of such unconsolidated ventures in our consolidated financial statements. In each case, our exposure to loss is limited to the carrying value of our investment.
Related Party Arrangements
NorthStar Asset Management Group
Management Agreement
Upon completion of the spin-off of our asset management business, we entered into a management agreement with an affiliate of NSAM for an initial term of 20 years, which will be automatically renewed for additional 20-year terms each anniversary thereafter unless earlier terminated. As asset manager, NSAM is responsible for our day-to-day operations, subject to the supervision of our board of directors. Through its global network of subsidiaries and branch offices, NSAM will perform services and activities relating to, among other things, investments and financing, portfolio management and other administrative services, such as accounting and investor relations, to us and our subsidiaries other than our CRE loan origination business. The management agreement with NSAM provides for a base management and incentive fee.
For the six months ended December 31, 2014, we incurred $79 million related to the base management fee. The management contract with NSAM commenced on July 1, 2014, and as such, there were no management fees incurred for the six months ended June 30, 2014. The base management fee to NSAM will increase subsequent to December 31, 2014 by an amount equal to 1.5% per annum of the sum of:
| |
| • | cumulative net proceeds of all future common equity and preferred equity issued by us; |
| |
| • | equity issued by us in exchange or conversion of exchangeable senior notes based on the stock price at the date of issuance; |
| |
| • | any other issuances by us of common equity, preferred equity or other forms of equity, including but not limited to limited partnership interests in an operating partnership (excluding equity-based compensation, but including issuances related to an acquisition, investment, joint venture or partnership); and |
| |
| • | our cumulative CAD in excess of cumulative distributions paid on our common stock, LTIP units or other equity awards beginning the first full calendar quarter after the spin-off. |
Additionally, our equity interest in RXR Realty and Aerium is structured so that NSAM is entitled to the portion of distributable cash flow from each investment in excess of the $10 million minimum annual base amount.
For the six months ended December 31, 2014, we incurred $3 million related to the incentive management fee. The incentive management fee is calculated and payable quarterly in arrears in cash, equal to:
| |
| • | the product of: (a) 15% and (b) our CAD before such incentive fee, divided by the weighted average shares outstanding for the calendar quarter, when such amount is in excess of $0.39 per share but less than $0.45 per share; plus |
| |
| • | the product of: (a) 25% and (b) our CAD before such incentive fee, divided by the weighted average shares outstanding for the calendar quarter, when such amount is equal to or in excess of $0.45 per share; |
| |
| • | multiplied by our weighted average shares outstanding for the calendar quarter. |
In addition, NSAM may also earn an incentive fee from our healthcare investments in connection with NSAM’s Healthcare Strategic Partnership (refer to below).
Weighted average shares represents the number of shares of our common stock, LTIP units or other equity-based awards (with some exclusions), outstanding on a daily weighted average basis. With respect to the base management fee, all equity issuances are allocated on a daily weighted average basis during the fiscal quarter of issuances.
Furthermore, if we were to spin-off any asset or business in the future, including our Proposed European Spin, such entity would be managed by NSAM on terms substantially similar to those set forth in the management agreement between us and NSAM. The management agreement further provides that the aggregate base management fee in place immediately after any future spin-off will not be less than our aggregate base management fee in place immediately prior to such spin-off.
Payment of Costs and Expenses and Expense Allocation
We are responsible for all of our direct costs and expenses and will reimburse NSAM for costs and expenses incurred by NSAM on our behalf. In addition to our costs and expenses, following the Distribution, we are obligated to reimburse NSAM for additional costs and expenses incurred by NSAM for an amount not to exceed the following: (i) 20% of the combined total of: (a) our general and administrative expenses as reported in its consolidated financial statements excluding: (1) equity-based compensation expense, (2) non-recurring items, (3) fees payable to NSAM under the terms of the management agreement and (4) any allocation of expenses from us, or NorthStar Realty G&A; and (b) NSAM’s general and administrative expenses as reported in its consolidated financial statements, excluding equity-based compensation expense and adding back any costs or expenses allocated to any managed company of NSAM, less (ii) the NorthStar Realty G&A. For the six months ended December 31, 2014, NSAM allocated $5 million to us. In addition, we will also pay directly or reimburse NSAM for an allocable portion of any severance paid pursuant to any employment, consulting or similar service agreements in effect between NSAM and any of its executives, employees or other services providers.
Investment Opportunities
Under the management agreement, we agreed to make available to NSAM for the benefit of NSAM and its managed companies, including us, all investment opportunities that we source. NSAM agreed to fairly allocate such opportunities among NSAM’s managed companies, including us, and NSAM in accordance with an investment allocation policy. Pursuant to the management agreement, we will be entitled to fair and reasonable compensation for our services in connection with any loan origination opportunities sourced by us, which may include first mortgage loans, subordinate mortgage interests, mezzanine loans and preferred equity interests, in each case relating to commercial real estate.
NSAM provides services with regard to such areas as payroll, human resources and employee benefits, financial systems management, treasury and cash management, accounts payable services, telecommunications services, information technology services, property management services, legal and accounting services and various other corporate services to us as it relates to our loan origination business for CRE debt.
Credit Agreement
In connection with the Distribution, we entered into a revolving credit agreement with NSAM pursuant to which we make available to NSAM, on an “as available basis,” up to $250 million of financing for a five year term at LIBOR plus 3.50%. The revolving credit facility is unsecured. NSAM expects to use the proceeds for general corporate purposes, including potential future acquisitions. In addition, NSAM may use the proceeds to acquire assets on behalf of its managed companies, including us, that it intends to allocate to such managed company but for which such managed company may not then have immediately available funds. The terms of the revolving credit facility contain various representations, warranties, covenants and conditions, including the condition that our obligation to advance proceeds to NSAM is dependent upon us and its affiliates having at least $100 million of either unrestricted cash and cash equivalents or amounts available under committed lines of credit, after taking into account the amount NSAM seeks to draw under the facility. As of December 31, 2014, we have not funded any amounts to NSAM in connection with this agreement.
Healthcare Strategic Joint Venture
In January 2014, NSAM entered into a long-term strategic partnership with James F. Flaherty III, former Chief Executive Officer of HCP, Inc., focused on expanding our healthcare business into a preeminent healthcare platform, or the Healthcare Strategic Partnership. In connection with the partnership, Mr. Flaherty oversees and seeks to grow both our healthcare real estate portfolio and the portfolio of NorthStar Healthcare. In connection with entering into the partnership, we granted Mr. Flaherty certain RSUs (refer to Note 12. “Equity-Based Compensation” in Item 8. “Financial Statements and Supplementary Data”). The Healthcare Strategic Partnership is entitled to incentive fees ranging from 20% to 25% above certain hurdles for new and existing healthcare real estate investments held by us. For the year ended December 31, 2014, we have not incurred any incentive fees related to the Healthcare Strategic Partnership.
NSAM Sponsored Companies
Prior to the spin-off of our asset management business, we had agreements with each of the NSAM Sponsored Companies to manage their day-to-day operations, including identifying, originating and acquiring investments on their behalf and earning fees for our services. For the six months ended June 30, 2014, we earned $22 million of fees related to these agreements, which are recorded in discontinued operations in the consolidated statements of operations. In addition, we were entitled to certain expense allocation for costs paid on behalf of the NSAM Sponsored Companies. For the six months ended June 30, 2014, we received $14 million of reimbursement from the NSAM Sponsored Companies.
We committed to purchase up to $10 million in shares of each of NSAM’s Sponsored Companies’ common stock during the two year period from when each offering was declared effective through the end of their respective offering period, in the event
that NSAM Sponsored Companies’ distributions to its stockholders, on a quarterly basis, exceeds its modified funds from operations (as defined in accordance with the current practice guidelines issued by the Investment Program Association).
We acquired an aggregate of $12 million of shares of NorthStar Income, NorthStar Healthcare and NorthStar Income II through December 31, 2014. In addition, pursuant to the management agreement with NSAM, we committed up to $10 million to invest as distribution support consistent with past practice in each future public non-traded NSAM Sponsored Company, up to a total of five new companies per year. We have committed to invest as distribution support in the following future NSAM Sponsored Companies:
| |
| • | NorthStar/RXR New York Metro - On February 9, 2015, NorthStar/RXR New York Metro Income, Inc.’s, or NorthStar/RXR New York Metro, registration statement on Form S-11, seeking to raise up to $2 billion in a public offering of common stock, was declared effective by the SEC. NorthStar/RXR New York Metro expects to begin raising capital in the third quarter 2015. |
| |
| • | NorthStar Corporate - On December 2, 2014, NorthStar Corporate Income, Inc. confidentially submitted its registration statement on Form N-2 to the SEC seeking to raise up to $1 billion in a public offering of common stock. |
In January 2014, we sold a $9.0 million pari passu participation in a first mortgage loan at cost originated by us to NorthStar Income II. Additionally, in April 2014, we sold a $5 million pari passu participation in a first mortgage loan at cost to NorthStar Income II. Such sales were approved by the independent board of directors of NorthStar Income II.
NorthStar Securities
Prior to the spin-off of our asset management business, we earned selling commissions and dealer manager fees for selling equity in the NSAM Sponsored Companies through NorthStar Securities and paid commission expense to participating broker-dealers with whom NorthStar Securities has selling agreements and commissions to employees of NorthStar Securities. For the six months ended June 30, 2014, commission expense was $32 million, of which $4 million related to employees of NorthStar Securities. These amounts are recorded in discontinued operations in the consolidated statements of operations.
N-Star CDOs
We earn certain collateral management fees from the N-Star CDOs primarily for administrative services. For the year ended December 31, 2014, we earned $6 million in fee income, of which $3 million was eliminated in consolidation. Prior to the third quarter 2013, all amounts were eliminated in consolidation as all of the N-Star CDOs were consolidated by us.
Additionally, we earn interest income from the N-Star CDO bonds and N-Star CDO equity in deconsolidated N-Star CDOs. For the year ended December 31, 2014, we earned $72 million of interest income from such investments in deconsolidated N-Star CDOs.
American Healthcare Investors
In December 2014, NSAM acquired an approximate 44% interest in American Healthcare Investors LLC, or AHI, and James F. Flaherty III, a strategic partner of NSAM acquired a 9% interest in AHI. AHI is a healthcare-focused real estate investment management firm that co-sponsored and advised Griffin-American, until Griffin-American was acquired by us and NorthStar Healthcare. In connection with this acquisition, AHI will provide certain management and related services including property management, to NSAM and us to assist NSAM in managing the current and future healthcare assets (excluding any joint venture assets) acquired by us and, subject to certain conditions, other NSAM managed companies.
Island Hospitality Management
In January 2015, NSAM acquired an approximate 45% interest in Island Hospitality Management Inc., or Island. Island is a leading, independent select service hotel management company that manages 143 hotel properties, representing $4 billion, of which 101 hotel properties are owned by us.
Legacy Commercial
In September 2014, we entered into a debt and equity investment with Legacy Commercial, comprised of a 40% interest in entities affiliated with Legacy Commercial and loans to certain Legacy Commercial entities totaling $30 million. C. Preston Butcher, a former director of ours, held certain preferred and other significant interests in Legacy Commercial and was the chairman of the board of directors and chief executive officer of Legacy Commercial. $15 million of the proceeds from the Legacy Investment will be used by the Legacy Commercial Entities for future investments, subject to certain approval rights held by us and $15 million of the proceeds of the Legacy Investment was used by the Legacy Commercial Entities to redeem the majority of the interests held by Mr. Butcher and a family limited partnership controlled by Mr. Butcher in the Legacy Commercial Entities. The Legacy Investment was made on a pari passu basis with the investment held by the two remaining
partners in Legacy Commercial, Mr. Butcher and certain employees of Legacy Commercial. We own 75% of the senior debt and preferred equity and 40% of the common equity issued by the applicable Legacy Commercial Entities. Mr. Butcher and a family limited partnership controlled by Mr. Butcher received total consideration of $30 million, of which $15 million was in the form of a cash distribution from the Legacy Commercial Entities and $15 million was funded from the Legacy Investment. At closing, Mr. Butcher retained a 15% indirect interest in the senior debt and 15% indirect interest in the preferred equity issued by the applicable Legacy Commercial Entities. In addition, a family limited partnership controlled by Mr. Butcher indirectly owns 10% of the common equity issued by the applicable Legacy Commercial Entities. The transaction also includes up to an additional $10 million in future preferred loans from us for additional real estate investments, subject to our approval. In connection with this transaction, Mr. Butcher stepped down as chairman and chief executive officer of Legacy Commercial and retains no ongoing voting or decision making rights. Subject to certain approval rights held by us, Mr. Butcher has been hired as an employee of a Legacy Commercial Entity and Legacy Commercial is now controlled by the two remaining principals. Mr. Butcher retained his ownership interests in Legacy Partners Residential, Inc. and certain other related entities and companies that are not owned by Legacy Commercial or any Legacy Commercial Entity in which we are making investments.
PE Investments
We guaranteed all of our funding obligations that may be due and owed under the respective agreement of the respective PE Investments directly to the PE Investment entities. We and NorthStar Income each agreed to indemnify the other proportionately for any losses that may arise in connection with the funding and other obligations as set forth in the governing documents in the case of a joint default by us and NorthStar Income. We and NorthStar Income further agreed to indemnify each other for all of the losses that may arise as a result of a default that was solely caused by us or NorthStar Income, as the case may be.
PE Investment I
In connection with PE Investment I, we assigned our rights to subscribe to 29.5% of our interest in PE Investment I to a subsidiary of NorthStar Income.
West Point Partners
In June 2014, we paid $0.8 million to West Point Partners in connection with its services facilitating the acquisition of a hotel portfolio we acquired for an aggregate purchase price of approximately $1.1 billion, including all costs, reserves and escrows. West Point Partners is a real estate investment and advisory firm based in New York. Sridhar Sambamurthy, who was a member of our board of directors at the time of such payment, is managing principal and co-founder of West Point Partners and owns a 50% interest in that company and consequently ceased to be independent at that time. Mr. Sambamurthy is no longer a member of our board of directors.
Recent Developments
Dividends
On February 25, 2015, we declared a dividend of $0.40 per share of common stock. The common stock dividend will be paid on March 13, 2015 to stockholders of record as of the close of business on March 9, 2015. On January 30, 2015, we declared a dividend of $0.54688 per share of Series A preferred stock, $0.51563 per share of Series B preferred stock, $0.55469 per share of Series C preferred stock, $0.53125 per share of Series D Preferred Stock and $0.54688 per share of Series E Preferred Stock. Dividends were paid on all series of preferred stock on February 17, 2015 to stockholders of record as of the close of business on February 9, 2015.
SEB Portfolio
In December 2014, we entered into a definitive agreement to acquire an approximate €1.1 billion ($1.3 billion) European office portfolio, the SEB Portfolio, comprised of 11 Class A office properties located across gateway cities in seven of Europe’s top markets. The SEB Portfolio consists of approximately 186,000 square meters with a well-diversified mix of market leading tenants. In connection with entering into the agreement to acquire the SEB Portfolio, we deposited in escrow €25.0 million in cash and also provided a €25.0 million corporate guarantee to secure its obligations under the purchase agreement, both of which are non-refundable except in limited circumstances where the acquisition of the SEB Portfolio is not completed due to no fault by us.
Trias Portfolio
In December 2014, we signed a purchase agreement to acquire an approximate €0.5 billion ($0.6 billion) Pan-European office portfolio, or Trias Portfolio, located across eight European countries including United Kingdom, Germany, France, Belgium,
Netherlands, Spain, Portugal and Italy. The Trias Portfolio is comprised of 38 properties which includes 30 office properties, five retail properties, two hotels and an industrial property. Approximately 75% of the rent derived from the Trias Portfolio is from properties located in the U.K., Germany and France. The Trias Portfolio consists of approximately 259,000 square meters and is currently approximately 90% leased with a weighted average lease term of approximately four years.
Proposed Spin-off of European Real Estate Business
On February 26, 2015, we announced that our board of directors unanimously approved the Proposed European Spin. Currently, we acquired or committed to acquire $2 billion of European real estate comprised of 50 properties spanning across some of Europe’s top markets that will be contributed to NRE upon the completion of the Proposed European Spin. NSAM will manage NRE pursuant to a long-term management agreement, on substantially similar terms as our management agreement with NSAM. The Proposed European Spin is expected to be completed in the second half of 2015.
Inflation
Virtually all of our assets and liabilities are interest rate sensitive in nature. As a result, interest rates and other factors influence our performance significantly more than inflation does. Changes in interest rates may correlate with inflation rates. Substantially all of the leases at our manufactured housing communities and multifamily properties allow for monthly or annual rent increases which provide us with the opportunity to achieve increases, where justified by the market, as each lease matures. Such types of leases generally minimize the risks of inflation on our manufactured housing communities and multifamily properties.
Refer to Item 7A. “Quantitative and Qualitative Disclosures About Market Risk” for additional details.
Non-GAAP Financial Measure
Cash Available for Distribution
We believe that CAD provides investors and management with a meaningful indicator of operating performance. Management also uses CAD, among other measures, to evaluate profitability. We also believe that CAD is useful because it adjusts for a variety of cash (such as transaction costs and cash flow related to N-Star CDO equity interests) and non-cash items (such as depreciation and amortization, equity-based compensation, realized gain (loss) on investments, provision for loan losses, asset impairment, bad debt expense and non-cash interest income and expense items). We adjust for transaction costs because these costs are not a meaningful indicator of our recurring operating performance. For instance, these transaction costs represent costs such as professional fees associated with new investments, which are non-recurring expenses related to specific transactions. We also adjust for the cash flow related to N-Star CDO equity interests which represents the net interest generated from the N-Star CDO equity interests. This net interest is a component of our ongoing return on its investment, and therefore, is adjusted in CAD as it provides investors and management with a meaningful indicator of our recurring operating performance. Furthermore, CAD adjusts N-Star CDO bond discounts to record such investments on an effective yield basis over the expected weighted average life of the investment. N-Star CDO bond discounts relates to repurchased CDO bonds of consolidated CDO financing transactions at a discount to par. These CDO bonds typically have a low interest rate and the majority of the return is generated from repurchasing the CDO bonds at a discount to expected recovery value. Because the return generated through the accretion of the discount is a meaningful contributor to our recurring operating performance, such accretion is adjusted in CAD. The computation for the accretion of the discount under U.S. GAAP and CAD is the same. However, for CDO financing transactions that are consolidated under U.S. GAAP, the CDO bonds are not presented as an investment but rather are eliminated in our consolidated financial statements. In addition, we adjust for distributions and adjustments to joint venture partners which represent the net return generated from our investments allocated to our non-controlling interests. For our owned hotels, our CAD calculation is equivalent to earnings before interest taxes depreciation and amortization (EBITDA), the hotel industry standard metric, which does not make an adjustment for furniture, fixtures and equipment (FF&E) reserves. CAD may fluctuate from period to period based upon a variety of factors, including, but not limited to, the timing and amount of investments, repayments and asset sales, capital raised, use of leverage, changes in the expected yield of investments and the overall conditions in commercial real estate and the economy generally. Management also believes that quarterly distributions are principally based on operating performance and our board of directors includes CAD as one of several metrics it reviews to determine quarterly distributions to stockholders.
We calculate CAD by subtracting from or adding to net income (loss) attributable to common stockholders, non-controlling interests and the following items: depreciation and amortization items including depreciation and amortization, straight-line rental income or expense, amortization of above/below market leases, amortization of deferred financing costs, amortization of discount on financings and other and equity-based compensation; cash flow related to N-Star CDO equity interests; accretion of consolidated N-Star CDO bond discounts; non-cash net interest income in consolidated N-Star CDOs; unrealized gain (loss) from the change in fair value; realized gain (loss) on investments and other, excluding accelerated amortization related to sales
of CDO bonds or other investments; provision for loan losses, net; impairment on depreciable property; bad debt expense; deferred tax benefit (expense); acquisition gains or losses; distributions and adjustments related to joint venture partners; transaction costs; foreign currency gains (losses); impairment on goodwill and other intangible assets; gains (losses) on sales; and one-time events pursuant to changes in U.S. GAAP and certain other non-recurring items. For example, CAD has been adjusted to exclude non-recurring gain (loss) from deconsolidation of certain N-Star CDOs. These items, if applicable, include any adjustments for unconsolidated ventures.
CAD should not be considered as an alternative to net income (loss), determined in accordance with U.S. GAAP, as an indicator of operating performance. In addition, our methodology for calculating CAD may differ from the methodologies used by other comparable companies, including other REITs, when calculating the same or similar supplemental financial measures and may not be comparable with these companies.
The following table presents a reconciliation of CAD to net income (loss) attributable to common stockholders for the three months and year ended December 31, 2014 (dollars in thousands):
|
| | | | | | | | |
| | December 31, 2014 | |
| | Three Months Ended | | Year Ended(1) | |
| Net income (loss) attributable to common stockholders | $ | (116,453 | ) | | $ | (371,507 | ) | |
| Non-controlling interests | (15,487 | ) | | (22,879 | ) | (2) |
| (Gain) loss from deconsolidation of N-Star CDOs | — |
| | 31,423 |
| |
| Subtotal | (131,940 | ) | | (362,963 | ) | |
| | | | | |
| Adjustments: | | | | |
| Depreciation and amortization items | 82,886 |
| (3) | 244,400 |
| (4) |
N-Star CDO bond discounts(5) | 1,567 |
| | 9,706 |
| |
| Non-cash net interest income in consolidated N-Star CDOs | (4,255 | ) | | (31,001 | ) | |
| Unrealized (gain) loss from fair value adjustments / Provision for loan losses, net | 15,496 |
| | 218,584 |
| |
Realized (gain) loss on investments(6) | 24,100 |
| | 96,939 |
| |
| Distributions / adjustments to joint venture partners | (8,846 | ) | | (10,963 | ) | |
Transaction costs and other(7) | 131,292 |
| | 227,034 |
| |
| CAD | $ | 110,300 |
| | $ | 391,736 |
| |
____________________________________________________________
| |
| (1) | The consolidated financial statements for the year ended December 31, 2014 include: (i) our results of operations for the six months ended December 31, 2014 which represents our results of operations following the spin-off of our historical asset management business on June 30, 2014; and (ii) our results of operations for the six months ended June 30, 2014 which represents a carve-out of revenues and expenses attributable to NSAM in discontinued operations. |
| |
| (2) | Includes non-controlling interests attributable to the Operating Partnership of $5.3 million for the six months ended June 30, 2014. |
| |
| (3) | The three months ended December 31, 2014 includes depreciation and amortization of $73.2 million (including $0.5 million related to unconsolidated ventures), straight-line rental income of $(5.2) million, amortization of above/below market leases of $2.3 million, amortization of deferred financing costs of $7.5 million, amortization of discount on financings and other of $0.5 million and amortization of equity-based compensation of $4.6 million. |
| |
| (4) | The year ended December 31, 2014 includes depreciation and amortization of $187.1 million (including $1.9 million related to unconsolidated ventures), straight-line rental income of $(9.1) million, amortization of above/below market leases of $1.1 million, amortization of deferred financing costs of $18.5 million, amortization of discount on financings and other of $8.2 million and amortization of equity-based compensation of $38.6 million. |
| |
| (5) | For CAD, realized discounts on CDO bonds are accreted on an effective yield basis based on expected maturity. For CDOs that were deconsolidated, CDO bond accretion is included in net income attributable to common stockholders from the date of deconsolidation. |
| |
| (6) | The three months ended December 31, 2014 includes $(13.9) million of non-cash losses generated from the repurchase of bonds of a consolidated N-Star CDO for which we elected the fair value option. CDO bonds of consolidated N-Star CDOs are liabilities carried at fair value on our balance sheet and these non-cash losses reflect the repurchase price of the CDO bond compared to the carrying value of the CDO bond as of December 31, 2013. The year ended December 31, 2014 includes $(65.8) million of non-cash loss from extinguishment and exchange of debt. |
| |
| (7) | The three months ended December 31, 2014 includes $119.9 million of transaction costs primarily related to the $4 billion acquisition of Griffin-American and a $1.1 billion hotel acquisition. The three months ended December 31, 2014 also includes $9.6 million of cash flow related to N-Star CDO equity interests and $1.8 million of bad debt expense. The year ended December 31, 2014 includes $204.1 million of transaction costs, $21.1 million of cash flow related to N-Star CDO equity interests and $1.8 million of bad debt expense. |
Item 7A. Quantitative and Qualitative Disclosures About Market Risk
We are primarily subject to interest rate risk and credit risk. These risks are dependent on various factors beyond our control, including monetary and fiscal policies, domestic and international economic conditions and political considerations. Our market risk sensitive assets, liabilities and related derivative positions are held for investment and not for trading purposes.
Interest Rate Risk
Changes in interest rates affect our net interest income, which is the difference between the income earned on our investments and the interest expense incurred in connection with our borrowings and derivatives.
Our CRE debt and securities investments bear interest at either a floating or fixed rate. The interest rate on our floating-rate assets is a fixed spread over an index such as LIBOR and typically reprices every 30 days based on LIBOR in effect at the time. Given the frequent and periodic repricing of our floating-rate assets, changes in benchmark interest rates are unlikely to materially affect the value of our floating-rate portfolio. Changes in short-term rates will, however, affect income from these investments. However, some of our non-legacy CRE debt originations have LIBOR floors that are in excess of current LIBOR. We will not benefit from an increase in LIBOR until it is in excess of the floors.
Our general financing strategy has focused on the use of “match-funded” structures. This means that we seek to align the maturities of our liabilities with the maturities on our assets as closely as possible in order to manage the risks of being forced to refinance our liabilities prior to the maturities of our assets. Substantially all of our investments are financed with either non-recourse securitization financing transactions or non-recourse mortgage notes. In addition, we seek to match the interest rate on our assets with like-kind borrowings, so fixed-rate investments are financed with fixed-rate borrowings and floating-rate assets are financed with floating-rate borrowings, directly or indirectly, through the use of interest rate swaps, caps and other financial instruments or through a combination of these strategies. For longer duration, stable investment real estate cash flows such as those derived from net lease assets, we tend to use fixed rate financing. For real estate cash flows with greater growth potential such as hotels and healthcare under a RIDEA structure, we tend to use floating rate financing which provides prepayment flexibility and may provide a better match between underlying cash flow and potential increases in interest rates. As of December 31, 2014, a hypothetical 100 basis point increase in one-month LIBOR applied to our floating-rate assets and liabilities (including derivatives) would result in a decrease in net interest income of approximately $36 million annually, of which $26 million of the change is attributable to floating rate financing of hotel and healthcare operating real estate and does not reflect the potential increase in rental cash flow associated with economic growth that may be typical in a rising interest rate environment.
A change in interest rates could affect the value of our fixed-rate CRE debt and securities investments and our real estate investments. For example, increasing interest rates could result in a higher required yield on investments, which could decrease the value on existing fixed-rate investments in order to adjust their yields to current market levels. In addition, the value of our real estate properties may be influenced by changes in interest rates and credit spreads (as discussed below) because value is typically derived by discounting expected future cash flow generated by the property using interest rates (such as the 10-year U.S. Treasury Note yield) plus a risk premium based on the property type and creditworthiness of the tenants/operators. A lower risk-free rate generally results in a lower discount rate and, therefore, a higher valuation, and vice versa; however, an increase in the risk-free rate would not impact our net interest income.
A change in the interest rate and credit spread may also impact our net book value as CRE securities are marked-to-market each quarter with any change in fair value reflected in unrealized gains (losses) or OCI. Generally, as interest rates increase, the value of fixed-rate securities within our CDO financing transaction, such as CMBS, decreases and as interest rates decrease, the value of these securities will increase. A change in unrealized gains (losses) do not directly affect our operating cash flow or our ability to pay a dividend to stockholders.
We use derivative instruments primarily to manage interest rate exposure. These derivatives are typically in the form of interest rate swap agreements and the primary objective is to minimize interest rate risks associated with our investments and financing activities. The counterparties of these arrangements are major financial institutions with which we may also have other financial relationships. We are exposed to credit risk in the event of non-performance by these counterparties and we monitor their financial condition. As of December 31, 2014, our counterparties do not hold any cash margin as collateral against our swap contracts. As of December 31, 2014, none of our derivatives qualify for hedge accounting treatment, therefore, gains (losses) resulting from their fair value measurement at the end of each reporting period are recognized as an increase or decrease in unrealized gain (loss) on investments and other in our consolidated statements of operations. In addition, we are, and may in the future be, subject to additional expense based on the notional amount of the derivative and a specified spread over the applicable LIBOR. Because the fair value of these instruments can vary significantly between periods, we may experience significant fluctuations in the amount of our unrealized gain (loss) in any given period.
Credit Spread Risk
The value of our fixed and floating-rate investments also changes with market credit spreads. This means that when market-demanded risk premium, or credit spread, increases, the value of our fixed- and floating-rate assets decrease and vice versa. Fixed-rate assets are valued based on a market credit spread over the rate payable on fixed rate U.S. Treasury of like maturity. This means that their value is dependent on the yield demanded on such assets by the market, based on their credit relative to U.S. Treasuries. The floating-rate CRE debt and securities investments are valued based on a market credit spread over the applicable LIBOR. Demand for a higher yield on investments results in higher or “wider” spread over the benchmark rate (usually the applicable U.S. Treasury yield) to value these assets. Under these conditions, the value of our portfolio should decrease. Conversely, if the spread used to value these assets were to decrease or “tighten,” the value of these assets should increase.
Credit Risk
Credit risk in our CRE debt and securities investments relates to each individual borrower’s ability to make required interest and principal payments on scheduled due dates. We seek to manage credit risk through a comprehensive credit analysis prior to making an investment, actively monitoring our portfolio and the underlying credit quality, including subordination and diversification of our portfolio. Our analysis is based on a broad range of real estate, financial, economic and borrower-related factors which we believe are critical to the evaluation of credit risk inherent in a transaction.
Most of our CMBS investments are generally junior in right of payment of interest and principal to one or more senior classes but benefit from the support of one or more subordinate classes of securities or other form of credit support within a securitization transaction. Our CRE debt investments are collateral dependent, meaning the principal source of repayment is from a sale or refinancing of the collateral securing our debt. In the event that a borrower cannot repay our debt, we may exercise our remedies under the debt agreements, which may include taking title to collateral. We describe many of the options available to us in this situation in the “Portfolio Management” section of this Annual Report on Form 10-K. To the extent the value of our collateral exceeds the amount of our debt (including all debt senior to us) and the expense we incur in collecting the debt, we would collect 100% of our debt amount. To the extent the amount of our debt investment plus all senior debt to our position exceeds the realizable value to our collateral (net of expenses), then we would incur a loss.
We are subject to the credit risk of the tenant/operators of our properties. We seek to undertake a rigorous credit evaluation of each tenant and healthcare operator prior to acquiring properties. This analysis includes an extensive due diligence investigation of the tenant/operator’s business as well as an assessment of the strategic importance of the underlying real estate to the tenant/operator’s core business operations. Where appropriate, we may seek to augment the tenant/operator’s commitment to the facility by structuring various credit enhancement mechanisms into the underlying leases. These mechanisms could include security deposit requirements or guarantees from entities we deem creditworthy. In addition, we actively monitor lease coverage at each facility within our healthcare portfolio. However, as of December 31, 2014, approximately 65% of our tenant/operator revenues are derived from government sources, notably Medicare or Medicaid, excluding the Griffin-American portfolio which was acquired in December 2014. Previously announced and potential future changes to these programs may have a material impact on the valuation and financial performance of this portion of our portfolio.
Foreign Currency Exchange Rate Risk
We are subject to risks related to changes in foreign currency exchange rates as a result of our ownership of, or commitments to acquire, properties in the United Kingdom and Europe and our investments in European joint ventures. As a result, changes in exchange rates may either positively or negatively affect our consolidated revenues and expenses (as expressed in U.S. dollars) from our European real estate business. We may use several strategies to mitigate our exposure to exchange rate risk to hedge our equity and/or net income, including using local currency denominated financing and entering into forward or option foreign currency purchase contracts.
Item 8. Financial Statements and Supplementary Data
The consolidated financial statements of NorthStar Realty Finance Corp. and the notes related to the foregoing consolidated financial statements, together with the independent registered public accounting firm’s reports thereon are included in this Item 8.
Index to Consolidated Financial Statements
Report of Independent Registered Public Accounting Firm
Board of Directors and Stockholders
NorthStar Realty Finance Corp.
We have audited the accompanying consolidated balance sheets of NorthStar Realty Finance Corp. (a Maryland corporation) and subsidiaries (the “Company”) as of December 31, 2014 and 2013, and the related consolidated statements of operations, comprehensive income (loss), equity, and cash flows for each of the three years in the period ended December 31, 2014. Our audits of the basic consolidated financial statements included the financial statement schedules listed in the index appearing under Item 15. These financial statements and financial statement schedules are the responsibility of the Company’s management. Our responsibility is to express an opinion on these financial statements and financial statement schedules based on our audits.
We conducted our audits in accordance with the standards of the Public Company Accounting Oversight Board (United States). Those standards require that we plan and perform the audit to obtain reasonable assurance about whether the financial statements are free of material misstatement. An audit includes examining, on a test basis, evidence supporting the amounts and disclosures in the financial statements. An audit also includes assessing the accounting principles used and significant estimates made by management, as well as evaluating the overall financial statement presentation. We believe that our audits provide a reasonable basis for our opinion.
In our opinion, the consolidated financial statements referred to above present fairly, in all material respects, the financial position of NorthStar Realty Finance Corp. and subsidiaries as of December 31, 2014 and 2013, and the results of their operations and their cash flows for each of the three years in the period ended December 31, 2014 in conformity with accounting principles generally accepted in the United States of America. Also in our opinion, the related financial statement schedules, when considered in relation to the basic consolidated financial statements taken as a whole, presents fairly, in all material respects, the information set forth therein.
We also have audited, in accordance with the standards of the Public Company Accounting Oversight Board (United States), the Company’s internal control over financial reporting as of December 31, 2014, based on criteria established in the 2013 Internal Control-Integrated Framework issued by the Committee of Sponsoring Organizations of the Treadway Commission (COSO), and our report dated March 2, 2015 expressed an unqualified opinion.
/s/ GRANT THORNTON LLP
New York, New York
March 2, 2015
Report of Independent Registered Public Accounting Firm
Board of Directors and Stockholders
NorthStar Realty Finance Corp.
We have audited the internal control over financial reporting of NorthStar Realty Finance Corp. (a Maryland corporation) and subsidiaries (the “Company”) as of December 31, 2014, based on criteria established in the 2013 Internal Control-Integrated Framework issued by the Committee of Sponsoring Organizations of the Treadway Commission (COSO). The Company’s management is responsible for maintaining effective internal control over financial reporting and for its assessment of the effectiveness of internal control over financial reporting, included in the accompanying Management Report on Internal Control over Financial Reporting (“Management’s Report”). Our responsibility is to express an opinion on the Company’s internal control over financial reporting based on our audit. Our audit of, and opinion on, the Company’s internal control over financial reporting does not include the internal control over financial reporting of the Griffin-American Portfolio, the K Partners Portfolio, Industrial Portfolio, Courtyard Portfolio, UK Property, Legacy Properties and Inland Portfolio, whose financial statements reflect total assets and revenues constituting 46 and 14 percent, respectively, of the related consolidated financial statement amounts as of and for the year ended December 31, 2014. As indicated in Management’s Report, the Griffin-American Portfolio, the K Partners Portfolio, Industrial Portfolio, Courtyard Portfolio, UK Property, Legacy Properties and Inland Portfolio were acquired during 2014. Management’s assertion on the effectiveness of the Company’s internal control over financial reporting excluded internal control over financial reporting of the Griffin-American Portfolio, the K Partners Portfolio, Industrial Portfolio, Courtyard Portfolio, UK Property, Legacy Properties and Inland Portfolio.
We conducted our audit in accordance with the standards of the Public Company Accounting Oversight Board (United States). Those standards require that we plan and perform the audit to obtain reasonable assurance about whether effective internal control over financial reporting was maintained in all material respects. Our audit included obtaining an understanding of internal control over financial reporting, assessing the risk that a material weakness exists, testing and evaluating the design and operating effectiveness of internal control based on the assessed risk, and performing such other procedures as we considered necessary in the circumstances. We believe that our audit provides a reasonable basis for our opinion.
A company’s internal control over financial reporting is a process designed to provide reasonable assurance regarding the reliability of financial reporting and the preparation of financial statements for external purposes in accordance with generally accepted accounting principles. A company’s internal control over financial reporting includes those policies and procedures that (1) pertain to the maintenance of records that, in reasonable detail, accurately and fairly reflect the transactions and dispositions of the assets of the company; (2) provide reasonable assurance that transactions are recorded as necessary to permit preparation of financial statements in accordance with generally accepted accounting principles, and that receipts and expenditures of the company are being made only in accordance with authorizations of management and directors of the company; and (3) provide reasonable assurance regarding prevention or timely detection of unauthorized acquisition, use, or disposition of the company’s assets that could have a material effect on the financial statements.
Because of its inherent limitations, internal control over financial reporting may not prevent or detect misstatements. Also, projections of any evaluation of effectiveness to future periods are subject to the risk that controls may become inadequate because of changes in conditions, or that the degree of compliance with the policies or procedures may deteriorate.
In our opinion, the Company maintained, in all material respects, effective internal control over financial reporting as of December 31, 2014, based on criteria established in the 2013 Internal Control-Integrated Framework issued by COSO.
We also have audited, in accordance with the standards of the Public Company Accounting Oversight Board (United States), the consolidated financial statements of the Company as of and for the year ended December 31, 2014, and our report dated March 2, 2015 expressed an unqualified opinion on those financial statements.
/s/ GRANT THORNTON LLP
New York, New York
March 2, 2015
NORTHSTAR REALTY FINANCE CORP. AND SUBSIDIARIES
CONSOLIDATED BALANCE SHEETS
(Dollars in Thousands)
|
| | | | | | | |
| | December 31, |
| | 2014 | | 2013 |
| Assets |
| | |
| Cash and cash equivalents | $ | 296,964 |
|
| $ | 635,990 |
|
| Restricted cash | 395,056 |
| | 166,487 |
|
| Operating real estate, net | 10,274,581 |
|
| 2,370,183 |
|
| Real estate debt investments, net (refer to Note 5) | 1,067,667 |
|
| 1,031,078 |
|
| Investments in private equity funds, at fair value (refer to Note 6) | 962,038 |
|
| 586,018 |
|
| Investments in unconsolidated ventures (refer to Note 7) | 207,777 |
|
| 142,340 |
|
| Real estate securities, available for sale (refer to Note 8) | 878,514 |
|
| 1,052,320 |
|
| Receivables, net of allowance of $2,020 and $1,151 as of December 31, 2014 and 2013, respectively | 111,358 |
| | 59,895 |
|
| Receivables, related parties | 3,158 |
| | 25,262 |
|
| Unbilled rent receivable, net of allowance of $4,037 and $307 as of December 31, 2014 and 2013, respectively | 16,404 |
| | 15,006 |
|
| Derivative assets, at fair value | 3,247 |
| | 3,469 |
|
| Deferred costs and intangible assets, net | 812,583 |
| | 89,838 |
|
| Assets of properties held for sale | 29,012 |
| | 30,063 |
|
| Other assets | 267,997 |
| | 152,101 |
|
Total assets(1) | $ | 15,326,356 |
|
| $ | 6,360,050 |
|
| Liabilities | | | |
| Mortgage and other notes payable | $ | 8,535,863 |
| | $ | 2,113,334 |
|
| CDO bonds payable, at fair value | 390,068 |
| | 384,183 |
|
| Securitization bonds payable | 41,823 |
| | 82,340 |
|
| Credit facilities | 732,780 |
| | 70,038 |
|
| Exchangeable senior notes | 41,762 |
| | 490,973 |
|
| Junior subordinated notes, at fair value | 215,172 |
| | 201,203 |
|
| Accounts payable and accrued expenses | 188,330 |
| | 74,547 |
|
| Due to related party (refer to Note 11) | 47,430 |
| | — |
|
| Escrow deposits payable | 67,750 |
| | 90,929 |
|
| Derivative liabilities, at fair value | 17,915 |
| | 52,204 |
|
| Liabilities of properties held for sale | 28,962 |
| | 28,962 |
|
| Other liabilities | 304,845 |
| | 73,874 |
|
Total liabilities(2) | 10,612,700 |
|
| 3,662,587 |
|
| Commitments and contingencies |
| |
|
| Equity | | | |
| NorthStar Realty Finance Corp. Stockholders’ Equity | | | |
| Preferred stock, $986,640 and $736,640 aggregate liquidation preference as of December 31, 2014 and 2013, respectively | 939,118 |
|
| 697,352 |
|
Common stock, $0.01 par value, 500,000,000 shares authorized, 301,684,041 and 154,403,414 shares issued and outstanding as of December 31, 2014 and 2013, respectively(3) | 3,017 |
| | 1,544 |
|
| Additional paid-in capital | 4,827,419 |
| | 2,649,450 |
|
| Retained earnings (accumulated deficit) | (1,422,399 | ) | | (685,936 | ) |
| Accumulated other comprehensive income (loss) | 49,540 |
| | (4,334 | ) |
| Total NorthStar Realty Finance Corp. stockholders’ equity | 4,396,695 |
| | 2,658,076 |
|
| Non-controlling interests | 316,961 |
| | 39,387 |
|
| Total equity | 4,713,656 |
|
| 2,697,463 |
|
| Total liabilities and equity | $ | 15,326,356 |
| | $ | 6,360,050 |
|
Refer to accompanying notes to consolidated financial statements.
NORTHSTAR REALTY FINANCE CORP. AND SUBSIDIARIES
CONSOLIDATED BALANCE SHEETS (Continued)
(Dollars in Thousands)
|
| | | | | | | | |
| | | December 31, |
| | | 2014 | | 2013 |
(1) | Assets of consolidated VIEs included in the total assets above: | | | |
| | Restricted cash | $ | 4,601 |
| | $ | 24,411 |
|
| | Operating real estate, net | 7,137 |
| | 4,945 |
|
| | Real estate debt investments, net | 25,325 |
| | 44,298 |
|
| | Real estate securities, available for sale | 463,050 |
| | 644,015 |
|
| | Receivables | 2,304 |
| | 4,476 |
|
| | Other assets | 242 |
| | 269 |
|
| | Total assets of consolidated VIEs | $ | 502,659 |
| | $ | 722,414 |
|
(2) | Liabilities of consolidated VIEs included in the total liabilities above: | | | |
| | CDO bonds payable, at fair value | $ | 390,068 |
| | $ | 384,183 |
|
| | Accounts payable and accrued expenses | 1,761 |
| | 2,686 |
|
| | Derivative liabilities, at fair value | 17,707 |
| | 52,204 |
|
| | Other liabilities | 1,784 |
| | 2,993 |
|
| | Total liabilities of consolidated VIEs | $ | 411,320 |
| | $ | 442,066 |
|
_______________________________
| |
| (3) | Adjusted for the one-for-two reverse stock split completed on June 30, 2014. Refer to Note 13. “Stockholders’ Equity” for additional disclosure related to the reverse stock split. |
Refer to accompanying notes to consolidated financial statements.
NORTHSTAR REALTY FINANCE CORP. AND SUBSIDIARIES
CONSOLIDATED STATEMENTS OF OPERATIONS
(Dollars in Thousands, Except Share and Per Share Data)
|
| | | | | | | | | | | |
| | Years Ended December 31, |
| | 2014 (1) | | 2013 (1) | | 2012 (1) |
| Property and other revenues | | | | | |
| Rental and escalation income | $ | 351,558 |
| | $ | 235,124 |
| | $ | 112,496 |
|
| Hotel related income | 237,039 |
| | — |
| | — |
|
| Resident fee income | 77,516 |
| | — |
| | — |
|
| Other revenue | 15,033 |
| | 5,723 |
| | 1,812 |
|
| Total property and other revenues | 681,146 |
|
| 240,847 |
|
| 114,308 |
|
| Net interest income | | | | | |
| Interest income (refer to Note 11) | 310,117 |
| | 303,989 |
| | 386,053 |
|
| Interest expense on debt and securities | 12,870 |
| | 38,152 |
| | 50,557 |
|
| Net interest income on debt and securities | 297,247 |
|
| 265,837 |
|
| 335,496 |
|
| Expenses | | | | | |
| Management fee, related party (refer to Note 11) | 82,756 |
| | — |
| | — |
|
| Other interest expense | 231,181 |
| | 140,507 |
| | 89,536 |
|
| Real estate properties—operating expenses | 325,753 |
| | 73,668 |
| | 18,679 |
|
| Other expenses | 1,812 |
| | 4,558 |
| | 6,358 |
|
| Transaction costs | 204,102 |
| | 12,464 |
| | 2,571 |
|
| Provision for (reversal of) loan losses, net | 3,769 |
| | (8,786 | ) | | 23,037 |
|
| General and administrative expenses | | | | | |
| Salaries and related expense | 26,481 |
| | 26,421 |
| | 29,279 |
|
Equity-based compensation expense(2) | 24,885 |
| | 11,784 |
| | 8,593 |
|
| Other general and administrative expenses | 13,483 |
| | 16,159 |
| | 14,524 |
|
| Total general and administrative expenses | 64,849 |
| | 54,364 |
| | 52,396 |
|
| Depreciation and amortization | 185,222 |
| | 93,470 |
| | 47,499 |
|
| Total expenses | 1,099,444 |
|
| 370,245 |
|
| 240,076 |
|
| Other income (loss) | |
| |
| |
| Unrealized gain (loss) on investments and other | (231,697 | ) | | (32,677 | ) | | (547,132 | ) |
| Realized gain (loss) on investments and other | (77,234 | ) | | 32,376 |
| | 59,340 |
|
| Gain (loss) from deconsolidation of N-Star CDOs (refer to Note 3) | (31,423 | ) | | (299,802 | ) | | — |
|
| Other income (loss) | — |
| | 38 |
| | 20,258 |
|
| Income (loss) before equity in earnings (losses) of unconsolidated ventures and income tax benefit (expense) | (461,405 | ) |
| (163,626 | ) |
| (257,806 | ) |
| Equity in earnings (losses) of unconsolidated ventures | 148,290 |
|
| 85,477 |
|
| 88 |
|
| Income tax benefit (expense) | 157 |
| | (1,000 | ) | | — |
|
| Income (loss) from continuing operations | (312,958 | ) |
| (79,149 | ) |
| (257,718 | ) |
Income (loss) from discontinued operations (refer to Note 10)(2)(3) | (8,128 | ) |
| (8,761 | ) |
| (17,450 | ) |
| Gain (loss) on sale from discontinued operations | — |
| | — |
| | 2,079 |
|
| Net income (loss) | (321,086 | ) |
| (87,910 | ) |
| (273,089 | ) |
| Net (income) loss attributable to non-controlling interests | 22,879 |
| | 5,973 |
| | 11,527 |
|
| Preferred stock dividends | (73,300 | ) | | (55,516 | ) | | (27,025 | ) |
| Net income (loss) attributable to NorthStar Realty Finance Corp. common stockholders | $ | (371,507 | ) |
| $ | (137,453 | ) |
| $ | (288,587 | ) |
Earnings (loss) per share:(4) | | | | | |
| Income (loss) per share from continuing operations | $ | (1.85 | ) | | $ | (1.22 | ) | | $ | (4.36 | ) |
| Income (loss) per share from discontinued operations | (0.04 | ) | | (0.08 | ) | | (0.28 | ) |
| Gain per share on sale of discontinued operations | — |
| | — |
| | 0.03 |
|
| Basic | $ | (1.89 | ) |
| $ | (1.30 | ) |
| $ | (4.61 | ) |
| Diluted | $ | (1.89 | ) |
| $ | (1.30 | ) |
| $ | (4.61 | ) |
Weighted average number of shares:(4) | | | | | |
| Basic | 196,071,771 |
| | 105,907,760 |
| | 62,599,258 |
|
| Diluted | 197,990,458 |
| | 110,489,168 |
| | 65,612,099 |
|
______________________
| |
| (1) | The consolidated financial statements for the year ended December 31, 2014 include: (i) the Company’s results of operations for the six months ended December 31, 2014 which represents the Company’s results of operations following the spin-off of the Company’s historical asset management business on June 30, 2014; and (ii) the Company’s results of operations for the six months ended June 30, 2014 which represents a carve-out of revenues and expenses attributable to NSAM in discontinued operations. The Company’s historical financial information for the years ended December 31, 2013 and 2012 was prepared on the same basis as the six months ended June 30, 2014. As a result, results of operations for the year ended December 31, 2014 may not be comparative to the Company's results of operations reported for the prior periods presented. |
| |
| (2) | Primarily relates to the operations of NSAM prior to the spin-off. Refer to Note 10. “Spin-off of Asset Management Business” for disclosure related to the spin-off of NSAM. |
| |
| (3) | The six months ended June 30, 2014 and the years ended December 31, 2013 and 2012 include $13.7 million, $5.2 million and $4.2 million, respectively, of equity-based compensation recorded in discontinued operations. |
| |
| (4) | Adjusted for the one-for-two reverse stock split completed on June 30, 2014. Refer to Note 13. “Stockholders’ Equity” for disclosure related to the reverse stock split. |
Refer to accompanying notes to consolidated financial statements.
NORTHSTAR REALTY FINANCE CORP. AND SUBSIDIARIES
CONSOLIDATED STATEMENTS OF COMPREHENSIVE INCOME (LOSS)
(Dollars in Thousands)
|
| | | | | | | | | | | |
| | Years Ended December 31, |
| | 2014 | | 2013 | | 2012 |
| Net income (loss) | $ | (321,086 | ) | | $ | (87,910 | ) | | $ | (273,089 | ) |
| Other comprehensive income (loss): | | | | | |
| Unrealized gain (loss) on real estate securities, available for sale | 60,140 |
| | (557 | ) | | 7,259 |
|
| Reclassification of unrealized (gain) loss on real estate securities, available for sale into realized gain (loss) on investments and other | (1,268 | ) | | (926 | ) | | — |
|
| Reclassification of swap (gain) loss into interest expense on debt and securities (refer to Note 16) | 915 |
| | 4,885 |
| | 7,412 |
|
| Reclassification of swap (gain) loss into gain (loss) from deconsolidation of N-Star CDOs (refer to Note 3) | — |
| | 15,246 |
| | — |
|
| Foreign currency translation adjustment | (5,155 | ) | | — |
| | — |
|
| Total other comprehensive income (loss) | 54,632 |
| | 18,648 |
| | 14,671 |
|
| Comprehensive income (loss) | (266,454 | ) | | (69,262 | ) |
| (258,418 | ) |
| Comprehensive (income) loss attributable to non-controlling interests | 22,121 |
| | 5,174 |
| | 10,837 |
|
| Comprehensive income (loss) attributable to NorthStar Realty Finance Corp. | $ | (244,333 | ) | | $ | (64,088 | ) |
| $ | (247,581 | ) |
Refer to accompanying notes to consolidated financial statements.
NORTHSTAR REALTY FINANCE CORP. AND SUBSIDIARIES
CONSOLIDATED STATEMENTS OF EQUITY
(Dollars and Shares in Thousands)
|
| | | | | | | | | | | | | | | | | | | | | | | | | | | | | | | | | | | | | |
| Preferred Stock |
| Common Stock(1) |
| Additional Paid-in Capital(1) |
| Retained Earnings (Accumulated Deficit) |
| Accumulated Other Comprehensive Income (Loss) |
| Total NorthStar Stockholders’ Equity |
| Non-controlling Interests |
|
|
| |
|
| Total Equity |
| Shares |
| Amount |
| Shares |
| Amount |
|
| Balance as of December 31, 2011 | 10,000 |
| | $ | 241,372 |
| | 48,023 |
| | $ | 480 |
| | $ | 810,306 |
| | $ | (8,626 | ) | | $ | (36,160 | ) | | $ | 1,007,372 |
| | $ | 32,242 |
| | $ | 1,039,614 |
|
| Net proceeds from offering of common stock | — |
| | — |
| | 33,625 |
| | 337 |
| | 382,473 |
| | — |
| | — |
| | 382,810 |
| | — |
| | 382,810 |
|
| Net proceeds from offering of preferred stock | 11,466 |
| | 262,646 |
| | — |
| | — |
| | — |
| | — |
| | — |
| | 262,646 |
| | — |
| | 262,646 |
|
| Redemptions of non-controlling interests | — |
| | — |
| | — |
| | — |
| | (2,358 | ) | | — |
| | — |
| | (2,358 | ) | | 2,358 |
| | — |
|
| Non-controlling interests—contributions | — |
| | — |
| | — |
| | — |
| | — |
| | — |
| | — |
| | — |
| | 8,755 |
| | 8,755 |
|
| Non-controlling interests—distributions | — |
| | — |
| | — |
| | — |
| | — |
| | — |
| | — |
| | — |
| | (7,053 | ) | | (7,053 | ) |
| Dividend reinvestment plan | — |
| | — |
| | 18 |
| | 1 |
| | 201 |
| | — |
| | — |
| | 202 |
| | — |
| | 202 |
|
| Amortization of equity-based compensation | — |
| | — |
| | — |
| | — |
| | — |
| | — |
| | — |
| | — |
| | 12,817 |
| | 12,817 |
|
| Equity component of exchangeable senior notes | — |
| | — |
| | — |
| | — |
| | 2,179 |
| | — |
| | — |
| | 2,179 |
| | — |
| | 2,179 |
|
| Other comprehensive income (loss) | — |
| | — |
| | — |
| | — |
| | — |
| | — |
| | 13,981 |
| | 13,981 |
| | 690 |
| | 14,671 |
|
| Conversion of LTIP Units | — |
| | — |
| | 138 |
| | — |
| | 3,148 |
| | — |
| | — |
| | 3,148 |
| | (3,148 | ) | | — |
|
| Dividends on common stock, LTIP Units and RSUs | — |
| | — |
| | — |
| | — |
| | — |
| | (79,472 | ) | | — |
| | (79,472 | ) | | (6,191 | ) | | (85,663 | ) |
| Dividends on preferred stock | — |
| | — |
| | — |
| | — |
| | — |
| | (27,025 | ) | | — |
| | (27,025 | ) | | — |
| | (27,025 | ) |
| Net income (loss) | — |
| | — |
| | — |
| | — |
| | — |
| | (261,562 | ) | | — |
| | (261,562 | ) | | (11,527 | ) | | (273,089 | ) |
| Balance as of December 31, 2012 | 21,466 |
| | $ | 504,018 |
| | 81,804 |
| | $ | 818 |
| | $ | 1,195,949 |
| | $ | (376,685 | ) | | $ | (22,179 | ) | | $ | 1,301,921 |
| | $ | 28,943 |
| | $ | 1,330,864 |
|
| Net proceeds from offering of common stock | — |
| | — |
| | 66,125 |
| | 661 |
| | 1,304,958 |
| | — |
| | — |
| | 1,305,619 |
| | — |
| | 1,305,619 |
|
| Net proceeds from offering of preferred stock | 8,000 |
| | 193,334 |
| | — |
| | — |
| | — |
| | — |
| | — |
| | 193,334 |
| | — |
| | 193,334 |
|
| Common stock related to transactions (refer to Note 13) | — |
| | — |
| | — |
| | — |
| | 17,712 |
| | — |
| | — |
| | 17,712 |
| | — |
| | 17,712 |
|
| Non-controlling interests—contributions | — |
| | — |
| | — |
| | — |
| | — |
| | — |
| | — |
| | — |
| | 19,774 |
| | 19,774 |
|
| Non-controlling interests—distributions | — |
| | — |
| | — |
| | — |
| | — |
| | — |
| | — |
| | — |
| | (1,403 | ) | | (1,403 | ) |
| Dividend reinvestment plan | — |
| | — |
| | 14 |
| | — |
| | 249 |
| | — |
| | — |
| | 249 |
| | — |
| | 249 |
|
| Amortization of equity-based compensation | — |
| | — |
| | — |
| | — |
| | — |
| | — |
| | — |
| | — |
| | 16,961 |
| | 16,961 |
|
| Equity component of exchangeable senior notes | — |
| | — |
| | — |
| | — |
| | 45,740 |
| | — |
| | — |
| | 45,740 |
| | — |
| | 45,740 |
|
| Conversion of exchangeable senior notes | — |
| | — |
| | 5,791 |
| | 58 |
| | 74,719 |
| | — |
| | — |
| | 74,777 |
| | — |
| | 74,777 |
|
| Other comprehensive income (loss) | — |
| | — |
| | — |
| | — |
| | — |
| | — |
| | 17,845 |
| | 17,845 |
| | 803 |
| | 18,648 |
|
| Conversion of Old LTIP Units | — |
| | — |
| | 670 |
| | 7 |
| | 10,123 |
| | — |
| | — |
| | 10,130 |
| | (10,130 | ) | | — |
|
| Dividends on common stock, Old LTIP Units and RSUs | — |
| | — |
| | — |
| | — |
| | — |
| | (171,798 | ) | | — |
| | (171,798 | ) | | (9,588 | ) | | (181,386 | ) |
| Dividends on preferred stock | — |
| | — |
| | — |
| | — |
| | — |
| | (55,516 | ) | | — |
| | (55,516 | ) | | — |
| | (55,516 | ) |
| Net income (loss) | — |
| | — |
| | — |
| | — |
| | — |
| | (81,937 | ) | | — |
| | (81,937 | ) | | (5,973 | ) | | (87,910 | ) |
| Balance as of December 31, 2013 | 29,466 |
| | $ | 697,352 |
| | 154,404 |
| | $ | 1,544 |
| | $ | 2,649,450 |
| | $ | (685,936 | ) | | $ | (4,334 | ) | | $ | 2,658,076 |
| | $ | 39,387 |
| | $ | 2,697,463 |
|
| Net proceeds from offering of common stock | — |
| | — |
| | 55,250 |
| | 553 |
| | 1,190,754 |
| | — |
| | — |
| | 1,191,307 |
| | — |
| | 1,191,307 |
|
| Net proceeds from offering of preferred stock | 10,000 |
| | 241,766 |
| | — |
| | — |
| | — |
| | — |
| | — |
| | 241,766 |
| | — |
| | 241,766 |
|
| Common stock related to transactions (refer to Note 13) | — |
| | — |
| | 61,708 |
| | 617 |
| | 1,082,114 |
| | — |
| | — |
| | 1,082,731 |
| | — |
| | 1,082,731 |
|
| Issuance of common stock in connection with exercise of warrants (refer to Note 13) | — |
| | — |
| | 799 |
| | 8 |
| | 8 |
| | — |
| | — |
| | 16 |
| | — |
| | 16 |
|
| Non-controlling interests—contributions | — |
| | — |
| | — |
| | — |
| | — |
| | — |
| | — |
| | — |
| | 321,455 |
| | 321,455 |
|
| Non-controlling interests—distributions | — |
| | — |
| | — |
| | — |
| | — |
| | — |
| | — |
| | — |
| | (13,593 | ) | | (13,593 | ) |
| Dividend reinvestment plan | — |
| | — |
| | 9 |
| | — |
| | 239 |
| | — |
| | — |
| | 239 |
| | — |
| | 239 |
|
| Amortization of equity-based compensation | — |
| | — |
| | — |
| | — |
| | 21,053 |
| | — |
| | — |
| | 21,053 |
| | 16,322 |
| | 37,375 |
|
| Exchangeable senior notes exchanged for Senior Notes (refer to Note 9) | — |
| | — |
| | — |
| | — |
| | (296,382 | ) | | — |
| | — |
| | (296,382 | ) | | — |
| | (296,382 | ) |
| Conversion of exchangeable senior notes | — |
| | — |
| | 24,907 |
| | 249 |
| | 320,055 |
| | — |
| | — |
| | 320,304 |
| | — |
| | 320,304 |
|
| Other comprehensive income (loss) | — |
|
| — |
|
| — |
|
| — |
|
| — |
|
| — |
|
| 53,874 |
|
| 53,874 |
|
| 758 |
|
| 54,632 |
|
NORTHSTAR REALTY FINANCE CORP. AND SUBSIDIARIES
CONSOLIDATED STATEMENTS OF EQUITY (Continued)
(Dollars and Shares in Thousands)
|
| | | | | | | | | | | | | | | | | | | | | | | | | | | | | | | | | | | | | |
| | Preferred Stock | | Common Stock(1) | | Additional
Paid-in
Capital(1) | | Retained
Earnings
(Accumulated
Deficit) | | Accumulated
Other
Comprehensive
Income (Loss) | | Total
NorthStar
Stockholders’
Equity | | Non-controlling
Interests | | |
| | | | Total
Equity |
| | Shares | | Amount | | Shares | | Amount | |
| Conversion of Old LTIP Units (refer to Note 12) | — |
| | — |
| | 4,607 |
| | 46 |
| | 18,565 |
| | — |
| | — |
| | 18,611 |
| | (18,611 | ) | | — |
|
| Spin-off of NSAM (refer to Note 10) | — |
| | — |
| | — |
| | — |
| | (158,437 | ) | | — |
| | — |
| | (158,437 | ) | | — |
| | (158,437 | ) |
| Dividends on common stock, Old LTIP Units, Deferred LTIP Units and RSUs (refer to Note 12) | — |
| | — |
| | — |
| | — |
| | — |
| | (364,956 | ) | | — |
| | (364,956 | ) | | (5,878 | ) | | (370,834 | ) |
| Dividends on preferred stock | — |
| | — |
| | — |
| | — |
| | — |
| | (73,300 | ) | | — |
| | (73,300 | ) | | — |
| | (73,300 | ) |
| Net income (loss) | — |
| | — |
| | — |
| | — |
| | — |
| | (298,207 | ) | | — |
| | (298,207 | ) | | (22,879 | ) | | (321,086 | ) |
| Balance as of December 31, 2014 | 39,466 |
| | $ | 939,118 |
| | 301,684 |
| | $ | 3,017 |
| | $ | 4,827,419 |
| | $ | (1,422,399 | ) | | $ | 49,540 |
| | $ | 4,396,695 |
| | $ | 316,961 |
| | $ | 4,713,656 |
|
_______________________
| |
| (1) | Adjusted for the one-for-two reverse stock split completed on June 30, 2014. Refer to Note 13. “Stockholders’ Equity” for additional disclosure related to the reverse stock split. |
Refer to accompanying notes to consolidated financial statements.
NORTHSTAR REALTY FINANCE CORP. AND SUBSIDIARIES
CONSOLIDATED STATEMENTS OF CASH FLOWS
(Dollars in Thousands)
|
| | | | | | | | | | | |
| | Years Ended December 31, |
| | 2014 | | 2013 | | 2012 |
| Cash flows from operating activities: | | | | | |
| Net income (loss) | $ | (321,086 | ) | | $ | (87,910 | ) | | $ | (273,089 | ) |
| Adjustments to reconcile net income (loss) to net cash provided by (used in) operating activities: | | | | | |
| Equity in (earnings) losses of PE Investments | (134,036 | ) | | (82,592 | ) | | — |
|
| Equity in (earnings) losses of unconsolidated ventures | (14,254 | ) | | (2,885 | ) | | (88 | ) |
| Depreciation and amortization | 185,222 |
| | 94,840 |
| | 49,207 |
|
| Amortization of premium/accretion of discount on investments | (76,040 | ) | | (58,032 | ) | | (137,816 | ) |
| Interest accretion on investments | (22,064 | ) | | (1,549 | ) | | (1,827 | ) |
| Amortization of deferred financing costs | 18,400 |
| | 7,393 |
| | 3,528 |
|
| Amortization of equity-based compensation | 37,375 |
| | 16,961 |
| | 12,817 |
|
| Unrealized (gain) loss on investments and other | 214,815 |
| | (20,054 | ) | | 468,229 |
|
| Realized gain (loss) on investments and other / other income | 77,234 |
| | (31,414 | ) | | (59,598 | ) |
| (Gain) loss on deconsolidation of N-Star CDOs | 31,423 |
| | 299,802 |
| | — |
|
| Gain on sale from discontinued operations/gain from acquisition | — |
| | — |
| | (2,079 | ) |
| Reversal of accrued loss contingency and other costs | — |
| | — |
| | (20,000 | ) |
| Impairment from discontinued operations | 555 |
| | 8,613 |
| | 966 |
|
| Distributions from PE Investments (refer to Note 6) | 134,036 |
| | 82,592 |
| | — |
|
| Distributions from unconsolidated ventures | 3,514 |
| | 4,744 |
| | 2,433 |
|
| Distributions from equity investments | 19,453 |
| | 7,028 |
| | — |
|
| Amortization of capitalized above/below market leases | 1,189 |
| | (1,438 | ) | | (1,266 | ) |
| Straight line rental income, net | (9,263 | ) | | (2,713 | ) | | (3,342 | ) |
| Provision for (reversal of) loan losses, net | 3,769 |
| | (8,786 | ) | | 23,037 |
|
| Allowance for uncollectible accounts | 10,858 |
| | 1,138 |
| | 833 |
|
| Other | 502 |
| | 148 |
| | 598 |
|
| Discount received | 3,223 |
| | 7,815 |
| | 17,399 |
|
| Changes in assets and liabilities: | | |
| |
|
| Restricted cash | (83,159 | ) | | (6,846 | ) | | 495 |
|
| Receivables | (34,997 | ) | | (10,912 | ) | | 969 |
|
| Receivables, related parties | 6,323 |
| | (11,946 | ) | | (5,908 | ) |
| Other assets | (37,167 | ) | | (1,040 | ) | | (1,464 | ) |
| Accounts payable and accrued expenses | 56,284 |
| | 32,860 |
| | (21,425 | ) |
| Due to related party | 47,430 |
| | — |
| | — |
|
| Other liabilities | 25,317 |
| | 4,857 |
| | 24,302 |
|
| Net cash provided by (used in) operating activities | 144,856 |
|
| 240,674 |
|
| 76,911 |
|
| Cash flows from investing activities: | | | | | |
| Acquisition of operating real estate, net | (3,466,610 | ) | | (1,624,959 | ) | | (311,485 | ) |
| Acquisition of Griffin-American, net of cash | (2,947,856 | ) | | — |
| | — |
|
| Improvements of operating real estate | (37,955 | ) | | (11,028 | ) | | (4,485 | ) |
| Proceeds from sale of operating real estate | 27,630 |
| | 17,687 |
| | 13,369 |
|
| Deferred costs and intangible assets | (21,597 | ) | | (769 | ) | | (575 | ) |
| Origination of real estate debt investments, net | (282,181 | ) | | (744,209 | ) | | (242,326 | ) |
| Acquisition of real estate debt investments | (997 | ) | | (56,301 | ) | | (100,460 | ) |
| Proceeds from sale of real estate debt investments (refer to Note 11) | 28,500 |
| | 106,845 |
| | 18,109 |
|
| Repayment on real estate debt investments | 196,034 |
| | 274,029 |
| | 239,588 |
|
| Investment in PE Investments (refer to Note 6) | (557,719 | ) | | (664,392 | ) | | — |
|
| Distributions from PE Investments (refer to Note 6) | 230,598 |
| | 135,607 |
| | — |
|
| Investments in unconsolidated ventures | (73,254 | ) | | (109,218 | ) | | (20,326 | ) |
| Distributions from unconsolidated ventures | 11,873 |
| | 11,782 |
| | 487 |
|
| Acquisition of real estate securities, available for sale | (36,519 | ) | | (2,800 | ) | | (89,041 | ) |
| Proceeds from the sale of real estate securities, available for sale | 94,763 |
| | 223,992 |
| | 343,900 |
|
| Repayment on real estate securities, available for sale | 63,902 |
| | 187,622 |
| | 229,870 |
|
| Change in restricted cash | (201,135 | ) | | (30,736 | ) | | (5,084 | ) |
| Other assets | (81,704 | ) | | 1,695 |
| | (19,640 | ) |
| Net cash provided by (used in) investing activities | (7,054,227 | ) |
| (2,285,153 | ) |
| 51,901 |
|
Refer to accompanying notes to consolidated financial statements.
NORTHSTAR REALTY FINANCE CORP. AND SUBSIDIARIES
CONSOLIDATED STATEMENTS OF CASH FLOWS (Continued)
(Dollars in Thousands)
|
| | | | | | | | | | | |
| | Years Ended December 31, |
| | 2014 | | 2013 | | 2012 |
| Cash flows from financing activities: | | | | | |
| Borrowings from mortgage notes | $ | 5,932,208 |
| | $ | 1,252,085 |
| | $ | 241,400 |
|
| Repayment of mortgage notes | (383,018 | ) | | (21,272 | ) | | (8,987 | ) |
| Proceeds from CDO bonds reissuance | — |
| | 23,725 |
| | 89,637 |
|
| Proceeds from CDO bonds | — |
| | — |
| | 10,000 |
|
| Repayment of CDO bonds | (87,859 | ) | | (655,575 | ) | | (693,705 | ) |
| Repurchase of CDO bonds | (15,320 | ) | | (44,222 | ) | | (98,818 | ) |
| Proceeds from securitization bonds payable | — |
| | — |
| | 98,131 |
|
| Paydowns on securitization bonds payable | (40,505 | ) | | (15,794 | ) | | — |
|
| Borrowings from credit facilities | 922,540 |
| | 147,748 |
| | 134,775 |
|
| Repayment of credit facilities | (259,798 | ) | | (138,798 | ) | | (137,946 | ) |
| Repayment of secured term loan | — |
| | (105 | ) | | (18 | ) |
| Proceeds from exchangeable senior notes | — |
| | 345,000 |
| | 82,000 |
|
| Repurchases and repayment of exchangeable senior notes | — |
| | (36,710 | ) | | (7,500 | ) |
| Repayment of Senior Notes | (481,118 | ) | | — |
| | — |
|
| Payment of deferred financing costs | (139,937 | ) | | (28,280 | ) | | (11,088 | ) |
| Purchase of derivative instruments | (4,159 | ) | | (9,563 | ) | | (8,920 | ) |
| Settlement of derivative instruments | 2,995 |
| | — |
| | (11,175 | ) |
| Change in restricted cash | 22,843 |
| | 134,504 |
| | (41,522 | ) |
| Net proceeds from common stock offering | 1,191,307 |
| | 1,305,619 |
| | 383,480 |
|
| Net proceeds from preferred stock offering | 241,766 |
| | 193,334 |
| | 262,646 |
|
| Proceeds from dividend reinvestment plan | 239 |
| | 249 |
| | 202 |
|
| Spin-off of NSAM (refer to Note 10) | (118,728 | ) | | — |
| | — |
|
| Dividends | (438,256 | ) | | (227,314 | ) | | (106,497 | ) |
| Contributions from non-controlling interests | 246,027 |
| | 19,774 |
| | 8,756 |
|
| Distributions to non-controlling interests | (18,709 | ) | | (8,863 | ) | | (13,244 | ) |
| Net cash provided by (used in) financing activities | 6,572,518 |
|
| 2,235,542 |
|
| 171,607 |
|
| Effect of foreign currency translation on cash and cash equivalents | (2,173 | ) | | — |
| | — |
|
| Net increase (decrease) in cash and cash equivalents | (339,026 | ) | | 191,063 |
| | 300,419 |
|
| Cash and cash equivalents—beginning of period | 635,990 |
| | 444,927 |
| | 144,508 |
|
| Cash and cash equivalents—end of period | $ | 296,964 |
| | $ | 635,990 |
| | $ | 444,927 |
|
Refer to accompanying notes to consolidated financial statements.
NORTHSTAR REALTY FINANCE CORP. AND SUBSIDIARIES
NOTES TO CONSOLIDATED FINANCIAL STATEMENTS
| |
| 1. | Business and Organization |
NorthStar Realty Finance Corp. is a diversified commercial real estate company (the “Company”). The Company invests in multiple asset classes across commercial real estate (“CRE”) that it expects will generate attractive risk-adjusted returns and may take the form of acquiring real estate, originating or acquiring senior or subordinate loans, as well as pursuing opportunistic CRE investments, both in the United States and internationally, with a current focus on Europe. Effective June 30, 2014, the Company is externally managed and advised by an affiliate of NorthStar Asset Management Group Inc. (NYSE: NSAM), which together with its affiliates is referred to as NSAM. The Company is a Maryland corporation and completed its initial public offering in October 2004. The Company conducts its operations so as to continue to qualify as a real estate investment trust (“REIT”) for U.S. federal income tax purposes.
Proposed Spin-off of European Real Estate Business
On February 26, 2015, the Company announced that its board of directors unanimously approved a plan to spin-off the Company’s European real estate business (the “Proposed European Spin”) into a newly-formed publicly-traded REIT, NorthStar Realty Europe Corp. (“NRE”) expected to be listed on the New York Stock Exchange (“NYSE”) and potentially in Europe. Currently, the Company acquired or committed to acquire $2.0 billion of European real estate comprised of 50 properties spanning across some of Europe’s top markets (“European Portfolio”) that will be contributed to NRE upon the completion of the Proposed European Spin. NSAM will manage NRE pursuant to a long-term management agreement, on substantially similar terms as the Company’s management agreement with NSAM. The Proposed European Spin is expected to be completed in the second half of 2015.
Griffin-American Healthcare REIT II, Inc.
On December 3, 2014, the Company completed its previously announced merger of Griffin-American Healthcare REIT II, Inc. (“Griffin-American”) where the Company acquired all of the outstanding shares of Griffin-American in a stock and cash transaction valued at $4.0 billion. Griffin-American was a public REIT focused on medical office buildings, senior housing and other healthcare-related facilities and was co-sponsored by American Healthcare Investors LLC (“AHI”) and Griffin Capital Corporation. Additionally, NorthStar Healthcare acquired a 14.3% equity interest in the Griffin-American portfolio for $187.2 million in cash, including its share of transaction costs. The European healthcare properties that the Company acquired from Griffin-American will not be contributed to NRE in the Proposed European Spin.
Spin-off of Asset Management Business
On June 30, 2014, the Company completed the spin-off of its asset management business into a separate publicly-traded company, NSAM, in the form of a tax-free distribution (the “NSAM Spin-off” or the “Distribution”). In connection with the NSAM Spin-off, each of the Company’s common stockholders received shares of NSAM’s common stock on a one-for-one basis, after giving effect to a one-for-two reverse stock split of the Company’s common stock (the “Reverse Split”). Upon completion of the NSAM Spin-off, the asset management business of the Company is owned and operated by NSAM and the Company is externally managed by an affiliate of NSAM through a management contract with an initial term of 20 years. Subsequent to the NSAM Spin-off, the Company continues to operate its CRE debt origination business. Most of the employees of the Company at the time of the NSAM Spin-off became employees of NSAM and executive officers, employees engaged in the Company’s loan origination business at the time of the NSAM Spin-off and certain other employees became co-employees of both the Company and NSAM. Affiliates of NSAM also manage the Company’s previously sponsored non-traded REITs: NorthStar Real Estate Income Trust, Inc. (“NorthStar Income”), NorthStar Healthcare Income, Inc. (“NorthStar Healthcare”) and NorthStar Real Estate Income II, Inc. (“NorthStar Income II”) and together with any new sponsored companies, (herein collectively referred to as the “NSAM Sponsored Companies”). In addition, NSAM owns NorthStar Realty Securities, LLC (“NorthStar Securities”), the Company’s previously owned captive broker-dealer platform, which raises capital in the retail market for NSAM’s Sponsored Companies. Refer to Note 10. “Spin-off of Asset Management Business” for further disclosure.
Prior to the NSAM Spin-off, the Company completed an internal corporate reorganization (the “Reorganization”) whereby the Company collapsed its three tier holding company structure into a single tier. The Company previously conducted substantially all of its operations and made its investments through NorthStar Realty Finance Limited Partnership (the “Operating Partnership”). Limited partnership units structured as profits interests previously issued by the Operating Partnership (“Old LTIP Units”) as equity-based compensation were recorded as non-controlling interests on the consolidated balance sheets and
were exchanged for shares of the Company’s common stock in the Reorganization. Refer to Note 12. “Equity-Based Compensation” and Note 14. “Non-controlling Interests” for further disclosure. The accompanying notes to these consolidated financial statements are presented after giving effect to the Reorganization, the Reverse Split and the NSAM Spin-off.
All references herein to the Company refer to NorthStar Realty Finance Corp. and its consolidated subsidiaries after giving effect to the Reorganization, the Reverse Split and the NSAM Spin-off, unless the context otherwise requires.
2. Summary of Significant Accounting Policies
Basis of Accounting
The accompanying consolidated financial statements and related notes of the Company have been prepared in accordance with accounting principles generally accepted in the United States (“U.S. GAAP”).
The consolidated financial statements for the six months ended December 31, 2014 represent the Company subsequent to the spin-off of its historical asset management business of managing the NSAM Sponsored Companies, owning NorthStar Securities and operating its special servicing business. In connection with the spin-off, most of the Company’s employees at the time of the spin-off became employees of NSAM except for executive officers, employees engaged in the Company’s loan origination business at the time of the spin-off and certain other employees that became co-employees of both the Company and NSAM. Therefore, subsequent to June 30, 2014, NSAM generally incurs substantially all employee-related cash costs.
Periods prior to June 30, 2014 present a carve-out of the Company’s historical financial information, including revenues and expenses allocated to NSAM, related to the Company’s historical asset management business being reported in discontinued operations. Expenses also included an allocation of indirect expenses of the Company to NSAM, including salaries, equity-based compensation and other general and administrative expenses (primarily occupancy and other cost) based on an estimate had the asset management business been run as an independent entity. This allocation method was principally based on relative headcount and management’s knowledge of the Company’s operations.
Principles of Consolidation
The consolidated financial statements include the accounts of the Company and its consolidated subsidiaries. The Company consolidates variable interest entities (“VIE”) where the Company is the primary beneficiary and voting interest entities which are generally majority owned or otherwise controlled by the Company. All significant intercompany balances are eliminated in consolidation.
Variable Interest Entities
A VIE is an entity that lacks one or more of the characteristics of a voting interest entity. A VIE is defined as an entity in which equity investors do not have the characteristics of a controlling financial interest or do not have sufficient equity at risk for the entity to finance its activities without additional subordinated financial support from other parties. The determination of whether an entity is a VIE includes both a qualitative and quantitative analysis. The Company bases its qualitative analysis on its review of the design of the entity, its organizational structure including decision-making ability and relevant financial agreements and the quantitative analysis on the forecasted cash flow of the entity.
The Company reassesses its initial evaluation of an entity as a VIE upon the occurrence of certain reconsideration events.
A VIE must be consolidated only by its primary beneficiary, which is defined as the party who, along with its affiliates and agents has both the: (i) power to direct the activities that most significantly impact the VIE’s economic performance; and (ii) obligation to absorb the losses of the VIE or the right to receive the benefits from the VIE, which could be significant to the VIE. The Company determines whether it is the primary beneficiary of a VIE by considering qualitative and quantitative factors, including, but not limited to: which activities most significantly impact the VIE’s economic performance and which party controls such activities; the amount and characteristics of its investment; the obligation or likelihood for the Company or other interests to provide financial support; consideration of the VIE’s purpose and design, including the risks the VIE was designed to create and pass through to its variable interest holders and the similarity with and significance to the business activities of the Company and the other interests. The Company reassesses its determination of whether it is the primary beneficiary of a VIE each reporting period. Significant judgments related to these determinations include estimates about the current and future fair value and performance of investments held by these VIEs and general market conditions.
The Company evaluates its CRE debt and securities, investments in unconsolidated ventures and securitization financing transactions, such as its collateralized debt obligations (“CDOs”) and its liabilities to subsidiary trusts issuing preferred securities (“junior subordinated notes”) to determine whether they are a VIE. The Company analyzes new investments and financings, as well as reconsideration events for existing investments and financings, which vary depending on type of investment or financing.
NORTHSTAR REALTY FINANCE CORP. AND SUBSIDIARIES
NOTES TO CONSOLIDATED FINANCIAL STATEMENTS (Continued)
Voting Interest Entities
A voting interest entity is an entity in which the total equity investment at risk is sufficient to enable it to finance its activities independently and the equity holders have the power to direct the activities of the entity that most significantly impact its economic performance, the obligation to absorb the losses of the entity and the right to receive the residual returns of the entity. The usual condition for a controlling financial interest in a voting interest entity is ownership of a majority voting interest. If the Company has a majority voting interest in a voting interest entity, the entity will generally be consolidated. The Company does not consolidate a voting interest entity if there are substantive participating rights by other parties and/or kick-out rights by a single party.
The Company performs on-going reassessments of whether entities previously evaluated under the voting interest framework have become VIEs, based on certain events, and therefore subject to the VIE consolidation framework.
Investments in Unconsolidated Ventures
Non-controlling, unconsolidated ownership interests in an entity may be accounted for using the equity method, at fair value or the cost method.
Under the equity method, the investment is adjusted each period for capital contributions and distributions and its share of the entity’s net income (loss). Capital contributions, distributions and net income (loss) of such entities are recorded in accordance with the terms of the governing documents. An allocation of net income (loss) may differ from the stated ownership percentage interest in such entity as a result of preferred returns and allocation formulas, if any, as described in such governing documents.
The Company may account for an investment in an unconsolidated entity at fair value by electing the fair value option. The Company elected the fair value option for its investments (directly or indirectly in joint ventures) that own limited partnership interests in real estate private equity funds (“PE Investments”) and certain investments in unconsolidated ventures (refer to Note 7). The Company records the change in fair value for its share of the projected future cash flow of such investments from one period to another in equity in earnings (losses) from unconsolidated ventures in the consolidated statements of operations. Any change in fair value attributed to market related assumptions is considered unrealized gain (loss).
The Company may account for an investment that does not qualify for equity method accounting or for which the fair value option was not elected using the cost method if the Company determines the investment in the unconsolidated entity is insignificant. Under the cost method, equity in earnings is recorded as dividends are received to the extent they are not considered a return of capital, which is recorded as a reduction of cost of the investment.
Non-controlling Interests
A non-controlling interest in a consolidated subsidiary is defined as the portion of the equity (net assets) in a subsidiary not attributable, directly or indirectly, to the Company. A non-controlling interest is required to be presented as a separate component of equity on the consolidated balance sheets and presented separately as net income (loss) and other comprehensive income (loss) (“OCI”) attributable to controlling and non-controlling interests. An allocation to a non-controlling interest may differ from the stated ownership percentage interest in such entities as a result of preferred returns and allocation formulas, if any, as described in such governing documents.
Estimates
The preparation of consolidated financial statements in conformity with U.S. GAAP requires management to make estimates and assumptions that could affect the amounts reported in the consolidated financial statements and accompanying notes. Actual results could materially differ from those estimates and assumptions.
Reclassifications
Certain prior period amounts have been reclassified in the consolidated financial statements to conform to current period presentation.
NORTHSTAR REALTY FINANCE CORP. AND SUBSIDIARIES
NOTES TO CONSOLIDATED FINANCIAL STATEMENTS (Continued)
Comprehensive Income (Loss)
The Company reports consolidated comprehensive income (loss) in separate statements following the consolidated statements of operations. Comprehensive income (loss) is defined as the change in equity resulting from net income (loss) and OCI. The components of OCI principally include: (i) unrealized gain (loss) on real estate securities available for sale for which the fair value option is not elected; (ii) the reclassification of unrealized gain (loss) on real estate securities available for sale for which the fair value option was not elected to realized gain (loss) upon sale or realized event; (iii) the reclassification of unrealized gain (loss) to interest expense on derivative instruments that are or were deemed to be effective hedges; and (iv) foreign currency translation adjustment.
The following table presents the components of accumulated other comprehensive income (loss) as of and for the years ended December 31, 2014, 2013 and 2012 (dollars in thousands):
|
| | | | | | | | | | | | | | | | |
| Accumulated OCI | | Cumulative Unrealized Gain (Loss) on Available for Sale Securities | | Effective Portion of Cash Flow Hedges | | Foreign Currency Translation | | Total |
| Balance as of December 31, 2011 | | $ | (7,187 | ) | | $ | (28,973 | ) | | $ | — |
| | $ | (36,160 | ) |
| Unrealized gain (loss) on real estate securities, available for sale | | 7,259 |
| | — |
| | — |
| | 7,259 |
|
| Reclassification of swap (gain) loss into interest expense on debt and securities (refer to Note 16) | | — |
| | 7,412 |
| | — |
| | 7,412 |
|
| Non-controlling interests | | (348 | ) | | (342 | ) | | — |
| | (690 | ) |
| Balance as of December 31, 2012 | | (276 | ) |
| (21,903 | ) |
| — |
|
| (22,179 | ) |
| Unrealized gain (loss) on real estate securities, available for sale | | (557 | ) | | — |
| | — |
| | (557 | ) |
| Reclassification of unrealized (gain) loss on real estate securities, available for sale into realized gain (loss) on investments and other | | (926 | ) | | — |
| | — |
| | (926 | ) |
| Reclassification of swap (gain) loss into interest expense on debt and securities (refer to Note 16) | | — |
| | 4,885 |
| | — |
| | 4,885 |
|
| Reclassification of swap (gain) loss into gain (loss) from deconsolidation of N-Star CDOs (refer to Note 3) | | — |
| | 15,246 |
| | — |
| | 15,246 |
|
| Non-controlling interests | | 23 |
| | (826 | ) | | — |
| | (803 | ) |
| Balance as of December 31, 2013 | | (1,736 | ) |
| (2,598 | ) |
| — |
|
| (4,334 | ) |
| Unrealized gain (loss) on real estate securities, available for sale | | 60,140 |
| | — |
| | — |
| | 60,140 |
|
| Reclassification of unrealized (gain) loss on real estate securities, available for sale into realized gain (loss) on investments and other | | (1,268 | ) | | — |
| | — |
| | (1,268 | ) |
| Reclassification of swap (gain) loss into interest expense on debt and securities (refer to Note 16) | | — |
| | 915 |
| | — |
| | 915 |
|
| Foreign currency translation adjustment | | — |
| | — |
| | (5,155 | ) | | (5,155 | ) |
| Non-controlling interests | | (1,064 | ) | | (11 | ) | | 317 |
| | (758 | ) |
| Balance as of December 31, 2014 | | $ | 56,072 |
|
| $ | (1,694 | ) |
| $ | (4,838 | ) | | $ | 49,540 |
|
Cash and Cash Equivalents
The Company considers all highly-liquid investments with a remaining maturity date of three months or less to be cash equivalents. Cash, including amounts restricted, may at times exceed the Federal Deposit Insurance Corporation deposit insurance limit of $250,000 per institution. The Company mitigates credit risk by placing cash and cash equivalents with major financial institutions. To date, the Company has not experienced any losses on cash and cash equivalents.
NORTHSTAR REALTY FINANCE CORP. AND SUBSIDIARIES
NOTES TO CONSOLIDATED FINANCIAL STATEMENTS (Continued)
Restricted Cash
Restricted cash primarily consists of amounts related to operating real estate and CRE debt investments. The following table presents a summary of restricted cash as of December 31, 2014 and 2013 (dollars in thousands):
|
| | | | | | | | |
| | | December 31, |
| | | 2014 | | 2013 |
| Capital expenditures reserves | | $ | 211,010 |
| | $ | 46,115 |
|
Operating real estate escrow reserves(1) | | 123,017 |
| | 7,599 |
|
| CRE debt escrow deposits | | 56,342 |
| | 92,347 |
|
Cash in CDOs(2) | | 4,687 |
| | 20,426 |
|
| Total | | $ | 395,056 |
| | $ | 166,487 |
|
__________________________________________________
| |
| (1) | Primarily represents insurance, real estate tax, tenant security deposits and other escrows related to operating real estate. |
| |
| (2) | Represents proceeds from repayments and/or sales pending distribution. |
Fair Value Option
The fair value option provides an election that allows a company to irrevocably elect fair value for certain financial assets and liabilities on an instrument-by-instrument basis at initial recognition. The Company may elect to apply the fair value option for certain investments due to the nature of the instrument. Any change in fair value for assets and liabilities for which the election is made is recognized in earnings.
Operating Real Estate
Operating real estate is carried at historical cost less accumulated depreciation. Costs directly related to an acquisition deemed to be a business combination are expensed and included in transaction costs in the consolidated statements of operations. Ordinary repairs and maintenance are expensed as incurred. Major replacements and betterments which improve or extend the life of the asset are capitalized and depreciated over their useful life.
Operating real estate is depreciated using the straight-line method over the estimated useful lives of the assets, summarized as follows:
|
| | |
| Category: | | Term: |
| Building (fee interest) | | 15 to 40 years |
| Building improvements | | Lesser of the useful life or remaining life of the building |
| Building leasehold interests | | Lesser of 40 years or remaining term of the lease |
| Land improvements | | 10 to 30 years |
| Tenant improvements | | Lesser of the useful life or remaining term of the lease |
The Company follows the purchase method for an acquisition of operating real estate, where the purchase price is allocated to tangible assets such as land, building, tenant and land improvements and other identified intangibles, such as goodwill. Major replacements and betterments which improve or extend the life of the asset are capitalized and depreciated over their useful life. Ordinary repairs and maintenance are expensed as incurred. Operating real estate is carried at historical cost less accumulated depreciation. Operating real estate is depreciated using the straight-line method over the estimated useful lives of the assets. Costs directly related to an acquisition deemed to be a business combination are expensed and included in transaction costs in the consolidated statements of operations. The Company evaluates whether real estate acquired in connection with a foreclosure, UCC/deed in lieu of foreclosure or a consentual modification of a loan (herein collectively referred to as taking title to collateral) (“REO”) constitutes a business and whether business combination accounting is appropriate. Any excess upon taking title to collateral between the carrying value of a loan over the estimated fair value of the property is charged to provision for loan losses.
Operating real estate, including REO, which has met the criteria to be classified as held for sale, is separately presented on the consolidated balance sheets. Such operating real estate is recorded at the lower of its carrying value or its estimated fair value less the cost to sell. Once a property is determined to be held for sale, depreciation is no longer recorded.
NORTHSTAR REALTY FINANCE CORP. AND SUBSIDIARIES
NOTES TO CONSOLIDATED FINANCIAL STATEMENTS (Continued)
Minimum rental amounts due under leases are generally either subject to scheduled fixed increases or adjustments. The following table presents approximate future minimum rental income under noncancelable operating leases to be received over the next five years and thereafter as of December 31, 2014 (dollars in thousands):
|
| | | | |
| Years Ending December 31: | | |
2015(1) | | $ | 374,726 |
|
| 2016 | | 361,704 |
|
| 2017 | | 342,502 |
|
| 2018 | | 323,201 |
|
| 2019 | | 310,320 |
|
| Thereafter | | 2,046,036 |
|
| Total | | $ | 3,758,489 |
|
_______________________
| |
| (1) | Excludes rental income from healthcare properties permitted by the REIT Investment Diversification and Empowerment Act of 2007 (“RIDEA”) and manufactured housing communities and multifamily properties that are subject to short-term leases. |
Real Estate Debt Investments
CRE debt investments are generally intended to be held to maturity and, accordingly, are carried at cost, net of unamortized loan fees, premium, discount and unfunded commitments. CRE debt investments that are deemed to be impaired are carried at amortized cost less a loan loss reserve, if deemed appropriate, which approximates fair value. CRE debt investments where the Company does not have the intent to hold the loan for the foreseeable future or until its expected payoff are classified as held for sale and recorded at the lower of cost or estimated value.
Real Estate Securities
The Company classifies its CRE securities investments as available for sale on the acquisition date, which are carried at fair value. The Company historically elected to apply the fair value option for its CRE securities investments. For those CRE securities for which the fair value option was elected, any unrealized gains (losses) from the change in fair value is recorded in unrealized gains (losses) on investments and other in the consolidated statements of operations.
The Company may decide to not elect the fair value option for certain CRE securities due to the nature of the particular instrument. For those CRE securities for which the fair value option was not elected, any unrealized gain (loss) from the change in fair value is recorded as a component of accumulated OCI in the consolidated statements of equity, to the extent impairment losses are considered temporary.
Deferred Costs
Deferred costs include deferred financing costs and deferred lease costs. Deferred financing costs represent commitment fees, legal and other third-party costs associated with obtaining financing. These costs are amortized to interest expense over the term of the financing using either the effective interest method or straight-line method depending on the type of financing. Unamortized deferred financing costs are expensed when the associated borrowing is refinanced or repaid before maturity. Costs incurred in seeking financing transactions, which do not close, are expensed in the period such financing transaction was terminated. Deferred lease costs consist of fees incurred to initiate and renew operating leases, which are amortized on a straight-line basis over the remaining lease term and is recorded to depreciation and amortization in the consolidated statements of operations.
Identified Intangibles
The Company records acquired identified intangibles, which includes intangible assets (such as value of the above-market leases, in-place leases, goodwill and other intangibles) and intangible liabilities (such as the value of below-market leases), based on estimated fair value. The value allocated to the above or below-market leases is amortized over the remaining lease term as a net adjustment to rental income. Other intangible assets are amortized into depreciation and amortization expense on a straight-line basis over the remaining lease term. As of December 31, 2014, the weighted average amortization period for above-market leases, below-market leases and in-place lease costs is 11.8 years, 13.9 years and 9.8 years, respectively.
Goodwill represents the excess of the purchase price over the fair value of net tangible and intangible assets acquired in a business combination and is not amortized. The Company performs an annual impairment test for goodwill and evaluates the recoverability whenever events or changes in circumstances indicate that the carrying value of goodwill may not be fully recoverable. In making such assessment, qualitative factors are used to determine whether it is more likely than not that the fair
NORTHSTAR REALTY FINANCE CORP. AND SUBSIDIARIES
NOTES TO CONSOLIDATED FINANCIAL STATEMENTS (Continued)
value of a reporting unit is less than its carrying value. If the estimated fair value of the reporting unit is less than its carrying value, then an impairment charge is recorded. The Company determined that goodwill was not impaired as of December 31, 2014.
Identified intangible assets are recorded in deferred costs and intangible assets and identified intangible liabilities are recorded in other liabilities on the consolidated balance sheets.
The following table presents identified intangibles as of December 31, 2014 and 2013 (dollars in thousands):
|
| | | | | | | | | | | | | | | | | | | | | | | | | | | | | | | | |
| | | December 31, 2014 | | December 31, 2013 |
| | | | | | | | | | | | | | | | | Intangible |
| | | Intangible Assets | | Intangible Liabilities | | Intangible Assets | | Liabilities |
| | | Above-market Leases | | Goodwill | | Other | | Below-market Leases | | Other | | Above-market Leases | | Other | | Below-market Leases |
| Gross amount | | $ | 273,522 |
| | $ | 75,806 |
| (1) | $ | 381,997 |
| (2) | $ | 184,209 |
| | $ | 7,157 |
| (3) | $ | 6,264 |
| | $ | 93,037 |
| | $ | 19,499 |
|
| Accumulated amortization | | (9,730 | ) | | NA |
| | (60,032 | ) | | (14,838 | ) | | NA |
| | (4,351 | ) | | (42,185 | ) | | (10,799 | ) |
| Total | | $ | 263,792 |
| | $ | 75,806 |
| | $ | 321,965 |
| | $ | 169,371 |
| | $ | 7,157 |
| | $ | 1,913 |
| | $ | 50,852 |
| | $ | 8,700 |
|
_______________________
| |
| (1) | Represents goodwill associated with the acquisitions of the Formation Portfolio ($25.5 million) and the Griffin-American Portfolio ($50.2 million). Refer to Note 4 for further disclosure. |
| |
| (2) | Primarily represents the value of in-place leases. |
| |
| (3) | Represents the value associated with a purchase price option associated with the Griffin-American Portfolio. |
The Company recorded amortization of acquired above-market leases, net of acquired below-market leases of ($1.2 million), $1.4 million and $1.3 million for the years ended December 31, 2014, 2013 and 2012, respectively. Amortization of other intangible assets was $20.3 million, $15.4 million and $13.7 million for the years ended December 31, 2014, 2013 and 2012, respectively.
The following table presents annual amortization of intangible assets and liabilities (dollars in thousands):
|
| | | | | | | | |
| Years Ending December 31: | | Above and Below Market Leases, Net(1) | | Other Intangibles(1) |
| 2015 | | $ | 9,347 |
| | $ | 36,874 |
|
| 2016 | | 9,366 |
| | 35,599 |
|
| 2017 | | 9,387 |
| | 33,539 |
|
| 2018 | | 9,960 |
| | 31,409 |
|
| 2019 | | 10,295 |
| | 30,563 |
|
| Thereafter | | 46,066 |
| | 139,392 |
|
| Total | | $ | 94,421 |
| | $ | 307,376 |
|
______________________________________________________
| |
| (1) | Identified intangibles will be amortized through periods ending December 2026. |
NORTHSTAR REALTY FINANCE CORP. AND SUBSIDIARIES
NOTES TO CONSOLIDATED FINANCIAL STATEMENTS (Continued)
Other Assets and Other Liabilities
The following table presents a summary of other assets and other liabilities as of December 31, 2014 and 2013 (dollars in thousands):
|
| | | | | | | | |
| | | December 31, |
| | | 2014 | | 2013 |
| Other assets: | | | | |
| Due from servicer | | $ | 64,583 |
| | $ | — |
|
| Pending deal costs | | 62,867 |
| | 7,048 |
|
| Notes receivable, net | | 48,932 |
| | 38,418 |
|
| Prepaid expenses | | 27,595 |
| | 5,361 |
|
| Manufactured homes | | 26,711 |
| | 69,217 |
|
| Other | | 14,955 |
| | 13,953 |
|
| Investment-related reserves and deposits | | 14,624 |
| | 11,127 |
|
| Deferred tax asset | | 7,730 |
| | — |
|
| Furniture, fixtures and equipment, net | | — |
| (1) | 6,977 |
|
| Total | | $ | 267,997 |
| | $ | 152,101 |
|
| | | | | |
| | | December 31, |
| | | 2014 | | 2013 |
| Other liabilities: | |
| | |
| Below-market leases | | $ | 169,371 |
| | $ | 8,700 |
|
| PE Investment III deferred purchase price (refer to Note 6) | | 39,759 |
|
| 39,759 |
|
| Deferred tax liability | | 38,303 |
| | — |
|
| Tenant security deposits | | 27,854 |
| | 9,294 |
|
| Unearned revenue | | 17,668 |
| | 2,029 |
|
| Other | | 11,890 |
| | 14,092 |
|
| Total | | $ | 304,845 |
| | $ | 73,874 |
|
__________________________________________________
(1)Distributed to NSAM in connection with the spin-off.
Revenue Recognition
Operating Real Estate
Rental and escalation income from operating real estate is derived from leasing of space to various types of tenants and healthcare operators. The leases are for fixed terms of varying length and generally provide for annual rentals and expense reimbursements to be paid in monthly installments. Rental income from leases is recognized on a straight-line basis over the term of the respective leases. The excess of rents recognized over amounts contractually due pursuant to the underlying leases are included in unbilled rent receivable on the consolidated balance sheets. Escalation income represents revenue from tenant/operator leases which provide for the recovery of all or a portion of the operating expenses and real estate taxes paid by the Company on behalf of the respective property. This revenue is accrued in the same period as the expenses are incurred.
The Company generates operating income from healthcare and hotel properties under a RIDEA structure. Revenue related to healthcare properties includes resident room and care charges and other resident charges. Revenue related to operating hotel properties primarily consists of room and food and beverage sales. Revenue is recognized when such services are provided, generally defined as the date upon which a resident or guest occupies a room or uses the healthcare property or hotel services and is recorded in resident fee income for healthcare properties and hotel related income for hotel properties in the consolidated statements of operations.
Real Estate Debt Investments
Interest income is recognized on an accrual basis and any related premium, discount, origination costs and fees are amortized over the life of the investment using the effective interest method. The amortization is reflected as an adjustment to interest income in the consolidated statements of operations. The amortization of a premium or accretion of a discount is discontinued if such loan is reclassified to held for sale.
NORTHSTAR REALTY FINANCE CORP. AND SUBSIDIARIES
NOTES TO CONSOLIDATED FINANCIAL STATEMENTS (Continued)
Real Estate Securities
Interest income is recognized using the effective interest method with any premium or discount amortized or accreted through earnings based on expected cash flow through the expected maturity date of the security. Changes to expected cash flow may result in a change to the yield which is then applied retrospectively for high-credit quality securities that cannot be prepaid or otherwise settled in such a way that the holder would not recover substantially all of the investment or prospectively for all other securities to recognize interest income.
Credit Losses and Impairment on Investments
Operating Real Estate
The Company’s real estate portfolio is reviewed on a quarterly basis, or more frequently as necessary, to assess whether there are any indicators that the value of its operating real estate may be impaired or that its carrying value may not be recoverable. A property’s value is considered impaired if the Company’s estimate of the aggregate expected future undiscounted cash flow generated by the property is less than the carrying value. In conducting this review, the Company considers U.S. macroeconomic factors, real estate sector conditions and asset specific and other factors. To the extent an impairment has occurred, the loss is measured as the excess of the carrying value of the property over the estimated fair value and recorded in impairment on operating real estate in the consolidated statements of operations.
An allowance for a doubtful account for a tenant/operator receivable is established based on a periodic review of aged receivables resulting from estimated losses due to the inability of tenant/operator to make required rent and other payments contractually due. Additionally, the Company establishes, on a current basis, an allowance for future tenant/operator/resident/guest credit losses on unbilled rent receivable based on an evaluation of the collectability of such amounts.
Real Estate Debt Investments
Loans are considered impaired when based on current information and events, it is probable that the Company will not be able to collect principal and interest amounts due according to the contractual terms. The Company assesses the credit quality of the portfolio and adequacy of loan loss reserves on a quarterly basis or more frequently as necessary. Significant judgment of the Company is required in this analysis. The Company considers the estimated net recoverable value of the loan as well as other factors, including but not limited to the fair value of any collateral, the amount and the status of any senior debt, the quality and financial condition of the borrower and the competitive situation of the area where the underlying collateral is located. Because this determination is based on projections of future economic events, which are inherently subjective, the amount ultimately realized may differ materially from the carrying value as of the balance sheet date. If upon completion of the assessment, the estimated fair value of the underlying collateral is less than the net carrying value of the loan, a loan loss reserve is recorded with a corresponding charge to provision for loan losses. The loan loss reserve for each loan is maintained at a level that is determined to be adequate by management to absorb probable losses.
Income recognition is suspended for a loan at the earlier of the date at which payments become 90-days past due or when, in the opinion of the Company, a full recovery of income and principal becomes doubtful. When the ultimate collectability of the principal of an impaired loan is in doubt, all payments are applied to principal under the cost recovery method. When the ultimate collectability of the principal of an impaired loan is not in doubt, contractual interest is recorded as interest income when received, under the cash basis method until an accrual is resumed when the loan becomes contractually current and performance is demonstrated to be resumed. A loan is written off when it is no longer realizable and/or legally discharged.
Investments in Unconsolidated Ventures
The Company reviews its investments in unconsolidated ventures for which the Company did not elect the fair value option on a quarterly basis, or more frequently as necessary, to assess whether there are any indicators that the value may be impaired or that its carrying value may not be recoverable. An investment is considered impaired if the projected net recoverable amount over the expected holding period is less than the carrying value. In conducting this review, the Company considers U.S. macroeconomic factors, including real estate sector conditions, together with asset specific and other factors. To the extent an impairment has occurred and is considered to be other than temporary, the loss is measured as the excess of the carrying value of the investment over the estimated fair value and recorded in provision for loss on equity investment in the consolidated statements of operations.
NORTHSTAR REALTY FINANCE CORP. AND SUBSIDIARIES
NOTES TO CONSOLIDATED FINANCIAL STATEMENTS (Continued)
Real Estate Securities
CRE securities for which the fair value option is elected are not evaluated for other-than-temporary impairment (“OTTI”) as any change in fair value is recorded in the consolidated statements of operations. Realized losses on such securities are reclassified to realized gain (loss) on investments and other as losses occur.
CRE securities for which the fair value option is not elected are evaluated for OTTI quarterly. Impairment of a security is considered to be other-than-temporary when: (i) the holder has the intent to sell the impaired security; (ii) it is more likely than not the holder will be required to sell the security; or (iii) the holder does not expect to recover the entire amortized cost of the security. When a CRE security has been deemed to be other-than-temporarily impaired due to (i) or (ii), the security is written down to its fair value and an OTTI is recognized in the consolidated statements of operations. In the case of (iii), the security is written down to its fair value and the amount of OTTI is then bifurcated into: (a) the amount related to expected credit losses; and (b) the amount related to fair value adjustments in excess of expected credit losses. The portion of OTTI related to expected credit losses is recognized in the consolidated statements of operations. The remaining OTTI related to the valuation adjustment is recognized as a component of accumulated OCI in the consolidated statements of equity. The portion of OTTI recognized through earnings is accreted back to the amortized cost basis of the security through interest income, while amounts recognized through OCI are amortized over the life of the security with no impact on earnings. CRE securities which are not high-credit quality are considered to have an OTTI if the security has an unrealized loss and there has been an adverse change in expected cash flow. The amount of OTTI is then bifurcated as discussed above.
Troubled Debt Restructuring
CRE debt investments modified in a troubled debt restructuring (“TDR”) are modifications granting a concession to a borrower experiencing financial difficulties where a lender agrees to terms that are more favorable to the borrower than is otherwise available in the current market. Management judgment is necessary to determine whether a loan modification is considered a TDR. Troubled debt that is fully satisfied via taking title to collateral, repossession or other transfers of assets is generally included in the definition of TDR. Loans acquired as a pool with deteriorated credit quality that have been modified are not considered a TDR.
Derivatives
Derivatives are used to manage exposure to interest rate risk and foreign currency exchange rate risk. For derivatives that qualify as cash flow hedges, the effective portion of changes in fair value of derivatives designated as a hedge is recorded in accumulated OCI and is subsequently reclassified into income in the period that the hedged item affects income. Amounts reported in OCI that relate to the hedge of the Company’s floating-rate borrowings are reclassified to interest expense as interest payments are made on associated borrowings.
The change in fair value for derivatives that do not qualify as a hedge for U.S. GAAP is recorded in earnings. When the Company elected the fair value option for certain of its borrowings, any derivatives designated as a qualifying hedge at the time no longer qualified for hedge accounting given that the underlying borrowing will be remeasured with changes in the fair value recorded in earnings. For such derivatives, the unrealized gain (loss) at that time will remain in accumulated OCI and will be reclassified into earnings over the life of the associated borrowing.
Exchangeable Senior Notes
The proceeds from exchangeable senior notes that may be settled in cash at the option of the issuer, including partial cash settlements, must be bifurcated between a liability component and an equity component associated with the embedded conversion option. The liability component is calculated based on the present value of the contractual cash flow discounted at a comparable market conventional borrowing rate at the date of issuance. The difference between the principal amount and the fair value of the liability component is reported as a discount on the exchangeable senior notes and is accreted as additional interest expense to the contractual maturity using the effective interest method. The equity component is calculated based on the difference between the proceeds received and the fair value of the liability component at the issuance date. The equity component is recorded in additional paid-in-capital, net of issuance costs, on the consolidated balance sheets. Issuance costs related to exchangeable senior notes is allocated between the liability and the equity components based on their relative values.
Equity-Based Compensation
The Company accounts for equity-based compensation awards, including awards granted to co-employees, using the fair value method, which requires an estimate of fair value of the award. Awards may be based on a variety of measures such as time, performance, market or a combination thereof. For time-based awards, fair value is determined based on the stock price on the
NORTHSTAR REALTY FINANCE CORP. AND SUBSIDIARIES
NOTES TO CONSOLIDATED FINANCIAL STATEMENTS (Continued)
grant date. The Company recognizes compensation expense over the vesting period on a straight-line basis. For performance-based awards, fair value is determined based on the stock price at the date of grant and an estimate of the probable achievement of such measure. The Company recognizes compensation expense over the requisite service period, net of estimated forfeitures, using the accelerated attribution expense method. For market-based measures, fair value is determined using a Monte Carlo analysis under a risk-neutral premise using a risk-free interest rate. The Company recognizes compensation expense, over the requisite service period, net of estimated forfeitures, on a straight-line basis.
For awards with a combination of performance or market measures, the Company estimates the fair value as if it were two separate awards. First, the Company estimates the probability of achieving the performance measure. If it is not probable the performance condition will be met, the Company records the compensation expense based on the fair value of the market measure, as described above. This expense is recorded even if the market-based measure is never met. If the performance-based measure is subsequently estimated to be achieved, the Company records compensation expense based on the performance-based measure. The Company would then record a cumulative catch-up adjustment for any additional compensation expense.
Equity-based compensation issued to non-employees is accounted for using the fair value of the award at the earlier of the performance commitment date or performance completion date. The awards are remeasured every quarter based on the stock price as of the end of the reporting period until such awards vest, if any.
Foreign Currency
Assets and liabilities denominated in a foreign currency for which the functional currency is a foreign currency are translated using the currency exchange rate in effect at the end of the period presented and the results of operations for such entities are translated into U.S. dollars using the average currency exchange rate in effect during the period. The resulting foreign currency translation adjustment is recorded as a component of accumulated OCI in the consolidated statements of equity.
Assets and liabilities denominated in a foreign currency for which the functional currency is the U.S. dollar are remeasured using the currency exchange rate in effect at the end of the period presented and the results of operations for such entities are remeasured into U.S. dollars using the average currency exchange rate in effect during the period. The resulting foreign currency remeasurement adjustment is recorded in unrealized gain (loss) on investments and other in the consolidated statements of operations.
Earnings Per Share
The Company’s basic earnings per share (“EPS”) is calculated by dividing net income (loss) attributable to common stockholders by the weighted average number of common stock outstanding. Diluted EPS includes restricted stock and the potential dilution that could occur if outstanding restricted stock units (“RSUs”) or other contracts to issue common stock, assuming performance hurdles have been met, were converted to common stock, including Deferred LTIP Units (refer to Note 12), where such exercise or conversion would result in a lower EPS. The dilutive effect of such RSUs and Deferred LTIP Units is calculated assuming all units are converted to common stock.
Income Taxes
The Company has elected to be taxed as a REIT and to comply with the related provisions of the Internal Revenue Code of 1986, as amended, the (“Code”). Accordingly, the Company generally will not be subject to U.S. federal income tax to the extent of its distributions to stockholders and as long as certain asset, income and share ownership tests are met. To maintain its qualification as a REIT, the Company must annually distribute at least 90% of its REIT taxable income to its stockholders and meet certain other requirements. The Company may also be subject to certain state, local and franchise taxes. Under certain circumstances, federal income and excise taxes may be due on its undistributed taxable income. If the Company were to fail to meet these requirements, it would be subject to U.S. federal income tax, which could have a material adverse impact on its results of operations and amounts available for distributions to its stockholders. The Company believes that all of the criteria to maintain the Company’s REIT qualification have been met for the applicable periods, but there can be no assurance that these criteria will continue to be met in subsequent periods.
The Company maintains various taxable REIT subsidiaries (“TRSs”) which may be subject to U.S. federal, state and local income taxes and foreign taxes. In general, a TRS of the Company may perform non-customary services for tenants of the Company, hold assets that the Company cannot hold directly and may engage in any real estate or non-real estate-related business. A TRS is subject to regular corporate income tax. The Company has established several TRSs in jurisdictions for which no taxes are assessed on corporate earnings. However, the Company must include in earnings the income from these TRSs even if it has received no cash distributions.
NORTHSTAR REALTY FINANCE CORP. AND SUBSIDIARIES
NOTES TO CONSOLIDATED FINANCIAL STATEMENTS (Continued)
Current and deferred taxes are provided on the portion of earnings (losses) recognized by the Company with respect to its interest in domestic TRSs. Deferred income tax assets and liabilities are calculated based on temporary differences between the Company’s U.S. GAAP consolidated financial statements and the federal and state income tax basis of assets and liabilities as of the consolidated balance sheet date. The Company evaluates the realizability of its deferred tax assets (e.g., net operating loss and capital loss carryforwards) and recognizes a valuation allowance if, based on the available evidence, it is more likely than not that some portion or all of its deferred tax assets will not be realized. When evaluating the realizability of its deferred tax assets, the Company considers estimates of expected future taxable income, existing and projected book/tax differences, tax planning strategies available and the general and industry specific economic outlook. This realizability analysis is inherently subjective, as it requires the Company to forecast its business and general economic environment in future periods. Changes in estimate of deferred tax asset realizability, if any, are included in provision for income tax expense included in other expenses in the consolidated statements of operations. As of December 31, 2014, the Company recorded a $7.7 million deferred tax asset primarily related to net operating losses related to the Company’s hotel and healthcare RIDEA properties. As of December 31, 2014, the Company recorded a deferred tax liability of $38.3 million related to foreign income tax associated with the acquisition of the UK properties in the Griffin-American acquisition which was treated as a tax-free transaction resulting in a carry-over basis in assets and liabilities. The Company recorded all of the acquired assets and liabilities associated with such portfolio at the estimated fair value and recognized the deferred tax liability representing the tax effect of the difference between the tax basis carried over and the fair value of the assets at the date of acquisition.
From time-to-time, the Company’s TRSs generate taxable income from intercompany transactions. The TRS entities generate taxable revenue from fees for services provided to the Company’s various lines of business. Certain entities may be consolidated in the Company’s financial statements. In consolidation, these fees are eliminated when the entity is included in the consolidated group. Nonetheless, all income taxes are accrued by the TRS in the year in which the taxable revenue is received. These income taxes are not eliminated when the related revenue is eliminated in consolidation.
Certain TRS entities are domiciled in non-U.S. jurisdictions and, accordingly, taxable income generated by these entities may not be subject to local income taxation, but generally are included in the Company’s taxable income on a current basis, whether or not distributed. Upon distribution of any previously included income, no incremental U.S. federal, state or local income taxes would be payable by the Company.
The TRS entities may be subject to tax laws that are complex and potentially subject to different interpretations by the taxpayer and the relevant governmental taxing authorities. In establishing a provision for income tax expense, the Company must make judgments and interpretations about the application of these inherently complex tax laws. Actual income taxes paid may vary from estimates depending upon changes in income tax laws, actual results of operations and the final audit of tax returns by taxing authorities. Tax assessments may arise several years after tax returns have been filed. The Company reviews the tax balances of its TRS entities quarterly and as new information becomes available, the balances are adjusted as appropriate.
The Company recorded an income tax benefit of $0.2 million for the year ended December 31, 2014 and a provision for income tax of $1.0 million for the year ended December 31, 2013. The Company recorded an immaterial amount of income tax for the year ended December 31, 2012.
The Company has assessed its tax positions for all open tax years, which includes 2011 to 2014 and concluded there were no material uncertainties to be recognized. The Company’s accounting policy with respect to interest and penalties is to classify these amounts as interest expense. The Company has not recognized any such amounts related to uncertain tax positions for the years ended December 31, 2014, 2013 and 2012.
Recent Accounting Pronouncements
In April 2014, the Financial Accounting Standards Board (“FASB”) issued an accounting update that changes the requirements for reporting discontinued operations. A discontinued operation may include a component of an entity or a group of components of an entity or a business. A disposal of a component of an entity or a group of components of an entity is required to be reported in discontinued operations if the disposal represents a strategic shift that has (or will have) a major effect on an entity’s operations and financial results. The requirements of this accounting update will be effective for the Company for the annual period beginning after December 15, 2014, however, early adoption is permitted but only for disposals or classifications as held for sale that have not been reported in financial statements previously issued or available for issue. The Company early adopted this accounting pronouncement effective January 1, 2014 and the update did not have a material impact on the consolidated financial statements.
In May 2014, the FASB issued an accounting update requiring a company to recognize as revenue the amount of consideration it expects to be entitled to in connection with the transfer of promised goods or services to customers. When it becomes
NORTHSTAR REALTY FINANCE CORP. AND SUBSIDIARIES
NOTES TO CONSOLIDATED FINANCIAL STATEMENTS (Continued)
effective on January 1, 2017, the accounting standard update will replace most of the existing revenue recognition guidance currently promulgated by U.S. GAAP. The Company is in the process of evaluating the impact, if any, of the update on its consolidated financial statements and related disclosures.
In February 2015, the FASB issued updated guidance that changes the rules regarding consolidation. The pronouncement eliminates specialized guidance for limited partnerships and similar legal entities and removes the indefinite deferral for certain investment funds. The new guidance is effective for annual periods and interim periods within those annual periods beginning after December 15, 2015, with early adoption permitted. The Company is currently assessing the impact of the guidance on the Company’s consolidated financial position, results of operations and financial statement disclosures.
| |
| 3. | Variable Interest Entities |
As of December 31, 2014, the Company has identified the following consolidated and unconsolidated VIEs.
CDO Financing Transactions
The Company sponsored nine CDOs, three of which were primarily collateralized by CRE debt and six of which were primarily collateralized by CRE securities. The Company acquired equity interests of two CRE debt focused CDOs, the CSE RE 2006-A CDO (“CSE CDO”) and the CapLease 2005-1 CDO (“CapLease CDO”). In the case of the CSE CDO, the Company was delegated the collateral management and special servicing rights, and for the CapLease CDO, the Company acquired the collateral management rights. These CDOs are collectively referred to as the N-Star CDOs and their assets are referred to as legacy investments. All N-Star CDOs are considered VIEs. At the time of issuance of the sponsored CDOs, the Company retained the below investment grade bonds, which are referred to as subordinate bonds, and preferred shares and equity notes, which are referred to as equity interests. In addition, the Company repurchased CDO bonds originally issued to third parties at discounts to par. These repurchased CDO bonds and retained subordinate bonds are herein collectively referred to as N-Star CDO bonds.
The collateral for the CRE debt CDO financing transactions primarily includes first mortgage loans, subordinate interests, mezzanine loans, credit tenant loans and other loans. The collateral for the CDO financing transactions primarily collateralized by CRE securities includes commercial mortgage-backed securities (“CMBS”), unsecured REIT debt and CDO notes backed primarily by CRE securities and debt. Assets of each of the VIEs may only be used to settle obligations of the respective VIE. Creditors of each of the VIEs have no recourse to the general credit of the Company.
Consolidated N-Star CDOs
As of December 31, 2014, the Company serves as collateral manager and/or special servicer for N-Star CDOs I and IX which are primarily collateralized by CRE securities. The Company consolidates these entities as the Company has the power to direct the activities that most significantly impact the economic performance of these CDOs, and therefore, continues to be the primary beneficiary.
The Company is not contractually required to provide financial support to any of these consolidated VIEs, however, the Company, in its capacity as collateral manager and/or special servicer, may in its sole discretion provide support such as protective and other advances it deems appropriate. The Company did not provide any other financial support to any of its consolidated VIEs for the years ended December 31, 2014 and 2013.
Unconsolidated N-Star CDOs
The Company delegated the collateral management rights for N-Star CDOs IV, VI and VIII and the CapLease CDO on September 30, 2013 and the CSE CDO on December 31, 2013 to a third-party collateral manager/collateral manager delegate who is entitled to a percentage of the senior and subordinate collateral management fees. The Company continues to receive fees as named collateral manager or collateral manager delegate and retained administrative responsibilities. The Company evaluated the fees paid to the third-party collateral manager/collateral manager delegate and concluded that such fees represented a variable interest in the deconsolidated loan CDOs and that the third party was functioning as a principal. The Company determined that the delegation of the Company’s collateral management power in the CDOs was a VIE reconsideration event and concluded that these CDOs were still VIEs as the equity investors do not have the characteristics of a controlling financial interest. The Company then reconsidered if it was the primary beneficiary of such VIEs and determined that it no longer has the power to direct the activities that most significantly impact the economic performance of these CDOs, which includes but is not limited to selling collateral, and therefore is no longer the primary beneficiary of such CDOs. As a
NORTHSTAR REALTY FINANCE CORP. AND SUBSIDIARIES
NOTES TO CONSOLIDATED FINANCIAL STATEMENTS (Continued)
result, the Company deconsolidated the assets and liabilities for N-Star CDOs IV, VI and VIII and the CapLease CDO on September 30, 2013 and the CSE CDO on December 31, 2013.
In March 2014, the Company determined it no longer had the power to direct the activities that most significantly impact the economic performance of N-Star CDO V due to the ability of a single party to remove the Company as collateral manager as a result of an existing event of default. The Company was no longer the primary beneficiary of N-Star CDO V, and as a result, in the first quarter 2014, the Company deconsolidated the assets and liabilities of this CDO.
In May 2014, the Company determined it no longer had the power to direct the activities that most significantly impact the economic performance of N-Star CDO III due to the ability of a single party to remove the Company as collateral manager as a result of an existing event of default. The Company was no longer the primary beneficiary of N-Star CDO III, and as a result, in the second quarter 2014, the Company deconsolidated the assets and liabilities of this CDO.
Similar events of default in the future, if they occur, could cause the Company to deconsolidate additional CDO financing transactions.
For the year ended December 31, 2014, the deconsolidation of N-Star CDOs III and V resulted in an aggregate non-cash realized loss on deconsolidation of $31.4 million recorded in the consolidated statement of operations, which was the result of the deconsolidation of an aggregate $192.5 million of assets, $149.0 million of liabilities, net of $8.8 million of fair value of N-Star CDO bonds recorded that no longer eliminated in consolidation and the reclassification of $3.3 million of unrealized gain to loss from deconsolidation.
For the year ended December 31, 2013, the deconsolidation of N-Star CDOs IV, VI, VIII and CapLease CDO resulted in an aggregate non-cash realized loss on deconsolidation of $299.8 million recorded in the consolidated statement of operations, which was the result of the deconsolidation of an aggregate $1.8 billion of assets, $1.4 billion of liabilities, net of $223.7 million of fair value of N-Star CDO bonds and equity recorded that no longer eliminated in consolidation and the reclassification of $3.3 million of unrealized gain and $15.2 million of OCI swap loss to loss from deconsolidation.
Other Unconsolidated VIEs
Based on management’s analysis, the Company is not the primary beneficiary of the VIEs summarized below and as such, these VIEs are not consolidated into the Company’s financial statements as of December 31, 2014. These unconsolidated VIEs are summarized as follows:
Real Estate Debt Investments
The Company identified three CRE debt investments with an aggregate carrying value of $74.1 million as variable interests in a VIE. The Company determined that it is not the primary beneficiary of such VIEs, and as such, the VIEs are not consolidated in the Company’s financial statements. For all other CRE debt investments, the Company determined that these investments are not VIEs and, as such, the Company continues to account for all CRE debt investments as loans.
Real Estate Securities
The Company identified two CRE securities with an aggregate fair value of $38.8 million as variable interests in VIEs. In connection with certain CMBS investments, the Company became the controlling class and/or was named directing certificate holder of a securitization it did not sponsor. For one of these securitizations, an affiliate of NSAM was appointed as special servicer. The special servicing business for certain securitizations was transferred to NSAM in connection with the spin-off. The Company determined each securitization was a VIE. However, the Company determined at that time and continues to believe that it does not currently or potentially hold a significant interest in any of these securitizations and, therefore, is not the primary beneficiary.
NorthStar Realty Finance Trusts
The Company owns all of the common stock of NorthStar Realty Finance Trusts I through VIII (collectively, the “Trusts”). The Trusts were formed to issue trust preferred securities. The Company determined that the holders of the trust preferred securities were the primary beneficiaries of the Trusts. As a result, the Company did not consolidate the Trusts and has accounted for the investment in the common stock of the Trusts under the equity method. As of December 31, 2014, the Company’s carrying value and maximum exposure to loss related to its investment in the Trusts is $3.7 million and is recorded in investments in unconsolidated ventures on the consolidated balance sheets.
NORTHSTAR REALTY FINANCE CORP. AND SUBSIDIARIES
NOTES TO CONSOLIDATED FINANCIAL STATEMENTS (Continued)
Summary of Unconsolidated VIEs
The following table presents the classification, carrying value and maximum exposure of unconsolidated VIEs as of December 31, 2014 (dollars in thousands):
|
| | | | | | | | | | | | | | | | | | | |
| Junior Subordinated Notes, at Fair Value |
| Real Estate Debt Investments, Net | | Real Estate Securities, Available for Sale |
| Total | | Maximum Exposure to Loss(1) |
| Real estate debt investments, net | $ | — |
| | $ | 74,070 |
| | $ | — |
| | $ | 74,070 |
| | $ | 74,070 |
|
| Investments in unconsolidated ventures | 3,742 |
| | — |
| | — |
| | 3,742 |
| | 3,742 |
|
| Real estate securities, available for sale: | | | | | | | | | |
| N-Star CDO bonds | — |
| | — |
| | 262,309 |
| | 262,309 |
| | 262,309 |
|
| N-Star CDO equity | — |
| | — |
| | 102,467 |
| | 102,467 |
| | 102,467 |
|
| CMBS | — |
| | — |
| | 38,823 |
| | 38,823 |
| | 38,823 |
|
| Subtotal real estate securities, available for sale | — |
| | — |
| | 403,599 |
| | 403,599 |
| | 403,599 |
|
| Total assets | 3,742 |
| | 74,070 |
| | 403,599 |
| | 481,411 |
| | 481,411 |
|
| Junior subordinated notes, at fair value | 215,172 |
| | — |
| | — |
| | 215,172 |
| | NA |
|
| Total liabilities | 215,172 |
| | — |
| | — |
| | 215,172 |
| | NA |
|
| Net | $ | (211,430 | ) | | $ | 74,070 |
| | $ | 403,599 |
| | $ | 266,239 |
| | $ | 481,411 |
|
____________________________________________________________
| |
| (1) | The Company’s maximum exposure to loss as of December 31, 2014 would not exceed the carrying value of its investment. |
The Company is not contractually required to provide financial support to any of its unconsolidated VIEs during the years ended December 31, 2014 and 2013 however, the Company, in its capacity as collateral manager/collateral manager delegate and/or special servicer of the deconsolidated CDOs, may in its sole discretion provide support such as protective and other advances it deems appropriate. As of December 31, 2014, there were no explicit arrangements or implicit variable interests that could require the Company to provide financial support to any of its unconsolidated VIEs.
The following table presents operating real estate, net as of December 31, 2014 and 2013 (dollars in thousands):
|
| | | | | | | | |
| | | December 31, |
| | | 2014 | | 2013 |
| Land | | $ | 1,490,613 |
| | $ | 461,133 |
|
| Land improvements | | 1,070,507 |
| | 1,003,069 |
|
| Buildings and improvements | | 7,008,856 |
| | 1,010,514 |
|
| Building leasehold interests and improvements | | 591,626 |
| | 38,560 |
|
| Furniture, fixtures and equipment | | 286,340 |
| | 15,415 |
|
| Tenant improvements | | 159,159 |
| | 31,811 |
|
| Construction in progress | | 17,054 |
| | 678 |
|
Subtotal(1) | | 10,624,155 |
| | 2,561,180 |
|
| Less: Accumulated depreciation | | (349,574 | ) | | (190,997 | ) |
Operating real estate, net(2) | | $ | 10,274,581 |
| | $ | 2,370,183 |
|
__________________
| |
| (1) | As of December 31, 2014 and 2013, includes $7.3 million and $4.9 million of REO, respectively. |
| |
| (2) | As of December 31, 2014 and 2013, operating real estate was subject to $8.5 billion and $2.1 billion of mortgage notes payable, respectively. |
For the years ended December 31, 2014, 2013 and 2012, depreciation expense was $164.9 million, $76.1 million and $33.3 million, respectively.
Real Estate Acquisitions
The following table summarizes the Company’s acquisitions for the year ended December 31, 2014 (dollars in millions): |
| | | | | | | | | | | | | | | | | | | | | | | | | | | |
| Acquisition Date | | Type | | Description | | Name | | Purchase Price(1) | | Properties | | Financing | | Equity | | Ownership Interest | | Transaction Costs |
| May 2014 | | Healthcare | | Senior housing and skilled nursing facilities | | Formation Portfolio | | $ | 1,054.7 |
| | 80 | | $ | 646.8 |
| | $ | 357.6 |
| | 86.0 | % | (2) | $ | 6.0 |
|
| May 2014 | | Manufactured Housing | | Manufactured housing communities | | Manufactured Housing Portfolio 3 | | 55.2 |
| | 4 | | 16.5 |
| | 34.5 |
| | 93.0 | % | (3) | 3.1 |
|
| June 2014 - November 2014 | | Hotel | | Upscale extended stay and premium branded select service | | Hotel Portfolios(4) | | 3,052.5 |
| | 155 | | 2,380.7 |
| | 667.3 |
| | 90.0% to 100.0% |
| (5) | 53.8 |
|
| August 2014 - November 2014 | | Net Lease and Office | | Industrial properties and multi-tenant office | | Other Portfolios(6) | | 588.0 |
| | 46 | | 344.4 |
| | 214.1 |
| | 40.0% to 95.0% |
| (7) | 7.8 |
|
| December 2014 | | Healthcare | | Medical office buildings and senior housing facilities | | Griffin-American Portfolio | | 4,458.7 |
| | 296 | | 2,991.8 |
| | 1,122.5 |
| | 85.7 | % | (8) | 72.9 |
|
| Total | | | | | | | | $ | 9,209.1 |
| | 581 | | $ | 6,380.2 |
| | $ | 2,396.0 |
| | | | $ | 143.6 |
|
| |
| (1) | Includes escrows and reserves and excludes transaction costs. |
| |
| (2) | The Company acquired the Formation Portfolio through a general partnership with a subsidiary of NorthStar Healthcare and a joint venture with an affiliate of Formation Capital, LLC. The Company together with NorthStar Healthcare owns an aggregate approximate 92% interest in the joint venture. |
| |
| (3) | Represents four of the 16 communities in Manufactured Housing Portfolio 3 acquired in May 2014. Previously, 12 communities were acquired in connection with this portfolio in December 2013. The Company structured the acquisition as a joint venture with the same third-party operating partner that currently manages the Company’s other manufactured housing portfolios. |
| |
| (4) | Includes a $1.0 billion hotel portfolio acquired in June 2014 (“Innkeepers Portfolio”), a $259.3 million hotel portfolio acquired in August 2014 (“K Partners Portfolio”), a $678.8 million hotel portfolio acquired in September 2014 (“Courtyard Portfolio”) and a $1.1 billion hotel portfolio acquired in November 2014 (“Inland Portfolio”). |
| |
| (5) | The Company acquired the Innkeepers and Inland portfolios through a joint venture with Chatham Lodging Trust (NYSE: CLDT). In connection with the K Partners portfolio acquisition, the Company entered into a guaranty agreement with Marriott, pursuant to which the Company guaranteed to pay up to $8.4 million in franchise fees and other related charges. |
| |
| (6) | Includes a $413.8 million industrial portfolio acquired in August 2014 (“Industrial Portfolio”), a $74.8 million multi-tenant office portfolio acquired in September - November 2014 (“Legacy Properties”) and a $99.5 million UK office property acquired in September 2014 (“UK Property”) |
| |
| (7) | The Company has a 40% equity interest and is entitled to 50% of the cash flow of the Industrial Portfolio, it also includes $153.0 million structured as preferred equity, which is eliminated in consolidation. |
| |
| (8) | NorthStar Healthcare acquired a 14.3% equity interest in the Griffin-American Portfolio for $187.2 million in cash, including its share of transaction costs. |
The following table presents the initial allocation of the purchase price of the assets acquired and the liabilities issued or assumed upon the closing of the following portfolios that continue to be subject to refinement upon receipt of all information (dollars in thousands):
|
| | | | | | | | | | | | |
| | | Griffin-American Portfolio(1) | | Hotel Portfolios 1(2)(3) | | UK Property(3) |
| Assets: | | | | | | |
| Land and improvements | | $ | 375,978 |
| | $ | 156,794 |
| | $ | 17,946 |
|
| Buildings, leasehold interests and improvements | | 3,310,186 |
| | 652,625 |
| | 71,863 |
|
Acquired intangibles (4) | | 462,045 |
| | 2,076 |
| | — |
|
| Other assets acquired | | 310,491 |
| | 126,621 |
| | 9,687 |
|
| Total assets acquired | | $ | 4,458,700 |
| | $ | 938,116 |
| | $ | 99,496 |
|
| | | | | | | |
| Liabilities: | | | | | | |
| Mortgage notes payable | | $ | 2,991,841 |
| | $ | 723,682 |
| | $ | 77,660 |
|
Other liabilities assumed (5) | | 229,624 |
| | 2,389 |
| | — |
|
| Total liabilities | | 3,221,465 |
| | 726,071 |
| | 77,660 |
|
Total NorthStar Realty Finance Corp. stockholders’ equity(6) | | 1,049,818 |
| | 210,721 |
| | 20,097 |
|
| Non-controlling interests | | 187,417 |
| | 1,324 |
| | 1,739 |
|
| Total equity | | 1,237,235 |
| | 212,045 |
| | 21,836 |
|
| Total liabilities and equity | | $ | 4,458,700 |
| | $ | 938,116 |
| | $ | 99,496 |
|
______________________________________
| |
| (1) | For the year ended December 31, 2014, the Company recorded revenue and net loss related to the Griffin-American Portfolio of $31.2 million and $69.3 million, respectively. Net loss is primarily related to transaction costs. |
| |
| (2) | Includes the K Partners Portfolio and the Courtyard Portfolio. |
| |
| (3) | For the year ended December 31, 2014, the Company recorded aggregate revenue and net loss of $72.7 million and $15.6 million, respectively. Net loss is primarily related to transaction costs, depreciation and amortization. |
| |
| (4) | Acquired intangibles includes in-place leases, above-market leases, certificates of need, goodwill and franchise costs. |
| |
| (5) | Other liabilities assumed includes below-market lease intangibles and deferred tax liabilities. |
NORTHSTAR REALTY FINANCE CORP. AND SUBSIDIARIES
NOTES TO CONSOLIDATED FINANCIAL STATEMENTS (Continued)
| |
| (6) | Stockholders’ equity excludes transaction costs incurred in connection with the acquisitions. |
The following table presents the final allocation of the purchase price of the assets acquired and liabilities issued upon the closing of the following portfolios (dollars in thousands):
|
| | | | | | | | |
| | | Hotel Portfolios 2(1)(2) | | Other Portfolios(2)(3) |
| Assets: | | | | |
| Land and improvements | | $ | 303,966 |
| | $ | 568,556 |
|
| Buildings and improvements | | 1,453,020 |
| | 1,117,693 |
|
Acquired intangibles (4) | | 22,710 |
| | 159,467 |
|
| Other assets acquired | | 334,664 |
| | 121,062 |
|
| Total assets acquired | | $ | 2,114,360 |
| | $ | 1,966,778 |
|
| | | | | |
| Liabilities: | | | | |
| Mortgage notes payable | | $ | 1,657,000 |
| | $ | 1,169,458 |
|
Other liabilities assumed (5) | | 5,116 |
| | 51,906 |
|
| Total liabilities | | 1,662,116 |
| | 1,221,364 |
|
| Total NorthStar Realty Finance Corp. stockholders’ equity | | 402,195 |
| | 660,518 |
|
| Non-controlling interests | | 50,049 |
| | 84,896 |
|
| Total equity | | 452,244 |
| | 745,414 |
|
| Total liabilities and equity | | $ | 2,114,360 |
| | $ | 1,966,778 |
|
______________________________________
| |
| (1) | Includes the Innkeepers Portfolio and the Inland Portfolio. |
| |
| (2) | For the year ended December 31, 2014, the Company recorded aggregate revenue and net loss of $321.0 million and $40.8 million, respectively. Net loss is primarily related to transaction costs. |
| |
| (3) | Includes the Formation Portfolio, the Manufactured Housing Portfolio 3, the Industrial Portfolio and the Legacy Properties. |
| |
| (4) | Acquired intangibles includes in-place leases, above-market leases, certificates of need, goodwill and franchise costs. |
| |
| (5) | Other liabilities assumed includes below-market debt and below-market lease intangibles. |
The following table presents unaudited consolidated pro forma results of operations based on the Company’s historical financial statements and adjusted for the acquisition of the Griffin-American Portfolio and related borrowings as if it occurred on January 1, 2013. The unaudited pro forma amounts were prepared for comparative purposes only and are not indicative of what actual consolidated results of operations of the Company would have been, nor are they indicative of the consolidated results of operations in the future, and exclude transaction costs (dollars in thousands, except per share data):
|
| | | | | | | |
| | Years Ended December 31, |
| | 2014 | | 2013 |
| Pro forma total revenues | $ | 1,340,046 |
| | $ | 749,568 |
|
| Pro forma net income (loss) attributable to NorthStar Realty Finance Corp. common stockholders | $ | (404,626 | ) | | $ | (239,693 | ) |
| Pro forma EPS—Basic | $ | (2.06 | ) | | $ | (1.44 | ) |
| Pro forma EPS—Diluted | $ | (2.06 | ) | | $ | (1.44 | ) |
The following table presents unaudited consolidated pro forma results of operations based on the Company’s historical financial statements and adjusted for the following acquisitions: the Hotel Portfolios, the Formation Portfolio, Manufactured Housing Portfolio 3, the Industrial Portfolio, the Legacy Properties and UK Property and related borrowings as if it occurred on January 1, 2013. The unaudited pro forma amounts were prepared for comparative purposes only and are not indicative of what actual consolidated results of operations of the Company would have been, nor are they indicative of the consolidated results of operations in the future, and exclude transaction costs (dollars in thousands, except per share data):
|
| | | | | | | |
| | Years Ended December 31, |
| | 2014 | | 2013 |
| Pro forma total revenues | $ | 1,542,183 |
| | $ | 1,378,723 |
|
| Pro forma net income (loss) attributable to NorthStar Realty Finance Corp. common stockholders | $ | (351,603 | ) | | $ | (136,771 | ) |
| Pro forma EPS—Basic | $ | (1.79 | ) | | $ | (1.29 | ) |
| Pro forma EPS—Diluted | $ | (1.79 | ) | | $ | (1.29 | ) |
NORTHSTAR REALTY FINANCE CORP. AND SUBSIDIARIES
NOTES TO CONSOLIDATED FINANCIAL STATEMENTS (Continued)
Discontinued Operations
Discontinued operations relates to five healthcare properties held for sale or sold as of December 31, 2014 and 2013 and a multifamily property and an office property sold in 2012. The following table presents income (loss) from discontinued operations related to such properties for the years ended December 31, 2014, 2013 and 2012 (dollars in thousands):
|
| | | | | | | | | | | | |
| | Years Ended December 31, | |
| | 2014 | | 2013 | | 2012 | |
| Revenue | | | | | | |
| Rental and escalation income | $ | — |
| | $ | 3,736 |
| | $ | 7,202 |
| |
| Other revenue | 85 |
| | 92 |
| | — |
| |
| Total revenue | 85 |
| | 3,828 |
| | 7,202 |
| |
| Expenses | | | | | | |
| Other interest expense | — |
| | 1,893 |
| | 1,934 |
| |
| Real estate properties—operating expenses | 383 |
| | 34 |
| | 1,580 |
| |
| Other expenses | 72 |
| | 195 |
| | 66 |
| |
| Impairment of operating real estate | 555 |
|
| 8,613 |
| | 966 |
| |
| Other general and administrative expenses | — |
| | 79 |
| | 1,076 |
| |
| Depreciation and amortization | — |
| | 1,370 |
| | 1,708 |
| |
| Total expenses | 1,010 |
| | 12,184 |
| | 7,330 |
| |
| Income (loss) from operating real estate discontinued operations | (925 | ) | | (8,356 | ) | | (128 | ) | |
| Gain(loss) on sale from discontinued operations | — |
| | — |
| | 2,079 |
| (1) |
| Total Income (loss) from operating real estate discontinued operations | $ | (925 | ) | | $ | (8,356 | ) | | $ | 1,951 |
| |
______________________________________
| |
| (1) | Relates primarily to the sale of a multifamily property and an office property. |
NORTHSTAR REALTY FINANCE CORP. AND SUBSIDIARIES
NOTES TO CONSOLIDATED FINANCIAL STATEMENTS (Continued)
5. Real Estate Debt Investments
The following table presents CRE debt investments as of December 31, 2014, excluding CRE debt underlying deconsolidated N-Star CDOs (dollars in thousands):
|
| | | | | | | | | | | | | | | | | | | | | | | | | |
| | | | | | | | | | Weighted Average(8) | | Floating Rate
as % of
Principal Amount(7) |
| | Number | | Principal
Amount | | Carrying
Value(6) | | Allocation by
Investment
Type(7) | | Fixed Rate | | Spread
Over
LIBOR(9) | | Yield(10) | |
| Asset Type: | | | | | | | | | | | | | | | |
First mortgage loans(1)(2) | 13 |
| | $ | 434,671 |
| | $ | 313,590 |
| | 36.6 | % | | 9.51 | % | | 6.66 | % | | 9.34 | % | | 57.2 | % |
| Mezzanine loans | 8 |
| | 149,816 |
| | 146,088 |
| | 12.6 | % | | 13.79 | % | | 13.83 | % | | 14.05 | % | | 53.3 | % |
| Subordinate interests | 8 |
| | 201,564 |
| | 200,237 |
| | 17.0 | % | | 13.11 | % | | 12.33 | % | | 13.01 | % | | 40.7 | % |
Corporate loans (3)(4) | 8 |
| | 360,343 |
| | 382,427 |
| | 30.3 | % | | 12.37 | % | | — |
| | 12.99 | % | | — |
|
Subtotal/Weighted average(5) | 37 |
| | 1,146,394 |
| | 1,042,342 |
| | 96.5 | % | | 11.89 | % | | 9.15 | % | | 12.00 | % | | 35.6 | % |
| CRE debt in N-Star CDOs | | | | | | |
|
| | | | | | | | |
| First mortgage loans | 2 |
| | 26,957 |
| | 11,360 |
| | 2.3 | % | | — |
| | 1.27 | % | | 3.08 | % | | 100.0 | % |
| Mezzanine loans | 1 |
| | 11,000 |
| | 11,000 |
| | 0.9 | % | | 8.00 | % | | — |
| | 8.00 | % | | — |
|
| Corporate loans | 6 |
| | 2,965 |
| | 2,965 |
| | 0.3 | % | | 6.74 | % | | — |
| | 6.74 | % | | — |
|
| Subtotal/Weighted average | 9 |
| | 40,922 |
| | 25,325 |
| | 3.5 | % | | 7.73 | % | | 1.27 | % | | 5.64 | % | | 65.9 | % |
| Total | 46 |
| | $ | 1,187,316 |
|
| $ | 1,067,667 |
| | 100.0 | % | | 11.82 | % | | 8.65 | % | | 11.85 | % | | 36.7 | % |
____________________________________________________________
| |
| (1) | Includes a Sterling denominated loan of £66.7 million, of which £16.1 million is outstanding as of December 31, 2014. This loan has various maturity dates depending upon the timing of advances; however, will be no later than March 2022. |
| |
| (2) | Includes three loans that pursuant to certain terms and conditions which may or may not be satisfied, where the Company has an option to purchase the properties securing these loans. |
| |
| (3) | Includes $112.0 million of preferred equity investments for which the Company elected the fair value option. As of December 31, 2014, carrying value represents fair value with respect to these investments. |
| |
| (4) | Includes four revolving loans of $156.4 million, of which $60.7 million is outstanding as of December 31, 2014. |
| |
| (5) | Certain CRE debt investments serve as collateral for financing transactions including carrying value of $35.8 million for Securitization 2012-1 and $140.6 million for credit facilities. The remainder is unleveraged. Assuming that all loans that have future fundings meet the terms to qualify for such funding, the Company’s cash requirement on future fundings would be $113.4 million. |
| |
| (6) | There are no loans on non-accrual status except for one first mortgage loan acquired with deteriorated credit quality with a carrying value of $5.7 million as of December 31, 2014. Certain loans have an accrual of interest at a specified rate that may be in addition to a current rate. Such loans represent an aggregate $3.2 million carrying value where the Company does not recognize interest income on the accrual rate but does recognize interest income based on the current rate. |
| |
| (7) | Based on principal amount. |
| |
| (8) | Excludes three CRE debt investments with an aggregate principal amount of $10.7 million that were originated prior to 2008. |
| |
| (9) | $357.9 million principal amount (excluding CRE debt in N-Star CDOs) has a weighted average LIBOR floor of 0.84%. Includes one first mortgage loan with a principal amount of $6.2 million with a spread over prime rate. |
| |
| (10) | Based on initial maturity and for floating-rate debt, calculated using one-month LIBOR as of December 31, 2014, and for CRE debt with a LIBOR floor, using such floor. |
For the year ended December 31, 2014, the Company originated ten loans with an aggregate principal amount of $298.5 million. In connection with the merger of Griffin-American, the Company acquired three debt investments with an aggregate principal amount of $131.4 million as of December 31, 2014.
NORTHSTAR REALTY FINANCE CORP. AND SUBSIDIARIES
NOTES TO CONSOLIDATED FINANCIAL STATEMENTS (Continued)
The following table presents CRE debt investments as of December 31, 2013, excluding CRE debt underlying deconsolidated N-Star CDOs (dollars in thousands):
|
| | | | | | | | | | | | | | | | | | | | | | | | | |
|
|
|
|
|
|
|
|
|
| Weighted Average(6) |
| Floating Rate as % of Principal Amount(6) |
| Number |
|
| Principal Amount |
| Carrying Value(4) |
| Allocation by Investment Type(5) |
| Fixed Rate |
| Spread Over LIBOR(7) |
| Yield(8) |
|
| Asset Type: |
|
|
|
| |
|
|
|
|
|
|
|
|
|
|
|
| First mortgage loans | 15 |
| | $ | 441,750 |
| | $ | 407,202 |
| | 40.7 | % | | 10.98 | % | | 6.59 | % | | 9.90 | % | | 90.2 | % |
| Mezzanine loans | 6 |
| | 109,215 |
| | 107,116 |
| | 10.1 | % | | 13.96 | % | | 12.09 | % | | 12.97 | % | | 74.2 | % |
| Subordinate interests | 7 |
| | 146,652 |
| | 144,853 |
| | 13.5 | % | | 13.05 | % | | 12.33 | % | | 13.14 | % | | 56.0 | % |
Corporate loans(1)(2) | 5 |
| | 330,343 |
| | 327,609 |
| | 30.3 | % | | 12.31 | % | | — |
| | 12.72 | % | | — |
|
Subtotal/Weighted average(3) | 33 |
|
| 1,027,960 |
| | 986,780 |
| | 94.6 | % | | 12.36 | % | | 8.04 | % | | 11.58 | % | | 53.8 | % |
| CRE debt in N-Star CDOs | | | | | | | | | | | | | | | |
| First mortgage loans | 2 |
| | 34,418 |
| | 21,431 |
| | 3.2 | % | | — |
| | 2.22 | % | | 3.68 | % | | 100.0 | % |
| Mezzanine loans | 1 |
| | 11,000 |
| | 10,965 |
| | 1.0 | % | | 8.00 | % | | — |
| | 8.33 | % | | — |
|
| Subordinate interests | 1 |
| | 7,773 |
| | 7,773 |
| | 0.8 | % | | — |
| | 6.75 | % | | 6.92 | % | | 100.0 | % |
| Corporate loans | 7 |
| | 4,129 |
| | 4,129 |
| | 0.4 | % | | 6.95 | % | | — |
| | 6.95 | % | | — |
|
| Subtotal/Weighted average | 11 |
|
| 57,320 |
| | 44,298 |
| | 5.4 | % | | 7.71 | % | | 3.05 | % | | 5.70 | % | | 73.6 | % |
| Total | 44 |
|
| $ | 1,085,280 |
| | $ | 1,031,078 |
| | 100.0 | % | | 12.21 | % | | 7.68 | % | | 11.31 | % | | 54.9 | % |
____________________________________________________________
| |
| (1) | Includes a $100.0 million preferred equity investment for which the Company elected the fair value option. As of December 31, 2013, carrying value represents fair value with respect to this investment. |
| |
| (2) | Corporate loans include one revolver of $25.0 million, of which $3.5 million was outstanding as of December 31, 2013. |
| |
| (3) | Certain CRE debt investments serve as collateral for financing transactions including carrying value of $133.4 million for Securitization 2012-1 and $109.1 million for credit facilities. The remainder is unleveraged. |
| |
| (4) | There are no loans on non-accrual status except for one first mortgage loan acquired with deteriorated credit quality with a carrying value of $6.4 million as of December 31, 2013. Certain loans have an accrual of interest at a specified rate that may be in addition to a current rate. Such loans represent an aggregate $5.1 million carrying value where the Company does not recognize interest income on the accrual rate but does recognize interest income based on the current rate. |
| |
| (5) | Based on principal amount. |
| |
| (6) | Excludes three CRE debt investments with an aggregate principal amount of $37.0 million that were originated prior to 2008. |
| |
| (7) | $426.1 million principal amount has a weighted average LIBOR floor of 0.99%. Includes one first mortgage loan with a principal amount of $7.4 million with a spread over prime rate. |
| |
| (8) | Based on initial maturity and for floating-rate debt, calculated using one-month LIBOR as of December 31, 2013, and for CRE debt with a LIBOR floor, using such floor. |
For the years ended December 31, 2014, 2013 and 2012, the Company sold one loan for a net realized loss of $0.7 million, five loans for cost and three loans for a net realized gain of $1.0 million, respectively.
The following table presents maturities of CRE debt investments based on principal amount as of December 31, 2014 (dollars in thousands):
|
| | | | | | | |
| Initial Maturity |
| Maturity Including Extensions(1) |
| Years Ending December 31: | | | |
| 2015 | $ | 222,701 |
| | $ | 103,803 |
|
| 2016 | 300,367 |
| | 145,816 |
|
| 2017 | 102,921 |
| | 189,371 |
|
| 2018 | 2,594 |
| | 189,594 |
|
| 2019 | — |
| | — |
|
| Thereafter | 558,733 |
| | 558,732 |
|
| Total | $ | 1,187,316 |
| | $ | 1,187,316 |
|
____________________________________________________________
| |
| (1) | Assumes that all debt with extension options will qualify for extension at such maturity according to the conditions stipulated in the governing documents. |
As of December 31, 2014, the weighted average maturity, including extensions, of CRE debt investments was 4.9 years.
Actual maturities may differ from contractual maturities as certain borrowers may have the right to prepay with or without prepayment penalty. The Company may also extend certain contractual maturities in connection with loan modifications.
NORTHSTAR REALTY FINANCE CORP. AND SUBSIDIARIES
NOTES TO CONSOLIDATED FINANCIAL STATEMENTS (Continued)
The principal amount of CRE debt investments differs from the carrying value primarily due to unamortized origination fees and costs, unamortized premium and discount and loan loss reserves recorded as part of the carrying value of the investment. As of December 31, 2014, the Company had $22.5 million of net unamortized discount and $4.8 million of net unamortized origination fees and costs.
The Company did not have any non-performing loans (“NPLs”) as of December 31, 2014 and 2013.
Provision for Loan Losses
The following table presents activity in loan loss reserves on CRE debt investments for the years ended December 31, 2014, 2013 and 2012 (dollars in thousands):
|
| | | | | | | | | | | |
| | Years Ended December 31, |
| | 2014 | | 2013 | | 2012 |
| Beginning balance | $ | 2,880 |
| | $ | 156,699 |
| | $ | 187,784 |
|
| Provision for (reversal of) loan losses, net | 2,719 |
| (1) | (8,786 | ) | (2) | 23,037 |
|
| Transfers to REO | — |
| | (5,623 | ) | | (5,260 | ) |
| Sales | — |
| | — |
| | (667 | ) |
| Write-offs / payoffs | — |
| | (20,210 | ) | (3) | (48,195 | ) |
| Deconsolidation of N-Star CDOs | — |
| | (119,200 | ) | | — |
|
| Ending balance | $ | 5,599 |
| | $ | 2,880 |
| | $ | 156,699 |
|
____________________________________________________________
| |
| (1) | Excludes $1.0 million of provision for loan losses relating to notes receivables recorded in other assets. |
| |
| (2) | Includes $4.0 million of reversal of previously recorded provisions for loan losses. |
| |
| (3) | Represents a write-off of a previously recorded loan loss reserve upon payoff of a loan. |
Credit Quality Monitoring
CRE debt investments are typically loans secured by direct senior priority liens on real estate properties or by interests in entities that directly own real estate properties, which serve as the primary source of cash for the payment of principal and interest. The Company evaluates its debt investments at least quarterly and differentiates the relative credit quality principally based on: (i) whether the borrower is currently paying contractual debt service in accordance with its contractual terms; and (ii) whether the Company believes the borrower will be able to perform under its contractual terms in the future, as well as the Company’s expectations as to the ultimate recovery of principal at maturity.
The Company categorizes a debt investment for which it expects to receive full payment of contractual principal and interest payments as a “loan with no loan loss reserve.” The Company categorizes a debt investment as an NPL if it is in maturity default and/or past due at least 90 days on its contractual debt service payments. The Company considers the remaining debt investments to be of weaker credit quality and categorizes such loans as “other loans with a loan loss reserve/non-accrual status.” These loans are not considered NPLs because such loans are performing in accordance with contractual terms but the loans have a loan loss reserve and/or are on non-accrual status. Even if a borrower is currently paying contractual debt service or debt service is not due in accordance with its contractual terms, the Company may still determine that the borrower may not be able to perform under its contractual terms in the future and make full payment upon maturity. The Company’s definition of an NPL may differ from that of other companies that track NPLs.
NORTHSTAR REALTY FINANCE CORP. AND SUBSIDIARIES
NOTES TO CONSOLIDATED FINANCIAL STATEMENTS (Continued)
The following table presents the carrying value of CRE debt investments, by credit quality indicator, as of each applicable balance sheet date (dollars in thousands):
|
| | | | | | | |
| | December 31, |
| Credit Quality Indicator: | 2014 |
| 2013 |
| Loans with no loan loss reserve: |
|
|
|
| First mortgage loans | $ | 324,251 |
| | $ | 426,850 |
|
| Mezzanine loans | 157,089 |
| | 116,195 |
|
| Subordinate interests | 200,236 |
| | 152,626 |
|
| Corporate loans | 385,391 |
| | 331,738 |
|
| Subtotal | 1,066,967 |
| | 1,027,409 |
|
| Other loans with a loan loss reserve/non-accrual status: | | | |
First mortgage loans(1) | 700 |
| | 1,783 |
|
Mezzanine loans(2) | — |
| | 1,886 |
|
| Subtotal | 700 |
| | 3,669 |
|
| Non-performing loans: | — |
| | — |
|
| Total | $ | 1,067,667 |
| | $ | 1,031,078 |
|
____________________________________________________________
| |
| (1) | Excludes one first mortgage loan acquired with deteriorated credit quality with a carrying value of $5.7 million and $6.4 million as of December 31, 2014 and 2013, respectively. |
| |
| (2) | Includes one mezzanine loan with a 100% loan loss reserve with a principal amount of $3.7 million. Such loan is not considered a NPL as debt service is currently being received. |
Impaired Loans
The Company considers impaired loans to generally include NPLs, loans with a loan loss reserve, loans on non-accrual status (excluding loans acquired with deteriorated credit quality) and TDRs. The following table presents impaired loans as of December 31, 2014 and 2013 (dollars in thousands):
|
| | | | | | | | | | | | | | | | | | | | | | | | | | | | | | |
| | December 31, 2014 | | December 31, 2013 |
| | Number | | Principal
Amount(1) | | Carrying
Value(1) | | Loan Loss
Reserve | | Number | | | Principal Amount(1) |
| Carrying Value(1) |
| Loan Loss Reserve |
| Class of Debt: | | | | | | | | | | | | | | | | |
| First mortgage loans | 1 |
| | $ | 2,533 |
| | $ | 700 |
| | $ | 1,833 |
| | 1 |
| | | $ | 2,533 |
| | $ | 1,783 |
| | $ | 1,000 |
|
| Mezzanine loans | 1 |
| | 3,766 |
| | — |
| | 3,766 |
| | 1 |
| | | 3,766 |
| | 1,886 |
| | 1,880 |
|
| Total | 2 |
| | $ | 6,299 |
| | $ | 700 |
| | $ | 5,599 |
| | 2 |
| | | $ | 6,299 |
| | $ | 3,669 |
| | $ | 2,880 |
|
____________________________________________________________
| |
| (1) | Principal amount differs from carrying value primarily due to unamortized origination fees and costs, unamortized premium or discount and loan loss reserves included in the carrying value of the investment. Excludes one first mortgage loan acquired with deteriorated credit quality with a carrying value of $5.7 million and $6.4 million as of December 31, 2014 and 2013, respectively. |
The following table presents average carrying value of impaired loans by type and the income recorded on such loans subsequent to their being deemed impaired for the years ended December 31, 2014, 2013 and 2012 (dollars in thousands):
|
| | | | | | | | | | | | | | | | | | | | | | | | | |
| | December 31, 2014(1) | | December 31, 2013(1) | | December 31, 2012 |
| | Number | | Average Carrying Value | | Year Ended Income | | Number |
| Average Carrying Value |
| Year Ended Income | | Number | | Average
Carrying
Value | | Year Ended Income |
| Class of Debt: | | | | | | | | | | | | | | | | | |
| First mortgage loans | 1 | | $ | 1,133 |
| | $ | — |
| | 5 | | $ | 67,531 |
| | $ | 1,050 |
| | 6 | | $97,580 | | $1,191 |
| Mezzanine loans | 1 | | 377 |
| | 6 |
| | 7 | | 100,109 |
| | 416 |
| | 9 | | 163,916 | | 6,922 |
| Subordinate interests | — | | — |
| | — |
| | 1 | | — |
| | 3 |
| | 2 | | 6,015 | | — |
| Corporate loans | — | | — |
| | — |
| | — | | 19,530 |
| | — |
| | 1 | | 23,917 | | 3,859 |
| Total/weighted average | 2 | | $ | 1,510 |
| | $ | 6 |
| | 13 | | $ | 187,170 |
| | $ | 1,469 |
| | 18 | | $291,428 | | $11,972 |
______________________________________
| |
| (1) | Includes impaired loans outstanding during the period which were deconsolidated on September 30, 2013 and December 31, 2013. Refer to Note 3 for further disclosure. |
As of December 31, 2014 and 2013, the Company did not have any loans past due greater than 90 days.
NORTHSTAR REALTY FINANCE CORP. AND SUBSIDIARIES
NOTES TO CONSOLIDATED FINANCIAL STATEMENTS (Continued)
Troubled Debt Restructurings
There were no CRE debt investments that were modified and considered a TDR for the year ended December 31, 2014. The following table presents CRE debt investments that were modified and considered a TDR for the year ended December 31, 2013 (dollars in thousands):
|
| | | | | | | | | | | | | | |
| | | December 31, 2013 | |
| Class of Debt: | | Number |
| Carrying
Value |
| Original
WA Interest
Rate |
| Modified
WA Interest
Rate | |
| Mezzanine loan | | 1 |
| | $ | 50,905 |
| | 10.85 | % | | — |
| (1) |
______________________________________
| |
| (1) | Considered a TDR in the first quarter 2013 and was subsequently modified in the second quarter 2013. On September 30, 2013, the Company deconsolidated certain N-Star CDOs, and as a result, no longer records this loan on its consolidated balance sheets. Refer to Note 3 for further disclosure. |
All loans modified in a TDR generally provided interest rate concessions and/or deferral of interest or principal repayments. Any loan modification is intended to maximize the collection of the principal and interest related to such loan. There are no write-downs related to the CRE debt investments that were modified and considered a TDR for the periods presented.
6.Investments in Private Equity Funds
The following is a description of investments in private equity funds that own PE Investments either through unconsolidated ventures (“PE Investment I” and “PE Investment II”), consolidated ventures (“PE Investment V” and “PE Investment VIII”) or direct investments (“PE Investment III,” “PE Investment IV,” “PE Investment VI,” “PE Investment VII,” “PE Investment IX” and “PE Investment X”) (consolidated and direct investments, collectively “Direct PE Investments”) which are recorded as investments in private equity funds at fair value on the consolidated balance sheets. The Company elected the fair value option for PE Investments. As a result, the Company records equity in earnings (losses) based on the change in fair value for its share of the projected future cash flow from one period to another. All PE Investments are considered voting interest entities. PE Investment I and II are not consolidated by the Company due to the substantive participating rights of the partners in joint ventures that own the interests in the real estate private equity funds. The Company does not consolidate any of the underlying real estate private equity funds owned in Direct PE Investments as it does not own a majority voting interest in any such funds. Refer to Note 7 for the Company’s disclosure of summarized financial information required for PE Investments.
Summary
The following tables summarize the Company’s PE Investments as of December 31, 2014 (dollars in millions): |
| | | | | | | | | | | | | | | |
PE Investment(1) | | Initial Closing Date | | NAV Reference Date(2) | | Number of Funds | | Purchase Price | | Expected Future Contributions(3) |
| PE Investment I | | February 15, 2013 | | June 30, 2012 | | 49 |
| | $ | 282.1 |
| | $ | 7 |
|
| PE Investment II | | July 3, 2013 | | September 30, 2012 | | 24 |
| | 353.4 |
| | 4 |
|
PE Investment III (4) | | December 31, 2013 | | June 30, 2013 | | 8 |
| | 39.8 |
| | 1 |
|
| PE Investment IV | | May 30, 2014 | | December 31, 2013 | | 1 |
| | 8.0 |
| | — |
|
| PE Investment V | | July 1, 2014 | | September 30, 2013 | | 3 |
| | 12.0 |
| | — |
|
| PE Investment VI | | July 30, 2014 | | June 30, 2014 | | 20 |
| | 90.2 |
| | 2 |
|
| PE Investment VII | | August 15, 2014 | | December 31, 2013 | | 15 |
| | 54.9 |
| | 1 |
|
| PE Investment IX | | October 2, 2014 | | March 31, 2014 | | 11 |
| | 217.7 |
| | 2 |
|
PE Investment X (5) | | December 4, 2014 | | June 30, 2014 | | 13 |
| | 152.4 |
| | — |
|
| Total | | | | | | 144 |
| (6) | $ | 1,210.5 |
| | $ | 17 |
|
| |
| (1) | On August 19, 2014, the Company, through a subsidiary, entered into a joint venture with a third party to source and invest in real estate private equity funds. As of December 31, 2014, PE Investment VIII has not made any investments. |
| |
| (2) | Represents the net asset value (“NAV”) date on which the Company agreed to acquire the respective PE Investment. |
| |
| (3) | Represents the estimated amount of expected future contributions to funds as of December 31, 2014. |
| |
| (4) | PE Investment III paid $39.8 million to the PE III Seller for all of the fund interests, or 50% of the June 30, 2013 NAV, and will pay the remaining $39.8 million, or 50% of the June 30, 2013 NAV, by December 31, 2015 to two third parties. Such amount is included in other liabilities on the consolidated balance sheets. |
| |
| (5) | The Company closed on 12 of the 13 fund interests for PE Investment X through March 2, 2015. The Company expects to close on the remaining fund interest in the first quarter 2015 once the Company receives general partner consent from the underlying fund. |
| |
| (6) | The total number includes 14 funds held across multiple PE Investments. |
NORTHSTAR REALTY FINANCE CORP. AND SUBSIDIARIES
NOTES TO CONSOLIDATED FINANCIAL STATEMENTS (Continued)
|
| | | | | | | | | | | | | | | | | | | | | | | | | | | | | | | | |
| | | Carrying Value | | Year Ended December 31, 2014 (1) | | Year Ended December 31, 2013 (2) |
PE Investment(3) | | December 31, 2014 | | December 31, 2013 | | Equity in Earnings | | Cash Distributions(4) | | Cash Contributions | | Equity in Earnings | | Cash Distributions(4) | | Cash Contributions |
PE Investment I(5) | | $ | 218.6 |
| | $ | 226.3 |
| | $ | 55.6 |
| | $ | 97.2 |
| | $ | 1.1 |
| | $ | 53.7 |
| | $ | 130.2 |
| | $ | 20.8 |
|
| PE Investment II | | 231.6 |
| | 288.9 |
| | 52.6 |
| | 115.9 |
| | 6.0 |
| | 28.9 |
| | 104.9 |
| | 11.6 |
|
| PE Investment III | | 51.0 |
| | 70.8 |
| | 5.6 |
| | 25.6 |
| | 0.3 |
| | — |
| | 9.0 |
| | 0.3 |
|
| PE Investment IV | | 7.8 |
| | — |
| | 0.8 |
| | 0.9 |
| | — |
| | — |
| | — |
| | — |
|
| PE Investment V | | 8.0 |
| | — |
| | 1.1 |
| | 4.9 |
| | — |
| | — |
| | — |
| | — |
|
| PE Investment VI | | 86.3 |
| | — |
| | 5.6 |
| | 10.8 |
| | 1.3 |
| | — |
| | — |
| | — |
|
| PE Investment VII | | 42.7 |
| | — |
| | 3.1 |
| | 15.6 |
| | 0.2 |
| | — |
| | — |
| | — |
|
| PE Investment IX | | 174.6 |
| | — |
| | 8.1 |
| | 55.9 |
| | 4.7 |
| | — |
| | — |
| | — |
|
| PE Investment X | | 141.4 |
| | — |
| | 1.5 |
| | 12.7 |
| | 0.2 |
| | — |
| | — |
| | — |
|
| Total | | $ | 962.0 |
| | $ | 586.0 |
| | $ | 134.0 |
| | $ | 339.5 |
| | $ | 13.8 |
| | $ | 82.6 |
| | $ | 244.1 |
| | $ | 32.7 |
|
____________________________________________________________
| |
| (1) | The year ended December 31, 2014 represents activity from July 30, 2014 for PE Investment VI, August 15, 2014 for PE Investment VII, October 2, 2014 for PE Investment IX and December 4, 2014 for PE Investment X. |
| |
| (2) | The year ended December 31, 2013 represents activity from February 15, 2013 for PE Investment I, July 3, 2013 for PE Investment II and December 31, 2013 for PE Investment III. |
| |
| (3) | On August 19, 2014, the Company, through a subsidiary, entered into a joint venture with a third party to source and invest in real estate private equity funds. For the year ended December 31, 2014, PE Investment VIII has not made any investments. |
| |
| (4) | Net of a $13.6 million and $6.4 million reserve for taxes in the aggregate for all PE Investments for the years ended December 31, 2014 and 2013, respectively. |
| |
| (5) | The Company recorded an unrealized gain of $32.6 million related to PE Investment I for the year ended December 31, 2014. |
Unconsolidated PE Investments
PE Investment I
In February 2013, the Company completed the initial closing (“PE I Initial Closing”) of PE Investment I which owns a portfolio of limited partnership interests in real estate private equity funds managed by institutional-quality sponsors. Pursuant to the terms of the agreement, at the PE I Initial Closing, the full purchase price was funded, excluding future capital commitments. Accordingly, the Company funded $282.1 million and NorthStar Income (together with the Company, the “NorthStar Entities”) funded $118.0 million. The NorthStar Entities have an aggregate ownership interest in PE Investment I of 51%, of which the Company owns 70.5%. The Company assigned its rights to the remaining 29.5% to a subsidiary of NorthStar Income. Teachers Insurance and Annuity Association of America (the “Class B Partner”) contributed its interests in 49 funds subject to the transaction in exchange for all of the Class B partnership interests in PE Investment I.
PE Investment I provides for all cash distributions on a priority basis to the NorthStar Entities as follows: (i) first, 85% to the NorthStar Entities and 15% to the Class B Partner until the NorthStar Entities receive a 1.5x multiple on all of their invested capital, including amounts funded in connection with future capital commitments; (ii) second, 15% to the NorthStar Entities and 85% to the Class B Partner until the Class B Partner receives a return of its then remaining June 30, 2012 capital; and (iii) third, 51% to the NorthStar Entities and 49% to the Class B Partner. All amounts paid to and received by the NorthStar Entities are based on each partner’s proportionate interest.
The Company guaranteed all of its funding obligations that may be due and owed under PE Investment I agreements directly to PE Investment I entities. The Company and NorthStar Income each agreed to indemnify the other proportionately for any losses that may arise in connection with the funding and other obligations as set forth in the governing documents in the case of a joint default by the Company and NorthStar Income. The Company and NorthStar Income further agreed to indemnify each other for all of the losses that may arise as a result of a default that is solely caused by the Company or NorthStar Income, as the case may be.
PE Investment II
In June 2013, the Company, NorthStar Income and funds managed by Goldman Sachs Asset Management (“Vintage Funds”) (each a “Partner”) formed joint ventures and entered into an agreement with Common Pension Fund E, a common trust fund created under New Jersey law (“PE II Seller”), to acquire a portfolio of limited partnership interests in 24 real estate private equity funds managed by institutional-quality sponsors. The aggregate reported NAV acquired was $910.0 million as of September 30, 2012. The Company, NorthStar Income and the Vintage Funds each have an ownership interest in PE Investment II of 70%, 15% and 15%, respectively. All amounts paid and received are based on each Partner’s proportionate interest.
NORTHSTAR REALTY FINANCE CORP. AND SUBSIDIARIES
NOTES TO CONSOLIDATED FINANCIAL STATEMENTS (Continued)
PE Investment II paid $504.8 million to PE II Seller for all of the fund interests, or 55% of the September 30, 2012 NAV (the “Initial Amount”), and will pay the remaining $411.4 million, or 45% of the September 30, 2012 NAV (the “Deferred Amount”), by the last day of the fiscal quarter after the four year anniversary following the closing date of each fund interest. The Company funded $353.4 million, all of its proportionate share of the Initial Amount, at the initial closing on July 3, 2013. For the year ended December 31, 2014, PE Investment II paid $2.4 million of the Deferred Amount to PE II Seller of which the Company’s share was $1.7 million. As of December 31, 2014, the Company’s share of the Deferred Amount was $286.3 million. The Deferred Amount is a liability of PE Investment II. Each Partner, directly or indirectly, guaranteed its proportionate interest of the Deferred Amount. The Company determined there was an immaterial amount of fair value related to the guarantee.
On March 31st of each year, commencing on March 31, 2015 and for a period of two years thereafter, PE Investment II will pay an amount necessary to reduce the Deferred Amount by the greater of 15% of the then outstanding Deferred Amount or 15% of the aggregate distributions received by PE Investment II during the preceding 12 month period.
On the last day of the fiscal quarter after the four-year anniversary of the applicable closing date of each fund interest, PE Investment II will be required to pay to PE II Seller the then outstanding unpaid Deferred Amount. PE Investment II will receive 100% of all distributions following the payment of the Deferred Amount.
The Company guaranteed all of its funding obligations that may be due and owed under PE Investment II agreements directly to PE Investment II entities. The Company and NorthStar Income each agreed to indemnify the other proportionately for any losses that may arise in connection with the funding and other obligations as set forth in the governing documents in the case of a joint default by the Company and NorthStar Income. The Company and NorthStar Income further agreed to indemnify each other for all of the losses that may arise as a result of a default that was solely caused by the Company or NorthStar Income, as the case may be.
| |
| 7. | Investments in Unconsolidated Ventures |
The following is a description of investments in unconsolidated ventures. The investment in RXR Realty LLC (“RXR Realty”), Aerium Group (“Aerium”) and Legacy Partners Commercial, LLC (“Legacy Commercial”) are accounted for at fair value. The investments in the NSAM Sponsored Companies were accounted for under the equity method prior to the spin-off of NSAM and are accounted for under the cost method subsequent to the spin-off of NSAM. All other investments in unconsolidated ventures are accounted for under the equity method.
RXR Realty
In December 2013, the Company entered into a strategic transaction with RXR Realty, a leading real estate owner, developer and investment management company focused on high-quality real estate in the New York Tri-State area. The investment in RXR Realty includes an approximate 30% equity interest (“RXR Equity Interest”). The carrying value of the RXR Equity Interest was $90.0 million and $84.1 million as of December 31, 2014 and 2013, respectively. For the year ended December 31, 2014, the Company recognized equity in earnings of $8.0 million. The Company’s equity interest in RXR Realty is structured so that NSAM is entitled to certain fees in connection with RXR Realty’s investment management business. Refer to Note 11. “Related Party Arrangements - NorthStar Asset Management Group - Management Agreement” for further disclosure.
Aerium
In June 2014, the Company acquired a 15% interest in Aerium, a pan-European real estate investment manager specializing in commercial real estate properties and is headquartered in Luxembourg with additional offices in London, Paris, Istanbul, Geneva, Düsseldorf and Bahrain. As of December 31, 2014, Aerium managed approximately €6.1 billion of real estate assets across 12 countries and employed over 200 professionals, some of whom provide services to NSAM following the spin-off. The investment in Aerium was acquired for €50 million ($68.8 million), excluding $3.6 million of transaction costs, funded with €45 million ($62.2 million) of cash and €5 million from the issuance of the Company’s common stock (refer to Note 13). The carrying value of the investment in Aerium was $62.8 million as of December 31, 2014. From closing to December 31, 2014, the Company recognized equity in earnings of $2.5 million associated with this investment. The Company’s equity interest in Aerium is structured so that NSAM is entitled to certain fees in connection with Aerium’s asset management business. Refer to Note 11. “Related Party Arrangements - NorthStar Asset Management Group - Management Agreement” for further disclosure.
NORTHSTAR REALTY FINANCE CORP. AND SUBSIDIARIES
NOTES TO CONSOLIDATED FINANCIAL STATEMENTS (Continued)
Legacy Commercial
In September 2014, the Company entered into an investment with Legacy Commercial, a real estate investment manager, owner and operator with a portfolio of commercial assets focused in key markets in the western United States. The investment included a 40% interest in the common equity of certain entities affiliated with Legacy Commercial (collectively referred to as the “Legacy Commercial Entities”). The carrying value of the Company’s investment as of December 31, 2014 was $5.0 million. From closing to December 31, 2014, the Company recognized $0.4 million of equity in earnings associated with this investment. Refer to Note 11. “Related Party Arrangements - Legacy Commercial” for further disclosure.
Multifamily Joint Venture
In July 2013, the Company through a joint venture with a private investor, acquired a multifamily property with 498 units, located in Philadelphia, Pennsylvania for an aggregate purchase price of $41.0 million, including all costs, escrows and reserves. The property was financed with a non-recourse mortgage note of $29.5 million and the remainder in cash. The mortgage note matures on July 1, 2023 and bears a fixed interest rate of 3.69%. The Company’s 90% interest in the joint venture was acquired for $10.4 million. The carrying value of the Company’s investment was $9.9 million and $10.0 million as of December 31, 2014 and 2013, respectively. For the years ended December 31, 2014 and 2013, the Company recognized equity in losses of $0.3 million and $0.7 million, respectively, which was primarily related to the joint venture recording transaction costs of $0.8 million, as well as depreciation and amortization.
LandCap Partners
In October 2007, the Company entered into a joint venture with Whitehall Street Global Real Estate Limited Partnership 2007 (“Whitehall”) to form LandCap Partners and LandCap LoanCo. (collectively referred to as “LandCap”). The joint venture is managed by a third-party management group which has extensive experience in the single family housing sector. The Company and Whitehall agreed to provide no additional new investment capital in the LandCap joint venture. The carrying value of the 49% interest in LandCap was $10.8 million and $14.1 million as of December 31, 2014 and 2013, respectively. As of December 31, 2014 and 2013, LandCap had investments totaling $22.0 million and $25.9 million, respectively. For the years ended December 31, 2014, 2013 and 2012 the Company recognized equity in earnings of $0.7 million and $0.5 million and equity in losses of $1.2 million, respectively.
CS Federal Drive, LLC
The Company owns a 50% interest in CS Federal Drive, LLC (“CS/Federal”), which owns three adjacent class A office/flex buildings in Colorado. The properties were acquired for $54.3 million and the joint venture financed the transaction with two separate non-recourse mortgages totaling $38.0 million and the remainder in cash. The mortgages mature on February 11, 2016 and bear a fixed interest rate of 5.51% and 5.46%, respectively. The carrying value of the investment in CS/Federal was $5.7 million and $5.5 million as of December 31, 2014 and 2013, respectively. For the years ended December 31, 2014, 2013 and 2012, the Company recognized equity in earnings of $0.1 million, $0.3 million and $0.7 million, respectively.
NSAM Sponsored Companies
The Company committed to purchase up to $10 million in shares of each of NSAM’s Sponsored Companies’ common stock during the two year period from when each offering was declared effective through the end of their respective offering period, in the event that NSAM Sponsored Companies’ distributions to its stockholders, on a quarterly basis, exceeds its modified funds from operations (as defined in accordance with the current practice guidelines issued by the Investment Program Association).
In connection with the Company’s commitment to purchase share of the NSAM Sponsored Companies, the Company acquired an aggregate of $12 million of shares of NorthStar Income, NorthStar Healthcare and NorthStar Income II through December 31, 2014. In addition, pursuant to the management agreement with NSAM, the Company committed up to $10 million to invest as distribution support consistent with past practice in each future public non-traded NSAM Sponsored Company, up to a total of five new companies per year.
The Company has the following ownership interest in the NSAM Sponsored Companies:
| |
| • | NorthStar Income - The carrying value of the investment in NorthStar Income was $6.1 million, representing an interest of 0.6%, as of December 31, 2014 and 2013, respectively. For the years ended December 31, 2014, 2013 and 2012, the Company recognized $0.4 million, $0.6 million and $0.3 million of equity in earnings, respectively. |
NORTHSTAR REALTY FINANCE CORP. AND SUBSIDIARIES
NOTES TO CONSOLIDATED FINANCIAL STATEMENTS (Continued)
| |
| • | NorthStar Healthcare - The carrying value of the investment in NorthStar Healthcare was $2.3 million and $2.1 million as of December 31, 2014 and 2013, respectively, representing an interest of 0.3% and 2.3%, respectively. For the years ended December 31, 2014 and 2013, the Company recognized equity in losses of $0.2 million and an immaterial amount, respectively. |
| |
| • | NorthStar Income II - The carrying value of the investment in NorthStar Income II was $3.1 million and $2.1 million as of December 31, 2014 and 2013, respectively, representing an interest of 1.2% and 8.7%, respectively. For the years ended December 31, 2014 and 2013, the Company recognized equity in earnings of $0.1 million and an immaterial amount, respectively. |
The Company has committed to invest as distribution support in the following future NSAM Sponsored Companies:
| |
| • | NorthStar/RXR New York Metro - On February 9, 2015, NorthStar/RXR New York Metro’s (“NorthStar/RXR New York Metro”) registration statement on Form S-11, seeking to raise up to $2 billion in a public offering of common stock, was declared effective by the SEC. NorthStar/RXR New York Metro expects to begin raising capital in the third quarter 2015. |
| |
| • | NorthStar Corporate - On December 2, 2014, NorthStar Corporate Income, Inc. confidentially submitted its registration statement on Form N-2 to the SEC seeking to raise up to $1 billion in a public offering of common stock. |
Other
The Company owned a 22% interest in Meadowlands Two, LLC, which holds 100% of Meadowlands One, LLC, which is currently in the form of a preferred equity interest secured by a retail/entertainment complex located in New Jersey (the “NJ Property”). As a result of the deconsolidation of certain N-Star CDOs, the Company deconsolidated its investment in the NJ Property on September 30, 2013 (refer to Note 3). For the years ended December 31, 2013 and 2012, the Company recognized equity in losses of $0.8 million and $1.5 million, respectively.
In May 2012, the Company acquired a 9.8% interest in a joint venture that owns a pari passu participation in a first mortgage loan secured by a portfolio of luxury residences located in resort destinations. In April 2014, the loan was repaid at par. As of December 31, 2013, the carrying value of the Company’s investment was $5.7 million. For the years ended December 31, 2014, 2013 and 2012, the Company recognized $1.5 million, $1.5 million and $1.0 million of equity in earnings, respectively.
In August 2012, the Company acquired a 33.3% interest in a joint venture that owns a pari passu participation in a first mortgage loan secured by an office building in New York. In July 2013, the loan was paid off at par. For the years ended December 31, 2013 and 2012, the Company recognized $2.8 million and $0.9 million of equity in earnings, respectively.
In April 2013, in connection with a loan on a hotel property in New York, the Company and NorthStar Income acquired an aggregate 35.0% interest in the Row NYC (formerly the Milford) hotel and retail component, of which the Company owns 65% and NorthStar Income owns 35%. There was no carrying value as of December 31, 2014 and 2013. For the years ended December 31, 2014 and 2013, the Company recognized $1.2 million of equity in earnings and $1.1 million of equity in losses, respectively. In March 2014, the retail component of the hotel was sold and for the year ended December 31, 2014, the Company recognized a $1.2 million gain from this sale in equity in earnings.
In June 2013, in connection with the restructuring of an existing mezzanine loan, the Company acquired a 9.99% equity interest for $8.5 million in a joint venture that owns two office buildings in Chicago. As of December 31, 2014 and 2013, the carrying value of the investment was $8.5 million for each period. For the years ended December 31, 2014 and 2013, the Company did not recognize any equity in earnings.
NORTHSTAR REALTY FINANCE CORP. AND SUBSIDIARIES
NOTES TO CONSOLIDATED FINANCIAL STATEMENTS (Continued)
Summarized Financial Information
The combined balance sheets for the unconsolidated ventures, including PE Investments, as of December 31, 2014 and 2013 are as follows (dollars in thousands):
|
| | | | | | | | |
| | | As of December 31, |
| | | 2014 | | 2013 |
| Assets | | | | |
| Operating real estate, net | | $ | 1,382,936 |
| | $ | 1,097,155 |
|
| Real estate debt investments | | 1,974,398 |
| | 1,246,311 |
|
| Investments in private equity funds | | 1,885,858 |
| | 1,589,493 |
|
| Real estate securities | | 355,986 |
| | 280,117 |
|
| Other assets | | 2,379,751 |
| | 1,064,653 |
|
| Total assets | | $ | 7,978,929 |
| | $ | 5,277,729 |
|
| | | | | |
| Liabilities and equity | | | | |
| Mortgages and other notes payable | | $ | 1,994,750 |
| | $ | 1,851,561 |
|
| Other liabilities | | 1,664,952 |
| | 1,064,479 |
|
| Total liabilities | | 3,659,702 |
| | 2,916,040 |
|
| Equity | | 4,319,227 |
| | 2,361,689 |
|
| Total liabilities and equity | | $ | 7,978,929 |
| | $ | 5,277,729 |
|
| | | | | |
| Net investment in unconsolidated ventures | | $ | 1,169,815 |
| | $ | 728,358 |
|
The combined statements of operations for the unconsolidated ventures, including PE Investments, from acquisition date through the three years ended December 31, 2014 are as follows (dollars in thousands):
|
| | | | | | | | | | | | |
| | | Years Ended December 31, |
| | | 2014 (1) | | 2013 | | 2012 |
| Total revenues | | $ | 950,983 |
| | $ | 322,944 |
| | $ | 44,378 |
|
| Operating expenses | | 361,214 |
| | 89,807 |
| | 21,357 |
|
| Transaction costs | | 19,737 |
| | 5,199 |
| | — |
|
| Interest expense | | 90,826 |
| | 37,838 |
| | 18,217 |
|
| Depreciation and amortization | | 48,766 |
| | 9,564 |
| | 2,993 |
|
| Total expenses | | 520,543 |
| | 142,408 |
| | 42,567 |
|
| Net income | | $ | 430,440 |
| | $ | 180,536 |
| | $ | 1,811 |
|
| | | | | | | |
| Equity in earnings (losses) of unconsolidated ventures | | $ | 148,290 |
| | $ | 85,477 |
| | $ | 88 |
|
| |
| (1) | Includes summarized financial information for PE Investments for the nine months ended September 30, 2014, which is the most recent financial information available from the underlying funds. |
NORTHSTAR REALTY FINANCE CORP. AND SUBSIDIARIES
NOTES TO CONSOLIDATED FINANCIAL STATEMENTS (Continued)
| |
| 8. | Real Estate Securities, Available for Sale |
The following table presents CRE securities as of December 31, 2014 (dollars in thousands):
|
| | | | | | | | | | | | | | | | | | | | | | | | | | | | | | | | |
| | | | | | | | | Cumulative Unrealized | | | | Allocation by | | Weighted | | Weighted |
| Number |
| Principal Amount(3) |
| Amortized Cost |
| Gains |
| (Losses) |
| Fair Value |
| Investment Type(3) |
| Average Coupon |
| Average Yield(4) |
| Asset Type: |
| |
|
|
|
|
|
|
|
|
|
|
|
|
|
|
|
|
|
N-Star CDO bonds(1) | 32 |
| | | $ | 461,974 |
| | $ | 205,463 |
| | $ | 58,116 |
| | $ | (1,270 | ) | | $ | 262,309 |
| | 30.1 | % | | 1.83 | % | | 24.13 | % |
N-Star CDO equity(5) | 5 |
| | | 137,143 |
| | 137,143 |
| | 522 |
| | (35,198 | ) | | 102,467 |
| | 8.9 | % | | NA |
| | 18.21 | % |
CMBS and other securities(6) | 15 |
| | | 119,089 |
| | 64,616 |
| | 12,241 |
| | (24,934 | ) | | 51,923 |
| | 7.8 | % | | 2.48 | % | | 5.51 | % |
Subtotal(2) | 52 |
| | | 718,206 |
| | 407,222 |
| | 70,879 |
| | (61,402 | ) | | 416,699 |
| | 46.8 | % | | 1.97 | % | | 19.18 | % |
CRE securities in N-Star CDOs(5)(7) | | | | | | | | | | | | | | | | | | |
| CMBS | 144 |
| | | 636,035 |
| | 458,186 |
| | 50,432 |
| | (125,751 | ) | | 382,867 |
| | 41.5 | % | | 3.69 | % | | 9.96 | % |
| Third-party CDO notes | 10 |
| | | 76,253 |
| | 68,821 |
| | — |
| | (45,603 | ) | | 23,218 |
| | 5.1 | % | | 0.26 | % | | 1.32 | % |
| Agency debentures | 8 |
| | | 87,172 |
| | 30,371 |
| | 10,164 |
| | (6 | ) | | 40,529 |
| | 5.7 | % | | — | % | | 4.56 | % |
| Unsecured REIT debt | 1 |
| | | 8,000 |
| | 8,396 |
| | 955 |
| | — |
| | 9,351 |
| | 0.5 | % | | 7.50 | % | | 5.88 | % |
| Trust preferred securities | 2 |
| | | 7,225 |
| | 7,225 |
| | — |
| | (1,373 | ) | | 5,850 |
| | 0.4 | % | | 2.25 | % | | — | % |
| Subtotal | 165 |
| | | 814,685 |
| | 572,999 |
| | 61,551 |
| | (172,733 | ) | | 461,815 |
| | 53.2 | % | | 3.00 | % | | 8.45 | % |
| Total | 217 |
| | | $ | 1,532,891 |
| | $ | 980,221 |
| | $ | 132,430 |
| | $ | (234,135 | ) | | $ | 878,514 |
| | 100.0 | % | | 2.57 | % | | 12.91 | % |
____________________________________________________________
| |
| (1) | Excludes $108.0 million principal amount of N-Star CDO bonds payable that are eliminated in consolidation. |
| |
| (2) | All securities are unleveraged. |
| |
| (3) | Based on amortized cost for N-Star CDO equity and principal amount for remaining securities. |
| |
| (4) | Based on expected maturity and for floating-rate securities, calculated using the applicable LIBOR as of December 31, 2014. |
| |
| (5) | The fair value option was elected for these securities (refer to Note 15). |
| |
| (6) | The fair value option was elected for $42.6 million carrying value of these securities (refer to Note 15). |
| |
| (7) | Investments in the same securitization tranche held in separate CDO financing transactions are reported as separate investments. |
As of December 31, 2014, the Company’s CRE securities portfolio is comprised of N-Star CDO bonds and N-Star CDO equity and other securities which are predominantly conduit CMBS, meaning each asset is a pool backed by a large number of commercial real estate loans. As a result, this portfolio is typically well-diversified by collateral type and geography. As of December 31, 2014, contractual maturities of CRE securities investments ranged from four months to 38 years, with a weighted average expected maturity of 3.7 years.
The following table presents CRE securities as of December 31, 2013 (dollars in thousands):
|
| | | | | | | | | | | | | | | | | | | | | | | | | | | | | | | | |
| | | | | | | | | Cumulative Unrealized | | | | Allocation by |
| Weighted |
| Weighted |
| | Number | | Principal
Amount(3) | | Amortized Cost | | Gains | | Losses | | Fair Value | | Investment
Type(3) | | Average
Coupon | | Average Yield(4) |
| Asset Type: | | | | | | | | | | | | | | | | | | |
N-Star CDO bonds(1) | 31 |
| | | $ | 481,386 |
| | $ | 207,547 |
| | $ | 1,878 |
| | $ | (4,138 | ) | | $ | 205,287 |
| | 23.0 | % | | 1.82 | % | | 20.00 | % |
N-Star CDO equity(5) | 5 |
| | | 158,274 |
| | 158,274 |
| | — |
| | — |
| | 158,274 |
| | 7.6 | % | | NA |
| | 18.42 | % |
CMBS and other securities(6) | 17 |
| | | 98,650 |
| | 58,482 |
| | 6,457 |
| | (18,264 | ) | | 46,675 |
| | 4.7 | % | | 3.06 | % | | 4.98 | % |
Subtotal(2) | 53 |
| | | 738,310 |
| | 424,303 |
| | 8,335 |
| | (22,402 | ) | | 410,236 |
| | 35.3 | % | | 2.03 | % | | 17.34 | % |
CRE securities in N-Star CDOs(5)(7) | | | | | | | | | | | | | | | | | | |
| CMBS | 264 |
| | | 1,140,368 |
| | 799,126 |
| | 67,770 |
| | (294,595 | ) | | 572,301 |
| | 54.5 | % | | 3.15 | % | | 9.65 | % |
| Third-party CDO notes | 20 |
| | | 109,651 |
| | 99,603 |
| | — |
| | (74,672 | ) | | 24,931 |
| | 5.2 | % | | 0.29 | % | | 1.17 | % |
| Agency debentures | 8 |
| | | 87,172 |
| | 29,031 |
| | 2,644 |
| | (2,135 | ) | | 29,540 |
| | 4.2 | % | | NA |
| | 4.64 | % |
| Unsecured REIT debt | 1 |
| | | 8,000 |
| | 8,502 |
| | 1,019 |
| | — |
| | 9,521 |
| | 0.4 | % | | 7.50 | % | | 6.00 | % |
| Trust preferred securities | 2 |
| | | 7,225 |
| | 7,225 |
| | — |
| | (1,434 | ) | | 5,791 |
| | 0.4 | % | | 2.26 | % | | 2.32 | % |
| Subtotal | 295 |
| | | 1,352,416 |
| | 943,487 |
| | 71,433 |
| | (372,836 | ) | | 642,084 |
| | 64.7 | % | | 2.73 | % | | 8.51 | % |
| Total | 348 |
| | | $ | 2,090,726 |
| | $ | 1,367,790 |
| | $ | 79,768 |
| | $ | (395,238 | ) | | $ | 1,052,320 |
| | 100.0 | % | | 2.52 | % | | 11.25 | % |
_________________________________________________________
| |
| (1) | Excludes $126.6 million principal amount of N-Star CDO bonds payable that are eliminated in consolidation. |
| |
| (2) | All securities are unleveraged. |
| |
| (3) | Based on amortized cost for N-Star CDO equity and principal amount for remaining securities. |
| |
| (4) | Based on expected maturity and for floating-rate securities, calculated using the applicable LIBOR as of December 31, 2013. |
| |
| (5) | The fair value option was elected for these securities (refer to Note 15). |
| |
| (6) | The fair value option was elected for $30.6 million carrying value of these securities (refer to Note 15). |
| |
| (7) | Investments in the same securitization tranche held in separate CDO financing transactions are reported as separate investments. |
NORTHSTAR REALTY FINANCE CORP. AND SUBSIDIARIES
NOTES TO CONSOLIDATED FINANCIAL STATEMENTS (Continued)
For the year ended December 31, 2014, proceeds from the sale of CRE securities was $94.8 million resulting in a net realized gain of $22.4 million. For the year ended December 31, 2013, proceeds from the sale of CRE securities was $224.0 million, resulting in a net realized gain of $35.4 million, which includes proceeds related to the liquidation of N-Star CDO II. For the year ended December 31, 2012, proceeds from the sale of CRE securities was $343.9 million, resulting in a net realized gain of $50.5 million.
CRE securities investments, not held in N-Star CDOs, include 34 securities for which the fair value option was not elected. As of December 31, 2014, the aggregate carrying value of these securities was $271.6 million, representing $56.8 million of accumulated net unrealized gains included in OCI. The Company held five securities with an aggregate carrying value of $9.8 million with an unrealized loss of $1.2 million as of December 31, 2014, one of which was in an unrealized loss position for a period of greater than 12 months. Based on management’s quarterly evaluation, OTTI of $1.6 million was recorded for one security. The Company does not intend to sell these securities and it is more likely than not that the Company will not be required to sell these securities prior to recovery of its amortized cost basis, which may be at maturity.
NORTHSTAR REALTY FINANCE CORP. AND SUBSIDIARIES
NOTES TO CONSOLIDATED FINANCIAL STATEMENTS (Continued)
9. Borrowings
The following table presents borrowings as of December 31, 2014 and 2013 (dollars in thousands): |
| | | | | | | | | | | | | | | | | | | | | |
| | |
| |
| |
| December 31, 2014 |
| December 31, 2013 |
| | Recourse vs. Non-Recourse |
| Final Maturity |
| Contractual Interest Rate(1)(2) |
| Principal Amount |
| Carrying Value(3) |
| Principal Amount |
| Carrying Value(3) |
Mortgage and other notes payable:(4) | |
| | | |
| |
| |
| |
| |
| Healthcare | |
| |
| |
| |
|
| |
|
| |
|
| |
|
Wakefield Portfolio(5) | Non-recourse |
| Mar-15 |
| LIBOR + 5.95% |
| $ | 54,751 |
|
| $ | 54,751 |
|
| $ | 55,768 |
|
| $ | 55,768 |
|
| East Arlington, TX | Non-recourse | | May-17 | | 5.89% | | 3,157 |
| | 3,157 |
| | 3,209 |
| | 3,209 |
|
Ohio Portfolio(6) | Non-recourse | | Jan-19 | | 6.00% | | 20,230 |
| | 20,230 |
| | 20,496 |
| | 20,496 |
|
Lancaster, OH(6) | Non-recourse | | Jan-19 | | LIBOR + 5.00% | | 2,442 |
| | 2,442 |
| | 4,399 |
| | 4,399 |
|
Wilkinson Portfolio(6) | Non-recourse | | Jan-19 | | 6.99% | | 150,024 |
| | 150,024 |
| | 152,772 |
| | 152,772 |
|
Tuscola/Harrisburg, IL(6) | Non-recourse | | Jan-19 | | 7.09% | | 7,412 |
| | 7,412 |
| | 7,545 |
| | 7,545 |
|
Minnesota Portfolio(7) | Non-recourse | | Nov-19 | | 3.50% | | 37,800 |
| | 37,800 |
| | 38,175 |
| | 38,175 |
|
| Griffin-American - U.K. | Non-recourse | | Dec-17 | | LIBOR + 4.10%(8) | | 348,588 |
| | 348,588 |
| | — |
| | — |
|
Griffin-American - U.S.(9) | Non-recourse | | Dec-19 | | LIBOR + 3.10%(8)/4.58% | | 2,618,797 |
| | 2,618,797 |
| | — |
| | — |
|
Healthcare Preferred(10) | Non-recourse |
| Jul-21 |
| LIBOR + 7.75% |
| 75,000 |
|
| 75,000 |
|
| 75,000 |
|
| 75,000 |
|
Indiana Portfolio(10) | Non-recourse | | Sept-21 | | LIBOR + 4.50% | | 121,130 |
| | 121,130 |
| | 121,130 |
| | 121,130 |
|
Formation Portfolio(9) | Non-recourse | | May-19/Jan-25 | | LIBOR + 4.25%(8)/4.54% | | 705,608 |
| | 700,958 |
| | — |
| | — |
|
| Subtotal Healthcare | | | | | | | 4,144,939 |
| | 4,140,289 |
| | 478,494 |
| | 478,494 |
|
| Hotel | | | | | | |
|
| | | | | | |
Innkeepers Portfolio(9) | Non-recourse | | Jun-19(11) | | LIBOR + 3.39%(8) | | 840,000 |
| | 840,000 |
| | — |
| | — |
|
K Partners Portfolio(9) | Non-recourse | | Aug-19(11) | | LIBOR + 3.25%(8) | | 211,681 |
| | 211,681 |
| | — |
| | — |
|
Courtyard Portfolio(9) | Non-recourse | | Oct-19(11) | | LIBOR + 3.05%(8) | | 512,000 |
| | 512,000 |
| | — |
| | — |
|
Inland Portfolio(9) | Non-recourse | | Nov-19(11) | | LIBOR + 3.60%(8) | | 817,000 |
| | 817,000 |
| | — |
| | — |
|
| Subtotal Hotel | | | | | | | 2,380,681 |
| | 2,380,681 |
| | — |
| | — |
|
| Manufactured housing communities | | | | | | | | | | | | | |
Manufactured Housing Portfolio 1(9) | Non-recourse | | Jan-23 | | 4.387%(8) | | 236,900 |
| | 236,900 |
| | 236,900 |
| | 236,900 |
|
Manufactured Housing Portfolio 2(9) | Non-recourse | | May-23 | | 4.016%(8) | | 639,909 |
| | 639,909 |
| | 639,999 |
| | 639,999 |
|
Manufactured Housing Portfolio 3(9) | Non-recourse | | Dec-21/ Jan-24/ Sept-24 | | 4.923%(8) | | 297,428 |
| | 299,716 |
| | 248,000 |
| | 248,000 |
|
| Subtotal Manufactured housing communities | | | | | | | 1,174,237 |
| | 1,176,525 |
| | 1,124,899 |
| | 1,124,899 |
|
| Net lease | | | | | | | | | | | | | |
Reading, PA(12) | — | | — | | — | | — |
| | — |
| | 12,765 |
| | 12,765 |
|
Reading, PA(12) | — | | — | | — | | — |
| | — |
| | 5,000 |
| | 5,000 |
|
Fort Wayne, IN(13) | Non-recourse | | Apr-15 | | 6.41% | | 2,909 |
| | 2,909 |
| | 3,019 |
| | 3,019 |
|
| EDS Portfolio | Non-recourse | | Oct-15 | | 5.37% | | 42,738 |
| | 42,738 |
| | 43,682 |
| | 43,682 |
|
| Keene, NH | Non-recourse | | Feb-16 | | 5.85% | | 6,105 |
| | 6,105 |
| | 6,237 |
| | 6,237 |
|
| Green Pond, NJ | Non-recourse | | Apr-16 | | 5.68% | | 15,799 |
| | 15,799 |
| | 16,095 |
| | 16,095 |
|
| Aurora, CO | Non-recourse | | Jul-16 | | 6.22% | | 30,720 |
| | 30,720 |
| | 31,232 |
| | 31,232 |
|
| DSG Portfolio | Non-recourse | | Oct-16 | | 6.17% | | 31,126 |
| | 31,126 |
| | 31,729 |
| | 31,729 |
|
| Indianapolis, IN | Non-recourse | | Feb-17 | | 6.06% | | 26,151 |
| | 26,151 |
| | 26,600 |
| | 26,600 |
|
| Milpitas, CA | Non-recourse | | Mar-17 | | 5.95% | | 19,459 |
| | 19,459 |
| | 20,055 |
| | 20,055 |
|
| Fort Mill, SC | Non-recourse | | Apr-17 | | 5.63% | | 27,700 |
| | 27,700 |
| | 27,700 |
| | 27,700 |
|
| Fort Mill, SC - Mezzanine | Non-recourse | | Apr-17 | | 6.21% | | 1,079 |
| | 1,079 |
| | 1,464 |
| | 1,464 |
|
| Salt Lake City, UT | Non-recourse | | Sept-17 | | 5.16% | | 13,181 |
| | 13,181 |
| | 13,689 |
| | 13,689 |
|
Industrial Portfolio(9) | Non-recourse | | Jul-17/Dec-17 | | 4.21%(8) | | 221,131 |
| | 228,071 |
| | — |
| | — |
|
| Columbus, OH | Non-recourse | | Dec-17 | | 6.48% | | 21,934 |
| | 21,934 |
| | 22,300 |
| | 22,300 |
|
| South Portland, ME | Non-recourse | | Jul-23 | | LIBOR + 2.15%(8) | | 3,597 |
| | 3,597 |
| | 3,819 |
| | 3,819 |
|
| Subtotal Net lease | | | | | | | 463,629 |
| | 470,569 |
| | 265,386 |
| | 265,386 |
|
| Multifamily | | | | | | | | | | | | | |
| Memphis, TN | Non-recourse | | Apr-23 | | 3.996% | | 39,600 |
| | 39,600 |
| | 39,600 |
| | 39,600 |
|
Southeast Portfolio(9) | Non-recourse | | May-23/July-23 | | 4.03%(8) | | 158,417 |
| | 158,417 |
| | 158,417 |
| | 158,417 |
|
Scottsdale, AZ(9) | Non-recourse | | Jul-23 | | 4.28%(8) | | 46,538 |
| | 46,538 |
| | 46,538 |
| | 46,538 |
|
| Subtotal Multifamily | | | | | | | 244,555 |
| | 244,555 |
| | 244,555 |
| | 244,555 |
|
| Other | | | | | | | | | | | | | |
| Legacy Portfolio | Non-recourse | | Nov-19 | | LIBOR + 1.75%(8) | | 45,584 |
| | 45,584 |
| | — |
| | — |
|
UK Property(9) | Non-recourse | | Dec-19 | | LIBOR + 3.00%(8) | | 77,660 |
| | 77,660 |
| | — |
| | — |
|
| Subtotal Other | | | | | | | 123,244 |
| | 123,244 |
| | — |
| | — |
|
| Subtotal Mortgage and other notes payable | | | | | | | 8,531,285 |
|
| 8,535,863 |
| | 2,113,334 |
| | 2,113,334 |
|
NORTHSTAR REALTY FINANCE CORP. AND SUBSIDIARIES
NOTES TO CONSOLIDATED FINANCIAL STATEMENTS (Continued)
|
| | | | | | | | | | | | | | | | | | | | | |
|
|
|
|
|
|
| December 31, 2014 |
| December 31, 2013 |
| Recourse vs. Non-Recourse |
| Final Maturity |
| Contractual Interest Rate(1)(2) |
| Principal Amount |
| Carrying Value(3) |
| Principal Amount | | Carrying Value(3) |
| CDO bonds payable: | | | | | | | | | | | | | |
| N-Star I | Non-recourse | | Aug-38 | | LIBOR + 7.01%(8) | | $ | 15,020 |
| | $ | 14,504 |
| | $ | 37,754 |
| | $ | 34,886 |
|
N-Star III(14) | — | | — | | — | | — |
| | — |
| | 100,022 |
| | 46,090 |
|
N-Star V(14) | — |
| — |
| — | | — |
| | — |
| | 202,899 |
| | 80,897 |
|
| N-Star IX | Non-recourse | | Aug-52 | | LIBOR + 0.43%(8) | | 545,939 |
| | 375,564 |
| | 629,544 |
| | 222,310 |
|
| Subtotal CDO bonds payable—VIE | | | | | | | 560,959 |
| | 390,068 |
| | 970,219 |
| | 384,183 |
|
| Securitization bonds payable: | | | | | | | | | | | | | |
| Securitization 2012-1 | Non-recourse | | Aug-29 | | LIBOR+2.17%(8) | | 41,831 |
|
| 41,823 |
| | 82,337 |
| | 82,340 |
|
| Subtotal Securitization financing transaction | | | | | | | 41,831 |
|
| 41,823 |
| | 82,337 |
| | 82,340 |
|
| Credit facilities: | | | | | | | | | | | | | |
Corporate Revolving Credit Facility(15) | Recourse | | Aug-17 | | LIBOR + 3.50%(8) | | 215,000 |
| | 215,000 |
| | — |
| | — |
|
| Corporate Term Facility | Recourse | | Sept-17 | | 4.60% / 4.55%(16) | | 425,000 |
| | 425,000 |
| | — |
| | — |
|
| Loan Facility 1 | Non-recourse | | Jul-18(17) | | 5.16%(18) | | 14,850 |
| | 14,850 |
| | 14,850 |
| | 14,850 |
|
| Loan Facility 2 | Partial Recourse(19) | | Mar-18(11) | | 3.09%(8) | | 77,930 |
| | 77,930 |
| | 55,188 |
| | 55,188 |
|
| Subtotal Credit facilities | | | | | | | 732,780 |
|
| 732,780 |
| | 70,038 |
| | 70,038 |
|
| Exchangeable senior notes: | | | | | | | | | | | | | |
| 7.25% Notes | Recourse | | Jun-27 | | 7.25% | | 12,955 |
| | 12,955 |
| | 12,955 |
| | 12,955 |
|
7.50% Notes(20) | — | | — | | — | | — |
| | — |
| | 172,500 |
| | 165,366 |
|
| 8.875% Notes | Recourse | | Jun-32 | | 8.875% | | 1,000 |
| | 983 |
| | 13,360 |
| | 13,068 |
|
| 5.375% Notes | Recourse | | Jun-33 | | 5.375% | | 31,633 |
| | 27,824 |
| | 345,000 |
| | 299,584 |
|
| Subtotal Exchangeable senior notes | | | | | | | 45,588 |
|
| 41,762 |
| | 543,815 |
| | 490,973 |
|
Junior subordinated notes:(21) | | | | | | | | | | | | | |
| Trust I | Recourse | | Mar-35 | | 8.15% | | 41,240 |
| | 32,992 |
| | 41,240 |
| | 31,342 |
|
| Trust II | Recourse | | Jun-35 | | 7.74% | | 25,780 |
| | 20,753 |
| | 25,780 |
| | 19,722 |
|
| Trust III | Recourse | | Jan-36 | | 7.81% | | 41,238 |
| | 32,784 |
| | 41,238 |
| | 31,547 |
|
| Trust IV | Recourse | | Jun-36 | | 7.95% | | 50,100 |
| | 39,830 |
| | 50,100 |
| | 38,327 |
|
| Trust V | Recourse | | Sept-36 | | LIBOR + 2.70%(8) | | 30,100 |
| | 21,823 |
| | 30,100 |
| | 19,866 |
|
| Trust VI | Recourse | | Dec-36 | | LIBOR + 2.90%(8) | | 25,100 |
| | 18,700 |
| | 25,100 |
| | 16,943 |
|
| Trust VII | Recourse | | Apr-37 | | LIBOR + 2.50%(8) | | 31,459 |
| | 22,492 |
| | 31,459 |
| | 20,290 |
|
| Trust VIII | Recourse | | Jul-37 | | LIBOR + 2.70%(8) | | 35,100 |
| | 25,798 |
| | 35,100 |
| | 23,166 |
|
| Subtotal Junior subordinated notes | | | | | | | 280,117 |
|
| 215,172 |
| | 280,117 |
| | 201,203 |
|
| Grand Total | | | | | | | $ | 10,192,560 |
| | $ | 9,957,468 |
| | $ | 4,059,860 |
| | $ | 3,342,071 |
|
____________________________________________________________
| |
| (1) | Refer to Note 16 for further disclosure regarding derivative instruments which are used to manage interest rate exposure. |
| |
| (2) | For borrowings with a contractual interest rate based on LIBOR, represents three-month LIBOR for N-Star CDO I and the Wakefield Portfolio and one-month LIBOR for the other borrowings. |
| |
| (3) | Carrying value represents fair value with respect to CDO bonds payable and junior subordinated notes due to the election of the fair value option (refer to Note 15) and amortized cost with regards to the other borrowings. |
| |
| (4) | Mortgage and other notes payable are subject to customary non-recourse carveouts. |
| |
| (5) | The Company is in the process of extending the loan which matures on March 31, 2015. |
| |
| (6) | In December 2014, the financing was modified extending the maturity date to January 2019. |
| |
| (7) | In July 2014, the Company repaid the entire principal amount. In November 2014, the Company obtained a new mortgage note maturing in November 2019. |
| |
| (8) | Contractual interest rate represents a weighted average. |
| |
| (9) | An aggregate principal amount of $7.4 billion is comprised of 41 senior mortgage notes totaling $6.1 billion and 15 mezzanine mortgage notes totaling $1.3 billion. |
| |
| (10) | Represents borrowings in N-Star CDOs. |
| |
| (11) | Represents final maturity taking into consideration the Company’s three one-year extension options. |
| |
| (12) | In October 2014, borrowings were repaid upon sale of the property. |
| |
| (13) | In February 2015, the financing was modified extending the maturity date to April 2015. |
| |
| (14) | In March 2014 and May 2014, the Company deconsolidated N-Star CDOs V and III, respectively, which resulted in the deconsolidation of its CDO bonds payable. Refer to Note 3 for further disclosure. |
| |
| (15) | Secured by collateral relating to a borrowing base comprised primarily of unlevered CRE debt and securities investments with a carrying value of $649.0 million as of December 31, 2014. |
| |
| (16) | Represents the respective fixed rate applicable to each borrowing under the Corporate Term Facility. |
| |
| (17) | The initial maturity date is July 30, 2015, with three one-year extensions at the Company’s option, which may be exercised upon the satisfaction of certain customary conditions set forth in the governing documents. |
| |
| (18) | Represents the weighted average contractual interest rate as of December 31, 2014, which varies based on the asset type and characteristics and ranges from one-month LIBOR plus 3.95% to 5.95%. |
NORTHSTAR REALTY FINANCE CORP. AND SUBSIDIARIES
NOTES TO CONSOLIDATED FINANCIAL STATEMENTS (Continued)
| |
| (19) | Recourse solely with respect to certain types of loans as defined in the governing documents. |
| |
| (20) | In March 2014, $172.5 million principal amount of the 7.50% Notes were exchanged for $481.1 million principal amount of Senior Notes, which were paid off in cash at maturity on September 30, 2014. |
| |
| (21) | Junior subordinated notes Trusts I, II, III and IV have a fixed interest rate for periods ranging from June 2015 to September 2016, when the interest rate will change to floating and reset quarterly at rates ranging from three-month LIBOR plus 2.80% to 3.25%. |
The following table presents scheduled principal on borrowings, based on final maturity as of December 31, 2014 (dollars in thousands):
|
| | | | | | | | | | | | | | | | | | | | | | | | | | | | |
| Years ending December 31: | | Total |
| Mortgage and Other Notes Payable | | CDO Bonds Payable | | Securitization Bonds Payable | | Credit Facilities | | Exchangeable Senior Notes(1) | | Junior Subordinated Notes |
| 2015 | | $ | 116,376 |
| | $ | 116,376 |
| | $ | — |
| | $ | — |
| | $ | — |
| | $ | — |
| | $ | — |
|
| 2016 | | 106,808 |
| | 106,808 |
| | — |
| | — |
| | — |
| | — |
| | — |
|
| 2017 | | 1,009,485 |
| | 356,530 |
| | — |
| | — |
| | 640,000 |
| | 12,955 |
| | — |
|
| 2018 | | 125,781 |
| | 33,001 |
| | — |
| | — |
| | 92,780 |
| | — |
| | — |
|
| 2019 | | 3,072,140 |
| | 3,071,140 |
| | — |
| | — |
| | — |
| | 1,000 |
| | — |
|
| Thereafter | | 5,761,970 |
| | 4,847,430 |
| | 560,959 |
| | 41,831 |
| | — |
| | 31,633 |
| | 280,117 |
|
| Total | | $ | 10,192,560 |
| | $ | 8,531,285 |
| | $ | 560,959 |
| | $ | 41,831 |
| | $ | 732,780 |
| | $ | 45,588 |
| | $ | 280,117 |
|
____________________________________________________________
| |
| (1) | The 7.25% Notes, 8.875% Notes and 5.375% Notes have a final maturity date of June 15, 2027, June 15, 2032 and June 15, 2033, respectively. The above table reflects the holders’ repurchase rights which may require the Company to repurchase the 7.25% Notes, 8.875% Notes and 5.375% Notes on June 15, 2017, June 15, 2019 and June 15, 2023, respectively. |
Corporate Credit Facilities
In August 2014, the Company and certain of its subsidiaries entered into a corporate revolving credit facility (“Corporate Revolving Credit Facility”) with certain commercial bank lenders, with a total commitment amount of $500.0 million for a three-year term. Corporate Revolving Credit Facility is secured by collateral relating to a borrowing base and also includes guarantees by certain subsidiaries of the Company. As of December 31, 2014 and February 24, 2015, $285.0 million and $305.0 million of financing remains undrawn under Corporate Revolving Credit Facility, respectively. Corporate Revolving Credit Facility and related agreements contain representations, warranties, covenants, conditions precedent to funding, events of default and indemnities that are customary for agreements of these types. More specifically, the Company must maintain at least $25.0 million based on the sum of unrestricted cash or cash equivalents and undrawn availability at all times during the term of the Corporate Revolving Credit Facility.
In September 2014, the Company entered into a corporate facility agreement (“Corporate Term Facility”) with a commercial bank lender with respect to the establishment of term borrowings to be made to the Company with an aggregate principal amount of up to $500.0 million. Corporate Term Facility provides that the Company may enter into one or more credit agreements for term borrowings with varying amounts, borrowing dates, maturities and interest rates, from time to time until September 2015. Borrowings may be prepaid at any time subject to customary breakage costs. In September 2014, the Company entered into a credit agreement providing for an initial term borrowing under Corporate Term Facility in a principal amount of $275.0 million, maturing on September 19, 2017 and with a fixed interest rate of 4.60%. In December 2014, the Company entered into a credit agreement providing for an additional term borrowing under Corporate Term Facility in a principal amount of $150.0 million, maturing on September 19, 2017 and with a fixed interest rate of 4.55%. As of December 31, 2014 and February 24, 2015, $75.0 million of financing remains undrawn under Corporate Term Facility. Corporate Term Facility and related agreements contain representations, warranties, covenants, conditions precedent to funding, events of default and indemnities that are customary for agreements of these types.
Loan Facilities
In July 2012, a subsidiary of the Company entered into a credit and security agreement (“Loan Facility 1”) of $40.0 million on a non-recourse basis, subject to certain exceptions, to finance first mortgage loans and senior loan participations secured by commercial real estate. In connection with Loan Facility 1, the Company agreed to guarantee interest payments and the customary obligations under Loan Facility 1 if either the Company or its affiliates engage in certain customary bad acts. In addition, the Company pledged its interests in its borrowing subsidiary as collateral. Loan Facility 1 and related agreements contain representations, warranties, covenants, conditions precedent to funding, events of default and indemnities that are customary for agreements of these types. More specifically, the Company must maintain at least $3.75 million and as much as $7.5 million in unrestricted cash, or other eligible investments, at all times during the term of Loan Facility 1.
NORTHSTAR REALTY FINANCE CORP. AND SUBSIDIARIES
NOTES TO CONSOLIDATED FINANCIAL STATEMENTS (Continued)
In March 2013, a subsidiary of the Company entered into a master repurchase agreement (“Loan Facility 2”) of $200.0 million to finance first mortgage loans and senior interests secured by commercial real estate. In connection with Loan Facility 2, the Company entered into a guaranty agreement under which the Company guaranteed certain of the obligations under Loan Facility 2. Loan Facility 2 and related agreements contain representations, warranties, covenants, conditions precedent to funding, events of default and indemnities that are customary for agreements of these types. More specifically, the Company must maintain at least $20.0 million in unrestricted cash or cash equivalents at all times during the term of Loan Facility 2. In addition, the Company has agreed to guarantee certain customary obligations under Loan Facility 2 if the Company or an affiliate of the Company engage in certain customary bad acts.
As of December 31, 2014, the Company had $140.6 million carrying value of loans financed with $92.8 million on the loan facilities, with $147.2 million of available borrowing under its loan facilities.
During the initial term, the loan facilities act as revolving credit facilities that can be paid down as assets repay or are sold and re-drawn upon for new investments. As of December 31, 2014, the Company was in compliance with all of its financial covenants.
Senior Notes and Exchangeable Senior Notes
In March 2014, $172.5 million principal amount of the 7.50% Notes were exchanged for $481.1 million principal amount of senior notes that matured on September 30, 2014 (the “Senior Notes”). In connection with this exchange, the Company recorded a loss of $22.4 million in realized gain (loss) on investments and other in the consolidated statements of operations. On September 30, 2014, the Company repaid the Senior Notes in cash, including interest, in the amount of $488.3 million.
In June 2007, the Company issued $172.5 million of 7.25% exchangeable senior notes (“7.25% Notes”) which were offered in accordance with Rule 144A under the Securities Act of 1933, as amended (“Rule 144A”), of which $13.0 million remains outstanding as of December 31, 2014. The 7.25% Notes may be exchangeable upon the occurrence of specified events, and at any time on or after June 15, 2017, and prior to the close of business on the second business day immediately preceding the maturity date, into cash or common stock of the Company, or a combination thereof, if any, at the Company’s option. The exchange price as of December 31, 2014 was $14.71 per share.
In June 2012, the Company issued $75.0 million of 8.875% exchangeable senior notes (“8.875% Notes”) which were offered in accordance with Rule 144A for net proceeds of $72.0 million, of which $1.0 million remains outstanding as of December 31, 2014. In July 2012, the underwriters exercised their over-allotment option resulting in the issuance of an additional $7.0 million of the 8.875% Notes for net proceeds of $6.8 million. The 8.875% Notes may be exchangeable upon the occurrence of specified events, and at any time on or after June 15, 2019, and prior to the close of business on the second business day immediately preceding the maturity date, into cash or common stock of the Company, or a combination thereof, if any, at the Company’s option. The exchange price as of December 31, 2014 was $5.19 per share.
In June 2013, the Company issued $300.0 million of 5.375% exchangeable senior notes (“5.375% Notes”) which were offered in accordance with Rule 144A for net proceeds of $290.5 million, of which $31.6 million remains outstanding as of December 31, 2014. In July 2013, the Company issued an additional $45.0 million of the 5.375% Notes as a result of the full over-allotment option being settled. Net proceeds from the exercise of the over-allotment option was $43.7 million. The 5.375% Notes may be exchangeable upon the occurrence of specified events, and at any time on or after June 15, 2023, and prior to the close of business on the second business day immediately preceding the maturity date, into cash or common stock of the Company, or a combination thereof, if any, at the Company’s option. The exchange price as of December 31, 2014 was $8.68 per share.
All of the Company’s outstanding exchangeable senior notes contain unconditional guarantees by the Company on an unsecured and unsubordinated basis.
NORTHSTAR REALTY FINANCE CORP. AND SUBSIDIARIES
NOTES TO CONSOLIDATED FINANCIAL STATEMENTS (Continued)
The following table presents the components of outstanding exchangeable senior notes as of December 31, 2014 and 2013 (dollars in thousands):
|
| | | | | | | | | | | | | | | | | | | | | | | | |
| | | December 31, 2014 | | December 31, 2013 |
| | | Principal Amount | | Unamortized Discount(1) | | Carrying Value | | Principal Amount | | Unamortized Discount | | Carrying Value |
| 7.25% Notes | | $ | 12,955 |
| | $ | — |
| | $ | 12,955 |
| | $ | 12,955 |
| | $ | — |
| | $ | 12,955 |
|
| 7.50% Notes | | — |
| | — |
| | — |
| | 172,500 |
| | (7,134 | ) | | 165,366 |
|
| 8.875% Notes | | 1,000 |
| | (17 | ) | | 983 |
| | 13,360 |
| | (292 | ) | | 13,068 |
|
| 5.375% Notes | | 31,633 |
| | (3,809 | ) | | 27,824 |
| | 345,000 |
| | (45,416 | ) | | 299,584 |
|
| Total | | $ | 45,588 |
| | $ | (3,826 | ) | | $ | 41,762 |
| | $ | 543,815 |
| | $ | (52,842 | ) | | $ | 490,973 |
|
______________________
| |
| (1) | The remaining amortization period for the 7.25% Notes, 8.875% Notes and 5.375% Notes is 2.2 years, 5.5 years and 9.5 years, respectively. |
As of December 31, 2014 and 2013, the aggregate carrying value of the equity components of the exchangeable senior notes is $23.7 million and $25.9 million, respectively, which is recorded as a component of additional paid-in capital. The following table presents the components of interest expense related to outstanding exchangeable senior notes for the years ended December 31, 2014, 2013 and 2012 (dollars in thousands):
|
| | | | | | | | | | | | |
| | | Interest and Amortization Expense |
| Years Ended | | Interest Expense | | Amortization Expense(1) | | Total Interest Expense |
| 2014 | | $ | 15,812 |
| | $ | 7,542 |
| | $ | 23,354 |
|
| 2013 | | 32,475 |
| | 8,416 |
| | 40,891 |
|
| 2012 | | 22,204 |
| | 5,025 |
| | 27,229 |
|
_________________________
| |
| (1) | The effective interest rate of the 7.25% Notes, 8.875% Notes and 5.375% Notes was 8.0%, 9.4% and 7.3% for the year ended December 31, 2014, respectively. |
The following table presents the Company’s exchangeable senior notes exchanged for common stock during the year ended December 31, 2014 (dollars in thousands):
|
| | | | | | | | | | | |
| | | Principal Amount Exchanged | | Common Shares(1) | | Realized Gain (Loss) |
| 8.875% Notes | | $ | 12,360 |
| | 1,337,100 |
| | $ | (2,800 | ) |
| 5.375% Notes | | 313,367 |
| | 23,570,229 |
| | (40,533 | ) |
| Total | | $ | 325,727 |
| | 24,907,329 |
| | $ | (43,333 | ) |
___________________________
| |
| (1) | Adjusted for the Reverse Split effected on June 30, 2014. |
| |
| 10. | Spin-off of Asset Management Business |
In connection with the spin-off of the Company’s asset management business, $179.5 million of assets were transferred and $21.1 million of liabilities were assumed by NSAM. Included in the assets transferred was $118.7 million of cash representing the initial capitalization amount of NSAM upon completion of the spin-off, including an amount related to transaction costs to be paid by NSAM. Such transaction costs were expensed by NSAM upon completion of the spin-off and included legal, accounting, tax and other professional services and relocation and start-up costs.
The following table presents a carve-out of revenues and expenses associated with NSAM and included in discontinued operations in the Company’s consolidated statements of operations. Such amounts exclude the effect of any fees that NSAM began earning in connection with the management agreement with the Company upon completion of the spin-off (dollars in thousands):
|
| | | | | | | | | | | |
| | Years Ended December 31, |
| | 2014(1) | | 2013 | | 2012 |
| Total revenues | $ | 56,013 |
| | $ | 89,938 |
| | $ | 50,761 |
|
| Total expenses | 63,216 |
| | 90,343 |
| | 68,083 |
|
| NSAM income (loss) in discontinued operations | $ | (7,203 | ) | | $ | (405 | ) | | $ | (17,322 | ) |
__________________
| |
| (1) | Represents six months of total revenues and expenses of NSAM included in discontinued operations prior to the spin-off on June 30, 2014. |
NORTHSTAR REALTY FINANCE CORP. AND SUBSIDIARIES
NOTES TO CONSOLIDATED FINANCIAL STATEMENTS (Continued)
Total revenues include asset management and other fee income from NSAM Sponsored Companies earned prior to the spin-off. In connection with the spin-off, the advisory agreements between the Company and each of the NSAM Sponsored Companies were terminated and affiliates of NSAM entered into new advisory agreements with each of the NSAM Sponsored Companies on substantially the same terms as those in effect at the time of the spin-off.
Total revenues also include selling commissions and dealer manager fees earned by selling equity in the NSAM Sponsored Companies through NorthStar Securities. As part of the Distribution to NSAM, NorthStar Securities became a subsidiary of NSAM. Pursuant to dealer manager agreements between NorthStar Securities and the NSAM Sponsored Companies, the Company generally received selling commissions of up to 7% of gross offering proceeds raised. The Company reallowed all selling commissions earned to participating broker-dealers. In addition, the Company also generally received a dealer manager fee of up to 3% of gross offering proceeds raised, a portion of which is typically reallowed to participating broker-dealers. Total expenses include commission expense representing fees to participating broker-dealers with whom NorthStar Securities has selling agreements and commissions to employees of NorthStar Securities.
In addition, total expenses primarily included an allocation of indirect expenses of the Company to NSAM related to managing the NSAM Sponsored Companies and owning NorthStar Securities, including salaries, equity-based compensation and other general and administrative expenses (primarily occupancy and other costs) based on an estimate had the asset management business been run as an independent entity.
11.Related Party Arrangements
NorthStar Asset Management Group
Management Agreement
Upon completion of the spin-off of the Company’s asset management business, the Company entered into a management agreement with an affiliate of NSAM for an initial term of 20 years, which will be automatically renewed for additional 20-year terms each anniversary thereafter unless earlier terminated. As asset manager, NSAM is responsible for the Company’s day-to-day operations, subject to the supervision of the Company’s board of directors. Through its global network of subsidiaries and branch offices, NSAM performs services and activities relating to, among other things, investments and financing, portfolio management and other administrative services, such as accounting and investor relations, to the Company and its subsidiaries other than the Company’s CRE loan origination business. The management agreement with NSAM provides for a base management and incentive fee.
For the six months ended December 31, 2014, the Company incurred $79.4 million related to the base management fee, $41.4 million of which is recorded in due to related party on the consolidated balance sheets. The management contract with NSAM commenced on July 1, 2014, and as such, there were no management fees incurred for the six months ended June 30, 2014. The base management fee to NSAM will increase subsequent to December 31, 2014 by an amount equal to 1.5% per annum of the sum of:
| |
| • | cumulative net proceeds of all future common equity and preferred equity issued by the Company; |
NORTHSTAR REALTY FINANCE CORP. AND SUBSIDIARIES
NOTES TO CONSOLIDATED FINANCIAL STATEMENTS (Continued)
| |
| • | equity issued by the Company in exchange or conversion of exchangeable senior notes based on the stock price at the date of issuance; |
| |
| • | any other issuances by the Company of common equity, preferred equity or other forms of equity, including but not limited to limited partnership interests in an operating partnership (“LTIP units”) (excluding equity-based compensation, but including issuances related to an acquisition, investment, joint venture or partnership); and |
| |
| • | cumulative cash available for distribution (“CAD”) of the Company in excess of cumulative distributions paid on common stock, LTIP units or other equity awards beginning the first full calendar quarter after the spin-off. |
Additionally, the Company’s equity interest in RXR Realty and Aerium is structured so that NSAM is entitled to the portion of distributable cash flow from each investment in excess of the $10 million minimum annual base amount.
For the six months ended December 31, 2014, the Company incurred $3.3 million related to the incentive management fee, $2.0 million of which is recorded in due to related party on the consolidated balance sheets. The incentive management fee is calculated and payable quarterly in arrears in cash, equal to:
| |
| • | the product of: (a) 15% and (b) the Company’s CAD before such incentive fee, divided by the weighted average shares outstanding for the calendar quarter, when such amount is in excess of $0.39 per share but less than $0.45 per share; plus |
| |
| • | the product of: (a) 25% and (b) the Company’s CAD before such incentive fee, divided by the weighted average shares outstanding for the calendar quarter, when such amount is equal to or in excess of $0.45 per share; |
| |
| • | multiplied by the Company’s weighted average shares outstanding for the calendar quarter. |
In addition, NSAM may also earn an incentive fee from the Company’s healthcare investments in connection with NSAM’s Healthcare Strategic Partnership (refer to below).
Weighted average shares represents the number of shares of the Company’s common stock, LTIP units or other equity-based awards (with some exclusions), outstanding on a daily weighted average basis. With respect to the base management fee, all equity issuances are allocated on a daily weighted average basis during the fiscal quarter of issuances.
Furthermore, if the Company were to spin-off any asset or business in the future, including the Proposed European Spin, such entity would be managed by NSAM on terms substantially similar to those set forth in the management agreement between the Company and NSAM. The management agreement further provides that the aggregate base management fee in place immediately after any future spin-off will not be less than the aggregate base management fee in place at the Company immediately prior to such spin-off.
Payment of Costs and Expenses and Expense Allocation
The Company is responsible for all of its direct costs and expenses and will reimburse NSAM for costs and expenses incurred by NSAM on its behalf. In addition to the Company’s costs and expenses, following the Distribution, the Company is obligated to reimburse NSAM for additional costs and expenses incurred by NSAM for an amount not to exceed the following: (i) 20% of the combined total of: (a) the Company’s general and administrative expenses as reported in its consolidated financial statements excluding: (1) equity-based compensation expense, (2) non-recurring items, (3) fees payable to NSAM under the terms of the management agreement and (4) any allocation of expenses from the Company (“NorthStar Realty G&A”); and (b) NSAM’s general and administrative expenses as reported in its consolidated financial statements, excluding equity-based compensation expense and adding back any costs or expenses allocated to any managed company of NSAM, less (ii) the NorthStar Realty G&A. For the six months ended December 31, 2014, NSAM allocated $5.2 million to the Company, of which $4.0 million is recorded in due to related party on the consolidated balance sheets. In addition, the Company will also pay directly or reimburse NSAM for an allocable portion of any severance paid pursuant to any employment, consulting or similar service agreements in effect between NSAM and any of its executives, employees or other services providers.
Investment Opportunities
Under the management agreement, the Company agreed to make available to NSAM for the benefit of NSAM and its managed companies, including the Company, all investment opportunities sourced by the Company. NSAM agreed to fairly allocate such opportunities among NSAM’s managed companies, including the Company and NSAM in accordance with an investment allocation policy. Pursuant to the management agreement, the Company is entitled to fair and reasonable compensation for its services in connection with any loan origination opportunities sourced by the Company, which may include first mortgage loans, subordinate mortgage interests, mezzanine loans and preferred equity interests, in each case relating to commercial real estate.
NORTHSTAR REALTY FINANCE CORP. AND SUBSIDIARIES
NOTES TO CONSOLIDATED FINANCIAL STATEMENTS (Continued)
NSAM provides services with regard to such areas as payroll, human resources and employee benefits, financial systems management, treasury and cash management, accounts payable services, telecommunications services, information technology services, property management services, legal and accounting services and various other corporate services to the Company as it relates to its loan origination business for CRE debt.
Credit Agreement
In connection with the Distribution, the Company entered into a revolving credit agreement with NSAM pursuant to which the Company makes available to NSAM, on an “as available basis,” up to $250 million of financing for a five year term at LIBOR plus 3.50%. The revolving credit facility is unsecured. NSAM expects to use the proceeds for general corporate purposes, including potential future acquisitions. In addition, NSAM may use the proceeds to acquire assets on behalf of its managed companies, including the Company, that it intends to allocate to such managed company but for which such managed company may not then have immediately available funds. The terms of the revolving credit facility contain various representations, warranties, covenants and conditions, including the condition that the Company’s obligation to advance proceeds to NSAM is dependent upon the Company and its affiliates having at least $100 million of either unrestricted cash and cash equivalents or amounts available under committed lines of credit, after taking into account the amount NSAM seeks to draw under the facility. As of December 31, 2014, the Company has not funded any amounts to NSAM in connection with this agreement.
Healthcare Strategic Joint Venture
In January 2014, NSAM entered into a long-term strategic partnership with James F. Flaherty III, former Chief Executive Officer of HCP, Inc., focused on expanding the Company’s healthcare business into a preeminent healthcare platform (“Healthcare Strategic Partnership”). In connection with the partnership, Mr. Flaherty oversees and seeks to grow both the Company’s healthcare real estate portfolio and the portfolio of NorthStar Healthcare. In connection with entering into the partnership, the Company granted Mr. Flaherty certain RSUs (refer to Note 12). The Healthcare Strategic Partnership is entitled to incentive fees ranging from 20% to 25% above certain hurdles for new and existing healthcare real estate investments held by the Company. For the year ended December 31, 2014, the Company did not incur any incentive fees related to the Healthcare Strategic Partnership.
N-Star CDOs
The Company earns certain collateral management fees from the N-Star CDOs primarily for administrative services. Such fees are recorded in other revenue in the consolidated statements of operations. For the years ended December 31, 2014, 2013 and 2012, the Company earned $5.9 million, $11.1 million and $14.4 million in fee income, respectively, of which $2.6 million, $10.4 million and $14.4 million, respectively, were eliminated in consolidation. Prior to the third quarter 2013, all amounts were eliminated in consolidation as all of the N-Star CDOs were consolidated by the Company.
Additionally, the Company earns interest income from the N-Star CDO bonds and N-Star CDO equity in deconsolidated N-Star CDOs. For the years ended December 31, 2014 and 2013, the Company earned $71.6 million and $11.7 million of interest income from such investments in deconsolidated N-Star CDOs.
Securitization 2012-1
The Company entered into an agreement with NorthStar Income that provides that both the Company and NorthStar Income receive the economic benefit and bear the economic risk associated with the investments each contributed into Securitization 2012-1, a securitization transaction entered into by the Company and NorthStar Income. In both cases, the respective retained equity interest of the Company and NorthStar Income is subordinate to interests of the investment-grade bondholders of Securitization 2012-1 and the investment-grade bondholders have no recourse to the general credit of the Company or NorthStar Income. In the event that either the Company or NorthStar Income suffer a complete loss of the retained equity interests in Securitization 2012-1, any additional losses would be borne by the remaining retained equity interests held by the Company or NorthStar Income, as the case may be, prior to the investment-grade bondholders.
American Healthcare Investors
In December 2014, NSAM acquired an approximate 44% interest in American Healthcare Investors LLC (“AHI”) and James F. Flaherty III, a strategic partner of NSAM acquired a 9% interest in AHI. AHI is a healthcare-focused real estate investment management firm that co-sponsored and advised Griffin-American, until Griffin-American was acquired by the Company and NorthStar Healthcare. In connection with this acquisition, AHI will provide certain management and related services, including property management, to NSAM, NorthStar Healthcare and the Company to assist NSAM in managing the current and future
NORTHSTAR REALTY FINANCE CORP. AND SUBSIDIARIES
NOTES TO CONSOLIDATED FINANCIAL STATEMENTS (Continued)
healthcare assets (excluding any joint venture assets) acquired by the Company and, subject to certain conditions, other NSAM managed companies.
Island Hospitality Management
In January 2015, NSAM acquired an approximate 45% interest in Island Hospitality Management Inc. (“Island”). Island is a leading, independent select service hotel management company that currently manages 143 hotel properties, representing $3.7 billion, of which 101 hotel properties are owned by the Company.
Legacy Commercial
In September 2014, the Company entered into a debt and equity investment with Legacy Commercial, comprised of a 40% interest in entities affiliated with Legacy Commercial (refer to Note 7) and loans to certain Legacy Commercial entities totaling $30.0 million (collectively the “Legacy Investment”). C. Preston Butcher, a former director of the Company, held certain preferred and other significant interests in Legacy Commercial and was the chairman of the board of directors and chief executive officer of Legacy Commercial. $14.8 million of the proceeds from the Legacy Investment will be used by the Legacy Commercial Entities for future investments, subject to certain approval rights held by the Company and $15.2 million of the proceeds of the Legacy Investment was used by the Legacy Commercial Entities to redeem the majority of the interests held by Mr. Butcher and a family limited partnership controlled by Mr. Butcher in the Legacy Commercial Entities. The Legacy Investment was made on a pari passu basis with the investment held by the two remaining partners in Legacy Commercial, Mr. Butcher and certain employees of Legacy Commercial. The Company owns 75% of the senior debt and preferred equity and 40% of the common equity issued by the applicable Legacy Commercial Entities. Mr. Butcher and a family limited partnership controlled by Mr. Butcher received total consideration of $30.0 million, of which $14.8 million was in the form of a cash distribution from the Legacy Commercial Entities and $15.2 million was funded from the Legacy Investment. At closing, Mr. Butcher retained a 15.3% indirect interest in the senior debt and 15.3% indirect interest in the preferred equity issued by the applicable Legacy Commercial Entities. In addition, a family limited partnership controlled by Mr. Butcher indirectly owns 10% of the common equity issued by the applicable Legacy Commercial Entities. The transaction also includes up to an additional $10.0 million in future preferred loans from the Company for additional real estate investments, subject to the Company’s approval. In connection with this transaction, Mr. Butcher stepped down as chairman and chief executive officer of Legacy Commercial and retains no ongoing voting or decision making rights. Subject to certain approval rights held by the Company, Mr. Butcher has been hired as an employee of a Legacy Commercial Entity and Legacy Commercial is now controlled by the two remaining principals. Mr. Butcher retained his ownership interests in Legacy Partners Residential, Inc. and certain other related entities and companies that are not owned by Legacy Commercial or any Legacy Commercial Entity in which the Company is making investments.
NorthStar Income II
In January 2014, the Company sold a $9.0 million pari passu participation in a first mortgage loan at cost originated by the Company to NorthStar Income II. Additionally, in April 2014, the Company sold a $5.0 million pari passu participation in a first mortgage loan at cost to NorthStar Income II. Such sales were approved by the independent board of directors of NorthStar Income II.
West Point Partners
In June 2014, the Company paid $0.8 million to West Point Partners LLC (“West Point Partners”) in connection with its services facilitating the acquisition of the Innkeepers Portfolio for an aggregate purchase price of approximately $1.1 billion, including all costs, reserves and escrows (refer to Note 4). West Point Partners is a real estate investment and advisory firm based in New York. Sridhar Sambamurthy, who was a member of the board of directors of the Company at the time of such payment, is managing principal and co-founder of West Point Partners and owns a 50% interest in that company and consequently ceased to be independent at that time. Mr. Sambamurthy is no longer a member of the Company’s board of directors.
| |
| 12. | Equity-Based Compensation |
Impact of the Reorganization and Spin-off
The Company has issued equity-based awards to directors, officers, employees, consultants and advisors pursuant to the NorthStar Realty Finance Corp. 2004 Omnibus Stock Incentive Plan (the “Stock Plan”) and the NorthStar Realty Executive Incentive Bonus Plan, as amended (the “Plan” and collectively the “NorthStar Realty Equity Plans”). All of the vested and
NORTHSTAR REALTY FINANCE CORP. AND SUBSIDIARIES
NOTES TO CONSOLIDATED FINANCIAL STATEMENTS (Continued)
unvested equity-based awards granted by the Company prior to the spin-off remain outstanding following the Reorganization and the spin-off. Appropriate adjustments were made to all awards to reflect the Reorganization, the Reverse Split and the spin-off. Pursuant to the Reorganization, Old LTIP Units were converted into an equal number of shares of common stock of NRFC Sub-REIT Corp. (refer to Note 14) and holders of such shares received an equal number of shares of NSAM’s common stock in connection with the spin-off, all of which generally remain subject to the same vesting and other terms that applied prior to the spin-off. Old LTIP Units that remain subject to vesting are herein referred to as restricted stock. Deferred LTIP Units are equity awards representing the right to receive either LTIP units in the Company’s successor operating partnership or, if such LTIP units are not available upon settlement of the award, shares of common stock of the Company. Equity and equity-based awards relating to the Company’s common stock, such as RSUs and such Deferred LTIP Units, were adjusted to also relate to an equal number of shares of NSAM’s common stock, but otherwise generally remain subject to the same vesting and other terms that applied prior to the spin-off. Vesting conditions for outstanding awards have been adjusted to reflect the impact of NSAM in terms of employment for service based on awards and total stockholder return for performance-based awards with respect to periods after the spin-off.
Following the spin-off, the Company and the compensation committee of its board of directors (the “Committee”) continues to administer all awards issued under the NorthStar Realty Equity Plans but NSAM is obligated to issue shares of NSAM’s common stock or other equity awards of its subsidiaries or make cash payments in lieu thereof with respect to dividend or distribution equivalent obligations to the extent required by such awards previously issued under the NorthStar Realty Equity Plans. These awards will continue to be governed by the NorthStar Realty Equity Plans, as applicable, and shares of NSAM’s common stock issued pursuant to these awards will not be issued pursuant to, or reduce availability, under the NorthStar Realty Equity Plans.
Additionally, in connection with the spin-off and pursuant to an employee matters agreement, the Company agreed to make the cash portion of any incentive payment to NSAM’s employees for services performed in 2014 through the date of the spin-off. As a result, the Company is responsible for paying approximately 50% of the 2014 annual cash and long-term bonuses earned under the NorthStar Asset Management Group Inc. Executive Incentive Bonus Plan (“NSAM Bonus Plan”). Long-term bonuses will be paid to executives in both Company and NSAM equity-based awards, subject to performance-based and time-based vesting conditions over the four-year performance period from January 1, 2014 through December 31, 2017.
Furthermore, pursuant to the management agreement with NSAM, the Company will pay directly or reimburse NSAM for up to 50% of any long-term bonus or other compensation that NSAM's compensation committee determines shall be paid and/or settled in the form of equity and/or equity-based compensation to NSAM's executives, employees and service providers in connection with the performance of services under the management agreement. At the discretion of the Committee, this compensation may be granted in shares of the Company's restricted stock, restricted stock units, LTIP units or other forms of equity compensation or stock-based awards.
All of the adjustments made in connection with the Reorganization, Reverse Split and the spin-off were deemed to be equitable adjustments pursuant to anti-dilution provisions in accordance with the terms of the NorthStar Realty Equity Plans. As a result, there was no incremental value attributed to these adjustments and these adjustments do not impact the amount recorded for equity-based compensation expense for the years ended December 31, 2014, 2013 and 2012.
NORTHSTAR REALTY FINANCE CORP. AND SUBSIDIARIES
NOTES TO CONSOLIDATED FINANCIAL STATEMENTS (Continued)
The following summarizes the equity-based compensation plans and related expenses.
All share amounts disclosed below have been retrospectively adjusted to reflect the Reverse Split.
NorthStar Realty Equity Plans
Omnibus Stock Incentive Plan
In September 2004, the board of directors of the Company adopted the Stock Plan, and such plan, as amended and restated, was further adopted by the board of directors of the Company on April 17, 2013 and approved by the stockholders on May 29, 2013. The Stock Plan provides for the issuance of stock-based incentive awards, including incentive stock options, non-qualified stock options, stock appreciation rights, shares of common stock of the Company, in the form of restricted stock and other equity-based awards such as LTIP units or any combination of the foregoing. The eligible participants in the Stock Plan include directors, officers, employees, consultants and advisors of the Company.
As of December 31, 2014, 3,886,770 shares of common stock remain available for issuance pursuant to the Stock Plan, which includes shares reserved for issuance upon settlement of outstanding Deferred LTIP Units and RSUs and 686,262 shares of restricted stock (net of forfeitures), after giving effect to the Reverse Split. As noted above, in connection with the spin-off, each outstanding Old LTIP Unit received an equal number of shares of NSAM’s common stock and each Deferred LTIP Unit award was adjusted to also relate to an equal number of Deferred LTIP Units in NSAM. Holders of shares of restricted stock or Deferred LTIP Units are entitled to receive dividends or dividend equivalents with respect to both the Company and NSAM on shares of restricted stock and vested and unvested Deferred LTIP Units for as long as such shares and Deferred LTIP Units remain outstanding.
Incentive Compensation Plan
In July 2009, the Committee approved the material terms of the Plan for the Company’s executive officers and other employees. Pursuant to the Plan, an incentive pool was established each calendar year through 2013. The size of the incentive pool was calculated as the sum of: (a) 1.75% of the Company’s “adjusted equity capital” for the year; and (b) 25% of the Company’s adjusted funds from operations, as adjusted, above a 9% return hurdle on adjusted equity capital. Payout from the incentive pool is or was subject to achievement of additional performance and/or time-based goals summarized below.
The portion of the incentive pool for the executive officers was divided into the following three separate incentive compensation components: (a) an annual cash bonus, tied to annual performance of the Company and paid prior to or shortly after completion of the year-end audit (“Annual Bonus”); (b) a deferred bonus, determined based on the same year’s performance, but paid 50% following the close of each of the first and second years after such incentive pool is determined, subject to the participant’s continued employment through each payment date (“Deferred Bonus”); and (c) a long-term incentive in the form of RSUs, LTIP units and/or Deferred LTIP Units. RSUs are subject to the Company achieving cumulative performance hurdles and/or total stockholder return hurdles established by the Committee for a three- or four-year period, subject to the participant’s continued employment through the payment date. Upon the conclusion of the applicable performance period, each executive officer will receive a payout, if any, equal to the value of one share of common stock at the time of such payout, including the dividends paid with respect to a share of common stock following the first year of the applicable performance period, for each RSU actually earned (the “Long-Term Amount Value”). The Long-Term Amount Value, if any, will be paid in the form of shares of common stock or LTIP units in the Company’s successor operating partnership to the extent available under the NorthStar Realty Equity Plans and, pursuant to adjustments made in connection with the spin-off, an equal number of shares of NSAM’s common stock or LTIP units in NSAM’s operating partnership, if any, or, if all or a portion of such shares or LTIP units are not available, in cash (the “Long Term Amount Payout”). These performance based RSUs were adjusted to refer to combined total stockholder return of the Company and NSAM with respect to periods after the spin-off. Old LTIP Units (converted into common stock of the Company in the Reorganization) or Deferred LTIP Units granted as a portion of the long-term incentive are subject to vesting based on continued employment during the performance period, but are not subject to performance-based vesting hurdles.
In connection with the 2011 Plan, the Company issued 762,898 RSUs to executive officers, after giving effect to the Reverse Split, which were subject to vesting based on continued employment and achieving total stockholder return hurdles for the four-year period ending December 31, 2014. The grant date fair value was $5.40, adjusted for the Reverse Split, determined using a risk-free interest rate of 0.42%. As of December 31, 2014, the Company determined the performance hurdle was met which resulted in all of these RSUs vesting. As a result, to settle these RSUs, on January 1, 2015 the Company issued 49,149 shares of common stock, net of the minimum statutory tax withholding requirements, and the Company will issue 669,743 LTIP Units in a newly-formed operating partnership later in 2015. At the same time, the Company granted 762,898 Old LTIP Units to
NORTHSTAR REALTY FINANCE CORP. AND SUBSIDIARIES
NOTES TO CONSOLIDATED FINANCIAL STATEMENTS (Continued)
executive officers, after giving effect to the Reverse Split, which were subject to vesting in four annual installments ending on January 29, 2015. The Company also granted 302,692 Old LTIP Units (net of forfeitures), after giving effect to the Reverse Split to certain non-executive employees, which vest quarterly over three years beginning April 2012, subject to continued employment through the applicable vesting date.
In connection with the 2012 Plan, the Company issued 704,839 RSUs to executive officers, after giving effect to the Reverse Split, subject to continued employment and achieving total stockholder return hurdles for the four-year period ending December 31, 2015. The grant date fair value was $12.32, adjusted for the Reverse Split, determined using a risk-free interest rate of 0.44%. The Company does not yet know whether it is probable that such measure will be achieved and that such RSUs will be earned. Upon conclusion of the applicable performance period, each executive officer will receive the Long Term Amount Payout (if earned). In connection with the 2012 Plan, the Company granted 704,839 Old LTIP Units to executive officers, after giving effect to the Reverse Split, which were subject to vesting in four annual installments beginning on January 29, 2013, subject to the executive officer’s continued employment through the applicable vesting date, and which may not be sold prior to December 31, 2015. The Company also granted 289,975 Old LTIP Units (net of forfeitures), after giving effect to the Reverse Split, as of December 31, 2014 to certain non-executive employees which vest quarterly over three years beginning April 2013, subject to continued employment through the applicable vesting date.
In connection with the 2013 Plan, the Company issued 500,371 RSUs to executive officers, after giving effect to the Reverse Split, subject to continued employment and achieving total stockholder return hurdles for the four-year period ending December 31, 2016. The grant date fair value was $26.96, adjusted for the Reverse Split, determined using a risk-free interest rate of 0.63%. The Company does not yet know whether it is probable that such measure will be achieved and that such RSUs will be earned. Upon conclusion of the applicable performance period, each executive officer will receive the Long Term Amount Payout (if earned). In connection with the 2013 Plan, the Company also granted 500,371 Deferred LTIP Units, after giving effect to the Reverse Split, to executive officers which vest in four annual installments beginning on January 29, 2014, subject to the executive officer’s continued employment through the applicable vesting date, and may not be sold prior to December 31, 2016, and 261,577 Deferred LTIP Units, after giving effect to the Reverse Split, as of December 31, 2014 which are subject to vesting based on continued employment through December 31, 2015. The Company also granted 276,105 of Deferred LTIP Units (net of forfeitures), after giving effect to the Reverse Split, to certain non-executive employees which vest quarterly over three years beginning April 2014, subject to continued employment through the applicable vesting date.
NSAM Bonus Plan
In connection with the 2014 NSAM Bonus Plan, approximately 31.65% of the long-term bonuses are to be paid in the Company’s LTIP Units. The remainder of the long-term bonus of approximately 18.35% will also be paid by the Company by issuing RSUs. In connection with the long-term bonuses to be paid by the Company, in February 2015, the Company granted 1,038,233 Deferred LTIP Units to executive officers which vest in four annual installments beginning on December 31, 2014, subject to the executive officer’s continued employment through the applicable vesting date. The Company also granted 584,879 RSUs to executive officers, subject to continued employment and achieving total stockholder return hurdles for the four-year period ending December 31, 2017. In February 2015, the Company also granted 698,880 Deferred LTIPs to certain non-executive employees, with substantially similar terms to the executive awards subject to time based vesting conditions.
Other Issuances
Healthcare Strategic Joint Venture
In connection with entering into the Healthcare Strategic Partnership, the Company granted Mr. Flaherty 500,000 RSUs on January 22, 2014, adjusted to reflect the Reverse Split, which vest on January 22, 2019, unless certain conditions are met. In connection with the spin-off, the RSUs granted to Mr. Flaherty were adjusted to also relate to an equal number of shares of NSAM’s common stock. The RSUs are entitled to dividend equivalents prior to vesting and may be settled either in shares of common stock of the Company or in cash at the option of the Company.
Summary
The year ended December 31, 2014 includes: (i) the Company’s equity-based compensation for the six months ended December 31, 2014 following the spin-off of the Company’s historical asset management business on June 30, 2014; and (ii) the Company’s equity-based compensation for the six months ended June 30, 2014, including an allocation to NSAM recorded to discontinued operations. The Company’s historical equity-based compensation for the years ended December 31, 2013 and 2012 is prepared on the same basis as the six months ended June 30, 2014.
NORTHSTAR REALTY FINANCE CORP. AND SUBSIDIARIES
NOTES TO CONSOLIDATED FINANCIAL STATEMENTS (Continued)
The following table presents equity-based compensation expense for the years ended December 31, 2014, 2013 and 2012 (dollars in thousands):
|
| | | | | | | | | | | |
| | Years Ended December 31, |
| | 2014 | | 2013 | | 2012 |
| NorthStar Realty | $ | 24,885 |
| | $ | 11,784 |
| | $ | 8,593 |
|
Allocation to NSAM (1) | 13,745 |
| | 5,177 |
| | 4,224 |
|
| Total | $ | 38,630 |
| (2) | $ | 16,961 |
| | $ | 12,817 |
|
___________________________________________________________
| |
| (1) | Recorded in discontinued operations. The allocation to NSAM for 2014 represents equity-based compensation expense for the six months ended June 30, 2014. |
| |
| (2) | Represents $28.0 million related to the NorthStar Realty Equity Plans and $10.6 million related to the NSAM Stock Plan. |
The following table presents a summary of Old LTIP Units and Deferred LTIP Units. The balance as of December 31, 2014 represents unvested Old LTIP Units (representing shares of restricted stock) and Deferred LTIP Units that are outstanding, whether vested or not (grants in thousands):
|
| | | | | | |
| | Year Ended December 31, 2014 |
| |
Grants | | Weighted Average Grant Price(5) |
Beginning balance(1) | 4,609 |
| | $ | 14.31 |
|
Granted(2) | 1,189 |
| | 30.55 |
|
| Converted to common stock | (647 | ) | | 17.31 |
|
| Forfeited | (5 | ) | | 20.48 |
|
Vested Old LTIP Units converted to common stock in the Reorganization(3) | (3,178 | ) | | 14.52 |
|
| Vesting of restricted stock post-spin | (95 | ) | | 13.43 |
|
Ending balance/weighted average(4) | 1,873 |
| | $ | 23.25 |
|
____________________________________________________________
| |
| (1) | Includes 349,071 Old LTIP Units issued in connection with the NorthStar Realty Finance Corp. 2004 Long-Term Incentive Bonus Plan of which 333,755 Old LTIP Units have been converted. The remaining 15,316 Old LTIP Units were converted to common stock in the spin-off. |
| |
| (2) | Awards were grants in the form of Old LTIP Units for the year ended December 31, 2013 and Deferred LTIP Units for the year ended December 31, 2014. |
| |
| (3) | Represents vested Old LTIP Units that were converted to the Company’s common stock in connection with the Reorganization. |
| |
| (4) | Includes 686,185 shares of restricted stock, 227,693 vested Deferred LTIP Units and 958,966 unvested Deferred LTIP Units as of December 31, 2014. |
| |
| (5) | Amounts have been retrospectively adjusted to reflect the Reverse Split. |
As of December 31, 2014, equity-based compensation expense to be recognized over the remaining vesting period, excluding equity-based compensation expense for awards to non-employees recorded at fair value, through April 2018 is $19.1 million, provided there are no forfeitures.
Reverse Split
On June 30, 2014, the Company effected a Reverse Split of its common stock with any fractional shares settled in cash. As a result of the Reverse Split, the common stock was reduced by dividing the par value prior to the Reverse Split by two (including retrospective adjustment of prior periods) with a corresponding increase to additional paid-in capital. The par value per share of common stock remained unchanged.
All share and per share amounts disclosed in the Company’s consolidated financial statements and the accompanying notes have been retrospectively adjusted to reflect the Reverse Split, including common stock outstanding, earnings per share and shares or units outstanding related to equity-based compensation (refer to Note 12).
Common Stock
In January 2014, as part of the consideration for the investment in RXR Realty, the Company issued 677,570 shares of its common stock, after giving effect to the Reverse Split, in a private offering to an RXR Realty affiliate. Such amount was granted in December 2013 resulting in an increase to additional paid-in capital in 2013 of $17.7 million. This amount is recorded as a premium on the related CRE debt investments and is amortized to interest income over the life of the debt, using the effective interest method, in the consolidated statements of operations.
NORTHSTAR REALTY FINANCE CORP. AND SUBSIDIARIES
NOTES TO CONSOLIDATED FINANCIAL STATEMENTS (Continued)
In May 2014, the Company issued 17.25 million shares of its common stock at a public offering price of $30.90 per share, after giving effect to the Reverse Split, which includes the full over-allotment option exercised by the underwriters of the offering. The net proceeds to the Company were $519.0 million.
In June 2014, as part of the consideration for the investment in Aerium, the Company issued 208,819 shares of its common stock in a private offering to an Aerium affiliate at an agreed upon price of $32.52 per share, after giving effect to the Reverse Split, resulting in an increase to additional paid-in capital of $6.8 million or €5 million.
In June 2014, the Company settled all outstanding warrants in a cashless exercise issuing 799,500 shares of its common stock, after giving effect to the Reverse Split.
In September 2014, the Company issued 15.0 million shares of its common stock at a public offering price of $18.40 per share and received net proceeds of $268.6 million. In connection with this offering, the Company entered into a forward sale agreement with a financial institution to issue an aggregate of 30.0 million shares of its common stock, subject to certain conditions. The forward sale agreement generally provides for settlement on one or more dates specified by the Company on or prior to March 4, 2015, subject to acceleration upon the occurrence of certain events. On a settlement date, if the Company decides to physically settle all or a portion of the forward sale agreement, it will issue common stock to such financial institution at the then-applicable forward sale price multiplied by 0.995. The initial forward sale price is equal to $17.95 per share. The forward sale agreement provides that the forward sale price will be adjusted based on the federal funds rate less the stock loan rate specified in the forward sale agreement and will be decreased by amounts related to expected dividends on the Company’s common stock during the term of the forward sale agreement. As of December 31, 2014, the Company issued 23.0 million shares of common stock under this forward sale agreement for net proceeds of $403.5 million. Subsequent to year end, the Company issued the remaining 7.0 million shares of common stock under its forward sale agreement for net proceeds of $122.2 million.
In December 2014, as part of the consideration for the merger of Griffin-American, the Company issued 60.8 million shares of its common stock at a price of $18.11 per share resulting in an increase to additional paid-in capital of $1.1 billion.
Preferred Stock
The following table presents classes of cumulative redeemable preferred stock issued in a public offering and outstanding as of December 31, 2014 (dollars in thousands):
|
| | | | | | | |
| | | Number of Shares | | Amount (1) |
| Series A 8.75% | | 2,466,689 |
| | $ | 59,453 |
|
| Series B 8.25% | | 13,998,905 |
| | 323,757 |
|
Series C 8.875%(2) | | 5,000,000 |
| | 120,808 |
|
Series D 8.50%(2) | | 8,000,000 |
| | 193,334 |
|
Series E 8.75%(2) | | 10,000,000 |
| | 241,766 |
|
| Total | | 39,465,594 |
| | $ | 939,118 |
|
__________________________________
| |
| (1) | 250 million shares have been authorized and all shares have a $0.01 par value. All preferred shares have a $25 per share liquidation preference. |
| |
| (2) | The Series C, D and E shares are currently not callable. |
Dividend Reinvestment Plan
In April 2007, as amended effective January 1, 2012, the Company implemented a Dividend Reinvestment Plan (the “DRP”), pursuant to which it registered with the SEC and reserved for issuance 7,139,923 shares of its common stock, after giving effect to the Reverse Split. Pursuant to the amended terms of the DRP, stockholders are able to automatically reinvest all or a portion of their dividends for additional shares of the Company’s common stock. The Company expects to use the proceeds from the DRP for general corporate purposes. For the year ended December 31, 2014, the Company issued 9,374 shares of its common stock pursuant to the DRP, after giving effect to the Reverse Split, for gross proceeds of $0.2 million.
NORTHSTAR REALTY FINANCE CORP. AND SUBSIDIARIES
NOTES TO CONSOLIDATED FINANCIAL STATEMENTS (Continued)
Dividends
The following table presents dividends declared (on a per share basis) for the years ended December 31, 2014, 2013 and 2012:
|
| | | | | | | | | | | | | | | | | | | | | | | | | | |
Common Stock(1) | | Preferred Stock |
| | | | | | | Dividend Per Share |
Declaration Date | | Dividend Per Share(2) | | Declaration Date | | Series A | | Series B | | Series C | | Series D | | Series E |
| 2014 | | | | | | | | | | | | | | |
| February 26 | | $ | 0.50 |
| | January 29 | | $ | 0.54688 |
| | $ | 0.51563 |
| | $ | 0.55469 |
| | $ | 0.53125 |
| | N/A |
|
| May 7 | | $ | 0.50 |
| | May 7 | | $ | 0.54688 |
| | $ | 0.51563 |
| | $ | 0.55469 |
| | $ | 0.53125 |
| | N/A |
|
| August 6 | | $ | 0.50 |
| | August 6 | | $ | 0.54688 |
| | $ | 0.51563 |
| | $ | 0.55469 |
| | $ | 0.53125 |
| | $ | 0.54690 |
|
| October 29 | | $ | 0.40 |
| (3) | October 29 | | $ | 0.54688 |
| | $ | 0.51563 |
| | $ | 0.55469 |
| | $ | 0.53125 |
| | $ | 0.54690 |
|
| | | | | | | | | | | | | | | |
| 2013 | | | | | | | | | | | | | | |
| February 13 | | $ | 0.36 |
| | February 1 | | $ | 0.54688 |
| | $ | 0.51563 |
| | $ | 0.76424 |
| | N/A |
| | N/A |
|
| May 1 | | $ | 0.38 |
| | May 1 | | $ | 0.54688 |
| | $ | 0.51563 |
| | $ | 0.55469 |
| | $ | 0.20660 |
| | N/A |
|
| July 31 | | $ | 0.40 |
| | July 31 | | $ | 0.54688 |
| | $ | 0.51563 |
| | $ | 0.55469 |
| | $ | 0.53125 |
| | N/A |
|
| October 30 | | $ | 0.42 |
| | October 30 | | $ | 0.54688 |
| | $ | 0.51563 |
| | $ | 0.55469 |
| | $ | 0.53125 |
| | N/A |
|
| | | | | | | | | | | | | | | |
| 2012 | | | | | | | | | | | | | | |
| February 15 | | $ | 0.27 |
| | January 30 | | $ | 0.54688 |
| | $ | 0.51563 |
| | N/A |
| | N/A |
| | N/A |
|
| May 2 | | $ | 0.30 |
| | May 2 | | $ | 0.54688 |
| | $ | 0.51563 |
| | N/A |
| | N/A |
| | N/A |
|
| August 2 | | $ | 0.32 |
| | August 2 | | $ | 0.54688 |
| | $ | 0.51563 |
| | N/A |
| | N/A |
| | N/A |
|
| November 1 | | $ | 0.34 |
| | November 1 | | $ | 0.54688 |
| | $ | 0.51563 |
| | N/A |
| | N/A |
| | N/A |
|
______________________
| |
| (1) | For the year ended December 31, 2014, approximately 17% of distributions paid was ordinary income and 83% was a return of capital. For the year ended December 31, 2013, 100% of distributions paid was a return of capital. For the year ended December 31, 2012, 100% of distributions paid was ordinary income. |
| |
| (2) | Adjusted for the Reverse Split effected on June 30, 2014. |
| |
| (3) | Represents the first dividend subsequent to the spin-off of NSAM. |
Earnings Per Share
The following table presents EPS for the years ended December 31, 2014, 2013 and 2012 (dollars and shares in thousands, except per share data):
|
| | | | | | | | | | | |
| | Years Ended December 31, |
| 2014 | | 2013 | | 2012 |
| Numerator: | | | | | |
| Net income (loss) attributable to NorthStar Realty Finance Corp. common stockholders | $ | (371,507 | ) | | $ | (137,453 | ) | | $ | (288,587 | ) |
| Net income (loss) attributable to Old LTIP Units non-controlling interest | (5,296 | ) | | (5,571 | ) | | (13,962 | ) |
Net income (loss) attributable to common stockholders and Old LTIP Units(1) | $ | (376,803 | ) | | $ | (143,024 | ) | | $ | (302,549 | ) |
Denominator:(2) | | | | | |
| Weighted average shares of common stock | 196,072 |
| | 105,908 |
| | 62,599 |
|
Weighted average Old LTIP Units(1) | 1,919 |
| | 4,581 |
| | 3,013 |
|
Weighted average shares of common stock and Old LTIP Units(3) | 197,991 |
| | 110,489 |
| | 65,612 |
|
Earnings (loss) per share:(2) | | | | | |
| Basic | $ | (1.89 | ) | | $ | (1.30 | ) | | $ | (4.61 | ) |
| Diluted | $ | (1.89 | ) | | $ | (1.30 | ) | | $ | (4.61 | ) |
____________________________________________________________
| |
| (1) | The EPS calculation takes into account Old LTIP Units, which received non-forfeitable dividends from the date of grant, shared equally in the Company’s net income (loss) and converted on a one-for-one basis into common stock. Such Old LTIP Units were converted to common stock, the unvested portion of which remain restricted, in connection with the Reorganization (refer to Note 12). |
| |
| (2) | Adjusted for the Reverse Split effected on June 30, 2014. |
| |
| (3) | Excludes the effect of exchangeable senior notes, Deferred LTIP Units, shares under the forward sale agreement and RSUs outstanding that were not dilutive as of December 31, 2014. These instruments could potentially impact diluted EPS in future periods, depending on changes in the Company’s stock price and other factors. |
| |
| 14. | Non-controlling Interests |
Reorganization
Prior to the Distribution, the Company’s predecessor, NorthStar Realty Finance Corp. (“NRF Predecessor”), conducted substantially all of its operations and made its investments through the Operating Partnership and the Company (formerly known as “NRFC Sub-REIT Corp.”), NRF Predecessor’s then-majority-owned subsidiary. In connection with the Reorganization, the Operating Partnership merged with and into NRF Predecessor with NRF Predecessor as the surviving entity (“OP Merger”). Second, NRF Predecessor merged with and into the Company (known at the time as NRFC Sub-REIT Corp.) with the Company as the surviving entity (“Sub-REIT Merger”) and then NRFC Sub-REIT Corp. renamed itself as “NorthStar Realty Finance Corp.” In the OP Merger, Old LTIP Units were converted into an equal number of shares of common stock of NRFC Sub-REIT Corp. In the Sub-REIT Merger, each share of common stock and each series of the preferred stock of NRF Predecessor were exchanged for one share of common stock and the corresponding series of preferred stock with substantially similar terms, respectively, of the Company. Immediately after the Reorganization, the Company had the same number of shares of common stock and preferred stock outstanding as NRF Predecessor, except for the Old LTIP Units. On June 30, 2014 prior to the OP Merger, the Old LTIP Units represented 2.2% of the Operating Partnership with the remaining 97.8% held by NRF Predecessor. As a result of the OP Merger, the Old LTIP Units were converted to common stock of the Company.
Prior to the spin-off, net income (loss) attributable to the non-controlling interest was based on the weighted average Old LTIP Unit holders’ ownership percentage of the Operating Partnership for the respective period. The issuance of additional common stock or Old LTIP Units changed the percentage ownership of both the Old LTIP Unit holders and the Company. Since a unit was generally redeemable for cash or common stock at the option of the Company, it was deemed to be equivalent to common stock. Therefore, such transactions were treated as capital transactions and resulted in an allocation between stockholders’ equity and non-controlling interests on the accompanying consolidated balance sheets to account for the change in the ownership of the underlying equity in the Operating Partnership. As of December 31, 2014, there were no Old LTIP Units outstanding as all were converted to common stock in connection with the Reorganization and the unvested portion remains restricted (refer to Note 12). As of December 31, 2013, Old LTIP Units of 4,608,759 were outstanding, after giving effect to the Reverse Split, representing a 2.9% ownership and non-controlling interest in the Operating Partnership. Net income (loss) attributable to the Operating Partnership non-controlling interest for the six months ended June 30, 2014 was a loss of $5.3 million. Net income (loss) attributable to the Operating Partnership non-controlling interest for the years ended December 31, 2013 and 2012 was a loss of $5.6 million and $14.0 million, respectively. Since the Operating Partnership does not exist subsequent to the spin-off, there was no allocation of net income (loss) attributable to the Operating Partnership non-controlling
NORTHSTAR REALTY FINANCE CORP. AND SUBSIDIARIES
NOTES TO CONSOLIDATED FINANCIAL STATEMENTS (Continued)
interest for the six months ended December 31, 2014. Such amounts exclude 1,186,659 Deferred LTIP Units, net of forfeitures, after giving effect to the Reverse Split, issued in connection with the Stock Plan.
In connection with the Reorganization, all obligations of the Operating Partnership and NRF Predecessor were assumed by the Company. Immediately following the Reorganization, the Company had, on a consolidated basis, the same assets, business and operations as NRF Predecessor had on a consolidated basis, immediately prior to the Reorganization. The Company accounted for the Reorganization as a reverse merger between entities under common control. The Company did not record any gain or loss related to the Reorganization.
Other
Other non-controlling interests represent third-party equity interests in ventures that are consolidated with the Company’s financial statements. Net income (loss) attributable to the other non-controlling interests for the years ended December 31, 2014, 2013 and 2012 was a loss of $17.6 million, $0.4 million and income of $2.4 million, respectively.
The following table presents net income (loss) attributable to the Company’s common stockholders for the years ended December 31, 2014, 2013 and 2012 (dollars in thousands):
|
| | | | | | | | | | | |
| | Years Ended December 31, |
| 2014 | | 2013 | | 2012 |
| Income (loss) from continuing operations | $ | (363,541 | ) | | $ | (129,394 | ) | | $ | (290,451 | ) |
| Income (loss) from discontinued operations | (7,966 | ) | | (8,059 | ) | | (123 | ) |
| Gain on sale from discontinued operations | — |
| | — |
| | 1,987 |
|
| Net income (loss) attributable to NorthStar Realty Finance Corp. common stockholders | $ | (371,507 | ) | | $ | (137,453 | ) | | $ | (288,587 | ) |
Fair Value Measurement
The fair value of financial instruments is categorized based on the priority of the inputs to the valuation technique and categorized into a three-level fair value hierarchy. The fair value hierarchy gives the highest priority to quoted prices in active markets for identical assets or liabilities (Level 1) and the lowest priority to unobservable inputs (Level 3). If the inputs used to measure the financial instruments fall within different levels of the hierarchy, the categorization is based on the lowest level input that is significant to the fair value measurement of the instrument.
Financial assets and liabilities recorded at fair value on the consolidated balance sheets are categorized based on the inputs to the valuation techniques as follows:
Level 1. Quoted prices for identical assets or liabilities in an active market.
Level 2. Financial assets and liabilities whose values are based on the following:
(a)Quoted prices for similar assets or liabilities in active markets.
(b)Quoted prices for identical or similar assets or liabilities in non-active markets.
(c)Pricing models whose inputs are observable for substantially the full term of the asset or liability.
(d)Pricing models whose inputs are derived principally from or corroborated by observable market data
for substantially the full term of the asset or liability.
Level 3. Prices or valuation techniques based on inputs that are both unobservable and significant to the overall fair value measurement.
Determination of Fair Value
The following is a description of the valuation techniques used to measure fair value of assets and liabilities accounted for at fair value on a recurring basis and the general classification of these instruments pursuant to the fair value hierarchy.
NORTHSTAR REALTY FINANCE CORP. AND SUBSIDIARIES
NOTES TO CONSOLIDATED FINANCIAL STATEMENTS (Continued)
PE Investments
The Company accounts for PE Investments at fair value which is determined based on a valuation model using assumptions for the timing and amount of expected future cash flow for income and realization events for the underlying assets in the funds and discount rate. This fair value measurement is generally based on unobservable inputs and, as such, is classified as Level 3 of the fair value hierarchy. The Company is not using the NAV (practical expedient) of the underlying funds for purposes of determining fair value.
Investments in Unconsolidated Ventures
The Company accounts for certain investments in unconsolidated ventures at fair value determined based on a valuation model using assumptions for the timing and amount of expected future cash flow for income and realization events for the underlying assets and discount rate and foreign currency exchange rate considerations. Additionally, the Company accounts for certain CRE debt investments made in connection with certain investments in unconsolidated ventures at fair value, which is determined based on comparing the current yield to the estimated yield for newly originated loans with similar credit risk. These fair value measurements are generally based on unobservable inputs and, as such, are classified as Level 3 of the fair value hierarchy.
Real Estate Securities
N-Star CDO Bonds
The fair value of subordinate N-Star CDO bonds is determined using an internal price interpolated based on third party prices of the more senior N-Star CDO bonds of the respective CDO. For the remaining N-Star CDO bonds, fair value is determined using quotations from nationally recognized financial institutions that generally acted as underwriter for the transactions. These quotations are not adjusted and are generally based on a valuation model with observable inputs such as interest rate and other unobservable inputs for assumptions related to the timing and amount of expected future cash flow, discount rate, estimated prepayments and projected losses. All N-Star CDO bonds are classified as Level 3 of the fair value hierarchy.
N-Star CDO Equity
The fair value of N-Star CDO equity is determined based on a valuation model using assumptions for the timing and amount of expected future cash flow for income and realization events for the underlying collateral of these CDOs and discount rate. This fair value measurement is generally based on unobservable inputs and, as such, is classified as Level 3 of the fair value hierarchy.
Other CRE Securities
Other CRE securities are generally valued using a third-party pricing service or broker quotations. These quotations are not adjusted and are based on observable inputs that can be validated, and as such, are classified as Level 2 of the fair value hierarchy. Certain CRE securities may be valued based on a single broker quote or an internal price which may have less observable pricing, and as such, would be classified as Level 3 of the fair value hierarchy. Management determines the prices are representative of fair value through a review of available data, including observable inputs, recent transactions as well as its knowledge of and experience in the market.
Derivative Instruments
Derivative instruments are valued using a third-party pricing service. These quotations are not adjusted and are generally based on valuation models with observable inputs such as interest rates and contractual cash flow, and as such, are classified as Level 2 of the fair value hierarchy. Derivative instruments are also assessed for credit valuation adjustments due to the risk of non-performance by the Company and derivative counterparties. However, since the majority of derivatives are held in non-recourse CDO financing structures where, by design, the derivative contracts are senior to all the CDO bonds payable, there is no material impact of a credit valuation adjustment.
NORTHSTAR REALTY FINANCE CORP. AND SUBSIDIARIES
NOTES TO CONSOLIDATED FINANCIAL STATEMENTS (Continued)
CDO Bonds Payable
CDO bonds payable are valued using quotations from nationally recognized financial institutions that generally acted as underwriter for the transactions. These quotations are not adjusted and are generally based on a valuation model with observable inputs such as interest rate and other unobservable inputs for assumptions related to the timing and amount of expected future cash flow, discount rate, estimated prepayments and projected losses. CDO bonds payable are classified as Level 3 of the fair value hierarchy.
Junior Subordinated Notes
Junior subordinated notes are valued using quotations from nationally recognized financial institutions. These quotations are not adjusted and are generally based on a valuation model with observable inputs such as interest rate and other unobservable inputs for assumptions related to the implied credit spread of the Company’s other borrowings and the timing and amount of expected future cash flow. Junior subordinated notes are classified as Level 3 of the fair value hierarchy.
Fair Value Hierarchy
Financial assets and liabilities recorded at fair value on a recurring basis are classified in their entirety based on the lowest level of input that is significant to the fair value measurement. The following tables present financial assets and liabilities that were accounted for at fair value on a recurring basis as of December 31, 2014 and 2013 by level within the fair value hierarchy (dollars in thousands):
|
| | | | | | | | | | | | | | | |
| December 31, 2014 |
| Level 1 |
| Level 2 |
| Level 3 |
| Total |
| Assets: |
|
|
|
|
|
|
|
| PE Investments | $ | — |
|
| $ | — |
| | $ | 962,038 |
| | $ | 962,038 |
|
Investments in unconsolidated ventures(1) | — |
|
| — |
| | 276,437 |
| | 276,437 |
|
| Real estate securities, available for sale: | | | | | | |
|
| N-Star CDO bonds | — |
| | — |
| | 262,309 |
| | 262,309 |
|
| N-Star CDO equity | — |
| | — |
| | 102,467 |
| | 102,467 |
|
| CMBS and other securities | — |
| | 17,243 |
| | 34,680 |
| | 51,923 |
|
| CRE securities in N-Star CDOs | | | | | | |
|
|
| CMBS | — |
| | 329,815 |
| | 53,052 |
| | 382,867 |
|
| Third-party CDO notes | — |
| | — |
| | 23,218 |
| | 23,218 |
|
| Agency debentures | — |
| | 40,529 |
| | — |
| | 40,529 |
|
| Unsecured REIT debt | — |
| | 9,351 |
| | — |
| | 9,351 |
|
| Trust preferred securities | — |
| | — |
| | 5,850 |
| | 5,850 |
|
| Subtotal CRE securities in N-Star CDOs | — |
| | 379,695 |
| | 82,120 |
| | 461,815 |
|
| Subtotal real estate securities, available for sale | — |
| | 396,938 |
| | 481,576 |
| | 878,514 |
|
| Derivative assets | — |
| | 3,245 |
| | — |
| | 3,245 |
|
| Total assets | $ | — |
| | $ | 400,183 |
| | $ | 1,720,051 |
| | $ | 2,120,234 |
|
| Liabilities: | | | | | | | |
| CDO bonds payable | $ | — |
| | $ | — |
| | $ | 390,068 |
| | $ | 390,068 |
|
| Junior subordinated notes | — |
| | — |
| | 215,172 |
| | 215,172 |
|
| Derivative liabilities | — |
| | 17,915 |
| | — |
| | 17,915 |
|
| Total liabilities | $ | — |
| | $ | 17,915 |
| | $ | 605,240 |
| | $ | 623,155 |
|
_____________________________________________________________________
| |
| (1) | Includes certain CRE debt investments made in connection with certain investments in unconsolidated ventures, for which the fair value option was elected. |
NORTHSTAR REALTY FINANCE CORP. AND SUBSIDIARIES
NOTES TO CONSOLIDATED FINANCIAL STATEMENTS (Continued)
|
| | | | | | | | | | | | | | | |
| December 31, 2013 |
| Level 1 |
| Level 2 |
| Level 3 |
| Total |
| Assets: |
|
|
|
|
|
|
|
| PE Investments | $ | — |
| | $ | — |
| | $ | 586,018 |
| | $ | 586,018 |
|
Investments in unconsolidated ventures(1) | — |
| | — |
| | 192,419 |
| | 192,419 |
|
| Real estate securities, available for sale: | | | | | |
|
|
| N-Star CDO bonds | — |
| | — |
| | 205,287 |
| | 205,287 |
|
| N-Star CDO equity | — |
| | — |
| | 158,274 |
| | 158,274 |
|
| CMBS and other securities | — |
| | 20,694 |
| | 25,981 |
| | 46,675 |
|
| CRE securities in N-Star CDOs | | | | | | |
|
|
| CMBS | — |
| | 507,725 |
| | 64,576 |
| | 572,301 |
|
| Third-party CDO notes | — |
| | | | 24,931 |
| | 24,931 |
|
| Agency debentures | — |
| | 29,540 |
| | — |
| | 29,540 |
|
| Unsecured REIT debt | — |
| | 9,521 |
| | — |
| | 9,521 |
|
| Trust preferred securities | — |
| | — |
| | 5,791 |
| | 5,791 |
|
| Subtotal CRE securities in N-Star CDOs | — |
| | 546,786 |
| | 95,298 |
| | 642,084 |
|
| Subtotal real estate securities, available for sale | — |
| | 567,480 |
| | 484,840 |
| | 1,052,320 |
|
| Derivative assets | — |
| | 3,469 |
| | — |
| | 3,469 |
|
| Total assets | $ | — |
|
| $ | 570,949 |
| | $ | 1,263,277 |
| | $ | 1,834,226 |
|
| Liabilities: | | | | | | | |
| CDO bonds payable | $ | — |
| | $ | — |
| | $ | 384,183 |
| | $ | 384,183 |
|
| Junior subordinated notes | — |
| | — |
| | 201,203 |
| | 201,203 |
|
| Derivative liabilities | — |
| | 52,204 |
| | — |
| | 52,204 |
|
| Total liabilities | $ | — |
| | $ | 52,204 |
| | $ | 585,386 |
| | $ | 637,590 |
|
_____________________________________________________________________
| |
| (1) | Includes certain CRE debt investments made in connection with certain investments in unconsolidated ventures, for which the fair value option was elected. |
NORTHSTAR REALTY FINANCE CORP. AND SUBSIDIARIES
NOTES TO CONSOLIDATED FINANCIAL STATEMENTS (Continued)
The following table presents the changes in fair value of financial assets and liabilities which are measured at fair value on a recurring basis using Level 3 inputs to determine fair value for the year ended December 31, 2014 (dollars in thousands):
|
| | | | | | | | | | | | | | | | | | | |
| Year Ended December 31, 2014 |
| PE Investments | | Investments in Unconsolidated Ventures(1) | | Real Estate Securities | | CDO Bonds Payable |
| Junior Subordinated Notes |
| January 1, 2014 | $ | 586,018 |
| | $ | 192,419 |
| | $ | 484,840 |
| | $ | 384,183 |
| | $ | 201,203 |
|
Transfers into Level 3(2) | — |
| | — |
| | 17,513 |
| | — |
| | — |
|
| Purchases / borrowings / amortization / contributions | 548,961 |
| | 84,206 |
| | 64,104 |
| | (15,320 | ) | | — |
|
| Sales | — |
| | — |
| | (65,504 | ) | | — |
| | — |
|
| Paydowns / distributions | (339,598 | ) | | (2,507 | ) | | (48,511 | ) | | (87,859 | ) | | — |
|
| Gains: | | | | | | | | | |
| Equity in earnings of unconsolidated ventures | 134,036 |
| | 10,494 |
| | — |
| | — |
| | — |
|
| Unrealized gains included in earnings | 32,621 |
| | — |
| | 44,308 |
| | — |
| | — |
|
| Realized gains included in earnings | — |
| | — |
| | 15,626 |
| | — |
| | — |
|
| Unrealized gain on real estate securities, available for sale included in OCI | — |
| | — |
| | 61,045 |
| | — |
| | — |
|
Deconsolidation of N-Star CDOs(3) | — |
| | — |
| | 873 |
| | (122,486 | ) | | — |
|
| Losses: | | | | | | | | | |
| Unrealized losses included in earnings | — |
| | (8,175 | ) | | (64,977 | ) | | 217,608 |
| | 13,969 |
|
| Realized losses included in earnings | — |
| | — |
| | (3,152 | ) | | 13,942 |
| | — |
|
| Unrealized losses on real estate securities, available for sale included in OCI | — |
| | — |
| | (3,519 | ) | | — |
| | — |
|
Deconsolidation of N-Star CDOs(3) | — |
| | — |
| | (21,070 | ) | | — |
| | — |
|
| December 31, 2014 | $ | 962,038 |
| | $ | 276,437 |
| | $ | 481,576 |
| | $ | 390,068 |
| | $ | 215,172 |
|
| Gains (losses) included in earnings attributable to the change in unrealized gains (losses) relating to assets or liabilities still held. | $ | 32,621 |
| | $ | (8,175 | ) | | $ | (37,487 | ) | | $ | (217,608 | ) | | $ | (13,969 | ) |
____________________________________________________________
| |
| (1) | Includes certain CRE debt investments made in connection with certain investments in unconsolidated ventures, for which the fair value option was elected. |
| |
| (2) | Transfers between Level 2 and Level 3 represent a fair value measurement from a third-party pricing service or broker quotations that have become more or less observable during the period. Transfers are assumed to occur at the beginning of the year. |
| |
| (3) | Represents amounts recorded as a result of the deconsolidation of certain N-Star CDOs. Refer to Note 3 for further disclosure. |
NORTHSTAR REALTY FINANCE CORP. AND SUBSIDIARIES
NOTES TO CONSOLIDATED FINANCIAL STATEMENTS (Continued)
The following table presents the changes in fair value of financial assets and liabilities which are measured at fair value on a recurring basis using Level 3 inputs to determine fair value for the year ended December 31, 2013 (dollars in thousands):
|
| | | | | | | | | | | | | | | | | | | |
| | Year Ended December 31, 2013 |
| | PE Investments | | Investments in Unconsolidated Ventures(1) | | Real Estate Securities | | CDO Bonds Payable | | Junior Subordinated Notes |
| January 1, 2013 | $ | — |
| | $ | — |
| | $ | 338,213 |
| | $ | 1,999,470 |
| | $ | 197,173 |
|
Transfers into Level 3(2) | — |
| | — |
| | 7,788 |
| | — |
| | — |
|
Transfers out of Level 3(2) | — |
| | — |
| | (108,143 | ) | | — |
| | — |
|
| Purchases / borrowings / amortization / contributions | 747,564 |
| | 192,209 |
| | 23,594 |
| | 43,983 |
| | — |
|
| Sales | — |
| | — |
| | (40,328 | ) | | — |
| | — |
|
| Paydowns / distributions | (244,138 | ) | | — |
| | (54,971 | ) | | (647,947 | ) | | — |
|
| Repurchases | — |
| | — |
| | — |
| | (44,221 | ) | | — |
|
| Gains: | | | | | | | | | |
| Equity in earnings of unconsolidated ventures | 82,592 |
| | 210 |
| | — |
| | — |
| | — |
|
| Unrealized gains included in earnings | — |
| | — |
| | 68,794 |
| | — |
| | — |
|
| Realized gains included in earnings | — |
| | — |
| | 15,179 |
| | — |
| | — |
|
| Unrealized gain on real estate securities, available for sale included in OCI | — |
| | — |
| | 3,098 |
| | — |
| | — |
|
Deconsolidation of N-Star CDOs(3) | — |
| | — |
| | 350,886 |
| | (1,656,857 | ) | | — |
|
| Losses: | | | | | | | | | |
| Unrealized losses included in earnings | — |
| | — |
| | (19,523 | ) | | 106,622 |
| | 4,030 |
|
| Realized losses included in earnings | — |
| | — |
| | (5,601 | ) | | 26,697 |
| | — |
|
| Unrealized losses on real estate securities, available for sale included in OCI | — |
| | — |
| | (4,138 | ) | | — |
| | — |
|
Deconsolidation of N-Star CDOs(3) | — |
| | — |
| | (90,008 | ) | | 556,436 |
| | — |
|
| December 31, 2013 | $ | 586,018 |
| | $ | 192,419 |
| | $ | 484,840 |
| | $ | 384,183 |
| | $ | 201,203 |
|
| Gains (losses) included in earnings attributable to the change in unrealized gains (losses) relating to assets or liabilities still held. | $ | — |
| | $ | — |
| | $ | 20,746 |
| | $ | (106,622 | ) | | $ | (4,030 | ) |
____________________________________________________________
| |
| (1) | Includes certain CRE debt investments made in connection with certain investments in unconsolidated ventures, for which the fair value option was elected. |
| |
| (2) | Transfers between Level 2 and Level 3 represent a fair value measurement from a third-party pricing service or broker quotations that have become more or less observable during the period. Transfers are assumed to occur at the beginning of the year. |
| |
| (3) | Represents amounts recorded as a result of the deconsolidation of certain N-Star CDOs. Refer to Note 3 for further disclosure. |
There were no transfers, other than those identified in the table above, during the years ended December 31, 2014 and 2013.
The Company relies on the third-party pricing exception with respect to the requirement to provide quantitative disclosures about significant Level 3 inputs being used to determine fair value measurements related to CRE securities (including N-Star CDO bonds), CDO bonds payable and junior subordinated notes. The Company believes such pricing service or broker quotation for such items may be based on a market transaction of comparable securities, inputs including forecasted market rates, contractual terms, observable discount rates for similar securities and credit (such as credit support and delinquency rates).
For the year ended December 31, 2014, quantitative information about the Company’s remaining Level 3 fair value measurements on a recurring basis are as follows (dollars in thousands):
|
| | | | | | | | | |
| | Fair Value | | Valuation Technique | | Key Unobservable Inputs(2) | | Range |
| PE Investments | $ | 962,038 |
| | Discounted Cash Flow Model | | Discount Rate | | 15% - 27% |
Investments in unconsolidated ventures(1) | $ | 276,437 |
| | Discounted Cash Flow Model/Credit Spread | | Discount Rate/Credit Spread | | 7% - 30% |
| N-Star CDO equity | $ | 102,467 |
| | Discounted Cash Flow Model | | Discount Rate | | 18% |
_________________________________________
| |
| (1) | Includes certain CRE debt investments made in connection with certain investments in unconsolidated ventures, for which the fair value option was elected. |
| |
| (2) | Includes timing and amount of expected future cash flows. |
NORTHSTAR REALTY FINANCE CORP. AND SUBSIDIARIES
NOTES TO CONSOLIDATED FINANCIAL STATEMENTS (Continued)
Significant increases (decreases) in any one of the inputs described above in isolation may result in a significantly different fair value for the financial assets and liabilities using such Level 3 inputs.
Fair Value Option
The Company has historically elected to apply the fair value option for the following financial assets and liabilities existing at the time of adoption or at the time the Company recognizes the eligible item for the purpose of consistent accounting application: CRE securities financed in N-Star CDOs; CDO bonds payable; and junior subordinated notes. Given past market volatility the Company had observed that the impact of electing the fair value option would generally result in additional variability to the Company’s consolidated statements of operations which management believes is not a useful presentation for such financial assets and liabilities. Therefore, the Company more recently has not elected the fair value option for new investments in CRE securities and securitization financing transactions. The Company may elect the fair value option for certain of its financial assets or liabilities due to the nature of the instrument. In the case of PE Investments, certain investments in unconsolidated ventures (refer to Note 7) and N-Star CDO equity, the Company elected the fair value option because management believes it is a more useful presentation for such investments. The Company determined recording such investments based on the change in fair value of projected future cash flow from one period to another better represents the underlying economics of the respective investment.
The following table presents the fair value of financial instruments for which the fair value option was elected as of December 31, 2014 and 2013 (dollars in thousands):
|
| | | | | | | |
| | December 31, |
| 2014 |
| 2013 |
| Assets: |
|
|
|
| PE Investments | $ | 962,038 |
| | $ | 586,018 |
|
Investments in unconsolidated ventures(1) | 276,437 |
| | 192,419 |
|
Real estate securities, available for sale:(2) | | | |
| N-Star CDO equity | 102,467 |
| | 158,274 |
|
| CMBS and other securities | 42,613 |
| | 30,642 |
|
| CRE securities in N-Star CDOs | | | |
| CMBS | 382,867 |
| | 572,301 |
|
| Third-party CDO notes | 23,218 |
| | 24,931 |
|
| Agency debentures | 40,529 |
| | 29,540 |
|
| Unsecured REIT debt | 9,351 |
| | 9,521 |
|
| Trust preferred securities | 5,850 |
| | 5,791 |
|
| Subtotal CRE securities in N-Star CDOs | 461,815 |
| | 642,084 |
|
| Subtotal real estate securities, available for sale | 606,895 |
| | 831,000 |
|
| Total assets | $ | 1,845,370 |
| | $ | 1,609,437 |
|
| Liabilities: | | | |
| CDO bonds payable | $ | 390,068 |
| | $ | 384,183 |
|
| Junior subordinated notes | 215,172 |
| | 201,203 |
|
| Total liabilities | $ | 605,240 |
| | $ | 585,386 |
|
___________________________________________________________
| |
| (1) | Includes certain CRE debt investments made in connection with certain investments in unconsolidated ventures, for which the fair value option was elected. |
| |
| (2) | December 31, 2014 excludes 34 CRE securities including $271.6 million of N-Star CDO bonds and $9.3 million of CRE securities, for which the fair value option was not elected. December 31, 2013 excludes 36 CRE securities including $205.3 million of N-Star CDO bonds and $16.0 million of CRE securities, for which the fair value option was not elected. |
The following table presents the difference between the fair value and the aggregate principal amount of liabilities, for which the fair value option has been elected as of December 31, 2014 (dollars in thousands):
|
| | | | | | | | | | | |
| Fair Value |
| Amount Due Upon Maturity |
| Difference |
| CDO bonds payable | $ | 390,068 |
| | $ | 560,959 |
| | $ | (170,891 | ) |
| Junior subordinated notes | 215,172 |
| | 280,117 |
| | (64,945 | ) |
| Total | $ | 605,240 |
| | $ | 841,076 |
| | $ | (235,836 | ) |
NORTHSTAR REALTY FINANCE CORP. AND SUBSIDIARIES
NOTES TO CONSOLIDATED FINANCIAL STATEMENTS (Continued)
The Company attributes the change in the fair value of floating-rate liabilities to changes in instrument-specific credit spreads. For fixed-rate liabilities, the Company attributes the change in fair value to interest rate-related and instrument-specific credit spread changes.
Change in Fair Value Recorded in the Statements of Operations
The following table presents unrealized gains (losses) on investments and other related to the change in fair value of financial assets and liabilities in the consolidated statements of operations for the years ended December 31, 2014, 2013 and 2012 (dollars in thousands):
|
| | | | | | | | | | | |
| | Years Ended December 31, |
| 2014 | | 2013 | | 2012 |
| Assets: | | | | |
|
| Real estate securities, available for sale | $ | (12,324 | ) | | $ | 94,676 |
| | $ | 35,993 |
|
| PE Investments | 32,621 |
| | — |
| | — |
|
Foreign currency remeasurement(1) | (11,719 | ) | | 2,300 |
| | 1,145 |
|
| Liabilities: | | | | | |
| CDO bonds payable | (217,608 | ) | | (106,622 | ) | | (510,105 | ) |
| Junior subordinated notes | (13,969 | ) | | (4,030 | ) | | (40,005 | ) |
Subtotal(2) | (222,999 | ) | | (13,676 | ) | | (512,972 | ) |
| Derivatives | 8,184 |
| | 33,730 |
| | 44,743 |
|
| Total | $ | (214,815 | ) | | $ | 20,054 |
| | $ | (468,229 | ) |
____________________________________________________________
| |
| (1) | Primarily represents foreign currency remeasurement on an investment denominated in Euros. |
| |
| (2) | Represents financial assets and liabilities for which the fair value option was elected. |
The remaining amount recorded to unrealized gains (losses) on investments and other in the consolidated statements of operations relates to net cash payments on interest rate swaps (refer to Note 16).
Fair Value of Financial Instruments
In addition to the above disclosures regarding financial assets or liabilities which are recorded at fair value, U.S. GAAP requires disclosure of fair value about all financial instruments. The following disclosure of estimated fair value of financial instruments was determined by the Company using available market information and appropriate valuation methodologies. Considerable judgment is necessary to interpret market data and develop estimated fair value. Accordingly, the estimates presented herein are not necessarily indicative of the amounts the Company could realize on disposition of the financial instruments. The use of different market assumptions and/or estimation methodologies may have a material effect on estimated fair value.
The following table presents the principal amount, carrying value and fair value of certain financial assets and liabilities as of December 31, 2014 and 2013 (dollars in thousands):
|
| | | | | | | | | | | | | | | | | | | | | | | |
| December 31, 2014 |
| December 31, 2013 |
| Principal / Notional Amount |
| Carrying Value |
| Fair Value |
| Principal / Notional Amount |
| Carrying Value |
| Fair Value |
Financial assets:(1) | | | | | | | | | | | |
| Real estate debt investments, net | $ | 1,187,316 |
| | $ | 1,067,667 |
| | $ | 1,066,911 |
| | $ | 1,085,280 |
| | $ | 1,031,078 |
| | $ | 1,026,709 |
|
Real estate securities, available for sale(2) | 1,532,891 |
| | 878,514 |
| | 878,514 |
| | 2,090,726 |
| | 1,052,320 |
| | 1,052,320 |
|
Derivative assets(2)(3) | 3,848,859 |
| | 3,247 |
| | 3,247 |
| | 478,688 |
| | 3,469 |
| | 3,469 |
|
Financial liabilities:(1) | | | | | | | | | | | |
| Mortgage and other notes payable | $ | 8,531,285 |
| | $ | 8,535,863 |
| | $ | 8,539,363 |
| | $ | 2,133,334 |
| | $ | 2,113,334 |
| | $ | 2,107,110 |
|
CDO bonds payable(2) | 560,959 |
| | 390,068 |
| | 390,068 |
| | 970,219 |
| | 384,183 |
| | 384,183 |
|
| Securitization bonds payable | 41,831 |
| | 41,823 |
| | 41,929 |
| | 82,337 |
| | 82,340 |
| | 82,517 |
|
| Credit facilities | 732,780 |
| | 732,780 |
| | 732,780 |
| | 70,038 |
| | 70,038 |
| | 70,038 |
|
| Exchangeable senior notes | 45,588 |
| | 41,762 |
| | 82,443 |
| | 543,815 |
| | 490,973 |
| | 909,601 |
|
Junior subordinated notes(2) | 280,117 |
| | 215,172 |
| | 215,172 |
| | 280,117 |
| | 201,203 |
| | 201,203 |
|
Derivative liabilities(2)(3) | 318,726 |
| | 17,915 |
| | 17,915 |
| | 674,418 |
| | 52,204 |
| | 52,204 |
|
____________________________________________________________
| |
| (1) | The fair value of other financial instruments not included in this table is estimated to approximate their carrying value. |
| |
| (2) | Refer to the “Determination of Fair Value” above for disclosure of methodologies used to determine fair value. |
NORTHSTAR REALTY FINANCE CORP. AND SUBSIDIARIES
NOTES TO CONSOLIDATED FINANCIAL STATEMENTS (Continued)
| |
| (3) | Derivative assets and liabilities exclude timing swaps with an aggregate notional amount of $28.0 million as of December 31, 2014 and 2013. |
Disclosure about fair value of financial instruments is based on pertinent information available to management as of the reporting date. Although management is not aware of any factors that would significantly affect fair value, such amounts have not been comprehensively revalued for purposes of these consolidated financial statements since that date and current estimates of fair value may differ significantly from the amounts presented herein.
Real Estate Debt Investments
For CRE debt investments, fair value was approximated by comparing the current yield to the estimated yield for newly originated loans with similar credit risk or the market yield at which a third party might expect to purchase such investment. Fair value was determined assuming fully-extended maturities regardless of structural or economic tests required to achieve such extended maturities. For any CRE debt investments that are deemed impaired, carrying value approximates fair value. These fair value measurements of CRE debt are generally based on unobservable inputs and, as such, are classified as Level 3 of the fair value hierarchy.
Mortgage and Other Notes Payable
For mortgage and other notes payable, the Company primarily uses rates currently available with similar terms and remaining maturities to estimate fair value. These measurements are determined using comparable U.S. Treasury rates as of the end of the reporting period. These fair value measurements are based on observable inputs, and as such, are classified as Level 2 of the fair value hierarchy.
Securitization Bonds Payable
Securitization bonds payable are valued using quotations from nationally recognized financial institutions that generally acted as underwriter for the transactions. These quotations are not adjusted and are generally based on observable inputs that can be validated, and as such, are classified as Level 2 of the fair value hierarchy.
Credit Facilities
As of the reporting date, the Company believes the carrying value of its credit facilities approximates fair value. These fair value measurements are based on observable inputs, and as such, are classified as Level 2 of the fair value hierarchy.
Exchangeable Senior Notes
For the exchangeable senior notes, the Company uses available market information, which includes quoted market prices or recent transactions, if available, to estimate their fair value and are, therefore, based on observable inputs, and as such, are classified as Level 2 of the fair value hierarchy.
| |
| 16. | Risk Management and Derivative Activities |
Derivatives
The Company uses derivative instruments primarily to manage interest rate risk and such derivatives are not considered speculative. These derivative instruments are typically in the form of interest rate swap and cap agreements and the primary objective is to minimize interest rate risks associated with investment and financing activities. The counterparties of these arrangements are major financial institutions with which the Company may also have other financial relationships. The Company is exposed to credit risk in the event of non-performance by these counterparties and it monitors their financial condition; however, the Company currently does not anticipate that any of the counterparties will fail to meet their obligations.
NORTHSTAR REALTY FINANCE CORP. AND SUBSIDIARIES
NOTES TO CONSOLIDATED FINANCIAL STATEMENTS (Continued)
The following tables present derivative instruments that were not designated as hedges under U.S. GAAP as of December 31, 2014 and 2013 (dollars in thousands):
|
| | | | | | | | | | | | | | | |
| Number |
| Notional Amount(1) |
| Fair Value Net Asset (Liability) |
| Range of Fixed LIBOR / Forward Rate |
| Range of Maturity |
| As of December 31, 2014: | | | | | | | | | | |
| Interest rate swaps | 12 |
| | | $ | 318,726 |
| | $ | (17,915 | ) | (2) | 0.62% - 5.25% | | June 2015 - July 2023 |
| Interest rate caps/floors | 22 |
| | | 3,848,859 |
| | 3,247 |
| (3) | 2.00% - 5.00% | | January 2015 - January 2020 |
| Total | 34 |
| | | $ | 4,167,585 |
| | $ | (14,668 | ) | | | | |
| As of December 31, 2013: | | | | | | | | | | |
| Interest rate swaps | 19 |
| | | $ | 674,418 |
| | $ | (52,204 | ) | (2) | 4.27% - 5.25% | | May 2014 - July 2018 |
| Interest rate caps/floors | 3 |
| | | 478,688 |
| | 3,469 |
| | 1.64% - 5.00% | | July 2014 - January 2015 |
| Total | 22 |
| | | $ | 1,153,106 |
| | $ | (48,735 | ) | | | | |
____________________________________________________________
| |
| (1) | Excludes timing swaps with a notional amount of $28.0 million as of December 31, 2014 and 2013. |
| |
| (2) | Most of the interest rate swaps were liabilities of consolidated N-Star CDOs at period end and are only subject to the credit risks of the respective CDO transaction. As the interest rate swaps are senior to all the liabilities of the respective CDO and the fair value of each of the CDO’s investments exceeded the fair value of the CDO’s derivative liabilities, a credit valuation adjustment was not recorded. |
| |
| (3) | Includes two Sterling denominated interest rate caps. |
The change in number and notional amount of interest rate swaps from December 31, 2013 primarily relates to the decrease from deconsolidation of N-Star CDOs III and V (refer to Note 3) and contractual notional amortization, offset by an interest rate swap assumed in connection with the Formation Portfolio. The change in number and notional amount of interest rate caps/floors from December 31, 2013 primarily relates to the assumption of and new caps in connection with the Formation Portfolio, Innkeepers Portfolio and K Partners Portfolio. The Company had no derivative financial instruments that were designated as hedges in qualifying hedging relationships as of December 31, 2014 and 2013.
The following table presents the fair value of derivative instruments, as well as their classification on the consolidated balance sheets, as of December 31, 2014 and 2013 (dollars in thousands):
|
| | | | | | | | | |
| | Balance Sheet | | December 31, |
| Location | | 2014 | | 2013 |
| Interest rate caps/floors | Derivative assets | | $ | 3,247 |
| | $ | 3,469 |
|
| Interest rate swaps | Derivative liabilities | | $ | 17,915 |
| | $ | 52,204 |
|
The following table presents the effect of derivative instruments in the consolidated statements of operations for the years ended December 31, 2014, 2013 and 2012 (dollars in thousands):
|
| | | | | | | | | | | | | |
|
|
| Years Ended December 31, |
| Statements of Operations Location |
| 2014 | | 2013 | | 2012 |
| Amount of gain (loss) recognized in earnings: |
|
| | | | | |
| Adjustment to fair value interest rate swaps | Unrealized gain (loss) on investments and other |
| $ | 8,196 |
| | $ | 33,730 |
| | $ | 44,743 |
|
| Net cash payment for interest rate swaps | Unrealized gain (loss) on investments and other |
| $ | (16,880 | ) | | $ | (52,734 | ) | | $ | (78,903 | ) |
| Amount of swap gain (loss) reclassified from OCI into earnings | Interest expense on debt and securities |
| $ | 915 |
| | $ | (4,885 | ) | | $ | (7,412 | ) |
| Reclassification of swap gain (loss) into gain (loss) from deconsolidation of N-Star CDOs (refer to Note 3) | Gain (loss) from deconsolidation of N-Star CDOs | | $ | — |
| | $ | (15,246 | ) | | $ | — |
|
The Company’s counterparties held no cash margin as collateral against the Company’s derivative contracts as of December 31, 2014 and 2013.
| |
| 17. | Commitments and Contingencies |
The Company is involved in various litigation matters arising in the ordinary course of its business. Although the Company is unable to predict with certainty the eventual outcome of any litigation, in the opinion of management, the legal proceedings are not expected to have a material adverse effect on the Company’s financial position or results of operations.
WaMu Matter
In 2009, one of the Company’s net lease investments comprised of three office buildings totaling 257,000 square feet located in Chatsworth, California and 100% leased to Washington Mutual Bank was foreclosed on by the lender. The lender subsequently filed a complaint against subsidiaries of the Company in the Superior Court of the State of California, County of Los Angeles. In March 2012, the Court of Appeal of the State of California, Second Appellate District, issued a unanimous decision in favor of the Company’s subsidiary, overturning the judgment issued by the Superior Court of California for the County of Los Angeles. The ruling directed the Superior Court to enter summary judgment in the Company’s favor and reversed the award against the Company. Furthermore, the Court of Appeal awarded the Company costs on appeal. As a result of the ruling, in the first quarter 2012, the Company reversed a $20.0 million loss accrual recorded in other income (loss) in the consolidated statements of operations.
Other
Effective January 1, 2005, the Company adopted the NorthStar Realty Limited Partnership 401(k) Retirement Plan (the “401(k) Plan”) for its employees. Eligible employees under the 401(k) Plan may begin participation on the first day of the month after they have completed 30 days of employment. The Company’s matching contribution is calculated as 100% of the first 3% and 50% of the next 2% of participant’s eligible earnings contributed (utilizing earnings that are not in excess of the amount established by the Internal Revenue Service). The Company’s aggregate matching contribution for the years ended December 31, 2014, 2013 and 2012 was $1.0 million, $0.8 million and $0.8 million, respectively.
Obligations Under Ground Leases
The following table presents minimum future rental payments under the Company’s contractual ground lease obligations for certain building leaseholds as of December 31, 2014 (dollars in thousands):
|
| | | | |
| Years ending December 31: | | Total(1) |
| 2015 | | $ | 4,739 |
|
| 2016 | | 4,751 |
|
| 2017 | | 4,795 |
|
| 2018 | | 4,905 |
|
| 2019 | | 4,848 |
|
| Thereafter | | 89,608 |
|
| Total minimum lease payments | | $ | 113,646 |
|
__________________
| |
| (1) | Represents 53 ground leases of which for 17 leases ground rent is paid directly by the tenants/operators. |
18. Quarterly Financial Information (Unaudited)
The following presents selected quarterly information, which reflects prior period reclassifications related to discontinued operations, for the years ended December 31, 2014 and 2013 (dollars in thousands):
|
| | | | | | | | | | | | | | | | | |
| | | Three Months Ended | |
| | | December 31, | | September 30, | | June 30, | | March 31, | |
| | | 2014 | | 2014 | | 2014 | | 2014 | |
| Property and other revenues | | $ | 296,555 |
| | $ | 194,325 |
| | $ | 119,357 |
| | $ | 70,909 |
| |
| Net interest income on debt and securities | | 71,154 |
| | 77,936 |
| | 72,761 |
| | 75,396 |
| |
| Expenses | | 491,765 |
| | 305,399 |
| | 191,711 |
| | 110,569 |
| |
| Equity in earnings (losses) of unconsolidated ventures | | 46,884 |
| | 38,234 |
| | 31,380 |
| | 31,792 |
| |
| Income (loss) from continuing operations | | (109,742 | ) | | (26,331 | ) | | (59,916 | ) | | (116,969 | ) | |
| Net income (loss) | | (110,881 | ) | | (26,609 | ) | | (60,488 | ) | | (123,108 | ) | |
| Net income (loss) attributable to NorthStar Realty Finance Corp. common stockholders | | (116,453 | ) | | (46,525 | ) | | (73,566 | ) | | (134,963 | ) | |
Earnings (loss) per share:(1) | | | | | | | | | |
| Basic | | $ | (0.47 | ) | | $ | (0.23 | ) | | $ | (0.42 | ) | | $ | (0.84 | ) | (2) |
| Diluted | | $ | (0.47 | ) | | $ | (0.23 | ) | | $ | (0.42 | ) | | $ | (0.84 | ) | (2) |
__________________
(1)The total for the year may differ from the sum of the quarters as a result of weighting.
(2)Adjusted for the Reverse Split effected on June 30, 2014.
|
| | | | | | | | | | | | | | | | |
| | | Three Months Ended |
| | | December 31, | | September 30, | | June 30, | | March 31, |
| | | 2013 | | 2013 | | 2013 | | 2013 |
| Property and other revenues | | $ | 64,057 |
| | $ | 73,295 |
| | $ | 65,214 |
| | $ | 38,281 |
|
| Net interest income on debt and securities | | 80,330 |
| | 65,009 |
| | 61,560 |
| | 58,938 |
|
| Expenses | | 98,581 |
| | 105,632 |
| | 94,498 |
| | 71,534 |
|
| Equity in earnings (losses) of unconsolidated ventures | | 31,032 |
| | 31,013 |
| | 15,119 |
| | 8,313 |
|
| Income (loss) from continuing operations | | 10,881 |
| | (143,389 | ) | | 1,694 |
| | 51,665 |
|
| Net income (loss) | | 4,689 |
| | (141,749 | ) | | (546 | ) | | 49,696 |
|
| Net income (loss) attributable to NorthStar Realty Finance Corp. common stockholders | | (10,422 | ) | | (151,027 | ) | | (12,626 | ) | | 36,622 |
|
Earnings (loss) per share:(1)(2) | | | | | | | | |
| Basic | | $ | (0.08 | ) | | $ | (1.36 | ) | | $ | (0.13 | ) | | $ | 0.42 |
|
| Diluted | | $ | (0.08 | ) | | $ | (1.36 | ) | | $ | (0.13 | ) | | $ | 0.40 |
|
_________________
| |
| (1) | The total for the year may differ from the sum of the quarters as a result of weighting. |
| |
| (2) | Adjusted for the Reverse Split effected on June 30, 2014. |
19.Segment Reporting
The Company currently conducts its business through the following five segments (excluding the asset management business which the Company spun off on June 30, 2014 which is no longer a separate operating segment), based on how management reviews and manages its business:
| |
| • | Real Estate - The real estate business concentrates on various types of investments in commercial real estate located throughout the United States and internationally, with a current focus on Europe, that includes healthcare, hotel, manufactured housing communities, net lease, multifamily and multi-tenant office properties. In addition, it includes PE Investments diversified by property type and geography. |
| |
| • | Healthcare - The healthcare properties are comprised of a diverse portfolio of medical office buildings and other properties typically leased under net leases to healthcare operators with a focus on mid-acuity facilities (i.e., skilled nursing and assisted living), with the highest concentration in private-pay assisted living facilities. In addition, the Company owns healthcare properties that operate under a RIDEA structure generating resident income from short-term residential agreements and incur customary related operating expenses. |
| |
| • | Hotel - The hotel portfolio is a geographically diverse portfolio primarily comprised of extended stay hotels and premium branded select service hotels primarily located in major metropolitan markets with the majority affiliated with top hotel brands. |
| |
| • | European - The Company is expanding outside the United States, with a current focus on Europe, and seeks to invest in various types of commercial real estate assets. |
| |
| • | Manufactured Housing - The manufactured housing portfolio consists of communities that lease pad rental sites for placement of factory built homes located throughout the United States. In addition, the portfolio includes manufactured homes for sale or rent and receivables related to the financing of homes sold to residents. |
| |
| • | Net Lease - The net lease properties are primarily industrial, office and retail properties typically under net leases to corporate tenants. |
| |
| • | Multifamily - The multifamily portfolio primarily focuses on properties located in suburban markets that are well suited to capture the formation of new households. |
| |
| • | Multi-tenant Office - The Company pursues other real estate opportunities such as the Company’s recent acquisition of multi-tenant office properties. |
| |
| • | PE Investments - The real estate business also includes investments (directly or indirectly in joint ventures) owning limited partnership interests in real estate private equity funds, managed by institutional quality sponsors and diversified by property type and geography. |
| |
| • | Commercial Real Estate Debt - The CRE debt business is focused on originating, acquiring and asset managing senior and subordinate debt investments secured primarily by commercial real estate and includes first mortgage loans, subordinate mortgage and mezzanine loans and participations in such loans and preferred equity interests. The Company |
NORTHSTAR REALTY FINANCE CORP. AND SUBSIDIARIES
NOTES TO CONSOLIDATED FINANCIAL STATEMENTS (Continued)
may from time to time take title to collateral in connection with a CRE debt investment as REO which would be included in the CRE debt business.
| |
| • | Commercial Real Estate Securities - The CRE securities business is predominately comprised of N-Star CDO bonds and N-Star CDO equity of deconsolidated N-Star CDOs and includes other securities, mostly conduit CMBS. The Company also invests in opportunistic CRE securities such as an investment in a “B-piece” CMBS. |
| |
| • | N-Star CDOs - The Company historically originated or acquired CRE debt and securities investments that were predominantly financed through permanent, non-recourse CDOs. All of the Company’s CDOs are past the reinvestment period and given the nature of these transactions, these CDOs are amortizing over time as the underlying assets paydown or are sold. The Company has been winding down its legacy CDO business and investing in a broad and diverse range of CRE assets. As a result, this distinct business is a significantly smaller portion of its business today than in the past. As of December 31, 2014, only N-Star securities CDOs I and IX continue to be consolidated. Refer to Note 3 for further disclosure regarding deconsolidated N-Star CDOs. The Company continues to receive collateral management fees related to administrative responsibilities for deconsolidated N-Star CDO financing transactions, which are recorded in other revenue and included in the N-Star CDOs segment. |
| |
| • | Corporate - The corporate segment includes corporate level interest income, interest expense and general and administrative expenses. |
The Company primarily generates revenue from rental income from its real estate properties, operating income from healthcare and hotel properties permitted by the RIDEA and net interest income on the CRE debt and securities portfolios. Additionally, the Company records equity in earnings of unconsolidated ventures, including from PE Investments. The Company’s income is primarily derived through the difference between revenue and the cost at which the Company is able to finance its investments. The Company may also acquire investments which generate attractive returns without any leverage.
Prior to the spin-off of its asset management business, the Company generated fee income from asset management activities. The asset management segment represents the consolidated results of operations and balance sheet of such asset management business which was transferred to NSAM in connection with the spin-off. Amounts related to the asset management business are reported in discontinued operations and include an allocation of indirect expenses related to managing the NSAM Sponsored Companies and owning NorthStar Securities, including salaries, equity-based compensation and other general and administrative expenses (primarily occupancy and other costs) based on an estimate had the asset management business been run as an independent entity.
The following tables present segment reporting for the years ended December 31, 2014, 2013 and 2012 (dollars in thousands):
|
| | | | | | | | | | | | | | | | | | | | | | | | | | | |
| Statement of Operations: |
|
|
|
|
|
| N-Star CDOs(1) |
|
|
|
|
|
|
| Year ended December 31, 2014: | Real Estate |
| CRE
Debt |
| CRE
Securities |
| CRE Securities |
| Corporate |
| Asset Management(2) |
| Consolidated Total |
| Rental and escalation income | $ | 350,273 |
| | $ | — |
| | $ | — |
| | $ | 1,285 |
| | $ | — |
| | $ | — |
| | $ | 351,558 |
|
| Hotel related income | 237,039 |
| | — |
| | — |
| | — |
| | — |
| | — |
| | 237,039 |
|
| Resident fee income | 77,516 |
| | — |
| | — |
| | — |
| | — |
| | — |
| | 77,516 |
|
| Net interest income on debt and securities | 5,059 |
| (3) | 145,159 |
| | 82,246 |
| | 63,216 |
| | 1,567 |
| (4) | — |
| | 297,247 |
|
| Other interest expense | 182,329 |
| | — |
| | — |
| | — |
| | 48,852 |
| | — |
| | 231,181 |
|
| Income (loss) before equity in earnings (losses) and income tax benefit (expense) | (174,129 | ) | (5) | 139,581 |
| | 104,423 |
| | (188,462 | ) | | (342,818 | ) | | — |
| | (461,405 | ) |
| Equity in earnings (losses) of unconsolidated ventures | 145,363 |
| | 2,644 |
| | — |
| | — |
| | 283 |
| | — |
| | 148,290 |
|
| Income tax benefit (expense) | 859 |
| | (70 | ) | | (205 | ) | | (352 | ) | | (75 | ) | | — |
| | 157 |
|
| Income (loss) from continuing operations | (27,907 | ) | | 142,155 |
| | 104,218 |
| | (188,814 | ) | | (342,610 | ) | | — |
| | (312,958 | ) |
| Income (loss) from discontinued operations | (925 | ) | | — |
| | — |
| | — |
| | — |
| | (7,203 | ) | | (8,128 | ) |
| Net income (loss) | (28,832 | ) | | 142,155 |
| | 104,218 |
| | (188,814 | ) | | (342,610 | ) | | (7,203 | ) | | (321,086 | ) |
| Balance Sheet: | | | | | | | | | | | | | |
| December 31, 2014: | | | | | | | | | | | | | |
| Investments in private equity funds, at fair value | $ | 962,038 |
| | $ | — |
| | $ | — |
| | $ | — |
| | $ | — |
| | $ | — |
| | $ | 962,038 |
|
| Investments in unconsolidated ventures | 184,026 |
| | 8,526 |
| | — |
| | — |
| | 15,225 |
| | — |
| | 207,777 |
|
| Total Assets | 13,006,146 |
| | 1,160,763 |
| | 421,840 |
| | 502,660 |
| | 234,947 |
| | — |
| | 15,326,356 |
|
___________________________________
| |
| (1) | Based on CDO financing transactions that were primarily collateralized by either CRE debt or securities and may include other types of investments. $5.9 million of collateral management fees were earned from CDO financing transactions for the year ended December 31, 2014, of which $2.6 million were |
NORTHSTAR REALTY FINANCE CORP. AND SUBSIDIARIES
NOTES TO CONSOLIDATED FINANCIAL STATEMENTS (Continued)
eliminated in consolidation. The eliminated amounts are recorded as other revenue in the Corporate segment and as an expense in the N-Star CDO segment.
| |
| (2) | Represents the consolidated statements of operations of NSAM reported in discontinued operations and includes an allocation of indirect expenses from the Company (refer to Note 10). |
| |
| (3) | Primarily represents interest income earned from notes receivable on manufactured homes. |
| |
| (4) | Represents income earned from CDO bonds repurchased at a discount, recognized using the effective interest method, that is eliminated in consolidation. The corresponding interest expense is recorded in net interest income in the N-Star CDO segments. |
| |
| (5) | Primarily relates to transaction costs and includes depreciation and amortization of $182.6 million for the year ended December 31, 2014. |
|
| | | | | | | | | | | | | | | | | | | | | | | | | | | | | | | |
| Statement of Operations: |
|
|
|
|
|
| N-Star CDOs(1) | | |
|
|
|
|
| Year ended December 31, 2013: | Real Estate |
| CRE
Debt |
| CRE
Securities |
| CRE
Debt |
| CRE
Securities | | Corporate |
| Asset Management(2) |
| Consolidated
Total |
| Rental and escalation income | $ | 202,765 |
|
| $ | 260 |
|
| $ | — |
|
| $ | 30,947 |
|
| $ | 1,152 |
| | $ | — |
|
| $ | — |
|
| $ | 235,124 |
|
| Net interest income on debt and securities | 833 |
| (3) | 48,594 |
|
| 38,160 |
|
| 50,149 |
|
| 84,600 |
| | 43,501 |
| (4) | — |
|
| 265,837 |
|
| Other interest expense | 76,388 |
| | — |
| | — |
| | 9,356 |
| | — |
| | 54,763 |
| | — |
| | 140,507 |
|
| Income (loss) before equity in earnings (losses) and income tax benefit (expense) | (5,186 | ) | (5) | 50,632 |
|
| 83,828 |
|
| (312,148 | ) |
| 97,788 |
| | (78,540 | ) |
| — |
|
| (163,626 | ) |
| Equity in earnings (losses) of unconsolidated ventures | 82,700 |
|
| 3,594 |
|
| — |
|
| (817 | ) |
| — |
| | — |
|
| — |
|
| 85,477 |
|
| Income tax benefit (expense) | (1,000 | ) | | — |
| | — |
| | — |
| | — |
| | — |
| | — |
| | (1,000 | ) |
| Income (loss) from continuing operations | 76,514 |
|
| 54,226 |
|
| 83,828 |
|
| (312,965 | ) |
| 97,788 |
| | (78,540 | ) |
| — |
|
| (79,149 | ) |
| Income (loss) from discontinued operations | (8,356 | ) |
| — |
|
| — |
|
| — |
|
| — |
| | — |
|
| (405 | ) |
| (8,761 | ) |
| Net income (loss) | 68,158 |
|
| 54,226 |
|
| 83,828 |
|
| (312,965 | ) |
| 97,788 |
| | (78,540 | ) |
| (405 | ) |
| (87,910 | ) |
| Balance Sheet: | | | | | | | | | | | | | | | |
| December 31, 2013: | | | | | | | | | | | | | | | |
| Investments in private equity funds, at fair value | $ | 586,018 |
| | $ | — |
| | $ | — |
| | $ | — |
| | $ | — |
| | $ | — |
| | $ | — |
| | $ | 586,018 |
|
| Investments in unconsolidated ventures | 113,735 |
| | 14,222 |
| | — |
| | — |
| | — |
| | 14,383 |
| | — |
| | 142,340 |
|
| Total Assets | 3,343,402 |
| | 1,211,079 |
| | 418,837 |
| | — |
| | 727,875 |
| | 627,148 |
| | 31,709 |
| | 6,360,050 |
|
___________________________________
| |
| (1) | Based on CDO financing transactions that were primarily collateralized by either CRE debt or securities and may include other types of investments. $11.1 million of collateral management fees were earned from CDO financing transactions for the year ended December 31, 2013, of which $10.4 million were eliminated in consolidation. The eliminated amounts are recorded as other revenue in the Corporate segment and as an expense in the N-Star CDO segment. |
| |
| (2) | Represents the consolidated statements of operations of NSAM reported in discontinued operations and includes an allocation of indirect expenses from the Company (refer to Note 10). |
| |
| (3) | Primarily represents interest income earned from notes receivable on manufactured homes. |
| |
| (4) | Represents income earned from CDO bonds repurchased at a discount, recognized using the effective interest method, that is eliminated in consolidation. The corresponding interest expense is recorded in net interest income in the N-Star CDO segments. |
| |
| (5) | Includes depreciation and amortization of $75.8 million for the year ended December 31, 2013. |
|
| | | | | | | | | | | | | | | | | | | | | | | | | | | | | | | |
| Statement of Operations: | | | | | | | N-Star CDOs(1) | | | | | | |
| Year ended December 31, 2012: | Real Estate | | CRE
Debt | | CRE
Securities | | CRE
Debt | | CRE
Securities | | Corporate | | Asset Management(2) | | Consolidated
Total |
| Rental and escalation income | $ | 82,201 |
| | $ | — |
| | $ | — |
| | $ | 30,295 |
| | $ | — |
| | $ | — |
| | $ | — |
| | $ | 112,496 |
|
| Net interest income on debt and securities | 158 |
| (3) | 14,592 |
| | 17,499 |
| | 146,977 |
| | 117,320 |
| | 38,950 |
| (4) | — |
| | 335,496 |
|
| Other interest expense | 39,992 |
| | — |
| | — |
| | 9,858 |
| | — |
| | 39,686 |
| | — |
| | 89,536 |
|
| Income (loss) before equity in earnings (losses) and income tax benefit (expense) | 44,782 |
| (5) | 14,256 |
| | 21,966 |
| | (164,971 | ) | | (90,109 | ) | | (83,730 | ) | | — |
| | (257,806 | ) |
| Equity in earnings (losses) of unconsolidated ventures | (458 | ) | | 1,904 |
| | — |
| | (1,358 | ) | | — |
| | — |
| | — |
| | 88 |
|
| Income (loss) from continuing operations | 44,324 |
| | 16,160 |
| | 21,966 |
| | (166,329 | ) | | (90,109 | ) | | (83,730 | ) | | — |
| | (257,718 | ) |
| Income (loss) from discontinued operations | (668 | ) | | — |
| | — |
| | 540 |
| | — |
| | — |
| | (17,322 | ) | | (17,450 | ) |
| Gain (loss) on sale of discontinued operations | — |
| | — |
| | — |
| | 2,079 |
| | — |
| | — |
| | — |
| | 2,079 |
|
| Net income (loss) | 43,656 |
| | 16,160 |
| | 21,966 |
| | (163,710 | ) | | (90,109 | ) | | (83,730 | ) | | (17,322 | ) | | (273,089 | ) |
| Balance Sheet: | | | | | | | | | | | | | | | |
| December 31, 2012: | | | | | | | | | | | | | | | |
| Investments in unconsolidated ventures | $ | 30,293 |
| | $ | 5,740 |
| | $ | — |
| | $ | 64,845 |
| | $ | — |
| | $ | 10,147 |
| | $ | — |
| | $ | 111,025 |
|
| Total Assets | 1,197,910 |
| | 412,598 |
| | 208,988 |
| | 2,245,530 |
| | 1,035,862 |
| | 391,898 |
| | 20,992 |
| | 5,513,778 |
|
NORTHSTAR REALTY FINANCE CORP. AND SUBSIDIARIES
NOTES TO CONSOLIDATED FINANCIAL STATEMENTS (Continued)
_______________________________________________
| |
| (1) | Based on CDO financing transactions that were primarily collateralized by either CRE debt or securities and may include other types of investments. $14.4 million of collateral management fees were earned from CDO financing transactions for the year ended December 31, 2012, of which all amounts were eliminated in consolidation. The eliminated amounts are recorded as other revenue in the Corporate segment and as an expense in the N-Star CDO segment. |
| |
| (2) | Represents the consolidated statements of operations of NSAM reported in discontinued operations and includes an allocation of indirect expenses from the Company (refer to Note 10). |
| |
| (3) | Primarily represents interest income earned from notes receivable on manufactured homes. |
| |
| (4) | Represents income earned from CDO bonds repurchased at a discount, recognized using the effective interest method, that is eliminated in consolidation. The corresponding interest expense is recorded in net interest income in the N-Star CDO segments. |
| |
| (5) | Includes depreciation and amortization of $27.0 million for the year ended December 31, 2012. |
20.Supplemental Disclosures of Non-cash Investing and Financing Activities
The following table presents non-cash investing and financing activities for the years ended December 31, 2014, 2013 and 2012 (dollars in thousands):
|
| | | | | | | | | | | |
| | Years Ended December 31, |
| | 2014 | | 2013 | | 2012 |
| Issuance of common stock in connection with the merger of Griffin-American | $ | 1,075,930 |
| | $ | — |
| | $ | — |
|
| Assumption of mortgage notes payable upon acquisition of operating real estate | 870,871 |
| | — |
| | — |
|
| Acquired assets in connection with the merger of Griffin-American | 503,784 |
| | — |
| | — |
|
| Conversion of exchangeable senior notes | 320,304 |
| | 74,778 |
| | — |
|
| Exchangeable senior notes exchanged for Senior Notes (refer to Note 9) | 296,382 |
| | — |
| | — |
|
| Acquired liabilities in connection with the merger of Griffin-American | 229,015 |
| | — |
| | — |
|
| Reclassification of operating real estate to deferred costs and intangible assets | 160,511 |
| | 25,497 |
| | 7,536 |
|
| Contribution from non-controlling interests | 75,428 |
| | — |
| | — |
|
| Reclassification of operating real estate to other assets | 67,655 |
| | 89,219 |
| | — |
|
| CRE debt investment payoff due from servicer | 64,092 |
| | — |
| | — |
|
| Net assets distributed in spin-off of asset management business (refer to Note 10) | 39,709 |
| | — |
| | — |
|
| Escrow deposit payable related to CRE debt investments | 34,521 |
| | 57,226 |
| | 37,176 |
|
| Reclassification of operating real estate to asset held for sale | 22,323 |
| | 30,063 |
| | 1,046 |
|
| Conversion of Old LTIP Units (refer to Note 12) | 18,611 |
| | 10,129 |
| | 3,149 |
|
| Non-cash related to PE Investments | 15,581 |
| | 17,473 |
| | — |
|
| Reclassification of CRE debt investment to held for sale | 15,223 |
| | — |
| | — |
|
| Common stock related to transactions (refer to Note 13) | 6,801 |
| | 17,712 |
| | — |
|
| Dividends payable related to RSUs | — |
| | 2,128 |
| | — |
|
Real estate acquisition(1) | — |
| | 135,361 |
| | 62,236 |
|
Reduction of CRE debt investments(1) | — |
| | 135,361 |
| | 62,236 |
|
| Assignment of mortgage note payable via sale | — |
| | 7,813 |
| | — |
|
Increase in restricted cash(1) | — |
| | 2,730 |
| | — |
|
| Deferred purchase price for PE Investment III (refer to Note 6) | — |
| | 39,759 |
| | — |
|
| Reclassification of real estate debt investment to other assets | — |
| | 8,952 |
| | — |
|
| Reclassification of mortgage note payable to liabilities held for sale | — |
| | 28,962 |
| | — |
|
| Activity in non-controlling interest | — |
| | — |
| | 2,358 |
|
| Equity component of exchangeable senior notes | — |
| | 45,740 |
| | 2,179 |
|
| Decrease of restricted cash in connection with swap collateral | — |
| | — |
| | 22,037 |
|
| Assignment of CRE debt investment | — |
| | — |
| | 26,100 |
|
| Discount on CRE debt investment | — |
| | — |
| | 2,516 |
|
| Due from related party | — |
| | — |
| | 11,795 |
|
___________________________________________________________
| |
| (1) | Non-cash activity occurred in connection with taking title to collateral. |
Cash Paid for Interest and Income Taxes
For the years ended December 31, 2014, 2013, and 2012, cash paid for interest on outstanding borrowings was $223.0 million, $158.9 million and $126.2 million, respectively. The difference between interest expense on the consolidated statements of operations and cash paid for interest is primarily due to reclassification of losses related to derivative instruments from OCI into earnings and non-cash interest expense recorded on amortization of deferred financing costs related to borrowings. For the year ended December 31, 2014, cash paid for income taxes was $3.4 million. There was an immaterial amount of cash paid for
income taxes for the years ended December 31, 2013 and 2012.
Dividends
On February 25, 2015, the Company declared a dividend of $0.40 per share of common stock. The common stock dividend will be paid on March 13, 2015 to stockholders of record as of the close of business on March 9, 2015. On January 30, 2015, the Company declared a dividend of $0.54688 per share of Series A preferred stock, $0.51563 per share of Series B preferred stock, $0.55469 per share of Series C preferred stock, $0.53125 per share of Series D Preferred Stock and $0.54688 per share of Series E Preferred Stock. Dividends were paid on all series of preferred stock on February 17, 2015 to stockholders of record as of the close of business on February 9, 2015.
SEB Portfolio
In December 2014, the Company entered into a definitive agreement to acquire an approximate €1.1 billion ($1.3 billion) European office portfolio (“SEB Portfolio”), comprised of 11 Class A office properties located across gateway cities in seven of Europe’s top markets. The SEB Portfolio consists of approximately 186,000 square meters with a well-diversified mix of market leading tenants. The Company recorded $8.9 million of estimated transaction costs in the fourth quarter 2014 in connection with this transaction. In connection with entering into the agreement to acquire the SEB Portfolio, the Company deposited in escrow €25.0 million in cash and also provided a €25.0 million corporate guarantee to secure its obligations under the purchase agreement, both of which are non-refundable except in limited circumstances where the acquisition of the SEB Portfolio is not completed due to no fault by the Company.
Trias Portfolio
In December 2014, the Company signed a purchase agreement to acquire an approximate €0.5 billion ($0.6 billion) Pan-European office portfolio (“Trias Portfolio”), located across eight European countries including United Kingdom, Germany, France, Belgium, Netherlands, Spain, Portugal and Italy. The Trias Portfolio is comprised of 38 properties, which includes 30 office properties, five retail properties, two hotels and an industrial property. Approximately 75% of the rent derived from the Trias Portfolio is from properties located in the U.K., Germany and France. The Trias Portfolio consists of approximately 259,000 square meters and is currently approximately 90% leased with a weighted average lease term of approximately four years. The Company recorded $18.6 million of estimated transaction costs in the fourth quarter 2014 in connection with this transaction.
Proposed Spin-off of European Real Estate Business
On February 26, 2015, the Company announced that its board of directors unanimously approved the Proposed European Spin of NRE, expected to be listed on the NYSE and potentially in Europe. Currently, the Company acquired or committed to acquire $2.0 billion of European real estate comprised of 50 properties spanning across some of Europe’s top markets that will be contributed to NRE upon the completion of the Proposed European Spin. NSAM will manage NRE pursuant to a long-term management agreement, on substantially similar terms as the Company’s management agreement with NSAM. The Proposed European Spin is expected to be completed in the second half of 2015.
NORTHSTAR REALTY FINANCE CORP. AND SUBSIDIARIES
SCHEDULE II - VALUATION AND QUALIFYING ACCOUNTS AND RESERVES
(Dollars in Thousands)
|
| | | | | | | | | | | | | | | | | | | | |
| | | Beginning Balance | | Charged to Costs and Expenses | | Other Charges | | Deductions | | Ending Balance |
| For the Year Ended December 31, 2014 | | | | | | | | | | |
| Loan loss reserves | | $ | 2,880 |
| | $ | 2,719 |
| (1) | $ | — |
| | $ | — |
| | $ | 5,599 |
|
| Allowance for doubtful accounts | | 1,151 |
| | 3,220 |
| | — |
| | (2,351 | ) | | 2,020 |
|
| Allowance for unbilled rent receivable | | 307 |
| | 7,638 |
| | — |
| | (3,908 | ) | | 4,037 |
|
| | | $ | 4,338 |
| | $ | 13,577 |
| | $ | — |
| | $ | (6,259 | ) | | $ | 11,656 |
|
| For the Year Ended December 31, 2013 | | | | | | | | | | |
| Loan loss reserves | | $ | 156,699 |
| | $ | (8,786 | ) | | $ | — |
| | $ | (145,033 | ) | | $ | 2,880 |
|
| Allowance for doubtful accounts | | 1,526 |
| | 784 |
| | — |
| | (1,159 | ) | | 1,151 |
|
| Allowance for unbilled rent receivable | | — |
| | 354 |
| | — |
| | (47 | ) | | 307 |
|
| | | $ | 158,225 |
| | $ | (7,648 | ) | | $ | — |
| | $ | (146,239 | ) | | $ | 4,338 |
|
| For the Year Ended December 31, 2012 | | | | | | | | | | |
| Loan loss reserves | | $ | 187,784 |
| | $ | 23,037 |
| | $ | — |
| | $ | (54,122 | ) | | $ | 156,699 |
|
| Allowance for doubtful accounts | | 1,179 |
| | 833 |
| | — |
| | (486 | ) | | 1,526 |
|
| | | $ | 188,963 |
| | $ | 23,870 |
| | $ | — |
| | $ | (54,608 | ) | | $ | 158,225 |
|
____________________________________________________________
| |
| (1) | Excludes $1.0 million of provision for loan losses relating to notes receivables recorded in other assets. |
NORTHSTAR REALTY FINANCE CORP. AND SUBSIDIARIES
SCHEDULE III - REAL ESTATE AND ACCUMULATED DEPRECIATION
As of December 31, 2014
(Dollars in Thousands)
|
| | | | | | | | | | | | | | | | | | | | | | | | | | | | | | | | | | | | | | | | |
| Column A | | Column B | | Column C Initial Cost | | Column D Capitalized Subsequent to Acquisition | | Column E Gross Amount Carried at Close of Period | | Column F | | Column G | | Column H |
| Location City, State | | Encumbrances | | Land | | Building & Improvements | | Land, Buildings & Improvements | | Land | | Building & Improvements | | Total | | Accumulated Depreciation | | Total | | Date Acquired | | Life on Which Depreciation is Computed |
| Healthcare | | | | | | | | | | | | | | | | | | | | | | |
| Medical Office Building | | | | | | | | | | | | | | | | | | | | | | |
| Abilene, TX | | $ | 11,430 |
| | $ | 742 |
| | $ | 7,629 |
| | $ | — |
| | $ | 742 |
| | $ | 7,629 |
| | $ | 8,371 |
| | $ | 20 |
| | $ | 8,351 |
| | Dec-14 | | 39 years |
| Alice, TX | | 6,199 |
| | 952 |
| | 24,518 |
| | — |
| | 952 |
| | 24,518 |
| | 25,470 |
| | 62 |
| | 25,408 |
| | Dec-14 | | 39 years |
| Amarillo, TX | | 17,435 |
| | 411 |
| | 6,734 |
| | — |
| | 411 |
| | 6,734 |
| | 7,145 |
| | 17 |
| | 7,128 |
| | Dec-14 | | 39 years |
Austell, GA(3) | | 7,362 |
| | — |
| | 6,607 |
| | 15 |
| | — |
| | 6,622 |
| | 6,622 |
| | 16 |
| | 6,606 |
| | Dec-14 | | 39 years |
| Avon, IN | | 5,231 |
| | 1,313 |
| | 6,791 |
| | — |
| | 1,313 |
| | 6,791 |
| | 8,104 |
| | 20 |
| | 8,084 |
| | Dec-14 | | 39 years |
| Batavia, OH | | 9,589 |
| | 1,233 |
| | 23,274 |
| | — |
| | 1,233 |
| | 23,274 |
| | 24,507 |
| | 60 |
| | 24,447 |
| | Dec-14 | | 39 years |
| Beachwood, OH | | 12,108 |
| | 411 |
| | 5,042 |
| | — |
| | 411 |
| | 5,042 |
| | 5,453 |
| | 13 |
| | 5,440 |
| | Dec-14 | | 39 years |
| Benton, AR | | 9,378 |
| | 1,353 |
| | 47,897 |
| | — |
| | 1,353 |
| | 47,897 |
| | 49,250 |
| | 120 |
| | 49,130 |
| | Dec-14 | | 39 years |
| Bessemer, AL | | 25,208 |
| | 942 |
| | 33,535 |
| | — |
| | 942 |
| | 33,535 |
| | 34,477 |
| | 84 |
| | 34,393 |
| | Dec-14 | | 39 years |
| Bloomington, IN | | 5,812 |
| | 1,303 |
| | 16,943 |
| | 16 |
| | 1,303 |
| | 16,959 |
| | 18,262 |
| | 44 |
| | 18,218 |
| | Dec-14 | | 39 years |
| Boynton Beach, FL | | 6,329 |
| | 1,183 |
| | 17,214 |
| | — |
| | 1,183 |
| | 17,214 |
| | 18,397 |
| | 45 |
| | 18,352 |
| | Dec-14 | | 39 years |
Bradenton, FL(3) | | 12,723 |
| | — |
| | 6,477 |
| | — |
| | — |
| | 6,477 |
| | 6,477 |
| | 16 |
| | 6,461 |
| | Dec-14 | | 39 years |
Brentwood, CA(3) | | 16,292 |
| | — |
| | 33,612 |
| | — |
| | — |
| | 33,612 |
| | 33,612 |
| | 82 |
| | 33,530 |
| | Dec-14 | | 39 years |
| Brownsburg, IN | | 17,629 |
| | 521 |
| | 3,388 |
| | — |
| | 521 |
| | 3,388 |
| | 3,909 |
| | 10 |
| | 3,899 |
| | Dec-14 | | 39 years |
| Bryant, AR | | 5,570 |
| | 922 |
| | 25,216 |
| | — |
| | 922 |
| | 25,216 |
| | 26,138 |
| | 64 |
| | 26,074 |
| | Dec-14 | | 39 years |
| Carlsbad, NM | | 6,800 |
| | 451 |
| | 5,278 |
| | — |
| | 451 |
| | 5,278 |
| | 5,729 |
| | 14 |
| | 5,715 |
| | Dec-14 | | 39 years |
| Carmel, IN | | 22,472 |
| | 6,084 |
| | 117,849 |
| | — |
| | 6,084 |
| | 117,849 |
| | 123,933 |
| | 302 |
| | 123,631 |
| | Dec-14 | | 39 years |
| Carson City, NV | | 19,179 |
| | 561 |
| | 8,395 |
| | 12 |
| | 561 |
| | 8,407 |
| | 8,968 |
| | 22 |
| | 8,946 |
| | Dec-14 | | 39 years |
| Champaign, IL | | 4,688 |
| | 1,002 |
| | 14,176 |
| | 1 |
| | 1,002 |
| | 14,177 |
| | 15,179 |
| | 37 |
| | 15,142 |
| | Dec-14 | | 39 years |
Chillicothe, OH(3) | | — |
| | 401 |
| | 6,654 |
| | — |
| | 401 |
| | 6,654 |
| | 7,055 |
| | 17 |
| | 7,038 |
| | Dec-14 | | 39 years |
| Chula Vista, CA | | 22,543 |
| | 1,403 |
| | 15,109 |
| | 1 |
| | 1,403 |
| | 15,110 |
| | 16,513 |
| | 40 |
| | 16,473 |
| | Dec-14 | | 39 years |
Cleveland, OH(3) | | 6,635 |
| | — |
| | 28,811 |
| | — |
| | — |
| | 28,811 |
| | 28,811 |
| | 70 |
| | 28,741 |
| | Dec-14 | | 39 years |
| Columbia, SC | | 3,874 |
| | 672 |
| | 5,045 |
| | — |
| | 672 |
| | 5,045 |
| | 5,717 |
| | 14 |
| | 5,703 |
| | Dec-14 | | 39 years |
| Decatur, GA | | 12,694 |
| | 1,333 |
| | 10,554 |
| | — |
| | 1,333 |
| | 10,554 |
| | 11,887 |
| | 29 |
| | 11,858 |
| | Dec-14 | | 39 years |
| Des Plaines, IL | | 9,880 |
| | 1,834 |
| | 18,329 |
| | — |
| | 1,834 |
| | 18,329 |
| | 20,163 |
| | 49 |
| | 20,114 |
| | Dec-14 | | 39 years |
| DeSoto, TX | | 9,414 |
| | 1,082 |
| | 7,041 |
| | — |
| | 1,082 |
| | 7,041 |
| | 8,123 |
| | 20 |
| | 8,103 |
| | Dec-14 | | 39 years |
| East Arlington, TX | | 3,157 |
| | 3,619 |
| | 901 |
| | 63 |
| | 3,619 |
| | 964 |
| | 4,583 |
| | 172 |
| | 4,411 |
| | May-07 | | 40 years |
| El Paso, TX | | 9,996 |
| | 702 |
| | 7,389 |
| | — |
| | 702 |
| | 7,389 |
| | 8,091 |
| | 20 |
| | 8,071 |
| | Dec-14 | | 39 years |
| Ennis, TX | | 7,265 |
| | 1,113 |
| | 7,603 |
| | — |
| | 1,113 |
| | 7,603 |
| | 8,716 |
| | 21 |
| | 8,695 |
| | Dec-14 | | 39 years |
| Escanaba, MI | | 13,437 |
| | 872 |
| | 7,719 |
| | — |
| | 872 |
| | 7,719 |
| | 8,591 |
| | 21 |
| | 8,570 |
| | Dec-14 | | 39 years |
| Evansville, IN | | 34,515 |
| | 1,082 |
| | 3,781 |
| | 89 |
| | 1,082 |
| | 3,870 |
| | 4,952 |
| | 12 |
| | 4,940 |
| | Dec-14 | | 39 years |
| Frisco, TX | | 16,902 |
| | 1,133 |
| | 8,797 |
| | — |
| | 1,133 |
| | 8,797 |
| | 9,930 |
| | 24 |
| | 9,906 |
| | Dec-14 | | 39 years |
| Greeley, CO | | 36,636 |
| | 2,195 |
| | 40,133 |
| | 30 |
| | 2,195 |
| | 40,163 |
| | 42,358 |
| | 103 |
| | 42,255 |
| | Dec-14 | | 39 years |
| Hendersonville, TN | | 7,846 |
| | 2,135 |
| | 23,346 |
| | — |
| | 2,135 |
| | 23,346 |
| | 25,481 |
| | 62 |
| | 25,419 |
| | Dec-14 | | 39 years |
Highlands Ranch, CO(3) | | 8,495 |
| | — |
| | 6,150 |
| | — |
| | — |
| | 6,150 |
| | 6,150 |
| | 15 |
| | 6,135 |
| | Dec-14 | | 39 years |
Hilo, HI(3) | | 8,814 |
| | — |
| | 6,204 |
| | — |
| | — |
| | 6,204 |
| | 6,204 |
| | 15 |
| | 6,189 |
| | Dec-14 | | 39 years |
| Hinsdale, IL | | 37,001 |
| | 481 |
| | 4,342 |
| | — |
| | 481 |
| | 4,342 |
| | 4,823 |
| | 12 |
| | 4,811 |
| | Dec-14 | | 39 years |
Hobbs, NM(3) | | 4,262 |
| | — |
| | 5,466 |
| | — |
| | — |
| | 5,466 |
| | 5,466 |
| | 13 |
| | 5,453 |
| | Dec-14 | | 39 years |
| Hope, AR | | 533 |
| | 3,929 |
| | 76,132 |
| | — |
| | 3,929 |
| | 76,132 |
| | 80,061 |
| | 195 |
| | 79,866 |
| | Dec-14 | | 39 years |
Houston, TX(3) | | 4,097 |
| | — |
| | 2,051 |
| | — |
| | — |
| | 2,051 |
| | 2,051 |
| | 5 |
| | 2,046 |
| | Dec-14 | | 39 years |
Humble, TX(3) | | 11,594 |
| | — |
| | 6,844 |
| | — |
| | — |
| | 6,844 |
| | 6,844 |
| | 17 |
| | 6,827 |
| | Dec-14 | | 39 years |
Huntsville, AL(3) | | 8,718 |
| | — |
| | 11,267 |
| | — |
| | — |
| | 11,267 |
| | 11,267 |
| | 27 |
| | 11,240 |
| | Dec-14 | | 39 years |
| Indianapolis, IN | | 81,967 |
| | 5,663 |
| | 125,508 |
| | 15 |
| | 5,663 |
| | 125,523 |
| | 131,186 |
| | 319 |
| | 130,867 |
| | Dec-14 | | 39 years |
| Jasper, GA | | 14,505 |
| | 7,186 |
| | 71,232 |
| | 600 |
| | 7,186 |
| | 71,832 |
| | 79,018 |
| | 191 |
| | 78,827 |
| | Dec-14 | | 39 years |
| Jersey City, NJ | | 31,771 |
| | 1,293 |
| | 64,130 |
| | 60 |
| | 1,293 |
| | 64,190 |
| | 65,483 |
| | 159 |
| | 65,324 |
| | Dec-14 | | 39 years |
| Johns Creek, GA | | 19,469 |
| | 1,103 |
| | 7,227 |
| | — |
| | 1,103 |
| | 7,227 |
| | 8,330 |
| | 20 |
| | 8,310 |
| | Dec-14 | | 39 years |
| Killeen, TX | | 1,744 |
| | 551 |
| | 8,871 |
| | — |
| | 551 |
| | 8,871 |
| | 9,422 |
| | 23 |
| | 9,399 |
| | Dec-14 | | 39 years |
| Knoxville, TN | | 58,785 |
| | 722 |
| | 8,941 |
| | — |
| | 722 |
| | 8,941 |
| | 9,663 |
| | 24 |
| | 9,639 |
| | Dec-14 | | 39 years |
| Lacombe, LA | | 11,381 |
| | 2,456 |
| | 26,082 |
| | 27 |
| | 2,456 |
| | 26,109 |
| | 28,565 |
| | 69 |
| | 28,496 |
| | Dec-14 | | 39 years |
Lafayette, IN(3) | | 36,129 |
| | — |
| | 34,590 |
| | — |
| | — |
| | 34,590 |
| | 34,590 |
| | 84 |
| | 34,506 |
| | Dec-14 | | 39 years |
| Lake Charles, LA | | 3,429 |
| | 2,005 |
| | 16,141 |
| | — |
| | 2,005 |
| | 16,141 |
| | 18,146 |
| | 44 |
| | 18,102 |
| | Dec-14 | | 39 years |
| Las Vegas, NM | | 4,843 |
| | 1,473 |
| | 6,959 |
| | — |
| | 1,473 |
| | 6,959 |
| | 8,432 |
| | 21 |
| | 8,411 |
| | Dec-14 | | 39 years |
Lawton, OK(3) | | 11,944 |
| | — |
| | 77,165 |
| | — |
| | — |
| | 77,165 |
| | 77,165 |
| | 188 |
| | 76,977 |
| | Dec-14 | | 39 years |
Lemont, IL(3) | | 6,683 |
| | — |
| | 29,571 |
| | — |
| | — |
| | 29,571 |
| | 29,571 |
| | 72 |
| | 29,499 |
| | Dec-14 | | 39 years |
| Livingston, TX | | 6,296 |
| | 2,857 |
| | 10,266 |
| | — |
| | 2,857 |
| | 10,266 |
| | 13,123 |
| | 32 |
| | 13,091 |
| | Dec-14 | | 39 years |
Lufkin, TX(3) | | 3,962 |
| | — |
| | 5,559 |
| | 39 |
| | — |
| | 5,598 |
| | 5,598 |
| | 14 |
| | 5,584 |
| | Dec-14 | | 39 years |
| Marrietta, GA | | 13,561 |
| | 5,132 |
| | 21,153 |
| | — |
| | 5,132 |
| | 21,153 |
| | 26,285 |
| | 64 |
| | 26,221 |
| | Dec-14 | | 39 years |
| Memphis, TN | | 5,134 |
| | 1,273 |
| | 26,618 |
| | 21 |
| | 1,273 |
| | 26,639 |
| | 27,912 |
| | 68 |
| | 27,844 |
| | Dec-14 | | 39 years |
| Middletown, NY | | 119,033 |
| | 12,779 |
| | 74,718 |
| | — |
| | 12,779 |
| | 74,718 |
| | 87,497 |
| | 213 |
| | 87,284 |
| | Dec-14 | | 39 years |
| Muncie, IN | | 8,136 |
| | 3,368 |
| | 14,980 |
| | — |
| | 3,368 |
| | 14,980 |
| | 18,348 |
| | 45 |
| | 18,303 |
| | Dec-14 | | 39 years |
| Munster, IN | | 28,126 |
| | 4,350 |
| | 36,960 |
| | 95 |
| | 4,350 |
| | 37,055 |
| | 41,405 |
| | 101 |
| | 41,304 |
| | Dec-14 | | 39 years |
| Naperville, IL | | 9,938 |
| | 852 |
| | 4,501 |
| | — |
| | 852 |
| | 4,501 |
| | 5,353 |
| | 13 |
| | 5,340 |
| | Dec-14 | | 39 years |
| New Port Richey, FL | | 3,681 |
| | 852 |
| | 4,610 |
| | 41 |
| | 852 |
| | 4,651 |
| | 5,503 |
| | 13 |
| | 5,490 |
| | Dec-14 | | 39 years |
| Noblesville, IN | | 15,315 |
| | 852 |
| | 16,920 |
| | — |
| | 852 |
| | 16,920 |
| | 17,772 |
| | 43 |
| | 17,729 |
| | Dec-14 | | 39 years |
Novi, MI(3) | | 11,623 |
| | — |
| | 16,798 |
| | — |
| | — |
| | 16,798 |
| | 16,798 |
| | 41 |
| | 16,757 |
| | Dec-14 | | 39 years |
Okatie, SC(3) | | 6,563 |
| | — |
| | 4,742 |
| | — |
| | — |
| | 4,742 |
| | 4,742 |
| | 12 |
| | 4,730 |
| | Dec-14 | | 39 years |
Pocatello, ID(3) | | 24,215 |
| | — |
| | 6,876 |
| | — |
| | — |
| | 6,876 |
| | 6,876 |
| | 17 |
| | 6,859 |
| | Dec-14 | | 39 years |
| Raleigh, NC | | 23,317 |
| | 331 |
| | 15,041 |
| | — |
| | 331 |
| | 15,041 |
| | 15,372 |
| | 37 |
| | 15,335 |
| | Dec-14 | | 39 years |
| Rockhill, NY | | 35,049 |
| | 1,092 |
| | 13,755 |
| | — |
| | 1,092 |
| | 13,755 |
| | 14,847 |
| | 36 |
| | 14,811 |
| | Dec-14 | | 39 years |
| Rockwall, TX | | 30,681 |
| | 3,508 |
| | 32,020 |
| | — |
| | 3,508 |
| | 32,020 |
| | 35,528 |
| | 86 |
| | 35,442 |
| | Dec-14 | | 39 years |
Rowlett, TX(3) | | 3,487 |
| | — |
| | 18,613 |
| | — |
| | — |
| | 18,613 |
| | 18,613 |
| | 45 |
| | 18,568 |
| | Dec-14 | | 39 years |
| Ruston, LA | | 20,583 |
| | 371 |
| | 3,991 |
| | — |
| | 371 |
| | 3,991 |
| | 4,362 |
| | 11 |
| | 4,351 |
| | Dec-14 | | 39 years |
| San Angelo, TX | | 8,282 |
| | 481 |
| | 8,674 |
| | — |
| | 481 |
| | 8,674 |
| | 9,155 |
| | 22 |
| | 9,133 |
| | Dec-14 | | 39 years |
| San Antonio, TX | | 37,993 |
| | 1,924 |
| | 34,122 |
| | — |
| | 1,924 |
| | 34,122 |
| | 36,046 |
| | 88 |
| | 35,958 |
| | Dec-14 | | 39 years |
| Santa Rosa, CA | | 19,082 |
| | 1,834 |
| | 8,920 |
| | 3 |
| | 1,834 |
| | 8,923 |
| | 10,757 |
| | 26 |
| | 10,731 |
| | Dec-14 | | 39 years |
| Sarasota, FL | | 8,718 |
| | 1,483 |
| | 8,989 |
| | — |
| | 1,483 |
| | 8,989 |
| | 10,472 |
| | 25 |
| | 10,447 |
| | Dec-14 | | 39 years |
| Sartell, MN | | 7,362 |
| | 2,055 |
| | 4,806 |
| | — |
| | 2,055 |
| | 4,806 |
| | 6,861 |
| | 17 |
| | 6,844 |
| | Dec-14 | | 39 years |
| Schertz, TX | | 4,049 |
| | 792 |
| | 15,243 |
| | — |
| | 792 |
| | 15,243 |
| | 16,035 |
| | 39 |
| | 15,996 |
| | Dec-14 | | 39 years |
Shelbyville, TN(3) | | 7,095 |
| | — |
| | 17,045 |
| | — |
| | — |
| | 17,045 |
| | 17,045 |
| | 41 |
| | 17,004 |
| | Dec-14 | | 39 years |
| Shenandoah, TX | | 12,301 |
| | 1,103 |
| | 8,736 |
| | — |
| | 1,103 |
| | 8,736 |
| | 9,839 |
| | 24 |
| | 9,815 |
| | Dec-14 | | 39 years |
| Spokane, WA | | 22,548 |
| | 1,794 |
| | 9,081 |
| | — |
| | 1,794 |
| | 9,081 |
| | 10,875 |
| | 26 |
| | 10,849 |
| | Dec-14 | | 39 years |
| St. John, IN | | 3,487 |
| | 902 |
| | 13,129 |
| | — |
| | 902 |
| | 13,129 |
| | 14,031 |
| | 34 |
| | 13,997 |
| | Dec-14 | | 39 years |
| St. Petersburg, FL | | 9,682 |
| | 581 |
| | 8,803 |
| | 24 |
| | 581 |
| | 8,827 |
| | 9,408 |
| | 23 |
| | 9,385 |
| | Dec-14 | | 39 years |
Stockbridge, GA(3) | | 11,817 |
| | — |
| | 7,862 |
| | — |
| | — |
| | 7,862 |
| | 7,862 |
| | 19 |
| | 7,843 |
| | Dec-14 | | 39 years |
| Sylva, NC | | 13,561 |
| | 1,734 |
| | 13,327 |
| | — |
| | 1,734 |
| | 13,327 |
| | 15,061 |
| | 37 |
| | 15,024 |
| | Dec-14 | | 39 years |
| Tempe, AZ | | 8,088 |
| | 742 |
| | 10,220 |
| | — |
| | 742 |
| | 10,220 |
| | 10,962 |
| | 27 |
| | 10,935 |
| | Dec-14 | | 39 years |
| Temple, TX | | 7,652 |
| | 411 |
| | 8,591 |
| | — |
| | 411 |
| | 8,591 |
| | 9,002 |
| | 22 |
| | 8,980 |
| | Dec-14 | | 39 years |
Texarkana, TX(3) | | 7,362 |
| | — |
| | 22,058 |
| | — |
| | — |
| | 22,058 |
| | 22,058 |
| | 54 |
| | 22,004 |
| | Dec-14 | | 39 years |
| Urbana, IL | | 12,205 |
| | 571 |
| | 7,799 |
| | — |
| | 571 |
| | 7,799 |
| | 8,370 |
| | 20 |
| | 8,350 |
| | Dec-14 | | 39 years |
Victoria, TX(3) | | 7,546 |
| | — |
| | 6,102 |
| | — |
| | — |
| | 6,102 |
| | 6,102 |
| | 15 |
| | 6,087 |
| | Dec-14 | | 39 years |
Warsaw, IN(3) | | 6,170 |
| | — |
| | 9,994 |
| | — |
| | — |
| | 9,994 |
| | 9,994 |
| | 24 |
| | 9,970 |
| | Dec-14 | | 39 years |
| West Bloomfield, MI | | 8,911 |
| | 1,092 |
| | 4,702 |
| | — |
| | 1,092 |
| | 4,702 |
| | 5,794 |
| | 14 |
| | 5,780 |
| | Dec-14 | | 39 years |
| Westminster, CO | | 17,443 |
| | 1,473 |
| | 10,958 |
| | — |
| | 1,473 |
| | 10,958 |
| | 12,431 |
| | 30 |
| | 12,401 |
| | Dec-14 | | 39 years |
| Wharton, TX | | 5,403 |
| | 961 |
| | 7,440 |
| | — |
| | 961 |
| | 7,440 |
| | 8,401 |
| | 19 |
| | 8,382 |
| | Dec-14 | | 39 years |
| Total Medical Office Building | | 1,397,849 |
| | 123,372 |
| | 1,771,382 |
| | 1,152 |
| | 123,372 |
| | 1,772,534 |
| | 1,895,906 |
| | 4,772 |
| | 1,891,134 |
| | | | |
| | | | | | | | | | | | | | | | | | | | | | | |
| Skilled Nursing Facilities | | | | | | | | | | | | | | | | | | | | | | |
| Abingdon, VA | | 7,229 |
| | 531 |
| | 6,626 |
| | — |
| | 531 |
| | 6,626 |
| | 7,157 |
| | 165 |
| | 6,992 |
| | May-14 | | 40 years |
| Annandale, VA | | 7,109 |
| | 2,497 |
| | 11,713 |
| | — |
| | 2,497 |
| | 11,713 |
| | 14,210 |
| | 271 |
| | 13,939 |
| | May-14 | | 40 years |
| Atlanta, GA | | 29,446 |
| | 3,348 |
| | 29,841 |
| | — |
| | 3,348 |
| | 29,841 |
| | 33,189 |
| | 81 |
| | 33,108 |
| | Dec-14 | | 39 years |
| Aurora, IL | | 12,915 |
| | 1,372 |
| | 20,571 |
| | 121 |
| | 1,372 |
| | 20,692 |
| | 22,064 |
| | 418 |
| | 21,646 |
| | May-14 | | 40 years |
| Baltimore, MD | | 7,313 |
| | 1,739 |
| | 9,183 |
| | — |
| | 1,739 |
| | 9,183 |
| | 10,922 |
| | 207 |
| | 10,715 |
| | May-14 | | 40 years |
| Bastian, VA | | 3,644 |
| | 281 |
| | 3,197 |
| | — |
| | 281 |
| | 3,197 |
| | 3,478 |
| | 8 |
| | 3,470 |
| | Dec-14 | | 39 years |
| Belvidere, IL | | 11,422 |
| | 592 |
| | 22,509 |
| | 824 |
| | 592 |
| | 23,333 |
| | 23,925 |
| | 485 |
| | 23,440 |
| | May-14 | | 40 years |
| Bend, OR | | 10,955 |
| | 1,363 |
| | 13,193 |
| | — |
| | 1,363 |
| | 13,193 |
| | 14,556 |
| | 35 |
| | 14,521 |
| | Dec-14 | | 39 years |
| Black Mountain, NC | | 6,096 |
| | 468 |
| | 5,786 |
| | 861 |
| | 468 |
| | 6,647 |
| | 7,115 |
| | 1,272 |
| | 5,843 |
| | Jul-06 | | 40 years |
| Blountstown, FL | | 4,209 |
| | 378 |
| | 5,069 |
| | 908 |
| | 378 |
| | 5,977 |
| | 6,355 |
| | 1,124 |
| | 5,231 |
| | Jul-06 | | 40 years |
| Boetourt, VA | | 4,699 |
| | 341 |
| | 7,422 |
| | — |
| | 341 |
| | 7,422 |
| | 7,763 |
| | 19 |
| | 7,744 |
| | Dec-14 | | 39 years |
| Castleton, IN | | 7,453 |
| | 677 |
| | 8,077 |
| | — |
| | 677 |
| | 8,077 |
| | 8,754 |
| | 1,523 |
| | 7,231 |
| | Jun-07 | | 40 years |
| Charlottesville, VA | | 7,904 |
| | 1,193 |
| | 15,649 |
| | — |
| | 1,193 |
| | 15,649 |
| | 16,842 |
| | 41 |
| | 16,801 |
| | Dec-14 | | 39 years |
| Chesterfield, IN | | 4,282 |
| | 815 |
| | 4,204 |
| | — |
| | 815 |
| | 4,204 |
| | 5,019 |
| | 793 |
| | 4,226 |
| | Jun-07 | | 40 years |
| Clemmons, NC | | 1,596 |
| | 337 |
| | 4,541 |
| | 33 |
| | 337 |
| | 4,574 |
| | 4,911 |
| | 818 |
| | 4,093 |
| | Apr-07 | | 40 years |
| Columbia City, IN | | 8,339 |
| | 1,034 |
| | 6,390 |
| | — |
| | 1,034 |
| | 6,390 |
| | 7,424 |
| | 1,205 |
| | 6,219 |
| | Jun-07 | | 40 years |
| Conyers, GA | | 20,147 |
| | 1,844 |
| | 26,777 |
| | — |
| | 1,844 |
| | 26,777 |
| | 28,621 |
| | 70 |
| | 28,551 |
| | Dec-14 | | 39 years |
| Covington, GA | | 21,019 |
| | 1,473 |
| | 21,537 |
| | — |
| | 1,473 |
| | 21,537 |
| | 23,010 |
| | 56 |
| | 22,954 |
| | Dec-14 | | 39 years |
| Crestwood, IL | | 15,161 |
| | 1,590 |
| | 24,623 |
| | 352 |
| | 1,590 |
| | 24,975 |
| | 26,565 |
| | 490 |
| | 26,075 |
| | May-14 | | 40 years |
| Dalton, MA | | 7,050 |
| | 1,820 |
| | 3,022 |
| | — |
| | 1,820 |
| | 3,022 |
| | 4,842 |
| | 12 |
| | 4,830 |
| | Dec-14 | | 39 years |
| Daly City, CA | | 25,136 |
| | 3,297 |
| | 1,872 |
| | 12,322 |
| | 3,297 |
| | 14,194 |
| | 17,491 |
| | 6,764 |
| | 10,727 |
| | Aug-07 | | 40 years |
| Decatur, IL | | 14,247 |
| | 1,945 |
| | 23,219 |
| | 498 |
| | 1,945 |
| | 23,717 |
| | 25,662 |
| | 546 |
| | 25,116 |
| | May-14 | | 40 years |
| Dunkirk, IN | | 2,164 |
| | 310 |
| | 2,299 |
| | — |
| | 310 |
| | 2,299 |
| | 2,609 |
| | 433 |
| | 2,176 |
| | Jun-07 | | 40 years |
| Eustis, FL | | 14,852 |
| | 817 |
| | 4,607 |
| | — |
| | 817 |
| | 4,607 |
| | 5,424 |
| | 118 |
| | 5,306 |
| | May-14 | | 40 years |
| Fort Lauderdale, FL | | 5,534 |
| | 581 |
| | 5,571 |
| | — |
| | 581 |
| | 5,571 |
| | 6,152 |
| | 117 |
| | 6,035 |
| | May-14 | | 40 years |
| Fort Myers, FL | | 4,794 |
| | 1,058 |
| | 12,324 |
| | 20 |
| | 1,058 |
| | 12,344 |
| | 13,402 |
| | 250 |
| | 13,152 |
| | May-14 | | 40 years |
| Fort Wayne, IN | | 5,048 |
| | 1,478 |
| | 4,409 |
| | — |
| | 1,478 |
| | 4,409 |
| | 5,887 |
| | 831 |
| | 5,056 |
| | Jun-07 | | 40 years |
| Gainesville, FL | | 12,461 |
| | 1,096 |
| | 21,952 |
| | 351 |
| | 1,096 |
| | 22,303 |
| | 23,399 |
| | 418 |
| | 22,981 |
| | May-14 | | 40 years |
| Gainesville, GA | | 14,432 |
| | 1,163 |
| | 17,214 |
| | — |
| | 1,163 |
| | 17,214 |
| | 18,377 |
| | 45 |
| | 18,332 |
| | Dec-14 | | 39 years |
| Grants Pass, OR | | 10,200 |
| | 1,243 |
| | 11,386 |
| | — |
| | 1,243 |
| | 11,386 |
| | 12,629 |
| | 31 |
| | 12,598 |
| | Dec-14 | | 39 years |
| Hartford City, IN | | 721 |
| | 199 |
| | 1,782 |
| | — |
| | 199 |
| | 1,782 |
| | 1,981 |
| | 336 |
| | 1,645 |
| | Jun-07 | | 40 years |
| Hobart, IN | | 5,860 |
| | 1,835 |
| | 5,019 |
| | — |
| | 1,835 |
| | 5,019 |
| | 6,854 |
| | 946 |
| | 5,908 |
| | Jun-07 | | 40 years |
| Hot Springs, VA | | 2,973 |
| | 291 |
| | 3,156 |
| | — |
| | 291 |
| | 3,156 |
| | 3,447 |
| | 8 |
| | 3,439 |
| | Dec-14 | | 39 years |
| Huntington, IN | | 5,093 |
| | 646 |
| | 5,037 |
| | — |
| | 646 |
| | 5,037 |
| | 5,683 |
| | 950 |
| | 4,733 |
| | Jun-07 | | 40 years |
| Hyde Park, MA | | 2,092 |
| | 1,130 |
| | 568 |
| | — |
| | 1,130 |
| | 568 |
| | 1,698 |
| | 4 |
| | 1,694 |
| | Dec-14 | | 39 years |
| Jacksonville, FL | | 16,968 |
| | 2,634 |
| | 28,407 |
| | 49 |
| | 2,634 |
| | 28,456 |
| | 31,090 |
| | 633 |
| | 30,457 |
| | May-14 | | 40 years |
| Joliet, IL | | 17,012 |
| | 1,105 |
| | 24,512 |
| | 449 |
| | 1,105 |
| | 24,961 |
| | 26,066 |
| | 469 |
| | 25,597 |
| | May-14 | | 40 years |
| Kissimmee, FL | | 5,694 |
| | 1,120 |
| | 16,479 |
| | — |
| | 1,120 |
| | 16,479 |
| | 17,599 |
| | 335 |
| | 17,264 |
| | May-14 | | 40 years |
| LaGrange, IN | | 4,828 |
| | 446 |
| | 5,494 |
| | — |
| | 446 |
| | 5,494 |
| | 5,940 |
| | 1,036 |
| | 4,904 |
| | Jun-07 | | 40 years |
| Lakeland, FL | | 14,754 |
| | 1,473 |
| | 18,758 |
| | — |
| | 1,473 |
| | 18,758 |
| | 20,231 |
| | 403 |
| | 19,828 |
| | May-14 | | 40 years |
| Largo, FL | | 18,977 |
| | 2,270 |
| | 30,439 |
| | 44 |
| | 2,270 |
| | 30,483 |
| | 32,753 |
| | 653 |
| | 32,100 |
| | May-14 | | 40 years |
| Lebanon, VA | | 4,507 |
| | 351 |
| | 4,694 |
| | — |
| | 351 |
| | 4,694 |
| | 5,045 |
| | 12 |
| | 5,033 |
| | Dec-14 | | 39 years |
| Lincoln, IL | | 2,943 |
| | 896 |
| | 2,841 |
| | 127 |
| | 896 |
| | 2,968 |
| | 3,864 |
| | 131 |
| | 3,733 |
| | May-14 | | 40 years |
| Loma Linda, CA | | 14,820 |
| | 1,413 |
| | 29,056 |
| | — |
| | 1,413 |
| | 29,056 |
| | 30,469 |
| | 74 |
| | 30,395 |
| | Dec-14 | | 39 years |
| Longwood, FL | | 6,297 |
| | 970 |
| | 8,535 |
| | — |
| | 970 |
| | 8,535 |
| | 9,505 |
| | 188 |
| | 9,317 |
| | May-14 | | 40 years |
| Low Moor, VA | | 8,918 |
| | 732 |
| | 9,987 |
| | — |
| | 732 |
| | 9,987 |
| | 10,719 |
| | 26 |
| | 10,693 |
| | Dec-14 | | 39 years |
| McMinnville, TN | | 5,197 |
| | 1,065 |
| | 7,151 |
| | — |
| | 1,065 |
| | 7,151 |
| | 8,216 |
| | 183 |
| | 8,033 |
| | May-14 | | 40 years |
| Memphis, TN | | 14,723 |
| | 1,533 |
| | 15,219 |
| | — |
| | 1,533 |
| | 15,219 |
| | 16,752 |
| | 41 |
| | 16,711 |
| | Dec-14 | | 39 years |
| Middletown, IN | | 3,831 |
| | 184 |
| | 4,750 |
| | — |
| | 184 |
| | 4,750 |
| | 4,934 |
| | 895 |
| | 4,039 |
| | Jun-07 | | 40 years |
| Midlothian, VA | | 14,747 |
| | 1,764 |
| | 18,724 |
| | — |
| | 1,764 |
| | 18,724 |
| | 20,488 |
| | 50 |
| | 20,438 |
| | Dec-14 | | 39 years |
| Millington, TN | | 15,207 |
| | 501 |
| | 16,268 |
| | — |
| | 501 |
| | 16,268 |
| | 16,769 |
| | 41 |
| | 16,728 |
| | Dec-14 | | 39 years |
| Milton, PA | | 9,685 |
| | 1,413 |
| | 9,920 |
| | — |
| | 1,413 |
| | 9,920 |
| | 11,333 |
| | 28 |
| | 11,305 |
| | Dec-14 | | 39 years |
| Mobile, AL | 9,783 |
| | 381 |
| | 9,544 |
| | — |
| | 381 |
| | 9,544 |
| | 9,925 |
| | 24 |
| | 9,901 |
| | Dec-14 | | 39 years |
| Morris, IL | | 4,934 |
| | 568 |
| | 9,103 |
| | (2,682 | ) | | 568 |
| | 6,421 |
| | 6,989 |
| | 1,436 |
| | 5,553 |
| | May-06 | | 40 years |
| Mt. Sterling, KY | | 10,056 |
| | 996 |
| | 12,561 |
| | 363 |
| | 996 |
| | 12,924 |
| | 13,920 |
| | 2,382 |
| | 11,538 |
| | Feb-07 | | 40 years |
| Niles, MI | | 4,621 |
| | 492 |
| | 6,585 |
| | — |
| | 492 |
| | 6,585 |
| | 7,077 |
| | 175 |
| | 6,902 |
| | May-14 | | 40 years |
| North Bend, WA | | 2,267 |
| | 732 |
| | 831 |
| | — |
| | 732 |
| | 831 |
| | 1,563 |
| | 4 |
| | 1,559 |
| | Dec-14 | | 39 years |
| Olympia, WA | | 2,550 |
| | 361 |
| | 2,144 |
| | — |
| | 361 |
| | 2,144 |
| | 2,505 |
| | 6 |
| | 2,499 |
| | Dec-14 | | 39 years |
| Ormond Beach, FL | | 11,871 |
| | 2,067 |
| | 15,777 |
| | — |
| | 2,067 |
| | 15,777 |
| | 17,844 |
| | 389 |
| | 17,455 |
| | May-14 | | 40 years |
| Palm Harbor, FL | | 14,637 |
| | 1,007 |
| | 13,936 |
| | 64 |
| | 1,007 |
| | 14,000 |
| | 15,007 |
| | 300 |
| | 14,707 |
| | May-14 | | 40 years |
| Peru, IN | | 4,507 |
| | 502 |
| | 7,135 |
| | — |
| | 502 |
| | 7,135 |
| | 7,637 |
| | 1,345 |
| | 6,292 |
| | Jun-07 | | 40 years |
| Philadelphia, PA | | 147,261 |
| | 4,921 |
| | 165,390 |
| | — |
| | 4,921 |
| | 165,390 |
| | 170,311 |
| | 415 |
| | 169,896 |
| | Dec-14 | | 39 years |
| Pittsfield, MA | | 9,343 |
| | 2,620 |
| | 4,278 |
| | — |
| | 2,620 |
| | 4,278 |
| | 6,898 |
| | 17 |
| | 6,881 |
| | Dec-14 | | 39 years |
| Prineville, OR | | 944 |
| | 561 |
| | 1,401 |
| | — |
| | 561 |
| | 1,401 |
| | 1,962 |
| | 5 |
| | 1,957 |
| | Dec-14 | | 39 years |
| Redmond, OR | | 6,139 |
| | 541 |
| | 6,767 |
| | — |
| | 541 |
| | 6,767 |
| | 7,308 |
| | 18 |
| | 7,290 |
| | Dec-14 | | 39 years |
| Rockport, IN | | 2,119 |
| | 619 |
| | 2,092 |
| | — |
| | 619 |
| | 2,092 |
| | 2,711 |
| | 394 |
| | 2,317 |
| | Jun-07 | | 40 years |
| Royersford, PA | | 41,002 |
| | 20,096 |
| | 23,840 |
| | — |
| | 20,096 |
| | 23,840 |
| | 43,936 |
| | 107 |
| | 43,829 |
| | Dec-14 | | 39 years |
| Rushville, IN | | 5,401 |
| | 310 |
| | 5,858 |
| | — |
| | 310 |
| | 5,858 |
| | 6,168 |
| | 1,104 |
| | 5,064 |
| | Jun-07 | | 40 years |
| Sarasota, FL | | 9,461 |
| | 1,403 |
| | 15,909 |
| | 8 |
| | 1,403 |
| | 15,917 |
| | 17,320 |
| | 347 |
| | 16,973 |
| | May-14 | | 40 years |
| Shreveport, LA | | 20,341 |
| | 942 |
| | 23,292 |
| | — |
| | 942 |
| | 23,292 |
| | 24,234 |
| | 59 |
| | 24,175 |
| | Dec-14 | | 39 years |
| Snellville, GA | | 22,956 |
| | 2,867 |
| | 25,440 |
| | — |
| | 2,867 |
| | 25,440 |
| | 28,307 |
| | 69 |
| | 28,238 |
| | Dec-14 | | 39 years |
| Soddy Daisy, TN | | 8,681 |
| | 933 |
| | 9,808 |
| | — |
| | 933 |
| | 9,808 |
| | 10,741 |
| | 244 |
| | 10,497 |
| | May-14 | | 40 years |
| St. Petersburg, FL | | 12,425 |
| | 1,462 |
| | 11,060 |
| | — |
| | 1,462 |
| | 11,060 |
| | 12,522 |
| | 272 |
| | 12,250 |
| | May-14 | | 40 years |
| Sterling, IL | | 2,725 |
| | 129 |
| | 6,229 |
| | (1,145 | ) | | 129 |
| | 5,084 |
| | 5,213 |
| | 1,228 |
| | 3,985 |
| | May-06 | | 40 years |
| Sullivan, IN | | 5,344 |
| | 1,794 |
| | 4,469 |
| | — |
| | 1,794 |
| | 4,469 |
| | 6,263 |
| | 842 |
| | 5,421 |
| | Jun-07 | | 40 years |
| Syracuse, IN | | 4,733 |
| | 125 |
| | 4,564 |
| | — |
| | 125 |
| | 4,564 |
| | 4,689 |
| | 860 |
| | 3,829 |
| | Jun-07 | | 40 years |
| Tacoma, WA | | 10,200 |
| | 1,894 |
| | 10,727 |
| | — |
| | 1,894 |
| | 10,727 |
| | 12,621 |
| | 31 |
| | 12,590 |
| | Dec-14 | | 39 years |
| Tampa, FL | | 11,399 |
| | 1,888 |
| | 20,681 |
| | — |
| | 1,888 |
| | 20,681 |
| | 22,569 |
| | 457 |
| | 22,112 |
| | May-14 | | 40 years |
| Three Rivers, MI | | 4,047 |
| | 582 |
| | 5,285 |
| | — |
| | 582 |
| | 5,285 |
| | 5,867 |
| | 162 |
| | 5,705 |
| | May-14 | | 40 years |
| Tipton, IN | | 9,944 |
| | 1,102 |
| | 10,836 |
| | (27 | ) | | 1,102 |
| | 10,809 |
| | 11,911 |
| | 1,859 |
| | 10,052 |
| | Jun-07 | | 40 years |
| Vero Beach, FL | | 6,626 |
| | 662 |
| | 7,418 |
| | — |
| | 662 |
| | 7,418 |
| | 8,080 |
| | 158 |
| | 7,922 |
| | May-14 | | 40 years |
| Wabash, IN | | 6,310 |
| | 2,511 |
| | 5,024 |
| | — |
| | 2,511 |
| | 5,024 |
| | 7,535 |
| | 947 |
| | 6,588 |
| | Jun-07 | | 40 years |
| Wakarusa, IN | | 9,316 |
| | 289 |
| | 13,420 |
| | — |
| | 289 |
| | 13,420 |
| | 13,709 |
| | 2,530 |
| | 11,179 |
| | Jun-07 | | 40 years |
| Watsontown, PA | | 5,479 |
| | 682 |
| | 4,610 |
| | 10 |
| | 682 |
| | 4,620 |
| | 5,302 |
| | 13 |
| | 5,289 |
| | Dec-14 | | 39 years |
| West Melbourne, FL | | 10,813 |
| | 1,653 |
| | 10,757 |
| | — |
| | 1,653 |
| | 10,757 |
| | 12,410 |
| | 277 |
| | 12,133 |
| | May-14 | | 40 years |
| Yuma, AZ | | 11,624 |
| | 871 |
| | 17,558 |
| | — |
| | 871 |
| | 17,558 |
| | 18,429 |
| | 44 |
| | 18,385 |
| | Dec-14 | | 39 years |
| Total Skilled Nursing Facilities | | 952,562 |
| | 119,215 |
| | 1,115,908 |
| | 13,550 |
| | 119,215 |
| | 1,129,458 |
| | 1,248,673 |
| | 44,608 |
| | 1,204,065 |
| | | | |
| | | | | | | | | | | | | | | | | | | | | | | |
| Assisted Living Facilities-RIDEA | | | | | | | | | | | | | | | | | | | | | | |
| Albany, OR | | 10,400 |
| | 510 |
| | 13,149 |
| | — |
| | 510 |
| | 13,149 |
| | 13,659 |
| | 242 |
| | 13,417 |
| | May-14 | | 40 years |
| Baker City, OR | | 4,697 |
| | 510 |
| | 8,195 |
| | 69 |
| | 510 |
| | 8,264 |
| | 8,774 |
| | 180 |
| | 8,594 |
| | May-14 | | 40 years |
| Battle Ground, WA | | 9,525 |
| | 740 |
| | 12,503 |
| | 4 |
| | 740 |
| | 12,507 |
| | 13,247 |
| | 249 |
| | 12,998 |
| | May-14 | | 40 years |
| Bremerton, WA | | 4,653 |
| | 964 |
| | 8,171 |
| | 847 |
| | 964 |
| | 9,018 |
| | 9,982 |
| | 1,797 |
| | 8,185 |
| | Jan-07 | | 40 years |
| Carrollton, GA | | 7,050 |
| | 816 |
| | 4,220 |
| | 3,181 |
| | 816 |
| | 7,401 |
| | 8,217 |
| | 1,052 |
| | 7,165 |
| | May-14 | | 40 years |
| Casa Grande, AZ | | 8,998 |
| | 420 |
| | 11,907 |
| | 261 |
| | 420 |
| | 12,168 |
| | 12,588 |
| | 270 |
| | 12,318 |
| | May-14 | | 40 years |
| Cedar Park, TX | | 6,140 |
| | 1,230 |
| | 3,318 |
| | 8 |
| | 1,230 |
| | 3,326 |
| | 4,556 |
| | 90 |
| | 4,466 |
| | Jan-07 | | 40 years |
| Charleston, IL | | 4,019 |
| | 485 |
| | 6,211 |
| | 748 |
| | 485 |
| | 6,959 |
| | 7,444 |
| | 1,351 |
| | 6,093 |
| | Jan 07-Dec 14 | | 40 years |
| Cincinnati, OH | | 179,389 |
| | 14,622 |
| | 166,505 |
| | 808 |
| | 14,622 |
| | 167,313 |
| | 181,935 |
| | 4,014 |
| | 177,921 |
| | Jan-07 | | 40 years |
| Clinton, OK | | 705 |
| | 225 |
| | 3,513 |
| | 500 |
| | 225 |
| | 4,013 |
| | 4,238 |
| | 1,014 |
| | 3,224 |
| | May-14 | | 40 years |
| College Place, WA | | 7,575 |
| | 580 |
| | 9,823 |
| | 4 |
| | 580 |
| | 9,827 |
| | 10,407 |
| | 187 |
| | 10,220 |
| | Dec-14 | | 39 years |
| Colorado Springs, CO | | 80,783 |
| | 9,180 |
| | 62,289 |
| | — |
| | 9,180 |
| | 62,289 |
| | 71,469 |
| | 174 |
| | 71,295 |
| | May-14 | | 40 years |
| Corpus Christi, TX | | 15,150 |
| | 2,270 |
| | 17,396 |
| | 35 |
| | 2,270 |
| | 17,431 |
| | 19,701 |
| | 372 |
| | 19,329 |
| | Dec-14 | | 39 years |
| Dalton, MA | | 10,674 |
| | 1,210 |
| | 10,988 |
| | — |
| | 1,210 |
| | 10,988 |
| | 12,198 |
| | 30 |
| | 12,168 |
| | May-07 | | 40 years |
| Effingham, IL | | 9,255 |
| | 811 |
| | 9,684 |
| | 377 |
| | 811 |
| | 10,061 |
| | 10,872 |
| | 1,304 |
| | 9,568 |
| | Jan 07-Dec 14 | | 40 years |
| Elk City, OK | | 4,794 |
| | 143 |
| | 6,721 |
| | 694 |
| | 143 |
| | 7,415 |
| | 7,558 |
| | 1,609 |
| | 5,949 |
| | Jan-07 | | 40 years |
| Eugene, OR | | 12,640 |
| | 840 |
| | 14,813 |
| | 49 |
| | 840 |
| | 14,862 |
| | 15,702 |
| | 291 |
| | 15,411 |
| | May-14 | | 40 years |
| Fairfield, IL | | 5,076 |
| | 153 |
| | 7,898 |
| | 73 |
| | 153 |
| | 7,971 |
| | 8,124 |
| | 1,597 |
| | 6,527 |
| | Jan-07 | | 40 years |
| Fullerton, CA | | 7,614 |
| | 5,422 |
| | 9,436 |
| | 420 |
| | 5,422 |
| | 9,856 |
| | 15,278 |
| | 2,038 |
| | 13,240 |
| | Jan-07 | | 40 years |
| Garden Grove, CA | | 6,838 |
| | 6,975 |
| | 5,927 |
| | 274 |
| | 6,975 |
| | 6,201 |
| | 13,176 |
| | 1,312 |
| | 11,864 |
| | Jan-07 | | 40 years |
| Grants Pass, OR | | 7,520 |
| | 490 |
| | 6,900 |
| | 10 |
| | 490 |
| | 6,910 |
| | 7,400 |
| | 161 |
| | 7,239 |
| | May-14 | | 40 years |
| Greenville, IL | | 8,420 |
| | 220 |
| | 9,387 |
| | — |
| | 220 |
| | 9,387 |
| | 9,607 |
| | 23 |
| | 9,584 |
| | Dec-14 | | 39 years |
| Grove City, OH | | 4,959 |
| | 613 |
| | 6,882 |
| | 353 |
| | 613 |
| | 7,235 |
| | 7,848 |
| | 1,430 |
| | 6,418 |
| | Jun-07 | | 40 years |
| Harrisburg, IL | | 2,863 |
| | 191 |
| | 5,059 |
| | 10 |
| | 191 |
| | 5,069 |
| | 5,260 |
| | 1,010 |
| | 4,250 |
| | Jun-07 | | 40 years |
| Hood River, OR | | 9,360 |
| | 390 |
| | 11,113 |
| | 13 |
| | 390 |
| | 11,126 |
| | 11,516 |
| | 230 |
| | 11,286 |
| | May-14 | | 40 years |
| Junction City, OR | | 4,531 |
| | 840 |
| | 5,984 |
| | 102 |
| | 840 |
| | 6,086 |
| | 6,926 |
| | 139 |
| | 6,787 |
| | May-14 | | 40 years |
| Kingfisher, OK | | 1,128 |
| | 128 |
| | 5,497 |
| | 304 |
| | 128 |
| | 5,801 |
| | 5,929 |
| | 1,287 |
| | 4,642 |
| | Jan-07 | | 40 years |
| La Grande, OR | | 7,272 |
| | 430 |
| | 9,635 |
| | 178 |
| | 430 |
| | 9,813 |
| | 10,243 |
| | 205 |
| | 10,038 |
| | May-14 | | 40 years |
NORTHSTAR REALTY FINANCE CORP. AND SUBSIDIARIES
SCHEDULE III - REAL ESTATE AND ACCUMULATED DEPRECIATION
As of December 31, 2014
(Dollars in Thousands)
|
| | | | | | | | | | | | | | | | | | | | | | | | | | | | | | | |
| Column A | | Column B | | Column C Initial Cost | | Column D Capitalized Subsequent to Acquisition | | Column E Gross Amount Carried at Close of Period | | Column F | | Column G | | Column H |
| Location City, State | | Encumbrances | | Land | | Building & Improvements | | Land, Buildings & Improvements | | Land | | Building & Improvements | | Total | | Accumulated Depreciation | | Total | | Date Acquired | | Life on Which Depreciation is Computed |
| La Vista, NE | | 2,609 |
| | 562 |
| | 4,966 |
| | 416 |
| | 562 |
| | 5,382 |
| | 5,944 |
| | 1,102 |
| | 4,842 |
| | Jan-07 | | 40 years |
| Lake Wylie, SC | | 16,184 |
| | 1,210 |
| | 19,856 |
| | 71 |
| | 1,210 |
| | 19,927 |
| | 21,137 |
| | 396 |
| | 20,741 |
| | May-14 | | 40 years |
| Lancaster, OH | | 8,696 |
| | 1,014 |
| | 11,874 |
| | 1,355 |
| | 1,014 |
| | 13,229 |
| | 14,243 |
| | 1,960 |
| | 12,283 |
| | Jun-07-Jan-12 | | 40 years |
| League City, TX | | 16,607 |
| | 2,540 |
| | 20,426 |
| | 61 |
| | 2,540 |
| | 20,487 |
| | 23,027 |
| | 417 |
| | 22,610 |
| | May-14 | | 40 years |
| Lincolnwood, IL | | 72,879 |
| | 4,970 |
| | 78,805 |
| | — |
| | 4,970 |
| | 78,805 |
| | 83,775 |
| | 204 |
| | 83,571 |
| | Dec-14 | | 39 years |
| Mahomet, IL | | 7,177 |
| | 290 |
| | 6,779 |
| | — |
| | 290 |
| | 6,779 |
| | 7,069 |
| | 17 |
| | 7,052 |
| | Dec-14 | | 39 years |
| Marysville, OH | | 4,565 |
| | 2,218 |
| | 5,015 |
| | 396 |
| | 2,218 |
| | 5,411 |
| | 7,629 |
| | 1,147 |
| | 6,482 |
| | Jun-07 | | 40 years |
| Mattoon, IL | | 9,448 |
| | 437 |
| | 14,405 |
| | 594 |
| | 437 |
| | 14,999 |
| | 15,436 |
| | 2,967 |
| | 12,469 |
| | Jan-07 | | 40 years |
| McMinnville, OR | | 10,715 |
| | 650 |
| | 11,686 |
| | 52 |
| | 650 |
| | 11,738 |
| | 12,388 |
| | 252 |
| | 12,136 |
| | May-14 | | 40 years |
| Memphis, TN | | 15,914 |
| | 5,790 |
| | 19,902 |
| | 586 |
| | 5,790 |
| | 20,488 |
| | 26,278 |
| | 3,295 |
| | 22,983 |
| | Jan 07-Dec 14 | | 40 years |
| Mobile, AL | | 4,540 |
| | 510 |
| | 6,848 |
| | 35 |
| | 510 |
| | 6,883 |
| | 7,393 |
| | 152 |
| | 7,241 |
| | May-14 | | 40 years |
| Mt. Zion, IL | | 5,187 |
| | 290 |
| | 2,305 |
| | — |
| | 290 |
| | 2,305 |
| | 2,595 |
| | 6 |
| | 2,589 |
| | Dec-14 | | 39 years |
| Northglenn, CO | | 29,121 |
| | 1,530 |
| | 28,245 |
| | 103 |
| | 1,530 |
| | 28,348 |
| | 29,878 |
| | 545 |
| | 29,333 |
| | May-14 | | 40 years |
| Oklahoma City, OK | | 1,480 |
| | 757 |
| | 5,184 |
| | 364 |
| | 757 |
| | 5,548 |
| | 6,305 |
| | 1,270 |
| | 5,035 |
| | Jan-07 | | 40 years |
| Olney, IL | | 8,248 |
| | 166 |
| | 8,316 |
| | 406 |
| | 166 |
| | 8,722 |
| | 8,888 |
| | 1,738 |
| | 7,150 |
| | Jan-07 | | 40 years |
| Paris, IL | | 6,204 |
| | 187 |
| | 6,797 |
| | 22 |
| | 187 |
| | 6,819 |
| | 7,006 |
| | 1,364 |
| | 5,642 |
| | Jan-07 | | 40 years |
| Port Orchard, WA | | 6,539 |
| | 790 |
| | 8,763 |
| | 9 |
| | 790 |
| | 8,772 |
| | 9,562 |
| | 164 |
| | 9,398 |
| | May-14 | | 40 years |
| Raleigh, NC | | 11,132 |
| | 1,000 |
| | 16,416 |
| | 10 |
| | 1,000 |
| | 16,426 |
| | 17,426 |
| | 325 |
| | 17,101 |
| | May-14 | | 40 years |
| Rantoul, IL | | 6,415 |
| | 151 |
| | 5,377 |
| | 348 |
| | 151 |
| | 5,725 |
| | 5,876 |
| | 1,128 |
| | 4,748 |
| | Jan-07 | | 40 years |
| Robinson, IL | | 4,371 |
| | 219 |
| | 4,746 |
| | 92 |
| | 219 |
| | 4,838 |
| | 5,057 |
| | 998 |
| | 4,059 |
| | Jan-07 | | 40 years |
| Rockford, IL | | 5,005 |
| | 1,101 |
| | 4,814 |
| | 92 |
| | 1,101 |
| | 4,906 |
| | 6,007 |
| | 988 |
| | 5,019 |
| | Jan-07 | | 40 years |
| Rogue River, OR | | 4,373 |
| | 590 |
| | 5,310 |
| | 34 |
| | 590 |
| | 5,344 |
| | 5,934 |
| | 117 |
| | 5,817 |
| | May-14 | | 40 years |
| Roseburg, OR | | 25,142 |
| | 2,160 |
| | 23,626 |
| | 42 |
| | 2,160 |
| | 23,668 |
| | 25,828 |
| | 449 |
| | 25,379 |
| | May-14 | | 40 years |
| Round Rock, TX | | 22,578 |
| | 2,571 |
| | 28,717 |
| | 122 |
| | 2,571 |
| | 28,839 |
| | 31,410 |
| | 557 |
| | 30,853 |
| | May-14 | | 40 years |
| Sacramento, CA | | 11,474 |
| | 1,570 |
| | 18,259 |
| | 13 |
| | 1,570 |
| | 18,272 |
| | 19,842 |
| | 352 |
| | 19,490 |
| | May-14 | | 40 years |
| Santa Ana, CA | | 3,595 |
| | 2,281 |
| | 7,046 |
| | 237 |
| | 2,281 |
| | 7,283 |
| | 9,564 |
| | 1,524 |
| | 8,040 |
| | Jan-07 | | 40 years |
| Seaside, OR | | 605 |
| | 720 |
| | 3,526 |
| | 8 |
| | 720 |
| | 3,534 |
| | 4,254 |
| | 101 |
| | 4,153 |
| | May-14 | | 40 years |
| Staunton, IL | | 9,248 |
| | 180 |
| | 8,433 |
| | — |
| | 180 |
| | 8,433 |
| | 8,613 |
| | 21 |
| | 8,592 |
| | Dec-14 | | 39 years |
| Stephenville, TX | | 3,031 |
| | 507 |
| | 6,459 |
| | 412 |
| | 507 |
| | 6,871 |
| | 7,378 |
| | 1,409 |
| | 5,969 |
| | Jan-07 | | 40 years |
| Sugar Land, TX | | 29,693 |
| | 2,240 |
| | 31,010 |
| | 88 |
| | 2,240 |
| | 31,098 |
| | 33,338 |
| | 589 |
| | 32,749 |
| | May-14 | | 40 years |
| Sycamore, IL | | 8,319 |
| | 816 |
| | 9,897 |
| | 121 |
| | 816 |
| | 10,018 |
| | 10,834 |
| | 2,014 |
| | 8,820 |
| | Jan-07 | | 40 years |
| Temple, TX | | 15,565 |
| | 2,260 |
| | 20,149 |
| | 180 |
| | 2,260 |
| | 20,329 |
| | 22,589 |
| | 411 |
| | 22,178 |
| | May-14 | | 40 years |
| Tuscola, IL | | 4,548 |
| | 237 |
| | 4,616 |
| | 268 |
| | 237 |
| | 4,884 |
| | 5,121 |
| | 1,024 |
| | 4,097 |
| | Jan-07 | | 40 years |
| Tyler, TX | | 10,333 |
| | 2,020 |
| | 12,719 |
| | 169 |
| | 2,020 |
| | 12,888 |
| | 14,908 |
| | 291 |
| | 14,617 |
| | May-14 | | 40 years |
| Ukiah, CA | | 4,942 |
| | 990 |
| | 7,637 |
| | — |
| | 990 |
| | 7,637 |
| | 8,627 |
| | 162 |
| | 8,465 |
| | May-14 | | 40 years |
| Vandalia, IL | | 6,697 |
| | 82 |
| | 7,969 |
| | 49 |
| | 82 |
| | 8,018 |
| | 8,100 |
| | 1,599 |
| | 6,501 |
| | Jan-07 | | 40 years |
| Washington Court House, OH | | 4,452 |
| | 341 |
| | 5,169 |
| | 636 |
| | 341 |
| | 5,805 |
| | 6,146 |
| | 1,110 |
| | 5,036 |
| | Jun-07 | | 40 years |
| Weatherford, OK | | 1,551 |
| | 229 |
| | 5,600 |
| | 384 |
| | 229 |
| | 5,984 |
| | 6,213 |
| | 1,361 |
| | 4,852 |
| | Jan-07 | | 40 years |
| Wenatchee, WA | | 15,600 |
| | 1,340 |
| | 17,486 |
| | 20 |
| | 1,340 |
| | 17,506 |
| | 18,846 |
| | 350 |
| | 18,496 |
| | May-14 | | 40 years |
| Wichita, KS | | 5,428 |
| | 2,282 |
| | 10,478 |
| | 395 |
| | 2,282 |
| | 10,873 |
| | 13,155 |
| | 1,858 |
| | 11,297 |
| | Dec-07 | | 40 years |
| Woodburn, OR | | 4,023 |
| | 309 |
| | 6,620 |
| | 13 |
| | 309 |
| | 6,633 |
| | 6,942 |
| | 132 |
| | 6,810 |
| | May-14 | | 40 years |
| Total Assisted Living Facilities-RIDEA | | 886,261 |
| | 101,515 |
| | 985,375 |
| | 17,525 |
| | 101,515 |
| | 1,002,900 |
| | 1,104,415 |
| | 59,524 |
| | 1,044,891 |
| | | | |
| | | | | | | | | | | | | | | | | | | | | | | |
Assisted Living Facilities(1) | | | | | | | | | | | | | | | | | | | | | | |
| Alexandria, MN | | 1,653 |
| | 260 |
| | 2,200 |
| | — |
| | 260 |
| | 2,200 |
| | 2,460 |
| | 102 |
| | 2,358 |
| | Jun-13 | | 40 years |
| Ascot, UK | | 17,656 |
| | 2,396 |
| | 20,311 |
| | — |
| | 2,396 |
| | 20,311 |
| | 22,707 |
| | 56 |
| | 22,651 |
| | Dec-14 | | 39 years |
| Auchtermuchty, UK | | 2,788 |
| | 348 |
| | 3,237 |
| | — |
| | 348 |
| | 3,237 |
| | 3,585 |
| | 9 |
| | 3,576 |
| | Dec-14 | | 39 years |
| Baxter, MN | | 1,868 |
| | 220 |
| | 2,786 |
| | 77 |
| | 220 |
| | 2,863 |
| | 3,083 |
| | 125 |
| | 2,958 |
| | Jun-13 | | 40 years |
| Bend, OR | | 26,797 |
| | 2,630 |
| | 35,910 |
| | — |
| | 2,630 |
| | 35,910 |
| | 38,540 |
| | 643 |
| | 37,897 |
| | Dec-14 | | 39 years |
| Bishops Hull, UK | | 5,890 |
| | 1,329 |
| | 6,246 |
| | — |
| | 1,329 |
| | 6,246 |
| | 7,575 |
| | 19 |
| | 7,556 |
| | Dec-14 | | 39 years |
| Braintree, UK | | 2,110 |
| | 584 |
| | 2,129 |
| | — |
| | 584 |
| | 2,129 |
| | 2,713 |
| | 7 |
| | 2,706 |
| | Dec-14 | | 39 years |
| Bromley, UK | | 4,386 |
| | 1,315 |
| | 4,326 |
| | — |
| | 1,315 |
| | 4,326 |
| | 5,641 |
| | 14 |
| | 5,627 |
| | Dec-14 | | 39 years |
| Camberely, UK | | 3,135 |
| | 2,818 |
| | 1,215 |
| | — |
| | 2,818 |
| | 1,215 |
| | 4,033 |
| | 10 |
| | 4,023 |
| | Dec-14 | | 39 years |
| Chippenham, UK | | 5,919 |
| | 1,875 |
| | 5,737 |
| | — |
| | 1,875 |
| | 5,737 |
| | 7,612 |
| | 19 |
| | 7,593 |
| | Dec-14 | | 39 years |
| Chipping Campden, UK | | 10,867 |
| | 1,819 |
| | 12,158 |
| | — |
| | 1,819 |
| | 12,158 |
| | 13,977 |
| | 34 |
| | 13,943 |
| | Dec-14 | | 39 years |
| Chobham, UK | | 15,477 |
| | 2,424 |
| | 17,482 |
| | — |
| | 2,424 |
| | 17,482 |
| | 19,906 |
| | 49 |
| | 19,857 |
| | Dec-14 | | 39 years |
| Cloquet, MN | | 2,587 |
| | 170 |
| | 4,021 |
| | 62 |
| | 170 |
| | 4,083 |
| | 4,253 |
| | 172 |
| | 4,081 |
| | Jun-13 | | 40 years |
| Corvallis, OR | | 6,800 |
| | 742 |
| | 6,317 |
| | — |
| | 742 |
| | 6,317 |
| | 7,059 |
| | 17 |
| | 7,042 |
| | Dec-14 | | 39 years |
| Cranleigh, UK | | 10,371 |
| | 2,839 |
| | 10,498 |
| | — |
| | 2,839 |
| | 10,498 |
| | 13,337 |
| | 33 |
| | 13,304 |
| | Dec-14 | | 39 years |
| Denham, UK | | 7,826 |
| | 1,897 |
| | 8,167 |
| | — |
| | 1,897 |
| | 8,167 |
| | 10,064 |
| | 25 |
| | 10,039 |
| | Dec-14 | | 39 years |
| Detroit Lakes, MN | | 4,528 |
| | 290 |
| | 4,174 |
| | 144 |
| | 290 |
| | 4,318 |
| | 4,608 |
| | 197 |
| | 4,411 |
| | Jun-13 | | 40 years |
| Dorking, UK | | 6,424 |
| | 1,557 |
| | 6,705 |
| | — |
| | 1,557 |
| | 6,705 |
| | 8,262 |
| | 20 |
| | 8,242 |
| | Dec-14 | | 39 years |
| Duluth, MN | | 15,450 |
| | 1,300 |
| | 16,791 |
| | 1 |
| | 1,300 |
| | 16,792 |
| | 18,092 |
| | 711 |
| | 17,381 |
| | Jun-13 | | 40 years |
| Durham, NC | | 20,728 |
| | 2,426 |
| | 23,551 |
| | — |
| | 2,426 |
| | 23,551 |
| | 25,977 |
| | 63 |
| | 25,914 |
| | Dec-14 | | 39 years |
Eustis, FL(3) | | 417 |
| | — |
| | — |
| | — |
| | — |
| | — |
| | — |
| | — |
| | — |
| | May-14 | | 40 years |
| Farleigh Common, UK | | 17,168 |
| | 2,441 |
| | 19,638 |
| | — |
| | 2,441 |
| | 19,638 |
| | 22,079 |
| | 54 |
| | 22,025 |
| | Dec-14 | | 39 years |
| Farmoor, UK | 14,303 |
| | 1,863 |
| | 16,532 |
| | 1,490 |
| | 1,863 |
| | 18,022 |
| | 19,885 |
| | 45 |
| | 19,840 |
| | Dec-14 | | 39 years |
| Fayetteville, NC | | 11,527 |
| | 1,183 |
| | 9,566 |
| | — |
| | 1,183 |
| | 9,566 |
| | 10,749 |
| | 26 |
| | 10,723 |
| | Dec-14 | | 39 years |
| Fishcross, UK | | 8,719 |
| | 2,271 |
| | 8,942 |
| | — |
| | 2,271 |
| | 8,942 |
| | 11,213 |
| | 27 |
| | 11,186 |
| | Dec-14 | | 39 years |
| Fuguay-Varina, NC | | 16,079 |
| | 1,123 |
| | 19,489 |
| | — |
| | 1,123 |
| | 19,489 |
| | 20,612 |
| | 50 |
| | 20,562 |
| | Dec-14 | | 39 years |
| Grand Rapids, MN | | 1,509 |
| | 160 |
| | 3,849 |
| | 71 |
| | 160 |
| | 3,920 |
| | 4,080 |
| | 166 |
| | 3,914 |
| | Jun-13 | | 40 years |
| Haywards Heath, UK | | 10,102 |
| | 1,527 |
| | 11,466 |
| | — |
| | 1,527 |
| | 11,466 |
| | 12,993 |
| | 32 |
| | 12,961 |
| | Dec-14 | | 39 years |
| Hulcott, UK | | 4,943 |
| | 1,644 |
| | 4,712 |
| | — |
| | 1,644 |
| | 4,712 |
| | 6,356 |
| | 16 |
| | 6,340 |
| | Dec-14 | | 39 years |
| Indianapolis, IN | | 2,463 |
| | 210 |
| | 2,511 |
| | — |
| | 210 |
| | 2,511 |
| | 2,721 |
| | 473 |
| | 2,248 |
| | Jun-07 | | 40 years |
| Kincardine, UK | | 3,763 |
| | 787 |
| | 4,052 |
| | — |
| | 787 |
| | 4,052 |
| | 4,839 |
| | 12 |
| | 4,827 |
| | Dec-14 | | 39 years |
| Kingston upon Thames, UK | | 26,475 |
| | 3,672 |
| | 30,378 |
| | — |
| | 3,672 |
| | 30,378 |
| | 34,050 |
| | 83 |
| | 33,967 |
| | Dec-14 | | 39 years |
| Kissimmee, FL | | 347 |
| | 337 |
| | 213 |
| | — |
| | 337 |
| | 213 |
| | 550 |
| | 5 |
| | 545 |
| | May-14 | | 40 years |
| Knightdale, NC | | 15,304 |
| | 2,215 |
| | 16,661 |
| | — |
| | 2,215 |
| | 16,661 |
| | 18,876 |
| | 46 |
| | 18,830 |
| | Dec-14 | | 39 years |
| La Grande, OR | | 9,747 |
| | 1,394 |
| | 10,774 |
| | — |
| | 1,394 |
| | 10,774 |
| | 12,168 |
| | 250 |
| | 11,918 |
| | May-14 | | 40 years |
| LaGrange, IN | | 490 |
| | 47 |
| | 584 |
| | — |
| | 47 |
| | 584 |
| | 631 |
| | 110 |
| | 521 |
| | Jun-07 | | 40 years |
| Lebanon, OR | | 11,164 |
| | 1,327 |
| | 14,227 |
| | — |
| | 1,327 |
| | 14,227 |
| | 15,554 |
| | 295 |
| | 15,259 |
| | May-14 | | 40 years |
| Leven, UK | | 3,592 |
| | 523 |
| | 4,096 |
| | — |
| | 523 |
| | 4,096 |
| | 4,619 |
| | 11 |
| | 4,608 |
| | Dec-14 | | 39 years |
| Lewes, UK | | 4,242 |
| | 1,144 |
| | 4,312 |
| | — |
| | 1,144 |
| | 4,312 |
| | 5,456 |
| | 13 |
| | 5,443 |
| | Dec-14 | | 39 years |
| Lightwater, UK | | 3,932 |
| | 1,666 |
| | 3,391 |
| | — |
| | 1,666 |
| | 3,391 |
| | 5,057 |
| | 12 |
| | 5,045 |
| | Dec-14 | | 39 years |
| Lincolnton, NC | | 16,079 |
| | 1,072 |
| | 21,517 |
| | — |
| | 1,072 |
| | 21,517 |
| | 22,589 |
| | 55 |
| | 22,534 |
| | Dec-14 | | 39 years |
| Liss, UK | | 5,069 |
| | 1,583 |
| | 4,936 |
| | — |
| | 1,583 |
| | 4,936 |
| | 6,519 |
| | 16 |
| | 6,503 |
| | Dec-14 | | 39 years |
| Merstham, UK | | 10,897 |
| | 2,105 |
| | 11,910 |
| | — |
| | 2,105 |
| | 11,910 |
| | 14,015 |
| | 34 |
| | 13,981 |
| | Dec-14 | | 39 years |
| Monroe, NC | | 15,788 |
| | 1,343 |
| | 23,441 |
| | — |
| | 1,343 |
| | 23,441 |
| | 24,784 |
| | 60 |
| | 24,724 |
| | Dec-14 | | 39 years |
| Mooresville, IN | | 4,282 |
| | 631 |
| | 4,187 |
| | — |
| | 631 |
| | 4,187 |
| | 4,818 |
| | 789 |
| | 4,029 |
| | Jun-07 | | 40 years |
| Mountain Iron, MN | | 2,803 |
| | 175 |
| | 3,651 |
| | 70 |
| | 175 |
| | 3,721 |
| | 3,896 |
| | 158 |
| | 3,738 |
| | Jun-13 | | 40 years |
| Nuffield, UK | | 5,009 |
| | 1,705 |
| | 4,736 |
| | — |
| | 1,705 |
| | 4,736 |
| | 6,441 |
| | 16 |
| | 6,425 |
| | Dec-14 | | 39 years |
| Nuneaton, UK | | 5,499 |
| | 1,901 |
| | 5,171 |
| | — |
| | 1,901 |
| | 5,171 |
| | 7,072 |
| | 17 |
| | 7,055 |
| | Dec-14 | | 39 years |
| Oregon City, OR | | 12,643 |
| | 1,596 |
| | 15,694 |
| | — |
| | 1,596 |
| | 15,694 |
| | 17,290 |
| | 315 |
| | 16,975 |
| | May-14 | | 40 years |
| Park Rapids, MN | | 1,725 |
| | 50 |
| | 2,683 |
| | 143 |
| | 50 |
| | 2,826 |
| | 2,876 |
| | 121 |
| | 2,755 |
| | Jun-13 | | 40 years |
| Plymouth, IN | | 3,471 |
| | 128 |
| | 5,538 |
| | — |
| | 128 |
| | 5,538 |
| | 5,666 |
| | 1,044 |
| | 4,622 |
| | Jun-07 | | 40 years |
| Portage, IN | | 4,958 |
| | 1,438 |
| | 7,988 |
| | — |
| | 1,438 |
| | 7,988 |
| | 9,426 |
| | 1,506 |
| | 7,920 |
| | Jun-07 | | 40 years |
| Prineville, OR | | 4,816 |
| | 231 |
| | 4,885 |
| | — |
| | 231 |
| | 4,885 |
| | 5,116 |
| | 12 |
| | 5,104 |
| | Dec-14 | | 39 years |
| Proctor, MN | | 5,677 |
| | 300 |
| | 7,920 |
| | — |
| | 300 |
| | 7,920 |
| | 8,220 |
| | 325 |
| | 7,895 |
| | Jun-13 | | 40 years |
| Redmond, OR | 3,589 |
| | 241 |
| | 2,200 |
| | — |
| | 241 |
| | 2,200 |
| | 2,441 |
| | 6 |
| | 2,435 |
| | Dec-14 | | 39 years |
| Rendlesham, UK | | 13,003 |
| | 3,524 |
| | 13,199 |
| | — |
| | 3,524 |
| | 13,199 |
| | 16,723 |
| | 41 |
| | 16,682 |
| | Dec-14 | | 39 years |
| Rushville, IN | | 729 |
| | 62 |
| | 1,177 |
| | — |
| | 62 |
| | 1,177 |
| | 1,239 |
| | 222 |
| | 1,017 |
| | Jun-07 | | 40 years |
| Salem, OR | | 3,589 |
| | 501 |
| | 3,469 |
| | — |
| | 501 |
| | 3,469 |
| | 3,970 |
| | 10 |
| | 3,960 |
| | Dec-14 | | 39 years |
| Sauchie, UK | | 8,116 |
| | 1,667 |
| | 8,771 |
| | — |
| | 1,667 |
| | 8,771 |
| | 10,438 |
| | 26 |
| | 10,412 |
| | Dec-14 | | 39 years |
| Scarning, UK | | 5,441 |
| | 1,976 |
| | 5,022 |
| | — |
| | 1,976 |
| | 5,022 |
| | 6,998 |
| | 17 |
| | 6,981 |
| | Dec-14 | | 39 years |
| Sevenoaks, UK | | 6,699 |
| | 1,535 |
| | 7,080 |
| | — |
| | 1,535 |
| | 7,080 |
| | 8,615 |
| | 21 |
| | 8,594 |
| | Dec-14 | | 39 years |
| Shipton-Under-Wychwood, UK | | 12,749 |
| | 2,428 |
| | 13,968 |
| | — |
| | 2,428 |
| | 13,968 |
| | 16,396 |
| | 40 |
| | 16,356 |
| | Dec-14 | | 39 years |
| Sompting, UK | | 2,847 |
| | 1,332 |
| | 2,330 |
| | — |
| | 1,332 |
| | 2,330 |
| | 3,662 |
| | 9 |
| | 3,653 |
| | Dec-14 | | 39 years |
| Sonning Common, UK | | 19,244 |
| | 2,598 |
| | 22,152 |
| | — |
| | 2,598 |
| | 22,152 |
| | 24,750 |
| | 61 |
| | 24,689 |
| | Dec-14 | | 39 years |
| St George, UK | | 6,104 |
| | 2,927 |
| | 4,922 |
| | — |
| | 2,927 |
| | 4,922 |
| | 7,849 |
| | 19 |
| | 7,830 |
| | Dec-14 | | 39 years |
| St Peter, UK | | 13,239 |
| | 3,692 |
| | 13,336 |
| | — |
| | 3,692 |
| | 13,336 |
| | 17,028 |
| | 42 |
| | 16,986 |
| | Dec-14 | | 39 years |
| Sullivan, IN | | 966 |
| | 596 |
| | 441 |
| | — |
| | 596 |
| | 441 |
| | 1,037 |
| | 84 |
| | 953 |
| | Jun-07 | | 40 years |
| Swansea, IL | | 6,106 |
| | 521 |
| | 5,667 |
| | 59 |
| | 521 |
| | 5,726 |
| | 6,247 |
| | 167 |
| | 6,080 |
| | May-14 | | 40 years |
| Teddington, UK | | 18,366 |
| | 544 |
| | 23,077 |
| | — |
| | 544 |
| | 23,077 |
| | 23,621 |
| | 58 |
| | 23,563 |
| | Dec-14 | | 39 years |
| Tunbridge Wells, UK | | 5,900 |
| | 1,533 |
| | 6,055 |
| | — |
| | 1,533 |
| | 6,055 |
| | 7,588 |
| | 19 |
| | 7,569 |
| | Dec-14 | | 39 years |
| Wakarusa, IN | | 5,996 |
| | 153 |
| | 7,111 |
| | — |
| | 153 |
| | 7,111 |
| | 7,264 |
| | 1,341 |
| | 5,923 |
| | Jun-07 | | 40 years |
| Warsaw, IN | | 2,479 |
| | 396 |
| | 3,722 |
| | — |
| | 396 |
| | 3,722 |
| | 4,118 |
| | 701 |
| | 3,417 |
| | Jun-07 | | 40 years |
| Wimborne, UK | | 6,264 |
| | 2,376 |
| | 5,681 |
| | — |
| | 2,376 |
| | 5,681 |
| | 8,057 |
| | 20 |
| | 8,037 |
| | Dec-14 | | 39 years |
| Winshill, UK | | 7,501 |
| | 1,702 |
| | 7,945 |
| | — |
| | 1,702 |
| | 7,945 |
| | 9,647 |
| | 24 |
| | 9,623 |
| | Dec-14 | | 39 years |
| Wootton Bassett, UK | | 5,554 |
| | 2,286 |
| | 4,857 |
| | — |
| | 2,286 |
| | 4,857 |
| | 7,143 |
| | 17 |
| | 7,126 |
| | Dec-14 | | 39 years |
| Yelverton, UK | | 1,001 |
| | 243 |
| | 1,046 |
| | — |
| | 243 |
| | 1,046 |
| | 1,289 |
| | 3 |
| | 1,286 |
| | Dec-14 | | 39 years |
| Total Assisted Living Facilities | | 593,744 |
| | 101,864 |
| | 666,839 |
| | 2,116 |
| | 101,864 |
| | 668,955 |
| | 770,819 |
| | 11,467 |
| | 759,352 |
| | | | |
| | | | | | | | | | | | | | | | | | | | | | | |
| Hospitals | | | | | | | | | | | | | | | | | | | | | | |
| Athens, GA | | 14,626 |
| | 1,824 |
| | 17,610 |
| | — |
| | 1,824 |
| | 17,610 |
| | 19,434 |
| | 47 |
| | 19,387 |
| | Dec-14 | | 39 years |
| Cape Girardeau, MO | | 9,783 |
| | 672 |
| | 12,232 |
| | — |
| | 672 |
| | 12,232 |
| | 12,904 |
| | 31 |
| | 12,873 |
| | Dec-14 | | 39 years |
| Columbia, MO | | 12,979 |
| | 1,323 |
| | 10,585 |
| | — |
| | 1,323 |
| | 10,585 |
| | 11,908 |
| | 29 |
| | 11,879 |
| | Dec-14 | | 39 years |
| Gardena, CA | | 55,579 |
| | 5,803 |
| | 58,619 |
| | — |
| | 5,803 |
| | 58,619 |
| | 64,422 |
| | 157 |
| | 64,265 |
| | Dec-14 | | 39 years |
| Houston, TX | | 23,649 |
| | 2,245 |
| | 18,908 |
| | 113 |
| | 2,245 |
| | 19,021 |
| | 21,266 |
| | 51 |
| | 21,215 |
| | Dec-14 | | 39 years |
| Humble, TX | | 14,327 |
| | 611 |
| | 13,226 |
| | — |
| | 611 |
| | 13,226 |
| | 13,837 |
| | 34 |
| | 13,803 |
| | Dec-14 | | 39 years |
| Joplin, MO | | 10,945 |
| | 1,052 |
| | 8,504 |
| | — |
| | 1,052 |
| | 8,504 |
| | 9,556 |
| | 23 |
| | 9,533 |
| | Dec-14 | | 39 years |
| Lafayette, LA | | 12,931 |
| | 1,403 |
| | 9,740 |
| | — |
| | 1,403 |
| | 9,740 |
| | 11,143 |
| | 27 |
| | 11,116 |
| | Dec-14 | | 39 years |
| Los Angeles, CA | | 29,275 |
| | 4,621 |
| | 29,984 |
| | — |
| | 4,621 |
| | 29,984 |
| | 34,605 |
| | 84 |
| | 34,521 |
| | Dec-14 | | 39 years |
| Murray, UT | | 15,595 |
| | 1,714 |
| | 13,137 |
| | — |
| | 1,714 |
| | 13,137 |
| | 14,851 |
| | 36 |
| | 14,815 |
| | Dec-14 | | 39 years |
| Muskogee, OK | | 12,398 |
| | 480 |
| | 19,743 |
| | — |
| | 480 |
| | 19,743 |
| | 20,223 |
| | 49 |
| | 20,174 |
| | Dec-14 | | 39 years |
| Norwalk, CA | | 27,436 |
| | 4,069 |
| | 12,656 |
| | — |
| | 4,069 |
| | 12,656 |
| | 16,725 |
| | 40 |
| | 16,685 |
| | Dec-14 | | 39 years |
| Total Hospitals | | 239,523 |
| | 25,817 |
| | 224,944 |
| | 113 |
| | 25,817 |
| | 225,057 |
| | 250,874 |
| | 608 |
| | 250,266 |
| | Dec-14 | | 39 years |
Total Healthcare(2) | | 4,069,939 |
| | 471,783 |
| | 4,764,448 |
| | 34,456 |
| | 471,783 |
| | 4,798,904 |
| | 5,270,687 |
| | 120,979 |
| | 5,149,708 |
| | | | |
| | | | | | | | | | | | | | | | | | | | | | | |
| Hotels | | | | | | | | | | | | | | | | | | | | | | |
| Addison, TX | | 29,900 |
| | 3,927 |
| | 28,185 |
| | 418 |
| | 3,927 |
| | 28,603 |
| | 32,530 |
| | 787 |
| | 31,743 |
| | Jun-14 | | 40 years |
| Albany, NY | | 27,324 |
| | 4,918 |
| | 25,824 |
| | — |
| | 4,918 |
| | 25,824 |
| | 30,742 |
| | 112 |
| | 30,630 |
| | Nov-14 | | 40 years |
| Albuquerque, NM | | 19,582 |
| | 1,753 |
| | 23,792 |
| | — |
| | 1,753 |
| | 23,792 |
| | 25,545 |
| | 100 |
| | 25,445 |
| | Nov-14 | | 40 years |
NORTHSTAR REALTY FINANCE CORP. AND SUBSIDIARIES
SCHEDULE III - REAL ESTATE AND ACCUMULATED DEPRECIATION
As of December 31, 2014
(Dollars in Thousands)
|
| | | | | | | | | | | | | | | | | | | | | | | | | | | | | | | |
| Column A | | Column B | | Column C Initial Cost | | Column D Capitalized Subsequent to Acquisition | | Column E Gross Amount Carried at Close of Period | | Column F | | Column G | | Column H |
| Location City, State | | Encumbrances | | Land | | Building & Improvements | | Land, Buildings & Improvements | | Land | | Building & Improvements | | Total | | Accumulated Depreciation | | Total | | Date Acquired | | Life on Which Depreciation is Computed |
| Altamonte Springs, FL | | 8,000 |
| | 2,352 |
| | 5,776 |
| | 69 |
| | 2,352 |
| | 5,845 |
| | 8,197 |
| | 312 |
| | 7,885 |
| | Jun-14 | | 15 years |
| Ann Arbor, MI | | 28,782 |
| | 4,088 |
| | 26,376 |
| | — |
| | 4,088 |
| | 26,376 |
| | 30,464 |
| | 118 |
| | 30,346 |
| | Nov-14 | | 40 years |
| Annapolis Junction, MD | | 15,028 |
| | 1,613 |
| | 13,343 |
| | — |
| | 1,613 |
| | 13,343 |
| | 14,956 |
| | 62 |
| | 14,894 |
| | Nov-14 | | 40 years |
| Ardmore, OK | | 7,377 |
| | 409 |
| | 6,558 |
| | 43 |
| | 409 |
| | 6,601 |
| | 7,010 |
| | 128 |
| | 6,882 |
| | Aug-14 | | 40 years |
| Arlington, TX | | 29,301 |
| | 2,850 |
| | 33,258 |
| | 233 |
| | 2,850 |
| | 33,491 |
| | 36,341 |
| | 529 |
| | 35,812 |
| | Jun-14-Sep-14 | | 40 years |
| Atlanta, GA | | 33,802 |
| | 7,242 |
| | 39,703 |
| | 1,182 |
| | 7,242 |
| | 40,885 |
| | 48,127 |
| | 697 |
| | 47,430 |
| | Jun-14-Sep-14 | | 40 years |
| Atlantic City, NJ | | 16,670 |
| | 2,792 |
| | 13,163 |
| | 1,282 |
| | 2,792 |
| | 14,445 |
| | 17,237 |
| | 262 |
| | 16,975 |
| | Jun-14 | | 40 years |
| Augusta, GA | | 15,103 |
| | 1,936 |
| | 17,969 |
| | 81 |
| | 1,936 |
| | 18,050 |
| | 19,986 |
| | 157 |
| | 19,829 |
| | Sep-14 | | 40 years |
| Baton Rouge, LA | | 11,476 |
| | 1,574 |
| | 12,953 |
| | — |
| | 1,574 |
| | 12,953 |
| | 14,527 |
| | 61 |
| | 14,466 |
| | Nov-14 | | 40 years |
| Bellevue, WA | | 28,100 |
| | 6,460 |
| | 25,049 |
| | 8 |
| | 6,460 |
| | 25,057 |
| | 31,517 |
| | 1,090 |
| | 30,427 |
| | Jun-14 | | 15 years |
| Belmont, CA | | 45,200 |
| | 10,556 |
| | 39,920 |
| | 682 |
| | 10,556 |
| | 40,602 |
| | 51,158 |
| | 893 |
| | 50,265 |
| | Jun-14 | | 40 years |
| Binghamton, NY | | 7,060 |
| | 1,408 |
| | 7,423 |
| | 25 |
| | 1,408 |
| | 7,448 |
| | 8,856 |
| | 245 |
| | 8,611 |
| | Jun-14 | | 15 years |
| Blue Ash, OH | | 14,139 |
| | 1,838 |
| | 21,060 |
| | 38 |
| | 1,838 |
| | 21,098 |
| | 22,936 |
| | 192 |
| | 22,744 |
| | Sep-14 | | 40 years |
| Bothell, WA | | 20,620 |
| | 4,058 |
| | 20,025 |
| | 17 |
| | 4,058 |
| | 20,042 |
| | 24,100 |
| | 911 |
| | 23,189 |
| | Jun-14 | | 15 years |
| Brentwood, TN | | 17,915 |
| | 2,535 |
| | 17,235 |
| | 46 |
| | 2,535 |
| | 17,281 |
| | 19,816 |
| | 160 |
| | 19,656 |
| | Sep-14 | | 40 years |
| Brownsville, TX | | 10,474 |
| | 624 |
| | 10,969 |
| | — |
| | 624 |
| | 10,969 |
| | 11,593 |
| | 53 |
| | 11,540 |
| | Nov-14 | | 40 years |
| Buena Park, CA | | 19,763 |
| | 9,031 |
| | 8,119 |
| | 60 |
| | 9,031 |
| | 8,179 |
| | 17,210 |
| | 128 |
| | 17,082 |
| | Sep-14 | | 40 years |
| Campbell, CA | | 20,450 |
| | 5,530 |
| | 16,547 |
| | 4 |
| | 5,530 |
| | 16,551 |
| | 22,081 |
| | 720 |
| | 21,361 |
| | Jun-14 | | 40 years |
| Cary, NC | | 18,398 |
| | 1,552 |
| | 22,537 |
| | — |
| | 1,552 |
| | 22,537 |
| | 24,089 |
| | 102 |
| | 23,987 |
| | Nov-14 | | 40 years |
| Chapel Hill, NC | | 19,491 |
| | 1,508 |
| | 18,756 |
| | — |
| | 1,508 |
| | 18,756 |
| | 20,264 |
| | 76 |
| | 20,188 |
| | Nov-14 | | 40 years |
| Charlotte, NC | | 11,649 |
| | 717 |
| | 19,583 |
| | 44 |
| | 717 |
| | 19,627 |
| | 20,344 |
| | 173 |
| | 20,171 |
| | Sep-14 | | 40 years |
| Cherry Hill, NJ | | 12,560 |
| | 2,665 |
| | 10,380 |
| | 595 |
| | 2,665 |
| | 10,975 |
| | 13,640 |
| | 573 |
| | 13,067 |
| | Jun-14 | | 15 years |
| Colorado Springs, CO | | 27,688 |
| | 2,835 |
| | 27,865 |
| | — |
| | 2,835 |
| | 27,865 |
| | 30,700 |
| | 133 |
| | 30,567 |
| | Nov-14 | | 40 years |
| Columbia, MD | | 5,800 |
| | 1,191 |
| | 6,134 |
| | 31 |
| | 1,191 |
| | 6,165 |
| | 7,356 |
| | 157 |
| | 7,199 |
| | Jun-14 | | 40 years |
| Columbus, GA | | 4,745 |
| | 1,268 |
| | 7,551 |
| | 58 |
| | 1,268 |
| | 7,609 |
| | 8,877 |
| | 95 |
| | 8,782 |
| | Sep-14 | | 40 years |
| Columbus, OH | | 10,604 |
| | 1,690 |
| | 12,788 |
| | 17 |
| | 1,690 |
| | 12,805 |
| | 14,495 |
| | 141 |
| | 14,354 |
| | Sep-14 | | 40 years |
| Cotulla, TX | | 6,762 |
| | 365 |
| | 8,344 |
| | 8 |
| | 365 |
| | 8,352 |
| | 8,717 |
| | 167 |
| | 8,550 |
| | Aug-14 | | 40 years |
| Cranbury, NJ | | 14,573 |
| | 1,836 |
| | 16,831 |
| | — |
| | 1,836 |
| | 16,831 |
| | 18,667 |
| | 74 |
| | 18,593 |
| | Nov-14 | | 40 years |
| Dallas, TX | | 12,660 |
| | 1,030 |
| | 12,187 |
| | — |
| | 1,030 |
| | 12,187 |
| | 13,217 |
| | 62 |
| | 13,155 |
| | Nov-14 | | 40 years |
| Danbury, CT | | 8,015 |
| | 1,231 |
| | 9,601 |
| | — |
| | 1,231 |
| | 9,601 |
| | 10,832 |
| | 47 |
| | 10,785 |
| | Nov-14 | | 40 years |
| Dearborn, MI | | 13,496 |
| | 1,710 |
| | 16,476 |
| | 33 |
| | 1,710 |
| | 16,509 |
| | 18,219 |
| | 176 |
| | 18,043 |
| | Sep-14 | | 40 years |
| Denton, TX | | 6,148 |
| | 1,176 |
| | 6,638 |
| | 22 |
| | 1,176 |
| | 6,660 |
| | 7,836 |
| | 134 |
| | 7,702 |
| | Aug-14 | | 40 years |
| Denver, CO | | 47,400 |
| | 9,258 |
| | 41,619 |
| | 100 |
| | 9,258 |
| | 41,719 |
| | 50,977 |
| | 1,867 |
| | 49,110 |
| | Jun-14 | | 15 years |
| Doral, FL | | 17,754 |
| | 3,321 |
| | 22,414 |
| | — |
| | 3,321 |
| | 22,414 |
| | 25,735 |
| | 202 |
| | 25,533 |
| | Sep-14 | | 40 years |
| Dublin, OH | | 9,721 |
| | 2,162 |
| | 10,989 |
| | 40 |
| | 2,162 |
| | 11,029 |
| | 13,191 |
| | 141 |
| | 13,050 |
| | Sep-14 | | 40 years |
| Duluth, GA | | 10,110 |
| | 1,024 |
| | 11,109 |
| | 42 |
| | 1,024 |
| | 11,151 |
| | 12,175 |
| | 53 |
| | 12,122 |
| | Nov-14 | | 40 years |
| El Paso, TX | | 20,492 |
| | 2,063 |
| | 18,740 |
| | 37 |
| | 2,063 |
| | 18,777 |
| | 20,840 |
| | 350 |
| | 20,490 |
| | Aug-14 | | 40 years |
| El Segundo, CA | | 27,050 |
| | 5,041 |
| | 24,161 |
| | 787 |
| | 5,041 |
| | 24,948 |
| | 29,989 |
| | 547 |
| | 29,442 |
| | Jun-14 | | 40 years |
| Elizabeth, NJ | | 43,719 |
| | 3,242 |
| | 47,287 |
| | — |
| | 3,242 |
| | 47,287 |
| | 50,529 |
| | 208 |
| | 50,321 |
| | Nov-14 | | 40 years |
| Elmsford, NY | | 21,860 |
| | 2,855 |
| | 17,619 |
| | — |
| | 2,855 |
| | 17,619 |
| | 20,474 |
| | 77 |
| | 20,397 |
| | Nov-14 | | 40 years |
| Fairfax, VA | | 9,801 |
| | 3,941 |
| | 8,215 |
| | 53 |
| | 3,941 |
| | 8,268 |
| | 12,209 |
| | 88 |
| | 12,121 |
| | Sep-14 | | 40 years |
| Federal Way, WA | | 26,231 |
| | 1,633 |
| | 24,493 |
| | — |
| | 1,633 |
| | 24,493 |
| | 26,126 |
| | 98 |
| | 26,028 |
| | Nov-14 | | 40 years |
| Fort Lauderdale, FL | | 9,450 |
| | — |
| | 10,537 |
| | 67 |
| | — |
| | 10,604 |
| | 10,604 |
| | 258 |
| | 10,346 |
| | Jun-14 | | 40 years |
| Fort Walton Beach, FL | | 30,550 |
| | 6,414 |
| | 24,996 |
| | 237 |
| | 6,414 |
| | 25,233 |
| | 31,647 |
| | 782 |
| | 30,865 |
| | Jun-14 | | 40 years |
| Fort Worth, TX | | 6,011 |
| | 675 |
| | 5,907 |
| | 6 |
| | 675 |
| | 5,913 |
| | 6,588 |
| | 31 |
| | 6,557 |
| | Nov-14 | | 40 years |
| Fremont, CA | | 35,608 |
| | 9,307 |
| | 26,629 |
| | 3 |
| | 9,307 |
| | 26,632 |
| | 35,939 |
| | 766 |
| | 35,173 |
| | Jun-14-Sep-14 | | 15-40 years |
| Gaithersburg, MD | | 20,800 |
| | 2,708 |
| | 19,670 |
| | 2,235 |
| | 2,708 |
| | 21,905 |
| | 24,613 |
| | 604 |
| | 24,009 |
| | Jun-14 | | 40 years |
| Hampton, VA | | 2,720 |
| | 894 |
| | 6,339 |
| | 11 |
| | 894 |
| | 6,350 |
| | 7,244 |
| | 91 |
| | 7,153 |
| | Sep-14 | | 40 years |
| Harlingen, TX | | 14,846 |
| | 3,291 |
| | 12,868 |
| | — |
| | 3,291 |
| | 12,868 |
| | 16,159 |
| | 64 |
| | 16,095 |
| | Nov-14 | | 40 years |
| Harrisburg, PA | | 14,700 |
| | 2,429 |
| | 13,025 |
| | 107 |
| | 2,429 |
| | 13,132 |
| | 15,561 |
| | 599 |
| | 14,962 |
| | Jun-14 | | 15 years |
| Hauppauge, NY | | 13,662 |
| | 911 |
| | 14,855 |
| | — |
| | 911 |
| | 14,855 |
| | 15,766 |
| | 67 |
| | 15,699 |
| | Nov-14 | | 40 years |
| Herndon, VA | | 14,380 |
| | 2,801 |
| | 12,873 |
| | 12 |
| | 2,801 |
| | 12,885 |
| | 15,686 |
| | 131 |
| | 15,555 |
| | Sep-14 | | 40 years |
| Homewood, AL | | 16,850 |
| | 971 |
| | 16,808 |
| | — |
| | 971 |
| | 16,808 |
| | 17,779 |
| | 67 |
| | 17,712 |
| | Nov-14 | | 40 years |
| Horsham, PA | | 6,770 |
| | 1,359 |
| | 5,766 |
| | 1,490 |
| | 1,359 |
| | 7,256 |
| | 8,615 |
| | 186 |
| | 8,429 |
| | Jun-14 | | 40 years |
| Houma, LA | | 23,361 |
| | 1,591 |
| | 22,599 |
| | 431 |
| | 1,591 |
| | 23,030 |
| | 24,621 |
| | 475 |
| | 24,146 |
| | Aug-14 | | 40 years |
| Houston, TX | | 59,112 |
| | 10,474 |
| | 55,814 |
| | 13 |
| | 10,474 |
| | 55,827 |
| | 66,301 |
| | 263 |
| | 66,038 |
| | Nov-14 | | 40 years |
| Hunt Valley, MD | | 13,577 |
| | 2,437 |
| | 12,517 |
| | 3 |
| | 2,437 |
| | 12,520 |
| | 14,957 |
| | 131 |
| | 14,826 |
| | Sep-14 | | 40 years |
| Irving, TX | | 27,823 |
| | 3,274 |
| | 31,922 |
| | 177 |
| | 3,274 |
| | 32,099 |
| | 35,373 |
| | 233 |
| | 35,140 |
| | Sep-14-Nov-14 | | 40 years |
| Islandia, NY | | 15,450 |
| | 3,387 |
| | 13,672 |
| | 75 |
| | 3,387 |
| | 13,747 |
| | 17,134 |
| | 369 |
| | 16,765 |
| | Jun-14 | | 40 years |
| Lafayette, LA | | 7,787 |
| | 563 |
| | 6,883 |
| | 26 |
| | 563 |
| | 6,909 |
| | 7,472 |
| | 112 |
| | 7,360 |
| | Aug-14 | | 40 years |
| Lancaster, CA | | 22,131 |
| | 2,507 |
| | 21,683 |
| | 38 |
| | 2,507 |
| | 21,721 |
| | 24,228 |
| | 350 |
| | 23,878 |
| | Aug-14 | | 40 years |
| Landover, MD | | 6,431 |
| | 1,798 |
| | 7,035 |
| | 7 |
| | 1,798 |
| | 7,042 |
| | 8,840 |
| | 110 |
| | 8,730 |
| | Sep-14 | | 40 years |
| Laredo, TX | | 10,656 |
| | 583 |
| | 10,786 |
| | 17 |
| | 583 |
| | 10,803 |
| | 11,386 |
| | 154 |
| | 11,232 |
| | Aug-14 | | 40 years |
| Las Colinas, TX | | 18,250 |
| | 2,589 |
| | 16,477 |
| | 1,466 |
| | 2,589 |
| | 17,943 |
| | 20,532 |
| | 429 |
| | 20,103 |
| | Jun-14 | | 40 years |
| Lebanon, NJ | | 18,216 |
| | 2,486 |
| | 17,993 |
| | — |
| | 2,486 |
| | 17,993 |
| | 20,479 |
| | 76 |
| | 20,403 |
| | Nov-14 | | 40 years |
| Lexington, KY | | 8,080 |
| | 1,299 |
| | 6,328 |
| | 369 |
| | 1,299 |
| | 6,697 |
| | 7,996 |
| | 293 |
| | 7,703 |
| | Jun-14 | | 15 years |
| Livonia, MI | | 16,240 |
| | 2,075 |
| | 14,783 |
| | 6 |
| | 2,075 |
| | 14,789 |
| | 16,864 |
| | 382 |
| | 16,482 |
| | Jun-14 | | 40 years |
| Los Alamitos, CA | | 25,503 |
| | 4,279 |
| | 29,207 |
| | — |
| | 4,279 |
| | 29,207 |
| | 33,486 |
| | 118 |
| | 33,368 |
| | Nov-14 | | 40 years |
| Louisville, KY | | 44,675 |
| | 7,259 |
| | 39,904 |
| | 141 |
| | 7,259 |
| | 40,045 |
| | 47,304 |
| | 1,135 |
| | 46,169 |
| | Jun-14 | | 15-40 years |
| Lubbock, TX | | 9,016 |
| | 1,135 |
| | 7,235 |
| | 94 |
| | 1,135 |
| | 7,329 |
| | 8,464 |
| | 118 |
| | 8,346 |
| | Aug-14 | | 40 years |
| Lynnwood, WA | | 19,600 |
| | 1,877 |
| | 20,301 |
| | 43 |
| | 1,877 |
| | 20,344 |
| | 22,221 |
| | 896 |
| | 21,325 |
| | Jun-14 | | 15 years |
| Mansfield, TX | | 13,935 |
| | 2,132 |
| | 13,098 |
| | 25 |
| | 2,132 |
| | 13,123 |
| | 15,255 |
| | 249 |
| | 15,006 |
| | Aug-14 | | 40 years |
| Medford, MA | | 29,055 |
| | 2,632 |
| | 28,588 |
| | — |
| | 2,632 |
| | 28,588 |
| | 31,220 |
| | 114 |
| | 31,106 |
| | Nov-14 | | 40 years |
| Memphis, TN | | 11,327 |
| | 1,985 |
| | 10,861 |
| | 151 |
| | 1,985 |
| | 11,012 |
| | 12,997 |
| | 126 |
| | 12,871 |
| | Sep-14 | | 40 years |
| Montvale, NJ | | 34,075 |
| | 8,247 |
| | 27,879 |
| | 31 |
| | 8,247 |
| | 27,910 |
| | 36,157 |
| | 667 |
| | 35,490 |
| | Jun-14 | | 40 years |
| Morristown, NJ | | 31,160 |
| | 13,471 |
| | 25,665 |
| | 172 |
| | 13,471 |
| | 25,837 |
| | 39,308 |
| | 707 |
| | 38,601 |
| | Jun-14 | | 40 years |
| Morrisville, NC | | 21,768 |
| | 4,024 |
| | 21,790 |
| | — |
| | 4,024 |
| | 21,790 |
| | 25,814 |
| | 93 |
| | 25,721 |
| | Nov-14 | | 40 years |
| Mount Laurel, NJ | | 7,680 |
| | 2,304 |
| | 8,734 |
| | 888 |
| | 2,304 |
| | 9,622 |
| | 11,926 |
| | 187 |
| | 11,739 |
| | Jun-14 | | 40 years |
| Naperville, IL | | 9,319 |
| | 2,241 |
| | 15,480 |
| | 3 |
| | 2,241 |
| | 15,483 |
| | 17,724 |
| | 157 |
| | 17,567 |
| | Sep-14 | | 40 years |
| Naples, FL | | 11,500 |
| | 2,301 |
| | 9,842 |
| | 12 |
| | 2,301 |
| | 9,854 |
| | 12,155 |
| | 263 |
| | 11,892 |
| | Jun-14 | | 40 years |
| Nashville, TN | | 21,677 |
| | 3,518 |
| | 25,965 |
| | — |
| | 3,518 |
| | 25,965 |
| | 29,483 |
| | 113 |
| | 29,370 |
| | Nov-14 | | 40 years |
| Norcross, GA | | 10,600 |
| | 1,740 |
| | 10,603 |
| | 238 |
| | 1,740 |
| | 10,841 |
| | 12,581 |
| | 325 |
| | 12,256 |
| | Jun-14 | | 40 years |
| Ontario, CA | | 22,850 |
| | 5,419 |
| | 31,910 |
| | 29 |
| | 5,419 |
| | 31,939 |
| | 37,358 |
| | 1,426 |
| | 35,932 |
| | Jun-14 | | 15 years |
| Palmdale, CA | | 6,557 |
| | 918 |
| | 7,790 |
| | 38 |
| | 918 |
| | 7,828 |
| | 8,746 |
| | 189 |
| | 8,557 |
| | Aug-14 | | 40 years |
| Phoenix, AZ | | 13,657 |
| | 4,452 |
| | 14,304 |
| | 37 |
| | 4,452 |
| | 14,341 |
| | 18,793 |
| | 142 |
| | 18,651 |
| | Sep-14 | | 40 years |
| Pismo Beach, CA | | 14,549 |
| | 6,221 |
| | 9,986 |
| | — |
| | 6,221 |
| | 9,986 |
| | 16,207 |
| | 194 |
| | 16,013 |
| | Aug-14 | | 40 years |
| Pleasanton, CA | | 24,503 |
| | 5,257 |
| | 16,560 |
| | 22 |
| | 5,257 |
| | 16,582 |
| | 21,839 |
| | 187 |
| | 21,652 |
| | Sep-14 | | 40 years |
| Portland, ME | | 10,000 |
| | 1,344 |
| | 9,595 |
| | 13 |
| | 1,344 |
| | 9,608 |
| | 10,952 |
| | 277 |
| | 10,675 |
| | Jun-14 | | 40 years |
| Poughkeepsie, NY | | 20,038 |
| | 1,326 |
| | 24,698 |
| | — |
| | 1,326 |
| | 24,698 |
| | 26,024 |
| | 101 |
| | 25,923 |
| | Nov-14 | | 40 years |
| Princeton, NJ | | 18,216 |
| | 2,457 |
| | 21,727 |
| | — |
| | 2,457 |
| | 21,727 |
| | 24,184 |
| | 95 |
| | 24,089 |
| | Nov-14 | | 40 years |
| Raleigh, NC | | 10,926 |
| | 2,476 |
| | 13,170 |
| | 44 |
| | 2,476 |
| | 13,214 |
| | 15,690 |
| | 139 |
| | 15,551 |
| | Sep-14 | | 40 years |
| Rancho Cordova, CA | | 10,122 |
| | 3,321 |
| | 5,692 |
| | 3 |
| | 3,321 |
| | 5,695 |
| | 9,016 |
| | 101 |
| | 8,915 |
| | Sep-14 | | 40 years |
| Richmond, VA | | 40,543 |
| | 5,165 |
| | 35,898 |
| | 2,180 |
| | 5,165 |
| | 38,078 |
| | 43,243 |
| | 741 |
| | 42,502 |
| | Jun-14-Nov-14 | | 15-40 years |
| Roanoke, VA | | 27,324 |
| | 7,543 |
| | 28,174 |
| | — |
| | 7,543 |
| | 28,174 |
| | 35,717 |
| | 123 |
| | 35,594 |
| | Nov-14 | | 40 years |
| Rockville, MD | | 19,944 |
| | 4,233 |
| | 17,282 |
| | 241 |
| | 4,233 |
| | 17,523 |
| | 21,756 |
| | 335 |
| | 21,421 |
| | Jun-14-Sep-14 | | 40 years |
| Rosemont, IL | | 22,520 |
| | 3,755 |
| | 22,336 |
| | 3,754 |
| | 3,755 |
| | 26,090 |
| | 29,845 |
| | 588 |
| | 29,257 |
| | Jun-14 | | 40 years |
| Saddle River, NJ | | 30,000 |
| | 5,069 |
| | 26,842 |
| | 12 |
| | 5,069 |
| | 26,854 |
| | 31,923 |
| | 663 |
| | 31,260 |
| | Jun-14 | | 40 years |
| San Angelo, TX | | 26,645 |
| | 844 |
| | 17,308 |
| | 56 |
| | 844 |
| | 17,364 |
| | 18,208 |
| | 334 |
| | 17,874 |
| | Aug-14 | | 40 years |
| San Antonio, TX | | 44,809 |
| | 8,356 |
| | 49,090 |
| | 481 |
| | 8,356 |
| | 49,571 |
| | 57,927 |
| | 862 |
| | 57,065 |
| | Aug-14 | | 40 years |
San Bruno, CA(3) | | 32,134 |
| | — |
| | 38,636 |
| | 70 |
| | — |
| | 38,706 |
| | 38,706 |
| | 358 |
| | 38,348 |
| | Sep-14 | | 40 years |
| San Jose, CA | | 32,250 |
| | 7,955 |
| | 30,077 |
| | 29 |
| | 7,955 |
| | 30,106 |
| | 38,061 |
| | 630 |
| | 37,431 |
| | Jun-14 | | 15 years |
| Santa Ana, CA | | 21,530 |
| | 5,208 |
| | 15,525 |
| | 20 |
| | 5,208 |
| | 15,545 |
| | 20,753 |
| | 165 |
| | 20,588 |
| | Sep-14 | | 40 years |
| Savannah, GA | | 9,319 |
| | 1,788 |
| | 12,425 |
| | 118 |
| | 1,788 |
| | 12,543 |
| | 14,331 |
| | 132 |
| | 14,199 |
| | Sep-14 | | 40 years |
| Shelton, CT | | 7,240 |
| | 1,424 |
| | 6,002 |
| | 472 |
| | 1,424 |
| | 6,474 |
| | 7,898 |
| | 304 |
| | 7,594 |
| | Jun-14 | | 15 years |
| Solon, OH | | 8,835 |
| | 495 |
| | 11,007 |
| | — |
| | 495 |
| | 11,007 |
| | 11,502 |
| | 50 |
| | 11,452 |
| | Nov-14 | | 40 years |
| Somerset, NJ | | 16,395 |
| | 1,757 |
| | 15,867 |
| | — |
| | 1,757 |
| | 15,867 |
| | 17,624 |
| | 70 |
| | 17,554 |
| | Nov-14 | | 40 years |
| Tallahassee, FL | | 16,630 |
| | 1,838 |
| | 20,658 |
| | 5 |
| | 1,838 |
| | 20,663 |
| | 22,501 |
| | 187 |
| | 22,314 |
| | Sep-14 | | 40 years |
| Tampa, FL | | 13,935 |
| | 2,111 |
| | 14,207 |
| | — |
| | 2,111 |
| | 14,207 |
| | 16,318 |
| | 58 |
| | 16,260 |
| | Nov-14 | | 40 years |
| Tarrytown, NY | | 12,854 |
| | 5,080 |
| | 9,642 |
| | 190 |
| | 5,080 |
| | 9,832 |
| | 14,912 |
| | 151 |
| | 14,761 |
| | Sep-14 | | 40 years |
| Troy, MI | | 21,453 |
| | 2,983 |
| | 26,076 |
| | 888 |
| | 2,983 |
| | 26,964 |
| | 29,947 |
| | 668 |
| | 29,279 |
| | Jun-14-Sep-14 | | 15-40 years |
| Tucson, AZ | | 24,319 |
| | 3,245 |
| | 27,132 |
| | 42 |
| | 3,245 |
| | 27,174 |
| | 30,419 |
| | 127 |
| | 30,292 |
| | Nov-14 | | 40 years |
| Tukwila, WA | | 28,600 |
| | 5,750 |
| | 26,863 |
| | 24 |
| | 5,750 |
| | 26,887 |
| | 32,637 |
| | 1,183 |
| | 31,454 |
| | Jun-14 | | 15 years |
| Twentynine Palms, CA | | 7,992 |
| | 632 |
| | 9,044 |
| | 27 |
| | 632 |
| | 9,071 |
| | 9,703 |
| | 162 |
| | 9,541 |
| | Aug-14 | | 40 years |
| Vienna, VA | | 31,241 |
| | 3,295 |
| | 28,045 |
| | — |
| | 3,295 |
| | 28,045 |
| | 31,340 |
| | 125 |
| | 31,215 |
| | Nov-14 | | 40 years |
| Virginia Beach, VA | | 5,099 |
| | 1,828 |
| | 5,526 |
| | 17 |
| | 1,828 |
| | 5,543 |
| | 7,371 |
| | 86 |
| | 7,285 |
| | Sep-14 | | 40 years |
| Warren, MI | | 10,363 |
| | 1,494 |
| | 12,235 |
| | 71 |
| | 1,494 |
| | 12,306 |
| | 13,800 |
| | 152 |
| | 13,648 |
| | Sep-14 | | 40 years |
| Wayne, PA | | 19,763 |
| | 1,897 |
| | 23,784 |
| | 68 |
| | 1,897 |
| | 23,852 |
| | 25,749 |
| | 223 |
| | 25,526 |
| | Sep-14 | | 40 years |
| West Homestead, PA | | 11,021 |
| | 797 |
| | 11,695 |
| | — |
| | 797 |
| | 11,695 |
| | 12,492 |
| | 50 |
| | 12,442 |
| | Nov-14 | | 40 years |
| West Melbourne, FL | | 8,034 |
| | 2,015 |
| | 8,971 |
| | 123 |
| | 2,015 |
| | 9,094 |
| | 11,109 |
| | 109 |
| | 11,000 |
| | Sep-14 | | 40 years |
| West Palm Beach, FL | | 8,926 |
| | 1,021 |
| | 9,030 |
| | 34 |
| | 1,021 |
| | 9,064 |
| | 10,085 |
| | 43 |
| | 10,042 |
| | Nov-14 | | 40 years |
| Westbury, NY | | 27,324 |
| | 10,196 |
| | 30,132 |
| | — |
| | 10,196 |
| | 30,132 |
| | 40,328 |
| | 121 |
| | 40,207 |
| | Nov-14 | | 40 years |
| Willow Grove, PA | | 15,450 |
| | 2,658 |
| | 13,599 |
| | 220 |
| | 2,658 |
| | 13,819 |
| | 16,477 |
| | 326 |
| | 16,151 |
| | Jun-14 | | 40 years |
| Wilmington, NC | | 25,412 |
| | 2,238 |
| | 25,907 |
| | — |
| | 2,238 |
| | 25,907 |
| | 28,145 |
| | 121 |
| | 28,024 |
| | Nov-14 | | 40 years |
| Windsor, CT | | 34,215 |
| | 5,906 |
| | 38,347 |
| | 347 |
| | 5,906 |
| | 38,694 |
| | 44,600 |
| | 656 |
| | 43,944 |
| | Jun-14-Nov-14 | | 15-40 years |
| Total Hotels | | 2,380,681 |
| | 400,543 |
| | 2,362,275 |
| | 24,324 |
| | 400,543 |
| | 2,386,599 |
| | 2,787,142 |
| | 38,503 |
| | 2,748,639 |
| | | | |
| | | | | | | | | | | | | | | | | | | | | | | |
| Manufactured Housing | | | | | | | | | | | | | | | | | | | | | | |
| Alton, IL | | 3,273 |
| | 987 |
| | 2,962 |
| | 16 |
| | 987 |
| | 2,978 |
| | 3,965 |
| | 272 |
| | 3,693 |
| | Dec-12 | | 10-30 years |
| Apopka, FL | | 17,029 |
| | 3,311 |
| | 12,637 |
| | 104 |
| | 3,311 |
| | 12,741 |
| | 16,052 |
| | 1,329 |
| | 14,723 |
| | Apr-13 | | 10-30 years |
| Arvada, CO | | 18,187 |
| | 6,028 |
| | 12,481 |
| | 7 |
| | 6,028 |
| | 12,488 |
| | 18,516 |
| | 1,427 |
| | 17,089 |
| | Dec-12 | | 10-30 years |
| Aurora, CO | | 6,243 |
| | 7,262 |
| | 14,333 |
| | 112 |
| | 7,262 |
| | 14,445 |
| | 21,707 |
| | 1,689 |
| | 20,018 |
| | Dec-12 | | 10-30 years |
| Austin, TX | | 34,357 |
| | 20,539 |
| | 22,253 |
| | 168 |
| | 20,539 |
| | 22,421 |
| | 42,960 |
| | 1,122 |
| | 41,838 |
| | Dec-13 | | 10-30 years |
| Belton, MO | | 11,618 |
| | 1,681 |
| | 15,797 |
| | 105 |
| | 1,681 |
| | 15,902 |
| | 17,583 |
| | 1,333 |
| | 16,250 |
| | Apr-13 | | 10-30 years |
| Bloomingburg, NY | | 17,692 |
| | 1,953 |
| | 18,546 |
| | 26 |
| | 1,953 |
| | 18,572 |
| | 20,525 |
| | 2,021 |
| | 18,504 |
| | Apr-13 | | 10-30 years |
| Blossvale, NY | | 2,949 |
| | 107 |
| | 3,608 |
| | 73 |
| | 107 |
| | 3,681 |
| | 3,788 |
| | 398 |
| | 3,390 |
| | Apr-13 | | 10-30 years |
| Casper, WY | | 34,172 |
| | 6,924 |
| | 13,906 |
| | 51 |
| | 6,924 |
| | 13,957 |
| | 20,881 |
| | 1,639 |
| | 19,242 |
| | Dec-12 | | 10-30 years |
| Cheyenne, WY | | 13,109 |
| | 5,299 |
| | 10,445 |
| | 93 |
| | 5,299 |
| | 10,538 |
| | 15,837 |
| | 1,243 |
| | 14,594 |
| | Dec-12 | | 10-30 years |
| Clearfield, UT | | 10,342 |
| | 3,246 |
| | 11,837 |
| | 32 |
| | 3,246 |
| | 11,869 |
| | 15,115 |
| | 1,264 |
| | 13,851 |
| | Apr-13 | | 10-30 years |
| Clio, MI | | 3,539 |
| | 3,538 |
| | 3,833 |
| | 29 |
| | 3,538 |
| | 3,862 |
| | 7,400 |
| | 193 |
| | 7,207 |
| | Dec-13 | | 10-30 years |
| Commerce City, CO | | 9,713 |
| | 2,318 |
| | 4,604 |
| | 1 |
| | 2,318 |
| | 4,605 |
| | 6,923 |
| | 548 |
| | 6,375 |
| | Dec-12 | | 10-30 years |
| Connelly, NY | | 6,295 |
| | 308 |
| | 7,099 |
| | 32 |
| | 308 |
| | 7,131 |
| | 7,439 |
| | 794 |
| | 6,645 |
| | Apr-13 | | 10-30 years |
| Davie, FL | | 29,487 |
| | 9,381 |
| | 9,923 |
| | 12 |
| | 9,381 |
| | 9,935 |
| | 19,316 |
| | 979 |
| | 18,337 |
| | Apr-13 | | 10-30 years |
| Davison, MI | | 3,791 |
| | 3,986 |
| | 4,319 |
| | 33 |
| | 3,986 |
| | 4,352 |
| | 8,338 |
| | 218 |
| | 8,120 |
| | Dec-13 | | 10-30 years |
| Denver, CO | | 34,684 |
| | 10,838 |
| | 14,403 |
| | 78 |
| | 10,838 |
| | 14,481 |
| | 25,319 |
| | 1,028 |
| | 24,291 |
| | Dec-12 | | 10-30 years |
NORTHSTAR REALTY FINANCE CORP. AND SUBSIDIARIES
SCHEDULE III - REAL ESTATE AND ACCUMULATED DEPRECIATION
As of December 31, 2014
(Dollars in Thousands)
|
| | | | | | | | | | | | | | | | | | | | | | | | | | | | | | | | | | | | | | | | |
| Column A | | Column B | | Column C Initial Cost | | Column D Capitalized Subsequent to Acquisition | | Column E Gross Amount Carried at Close of Period | | Column F | | Column G | | Column H |
| Location City, State | | Encumbrances | | Land | | Building & Improvements | | Land, Buildings & Improvements | | Land | | Building & Improvements | | Total | | Accumulated Depreciation | | Total | | Date Acquired | | Life on Which Depreciation is Computed |
| Fayetteville, CO | | 1,307 |
| | 346 |
| | 743 |
| | — |
| | 346 |
| | 743 |
| | 1,089 |
| | 88 |
| | 1,001 |
| | Dec-13 | | 10-30 years |
| Ft. Collins, CO | | 27,322 |
| | 11,856 |
| | 23,200 |
| | 25 |
| | 11,856 |
| | 23,225 |
| | 35,081 |
| | 2,745 |
| | 32,336 |
| | Dec-12 | | 10-30 years |
| Gainesville, FL | | 15,038 |
| | 2,886 |
| | 12,179 |
| | 82 |
| | 2,886 |
| | 12,261 |
| | 15,147 |
| | 1,287 |
| | 13,860 |
| | Dec-12 | | 10-30 years |
| Gansevoort, NY | | 560 |
| | 163 |
| | 532 |
| | 1 |
| | 163 |
| | 533 |
| | 696 |
| | 61 |
| | 635 |
| | Apr-13 | | 10-30 years |
| Gillette, WY | | 20,647 |
| | 9,148 |
| | 18,156 |
| | 57 |
| | 9,148 |
| | 18,213 |
| | 27,361 |
| | 2,139 |
| | 25,222 |
| | Apr-13 | | 10-30 years |
| Godfrey, IL | | 3,564 |
| | 492 |
| | 1,077 |
| | 5 |
| | 492 |
| | 1,082 |
| | 1,574 |
| | 123 |
| | 1,451 |
| | Dec-12 | | 10-30 years |
| Golden, CO | | 2,926 |
| | 4,955 |
| | 10,005 |
| | 54 |
| | 4,955 |
| | 10,059 |
| | 15,014 |
| | 1,167 |
| | 13,847 |
| | Dec-12 | | 10-30 years |
| Grand Prairie, TX | | 21,967 |
| | 24,701 |
| | 26,762 |
| | 202 |
| | 24,701 |
| | 26,964 |
| | 51,665 |
| | 1,349 |
| | 50,316 |
| | Dec-12 | | 10-30 years |
| Greeley, CO | | 25,159 |
| | 13,659 |
| | 23,978 |
| | 312 |
| | 13,659 |
| | 24,290 |
| | 37,949 |
| | 2,570 |
| | 35,379 |
| | Dec-13 | | 10-30 years |
| Haysville, KS | | 1,445 |
| | 95 |
| | 2,497 |
| | 1 |
| | 95 |
| | 2,498 |
| | 2,593 |
| | 177 |
| | 2,416 |
| | Dec-12/May 14 | | 10-30 years |
| Henderson, CO | | 21,998 |
| | 8,734 |
| | 17,661 |
| | 8 |
| | 8,734 |
| | 17,669 |
| | 26,403 |
| | 2,009 |
| | 24,394 |
| | Apr-13 | | 10-30 years |
| Jacksonville, FL | | 87,059 |
| | 22,173 |
| | 80,785 |
| | 469 |
| | 22,173 |
| | 81,254 |
| | 103,427 |
| | 7,999 |
| | 95,428 |
| | Dec-12 | | 10-30 years |
| Kansas City, KS | | 7,490 |
| | 1,221 |
| | 8,471 |
| | 35 |
| | 1,221 |
| | 8,506 |
| | 9,727 |
| | 767 |
| | 8,960 |
| | Apr-13 | | 10-30 years |
| Kansas City, MO | | 8,256 |
| | 885 |
| | 11,312 |
| | 79 |
| | 885 |
| | 11,391 |
| | 12,276 |
| | 1,079 |
| | 11,197 |
| | Apr-13 | | 10-30 years |
| Kissimmee, FL | | 23,589 |
| | 5,771 |
| | 24,506 |
| | 90 |
| | 5,771 |
| | 24,596 |
| | 30,367 |
| | 2,646 |
| | 27,721 |
| | Apr-13 | | 10-30 years |
| Lake Wales, FL | | 7,961 |
| | 1,841 |
| | 6,421 |
| | 114 |
| | 1,841 |
| | 6,535 |
| | 8,376 |
| | 733 |
| | 7,643 |
| | Apr-13 | | 10-30 years |
| Laramie, WY | | 4,566 |
| | 1,794 |
| | 3,687 |
| | 19 |
| | 1,794 |
| | 3,706 |
| | 5,500 |
| | 426 |
| | 5,074 |
| | Apr-13 | | 10-30 years |
| Lawrence, KS | | 13,225 |
| | 931 |
| | 18,174 |
| | 113 |
| | 931 |
| | 18,287 |
| | 19,218 |
| | 1,685 |
| | 17,533 |
| | Dec-12 | | 10-30 years |
| Layton, UT | | 21,945 |
| | 7,145 |
| | 21,839 |
| | 64 |
| | 7,145 |
| | 21,903 |
| | 29,048 |
| | 2,396 |
| | 26,652 |
| | Apr-13 | | 10-30 years |
| Lewisville, TX | | 56,852 |
| | 38,613 |
| | 41,835 |
| | 315 |
| | 38,613 |
| | 42,150 |
| | 80,763 |
| | 2,109 |
| | 78,654 |
| | Apr-13 | | 10-30 years |
| Liverpool, NY | | 12,384 |
| | 1,398 |
| | 14,505 |
| | 71 |
| | 1,398 |
| | 14,576 |
| | 15,974 |
| | 1,446 |
| | 14,528 |
| | Dec-13/May-14 | | 10-30 years |
| Longmont, CO | | 49,465 |
| | 13,716 |
| | 16,893 |
| | 120 |
| | 13,716 |
| | 17,013 |
| | 30,729 |
| | 1,122 |
| | 29,607 |
| | Apr-13 | | 10-30 years |
| Loveland, CO | | 5,456 |
| | 2,206 |
| | 4,351 |
| | 19 |
| | 2,206 |
| | 4,370 |
| | 6,576 |
| | 520 |
| | 6,056 |
| | Dec-12 | | 10-30 years |
| Magna, UT | | 10,984 |
| | 3,224 |
| | 12,293 |
| | 36 |
| | 3,224 |
| | 12,329 |
| | 15,553 |
| | 1,355 |
| | 14,198 |
| | Dec-13 | | 10-30 years |
| Manhattan, KS | | 16,255 |
| | 1,130 |
| | 21,804 |
| | 47 |
| | 1,130 |
| | 21,851 |
| | 22,981 |
| | 2,091 |
| | 20,890 |
| | Dec-12 | | 10-30 years |
| Nanuet, NY | | 12,090 |
| | 1,106 |
| | 13,022 |
| | 81 |
| | 1,106 |
| | 13,103 |
| | 14,209 |
| | 1,462 |
| | 12,747 |
| | Apr-13 | | 10-30 years |
| Naples, FL | | 20,125 |
| | 4,316 |
| | 11,293 |
| | 106 |
| | 4,316 |
| | 11,399 |
| | 15,715 |
| | 1,256 |
| | 14,459 |
| | Apr-13 | | 10-30 years |
| North Salt Lake, UT | | 26,022 |
| | 8,878 |
| | 22,433 |
| | 79 |
| | 8,878 |
| | 22,512 |
| | 31,390 |
| | 2,490 |
| | 28,900 |
| | Apr-13 | | 10-30 years |
| O' Fallon, IL | | 4,106 |
| | 1,643 |
| | 3,303 |
| | 41 |
| | 1,643 |
| | 3,344 |
| | 4,987 |
| | 391 |
| | 4,596 |
| | Apr-13 | | 10-30 years |
| Ogden, UT | | 49,818 |
| | 14,388 |
| | 53,666 |
| | 161 |
| | 14,388 |
| | 53,827 |
| | 68,215 |
| | 5,940 |
| | 62,275 |
| | Apr-13 | | 10-30 years |
| Orlando, FL | | 33,172 |
| | 7,480 |
| | 27,638 |
| | 187 |
| | 7,480 |
| | 27,825 |
| | 35,305 |
| | 2,993 |
| | 32,312 |
| | Dec-12 | | 10-30 years |
| Park City, KS | | 4,077 |
| | 722 |
| | 6,317 |
| | 128 |
| | 722 |
| | 6,445 |
| | 7,167 |
| | 473 |
| | 6,694 |
| | Apr-13 | | 10-30 years |
| Pompano Beach, FL | | 6,561 |
| | 2,515 |
| | 4,316 |
| | 30 |
| | 2,515 |
| | 4,346 |
| | 6,861 |
| | 468 |
| | 6,393 |
| | Apr-13 | | 10-30 years |
| Pontoon Beach, IL | | 8,686 |
| | 3,383 |
| | 7,064 |
| | 70 |
| | 3,383 |
| | 7,134 |
| | 10,517 |
| | 808 |
| | 9,709 |
| | Apr-13 | | 10-30 years |
| Port Jervis, NY | | 8,772 |
| | 985 |
| | 9,601 |
| | 49 |
| | 985 |
| | 9,650 |
| | 10,635 |
| | 1,058 |
| | 9,577 |
| | Apr-13 | | 10-30 years |
| Queensbury, NY | | 7,667 |
| | 296 |
| | 9,205 |
| | 23 |
| | 296 |
| | 9,228 |
| | 9,524 |
| | 971 |
| | 8,553 |
| | Dec-12 | | 10-30 years |
NORTHSTAR REALTY FINANCE CORP. AND SUBSIDIARIES
SCHEDULE III - REAL ESTATE AND ACCUMULATED DEPRECIATION
As of December 31, 2014
(Dollars in Thousands)
|
| | | | | | | | | | | | | | | | | | | | | | | | | | | | | | | | | | | | | | | | |
| Column A | | Column B | | Column C Initial Cost | | Column D Capitalized Subsequent to Acquisition | | Column E Gross Amount Carried at Close of Period | | Column F | | Column G | | Column H |
| Location City, State | | Encumbrances | | Land | | Building & Improvements | | Land, Buildings & Improvements | | Land | | Building & Improvements | | Total | | Accumulated Depreciation | | Total | | Date Acquired | | Life on Which Depreciation is Computed |
| Salt Lake City, UT | | 49,685 |
| | 14,506 |
| | 59,627 |
| | 114 |
| | 14,506 |
| | 59,741 |
| | 74,247 |
| | 6,667 |
| | 67,580 |
| | Apr-13 | | 10-30 years |
| Sandy, UT | | 18,577 |
| | 6,412 |
| | 19,874 |
| | 9 |
| | 6,412 |
| | 19,883 |
| | 26,295 |
| | 2,221 |
| | 24,074 |
| | Apr-13 | | 10-30 years |
| Sarasota Springs, NY | | 2,433 |
| | 95 |
| | 3,034 |
| | 6 |
| | 95 |
| | 3,040 |
| | 3,135 |
| | 331 |
| | 2,804 |
| | Apr-13 | | 10-30 years |
| Springdale, AR | | 2,612 |
| | 1,850 |
| | 3,713 |
| | 24 |
| | 1,850 |
| | 3,737 |
| | 5,587 |
| | 447 |
| | 5,140 |
| | Apr-13 | | 10-30 years |
| Thornton, CO | | 105,466 |
| | 42,284 |
| | 49,978 |
| | 307 |
| | 42,284 |
| | 50,285 |
| | 92,569 |
| | 3,139 |
| | 89,430 |
| | Apr-13 | | 10-30 years |
| Tooele, UT | | 7,445 |
| | 982 |
| | 9,775 |
| | 27 |
| | 982 |
| | 9,802 |
| | 10,784 |
| | 1,061 |
| | 9,723 |
| | Dec-12 | | 10-30 years |
| Topeka, KS | | 10,342 |
| | 5,097 |
| | 10,521 |
| | 112 |
| | 5,097 |
| | 10,633 |
| | 15,730 |
| | 810 |
| | 14,920 |
| | Dec-12 | | 10-30 years |
| Tucson, AZ | | 11,166 |
| | 7,316 |
| | 7,926 |
| | 60 |
| | 7,316 |
| | 7,986 |
| | 15,302 |
| | 400 |
| | 14,902 |
| | Dec-13 | | 10-30 years |
| Washingtonville, NY | | 4,755 |
| | 1,181 |
| | 4,883 |
| | 13 |
| | 1,181 |
| | 4,896 |
| | 6,077 |
| | 541 |
| | 5,536 |
| | Apr-13 | | 10-30 years |
| West Jordan, UT | | 23,649 |
| | 7,195 |
| | 28,939 |
| | 65 |
| | 7,195 |
| | 29,004 |
| | 36,199 |
| | 3,239 |
| | 32,960 |
| | Apr-13 | | 10-30 years |
| West Valley City, UT | | 14,117 |
| | 3,445 |
| | 18,239 |
| | 20 |
| | 3,445 |
| | 18,259 |
| | 21,704 |
| | 2,028 |
| | 19,676 |
| | May-14 | | 10-30 years |
| Wichita, KS | | 13,244 |
| | 2,265 |
| | 19,524 |
| | 235 |
| | 2,265 |
| | 19,759 |
| | 22,024 |
| | 1,510 |
| | 20,514 |
| | Apr-13 | | 10-30 years |
| Winter Haven, FL | | 5,750 |
| | 580 |
| | 5,550 |
| | 24 |
| | 580 |
| | 5,574 |
| | 6,154 |
| | 611 |
| | 5,543 |
| | Apr-13 | | 10-30 years |
| Total Manufactured Housing | | 1,174,237 |
| | 405,709 |
| | 1,016,093 |
| | 5,281 |
| | 405,709 |
| | 1,021,374 |
| | 1,427,083 |
| | 98,901 |
| | 1,328,182 |
| | | | |
| | | | | | | | | | | | | | | | | | | | | | |
| Net Lease | | | | | | | | | | | | | | | | | | | | | | |
| Industrial | | | | | | | | | | | | | | | | | | | | | | |
| Arvada, CO | | 4,951 |
| | 879 |
| | 6,990 |
| | — |
| | 879 |
| | 6,990 |
| | 7,869 |
| | 72 |
| | 7,797 |
| | Aug-14 | | 40 years |
| Aurora & Twinsburg, OH | | 5,360 |
| | 1,139 |
| | 6,665 |
| | — |
| | 1,139 |
| | 6,665 |
| | 7,804 |
| | 69 |
| | 7,735 |
| | Aug-14 | | 40 years |
| Bedford Park, IL | | 6,552 |
| | 2,459 |
| | 7,438 |
| | — |
| | 2,459 |
| | 7,438 |
| | 9,897 |
| | 77 |
| | 9,820 |
| | Aug-14 | | 40 years |
| Charleston, SC | | 4,421 |
| | 665 |
| | 5,332 |
| | — |
| | 665 |
| | 5,332 |
| | 5,997 |
| | 56 |
| | 5,941 |
| | Aug-14 | | 40 years |
| Chicago, IL | | 17,882 |
| | 8,745 |
| | 20,798 |
| | — |
| | 8,745 |
| | 20,798 |
| | 29,543 |
| | 217 |
| | 29,326 |
| | Aug-14 | | 40 years |
| Cleveland, OH | | 5,819 |
| | 503 |
| | 7,390 |
| | — |
| | 503 |
| | 7,390 |
| | 7,893 |
| | 71 |
| | 7,822 |
| | Aug-14 | | 40 years |
| Compton, CA | | 19,182 |
| | 12,622 |
| | 18,510 |
| | — |
| | 12,622 |
| | 18,510 |
| | 31,132 |
| | 179 |
| | 30,953 |
| | Aug-14 | | 40 years |
| Corpus Christi, TX | | 600 |
| | 274 |
| | 639 |
| | — |
| | 274 |
| | 639 |
| | 913 |
| | 9 |
| | 904 |
| | Aug-14 | | 40 years |
| Decatur, GA | | 7,933 |
| | 1,123 |
| | 11,414 |
| | — |
| | 1,123 |
| | 11,414 |
| | 12,537 |
| | 119 |
| | 12,418 |
| | Aug-14 | | 40 years |
| Easley, SC | | 5,842 |
| | 744 |
| | 7,699 |
| | — |
| | 744 |
| | 7,699 |
| | 8,443 |
| | 93 |
| | 8,350 |
| | Aug-14 | | 40 years |
| Eden Prairie, MN | | 3,950 |
| | 1,542 |
| | 4,574 |
| | — |
| | 1,542 |
| | 4,574 |
| | 6,116 |
| | 56 |
| | 6,060 |
| | Aug-14 | | 40 years |
| Ferndale, MI | | 1,940 |
| | 182 |
| | 2,464 |
| | — |
| | 182 |
| | 2,464 |
| | 2,646 |
| | 25 |
| | 2,621 |
| | Aug-14 | | 40 years |
| Fraser, MI | | 2,812 |
| | 563 |
| | 3,245 |
| | — |
| | 563 |
| | 3,245 |
| | 3,808 |
| | 39 |
| | 3,769 |
| | Aug-14 | | 40 years |
| Gladewater, TX | | 1,222 |
| | 221 |
| | 1,446 |
| | — |
| | 221 |
| | 1,446 |
| | 1,667 |
| | 17 |
| | 1,650 |
| | Aug-14 | | 40 years |
| Louisville, KY | | 5,202 |
| | 1,300 |
| | 5,484 |
| | — |
| | 1,300 |
| | 5,484 |
| | 6,784 |
| | 61 |
| | 6,723 |
| | Aug-14 | | 40 years |
| Mayfield, KY | | 2,251 |
| | 124 |
| | 3,142 |
| | — |
| | 124 |
| | 3,142 |
| | 3,266 |
| | 37 |
| | 3,229 |
| | Aug-14 | | 40 years |
| New Boston, MI | | 9,064 |
| | 1,175 |
| | 9,767 |
| | — |
| | 1,175 |
| | 9,767 |
| | 10,942 |
| | 104 |
| | 10,838 |
| | Aug-14 | | 40 years |
| Norcross, GA | | 5,852 |
| | 1,945 |
| | 7,198 |
| | — |
| | 1,945 |
| | 7,198 |
| | 9,143 |
| | 99 |
| | 9,044 |
| | Aug-14 | | 40 years |
| North Richland Hills, TX | | 4,080 |
| | 987 |
| | 5,175 |
| | — |
| | 987 |
| | 5,175 |
| | 6,162 |
| | 52 |
| | 6,110 |
| | Aug-14 | | 40 years |
NORTHSTAR REALTY FINANCE CORP. AND SUBSIDIARIES
SCHEDULE III - REAL ESTATE AND ACCUMULATED DEPRECIATION
As of December 31, 2014
(Dollars in Thousands)
|
| | | | | | | | | | | | | | | | | | | | | | | | | | | | | | | | | | | | | | | | |
| Column A | | Column B | | Column C Initial Cost | | Column D Capitalized Subsequent to Acquisition | | Column E Gross Amount Carried at Close of Period | | Column F | | Column G | | Column H |
| Location City, State | | Encumbrances | | Land | | Building & Improvements | | Land, Buildings & Improvements | | Land | | Building & Improvements | | Total | | Accumulated Depreciation | | Total | | Date Acquired | | Life on Which Depreciation is Computed |
| North Vernon, IN | | 2,076 |
| | 253 |
| | 2,588 |
| | — |
| | 253 |
| | 2,588 |
| | 2,841 |
| | 34 |
| | 2,807 |
| | Aug-14 | | 40 years |
| Phoenix, AZ | | 13,525 |
| | 2,718 |
| | 18,743 |
| | — |
| | 2,718 |
| | 18,743 |
| | 21,461 |
| | 178 |
| | 21,283 |
| | Aug-14 | | 40 years |
| Plant City, FL | | 2,205 |
| | 1,210 |
| | 2,359 |
| | — |
| | 1,210 |
| | 2,359 |
| | 3,569 |
| | 31 |
| | 3,538 |
| | Aug-14 | | 40 years |
| Rochester, NY | | 5,381 |
| | 651 |
| | 5,488 |
| | — |
| | 651 |
| | 5,488 |
| | 6,139 |
| | 64 |
| | 6,075 |
| | Aug-14 | | 40 years |
| Schiller Park, IL | | 2,146 |
| | 2,654 |
| | 3,452 |
| | — |
| | 2,654 |
| | 3,452 |
| | 6,106 |
| | 40 |
| | 6,066 |
| | Aug-14 | | 40 years |
| South Holland, IL | | 7,673 |
| | 2,503 |
| | 10,716 |
| | — |
| | 2,503 |
| | 10,716 |
| | 13,219 |
| | 120 |
| | 13,099 |
| | Aug-14 | | 40 years |
| St. Louis, MO | | 2,471 |
| | 938 |
| | 2,771 |
| | — |
| | 938 |
| | 2,771 |
| | 3,709 |
| | 28 |
| | 3,681 |
| | Aug-14 | | 40 years |
| Stone Mountain, GA | | 6,633 |
| | 867 |
| | 8,966 |
| | — |
| | 867 |
| | 8,966 |
| | 9,833 |
| | 93 |
| | 9,740 |
| | Aug-14 | | 40 years |
| Strongsville, OH | | 2,456 |
| | 313 |
| | 3,011 |
| | — |
| | 313 |
| | 3,011 |
| | 3,324 |
| | 31 |
| | 3,293 |
| | Aug-14 | | 40 years |
| Tallahassee, FL | | 1,088 |
| | 199 |
| | 1,330 |
| | — |
| | 199 |
| | 1,330 |
| | 1,529 |
| | 16 |
| | 1,513 |
| | Aug-14 | | 40 years |
| Thorofare, NJ | | 3,300 |
| | 1,034 |
| | 4,919 |
| | — |
| | 1,034 |
| | 4,919 |
| | 5,953 |
| | 48 |
| | 5,905 |
| | Aug-14 | | 40 years |
| Vernon, CA | | 28,830 |
| | 29,905 |
| | 19,333 |
| | — |
| | 29,905 |
| | 19,333 |
| | 49,238 |
| | 193 |
| | 49,045 |
| | Aug-14 | | 40 years |
| Warren, MI | | 4,808 |
| | 661 |
| | 4,352 |
| | — |
| | 661 |
| | 4,352 |
| | 5,013 |
| | 49 |
| | 4,964 |
| | Aug-14 | | 40 years |
| Winston-Salem, NC | | 8,323 |
| | 1,641 |
| | 6,799 |
| | — |
| | 1,641 |
| | 6,799 |
| | 8,440 |
| | 68 |
| | 8,372 |
| | Aug-14 | | 40 years |
| Subtotal Industrial | | 205,830 |
| | 82,739 |
| | 230,197 |
| | — |
| | 82,739 |
| | 230,197 |
| | 312,936 |
| | 2,445 |
| | 310,491 |
| | | | |
| | | | | | | | | | | | | | | | | | | | | | | |
| Office | | | | | | | | | | | | | | | | | | | | | | |
| Auburn Hills, MI | | 11,646 |
| | 2,980 |
| | 8,607 |
| | — |
| | 2,980 |
| | 8,607 |
| | 11,587 |
| | 4,094 |
| | 7,493 |
| | Sept-05 | | 40 years |
| Aurora, CO | | 30,719 |
| | 2,650 |
| | 35,786 |
| | 23 |
| | 2,650 |
| | 35,809 |
| | 38,459 |
| | 8,175 |
| | 30,284 |
| | Jul-06 | | 40 years |
| Camp Hill, PA | | 23,598 |
| | 5,900 |
| | 19,510 |
| | — |
| | 5,900 |
| | 19,510 |
| | 25,410 |
| | 7,742 |
| | 17,668 |
| | Sept-05 | | 40 years |
| Columbus, OH | | 21,934 |
| | 4,375 |
| | 29,184 |
| | — |
| | 4,375 |
| | 29,184 |
| | 33,559 |
| | 6,266 |
| | 27,293 |
| | Nov-07 | | 40 years |
| Fort Mill, SC | | 28,778 |
| | 3,300 |
| | 31,554 |
| | — |
| | 3,300 |
| | 31,554 |
| | 34,854 |
| | 6,996 |
| | 27,858 |
| | Mar-07 | | 40 years |
| Indianapolis, IN | | 26,152 |
| | 1,670 |
| | 32,306 |
| | — |
| | 1,670 |
| | 32,306 |
| | 33,976 |
| | 8,359 |
| | 25,617 |
| | Mar-06 | | 40 years |
| Milpitas, CA | | 19,460 |
| | 16,800 |
| | 8,847 |
| | — |
| | 16,800 |
| | 8,847 |
| | 25,647 |
| | 2,808 |
| | 22,839 |
| | Feb-07 | | 40 years |
| Ocala, FL | | 1,627 |
| | 565 |
| | 2,868 |
| | — |
| | 565 |
| | 2,868 |
| | 3,433 |
| | 39 |
| | 3,394 |
| | Aug-14 | | 40 years |
| Pensacola, FL | | 2,682 |
| | 1,132 |
| | 2,691 |
| | — |
| | 1,132 |
| | 2,691 |
| | 3,823 |
| | 36 |
| | 3,787 |
| | Aug-14 | | 40 years |
| Rancho Cordova, CA | | 7,494 |
| | 3,060 |
| | 9,360 |
| | — |
| | 3,060 |
| | 9,360 |
| | 12,420 |
| | 2,457 |
| | 9,963 |
| | Sept-05 | | 40 years |
| Rockaway, NJ | | 15,799 |
| | 6,118 |
| | 15,664 |
| | 295 |
| | 6,118 |
| | 15,959 |
| | 22,077 |
| | 4,275 |
| | 17,802 |
| | Mar-06 | | 40 years |
| Salt Lake City, UT | | 13,181 |
| | 672 |
| | 19,739 |
| | 394 |
| | 672 |
| | 20,133 |
| | 20,805 |
| | 6,103 |
| | 14,702 |
| | Aug-05 | | 40 years |
| Savannah, GA | | 4,070 |
| | 509 |
| | 5,522 |
| | — |
| | 509 |
| | 5,522 |
| | 6,031 |
| | 63 |
| | 5,968 |
| | Aug-14 | | 40 years |
| West Sacramento, CA | | 6,921 |
| | 1,115 |
| | 10,433 |
| | — |
| | 1,115 |
| | 10,433 |
| | 11,548 |
| | 121 |
| | 11,427 |
| | Aug-14 | | 40 years |
| Subtotal Office | | 214,061 |
| | 50,846 |
| | 232,071 |
| | 712 |
| | 50,846 |
| | 232,783 |
| | 283,629 |
| | 57,534 |
| | 226,095 |
| | | | |
| | | | | | | | | | | | | | | | | | | | | | | |
| Retail | | | | | | | | | | | | | | | | | | | | | | |
Bloomingdale, IL(3) | | 5,230 |
| | — |
| | 5,810 |
| | — |
| | — |
| | 5,810 |
| | 5,810 |
| | 1,461 |
| | 4,349 |
| | Sept-06 | | 40 years |
Fort Wayne, IN(3) | | 2,908 |
| | — |
| | 3,642 |
| | — |
| | — |
| | 3,642 |
| | 3,642 |
| | 985 |
| | 2,657 |
| | Sept-06 | | 40 years |
NORTHSTAR REALTY FINANCE CORP. AND SUBSIDIARIES
SCHEDULE III - REAL ESTATE AND ACCUMULATED DEPRECIATION
As of December 31, 2014
(Dollars in Thousands)
|
| | | | | | | | | | | | | | | | | | | | | | | | | | | | | | | | | | | | | | | | |
| Column A | | Column B | | Column C Initial Cost | | Column D Capitalized Subsequent to Acquisition | | Column E Gross Amount Carried at Close of Period | | Column F | | Column G | | Column H |
| Location City, State | | Encumbrances | | Land | | Building & Improvements | | Land, Buildings & Improvements | | Land | | Building & Improvements | | Total | | Accumulated Depreciation | | Total | | Date Acquired | | Life on Which Depreciation is Computed |
| Keene, NH | | 6,105 |
| | 3,033 |
| | 5,919 |
| | — |
| | 3,033 |
| | 5,919 |
| | 8,952 |
| | 1,470 |
| | 7,482 |
| | Sept-06 | | 40 years |
| Concord, NH | | 7,640 |
| | 2,145 |
| | 9,216 |
| | — |
| | 2,145 |
| | 9,216 |
| | 11,361 |
| | 2,357 |
| | 9,004 |
| | Sept-06 | | 40 years |
Melville, NY(3) | | 4,057 |
| | — |
| | 3,187 |
| | — |
| | — |
| | 3,187 |
| | 3,187 |
| | 899 |
| | 2,288 |
| | Sept-06 | | 40 years |
Millbury, MA(3) | | 4,312 |
| | — |
| | 5,994 |
| | — |
| | — |
| | 5,994 |
| | 5,994 |
| | 1,345 |
| | 4,649 |
| | Sept-06 | | 40 years |
North Attleboro, MA(3) | | 4,295 |
| | — |
| | 5,445 |
| | — |
| | — |
| | 5,445 |
| | 5,445 |
| | 1,364 |
| | 4,081 |
| | Sept-06 | | 40 years |
South Portland, ME(3) | | 3,597 |
| | — |
| | 6,687 |
| | — |
| | — |
| | 6,687 |
| | 6,687 |
| | 2,413 |
| | 4,274 |
| | Sept-06 | | 40 years |
| Wichita, KS | | 5,594 |
| | 1,325 |
| | 5,583 |
| | — |
| | 1,325 |
| | 5,583 |
| | 6,908 |
| | 1,348 |
| | 5,560 |
| | Sept-06 | | 40 years |
| Subtotal Retail | | 43,738 |
| | 6,503 |
| | 51,483 |
| | — |
| | 6,503 |
| | 51,483 |
| | 57,986 |
| | 13,642 |
| | 44,344 |
| | | | |
| Total Net Lease | | 463,629 |
| | 140,088 |
| | 513,751 |
| | 712 |
| | 140,088 |
| | 514,463 |
| | 654,551 |
| | 73,621 |
| | 580,930 |
| | | | |
| | | | | | | | | | | | | | | | | | | | | | | |
| Multifamily | | | | | | | | | | | | | | | | | | | | | | |
| Houston, TX | | 14,870 |
| | 2,401 |
| | 16,293 |
| | 538 |
| | 2,401 |
| | 16,831 |
| | 19,232 |
| | 933 |
| | 18,299 |
| | Jun-13 | | 10-30 years |
| Jacksonville, FL | | 51,130 |
| | 8,933 |
| | 55,617 |
| | 1,337 |
| | 8,933 |
| | 56,954 |
| | 65,887 |
| | 3,200 |
| | 62,687 |
| | Apr-13/Jun-13 | | 10-30 years |
| Marietta, GA | | 11,395 |
| | 3,742 |
| | 11,258 |
| | 449 |
| | 3,742 |
| | 11,707 |
| | 15,449 |
| | 843 |
| | 14,606 |
| | Apr-13 | | 10-30 years |
| Memphis, TN | | 39,600 |
| | 7,300 |
| | 41,896 |
| | 2,144 |
| | 7,300 |
| | 44,040 |
| | 51,340 |
| | 2,507 |
| | 48,833 |
| | Mar-13 | | 10-30 years |
| Murfreesboro, TN | | 18,780 |
| | 2,900 |
| | 20,850 |
| | 912 |
| | 2,900 |
| | 21,762 |
| | 24,662 |
| | 1,356 |
| | 23,306 |
| | Apr-13 | | 10-30 years |
| Panama City, FL | | 12,880 |
| | 800 |
| | 15,150 |
| | 578 |
| | 800 |
| | 15,728 |
| | 16,528 |
| | 1,026 |
| | 15,502 |
| | Apr-13 | | 10-30 years |
| Roswell, GA | | 23,812 |
| | 7,920 |
| | 23,825 |
| | 1,304 |
| | 7,920 |
| | 25,129 |
| | 33,049 |
| | 1,634 |
| | 31,415 |
| | Apr-13 | | 10-30 years |
| Savannah, GA | | 25,550 |
| | 2,700 |
| | 29,750 |
| | 781 |
| | 2,700 |
| | 30,531 |
| | 33,231 |
| | 1,781 |
| | 31,450 |
| | Apr-13 | | 10-30 years |
| Scottsdale, AZ | | 46,538 |
| | 8,393 |
| | 53,130 |
| | 2,137 |
| | 8,393 |
| | 55,267 |
| | 63,660 |
| | 2,781 |
| | 60,879 |
| | Jun-13 | | 10-30 years |
| Total Multifamily | | 244,555 |
| | 45,089 |
| | 267,769 |
| | 10,180 |
| | 45,089 |
| | 277,949 |
| | 323,038 |
| | 16,061 |
| | 306,977 |
| | | | |
| | | | | | | | | | | | | | | | | | | | | | | |
European Office(1) | | | | | | | | | | | | | | | | | | | | | | |
| Woking, UK | | 77,660 |
| | 17,946 |
| | 71,863 |
| | — |
| | 17,946 |
| | 71,863 |
| | 89,809 |
| | 521 |
| | 89,288 |
| | Oct-14 | | 40 years |
| Total European Office | | 77,660 |
| | 17,946 |
| | 71,863 |
| | — |
| | 17,946 |
| | 71,863 |
| | 89,809 |
| | 521 |
| | 89,288 |
| | | | |
| | | | | | | | | | | | | | | | | | | | | | |
| Multi-tenant Office | | | | | | | | | | | | | | | | | | | | | | |
| Austin, TX | | 11,906 |
| | 1,808 |
| | 16,268 |
| | — |
| | 1,808 |
| | 16,268 |
| | 18,076 |
| | 153 |
| | 17,923 |
| | Oct-14 | | 40 years |
| Boulder, CO | | 11,591 |
| | 3,155 |
| | 13,334 |
| | 25 |
| | 3,155 |
| | 13,359 |
| | 16,514 |
| | 143 |
| | 16,371 |
| | Sep-14 | | 40 years |
| Denver, CO | | 13,503 |
| | 1,113 |
| | 16,882 |
| | 125 |
| | 1,113 |
| | 17,007 |
| | 18,120 |
| | 413 |
| | 17,707 |
| | Sep-14 | | 40 years |
| San Diego, CA | | 8,584 |
| | 1,751 |
| | 10,047 |
| | — |
| | 1,751 |
| | 10,047 |
| | 11,798 |
| | 79 |
| | 11,719 |
| | Nov-14 | | 40 years |
| Total Multi-tenant Office | | 45,584 |
| | 7,827 |
| | 56,531 |
| | 150 |
| | 7,827 |
| | 56,681 |
| | 64,508 |
| | 788 |
| | 63,720 |
| | | | |
| | | | | | | | | | | | | | | | | | | | | | |
| REO | | | | | | | | | | | | | | | | | | | | | | |
| Sheboygan, WI | | — |
| | 1,628 |
| | 5,709 |
| | — |
| | 1,628 |
| | 5,709 |
| | 7,337 |
| | 200 |
| | 7,137 |
| | Jan-13 | | 40 years |
| Total REO | | — |
| | 1,628 |
| | 5,709 |
| | — |
| | 1,628 |
| | 5,709 |
| | 7,337 |
| | 200 |
| | 7,137 |
| | | | |
NORTHSTAR REALTY FINANCE CORP. AND SUBSIDIARIES
SCHEDULE III - REAL ESTATE AND ACCUMULATED DEPRECIATION
As of December 31, 2014
(Dollars in Thousands)
|
| | | | | | | | | | | | | | | | | | | | | | | | | | | | | | | | | | | | | | | | |
| Column A | | Column B | | Column C Initial Cost | | Column D Capitalized Subsequent to Acquisition | | Column E Gross Amount Carried at Close of Period | | Column F | | Column G | | Column H |
| Location City, State | | Encumbrances | | Land | | Building & Improvements | | Land, Buildings & Improvements | | Land | | Building & Improvements | | Total | | Accumulated Depreciation | | Total | | Date Acquired | | Life on Which Depreciation is Computed |
| Grand Total | | $ | 8,456,285 |
| | $ | 1,490,613 |
| | $ | 9,058,439 |
| | $ | 75,103 |
| | $ | 1,490,613 |
| | $ | 9,133,542 |
| | $ | 10,624,155 |
| | $ | 349,574 |
| | $ | 10,274,581 |
| | | | |
___________________________________________
(1) Initial cost for UK properties includes foreign currency translation as of December 31, 2014.
(2) Excludes portfolio level financing of $75 million.
(3) Represents a leasehold interest in the property. All other properties are fee interest.
NORTHSTAR REALTY FINANCE CORP. AND SUBSIDIARIES
SCHEDULE III - REAL ESTATE AND ACCUMULATED DEPRECIATION (Continued)
As of December 31, 2014
(Dollars in Thousands)
The following table presents changes in the Company’s operating real estate portfolio for the years ended December 31, 2014, 2013 and 2012 (dollars in thousands):
|
| | | | | | | | | | | | |
| | | 2014 | | 2013 | | 2012 |
| Beginning balance | | $ | 2,561,180 |
| | $ | 1,538,489 |
| | $ | 1,207,519 |
|
| Property acquisitions | | 8,030,551 |
| | 1,598,837 |
| | 330,397 |
|
| Transfers to held for sale | | — |
| | (29,097 | ) | | (966 | ) |
| Improvements | | 37,955 |
| | 11,706 |
| | 4,785 |
|
| Retirements and disposals | | (5,531 | ) | | — |
| | (3,246 | ) |
| Deconsolidation of N-Star CDOs | | — |
| | (558,755 | ) | | — |
|
| Ending balance | | $ | 10,624,155 |
| | $ | 2,561,180 |
| | $ | 1,538,489 |
|
The following table presents changes in accumulated depreciation for the years ended December 31, 2014, 2013 and 2012 (dollars in thousands):
|
| | | | | | | | | | | | |
| | | 2014 | | 2013 | | 2012 |
| Beginning balance | | $ | 190,997 |
| | $ | 147,943 |
| | $ | 118,070 |
|
| Depreciation expense | | 164,924 |
| | 76,127 |
| | 33,257 |
|
| Assets held for sale | | — |
| | (7,387 | ) | | — |
|
Retirements and disposals(1) | | (6,347 | ) | | (1,370 | ) | | (3,384 | ) |
| Deconsolidation | | — |
| | (24,316 | ) | | — |
|
| Ending balance | | $ | 349,574 |
| | $ | 190,997 |
| | $ | 147,943 |
|
______________________
| |
| (1) | Includes $0.4 million of write-offs related to taking title to collateral in 2012. There were no write-offs in 2014 and 2013. |
NORTHSTAR REALTY FINANCE CORP. AND SUBSIDIARIES
SCHEDULE IV - MORTGAGE LOANS ON REAL ESTATE
December 31, 2014
(Dollars in Thousands)
|
| | | | | | | | | | | | | | | | | | | | | | | | | | | | |
| Asset Type: | | Location / Description(1) | | Number | | Interest Rate | | Maturity Date(3) | | Periodic Payment Terms(4) | | Prior Liens(5) | | Principal Amount(5) | | Carrying Value(6) | | Principal Amount of Loans Subject to Delinquent Principal or Interest(7) |
Floating(2) | | Fixed |
| First mortgage loans: | | | | | | | | | | | | | | | | | | | | |
| First Mortgage - A | | Pennsylvania / Office | | 1 | | 7.25% | | — | | Sep-16 | | I/O | | $ | — |
| | $ | 61,500 |
| | $ | 60,944 |
| | $ | — |
|
| First Mortgage - B | | Texas / Multifamily | | 1 | | — | | 15.00% | | Feb-15 | | I/O | | — |
| | 53,500 |
| | 53,377 |
| | — |
|
| First Mortgage - C | | California / Office | | 1 | | 6.90% | | — | | Oct-16 | | I/O | | — |
| | 38,750 |
| | 38,588 |
| | — |
|
| First Mortgage - D | | Miami / Land | | 1 | | 15.00% | | — | | Apr-15 | | I/O | | — |
| | 38,190 |
| | 38,458 |
| | — |
|
| First Mortgage - E | | Colorado / Retail | | 1 | | 6.65% | | — | | Apr-15 | | I/O | | — |
| | 35,500 |
| | 35,784 |
| | — |
|
| Other first mortgage loans | | Various / Various | | 10 | | 0.00% to 6.00% | | 0.00% to 7.50% | | Mar-19 | | — | | — |
| | 234,188 |
| | 97,799 |
| | — |
|
| Subtotal first mortgage loans: | | | | 15 | | | | | | | | | | | | 461,628 |
| | 324,950 |
| | — |
|
| | | | | | | | | | | | | | | | | | | | | |
| Mezzanine loans: | | | | | | | | | | | | | | | | | | | | |
| Mezzanine loans - A | | New York / Hotel | | 1 | | 15.25% | | — | | Feb-16 | | I/O | | 198,000 |
| | 48,525 |
| | 48,578 |
| | — |
|
| Mezzanine loans - B | | New York / Land | | 1 | | — | | 14.00% | | Oct-17 | | I/O | | 148,550 |
| | 40,250 |
| | 40,250 |
| | — |
|
| Other mezzanine loans | | Various / Various | | 7 | | — | | 0.00% to 14.50% | | Jun-18 | | — | | — |
| | 72,041 |
| | 68,260 |
| | — |
|
| Subtotal mezzanine loans | | | | 9 | | | | | | | | | | 346,550 |
|
| 160,816 |
| | 157,088 |
| | — |
|
| | | | | | | | | | | | | | | | | | | | | |
| Subordinate interests | | | | | | | | | | | | | | | | | | | | |
| Subordinate interests - A | | New York / Hotel | | 1 | | — | | 13.11% | | May-23 | | I/O | | — |
| | 61,750 |
| | 60,845 |
| | — |
|
| Subordinate interests - B | | Various / Hotel | | 1 | | — | | 13.20% | | Jul-16 | | I/O | | 64,468 |
| | 54,350 |
| | 54,310 |
| | — |
|
| Subordinate interests - C | | New York / Hotel | | 1 | | 11.07% | | — | | May-23 | | I/O | | — |
| | 46,930 |
| | 46,442 |
| | — |
|
Other subordinate interests | | Various / Various | | 5 | | 12.22% to 14.00% | | 11.50% to 13.20% | | Mar-16 | | — | | — |
| | 38,534 |
| | 38,640 |
| | — |
|
| Subtotal subordinate interests | | | | 8 | | | | | | | | | | 64,468 |
|
| 201,564 |
| | 200,237 |
| | — |
|
| | | | | | | | | | | | | | | | | | | | | |
| Corporate loans | | | | | | | | | | | | | | | | | | | | |
| Corporate loan - A | | NY, NJ, CT / Office | | 2 | | — | | 12.00% | | Dec-20 | | I/O | | — |
| | 150,000 |
| | 167,630 |
| | — |
|
| Corporate loan - B | | NY, NJ, CT / Office | | 1 | | — | | 12.00% | | Dec-20 | | I/O | | — |
| | 100,000 |
| | 111,655 |
| | — |
|
| Corporate loan - C | | Other / Other | | 1 | | — | | 14.00% | | Jul-17 | | I/O | | — |
| | 50,000 |
| | 48,527 |
| | — |
|
| Other term loans | | Various / Various | | 10 | | — | | 6.36% to 13.00% | | Aug-24 | | — | | — |
| | 63,308 |
| | 57,580 |
| | — |
|
| Subtotal corporate loans | | | | 14 | | | | | | | | | | — |
| | 363,308 |
| | 385,392 |
| | — |
|
| Total | | | | 46 | | | | | | | | | | $ | 411,018 |
| | $ | 1,187,316 |
|
| $ | 1,067,667 |
| | $ | — |
|
_________________________
| |
| (1) | Description of property types include condo, hotel, industrial, land, multifamily, office, retail and other. |
| |
| (2) | Certain floating rate loans are subject to LIBOR floors ranging from 0.25% to 3.50%. Includes one first mortgage loan with a principal amount of $6.2 million with a spread over prime rate. All other floating rate loans are based on one-month LIBOR. |
| |
| (3) | Represents initial maturity. |
| |
| (5) | Included are four revolver loans of $156.4 million, of which $60.7 million is outstanding as of December 31, 2014. Excludes any prior liens owned by the Company. |
| |
| (6) | Individual loans each have a carrying value greater than 3% of total loans. All other loans each have a carrying value less than 3% of total loans. |
| |
| (7) | There are no loans that have principal and interest delinquencies greater than 90 days. |
NORTHSTAR REALTY FINANCE CORP. AND SUBSIDIARIES
SCHEDULE IV - MORTGAGE LOANS ON REAL ESTATE (Continued)
December 31, 2014
(Dollars in Thousands)
Reconciliation of Carrying Value of Real Estate Debt:
|
| | | | | | | | | | | | |
| | | Years Ended December 31, |
| | | 2014 | | 2013 | | 2012 |
| Beginning balance | | $ | 1,031,078 |
| | $ | 1,832,231 |
| | $ | 1,710,582 |
|
| Additions: | | | | | | |
| Principal amount of new loans and additional funding on existing loans | | 323,215 |
| | 806,138 |
| | 397,058 |
|
| Interest accretion | | 21,103 |
| | 1,284 |
| | 1,636 |
|
| Acquisition cost (fees) on new loans | | (600 | ) | | (4,032 | ) | | (2,949 | ) |
| Premium (discount) on new loans | | (7,078 | ) | | 16,116 |
| | (26,014 | ) |
| Amortization of acquisition costs, fees, premiums and discounts | | 11,193 |
| | 28,480 |
| | 95,233 |
|
| Deductions: | | | | | | |
| Collection of principal | | 279,272 |
| | 274,354 |
| | 259,187 |
|
| Deconsolidation of CDOs (refer to Note 3) | | 9,709 |
| | 1,134,713 |
| | — |
|
| Provision for (reversal of) loan losses, net | | 2,719 |
| | (8,786 | ) | | 23,037 |
|
| Transfers to affiliates (refer to Note 11) | | — |
| | 115,797 |
| | — |
|
| Taking title to collateral | | — |
| | 135,361 |
| | 62,236 |
|
| Transfer to held for sale | | 15,223 |
| | — |
| | — |
|
| Unrealized (gain) loss on foreign currency remeasurement | | 2,084 |
| | (2,300 | ) | | (1,145 | ) |
| Realized loss on foreign currency remeasurement | | 2,237 |
| | — |
| | — |
|
| Ending balance | | $ | 1,067,667 |
| | $ | 1,031,078 |
| | $ | 1,832,231 |
|
Item 9. Changes in and Disagreements with Accountants on Accounting and Financial Disclosure
None.
Item 9A. Controls and Procedures
Attached as exhibits to this Annual Report on Form 10-K are certifications of the Company’s Chief Executive Officer and Chief Financial Officer, which are required in accordance with Rule 13a-14 of the Securities Exchange Act of 1934, as amended (the “Exchange Act”). This “Controls and Procedures” section includes information concerning the controls and procedures evaluation referred to in the certifications. Item 8. of this Annual Report on Form 10-K sets forth the report of Grant Thornton LLP, the Company’s independent registered public accounting firm, regarding its audit of the Company’s internal control over financial reporting set forth below in this section. This section should be read in conjunction with the certifications and the Grant Thornton LLP report for a more complete understanding of the topics presented.
Disclosure Controls and Procedures
The management of the Company established and maintains disclosure controls and procedures that are designed to ensure that material information relating to the Company and its subsidiaries required to be disclosed in the reports that are filed or submitted under the Exchange Act are recorded, processed, summarized, and reported within the time periods specified in the SEC’s rules and forms, and that such information is accumulated and communicated to management, including the Company’s Chief Executive Officer and Chief Financial Officer, as appropriate to allow timely decisions regarding required disclosures.
As of the end of the period covered by this report, management conducted an evaluation as required under Rules 13a-15(b) and 15d-15(b) under the Exchange Act under the supervision and with the participation of the Company’s Chief Executive Officer and Chief Financial Officer of the effectiveness of the Company’s disclosure controls and procedures (as defined in Rules 13a-15(e) and 15d-15(e) under the Exchange Act).
Based on this evaluation, the Company’s Chief Executive Officer and Chief Financial Officer concluded that, as of the end of the period covered by this report, the Company’s disclosure controls and procedures are effective. Notwithstanding the foregoing, a control system, no matter how well designed and operated, can provide only reasonable, not absolute, assurance that it will detect or uncover failures to disclose material information otherwise required to be set forth in the Company’s periodic reports.
Internal Control over Financial Reporting
(a) Management’s annual report on internal control over financial reporting.
Management is responsible for establishing and maintaining adequate internal control over financial reporting. As defined in Exchange Act Rule 13a-15(f), internal control over financial reporting is a process designed by, or under the supervision of, the principal executive and principal financial officer and effected by the board of directors, management and other personnel, to provide reasonable assurance regarding the reliability of financial reporting and the preparation of financial statements for external purposes in accordance with U.S. GAAP and includes those policies and procedures that: (i) pertain to the maintenance of records that in reasonable detail accurately and fairly reflect the transactions and dispositions of the assets of the Company; (ii) provide reasonable assurance that transactions are recorded as necessary to permit preparation of financial statements in accordance with GAAP, and that receipts and expenditures of the Company are being made only in accordance with authorizations of management and directors of the Company; and (iii) provide reasonable assurance regarding prevention or timely detection of unauthorized acquisition, use or disposition of the Company’s assets that could have a material effect on the financial statements.
Under the supervision and with the participation of management, including the Chief Executive Officer and Chief Financial Officer, the Company carried out an evaluation of the effectiveness of its internal control over financial reporting as of December 31, 2014 based on the “Internal Control-Integrated Framework” issued by the Committee of Sponsoring Organizations of the Treadway Commission (COSO) (2013 framework).
The Company has excluded from its assessment the internal control over financial reporting of recently acquired businesses in accordance with the general guidance issued by the SEC that an assessment of a recent business combination may be omitted from management’s report on internal control over financial reporting in the year of consolidation. The Company acquired real estate in the third and fourth quarters 2014, including the Griffin-American Portfolio, the K Partners Portfolio, Industrial Portfolio, Courtyard Portfolio, UK Property, Legacy Properties and Inland Portfolio. As these acquisitions occurred during the third and fourth quarters 2014, the scope of the Company’s assessment of the effectiveness of disclosure controls and procedures do not include such real estate acquisitions. The aggregated portfolios, excluding the Griffin-American Portfolio, represented approximately 11% and 17% of the Company’s total revenues and total assets, respectively. The Griffin-American
Portfolio represented approximately 3% and 29% of the Company’s total revenues and total assets, respectively. See Note 4 to the Company’s consolidated financial statements included in this Annual Report on Form 10-K.
Based upon this evaluation, management has concluded that the Company’s internal control over financial reporting was effective as of December 31, 2014.
(b) Attestation report of the registered public accounting firm.
The Company’s independent registered public accounting firm, Grant Thornton LLP, independently assessed the effectiveness of the Company’s internal control over financial reporting as of December 31, 2014. Grant Thornton LLP has issued an attestation report, which is included in Item 8. “Financial Statements and Supplementary Data” of this Annual Report on Form 10-K.
(c) Changes in internal control over financial reporting.
Except as set forth below, there have not been any changes in the Company’s internal control over financial reporting (as defined in Rules 13a-15(f) and 15d-15(f) under the Exchange Act) during the most recent fiscal quarter that materially affected, or are reasonably likely to materially affect, the Company’s internal control over financial reporting.
The Company is currently assessing the control environment and intends to disclose all material changes resulting from the recently acquired businesses noted above within or prior to the time the Company’s first annual assessment of internal control over financial reporting that is required to include these entities. While the Company has obtained an understanding of the internal control environment, the Company’s assessment will include documentation, testing and evaluation of internal controls over financial reporting.
The Company implemented certain controls and procedures relative to certain acquired businesses including financial reviews, policies and procedures, disclosure controls and procedures and organization integration. The Company believes these controls and procedures mitigate the risk of weaknesses in internal control over financial reporting. For the year ended December 31, 2014, these acquired businesses represented 16% and 14% of the Company’s total revenues and total assets, respectively.
Inherent Limitations on Effectiveness of Controls
The Company’s management, including the Chief Executive Officer and Chief Financial Officer, does not expect that the Company’s disclosure controls and procedures or the Company’s internal control over financial reporting will prevent or detect all error and all fraud. A control system, no matter how well designed and operated, can provide only reasonable, not absolute, assurance that the control system’s objectives will be met. The design of a control system must reflect the fact that there are resource constraints, and the benefits of controls must be considered relative to their costs.
Item 9B. Other Information
The Company’s 2015 Annual Meeting of Stockholders will be held on May 27, 2015, at a place and time to be specified in the Company’s definitive proxy statement. Because the date of the Company’s 2015 Annual Meeting of Stockholders is more than 30 days in advance of the anniversary date of the Company’s 2014 Annual Meeting of Stockholders, the Company is hereby notifying the Company’s stockholders that stockholder proposals to be considered for inclusion in the Company’s proxy materials for the Company’s 2015 annual meeting in accordance with Rule 14a-8 under the Exchange Act must be received by the Company by March 12, 2015 and must comply with the applicable rules and regulations of the SEC. In order for a stockholder to present any other proposal or director nomination at the 2015 annual meeting, a stockholder’s notice complying with the requirements set forth in the Company’s current bylaws must be delivered to the Company not later than March 12, 2015. All stockholder proposals or notices should be directed to the attention of the Company’s Corporate Secretary at the Company’s principal executive offices.
ADDITIONAL MATERIAL FEDERAL INCOME TAX CONSEQUENCES
The following is a summary of certain additional material federal income tax consequences with respect to the Company and the ownership of the Company’s shares of common stock.
Tax Considerations Relating to the Proposed European Spin
Tax Treatment of the Proposed European Spin in General
For federal income tax purposes, the Proposed European Spin will not be eligible for treatment as a tax-deferred distribution by the Company with respect to the Company’s common stock. Accordingly, the Proposed European Spin, if completed, will be treated as if the Company had distributed to each of the Company’s stockholders an amount equal to the fair market value of the NRE common stock received by such stockholder, determined as of the date of the Proposed European Spin (such amount,
the “distribution amount”). The federal income tax consequences of the Proposed European Spin to the Company’s stockholders are thus generally the same as the federal income tax consequences of cash distributions by us.
Although the Company will ascribe a value to the NRE common stock distributed in the Proposed European Spin, this valuation is not binding on the Internal Revenue Service, or IRS, or any other taxing authority. These taxing authorities could ascribe a higher valuation to the distributed NRE common stock, particularly if, following the distribution, NRE’s common stock trades at prices significantly above the value ascribed to the common stock by us. Such a higher valuation may affect the distribution amount and thus the federal income tax consequences of the Proposed European Spin to the Company’s stockholders.
The Company will be required to recognize any gain, but will not be permitted to recognize any loss, with respect to the NRE shares that the Company distributes in the Proposed European Spin. Because the Company expects NRE to qualify as a REIT for federal income tax purposes, the Company expects any gain the Company recognizes as a result of the Proposed European Spin will be qualifying income for purposes of both the 75% gross income test and the 95% gross income test applicable to REITs. In the event that NRE does not qualify as a REIT, any gain the Company recognizes as a result of the Proposed European Spin will be qualifying income for the 95% gross income test but will not be qualifying income for purposes of the 75% gross income test.
Tax Basis and Holding Period of NRE Shares Received by Holders of the Company’s Common Stock.
A stockholder’s tax basis in shares of NRE common stock received in the Proposed European Spin (including any fractional shares deemed to be received, as described above) generally will equal the fair market value of such shares on the date of the distribution, and the holding period for such shares will begin the day after the date of the distribution.
Time for Determination of the Tax Impact of the Proposed European Spin.
The actual tax impact of the Proposed European Spin will be affected by a number of factors that are unknown at this time, including the Company’s final earnings and profits for the year in which the distribution occurs (including as a result of the gain, if any, the Company recognizes in the distribution), the fair market value of NRE’s common stock on the date of the distribution and sales of capital assets during the year of the distribution. Thus, a definitive calculation of the federal income tax impact of the Proposed European Spin will not be possible until after the end of the calendar year in which the distribution occurs. The Company will notify the Company’s stockholders of the tax attributes of the distribution (including the distribution amount) on an IRS Form 1099-DIV.
Withholding of Amounts Distributable to Non-U.S. Stockholders in the Proposed European Spin.
If the Company is required to withhold any amounts otherwise distributable to a non-U.S. stockholder in the Proposed European Spin, the Company or other applicable withholding agents will collect the amount required to be withheld by reducing to cash for remittance to the IRS a sufficient portion of NRE common stock that such non-U.S. stockholder would otherwise receive, and such stockholder may bear brokerage or other costs for this withholding procedure. A non-U.S. stockholder may seek a refund from the IRS of any amounts withheld if it is subsequently determined that the amounts withheld exceeded the non-U.S. stockholder’s U.S. tax liability for the year in which the distribution occurred.
Requirements for Qualification as a REIT
Taxable REIT Subsidiaries and Gross Income Tests-Rents from Real Property
A REIT may lease qualified health care properties or qualified lodging facilities to a TRS which, in turn, engages “eligible independent contractors” to operate such properties. Such an arrangement is referred to as a “RIDEA structure.”
The Company has acquired interests in multiple joint ventures owning multiple hotel portfolios. Those investments are organized in RIDEA structures pursuant to which the Company invested in: (i) a joint venture partnership owning the fee interests in the hotels through a disregarded subsidiary; and (ii) the joint venture partnership owning the operating lessees through a TRS. The Company also recently placed a portfolio of healthcare properties into a RIDEA structure. The operating lessees have engaged third party operators to manage these hotels and healthcare properties. The Company believes that: (i) the hotels and healthcare properties the Company has acquired and/or placed in a RIDEA structure constitute “qualified lodging facilities” and “qualified healthcare properties”; (ii) the operators engaged by the operating lessees qualify as “eligible independent contractors” and (iii) the rental income from the leases with the operating lessees will qualify as “rents from real property” for purposes of the gross income tests applicable to REITs. The Company anticipates owning additional health care properties and hotels in RIDEA structures in the future.
As a result of the merger of Griffin-American, the Company acquired certain senior living facilities from Griffin-American that are held in RIDEA structures. The Company believes that those senior living facilities are “qualified health care properties,” the third-party managers engaged to operate those properties qualify as “eligible independent contractors,” and the TRSs that engaged the third-party managers will not be treated as operating or managing any “qualified health care properties.” However,
the application of the REIT rules to RIDEA structures is complex and not entirely clear in all cases. The Company believes that if it were determined that the RIDEA structures the Company acquired from Griffin-American do not qualify for the intended tax treatment, the Company would nevertheless be able to maintain the Company’s qualification as a REIT.
Gross Income Tests-Foreign Currency Gain
Also as a result of the merger of Griffin-American, the Company acquired from Griffin-American its portfolio of health care properties in the United Kingdom, and the Company’s operating income, expenses and distributions from that investment will be denominated in U.K. pound sterling rather than the U.S. dollar. As a result, the Company expects to have foreign currency gains and losses. Certain foreign currency gains will be excluded from gross income for purposes of one or both of the gross income tests. “Real estate foreign exchange gain” will be excluded from gross income for purposes of the 75% gross income test. Real estate foreign exchange gain generally includes foreign currency gain attributable to any item of income or gain that is qualifying income for purposes of the 75% gross income test, foreign currency gain attributable to the acquisition or ownership of (or becoming or being the obligor under) obligations secured by mortgages on real property or on interest in real property and certain foreign currency gain attributable to a qualified business unit (“QBU”) provided the QBU itself satisfies both the 75% gross income test and the 75% asset test applicable to REITs.
“Passive foreign exchange gain” will be excluded from gross income for purposes of the 95% gross income test. Passive foreign exchange gain generally includes real estate foreign exchange gain as described above and also includes foreign currency gain attributable to any item of income or gain that is qualifying income for purposes of the 95% gross income test and foreign currency gain attributable to the acquisition or ownership of (or becoming or being the obligor under) obligations. Because passive foreign exchange gain includes real estate foreign exchange gain, real estate foreign exchange gain is excluded from gross income for purposes of both the 75% and 95% gross income tests. These exclusions for real estate foreign exchange gain and passive foreign exchange gain do not apply to any certain foreign currency gain derived from dealing, or engaging in substantial and regular trading, in securities. Such gain is treated as nonqualifying income for purposes of both the 75% and 95% gross income tests.
The Company expects that the foreign currency gains recognized by the Company would likely be excluded from the 75% and 95% gross income tests. The U.S. federal income tax rules regarding foreign currency transactions are complex and limited authority is available regarding the application of such rules. As a result, there can be no assurance that the IRS will not challenge the manner in which the Company applies such rules to the Company’s operations in the United Kingdom. If the Company were to recognize significant foreign currency gains not excluded from the REIT gross income tests, the Company could fail to qualify as a REIT.
Asset Tests
The Company and the Company’s subsidiaries invest in distressed mortgage loans. In general, under the applicable Treasury Regulations, if a loan is secured by real property and other property and the highest principal amount of the loan outstanding during a taxable year exceeds the fair market value of the real property securing the loan as of: (i) the date the Company agrees to acquire or originate the loan; or (ii) in the event of a significant modification, the date the Company modified the loan, then a portion of the interest income from such a loan will not be qualifying income for purposes of the 75% gross income test but will be qualifying income for purposes of the 95% gross income test. A portion of the loan will also likely be a non-qualifying asset for purposes of the 75% asset test. The non-qualifying portion of such a loan would be subject to, among other requirements, the 10% vote or value test. IRS Revenue Procedure 2014-51 provides a safe harbor under which the IRS has stated that it will not challenge a REIT’s treatment of a loan as being, in part, a qualifying real estate asset in an amount equal to the lesser of (i) the fair market value of the loan on the date of the relevant quarterly REIT asset testing date; or (ii) the greater of (i) the current value of the real property securing the loan on the date of the relevant quarterly REIT asset testing date; or (ii) the fair market value of the real property securing the loan determined as of the date the REIT committed to acquire the loan. The Company intends to continue to invest in distressed mortgage loans in a manner consistent with maintaining its qualification as a REIT.
Sale-Leaseback Transactions
A portion of the properties the Company acquired from Griffin-American in the merger of Griffin-American were initially acquired by Griffin-American in the form of sale-leaseback transactions. The Company intends to treat these transactions as true leases for United States federal income tax purposes. However, depending on the terms of any specific transaction, the IRS might take the position that the transaction is not a true lease but is more properly treated in some other manner. If such recharacterization were successful, the Company would not be entitled to claim the depreciation deductions available to an owner of the property. In addition, the recharacterization of one or more of these transactions might cause the Company to fail to satisfy the asset tests or the income tests described above and such failure could result in the Company failing to qualify as a REIT. Alternatively, the amount or timing of income inclusion or the loss of depreciation deductions resulting from the recharacterization might cause the Company to fail to meet the distribution requirement described below for one or more
taxable years absent the availability of the deficiency dividend procedure or might result in a larger portion of the Company’s dividends being treated as ordinary income.
Taxation of Non-U.S. Stockholders
A non-U.S. stockholder generally will not incur tax under the Foreign Investment in Real Property Tax Act of 1980, or FIRPTA, with respect to gain realized upon a disposition of the Company’s common stock as long as we: (i) are not a “United States real property holding corporation” during a specified testing period; or (ii) are a domestically controlled qualified investment entity. The Company believes that, as a result of the merger of Griffin-American, the Company is a “United States real property holding corporation.” However, the Company believes that the Company currently is a domestically controlled qualified investment entity, but because the Company’s common stock and preferred stock are publicly traded, the Company cannot assure you that the Company is or will be a domestically controlled qualified investment entity in the future. Nevertheless, even if the Company were a “United States real property holding corporation” and were not a domestically controlled qualified investment entity, a non-U.S. stockholder that owned, actually or constructively, 5% or less of the Company’s common stock at all times during a specified testing period would not incur tax under FIRPTA as long as the Company’s common stock continues to be “regularly traded” on an established securities market. Additionally, because the Company believes the Company is treated as a “United States real property holding corporation” after the merger of Griffin-American, the Company may be required to withhold 10% of any distribution that exceeds the Company’s current and accumulated earnings and profits. Consequently, although the Company intends to withhold at a rate of 30% on the entire amount of any distribution, to the extent that the Company does not do so, the Company may withhold at a rate of 10% on any portion of a distribution not subject to withholding at a rate of 30%. If payment of withholding taxes is required, non-U.S. stockholders that are otherwise eligible for an exemption from, or reduction of, U.S. withholding taxes with respect of such dividends and proceeds will be required to seek a refund from the IRS to obtain the benefit or such exemption or reduction. The Company will not pay any additional amounts in respect of any amounts withheld.
PART III
Item 10. Directors, Executive Officers and Corporate Governance*
Certain information relating to the Company’s code of business conduct and ethics and code of ethics for senior financial officers (as defined in the code) is included in Part I, Item 1. “Business” of this Annual Report on Form 10-K.
Item 11. Executive Compensation*
Item 12. Security Ownership of Certain Beneficial Owners and Management and Related Stockholder Matters*
Item 13. Certain Relationships and Related Transactions and Director Independence*
Item 14. Principal Accountant Fees and Services*
__________________________
| |
| * | The information that is required by Items 10, 11, 12, 13 and 14 (other than the information included in this Annual Report on Form 10-K) is incorporated herein by reference from the definitive proxy statement relating to the 2015 Annual Meeting of Stockholders, to be filed with the Securities and Exchange Commission pursuant to Regulation 14A under the Securities Exchange Act of 1934, as amended, no later than 120 days after the end of the Company’s fiscal year ended December 31, 2014. |
PART IV
Item 15. Exhibits and Financial Statement Schedules
(a) 1. Consolidated Financial Statements and (a) 2. Financial Statement Schedules are included in Part II, Item 8. “Financial Statements and Supplementary Data” of this Annual Report on Form 10-K:
Reports of Independent Registered Public Accounting Firm
Consolidated Balance Sheets as of December 31, 2014 and 2013
Consolidated Statements of Operations for the years ended December 31, 2014, 2013 and 2012
Consolidated Statements of Comprehensive Income (Loss) for the years ended December 31, 2014, 2013 and 2012
Consolidated Statements of Equity for the years ended December 31, 2014, 2013 and 2012
Consolidated Statements of Cash Flows for the years ended December 31, 2014, 2013 and 2012
Notes to the Consolidated Financial Statements
Schedule II-Valuation and Qualifying Accounts and Reserves
Schedule III-Real Estate and Accumulated Depreciation as of December 31, 2014
Schedule IV-Mortgage Loans on Real Estate as of December 31, 2014
(a) 3. Exhibit Index:
|
| | | |
Exhibit Number | | Description of Exhibit |
| 2.1 |
| | Agreement and Plan of Merger, dated as of August 5, 2014, by and among NorthStar Realty Finance Corp., NRF Healthcare Subsidiary, LLC, NRF OP Healthcare Subsidiary, LLC, Griffin-American Healthcare REIT II Holdings, LP and Griffin-American Healthcare REIT II, Inc. (incorporated by reference to Exhibit 2.1 to NorthStar Realty Finance Corp.’s Current Report on Form 8-K filed on August 5, 2014). |
| 3.1 |
| | Articles of Restatement of NorthStar Realty Finance Corp. (incorporated by reference to Exhibit 3.1 to NorthStar Realty Finance Corp.’s Current Report on Form 8-K filed on August 7, 2014) |
| 3.2 |
| | Amended and Restated Bylaws of NorthStar Realty Finance Corp. (incorporated by reference to Exhibit 3.4 to NorthStar Realty Finance Corp.’s Current Report on Form 8-K filed on July 1, 2014) |
| 4.1 |
| | Registration Rights Agreement relating to the 7.25% Exchangeable Senior Notes due 2027 of NorthStar Realty Finance Limited Partnership, dated June 18, 2007 (incorporated by reference to Exhibit 4.2 to NorthStar Realty Finance Corp.’s Registration Statement on Form S-3 (File No. 333-146679)) |
| 4.2 |
| | Indenture dated as of June 18, 2007, among NorthStar Realty Finance Limited Partnership, as Issuer, NorthStar Realty Finance Corp., as Guarantor, and Wilmington Trust Company, as Trustee (incorporated by reference to Exhibit 4.1 to NorthStar Realty Finance Corp.’s Current Report on Form 8-K filed on June 22, 2007) |
| 4.3 |
| | Supplemental Indenture dated as of June 30, 2014, relating to the 7.25% Exchangeable Senior Notes, by and among NorthStar Realty Finance Corp., NRFC Sub-REIT Corp. (renamed NorthStar Realty Finance Corp.) and Wilmington Trust, National Association (incorporated by reference to Exhibit 4.9 to NorthStar Realty Finance Corp.’s Current Report on Form 8-K filed on July 1, 2014) |
| 4.4 |
| | Registration Rights Agreement relating to the 8.875% Exchangeable Senior Notes due 2032 of NorthStar Realty Finance Limited Partnership, dated as of June 12, 2012 (incorporated by reference to Exhibit 4.4 to NorthStar Realty Finance Corp.’s Current Report on Form 8-K filed June 12, 2012) |
| 4.5 |
| | Indenture dated as of June 12, 2012, among NorthStar Realty Finance Limited Partnership, as Issuer, NorthStar Realty Finance Corp. and NRFC Sub-REIT Corp., as Guarantors, and Wilmington Trust, National Association, as Trustee (incorporated by reference to Exhibit 4.1 to NorthStar Realty Finance Corp.’s Current Report on Form 8-K filed June 12, 2012) |
| 4.6 |
| | Supplemental Indenture, relating to the 8.875% Exchangeable Senior Notes, dated as of June 30, 2014, by and among NorthStar Realty Finance Corp., NRFC Sub-REIT Corp. (renamed NorthStar Realty Finance Corp.) and Wilmington Trust, National Association (incorporated by reference to Exhibit 4.6 to NorthStar Realty Finance Corp.’s Current Report on Form 8-K filed on July 1, 2014) |
| 4.7 |
| | Registration Rights Agreement relating to the 5.375% Exchangeable Senior Notes due 2033 of NorthStar Realty Finance Limited Partnership, dated as of June 19, 2013 (incorporated by reference to Exhibit 4.4 to NorthStar Realty Finance Corp.’s Current Report on Form 8-K filed June 19, 2013) |
| 4.8 |
| | Indenture, dated as of June 19, 2013, among NorthStar Realty Finance Limited Partnership, as Issuer, NorthStar Realty Finance Corp. and NRFC Sub-REIT Corp., as Guarantors, and Wilmington Trust, National Association, as Trustee (incorporated by reference to Exhibit 4.1 to NorthStar Realty Finance Corp.’s Current Report on Form 8-K filed June 19, 2013) |
| 4.9 |
| | Supplemental Indenture dated as of June 30, 2014, relating to the 5.375% Exchangeable Senior Notes, by and among NorthStar Realty Finance Corp., NRFC Sub-REIT Corp. (renamed NorthStar Realty Finance Corp.) and Wilmington Trust, National Association (incorporated by referent to Exhibit 4.3 to NorthStar Realty Finance Corp.’s Current Report on Form 8-K filed on July 1, 2014) |
| 4.10 |
| | Indenture, dated as of March 31, 2014, between NorthStar Realty Finance Corp. and Wilmington Trust, National Association, as Trustee (including the Form of Security) (incorporated by reference to NorthStar Realty Finance Corp.’s Current Report on Form 8-K filed March 31, 2014) |
| | | Certain Instruments defining the rights of holders of long-term debt securities of the Registrant and its subsidiaries are omitted pursuant to Item 601(b)(4)(iii) of Regulation S-K. The Registrant hereby undertakes to furnish to the SEC, upon request, copies of any such instruments. |
| 10.1 |
| + | NorthStar Realty Finance Corp. Executive Incentive Bonus Plan (incorporated by reference to Exhibit 10.31 to NorthStar Realty Finance Corp.’s Quarterly Report on Form 10-Q for the quarter ended September 30, 2009) |
| 10.2 |
| + | Amendment to the NorthStar Realty Finance Corp. Executive Incentive Bonus Plan (incorporated by reference to Exhibit 10.26 to NorthStar Realty Finance Corp.’s Quarterly Report on Form 10-Q for the quarter ended March 31, 2011) |
| 10.3 |
| + | Form of Amended and Restated Indemnification Agreement for directors and officers of NorthStar Realty Finance Corp. (incorporated by reference to Exhibit 10.25 to NorthStar Realty Finance Corp.’s Quarterly Report on Form 10-Q for the quarter ended June 30, 2011) |
| 10.4 |
| | Subscription Agreement dated as of December 10, 2012, by and among NRFC PE Fund Investor LLC, NRFC Inception, LP, Inception GP, LLC, Teachers Insurance and Annuity Association of America and NRFC PE Fund GP, LLC, portions of which have been omitted pursuant to a request for confidential treatment (incorporated by reference to Exhibit 10.23 to Amendment No. 1 to NorthStar Realty Finance Corp.’s Annual Report on Form 10-K/A for the year ended December 31, 2013) |
| 10.5 |
| + | Amendment to the NorthStar Realty Finance Corp. Executive Incentive Bonus Plan (incorporated by reference to Exhibit 10.30 to NorthStar Realty Finance Corp.’s Quarterly Report on Form 10-Q for the quarter ended March 31, 2013) |
| 10.6 |
| | Purchase and Sale Agreement, effective as of February 15, 2013 among NRFC MH II Holdings, LLC. ARC Real Estate Holdings, LLC and certain of its affiliates (incorporated by reference to Exhibit 10.1 to NorthStar Realty Finance Corp.’s Current Report on Form 8-K/A filed May 6, 2013) |
| 10.7 |
| | Amendment to Purchase and Sale Agreement, made as of March 27, 2013 among NRFC MH II Holdings, LLC, ARC Real Estate Holdings, LLC and certain of its affiliates (incorporated by reference to Exhibit 10.2 to NorthStar Realty Finance Corp.’s Current Report on Form 8-K/A filed May 6, 2013) |
| 10.8 |
| | Master Repurchase Agreement, dated as of March 11, 2013, by and among NRFC DB Loan, LLC, as master seller, and Deutsche Bank AG, Cayman Islands Branch, as buyer (incorporated by reference to Exhibit 10.1 to NorthStar Realty Finance Corp.’s Current Report on Form 8-K filed March 12, 2013) |
|
| | | |
Exhibit Number | | Description of Exhibit |
| 10.9 |
| | Limited Guaranty, dated as of March 11, 2013, executed and delivered by NorthStar Realty Finance Corp., NorthStar Realty Finance Limited Partnership and NRFC Sub-REIT Corp. to Deutsche Bank AG, Cayman Islands Branch (incorporated by reference to Exhibit 10.2 to NorthStar Realty Finance Corp.’s Current Report on Form 8-K filed March 12, 2013) |
| 10.10 |
| + | Second Amended and Restated 2004 Omnibus Stock Incentive Plan of NorthStar Realty Finance Corp. (incorporated by reference to Appendix A to NorthStar Realty Finance Corp.’s Definitive Proxy Statement on Schedule 14A filed April 19, 2013) |
| 10.11 |
| | Agreement of Purchase and Sale, dated as of June 12, 2013, by and between Project Shore JV I, LLC and Project Shore JV II, LLC, as Buyers, and Common Pensions Fund E, as Seller (incorporated by reference to Exhibit 10.36 to NorthStar Realty Finance Corp.’s Quarterly Report on Form 10-Q for the quarter ended June 30, 2013) |
| 10.12 |
| | Portfolio Acquisition Agreement and Interest Purchase and Sale Agreement dated as of March 14, 2014, by and among Seller (as defined therein) Eclipse Health Holdings-T, LLC, as Purchaser, Formation Capital Asset Management III LLC and Safanad, Inc., as Stakeholder Representatives and Madison Title Agency, LLC, as Escrow Agent (solely for the purposes of Sections 4(b), 11(l) and 34(c)) (incorporated by reference to Exhibit 10.1 to NorthStar Realty Finance Corp.’s Current Report on Form 8-K filed March 17, 2014) |
| 10.13 |
| | Limited Liability Company Agreement of Eclipse Investment, LLC, dated as of May 7, 2014, by and between FC Eclipse Investment, LLC and Eclipse Health Holdings-T, LLC (incorporated by reference to Exhibit A to the Portfolio Acquisition Agreement and Interest Purchase and Sale Agreement filed as Exhibit 10.1 to NorthStar Realty Finance Corp.’s Current Report on Form 8-K filed March 17, 2014) |
| 10.14 |
| | Separation Agreement, dated June 30, 2014, between NorthStar Asset Management Group Inc. and NorthStar Realty Finance Corp. (incorporated by reference to Exhibit 10.1 to NorthStar Realty Finance Corp.’s Current Report on Form 8-K filed on July 1, 2014) |
| 10.15 |
| | Asset Management Agreement dated June 30, 2014, between NSAM J-NRF Ltd and NorthStar Realty Finance Corp. (incorporated by reference to Exhibit 10.2 to NorthStar Realty Finance Corp.’s Current Report on Form 8-K filed on July 1, 2014) |
| 10.16 |
| | Loan Origination Services Agreement, dated June 30, 2014, between NSAM US LLC and NorthStar Realty Finance Corp. (incorporated by reference to Exhibit 10.3 to NorthStar Realty Finance Corp.’s Current Report on Form 8-K filed on July 1, 2014) |
| 10.17 |
| | Tax Disaffiliation Agreement, dated June 30, 2014, between NorthStar Asset Management Group Inc. and NorthStar Realty Finance Corp. (incorporated by reference to Exhibit 10.4 to NorthStar Realty Finance Corp.’s Current Report on Form 8-K filed on July 1, 2014) |
| 10.18 |
| | Employee Matters Agreement, dated June 30, 2014, between NorthStar Asset Management Group Inc. and NorthStar Realty Finance Corp. (incorporated by reference to Exhibit 10.5 to NorthStar Realty Finance Corp.’s Current Report on Form 8-K filed on July 1, 2014) |
| 10.19 |
| | Contribution Agreement, dated June 30, 2014, between NorthStar Asset Management Group Inc. and NRFC Sub-REIT Corp. (renamed NorthStar Realty Finance Corp.) (incorporated by reference to Exhibit 10.6 to NorthStar Realty Finance Corp.’s Current Report on Form 8-K filed on July 1, 2014) |
| 10.20 |
| | Credit Agreement, dated June 30, 2014, between NorthStar Asset Management Group Inc. and NorthStar Realty Finance Corp. (incorporated by reference to Exhibit 10.7 to NorthStar Realty Finance Corp.’s Current Report on Form 8-K filed on July 1, 2014) |
| 10.21 |
| | Credit and Guaranty Agreement, dated as of August 5, 2014, by and among NorthStar Realty Finance Corp., as borrower, certain subsidiaries of NorthStar Realty Finance Corp., as guarantors, the various lenders party thereto from time to time, Deutsche Bank AG New York Branch, as administrative agent and collateral agent, and Deutsche Bank Securities Inc., as sole lead arranger and sole bookrunner (incorporated by reference to Exhibit 10.1 to NorthStar Realty Finance Corp.’s Current Report on Form 8-K filed on August 6, 2014) |
| 10.22 |
| | Debt Commitment Letter, dated as of August 5, 2014, by and among NorthStar Realty Finance Corp., Citigroup Global Markets Inc., JPMorgan Chase Bank, National Association, Barclays Bank plc, and Column Financial, Inc. (incorporated by reference to Exhibit 10.1 to NorthStar Realty Finance Corp.’s Current Report on Form 8-K filed on August 5, 2014) |
| 10.23 |
| | Confirmation of Registered Forward Transaction, dated September 3, 2014, by and among NorthStar Realty Finance Corp., Deutsche Bank Securities Inc. and Deutsche Bank AG, London Branch, including the First Amendment thereto dated September 4, 2014(incorporated by reference to Exhibit 10.1 to NorthStar Realty Finance Corp.’s Current Report on Form 8-K filed on September 9, 2014) |
| 10.24 |
| | Asset Purchase Agreement, dated as of September 17, 2014, by and among Inland American Real Estate Trust, Inc., as Parent, IHP I Owner JV, LLC, as Buyer I, IHP West Homestead (PA) Owner LLC, as Buyer II, and NorthStar Realty Finance Corp., as Buyer Parent (solely for the purposes of Article V, Section 10.11 and Article X as it relates to Article V and Section 10.11) (incorporated by reference to Exhibit 10.1 to NorthStar Realty Finance Corp.’s Current Report on Form 8-K filed on September 23, 2014) |
| 10.25 |
| | Facility Agreement, dated as of September 26, 2014, by and between NorthStar Realty Finance Corp., and UBS AG, Stamford Branch (incorporated by reference to Exhibit 10.1 to NorthStar Realty Finance Corp.’s Current Report on Form 8-K filed on September 29, 2014) |
| 10.26 |
| | Credit Agreement, dated as of September 26, 2014, by and among NorthStar Realty Finance Corp., as borrower, the various lenders party thereto from time to time, and UBS AG, Stamford Branch, as administrative agent (incorporated by reference to Exhibit 10.2 to NorthStar Realty Finance Corp.’s Current Report on Form 8-K filed on September 29, 2014) |
| 10.27 |
| | Loan Agreement dated as of December 3, 2014, among the Borrowers party thereto, as borrowers, and Citigroup Global Markets Realty Corp., JPMorgan Chase Bank, National Association, Barclays Bank PLC and Column Financial, Inc., as lenders (incorporated by reference to Exhibit 10.1 to NorthStar Realty Finance Corp.’s Current Report on Form 8-K filed on December 9, 2014) |
| 10.28 |
| | Facility Agreement, dated as of December 3, 2014, among GA HC REIT II CH U.K. Senior Housing Portfolio Limited (as Original Borrower upon its accession in accordance with the terms thereof), the Original Borrower and certain of its subsidiaries (as Original Guarantors upon their accession in accordance with the terms thereof), NorthStar Realty Healthcare, LLC (as Indemnitor) and arranged by Credit Suisse AG, London Branch (as Mandated Lead Arranger and Original Lender), with Elavon Financial Services Limited as Agent, and U.S. Bank Trustees Limited as Security Agent (incorporated by reference to Exhibit 10.2 to NorthStar Realty Finance Corp.’s Current Report on Form 8-K filed on December 9, 2014) |
| 10.29 |
| | Mezzanine A Loan Agreement dated as of December 3, 2014, among HC Mezz 1-T, LLC, Glenwood Owner MB1-T, LLC, Glenwood Ops MB2-T, LLC, MA Owner MB1-T, LLC, MA Ops MB2-T, LLC, CCRC Owner MB1-T, LLC and CCRC Ops MB2-T, LLC, as borrowers, and Citigroup Global Markets Realty Corp., JPMorgan Chase Bank, National Association, Barclays Bank PLC and Column Financial, Inc., as lenders (incorporated by reference to Exhibit 10.3 to NorthStar Realty Finance Corp.’s Current Report on Form 8-K filed on December 9, 2014) |
|
| | | |
| 10.30 |
| | Mezzanine B Loan Agreement dated as of December 3, 2014, among HC Mezz 2-T, LLC, Glenwood Owner MB2-T, LLC, Glenwood Ops MB3-T, LLC, MA Owner MB2-T, LLC, MA Ops MB3-T, LLC, CCRC Owner MB2-T, LLC and CCRC Ops MB3-T, LLC, as borrowers, and Citigroup Global Markets Realty Corp., JPMorgan Chase Bank, National Association, Barclays Bank PLC and Column Financial, Inc., as lenders (incorporated by reference to Exhibit 10.4 to NorthStar Realty Finance Corp.’s Current Report on Form 8-K filed on December 9, 2014) |
| 10.31 |
| | Mezzanine C Loan Agreement dated as of December 3, 2014, among HC Mezz 3-T, LLC, Glenwood Owner MB3-T, LLC, Glenwood Ops MB4-T, LLC, MA Owner MB3-T, LLC, MA Ops MB4-T, LLC, CCRC Owner MB3-T, LLC and CCRC Ops MB4-T, LLC, as borrowers, and Citigroup Global Markets Realty Corp., JPMorgan Chase Bank, National Association, Barclays Bank PLC and Column Financial, Inc., as lenders (incorporated by reference to Exhibit 10.5 to NorthStar Realty Finance Corp.’s Current Report on Form 8-K filed on December 9, 2014) |
| 10.32 |
| * | Umbrella Agreement, dated December 22, 2014, by and among Prime Holdco C-T, S.à r.l., Prime GER Drehbahn - T S.à r.l., Prime GER Valentinskamp - T S.à r.l. and Trias Pool II A - T S.à r.l., as Buyers, and SEB Investment GmbH (“SEB”), SEB Investment GmbH, Filiale di Milano, SEB Investment GmbH, French Branch SEB Investment GmbH, Altair Issy S.A.S. and Balni bvba (SPRL), as Sellers |
| 10.33 |
| | Umbrella Sale and Purchase Agreement, dated as of February 16, 2015, between SEB Investment GmbH, SEB Investment GmbH, Filiale di Milano, SEB Investment GmbH, French Branch SEB Investment GmbH, Altair Issy S.A.S. and Balni bvba (SPRL), collectively as the Sellers, and certain subsidiaries of the Company listed therein, as Buyers (incorporated by reference to Exhibit 10.1 to NorthStar Realty Finance Corp.’s Current Report on Form 8-K filed on February 20, 2015) |
| 12.1 |
| * | Ratio of Earnings to Combined Fixed Charges and Preferred Stock Dividends |
| 21.1 |
| * | Significant Subsidiaries of the Registrant |
| 23.1 |
| * | Consent of Grant Thornton LLP |
| 24.1 |
| * | Power of Attorney (see the Power of Attorney in the signature page hereto) |
| 31.1 |
| * | Certification by the Chief Executive Officer pursuant to 17 CFR 240.13a-14(a)/15(d)-14(a), as adopted pursuant to Section 302 of the Sarbanes-Oxley Act of 2002 |
| 31.2 |
| * | Certification by the Chief Financial Officer pursuant to 17 CFR 240.13a-14(a)/15(d)-14(a), as adopted pursuant to Section 302 of the Sarbanes-Oxley Act of 2002 |
| 32.1 |
| * | Certification by the Chief Executive Officer pursuant to Rule 13a-14(b) under the Securities Exchange Act of 1934 and 18 U.S.C. Section 1350, as adopted pursuant to Section 906 of the Sarbanes-Oxley Act of 2002 |
| 32.2 |
| * | Certification by the Chief Financial Officer pursuant to Rule 13a-14(b) under the Securities Exchange Act of 1934 and 18 U.S.C. Section 1350, as adopted pursuant to Section 906 of the Sarbanes-Oxley Act of 2002 |
|
| | | |
Exhibit Number | | Description of Exhibit |
| 101 |
| * | The following materials from the NorthStar Realty Finance Corp. Annual Report on Form 10-K for the year ended December 31, 2014, formatted in XBRL (eXtensible Business Reporting Language): (i) Consolidated Balance Sheets as of December 31, 2014 and December 31, 2013; (ii) Consolidated Statements of Operations for the years ended December 31, 2014, 2013 and 2012; (iii) Consolidated Statements of Comprehensive Income (Loss) for the years ended December 31, 2014, 2013 and 2012; (iv) Consolidated Statements of Equity for the years ended December 31, 2014, 2013 and 2012; (v) Consolidated Statements of Cash Flows for the years ended December 31, 2014, 2013 and 2012; and (vi) Notes to Consolidated Financial Statements |
____________________________________________________________
* Filed herewith.
+ Denotes management contract or compensatory plan or arrangement required to be filed as an exhibit hereto.
SIGNATURES
Pursuant to the requirements of the Securities Exchange Act of 1934, the Registrant has duly caused this report to be signed on its behalf by the undersigned thereunto duly authorized.
|
| | | | | |
| | | | NorthStar Realty Finance Corp. |
| Date: | March 2, 2015 | | By: | | |
| | | | | | Name: David T. Hamamoto |
| | | | | | Title: Chairman and Chief Executive Officer |
POWER OF ATTORNEY
KNOW ALL PERSONS BY THESE PRESENTS, that each person whose signature appears below constitutes and appoints Debra A. Hess and Ronald Lieberman and each of them severally, her or his true and lawful attorney-in-fact with power of substitution and re-substitution to sign in her or his name, place and stead, in any and all capacities, to do any and all things and execute any and all instruments that such attorney may deem necessary or advisable under the Securities Exchange Act of 1934 and any rules, regulations and requirements of the U.S. Securities and Exchange Commission in connection with this Annual Report on Form 10-K and any and all amendments hereto, as fully for all intents and purposes as she or he might or could do in person, and hereby ratifies and confirms all said attorneys-in-fact and agents, each acting alone, and her or his substitute or substitutes, may lawfully do or cause to be done by virtue hereof. Pursuant to the requirements of Section 13 or 15(d) of the Securities Exchange Act of 1934, this report has been signed below on behalf of the Registrant in the capacities and on the dates indicated.
|
| | | | |
| Signature | | Title | | Date |
| /s/ DAVID T. HAMAMOTO | | Chairman and Chief Executive Officer | | March 2, 2015 |
| David T. Hamamoto | | (Principal Executive Officer) | | |
| | | | | |
| /s/ DEBRA A. HESS | | Chief Financial Officer | | March 2, 2015 |
| Debra A. Hess | | (Principal Financial Officer and Principal Accounting Officer) | | |
| | | | | |
| /s/ JUDITH A. HANNAWAY | | Director | | March 2, 2015 |
| Judith A. Hannaway | | | | |
| | | | | |
| /s/ WESLEY D. MINAMI | | Director | | March 2, 2015 |
| Wesley D. Minami | | | | |
| | | | | |
| /s/ LOUIS J. PAGLIA | | Director | | March 2, 2015 |
| Louis J. Paglia | | | | |
| | | | | |
| /s/ CHARLES W. SCHOENHERR | | Director | | March 2, 2015 |
| Charles W. Schoenherr | | | | |
| | | | | |