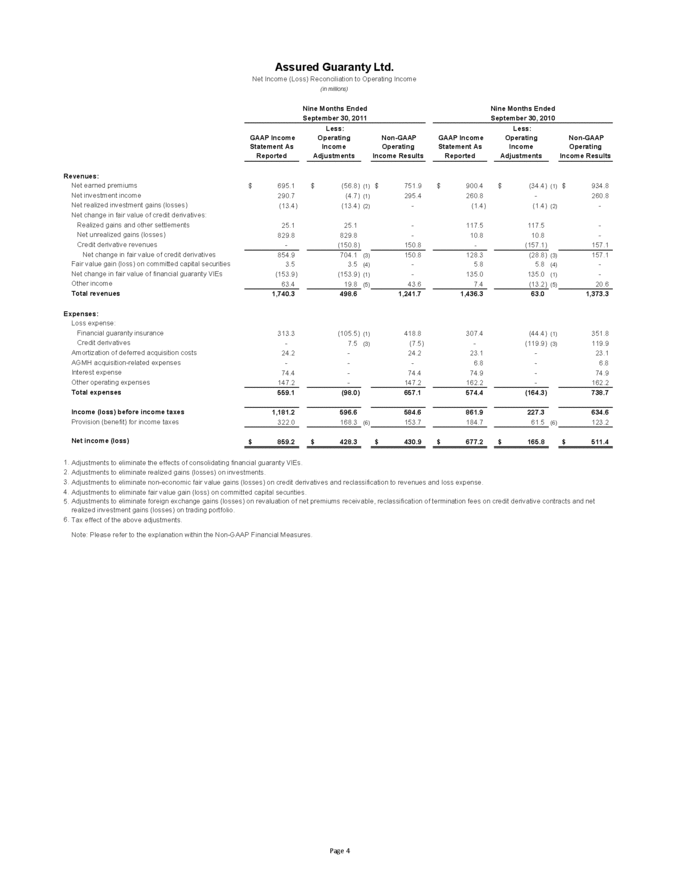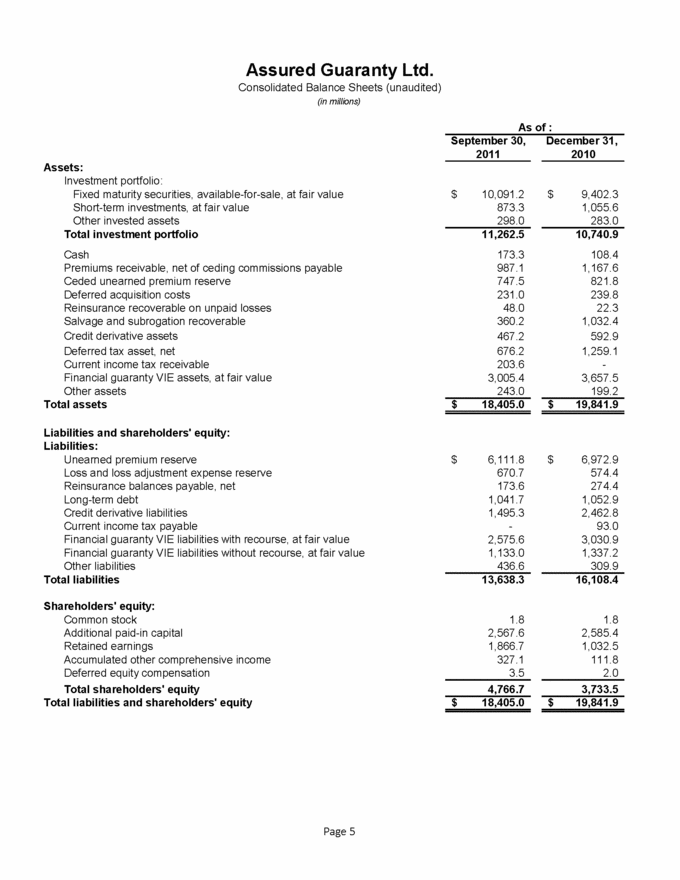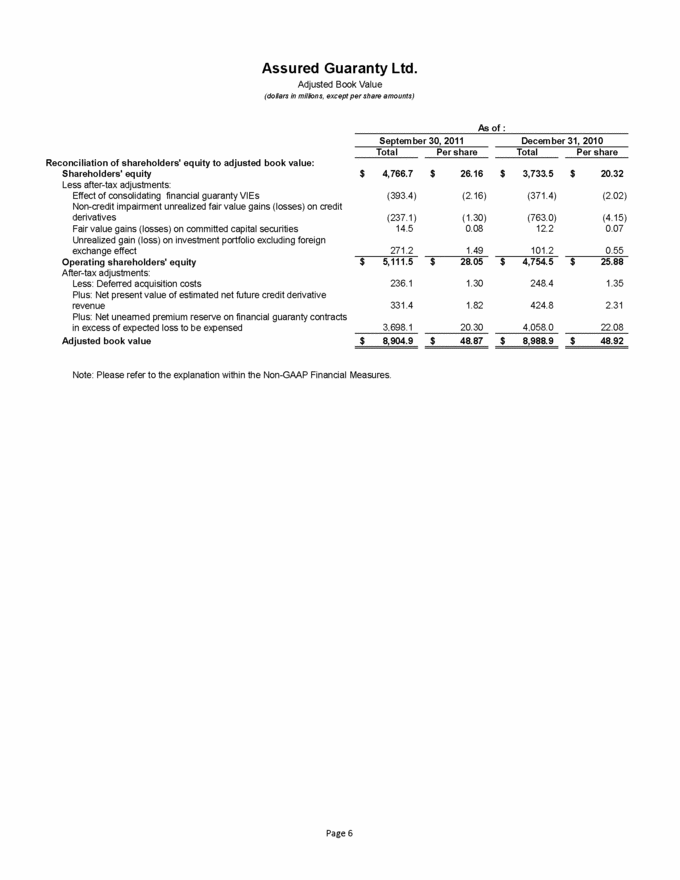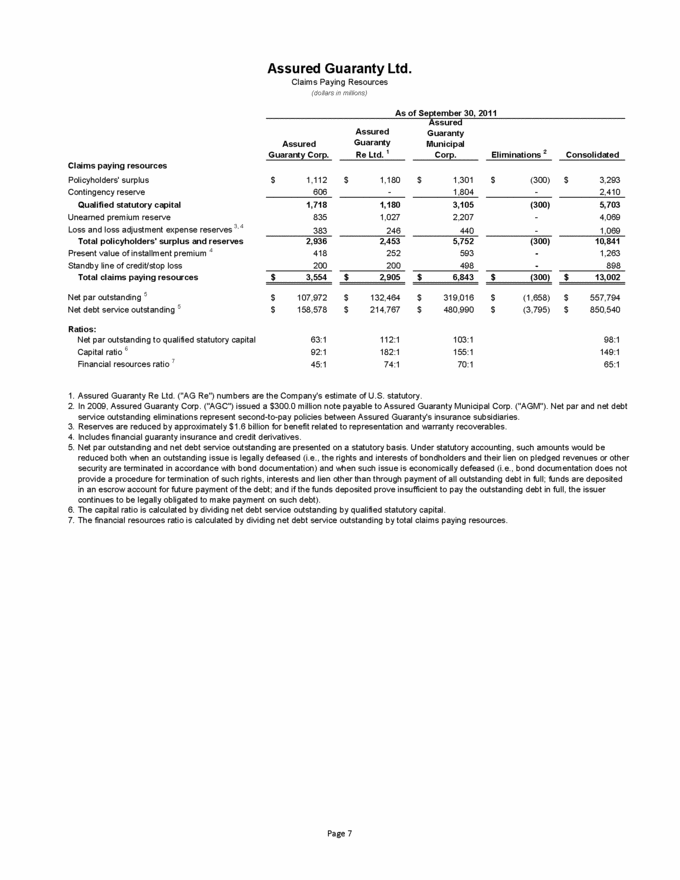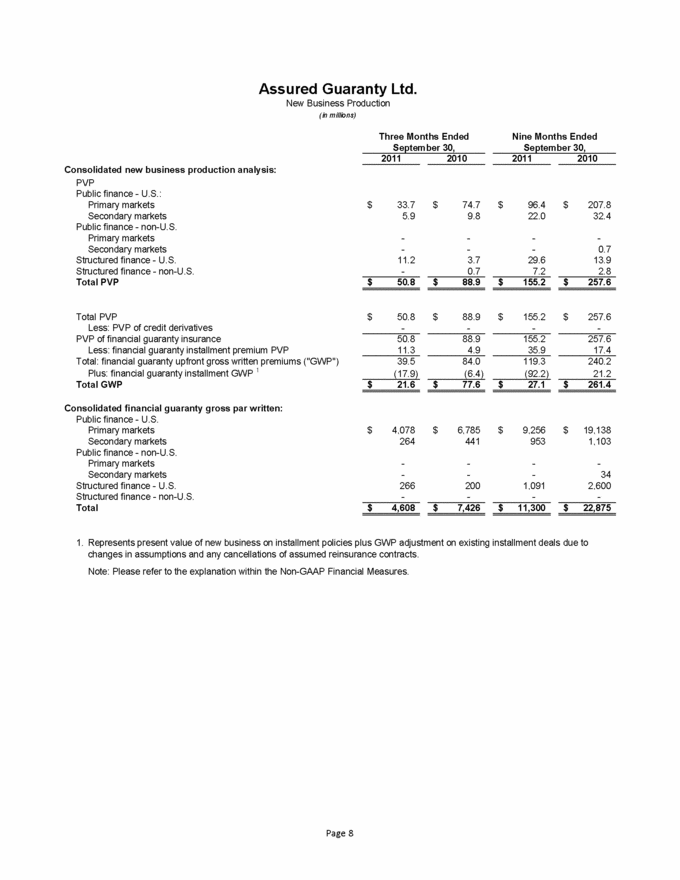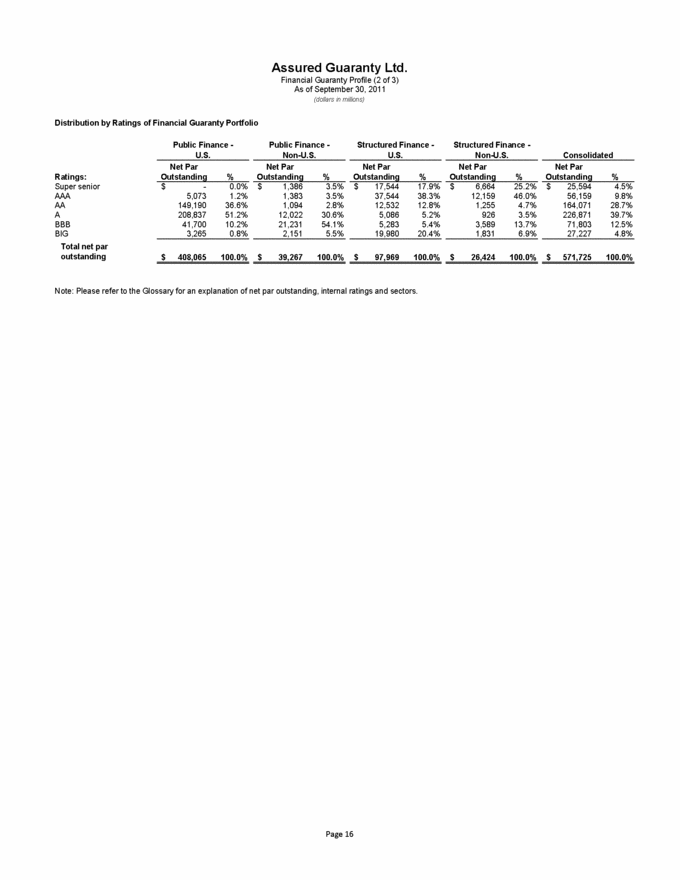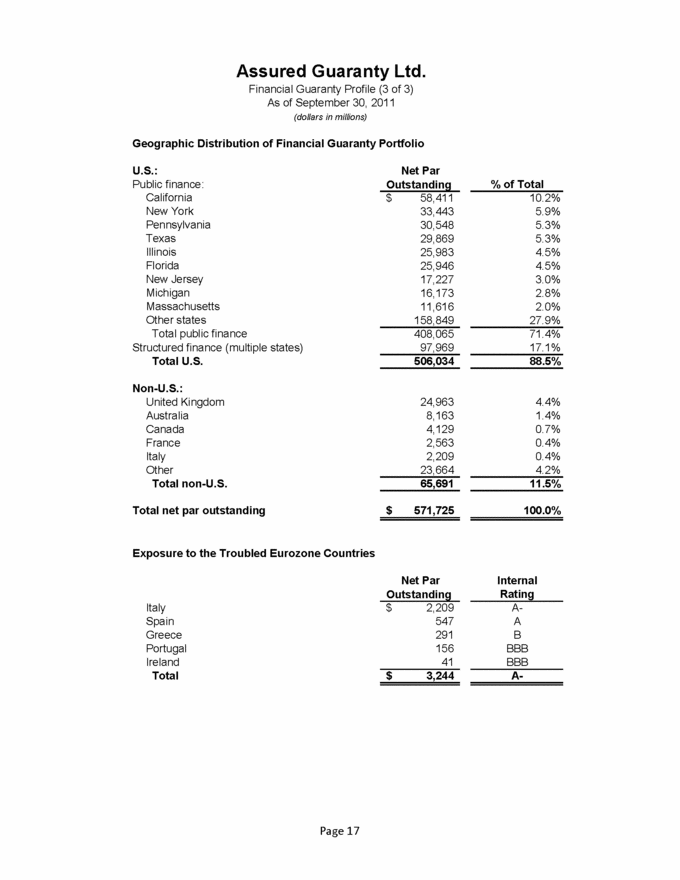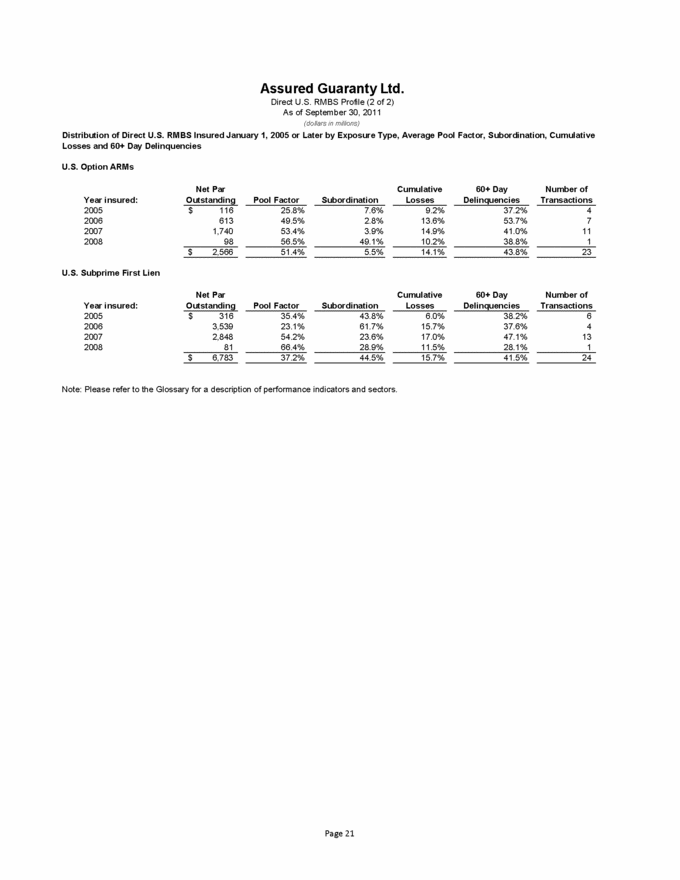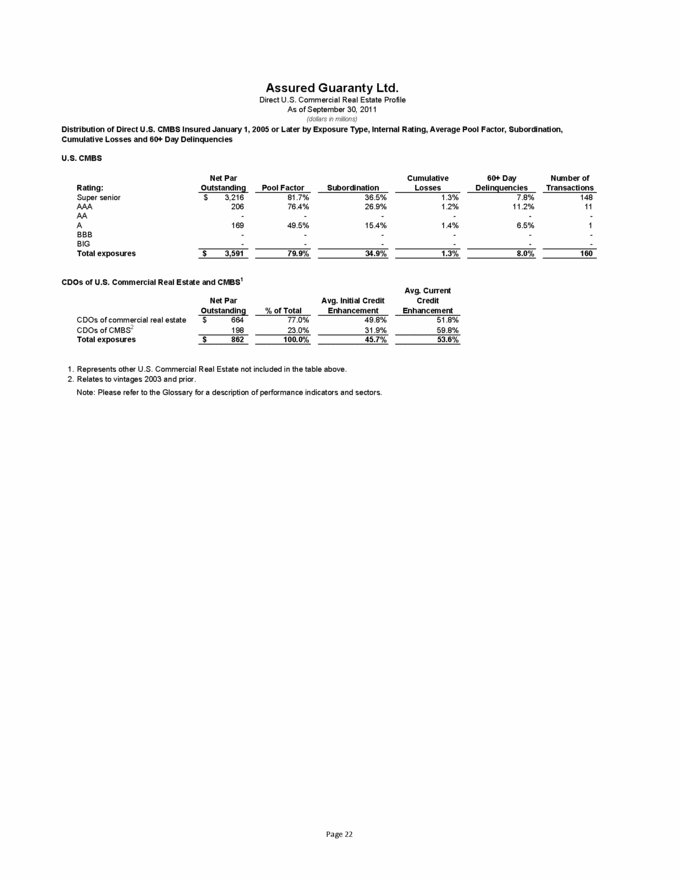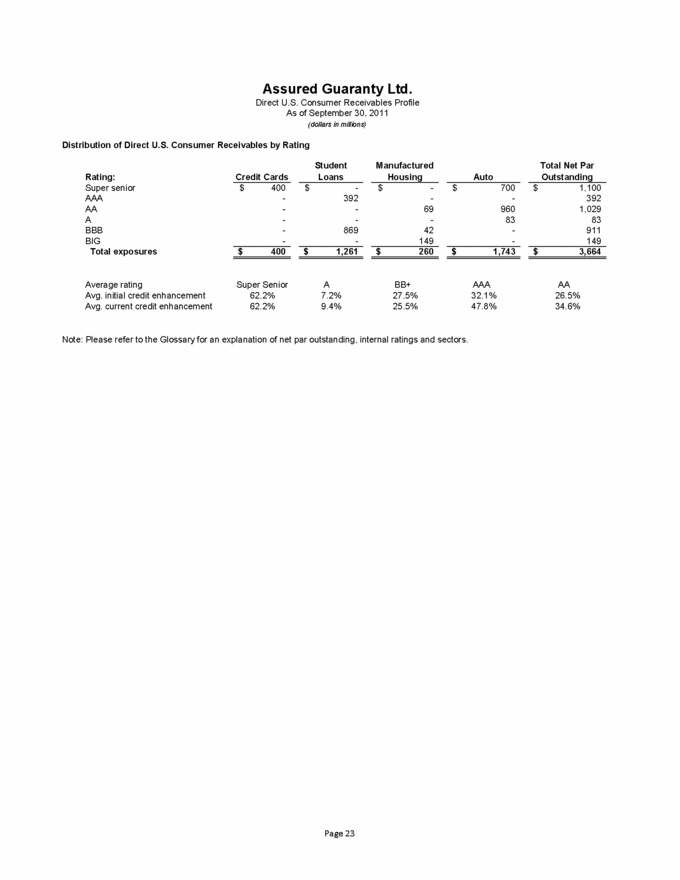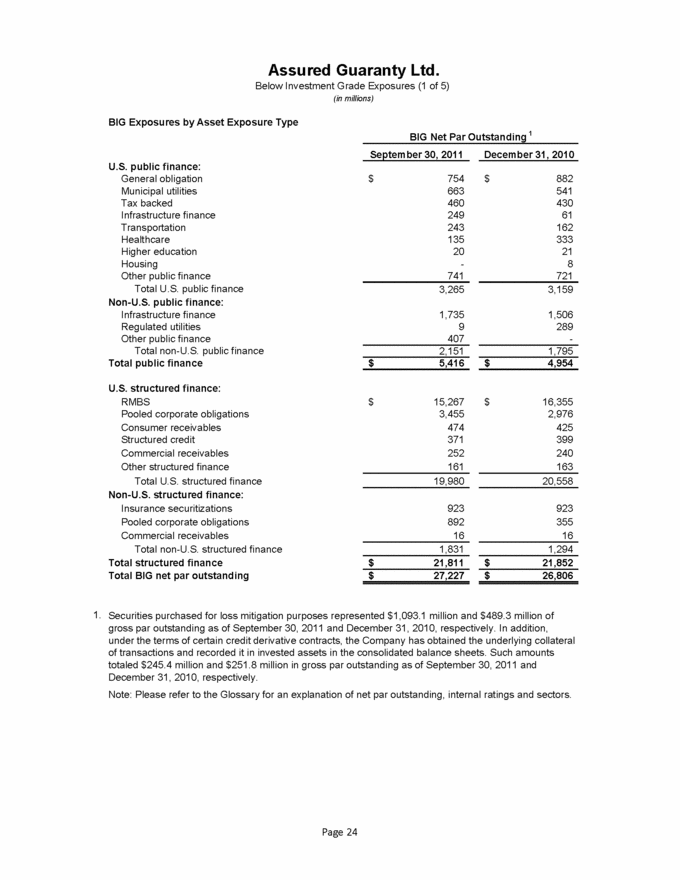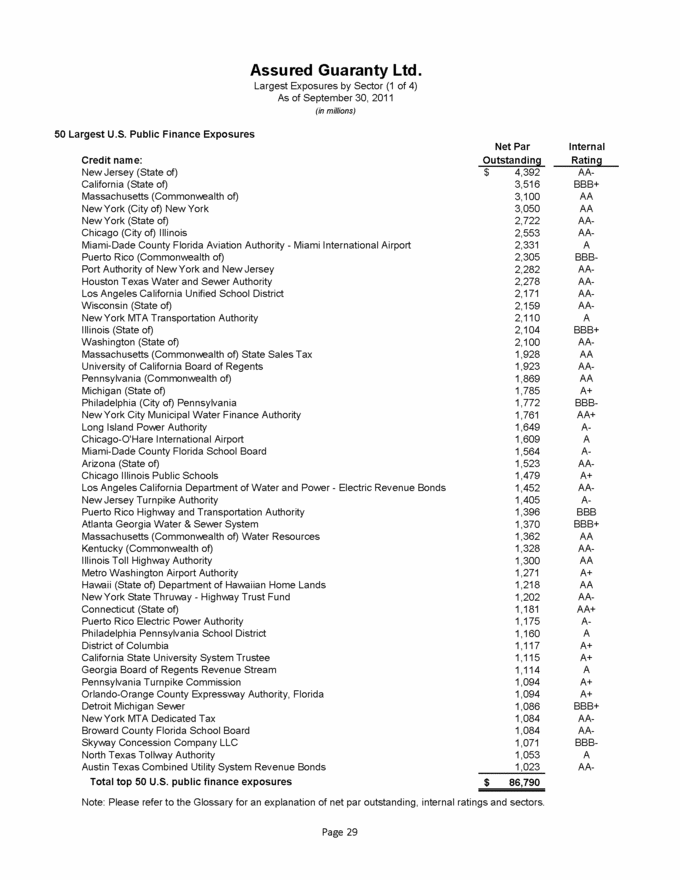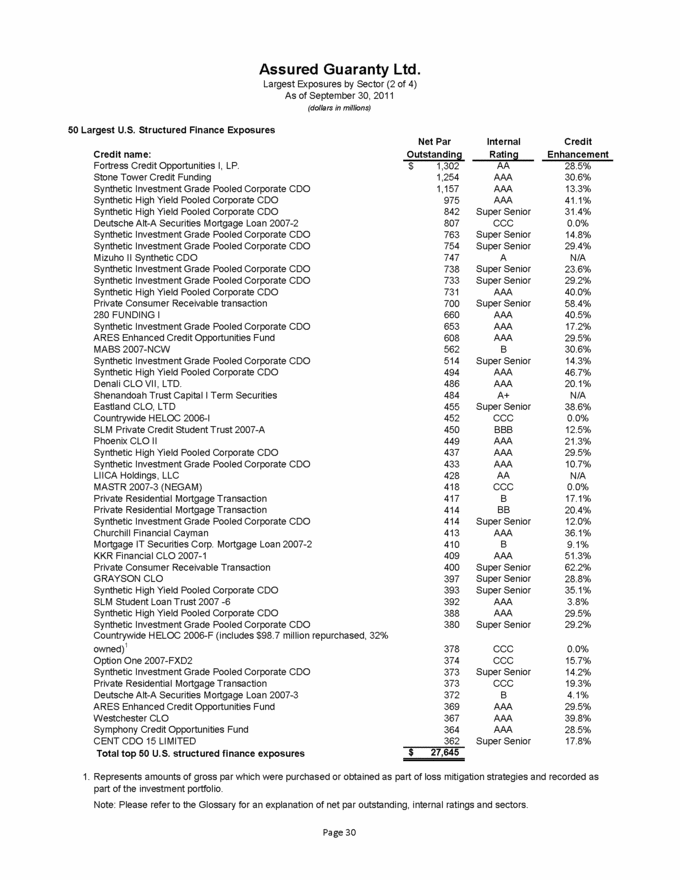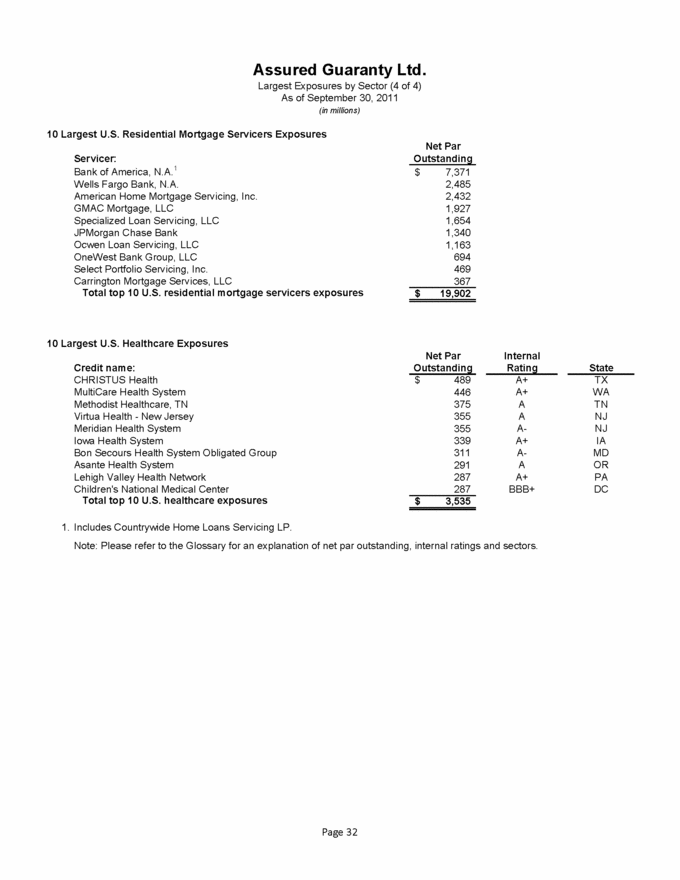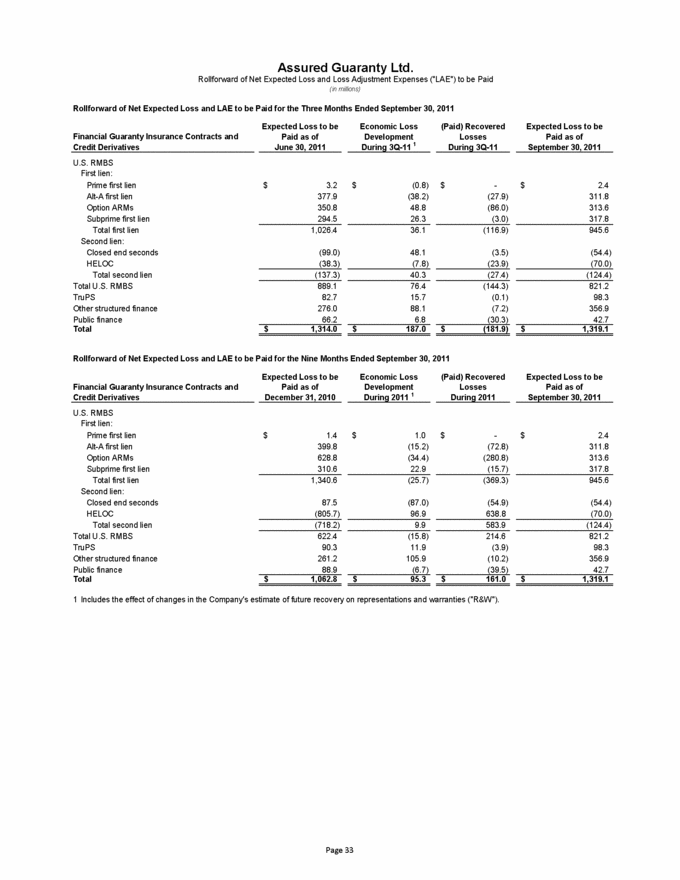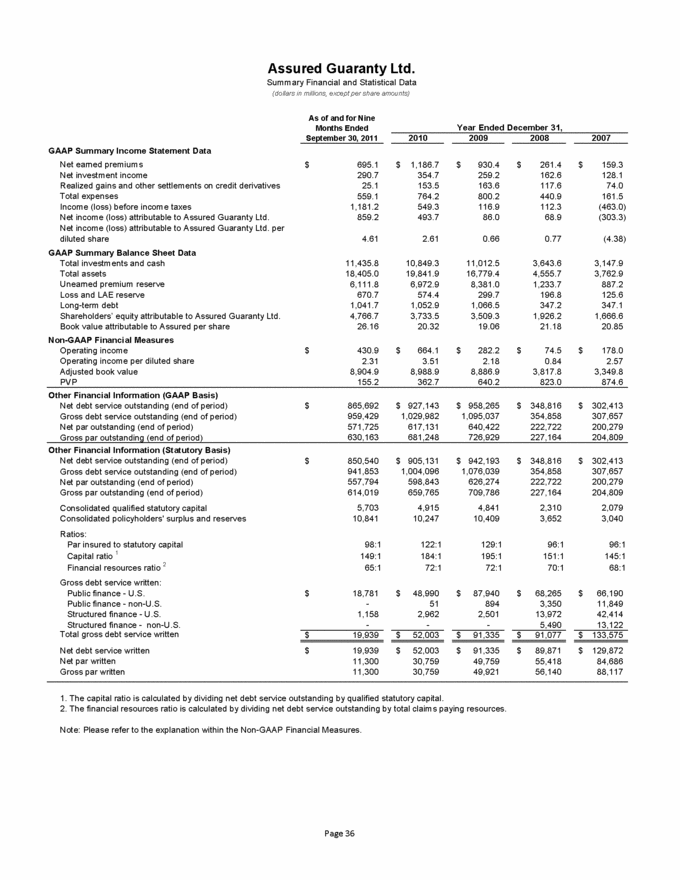
| 2010 2009 2008 2007 GAAP Summary Income Statement Data Net earned premiums 695.1 $ 1,186.7 $ 930.4 $ 261.4 $ 159.3 $ Net investment income 290.7 354.7 259.2 162.6 128.1 Realized gains and other settlements on credit derivatives 25.1 153.5 163.6 117.6 74.0 Total expenses 559.1 764.2 800.2 440.9 161.5 Income (loss) before income taxes 1,181.2 549.3 116.9 112.3 (463.0) Net income (loss) attributable to Assured Guaranty Ltd. 859.2 493.7 86.0 68.9 (303.3) Net income (loss) attributable to Assured Guaranty Ltd. per diluted share 4.61 2.61 0.66 0.77 (4.38) GAAP Summary Balance Sheet Data Total investments and cash 11,435.8 10,849.3 11,012.5 3,643.6 3,147.9 Total assets 18,405.0 19,841.9 16,779.4 4,555.7 3,762.9 Unearned premium reserve 6,111.8 6,972.9 8,381.0 1,233.7 887.2 Loss and LAE reserve 670.7 574.4 299.7 196.8 125.6 Long-term debt 1,041.7 1,052.9 1,066.5 347.2 347.1 Shareholders’ equity attributable to Assured Guaranty Ltd. 4,766.7 3,733.5 3,509.3 1,926.2 1,666.6 Book value attributable to Assured per share 26.16 20.32 19.06 21.18 20.85 Non-GAAP Financial Measures Operating income 430.9 $ 664.1 $ 282.2 $ 74.5 $ 178.0 $ Operating income per diluted share 2.31 3.51 2.18 0.84 2.57 Adjusted book value 8,904.9 8,988.9 8,886.9 3,817.8 3,349.8 PVP 155.2 362.7 640.2 823.0 874.6 Other Financial Information (GAAP Basis) Net debt service outstanding (end of period) 865,692 $ 927,143 $ 958,265 $ 348,816 $ 302,413 $ Gross debt service outstanding (end of period) 959,429 1,029,982 1,095,037 354,858 307,657 Net par outstanding (end of period) 571,725 617,131 640,422 222,722 200,279 Gross par outstanding (end of period) 630,163 681,248 726,929 227,164 204,809 Other Financial Information (Statutory Basis) Net debt service outstanding (end of period) 850,540 $ 905,131 $ 942,193 $ 348,816 $ 302,413 $ Gross debt service outstanding (end of period) 941,853 1,004,096 1,076,039 354,858 307,657 Net par outstanding (end of period) 557,794 598,843 626,274 222,722 200,279 Gross par outstanding (end of period) 614,019 659,765 709,786 227,164 204,809 Consolidated qualified statutory capital 5,703 4,915 4,841 2,310 2,079 Consolidated policyholders' surplus and reserves 10,841 10,247 10,409 3,652 3,040 Ratios: Par insured to statutory capital 98:1 122:1 129:1 96:1 96:1 Capital ratio 1 149:1 184:1 195:1 151:1 145:1 Financial resources ratio 2 65:1 72:1 72:1 70:1 68:1 Gross debt service written: Public finance - U.S. 18,781 $ 48,990 $ 87,940 $ 68,265 $ 66,190 $ Public finance - non-U.S. - 51 894 3,350 11,849 Structured finance - U.S. 1,158 2,962 2,501 13,972 42,414 Structured finance - non-U.S. - - - 5,490 13,122 Total gross debt service written 19,939 $ 52,003 $ 91,335 $ 91,077 $ 133,575 $ Net debt service written 19,939 $ 52,003 $ 91,335 $ 89,871 $ 129,872 $ Net par written 11,300 30,759 49,759 55,418 84,686 Gross par written 11,300 30,759 49,921 56,140 88,117 1. The capital ratio is calculated by dividing net debt service outstanding by qualified statutory capital. Note: Please refer to the explanation within the Non-GAAP Financial Measures. Assured Guaranty Ltd. Summary Financial and Statistical Data (dollars in millions, except per share amounts) 2. The financial resources ratio is calculated by dividing net debt service outstanding by total claims paying resources. Year Ended December 31, As of and for Nine Months Ended September 30, 2011 Page 36 |
