0001273813us-gaap:FairValueInputsLevel3Memberus-gaap:IncomeApproachValuationTechniqueMembersrt:WeightedAverageMemberus-gaap:USStatesAndPoliticalSubdivisionsMember2023-01-012023-12-31
UNITED STATES SECURITIES AND EXCHANGE COMMISSION
Washington, D.C. 20549
____________________________________________________________________________
FORM 10-K | | | | | | | | |
| ☒ | | ANNUAL REPORT UNDER SECTION 13 OR 15(d) OF THE SECURITIES EXCHANGE ACT OF 1934 |
For the fiscal year ended December 31, 2024
Or
| | | | | | | | |
| ☐ | | TRANSITION REPORT PURSUANT TO SECTION 13 OR 15(d) OF THE SECURITIES EXCHANGE ACT OF 1934 |
For the transition period from to
Commission File Number 001-32141
ASSURED GUARANTY LTD.
(Exact name of Registrant as specified in its charter) | | | | | | | | |
| Bermuda | | 98-0429991 |
| (State or other jurisdiction of incorporation) | | (I.R.S. employer identification no.) |
30 Woodbourne Avenue Hamilton HM 08 Bermuda (441) 279-5700
(Address, including zip code, and telephone number, including area code, of Registrant’s principal executive office)
Securities registered pursuant to Section 12(b) of the Act: | | | | | | | | | | | |
| Title of each class: | Trading Symbol(s) | Name of exchange on
which registered |
| Common Shares | $0.01 par value per share | AGO | New York Stock Exchange |
| Assured Guaranty US Holdings Inc. 6.125% Senior Notes due 2028 (and the related guarantee of Registrant) | AGO/28 | New York Stock Exchange |
| Assured Guaranty US Holdings Inc. 3.150% Senior Notes due 2031 (and the related guarantee of Registrant) | AGO/31 | New York Stock Exchange |
| Assured Guaranty US Holdings Inc. 3.600% Senior Notes due 2051 (and the related guarantee of Registrant) | AGO/51 | New York Stock Exchange |
Securities registered pursuant to Section 12(g) of the Act: None
Indicate by check mark if the Registrant is a well-known seasoned issuer, as defined in Rule 405 of the Securities Act. Yes ý No o
Indicate by check mark if the Registrant is not required to file reports pursuant to Section 13 or Section 15(d) of the Act. Yes o No ý
Indicate by check mark whether the Registrant: (1) has filed all reports required to be filed by Section 13 or 15(d) of the Securities Exchange Act of 1934 during the preceding 12 months (or for such shorter period that the Registrant was required to file such reports), and (2) has been subject to such filing requirements for the past 90 days. Yes ý No o
Indicate by check mark whether the Registrant has submitted electronically every Interactive Data File required to be submitted pursuant to Rule 405 of Regulation S-T during the preceding 12 months (or for such shorter period that the Registrant was required to submit such files). Yes ý No o
Indicate by check mark whether the Registrant is a large accelerated filer, an accelerated filer, a non-accelerated filer, a smaller reporting company, or an emerging growth company. See definition of “large accelerated filer”, “accelerated filer”, “smaller reporting company”, and “emerging growth company” in Rule 12b-2 of the Exchange Act.
| | | | | | | | | | | | | | | | | | | | | | | | | | | | | |
| Large accelerated filer | ☒ | Accelerated filer | ☐ | Non-accelerated filer | ☐ | Smaller reporting company | ☐ | Emerging growth company | ☐ |
If an emerging growth company, indicate by check mark if the Registrant has elected not to use the extended transition period for complying with any new or revised financial accounting standards provided pursuant to Section 13(a) of the Exchange Act. oIndicate by check mark whether the Registrant has filed a report on and attestation to its management’s assessment of the effectiveness of its internal control over financial reporting under Section 404(b) of the Sarbanes-Oxley Act (15 U.S.C. 7262(b)) by the registered public accounting firm that prepared or issued its audit report. x
If securities are registered pursuant to Section 12(b) of the Act, indicate by check mark whether the financial statements of the Registrant included in the filing reflect the correction of an error to previously issued financial statements. o
Indicate by check mark whether any of those error corrections are restatements that required a recovery analysis of incentive-based compensation received by any of the Registrant’s executive officers during the relevant recovery period pursuant to §240.10D-1(b). o
Indicate by check mark whether the Registrant is a shell company (as defined in Rule 12b-2 of the Exchange Act). Yes ☐ No ý
The aggregate market value of Common Shares held by non-affiliates of the Registrant as of the close of business on June 30, 2024 was $3,903,669,901 (based upon the closing price of the Registrant's shares on the New York Stock Exchange on that date, which was $77.15). For purposes of this information, the outstanding Common Shares which were owned by all directors and executive officers of the Registrant were deemed to be the only shares of Common Shares held by affiliates.
As of February 26, 2025, 50,103,140 Common Shares, par value $0.01 per share, were outstanding (including 21,413 unvested restricted shares).
DOCUMENTS INCORPORATED BY REFERENCE
Certain portions of Registrant’s definitive proxy statement relating to its 2025 Annual General Meeting of Shareholders to be held on May 2, 2025, are incorporated by reference to Part III of this report.
Forward Looking Statements
This Form 10-K contains information that includes or is based upon forward looking statements within the meaning of the Private Securities Litigation Reform Act of 1995. Forward looking statements give the expectations or forecasts of future events of Assured Guaranty Ltd. (AGL) and its subsidiaries (collectively with AGL, Assured Guaranty or the Company). These statements can be identified by the fact that they do not relate strictly to historical or current facts and relate to future operating or financial performance.
Any or all of Assured Guaranty’s forward looking statements herein are based on current expectations and the current economic environment and may turn out to be incorrect. Assured Guaranty’s actual results may vary materially from those expressed in, or implied or projected by, the forward-looking information and statements. Among factors that could cause actual results to differ materially are:
(i) significant changes in inflation, interest rates, the world’s credit markets or segments thereof, credit spreads, foreign exchange rates or general economic conditions, including the possibility of a recession or stagflation; (ii) geopolitical risk, terrorism and political violence risk, including those arising out of Russia’s invasion of Ukraine and intentional or accidental escalation between The North Atlantic Treaty Organization (NATO) and Russia, conflict in the Middle East and confrontation over Iran’s nuclear program, the polarized political environment in the United States (U.S.), and U.S. – China strategic competition; (iii) cybersecurity risk and the impacts of artificial intelligence, machine learning and other technological advances, including potentially increasing the risks of malicious cyber attacks, dissemination of misinformation, and disruption of markets, including the markets in which the Company participates; (iv) the possibility of a U.S. government shutdown, payment defaults on the debt of the U.S. government or instruments issued, insured or guaranteed by related institutions, agencies or instrumentalities, and downgrades to their credit ratings; (v) developments in the world’s financial and capital markets, including stresses in the financial condition of banking institutions in the U.S. and the possibility that increasing participation of unregulated financial institutions in these markets results in losses or lower valuations of assets, reduced liquidity and credit and/or contraction of these markets, that adversely affect repayment rates of insured obligors, Assured Guaranty’s insurance loss or recovery experience, or investments of Assured Guaranty; (vi) reduction in the amount of available insurance opportunities and/or in the demand for Assured Guaranty’s insurance; (vii) the possibility that budget or pension shortfalls, difficulties in obtaining additional financing or other factors will result in credit losses or liquidity claims on obligations of state, territorial and local governments, their related authorities, public corporations and other obligors that Assured Guaranty insures or reinsures; (viii) insured losses, including losses with respect to related legal proceedings, in excess of those expected by Assured Guaranty or the failure of Assured Guaranty to realize loss recoveries that are assumed in its expected loss estimates for insurance exposures, including below-investment-grade (BIG) healthcare, U.K. regulated utilities, European renewable energy, and Puerto Rico Electric Power Authority (PREPA) exposures; (ix) the impact of Assured Guaranty satisfying its obligations under insurance policies with respect to legacy insured Puerto Rico bonds; (x) the possibility that underwriting insurance in new jurisdictions and/or covering new sectors or classes of business does not result in the benefits anticipated or subjects Assured Guaranty to negative consequences; (xi) increased competition, including from new entrants into the financial guaranty industry, nonpayment insurance and other forms of capital saving or risk syndication available to banks and insurers; (xii) the possibility that investments made by Assured Guaranty for its investment portfolio, including alternative investments, do not result in the benefits anticipated or subject Assured Guaranty to reduced liquidity at a time it requires liquidity, or to other negative or unanticipated consequences; (xiii) the impacts of Assured Guaranty’s transaction with Sound Point Capital Management, LP (Sound Point, LP) and certain of its investment management affiliates (together with Sound Point, LP, Sound Point) on Assured Guaranty and its relationships with its shareholders, regulators, rating agencies and the obligors it insures and on Assured Guaranty’s Asset Management segment results; (xiv) the possibility that mergers, acquisitions, divestitures and other strategic transactions made by Assured Guaranty, including the transactions with Sound Point and/or Assured Healthcare Partners LLC (AHP) and/or merger of Assured Guaranty Municipal Corp. (AGM) with and into Assured Guaranty Inc. (AG, formerly Assured Guaranty Corp.), do not result in the benefits anticipated or subject Assured Guaranty to negative consequences; (xv) the inability to control the business, management or policies of entities in which Assured Guaranty holds a minority interest; (xvi) the impact of market volatility on the fair value of Assured Guaranty’s assets and liabilities subject to mark-to-market, including certain of its investments, contracts accounted for as derivatives, its committed capital securities, its consolidated investment vehicles (CIVs) and consolidated variable interest entities (VIEs); (xvii) rating agency action, including a ratings downgrade, a change in outlook, the placement of ratings on watch for downgrade, or a change in rating criteria, at any time, of AGL or any of its insurance subsidiaries, and/or of any securities AGL or any of its subsidiaries have issued, and/or of transactions that AGL’s insurance subsidiaries have insured; (xviii) the inability of Assured Guaranty to access external sources of capital on acceptable terms; (xix) changes in applicable accounting policies or practices; (xx) changes in applicable laws or regulations, including insurance, bankruptcy and tax laws, or other governmental actions; (xxi) the possibility that legal or regulatory decisions or determinations subject Assured Guaranty or obligations that it insures or reinsures to negative consequences; (xxii) difficulties with the execution of Assured Guaranty’s business strategy; (xxiii) loss of key personnel; (xxiv) public health crises, including pandemics and endemics, and the
governmental and private actions taken in response to such events; (xxv) natural or man-made catastrophes; (xxvi) the impact of climate change on Assured Guaranty’s business and regulatory actions taken related to such risk; (xxvii) other risk factors identified in AGL’s filings with the U.S. Securities and Exchange Commission (SEC); (xxviii) other risks and uncertainties that have not been identified at this time; and (xxix) management’s response to these factors.
The foregoing important factors should not be construed as exhaustive, and should be read in conjunction with the other cautionary statements that are included in this Form 10-K. The Company undertakes no obligation to update or review any forward looking statement, whether as a result of new information, future developments or otherwise, except as required by law. Investors are advised, however, to consult any further disclosures the Company makes on related subjects in the Company’s reports filed with the SEC.
If one or more of these or other risks or uncertainties materialize, or if the Company’s underlying assumptions prove to be incorrect, actual results may vary materially from what the Company projected. Any forward looking statements in this Form 10-K reflect the Company’s current views with respect to future events and are subject to these and other risks, uncertainties and assumptions relating to its operations, results of operations, growth strategy and liquidity.
For these statements, the Company claims the protection of the safe harbor for forward looking statements contained in Section 27A of the Securities Act of 1933, as amended (Securities Act), and Section 21E of the Securities Exchange Act of 1934, as amended (Exchange Act).
Conventions
Unless otherwise noted, ratings on Assured Guaranty’s insured portfolio are Assured Guaranty’s internal ratings. The Company purchases attractively priced obligations that it has insured and for which it had expected losses to be paid (Loss Mitigation Securities) in order to mitigate the economic effect of insured losses. Ratings on Loss Mitigation Securities are also Assured Guaranty's internal ratings. Internal credit ratings are expressed on a rating scale similar to that used by the rating agencies and generally reflect an approach similar to that employed by the rating agencies, except that Assured Guaranty’s internal credit ratings focus on future performance, rather than lifetime performance. The Company excludes amounts relating to Loss Mitigation Securities from its outstanding insured par and debt services.
ASSURED GUARANTY LTD.
FORM 10-K
TABLE OF CONTENTS
PART I
ITEM 1. BUSINESS
Overview
Assured Guaranty Ltd. (AGL and, together with its subsidiaries, Assured Guaranty or the Company) is a Bermuda-based holding company that provides, through its wholly-owned operating subsidiaries, credit protection products to the United States (U.S.) and non-U.S. public finance (including infrastructure) and structured finance markets. Assured Guaranty also participates in the asset management business.
Through its insurance subsidiaries, the Company applies its credit underwriting judgment, risk management skills and capital markets experience primarily to offer financial guaranty insurance that protects holders of debt instruments and other monetary obligations from defaults in scheduled payments. If an obligor defaults on a scheduled payment due on an obligation, including a scheduled principal or interest payment (collectively, debt service), the Company is required under its unconditional and irrevocable financial guaranty to pay the amount of the shortfall to the holder of the obligation. The Company markets
its financial guaranty insurance directly to issuers and underwriters of public finance and structured finance securities as well as to investors in such obligations. The Company guarantees obligations issued principally in the U.S. and the United Kingdom (U.K.), and also guarantees obligations issued in other countries and regions, including Western Europe. The Company also provides specialty insurance and reinsurance on transactions with risk profiles similar to those of its structured finance exposures written in financial guaranty form.
The Company participates in the asset management business through its ownership interest in Sound Point Capital Management, LP (Sound Point, LP) and certain of its investment management affiliates (together with Sound Point, LP, Sound Point), as described in greater detail under Item 1. Business — Asset Management — Strategic Transactions.
The Company continually evaluates its key business strategies, which fall into four areas: (i) insurance; (ii) asset management, (iii) alternative investments; and (iv) capital management. The Company seeks to grow the insurance business through new business production in established sectors and jurisdictions and by entering into new markets and classes of business, and also through acquisitions of financial guaranty insurance companies that currently are in runoff and no longer actively writing new business (legacy financial guarantors) or reinsurance of their portfolios. The Company also furthers its insurance strategy by mitigating losses in its insured portfolio. The Company’s ownership interest in Sound Point advances its strategy of participating in a fee-based earnings stream independent of the risk-based premiums generated by its financial guaranty business. The Company also expects its relationship with Sound Point to enhance its alternative investment opportunities. Finally, the Company pursues strategies to manage capital within the Assured Guaranty group more efficiently.
Insurance
Insurance Business - Financial Guaranty
Financial guaranty insurance generally provides an unconditional and irrevocable guaranty that protects the holder of a debt instrument or other monetary obligation against non-payment of scheduled principal and interest payments when due. Upon an obligor’s default on scheduled payments due on the debt obligation, whether due to its insolvency or otherwise, the Company is generally required under the financial guaranty contract to pay the investor the principal and interest shortfalls when due.
Financial guaranty insurance may be issued to all of the investors of the guaranteed series or tranche of a municipal bond or structured finance security at the time of issuance of those obligations or it may be issued to specific individual holders of such obligations who purchase the Company’s credit protection either in the secondary market or on a bilateral basis in the primary market when an obligation is not normally traded.
Both issuers of, and investors in, financial instruments may benefit from financial guaranty insurance. Issuers benefit when they purchase financial guaranty insurance for their new issue debt transaction because the insurance may have the effect of lowering an issuer’s interest cost over the life of the debt transaction to the extent that the insurance premium charged by the Company is less than the net present value of the difference between the yield on the obligation insured by Assured Guaranty (which carries the credit rating of the specific subsidiary that guarantees the debt obligation) and the yield on the debt obligation if sold on the basis of its uninsured credit rating. The principal benefit to investors is that the Company's guaranty provides increased certainty that scheduled payments will be received when due. A financial guaranty may also improve the marketability and liquidity of obligations, especially obligations with complex structures or backed by asset classes new to the
market. In general, and especially in such instances, investors may be able to sell insured bonds more quickly and at a better price than the comparable uninsured debt.
As an alternative to traditional financial guaranty insurance, the Company also may provide credit protection relating to a particular security or obligor through a credit derivative contract, such as a credit default swap (CDS). Under the terms of a CDS, the seller of credit protection agrees to make a specified payment to the buyer of credit protection if one or more specified credit events occurs with respect to a reference obligation or entity. In general, the Company, as the seller of credit protection, specified as credit events in its CDS failure to pay interest and principal on the reference obligation, but the Company’s rights and remedies under a CDS may be different and more limited than under financial guaranty insurance.
The Company also offers credit protection through reinsurance, and in the past has provided reinsurance to other financial guaranty insurers with respect to their financial guaranties of public finance, infrastructure and structured finance obligations. The Company believes that the opportunities currently available to it in the reinsurance market primarily consist of potentially assuming portfolios of transactions from legacy financial guarantors.
U.S. Public Finance Obligations The Company insures and reinsures a number of different types of U.S. public finance obligations. The types of U.S. public finance obligations the Company insures include the following:
General Obligation Bonds are full faith and credit obligations that are issued by states, their political subdivisions and other municipal issuers, and are supported by the general obligation of the issuer to pay from available funds and by a pledge of the issuer to levy property taxes in an amount sufficient to provide for the full payment of the bonds.
Tax-Backed Bonds are obligations that are supported by the issuer from specific and discrete sources of taxation and tax-backed revenue bonds. Tax-backed obligations may be secured by a lien on specific pledged tax revenues, such as a gasoline or excise tax, or an income tax, or incrementally from growth in property tax revenue associated with growth in property values. These obligations also include obligations secured by special assessments levied against property owners and often benefit from issuer covenants to enforce collections of such assessments and to foreclose on delinquent properties. Lease revenue bonds typically are general fund obligations of a municipality or other governmental authority that are subject to annual appropriation or abatement; projects financed and subject to such lease payments ordinarily include real estate or equipment serving an essential public purpose.
Municipal Utility Bonds are obligations of all forms of municipal utilities, including electric, water and sewer utilities and resource recovery revenue bonds. These utilities may be organized in various forms, including municipal enterprise systems, authorities or joint action agencies.
Transportation Bonds include a wide variety of revenue-supported obligations, such as bonds for airports, ports, tunnels, municipal parking facilities, toll roads and toll bridges.
Healthcare Bonds are obligations of healthcare facilities, including community based hospitals and systems, as well as of health maintenance organizations and long-term care facilities.
Infrastructure Bonds include obligations issued by a variety of entities engaged in the financing of infrastructure projects, such as roads, airports, ports, social infrastructure and other physical assets delivering essential services supported by long-term concession arrangements with a public sector entity.
Higher Education Bonds are obligations secured by revenue collected by either public or private secondary schools, colleges and universities. Such revenue can encompass all of an institution’s revenue, including tuition and fees, or in other cases, can be specifically restricted to certain auxiliary sources of revenue or revenue relating to student accommodation.
Housing Revenue Bonds are obligations relating to both single and multi-family housing, issued by states and localities, supported by cash flow and, in some cases, insurance from entities such as the Federal Housing Administration.
Investor-Owned Utility Bonds are obligations primarily issued by investor-owned utilities, and include first mortgage bond obligations of for-profit electric or water utilities providing retail, industrial and commercial service, as well as sale-leaseback obligation bonds supported by such entities.
Renewable Energy Bonds are obligations backed by revenue from renewable energy sources.
Other Public Finance Bonds include other debt issued, guaranteed or otherwise supported by U.S. national or local governmental authorities, as well as student loans, revenue bonds, and obligations of some not-for-profit organizations.
A portion of the Company’s exposure to tax-backed bonds, municipal utility bonds and transportation bonds constitutes “special revenue” bonds under the United States Bankruptcy Code (Bankruptcy Code). Special revenue bonds benefit from a lien on the special revenues, after deducting necessary operating expenses, of the project or system from which the revenues are derived.
Non-U.S. Public Finance Obligations The Company insures and reinsures a number of different types of non-U.S. public finance obligations. The types of non-U.S. public finance securities the Company insures and reinsures include the following:
Regulated Utility Obligations are obligations issued by government-regulated providers of essential services and commodities, including electric, water and gas utilities, supported by the rates and charges paid by the utilities’ customers. The majority of the Company’s non-U.S. regulated utility business is conducted in the U.K.
Infrastructure Finance Obligations are obligations issued by a variety of entities engaged in the financing of non-U.S. infrastructure projects, such as roads, airports, ports, social infrastructure, student accommodations, stadiums, and other physical assets delivering essential services supported either by long-term concession arrangements or a regulatory regime. The majority of the Company’s non-U.S. infrastructure business is conducted in the U.K.
Sovereign and Sub-Sovereign Obligations primarily includes obligations of local, municipal, regional or national governmental authorities or agencies outside of the U.S.
Renewable Energy Bonds are obligations secured by revenues relating to renewable energy sources, typically solar or wind farms. These transactions often benefit from regulatory support in the form of regulated minimum prices for the electricity produced. The majority of the Company’s non-U.S. renewable energy business is conducted in Spain.
Pooled Infrastructure Obligations are synthetic asset-backed obligations that take the form of CDS obligations or credit-linked notes that reference either infrastructure finance obligations or a pool of such obligations, with a defined deductible to cover credit risks associated with the referenced obligations. The Company has not entered into a pooled infrastructure transaction since 2006.
U.S. and Non-U.S. Structured Finance Obligations The Company insures and reinsures a number of different types of U.S. and non-U.S. structured finance obligations. Structured finance counterparties and policy beneficiaries use the Company’s financial guaranty for a variety of reasons, including credit enhancement, risk syndication and regulatory capital optimization. Credit support for the exposures written by the Company may come from a variety of sources, including some combination of subordinated tranches, excess spread, over-collateralization or cash reserves. Additional support also may be provided by transaction provisions intended to benefit noteholders or credit enhancers. The types of U.S. and non-U.S. structured finance obligations the Company insures and reinsures include the following:
Insurance Securitizations are transactions, including life insurance transactions, where obligations are secured by the future earnings from pools of various types of insurance/reinsurance policies and income produced by invested assets.
Residential Mortgage-Backed Securities (RMBS) are obligations backed by first and second lien mortgage loans on residential properties. The credit quality of borrowers covers a broad range, including “prime,” “subprime” and “Alt-A.” A prime borrower is generally defined as one with strong risk characteristics as measured by factors such as payment history, credit score, and debt-to-income ratio. A subprime borrower is a borrower with higher risk characteristics. An Alt-A borrower is generally defined as a prime quality borrower that lacks certain ancillary characteristics, such as fully documented income. RMBS include home equity lines of credit (HELOCs), which refers to a type of residential mortgage-backed transaction backed by second-lien loan collateral. The Company has not provided insurance for RMBS in the primary market since 2008.
Subscription Finance Facilities are lending facilities provided to closed-end private market funds, most frequently private-equity funds. The facilities are secured by the uncalled capital commitments of the limited partners (LP) to the fund. The Company may guarantee new or existing facilities and on a single facility or portfolio basis. Assured Guaranty’s exposures are generally to facilities with characteristics that include a high-quality fund sponsor with
strong historical performance, a diverse LP base composed primarily of institutional LPs and experienced bank lenders.
Pooled Corporate Obligations are securities primarily backed by various types of corporate debt obligations, such as secured or unsecured bonds, bank loans or loan participations and trust preferred securities. These securities are often issued in “tranches,” with subordinated tranches providing credit support to the more senior tranches. The Company’s financial guaranty exposures generally are to the more senior tranches of these issues.
Financial Products Business is the guarantee of certain business written by financial products companies owned by Dexia SA, which comprised guaranteed investment contracts (GICs), medium term notes (MTNs) and equity payment undertaking agreements associated with leveraged lease business. This business is being run off with the final maturity due in 2031. Assured Guaranty is indemnified by Dexia SA and certain of its affiliates against loss from the former financial products business.
Consumer Receivables Securities are obligations backed by non-mortgage consumer receivables, such as student loans, automobile loans and leases, manufactured home loans and other consumer receivables.
Other Structured Finance Obligations are obligations backed by assets not generally described in any of the other U.S. and Non-U.S. Structured Finance Obligations categories above.
Insurance Business - Specialty
The Company also guarantees specialty business with similar risk profiles to its structured finance exposures written in financial guaranty form. Specialty business includes, for example, diversified real estate, insurance securitizations, pooled corporate obligations and aircraft residual value insurance (RVI) transactions.
Exposure Limits, Underwriting Process, and Credit Policy
Exposure Limits
The Company establishes exposure limits and underwriting criteria for obligors, sectors and countries, and for individual insurance transactions. Risk exposure limits for single obligors are based on the Company’s capital resources and its assessment of potential frequency and severity of loss as well as other factors, such as historical and stressed collateral performance. Moreover, these limits may also be constrained by both regulatory limits or rating agency requirements. Sector limits are based on the Company’s view of stress losses for the sector and on its assessment of correlation. Country limits are based on the size and stability of the relevant economy, and the Company’s view of the political environment and legal system. All of the foregoing limits are established in relation to the Company’s capital base. In certain cases, however, the Company’s ultimate exposure may exceed its underwriting guidelines (caused by, for example, bond accretion exceeding the risk limitation, acquisitions, reassumptions or other strategic exceptions). See Item 1A. Risk Factors, Risks Related to Economic, Market and Political Conditions and Natural Phenomena captioned “The Company may be subjected to significant risks from large individual or correlated insurance exposures.”
Underwriting Process
The underwriting process for each insurance transaction involves underwriters, credit personnel and lawyers who analyze the structure of a potential transaction and the credit and legal issues pertinent to the particular line of business or asset class. Some transactions also involve accounting personnel who review the transactions to determine the appropriate accounting treatment. Formal credit reports for each proposed insurance transaction are assessed and approved by a credit committee composed of senior officers of the Company.
The Company maintains underwriting manuals that articulate the application of the principles in its risk appetite statement to its insurance business. For new business, generally a risk must be viewed by the Company as investment grade at the time of underwriting to be eligible for insurance. The underwriting manuals also articulate the Company’s exposure limits and credit policies applicable to specific products.
U.S. Public Finance. For U.S. public finance transactions, the Company’s underwriters generally analyze the issuer’s historical financial statements and, where warranted, develop stress case projections to test the issuer’s ability to make timely debt service payments under stressful economic conditions.
The Company focuses principally on the credit quality of the obligor based on population size and trends, wealth factors, and strength of the economy. The Company evaluates the obligor’s liquidity position; its fiscal management policies and track record; its ability to raise revenues and control expenses; and its exposure to derivative contracts and to debt subject to acceleration. The Company assesses the obligor’s pension and other post-employment benefits obligations, if applicable, and funding policies and evaluates the obligor’s ability to adequately fund such obligations in the future. The Company analyzes other critical risk factors including the type of issue; the repayment source; pledged security, if any; the presence of restrictive covenants and the tenor of the risk. The Company also considers the ability of obligors to file for bankruptcy or receivership under applicable statutes (and on related statutes that provide for state oversight or fiscal control over financially troubled obligors). The Company evaluates the impact of environmental and climate change risks, including natural perils, on the ability of the obligor to meet its financial obligations over the life of the insured transaction. Such risks may include rising sea levels, hurricanes, wildfires and earthquakes.
In cases of not-for-profit institutions, such as healthcare issuers and private higher education issuers, the Company focuses on the financial stability of the institution, its competitive position and its management experience as well as restrictive covenants imposed on the obligor for the benefit of debt holders.
The Company’s credit policy for U.S. infrastructure transactions is substantially similar to that of non-U.S. infrastructure transactions described below.
Non-U.S. Public Finance Transactions. For non-U.S. transactions, the Company undertakes an analysis of the country or countries in which the risk resides, which includes political risk as well as economic and demographic characteristics. For each transaction, the Company also performs an assessment of the legal framework governing the transaction and the laws affecting the underlying assets supporting the obligations to be insured.
The underwriting of regulated utilities outside of the U.S. primarily focuses on financial strength of the utility, financial covenants made by the utility, and regulations relevant to the specific jurisdiction. The Company also assesses each transaction for material environmental and climate change risks, and incorporates its assessment into its underwriting decisions.
For non-U.S. infrastructure transactions, the Company reviews the type of project (e.g., utility, hospital, road, social housing, transportation or student accommodation) and the source of repayment of the debt. For certain transactions, debt service and operational expenses are covered by availability payments made by either a governmental or not-for-profit entity. The availability payments are due if the project is available for use, regardless of whether the project actually is in use. The principal risks for such transactions are construction risk and operational risk.
For other transactions, notably transactions secured by toll-roads, student accommodation and stadiums, revenues derived from the project must be sufficient to make debt service payments as well as cover the upfront operating expenses it experiences during the build phase before revenues are generated.
For infrastructure transactions, underwriters generally use financial models to evaluate the ability of the transaction to generate adequate cash flow to service the debt under a variety of scenarios. The models include economically stressed scenarios that the underwriters use for their assessment of the potential credit risk inherent in a particular transaction. Stress models developed internally by the Company’s underwriters reflect both empirical research and information gathered from third parties, such as rating agencies or investment banks. The Company may also engage advisers such as consultants and external counsel to assist in analyzing a transaction’s financial or legal risks.
The Company’s due diligence for infrastructure projects also includes: a financial review of the entity seeking the development of the project (usually a governmental entity or university); a financial and operational review of the developer, the construction companies, and the project operator; and a financial review of the various providers of operational financial protection for the bondholders (and therefore the insurer), including construction surety providers, letter-of-credit providers, and banks. The Company uses outside consultants to review the construction program and to assess whether the project can be completed on time and on budget. The Company projects the cost of replacing the construction company, including delays in construction, in the event that a construction company is unable to complete the construction for any reason. Construction security packages are sized appropriately to cover these risks and the Company requires such coverage from credit-worthy institutions.
U.S. Structured Finance. Structured finance obligations generally present three distinct forms of risk: asset risk, pertaining to the amount and quality of assets underlying an issue; structural risk, pertaining to the extent to which an issuer's legal structure provides protection from loss; and execution risk, which is the risk that poor performance by a servicer or collateral manager contributes to a decline in the cash flow available to the transaction. Each of these risks is addressed through
the Company’s underwriting process. The underwriter is also required to assess the presence of any environmental or climate change risk and, to the extent there are notable environmental or climate change risks, analyze the potential impact, if any, of these risks on the transaction over its expected life, and present this assessment to the credit committee.
For structured finance transactions, underwriters generally use financial models to evaluate the ability of the transaction to generate adequate cash flow to service the debt under a variety of hypothetical scenarios. The models include economically stressed scenarios that the underwriters use for their assessment of the potential credit risk inherent in a particular transaction. Stress models developed internally by the Company’s underwriters reflect both empirical research and information gathered from third parties, such as rating agencies or investment banks. Generally, the amount and quality of asset coverage required with respect to a structured finance exposure is dependent upon both the historic performance of the asset class, as well as the Company’s view of the future performance of the subject assets.
The Company may also engage advisers such as consultants and external counsel to assist in analyzing a transaction's financial or legal risks. The Company may also conduct a due diligence review that includes, among other things, a site visit to the project or facility, meetings with issuer management, review of underwriting and operational procedures, file reviews, and review of financial procedures and computer systems.
In addition, structured securities usually are designed to protect investors (and therefore the insurer or reinsurer) from the bankruptcy or insolvency of the entity that originated the underlying assets, as well as the bankruptcy or insolvency of the servicer or manager of those assets.
The Company conducts due diligence on the collateral that supports its insured transactions. The principal focus of the due diligence is to confirm the underlying collateral was originated in accordance with the stated underwriting criteria of the asset originator. The Company also conducts audits of servicing or other management procedures, reviewing critical aspects of these procedures such as cash management and collections. The Company may, for certain transactions, obtain background checks on key managers of the originator, servicer or manager of the obligations underlying that transaction.
Non-U.S. Structured Finance. The underwriting process for Non-U.S. Structured Finance transactions is substantially similar to the procedures described above for U.S. Structured Finance transactions, with additional consideration for the risks relating to the relevant jurisdiction for each transaction.
Importance of Financial Strength Ratings
Financial strength ratings reflect a rating agency’s opinion of an insurer’s ability to pay under its insurance policies and contracts in accordance with their terms. When an insurance subsidiary of the Company guarantees an obligation, the issuer or another party may request that one or more rating agencies providing financial strength ratings on such insurer assign that insurer’s financial strength rating to the specific obligation it guaranteed. The ability to uplift credit ratings of underlying obligations is one attribute that makes the Company’s insurance products attractive in the market.
An insurer’s financial strength rating itself is not specific to any particular policy or contract; a rating agency instead assigns a rating to the insured obligation. A financial strength rating does not refer to an insurer's ability to meet non-insurance obligations and is not a recommendation to purchase any policy or contract issued by an insurer or to buy, hold, or sell any security insured by an insurer. The insurance financial strength ratings assigned by the rating agencies are based upon factors that the rating agencies believe are relevant to policyholders and are not directed toward the protection of investors in AGL’s common shares. Ratings reflect only the views of the respective rating agencies assigning them and are subject to continuous review and revision or withdrawal at any time.
Low financial strength ratings or uncertainty over the Company’s ability to maintain its financial strength ratings for its insurance subsidiaries would have a negative impact on issuers’ and investors’ perceptions of the value of the Company’s insurance product. Therefore, the Company manages its business with the goal of achieving high financial strength ratings.
A major component in arriving at a financial guaranty insurer’s rating has been the rating agency’s assessment of the insurer’s capital adequacy, with each rating agency employing its own proprietary model. These capital adequacy approaches include “stress case” loss assumptions for various risks or risk categories. The rating agencies have at various times materially increased stress case loss assumptions for various risks or risk categories, in some cases later reducing such stress case losses. This approach has made predicting the amount of capital required to maintain or attain a certain rating more difficult. In addition, both S&P Global Ratings, a division of Standard & Poor’s Financial Services LLC (S&P), and Moody’s Investors Service, Inc. (Moody’s) have applied other factors, some of which are subjective, such as the insurer's business strategy and
franchise value or the anticipated future demand for its product, to justify ratings for the Company’s insurance subsidiaries below the ratings implied by their own capital adequacy models. Currently, for example, S&P has concluded that Assured Guaranty’ insurance subsidiaries have “AAA” capital adequacy under the S&P model (but apply a downward adjustment due to a “largest obligor test” and rate them “AA”) and Moody’s has concluded that AG has “Aa” capital adequacy under the Moody’s model (but rates it A1 based on other factors including the rating agency’s assessment of competitive profile, future profitability and market share). The application of these additional factors make it uncertain whether a rating downgrade could generally be avoided by raising additional capital or otherwise improving capital adequacy under the rating agency’s model.
Despite the unpredictable application of subjective factors that are in addition to a rating agency’s assessment of insurers’ capital adequacy, the Company has been able to maintain strong financial strength ratings. The Company believes that if the financial strength ratings of any of its insurance subsidiaries were downgraded from their current levels, such downgrade could result in downward pressure on the premium that such insurance subsidiary would be able to charge for its insurance. The Company believes that so long as its insurance subsidiaries continue to have financial strength ratings in the double-A category from at least one of S&P or Moody’s, they are likely to be able to continue writing financial guaranty business with a credit quality similar to that historically written. However, if neither S&P nor Moody’s were to maintain financial strength ratings of an insurance subsidiary in the double-A category, or if either S&P or Moody’s were to downgrade an insurance subsidiary below the single-A level, it could be extremely difficult or impossible for such insurance subsidiary to originate the current volume of new financial guaranty business with comparable credit characteristics.
The Company periodically assesses the value of each rating assigned to each of its companies and may, as a result of such assessment, request that a rating agency add or drop a rating from certain of its companies. For example, a Moody’s rating was dropped from Assured Guaranty Re Ltd. (AG Re) and Assured Guaranty Re Overseas Ltd. (AGRO) in 2015.
See Item 1A. Risk Factors, Strategic Risks, captioned “A downgrade of the financial strength or financial enhancement ratings of any of the Company’s insurance or reinsurance subsidiaries may adversely affect its business and prospects.”
Market Demand and Competition
Assured Guaranty is the market leader in the financial guaranty industry. The Company’s position in the market benefits from its ability to maintain strong financial strength ratings, its strong claims-paying resources, its proven willingness and ability to make claim payments to policyholders after obligors have defaulted, and its ability to achieve recoveries in respect of the claims that it has paid and to resolve its troubled public finance and structured finance exposures, including residential mortgage-backed securities.
Market demand for financial guaranty insurance in the U.S. public finance market is generally driven by the difference in yield (or the credit spread) between an insured bond and an uninsured bond. When the difference in yield (or the credit spread) between a bond insured by Assured Guaranty and an uninsured bond is narrow, as is often the case in a low interest rate environment, investors may prefer greater yield over insurance protection, and issuers may find the cost savings from insurance less compelling. In contrast, when credit spreads are wider, there is comparatively more room for issuer savings and insurance premium. However, credit spreads may be narrower in a higher interest rate environment, as occurred in late 2022, and credit spreads may widen in a low interest rate environment, as occurred after the onset of the COVID-19 pandemic as a result of market concerns about the impact of the COVID-19 pandemic on some municipal credits. For a discussion of the economic environment, see Part II, Item 7, Management’s Discussion and Analysis of Financial Condition and Results of Operations — Overview — Economic Environment. In the non-U.S. infrastructure finance market, demand is a function of whether bonds are sold in the public markets rather than as privately funded transactions with uninsured executions.
In the U.S. public finance market, Assured Guaranty is the only financial guaranty company active before the 2008 financial crisis that has maintained sufficient financial strength to write new business continuously since the crisis began. Assured Guaranty has only one direct competitor for public finance financial guaranty business, Build America Mutual Assurance Company (BAM), a mutual insurance company that commenced business in 2012.
The Company estimates that, of the new U.S. public finance bonds sold with insurance in 2024, the Company insured approximately 58% of the par, while BAM insured approximately 42%. The Company believes that BAM is effective in competing with it for small to medium sized U.S. public finance transactions in certain sectors, and may in the future compete for non-U.S. transactions. BAM sometimes prices its guaranties for such transactions at levels the Company does not believe produces an adequate rate of return and so does not match, but BAM's pricing and underwriting strategies may have a negative impact on the amount of premium the Company is able to charge for its insurance for such transactions. However, the Company believes it has competitive advantages over BAM due to: AG’s larger capital base; AG’s ability to insure larger transactions and issuances in more diverse bond sectors; BAM’s higher leverage ratios than those of AG; and AG’s strong financial strength
ratings from multiple rating agencies (in the case of AG, AA+ from Kroll Bond Rating Agency (KBRA), AA from S&P and A1 from Moody’s, compared with BAM’s AA solely from S&P). Additionally, as a public company with access to both the equity and debt capital markets, Assured Guaranty may have greater flexibility to raise capital, if needed.
In the U.S. and non-U.S. structured finance markets, Assured Guaranty is the only financial guaranty insurance company currently writing new guaranties. Management considers the Company’s greater diversification to be a competitive advantage in the long run because it means the Company is not wholly dependent on conditions in any one market. The majority of the Company’s new structured finance business is represented by bilateral transactions with counterparties (typically insurance companies or banks) where the motivation to buy its product relates to capital savings, and/or single risk or sectoral risk management. In the securitization markets, uninsured execution occurs in both public and private transactions primarily where bonds are sold with sufficient credit or structural enhancement embedded in transactions, such as through overcollateralization, first loss insurance, excess spread or other terms, to make the bonds attractive to investors without bond insurance.
In the future, additional new entrants into the financial guaranty industry could reduce the Company’s new business prospects, including by furthering price competition or offering financial guaranty insurance on transactions with structural and security features that are more favorable to the issuers than those required by Assured Guaranty. However, the Company believes that the presence of additional guarantors might also increase the overall visibility and acceptance of the product by a broadening group of investors, and the fact that investors are willing to commit fresh capital to the industry may promote market confidence in the product.
In addition to financial guaranty insurance companies, Assured Guaranty competes with other forms of credit enhancement such as letters of credit or credit derivatives provided by banks and other financial institutions (some of which are governmental enterprises), other forms of capital savings or risk syndication, including nonpayment insurance, and direct guaranties of municipal, structured finance or other debt by federal or state governments or government sponsored or affiliated agencies. Alternative credit enhancement structures, and in particular federal government credit enhancement or other programs, can interfere with the Company’s new business prospects, particularly if they provide direct government-level guaranties, restrict the use of third-party financial guaranties or reduce the amount of transactions that might qualify for financial guaranties.
The Company believes that issuers and investors in securities will continue to purchase financial guaranty insurance, especially if credit spreads widen. U.S. municipalities have budgetary requirements that are best met through financings in the fixed income capital markets. Historically, smaller municipal issuers have frequently used financial guaranties in order to access the capital markets with new debt offerings at a lower all-in interest rate than on an unguaranteed basis. In addition, the Company expects long-term debt financings for infrastructure projects will grow throughout the world, as will the financing needs associated with privatization initiatives or refinancing of infrastructure projects in developed countries.
The Company evaluates the amount of capital it requires based on an internal capital model as well as rating agency models and insurance regulations. The Company believes it has excess capital based on its internal capital model and rating agency models, and, to the extent permitted by insurance regulation or other regulatory authority, has been returning some of its excess capital to shareholders by repurchasing its common shares and paying dividends, and has been deploying some of its excess capital to acquire financial guaranty portfolios and diversify the Company’s sources of earnings.
Insurance Acquisitions
Since 2009, the Company has acquired financial guaranty portfolios, including by acquiring legacy financial guarantors or acquiring (through reinsurance) substantial portions of their insured portfolios, and by commuting business that the Company had previously ceded prior to 2009 to various non-affiliated legacy financial guarantors and multiline reinsurers that were active in the financial guaranty reinsurance market. The Company also has periodically assumed, on a quota share basis, selected insured transactions from certain other legacy financial guarantors. The Company continues to investigate additional opportunities related to remaining legacy financial guaranty portfolios, but the number and size of the opportunities have decreased and there can be no assurance of whether or when the Company will find suitable opportunities on appropriate terms.
Insurance Subsidiaries
The Company conducts financial guaranty business through its insurance subsidiaries:
•Assured Guaranty Inc. (AG), domiciled in Maryland and formerly known as Assured Guaranty Corp., and its insurance subsidiaries:
▪Assured Guaranty UK Limited (AGUK), organized in the U.K.;
▪Assured Guaranty (Europe) SA (AGE), organized in France;
•AG Re, domiciled in Bermuda, and its insurance subsidiary:
▪Assured Guaranty Re Overseas Ltd. (AGRO), domiciled in Bermuda.
The following is a description of the Company’s insurance subsidiaries:
•Assured Guaranty Inc. AG is located in New York and domiciled in Maryland, was organized in 1985 and commenced operations in 1988. It provides financial guaranty insurance and reinsurance in the U.S., U.K., European Economic Area (EEA) and certain other countries. Effective August 1, 2024, AG’s U.S. affiliate, Assured Guaranty Municipal Corp. (AGM) merged with and into AG, with AG as the surviving company. Prior to the merger, AGM was an insurance subsidiary of the Company.
•Assured Guaranty UK Limited AGUK provides financial guaranties in the U.K. and certain other non-EEA countries. AGUK is a U.K. incorporated private limited company licensed as a U.K. insurance company and located in England. AGUK was organized in 1990 and issued its first financial guaranty in 1994.
•Assured Guaranty (Europe) SA. AGE (together with AGUK, the European Insurance Subsidiaries) is a French incorporated company located in France and established in 2019 that has been authorized by the French insurance and banking supervisory authority, the Autorité de Contrôle Prudentiel et de Résolution (ACPR), to conduct financial guaranty business. AGE writes new business in the EEA.
•Assured Guaranty Re Ltd. AG Re primarily underwrites financial guaranty reinsurance of certain affiliated companies and third-party primary insurers. AG Re is incorporated under the laws of Bermuda and is licensed as a Class 3B insurer under the Insurance Act 1978 and related regulations of Bermuda.
•Assured Guaranty Re Overseas Ltd. AGRO underwrites direct and assumed financial guaranty insurance, and also underwrites specialty business. AGRO is incorporated under the laws of Bermuda and is licensed as a Bermuda Class 3A and Class C insurer.
Support of the European Insurance Subsidiaries
AG Support of AGUK
AG and AGUK have in place a co-guarantee structure pursuant to which each of AG and AGUK directly guarantees a share of certain issued obligations (Co-Guarantee Structure). Under the current Co-Guarantee Structure: (i) AGUK directly guarantees 15% of the obligations issued in a particular transaction; (ii) AG directly guarantees 85% of the guaranteed obligations; and (iii) AG also provides a second-to-pay guarantee for AGUK’s 15% portion of the guaranteed obligations. The Co-Guarantee Structure has been in place since 2011 for public finance business and since 2021 for non-public finance business.
Separate and apart from the Co-Guarantee Structure, AG provides support to AGUK through a quota share and excess of loss reinsurance agreement (Reinsurance Agreement) and a net worth maintenance agreement (Net Worth Agreement).
Under the quota share cover of the Reinsurance Agreement, AG reinsures approximately 50-100% of most of the outstanding financial guaranties that AGUK wrote prior to the initial implementation of the Co-Guarantee Structure in 2011. The quota share cover of the Reinsurance Agreement also obligates AG to reinsure 85% of new business written by AGUK where the Co-Guarantee Structure cannot be utilized; currently, there is no such outstanding business at AGUK.
Under the excess of loss cover of the Reinsurance Agreement, AG is obligated to pay AGUK quarterly the amount (if any) by which (i) the sum of: (a) AGUK’s incurred losses, calculated in accordance with generally accepted accounting practice in the U.K. (UK GAAP) as reported by AGUK in its financial returns filed with the Prudential Regulation Authority (PRA); and (b) AGUK’s paid losses and loss adjustment expenses (LAE), in both cases net of all other performing reinsurance (including the reinsurance provided by AG under the quota share cover of the Reinsurance Agreement), exceeds (ii) an amount
equal to: (a) AGUK’s capital resources under U.K. law; minus (b) 110% of the greatest of the amounts as may be required by the PRA as a condition for maintaining AGUK’s authorization to carry on a financial guarantee business in the U.K. The purpose of this excess of loss cover is to ensure that AGUK maintains capital resources equal to at least 110% of the most stringent amount of capital that it may be required to maintain as a condition to carrying on a financial guarantee business in the U.K.
AG secures its quota share reinsurance obligations to AGUK under the Reinsurance Agreement by posting collateral in trust equal to 102% of the sum of AG’s assumed share of the following in respect of the reinsured AGUK policies: (i) AGUK’s unearned premium reserve (net of AGUK’s reinsurance premium payable to AG); (ii) AGUK’s provisions for unpaid losses and allocated LAE (net of any salvage recoverable); and (iii) any unexpired risk provisions of AGUK, in each case (i) - (iii) as calculated by AGUK in accordance with UK GAAP.
AGUK may terminate the Reinsurance Agreement upon the occurrence of any of the following events: (i) AG’s rating by Moody’s falls below “Aa3” or its rating by S&P falls below “AA-” (and AG fails to restore such rating(s) within a prescribed period of time); (ii) AG’s insolvency, failure to maintain the minimum capital required under the laws of AG’s domiciliary jurisdiction, filing a petition in bankruptcy, going into liquidation or rehabilitation, or having a receiver appointed; or (iii) AG’s failure to maintain its required collateral described above. AGUK has had a right to terminate the Reinsurance Agreement since 2013 when Moody’s downgraded AG below “Aa3”, but has not elected to exercise this right. AG is currently rated “A1” by Moody’s.
Under the Net Worth Agreement, AG is obligated to make capital contributions to AGUK in amounts sufficient to ensure that AGUK maintains capital resources equal to 110% of the greatest of the amounts as may be required by the PRA as a condition of AGUK maintaining its authorization to carry on a financial guarantee business in the U.K., provided that, except with the express approval (or non-disapproval) of the Maryland Insurance Administration (MIA), (a) no individual contribution by AG to AGUK for such purpose shall exceed $25 million; (b) AG shall not be permitted to make more than two (2) individual contributions to AGUK under the Net Worth Agreement during any calendar year, which two (2) contributions together shall not exceed $25 million; and (c) the aggregate contributions by AG to AGUK under the Net Worth Agreement shall not exceed $100 million. The Net Worth Agreement obligates AG to provide AGUK with support similar to that which AG also provides AGUK under the excess of loss cover of the Reinsurance Agreement, except the latter is meant to protect against erosion of AGUK’s capital resources due to insurance and/or reinsurance losses in AGUK’s insured portfolio, while the former is meant to protect against an erosion of AGUK’s capital resources for other reasons (e.g., poor investment performance or origination expenses exceeding premium). Given this purpose, the Net Worth Agreement clarifies that any amounts due thereunder must take into account all amounts paid, or reasonably expected to be paid, under the Reinsurance Agreement. The Net Worth Agreement also includes termination provisions substantially similar to those in the Reinsurance Agreement. AG has never been required to make any contributions to AGUK’s capital under the current Net Worth Agreement; however, AG may elect to make, from time to time and subject to MIA approval or non-disapproval, capital contributions to AGUK not required by the net worth maintenance agreement.
AG Support of AGE
AGE has in place similar reinsurance and capital support agreements as are in place with AGUK.
AG’s reinsurance agreements with AGE generally apply to all AGE policies that insure business in EEA jurisdictions. These agreements consist of:
(i) a quota share reinsurance agreement whereby AG provides AGE with 90% proportional reinsurance for new business written by AGE since its authorization in January 2020;
(ii) a second quota share reinsurance agreement between AGE and AG pursuant to which AG:
a. reinsures approximately 70-100% of business that was transferred to AGE by AGUK effective October 1, 2020 pursuant to the Part VII of the Financial Services and Markets Act 2000 (FSMA) (Part VII Transfer) (i.e., the same reinsurance to AGE as AGUK received prior to such transfer); and
b. provides 90% proportional reinsurance for certain business transferred to AGE pursuant to the Part VII Transfer that was not reinsured by AG (or its affiliates) when such business was part of AGUK’s insured portfolio; and
(iii) an excess of loss reinsurance agreement, similar to the excess of loss cover of AG’s Reinsurance Agreement with AGUK, pursuant to which AG is obligated, effectively, to ensure that AGE maintains capital resources equal to at least 110% of the most stringent amount of capital that AGE may be required to maintain as a condition of it maintaining its authorization to carry on a financial guarantee business in France.
AG secures its quota share reinsurance obligations to AGE under the agreements described above by depositing collateral in accounts maintained by an EEA financial institution and pledging such accounts to AGE under French law. The measure of AG’s required collateral for AGE is generally the same as the measure of AG’s required collateral for AGUK, except that the former is determined in accordance with generally accepted accounting principles in France (French GAAP).
AG also has in place with AGE a net worth maintenance agreement that is similar to AG’s Net Worth Agreement with AGUK - i.e., the former obligates AG to ensure that AGE maintains capital resources at least equal to 110% of its most stringent capital requirement for maintaining its authorization to carry on a financial guarantee business in France, subject to limitations on the amount of individual and aggregate contributions that AG can make to AGE under the agreement without MIA approval or non-disapproval. AG may elect to make, from time to time and subject to MIA approval or non-disapproval, capital contributions to AGE not required by the net worth maintenance agreement.
Other Group Support of the European Insurance Subsidiaries for Certain Legacy Business
AG Re also provide reinsurance support to the European Insurance Subsidiaries for certain legacy business that was insured prior to 2009 by AGUK. Some of this business continues to reside at AGUK, while some of it was transferred to AGE in October 2020 pursuant to the Part VII Transfer. AG Re does not currently provide direct reinsurance support for new business being written by AGUK or AGE.
AG Re secures its reinsurance of this legacy business in essentially the same manner as AG secures its reinsurance of the European Insurance Subsidiaries - i.e., AG Re pledges collateral equal to its assumed UK GAAP liabilities for AGUK and equal to its assumed French GAAP liabilities for AGE.
Asset Management
Strategic Transactions
Until July 1, 2023, the Company served as an investment adviser to primarily collateralized loan obligations (CLOs) and opportunity funds, through Assured Investment Management LLC (AssuredIM LLC) and its investment management affiliates (together with AssuredIM LLC, AssuredIM). Beginning July 1, 2023, the Company participates in the asset management business through its ownership interest in Sound Point, LP and certain of its investment management affiliates (together with Sound Point, LP, Sound Point), as described below.
On July 1, 2023, Assured Guaranty contributed to Sound Point, LP most of its asset management business, other than that conducted by Assured Healthcare Partners LLC (AHP) (AssuredIM Contributed Business), as contemplated by the transaction agreement entered into with Sound Point on April 5, 2023 (Transaction Agreement). Assured Guaranty received, subject to certain potential post-closing adjustments, approximately 30% of the common interests in Sound Point, LP, and certain other interests in Sound Point. See Part II, Item 8, Financial Statements and Supplementary Data, Note 1, Business and Basis of Presentation, for additional information.
In addition, in accordance with the terms of a letter agreement (Letter Agreement), effective July 1, 2023, AG (i) engaged Sound Point as its sole alternative credit manager and (ii) transitioned to Sound Point the management of certain existing alternative investments and related commitments. The Letter Agreement also provides that, within the first two years of Sound Point’s engagement, AG would, subject to regulatory approval, cure terms and other terms of the Letter Agreement, make new investments in funds, other vehicles and separately managed accounts managed by Sound Point which, when aggregated with the alternative investments and commitments transitioned from AssuredIM and any reinvestments (collectively, Sound Point Investments), and investments made by other Assured Guaranty affiliates, will total $1 billion. The Letter Agreement contemplates a long-term investment partnership between Sound Point and Assured Guaranty, whereby AG has agreed to reinvest all returns of capital from Sound Point Investments for a period of 15 years, until July 1, 2038. Similarly, the Letter Agreement provides that AG will reinvest all gains and dividends from Sound Point Investments for the first two years of Sound Point’s engagement, and reinvest half of all such gains and dividends thereafter until July 1, 2033 (the transactions contemplated under the Transaction Agreement and the Letter Agreement, the Sound Point Transaction). On July 1, 2028, AG may choose to reduce the amounts invested or required to be reinvested in certain Sound Point Investments under the Letter Agreement, subject to adjustment of Assured Guaranty’s portion of its ownership interest in Sound Point. To the
extent not required to be reinvested by the Letter Agreement, all proceeds from Sound Point Investments received in accordance with their operative investment documents can be distributed to the AG. See Part II, Item 8, Financial Statements and Supplementary Data, Note 7, Investments and Cash.
The Company’s ownership interest in Sound Point advances one of the Company’s key strategic initiatives to diversify its sources of earnings into fee-based industries that leverage its core competency in credit. In addition, the Company’s alternative investments made under the Letter Agreement with Sound Point furthers the Company’s goal of diversifying and expanding the categories and types of its investments.
In July 2023, Assured Guaranty sold all of its equity interests in AHP, which manages healthcare funds, to an entity owned and controlled by the managing partner of AHP (AHP Transaction), thereby disposing of its remaining asset management business. In connection with the AHP Transaction, the Company agreed to remain a strategic investor in certain AHP managed funds, retained its portion of carried interest in certain AHP managed funds and received other consideration.
Please see Item 1A. Risk Factors, Strategic Risks, captioned “Competition in the Company’s industries may adversely affect its results of operations, business prospects and share price,” “Strategic transactions may not result in the benefits anticipated,” “The Company’s investments in Sound Point are subject to the risks of Sound Point’s business that may adversely affect the Company’s financial condition, results of operations, capital, business prospects and share price,” and “The Company’s interest in Sound Point is subject to the risks normally associated with a minority interest.”
Asset Management Strategies
The Company participates in the asset management business through its ownership interest in Sound Point. Sound Point, LP was founded in 2008 and has five main credit strategies: (i) CLOs and performing credit, (ii) private credit, (iii) structured credit, (iv) opportunistic credit, and (v) commercial real estate credit. Sound Point also makes co-investments across the foregoing strategies. The Company invests in certain of Sound Point, LP’s credit strategies. These strategies are implemented for clients, including the Company, through funds and customized separately managed accounts and co-investment opportunities as further described below and in Sound Point, LP’s Firm Brochure on Form ADV Part 2A filed with the SEC. Sound Point, LP’s Firm Brochure and other SEC filings are maintained by Sound Point, LP, which remains solely responsible for their content.
Sound Point, LP’s CLO Strategy focuses on launching and managing CLOs (SP CLOs) whose investment assets primarily include corporate senior-secured bank loans and bonds. Sound Point, LP’s CLO Strategy also includes managing funds and vehicles that invest in securities issued by SP CLOs and residual interests in warehouse facilities for such CLOs. Sound Point, LP’s Performing Credit Floating Rate Strategy primarily focuses on performing non-investment grade corporate senior-secured bank loans and bonds.
Sound Point, LP’s Private Credit Strategy is comprised of the following sub-strategies: Middle Market Direct Lending Capital Solutions and Specialty Finance. Middle Market Direct Lending primarily focuses on privately negotiated, secured loans to U.S. middle-market companies. Capital Solutions primarily focuses on investments in senior secured debt, junior secured debt, accounts receivable financings, mezzanine debt and equity or equity linked securities and Specialty Finance Strategy which invests in specialty finance assets, financial technology, marketplace lending, consumer finance, structured finance and securitized products related to specialty finance lenders.
Sound Point, LP’s Structured Credit Strategy primarily invests in the equity and debt of Third Party CLOs as well as the residual interests in warehouse facilities for such CLOs.
Sound Point, LP’s Opportunistic Credit Strategy is comprised of both a Credit Opportunity Strategy and a Loan Opportunity Strategy. The Credit Opportunity Strategy primarily focuses on corporate bonds, senior-secured bank loans and equities and the Loan Opportunity Strategy primarily focuses on distressed bonds, distressed bank loans, public and private equity, and trade claims.
Sound Point, LP’s Commercial Real Estate Credit Strategy focuses on commercial mortgage loans and debt where commercial real estate properties serve as the underlying collateral.
Investments
The Company invests primarily in investment-grade fixed-maturity securities and short-term investments, as well as various alternative investments. Income from the Company’s investments is one of the primary sources of cash flow supporting
its claim payments and other operational costs, as well as its capital management objectives. The Company’s principal objectives in managing its investment portfolio are to maintain sufficient liquidity to cover unexpected stress in the insurance portfolio; to maximize after tax book income; to manage investment risk within the context of the underlying portfolio of insurance risk; and to preserve the highest possible ratings for each Assured Guaranty subsidiary.
If the Company’s calculations with respect to its insurance subsidiaries’ liabilities are incorrect or other unanticipated payment obligations arise, or if the Company improperly structures its investments to meet these and other corporate liabilities, it could have unexpected losses, including losses resulting from forced liquidation of investments. The investment policies of the Company’s insurance subsidiaries are subject to insurance law requirements, and may change depending upon regulatory, economic, rating agency and market conditions and the existing or anticipated financial condition and operating requirements, including the tax position, of the businesses. The performance of invested assets is subject to the ability of the Company and its investment managers to select and manage appropriate investments.
As of December 31, 2024, the investment portfolio had a carrying value of $8.7 billion and consisted primarily of the following:
Fixed-maturity securities and short-term investments: As of December 31, 2024, approximately $7.7 billion or 89% of the investment portfolio consisted of fixed-maturity securities and short-term investments. As of December 31, 2024, the majority (70%, or $5.5 billion) of the fixed-maturity securities and short-term investments was managed by Goldman Sachs Asset Management, L.P., Wellington Management Company, LLP, and MacKay Shields LLC. Each of these investment managers has discretionary authority over the portion of the investment portfolio it manages, within the limits of the investment guidelines approved by the Company’s Board of Directors (the Board or AGL’s Board). Each manager is compensated based upon a fixed percentage of the market value of the portion of the portfolio being managed by such manager. Wellington Management Company LLP owns or manages funds that own more than 5% of the Company’s common shares. The available-for-sale fixed-maturity securities in the investment portfolio primarily consist of investment-grade obligations of state and political subdivisions, U.S. government and agencies, corporate securities, mortgage-backed and other asset-backed securities.
In addition, as of December 31, 2024, $479 million (based on fair value) of the available-for-sale fixed maturity securities were Loss Mitigation Securities, and $277 million were CLO equity tranches, most of which were transferred out of the CLO fund in the fourth quarter of 2024. The Company considers CLO equity tranches to be a component of its alternative investment strategy.
The Company also had $123 million (based on fair value) of Contingent Value Instruments (CVIs), obtained as part of the resolution of the Company’s exposure to insured Puerto Rico credits experiencing payment default other than PREPA (2022 Puerto Rico Resolutions), all of which were classified as trading securities. See Part II, Item 8, Financial Statements and Supplementary Data, Note 7, Investments and Cash.
Other invested assets and CIVs: As of December 31, 2024 the carrying value of the Company’s ownership interest in Sound Point was $418 million and is reported in “other invested assets” on the consolidated balance sheets.
The Company also has alternative investments in a variety of investment strategies and asset classes offered by Sound Point as described above in “ - Asset Management Strategies,” as well as alternative investments managed by AHP and other parties. As of December 31, 2024, the Company’s other invested assets primarily consisted of funds focused on private healthcare investing, asset-based/specialty finance, CLOs, and middle market direct lending. In 2024 the underlying assets of certain funds were distributed, primarily CLO equity tranches, and were reclassified to available-for-sale fixed-maturity securities. As of December 31, 2024, one Sound Point managed fund was consolidated and classified as a CIV. The Company’s interest in that CIV based on net-asset-value was $33 million.
See Part II, Item 8, Financial Statements and Supplementary Data, Note 8, Financial Guaranty Variable Interest Entities and Consolidated Investment Vehicles, for information on the CIVs.
Risk Management
Organizational Structure
The Board oversees the risk management process. The Board employs an enterprise-wide approach to risk management that supports the Company’s business plans within a reasonable level of risk. Risk assessment and risk management encompass not only understanding the risks the Company faces and what steps management is taking to manage those risks, but also understanding what level of risk is appropriate for the Company. The Board annually approves the
Company’s business plan, taking risk management into account. It also approves the Company’s risk appetite statement, which articulates the Company’s tolerance for risk and describes the general types of risk that the Company accepts or attempts to avoid. The involvement of the Board in setting the Company’s business strategy is a key part of its assessment of management’s risk tolerance and a determinant of what constitutes an appropriate level of risk for the Company.
While the Board has the ultimate oversight responsibility for the risk management process, various committees of the Board also have responsibility for risk assessment and risk management. The Risk Oversight Committee of the Board oversees the standards, controls, limits, underwriting guidelines and policies that the Company establishes and implements in respect of credit underwriting and risk management. It focuses on management's assessment and management of credit risks as well as other risks, including, but not limited to, market, financial, legal, operational risks (including information technology, cybersecurity and data privacy risks), and risks relating to the Company's reputation and ethical standards. In addition, the Audit Committee of the Board is responsible for, among other matters, reviewing policies and processes related to risk assessment and risk management, including the Company’s major financial risk exposures and the steps management has taken to monitor and control such exposures, in coordination with the Risk Oversight Committee. It also oversees information technology, cybersecurity and data privacy as related to financial systems and controls, and reviews compliance with related legal and regulatory requirements. The Compensation Committee of the Board reviews risks to the Company arising from its compensation program. The Finance Committee of the Board oversees the Company’s investment portfolio (including alternative investments) and the Company’s capital structure, liquidity, financing arrangements, rating agency matters, and any corporate development activities in support of the Company’s financial plan. The Nominating and Governance Committee of the Board oversees risk at the Company by developing appropriate corporate governance guidelines, identifying qualified individuals to become Board members and, in coordination with the Compensation Committee, making plans for senior management succession. The Environmental and Social Responsibility Committee oversees the Company’s risk and opportunities related to environmental issues, such as climate change, as well as aspects of human capital management, including its strategies, policies and initiatives.
The board of directors of each of the Company’s insurance subsidiaries has overall responsibility for the system of governance, oversight of the business and affairs and establishment of the key strategic direction and key financial objectives, including risk management, of its respective company.
The Company has established several management committees to develop enterprise level risk management guidelines, and policies and procedures for the Company’s insurance and reinsurance subsidiaries that are tailored to their respective businesses, providing multiple levels of review, analysis and control.
The Company’s management committees responsible for risk management include:
•Portfolio Risk Management Committee—The portfolio risk management committee is responsible for enterprise risk management for the Company’s insurance business and focuses on measuring and managing credit, market and liquidity risk for the Company’s insurance business. This committee establishes company-wide credit policy for the Company’s direct and assumed insured business. It implements specific underwriting procedures and limits for the Company and allocates underwriting capacity among the Company’s subsidiaries. All transactions in new asset classes or new jurisdictions, or otherwise outside the Company’s Board-approved risk appetite statement or its risk limits, must be approved by this committee.
•Risk Management—Each insurance subsidiary has a committee responsible for conducting an in-depth review of the insured portfolios of the relevant subsidiaries, focusing on varying portions of the portfolio at each meeting. These committees review and may revise internal ratings assigned to the insured transactions and review sector reports, monthly product line surveillance reports and compliance reports, and are responsible for assisting in the management of risk and oversight of their respective company’s risk management framework and processes. This includes monitoring their respective company’s compliance with risk strategy, risk appetite, risk limits, as well as overseeing and challenging their respective company’s risk management and compliance functions. In carrying out its responsibilities, each of the risk management committees considers numerous factors that could impact their insured portfolios, including macroeconomic factors, long term trends and climate change.
•Workout Committee—This committee receives reports from surveillance and workout personnel on transactions insured by the Company that might benefit from active loss mitigation or risk reduction and approves loss mitigation or risk reduction strategies for such transactions.
•Reserve Committees—Each insurance subsidiary has a committee responsible for oversight of reserves for insured obligations. The reserve committees review the reserve methodology and assumptions for each major asset class
or significant below-investment-grade (BIG) transaction, as well as the loss projection scenarios used and the probability weights assigned to those scenarios. The reserve committees establish reserves for their respective insurance subsidiaries, taking into consideration supporting information provided by surveillance and portfolio analytics personnel, and are responsible for approving changes to assumptions that have a significant impact on expected losses.
•Assumptions Committees—The insurance subsidiaries have committees responsible for setting the assumptions, other than assumptions related to BIG exposures that use transaction-specific models within the scope of the reserve committees, used to calculate the Company’s probability of default and loss in various portfolio loss scenario and economic capital models. When setting these assumptions, each committee considers relevant historical internal and external experience and any potential changes to market conditions that could affect these parameters going forward.
In addition, management and the boards of the Company’s subsidiaries evaluate alternative investments prior to committing any funds to such investments. In the case of AG, the board has delegated the approval of alternative investments to an investment committee consisting of directors who are the insurer’s Chief Investment Officer, Chief Executive Officer, Chief Operating Officer and Chief Financial Officer; the activities of the investment committee are further reviewed by the insurer’s full board of directors.
Enterprise Risk Management
The business units and functional areas are responsible for identifying, assessing, monitoring, reporting and managing their own risks. The Chief Risk Officer and other risk management personnel are separate from the business units and are responsible for developing the risk management framework, ensuring applicable risk management policies and procedures are followed consistently across business units, and for providing objective oversight and aggregated risk analysis.
The internal audit function (Internal Audit) provides independent assurance around effective risk management design and control execution. On a quarterly basis, or more frequently when required, Internal Audit reports its findings directly to the Audit Committee of the Board and informs the Chief Executive Officer and other senior management of any material issues identified during their audits.
The Company has established an enterprise level risk appetite statement, approved by the Board, and risk limits, that govern the Company’s risk-taking activities, with similar documents governing the activities of each operating subsidiary. Risk management personnel monitor a variety of key risk indicators on an ongoing basis and work with the business units to take the appropriate steps to manage the Company’s established risk appetites and tolerances. Risk management also uses an internally developed economic capital model to project potential ultimate losses in the insured portfolio as well as on alternative investments, and analyze the related capital implications for the Company. Risk management also performs stress and scenario testing to both validate model results and assess the potential financial impact of emerging risks and major strategic initiatives such as acquisitions or releases of capital.
Quarterly risk reporting keeps the Board, its Risk Oversight Committee and senior management informed about material risk-related developments. At least once each year, risk management personnel prepare an Own Risk and Solvency Assessment for the Company as a whole and each of the operating companies (Commercial Insurer Solvency Self-Assessment for AG Re and AGRO) which reports the results of capital modeling, the status of key risk indicators and any emerging risks to the Risk Oversight Committee. In addition, the Company performs in-depth reviews annually of risk topics of interest to management and the Board. To the extent potentially significant business activities or operational initiatives are considered, the Chief Risk Officer analyzes the possible impact on the Company’s risk profile and capital adequacy.
Surveillance of Insured Transactions
The Company’s surveillance personnel are responsible for monitoring and reporting on the performance of each risk in its insured portfolio and tracking aggregation of risk. The primary objective of the surveillance process is to monitor trends and changes in transaction credit quality, detect any deterioration in credit quality, change or affirm ratings during reviews, and recommend remedial actions to management. The Company assigns internal credit ratings at closing to all transactions in the insured portfolio, and surveillance personnel recommend rating affirmations or adjustments to those ratings via the risk management committees to reflect changes in transaction credit quality. The Company monitors its insured portfolio and refreshes its internal credit ratings on individual exposures in quarterly, semi-annual or annual review cycles based on the Company’s view of the exposure’s quality, loss potential, volatility and sector. Ratings on exposures in sectors identified as
under the most stress or with the most potential volatility are reviewed every quarter, although the Company may also review a rating in response to developments impacting the credit when a ratings review is not scheduled.
The review cycle and scope vary based upon transaction type and credit quality. In general, the review process includes the collection and analysis of information from various sources, including trustee and servicer reports, performance reports from Intex (a commercially available structured finance reporting system), financial statements, general industry or sector news and analyses, and rating agency reports. Additionally, the Company uses various quantitative tools, scorecards and models to assess transaction performance and identify situations where there may have been a change in credit quality. Surveillance activities may include discussions with or site visits to issuers, servicers, collateral managers or other parties to a transaction. Surveillance may adopt augmented procedures in response to various events, as it has done in response to the COVID-19 pandemic, major natural disasters, and the transition away from the London Interbank Offered Rate as a reference rate.
For transactions that the Company has assumed, the ceding insurers are generally responsible for conducting ongoing surveillance of the exposures that have been ceded to the Company. The Company’s surveillance personnel monitor the ceding insurer’s surveillance activities on exposures ceded to the Company through a variety of means, including reviews of surveillance reports provided by the ceding insurers, meetings and discussions with their analysts and, in certain cases, independently review assumed transactions.
Workouts
The Company has personnel drawn from its surveillance, risk management, legal and other functions who are responsible for managing workout, loss mitigation and risk reduction situations. They work to develop and implement strategies on transactions that are experiencing loss or could possibly experience loss. They, along with the workout committee, develop strategies designed to enhance the ability of the Company to enforce its contractual rights and remedies and mitigate potential losses. They also engage in negotiation discussions with transaction participants and, when necessary, manage (along with legal personnel) the Company’s litigation proceedings. They may also make open market or negotiated purchases of securities that the Company has insured, negotiate or otherwise implement consensual terminations of insurance coverage prior to contractual maturity, or engage in other loss mitigation strategies. In addition, the Company’s surveillance personnel work with servicers of RMBS transactions to enhance their performance.
Asset Management and Alternative Investments
The Company’s investment management personnel and other risk personnel (together the investment team) monitor the Company's ownership interest in Sound Point, and investments in Sound Point funds and other alternative investments. Investment team personnel are responsible for the evaluation and due diligence processes for proposed new investments, and submit recommended investment actions to management, the boards of directors of the insurance subsidiaries, or AG’s investment committee in accordance with the Company's investment procedures. Investment team members monitor existing investments and provide periodic reporting at least quarterly to senior management, AGL’s Board and the Board's Risk Oversight and Finance Committees.
Data Protection
The Company is subject to local, state, and national laws and regulations in the U.S., U.K., the European Union (EU), the other EEA countries that comply with data protection laws in the EU, and other non-U.S. jurisdictions that require financial institutions and other businesses to protect personal and other sensitive information and provide notice of their privacy and security practices relating to the collection, disclosure and other processing of personal information. The Company is also subject to local, state, and national laws and regulations in various jurisdictions in which it does business that require notification to affected individuals and regulators regarding data security breaches. To address these requirements, the Company has established and implemented policies and procedures that are intended to protect the privacy and security of personal information that comes into the Company’s possession or control, and to comply with applicable laws and regulations. Company policies and procedures include, but are not limited to, specific technical, administrative, and physical safeguards for personal information, periodic risk assessments on privacy and security measures, monitoring and testing, an incident response plan that requires Company personnel to promptly report suspected and actual data breach incidents to designated management representatives, an enterprise-wide data governance program, and regularly maintained records that demonstrate the Company’s accountability for compliance with the core privacy principles, relating to the processing of personal information and applicable data protection laws. The Company has imposed similar requirements, as applicable, on third parties with whom it shares personal information including through a rigorous vendor selection and management process. The Company engages its
personnel and strives to enhance data privacy and security awareness through Company training, which is mandatory for all employees globally on an annual basis. See Item 1C. Cybersecurity.
Changing Climate Risks
The Company has long considered environmental impacts as part of its underwriting process, in particular with regard to U.S. public finance transactions. Global awareness of changing climate conditions and weather patterns has drawn greater attention to the financial implications and long-term consequences of frequent or severe natural disaster perils (e.g., storms and wildfires). As a financial guarantor of municipal and structured finance transactions, the Company does not have direct insurance exposure to natural perils but does face the risk that its obligors’ ability to pay debt service may be impacted as a result of such perils and the exacerbating effect extreme weather or deteriorating climatic conditions may have on their operations and/or financial condition.
The Company continues to enhance its approach to the consideration of climate risk in the origination, underwriting, credit approval, and surveillance of its insured exposures and has integrated climate risk into its risk management and control functions. Credit underwriting submissions are required to include an assessment of environmental and/or transitional risk factors as part of the underwriting analysis. Specifically, the vulnerability of obligors is evaluated with respect to climatic changes (e.g., sea level rise, droughts), extreme weather events (e.g., hurricanes, tornadoes, floods) or geological events (e.g., earthquakes, volcanic activity) as well as resilience factors (e.g., mitigation capabilities, adaptation capacity) to determine if such environmental issues could materially impact an obligor’s expected performance.
The Company’s assessment of how climate risks may impact a prospective obligor’s ability to pay debt service is informed by its extensive experience in municipal finance coupled with proprietary analytics and third-party data and insights. To improve the Company’s understanding of changing climate conditions and to develop the analytical tools needed to measure and manage the related financial risks, the Company has been investing in both talent and technology. The Company’s risk management resources include climate science expertise. In addition, a dedicated internal team works with a data analytics company specializing in climate risk analysis and the impact of extreme weather events on cities, counties, and states to develop analytical capabilities to evaluate climate risk and assess potential negative impacts that climate change could have on the proposed obligor’s ability to pay debt service.
The Company is also exposed indirectly to climate trends and extreme weather events that might impair the performance of securities in its investment portfolio. The portfolio consists predominantly of fixed-maturity securities. Nevertheless, environmental issues, including regulatory changes, changes in supply or demand characteristics of fuels, and extreme weather events, may impact the value of certain securities. The investment guidelines incorporate material environmental factors into the investment analysis to enhance the quality of investment decisions. On an annual basis, the Company requests and reviews reports from its primary investment managers on any material non-financial risks (including vulnerability to climate risks or exposure to extreme weather events) that may adversely impact returns.
The Company believes that the physical effects of climate change on the Company’s business operations are not likely to be material and the Company does not anticipate capital expenditures for climate related projects.
Regulatory Reporting. As the global community moves to address and mitigate the effects of climate change, regulators across jurisdictions have taken steps to require climate risk management and related reporting. Several of the Company’s subsidiaries are subject to regulatory reporting with respect to managing and disclosing the impact of changing climate conditions and the related financial risks. The Company continues to monitor regulatory developments and meet requirements applicable to its subsidiaries. To date, the costs associated with complying with regulatory reporting obligations have not had a material impact on the Company’s business, financial condition, and results of operations.
Governance. The Environmental and Social Responsibility Committee and the Risk Oversight Committee of AGL’s Board, each consisting solely of independent directors, provide oversight of the Company's approach to addressing climate change risk in accordance with their respective charters. The Environmental and Social Responsibility Committee reviews updates on the consideration of environmental risks in the Company’s insurance risk management and its investment portfolio, as well as legislative and regulatory developments of significance to the Company’s environmental initiatives and related oversight. The Risk Oversight Committee reviews the establishment and implementation of enterprise risk management policies and practices.
The Company has also formed an environmental risk working group composed of senior members of the Company’s credit, underwriting, surveillance, and risk management departments to review the impact of environmental risk on the Company, including the development of objective risk measures, metrics and methodologies needed to evaluate the financial impact of evolving climate conditions and extreme weather events on obligors in its insured portfolio on both aggregate and individual risk levels.
Regulation
Overview
The Company is a public company subject to SEC rules and regulations, and is also subject to insurance-related statutes, regulations and supervision by the U.S. states and territories and the non-U.S. jurisdictions in which it does business. The degree and type of regulation varies from one jurisdiction to another. In addition, from July 1, 2023, following the Sound Point Transaction, the Company participates in the asset management business through its ownership interest in Sound Point, which is a registered investment adviser with the SEC and subject to asset management-related statutes and regulations. The Company expects that the statutes and regulations applicable to the Company and to Sound Point will continue to evolve for the foreseeable future.
United States Regulation
Insurance and Financial Services Regulation
AGL has one insurance subsidiary domiciled in the U.S., AG, a Maryland domiciled insurance company licensed to write financial guaranty insurance and reinsurance in 50 U.S. states, the District of Columbia and Puerto Rico.
Insurance Holding Company Regulation
AG is subject to the insurance holding company laws of Maryland, its domiciliary jurisdiction, as well as other jurisdictions where it is licensed to do insurance business. These laws generally require AG to register with MIA and annually to furnish financial and other information about the operations of companies within its holding company system. Generally, all transactions among companies in the holding company system to which AG is a party (including sales, loans, reinsurance agreements and service agreements) must be fair, reasonable and equitable, and, if material or of a specified category, such as reinsurance or service agreements, require prior notice to and approval or non-disapproval by the MIA.
Change of Control
Before a person can acquire control of a U.S.-domiciled insurance company, prior written approval must be obtained from the insurance commissioner of the state where the insurer is domiciled or deemed commercially domiciled. Generally, state statutes provide that control over a domestic insurer is presumed to exist if any person, directly or indirectly, owns, controls, holds with the power to vote, or holds proxies representing, 10% or more of the voting securities of such insurer. Because a person acquiring 10% or more of AGL’s common shares would indirectly control the same percentage of the stock of AG, the insurance change of control laws of Maryland would likely apply to such acquisition. Accordingly, a person acquiring 10% or more of AGL’s common shares must either file a disclaimer of control of AG with the insurance commissioner of the State of Maryland (the Maryland Commissioner) or apply to acquire control of AG with the Maryland Commissioner. However, this presumption does not create a safe harbor for acquisitions below the 10% threshold, which may still result in a control determination. Significantly, an acquirer of less than 10% of an insurer’s voting securities may still be deemed to control the insurer based on all the facts and circumstances, including the terms and conditions of the proposed transaction. Moreover, a control relationship can arise from a contract or other factors, in the absence of any ownership of voting securities of an insurer.
Prior to approving an application to acquire control of a domestic insurer, the Maryland Commissioner will consider factors such as the financial strength of the applicant, the integrity and management of the applicant’s board of directors and executive officers, the applicant's plans for the management of the board of directors and executive officers of the insurer, the applicant’s plans for the future operations of the insurer and any anti-competitive results that may arise from the consummation of the acquisition of control. These review requirements may discourage potential acquisition proposals and may delay, deter or prevent a change of control involving AGL that some or all of AGL’s shareholders might consider to be desirable, including, in particular, unsolicited transactions.
Other State Insurance Regulations
State insurance authorities have broad regulatory powers with respect to various aspects of the business of U.S. insurance companies, including licensing these companies to transact business, “accrediting” reinsurers, determining whether assets are “admitted” and counted in statutory surplus, prohibiting unfair trade and claims practices, establishing reserve requirements and solvency standards, regulating investments and dividends and, in certain instances, approving policy forms and related materials and approving premium rates. State insurance laws and regulations require AG to file financial statements with insurance departments in every U.S. state or jurisdiction where it is licensed, authorized or accredited to conduct insurance business, and its operations are subject to examination by those departments at any time. AG prepares statutory financial statements in accordance with Statutory Accounting Principles, or SAP, and procedures prescribed or permitted by these departments. State insurance departments conduct periodic examinations of the books and records, financial reporting, policy filings and market conduct of insurance companies domiciled in their states, generally once every three to five years.
The MIA, the regulatory authority of the domiciliary jurisdiction of AG, conducts a periodic financial examination of insurance companies domiciled in Maryland, usually at five-year intervals. In 2023, the MIA last completed an examination of AG. The examination was for the five-year period ending December 31, 2021 and was a joint examination of both AG and its former affiliate, AGM, by the MIA and AGM’s domiciliary regulator, the New York State Department of Financial Services (NYDFS). The examination reports from the MIA and the NYDFS did not note any significant regulatory issues.
State Dividend Limitations
Maryland. One of the primary sources of cash for the payment of debt service by Assured Guaranty Municipal Holdings Inc. (AGMH) and Assured Guaranty US Holdings Inc. (AGUS) and for repurchases of shares and dividends by AGL is the receipt of dividends from AG. Under Maryland’s insurance law, AG may pay any dividend or other distribution in an amount that, together with any other dividends or distributions paid in the prior 12 months, does not exceed the lesser of (i) 10% of its policyholders’ surplus (as of the prior December 31); or (ii) 100% of its adjusted net investment income; provided, that, AG notifies the Maryland Commissioner of the proposed payment within five business days following declaration and at least ten days before payment. The Maryland Commissioner may declare that such dividend or distribution not be paid if it finds that AG’s policyholders’ surplus would be inadequate after payment or if payment could lead AG to a hazardous financial condition. “Adjusted net investment income” means the sum of (x) AG’s net investment income during the 12-month period ending December 31 of the preceding year (excluding realized capital gains and pro rata distributions of its own securities), and (y) AG’s net investment income (excluding realized capital gains) from the three calendar years prior to the preceding calendar year that has not already been paid out as dividends. A dividend or distribution to a shareholder of AG in excess of the foregoing limitation would constitute an “extraordinary dividend” or “extraordinary distribution,” which must be paid out of AG’s “earned surplus” and reported to, and approved by, the MIA prior to payment. "Earned surplus" is that portion of AG’s surplus that represents the net earnings, gains or profits (after deduction of all losses) that have not been distributed to its shareholders as dividends or transferred to stated capital or capital surplus, or applied to other purposes permitted by law, but does not include unrealized capital gains and appreciation of assets. See Part II, Item 7, Management’s Discussion and Analysis of Financial Condition and Results of Operations — Liquidity and Capital Resources — Insurance Subsidiaries, for the maximum amount of dividends or other distributions that can be paid without regulatory approval, recent dividend and distribution history and other recent capital movements.
Contingency Reserves
AG, under Maryland insurance law and regulations, must establish a contingency reserve, as reported on its statutory financial statements, to protect policyholders. The Maryland insurance laws and regulations determine the calculation of the contingency reserve and the period of time over which it must be established and, subsequently, can be released.
In Maryland, releases from the insurer’s contingency reserve may be permitted under specified circumstances in the event that actual loss experience exceeds certain thresholds or if the reserve accumulated is deemed excessive in relation to the insurer's outstanding insured obligations.
From time to time, AG has obtained the approval of the Maryland Commissioner to release contingency reserves based on losses or because the accumulated reserve is deemed excessive in relation to the insurer’s outstanding insured obligations.
Maryland laws and regulations require regular, quarterly contributions to contingency reserves, but such laws and regulations permit the discontinuation of such quarterly contributions to an insurer's contingency reserves when such insurer’s aggregate contingency reserves for a particular line of business (i.e., municipal or non-municipal) exceed the sum of the insurer’s outstanding principal for each specified category of obligations within the particular line of business multiplied by the
specified contingency reserve factor for each such category. In accordance with such laws and regulations, and with the approval of the MIA, AG ceased making quarterly contributions to its contingency reserves for both municipal and non-municipal business beginning in the fourth quarter of 2014, but AG resumed its quarterly contributions to its contingency reserves for municipal business in the third quarter of 2024 due to the merger on August 1, 2024 of AGM with and into AG, with AG surviving. The ongoing cessation of quarterly contributions to AG’s contingency reserves for non-municipal business is expected to continue for as long as AG satisfies the foregoing condition for such line of business.
Single and Aggregate Risk Limits
The Code of Maryland Regulations establishes single risk limits for financial guaranty insurers applicable to all obligations insured by a financial guaranty insurer that are issued by a single entity and backed by a single revenue source. For example, under the limit applicable to municipal obligations, the insured average annual debt service for a single risk, net of qualifying reinsurance and collateral, may not exceed 10% of the sum of the insurer's policyholders’ surplus and contingency reserves. In addition, the insured unpaid principal of municipal obligations attributable to any single risk, net of qualifying reinsurance and collateral, is limited to 75% of the insurer’s policyholders’ surplus and contingency reserves.
Under the limit applicable to qualifying asset-backed securities, the lesser of:
•the insured average annual debt service for a single risk, net of qualifying reinsurance and collateral, or
•the insured unpaid principal (reduced by the extent to which the unpaid principal of the supporting assets exceeds the insured unpaid principal) divided by nine, net of qualifying reinsurance and collateral,
may not exceed 10% of the sum of the insurer’s policyholders’ surplus and contingency reserves, subject to certain conditions.
Single-risk limits are also specified for other categories of insured obligations, and generally are more restrictive than those described above for municipal and asset-backed obligations. Obligations not qualifying for an enhanced single-risk limit are generally subject to a catch-all or “other” limit under which the unpaid principal of the single risk, net of qualifying reinsurance and collateral, may not exceed 10% of the sum of the insurer's policyholders’ surplus and contingency reserves. For example, “triple-X” and “future flow” securitizations, as well as unsecured corporate obligations and unsecured investor-owned utility obligations, are generally subject to this catch-all or “other” single-risk limit.
The Code of Maryland Regulations also establishes an aggregate risk limit on the basis of the aggregate net liability insured by a financial guaranty insurer as compared with its statutory capital. “Aggregate net liability” is defined for this purpose as the outstanding principal and interest of guaranteed obligations insured, net of qualifying reinsurance and collateral. Under this limit, an insurer’s combined policyholders’ surplus and contingency reserves must not be less than the sum of various percentages of aggregate net liability for various categories of specified obligations. The percentage varies from 0.3333% for certain municipal obligations to 4.0% for certain non-investment-grade obligations. As of December 31, 2024, the aggregate net liability of AG utilized approximately 27% of its policyholders’ surplus and contingency reserves.
The Maryland Commissioner has broad discretion to order a financial guaranty insurer to cease new business originations if the insurer fails to comply with single or aggregate risk limits, but, based on the Company’s experience, is likely to show a willingness to work with AG for isolated instances of non-compliance.
Investments
AG is subject to laws and regulations that require diversification of its investment portfolio and limit the amount of investments in certain asset categories, such as BIG fixed-maturity securities, foreign investments, real estate, equity investments, and derivatives. Failure to comply with these laws and regulations would cause investments exceeding regulatory limitations to be treated as non-admitted assets for purposes of measuring surplus, and, in some instances, would require divestiture of such non-qualifying investments. In addition, any investment by AG must be authorized or approved by its board of directors or a committee thereof that is responsible for supervising or making such investment.
Group Regulation
In connection with AGL’s establishment of tax residence in the U.K., as discussed in greater detail under “Tax Matters” below, the MIA has been designated as group-wide supervisor for the Assured Guaranty group. Group-wide supervision by the MIA results in additional regulatory oversight over Assured Guaranty, particularly with respect to group-wide enterprise risk, and may subject Assured Guaranty to new regulatory requirements and constraints.
U.S. Credit for Reinsurance Requirements for Non-U.S. Reinsurance Subsidiaries
The Company’s Bermuda reinsurance subsidiaries, AG Re and AGRO, may be affected by regulatory requirements in the 50 U.S. states, District of Columbia, American Samoa, Guam, Northern Marianas, Puerto Rico, and U.S. Virgin Islands (collectively, NAIC Jurisdictions) governing the ability of a ceding company to receive credit on its statutory financial statements for reinsurance provided by a reinsurer. In general, under such requirements, a ceding company that obtains reinsurance from a reinsurer that is licensed, accredited or approved by the ceding company’s state jurisdiction of domicile is permitted to reflect in its statutory financial statements a credit in an aggregate amount equal to the ceding company's liability for unearned premiums (which are that portion of premiums written which applies to the unexpired portion of the policy period), and loss and LAE reserves ceded to the reinsurer. NAIC Jurisdictions, however, generally also permit a credit on the statutory financial statements of a ceding insurer for reinsurance obtained from a non-licensed or non-accredited reinsurer to the extent that the reinsurer secures its reinsurance obligations to the ceding insurer by providing collateral in the form of a letter of credit, trust fund or other acceptable security arrangement. Certain of those jurisdictions also permit such non-licensed/non-accredited reinsurers that meet certain specified requirements to apply for “certified reinsurer” status. If granted, such status allows the certified reinsurer to post less than 100% collateral (the exact percentage depends on the certifying jurisdiction’s view of the reinsurer's financial strength) and the applicable ceding company will still qualify, on the basis of such reduced collateral, for full credit for reinsurance on its statutory financial statements with respect to reinsurance contracts renewed or entered into with the certified reinsurer on or after the date the reinsurer becomes certified. Each NAIC Jurisdiction has adopted laws and regulations allowing for the elimination of reinsurance collateral requirements for unauthorized reinsurers in qualifying non-U.S. jurisdictions that (i) meet specified requirements, such as minimum capital and surplus amounts and minimum solvency or capital ratios, and (ii) provide certain commitments to the ceding insurer’s domiciliary regulator, such as submission to jurisdiction and the filing of annual audited financial statements.
AG Re and AGRO are not licensed, accredited or approved in any state and have established trusts to secure their reinsurance obligations. In 2017, AGRO obtained certified reinsurer status in Missouri, which allows AGRO to post 10% collateral in respect of any reinsurance assumed from a Missouri-domiciled ceding company on or after the date of AGRO’s certification (although, currently, AGRO does not assume any such reinsurance). See “Non-U.S. Regulation —Bermuda—Bermuda Insurance Regulation” for Bermuda regulations applicable to AG Re and AGRO.
Regulation of Swap Transactions Under Dodd-Frank
AG is subject to direct and indirect regulation under U.S. federal law. In particular, its derivatives activities are directly and indirectly subject to a variety of regulatory requirements under the Dodd-Frank Wall Street Reform and Consumer Protection Act (Dodd-Frank Act). Based on the size of AG’s derivatives portfolios, AGL does not believe AG is required to register with the Commodity Futures Trading Commission as a “major swap participant” or with the SEC as a “major securities-based swap participant.” Certain of the Company's subsidiaries may be subject to Dodd-Frank Act requirements to post margin for, or to clear on a regulated execution facility, future swap transactions or with respect to certain amendments to legacy swap transactions, if they enter into such transactions.
Regulation of U.S. Asset Management Business
Since July 1, 2023, following the Sound Point Transaction, the Company participates in the asset management business through its ownership interest in Sound Point. The Company is an approximately 30% owner of Sound Point, does not control the business, management or policies of Sound Point and relies upon Sound Point to make appropriate decisions and operate in a manner consistent with applicable rules and regulations. Sound Point is registered as an investment adviser with the SEC and is subject to the requirements and regulations of the U.S. Investment Advisers Act of 1940, as amended (the Advisers Act). As a registered investment adviser, Sound Point, LP and certain other Sound Point entities must submit periodic filings with the SEC on Forms ADV, which are publicly available. The Advisers Act also imposes additional requirements on registered advisers, including the maintenance of a Code of Ethics addressing potential conflicts of interest, an effective compliance program, recordkeeping and reporting, disclosure, limitations on cross and principal transactions between an adviser and its advisory clients and general anti-fraud prohibitions. Furthermore, private funds advised by Sound Point rely on exemptions from various requirements of the Securities Act, the Exchange Act, the U.S. Investment Company Act of 1940, as
amended (the Investment Company Act), the Commodity Exchange Act and the U.S. Employee Retirement Income Security Act of 1974, as amended (ERISA). In addition, registered investment companies advised by Sound Point are subject to the requirements of the Securities Act, the Exchange Act and the Investment Company Act and rely on exemptions from the Commodity Exchange Act and ERISA.
Non-U.S. Regulation
General
A portion of the Company’s business is conducted in non-U.S. countries. Generally, the Company’s subsidiaries operating in non-U.S. jurisdictions must satisfy local regulatory requirements. Certain of these jurisdictions require registration and periodic reporting by insurance and reinsurance companies that are licensed or authorized in such jurisdictions and are controlled by other entities. Applicable legislation also typically requires periodic disclosure concerning the entity that controls the insurer and reinsurer and the other companies in the holding company system and prior approval of intercompany transactions and transfers of assets, including, in some instances, payment of dividends by the insurance and reinsurance subsidiary within the holding company system.
In addition to these licensing, disclosure and asset transfer requirements, the Company’s non-U.S. operations are also regulated in various jurisdictions with respect to, among other matters, policy language and terms, amount and type of reserves, amount and type of capital to be held, amount and type of local investment, local tax requirements, and restrictions on changes in control. AGL, as a Bermuda-domiciled holding company, is also subject to shareholding restrictions. Such shareholding restrictions of AGL and restrictions on changes in control of our non-U.S. operations may discourage potential acquisition proposals and may delay, deter or prevent a change of control of AGL, including through transactions, and, in particular, unsolicited transactions, that some or all of its shareholders might consider to be desirable. See Item 1A. Risk Factors, Risks Related to Applicable Law, Litigation and GAAP, captioned “Applicable insurance laws may make it difficult to effect a change of control of AGL.”
Bermuda
The Bermuda Monetary Authority (the Authority) regulates the Company’s operating insurance and reinsurance subsidiaries in Bermuda. AG Re and AGRO are each an insurance company currently registered and licensed under the Insurance Act 1978 of Bermuda, amendments thereto and related regulations (collectively, the Insurance Act). AG Re is registered and licensed as a Class 3B insurer and is authorized to carry on general insurance business (as understood under the Insurance Act), subject to any conditions attached to its license and to compliance with the requirements imposed by the Insurance Act.
AGRO is registered and licensed as both a Class 3A insurer and a Class C long-term (life) insurer, and therefore carries on both general and long-term (life) business (as understood under the Insurance Act), subject to any conditions attached to its license. In particular, AGRO must keep its accounts in respect of its general business and its long-term (life) business separate in respect of any other business. AGRO is required to maintain both a general business fund and a long-term (life) business fund (as defined in the Insurance Act.)
Bermuda Insurance Regulation
The Insurance Act, as enforced by the Authority, imposes on AG Re and AGRO a variety of requirements and restrictions, including the filing of annual U.S. GAAP financial statements and audited statutory financial statements; compliance with minimum enhanced capital requirements; compliance with the Authority’s Insurance Code of Conduct; compliance with the Authority’s Insurance Sector Operational Cyber Risk Management Code of Conduct; compliance with minimum solvency and liquidity standards; restrictions on the declaration and payment of dividends and distributions; preparation and publication of an annual Financial Condition Report providing details on measures governing the business operations, corporate governance framework, solvency and financial performance of the insurer and reinsurer; restrictions on changes in control of regulated insurers and reinsurers; restrictions on the reduction of statutory capital; and the need to have a principal representative and a principal office (as understood under the Insurance Act) in Bermuda. The Insurance Act grants to the Authority the power to cancel insurance licenses, supervise, investigate and intervene in the affairs of insurance and reinsurance companies and in certain circumstances share information with foreign regulators.
Shareholder Controllers
Pursuant to provisions in the Insurance Act, any person who becomes a holder of 10% or more, 20% or more, 33% or more or 50% or more of the Company’s common shares must notify the Authority in writing within 45 days of becoming such a holder. The Authority has the power to object to such a person if it appears to the Authority that the person is not fit and proper to be such a holder. In such a case, the Authority may require the holder to reduce their shareholding in the Company and may direct, among other things, that the voting rights attached to their common shares are not exercisable.
Minimum Solvency Margin and Enhanced Capital Requirements
Under the Insurance Act, AG Re and AGRO must each ensure that the value of its general business statutory assets exceeds the amount of its general business statutory liabilities by an amount greater than a prescribed minimum solvency margin and each company’s applicable enhanced capital requirement, which is established by reference to either its Bermuda Solvency Capital Requirement (BSCR) model or an approved internal capital model. The BSCR model is a risk-based capital model which provides a method for determining an insurer’s capital requirements (statutory economic capital and surplus) by establishing capital requirements for ten categories of risk in the insurer’s business: fixed income investment risk, equity investment risk, interest rate/liquidity risk, currency risk, concentration risk, premium risk, reserve risk, credit risk, catastrophe risk and operational risk.
Restrictions on Dividends and Distributions
The Insurance Act limits the declaration and payment of dividends by AG Re and AGRO, including by prohibiting each company from declaring or paying any dividends during any financial year if it is in breach of its prescribed minimum solvency margin, minimum liquidity ratio or enhanced capital requirement, or if the declaration or payment of such dividends would cause such a breach. Dividends cannot exceed an insurer’s current outstanding statutory surplus. In accordance with the Insurance Act, AG Re and AGRO may declare or pay in any financial year dividends of up to 25% of its total statutory capital and surplus (as shown on its previous financial year’s statutory balance sheet) without seeking prior approval from the Authority. AG Re and AGRO dividend declarations or payments in excess of this 25% threshold in any financial year are prohibited without certification to the Authority that the Company will continue to meet its relevant margins. The Insurance Act also prohibits AGRO, as a Class C licensed insurer writing long-term (life) business, from declaring or paying any dividends to any person other than a policyholder unless its approved actuary certifies that the proposed amount of the dividend would not exceed the excess of funds available to satisfy its long-term (life) business obligations. Further, AG Re and AGRO are permitted to make capital distributions of up to 15% of its prior year statutory capital (as shown in its previous financial year statutory balance sheet). AG Re and AGRO must obtain the Authority’s prior approval before making capital distributions in excess of the 15% threshold. See “Minimum Solvency Margin and Enhanced Capital Requirements” above and “Minimum Liquidity Ratio” below.
The Companies Act 1981 of Bermuda (Companies Act) also limits the declaration and payment of dividends and other distributions by Bermuda companies such as AGL and its Bermuda subsidiaries, which, in addition to AG Re and AGRO, also include Cedar Personnel Ltd. (collectively, the Bermuda Subsidiaries). Such companies may only declare and pay a dividend or make a distribution out of contributed surplus (as understood under the Companies Act) if there are reasonable grounds for believing that the company is, and after the payment will be, able to meet and pay its liabilities as they become due and the realizable value of the company’s assets will not be less than its liabilities.
Minimum Liquidity Ratio
The Insurance Act provides a minimum liquidity ratio for general business. An insurer engaged in general business is required to maintain the value of its relevant assets at not less than 75% of the amount of its relevant liabilities. Relevant assets include cash and time deposits, quoted investments, unquoted bonds and debentures, first liens on real estate, investment income due and accrued, accounts and premiums receivable, reinsurance balances receivable, funds held by ceding insurers and any other assets which the Authority accepts on application. The relevant liabilities are total general business insurance reserves and total other liabilities less deferred income tax and sundry liabilities (by interpretation, those not specifically defined) and letters of credit, corporate guaranties and other instruments.
Certain Other Bermuda Law Considerations
Although AGL is incorporated in Bermuda, it is classified as a non-resident of Bermuda for exchange control purposes by the Authority. Pursuant to its non-resident status, AGL may engage in transactions in currencies other than Bermuda dollars
and there are no restrictions on its ability to transfer funds (other than funds denominated in Bermuda dollars) in and out of Bermuda or to pay dividends to U.S. residents who are holders of its common shares.
AGL is not currently subject to taxes computed on profits or income or computed on any capital asset, gain or appreciation. Bermuda companies pay, as applicable, annual government fees, business fees, payroll tax and other taxes and duties. See “— Tax Matters—Taxation of AGL and Subsidiaries—Bermuda.”
United Kingdom Insurance and Financial Services Regulation
Each of AGUK and Assured Guaranty Finance Overseas Ltd. (AGFOL) are subject to the FSMA, which covers financial services relating to deposits, insurance, investments and certain other financial products. Under FSMA, effecting or carrying out contracts of insurance by way of business in the U.K. each constitutes a “regulated activity” requiring authorization by the appropriate regulator.
The PRA and the Financial Conduct Authority (FCA) are the main regulatory authorities responsible for insurance regulation in the U.K. These two regulatory bodies cover the following areas:
•the PRA, a part of the Bank of England, is responsible for prudential regulation of certain classes of financial services firms, including insurance companies, and
•the FCA is responsible for the prudential regulation of all non-PRA firms and the regulation of market conduct by all firms.
AGUK, as an insurance company, is regulated by both the PRA and the FCA. They impose on AGUK a variety of requirements and restrictions, including minimum solvency capital requirements; change of control; reporting requirements; supervision of management; intervention and enforcement; and fees and levies. AGFOL, as an insurance intermediary, is regulated by the FCA. AGFOL’s permissions from the FCA allow it to introduce business to AG, so that AGFOL can arrange financial guaranties underwritten by AG. AGFOL is not authorized as an insurer and does not itself take risk in the transactions it arranges or places.
AGUK also is the principal of Assured Guaranty Credit Protection Ltd. (AGCPL). Prior to 2009, AGCPL entered into a limited number of derivative contracts, some of which are still outstanding, that provide credit protection on certain referenced obligations. AGUK guarantees AGCPL’s obligations under such derivative contracts. AGCPL is not authorized by the PRA or FCA, but is an appointed representative of AGUK. This means that AGCPL can carry on insurance distribution activities without a license because AGUK has regulatory responsibility for it.
PRA Supervision and Enforcement
The PRA has extensive powers to intervene in the affairs of an authorized firm, including the power in certain circumstances to withdraw the firm’s authorization to carry on a regulated activity. The PRA carries out the prudential supervision of insurance companies like AGUK through a variety of methods, including the collection of information from statistical returns, the review of accountants’ reports and insurers’ annual reports and disclosures, visits to insurance companies and regular formal interviews. The PRA takes a risk-based approach to the supervision of insurance companies.
The PRA assesses, on an ongoing basis, whether insurers are acting in a manner consistent with safety and soundness and appropriate policyholder protection, and whether they meet, and are likely to continue to meet, threshold conditions. The PRA weights its supervision towards those issues and those insurers that, in its judgment, pose the greatest risk to its regulatory objectives. It is forward-looking, assessing its objectives not just against current risks, but also against those that could plausibly arise in the future. Its risk assessment framework looks at the insurer’s risk context, the potential impact of failure of the insurer and mitigating factors.
AGUK calculates its minimum required capital according to the solvency criteria applicable in the UK and is in compliance.
Other U.K. Regulatory Requirements
In 2010, it was agreed between AGUK’s management and its then regulator, the Financial Services Authority (now the PRA), that new business written by AGUK would be guaranteed using a co-guarantee structure pursuant to which AGUK would co-guarantee municipal and infrastructure transactions with AGM and structured finance transactions with AG. As a
result of the merger on August 1, 2024 of AGM with and into AG, with AG surviving, the co-guarantor for both types of transactions is now AG. AGUK’s financial guaranty for each transaction covers a proportionate share (currently fixed from 2018 at 15%) of the total exposure, and AG guarantees the remaining exposure under the transaction. AG will also provide a second-to-pay guaranty to cover AGUK’s financial guaranty. See “—Business—Insurance—Support of the European Insurance Subsidiaries.”
Solvency UK and Solvency Requirements
Solvency II took effect from January 1, 2016 in the U.K. and remained in effect as part of the U.K.’s retained EU law after the withdrawal of the U.K. from the EU. See “- Solvency II and Solvency Requirements,” below. On December 31, 2024, as part of Brexit reform, the U.K. government revoked Solvency II in the U.K and the prudential regime provisions for insurers were moved and assimilated into the PRA’s Rulebook and policy material (Solvency UK). Solvency UK provides rules on capital adequacy, governance and risk management and regulatory reporting and public disclosure. Under Solvency UK, AGUK is subject to certain limits and requirements, including the maintenance of a minimum solvency capital requirement (which depends on the type and amount of insurance business a company writes and the other risks to which it is exposed) and the establishment of technical provisions, which include projected losses and premium earnings. Failure to maintain capital at least equal to the capital requirements under Solvency UK is one of the grounds on which the wide powers of intervention conferred upon the PRA may be exercised. AGUK calculates its solvency capital requirements using the Standard Formula under Solvency UK which establishes capital requirements for underwriting risk, market risk, counterparty default risk and operational risk.
Restrictions on Dividend Payments
U.K. company law prohibits each of AGUK and AGFOL from declaring a dividend to its shareholders unless it has “profits available for distribution.” The determination of whether a company has profits available for distribution is based on its accumulated realized profits less its accumulated realized losses. While the U.K. insurance regulatory laws impose no statutory restrictions on a general insurer’s ability to declare a dividend, the PRA’s capital requirements may in practice act as a restriction on dividends for AGUK.
Change of Control
Under FSMA, when a person decides to acquire or increase “control” of a U.K. authorized firm (including an insurance company) they must give the PRA (if regulated by the PRA and FCA) or the FCA (if regulated solely by the FCA) notice in writing before making the acquisition. The PRA and the FCA have up to 60 working days (without including any period of interruption) in which to assess a change of control case. Any person (a company or individual) that directly or indirectly acquires 10% or 20% (depending on the type of firm, the “Control Percentage Threshold”) or more of the shares, or is entitled to exercise or control the exercise of the Control Percentage Threshold or more of the voting power, of a U.K. authorized firm or its parent undertaking is considered to “acquire control” of the authorized firm. Broadly speaking, the 10% threshold applies to banks, insurers and reinsurers (but not brokers) and Markets in Financial Instruments Directive (MiFID) investment firms, and the 20% threshold to insurance brokers and certain other firms that are Non-Directive firms for the purposes of Solvency UK.
U.K. Withdrawal from the European Union
Through 2019, AGUK wrote business in the U.K. and various countries throughout the EU as well as certain other non-EU countries. In mid-2019, to address the impact of the withdrawal of the U.K. from the EU, AGL established AGE as a French incorporated company. AGE was authorized by the French insurance and banking supervisory authority, the ACPR, to conduct financial guarantee business from January 2, 2020, and from that date AGUK ceased the underwriting of new business within the EEA. In October 2020, in preparation for Brexit, AGUK transferred to AGE certain existing AGUK policies relating to risks in the EEA under the Part VII Transfer.
AGUK will continue to write new business in the U.K. and certain other non-EEA countries.
France
As an insurance company licensed in France, AGE is regulated by the ACPR and is subject to the provisions of Solvency II as well as related EU delegated regulations as implemented in France, and by the French Insurance Code and the Monetary and Financial Code, both of which set out the primary rules governing the insurance industry in France. In
accordance with French insurance regulation and Solvency II, AGE is permitted to carry on its activities in the countries of the EEA where it is authorized to operate under the freedom to provide services regime.
French regulation of insurance companies imposes on AGE a variety of requirements and restrictions, including minimum solvency capital requirements; change of control; reporting requirements; supervision of management; and intervention and enforcement.
ACPR Supervision and Enforcement
The ACPR has extensive powers to intervene in the affairs of an insurance company, including the power in certain circumstances to withdraw the company’s authorization to carry on a regulated activity. The ACPR carries out the prudential supervision of insurance companies like AGE through a variety of methods, including the collection of information from statistical returns, the review of accountants' reports and insurers’ annual reports and disclosures, visits to insurance companies and regular formal interviews.
The ACPR assesses, on an ongoing basis, whether insurers are acting in a manner consistent with safety and soundness and appropriate policyholder protection, and whether they meet, and are likely to continue to meet, threshold conditions. The ACPR is forward-looking, assessing its objectives not just against current risks, but also against those that could plausibly arise in the future. Its risk assessment framework looks at the insurer’s risk context, the potential impact of failure of the insurer and mitigating factors.
Solvency II and Solvency Requirements
Solvency II is the legal and regulatory basis for the supervision of insurance firms in France. It provides rules on capital adequacy, governance, risk management, and regulatory reporting and public disclosure. Under Solvency II, AGE is subject to certain limits and requirements, including the maintenance of a minimum solvency capital requirement (which depends on the type and amount of insurance business a company writes and the other risks to which it is exposed) and the establishment of technical provisions, which include projected losses and premium earnings. Failure to maintain capital at least equal to the capital requirements under Solvency II is one of the grounds on which the wide powers of intervention conferred upon the ACPR may be exercised.
Among other things, Solvency II introduced a revised risk-based prudential regime which includes the following features: (1) assets and liabilities are generally to be valued at their market value; (2) the amount of required economic capital is intended to ensure, with a probability of 99.5%, that regulated insurance firms are able to meet their obligations to policyholders and beneficiaries over the following 12 months; and (3) reinsurance recoveries are treated as a separate asset (rather than being netted off the underlying insurance liabilities). AGE calculates its solvency capital requirements using the Standard Formula under Solvency II and is in compliance.
Restrictions on Dividend Payments
French company law prohibits AGE from declaring a dividend to its shareholders unless it has “profits and/or reserves available for distribution.” The determination of whether a company has profits available for distribution is based on its accumulated realized profits less its accumulated realized losses. While French law imposes no statutory restrictions on an insurer's ability to declare a dividend, the ACPR’s capital requirements may, in practice, act as a restriction on dividends for AGE.
Change of Control
The French insurance code has requirements regarding acquisitions, disposals, and increases or decreases in ownership of a French-licensed insurance company.
Any transaction enabling a person (a company or individual), acting alone or in concert with other persons, to acquire, increase, dispose of or reduce its ownership in an insurance company licensed in France requires express or implied approval from the ACPR: (i) where such transaction results directly or indirectly in the proportion of shares or voting rights held by that person or those persons rising above 10%, 20%, one-third or 50% of all shares or voting rights; (ii) where the insurance or reinsurance company becomes a subsidiary of that person or those persons; and (iii) where the transaction allows this person or persons to exercise a significant influence over the management of this company.
As a matter of principle, the ACPR has 60 business days from the date on which it acknowledges receipt of the notification of the transaction to notify the reporting entity and the insurance company whose ownership change is contemplated of its refusal or approval of the transaction. In approving or refusing the transaction, the ACPR takes into account various factors, including the reputation of the acquirer, the effect of the transaction on the business and the management of the company, the impact of the transaction on the financial strength of the company, or the ability of the company to continue to comply with applicable regulation.
Human Capital Management
The Company recognizes that its workforce, as a key driver of long-term performance, is among its most valued assets. Accordingly, the Company’s key human capital management objectives are to attract, hire, retain, develop, and support the highest quality employees, including talented and experienced business leaders who drive its corporate strategies and build long-term shareholder value. To promote these objectives, the Company’s human capital management programs are designed to reward and support employees with competitive compensation and benefit packages in each of its locations around the globe, and with professional development opportunities to cultivate talented employees and prepare them for critical roles and future leadership positions.
As of December 31, 2024, the Company employed 361 people worldwide. Approximately 40% of the Company’s workforce is female and 60% is male. The average tenure is approximately 13 years. Other than in the EEA, none of the Company’s employees are subject to collective bargaining agreements. The Company believes its employee relations are satisfactory.
Talent Acquisition, Development and Retention
Recruiting. The Company employs a number of talent acquisition strategies as part of its recruiting practices, including casting a wide net in order to deliberately reach and attract the best and broadest applicant pool, while at the same time ensuring all employment decisions are made in compliance with applicable law.
Learning and Development. The Company invests in the professional development of its workforce because it believes that encouraging employees to realize their full capabilities enhances job satisfaction, leads to increased performance, and enables the Company to cultivate a pipeline of internal talent for succession planning. To support the advancement of its employees, the Company endeavors to strengthen their knowledge and skills by providing access to training, including in leadership, management and effective communication skills, mentoring opportunities, as well as tuition reimbursement assistance.
Mentoring. The Company believes its culture is collegial and collaborative and this fosters informal mentoring and learning. The Company also has a formal one-on-one mentoring program, made available to all employees, to provide an additional learning resource for its employees, facilitate the onboarding of new recruits and reinforce connectedness.
Compensation and Benefits. The Company designed its compensation program to attract, retain, and motivate talented individuals and to recognize and reward outstanding achievement. The components of the program consist of base salary and may include performance-based incentive compensation in the form of an annual cash incentive and deferred compensation in the form of cash and/or equity. The Company believes that a compensation program with both short-term and long-term awards provides fair and competitive compensation and aligns the interests of employees and investors. The Company offers a benefits package designed to promote and support the physical and mental health of its employees as well as financial security. Benefits include life and health (medical, dental and vision) insurance, retirement savings plans (including Company matches of employee contributions), an employee stock purchase plan, hybrid work schedules, paid time off, paid family leave, an employee assistance program, commuter benefits, tuition reimbursement, and child, elder and pet care assistance.
Assured Guaranty employs a number of practices to help ensure that its compensation program is competitive, and aligns with the Company's goals. To promote consistency and fairness, the Company's compensation function is centralized. In addition, the Company conducts periodic reviews of its compensation program and works with independent compensation and benefits consultants to help ensure that its compensation program reflects best practices and current market standards. The Board's Compensation Committee is updated quarterly on different aspects of the Company' s compensation program, practices, and progress.
Culture
Ethical and Respectful Conduct. The Company seeks to foster and maintain strong ethical standards and a reputation as a business that conducts itself professionally and with a high degree of integrity. In addition, the Company works to provide and support a respectful and inclusive environment that values the abilities of each employee, which the Company believes leads to enhanced engagement, maximizing individual performance, and improving retention. The Company believes education and awareness are critical components in promoting the Company's cultural values across the organization. Upon onboarding and annually, the Company requires all employees to complete training in the Company's Global Code of Ethics as well as its policies on the prevention of sexual harassment and discrimination. The Company also provides additional targeted training and guidance to specific personnel regarding anti-fraud, anti-bribery and anti-corruption related matters.
Employee Resource Groups. In an effort to create community and encourage employees to engage with and support one another, Assured Guaranty established five employee resource groups (ERGs), selected based on employee feedback. Membership in the ERGs is voluntary and open to all employees, regardless of whether they identify with the group’s characteristics. Because the ERGs are employee-led, they provide additional opportunities for employees to develop and demonstrate their leadership and organizational skills. Each ERG is supported by two executive sponsors, a member and an ally, who offer guidance and advocate on behalf of the group. The ERGs prepare strategic plans that incorporate the Company’s business objectives into their programming. The ERGs align with the Company’s initiatives by providing mentorship, career development training, and assisting the Company in its efforts to retain, develop and promote its employees and to foster a more collaborative and collegial culture.
Employee-led Diversity and Inclusion Committee. The Company’s employee-led Diversity and Inclusion Committee (D&I Committee) is a critical ally in the Company's efforts to encourage cultural awareness, support a diverse workforce, and foster inclusion. The D&I Committee is composed of dedicated employees with different backgrounds, points of view, levels of seniority and tenure with the Company, who provide input into the Company's initiatives supporting its long-standing commitment to anti-discrimination and equal opportunity in the workplace.
Employee Engagement; Feedback. The Company utilizes employee engagement surveys, conducted by a third-party provider to foster confidentiality, to gauge the effectiveness of its efforts to enhance the employee experience and to gain insight into employee perceptions about various aspects of the work environment.
Governance. The Board’s Environmental and Social Responsibility Committee and Compensation Committee, pursuant to their respective charters, provide oversight of the Company’s human capital management strategies, policies, and initiatives. The Environmental and Social Responsibility Committee is periodically updated on employee engagement, learning and development programs, culture and workplace safety, and initiatives of the employee-led D&I Committee, Corporate Philanthropy Committee and ERGs. The Compensation Committee, which is advised by an independent compensation consultant, is responsible for the oversight of management development and evaluation of succession planning for senior management, and a review of the Company’s senior management compensation benchmarked against a comparison group.
AGL’s Board members also support the Company’s programming by participating in events sponsored by the Company’s ERGs and D&I Committee.
Tax Matters
United States Tax Reform
The 2017 Tax Cuts and Jobs Act of 2017 (the TCJA) lowered the corporate U.S. tax rate to 21%, eliminated the alternative minimum tax, limited the deductibility of interest expense and required a one-time tax on a deemed repatriation of untaxed earnings of non-U.S. subsidiaries. In the context of the taxation of U.S. property/casualty insurance companies such as the Company, the TCJA also modifies the loss reserve discounting rules and the proration rules that apply to reduce reserve deductions to reflect the lower corporate income tax rate. In addition, the TCJA included certain provisions intended to eliminate certain perceived tax advantages of companies (including insurance companies) that have legal domiciles outside the U.S. but have certain U.S. connections and U.S. persons investing in such companies. For example, the TCJA includes a base erosion and anti-abuse tax that could make affiliate reinsurance between U.S. and non-U.S. members of the Company’s group economically unfeasible. In addition, the TCJA introduced a current tax on global intangible low-taxed income that may result in an increase in U.S. corporate income tax imposed on the Company’s U.S. group members with respect to earnings of their non-U.S. subsidiaries. As discussed in more detail below, the TCJA also revised the rules applicable to passive foreign investment companies (PFICs) and controlled foreign corporations (CFCs). Further, it is possible that other legislation could be introduced and enacted by the current Congress or future Congresses that could have an adverse impact on the Company.
Additionally, tax laws and interpretations regarding whether a company is engaged in a U.S. trade or business or whether a company is a CFC or a PFIC or has related person insurance income (RPII) are subject to change, possibly on a retroactive basis. The U.S. Department of the Treasury issued final and proposed regulations intended to clarify the application of the insurance income exception to the classification of a non-U.S. insurer as a PFIC and provide guidance on a range of issues relating to PFICs, and issued proposed regulations that would expand the scope of the RPII rules. New regulations or pronouncements interpreting or clarifying such rules may be forthcoming. The Company cannot be certain if, when or in what form such regulations or pronouncements may be provided and whether such guidance will have a retroactive effect. See Part II, Item 8, Financial Statements and Supplementary Data, Note 13, Income Taxes.
Taxation of AGL and Subsidiaries
Bermuda
On December 27, 2023, the Bermuda government enacted the Corporate Income Tax Act 2023 (the CIT Act), which imposes a corporate income tax at the rate of 15% to in-scope entities for accounting periods starting on or after January 1, 2025. Entities subject to tax under the CIT Act are the Bermuda tax resident entities of multinational groups that have annual revenues of €750 million or greater for at least two of the last four fiscal years.
However, a Bermuda tax resident’s entity’s liability under the CIT Act is subject to the application of any foreign tax credits (FTC) that may arise if the entity’s income is taxed in a jurisdiction outside Bermuda. The CIT Act also contains a number of adjustments to an entity’s net income for tax purposes, including transitional adjustments such as the economic transition adjustment (ETA) which, broadly, permits certain deferred tax assets to be utilized against future liabilities as a result of a step-up in the tax basis of assets and liabilities as of September 30, 2023 for those entities that are (or will be) subject to the CIT Act but were Bermuda tax resident as of the step-up date. Under the CIT Act of Bermuda, any liability for the tax will apply regardless of any assurances previously provided under the Exempted Undertakings Tax Protection Act 1966 of Bermuda.
United States
AGL has conducted and intends to continue to conduct substantially all of its operations outside the U.S. and to limit the U.S. contacts of AGL and its non-U.S. subsidiaries (except AGRO, which elected to be taxed as a U.S. corporation) so that they should not be engaged in a trade or business in the U.S. A non-U.S. corporation, such as AG Re, that is deemed to be engaged in a trade or business in the U.S. would be subject to U.S. income tax at regular corporate rates, as well as the branch profits tax, on its income which is treated as effectively connected with the conduct of that trade or business, unless the corporation is entitled to relief under the permanent establishment provision of an applicable tax treaty, as discussed below. Such income tax, if imposed, would be based on effectively connected income computed in a manner generally analogous to that applied to the income of a U.S. corporation, except that a non-U.S. corporation would generally be entitled to deductions and credits only if it timely files a U.S. federal income tax return. AGL, AG Re and certain of the other non-U.S. subsidiaries have filed and will continue to file protective U.S. federal income tax returns on a timely basis in order to preserve the right to claim income tax deductions and credits if it is ever determined that they are subject to U.S. federal income tax. The highest marginal federal income tax rates currently are 21% for a corporation’s effectively connected income and 30% for the “branch profits” tax.
Under the income tax treaty between Bermuda and the U.S. (the Bermuda Treaty), a Bermuda insurance company would not be subject to U.S. income tax on income found to be effectively connected with a U.S. trade or business unless that trade or business is conducted through a permanent establishment in the U.S. AG Re currently intends to conduct its activities so that it does not have a permanent establishment in the U.S.
An insurance enterprise resident in Bermuda generally will be entitled to the benefits of the Bermuda Treaty if: (i) more than 50% of its shares are owned beneficially, directly or indirectly, by individual residents of the U.S. or Bermuda or U.S. citizens; and (ii) its income is not used in substantial part, directly or indirectly, to make disproportionate distributions to, or to meet certain liabilities of, persons who are neither residents of either the U.S. or Bermuda nor U.S. citizens.
Non-U.S. insurance companies carrying on an insurance business within the U.S. have a certain minimum amount of effectively connected net investment income determined in accordance with a formula that depends, in part, on the amount of U.S. risk insured or reinsured by such companies. If AG Re or another of the Company’s Bermuda subsidiaries is considered to be engaged in the conduct of an insurance business in the U.S. and is not entitled to the benefits of the Bermuda Treaty in general (because it fails to satisfy one of the limitations on treaty benefits discussed above), the Internal Revenue Code of 1986,
as amended (the Code), could subject a significant portion of AG Re’s or another of the Company’s Bermuda subsidiary’s investment income to U.S. income tax.
AGL, as a U.K. tax resident, would not be subject to U.S. income tax on any income found to be effectively connected with a U.S. trade or business under the income tax treaty between the U.S. and the U.K. (the U.K. Treaty), unless that trade or business is conducted through a permanent establishment in the U.S. AGL intends to conduct its activities so that it does not have a permanent establishment in the U.S.
Non-U.S. corporations not engaged in a trade or business in the U.S., and those that are engaged in a U.S. trade or business with respect to their non-effectively connected income are nonetheless subject to U.S. withholding tax on certain “fixed or determinable annual or periodic gains, profits and income” derived from sources within the U.S. (such as dividends and certain interest on investments), subject to exemption under the Code or reduction by applicable treaties. The standard non-treaty rate of U.S. withholding tax is currently 30%. The Bermuda Treaty does not reduce the U.S. withholding rate on U.S.-sourced investment income. The U.K. Treaty reduces or eliminates U.S. withholding tax on certain U.S.-sourced investment income, including dividends from U.S. companies to U.K. resident persons entitled to the benefit of the U.K. Treaty.
The U.S. also imposes an excise tax on insurance and reinsurance premiums paid to non-U.S. insurers with respect to risks of a U.S. person located wholly or partly within the U.S. or risks of a foreign person engaged in a trade or business in the U.S. which are located within the U.S. The rates of tax applicable to premiums paid are 4% for direct casualty insurance premiums and 1% for reinsurance premiums.
AGRO has elected to be treated as a U.S. corporation for all U.S. federal tax purposes and, as such, AGRO, together with AGL’s U.S. subsidiaries, is subject to taxation in the U.S. at regular corporate rates.
If AGRO were to pay dividends to its U.S. holding company parent and that U.S. holding company were to pay dividends to its Bermudian parent AG Re, such dividends would be subject to U.S. withholding tax at a rate of 30%.
United Kingdom
In November 2013, AGL became tax resident in the U.K. AGL remains a Bermuda-based company and its administrative and head office functions continue to be carried on in Bermuda. The AGL common shares have not changed and continue to be listed on the New York Stock Exchange (NYSE).
As a company that is not incorporated in the U.K., AGL will be considered tax resident in the U.K. only if it is “centrally managed and controlled” in the U.K. Central management and control constitutes the highest level of control of a company’s affairs. From November 6, 2013, AGL’s Board began to manage the affairs of AGL in such a way as to maintain its status as a company that is tax resident in the U.K.
As a U.K. tax resident company, AGL is subject to the tax rules applicable to companies resident in the U.K., including the benefits afforded by the U.K.’s tax treaties.
As a U.K. tax resident, AGL is required to file a corporation tax return with His Majesty’s Revenue & Customs (HMRC). AGL is subject to U.K. corporation tax in respect of its worldwide profits (both income and capital gains), subject to any applicable exemptions. The main rate of corporation tax is currently 25%. AGL has also registered in the U.K. to report its value-added tax (VAT) liability. The current standard rate of VAT is 20%. Further, with effect for accounting periods starting on or after December 31, 2023, AGL may be liable to charges under the U.K.’s multinational top-up tax to the extent that any member (or members) of the group is resident in a territory other than the U.K. and that member (or those members, collectively) has an effective tax rate of less than 15% in that territory. Alternatively, AGL may be liable to charges under the U.K.’s domestic top-up tax if profits arising in the U.K. are taxed at a rate of less than 15%.
The dividends AGL receives from its direct subsidiaries should be exempt from U.K. corporation tax due to the exemption in section 931D of the U.K. Corporation Tax Act 2009. In addition, any dividends paid by AGL to its shareholders should not be subject to any withholding tax in the U.K. The non-U.K. resident subsidiaries intend to operate in such a manner that their profits are outside the scope of the charge under the “controlled foreign companies” regime. Accordingly, Assured Guaranty does not expect any profits of non-U.K. resident members of the group to be attributed to AGL and taxed in the U.K. under the CFC regime. In 2013, Assured Guaranty obtained clearance from HMRC confirming this on the basis of the facts and intentions as they were at the time.
The U.K. enacted legislation in July 2023 and February 2024, and HMRC published guidance in respect of such legislation, which, broadly, implements the Organization for Economic Co-operation and Development (OECD) Model Rules for Pillar Two into U.K. domestic legislation for accounting periods starting on or after December 31, 2023. Pillar Two comprises rules granting jurisdictions additional taxing rights where other relevant jurisdictions have either not taxed relevant profits or those profits have been subject to a rate of tax below 15%. The rules apply to multinational groups with consolidated group revenue of €750 million or more in at least two out of the preceding four fiscal years. Through a series of complex interlocking rules, the intended effect is that low or no taxed profits would be subject to tax at an overall rate of at least 15%. See Item 1A. Risk Factors, Risks Related to Taxation captioned “AGL may, and AG Re and AGRO will, become subject to taxes in Bermuda, which may adversely affect the Company’s future results of operations and an investment in the Company” and “Assured Guaranty’s financial results may be affected by measures taken in response to the OECD BEPS project.”
Taxation of Shareholders
Bermuda Taxation
Currently, there is no Bermuda capital gains tax, or withholding or other tax payable on principal, interest or dividends paid to the holders of the AGL common shares.
United States Taxation
This discussion is based upon the Code, the regulations promulgated thereunder and any relevant administrative rulings or pronouncements or judicial decisions, all as in effect on the date of filing and as currently interpreted, and does not take into account possible changes in such tax laws or interpretations thereof, which may apply retroactively. This discussion does not include any description of the tax laws of any state or local governments within the U.S. or any foreign government.
The following summary sets forth the material U.S. federal income tax considerations related to the purchase, ownership and disposition of AGL’s shares. Unless otherwise stated, this summary deals only with holders that are U.S. Persons (as defined below) who purchase and hold their shares and who hold their shares as capital assets within the meaning of section 1221 of the Code. The following discussion is only a discussion of the material U.S. federal income tax matters as described herein and does not purport to address all of the U.S. federal income tax consequences that may be relevant to a particular shareholder in light of such shareholder’s specific circumstances. For example, special rules apply to certain shareholders, such as partnerships, insurance companies, regulated investment companies, real estate investment trusts, dealers or traders in securities, tax exempt organizations, expatriates, persons liable for alternative minimum tax, U.S. accrual method taxpayers subject to special tax accounting rules as a result of any item of gross income with respect to AGL’s shares being taken into account in an applicable financial statement as described in section 451(b) of the Code, persons that do not hold their securities in the U.S. dollar, persons who are considered with respect to AGL or any of its non-U.S. subsidiaries as “United States shareholders” for purposes of the CFC rules of the Code (generally, a U.S. Person, as defined below, who owns or is deemed to own 10% or more of the total combined voting power or value of all classes of AGL shares or the shares of any of AGL’s non-U.S. subsidiaries (i.e., 10% U.S. Shareholders)), or persons who hold the common shares as part of a hedging or conversion transaction or as part of a short-sale or straddle or other integrated transaction. Any such shareholder should consult their tax adviser.
If a partnership holds AGL’s shares, the tax treatment of the partners will generally depend on the status of the partner and the activities of the partnership. Partners of a partnership owning AGL’s shares should consult their tax advisers.
For purposes of this discussion, the term “U.S. Person” means: (i) a citizen or resident of the U.S.; (ii) a partnership or corporation, created or organized in or under the laws of the U.S., or organized under any political subdivision thereof; (iii) an estate the income of which is subject to U.S. federal income taxation regardless of its source; (iv) a trust if either (x) a court within the U.S. is able to exercise primary supervision over the administration of such trust and one or more U.S. Persons have the authority to control all substantial decisions of such trust or (y) the trust has a valid election in effect to be treated as a U.S. Person for U.S. federal income tax purposes; or (v) any other person or entity that is treated for U.S. federal income tax purposes as if it were one of the foregoing.
Taxation of Distributions. Subject to the discussions below relating to the potential application of the CFC, RPII and PFIC rules, cash distributions, if any, made with respect to AGL’s shares will constitute dividends for U.S. federal income tax purposes to the extent paid out of current or accumulated earnings and profits of AGL (as computed using U.S. tax principles). Dividends paid by AGL to corporate shareholders will not be eligible for the dividends received deduction. To the extent such distributions exceed AGL's earnings and profits, they will be treated first as a return of the shareholder’s basis in the common shares to the extent thereof, and then as gain from the sale of a capital asset.
AGL believes dividends paid by AGL on its common shares to non-corporate holders will be eligible for reduced rates of tax at the rates applicable to long-term capital gains as “qualified dividend income,” provided that AGL is not a PFIC and certain other requirements, including stock holding period requirements, are satisfied.
Classification of AGL or its Non-U.S. Subsidiaries as a CFC. Each 10% U.S. Shareholder (as defined below) of a non-U.S. corporation that is a CFC at any time during a taxable year that owns, directly or indirectly through non-U.S. entities, shares in the non-U.S. corporation on the last day of the non-U.S. corporation’s taxable year on which it is a CFC, must include in its gross income, for U.S. federal income tax purposes, its pro rata share of the CFC’s “subpart F income,” even if the subpart F income is not distributed. “Subpart F income” of a non-U.S. insurance corporation typically includes foreign personal holding company income (such as interest, dividends and other types of passive income), as well as insurance and reinsurance income (including underwriting and investment income). A non-U.S. corporation is considered a CFC if 10% U.S. Shareholders own (directly, indirectly through non-U.S. entities or by attribution by application of the constructive ownership rules of section 958(b) of the Code (i.e., constructively)) more than 50% of the total combined voting power of all classes of voting stock of such non-U.S. corporation, or more than 50% of the total value of all stock of such corporation on any day during the taxable year of such corporation. For purposes of taking into account insurance income, a CFC also includes a non-U.S. corporation in which more than 25% of the total combined voting power of all classes of stock or more than 25% of the total value of the stock is owned by 10% U.S. Shareholders, on any day during the taxable year of such corporation. A “10% U.S. Shareholder” is a U.S. Person who owns (directly, indirectly through non-U.S. entities or constructively) at least 10% of the total combined voting power or value of all classes of stock of the non-U.S. corporation. The TCJA expanded the definition of 10% U.S. Shareholder to include ownership by value (rather than just vote), so provisions in the Company’s organizational documents that cut back voting power to potentially avoid 10% U.S. Shareholder status will no longer mitigate the risk of 10% U.S. Shareholder status. AGL believes that because of the dispersion of AGL’s share ownership, no U.S. Person who owns shares of AGL directly or indirectly through one or more non-U.S. entities should be treated as owning (directly, indirectly through non-U.S. entities, or constructively), 10% or more of the total voting power or value of all classes of shares of AGL or any of its non-U.S. subsidiaries. However, AGL’s shares may not be as widely dispersed as the Company believes due to, for example, the application of certain ownership attribution rules, and no assurance may be given that a U.S. Person who owns the Company's shares will not be characterized as a 10% U.S. Shareholder. In addition, the direct and indirect subsidiaries of AGUS are characterized as CFCs and any subpart F income generated will be included in the gross income of the applicable domestic subsidiaries in the AGL group.
The RPII CFC Provisions. The following discussion generally is applicable only if the gross RPII of AG Re or any other non-U.S. insurance subsidiary that either: (i) has not made an election under section 953(d) of the Code to be treated as a U.S. corporation for all U.S. federal tax purposes or (ii) is not a CFC owned directly or indirectly by AGUS (each, a Foreign Insurance Subsidiary, or collectively, with AG Re, the Foreign Insurance Subsidiaries) is 20% or more of the Foreign Insurance Subsidiary’s gross insurance income for the taxable year and the 20% Ownership Exception (as defined below) is not met. The following discussion generally would not apply for any taxable year in which the Foreign Insurance Subsidiary’s gross RPII falls below the 20% threshold or the 20% Ownership Exception is met. Although the Company cannot be certain, it believes that each Foreign Insurance Subsidiary has been, in prior years of operations, and will be, for the foreseeable future, either below the 20% threshold or in compliance with the requirements of 20% Ownership Exception for each tax year.
RPII is any “insurance income” (as defined below) attributable to policies of insurance or reinsurance with respect to which the person (directly or indirectly) insured is a “RPII shareholder” (as defined below) or a “related person” (as defined below) to such RPII shareholder. In general, and subject to certain limitations, "insurance income" is income (including premium and investment income) attributable to the issuing of any insurance or reinsurance contract which would be taxed under the portions of the Code relating to insurance companies if the income were the income of a domestic insurance company. For purposes of inclusion of the RPII of a Foreign Insurance Subsidiary in the income of RPII shareholders, unless an exception applies, the term "RPII shareholder" means any U.S. Person who owns (directly or indirectly through non-U.S. entities) any amount of AGL’s common shares. Generally, the term “related person” for this purpose means someone who controls or is controlled by the RPII shareholder or someone who is controlled by the same person or persons which control the RPII shareholder. Control is measured by either more than 50% in value or more than 50% in voting power of stock applying certain constructive ownership principles. A Foreign Insurance Subsidiary will be treated as a CFC under the RPII provisions if RPII shareholders are treated as owning (directly, indirectly through non-U.S. entities or constructively) 25% or more of the shares of AGL by vote or value.
RPII Exceptions. The special RPII rules do not apply if: (i) at all times during the taxable year less than 20% of the voting power and less than 20% of the value of the stock of AGL (the 20% Ownership Exception) is owned (directly or indirectly through entities) by persons who are (directly or indirectly) insured under any policy of insurance or reinsurance issued by a Foreign Insurance Subsidiary or related persons to any such person; (ii) RPII, determined on a gross basis, is less than 20% of a Foreign Insurance Subsidiary’s gross insurance income for the taxable year (the 20% Gross Income Exception);
(iii) a Foreign Insurance Subsidiary elects to be taxed on its RPII as if the RPII were effectively connected with the conduct of a U.S. trade or business, and to waive all treaty benefits with respect to RPII and meet certain other requirements; or (iv) a Foreign Insurance Subsidiary elects to be treated as a U.S. corporation and waive all treaty benefits and meet certain other requirements. The Foreign Insurance Subsidiaries do not intend to make either of these elections. Where none of these exceptions applies, each U.S. Person owning or treated as owning any shares in AGL (and therefore, indirectly, in a Foreign Insurance Subsidiary) on the last day of AGL’s taxable year will be required to include in its gross income for U.S. federal income tax purposes its share of the RPII for the portion of the taxable year during which a Foreign Insurance Subsidiary was a CFC under the RPII provisions, determined as if all such RPII were distributed proportionately only to such U.S. Persons at that date, but limited by each such U.S. Person’s share of a Foreign Insurance Subsidiary’s current-year earnings and profits as reduced by the U.S. Person’s share, if any, of certain prior-year deficits in earnings and profits. The Foreign Insurance Subsidiaries intend to operate in a manner that is intended to ensure that each qualifies for either the 20% Gross Income Exception or 20% Ownership Exception.
Computation of RPII. For any year in which a Foreign Insurance Subsidiary does not meet the 20% Ownership Exception or the 20% Gross Income Exception, AGL may also seek information from its shareholders as to whether beneficial owners of shares at the end of the year are U.S. Persons so that the RPII may be determined and apportioned among such persons; to the extent AGL is unable to determine whether a beneficial owner of shares is a U.S. Person, AGL may assume that such owner is not a U.S. Person, thereby increasing the per share RPII amount for all known RPII shareholders. The amount of RPII includable in the income of a RPII shareholder is based upon the net RPII income for the year after deducting related expenses such as losses, loss reserves and operating expenses. If a Foreign Insurance Subsidiary meets the 20% Ownership Exception or the 20% Gross Income Exception, RPII shareholders will not be required to include RPII in their taxable income.
Apportionment of RPII to U.S. Holders. Every RPII shareholder who owns shares on the last day of any taxable year of AGL in which a Foreign Insurance Subsidiary does not meet the 20% Ownership Exception or the 20% Gross Income Exception should expect that for such year it will be required to include in gross income its share of a Foreign Insurance Subsidiary's RPII for the portion of the taxable year during which the Foreign Insurance Subsidiary was a CFC under the RPII provisions, whether or not distributed, even though it may not have owned the shares throughout such period. A RPII shareholder who owns shares during such taxable year but not on the last day of the taxable year is not required to include in gross income any part of the Foreign Insurance Subsidiary’s RPII.
Basis Adjustments. A RPII shareholder’s tax basis in its common shares will be increased by the amount of any RPII the shareholder includes in income. The RPII shareholder may exclude from income the amount of any distributions by AGL out of previously taxed RPII income. The RPII shareholder’s tax basis in its common shares will be reduced by the amount of such distributions that are excluded from income.
Uncertainty as to Application of RPII. The RPII provisions are complex and have never been interpreted by the courts or the Treasury Department in final regulations; regulations interpreting the RPII provisions of the Code exist only in proposed form. Further, proposed regulations could, if finalized in their current form, substantially expand the definition of RPII to include insurance income of our Foreign Insurance Subsidiaries related to affiliate reinsurance transactions. These regulations would apply to taxable years beginning after the date the regulations are finalized. Although we cannot predict whether, when or in what form the proposed regulations might be finalized, the proposed regulations, if finalized in their current form, could limit our ability to execute affiliate reinsurance transactions that would otherwise be undertaken for non-tax business reasons in the future and could increase the risk that gross RPII could constitute 20% or more of the gross insurance income of one or more of our Foreign Insurance Subsidiaries in a particular taxable year, which could result in such RPII being taxable to U.S. Persons that own or are treated as owning shares of AGL. Accordingly, the meaning of the RPII provisions and the application thereof to the Foreign Insurance Subsidiaries is uncertain. In addition, the Company cannot be certain that the amount of RPII or the amounts of the RPII inclusions for any particular RPII shareholder, if any, will not be subject to adjustment based upon subsequent Internal Revenue Service (IRS) examination. U.S. Persons owning or treated as owning shares of AGL should consult their tax advisors as to the effect of these uncertainties.
Information Reporting. Under certain circumstances, U.S. Persons owning shares (directly, indirectly or constructively) in a non-U.S. corporation are required to file IRS Form 5471, Information Return of U.S. Persons With Respect To Certain Foreign Corporations, with their U.S. federal income tax returns. Generally, information reporting on IRS Form 5471 is required by: (i) a person who is treated as a RPII shareholder; (ii) a 10% U.S. Shareholder of a non-U.S. corporation that is a CFC at any time during any tax year of the non-U.S. corporation and who owned the stock on the last day of that year; and (iii) under certain circumstances, a U.S. Person who acquires stock in a non-U.S. corporation and as a result thereof owns 10% or more of the voting power or value of such non-U.S. corporation, whether or not such non-U.S. corporation is a CFC. For any taxable year in which AGL determines that neither the 20% Gross Income Exception nor the 20% Ownership Exception applies, AGL will provide to all U.S. Persons registered as shareholders of its shares a completed IRS Form 5471 or
the relevant information necessary to complete the form. Failure to file IRS Form 5471 may result in penalties. In addition, U.S. shareholders should consult their tax advisers with respect to other information reporting requirements that may be applicable to them.
U.S. Persons holding the Company’s shares should consider their possible obligation to file FinCEN Form 114, Foreign Bank and Financial Accounts Report, with respect to their shares. Additionally, such U.S. and non-U.S. persons should consider their possible obligations to annually report certain information with respect to the non-U.S. accounts with their U.S. federal income tax returns. Shareholders should consult their tax advisers with respect to these or any other reporting requirement which may apply with respect to their ownership of the Company’s shares.
Tax-Exempt Shareholders. Tax-exempt entities will be required to treat certain subpart F insurance income, including RPII, that is includable in income by the tax-exempt entity as unrelated business taxable income. Prospective investors that are tax exempt entities are urged to consult their tax advisers as to the potential impact of the unrelated business taxable income provisions of the Code. A tax-exempt organization that is treated as a 10% U.S. Shareholder or a RPII Shareholder also must file IRS Form 5471 in certain circumstances.
Dispositions of AGL’s Shares. Subject to the discussions below relating to the potential application of the Code section 1248 and PFIC rules, holders of shares generally should recognize capital gain or loss for U.S. federal income tax purposes on the sale, exchange or other disposition of shares in the same manner as on the sale, exchange or other disposition of any other shares held as capital assets. If the holding period for these shares exceeds one year, any gain will be subject to tax at the marginal tax rate applicable to long term capital gains.
Code section 1248 provides that if a U.S. Person sells or exchanges stock in a non-U.S. corporation and such person owned, directly, indirectly through non-U.S. entities or constructively, 10% or more of the voting power of the corporation at any time during the five-year period ending on the date of disposition when the corporation was a CFC, any gain from the sale or exchange of the shares will be treated as a dividend to the extent of the CFC’s earnings and profits (determined under U.S. federal income tax principles) during the period that the shareholder held the shares and while the corporation was a CFC (with certain adjustments). The Company believes that because of the dispersion of AGL’s share ownership, no U.S. shareholder of AGL should be treated as owning (directly, indirectly through non-U.S. entities or constructively) 10% or more of the total voting power of AGL; to the extent this is the case this application of Code Section 1248 under the regular CFC rules should not apply to dispositions of AGL’s shares. A 10% U.S. Shareholder may in certain circumstances be required to report a disposition of shares of a CFC by attaching IRS Form 5471 to the U.S. federal income tax or information return that it would normally file for the taxable year in which the disposition occurs. In the event this is determined necessary, AGL will provide a completed IRS Form 5471 or the relevant information necessary to complete the Form. Code section 1248 in conjunction with the RPII rules also applies to the sale or exchange of shares in a non-U.S. corporation if the non-U.S. corporation would be treated as a CFC for RPII purposes regardless of whether the shareholder is a 10% U.S. Shareholder or whether the 20% Ownership Exception or 20% Gross Income Exception applies. Existing proposed regulations do not address whether Code section 1248 would apply if a non-U.S. corporation is not a CFC but the non-U.S. corporation has a subsidiary that is a CFC and that would be taxed as an insurance company if it were a U.S. domestic corporation. The Company believes, however, that this application of Code section 1248 under the RPII rules should not apply to dispositions of AGL’s shares because AGL will not be directly engaged in the insurance business. The Company cannot be certain, however, that the IRS will not interpret the proposed regulations in a contrary manner or that the Treasury Department will not amend the proposed regulations to provide that these rules will apply to dispositions of common shares. Prospective investors should consult their tax advisers regarding the effects of these rules on a disposition of common shares.
Passive Foreign Investment Companies. In general, a non-U.S. corporation will be a PFIC during a given year if: (i) 75% or more of its gross income constitutes “passive income” (the 75% test); or (ii) 50% or more of its assets produce passive income (the 50% test) and once characterized as a PFIC will generally retain PFIC status for future taxable years with respect to its U.S. shareholders in the taxable year of the initial PFIC characterization.
If AGL were characterized as a PFIC during a given year, each U.S. Person holding AGL’s shares would be subject to a penalty tax at the time of the sale at a gain of, or receipt of an "excess distribution" with respect to, their shares, unless such person: (i) is a 10% U.S. Shareholder and AGL is a CFC; or (ii) made a “qualified electing fund election” or “mark-to-market” election. It is uncertain that AGL would be able to provide its shareholders with the information necessary for a U.S. Person to make a qualified electing fund election. In addition, if AGL were considered a PFIC, upon the death of any U.S. individual owning common shares, such individual’s heirs or estate would not be entitled to a “step-up” in the basis of the common shares that might otherwise be available under U.S. federal income tax laws. In general, a shareholder receives an "excess distribution" if the amount of the distribution is more than 125% of the average distribution with respect to the common shares during the three preceding taxable years (or shorter period during which the taxpayer held common shares). In general, the penalty tax is
equivalent to an interest charge on taxes that are deemed due during the period the shareholder owned the common shares, computed by assuming that the excess distribution or gain (in the case of a sale) with respect to the common shares was taken in equal portion at the highest applicable tax rate on ordinary income throughout the shareholder's period of ownership. The interest charge is equal to the applicable rate imposed on underpayments of U.S. federal income tax for such period. In addition, a distribution paid by AGL to U.S. shareholders that is characterized as a dividend and is not characterized as an excess distribution would not be eligible for reduced rates of tax as qualified dividend income. A U.S. Person that is a shareholder in a PFIC may also be subject to additional information reporting requirements, including the annual filing of IRS Form 8621, Information Return by a Shareholder of a Passive Foreign Investment Company or Qualified Electing Fund.
For the above purposes, passive income generally includes interest, dividends, annuities and other investment income. The PFIC rules, as amended by the TCJA, provide that income derived in the active conduct of an insurance business by a qualifying insurance corporation is not treated as passive income. The PFIC provisions also contain a look-through rule under which a non-U.S. corporation shall be treated as if it “received directly its proportionate share of the income...” and as if it “held its proportionate share of the assets...” of any other corporation in which it owns at least 25% of the value of the stock. A second PFIC look-through rule would treat stock of a U.S. corporation owned by another U.S. corporation which is at least 25% owned (by value) by a non-U.S. corporation as a non-passive asset that generates non-passive income for purposes of determining whether the non-U.S. corporation is a PFIC.
The insurance income exception originally was intended to ensure that income derived by a bona fide insurance company is not treated as passive income, except to the extent such income is attributable to financial reserves in excess of the reasonable needs of the insurance business. The Company expects, for purposes of the PFIC rules, that each of AGL’s insurance subsidiaries is unlikely to have financial reserves in excess of the reasonable needs of its insurance business in each year of operations. However, the TCJA limits the insurance income exception to a non-U.S. insurance company that is a qualifying insurance corporation that would be taxable as an insurance company if it were a U.S. corporation and maintains insurance liabilities of more than 25% of such company’s assets for a taxable year (or maintains insurance liabilities that at least equal or exceed 10% of its assets, is predominantly engaged in an insurance business and satisfies a facts and circumstances test that requires a showing that the failure to exceed the 25% threshold is due to runoff-related or rating-related circumstances) (the Reserve Test). Further, the U.S. Treasury Department and the IRS issued final and proposed regulations (the 2020 Regulations) intended to clarify the application of the PFIC provisions to a non-U.S. insurance company and provide guidance on a range of issues relating to PFICs, including the application of the look-through rule, the treatment of income and assets of certain U.S. insurance subsidiaries for purposes of the look-through rule and the extension of the look-through rule to 25% or more owned partnerships. The 2020 Regulations define insurance liabilities for purposes of the Reserve Test, tighten the Reserve Test and the statutory cap on insurance liabilities, and provide guidance on the runoff-related and rating-related circumstances for purposes of the 10% test (including a provision that deems certain financial guaranty insurers that fail the 25% test to meet the rating-related circumstances test). The 2020 Regulations also propose that a non-U.S. insurance company will qualify for the insurance company exception only if a factual requirements test or an active conduct percentage test is satisfied. The factual requirements test will be met if the non-U.S. insurance company’s officers and employees perform its substantial managerial and operational activities on a regular and continuous basis with respect to its core functions and virtually all of the active decision-making functions relevant to underwriting on a contract-by-contract basis (taking into account activities of officers and employees of certain related entities in certain cases). The active conduct percentage test will be satisfied if: (1) the total costs incurred by the non-U.S. insurance company with respect to its officers and employees (including officers and employees of certain related entities) for services related to core functions (other than investment activities) equal at least 50% of the total costs incurred for all such services; and (2) the non-U.S. insurer’s officers and employees oversee any part of the non-U.S. insurance company’s core functions, including investment management, that are outsourced to an unrelated party. Services provided by officers and employees of certain related entities are only taken into account in the numerator of the active conduct percentage if the non-U.S. insurance company exercises regular oversight and supervision over such services and compensation arrangements meet certain requirements. The 2020 Regulations also propose that a non-U.S. insurance company with no or a nominal number of employees that relies exclusively or almost exclusively upon independent contractors (other than certain related entities) to perform its core functions will not be treated as engaged in the active conduct of an insurance business. The Company believes that, based on the application of the PFIC look-through rules described above and the Company's plan of operations for the current and future years, AGL should not be characterized as a PFIC. However, as the Company cannot predict the likelihood of finalization of the proposed 2020 Regulations or the scope, nature or impact of the 2020 Regulations on us, or whether the Company’s non-U.S. insurance subsidiaries will be able to satisfy the Reserve Test in future years and the interaction of the PFIC look-through rules is not clear, no assurance may be given that the Company will not be characterized as a PFIC. Prospective investors should consult their tax adviser as to the effects of the PFIC rules.
Foreign tax credit. If U.S. Persons own a majority of AGL’s common shares, only a portion of the current income inclusions, if any, under the CFC, RPII and PFIC rules and of dividends paid by AGL (including any gain from the sale of common shares that is treated as a dividend under section 1248 of the Code) will be treated as foreign source income for
purposes of computing a shareholder’s U.S. foreign tax credit limitations. The Company will consider providing shareholders with information regarding the portion of such amounts constituting foreign source income to the extent such information is reasonably available. It is also likely that substantially all of the “subpart F income,” RPII and dividends that are foreign source income will constitute either “passive” or “general” income. Thus, it may not be possible for most shareholders to utilize excess FTC to reduce U.S. tax on such income.
Information Reporting and Backup Withholding on Distributions and Disposition Proceeds. Information returns may be filed with the IRS in connection with distributions on AGL’s common shares and the proceeds from a sale or other disposition of AGL’s common shares unless the holder of AGL’s common shares establishes an exemption from the information reporting rules. A holder of common shares that does not establish such an exemption may be subject to U.S. backup withholding tax on these payments if the holder is not a corporation or non-U.S. Person or fails to provide its taxpayer identification number or otherwise comply with the backup withholding rules. The amount of any backup withholding from a payment to a U.S. Person will be allowed as a credit against the U.S. Person’s U.S. federal income tax liability and may entitle the U.S. Person to a refund, provided that the required information is furnished to the IRS.
United Kingdom
The following discussion is intended to be only a general guide to certain U.K. tax consequences of holding AGL common shares, under current law and the current practice of HMRC, either of which is subject to change at any time, possibly with retrospective effect. Except where otherwise stated, this discussion applies only to shareholders who are not (and have not recently been) resident or (in the case of individuals) domiciled for tax purposes in the U.K. who hold their AGL common shares as an investment and who are the absolute beneficial owners of their common shares. This discussion may not apply to certain shareholders, such as dealers in securities, life insurance companies, collective investment schemes, shareholders who are exempt from tax and shareholders who have (or are deemed to have) acquired their shares by virtue of an office or employment. Such shareholders may be subject to special rules.
The following statements do not purport to be a comprehensive description of all the U.K. considerations that may be relevant to any particular shareholder. Any person who is in any doubt as to their tax position should consult an appropriate professional tax adviser.
AGL’s Tax Residency. AGL is not incorporated in the U.K., but from November 6, 2013, AGL’s Board has managed its affairs with the intent to maintain its status as a company that is tax resident in the U.K.
Dividends. Under current U.K. tax law, AGL is not required to withhold tax at source from dividends paid to the holders of the AGL common shares.
Capital gains. U.K. tax is not normally charged on any capital gains realized by non-U.K. shareholders in AGL unless, in the case of a corporate shareholder, at or before the time the gain accrues, the shareholding is used in or for the purposes of a trade carried on by the non-resident shareholder through a permanent establishment in the U.K. or for the purposes of that permanent establishment. Similarly, an individual shareholder who carries on a trade, profession or vocation in the U.K. through a branch or agency may be liable for U.K. tax on the gain if such shareholder disposes of shares that are, or have been, used, held or acquired for the purposes of such trade, profession or vocation or for the purposes of such branch or agency. This treatment applies regardless of the U.K. tax residence status of AGL.
Stamp Taxes. On the basis that AGL does not currently intend to maintain a share register in the U.K., there should be no U.K. stamp duty reserve tax on a purchase of common shares in AGL. A conveyance or transfer on sale of common shares in AGL will not be subject to U.K. stamp duty, provided that the instrument of transfer is not executed in the U.K. and does not relate to any property situated, or any matter or thing done, or to be done, in the U.K.
Available Information
The Company maintains a website at assuredguaranty.com. The Company makes available, free of charge, on its website (under assuredguaranty.com/sec-filings) the Company’s annual report on Form 10-K, quarterly reports on Form 10-Q, current reports on Form 8-K, and amendments to those reports filed or furnished pursuant to Section 13 (a) or 15 (d) of the Exchange Act as soon as reasonably practicable after the Company files such material with, or furnishes it to, the SEC. The Company also makes available, free of charge, through its website (under assuredguaranty.com/governance) links to the Company’s Corporate Governance Guidelines, its Global Code of Ethics, AGL's Bye-Laws and the charters for its Board committees, as well as certain of the Company's environmental and social policies and statements. In addition, the SEC
maintains an Internet site (at sec.gov) that contains reports, proxy and information statements, and other information regarding issuers that file electronically with the SEC.
The Company routinely posts important information for investors on its website (under assuredguaranty.com/company-statements and, more generally, under the Investor Information tab at assuredguaranty.com/investor-information and Businesses tab at assuredguaranty.com/businesses). The Company also maintains a social media account on LinkedIn (linkedin.com/company/assured-guaranty/). The Company uses its website and may use its social media account as a means of disclosing material information and for complying with its disclosure obligations under SEC Regulation FD (Fair Disclosure). Accordingly, investors should monitor the Company Statements, Investor Information and Businesses portions of the Company’s website as well as the Company’s social media account on LinkedIn, in addition to following the Company’s press releases, SEC filings, public conference calls, presentations and webcasts.
The information contained on, or that may be accessed through, the Company’s website is not incorporated by reference into, and is not a part of, this report.
ITEM 1A. RISK FACTORS
You should carefully consider the following information, together with the information contained in AGL’s other filings with the SEC. The risks and uncertainties discussed below are not the only ones the Company faces. However, these are the risks that the Company’s management believes are material. The Company may face additional risks or uncertainties that are not presently known to the Company or that management currently deems immaterial, and such risks or uncertainties also may impair its business or results of operations. The risks discussed below could result in a significant or material adverse effect on the Company’s financial condition, results of operations, capital, liquidity, business prospects and/or share price.
Summary of Risk Factors
The following summarizes some of the risks and uncertainties that may adversely affect the Company’s financial condition, results of operations, capital, liquidity, business prospects and/or share price. It is provided for convenience and should be read together with the more expansive explanations below this summary.
Risks Related to Economic, Market and Political Conditions and Natural Phenomena
•Developments in the global financial markets, political systems and economy generally.
•Significant budget deficits and pension funding and revenue shortfalls of certain public finance obligors that issue obligations the Company insures.
•Significant risks from large individual or correlated exposures.
•Losses on obligations insured by the Company significantly in excess of those expected by the Company or recoveries significantly below those expected by the Company.
•Higher U.S. debt-to-GDP ratio and/or downgrades to the U.S. government’s sovereign credit ratings, or to the credit ratings of instruments issued, insured or guaranteed by related institutions, agencies or instrumentalities.
•Changes in attitudes toward debt repayment negatively impacting the Company’s insurance portfolio.
•The impact of narrow credit spreads on the demand for financial guaranty insurance.
•The effect of credit losses and interest rate changes on the Company’s investments.
•Effects of global climate change on the Company’s insurance portfolio and investments.
Risks Related to Estimates, Assumptions and Valuations
•The impact on reserves from uncertainties of estimates of expected insurance losses to be paid (recovered).
•The subjectivity of the valuation of many of the Company’s assets and liabilities.
Strategic Risks
•Competition in the Company’s industries.
•Strategic transactions not resulting in the benefits anticipated.
•The Company’s investments in Sound Point.
•Minority ownership interests and the inability to control the business, management or policies of such interests.
•Alternative investments, including investments managed by Sound Point and exclusivity with Sound Point, may not result in the benefits anticipated, and may increase credit, interest rate, liquidity, reputational, and other risks.
•A downgrade of the financial strength or financial enhancement ratings of any of the Company’s insurance or reinsurance subsidiaries.
Operational Risks
•Fluctuations in foreign exchange rates.
•Exposure to less predictable political, credit and legal risks by underwriting insurance in non-U.S. markets and/or covering new sectors or classes of business.
•Loss of senior management and other key employees and delay or inability to develop or recruit suitable replacements.
•A cyberattack, security breach or failure in the Company’s or a vendor's information technology system, or a data privacy breach of the Company’s or a vendor’s information technology system.
•Evolving cybersecurity, privacy and data security regulations.
•The exploration of artificial intelligence used in some of the Company’s business operations.
•Errors in, overreliance on, or misuse of, models.
•Reduction in the Company’s liquidity from significant claim payments.
•A sudden need to raise additional capital as a result of insurance losses or as a result of changes in regulatory or rating agency capital requirements applicable to its insurance subsidiaries at a time when additional capital may not be available or may be available only on unfavorable terms.
•Large insurance losses substantially increasing the Company’s insurance subsidiaries’ leverage ratios, and preventing them from writing new insurance.
•Constraints on the Company’s holding companies' ability to meet their obligations.
•Limitations on the ability of AGL and its subsidiaries to meet their liquidity needs.
Risks Related to Taxation
•The impacts of changes in U.S. tax laws on the demand or profitability of financial guaranty insurance and the Company’s investments.
•Certain of the Company’s non-U.S. subsidiaries may be subject to U.S. tax.
•AGL may, and AG Re and AGRO will, become subject to taxes in Bermuda.
•U.S. Persons holding AGL’s shares may be subject to taxation under the U.S. CFC rules.
•U.S. Persons holding AGL’s shares may be subject to additional U.S. income taxation on their proportionate share of the Company's RPII.
•U.S. tax-exempt shareholders may be subject to unrelated business taxable income rules.
•Adverse tax consequences to U.S. Persons holding AGL’s shares if AGL is considered to be a PFIC for U.S. federal income tax purposes.
•Changes in U.S. federal income tax law adversely affecting the Company and an investment in AGL’s common shares.
•U.S. federal tax consequences of an ownership change under Section 382 of the Code.
•A change in AGL’s U.K. tax residence or its ability to otherwise qualify for the benefits of income tax treaties to which the U.K. is a party.
•Changes in U.K. tax law or in AGL’s ability to satisfy all the conditions for exemption from U.K. taxation on dividend income or capital gains in respect of its direct subsidiaries.
•An adverse adjustment under U.K. legislation governing the taxation of U.K. tax resident holding companies on the profits of their non-U.K. subsidiaries.
•An adverse adjustment under U.K. transfer pricing legislation.
•Measures taken in response to the OECD Base Erosion and Profit Shifting (BEPS) project.
Risks Related to Applicable Law, Litigation and GAAP
•The impact of changes in or inability to comply with applicable law and regulations.
•The impact of changes in applicable laws or regulations on the ability of issuers to satisfy their obligations.
•Legislation, regulation, legal or regulatory determinations, or litigation arising out of struggles of distressed obligors.
•Certain insurance regulatory requirements and restrictions constraining AGL’s ability to pay dividends and fund share repurchases and other activities.
•Difficulties in effecting a change of control of AGL under applicable insurance laws.
•The inability to obtain accurate and timely financial information from Sound Point or other alternative investment managers.
•Changes in the fair value of the Company’s insured credit derivatives portfolio, certain of its investments, its committed capital securities (CCS), its FG VIEs, and/or the consolidation or deconsolidation of one or more FG VIEs during a financial reporting period.
•Changes in industry and other accounting practices.
Risks Related to AGL’s Common Shares
•Volatility in the market price of AGL’s common shares.
•Provisions in the Code and AGL’s Bye-Laws reducing the voting rights of its common shares.
•Provisions in AGL’s Bye-Laws potentially restricting the ability to transfer common share or requiring shareholders to sell their common shares.
Risks Related to Economic, Market and Political Conditions and Natural Phenomena
Developments in the global financial markets, political systems and the economy generally may adversely affect the Company’s financial condition, results of operations, capital, liquidity, business prospects and share price.
In recent years, global financial markets, political systems and the economy generally have been impacted by changes in inflation and interest rates, governmental policies and geopolitical events such as strategic competition and trade confrontations between the U.S. and China, Russia’s invasion of Ukraine, conflict in the Middle East, and events in Southeast Asia, including tensions between China and Taiwan and provocative actions taken by North Korea, and could be impacted by other natural and man-made events in the future, such as trade protectionism through tariffs.
These and other risks could materially and negatively affect the Company’s ability to access the capital markets, the cost of the Company’s debt, the demand for its credit enhancement products, the amount of losses incurred on transactions it guarantees, the value and performance of its investments, the Company’s earnings from its ownership interest in Sound Point, the capital and liquidity position and financial strength and enhancement ratings of its insurance subsidiaries, and the price of its common shares.
Some of the public finance obligors that have issued obligations insured or reinsured by the Company are experiencing significant budget, pension and revenue shortfalls, and difficulties in obtaining additional financing, that could result in increased credit losses or liquidity claims and increased rating agency capital charges on those insured obligations.
Some of the public finance obligors that have issued obligations insured or reinsured by the Company are experiencing significant budget, pension and revenue shortfalls, and difficulties in obtaining additional financing.
Certain territorial or local governments, including ones that have issued obligations insured or reinsured by the Company, have sought protection from creditors under Chapter 9 of the U.S. Bankruptcy Code, or, in the case of Puerto Rico, the similar provisions of the Puerto Rico Oversight, Management, and Economic Stability Act (PROMESA), as a means of restructuring their outstanding debt. In some instances where local governments were seeking to restructure their outstanding debt, pension and other obligations owed to workers were treated more favorably than senior bond debt owed to the capital markets. If the issuers of the obligations in the Company’s public finance portfolio do not have sufficient funds to cover their expenses and are unable or unwilling to raise taxes, decrease spending, or receive federal assistance, the Company may experience increased levels of losses or liquidity claims on its insured public finance obligations.
Obligations supported by revenue streams, which may include both revenue and non-revenue bonds, such as those issued by healthcare facilities, toll road authorities, municipal utilities, airport authorities or mass transit, may be adversely affected by revenue declines resulting from reduced demand, changing demographics, evolving business practices including hybrid work models, telecommuting, and other alternative work arrangements, or other causes. These obligations may also be adversely affected by increased costs resulting from operational strain, high financing costs and other capital constraints. These obligations, which may not necessarily benefit from financial support from other tax revenues or governmental authorities, may experience increased losses if the revenue streams are insufficient to pay scheduled interest and principal payments and the obligors are unable or unwilling to increase utility rates or revenues, decrease costs, or obtain other additional financing.
The Company may be subjected to significant risks from large individual or correlated insurance exposures.
The Company is exposed to the risk that issuers of obligations that it insures or other counterparties may default on their financial obligations, whether as a result of insolvency, lack of liquidity, operational failure (whether related to cybersecurity incidents, mismanagement, fraud or otherwise) or other reasons, and the amount of insurance exposure the Company has to some risks is quite large. The Company seeks to reduce this risk by managing exposure to large single risks, as well as concentrations of correlated risks, through tracking its aggregate exposure to single risks in its various lines of insurance business and establishing underwriting criteria to manage risk aggregations. However, in certain cases, the Company’s ultimate exposure to a single risk may exceed its underwriting guidelines (caused by, for example, bond accretion exceeding the risk limitation, acquisitions, reassumptions or other strategic exceptions). Should the Company's risk assessments prove inaccurate and/or should the applicable limits prove inadequate, the Company could be exposed to larger than anticipated losses, and could be required by the rating agencies to hold additional capital against insured exposures whether or not downgraded by the rating agencies.
The Company is exposed to correlation risk across its insured exposures and in its investment portfolio. During periods of strong macroeconomic performance, stress in an individual transaction generally occurs for idiosyncratic reasons or as a result of issues in a single sector. During a broad economic downturn or in the face of a significant natural or man-made event or disaster (such as the COVID-19 pandemic), a wider range of the Company’s insurance and investments could be exposed to stress at the same time. This stress may manifest itself in any or all of the following: ratings downgrades of insured risks, which may require more capital in the Company’s insurance subsidiaries; a reduction in the value of the Company’s investments; and actual defaults and losses in its insurance portfolio and/or investments.
Losses on obligations insured by the Company significantly in excess of those expected by the Company or recoveries significantly below those expected by the Company could have a negative effect on the Company’s financial condition, results of operations, capital, business prospects and share price.
Losses on insured exposures significantly in excess of those expected by the Company could have a negative effect on the Company’s financial condition, results of operations, capital, business prospects and share price. Certain issuers have defaulted on their debt service payments, and the Company has paid claims on them. The total net expected loss the Company calculates related to such exposures is net of a credit for estimated recoveries on claims already paid, and recoveries significantly below those expected by the Company could also have a negative effect on the Company’s financial condition, results of operations, capital, liquidity, business prospects and share prices. Additional information about the Company’s exposure and legal actions related to that exposure may be found in Part II, Item 8, Financial Statements and Supplementary Data, Note 4, Expected Loss to be Paid (Recovered).
A higher U.S. debt-to-GDP ratio and/or downgrades to the U.S. government’s sovereign credit ratings, or to the credit ratings of instruments issued, insured or guaranteed by related institutions, agencies or instrumentalities, could result in a deterioration in general economic conditions, increased credit losses in the Company’s insured portfolio, impairments or losses in its investment portfolio, and other risks to the Company and its credit ratings that the Company is not able to predict.
In the U.S., debt ceiling and budget deficit concerns, which have increased the possibility of a U.S. government shutdown, payment defaults on the debt of the U.S. government or instruments issued, insured or guaranteed by related institutions, agencies or instrumentalities, and downgrades to their credit ratings, could weaken the U.S. dollar, global economy and banking system, cause market volatility, raise the cost of credit, reduce public investment, increase interest rates and inflation, negatively impact the Company’s insured and investment portfolios, and disrupt general economic conditions in ways that the Company is not able to predict, which could materially and adversely affect the Company’s business, financial condition and results of operations. While rating agencies currently permit sub-sovereign and corporate credits in the U.S. to be rated higher than sovereign credits, in the event that the U.S. government is downgraded and if the rating agencies no longer permit sub-sovereign and/or corporate credit ratings to be higher than the U.S. government, the resulting downgrades could result in a material adverse impact to the Company’s credit ratings and its insurance and investment portfolios.
The Company may be exposed to a higher risk of default of U.S. public finance obligations in connection with a U.S. government default. While the Company historically has experienced low levels of defaults in its U.S. public finance insured portfolio, from time-to-time state and local governments that issue some of the obligations the Company insures have reported budget shortfalls that have required them to raise taxes and/or cut spending in order to satisfy their obligations. While there has been support provided by the U.S. federal government designed to provide aid to state and local governments, certain state and local governments remain under financial stress. If the issuers of the obligations in the Company’s U.S. public finance insurance portfolio are reliant on financial assistance from the U.S. government in order to meet their obligations, and the U.S. government does not provide such assistance, the Company may experience credit losses or impairments on those obligations.
A higher U.S. debt-to-GDP ratio and/or downgrade of the U.S. government may also result in higher interest rates, which could adversely affect the distressed RMBS that are in the Company’s insured portfolio, reduce the market value of the fixed-maturity securities held in the Company’s investment portfolio and dampen municipal bond issuance.
Changes in attitudes toward debt repayment could negatively impact the Company’s insurance portfolio.
The likelihood of debt repayment is impacted by both the ability and the willingness of the obligor to repay their debt. Debtors generally understand that debt repayment is not only a legal obligation but is also appropriate, and that a failure to repay their debt will impede their access to debt in the future. To the extent societal attitudes toward the repayment of debt by struggling obligors softens and such obligors believe there to be less of a penalty for nonpayment due to legal rulings or debt relief programs that may absolve them of the repayment obligation or otherwise, some struggling debtors may be more likely to default and, if they default, less likely to agree to repayment plans they view as burdensome. If the issuers of the obligations in
the Company’s public finance insurance portfolio become unwilling to raise taxes, decrease spending or receive federal assistance in order to repay their debt, the Company may experience increased levels of losses on its public finance obligations, which could adversely affect its financial condition, results of operations, capital, liquidity, business prospects and share price.
Narrow credit spreads could adversely affect demand for financial guaranty insurance.
Demand for financial guaranty insurance generally fluctuates with changes in market credit spreads. Credit spreads, which are based on the difference between interest rates on high-quality or “risk free” securities versus those on lower-rated securities, fluctuate due to a number of factors, and are sensitive to the absolute level of interest rates, current credit experience and investors’ risk appetite. When the bond market is less volatile or is relatively less risk averse, the credit spread between high-quality or insured obligations versus lower-rated obligations typically narrows. As a result, financial guaranty insurance typically provides lower interest cost savings to issuers than it would during periods of relatively wider credit spreads. Issuers are less likely to use financial guaranties on their new issues when credit spreads are narrow, so (absent other factors) this results in decreased demand or premiums obtainable for financial guaranty insurance.
Credit losses and changes in interest rates could adversely affect the Company’s investments.
The Company’s results of operations are affected by the performance of its investments, which primarily consist of fixed-maturity securities and short-term investments. As of December 31, 2024, fixed-maturity securities and short-term investments held by the Company had a fair value of approximately $7.7 billion. Credit losses on the Company’s investments adversely affect the Company’s financial condition and results of operations by reducing net income and shareholders’ equity. Alternative investments, including the Company’s equity method ownership interest in Sound Point, Loss Mitigation Securities and CVIs may be more susceptible to credit losses than most of the rest of the Company’s fixed-maturity portfolio.
The impact of changes in interest rates may also adversely affect both the Company’s financial condition and results of operations. For example, if interest rates decline, the value of the Company’s existing fixed-rate investments would generally be expected to increase, resulting in an unrealized gain on investments and improving the Company’s financial condition. At the same time, funds reinvested in new fixed rate investments will have a lower expected yield, reducing the Company’s future investment income compared to the amount it would have earned if interest rates had not declined. Conversely, if interest rates increase, the Company’s future results of operations could improve because of higher future reinvestment income from its new fixed rate investments, but its financial condition could be adversely affected since value of the fixed-rate investments generally would be reduced. Regarding the Company’s existing floating rate investments, as interest rates decline or increase, income from such investments will generally decrease or increase, respectively, while the value of such investments may or may not experience a material gain or loss commensurate with changes in prevailing interest rates.
Interest rates are highly sensitive to many factors, including monetary policies, U.S. and non-U.S. economic and political conditions and other factors beyond the Company’s control. The Company does not engage in active management, or hedging, of interest rate risk in its investment portfolio, and may not be able to mitigate interest rate sensitivity effectively.
Global climate change may adversely impact the Company’s insurance portfolio and investments.
Global climate change and climate change regulations may impact asset prices and general economic conditions and may disproportionately impact particular sectors, industries or locations. Due to the significant uncertainty of forecasted data related to the impact of climate change, the Company cannot predict the long-term consequences to the Company resulting from the physical, transition, legal, regulatory and reputational risks associated with climate change. The Company considers environmental risk in its insurance underwriting and surveillance process and its investment process and manages its insurance and investment risks by maintaining a well-diversified portfolio of insurance and investments both geographically and by sector and monitors these measures continuously. While the Company can adjust its investment exposure to sectors and/or geographical areas that face severe risks due to climate change or climate change regulation, the Company has less flexibility in adjusting the existing exposure in its insurance portfolio because the majority of the financial guaranties issued by the Company’s insurance subsidiaries insure the credit performance of the guaranteed obligations over an extended period of time, in some cases over 30 years, and, in most circumstances, the Company has no right to cancel such insurance.
Risks Related to Estimates, Assumptions and Valuations
Estimates of expected insurance losses to be paid (recovered), including losses with respect to related legal proceedings, are subject to uncertainties and actual amounts may be different, causing the Company to reserve either too little or too much for future losses.
The financial guaranties issued by the Company’s insurance subsidiaries insure the credit performance of the guaranteed obligations over an extended period of time, in some cases over 30 years, and, in most circumstances, the Company has no right to cancel such financial guaranties. As a result, the Company’s estimate of ultimate losses to be paid (recovered) on a policy is subject to significant uncertainty over the life of the insured transaction. Additionally, even after the Company pays a claim on its financial guaranties (or determines no claim is owing), subsequent related litigation may result in additional losses. If the Company’s actual losses exceed its current estimate, the Company’s financial condition, results of operations, capital, liquidity, business prospects, financial strength ratings, ability to raise additional capital and share price may all be adversely affected.
The Company does not use traditional actuarial approaches to determine its estimates of expected losses to be paid (recovered). The determination of expected loss to be paid (recovered) is an inherently subjective process involving numerous estimates, probability weightings, assumptions and judgments by management, using both internal and external data sources with regard to frequency, severity of loss, economic projections, future interest rates, the perceived strength of legal protections, the perceived strength of the Company’s position in any ongoing legal proceedings, governmental actions, negotiations, delinquency and prepayment rates (with respect to RMBS), timing of cash flows and other factors that affect credit performance. Actual losses will ultimately depend on future events, legal rulings, and/or transaction performance and may be influenced by many interrelated factors that are difficult to predict. As a result, the Company’s current estimates of losses to be paid (recovered), including losses with respect to related legal proceedings, may be subject to considerable volatility and may not reflect the Company’s future ultimate losses paid (recovered).
The Company’s expected loss models and reserve assumptions take into account current and expected future trends, which contemplate the impact of current and possible developments in the performance of the exposure and any related legal proceedings. These factors, which are integral elements of the Company's reserve estimation methodology, are updated on a quarterly basis based on current information. Also, in some instances, the Company may not be able to reasonably estimate the amount or range of loss that could result from an unfavorable outcome of a legal proceeding based on the information available at the stage of the legal proceeding or its estimate may prove to be materially different than the actual results. Loss models and reserve assumptions may be impacted by changes to interest rates due both to discounting and transaction structures that include floating rates, which could impact the calculation of expected losses. Because such information changes over time, sometimes materially, the Company’s projection of losses and its related reserves may also change materially.
See Part II, Item 8, Financial Statements and Supplementary Data, Note 4, Expected Loss to be Paid (Recovered), and Note 17, Contingencies, for additional information.
The valuation of many of the Company’s assets and liabilities includes methodologies, estimates and assumptions that are subjective and could result in changes to valuations of the Company’s assets and liabilities that may materially adversely affect the Company’s financial condition, results of operations, capital, business prospects and share price.
The Company carries a significant portion of its assets and liabilities at fair value. The approaches used by the Company to calculate the fair value of those assets and liabilities it carries at fair value are described under, Part II, Item 8, Financial Statements and Supplementary Data, Note 9, Fair Value Measurement. The determination of fair values is made at a specific point in time, based on available market information and judgments about the assets and liabilities being valued, including estimates of timing and amounts of cash flows and the creditworthiness of the issuer or counterparty. The use of different methodologies and assumptions may have a material effect on estimated fair value amounts.
During periods of market disruption, including periods of rapidly changing credit spreads or illiquidity, it may be difficult to value certain of the Company’s assets and liabilities, particularly if trading becomes less frequent or market data becomes less observable. An increase in the amount of the Company’s alternative investments in its investment portfolio may increase the amount of the Company’s assets subject to this risk. During such periods, more assets and liabilities may fall to the Level 3 valuation level, which describes model derived valuations in which one or more significant inputs or significant value drivers are unobservable, thereby resulting in values that may not be indicative of net realizable value or reflective of future fair values. Rapidly changing credit and equity market conditions could materially impact the valuation of assets and liabilities as reported within the financial statements, and period-to-period changes in value could vary significantly.
Strategic Risks
Competition in the Company’s industries may adversely affect its results of operations, business prospects and share price.
As described in greater detail under Item 1. Business — Insurance — Competition, the Company can face competition in its insurance business, either from other financial guaranty insurance companies or from current or new providers of other credit enhancement, such as nonpayment insurance, letters of credit or credit derivatives, or in terms of alternative structures, including uninsured offerings, which could have an adverse effect on the Company’s insurance business.
The Company’s Asset Management segment currently consists of its ownership interest in Sound Point, which operates in highly competitive markets. Sound Point competes with many other firms in every aspect of the asset management industry, including raising funds, seeking investments, and hiring and retaining professionals. Sound Point’s ability to increase and retain assets under management (AUM) is directly related to the performance of the assets it manages as measured against market averages and the performance of its competitors. Some of Sound Point’s competitors may have a lower cost of funds and access to funding and other resources that are not available to Sound Point. In addition, some of Sound Point’s competitors may have higher risk tolerances or different risk assessments, which could allow them to consider a wider variety of investments and establish more relationships than Sound Point does. Furthermore, Sound Point may lose investment opportunities if it does not match its competitors’ pricing, terms and structure. The loss of such investment opportunities may limit Sound Point’s ability to grow or cause it to have to shrink the size of its AUM, which could decrease its earnings. If Sound Point matches its competitors’ pricing, terms and structure, it may experience decreased earnings and increased risk of investment losses. If Sound Point is unable to successfully compete, it may result in decreased earnings for Sound Point and increased risk of investment losses in Sound Point funds, which could materially adversely impact the Company’s ownership interest in Sound Point and/or its investment in Sound Point funds and, ultimately, the Company’s financial condition, results of operations, capital, business prospects and share price.
Strategic transactions may not result in the benefits anticipated.
From time to time the Company evaluates potential mergers, acquisitions, divestitures and other strategic opportunities, including transactions involving legacy financial guaranty companies and financial guaranty portfolios, asset managers and other companies, and has executed a number of such transactions in the past. Such strategic transactions related to entities or portfolios may involve some or all of the various risks commonly associated with such strategic transactions, including, among other things: (a) failure to adequately identify and value potential exposures and liabilities associated with a new entity or portfolio; (b) difficulty in estimating the value of a new entity or portfolio; (c) potential diversion of management’s time and attention; (d) exposure to asset quality issues of a new entity or portfolio; (e) difficulty and expense of integrating the operations, systems and personnel of a new entity; (f) difficulty integrating the culture of a new entity; (g) failure to identify legal risks associated with the strategic transaction with an entity or portfolio, and (h) in the case of acquisitions of a financial guaranty company or portfolio, concentration of insurance exposures, including insurance exposures which may exceed single risk limits, aggregate risk limits, BIG limits and/or non-U.S. dollar exposure limits, due to the addition of the target insurance portfolio. Such strategic transactions related to entities or portfolios may also have unintended consequences on ratings assigned by the rating agencies to the Company or its insurance subsidiaries or on the applicability of laws and regulations to the Company’s existing businesses. These or other factors may cause any past or future strategic transactions relating to financial services entities or portfolios not to result in the benefits to the Company that the Company anticipated when the transaction was agreed. Past or future transactions may also subject the Company to non-monetary consequences that may or may not have been anticipated or fully mitigated at the time of the transaction.
Additionally, if the Company enters into discussions regarding a strategic transaction and a transaction is not consummated, especially if such discussions become known, related portions of the Company’s business may be negatively impacted.
The Company’s investments in Sound Point are subject to the risks of Sound Point’s business that may adversely affect the Company’s financial condition, results of operations, capital, business prospects and share price.
Since July 1, 2023, the Company participates in the asset management business through its ownership interest in Sound Point, which is subject to the risks of Sound Point’s business. See Item 1. Business — Asset Management. The Company had a carrying value for its ownership interest in Sound Point as of December 31, 2024 of $418 million. External factors, such as changes in inflation, interest rates, credit markets or segments thereof, geopolitical risk, developments in the global financial markets, general macroeconomic factors, and industry conditions, as well as the financial performance of Sound Point relative to the Company’s expectations at the time of the Sound Point Transaction, could result in an impairment, which could adversely affect the Company’s financial condition, results of operations and share price.
Asset management services are primarily a fee-based business, and Sound Point’s asset management and performance fees are based on the amount of its AUM as well as the performance of those assets. Sound Point’s business operates in highly competitive markets with many other firms in every aspect of the asset management industry. See “– Competition in the Company’s industries may adversely affect its results of operations, business prospects and share price.” Industry competition, volatility or declines in the markets in which Sound Point invests as an asset manager, or poor performance of its investments, may negatively affect its AUM and its asset management and performance fees, may deter future investment by third parties in Sound Point’s asset management products, and may result in an impairment to the Company’s ownership interest in Sound Point.
Sound Point is dependent on certain key personnel, including Sound Point’s Managing Partner and Chief Investment Officer, and its future success depends on their continued service. The departure of any of Sound Point’s key personnel for any reason could have a material adverse effect on Sound Point’s business, financial condition or results of operations and, consequently, the Company’s ownership interest in Sound Point and/or its investments in Sound Point funds, other vehicles and separately managed accounts.
The asset management business is also subject to legal, regulatory, compliance, accounting, valuation and political risks that differ from those that may affect the Company’s insurance business. Sound Point operates in a highly regulated industry and, as a registered investment adviser, is subject to the provisions of the Investment Advisers Act of 1940, as amended. Sound Point is, from time to time, subject to formal and informal examinations, investigations, inquiries, audits and reviews from numerous regulatory authorities both in response to issues and questions raised in such examinations or investigations and in connection with the changing priorities of the applicable regulatory authorities across the market in general.
Because the Company does not control the business, management or policies of Sound Point, it relies upon Sound Point to make appropriate decisions and operate in a manner consistent with applicable rules and regulations. In turn, Sound Point may rely on third party service providers such as custodians and fund administrators whom they do not control to comply with applicable rules and regulations. Failure of Sound Point or its service providers to comply with applicable rules and regulations could have a material adverse effect on the value of the Company’s ownership interest in Sound Point and/or its investments in Sound Point funds, other vehicles and separately managed accounts.
The Company’s interest in Sound Point is subject to the risks normally associated with a minority interest.
Since the Company holds a minority interest in Sound Point, it is unable to control the business, management or policies of Sound Point. For example, the Company is not be able to control the timing or amount of distributions from Sound Point and is not involved on a day-to-day basis with Sound Point’s operations or its decision-making or its adoption and implementation of policies and procedures with respect to its investment, reporting, internal control, legal, compliance or risk functions. In most cases, the Company will be bound by the decisions made by the Managing Partner and Chief Investment Officer, other members of management and the Board of Managers of Sound Point. In the event that the Managing Partner and Chief Investment Officer, other members of management and the Board of Managers of Sound Point have interests, objectives and incentives that differ from those of the Company, there can be no assurance that the decisions they make will be aligned with the interests of the Company. Decisions made by the Managing Partner and Chief Investment Officer, other members of management and the Board of Managers of Sound Point not in the Company’s interest could have a material adverse effect on the Company’s interest in Sound Point and/or its investments in Sound Point funds, other vehicles and separately managed accounts.
Alternative investments, including allocations of investments to Sound Point and the exclusivity arrangement with Sound Point, may not result in the benefits anticipated, and may expose it to increased credit, interest rate, liquidity, reputational and other risks.
The Company has invested in alternative investments, and may over time increase the proportion of the Company’s assets invested in alternative investments. Alternative investments may be riskier than other investments the Company makes, and may not result in the benefits anticipated at the time of the investment. Alternative investments are generally less liquid than most of the Company’s other investments and so may be difficult to convert to cash or investments that receive more favorable treatment under the capital models to which the Company is subject, and so may increase the risks described under “— Operational Risks — The ability of AGL and its subsidiaries to meet their liquidity needs may be limited.” Although the Company uses what it believes to be excess capital to make alternative investments, measures of required capital can fluctuate and such assets may not be given much, or any, value under the various rating agency, regulatory and internal capital models to which the Company is or may be subject. In addition, the changes in fair value of certain of these assets are reported in results of operations may be more volatile than net investment income earned from fixed maturity securities.
The Company is using Sound Point’s investment knowledge and experience to expand the categories and types of its alternative investments by: (a) allocating $1 billion of capital in Sound Point managed funds, other vehicles and separately managed accounts; (b) redeploying return of capital, gains and dividends from Sound Point managed funds, other vehicles and separately managed accounts in future Sound Point managed funds, other vehicles and separately managed accounts; and (c) having Sound Point serve as AG’s sole alternative credit manager. This expansion of categories and types of investments, allocations to Sound Point and exclusivity arrangement with Sound Point may increase the credit, interest rate and liquidity risk in the Company’s investments and expose the Company to reputational or other risks.
A downgrade of the financial strength or financial enhancement ratings of any of the Company’s insurance or reinsurance subsidiaries may adversely affect its business prospects.
The financial strength and financial enhancement ratings assigned by S&P, Moody’s, KBRA and A.M. Best Company, Inc. to each of the Company’s insurance and reinsurance subsidiaries represent such rating agencies’ opinions of the insurer’s financial strength and ability to meet ongoing obligations to policyholders and cedants in accordance with the terms of the financial guaranties it has issued or the reinsurance agreements it has executed. Issuers, investors, underwriters, ceding companies and others consider the Company’s financial strength or financial enhancement ratings an important factor when deciding whether or not to utilize a financial guaranty or purchase reinsurance from one of the Company’s insurance or reinsurance subsidiaries. A downgrade by a rating agency of the financial strength or financial enhancement ratings of one or more of the Company’s insurance subsidiaries could impair the Company’s financial condition, results of operation, capital, liquidity, business prospects and/or share price. The ratings assigned by the rating agencies to the Company’s insurance subsidiaries are subject to review and may be lowered by a rating agency at any time and without notice to the Company.
The rating agencies have changed their methodologies and criteria from time to time. Factors influencing the rating agencies are beyond management's control and not always known to the Company. In the event of an actual or perceived deterioration in creditworthiness of large risks in the Company’s insurance portfolio, or other large increases in liabilities (including those related to legal proceedings), or a change in a rating agency’s capital model or rating methodology, a rating agency may require the Company to increase the amount of capital it holds to maintain its financial strength and financial enhancement ratings under the rating agencies’ capital adequacy models, or a rating agency may identify an issue that additional capital would not address. The amount of any capital required may be substantial, and may not be available to the Company on favorable terms and conditions or at all, especially if it were known that additional capital was necessary to preserve the Company’s financial strength or financial enhancement ratings. The failure to raise any additional required capital, or successfully address another issue or issues raised by a rating agency, could result in a downgrade of the ratings of the Company’s insurance subsidiaries and thus have an adverse impact on its business, results of operations, financial condition and share price.
The Company periodically assesses the value of each rating assigned to each of its companies and may, as a result of such assessment, request that a rating agency add or drop a rating from certain of its subsidiaries. For example, a Moody’s rating was dropped from AG Re and AGRO in 2015.
The insurance subsidiaries’ financial strength and financial enhancement ratings are an important competitive factor in the financial guaranty insurance and reinsurance markets. If the financial strength or financial enhancement ratings of one or more of the Company’s insurance subsidiaries were reduced below current levels, the Company expects that the number of transactions that would benefit from the Company’s insurance would be reduced and that its premium rates on new business would decrease; consequently, a downgrade by rating agencies could harm the Company’s new insurance business production.
In addition, a downgrade may have a negative impact on the Company’s insurance subsidiaries in respect of transactions that they have insured or that they have assumed through reinsurance. For example, some of the Company’s insurance subsidiaries (Assuming Subsidiaries) assumed financial guaranty insurance from legacy financial guarantors. The agreements under which such Assuming Subsidiaries assumed such business are generally subject to termination at the option of the ceding company (i) if the Assuming Subsidiary fails to meet certain financial and regulatory criteria; (ii) if the Assuming Subsidiary fails to maintain a specified minimum financial strength rating; or (iii) upon certain changes of control of the Assuming Subsidiary. Upon termination due to one of the above events, the Assuming Subsidiary typically would be required to return to the ceding company unearned premiums (net of ceding commissions) and loss reserves, calculated on a U.S. statutory basis, attributable to the assumed business (plus in certain cases, an additional required amount), after which the Assuming Subsidiary would be released from liability with respect to such business. As of December 31, 2024, if each legacy financial guarantor ceding business to an Assuming Subsidiary had a right to recapture such business, and chose to exercise such right, the aggregate amounts those subsidiaries could be required to pay to all such ceding companies would be approximately $245 million. In addition, beneficiaries of financial guaranties issued by the Company’s insurance subsidiaries
may have the right to cancel the credit protection provided by them, which would result in the loss of future premium earnings and the reversal of any fair value gains recorded by the Company.
Operational Risks
Fluctuations in foreign exchange rates may adversely affect the Company’s financial position and results of operations.
The Company’s reporting currency is the U.S. dollar. The functional currency of the Company’s insurance and reinsurance subsidiaries is the U.S. dollar. The Company’s subsidiaries maintain both assets and liabilities in currencies different from their functional currencies, which exposes the Company to changes in currency exchange rates. The investment portfolios of non-U.S. subsidiaries are primarily invested in local currencies in order to satisfy regulatory requirements and to support local insurance operations regardless of currency fluctuations.
The principal currencies creating foreign exchange risk to the Company are the pound sterling and the euro. The Company cannot accurately predict the nature or extent of future exchange rate variability between these currencies or relative to the U.S. dollar. Foreign exchange rates are sensitive to factors beyond the Company’s control.
The Company does not engage in active management, or hedging, of its foreign exchange rate risk. Therefore, fluctuation in exchange rates between the U.S. dollar and the pound sterling or the euro could adversely impact the Company’s financial position, results of operations and cash flows. See Part II, Item 7A, Quantitative and Qualitative Disclosures About Market Risk — Sensitivity to Foreign Exchange Rate Risk.
The Company’s underwriting of insurance in non-U.S. markets and/or covering new sectors or classes of business may expose it to less predictable political, credit and legal risks.
The Company pursues new business opportunities in non-U.S. markets and/or covering new sectors or classes of business. The underwriting of obligations of an issuer in a country other than the U.S. involves the same process as that for a U.S. issuer, but additional risks must be addressed, such as the evaluation of currency exchange rates, non-U.S. business and legal issues, and the economic and political environment of the country or countries in which an issuer does business. Changes in such factors could impede the Company’s ability to insure, or increase the risk of loss from insuring, obligations in the non-U.S. countries in which it currently does business and limit its ability to pursue business opportunities in other non-U.S. countries.
The underwriting of insurance in new sectors or classes of business may subject the Company to additional credit risk because the underwriting history and loss experience for such exposures is minimal or nonexistent which could adversely affect the Company’s results of operations. In addition, the underwriting of insurance in new sectors or classes of business may present novel legal issues or political challenges beyond the Company’s control.
The Company is dependent on members of senior management and other key employees and the loss of any of these individuals, or the delay or inability to develop or recruit suitable replacements, could adversely affect its business.
The Company’s success substantially depends upon its ability to attract, motivate and retain qualified employees and upon the ability of its senior management and other key employees to implement its business strategy. The Company believes there are only a limited number of available qualified executives in the insurance business lines in which the Company competes.
The Company relies substantially upon the services of its Chief Executive Officer, other members of senior management and other key employees. The market to build, retain and replace talent is highly competitive. Although the Company has succession plans and has designed its compensation plans with the goal of retaining and creating incentives for its senior management and other key employees, the Company’s succession plans may not operate effectively and the Company may not be successful in retaining the services of senior management and other key employees. The loss of the services of any of these individuals, or the delay or inability to develop or recruit suitable replacements, could adversely affect the implementation of its business strategy.
The Company is dependent on its information technology and that of certain third parties, and a cyberattack, security breach or failure in the Company’s or a third party provider’s information technology system, or a data privacy breach of the Company’s or a vendor’s information technology system, could adversely affect the Company’s business.
The Company relies upon information technology and systems, including technology and systems provided by or interfacing with those of third parties, to conduct its businesses and interact with market participants and vendors. The Company’s ability to adequately price products and services, to establish reserves, to provide effective, efficient and secure service to its customers, to value its investments and to timely and accurately report its financial results also depends significantly on the integrity and availability of the data it maintains, including that within its information systems, as well as data in, and assets held through, third party service providers and systems. A cybersecurity threat or breach of the Company’s systems or the systems of its third party providers in the future could have a material adverse effect on the Company, including its business strategy, results of operations or financial condition. The Company receives and stores confidential information, including personally identifiable information, in connection with certain loss mitigation and due diligence activities related to its businesses, along with information regarding employees and directors and counterparties, among others. A breach of these systems could jeopardize the personal information of the Company’s employees, consultants and vendors, or sensitive and confidential information regarding the Company’s business and other information processed and stored within these systems, which could result in operational impairments, business interruptions, lost business, reputational harm, the disclosure or misuse of confidential, proprietary or personal information, incorrect reporting, legal costs, regulatory penalties (including under applicable data protection laws and regulations) and financial losses that may not be insured against or not fully covered by insurance, all of which would have an adverse effect on the Company’s business.
Information technology security threats and events are increasing in frequency and sophistication. The rapid evolution and increased adoption of computer systems that are able to learn and adapt without following explicit instructions or perform tasks that simulate human intelligence (Artificial Intelligence) technologies may intensify the Company’s cybersecurity risks. As Artificial Intelligence capabilities improve and are increasingly adopted, they may be used by bad actors to identify vulnerabilities and craft increasingly sophisticated cybersecurity attacks. In addition, vulnerabilities may be introduced from the use of Artificial Intelligence by the Company, its counterparties, vendors and other business partners and third party providers. Although the Company has implemented administrative and technical controls and has taken protective actions designed to reduce the risk of cyber incidents and to protect its information technology and assets, the Company’s data systems and those of third parties on which it relies have been, and the Company expects will continue to be, vulnerable to and the target of, security and data privacy breaches due to cyberattacks, viruses, malware, ransomware, other malicious codes, hackers, unauthorized access, or other computer-related penetrations, and other external hazards, as well as inadvertent errors, equipment and system failures, and employee misconduct. Over time, the frequency and sophistication of such threats continue to increase and often become further heightened in connection with geopolitical tensions, including hostile actions taken by nation-states or terrorist organizations. As a result, the Company may be required to expend significant additional resources to modify its protective measures or to investigate and remediate vulnerabilities or other exposures and to pursue recovery of lost data or assets. In addition, like other global companies, the Company has an increasing challenge of attracting and retaining highly qualified personnel to assist in combating these security threats.
The Company’s business operations rely on the continuous availability of its computer systems as well as those of certain third parties. In addition to disruptions caused by cyberattacks or data privacy breaches, such systems may be adversely affected by natural and man-made catastrophes. The Company’s failure to maintain business continuity in the wake of such events, particularly if there were an interruption for an extended period, could prevent the timely completion of critical processes across its operations, including, for example, financial reporting, claims processing, regulatory filings, treasury and investment operations and payroll. These failures could result in additional costs, loss of business, fines and litigation.
Evolving cybersecurity, privacy and data security regulations could adversely affect the Company’s business.
The Company and its subsidiaries are subject to numerous cybersecurity, data privacy and protection laws and regulations in a number of jurisdictions, particularly with regard to personally identifiable information, including the EU General Data Protection Regulation, the UK Data Protection Act 2018, and the Bermuda Personal Information Protection Act 2016. In the United States, there are numerous federal, state and local cybersecurity, privacy and data security laws and regulations governing the collection, sharing, use, retention, disclosure, security, transfer, storage and other processing of personal information. These laws and regulations are increasing in complexity and number, change frequently and sometimes conflict. The Company’s compliance efforts are further complicated by the fact that these cybersecurity, privacy and data security laws and regulations around the world may be subject to uncertain or inconsistent interpretations and enforcement. The Company’s failure to comply with these requirements could result in penalties and fines, regulatory enforcement actions, reputational harm and/or criminal prosecution in one or more jurisdictions, which could require significant effort from its management and technical personnel to remedy, increase the Company’s costs of doing business, and ultimately have a material adverse effect on the Company’s business, financial condition and results of operations.
The Company is beginning to explore the use of Artificial Intelligence in some of its business operations, and challenges with properly managing the use of Artificial Intelligence, compliance with new laws and regulations applicable to Artificial Intelligence, difficulties implementing Artificial Intelligence technologies efficiently and effectively, and challenges to the Company’s competitive position from faster or more effective use of Artificial Intelligence by competitors or other third-parties, could adversely affect the Company’s business.
The Company is beginning to explore the use of Artificial Intelligence technologies in its business, and its research into and continued deployment of such capabilities remain ongoing. Artificial Intelligence is still in its early stages, and the introduction and use of Artificial Intelligence technologies may result in unintended consequences or other new or expanded risks and liabilities. If the content, analyses or recommendations that Artificial Intelligence applications assist in producing are, or are alleged to be, deficient, inaccurate or biased, such as due to limitations in Artificial Intelligence algorithms, insufficient or biased base data or flawed training methodologies, the Company’s business, financial condition, results of operations and reputation may be adversely affected. In addition, the use of Artificial Intelligence carries inherent risks related to data privacy and security, such as unintended or inadvertent transmission of proprietary or sensitive information, including personal data. There is uncertainty in the legal and regulatory landscape for Artificial Intelligence, which is not fully developed and rapidly evolving, and any laws, regulations or industry standards adopted in response to the emergence of Artificial Intelligence may be burdensome, could entail significant costs, and may restrict or impede the Company’s ability to successfully develop, adopt and deploy Artificial Intelligence technologies efficiently and effectively. Additionally, the Company’s competitors or other third parties may incorporate Artificial Intelligence into their products and services more quickly or more successfully, which could cause the Company to experience competitive disadvantages that adversely affect its results of operations.
Errors in, overreliance on or misuse of models may result in financial loss, reputational harm or adverse regulatory action.
The Company uses models for numerous purposes in its business. For example, it uses models to project future cash flows associated with pricing models, calculating insurance expected losses to be paid (recovered), evaluating risks in its insurance portfolio and investments, valuing assets and liabilities and projecting liquidity needs. It also uses models to determine and project capital requirements under its own risk model as well as under regulatory and rating agency requirements. While the Company has a model governance and validation function and has adopted procedures to protect its models, the models may not operate properly (including as a result of errors or damage) and may rely on assumptions that are inherently uncertain and may prove to have been incorrect.
Significant claim payments may reduce the Company’s liquidity.
Claim payments and payments made in connection with related legal proceedings reduce the Company’s invested assets and result in reduced liquidity and net investment income, even if the Company is reimbursed in full over time and does not experience ultimate loss on the claim. In the years after the financial crisis that began in 2008, many of the larger claims paid by the Company were with respect to insured U.S. RMBS securities and, beginning in 2016, certain insured Puerto Rico exposures. If the amount of future claim payments is significantly more than that projected by the Company, the Company’s ability to make other claim payments and its financial condition, financial strength ratings and business prospects and share price could be adversely affected.
The Company may face a sudden need to raise additional capital as a result of insurance losses substantially in excess of the stress scenarios for which it plans, or as a result of changes in regulatory or rating agency capital requirements applicable to its insurance subsidiaries, which additional capital may not be available or may be available only on unfavorable terms.
The Company’s capital requirements depend on many factors, primarily related to its in-force book of insurance business and rating agency capital requirements for its insurance subsidiaries. Failure to raise additional capital if and as needed may result in the Company being unable to write new insurance business and may result in the ratings of the Company and its insurance subsidiaries being downgraded by one or more rating agency. The Company’s access to external sources of financing, as well as the cost of such financing, is dependent on various factors, including the market supply of such financing, the Company’s long-term debt ratings and insurance financial strength and enhancement ratings and the perceptions of its financial strength and the financial strength of its insurance subsidiaries. The Company’s debt ratings are in turn influenced by numerous factors, such as financial leverage, balance sheet strength, capital structure and earnings trends. If the Company’s need for capital arises because of significant insurance losses substantially in excess of the stress scenarios for which it plans, the occurrence of such losses may make it more difficult for the Company to raise the necessary capital.
Future capital raises for equity or equity-linked securities could also result in dilution to the Company’s shareholders. In addition, some securities that the Company could issue, such as preferred stock or securities issued by the Company's operating subsidiaries, may have rights, preferences and privileges that are senior to those of its common shares.
Large insurance losses could increase substantially the Company’s insurance subsidiaries’ leverage ratios, which may prevent them from writing new insurance.
Insurance regulatory authorities impose capital requirements on the Company’s insurance subsidiaries. These capital requirements, which include leverage ratios and surplus requirements, may limit the amount of insurance that the subsidiaries may write. A material reduction in the statutory capital and surplus of an insurance subsidiary, whether resulting from underwriting or investment losses, a change in regulatory capital requirements or another event, or a disproportionate increase in the amount of risk in force, could increase a subsidiary’s leverage ratio. This in turn could require that subsidiary to obtain reinsurance for existing business or add to its capital base (neither of which may be available, or may be available only on terms that the Company considers unfavorable). Failure to maintain regulatory capital levels could limit that insurance subsidiary’s ability to write new business.
The Company’s holding companies’ ability to meet their obligations may be constrained.
Each of AGL, AGUS and AGMH is a holding company and, as such, has no direct operations of its own. None of the holding companies expect to have any significant operations or assets other than its ownership of the stock of its subsidiaries and its equity method ownership interest in Sound Point and certain alternative investments. The Company expects that dividends and other payments from the insurance companies will be the primary source of funds for AGL, AGUS and AGMH to meet ongoing cash requirements, including operating expenses, intercompany loan payments, any future debt service payments and other expenses, to pay dividends to their respective shareholders, to fund any acquisitions, to fund investments and commitments to alternative investments, and, in the case of AGL, to repurchase its common shares. The insurance subsidiaries’ ability to pay dividends and make other payments depends, among other things, upon their financial condition, results of operations, cash requirements and compliance with rating agency requirements, and is also subject to restrictions contained in the insurance laws and related regulations of their states of domicile. Additionally, in recent years AG and AGUK have sought and been granted permission from their insurance regulators to make discretionary payments to their corporate parents in excess of the amounts permitted by right under the insurance laws and related regulations. There can be no assurance that such regulators will permit discretionary payments in the future. Accordingly, if the insurance subsidiaries are unable to pay sufficient dividends and other permitted payments at the times or in the amounts that are required, that would have an adverse effect on the ability of AGL, AGUS and AGMH to satisfy their ongoing cash requirements and on their ability to pay dividends to shareholders or repurchase common shares or fund other activities, including acquisitions.
The ability of AGL and its subsidiaries to meet their liquidity needs may be limited.
Each of AGL, AGUS and AGMH requires liquidity, either in the form of cash or in the ability to easily sell investments for cash, in order to meet its payment obligations, including, without limitation, its operating expenses, interest and principal payments on debt and dividends on common shares, to fund investments and commitments to alternative investments, and to make capital investments in operating subsidiaries. Such cash is also used by AGL to repurchase its common shares. The Company’s operating subsidiaries require substantial liquidity to meet their respective payment and/or collateral posting obligations, including under financial guaranty insurance policies or reinsurance agreements. They also require liquidity to pay operating expenses, reinsurance premiums, dividends to AGUS or AGMH for debt service and dividends to AGL, fund investments and commitments to alternative investments, as well as, where appropriate, to make capital investments in their own subsidiaries. In addition, the Company may require substantial liquidity to fund any future acquisitions. The Company cannot give any assurance that the liquidity of AGL and its subsidiaries will not be adversely affected by adverse market conditions, changes in insurance regulatory law, insurance claim payments and related litigation substantially in excess of those projected by the Company in its stress scenarios, or changes in general economic conditions.
AGL anticipates that its liquidity needs will be met by the ability of its operating subsidiaries to pay dividends or to make other payments; from earnings from its ownership interest in Sound Point; external financings; investment income from its invested assets; and current cash and short-term investments. The Company expects that its subsidiaries’ need for liquidity will be met by the operating cash flows of such subsidiaries; external financings; investment income from their invested assets; and proceeds derived from the sale of their investments, portions of which are in the form of cash or short-term investments. The value of the Company’s investments may be adversely affected by changes in interest rates, credit risk and capital market conditions that therefore may adversely affect the Company’s potential ability to sell investments quickly and the price which the Company might receive for those investments. Part of the Company’s investment strategy is to invest more of its excess capital in alternative investments, which may be particularly difficult to sell at adequate prices, or at all.
The Company’s sources of liquidity are subject to market, regulatory or other factors that may impact the Company’s liquidity position at any time. As discussed above, AGL’s insurance subsidiaries are subject to regulatory and rating agency
restrictions limiting their ability to declare and to pay dividends and make other payments to AGL. As further noted above, external financing may or may not be available to AGL or its subsidiaries in the future on satisfactory terms.
Risks Related to Taxation
Changes in U.S. tax laws could reduce the demand or profitability of financial guaranty insurance, or negatively impact the Company’s investments.
Changes in U.S. federal, state or local laws that materially adversely affect the tax treatment of municipal securities, including potential loss of tax-exemption, may impact the market for those securities and result in lower volume and demand for municipal obligations and also may adversely impact the value and liquidity of the Company’s investments, a significant portion of which is invested in tax-exempt instruments.
Certain of the Company’s non-U.S. subsidiaries may be subject to U.S. tax.
The Company manages its business so that AGL and its non-U.S. subsidiaries (other than AGRO) operate in such a manner that none of them should be subject to U.S. federal tax (other than U.S. excise tax on insurance and reinsurance premium income attributable to insuring or reinsuring U.S. risks, and U.S. withholding tax on certain U.S. source investment income). However the Company cannot be certain that the IRS will not contend successfully that AGL or any of its non-U.S. subsidiaries (other than AGRO) is/are engaged in a trade or business in the U.S., in which case each such company could be subject to U.S. corporate income and branch profits taxes on the portion of its earnings effectively connected to such U.S. business. See Item 1. Business — Tax Matters — Taxation of AGL and Subsidiaries— United States.
AGL may, and AG Re and AGRO will, become subject to taxes in Bermuda, which may adversely affect the Company’s future results of operations and an investment in the Company.
The Bermuda Minister of Finance, under Bermuda’s Exempted Undertakings Tax Protection Act 1966, as amended, has given AGL, AG Re and AGRO an assurance that if any legislation is enacted in Bermuda that would impose tax computed on profits or income, or computed on any capital asset, gain or appreciation, or any tax in the nature of estate duty or inheritance tax, then subject to certain limitations the imposition of any such tax will not be applicable to AGL, AG Re or AGRO, or any of AGL’s or its subsidiaries’ operations, stocks, debentures or other obligations until March 31, 2035.
Notwithstanding the above, on December 27, 2023 the Bermuda government enacted a corporate income tax which will apply for accounting periods starting on or after January 1, 2025. Importantly, under the Corporate Income Tax Act 2023 of Bermuda, any liability to the tax will apply regardless of any assurances previously provided under the Exempted Undertakings Tax Protection Act 1966 of Bermuda. Broadly, the Bermuda corporate income tax is intended to be treated as a covered tax for the purposes of Pillar Two (see below) and therefore no double taxation is expected to arise from these rules and the top-up taxes under Pillar Two in other jurisdictions. AGRe and AGRO will be subject to this tax beginning in 2025.
Further, the Corporate Income Tax Act 2023 of Bermuda incorporates a number of measures which allow Bermuda resident companies to recognize deferred tax assets in respect of certain ETAs which may be utilized in the calculation of the Company’s effective tax rate for the purposes of top-up taxes in other jurisdictions. The Company believes that the corporate income tax imposed by the Corporate Income Tax Act 2023 of Bermuda would not be applicable to AGL because AGL is a UK tax resident but is applicable to its Bermuda subsidiaries.
However, the treatment of the Bermuda corporate income tax as a covered tax is subject to interpretation in other jurisdictions and therefore remains uncertain at this time. If the Bermuda corporate income tax is not regarded as a covered tax for the purposes of Pillar Two in other jurisdictions, this may have a material impact on the Company’s future income tax expense. In addition, a change in the Corporate Income Tax Act 2023 or its interpretation, or any change in the regulatory treatment of the corporate income tax or matters related thereto, by Bermuda could adversely affect Assured Guaranty’s financial results. See Item 1A – Risk Factors, Risks Related to Taxation –Assured Guaranty’s financial results may be affected by measures taken in response to the OECD BEPS project.
U.S. Persons who hold 10% or more of AGL’s shares directly or through non-U.S. entities may be subject to taxation under the U.S. CFC rules.
If AGL and/or a non-U.S. subsidiary is considered a CFC, a U.S. Person that is treated as owning 10% or more of AGL’s shares may be required to include in income for U.S. federal income tax purposes its pro rata share of certain income of
AGL and its non-U.S. subsidiaries for a taxable year, even if such income is not distributed and may be subject to U.S. federal income tax on a portion of any gain upon a sale or other disposition of its shares at ordinary income tax rates.
No assurance may be given that a U.S. Person who owns the Company’s shares will not be characterized as owning 10% or more of AGL and/or its non-U.S. subsidiaries under the CFC rules, in which case such U.S. Person may be subject to taxation under such rules. See Item 1. Business — Tax Matters, — Taxation of Shareholders ─ United States Taxation ─ Classification of AGL or its Non-U.S. Subsidiaries as a CFC.
U.S. Persons who hold shares may be subject to U.S. income taxation at ordinary income rates on their proportionate share of the Company’s RPII.
If any Foreign Insurance Subsidiary generates RPII (broadly defined as insurance and related investment income attributable to the insurance of a U.S. shareholder and certain related persons to such shareholder) and certain exceptions are not met, each U.S. Person owning AGL shares (directly or indirectly through foreign entities) may be required to include in income for U.S. federal income tax purposes its pro rata share of the Foreign Insurance Subsidiary’s RPII, regardless of whether such income is distributed and may be subject to U.S. federal income tax on a portion of any gain upon a sale or other disposition of its shares at ordinary tax rates (even if an exception to the RPII rules applies).
The Company believes that each of its Foreign Insurance Subsidiaries should qualify for an exception to the RPII rules and the rules that subject gain on sale or disposition of shares to ordinary tax rates would not apply to the disposition of AGL shares. However, the Company cannot be certain that this will be the case because some of the factors which determine the extent of RPII may be beyond its control and rules regarding the treatment of gain on disposition of shares have not been interpreted or finalized. Proposed regulations could, if finalized in their current form, substantially expand the definition of RPII to include insurance income of the Company’s Foreign Insurance Subsidiaries related to affiliate reinsurance transactions. If these proposed regulations are finalized in their current form, it could limit the Company’s ability to execute affiliate reinsurance transactions that would otherwise be undertaken for non-tax business reasons in the future and could increase the risk that gross RPII could constitute 20% or more of the gross insurance income of one or more of the Company’s Foreign Insurance Subsidiaries in a particular taxable year, which could result in such RPII being taxable to U.S. Persons that own or are treated as owning shares of AGL. U.S. Persons owning or treated as owning shares of AGL should consult their tax advisors as to the effect of these uncertainties. See Item 1. Business — Tax Matters — Taxation of Shareholders — United States Taxation — The RPII CFC Provisions; Disposition of AGL Shares.
U.S. tax-exempt shareholders may be subject to the unrelated business taxable income rules with respect to certain insurance income of the Foreign Insurance Subsidiaries.
U.S. tax-exempt shareholders may be required to treat insurance income includable under the CFC or RPII rules as unrelated business taxable income. See Item 1. Business — Tax Matters — Taxation of Shareholders — United States Taxation — Tax-Exempt Shareholders.
U.S. Persons who hold AGL’s shares will be subject to adverse tax consequences if AGL is considered to be PFIC for U.S. federal income tax purposes.
If AGL is considered a PFIC for U.S. federal income tax purposes, a U.S. Person who owns any shares of AGL will be subject to adverse tax consequences that could materially adversely affect its investment, including subjecting the investor to both a greater tax liability than might otherwise apply and an interest charge or other unfavorable rules (either a mark-to-market or current inclusion regime). The Company believes that AGL was not a PFIC for U.S. federal income tax purposes for taxable years through 2024 and, based on the application of certain PFIC look-through rules and the Company’s plan of operations for the current and future years, should not be a PFIC in the future. See Item 1. Business — Tax Matters — Taxation of Shareholders — United States Taxation — Passive Foreign Investment Companies.
Changes in U.S. federal income tax law may adversely affect the Company and an investment in AGL’s common shares.
The tax treatment of non-U.S. companies and their U.S. and non-U.S. subsidiaries may be the subject of future legislation that could have an adverse impact on the Company and/or its shareholders. For example, U.S. federal income tax laws and interpretations regarding whether a company is engaged in a trade or business within the U.S. or is a PFIC, or whether U.S. Persons would be required to include in their gross income the “subpart F income” of a CFC or RPII CFC are subject to change, possibly on a retroactive basis. The Company cannot be certain if, when, or in what form any future regulations or pronouncements may be implemented or made, or whether such guidance will have a retroactive effect. See Item 1. Business — Tax Matters — United States Tax Reform.
An ownership change under Section 382 of the Code could have adverse U.S. federal tax consequences.
If AGL were to issue equity securities in the future, including in connection with any strategic transaction, or if previously issued securities of AGL were to be sold by the current holders, AGL may experience an “ownership change” within the meaning of Section 382 of the Code. In general terms, an ownership change would result from transactions increasing the aggregate ownership of certain holders in AGL’s shares by more than 50 percentage points over a testing period (generally three years). If an ownership change occurred, the Company’s ability to use certain tax attributes, including certain built-in losses, credits, deductions or tax basis and/or the Company’s ability to continue to reflect the associated tax benefits as assets on AGL’s balance sheet, may be limited. The Company cannot give any assurance that AGL will not undergo an ownership change at a time when these limitations could materially adversely affect the Company’s financial condition.
A change in AGL’s U.K. tax residence or its ability to otherwise qualify for the benefits of income tax treaties to which the U.K. is a party could adversely affect an investment in AGL’s common shares.
AGL is not incorporated in the U.K. and, accordingly, is only resident in the U.K. for U.K. tax purposes if it is “centrally managed and controlled” in the U.K. Central management and control constitutes the highest level of control of a company’s affairs. AGL believes it is entitled to take advantage of the benefits of income tax treaties to which the U.K. is a party on the basis that it is has established central management and control in the U.K. In 2013, AGL obtained confirmation that there was a low risk of challenge to its residency status from HMRC on the facts as they were at that time. The Board intends to manage the affairs of AGL in such a way as to maintain its status as a company that is tax resident in the U.K. for U.K. tax purposes and to qualify for the benefits of income tax treaties to which the U.K. is a party. However, the concept of central management and control is a case-law concept that is not comprehensively defined in U.K. statute. In addition, it is a question of fact. Moreover, tax treaties may be revised in a way that causes AGL to fail to qualify for benefits thereunder. Accordingly, a change in relevant U.K. tax law or in tax treaties to which the U.K. is a party, or in AGL’s central management and control as a factual matter, or other events, could adversely affect the ability of Assured Guaranty to manage its capital in the efficient manner that it contemplated in establishing U.K. tax residence.
Changes in U.K. tax law or in AGL’s ability to satisfy all the conditions for exemption from U.K. taxation on dividend income or capital gains in respect of its direct subsidiaries could affect an investment in AGL’s common shares.
As a U.K. tax resident, AGL is subject to U.K. corporation tax in respect of its worldwide profits (both income and capital gains), subject to applicable exemptions.
•With respect to income, the dividends that AGL receives from its subsidiaries should be exempt from U.K. corporation tax under the exemption contained in section 931D of the Corporation Tax Act 2009.
•With respect to capital gains, if AGL were to dispose of shares in its direct subsidiaries or if it were deemed to have done so, it may realize a chargeable gain for U.K. tax purposes. Any tax charge would be based on AGL’s original acquisition cost. It is anticipated that any such future gain should qualify for exemption under the substantial shareholding exemption in Schedule 7AC to the Taxation of Chargeable Gains Act 1992. However, the availability of such exemption would depend on facts at the time of disposal, in particular the “trading” nature of the relevant subsidiary. There is no statutory definition of what constitutes “trading” activities for this purpose and in practice reliance is placed on the published guidance of HMRC.
A change in U.K. tax law or its interpretation by HMRC, or any failure to meet all the qualifying conditions for relevant exemptions from U.K. corporation tax, could affect Assured Guaranty’s financial results of operations or its ability to provide returns to shareholders.
An adverse adjustment under U.K. legislation governing the taxation of U.K. tax resident holding companies on the profits of their non-U.K. subsidiaries could adversely impact Assured Guaranty’s tax liability.
Under the U.K. “controlled foreign company” regime, the income profits of non-U.K. resident companies may, in certain circumstances, be attributed to controlling U.K. resident shareholders for U.K. corporation tax purposes. The non-U.K. resident members of the Assured Guaranty group intend to operate and manage their levels of capital in such a manner that their profits would not be taxed on AGL under the U.K. CFC regime. In 2013, Assured Guaranty obtained clearance from HMRC that none of the profits of the non-U.K. resident members of the Assured Guaranty group should be subject to U.K. tax as a result of attribution under the CFC regime on the facts as they were at the time. However, a change in the way in which Assured Guaranty operates or any further change in the CFC regime, resulting in an attribution to AGL of any of the income profits of AGL’s non-U.K. resident subsidiaries for U.K. corporation tax purposes, could adversely affect Assured Guaranty’s financial results of operations.
An adverse adjustment under U.K. transfer pricing legislation or the imposition of diverted profits tax could adversely impact Assured Guaranty’s tax liability.
If any arrangements between U.K. resident companies in the Assured Guaranty group and other members of the Assured Guaranty group (whether resident in or outside the U.K.) are found not to be on arm's length terms and as a result a U.K. tax advantage is being obtained, an adjustment will be required to compute U.K. taxable profits as if such arrangement were on arm's length terms. Any transfer pricing adjustment could adversely affect Assured Guaranty’s results of operations.
Since January 1, 2016, the U.K. has implemented a country-by-country reporting (CBCR) regime whereby large multi-national enterprises are required to report details of their operations and intra-group transactions in each jurisdiction. The U.K. CBCR legislation includes power to introduce regulations requiring public disclosure of U.K. CBCR reports, although this power has not yet been exercised. It is possible that Assured Guaranty’s approach to transfer pricing may become subject to greater scrutiny from the tax authorities in the jurisdictions in which the group operates in consequence of the implementation of a CBCR regime in the U.K. (or other jurisdictions).
The diverted profits tax (DPT), which is currently levied at 31%, is an anti-avoidance measure, aimed at protecting the U.K. tax base against the diversion of profits away from the U.K., tax charge. In particular, DPT may apply to profits generated by economic activities carried out in the U.K., that are not taxed in the U.K. by reason of arrangements between companies in the same multinational group and involving a low-tax jurisdiction, including co-guarantees and reinsurance. In June 2023, the U.K. Government published a consultation on the reform of U.K. law relating to the DPT. The main proposal in relation to DPT is to remove its status as a separate tax and bring it within the main corporation tax framework. It is currently unknown if or when any such reforms will be adopted or come into effect. It is currently unclear whether DPT would constitute a creditable tax for U.S. foreign tax credit purposes. If any member of the Assured Guaranty group is liable for DPT, this could adversely affect the Company’s results of operations.
Assured Guaranty’s financial results may be affected by measures taken in response to the OECD BEPS project.
On October 8, 2021, nearly 140 countries agreed to the OECD’s proposed Two Pillar Solution to Address the Tax Challenges Arising from the Digitalization of the Economy.
Pillar One revisits tax allocations between jurisdictions to reflect an increasingly digitalized economy. The OECD intends that a portion of certain multinationals’ profits should be taxed in the jurisdiction where revenue is sourced. The current proposals contain an exclusion for regulated financial institutions including insurance (but not captive insurance) and reinsurance companies.
Pillar Two comprises new rules granting jurisdictions additional taxing rights where other relevant jurisdictions have either not taxed relevant profits or those profits have been subject to a rate of tax below 15%. The rules apply to multinational groups with consolidated group revenue of €750 million or more in at least two out of the preceding four fiscal years. Through a series of complex interlocking rules, the intended effect is that low or no taxed profits would be subject to tax at an overall rate of at least 15%.
The OECD published Model Rules for Pillar Two in December 2021. Many jurisdictions have enacted implementing legislation or are in the course of doing so. In particular, the U.K. enacted legislation in July 2023 and February 2024, and HMRC published guidance in respect of such legislation which broadly implement the OECD’s Model Rules for Pillar Two into U.K. domestic legislation of accounting periods starting on or after December 31 2023. In addition, in December 2023 the Bermuda government adopted legislation for a corporate income tax which would share many key concepts with the Model Rules and is intended to constitute a “covered tax” for the purposes of the Model Rules. See Item 1A – Risk Factors, Risks Related to Taxation – AGL may, and AG Re and AGRO will, become subject to taxes in Bermuda, which may adversely affect the Company’s future results of operations and an investment in the Company. In many countries, the rules will apply from January 1, 2024, although some jurisdictions have elected to postpone for one year or more.
In January 2025, the Organization for Economic Cooperation and Development (OECD) issued Administrative Guidance on Article 9.1 of the Global Anti-Base Erosion Model Rules, which excludes certain deferred tax assets for purposes of computing a multinational enterprise group’s effective tax rate when they arose prior to the application of the global minimum tax as a result of certain governmental arrangements or following the introduction of a new corporate income tax. If this guidance were adopted in countries in which the Company operates it could adversely affect tax expense.
The new rules are very complex and are likely to be subject to different applications and interpretations across jurisdictions. Although we cannot predict the approach of each relevant jurisdiction to the rules, their implementation could adversely affect Assured Guaranty’s tax liability.
Risks Related to Applicable Law, Litigation and GAAP
Changes in or inability to comply with applicable laws and regulations could adversely affect the Company’s financial condition, results of operations, capital, liquidity, business prospects and share price.
The Company’s businesses are subject to detailed insurance, asset management and other financial services laws and government regulations in the jurisdictions in which they operate. In addition to the insurance, asset management and other regulations and laws specific to the industries in which the Company operates or invests, regulatory agencies in jurisdictions in which the Company’s businesses operate have broad administrative power over many aspects of the Company’s business, which may include ethical issues, money laundering, privacy, recordkeeping and marketing and sales practices. Future legislative, regulatory, judicial or other legal changes in the jurisdictions in which the Company does business may adversely affect the Company’s financial condition, results of operations, capital, liquidity, business prospects and share price by, among other things, limiting the types of risks it may insure, lowering applicable single or aggregate risk limits related to its insurance business, increasing required reserves or capital for its insurance subsidiaries, providing insured obligors with additional avenues for avoiding or restructuring the repayment of their insured liabilities, increasing the level of supervision or regulation to which the Company’s operations may be subject, imposing restrictions that make the Company’s products less attractive to potential buyers and investors, lowering the profitability of the Company’s business activities, and requiring the Company to change certain of its business practices and exposing it to additional costs (including increased compliance costs).
Compliance with applicable laws and regulations is time consuming and personnel-intensive. If the Company fails to comply with applicable insurance or investment advisory laws and regulations it could be exposed to fines, the loss of insurance or investment advisory licenses, limitations on the right to originate new business and restrictions on its ability to pay dividends. If an insurance subsidiary’s surplus declines below minimum required levels, the insurance regulator could impose additional restrictions on the insurance subsidiary or initiate insolvency proceedings.
Changes in applicable laws or regulations may adversely impact the ability of issuers to satisfy obligations insured or reinsured by the Company.
Certain issuers of obligations insured or reinsured by the Company are reliant on governmental subsidies, funding, grants, loans and other forms of financial assistance, including, for example, emergency funding for disasters and catastrophes, regulated subsidies paid to utilities, housing subsidies and federal aid for schools. In addition, certain issuers of obligations insured or reinsured by the Company may rely on current federal, state and local tax laws (such as tariff regimes impacting imports and the transportation sector) and/or on legal and regulatory frameworks impacting their businesses (for example, the healthcare industry’s development around Medicaid, Medicare and the Affordable Care Act). If current laws or regulations impacting issuers of obligations in the Company’s insurance portfolio are changed in a manner adversely impacting such issuers and/or governmental financial assistance supporting such issuers is reduced or eliminated, the Company may experience increased levels of losses or claims on its insured obligations.
Legislation, regulation, determinations made by legal or regulatory authorities, or litigation arising out of the struggles of distressed obligors may adversely impact obligations insured or reinsured by the Company, the Company’s legal rights as creditor and its investments.
Borrower distress or default, whether or not the relevant obligation is insured by one of the Company’s insurance subsidiaries, may result in legislation, regulation, legal or regulatory determinations, or litigation that may adversely impact obligations insured or reinsured by the Company, the Company’s legal rights as creditor and its investments. For example, the default by the Commonwealth of Puerto Rico on much of its debt has resulted in both legislation (including the enactment of PROMESA) and litigation that is continuing to impact the Company’s rights as creditor, most directly in Puerto Rico but also elsewhere in the U.S. municipal market.
The Company is, and may be in the future, involved in litigation, both as a defendant and as a plaintiff, in the ordinary course of its insurance and asset management business and other business operations. The outcome of such litigation could materially impact the Company’s expected losses and results of operations and cash flows. For a discussion of material litigation, see Part II, Item 8, Financial Statements and Supplementary Data, Note 4, Expected Loss to be Paid (Recovered), and Note 17, Contingencies.
AGL’s ability to pay dividends and fund share repurchases and other activities may be constrained by certain insurance regulatory requirements and restrictions.
AGL is subject to Bermuda regulatory requirements that affect its ability to pay dividends on common shares and to make other payments. Under the Bermuda Companies Act 1981, as amended, AGL may declare or pay a dividend only if it has reasonable grounds for believing that it is, and after the payment would be, able to pay its liabilities as they become due, and if the realizable value of its assets would not be less than its liabilities. While AGL currently intends to pay dividends on its common shares, investors who require dividend income should carefully consider these risks before investing in AGL.
AGL is dependent on dividends from its subsidiaries, including dividends from its insurance subsidiaries, for resources to pay holders of its common shares, fund share repurchases and pursue other activities. The ordinary dividends that AGL’s insurance subsidiaries may pay without regulatory approval are subject to legal and regulatory limitations. See “– Regulatory – State Dividend Limitations,” “– Non-U.S. Regulation – Bermuda – Restrictions on Dividends and Distributions,” “– Non-U.S. Regulation – United Kingdom Insurance and Financial Services Regulation – Restrictions on Dividend Payments” and “– Non-U.S. Regulation – France – Restrictions on Dividend Payments.” As a result, absent relief from the relevant regulator(s), the Company’s insurance subsidiaries may be required to retain capital that is substantially in excess of what the Company believes is necessary to support its insurance businesses, reducing the Company’s ability to productively use or return to shareholders such excess capital. In addition, if, pursuant to insurance laws and regulations, AGL’s insurance subsidiaries are not permitted to pay ordinary dividends or make other permitted payments to AGL at the times or in sufficient amounts AGL requires to fund its activities, and if AGL’s other operating subsidiaries were unable to provide such funds, AGL’s ability to pay dividends to shareholders or fund share repurchases or pursue other activities could be adversely affected. See “— Operational Risks — The ability of AGL and its subsidiaries to meet their liquidity needs may be limited.”
Applicable insurance laws may make it difficult to effect a change of control of AGL.
Before a person can acquire control of a U.S., U.K. or French insurance company, prior written approval must be obtained from the relevant regulatory commissioner or superintendent of the state or country where the insurer is domiciled. In addition, once a person controls a Bermuda insurance company, the Authority may object to such a person who is not, or is no longer, a fit and proper person to exercise such control. Because a person acquiring 10% or more of AGL’s common shares would indirectly control the same percentage of the stock of its insurance subsidiaries, the insurance change of control laws of Maryland, the U.K., France and Bermuda would likely apply to such a transaction. These laws may discourage potential acquisition proposals and may delay, deter or prevent a change of control of AGL, including through transactions, and in particular unsolicited transactions, that some or all of its shareholders might consider to be desirable. While AGL’s Bye-Laws limit the voting power of any shareholder to less than 10%, the Company cannot provide assurances that the applicable regulatory bodies would agree that a shareholder who owned 10% or more of its common shares did not control the applicable insurance subsidiaries, notwithstanding the limitation on the voting power of such shares.
An inability to obtain accurate and timely financial information from Sound Point or other alternative investment managers may impair the Company’s ability to comply with reporting obligations under federal securities law.
The Company will be reliant on Sound Point and other alternative investment managers to provide accurate and timely financial reporting that will allow the Company to timely prepare and file its own financial statements in accordance with generally accepted accounting principles in the United States (GAAP) and in compliance with SEC regulations and NYSE listing rules.
As private companies, Sound Point and other alternative investment managers historically have not been required to prepare their financial statements in accordance with GAAP or in compliance with the SEC’s accounting regulations. The Company expects to report certain of its investments in Sound Point, the Sound Point funds, other vehicles and separately managed accounts and other alternative investment funds on a one-quarter lag. While each of Sound Point, other alternative investment managers and their respective related parties have agreed to provide to the Company financial information necessary to complete and file its periodic SEC reports on a timely basis, any failure by Sound Point, other alternative investment managers or their respective related parties to provide the Company with accurate and timely financial information could result in a delay in the Company’s timely reporting of its results of operations or it not filing one or more periodic reports with the SEC on time or inaccuracies in its financial statements.
Changes in the fair value of the Company’s insured credit derivatives portfolio, CCS, FG VIEs, alternative investments, including those accounted for as CIVs, and/or the consolidation or deconsolidation of one or more FG VIEs and/or CIVs during a financial reporting period, may subject its results of operations to volatility.
The Company is required to mark-to-market certain derivatives that it insures, including CDS that are considered derivatives under GAAP, as well as its CCS. Although there is no cash flow effect from this “marking-to-market,” net changes in the fair value of these derivatives are reported in the Company’s consolidated statements of operations and therefore affect its results of operations. If a credit derivative is held to maturity and no credit loss is incurred, any unrealized gains or losses previously reported would be reversed as the transaction reaches maturity. The Company also expects fluctuations in the fair value of its put option under its CCS to reverse over time. For discussion of the Company’s fair value methodology for credit derivatives, see Part II, Item 8, Financial Statements and Supplementary Data, Note 9, Fair Value Measurement.
The Company is required to consolidate certain VIEs, which generally consist of (1) entities to which it has provided financial guaranties and (2) funds and vehicles in which it invests, such as those managed by Sound Point (and, prior to July 1, 2023, AssuredIM), if it concludes that it is the primary beneficiary of that VIE. Substantially all of the assets and liabilities of the consolidated FG VIEs and CIVs are reported at fair value. The Company continuously evaluates its power to direct the activities that most significantly impact the economic performance of VIEs and, if circumstances change, may consolidate a VIE that was not previously consolidated or deconsolidate a VIE that had previously been consolidated, and such consolidation or deconsolidation would impact its financial condition and results of operations in the period in which such action is taken. See Part II, Item 8, Financial Statements and Supplementary Data, Note 8, Financial Guaranty Variable Interest Entities and Consolidated Investment Vehicles.
The required treatment under GAAP of the Company’s insured credit derivatives portfolio, its CCS and its VIEs causes its financial condition and results of operations as reported under GAAP to be more volatile than would be suggested by the actual performance of its business operations. Due to the complexity of fair value methodologies and the application of GAAP requirements, future amendments or interpretations of relevant accounting standards may cause the Company to modify its accounting methodology in a manner which may have an adverse impact on its financial results.
Change in industry and other accounting practices could adversely affect the Company’s financial condition, results of operations, business prospects and share price.
Changes in or the issuance of new U.S. GAAP accounting standards or statutory accounting standards in the jurisdictions in which the Company is domiciled, such as those that affect the measurement, amount and/or timing of revenue or loss recognition, or those that limit the admissibility of certain assets, among others, could adversely affect the Company’s financial condition, results of operations, business prospects and share price and or the insurance subsidiaries’ ability to pay dividends to AGMH, and ultimately, to AGL. See, Part II, Item 8, Financial Statements and Supplementary Data, Note 1, Business and Basis of Presentation, for a discussion of the future application of accounting standards.
Risks Related to AGL’s Common Shares
The market price of AGL’s common shares may be volatile, and the value of an investment in the Company may decline.
The market price of AGL’s common shares has experienced, and may continue to experience, significant volatility. Numerous factors, including many over which the Company has no control, may have a significant impact on the market price of its common shares. These risks include those described or referred to in this “Risk Factors” section as well as, among other things: (a) investor perceptions of the Company, its prospects and that of the financial guaranty and asset management industries and the markets in which the Company operates; (b) the Company’s operating and financial performance; (c) the Company’s access to financial and capital markets to raise additional capital, refinance its debt or obtain other financing; (d) Company’s ability to repay debt; (e) the Company’s dividend policy; (f) the amount of share repurchases authorized by the AGL’s Board; (g) future sales of equity or equity-related securities; (h) changes in earnings estimates or buy/sell recommendations by analysts; and (i) general financial, economic and other market conditions.
In addition, the stock market in recent years has experienced extreme price and trading volume fluctuations that often have been unrelated or disproportionate to the operating performance of individual companies. These broad market fluctuations may adversely affect the price of AGL’s common shares, regardless of AGL-specific factors.
Furthermore, future sales or other issuances of AGL equity may adversely affect the market price of its common shares.
Provisions in the Code and AGL’s Bye-Laws may reduce the voting rights of its common shares.
Under the Code, AGL’s Bye-Laws and contractual arrangements, certain shareholders have their voting rights limited to less than one vote per share. Moreover, the relevant provisions of the Code and AGL’s Bye-Laws may have the effect of
reducing the votes of certain shareholders who would not otherwise be subject to the limitation by virtue of their direct share ownership.
More specifically, pursuant to the relevant provisions of the Code, if, and so long as, the common shares of a shareholder are treated as “controlled shares” (as determined under section 958 of the Code) of any U.S. Person and such controlled shares constitute 9.5% or more of the votes conferred by AGL’s issued shares, the voting rights with respect to the controlled shares of such U.S. Person (a 9.5% U.S. Shareholder) are limited, in the aggregate, to a voting power of less than 9.5%, under a formula specified in AGL’s Bye-Laws. The formula is applied repeatedly until the voting power of all 9.5% U.S. Shareholders has been reduced to less than 9.5%. For these purposes, “controlled shares” include, among other things, all shares of AGL that such U.S. Person is deemed to own directly, indirectly or constructively (within the meaning of section 958 of the Code).
In addition, the Board may limit a shareholder’s voting rights where it deems appropriate to do so to: (1) avoid the existence of any 9.5% U.S. Shareholders; and (2) avoid certain material adverse tax, legal or regulatory consequences to the Company or any of the Company’s subsidiaries or any shareholder or its affiliates. AGL’s Bye-Laws provide that shareholders will be notified of their voting interests prior to any vote taken by them.
AGL also has the authority under its Bye-Laws to request information from any shareholder for the purpose of determining whether a shareholder’s voting rights are to be reduced under the Bye-Laws. If a shareholder fails to respond to a request for information or submits incomplete or inaccurate information in response to a request, the Company may, in its sole discretion, eliminate such shareholder’s voting rights.
Provisions in AGL’s Bye-Laws may restrict the ability to transfer common shares, and may require shareholders to sell their common shares.
AGL’s Board may decline to approve or register a transfer of any common shares: (1) if it appears to the Board, after taking into account the limitations on voting rights contained in AGL’s Bye-Laws, that any adverse tax, regulatory or legal consequences to AGL, any of its subsidiaries or any of its shareholders may occur as a result of such transfer (other than such as the Board considers to be de minimis); or (2) subject to any applicable requirements of or commitments to the NYSE, if a written opinion from counsel supporting the legality of the transaction under U.S. securities laws has not been provided or if any required governmental approvals have not been obtained.
AGL’s Bye-Laws also provide that if the Board determines that share ownership by a person may result in adverse tax, legal or regulatory consequences to the Company, any of the subsidiaries or any of the shareholders (other than such as the Board considers to be de minimis), then AGL has the option, but not the obligation, to require that shareholder to sell to AGL or to third parties to whom AGL assigns the repurchase right for fair market value the minimum number of common shares held by such person which is necessary to eliminate such adverse tax, legal or regulatory consequences.
ITEM 1B. UNRESOLVED STAFF COMMENTS
None.
ITEM 1C. CYBERSECURITY
Risk Management and Strategy
The Company has strategically integrated cybersecurity risk management into its broader risk management framework to promote a company-wide culture of cybersecurity risk management. This integration ensures that cybersecurity considerations are an integral part of the Company’s decision-making processes. The Company regularly assesses risks from cybersecurity threats and monitors its computer networks for vulnerabilities. To defend the Company’s computer systems from cyberattacks, the Company uses various security tools that are designed to help the Company protect against, identify, monitor, escalate, investigate, resolve, and recover from security incidents in a timely manner.
The Company maintains an Information Security Policy and Standards that details how material risks from cybersecurity threats are assessed, identified, and managed:
•Risk assessment – a periodic risk assessment is performed by the Chief Information Security Officer using the National Institute of Standards and Technology cybersecurity framework and rates risks by criticality.
•Risk identification – vulnerabilities and risks are identified through functions performed by the Chief Information Security Officer which includes assessments using automated tools, monitoring activities, reviewing threat intelligence, and responding to incidents. Risks are also identified through independent assessments performed by third-party consultants and the internal audit function.
•Risk management – the Chief Technology Officer oversees a process designed to protect against and remediate risks according to their criticality and presents to the Risk Oversight and Audit Committees of the Board and management at least semi-annually. The Chief Information Security Officer also presents to the Board and Risk Oversight Committee on information technology, cybersecurity and data privacy matters at least annually.
The Company’s Information Security Policy and Standards details a process for responding to cybersecurity events. Awareness and alertness are important components of the Company’s cybersecurity program; each year employees are required to take the cybersecurity training and the Company conducts regular exercises to educate employees about best practices and help them identify and avoid potential threats.
The Company engages third-party consultants to conduct periodic penetration testing designed to identify potential security vulnerabilities. The Company’s internal audit function, which has been outsourced to an international accounting firm, conducts periodic audits of cybersecurity and reports on such matters to the Audit Committee of the Board.
The Company takes measures designed to mitigate risks associated with third-party vendors that have access to confidential information or provide business critical functions. Through its vendor management program, the Company screens these third-party vendors to assess their data security protocols both prior to initial engagement and periodically thereafter for compliance with the program standards. The Company seeks contractual obligations from third-party vendors to notify it in the event of a cybersecurity incident, and monitors threat intelligence reports as well as current reports of SEC-registered vendors and their sub-service providers that have access to confidential information or provide business critical functions for cybersecurity incidents.
The Company has not experienced any cybersecurity incidents that have materially affected, or that it believes are reasonably likely to materially affect, the Company, including its business strategy, results of operations, or financial condition.
Governance
Under the Company’s cybersecurity governance framework, the Board has overall responsibility for overseeing management’s establishment and operation of a cybersecurity program. Members of the Board have broad-based skills in risk management oversight and/or cybersecurity oversight certifications. The Board delegates certain cybersecurity oversight responsibilities to the Risk Oversight Committee, which oversees enterprise risk, vendor management, and information technology risks, including assessing and managing cybersecurity and data privacy risks, and to the Audit Committee, whose oversight responsibility includes, as part of its oversight of the Company’s system of internal controls over financial reporting, assessing and managing financial risk exposures, including information technology, cybersecurity and data privacy risk related to the Company’s financial systems. The Risk Oversight Committee has specific responsibility for overseeing information technology processes and controls, including for cybersecurity, data privacy, compliance with related policies, and the process to monitor risks to the Company arising from changing technology trends, and coordinates with the Audit Committee, as needed.
The security of the Company’s products, services and corporate network is a key priority both for the growth of the Company’s business and its responsibilities as the leading financial guaranty insurance company. The Company takes a risk-based approach to cybersecurity and has implemented cybersecurity policies throughout its operations.
As described above in Cybersecurity – Risk Management and Strategy, the Company’s Chief Technology Officer has management responsibility for overseeing a process designed to remediate cybersecurity risks, and reports to the Board, Risk Oversight Committee, Audit Committee and management at least semi-annually. The Chief Technology Officer reported to the Board, Risk Oversight Committee and Audit Committee four times in 2024. The Chief Technology Officer has over 25 years of experience in information technology, technology research and security and operations management, with over 15 of those years focused in financial services and insurance. The Chief Technology Officer holds a Master of Science in Information Systems and a Master of Business Administration with a focus in Management and Operations. The Company has appointed a Chief Information Security Officer, who is responsible for leading the assessment and management of cybersecurity risk. In 2024, the Chief Information Security Officer made an annual report on information technology and cybersecurity risks to the Board and made four quarterly reports to the Risk Oversight Committee and the Audit Committee. The Chief Information Security Officer has over 25 years of experience in information security and is a Certified Information Systems Security Professional (CISSP), Certified Information Security Manager (CISM), and Certified Information Systems Auditor (CISA). The
Chief Information Security Officer reports to the Board, its committees, and management on cybersecurity threats on a regular basis.
The Company uses various tools to prevent, detect, and mitigate cybersecurity incidents. The Company has procedures in place to respond to cybersecurity incidents, which include prompt meeting of the Cybersecurity Incident Disclosure Committee, a Company management committee, to assess cybersecurity incidents and determine materiality requiring disclosure on Form 8-K, notification of the Board of any material cybersecurity incidents, quarterly reporting by the Chief Information Security Officer of material and non-material incidents to the Risk Oversight Committee and management, and to the Audit Committee of such incidents related to the Company’s financial systems.
ITEM 2. PROPERTIES
Management believes its office space is adequate for its current and anticipated needs. The Company’s office properties are used by its Insurance segment and its Corporate division and include the following:
•Hamilton, Bermuda:
◦approximately 8,700 square feet of office space that serves as the principal executive office of AGL, and as the principal offices of AG Re and AGRO. The lease expires in April 2026 and is renewable at the option of the Company.
•New York, U.S.:
◦155,500 square feet of office space that serves as the principal office of AG. Part of the lease expires in February 2032, with an option, subject to certain conditions, to renew for five years at a fair market rent, and part of the lease expires in December 2032. As of December 31, 2024, approximately 24,000 square feet of this office space was subleased to another tenant.
•London, U.K.:
◦approximately 7,000 square feet of office space that serves as the principal office of AGUK. The lease expires in September 2029, with an option, subject to certain conditions, to renew for five years at a fair market rent.
•Paris, France:
◦approximately 2,800 square feet of office space that serves as the principal office of AGE. The lease expires in March 2029.
•Other: The Company leases other space in San Francisco, California; Asheville, North Carolina; Sydney, Australia; and Singapore.
ITEM 3. LEGAL PROCEEDINGS
ITEM 4. MINE SAFETY DISCLOSURES
Not applicable.
Information About The Company’s Executive Officers
The table below sets forth the names, ages, positions and business experience of the executive officers of AGL as of February 27, 2025.
| | | | | | | | | | | | | | |
| Name | | Age | | Position(s) |
| Dominic J. Frederico | | 72 | | President and Chief Executive Officer; Deputy Chairman |
| Robert A. Bailenson | | 58 | | Chief Operating Officer |
| Benjamin G. Rosenblum | | 51 | | Chief Financial Officer |
| Ling Chow | | 54 | | General Counsel and Secretary |
| Stephen Donnarumma | | 62 | | Chief Credit Officer |
| Jorge A. Gana | | 54 | | Chief Risk Officer |
| Holly Horn | | 64 | | Chief Surveillance Officer |
Dominic J. Frederico has been a director of AGL since the Company’s 2004 initial public offering and the President and Chief Executive Officer of AGL since December 2003. Mr. Frederico served as Vice Chairman of ACE Limited from 2003 until 2004 and served as President and Chief Operating Officer of ACE Limited and Chairman of ACE INA Holdings, Inc. from 1999 to 2003. Mr. Frederico was a director of ACE Limited from 2001 through May 2005. From 1995 to 1999 Mr. Frederico served in a number of executive positions with ACE Limited. Prior to joining ACE Limited, Mr. Frederico spent 13 years working for various subsidiaries of American International Group, Inc.
Robert A. Bailenson has been Chief Operating Officer of AGL since January 1, 2024. Mr. Bailenson has been with Assured Guaranty and its predecessor companies since 1990. Prior to that, Mr. Bailenson was Chief Financial Officer of AGL from June 2011 through December 2023. Prior to that, Mr. Bailenson became Chief Accounting Officer of AG in 2003, of AGL in May 2005, and of AGM in July 2009, and served in such capacities until 2019. He was Chief Financial Officer and Treasurer of AG Re from 1999 until 2003 and was previously the Assistant Controller of Capital Re Corp., the Company’s predecessor.
Benjamin G. Rosenblum has been Chief Financial Officer of AGL since January 1, 2024. Prior to that, Mr. Rosenblum was Chief Actuary of AGL from 2021 through December 2023, and also Chief Actuary of AGM (until its merger with and into AG) and AG from December 2010 to October 2024. He joined Assured Guaranty in 2004, responsible for the loss reserve function at AGRE and AGRO, later assuming the same responsibilities at AGUK and AGE. He became a Senior Managing Director in 2015, and has been in charge of accounting and financial reporting since 2019.
Ling Chow has been General Counsel and Secretary of AGL since January 1, 2018. She is responsible for legal affairs and corporate governance at the Company, including its litigation and other legal strategies relating to distressed credits, and its corporate, compliance, regulatory and disclosure efforts. She is also responsible for the Company’s human capital management function. Ms. Chow began her tenure at the Company in 2002 as a transactional attorney, working on the insurance of structured finance and derivative transactions. She previously served as Deputy General Counsel and Assistant Secretary of AGL from May 2015 and as Assured Guaranty’s U.S. General Counsel from June 2016. Prior to that, Ms. Chow served as Deputy General Counsel of Assured Guaranty’s U.S. subsidiaries in several capacities from 2004. Before joining Assured Guaranty, Ms. Chow was an associate at law firms in New York City, where she was responsible for transactional work associated with public and private mergers and acquisitions, venture capital investments, and private and public securities offerings.
Stephen Donnarumma has been the Chief Credit Officer of AG since 2007, and of AGM from 2009 until its merger with and into AG. Mr. Donnarumma joined Assured Guaranty in 1993 and has held a number of positions over the years, including Deputy Chief Credit Officer of AGL, Chief Operating Officer and Chief Underwriting Officer of AG Re, Chief Risk Officer of AG, and Senior Managing Director, Head of Mortgage and Asset-backed Securities of AG. Prior to joining Assured Guaranty, Mr. Donnarumma was with Financial Guaranty Insurance Company from 1989 until 1993, where his responsibilities included underwriting domestic and international financial guaranty transactions. Prior to that, he served as a Director of Credit Risk Analysis at Fannie Mae from 1987 until 1989. Mr. Donnarumma was also an analyst with Moody’s Investors Services from 1985 until 1987.
Jorge A. Gana has been Chief Risk Officer of AGL and Chair of the U.S. Risk Management and Portfolio Risk Management Committees since January 1, 2023. Mr. Gana also maintains primary responsibility for the environmental aspect of Assured Guaranty’s ESG efforts. Prior to that, Mr. Gana served as Deputy Chief Risk Officer of AGM and AG. Mr. Gana joined Assured Guaranty in 2005 as a Director in structured finance. Over the years, Mr. Gana has held a number of positions at Assured Guaranty, including Managing Director, Structured Finance at AG, Senior Managing Director of Workouts and Government & Corporate Affairs at AGM and AG, and chair of AGM's and AG’s Workout Committees. Mr. Gana continues to serve as a voting member of AG’s Credit and Workout Committees. Prior to joining Assured Guaranty, Mr. Gana served as a Director of Global Commercial Asset Securitization for XLCA (now Syncora). Prior to XLCA, Mr. Gana worked at Natexis Banques Populaires (now Natixis) and at Banco Santander in global capacities dealing with credit and risk, managing investment portfolios, originating complex transactions, and issuing repackaged debt. Mr. Gana also worked for the Chile Economic Development Agency, New York Office, and as Editor of the Chile Economic Report until 1996.
Holly L. Horn has been Chief Surveillance Officer of AGL and AG since January 2022. Prior to that, Ms. Horn served as AGM’s and AG’s Chief Surveillance Officer, Public Finance where she was responsible for ongoing surveillance, monitoring and loss mitigation of municipal risks insured by the Company across all sectors of the municipal market. She joined AGM in 2003 as a director in the health care underwriting group, where she was responsible for analyzing and recommending the insurability of health care credits. She also served as a director in AGM’s health care surveillance group. Ms. Horn began her public finance career at Inova Health System, a nationally ranked integrated health care delivery system, and subsequently served as a senior manager for the national health care strategy practice at Ernst & Young.
PART II
ITEM 5. MARKET FOR REGISTRANT’S COMMON EQUITY, RELATED STOCKHOLDER MATTERS AND ISSUER PURCHASES OF EQUITY SECURITIES
AGL’s common shares are listed on the NYSE under the symbol “AGO.” On February 26, 2025, the approximate number of shareholders of record at the close of business on that date was 76.
AGL is a holding company whose principal source of liquidity is dividends from its operating subsidiaries. The ability of the operating subsidiaries to pay dividends to AGL and AGL’s ability to pay dividends to its shareholders are each subject to legal and regulatory restrictions. The declaration and payment of future dividends will be at the discretion of AGL’s Board and will be dependent upon the Company’s profits and financial requirements and other factors, including legal restrictions on the payment of dividends and such other factors as the Board deems relevant. AGL paid quarterly cash dividends in the amount of $0.31 and $0.28 per common share in 2024 and 2023, respectively. For more information concerning AGL’s dividends, see Item 7, Management’s Discussion and Analysis of Financial Condition and Results of Operations — Liquidity and Capital Resources and Item 8, Financial Statements and Supplementary Data, Note 18, Shareholders’ Equity.
Issuer’s Purchases of Equity Securities
In 2024, the Company repurchased a total of 6,180,774 common shares for approximately $502 million at an average price of $81.28 per share.
From time to time, the Board authorizes the repurchase of additional common shares under a program without an expiration date that it initiated on January 18, 2013. Most recently, on November 8, 2024, the Board authorized the repurchase of an additional $250 million of its common shares. As of February 27, 2025, the remaining amount the Company was authorized to purchase was approximately $276 million of its common shares. The Company expects future common share repurchases under the current authorization to be made from time to time in the open market or in privately negotiated transactions. The timing, form and amount of the share repurchases are at the discretion of management and will depend on a variety of factors, including availability of funds at the holding companies, other potential uses for such funds, market conditions, the Company’s capital position, legal requirements and other factors. The repurchase authorization may be modified, extended or terminated by the Board at any time. It does not have an expiration date. See Item 8, Financial Statements and Supplementary Data, Note 18, Shareholders’ Equity, for additional information about share repurchases and authorizations.
The following table reflects purchases of AGL common shares made by the Company during the fourth quarter of 2024.
| | | | | | | | | | | | | | | | | | | | | | | | | | |
| Period | | Total
Number of
Shares
Purchased (1) | | Average
Price Paid
Per Share | | Total Number of
Shares Purchased as
Part of Publicly
Announced Program (2) | | Maximum Number (or Approximate Dollar Value)
of Shares that
May Yet Be
Purchased
Under the Program(3) |
| October 1 - October 31 | | 601,575 | | | $ | 83.52 | | | 601,575 | | | $ | 142,267,634 | |
| November 1 - November 30 | | 280,661 | | | $ | 89.30 | | | 280,579 | | | $ | 367,211,562 | |
| December 1 - December 31 | | 172,573 | | | $ | 89.94 | | | 172,573 | | | $ | 351,689,856 | |
| Total | | 1,054,809 | | | $ | 86.11 | | | 1,054,727 | | | |
____________________
(1) The total number of shares purchased also includes shares purchased as a result of employees surrendering shares as payment for withholding taxes upon vesting of share awards.
(2) After giving effect to repurchases since the Board first authorized the repurchase program on January 18, 2013, through February 27, 2025, the Company has repurchased a total of 151 million common shares for approximately $5.4 billion, excluding commissions, at an average price of $35.99 per share. The repurchase program has no expiration date and the Board has periodically increased the authorization since 2013.
(3) Excludes commissions and excise taxes.
Performance Graph
Set forth below are a line graph and a table comparing the dollar change in the cumulative total shareholder return on AGL’s common shares from December 31, 2019 through December 31, 2024 as compared to the cumulative total return of the S&P’s 500 Stock Index, the cumulative total return of the S&P’s 500 Financials Stock Index and the cumulative total return of the Russell Midcap Index - Financials. The Company added the Russell Midcap Index - Financials in 2018 because it believes that this index, which includes the Company, provides a useful comparison to other companies in the financial services sector, and excludes companies that are included in the S&P’s 500 Financials Stock Index but are many times larger than the Company. The chart and table depict the value on December 31 of each year from 2019 through 2024 of a $100 investment made on December 31, 2019, with all dividends reinvested:
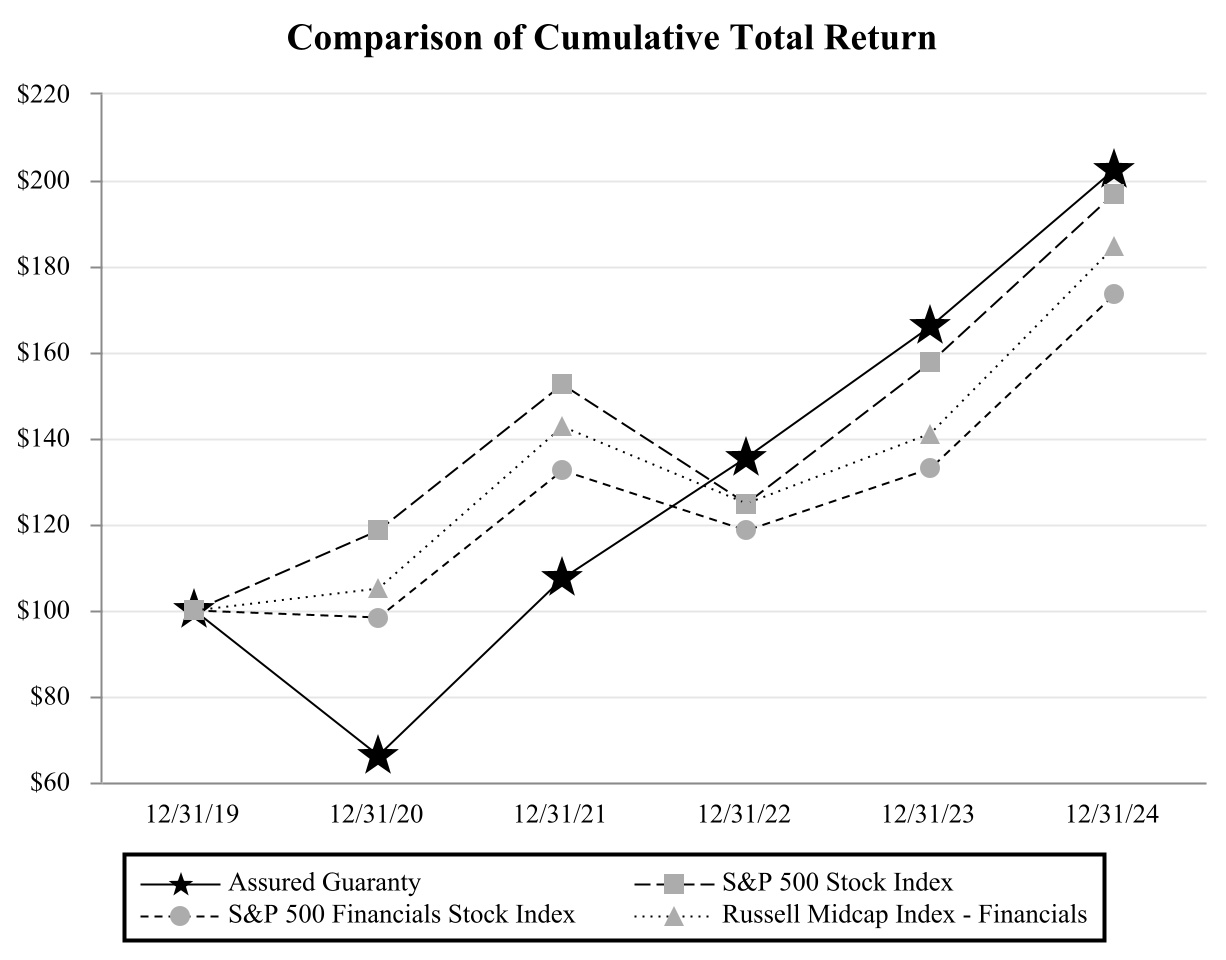
| | | | | | | | | | | | | | | | | | | | | | | |
| Assured Guaranty | | S&P 500 Stock Index | | S&P 500
Financials Stock Index | | Russell Midcap
Index - Financials |
| 12/31/2019 | $ | 100.00 | | | $ | 100.00 | | | $ | 100.00 | | | $ | 100.00 | |
| 12/31/2020 | 66.06 | | | 118.39 | | | 98.24 | | | 104.94 | |
| 12/31/2021 | 107.25 | | | 152.34 | | | 132.50 | | | 142.56 | |
| 12/31/2022 | 135.35 | | | 124.73 | | | 118.49 | | | 124.74 | |
| 12/31/2023 | 165.83 | | | 157.48 | | | 132.83 | | | 141.07 | |
| 12/31/2024 | 202.43 | | | 196.85 | | | 173.35 | | | 184.55 | |
___________________
Source: Calculated from total returns published by Bloomberg.
ITEM 7. MANAGEMENT’S DISCUSSION AND ANALYSIS OF FINANCIAL CONDITION AND RESULTS OF OPERATIONS
For a more detailed description of events, trends and uncertainties, as well as the capital, liquidity, credit, operational and market risks and the critical accounting policies and estimates affecting the Company, the following discussion and analysis of the Company’s financial condition and results of operations should be read in its entirety with the Company’s consolidated financial statements and accompanying notes which appear elsewhere in this Form 10-K. The following discussion and analysis of the Company’s financial condition and results of operations contains forward looking statements that involve risks and uncertainties. See “Forward Looking Statements” for more information. The Company’s actual results could differ materially from those anticipated in these forward looking statements as a result of various factors, including those discussed below and elsewhere in this Form 10-K, particularly under the headings “Risk Factors” and “Forward Looking Statements.”
Discussion related to the results of operations for the Company’s comparison of 2023 results to 2022 results have been omitted in this Form 10-K. The Company’s comparison of 2023 results to 2022 results is included in the Company’s Annual Report on Form 10-K for the fiscal year ended December 31, 2023, under Part II, Item 7, Management’s Discussion and Analysis of Financial Condition and Results of Operations.
Overview
Business
The Company reports its results of operations in two distinct segments, Insurance and Asset Management, consistent with the manner in which the Company’s chief operating decision maker reviews the business to assess performance and allocate resources. The Company’s Corporate division and other activities (including financial guaranty VIEs (FG VIEs) and CIVs) are presented separately.
In the Insurance segment, the Company provides credit protection products to the U.S. and non-U.S. public finance (including infrastructure) and structured finance markets. The Company participates in the asset management business through its ownership interest in Sound Point. See Item 1. Business, Asset Management, and Item 8, Financial Statements and Supplementary Data, Note 1, Business and Basis of Presentation.
The Corporate division primarily consists of the results of holding companies that have issued public equity or debt. The Other category in the segment tables below primarily includes the effect of consolidating FG VIEs and CIVs (FG VIE and CIV consolidation). See Item 8, Financial Statements and Supplementary Data, Note 2, Segment Information.
Economic Environment
Real gross domestic product (GDP) increased 2.8% in 2024, compared to an increase of 2.9% in 2023, according to the second estimate released by the U.S. Bureau of Economic Analysis (BEA). Additionally, the BEA reported real GDP increased at an annual rate of 2.3% in the fourth quarter of 2024. At the end of December 2024, the U.S. unemployment rate, seasonally adjusted, stood at 4.1%, higher than where it started the year at 3.8%. The Company believes a more robust economy makes it less likely that obligors whose obligations it guarantees will default.
According to the U.S. Bureau of Labor Statistics, the inflation rate in the U.S. before seasonal adjustment for the 12-month period ending December 2024, as measured by the Consumer Price Index for All Urban Consumers, was 2.9%, as compared to 3.4% for the 12-month period ending December 2023. According to the U.K. Office for National Statistics, the Consumer Prices Index including owner occupiers’ housing costs rose 3.5% for the 12 months through December 2024, as compared to 4.2% for the 12 months through December 2023. The Company believes that higher inflation may put pressure on the budgets of obligors whose obligations it guarantees and make defaults more likely. In addition, consumer price inflation in the U.K. increases reported net par outstanding for certain U.K. exposures with approximately $23.2 billion of net par outstanding as of December 31, 2024, and also increases projected future installment premiums on the portion of such exposure that pays at least a portion of the premium on an installment basis over the term of the exposure.
At its September 17-18, 2024 meeting, the Federal Open Market Committee (FOMC) decided to lower the federal funds rate, which was a reversal of the rate increases it had initiated in March 2022 to combat inflation. The federal funds rate is the rate at which banks lend to and borrow from each other, is the benchmark for most interest rates, and tends to influence mortgage rates. As the federal funds rate decreases, interest rates, including mortgage rates, tend to decrease. From September 2024 through December 2024, the FOMC lowered the federal funds rate from a target range of 5.25% to 5.50% to a range of 4.25% to 4.50%. At its January 28-29, 2025 meeting, the FOMC held the federal funds at a range of 4.25% to 4.50%, stating
that it seeks to achieve maximum employment and inflation at the rate of 2% over the longer run, and that the risks to achieving its employment and inflation goals are roughly in balance. In considering the extent and timing of additional adjustments to the target range for the federal funds rate, the FOMC has indicated it will carefully assess incoming data, the evolving outlook, and the balance of risks. These assessments will take into account a wide range of information, including readings on labor market conditions, inflation pressures and inflation expectations, and financial and international developments.
The level and direction of change of interest rates and credit spreads impact the Company in numerous ways. On the one hand, lower interest rates may increase the fair value of fixed-maturity securities currently held in the Company’s investment portfolio, encourage municipal bond issuance and positively impact the finances of some of the obligors whose payments the Company insures. On the other hand, lower interest rates may decrease the base on which the Company charges up-front premium on most new U.S. municipal bond transactions and may also decrease amounts the Company can earn on fixed-maturity securities newly acquired for its investment portfolio. Lower interest rates also are often accompanied by narrower spreads, which may also decrease the level of premiums the Company can charge for those products.
The 30-year AAA Municipal Market Data (MMD) rate is a measure of interest rates in the Company’s largest financial guaranty insurance market, U.S. public finance. The MMD rate averaged 3.68% for 2024, similar to the 3.65% rate in 2023 but higher than the 3.00% average for 2022. Meanwhile, the difference, or credit spread, between the 30-year BBB-rated general obligation relative to the 30-year AAA MMD averaged 90 basis points (bps) in 2024, which is narrower compared to the 101 bps average for 2023, but the same as the 90 bps average for 2022. The Company believes that wider spreads could permit it to increase its premium rates on new business.
According to Freddie Mac, the 30-year fixed-rate mortgage averaged 6.85% as of December 26, 2024, near the 30-year mortgage rate of 6.61% from one year ago. The Company believes that restricted housing inventory continues to influence home prices where demand outpaces supply. Higher housing prices may benefit distressed RMBS the Company insures. The National Association of Realtors reported that year-over-year existing-home sales increased 9.3% from December 2023 to December 2024, and that the median existing-home sales price also increased from December 2023 ($381,400) to December 2024 ($404,400), a 6.0% increase.
Key Business Strategies
The Company continually evaluates its business strategies and is currently pursuing key business strategies in four areas: (i) insurance; (ii) asset management, (iii) alternative investments; and (iv) capital management.
Insurance
The Company seeks to grow the insurance business through new business production in established sectors and jurisdictions and by entering into new markets and classes of business. The Company also furthers its insurance strategy by mitigating losses in its insured portfolio.
Growth of the Insured Portfolio
The Company seeks to grow its financial guaranty insurance portfolio through new business production in each of its markets: public finance (including infrastructure) and structured finance. The Company believes high-profile defaults by municipal obligors, such as Puerto Rico, Detroit, Michigan and Stockton, California as well as events such as the COVID-19 pandemic have led to increased awareness of the value of bond insurance and stimulated demand for the product. The Company believes there will be continued demand for its insurance in this market because, for those exposures that the Company guarantees, it undertakes the tasks of credit selection, analysis, negotiation of terms, surveillance and, if necessary, loss mitigation. The Company believes that its insurance: (i) encourages retail investors, who typically have fewer resources than the Company for analyzing municipal bonds, to purchase such bonds; (ii) enables institutional investors to operate more efficiently; and (iii) allows smaller, less well-known issuers to gain market access on a more cost-effective basis.
The low interest rate environment and tight U.S. municipal credit spreads from when the financial crisis began in 2008 through early 2020 dampened demand for bond insurance compared with the levels before the financial crisis. After the onset of the COVID-19 pandemic in early 2020, credit spreads initially widened as a result of market concerns about the impact of the COVID-19 pandemic on some municipal credits, thereby improving demand for financial guaranty insurance even in a low interest rate environment, before narrowing again in 2022. The Company believes that, over time, wider credit spreads may improve demand for bond insurance.
In certain segments of the infrastructure and structured finance markets, the Company believes its financial guaranty product is competitive with other financing options. For example, certain investors may receive advantageous capital requirement treatment with the addition of the Company’s guaranty. The Company considers its involvement in both infrastructure and structured finance transactions to be beneficial because such transactions diversify both the Company’s business opportunities and its risk profile beyond U.S. public finance. The timing of new business production in the infrastructure and structured finance sectors is influenced by typically long lead times and therefore may vary from period to period.
U.S. Municipal Market Data and Bond Insurance Penetration Rates (1)
Based on Sale Date
| | | | | | | | | | | | | | | | | |
| | Year Ended December 31, |
| 2024 | | 2023 | | 2022 |
| (dollars in billions) |
| Par: | | | | | |
| New municipal bonds issued | $ | 495.9 | | | $ | 362.8 | | | $ | 359.7 | |
| Total insured | $ | 41.1 | | | $ | 31.8 | | | $ | 28.8 | |
| Insured by Assured Guaranty | $ | 24.0 | | | $ | 19.5 | | | $ | 17.0 | |
| Number of issues: | | | | | |
| New municipal bonds issued | 8,640 | | | 7,268 | | | 7,902 | |
| Total insured | 1,680 | | | 1,397 | | | 1,420 | |
| Insured by Assured Guaranty | 791 | | | 645 | | | 648 | |
| Bond insurance market penetration based on: | | | | | |
| Par | 8.3 | % | | 8.8 | % | | 8.0 | % |
| Number of issues | 19.4 | % | | 19.2 | % | | 18.0 | % |
| Single A par sold | 24.0 | % | | 31.1 | % | | 30.2 | % |
| Single A transactions sold | 64.1 | % | | 61.6 | % | | 59.0 | % |
| $25 million and under par sold | 23.8 | % | | 24.6 | % | | 21.9 | % |
| $25 million and under transactions sold | 24.6 | % | | 23.6 | % | | 21.4 | % |
____________________
(1) Source: The amounts in the table are those reported by London Stock Exchange Group. The table excludes private placements and Corporate-CUSIP transactions insured by Assured Guaranty, certain of which the Company also considers to be public finance business.
The Company also considers opportunities to acquire financial guaranty portfolios, whether by acquiring financial guarantors that are no longer actively writing new business or their insured portfolios, generally through reinsurance or novations. These transactions enable the Company to improve its future earnings and deploy excess capital.
Merger of the U.S. Insurance Subsidiaries
On August 1, 2024, AGM merged with and into AG, with AG as the surviving company. Upon the merger all liabilities of AGM, including insurance policies issued or assumed by AGM, became obligations of AG.
The Company believes that Assured Guaranty’s simplified organizational and capital structure following the merger will help it grow its business. The combined company, as compared with either AG or AGM before the merger, has a larger, more highly diversified insured portfolio, a larger investment portfolio and a larger capital base, creating a more efficient capital structure and greater claims-paying resources. In addition, the combined company, as compared with either AG or AGM before the merger, has larger regulatory single risk limits. Such limits are applicable to each individual financial guaranty insurer for obligations issued by a single entity and backed by a single revenue source. Since the combined company has greater policyholder’s surplus and contingency reserves, as compared to standalone AG or AGM before the merger, the dollar amounts for its single risk limits on obligations issued by a single entity and backed by a single revenue source are also greater.
Prior to the merger, AG had been directly owned by AGUS. As a result of the merger, effective as of August 1, 2024, AG is directly owned by AGMH, a subsidiary of AGUS.
Loss Mitigation
In an effort to avoid, reduce or recover losses and potential losses in its insurance portfolio, the Company employs a number of strategies.
In the public finance area, the Company believes its experience and the resources it is prepared to deploy, as well as its ability to provide bond insurance or other solutions, result in more favorable outcomes in distressed public finance situations than would be the case without its participation. This has been illustrated by the Company’s role in negotiating various agreements in connection with the restructuring of obligations of the Commonwealth of Puerto Rico and various obligations of its related authorities and public corporations, as well as Detroit, Michigan and Stockton, California. The Company will also, where appropriate, participate in litigation to enforce or defend its rights. For example, the Company initiated a number of legal actions to enforce its rights with respect to obligations of the Commonwealth of Puerto Rico and various obligations of its related authorities and public corporations. In addition, the Company successfully defended claims brought by Lehman Brothers International (Europe) (in administration) (LBIE) and prevailed in its counterclaim against LBIE; following the exhaustion of LBIE’s appeals, the Company will recognize a gain in the first quarter of 2025 of approximately $103 million, which represents the full satisfaction of the judgment it was awarded and its claims for attorneys’ fees, expenses and interest in connection with this litigation. See, Item 8, Financial Statements and Supplementary Data, Note 17, Contingencies, Litigation, for additional information.
The Company is, and for several years has been, working with the servicers of some of the U.S. RMBS transactions it insures to encourage the servicers to provide alternatives to distressed borrowers that will encourage them to continue making payments on their loans to help improve the performance of the related RMBS. For public finance credits, the Company’s surveillance function monitors and proactively engages with the distressed credits to offer assistance aimed to improve operations and financial performance, including access to external consultants and other industry experts.
The Company may also purchase attractively priced obligations, including BIG obligations, that it has insured and for which it had expected losses to be paid, in order to mitigate the economic effect of insured losses (Loss Mitigation Securities). The fair value of Loss Mitigation Securities as of December 31, 2024 (excluding the value of the Company’s insurance) was $479 million.
In some instances, the terms of the Company’s policy or the terms of certain workout orders and resolutions give it the option to pay principal on an accelerated basis on an obligation on which it has paid a claim, thereby reducing the amount of guaranteed interest due in the future. The Company has at times exercised this option, which uses cash but reduces projected future losses. The Company may also facilitate the issuance of refunding bonds, by either providing insurance on the refunding bonds or purchasing refunding bonds, or both. Refunding bonds may provide the issuer with payment relief.
Asset Management
Until July 1, 2023, the Company pursued its asset management strategy through AssuredIM. Upon the closing of the transaction with Sound Point (Sound Point Transaction) and the AHP Transaction, effective as of July 1, 2023, the Company participates in the asset management business through its ownership interest in Sound Point, and no longer directly manages investments for third parties. The Company’s ownership interest in Sound Point furthers its strategy of participating in a fee-based earnings stream independent of the risk-based premiums generated by its financial guaranty business. The Sound Point business was strengthened by the addition of AssuredIM’s AUM (excluding AUM relating to AHP). See Item 8, Financial Statements and Supplementary Data, Note 1, Business and Basis of Presentation, for a description of the Sound Point Transaction and the AHP Transaction.
Alternative Investments
The Company seeks to maintain an investment portfolio that supports the requirements of its insurance subsidiaries, strategic initiatives and liquidity needs, while maximizing the income it earns from such investments. In support of that goal, the Company aims to diversify the types of investments in its portfolio. The Company expects its relationship with Sound Point to also enhance its alternative investment opportunities and the return on its investments. The Company has agreed to invest an aggregate amount of $1.5 billion in alternative investments, including $1 billion in Sound Point managed investments.
Capital Management
The Company has developed strategies to efficiently manage capital within the Assured Guaranty group.
From 2013 through February 27, 2025, the Company has repurchased 151 million common shares for approximately $5.4 billion, representing approximately 78% of the total shares outstanding at the beginning of the repurchase program in 2013. On May 2, 2024 and November 8, 2024, the AGL Board of Directors (the Board) authorized the repurchase of an additional $300 million and $250 million, respectively, of the Company’s common shares. Under this and previous authorizations, as of February 27, 2025, the remaining amount the Company was authorized to purchase was approximately $276 million of its common shares. Shares may be repurchased from time to time in the open market or in privately negotiated transactions. The timing, form and amount of the share repurchases under the program are at the discretion of management and will depend on a variety of factors, including funds available at the parent company, other potential uses for such funds, market conditions, the Company’s capital position, legal requirements and other factors. The repurchase program may be modified, extended or terminated by the Board at any time and it does not have an expiration date. See Item 8, Financial Statements and Supplementary Data, Note 18, Shareholders’ Equity, for additional information about the Company’s repurchases of its common shares.
Summary of Share Repurchases
| | | | | | | | | | | | | | | | | |
| Amount (1) | | Number of Shares | | Average price per share (1) |
| (in millions, except per share data) |
| 2013-2023 | $ | 4,860 | | | 144.09 | | | $ | 33.73 | |
| 2024 | 502 | | | 6.18 | | | 81.28 | |
| 2025 (through February 27, 2025) | 76 | | | 0.83 | | | 91.53 | |
| Cumulative repurchases since the beginning of 2013 | $ | 5,438 | | | 151.10 | | | 35.99 | |
____________________
(1) Excludes commissions and excise taxes.
As of December 31, 2024, the estimated accretive effect of the cumulative repurchases of common shares since the beginning of 2013 was approximately: $54.83 per share in shareholders’ equity attributable to AGL, $59.27 per share in adjusted operating shareholders’ equity, and $100.61 per share in adjusted book value.
In May 2024, the NYDFS approved, and AGM implemented, the redemption of approximately $100 million of AGM’s shares of common stock from AGMH. In connection with the merger of AGM into AG, the MIA approved, and in the third quarter of 2024 AG implemented, the redemption of approximately $300 million of AG’s shares of common stock from AGMH in exchange for cash of $167 million and the remainder in alternative investments.
The Company considers the appropriate mix of debt and equity in its capital structure. The Company may in the future choose to issue new debt or redeem or purchase its existing debt. See “— Liquidity and Capital Resources — AGL and its U.S. Holding Companies.”
Executive Summary
The primary drivers of volatility in the Company’s net income include: loss and loss adjustment expense (LAE), changes in fair value of credit derivatives, FG VIEs, CIVs, trading securities and CCS, as well as foreign exchange gains (losses), the level of refundings of insured obligations, changes in the value of the Company’s alternative investments, the effects of any large transactions, settlements, commutations and loss mitigation strategies, among other factors. Changes in laws and regulations, among other factors, may also have a significant effect on reported net income or loss in a given reporting period.
Financial Performance of Assured Guaranty
Financial Results
| | | | | | | | | | | | | | | | | |
| | Year Ended December 31, |
| | 2024 | | 2023 | | 2022 |
| | (in millions, except per share amounts) |
| GAAP | | | | | |
| Net income (loss) attributable to AGL | $ | 376 | | | $ | 739 | | | $ | 124 | |
| Net income (loss) attributable to AGL per diluted share | $ | 6.87 | | | $ | 12.30 | | | $ | 1.92 | |
| Weighted average diluted shares | 54.3 | | | 59.6 | | | 63.9 | |
| | | | | |
| Non-GAAP | | | | | |
| Adjusted operating income (loss) (1) | $ | 389 | | | $ | 648 | | | $ | 267 | |
| Adjusted operating income per diluted share | $ | 7.10 | | | $ | 10.78 | | | $ | 4.14 | |
| Weighted average diluted shares | 54.3 | | | 59.6 | | | 63.9 | |
| | | | | |
| Components of total adjusted operating income (loss) | | | | | |
| Insurance segment | $ | 525 | | | $ | 621 | | | $ | 413 | |
| Asset Management segment | 5 | | | 3 | | | (6) | |
| Corporate division (2) | (135) | | | 45 | | | (134) | |
| Other (3) | (6) | | | (21) | | | (6) | |
| Adjusted operating income (loss) | $ | 389 | | | $ | 648 | | | $ | 267 | |
| | | | | |
| Insurance Segment | | | | | |
| Gross written premiums (GWP) | $ | 440 | | | $ | 357 | | | $ | 360 | |
| Present value of new business production (PVP) (1) | 402 | | | 404 | | | 375 | |
| Gross par written | 31,829 | | | 28,960 | | | 22,047 | |
| | | | | | | | | | | | | | | | | | | | | | | | | | |
| | As of December 31, 2024 | | As of December 31, 2023 |
| | Amount | | Per Share | | Amount | | Per Share |
| | (in millions, except per share amounts) |
| Shareholders’ equity attributable to AGL | | $ | 5,495 | | | $ | 108.80 | | | $ | 5,713 | | | $ | 101.63 | |
| Adjusted operating shareholders’ equity (1) | | 5,795 | | | 114.75 | | | 5,990 | | | 106.54 | |
| Adjusted book value (1) | | 8,592 | | | 170.12 | | | 8,765 | | | 155.92 | |
| Common shares outstanding (4) | | 50.5 | | | | | 56.2 | | | |
____________________
(1) See “— Non-GAAP Financial Measures” for a definition of the financial measures that were not determined in accordance with accounting principles generally accepted in the United States of America (GAAP), a reconciliation of the non-GAAP financial measure to the most directly comparable GAAP measure, if available, and for additional details.
(2) In 2023, the Corporate division results include the gain on the Sound Point Transaction and AHP Transaction.
(3) Relates to the effect of consolidating FG VIEs and CIVs.
(4) See “— Overview— Key Business Strategies – Capital Management” above for information on common share repurchases.
Consolidated Results of Operations
Consolidated Results of Operations
| | | | | | | | | | | | | | | | | |
| | Year Ended December 31, |
| | 2024 | | 2023 | | 2022 |
| | (in millions) |
| Revenues: | | | | | |
| Net earned premiums | $ | 403 | | | $ | 344 | | | $ | 494 | |
| Net investment income | 340 | | | 365 | | | 269 | |
| Asset management fees | — | | | 53 | | | 93 | |
| Net realized investment gains (losses) | 9 | | | (14) | | | (56) | |
| Fair value gains (losses) on credit derivatives | 24 | | | 114 | | | (11) | |
| Fair value gains (losses) on CCS | (10) | | | (35) | | | 24 | |
| Fair value gains (losses) on FG VIEs | (11) | | | 8 | | | 22 | |
| Fair value gains (losses) on CIVs | 69 | | | 88 | | | 17 | |
| Foreign exchange gains (losses) on remeasurement | (27) | | | 53 | | | (112) | |
| Fair value gains (losses) on trading securities | 52 | | | 74 | | | (34) | |
| Gain on sale of asset management subsidiaries | — | | | 262 | | | — | |
| Other income (loss) | 23 | | | 61 | | | 17 | |
| Total revenues | 872 | | | 1,373 | | | 723 | |
| Expenses: | | | | | |
| Loss and LAE (benefit) | (26) | | | 162 | | | 16 | |
| Interest expense | 91 | | | 90 | | | 81 | |
| Amortization of deferred acquisition cost (DAC) | 20 | | | 13 | | | 14 | |
| Employee compensation, benefit and other operating expenses: | | | | | |
| Asset management subsidiaries | 6 | | | 91 | | | 140 | |
| Insurance and other subsidiaries | 355 | | | 377 | | | 285 | |
| Total expenses | 446 | | | 733 | | | 536 | |
| Income (loss) before income taxes and equity in earnings (losses) of investees | 426 | | | 640 | | | 187 | |
| Equity in earnings (losses) of investees | 62 | | | 28 | | | (39) | |
| Income (loss) before income taxes | 488 | | | 668 | | | 148 | |
| Less: Provision (benefit) for income taxes | 96 | | | (93) | | | 11 | |
| Net income (loss) | 392 | | | 761 | | | 137 | |
| Less: Noncontrolling interests | 16 | | | 22 | | | 13 | |
| Net income (loss) attributable to Assured Guaranty Ltd. | $ | 376 | | | $ | 739 | | | $ | 124 | |
| | | | | |
| Effective tax rate | 19.7 | % | | (13.9) | % | | 7.2 | % |
Net income attributable to AGL in 2024 was lower compared with 2023 primarily due to the following:
•the gain associated with the Sound Point Transaction and AHP Transaction, net of transaction expenses, of $175 million (after-tax) in 2023,
•the benefit related to Bermuda tax law changes of $189 million in 2023,
•lower fair value gains on credit derivatives of $24 million in 2024 compared with $114 million in 2023,
•foreign exchange remeasurement losses of $27 million in 2024, compared with gains of $53 million in 2023, and
•lower other income due to the reversal of a previously recorded litigation accrual of $20 million in 2023.
These decreases were partially offset by:
•lower loss and LAE, which was a benefit of $26 million in 2024 compared with a loss of $162 million in 2023,
•a large refunded transaction which was the primary driver of the increase in net earned premiums to $403 million in 2024 from $344 million in 2023, and
•higher equity earnings from the alternative investment portfolio, which was $62 million in 2024 compared with $28 million in 2023.
The Company’s effective tax rate reflects the proportion of income recognized by each of the Company’s operating subsidiaries, with U.S. subsidiaries generally taxed at the U.S. marginal corporate income tax rate of 21%, U.K. subsidiaries taxed at the U.K. marginal corporate tax rate of 25% for periods starting April 1, 2023, and 19% for periods ending on or before March 31, 2023, and the French subsidiary taxed at the French marginal corporate tax rate of 25%, and Assured Guaranty Re Ltd. (AG Re) and Cedar Personnel Ltd. taxed at the Bermuda marginal corporate tax rate of 0%. Effective January 1, 2024, the U.K. adopted a global minimum tax rate of 15% under the Organization for Economic Co-Operation and Development’s Base Erosion and Profit Shifting Pillar Two rules. See Part I, Item 1, Business - Regulation, and Part II, Item 8, Financial Statements and Supplementary Data, Note 13, Income Taxes.
Adjusted Operating Income
Adjusted operating income in 2024 was $389 million, compared with $648 million in 2023. The decrease was primarily due to the gain associated with the Sound Point Transaction and AHP Transaction and the benefit attributable to Bermuda tax law changes in 2023, offset in part by a benefit in loss expense in 2024 compared with a loss expense in 2023 and higher net earned premiums in 2024. See “— Results of Operations — Reconciliation to GAAP” for the reconciliation of net income (loss) attributable to AGL to adjusted operating income (loss).
Book Value and Adjusted Book Value
Shareholders’ equity attributable to AGL as of December 31, 2024 decreased compared with December 31, 2023, due to share repurchases of $508 million and dividends of $68 million, offset in part by net income. Adjusted operating shareholders’ equity and adjusted book value also decreased primarily due to share repurchases and dividends, partially offset by adjusted operating income of $389 million, and in the case of adjusted book value, the increase was also due to GWP of $440 million. See “— Non-GAAP Financial Measures” below for the reconciliation of shareholders’ equity attributable to AGL to adjusted operating shareholders' equity and adjusted book value.
On a per share basis, shareholders’ equity attributable to AGL, adjusted operating shareholders’ equity and adjusted book value increased as of December 31, 2024 compared with December 31, 2023, due in part to the accretive effect of the share repurchase program. See “— Non-GAAP Financial Measures” for the reconciliation of shareholders’ equity attributable to AGL to adjusted operating shareholders' equity and adjusted book value.
Other Matters
Inflation
By some key measures, consumer price inflation in the U.S. and the U.K. was higher in recent years than it has been in decades. In addition, government policies such as increased deficit spending or the imposition of tariffs on imported goods could increase inflationary pressures in the future. Consumer price inflation in the U.K. can impact the Company directly by increasing exposure for certain index-linked U.K. debt with par that accretes based on inflation, and also by increasing projected future installment premiums on the portion of such exposure that pays at least some of the premium on an installment basis over the term of the exposure. Consumer price inflation may also impact the Company indirectly to the extent it makes it more difficult for obligors to make their debt payments. See “— Overview — Economic Environment.”
Russia’s Invasion of Ukraine
Russia’s invasion of Ukraine has led to the imposition of economic sanctions by many western countries against Russia and certain Russian individuals, dislocation in global energy markets, massive refugee movements, and payment default by certain Russian credits. The economic sanctions imposed by western governments, along with decisions by private companies regarding their presence in Russia, continue to reduce western economic ties to Russia and to reshape global economic and political ties more generally, and the Company cannot predict all of the potential effects of the conflict on the world or on the Company.
The Company’s surveillance and treasury functions have reviewed the Company’s insurance and investment portfolios, respectively, and have identified no material direct exposure to Ukraine or Russia. In fact, the Company’s direct
insurance exposure to eastern Europe generally is limited to approximately $214 million in net par outstanding as of December 31, 2024, comprised of $198 million net par exposure to the sovereign debt of Poland and $16 million net par exposure to a toll road in Hungary. The Company rates all such exposure investment grade.
Middle East Conflict
In light of events in the Middle East, the Company’s surveillance and treasury functions have reviewed the Company’s insurance and investment portfolios, respectively, for exposures to the Middle East. After review, the Company’s surveillance and treasury functions have identified no material direct exposure to such area. The Company’s direct insurance exposure to the Middle East is generally limited to approximately $110 million in net par outstanding as of December 31, 2024, comprised of funded commitments to subscription finance facilities; however, such exposure may increase to a total of approximately $165 million to the extent all unfunded commitments under the facilities are ultimately funded. The Company rates all such insurance exposure investment grade.
January 2025 Los Angeles Wildfires
In January 2025, a series of destructive wildfires affected Los Angeles, California. The Company’s surveillance function has reviewed the Company’s insurance portfolio for exposures located within Los Angeles County and has identified no material impact to its exposure located directly within the perimeter of the wildfires.
Results of Operations
Critical Accounting Estimates
The preparation of financial statements in accordance with GAAP requires the application of accounting policies that often involve a significant degree of judgment and require the Company to make estimates and assumptions, based on available information, that affect the amounts of assets, liabilities, revenues and expenses reported in the consolidated financial statements. Estimates are inherently subject to change and actual results could differ from those estimates, and the differences may be material to the consolidated financial statements.
Critical estimates and assumptions are periodically evaluated based on historical developments, market conditions, industry trends and other information that is reasonable under the circumstances. There can be no assurance that actual results will conform to estimates and assumptions and that reported results of operations will not be materially different in the future due to changes in these estimates and assumptions.
Listed below are the accounting policies and estimates that the Company believes are most dependent on the application of judgment and assumptions. See Item 8, Financial Statements and Supplementary Data, Note 1, Business and Basis of Presentation, for the Company’s significant accounting policies which includes a reference to the applicable note where further details regarding the significant estimates and assumptions are provided. In addition, see Item 7A, Quantitative and Qualitative Disclosures About Market Risk, for further details regarding the sensitivity analyses.
•Expected loss to be paid (recovered);
•Fair value of certain assets and liabilities, primarily:
◦Investments (primarily Loss Mitigation Securities and alternative investments)
◦Assets and liabilities of FG VIEs
◦Credit derivatives;
•Acquisition date fair value of the equity method ownership interest in Sound Point;
•Impairments of equity method investments and financial instruments; and
•Income tax assets and liabilities, including the recoverability of all deferred tax assets (liabilities) and in particular the Bermuda deferred tax asset recorded in 2023.
Results of Operations by Segment
The Company analyzes the operating performance of each segment using each segment’s adjusted operating income as described in Item 8, Financial Statements and Supplementary Data, Note 2, Segment Information.
Insurance Segment Results
Insurance Segment Results
| | | | | | | | | | | | | | | | | |
| | Year Ended December 31, |
| | 2024 | | 2023 | | 2022 |
| | (in millions) |
| Segment revenues | | | | | |
| Net earned premiums and credit derivative revenues | $ | 417 | | | $ | 357 | | | $ | 508 | |
| Net investment income | 339 | | | 370 | | | 278 | |
| Fair value gains (losses) on trading securities | 52 | | | 74 | | | (34) | |
| Foreign exchange gains (losses) on remeasurement | (1) | | | 3 | | | (5) | |
| Other income (loss) | 14 | | | 51 | | | 10 | |
| Total segment revenues | 821 | | | 855 | | | 757 | |
| Segment expenses | | | | | |
| Loss expense (benefit) | (18) | | | 161 | | | 12 | |
| Interest expense | — | | | — | | | 1 | |
| Amortization of DAC | 20 | | | 13 | | | 14 | |
| Employee compensation and benefit expenses | 170 | | | 154 | | | 148 | |
| Other operating expenses | 117 | | | 107 | | | 84 | |
| Total segment expenses | 289 | | | 435 | | | 259 | |
| Equity in earnings (losses) of investees | 102 | | | 82 | | | (51) | |
| Segment adjusted operating income (loss) before income taxes | 634 | | | 502 | | | 447 | |
| Less: Provision (benefit) for income taxes | 109 | | | (119) | | | 34 | |
| Segment adjusted operating income (loss) | $ | 525 | | | $ | 621 | | | $ | 413 | |
Net Earned Premiums and Credit Derivative Revenues
Premiums are earned over the contractual lives, or in the case of insured obligations backed by homogeneous pools of assets, the remaining expected lives, of financial guaranty insurance contracts. The Company periodically estimates remaining expected lives of its insured obligations backed by homogeneous pools of assets and makes prospective adjustments for such changes in expected lives. Scheduled net earned premiums decrease each year unless replaced by a higher amount of new business, or books of business acquired in business combinations. See Item 8, Financial Statements and Supplementary Data, Note 5, Contracts Accounted for as Insurance, Premiums, for additional information.
Net earned premiums due to accelerations are attributable to changes in the expected lives of insured obligations driven by: (i) refundings of insured obligations; or (ii) terminations of insured obligations either through negotiated agreements or the exercise of the Company’s contractual rights to make claim payments on an accelerated basis.
Refundings occur in the public finance market when municipalities and other public finance issuers pay down insured obligations prior to their originally scheduled maturities. Refundings tend to increase when issuers can refinance their debt obligations at lower rates than they are currently paying. The premiums associated with the insured obligations of municipalities and other public finance issuers are generally received upfront when the obligations are issued and insured. When issuers pay down insured obligations, the Company is no longer on risk for payment defaults, and therefore accelerates the recognition of the remaining nonrefundable deferred premium revenue. The amortization of the Company’s outstanding book of business along with the previously high levels of refunding activity and the higher interest rate environment has led to a lower volume of refunding opportunities over the last several years.
Terminations are generally negotiated agreements with beneficiaries resulting in the extinguishment of the Company’s insurance obligation. Terminations have been more common in the structured finance asset class, but may also occur in the public finance asset class. While each termination may have different terms, they all result in the expiration of the Company’s insurance risk, the acceleration of the recognition of the associated deferred premium revenue and the reduction of any remaining premiums receivable.
Insurance Segment
Net Earned Premiums and Credit Derivative Revenues | | | | | | | | | | | | | | | | | |
| | Year Ended December 31, |
| | 2024 | | 2023 | | 2022 |
| | (in millions) |
| Net earned premiums: | | | | | |
| Financial guaranty insurance: | | | | | |
| Public finance | | | | | |
| Scheduled net earned premiums (1) | $ | 264 | | | $ | 252 | | | $ | 256 | |
| Refundings and terminations | 69 | | | 29 | | | 179 | |
| Total public finance | 333 | | | 281 | | | 435 | |
| Structured finance | | | | | |
| Scheduled net earned premiums (1) | 63 | | | 62 | | | 58 | |
| Accelerations | 2 | | | — | | | — | |
| Total structured finance | 65 | | | 62 | | | 58 | |
| Specialty insurance and reinsurance | 8 | | | 4 | | | 4 | |
| Total net earned premiums | 406 | | | 347 | | | 497 | |
| | | | | |
| Credit derivative revenues | 11 | | | 10 | | | 11 | |
| Total net earned premiums and credit derivative revenues | $ | 417 | | | $ | 357 | | | $ | 508 | |
____________________
(1) Includes accretion of discount.
Net earned premiums and credit derivative revenues increased in 2024 compared with 2023 primarily due to a large refunded transaction in the first quarter of 2024. As of December 31, 2024, $3.7 billion of net deferred premium revenue on financial guaranty insurance remained to be earned over the life of the insurance contracts.
New Business Production
Gross Written Premiums and New Business Production
| | | | | | | | | | | | | | | | | |
| | Year Ended December 31, |
| | 2024 | | 2023 | | 2022 |
| | (in millions) |
| GWP | | | | | |
| Public finance—U.S. | $ | 259 | | | $ | 211 | | | $ | 248 | |
| Public finance—non-U.S. | 136 | | | 82 | | | 75 | |
| Structured finance—U.S. | 20 | | | 59 | | | 37 | |
| Structured finance—non-U.S. | 25 | | | 5 | | | — | |
| Total GWP | $ | 440 | | | $ | 357 | | | $ | 360 | |
| | | | | |
| PVP (1): | | | | | |
| Public finance—U.S. | $ | 270 | | | $ | 212 | | | $ | 257 | |
| Public finance—non-U.S. | 67 | | | 83 | | | 68 | |
| Structured finance—U.S. | 25 | | | 68 | | | 43 | |
| Structured finance—non-U.S. | 40 | | | 41 | | | 7 | |
| Total PVP | $ | 402 | | | $ | 404 | | | $ | 375 | |
| | | | | |
| Gross Par Written (1): | | | | | |
| Public finance—U.S. | $ | 23,758 | | | $ | 22,464 | | | $ | 19,801 | |
| Public finance—non-U.S. | 2,673 | | | 1,544 | | | 624 | |
| Structured finance—U.S. | 1,476 | | | 1,886 | | | 1,077 | |
| Structured finance—non-U.S. | 3,922 | | | 3,066 | | | 545 | |
| Total gross par written | $ | 31,829 | | | $ | 28,960 | | | $ | 22,047 | |
____________________
(1) PVP and Gross Par Written in the table above are based on “close date,” when the transaction settles. See “— Non-GAAP Financial Measures — PVP or Present Value of New Business Production.” PVP was discounted at 5.0%, 4.0% and 2.5% in 2024, 2023 and 2022, respectively.
GWP relates to insurance and reinsurance contracts for both financial guaranty and specialty business. Financial guaranty insurance and reinsurance GWP includes: (i) amounts collected upfront on new business written; (ii) the present value of future contractual or expected premiums on new financial guaranty business written (discounted at risk-free rates); and (iii) the effects of changes in the estimated premium or lives of certain transactions in the in-force book of business. Specialty business GWP is recorded as premiums are due. Credit derivatives are accounted for at fair value and therefore not included in GWP. PVP and gross par written include the present value of future gross revenues and exposure, respectively, associated with a financial guaranty written by the Company that, under GAAP, is accounted for under Accounting Standards Codification (ASC) 460, Guarantees.
The non-GAAP financial measure, PVP, includes upfront premiums and the present value of expected future installments on new business at the time of issuance, discounted at the approximate average pre-tax book yield of fixed-maturity securities purchased during the prior calendar year, for all contracts regardless of form or accounting model. See “— Non-GAAP Financial Measures” below.
U.S. public finance GWP and PVP in 2024 were higher than GWP and PVP in 2023 primarily due to a large transportation revenue transaction. The Company’s direct par written represented 58% of the total U.S. primary municipal market insured par sold in 2024, compared with 61% in 2023, and the Company’s penetration of all municipal issuance was 4.8% in 2024 compared with 5.4% in 2023.
Non-U.S. public finance GWP increased while PVP decreased in 2024 compared with 2023. GWP in 2024 includes the present value of additional future premiums on a large existing transaction, which is not captured in PVP. New business in 2024 primarily included secondary market guaranties of several U.K. regulated utility and airport transactions, as well as new and renewed liquidity guarantees in the infrastructure sector.
In 2024, structured finance GWP and PVP decreased compared with 2023. Structured finance GWP and PVP in 2024 were primarily attributable to insurance securitizations, bank balance sheet relief transactions, a guaranty of a diversified real estate portfolio and subscription finance transactions.
Business activity in the non-U.S. public finance and structured finance markets often has long lead times and therefore may vary from period to period.
Financial Strength Ratings
Demand for the financial guaranties issued by the Company’s insurance subsidiaries may be impacted by changes in the credit ratings assigned to them by the rating agencies. The financial strength ratings (or similar ratings) assigned to AGL’s insurance subsidiaries, along with the date of the most recent rating action (or confirmation) by the rating agency assigning the rating, are shown in the table below.
| | | | | | | | | | | | | | | | | | | | | | | |
| | S&P | | KBRA | | Moody’s | | A.M. Best Company,
Inc. |
| AG | AA (stable) (5/28/24) | | AA+ (stable) (10/18/24) | | A1 (stable) (7/10/24) | | — |
| AG Re | AA (stable) (5/28/24) | | — | | — | | — |
| AGRO | AA (stable) (5/28/24) | | — | | — | | A+ (stable) (7/19/24) |
| AGUK | AA (stable) (5/28/24) | | AA+ (stable) (10/18/24) | | A1 (stable) (7/10/24) | | — |
| AGE | AA (stable) (5/28/24) | | AA+ (stable) (10/18/24) | | — | | — |
Ratings are subject to continuous rating agency review and revision or withdrawal at any time. In addition, the Company periodically assesses the value of each rating assigned to each of its companies, and as a result of such assessment may request that a rating agency add or drop a rating from certain of its companies. There can be no assurance that any of the rating agencies will not take negative action on the financial strength ratings (or similar ratings) of AGL’s insurance subsidiaries in the future or cease to rate one or more of AGL’s insurance subsidiaries, either voluntarily or at the request of that subsidiary.
For a discussion of the effects of rating actions on the Company beyond potential effects on the demand for its insurance products, see “Item 1A. Risk Factors —A downgrade of the financial strength or financial enhancement ratings of any of the Company’s insurance or reinsurance subsidiaries may adversely affect its business prospects.”
Income from Investments
Net investment income is a function of the yield that the Company earns on available-for-sale fixed-maturity securities and short-term investments and the size of such portfolio. The investment yield on fixed-maturity securities is a function of market interest rates at the time of investment as well as the type, credit quality and maturity of the securities in this portfolio.
CVIs issued by Puerto Rico and received as part of the 2022 Puerto Rico Resolutions are classified as trading with changes in fair value reported in “fair value gains (losses) on trading securities” in the consolidated statements of operations. The fair value of remaining CVIs as of December 31, 2024 and December 31, 2023 was $123 million and $318 million, respectively.
Equity method investments in the Insurance segment include investments that AG Asset Strategies LLC (AGAS) makes in certain alternative investments, primarily Sound Point and AHP funds. The income (loss) on such investments is reported in “equity in earnings (losses) of investees” and typically represents the Company’s share of earnings of its investees. As part of the August 5, 2024 AG stock redemption, certain alternative investments were distributed to AGMH, whose results are reported in the Corporate division. The carrying value of these transferred investments as of December 31, 2024 was $118 million.
Insurance Segment
Income from Investments
| | | | | | | | | | | | | | | | | |
| | Year Ended December 31, |
| | 2024 | | 2023 | | 2022 |
| | (in millions) |
| Net investment income | | | | | |
| Fixed-maturity securities, available-for-sale | $ | 263 | | | $ | 297 | | | $ | 260 | |
| Short-term investments | 70 | | | 65 | | | 13 | |
| Intercompany loans | 10 | | | 10 | | | 10 | |
| Other invested assets | 1 | | | 3 | | | 1 | |
| Investment income | 344 | | | 375 | | | 284 | |
| Investment expenses | (5) | | | (5) | | | (6) | |
| Net investment income | $ | 339 | | | $ | 370 | | | $ | 278 | |
| | | | | |
| Fair value gains (losses) on trading securities | $ | 52 | | | $ | 74 | | | $ | (34) | |
| | | | | |
| Equity in earnings (losses) of investees | | | | | |
| CLOs | $ | 47 | | | $ | 50 | | | $ | (2) | |
| Private healthcare investing | 11 | | | 19 | | | (11) | |
| Asset-based/specialty finance | 24 | | | 5 | | | 5 | |
| Middle market direct lending | 2 | | | — | | | — | |
| Other | 18 | | | 8 | | | (43) | |
| Equity in earnings (losses) of investees | $ | 102 | | | $ | 82 | | | $ | (51) | |
Net investment income for 2024 decreased compared to 2023, primarily due to the lower income on Loss Mitigation Securities and lower average asset balances due in part to sale of new general obligation bonds and new bonds backed by toll revenues (together, New Recovery Bonds) received as part of the 2022 Puerto Rico Resolutions, partially offset by higher income related to the distribution of assets to alternative investments from CIVs. The overall pre-tax book yield of available-for-sale fixed-maturity securities and short-term investments was 4.57% as of December 31, 2024 and 4.09% as of December 31, 2023.
Equity in earnings (losses) of investees for 2024 increased compared to 2023, primarily due to higher balances in the alternative investment portfolio and higher fair value gains on alternative investments.
The Company has a consolidated CLO fund, that has been reported on a one-quarter lag with changes in net asset value (NAV) reported in “equity in earnings (losses) of investees”. In the fourth quarter of 2024, the Company transferred the underlying investments to its fixed-maturity securities, available-for-sale portfolio. Beginning in the fourth quarter of 2024, interest income from the transferred CLOs are reported in net investment income with changes in fair value reported in other comprehensive income.
Other Income (Loss)
The decrease in “other income (loss)” in 2024 compared with 2023 was primarily attributable to the reversal of a previously recorded litigation accrual of $20 million and commutation gains of $10 million in 2023. See Item 8, Financial Statements and Supplementary Data, Note 17, Contingencies, for additional information.
Economic Loss Development (Benefit)
The insured portfolio includes policies accounted for under several different accounting models depending on the characteristics of the contract and the Company’s control rights. For a discussion of methodologies and significant estimates for expected loss to be paid (recovered), see Item 8, Financial Statements and Supplementary Data, Note 4, Expected Loss to be Paid (Recovered). For the GAAP accounting policies for measurement and recognition for each type of contract, see the notes listed below in Item 8, Financial Statements and Supplementary Data.
•Note 5 for contracts accounted for as insurance;
•Note 6 for contracts accounted for as credit derivatives;
•Note 8 for FG VIEs; and
•Note 9 for fair value methodologies for credit derivatives and FG VIEs’ assets and liabilities.
In order to efficiently evaluate and manage the economics of the entire insured portfolio, management compiles and analyzes expected loss information for all policies on a consistent basis. The discussion of losses that follows encompasses expected losses on all contracts in the insured portfolio regardless of accounting model, unless otherwise specified. Net expected loss to be paid (recovered) is equal to the present value of expected future cash outflows for loss and LAE payments, net of: (i) inflows for expected salvage, subrogation and other recoveries; (ii) excess spread on underlying collateral, as applicable; and (iii) amounts ceded to reinsurers. Assumptions used in the determination of the net expected loss to be paid (recovered) such as delinquency, severity, discount rates and expected time frames to recovery are consistent for each sector regardless of the accounting model used.
Current risk-free rates are used to discount expected losses at the end of each reporting period. Therefore, changes in such rates from period to period affect economic loss development and loss and LAE. However, the effect of changes in discount rates is not indicative of actual credit impairment or improvement. The weighted average discount rates used to discount expected losses (recoveries) were 4.38%, 4.09% and 4.08% as of December 31, 2024, 2023 and 2022, respectively.
The composition of economic loss development (benefit) by accounting model and by sector is presented in the tables that follow, and the drivers of economic loss development (benefit) are discussed below.
Net Expected Loss to be Paid (Recovered) and Net Economic Loss Development (Benefit)
by Accounting Model
| | | | | | | | | | | | | | | | | | | | | | | | | | | | | | | | |
| | Net Expected Loss to be Paid (Recovered) | | Net Economic Loss Development (Benefit) |
| | As of December 31, | | Year Ended December 31, |
| Accounting Model | | 2024 | | 2023 | | 2024 | | 2023 | | 2022 |
| | | (in millions) |
| Insurance | | $ | 90 | | | $ | 263 | | | $ | (1) | | | $ | 174 | | | $ | (112) | |
| FG VIEs (1) | | 16 | | | 240 | | | (1) | | | (11) | | | (17) | |
| Credit derivatives | | — | | | 2 | | | (1) | | | 1 | | | 4 | |
| Total | | $ | 106 | | | $ | 505 | | | $ | (3) | | | $ | 164 | | | $ | (125) | |
| | | | | | | | | | |
| Net exposure rated BIG (2) | | $ | 10,187 | | | $ | 5,521 | | | | | | | |
____________________
(1) In 2023, the net expected loss to be paid for FG VIEs primarily related to trusts established as part of the 2022 Puerto Rico Resolutions (Puerto Rico Trusts) and in 2024, the Company satisfied its remaining direct insured obligations and deconsolidated the remaining Puerto Rico Trusts. See Item 8, Financial Statements and Supplementary Data, Note 4, Expected Loss to be Paid (Recovered).
(2) The increase in BIG is primarily related to downgrades of certain U.K. regulated utility exposures.
Net Expected Loss to be Paid (Recovered)
Roll Forward by Sector
| | | | | | | | | | | | | | | | | | | | | | | | | | |
| | Year Ended December 31, 2024 |
| Sector | | Net Expected Loss to be Paid (Recovered) as of December 31, 2023 | | Net Economic Loss
Development (Benefit) | | Net
(Paid)
Recovered
Losses (1) | | Net Expected Loss to be Paid (Recovered) as of December 31, 2024 |
| | | (in millions) |
| Public finance: | | | | | | | | |
| U.S. public finance | | $ | 398 | | | $ | (9) | | | $ | (371) | | | $ | 18 | |
| Non-U.S. public finance | | 20 | | | 81 | | | (3) | | | 98 | |
| Public finance | | 418 | | | 72 | | | (374) | | | 116 | |
| Structured finance: | | | | | | | | |
| U.S. RMBS | | 43 | | | (75) | | | (11) | | | (43) | |
| Other structured finance | | 44 | | | — | | | (11) | | | 33 | |
| Structured finance | | 87 | | | (75) | | | (22) | | | (10) | |
| Total | | $ | 505 | | | $ | (3) | | | $ | (396) | | | $ | 106 | |
| | | | | | | | | | | | | | | | | | | | | | | | | | |
| | Year Ended December 31, 2023 |
| Sector | | Net Expected Loss to be Paid (Recovered) as of December 31, 2022 | | Net Economic Loss
Development (Benefit) | | Net
(Paid)
Recovered
Losses (1) | | Net Expected Loss to be Paid (Recovered) as of December 31, 2023 |
| | | (in millions) |
| Public finance: | | | | | | | | |
| U.S. public finance | | $ | 403 | | | $ | 201 | | | $ | (206) | | | $ | 398 | |
| Non-U.S. public finance | | 9 | | | 11 | | | — | | | 20 | |
| Public finance | | 412 | | | 212 | | | (206) | | | 418 | |
| Structured finance: | | | | | | | | |
| U.S. RMBS | | 66 | | | (56) | | | 33 | | | 43 | |
| Other structured finance | | 44 | | | 8 | | | (8) | | | 44 | |
| Structured finance | | 110 | | | (48) | | | 25 | | | 87 | |
| Total | | $ | 522 | | | $ | 164 | | | $ | (181) | | | $ | 505 | |
____________________
(1) Net of ceded paid losses, whether or not such amounts have been settled with reinsurers. Ceded paid losses are typically settled 45 days after the end of the reporting period. Such amounts are recorded as reinsurance recoverable on paid losses in “other assets.”
Effect of changes in the risk-free rates included in economic loss development (benefit) was a loss of $4 million in 2024 and a loss of $3 million in 2023.
2024 Net Economic Loss Development
Public Finance: The economic benefit of $9 million for U.S. public finance exposures was primarily attributable to certain healthcare exposures, partially offset by higher expected loss adjustment expenses related to certain Puerto Rico exposures. The economic loss development of $81 million for non-U.S. public finance exposures was primarily attributable to certain U.K. regulated utilities and healthcare exposures.
U.S. RMBS: The net benefit attributable to U.S. RMBS of $75 million was mainly attributable to a $43 million benefit from higher assumed and realized recoveries for secured second lien charged-off loans and a $15 million benefit from higher assumed recoveries for first lien deferred principal balances.
See Item 8, Financial Statements and Supplementary Data, Note 4, Expected Loss to be Paid (Recovered), for additional information.
2023 Net Economic Loss Development
Public Finance: The economic loss development on U.S. exposures in 2023 was $201 million, which was primarily attributable to PREPA and healthcare exposures, partially offset by higher projected recoveries in other municipal exposures.
U.S. RMBS: The benefit attributable to U.S. RMBS of $56 million was primarily attributable to a $53 million benefit related to higher recoveries for secured second lien charged-off loans and a $13 million benefit related to improved performance in certain transactions, partially offset by $17 million of loss development related to the return of certain previously received funds.
Insurance Segment Loss Expense
The primary differences between net economic loss development and the amount reported as “loss and LAE (benefit)” in the consolidated statements of operations are that loss and LAE (benefit): (i) considers deferred premium revenue in the calculation of loss reserves for financial guaranty insurance contracts; (ii) eliminates loss and LAE related to FG VIEs; and (iii) does not include estimated losses on credit derivatives.
Insurance segment loss expense includes loss and LAE on financial guaranty insurance contracts and losses on credit derivatives without giving effect to eliminations related to the consolidation of FG VIEs.
For financial guaranty insurance contracts, each transaction’s expected loss to be expensed is compared with the deferred premium revenue of that transaction. Expected loss to be expensed represents past or expected future net claim payments that have not yet been expensed. Such amounts will be expensed in future periods as deferred premium revenue amortizes into income on financial guaranty insurance policies. Expected loss to be expensed is the Company’s projection of incurred losses that will be recognized in future periods, excluding accretion of discount. When the expected loss to be expensed exceeds the deferred premium revenue, a loss is recognized in income for the amount of such excess. Therefore, the timing of loss recognition in income does not necessarily coincide with the timing of the actual credit impairment or improvement reported in net economic loss development. Transactions (particularly BIG transactions) acquired in business combinations or seasoned portfolios assumed from legacy financial guaranty insurers generally have the largest deferred premium revenue balances. To the extent that a BIG transaction has a large deferred premium revenue, the difference between economic development and loss and LAE may be significant.
While expected loss to be paid (recovered) is an important measure that provides the present value of amounts that the Company expects to pay or recover in future periods regardless of accounting model, expected loss to be expensed is important because it presents the Company’s projection of net expected losses that will be recognized in the consolidated statement of operations in future periods as deferred premium revenue amortizes into income for financial guaranty insurance policies. For additional information on the expected timing of net expected losses to be expensed see Item 8, Financial Statements and Supplementary Data, Note 5, Contracts Accounted for as Insurance.
The amount of Insurance segment loss expense, which includes losses on policies regardless of form, is a function of the amount of economic loss development discussed above and the deferred premium revenue amortization in a given period, on a contract-by-contract basis. The following table presents the Insurance segment loss expense (benefit).
Insurance Segment
Loss Expense (Benefit)
| | | | | | | | | | | | | | | | | |
| | Year Ended December 31, |
| | 2024 | | 2023 | | 2022 |
| | (in millions) |
| U.S. public finance | $ | 24 | | | $ | 191 | | | $ | 128 | |
| Non-U.S. public finance | 4 | | | — | | | — | |
| Structured finance: | | | | | |
| U.S. RMBS | (50) | | | (36) | | | (120) | |
| Other structured finance | 4 | | | 6 | | | 4 | |
| Structured finance | (46) | | | (30) | | | (116) | |
| Total Insurance segment loss expense (benefit) | $ | (18) | | | $ | 161 | | | $ | 12 | |
Employee Compensation and Benefit Expenses and Other Operating Expenses
The increase in employee compensation and benefit expenses in 2024 from 2023 was primarily attributable to an increase in headcount and other employee benefit costs. Other operating expenses increased in 2024 from 2023 primarily due to the write-off of $6 million of intangible assets attributable to insurance licenses in connection with AGM’s merger with and into AG.
Provision (Benefit) for Income Taxes
The tax provision in 2024 includes $13 million of global minimum tax for the Company’s Bermuda subsidiaries. The tax benefit in 2023 was primarily related to the $189 million benefit recognized in connection with the enactment of the 15% Bermuda corporate income tax in December 2023.
The new Bermuda corporate income tax allows for a deferred tax asset associated with an ETA equal to the difference between the fair market value and the carrying value of assets and liabilities of each of the Company’s Bermuda insurance subsidiaries as of September 30, 2023. The ETA is expected to be utilized over 10 to 15 years, depending on the nature of the deferred tax asset component, beginning in 2025. This was partially offset by income tax expense in the Company’s other operating jurisdictions. The Company expects its Bermuda insurance subsidiaries to incur tax which will be offset by the realization of the deferred tax asset beginning in 2025. See Item 8, Financial Statements and Supplementary Data, Note 13, Income Taxes, for additional information.
Asset Management Segment Results
Asset Management Segment Results
| | | | | | | | | | | | | | | | | |
| | Year Ended December 31, |
| 2024 | | 2023 | | 2022 |
| | (in millions) |
| Segment revenues | $ | 10 | | | $ | 76 | | | $ | 112 | |
| Segment expenses | 6 | | | 78 | | | 119 | |
| Equity in earnings (losses) of investees | 2 | | | 5 | | | — | |
| Segment adjusted operating income (loss) before income taxes | 6 | | | 3 | | | (7) | |
| Less: Provision (benefit) for income taxes | 1 | | | — | | | (1) | |
| Segment adjusted operating income (loss) | $ | 5 | | | $ | 3 | | | $ | (6) | |
Results in the table above primarily represent (i) equity in earnings of Sound Point since the third quarter of 2023 (Sound Point results are reported on a one-quarter lag), net of the amortization of finite-lived intangible assets associated with the basis difference in Sound Point, and incentive fees, and (ii) the consolidated results of AssuredIM for 2022 and the first half of 2023, prior to the Sound Point Transaction and the AHP Transaction. See Item 8, Financial Statements and Supplementary Data, Note 7, Investments and Cash, for additional information.
Corporate Division Results
Corporate Division Results
| | | | | | | | | | | | | | | | | |
| | Year Ended December 31, |
| | 2024 | | 2023 | | 2022 |
| | (in millions) |
| Revenues | | | | | |
| Gain on sale of asset management subsidiaries | $ | — | | | $ | 262 | | | $ | — | |
| Other | 17 | | | 13 | | | 4 | |
| Total revenues | 17 | | | 275 | | | 4 | |
| Expenses | | | | | |
| Interest expense | 101 | | | 99 | | | 89 | |
| Employee compensation and benefit expenses | 32 | | | 38 | | | 30 | |
| Other operating expenses | 36 | | | 79 | | | 24 | |
| Total expenses | 169 | | | 216 | | | 143 | |
| Equity in earnings (losses) of investees | 5 | | | — | | | — | |
| Adjusted operating income (loss) before income taxes | (147) | | | 59 | | | (139) | |
| Less: Provision (benefit) for income taxes | (12) | | | 14 | | | (5) | |
| Adjusted operating income (loss) | $ | (135) | | | $ | 45 | | | $ | (134) | |
The gain on sale of asset management subsidiaries relates to the Sound Point Transaction and AHP Transaction. See Item 8, Financial Statements and Supplementary Data, Note 1, Business and Basis of Presentation.
Corporate division interest expense primarily relates to debt issued by AGUS and AGMH (the U.S. Holding Companies), and also includes intersegment interest expense. See “— Liquidity and Capital Resources — AGL and its U.S. Holding Companies, Intercompany Loans Payable,” for additional information.
Corporate division employee compensation and benefits expenses and other operating expenses are an allocation of expenses based on time studies and represent the costs incurred and time spent on holding company activities, capital management, corporate oversight and governance including Board of Director expenses, legal fees and other direct or allocated expense. The decrease in operating expenses in 2024 was primarily due to expenses related to the Sound Point Transaction and AHP Transaction and a higher charge for value added taxes in 2023. Transaction related expenses in the Corporate division for Sound Point and AHP in 2023 were $40 million, consisting primarily of $25 million advisory and consent fees and $8 million legal fees.
Equity in earnings of investees in 2024 relates to certain alternative investments, which AG transferred to AGMH as part of the share redemption that occurred on August 5, 2024.
The provision for income taxes in 2023 included a $19 million benefit attributable to a change in New York State tax law.
Other (Effect of Consolidating FG VIEs and CIVs)
The effect of consolidating FG VIEs and CIVs, intersegment eliminations and, prior to July 1, 2023, reclassifications of reimbursable fund expenses to revenue, are presented in “other.” See Item 8, Financial Statements and Supplementary Data, Note 2, Segment Information.
As described in Item 8, Financial Statements and Supplementary Data, Note 8, Financial Guaranty Variable Interest Entities and Consolidated Investment Vehicles, the types of entities the Company consolidates when it is deemed to be the primary beneficiary primarily include: (i) FG VIEs; and (ii) CIVs. The Company eliminates the effects of intercompany transactions between its FG VIEs and CIVs and its insurance and asset management subsidiaries, as well as intercompany transactions between CIVs.
Consolidating FG VIEs (as opposed to accounting for the related insurance contracts in the Insurance segment), has a significant gross-up effect on the consolidated financial statements, and includes: (i) the establishment of the FG VIEs’ assets and liabilities and related changes in fair value on the consolidated financial statements; (ii) eliminating the premiums and
losses/recoveries associated with the financial guaranty insurance contracts between the insurance subsidiaries and the FG VIEs; and (iii) eliminating the investment balances associated with the insurance subsidiaries’ purchases of the debt obligations of the FG VIEs.
Consolidating CIVs (as opposed to accounting for them as equity method investments) has a significant effect on assets, liabilities and cash flows, and includes: (i) the establishment of the assets and liabilities of the CIVs, and related changes in fair value; (ii) eliminating the asset management fees earned by AssuredIM from the CIVs (prior to July 1, 2023); (iii) eliminating the equity method investments of the insurance subsidiaries, and related equity in earnings (losses) of investees; and (iv) establishing noncontrolling interest (NCI) for amounts not owned by the Company. The economic effect of AG’s ownership interests in CIVs is presented in the Insurance segment as “equity in earnings (losses) of investees,” while the effect of CIVs is presented as separate line items (“fair value gains (losses) on consolidated investment vehicles” and “noncontrolling interest”) on a consolidated basis.
The table below reflects the effect of consolidating FG VIEs and CIVs on the consolidated statements of operations. The amounts represent: (i) the revenues and expenses of the FG VIEs and the CIVs; and (ii) the consolidation adjustments and eliminations between consolidated FG VIEs or CIVs and the operating and investment subsidiaries.
Effect of Consolidating FG VIEs and CIVs on the Consolidated Statements of Operations
Increase (Decrease)
| | | | | | | | | | | | | | | | | | | | |
| | | Year Ended December 31, |
| | | 2024 | | 2023 | | 2022 |
| Effect on Financial Statement Line Item | | (in millions) |
| Fair value gains (losses) on FG VIEs (1) | | $ | (11) | | | $ | 8 | | | $ | 22 | |
| Fair value gains (losses) on CIVs | | 69 | | | 88 | | | 17 | |
| Equity in earnings (losses) of investees (2) | | (47) | | | (59) | | | 12 | |
| Other (3) | | (3) | | | (41) | | | (44) | |
| Effect on income before tax | | 8 | | | (4) | | | 7 | |
| Less: Tax provision (benefit) | | (2) | | | (5) | | | — | |
| Effect on net income (loss) | | 10 | | | 1 | | | 7 | |
| Less: Effect on noncontrolling interests (4) | | 16 | | | 22 | | | 13 | |
| Effect on net income (loss) attributable to AGL | | $ | (6) | | | $ | (21) | | | $ | (6) | |
| | | | | | |
| By Type of VIE | | | | | | |
| FG VIEs | | $ | (10) | | | $ | (4) | | | $ | 4 | |
| CIVs | | 4 | | | (17) | | | (10) | |
| Effect on net income (loss) attributable to AGL | | $ | (6) | | | $ | (21) | | | $ | (6) | |
____________________
(1) Changes in fair value of the FG VIEs’ assets and liabilities that are attributable to factors other than (i) changes in the Company’s own credit risk on the FG VIEs’ liabilities with recourse and (ii) unrealized gains and losses on available-for-sale fixed maturity securities.
(2) Represents the elimination of the equity in earnings (losses) of investees of AGAS and the other subsidiaries’ investments in certain alternative investments, primarily Sound Point funds (and prior to July 1, 2023, AssuredIM managed funds).
(3) Includes net earned premiums, net investment income, foreign exchange gains (losses) on remeasurement, other income (loss), loss and LAE (benefit), and for 2023 and 2022, other operating expenses and asset management fees.
(4) Represents the proportion of consolidated funds managed by Sound Point and prior to July 1, 2023, AssuredIM funds’ income that is not attributable to AGAS’ or any other subsidiaries’ ownership interest.
Reconciliation to GAAP
Reconciliation of Net Income (Loss) Attributable to AGL
to Adjusted Operating Income (Loss)
| | | | | | | | | | | | | | | | | |
| | Year Ended December 31, |
| | 2024 | | 2023 | | 2022 |
| | (in millions) |
| Net income (loss) attributable to AGL | $ | 376 | | | $ | 739 | | | $ | 124 | |
| Less pre-tax adjustments: | | | | | |
| Realized gains (losses) on investments | 9 | | | (14) | | | (56) | |
| Non-credit impairment-related unrealized fair value gains (losses) on credit derivatives | 14 | | | 106 | | | (18) | |
| Fair value gains (losses) on CCS | (10) | | | (35) | | | 24 | |
| Foreign exchange gains (losses) on remeasurement of premiums receivable and loss and LAE reserves | (26) | | | 51 | | | (110) | |
| Total pre-tax adjustments | (13) | | | 108 | | | (160) | |
| Less tax effect on pre-tax adjustments | — | | | (17) | | | 17 | |
| Adjusted operating income (loss) | $ | 389 | | | $ | 648 | | | $ | 267 | |
| | | | | |
| Gain (loss) related to FG VIE and CIV consolidation (net of tax provision (benefit) of $(2), $(5) and $- included in adjusted operating income | $ | (6) | | | $ | (21) | | | $ | (6) | |
| | | | | | | | | | | | | | | | | |
| | Year Ended December 31, |
| | 2024 | | 2023 | | 2022 |
| | (per share amounts) |
| Net income (loss) attributable to AGL | $ | 6.87 | | | $ | 12.30 | | | $ | 1.92 | |
| Less pre-tax adjustments: | | | | | |
| Realized gains (losses) on investments | 0.16 | | | (0.23) | | | (0.87) | |
| Non-credit impairment-related unrealized fair value gains (losses) on credit derivatives | 0.27 | | | 1.75 | | | (0.27) | |
| Fair value gains (losses) on CCS | (0.19) | | | (0.57) | | | 0.37 | |
| Foreign exchange gains (losses) on remeasurement of premiums receivable and loss and LAE reserves | (0.47) | | | 0.84 | | | (1.72) | |
| Total pre-tax adjustments | (0.23) | | | 1.79 | | | (2.49) | |
| Less tax effect on pre-tax adjustments | — | | | (0.27) | | | 0.27 | |
| Adjusted operating income (loss) | $ | 7.10 | | | $ | 10.78 | | | $ | 4.14 | |
| | | | | |
| Gain (loss) related to FG VIE and CIV consolidation included in adjusted operating income | $ | (0.12) | | | $ | (0.35) | | | $ | (0.10) | |
Net Realized Investment Gains (Losses)
The table below presents the components of net realized investment gains (losses).
Net Realized Investment Gains (Losses)
| | | | | | | | | | | | | | | | | |
| | Year Ended December 31, |
| | 2024 | | 2023 | | 2022 |
| | (in millions) |
| Gross realized gains on sales of available-for-sale securities | $ | 3 | | | $ | 21 | | | $ | 3 | |
| Gross realized losses on sales of available-for-sale securities | (12) | | | (19) | | | (45) | |
| Net foreign currency gains (losses) | (2) | | | (1) | | | (4) | |
| Change in the allowance for credit losses and intent to sell (1) | 18 | | | (14) | | | (21) | |
| Other net realized gains (losses) | 2 | | | (1) | | | 11 | |
| Net realized investment gains (losses) | $ | 9 | | | $ | (14) | | | $ | (56) | |
____________________
(1) Relates primarily to Loss Mitigation Securities.
Sales of New Recovery Bonds received as part of the 2022 Puerto Rico Resolutions were the primary components of gross realized gains on sales in 2023 and gross realized losses on sales in 2022.
Non-Credit Impairment-Related Unrealized Fair Value Gains (Losses) on Credit Derivatives
Changes in the fair value of credit derivatives occur because of changes in the Company’s own credit rating and credit spreads, collateral credit spreads, notional amounts, credit ratings of the referenced entities, expected terms, realized gains (losses) and other settlements, interest rates and other market factors. The components of changes in fair value of credit derivatives related to credit derivative revenues and changes in expected losses are included in Insurance segment results. Non-credit impairment-related changes in unrealized fair value gains and losses on credit derivatives are not included in the Insurance segment measure of adjusted operating income because they do not represent actual claims or losses and are expected to reverse to zero as the exposure approaches its maturity date. Changes in the fair value of the Company’s credit derivatives that do not reflect actual or expected claims or credit losses have no impact on the Company’s statutory claims-paying resources, rating agency capital or regulatory capital positions. Unrealized gains (losses) on credit derivatives may fluctuate significantly in future periods. Except for underlying credit impairment, which is recognized as loss expense in the Insurance segment, the fair value adjustments on credit derivatives in the insured portfolio are non-economic adjustments that reverse to zero over the remaining term of that portfolio. See Item 8, Financial Statements and Supplementary Data, Note 9, Fair Value Measurement, for additional information.
During 2024, non-credit impairment-related unrealized fair value gains of $14 million were generated primarily due to the termination of certain structured finance policies and generally lower collateral asset spreads. During 2023, non-credit impairment-related unrealized fair value gains of $106 million were generated primarily as a result of generally lower collateral asset spreads.
Fair Value Gains (Losses) on CCS
Fair value losses on CCS of $10 million in 2024 and $35 million in 2023 were primarily due to a tightening in market spreads. Fair value gains (losses) on CCS are heavily affected by, and in part fluctuate with, changes in market spreads and interest rates, credit spreads and other market factors and are not expected to result in an economic gain or loss.
Foreign Exchange Gain (Loss) on Remeasurement
Foreign exchange gains and losses of $26 million losses, $51 million gains and $110 million losses in 2024, 2023 and 2022, respectively, primarily relate to remeasurement of long-dated premiums receivable, for which the Company records the present value of future installment premiums, and are mainly due to changes in the exchange rate of the pound sterling and, to a lesser extent, the euro relative to the U.S. dollar. Approximately 69% and 70% of gross premiums receivable, net of commissions payable at December 31, 2024 and December 31, 2023, respectively, are denominated in currencies other than the U.S. dollar, primarily the pound sterling and euro. Premiums on European infrastructure and structured finance transactions typically are paid, in whole or in part, on an installment basis, whereas premiums on U.S. public finance transactions are often paid upfront.
The following table presents the foreign exchange rates as of the balance sheet dates.
Foreign Exchange Rates
U.S. Dollar Per Foreign Currency
| | | | | | | | | | | | | | | | | | | | | | | | | | | | | | | | | | | |
| | As of December 31, |
| 2024 | | 2023 | | 2022 |
| Pound sterling | $1.252 | | $1.273 | | $1.208 |
| Euro | $1.035 | | $1.104 | | $1.071 |
Non-GAAP Financial Measures
The Company discloses both: (i) financial measures determined in accordance with GAAP; and (ii) financial measures not determined in accordance with GAAP (non-GAAP financial measures). Financial measures identified as non-GAAP should not be considered substitutes for GAAP financial measures. The primary limitation of non-GAAP financial measures is the potential lack of comparability to financial measures of other companies, whose definitions of non-GAAP financial measures may differ from those of the Company.
The Company believes its presentation of non-GAAP financial measures provides information that is necessary for analysts to calculate their estimates of Assured Guaranty’s financial results in their research reports on Assured Guaranty and for investors, analysts and the financial news media to evaluate Assured Guaranty’s financial results.
GAAP requires the Company to consolidate entities where it is deemed to be the primary beneficiary which include FG VIEs, which the Company does not own and where its exposure is limited to its obligation under the financial guaranty insurance contract, and CIVs in which certain subsidiaries invest.
The Company discloses the effect of FG VIE and CIV consolidation that is embedded in each non-GAAP financial measure, as applicable. The Company believes this information may also be useful to analysts and investors evaluating Assured Guaranty’s financial results. In the case of both the consolidated FG VIEs and the CIVs, the economic effect on the Company of each of the consolidated FG VIEs and CIVs is reflected primarily in the results of the Insurance segment.
Management of the Company and AGL’s Board of Directors use non-GAAP financial measures further adjusted to remove the effect of FG VIE and CIV consolidation (which the Company refers to as its core financial measures), as well as GAAP financial measures and other factors, to evaluate the Company’s results of operations, financial condition and progress towards long-term goals. The Company uses core financial measures in its decision-making process for and in its calculation of certain components of management compensation. The financial measures that the Company uses to help determine compensation are: (1) adjusted operating income, further adjusted to remove the effect of FG VIE and CIV consolidation; (2) adjusted operating shareholders’ equity, further adjusted to remove the effect of FG VIE and CIV consolidation; (3) adjusted book value per share, further adjusted to remove the effect of FG VIE and CIV consolidation; and (4) PVP.
Management believes that many investors, analysts and financial news reporters use adjusted operating shareholders’ equity and/or adjusted book value, each further adjusted to remove the effect of FG VIE and CIV consolidation, as the principal financial measures for valuing AGL’s current share price or projected share price and also as the basis of their decision to recommend, buy or sell AGL’s common shares.
Adjusted operating income, further adjusted for the effect of FG VIE and CIV consolidation, enables investors and analysts to evaluate the Company’s financial results in comparison with the consensus analyst estimates distributed publicly by financial databases.
The following paragraphs define each non-GAAP financial measure disclosed by the Company and describe why it is useful. To the extent there is a directly comparable GAAP financial measure, a reconciliation of the non-GAAP financial measure and the most directly comparable GAAP financial measure is presented below.
Adjusted Operating Income
Management believes that adjusted operating income is a useful measure because it clarifies the understanding of the operating results of the Company. Adjusted operating income is defined as net income (loss) attributable to AGL, as reported under GAAP, adjusted for the following:
1) Elimination of realized gains (losses) on the Company’s investments that are recognized in net income (loss) attributable to AGL, except for gains and losses on securities classified as trading. The timing of realized gains and losses, which depends largely on market credit cycles, can vary considerably across periods. The timing of sales is largely subject to the Company’s discretion and influenced by market opportunities, as well as the Company’s tax and capital profile.
2) Elimination of non-credit impairment-related unrealized fair value gains (losses) on credit derivatives that are recognized in net income (loss) attributable to AGL, which is the amount of unrealized fair value gains (losses) in excess of the present value of the expected estimated economic credit losses, and non-economic payments. Such fair value adjustments are heavily affected by, and in part fluctuate with, changes in market interest rates, the Company’s credit spreads, and other market factors and are not expected to result in an economic gain or loss.
3) Elimination of fair value gains (losses) on the Company’s CCS that are recognized in net income (loss) attributable to AGL. Such amounts are affected by changes in market interest rates, the Company’s credit spreads, price indications on the Company’s publicly traded debt and other market factors and are not expected to result in an economic gain or loss.
4) Elimination of foreign exchange gains (losses) on remeasurement of net premium receivables and loss and LAE reserves that are recognized in net income (loss) attributable to AGL. Long-dated receivables and loss and LAE reserves represent the present value of future contractual or expected cash flows. Therefore, the current period’s foreign exchange remeasurement gains (losses) are not necessarily indicative of the total foreign exchange gains (losses) that the Company will ultimately recognize.
5) The tax effects related to the above adjustments, which are determined by applying the statutory tax rate in each of the jurisdictions that generate these adjustments.
See “— Results of Operations — Reconciliation to GAAP” for a reconciliation of net income (loss) attributable to AGL to adjusted operating income (loss).
Adjusted Operating Shareholders’ Equity and Adjusted Book Value
Management believes that adjusted operating shareholders’ equity is a useful measure because it excludes the fair value adjustments on investments, credit derivatives and CCS that are not expected to result in economic gain or loss.
Adjusted operating shareholders’ equity is defined as shareholders’ equity attributable to AGL, as reported under GAAP, adjusted for the following:
1) Elimination of non-credit impairment-related unrealized fair value gains (losses) on credit derivatives, which is the amount of unrealized fair value gains (losses) in excess of the present value of the expected estimated economic credit losses, and non-economic payments. Such fair value adjustments are heavily affected by, and in part fluctuate with, changes in market interest rates, credit spreads and other market factors and are not expected to result in an economic gain or loss.
2) Elimination of fair value gains (losses) on the Company’s CCS. Such amounts are affected by changes in market interest rates, the Company’s credit spreads, price indications on the Company’s publicly traded debt and other market factors and are not expected to result in an economic gain or loss.
3) Elimination of unrealized gains (losses) on the Company’s investments that are recorded as a component of accumulated other comprehensive income (AOCI). The AOCI component of the fair value adjustment on the investment portfolio is not deemed economic because the Company generally holds these investments to maturity and therefore would not recognize an economic gain or loss.
4) The tax effects related to the above adjustments, which are determined by applying the statutory tax rate in each of the jurisdictions that generate these adjustments.
Management uses adjusted book value, further adjusted to remove the effect of FG VIE and CIV consolidation, to measure the intrinsic value of the Company, excluding franchise value. Adjusted book value per share, further adjusted for FG VIE and CIV consolidation (core adjusted book value), is one of the key financial measures used in determining the amount of
certain long-term compensation elements to management and employees and used by rating agencies and investors. Management believes that adjusted book value is a useful measure because it enables an evaluation of the Company’s in-force premiums and revenues net of expected losses. Adjusted book value is adjusted operating shareholders’ equity, as defined above, further adjusted for the following:
1) Elimination of deferred acquisition costs, net. These amounts represent net deferred expenses that have already been paid or accrued and will be expensed in future accounting periods.
2) Addition of the net present value of estimated net future revenue. See below.
3) Addition of the deferred premium revenue on financial guaranty contracts in excess of expected loss to be expensed, net of reinsurance. This amount represents the present value of the expected future net earned premiums, net of the present value of expected losses to be expensed, which are not reflected in GAAP equity.
4) The tax effects related to the above adjustments, which are determined by applying the statutory tax rate in each of the jurisdictions that generate these adjustments.
The unearned premiums and revenues included in adjusted book value will be earned in future periods, but actual earnings may differ materially from the estimated amounts used in determining current adjusted book value due to changes in foreign exchange rates, prepayment speeds, terminations, credit defaults and other factors.
Reconciliation of Shareholders’ Equity Attributable to AGL
to Adjusted Operating Shareholders’ Equity and Adjusted Book Value
| | | | | | | | | | | | | | | | | | | | | | | |
| | As of December 31, 2024 | | As of December 31, 2023 |
| | Total | | Per Share | | Total | | Per Share |
| | (dollars in millions, except share amounts) |
| Shareholders’ equity attributable to AGL | $ | 5,495 | | | $ | 108.80 | | | $ | 5,713 | | | $ | 101.63 | |
| Less pre-tax adjustments: | | | | | | | |
| Non-credit impairment-related unrealized fair value gains (losses) on credit derivatives | 49 | | | 0.96 | | | 34 | | | 0.61 | |
| Fair value gains (losses) on CCS | 2 | | | 0.05 | | | 13 | | | 0.22 | |
| Unrealized gain (loss) on investment portfolio | (397) | | | (7.86) | | | (361) | | | (6.40) | |
| Less taxes | 46 | | | 0.90 | | | 37 | | | 0.66 | |
| Adjusted operating shareholders’ equity | 5,795 | | | 114.75 | | | 5,990 | | | 106.54 | |
| Pre-tax adjustments: | | | | | | | |
| Less: Deferred acquisition costs | 176 | | | 3.47 | | | 161 | | | 2.87 | |
| Plus: Net present value of estimated net future revenue | 202 | | | 3.99 | | | 199 | | | 3.54 | |
| Plus: Net deferred premium revenue on financial guaranty contracts in excess of expected loss to be expensed | 3,473 | | | 68.75 | | | 3,436 | | | 61.12 | |
| Plus taxes | (702) | | | (13.90) | | | (699) | | | (12.41) | |
| Adjusted book value | $ | 8,592 | | | $ | 170.12 | | | $ | 8,765 | | | $ | 155.92 | |
| | | | | | | |
| Gain (loss) related to FG VIE and CIV consolidation included in: | | | | | | | |
| Adjusted operating shareholders’ equity (net of tax provision (benefit) of $0 and $1) | $ | — | | | $ | 0.01 | | | $ | 5 | | | $ | 0.07 | |
| Adjusted book value (net of tax provision (benefit) of $(2) and $0) | (6) | | | (0.13) | | | — | | | — | |
Net Present Value of Estimated Net Future Revenue
Management believes that this amount is a useful measure because it enables an evaluation of the present value of estimated net future revenue for non-financial guaranty insurance contracts. This amount represents the net present value of
estimated future revenue from these contracts (other than credit derivatives with net expected losses), net of reinsurance, ceding commissions and premium taxes.
Future installment premiums are discounted at the approximate average pre-tax book yield of fixed-maturity securities purchased during the prior calendar year, other than Loss Mitigation Securities. The discount rate is recalculated annually and updated as necessary. Net present value of estimated future revenue for an obligation may change from period to period due to a change in the discount rate or due to a change in estimated net future revenue for the obligation, which may change due to changes in foreign exchange rates, prepayment speeds, terminations, credit defaults or other factors that affect par outstanding or the ultimate maturity of an obligation. There is no corresponding GAAP financial measure.
PVP or Present Value of New Business Production
Management believes that PVP is a useful measure because it enables the evaluation of the value of new business production in the Insurance segment by taking into account the value of estimated future installment premiums on all new contracts underwritten in a reporting period as well as additional installment premiums and fees on existing contracts (which may result from supplements or fees or from the issuer not calling an insured obligation the Company projected would be called), regardless of form, which management believes GAAP gross written premiums and changes in fair value of credit derivatives do not adequately measure. PVP in respect of contracts written in a specified period is defined as gross upfront and installment premiums received and the present value of gross estimated future installment premiums.
Future installment premiums are discounted at the approximate average pre-tax book yield of fixed-maturity securities purchased during the prior calendar year, other than certain fixed-maturity securities such as Loss Mitigation Securities. The discount rate is recalculated annually and updated as necessary. Under GAAP, financial guaranty installment premiums are discounted at a risk-free rate. Additionally, under GAAP, management records future installment premiums on financial guaranty insurance contracts covering non-homogeneous pools of assets based on the contractual term of the transaction, whereas for PVP purposes, management records an estimate of the future installment premiums the Company expects to receive, which may be based upon a shorter period of time than the contractual term of the transaction.
Actual installment premiums may differ from those estimated in the Company’s PVP calculation due to factors including, but not limited to, changes in foreign exchange rates, prepayment speeds, terminations, credit defaults, or other factors that affect par outstanding or the ultimate maturity of an obligation.
Reconciliation of GWP to PVP
| | | | | | | | | | | | | | | | | | | | | | | | | | | | | |
| Year Ended December 31, 2024 |
| Public Finance | | Structured Finance | | |
| U.S. | | Non - U.S. | | U.S. | | Non - U.S. | | Total |
| (in millions) |
| GWP | $ | 259 | | | $ | 136 | | | $ | 20 | | | $ | 25 | | | $ | 440 | |
| Less: Installment GWP and other GAAP adjustments (1) | 143 | | | 115 | | | 17 | | | 25 | | | 300 | |
| Upfront GWP | 116 | | | 21 | | | 3 | | | — | | | 140 | |
| Plus: Installment premiums and other (2) | 154 | | | 46 | | | 22 | | | 40 | | | 262 | |
| PVP | $ | 270 | | | $ | 67 | | | $ | 25 | | | $ | 40 | | | $ | 402 | |
| | | | | | | | | | | | | | | | | | | | | | | | | | | | | |
| Year Ended December 31, 2023 |
| Public Finance | | Structured Finance | | |
| U.S. | | Non - U.S. | | U.S. | | Non - U.S. | | Total |
| (in millions) |
| GWP | $ | 211 | | | $ | 82 | | | $ | 59 | | | $ | 5 | | | $ | 357 | |
| Less: Installment GWP and other GAAP adjustments (1) | 109 | | | 74 | | | 59 | | | 5 | | | 247 | |
| Upfront GWP | 102 | | | 8 | | | — | | | — | | | 110 | |
| Plus: Installment premiums and other (2) | 110 | | | 75 | | | 68 | | | 41 | | | 294 | |
| PVP | $ | 212 | | | $ | 83 | | | $ | 68 | | | $ | 41 | | | $ | 404 | |
| | | | | | | | | | | | | | | | | | | | | | | | | | | | | |
| Year Ended December 31, 2022 |
| Public Finance | | Structured Finance | | |
| U.S. | | Non - U.S. | | U.S. | | Non - U.S. | | Total |
| (in millions) |
| GWP | $ | 248 | | | $ | 75 | | | $ | 37 | | | $ | — | | | $ | 360 | |
| Less: Installment GWP and other GAAP adjustments (1) | 40 | | | 75 | | | 30 | | | — | | | 145 | |
| Upfront GWP | 208 | | | — | | | 7 | | | — | | | 215 | |
| Plus: Installment premiums and other (2) | 49 | | | 68 | | | 36 | | | 7 | | | 160 | |
| PVP | $ | 257 | | | $ | 68 | | | $ | 43 | | | $ | 7 | | | $ | 375 | |
_____________
(1) Includes the present value of new business on installment policies discounted at the prescribed GAAP discount rates, and GWP adjustments on existing installment policies due to changes in assumptions and other GAAP adjustments.
(2) Includes the present value of future premiums and fees on new business paid in installments discounted at the approximate average pre-tax book yield of fixed-maturity securities purchased during the prior calendar year, other than certain fixed-maturity securities such as Loss Mitigation Securities. Includes the present value of future premiums and fees associated with other business written by the Company that, under GAAP, are accounted for under ASC 460, Guarantees.
Insured Portfolio
Financial Guaranty Exposure
The following tables present information in respect of the financial guaranty insured portfolio to supplement the disclosures and discussion provided in Item 8, Financial Statements and Supplementary Data, Note 3, Outstanding Exposure.
The tables below show the Company’s ten largest U.S. public finance, U.S. structured finance and non-U.S. exposures by revenue source, excluding related authorities and public corporations, as of December 31, 2024.
Ten Largest U.S. Public Finance Exposures by Revenue Source
As of December 31, 2024
| | | | | | | | | | | | | | | | | |
| Net Par Outstanding | | Percent of Total U.S. Public Finance Net Par Outstanding | | Rating |
| (dollars in millions) |
| New Jersey (State of) | $ | 2,362 | | | 1.2 | % | | BBB |
| Pennsylvania (Commonwealth of) | 2,132 | | | 1.1 | | | BBB+ |
| Lower Colorado River Authority | 1,642 | | | 0.8 | | | A |
| Metro Washington Airports Authority (Dulles Toll Road) | 1,631 | | | 0.8 | | | BBB+ |
| JFK New Terminal One, New York | 1,600 | | | 0.8 | | | BBB- |
| Alameda Corridor Transportation Authority, California | 1,373 | | | 0.7 | | | BBB |
| North Texas Tollway Authority | 1,355 | | | 0.7 | | | A+ |
| New York Power Authority | 1,334 | | | 0.7 | | | AA- |
| New York Metropolitan Transportation Authority | 1,314 | | | 0.7 | | | A- |
| Foothill/Eastern Transportation Corridor Agency, California | 1,269 | | | 0.5 | | | BBB+ |
| Total of top ten U.S. public finance exposures | $ | 16,012 | | | 8.0 | % | | |
Ten Largest U.S. Structured Finance Exposures
As of December 31, 2024
| | | | | | | | | | | | | | | | | |
| Net Par Outstanding | | Percent of Total U.S. Structured Finance Net Par Outstanding | | Rating |
| | (dollars in millions) |
| Private US Insurance Securitization | $ | 1,196 | | | 14.1 | % | | AA- |
| Private US Insurance Securitization | 1,100 | | | 13.0 | | | AA- |
| Private US Insurance Securitization | 1,100 | | | 13.0 | | | AA |
| Private US Insurance Securitization | 414 | | | 4.9 | | | AA- |
| Private US Insurance Securitization | 398 | | | 4.7 | | | AA- |
| Private Middle Market CLO | 167 | | | 2.0 | | | A |
| DB Master Finance LLC | 165 | | | 2.0 | | | BBB |
| Private Middle Market CLO | 125 | | | 1.5 | | | BBB |
| SLM Student Loan Trust 2007-A | 123 | | | 1.5 | | | AA |
| Private US Insurance Securitization | 120 | | | 1.4 | | | AA |
| Total of top ten U.S. structured finance exposures | $ | 4,908 | | | 58.1 | % | | |
Ten Largest Non-U.S. Exposures
As of December 31, 2024
| | | | | | | | | | | | | | | | | | | | | | | |
| Country | | Net Par Outstanding | | Percent of Total Non-U.S. Net Par Outstanding | | Rating |
| | | | (dollars in millions) |
| Southern Water Services Limited | United Kingdom | | $ | 2,611 | | | 5.0 | % | | BB |
| Thames Water Utilities Finance Plc | United Kingdom | | 2,133 | | | 4.1 | | | B |
| Southern Gas Networks PLC | United Kingdom | | 2,082 | | | 4.0 | | | BBB+ |
| Dwr Cymru Financing Limited | United Kingdom | | 1,838 | | | 3.5 | | | A- |
| Anglian Water Services Financing PLC | United Kingdom | | 1,746 | | | 3.4 | | | A- |
| National Grid Gas PLC | United Kingdom | | 1,657 | | | 3.2 | | | A- |
| Yorkshire Water Services Finance Plc | United Kingdom | | 1,243 | | | 2.4 | | | BBB |
| Channel Link Enterprises Finance PLC | France, United Kingdom | | 1,214 | | | 2.3 | | | BBB |
| Quebec Province | Canada | | 1,021 | | | 2.0 | | | AA- |
| Capital Hospitals (Issuer) PLC | United Kingdom | | 980 | | | 1.9 | | | BBB- |
| Total of top ten non-U.S. exposures | | | $ | 16,525 | | | 31.8 | % | | |
Financial Guaranty Portfolio by Issue Size
The Company seeks broad coverage of the market by insuring and reinsuring small and large issues alike. The following tables set forth the distribution of the Company’s portfolio by original size of the Company’s exposure.
Public Finance Portfolio by Issue Size
As of December 31, 2024
| | | | | | | | | | | | | | | | | | | | |
| Original Par Amount Per Issue | | Number of Issues | | Net Par Outstanding | | % of Public Finance Net Par Outstanding |
| (dollars in millions) |
| Less than $10 million | 9,725 | | | $ | 30,434 | | | 12.2 | % |
| $10 million through $50 million | 3,688 | | | 64,488 | | | 25.8 | |
| $50 million through $100 million | 666 | | | 39,195 | | | 15.7 | |
| $100 million through $200 million | 365 | | | 44,094 | | | 17.6 | |
| $200 million or greater | 237 | | | 72,164 | | | 28.7 | |
| Total | 14,681 | | $ | 250,375 | | | 100.0 | % |
Structured Finance Portfolio by Issue Size
As of December 31, 2024
| | | | | | | | | | | | | | | | | | | | |
| Original Par Amount Per Issue | | Number of Issues | | Net Par Outstanding | | % of Structured Finance Net Par Outstanding |
| (dollars in millions) |
| Less than $10 million | 91 | | | $ | 99 | | | 0.9 | % |
| $10 million through $50 million | 120 | | | 876 | | | 7.8 | |
| $50 million through $100 million | 53 | | | 1,485 | | | 13.3 | |
| $100 million through $200 million | 52 | | | 2,345 | | | 21.0 | |
| $200 million or greater | 84 | | | 6,372 | | | 57.0 | |
| Total | 400 | | $ | 11,177 | | | 100.0 | % |
Exposure to Puerto Rico
All of the Company’s insured exposure to various authorities and public corporations of the Commonwealth of Puerto Rico (Puerto Rico or the Commonwealth) is rated BIG. Puerto Rico net par and net debt service outstanding as of December 31, 2024 were $637 million and $756 million respectively, compared with net par and net debt service outstanding as of December 31, 2023 of $1,105 million and $1,508 million, respectively.
As of December 31, 2024, the Company’s only remaining outstanding insured Puerto Rico exposure subject to a payment default was PREPA, which had net par and debt service outstanding of $532 million and $629 million, respectively. As of December 31, 2023, PREPA net par and debt service outstanding were $624 million and $751 million, respectively. See “—Liquidity and Capital Resources—Insurance Subsidiaries, Financial Guaranty Policies” below and Item 8, Financial Statements and Supplementary Data, Note 4, Expected Loss to be Paid (Recovered), for more information.
The following table shows the scheduled amortization for PREPA. The Company guarantees payment of interest and principal when those amounts are scheduled to be paid and cannot be required to pay on an accelerated basis, although in certain circumstances it may elect to do so. When obligors default on their obligations, the Company is only required to pay the shortfall between the debt service due in any given period and the amount paid by the obligors.
Amortization Schedule of PREPA
Net Par Outstanding and Net Debt Service Outstanding
As of December 31, 2024
| | | | | | | | | | | |
| Scheduled Net Par Amortization | | Scheduled Net Debt Service Amortization |
| (in millions) |
| 2025 (January 1 - March 31) | $ | — | | | $ | 10 | |
| 2025 (April 1 - June 30) | — | | | 3 | |
| 2025 (July 1 - September 30) | 68 | | | 78 | |
| 2025 (October 1 - December 31) | — | | | 2 | |
| Subtotal 2025 | 68 | | | 93 | |
| 2026 | 106 | | | 126 | |
| 2027 | 106 | | | 122 | |
| 2028 | 68 | | | 80 | |
| 2029 | 39 | | | 47 | |
| 2030-2034 | 141 | | | 157 | |
| 2035-2037 | 4 | | | 4 | |
| Total | $ | 532 | | | $ | 629 | |
Liquidity and Capital Resources
AGL and its U.S. Holding Companies
AGL directly owns (i) AG Re, an insurance company domiciled in Bermuda; and (ii) AGUS, a U.S. holding company with public debt outstanding. AGUS directly owns AGMH, another U.S. holding company with public debt outstanding. As of August 1, 2024, AGMH directly owns AG, an insurance company domiciled in Maryland. Until August 1, 2024, AGMH directly owned AGM, an insurance company domiciled in New York. See “— Overview — Key Business Strategies — Merger of the U.S. Insurance Subsidiaries” above. AGUS and AGMH are collectively referred to as the U.S. Holding Companies.
Sources and Uses of Funds
The liquidity of AGL and its U.S. Holding Companies is largely dependent on dividends, stock redemptions and other distributions from their operating subsidiaries (see “— Insurance Subsidiaries — Distributions from Insurance Subsidiaries” below) and access to external financing. The operating liquidity requirements of AGL and the U.S. Holding Companies include:
•principal and interest on debt issued by AGUS and AGMH;
•dividends on AGL’s common shares; and
•the payment of operating expenses.
AGL and its U.S. Holding Companies may also require liquidity to:
•make capital investments in their operating subsidiaries and in alternative investments;
•fund acquisitions of new businesses;
•purchase or redeem the Company’s outstanding debt; or
•repurchase AGL’s common shares pursuant to AGL’s share repurchase authorization.
In the ordinary course of business, the Company evaluates its liquidity needs and capital resources in light of holding company expenses and dividend policy, as well as rating agency considerations. The Company also subjects its cash flow projections and its assets to a stress test, maintaining a liquid asset balance of one and a half times its stressed operating company net cash flows. Management believes that AGL will have sufficient liquidity to satisfy its needs over the next twelve months. See “— Overview— Key Business Strategies, Capital Management” above for information on common share repurchases.
External Financing
From time to time, AGL and its subsidiaries have sought external debt or equity financing in order to meet their obligations. External sources of financing may or may not be available to the Company and, if available, the cost of such financing may not be acceptable to the Company.
Long-Term Debt Obligations
The Company has outstanding long-term debt issued by the U.S. Holding Companies. See Item 8, Financial Statements and Supplementary Data, Note 11, Long-Term Debt and Credit Facilities, and Guarantor and U.S. Holding Companies’ Summarized Financial Information below.
U.S. Holding Companies
Long-Term Debt and Intercompany Loans
| | | | | | | | | | | | | | | | | | | | | | | |
| | | | | As of December 31, |
| | | | | | 2024 | | 2023 |
| | | | | | (in millions) |
| Effective Interest Rate | | Final Maturity | | Principal Amount |
| AGUS - long-term debt | | | | | | | |
| 6.125% Senior Notes | 6.125% | | 2028 | | $ | 350 | | | $ | 350 | |
| 3.15% Senior Notes | 3.15% | | 2031 | | 500 | | | 500 | |
| 7% Senior Notes | 6.40% | | 2034 | | 200 | | | 200 | |
| 3.6% Senior Notes | 3.60% | | 2051 | | 400 | | | 400 | |
| Series A Enhanced Junior Subordinated Debentures | 3 month CME Term SOFR +2.64% | | 2066 | | 150 | | | 150 | |
| AGUS long-term debt | | | | | 1,600 | | | 1,600 | |
| AGUS - intercompany loans from: | | | | | | | |
| AG/AGM (1) | 3.50% | | 2029 | | 250 | | | 250 | |
| AGRO | 5.00% | | 2028 | | 20 | | | 20 | |
| AGUS intercompany loans | | | | | 270 | | | 270 | |
| Total AGUS long-term debt and intercompany loans | | | | | 1,870 | | | 1,870 | |
| AGMH | | | | | | | |
| Junior Subordinated Debentures (2) | 6.40% | | 2066 | | 300 | | | 300 | |
| Total AGMH long-term debt | | | | | 300 | | | 300 | |
| AGMH’s long-term debt purchased by AGUS (3) | | | | | (154) | | | (154) | |
| U.S. Holding Company long-term debt | | | | | $ | 2,016 | | | $ | 2,016 | |
____________________
(1) Effective August 1, 2024, AGM merged with and into AG, with AG as the surviving company.
(2) If the AGMH Junior Subordinated Debentures are outstanding after December 15, 2036, then the principal amount of the outstanding debentures will bear interest at One-Month Chicago Mercantile Exchange (CME) Term Secured Overnight Finance Rate (SOFR) plus 2.33%.
(3) Represents principal amount of Junior Subordinated Debentures issued by AGMH that has been purchased by AGUS.
Interest Paid on U.S. Holding Companies’ Long-Term Debt and Intercompany Loans
| | | | | | | | | | | | | | | | | |
| | Year Ended December 31, |
| 2024 | | 2023 | | 2022 |
| | (in millions) |
| AGUS - long-term debt | $ | 79 | | | $ | 68 | | | $ | 68 | |
| AGUS - intercompany loans | 10 | | | 10 | | | 10 | |
| Total AGUS | 89 | | | 78 | | | 78 | |
| AGMH - long-term debt | 19 | | | 19 | | | 19 | |
| AGMH’s long-term debt purchased by AGUS | (10) | | | (10) | | | (10) | |
| Total interest paid | $ | 98 | | | $ | 87 | | | $ | 87 | |
On August 21, 2023, AGUS issued $350 million of 6.125% Senior Notes due 2028. On September 25, 2023, AGUS redeemed $330 million of 5% Senior Notes due 2024. See Item 8, Financial Statements and Supplementary Data, Note 11, Long-Term Debt and Credit Facilities.
U.S. Holding Companies
Expected Debt Service of Long-Term Debt
As of December 31, 2024
| | | | | | | | | | | | | | | | | | | | | | | | | | |
| Year | | AGUS | | AGMH | | Eliminations (1) | | Total |
| | | (in millions) |
| 2025 | | $ | 136 | | | $ | 19 | | | $ | (69) | | | $ | 86 | |
| 2026 | | 134 | | | 19 | | | (68) | | | 85 | |
| 2027 | | 131 | | | 19 | | | (66) | | | 84 | |
| 2028 | | 493 | | | 19 | | | (84) | | | 428 | |
| 2029 | | 106 | | | 19 | | | (62) | | | 63 | |
| 2030-2049 | | 1,265 | | | 384 | | | (197) | | | 1,452 | |
| 2050-2066 | | 718 | | | 626 | | | (321) | | | 1,023 | |
| Total | | $ | 2,983 | | | $ | 1,105 | | | $ | (867) | | | $ | 3,221 | |
____________________
(1) Includes eliminations of intercompany loans payable and AGMH’s debt purchased by AGUS.
From time to time, AGL and its subsidiaries have entered into intercompany loan facilities. For example, on October 25, 2013, AGL, as borrower, and AGUS, as lender, entered into a revolving credit facility pursuant to which AGL may, from time to time, borrow for general corporate purposes. Under the credit facility, AGUS committed to lend a principal amount not exceeding $225 million in the aggregate. The commitment under the revolving credit facility terminates on October 25, 2033 (the loan commitment termination date). The unpaid principal amount of each loan will bear semi-annual interest at a fixed rate equal to 100% of the then applicable interest rate as determined under Internal Revenue Code Section 1274(d). Accrued interest on all loans will be paid on the last day of each June and December and at maturity. AGL must repay unpaid principal amounts of the loans, if any, by the third anniversary of the loan commitment termination date. AGL has not drawn upon the credit facility.
Intercompany Loans Payable
On October 1, 2019, AG made a 10-year, 3.5% interest rate intercompany loan to AGUS, in the amount of $250 million, to fund the acquisition of BlueMountain Capital Management LLC (AssuredIM LLC, now known as Sound Point Luna LLC) and its associated entities, and the related capital contributions. Interest is payable annually in arrears on each anniversary of the note, and commenced on October 1, 2020. Interest accrues daily and is computed on a basis of a 360-day year from October 1, 2019 until the date on which the principal amount is paid in full. AGUS will pay 20% of the original principal amount of each note on the sixth, seventh, eighth and ninth anniversaries. The remaining 20% of the original principal amount and all accrued and unpaid interest will be paid on the maturity date. AGUS has the right to prepay the principal amount of the notes in whole or in part at any time, or from time to time, without payment of any premium or penalty.
Guarantor and U.S. Holding Companies’ Summarized Financial Information
AGL fully and unconditionally guarantees the payment of the principal of, and interest on, the $1,450 million aggregate principal amount of notes issued by the U.S. Holding Companies, the $450 million aggregate principal amount of junior subordinated debentures issued by the U.S. Holding Companies and the intercompany loans. The following tables include summarized financial information for AGL and the U.S. Holding Companies, excluding their investments in subsidiaries.
| | | | | | | | | | | |
| As of December 31, 2024 |
| AGL | | U.S. Holding Companies |
| (in millions) |
| Assets, excluding investments in subsidiaries | | | |
| Fixed-maturity securities (1) | $ | 14 | | | $ | 4 | |
| Ownership Interest in Sound Point | — | | | 418 | |
| Other invested assets | — | | | 124 | |
| Short-term investments and cash | 52 | | | 367 | |
| Receivables from affiliates (2) | 67 | | | — | |
| Dividends receivable from U.S. Holding Companies | 150 | | | — | |
| Other assets | 2 | | | 42 | |
| Liabilities | | | |
| Long-term debt | — | | | 1,699 | |
| Loans payable to affiliates | — | | | 270 | |
| Payable to affiliates (2) | 14 | | | 14 | |
| Dividends payable to AGL | — | | | 150 | |
| Other liabilities | 13 | | | 84 | |
____________________
(1) As of December 31, 2024, weighted average durations of AGL’s and the U.S. Holding Companies’ fixed-maturity securities were 10.6 years and 3.5 years, respectively.
(2) Primarily represents receivables and payables with non-guarantor subsidiaries.
| | | | | | | | | | | |
| Year Ended December 31, 2024 |
| AGL | | U.S. Holding Companies |
| (in millions) |
| Revenues | $ | 2 | | | $ | 13 | |
| Expenses | | | |
| Interest expense | — | | | 101 | |
| Other expenses | 42 | | | 14 | |
| Income (loss) before provision for income taxes and equity in earnings (losses) of investees | (40) | | | (102) | |
| Net income (loss) excluding investments in subsidiaries | (40) | | | (85) | |
The following table presents significant cash flow items for AGL and the U.S. Holding Companies (other than investment income, operating expenses and taxes) related to distributions from subsidiaries and outflows for debt service, dividends and other capital management activities.
AGL and U.S. Holding Companies
Selected Cash Flow Items
| | | | | | | | | | | |
| Year Ended December 31, 2024 |
| AGL | | U.S. Holding Companies |
| (in millions) |
| Dividends received from U.S. Holding Companies | $ | 540 | | | $ | — | |
| Dividends received from other subsidiaries | 97 | | | 404 | |
| Distributions from equity method investees (1) | — | | | 37 | |
| Interest paid on intercompany loans | — | | | (10) | |
| Interest paid on long term debt | — | | | (88) | |
| Investments in subsidiaries | — | | | (14) | |
| Redemption of stock by insurance subsidiaries | — | | | 267 | |
| Dividends paid to AGL | — | | | (540) | |
| Dividends paid to AGL shareholders | (68) | | | — | |
| Repurchases of common shares (2) | (502) | | | — | |
____________________
(1) Includes distributions from Sound Point and other alternative investments.
(2) See Item 8, Financial Statements and Supplementary Data, Note 18, Shareholders’ Equity, for additional information about share repurchases and authorizations.
Generally, dividends paid by a U.S. company to a Bermuda holding company are subject to a 30% withholding tax. After AGL became tax resident in the U.K., it became subject to the tax rules applicable to companies resident in the U.K., including the benefits afforded by the U.K.’s tax treaties. The income tax treaty between the U.K. and the U.S. reduces or eliminates the U.S. withholding tax on certain U.S. sourced investment income (to 5% or 0%), including dividends from U.S. subsidiaries to U.K. resident persons entitled to the benefits of the treaty.
Insurance Subsidiaries
The Company has several insurance subsidiaries. AG is an insurance subsidiary domiciled in Maryland. As of August 1, 2024, AG owns: (i) AGUK, an insurance subsidiary domiciled in the U.K; and (ii) AGE, an insurance company domiciled in France. Until August 1, 2024, AGM was an insurance subsidiary of the Company domiciled in New York. See “— Overview — Key Business Strategies — Merger of the U.S. Insurance Subsidiaries” above. AGUK and AGE are collectively referred to as the European Insurance Subsidiaries. AG Re is an insurance company domiciled in Bermuda that owns AGRO, an insurance company that is also domiciled in Bermuda.
Sources and Uses of Funds
Liquidity of the insurance subsidiaries is primarily used to pay for:
•operating expenses,
•claims on the insured portfolio,
•dividends or other distributions to parent,
•reinsurance premiums, and
•capital investments in their own subsidiaries and in alternative investments.
Management believes that the insurance subsidiaries’ liquidity needs for the next twelve months can be met from current cash, short-term investments and operating cash flow, including premium collections and coupon payments as well as scheduled maturities and paydowns from their respective investment portfolios. The Company generally targets a balance of its most liquid assets including cash and short-term securities, U.S. Treasuries, agency RMBS and pre-refunded municipal bonds equal to 1.5 times its projected operating company cash flow needs over the next four quarters. As of December 31, 2024, the Company intended to hold and had the ability to hold securities in an unrealized loss position until the date of anticipated recovery of amortized cost.
Beyond the next twelve months, the ability of the operating subsidiaries to declare and pay dividends may be influenced by a variety of factors, including market conditions, general economic conditions and, in the case of the Company’s insurance subsidiaries, insurance regulations and rating agency capital requirements.
Financial Guaranty Policies
Insurance policies issued provide, in general, that payments of principal, interest and other amounts insured may not be accelerated by the holder of the obligation. Amounts paid by the Company therefore are typically in accordance with the obligation’s original payment schedule, unless the Company accelerates such payment schedule, at its sole option. Premiums received on financial guaranty contracts are paid either upfront or in installments over the life of the insured obligations.
Payments made in settlement of the Company’s obligations arising from its insured portfolio may, and often do, vary significantly from year to year, depending primarily on the frequency and severity of payment defaults and whether the Company chooses to accelerate its payment obligations in order to mitigate future losses. For example, the Company made substantial claim payments in 2022 and 2024 in connection with the resolution of certain Puerto Rico credits. The Company is continuing its efforts to resolve the one remaining unresolved Puerto Rico insured exposure that is in payment default, PREPA. The Company had $532 million in insured net par outstanding of PREPA obligations as of December 31, 2024. For more information, see Item 8, Financial Statements and Supplementary Data, Note 4, Expected Loss to be Paid (Recovered), and Note 8, Financial Guaranty Variable Interest Entities and Consolidated Investment Vehicles.
The terms of the Company’s credit default swaps (CDS) contracts generally are modified from standard CDS contract forms approved by International Swaps and Derivatives Association, Inc. such that the circumstances giving rise to the Company’s obligation to make loss payments are similar to those for its financial guaranty insurance contracts. The documentation for certain CDS was negotiated to require the Company to also pay if the obligor were to become bankrupt or if the reference obligation were restructured. Furthermore, some CDS documentation requires the Company to make a payment due to an event that is unrelated to the performance of the obligation referenced in the credit derivative. If events of default or termination events specified in the credit derivative documentation were to occur, the Company may be required to make a cash termination payment to its swap counterparty upon such termination. Any such payment would probably occur prior to the maturity of the reference obligation and be in an amount larger than the amount due for that period on a “pay-as-you-go” basis.
The following table presents estimated probability weighted expected cash outflows under direct and assumed financial guaranty contracts, whether accounted for as insurance or credit derivatives, including claim payments under contracts in consolidated FG VIEs, as of December 31, 2024. This amount does not include amounts related to loss adjustment expenses. This amount is not reduced for cessions under reinsurance contracts or recoveries attributable to Loss Mitigation Securities. This amount includes any benefit anticipated from excess spread or other recoveries within the contracts but does not reflect any benefit for recoveries under breaches of representation and warranty. This amount also excludes estimated recoveries for past claims paid for policies in the public finance sector. See Item 8. Financial Statements and Supplementary Data, Note 5, Contracts Accounted for as Insurance.
Estimated Expected Claim Payments
(Undiscounted)
| | | | | |
| | As of December 31, 2024 |
| | (in millions) |
| Less than 1 year | $ | 212 | |
| 1-3 years | 99 | |
| 3-5 years | (25) | |
| More than 5 years | 785 | |
| Total | $ | 1,071 | |
Ordinary Dividends From Insurance Subsidiaries to Holding Companies
The Company anticipates that, for the next twelve months, amounts paid by AGL’s direct and indirect insurance subsidiaries as dividends or other distributions will be a major source of the holding companies’ liquidity. The insurance subsidiaries’ ability to pay dividends depends upon their financial condition, results of operations, cash requirements, other potential uses for such funds and compliance with rating agency requirements, and is also subject to restrictions contained in the
insurance laws and related regulations of their states of domicile. For more information, see Item 8, Financial Statements and Supplementary Data, Note 14, Insurance Company Regulatory Requirements.
Dividend restrictions by insurance subsidiary are as follows:
•The Company expects the amount of ordinary dividends available for distribution by AG in 2025 to be approximately $287 million. Such payments would be payable in the second half of 2025 because AG’s ordinary dividends were concentrated in the second half of 2024 following the August 1, 2024 merger of AGM with and into AG. Under Maryland’s insurance law, AG may make an ordinary dividend payment in 2025 only when such amount, together with other dividends and distributions paid in the prior 12 months, does not exceed its expected 2025 ordinary dividend capacity of $287 million (i.e., a 12-month look back of dividends and distributions). However, in order to enable AG to make payments over the course of the year, AG has put in place for 2025 a quarterly process with the MIA, pursuant to which AG will confirm that the MIA does not object to AG dividending $71.8 million (i.e., 25%) of the $287 million amount in each calendar quarter of 2025. Pursuant to this process, AG obtained the MIA’s non-objection to pay, and expects to pay, a $71.8 million dividend on March 7, 2025. See Part I, Item 1, Business - Regulation, and Part II, Item 7, Management’s Discussion and Analysis of Financial Conditions and Results of Operations – Overview – Key Business Strategies – Merger of the U.S. Insurance Subsidiaries.
•The Company expects the amount of dividends available for distribution by AG Re in 2025 to be approximately $192 million. Based on applicable law and regulations, in 2025 AG Re has the capacity to declare and pay dividends in an aggregate amount up to 25% of the prior year statutory surplus (i.e., up to $272 million as of December 31, 2024); provided that such payment cannot exceed AG Re’s unencumbered assets ($192 million as of December 31, 2024) or its statutory surplus ($229 million as of December 31, 2024). Additionally, in 2025 AG Re can make capital distributions in an aggregate amount up to $129 million without the prior approval of the Authority.
Ordinary Dividends From Insurance Subsidiaries
to Holding Companies
| | | | | | | | | | | | | | | | | |
| Year Ended December 31, |
| 2024 | | 2023 | | 2022 |
| (in millions) |
| Dividends paid by AG Re to AGL | 97 | | | 53 | | | — | |
| Dividends paid by AG to U.S. Holding Companies (1) | 400 | | | 358 | | | 473 | |
___________________
(1) Prior to the merger of AGM with and into AG, with AG as the surviving company, AG had been directly owned by AGUS. As a result of the merger, effective as of August 1, 2024, AG is directly owned by AGMH, a subsidiary of AGUS.
Stock Redemptions by Insurance Subsidiaries
In May 2024, NYDFS approved, and AGM implemented, the redemption of approximately $100 million of AGM’s shares of common stock from AGMH.
In connection with the merger of AGM into AG, the MIA approved, and in third quarter of 2024 AG implemented, the redemption of approximately $300 million of AG’s shares of common stock from AGMH in exchange for cash of $167 million and the remainder in alternative investments.
Committed Capital Securities
AG is party to an arrangement that enables it to access, at its discretion, up to $400 million of capital, at any time, and has the right to use such capital for any purpose, including to pay claims. See Item 8, Financial Statements and Supplementary Data, Note 9, Fair Value Measurement.
Investment Portfolio
The Company’s principal objectives in managing its investment portfolio are to support the highest possible ratings for each operating company, manage investment risk within the context of the underlying portfolio of insurance risk, maintain sufficient liquidity to cover unexpected stress in the insurance portfolio and maximize after-tax net investment income. As of December 31, 2024, the Company had $7,590 million of available-for-sale fixed-maturity and short-term investments, of which
$5,452 million were managed by three investment managers who are required to, in accordance with the Company’s investment guidelines, maintain their portion of the Company’s investment portfolio with an overall credit quality rated at a minimum of A+/A1/A+ by S&P/Moody’s/Fitch Ratings Inc. In addition, $277 million of available-for-sale fixed-maturity securities were CLO equity tranches managed by Sound Point.
Changes in interest rates affect the value of the Company’s fixed-maturity securities. As interest rates fall, the fair value of fixed-maturity securities generally increases, and as interest rates rise, the fair value of fixed-maturity securities generally decreases. The Company’s portfolio of fixed-maturity securities primarily consists of investment-grade, liquid instruments. Other invested assets include other alternative investments, which are generally less liquid. For more information about the investment portfolio and a detailed description of the Company’s valuation of investments, see Item 8, Financial Statements and Supplementary Data, Note 7, Investments and Cash, and Note 9, Fair Value Measurement.
Investment Portfolio
Carrying Value
| | | | | | | | | | | |
| As of December 31, |
| | 2024 | | 2023 |
| | (in millions) |
| Fixed-maturity securities, available-for-sale | $ | 6,369 | | | $ | 6,307 | |
| Fixed-maturity securities, trading (1) | 147 | | | 318 | |
| Short-term investments | 1,221 | | | 1,661 | |
| Other invested assets (2) | 926 | | | 829 | |
| Total | $ | 8,663 | | | $ | 9,115 | |
____________________
(1) Includes primarily CVIs received under the 2022 Puerto Rico Resolutions, which are not rated.
(2) Excludes investments in Sound Point funds that are consolidated. See Item 8, Financial Statements and Supplementary Data, Note 8, Financial Guaranty Variable Interest Entities and Consolidated Investment Vehicles.
The Company’s available-for-sale fixed-maturity securities had a duration of 4.3 years as of December 31, 2024 and 3.9 years as of December 31, 2023, respectively.
Available-for-Sale Fixed-Maturity Securities By Rating
The following table summarizes the ratings distributions of the Company’s available-for-sale fixed-maturity securities as of December 31, 2024 and December 31, 2023. Ratings generally reflect the lower of Moody’s and S&P classifications, except for (i) Loss Mitigation Securities, which use Assured Guaranty’s internal ratings classifications, rated BIG, and (ii) CLO equity tranches, which are not rated. See Item 8, Financial Statements and Supplementary Data, Note 7, Investments and Cash, for additional information.
Distribution of Available-for-Sale Fixed-Maturity Securities by Rating
| | | | | | | | | | | | | | |
| | As of December 31, |
| Rating | | 2024 | | 2023 |
| AAA | | 12.5 | % | | 13.3 | % |
| AA | | 35.0 | | | 38.2 | |
| A | | 23.6 | | | 27.6 | |
| BBB | | 16.3 | | | 11.7 | |
| BIG | | 8.1 | | | 7.8 | |
| Not rated | | 4.5 | | | 1.4 | |
| Total | | 100.0 | % | | 100.0 | % |
Portfolio of Obligations of State and Political Subdivisions
The Company’s fixed-maturity available-for-sale securities include issuances by a wide number of municipal authorities across the U.S. and its territories. The following table presents the components of the Company’s $1,940 million (fair value) of obligations of state and political subdivisions included in the Company’s available-for-sale fixed-maturity securities investment portfolio as of December 31, 2024.
Fair Value of Available-for-Sale Fixed-Maturity Securities Investment Portfolio
of Obligations of State and Political Subdivisions
As of December 31, 2024 (1)
| | | | | | | | | | | | | | | | | | | | | | | | | | | | | | | | |
| State | | State
General
Obligation | | Local
General
Obligation | | Revenue Bonds | | Total Fair
Value | | Amortized
Cost |
| | | (in millions) |
| California | | $ | 45 | | | $ | 55 | | | $ | 245 | | | $ | 345 | | | $ | 355 | |
| Texas | | 15 | | | 63 | | | 212 | | | 290 | | | 307 | |
| New York | | 3 | | | 35 | | | 162 | | | 200 | | | 209 | |
| Massachusetts | | 43 | | | — | | | 60 | | | 103 | | | 107 | |
| Florida | | — | | | 1 | | | 101 | | | 102 | | | 108 | |
| Washington | | 13 | | | 27 | | | 56 | | | 96 | | | 101 | |
| Illinois | | 8 | | | 12 | | | 56 | | | 76 | | | 79 | |
| Colorado | | — | | | 20 | | | 38 | | | 58 | | | 60 | |
| Pennsylvania | | 12 | | | 2 | | | 32 | | | 46 | | | 48 | |
| Arizona | | — | | | — | | | 43 | | | 43 | | | 44 | |
| All others | | 65 | | | 69 | | | 331 | | | 465 | | | 499 | |
| Total | | $ | 204 | | | $ | 284 | | | $ | 1,336 | | | $ | 1,824 | | | $ | 1,917 | |
____________________
(1) Excludes $116 million as of December 31, 2024 of pre-refunded bonds, at fair value.
The revenue bond portfolio primarily consists of essential service revenue bonds issued by transportation authorities, utilities and universities.
Revenue Bonds
Sources of Funds
As of December 31, 2024
| | | | | | | | | | | | | | |
| Type | | Amortized
Cost | | Fair Value |
| | | (in millions) |
| Tax revenue | | $ | 374 | | | $ | 369 | |
| Transportation | | 330 | | | 315 | |
| Utilities | | 280 | | | 270 | |
| Education | | 228 | | | 219 | |
| Healthcare | | 107 | | | 101 | |
| All others | | 78 | | | 62 | |
| Total | | $ | 1,397 | | | $ | 1,336 | |
Other Investments
Other invested assets, which are generally less liquid than fixed-maturity securities, primarily consist of the ownership interest in Sound Point and alternative investments across a variety of strategies.
The Insurance segment reports the Company’s percentage ownership of Sound Point funds and AHP funds as equity method investments with changes in NAV included in the Insurance segment adjusted operating income. As of December 31, 2024, one active fund in which the Company invests was accounted for as a CIV and the remaining are accounted as equity method investments in the Company’s consolidated financial statements. See “— Commitments” below.
Ownership Interest in Sound Point and Alternative Investments
As of December 31, 2024
| | | | | | | | | | | | | | | | | | | | |
| | Investments | | CIVs | | Consolidated |
| | | (in millions) |
| Fixed-maturity securities, available-for-sale (1) | | $ | 319 | | | $ | — | | | $ | 319 | |
| Fixed-maturity securities, trading | | 24 | | | — | | | 24 | |
| Other invested assets: | | | | | | |
| Ownership interest in Sound Point | | 418 | | | — | | | 418 | |
| CLOs | | 100 | | | — | | | 100 | |
| Private healthcare investing | | 153 | | | — | | | 153 | |
| Asset-based/specialty finance | | 142 | | | (33) | | | 109 | |
| Middle market direct lending | | 11 | | | — | | | 11 | |
| Other | | 135 | | | — | | | 135 | |
| Total | | $ | 1,302 | | | $ | (33) | | | $ | 1,269 | |
____________________
(1) Include CLO equity tranches distributed from the CLO fund in the fourth quarter of 2024.
Ownership Interest in Sound Point and Alternative Investments
As of December 31, 2023
| | | | | | | | | | | | | | | | | | | | |
| | Investments | | CIVs | | Consolidated |
| | | (in millions) |
| Fixed-maturity securities, available-for-sale | | $ | 34 | | | $ | — | | | $ | 34 | |
| Other invested assets: | | | | | | |
| Sound Point | | 429 | | | — | | | 429 | |
| CLOs | | 302 | | | (223) | | | 79 | |
| Private healthcare investing | | 102 | | | — | | | 102 | |
| Asset-based/specialty finance | | 166 | | | (82) | | | 84 | |
| Middle market direct lending | | 5 | | | — | | | 5 | |
| Other | | 130 | | | — | | | 130 | |
| Total | | $ | 1,168 | | | $ | (305) | | | $ | 863 | |
Income from Ownership Interest in Sound Point and Alternative Investments
Year Ended December 31, 2024
| | | | | | | | | | | | | | | | | | | | |
| | Investments | | CIVs | | Consolidated |
| | | (in millions) |
| Net investment income (1) | | $ | 15 | | | $ | — | | | $ | 15 | |
| Fair value gains (losses) on trading securities | | 2 | | | — | | | 2 | |
| Equity in earnings of Sound Point | | 6 | | | — | | | 6 | |
| Equity in earnings (losses) of alternative investments: | | | | | | |
| CLOs | | 47 | | | (33) | | | 14 | |
| Private healthcare investing | | 11 | | | — | | | 11 | |
| Asset-based/specialty finance | | 24 | | | (14) | | | 10 | |
| Middle market direct lending | | 2 | | | — | | | 2 | |
| Other | | 19 | | | — | | | 19 | |
| Total | | $ | 126 | | | $ | (47) | | | $ | 79 | |
____________________
(1) Includes CLO equity tranches distributed from the CLO fund in the fourth quarter of 2024.
Income from Ownership Interest in Sound Point and Alternative Investments
Year Ended December 31, 2023
| | | | | | | | | | | | | | | | | | | | |
| | Investments | | CIVs | | Consolidated |
| | | (in millions) |
| Net investment income | | $ | 1 | | | $ | — | | | $ | 1 | |
| Equity in earnings of Sound Point | | 5 | | | — | | | 5 | |
| Equity in earnings (losses) of alternative investments: | | | | | | |
| CLOs | | 50 | | | (46) | | | 4 | |
| Private healthcare investing | | 19 | | | (9) | | | 10 | |
| Asset-based/specialty finance | | 5 | | | (4) | | | 1 | |
| Other | | 8 | | | — | | | 8 | |
| Total | | $ | 88 | | | $ | (59) | | | $ | 29 | |
Income from Alternative Investments
Year Ended December 31, 2022
| | | | | | | | | | | | | | | | | | | | |
| | Investments | | CIVs | | Consolidated |
| | | (in millions) |
| Equity in earnings (losses) of alternative investments: | | | | | | |
| CLOs | | $ | (2) | | | $ | 2 | | | $ | — | |
| Private healthcare investing | | (11) | | | 13 | | | 2 | |
| Asset-based/specialty finance | | 5 | | | (5) | | | — | |
| Other | | (43) | | | 2 | | | (41) | |
| Total | | $ | (51) | | | $ | 12 | | | $ | (39) | |
Beginning in the third quarter of 2023, the Company records an equity method ownership interest in Sound Point pursuant to the Sound Point Transaction described in Item 8, Financial Statements and Supplementary Data, Note 1, Business and Basis of Presentation.
Commitments
The Company has agreed to invest an aggregate amount of $1.5 billion in alternative investments, including $1 billion in Sound Point managed investments. Unfunded commitments for alternative investments as of December 31, 2024 were $610 million. See Part II, Item 8, Financial Statements and Supplementary Data, Note 1, Business and Basis of Presentation, for a description of the Sound Point Transaction.
Restricted Assets
Based on fair value, fixed-maturity securities, short-term investments and cash that are either held in trust for the benefit of third-party ceding insurers in accordance with statutory requirements, placed on deposit to fulfill state licensing requirements, or otherwise pledged or restricted, totaled $79 million and $234 million as of December 31, 2024 and December 31, 2023, respectively. The investment portfolio also contains securities that are held in trust by certain AGL subsidiaries or otherwise restricted for the benefit of other AGL subsidiaries in accordance with statutory and regulatory requirements with a fair value of $1,135 million and $1,154 million as of December 31, 2024 and December 31, 2023, respectively.
Lease Obligations
The Company has entered into several lease agreements for office space in Bermuda, New York, London, Paris, and other locations with various lease terms. See Item 8, Financial Statements and Supplementary Data, Note 16, Leases, for a table of minimum lease obligations.
FG VIEs and CIVs
The Company manages its liquidity needs by evaluating cash flows without the effect of consolidating FG VIEs and CIVs; however, the Company’s consolidated financial statements include the effect of consolidating FG VIEs and CIVs. The primary sources and uses of cash at Assured Guaranty’s FG VIEs and CIVs are as follows:
•FG VIEs. The primary sources of cash in FG VIEs are the collection of principal and interest on the collateral supporting the debt obligations, and the primary uses of cash are the payment of principal and interest due on the debt obligations. The insurance subsidiaries are not primarily liable for the debt obligations issued by the VIEs they insure and would only be required to make payments on those insured debt obligations in the event that the issuer of such debt obligations defaults on any principal or interest due and only for the amount of the shortfall. AGL’s and its insurance subsidiaries’ creditors do not have any rights with regard to the collateral supporting the debt issued by the FG VIEs.
•CIVs. The primary sources and uses of cash in the CIVs include, using capital to make investments, generating cash income from investments, paying expenses, distributing cash flow to investors. The assets and liabilities of the Company’s CIVs are held within separate legal entities. The assets of the CIVs are not available to creditors of the Company, other than creditors of the applicable CIVs. In addition, creditors of the CIVs have no recourse against the assets of the Company, other than the assets of such applicable CIVs. Liquidity available at the Company’s CIVs is not available for corporate liquidity needs, except to the extent of the Company’s investment in the funds, subject to redemption provisions.
See Item 8, Financial Statements and Supplementary Data, Note 8, Financial Guaranty Variable Interest Entities and Consolidated Investment Vehicles, for additional information.
Consolidated Cash Flow Summary
The summarized consolidated statements of cash flows in the table below present the cash flow effect for the aggregate of the Insurance and Asset Management businesses and holding companies, separately from the aggregate effect of consolidating FG VIEs and CIVs. In the third quarter of 2023, as a result of the Sound Point Transaction and AHP Transaction, the Company deconsolidated all CLOs and CLO warehouses and certain funds. Therefore, beginning July 1, 2023, the Company’s cash flow statements no longer include all the operating, investing and financing cash flow activity of those deconsolidated CIVs. See Item 8, Financial Statements and Supplementary Data, Note 1, Business and Basis of Presentation, and Note 8, Financial Guaranty Variable Interest Entities and Consolidated Investment Vehicles, for additional information.
Summarized Consolidated Cash Flows | | | | | | | | | | | | | | | | | |
| | Year Ended December 31, |
| | 2024 | | 2023 | | 2022 |
| | (in millions) |
| Net cash flows provided by (used in) operating activities, excluding FG VIEs and CIVs operating cash flows | $ | (168) | | | $ | (108) | | | $ | (1,056) | |
| FG VIEs and CIVs operating cash flows | 215 | | | 569 | | | (1,423) | |
| Net cash flows provided by (used in) operating activities | 47 | | | 461 | | | (2,479) | |
| | | | | |
| Net cash flows provided by (used in) investing activities, excluding FG VIEs and CIVs investing cash flows | 797 | | | 365 | | | 1,618 | |
| FG VIEs and CIVs investing cash flows | (17) | | | (79) | | | 122 | |
| Net cash flows provided by (used in) investing activities | 780 | | | 286 | | | 1,740 | |
| | | | | |
| Net cash flows provided by (used in) financing activities, excluding FG VIEs and CIVs financing cash flows | | | | | |
| Dividends paid | (68) | | | (67) | | | (64) | |
| Repurchases of common shares | (502) | | | (199) | | | (500) | |
| Issuance of long-term debt, net of issuance costs | — | | | 345 | | | — | |
| Redemption of debt | — | | | (330) | | | — | |
| Other | (28) | | | (19) | | | (8) | |
| FG VIEs and CIVs financing cash flows | (385) | | | (400) | | | 1,184 | |
| Net cash flows provided by (used in) financing activities (1) | (983) | | | (670) | | | 612 | |
| | | | | |
| Effect of exchange rate changes, excluding FG VIEs and CIVs | (2) | | | 2 | | | (3) | |
| Effect of exchange rate changes for FG VIEs and CIVs | — | | | — | | | (5) | |
| Effect of exchange rate changes | (2) | | | 2 | | | (8) | |
| Increase (decrease) in cash and cash equivalents and restricted cash | (158) | | | 79 | | | (135) | |
| Cash and cash equivalents and restricted cash at beginning of period | 286 | | | 207 | | | 342 | |
| Cash and cash equivalents and restricted cash at the end of the period | $ | 128 | | | $ | 286 | | | $ | 207 | |
____________________
(1) Claims paid on consolidated FG VIEs are presented in the consolidated statements of cash flows as a component of paydowns on FG VIEs’ liabilities in financing activities as opposed to operating activities.
Cash flows from operating activities were inflows of $47 million in 2024 and $461 million in 2023. The decrease in cash inflows during 2024 was primarily due to a $457 million decrease in net cash flows from CIVs, most of which were deconsolidated in 2023 as a result of the Sound Point Transaction, an $86 million increase in tax payments, a $56 million increase in net claim payments, which were partially offset by a $93 million increase in premiums received, a $40 million increase in return on capital from equity method investees, and Sound Point Transaction and AHP Transaction expenses in 2023.
Investing activities primarily consisted of net sales (purchases) of fixed-maturity securities and short-term investments, and paydowns on and sales of FG VIEs’ assets. The increase in investing cash inflows in 2024 compared with 2023 was mainly attributable to net purchases of short-term and fixed-maturity securities in 2023, higher sales of CVIs in 2024 and lower net sales of fixed-maturity securities in 2024. Investing inflows in both periods were used to fund claim payments and share repurchases. See Item 8, Financial Statements and Supplementary Data, Note 4, Expected Loss to be Paid (Recovered), for additional information.
Financing activities primarily consist of (i) AGL share repurchases and dividends, (ii) paydowns of FG VIEs’ liabilities, and (iii) until July 1, 2023, CLO issuances and CLO warehouse financing activities. In 2024, FG VIEs’ financing cash flows were $375 million, which primarily related to the paydown of Puerto Rico Trust liabilities. The CIVs’ financing cash flows in 2023 included repayments of CLO warehouse financing debt of $166 million and distributions from noncontrolling interests to CIVs. See Item 8, Financial Statements and Supplementary Data, Note 8, Financial Guaranty Variable Interest Entities and Consolidated Investment Vehicles.
From January 1, 2025 through February 27, 2025, the Company repurchased an additional 829 thousand common shares. As of February 27, 2025, the Company was authorized to purchase approximately $276 million of its common shares. For more information about the Company’s share repurchases and authorizations, see Item 8, Financial Statements and Supplementary Data, Note 18, Shareholders’ Equity.
ITEM 7A. QUANTITATIVE AND QUALITATIVE DISCLOSURES ABOUT MARKET RISK
Market risk is the risk of loss due to factors that affect the overall performance of the financial markets or movements in market prices. The Company’s primary market risk exposures include interest rate risk, foreign currency exchange rate risk and credit spread risk. Interest rate risk is the risk that financial instruments’ values will change due to changes in the level of interest rates, in the spread between two rates, in the shape of the yield curve or in any other interest rate relationship. The Company is primarily affected by market risk in the following areas.
•New business production is sensitive to changes in interest rates and credit spreads.
•Expected loss to be paid (recovered) is sensitive to changes in interest rates.
•The fair value of the investment portfolio is primarily driven by changes in interest rates and also affected by changes in credit spreads.
•The fair value of the investment portfolio contains non-U.S. dollar denominated securities whose value also fluctuates based on changes in foreign exchange rates. The carrying value of premiums receivable includes foreign denominated receivables whose values fluctuate based on changes in foreign exchange rates.
•The fair value of credit derivatives within the financial guaranty portfolio of insured obligations is sensitive to changes in credit spreads of the underlying obligations and the Company’s own credit spreads.
•The fair value of the assets and liabilities of consolidated FG VIEs may fluctuate based on changes in prepayments, spreads, default rates, interest rates and house prices. The fair value of the FG VIEs’ liabilities also fluctuates based on changes in the Company’s credit spread.
Sensitivity of New Business Production to Changes in Interest Rates and Credit Spreads
Fluctuations in interest rates and credit spreads also affect the demand for the Company’s product. When interest rates are lower or when the market is otherwise relatively less risk averse, the spread between insured and uninsured obligations typically narrows and, as a result, financial guaranty insurance typically provides lower cost savings to issuers than it would during periods of relatively wider spreads. These lower cost savings generally lead to a corresponding decrease in demand and premiums obtainable for financial guaranty insurance. In addition, increases in prevailing interest rate levels can lead to a decreased volume of capital markets activity and, correspondingly, a decreased volume of insured transactions. See Item 7, Management’s Discussion and Analysis of Financial Condition and Results of Operations, Results of Operations — Insurance Segment — New Business Production, for additional information.
Sensitivity of Expected Loss to be Paid (Recovered) to Interest Rates
Expected losses to be paid (recovered), and therefore loss reserves and loss and LAE, are sensitive to changes in interest rates in several ways. First, expected losses to be paid are discounted at the end of each reporting period at the risk-free rate, such that an increase in discount rates has the effect of reducing net expected loss to be paid or reducing net expected recoverables. The effect of changes in discount rates on expected losses to be paid was a loss of $4 million in 2024, a loss of $3 million in 2023 and a gain of $115 million in 2022. The gain related to changes in discount rates was highest in 2022 as interest rates rose from historically low levels during 2022.
Some of the Company’s expected losses to be paid (recovered) relate to insured obligations with variable interest rates.
Fluctuations in interest rates impact the performance of insured transactions where there are differences between the interest rates on the underlying collateral and the interest rates on the insured securities. For example, a rise in interest rates could increase the amount of losses the Company projects for certain RMBS and student loan transactions. The impact of fluctuations in interest rates on such transactions varies, depending on, among other things, the interest rates on the underlying collateral and insured securities, the relative amounts of underlying collateral and liabilities, the structure of the transaction and the sensitivity to interest rates of the behavior of the underlying borrowers and the value of the underlying assets.
In the case of RMBS, fluctuations in interest rates impact the amount of periodic excess spread, which is created when a trust’s underlying collateral produce interest that exceeds the amount required to pay interest on the insured notes. There are several RMBS transactions in the Company’s insured portfolio which benefit from excess spread either by using it to cover losses in a particular period or to reimburse past claims under the Company’s policies. As of December 31, 2024, the Company projects that the maximum potential excess spread at risk in the U.S. RMBS transactions is approximately $4 million.
Since RMBS excess spread is determined by the relationship between interest rates on the underlying collateral and of the trust’s certificates, it can be affected by unmatched moves in either of these interest rates. For example, modifications to underlying mortgage rates (e.g., rate reductions for troubled borrowers) can reduce excess spread when an upswing in short-term rates that increases the trust’s certificate interest rate is not met with equal increases to the interest rates on the underlying mortgages. These potential reductions in excess spread are often mitigated by an interest rate cap, which goes into effect once the collateral rate falls below the stated certificate rate. Interest due on most of the RMBS transactions the Company insures is capped at the collateral rate. The Company is not obligated to pay additional claims when the collateral interest rate drops below the trust's certificate stated interest rate, rather this just causes the Company to lose the benefit of potential positive excess spread. Additionally, faster than expected prepayments can decrease the dollar amount of excess spread and therefore reduce the cash flow available to cover losses or reimburse past claims. Interest rates can also have indirect effects on the underlying performance or value of collateral backing an obligation. Higher interest rates can lead to slower prepayments of debt, and can cause market prices of financed assets to decline. Conversely, lower interest rates can lead to faster prepayment and higher potential recovery values.
In addition, the value of expected recoveries that are in the form of bonds or other securities (which are sensitive to changes in interest rates) also affects the net expected loss to be paid (recovered). See Item 8, Financial Statements and Supplementary Data, Note 3, Outstanding Exposure and Note 4, Expected Loss to be Paid (Recovered).
Sensitivity of Investment Portfolio to Interest Rate Risk
The Company is exposed to interest rate risk in its investment portfolio. As interest rates rise for an available-for-sale investment portfolio, the fair value of fixed-maturity securities generally decreases; as interest rates fall for an available-for-sale portfolio, the fair value of fixed-maturity securities generally increases. The Company’s policy is generally to hold assets in the investment portfolio to maturity. Therefore, barring a default, interest rate movements do not result in realized gains or losses unless securities are sold prior to maturity. The Company does not hedge interest rate risk; instead, interest rate fluctuation risk is managed through the investment guidelines which limit duration and prohibit investment in historically high volatility sectors.
Interest rate sensitivity in the investment portfolio can be estimated by projecting a hypothetical instantaneous increase or decrease in interest rates. The following table presents the estimated pre-tax change in fair value of the Company’s fixed-maturity securities and short-term investments from instantaneous parallel shifts in interest rates.
Increase (Decrease) in Fair Value (Pre-Tax)
of Fixed-Maturity Securities and Short-Term Investments
from Changes in Interest Rates (1)
| | | | | | | | | | | |
| As of December 31, |
| 2024 | | 2023 |
| (in millions) |
| Decrease of 300 bps | $ | 875 | | | $ | 804 | |
| Decrease of 200 bps | 572 | | | 547 | |
| Decrease of 100 bps | 281 | | | 267 | |
| Increase of 100 bps | (275) | | | (261) | |
| Increase of 200 bps | (546) | | | (520) | |
| Increase of 300 bps | (804) | | | (774) | |
____________________
(1) Sensitivity analysis assumes a floor of zero for interest rates.
See Part II, Item 8, Financial Statements and Supplementary Data, Note 7, Investments and Cash, for additional information.
Sensitivity to Foreign Exchange Rate Risk
Foreign exchange risk is the risk that a financial instrument’s value will change due to a change in the foreign currency exchange rates. The Company has foreign denominated securities in its investment portfolio as well as foreign denominated premium receivables. The Company’s material exposure is to changes in U.S. dollar/pound sterling and U.S. dollar/euro exchange rates. Securities denominated in currencies other than U.S. dollar were 8.9% and 9.1% of the fixed-maturity securities and short-term investments as of December 31, 2024 and 2023, respectively. Changes in fair value of available-for-sale investments attributable to changes in foreign exchange rates are recorded in other comprehensive income. Approximately 69% and 70% of installment premiums at December 31, 2024 and December 31, 2023, respectively, are denominated in currencies other than the U.S. dollar, primarily the pound sterling and euro. Changes in premiums receivable attributable to changes in foreign exchange rates are reported in the consolidated statement of operations.
Increase (Decrease) in Carrying Value
of Fixed-Maturity Securities and Short-Term Investments and Premiums Receivable
from Changes in Foreign Exchange Rates
| | | | | | | | | | | | | | | | | | | | | | | |
| Fixed-Maturity Securities and Short-Term Investments | | Premium Receivable, net of Reinsurance and Commissions Payable |
| As of December 31, | | As of December 31, |
| 2024 | | 2023 | | 2024 | | 2023 |
| (in millions) |
| Decrease of 30% | $ | (207) | | | $ | (227) | | | $ | (319) | | | $ | (305) | |
| Decrease of 20% | (138) | | | (151) | | | (213) | | | (204) | |
| Decrease of 10% | (69) | | | (76) | | | (106) | | | (102) | |
| Increase of 10% | 69 | | | 76 | | | 106 | | | 102 | |
| Increase of 20% | 138 | | | 151 | | | 213 | | | 204 | |
| Increase of 30% | 207 | | | 227 | | | 319 | | | 305 | |
See Part II, Item 8, Financial Statements and Supplementary Data, Note 7, Investments and Cash, and Note 5, Contracts Accounted for as Insurance, for additional information.
Sensitivity of Credit Derivatives to Changes in Credit Spreads
Fair value gains and losses on credit derivatives are sensitive to changes in credit spreads of the underlying obligations and the Company’s own credit spread. Market liquidity could also impact valuations of the underlying obligations. The Company considers the impact of its own credit risk, together with credit spreads on the exposures that it insured through CDS contracts, in determining their fair value.
The Company determines its own credit risk based on quoted CDS prices traded on AG at each balance sheet date. The quoted price of five-year CDS contracts traded on AG at December 31, 2024 and December 31, 2023 was 75 bps and 66 bps, respectively.
The impact of changes in credit spreads will vary based upon the volume, tenor, interest rates and other market conditions at the time these fair values are determined. In addition, since each transaction has unique collateral and structural terms, the underlying change in fair value of each transaction may vary considerably. An overall narrowing of spreads generally results in a fair value gain on credit derivatives for the Company, and an overall widening of spreads generally results in a fair value loss for the Company.
The fair value of credit derivative contracts also reflects the change in the Company’s own credit cost, based on the price to purchase credit protection on AG. Historically, the price of CDS traded on AG typically moved directionally the same as general market spreads, although this may not always be the case. In certain circumstances, due to the fact that spread movements are not perfectly correlated, the narrowing or widening of the price of CDS traded on AG can have a more significant financial statement impact than the changes in credit spread of risks it insures.
In the Company’s valuation model, the premium the Company captures is not permitted to go below the minimum rate that the Company would currently charge to assume similar risks. This assumption can have the effect of mitigating the amount of fair value gains that are recognized on certain CDS contracts. The minimum premium assumption had no effect on the fair
value of CDS contracts as of December 31, 2024 or December 31, 2023. The percentage of transactions that price using the minimum premium fluctuates due to changes in AG’s credit spreads. In general, when AG’s credit spreads narrow, the cost to hedge AG’s name declines and more transactions price above previously established floor levels. Meanwhile, when AG’s credit spreads widen, the cost to hedge AG’s name increases causing more transactions to price at established floor levels.
The following table summarizes the estimated change in fair values on the net balance of the Company’s credit derivative positions assuming an immediate shift in the net spreads assumed by the Company. The net spread includes the spread of the underlying collateral and the credit spreads on AG.
Effect of Changes in Credit Spread on Credit Derivatives
| | | | | | | | | | | | | | | | | | | | | | | | | | |
| | As of December 31, 2024 | | As of December 31, 2023 |
| Credit Spreads | | Estimated Net
Fair Value
(Pre-Tax) | | Estimated Change
in Gain/(Loss)
(Pre-Tax) | | Estimated Net
Fair Value
(Pre-Tax) | | Estimated Change
in Gain/(Loss)
(Pre-Tax) |
| (in millions) |
| Increase of 25 bps | $ | (92) | | | $ | (63) | | | $ | (115) | | | $ | (65) | |
| Base Scenario | (29) | | | — | | | (50) | | | — | |
| Decrease of 25 bps | (14) | | | 15 | | | (29) | | | 21 | |
| All transactions priced at floor | (12) | | | 17 | | | (12) | | | 38 | |
See Part II, Item 8, Financial Statements and Supplementary Data, Note 6, Contracts Accounted for as Credit Derivatives, for additional information.
Sensitivity of FG VIEs’ Assets and Liabilities to Market Risk
The fair value of the Company’s FG VIEs’ assets is generally sensitive to changes related to estimated prepayment speeds; estimated default rates (determined on the basis of an analysis of collateral attributes such as: historical collateral performance, borrower profiles and other features relevant to the evaluation of collateral credit quality); yields implied by market prices for similar securities; and house price depreciation/appreciation rates based on macroeconomic forecasts. Significant changes to some of these inputs could materially change the fair value of the FG VIEs’ assets and the implied collateral losses within the transaction. In general, the fair value of the FG VIEs’ assets is most sensitive to changes in the projected collateral losses, where an increase in collateral losses typically leads to a decrease in the fair value of FG VIEs’ assets, while a decrease in collateral losses typically leads to an increase in the fair value of FG VIEs’ assets. The third-party pricing provider utilizes an internal model to determine an appropriate yield at which to discount the cash flows of the security, by factoring in collateral types, weighted average lives and other structural attributes specific to the security being priced. The expected yield is further calibrated by utilizing algorithms designed to aggregate market color, received by the independent third party, on comparable bonds.
The models to price the FG VIEs’ liabilities used, where appropriate, the same inputs used in determining fair value of FG VIEs’ assets and, for those liabilities insured by the Company, the benefit from the Company's insurance policy guaranteeing the timely payment of principal and interest, taking into account the Company’s own credit risk.
Significant changes to certain of the inputs described above could materially change the timing of expected losses within the insured transaction which is a significant factor in determining the implied benefit from the Company’s insurance policy guaranteeing the timely payment of principal and interest for the tranches of debt issued by the FG VIEs that is insured by the Company. In general, extending the timing of expected loss payments by the Company into the future typically leads to a decrease in the value of the Company’s insurance and a decrease in the fair value of the Company’s FG VIEs’ liabilities with recourse, while a shortening of the timing of expected loss payments by the Company typically leads to an increase in the value of the Company’s insurance and an increase in the fair value of the Company’s FG VIEs’ liabilities with recourse.
See Part II, Item 8, Financial Statements and Supplementary Data, Note 8, Financial Guaranty Variable Interest Entities and Consolidated Investment Vehicles, for additional information.
Item 8. FINANCIAL STATEMENTS AND SUPPLEMENTARY DATA
Report of Independent Registered Public Accounting Firm
To the Board of Directors and Shareholders of Assured Guaranty Ltd.
Opinions on the Financial Statements and Internal Control over Financial Reporting
We have audited the accompanying consolidated balance sheets of Assured Guaranty Ltd. and its subsidiaries (the “Company”) as of December 31, 2024 and 2023, and the related consolidated statements of operations, of comprehensive income (loss), of shareholders’ equity and of cash flows for each of the three years in the period ended December 31, 2024, including the related notes (collectively referred to as the “consolidated financial statements”). We also have audited the Company’s internal control over financial reporting as of December 31, 2024, based on criteria established in Internal Control - Integrated Framework (2013) issued by the Committee of Sponsoring Organizations of the Treadway Commission (COSO).
In our opinion, the consolidated financial statements referred to above present fairly, in all material respects, the financial position of the Company as of December 31, 2024 and 2023, and the results of its operations and its cash flows for each of the three years in the period ended December 31, 2024 in conformity with accounting principles generally accepted in the United States of America. Also in our opinion, the Company maintained, in all material respects, effective internal control over financial reporting as of December 31, 2024, based on criteria established in Internal Control - Integrated Framework (2013) issued by the COSO.
Basis for Opinions
The Company’s management is responsible for these consolidated financial statements, for maintaining effective internal control over financial reporting, and for its assessment of the effectiveness of internal control over financial reporting, included in Management’s Annual Report on Internal Control over Financial Reporting appearing under Item 9A. Our responsibility is to express opinions on the Company’s consolidated financial statements and on the Company’s internal control over financial reporting based on our audits. We are a public accounting firm registered with the Public Company Accounting Oversight Board (United States) (PCAOB) and are required to be independent with respect to the Company in accordance with the U.S. federal securities laws and the applicable rules and regulations of the Securities and Exchange Commission and the PCAOB.
We conducted our audits in accordance with the standards of the PCAOB. Those standards require that we plan and perform the audits to obtain reasonable assurance about whether the consolidated financial statements are free of material misstatement, whether due to error or fraud, and whether effective internal control over financial reporting was maintained in all material respects.
Our audits of the consolidated financial statements included performing procedures to assess the risks of material misstatement of the consolidated financial statements, whether due to error or fraud, and performing procedures that respond to those risks. Such procedures included examining, on a test basis, evidence regarding the amounts and disclosures in the consolidated financial statements. Our audits also included evaluating the accounting principles used and significant estimates made by management, as well as evaluating the overall presentation of the consolidated financial statements. Our audit of internal control over financial reporting included obtaining an understanding of internal control over financial reporting, assessing the risk that a material weakness exists, and testing and evaluating the design and operating effectiveness of internal control based on the assessed risk. Our audits also included performing such other procedures as we considered necessary in the circumstances. We believe that our audits provide a reasonable basis for our opinions.
Definition and Limitations of Internal Control over Financial Reporting
A company’s internal control over financial reporting is a process designed to provide reasonable assurance regarding the reliability of financial reporting and the preparation of financial statements for external purposes in accordance with generally accepted accounting principles. A company’s internal control over financial reporting includes those policies and procedures that (i) pertain to the maintenance of records that, in reasonable detail, accurately and fairly reflect the transactions and dispositions of the assets of the company; (ii) provide reasonable assurance that transactions are recorded as necessary to permit preparation of financial statements in accordance with generally accepted accounting principles, and that receipts and expenditures of the company are being made only in accordance with authorizations of management and directors of the company; and (iii) provide reasonable assurance regarding prevention or timely detection of unauthorized acquisition, use, or disposition of the company’s assets that could have a material effect on the financial statements.
Because of its inherent limitations, internal control over financial reporting may not prevent or detect misstatements. Also, projections of any evaluation of effectiveness to future periods are subject to the risk that controls may become inadequate because of changes in conditions, or that the degree of compliance with the policies or procedures may deteriorate.
Critical Audit Matter
The critical audit matter communicated below is a matter arising from the current period audit of the consolidated financial statements that was communicated or required to be communicated to the audit committee and that (i) relates to accounts or disclosures that are material to the consolidated financial statements and (ii) involved our especially challenging, subjective, or complex judgments. The communication of critical audit matters does not alter in any way our opinion on the consolidated financial statements, taken as a whole, and we are not, by communicating the critical audit matter below, providing a separate opinion on the critical audit matter or on the accounts or disclosures to which it relates.
Valuation of the Loss and Loss Adjustment Expense (LAE) Reserve and the Salvage and Subrogation Recoverable - Estimation of the Expected Loss to be Paid (Recovered) Related to Public Finance Obligations
As described in Notes 4 and 5 to the consolidated financial statements, the loss and LAE reserve and the salvage and subrogation recoverable reported on the consolidated balance sheet relate only to direct and assumed reinsurance contracts that are accounted for as insurance, substantially all of which are financial guaranty insurance contracts. As of December 31, 2024, the loss and LAE reserve was $268 million and the salvage and subrogation recoverable was $396 million, for which a significant portion of such amounts relate to public finance obligations. A loss and LAE reserve for a financial guaranty insurance contract is recorded only to the extent, and for the amount, that expected loss to be paid plus contra-paid (total losses) exceed the deferred premium revenue, on a contract by contract basis. The expected loss to be paid (recovered) is equal to the present value of expected future cash outflows for loss and LAE payments, and net of inflows for expected salvage and subrogation, using current risk-free rates. If a transaction is in a net recovery position, this results in the recording of a salvage and subrogation recoverable. Expected cash outflows and inflows are probability weighted cash flows that reflect management's assumptions about the likelihood of all possible outcomes based on all information available to management. The determination of expected loss to be paid (recovered) is a subjective process involving numerous estimates, assumptions and judgments relating to internal credit ratings, timing of cash flows, recovery rates, and probability weightings, as used in the respective cash flow models used by management.
The principal considerations for our determination that performing procedures relating to the valuation of the loss and LAE reserve and the salvage and subrogation recoverable – estimation of the expected loss to be paid (recovered) related to public finance obligations is a critical audit matter are (i) the significant judgment by management when developing the estimate of the loss and LAE reserve and the salvage and subrogation recoverable – estimation of the expected loss to be paid (recovered) related to public finance obligations, (ii) a high degree of auditor judgment, subjectivity, and effort in performing procedures and evaluating management's significant assumptions related to internal credit ratings, timing of cash flows, recovery rates, and probability weightings; and (iii) the audit effort included the involvement of professionals with specialized skill and knowledge.
Addressing the matter involved performing procedures and evaluating audit evidence in connection with forming our overall opinion on the consolidated financial statements. These procedures included testing the effectiveness of controls relating to the valuation of the loss and LAE reserve and the salvage and subrogation recoverable – estimation of the expected loss to be paid (recovered) related to public finance obligations. These procedures also included, among others, (i) testing management’s process for developing the estimate of the loss and LAE reserve and the salvage and subrogation recoverable, (ii) evaluating the appropriateness of the cash flow models used by management, (iii) testing the completeness and accuracy of the underlying data used in the cash flow models, and (iv) evaluating the reasonableness of the significant assumptions used by management related to internal credit ratings, timing of cash flows, recovery rates, and probability weightings. Evaluating management’s assumptions related to internal credit ratings, timing of cash flows, recovery rates, and probability weightings involved evaluating whether the assumptions used by management were reasonable, as considered applicable to the individual public finance obligation, considering (i) the current, past, or anticipated future performance of the obligor, and (ii) the consistency with external market and industry data. Professionals with specialized skill and knowledge were used to assist in evaluating the reasonableness of the significant assumptions related to timing of cash flows, recovery rates, and probability weightings for certain public finance obligations.
/s/ PricewaterhouseCoopers LLP
New York, New York
February 28, 2025
We have served as the Company’s auditor since 2003.
Assured Guaranty Ltd.
Consolidated Balance Sheets
(dollars in millions except share data)
| | | | | | | | | | | |
| As of December 31, |
| | 2024 | | 2023 |
| Assets | | | |
| Investments: | | | |
| Fixed-maturity securities, available-for-sale, at fair value, net of allowance for credit loss of $60 and $77 (amortized cost of $6,827 and $6,746) | $ | 6,369 | | | $ | 6,307 | |
| Fixed-maturity securities, trading, at fair value | 147 | | | 318 | |
| Short-term investments, at fair value | 1,221 | | | 1,661 | |
| Other invested assets (includes $4 and $3, at fair value) | 926 | | | 829 | |
| Total investments | 8,663 | | | 9,115 | |
| Cash | 121 | | | 97 | |
| Premiums receivable, net of commissions payable | 1,551 | | | 1,468 | |
| Deferred acquisition costs | 176 | | | 161 | |
| Salvage and subrogation recoverable | 396 | | | 298 | |
| Financial guaranty variable interest entities’ assets (includes $147 and $174, at fair value) | 147 | | | 328 | |
| Assets of consolidated investment vehicles (includes $99 and $331, at fair value) | 101 | | | 366 | |
| Other assets (includes $131 and $123, at fair value) | 746 | | | 706 | |
| Total assets | $ | 11,901 | | | $ | 12,539 | |
| Liabilities | | | |
| Unearned premium reserve | $ | 3,719 | | | $ | 3,658 | |
| Loss and loss adjustment expense reserve | 268 | | | 376 | |
| Long-term debt | 1,699 | | | 1,694 | |
| Financial guaranty variable interest entities’ liabilities, at fair value (with recourse $155 and $543, without recourse $9 and $11) | 164 | | | 554 | |
| Other liabilities (includes $34 and $53 at fair value) | 498 | | | 492 | |
| Total liabilities | 6,348 | | | 6,774 | |
| Commitments and contingencies (Notes 3, 4, 7, 17) | | | |
| Shareholders’ equity | | | |
| Common shares ($0.01 par value, 500,000,000 shares authorized; 50,505,320 and 56,217,305 shares issued and outstanding) | 1 | | | 1 | |
| Retained earnings | 5,878 | | | 6,070 | |
| Accumulated other comprehensive income (loss), net of tax of $(75) and $(67) | (385) | | | (359) | |
| Deferred equity compensation | 1 | | | 1 | |
| Total shareholders’ equity attributable to Assured Guaranty Ltd. | 5,495 | | | 5,713 | |
| Nonredeemable noncontrolling interests (Note 8) | 58 | | | 52 | |
| Total shareholders’ equity | 5,553 | | | 5,765 | |
| Total liabilities and shareholders’ equity | $ | 11,901 | | | $ | 12,539 | |
The accompanying notes are an integral part of these consolidated financial statements.
Assured Guaranty Ltd.
Consolidated Statements of Operations
(dollars in millions except share data)
| | | | | | | | | | | | | | | | | |
| | Year Ended December 31, |
| | 2024 | | 2023 | | 2022 |
| Revenues | | | | | |
| Net earned premiums | $ | 403 | | | $ | 344 | | | $ | 494 | |
| Net investment income | 340 | | | 365 | | | 269 | |
| Asset management fees | — | | | 53 | | | 93 | |
| Net realized investment gains (losses) | 9 | | | (14) | | | (56) | |
| Fair value gains (losses) on credit derivatives | 24 | | | 114 | | | (11) | |
| Fair value gains (losses) on committed capital securities | (10) | | | (35) | | | 24 | |
| Fair value gains (losses) on financial guaranty variable interest entities | (11) | | | 8 | | | 22 | |
| Fair value gains (losses) on consolidated investment vehicles | 69 | | | 88 | | | 17 | |
| Foreign exchange gains (losses) on remeasurement | (27) | | | 53 | | | (112) | |
| Fair value gains (losses) on trading securities | 52 | | | 74 | | | (34) | |
| Gain on sale of asset management subsidiaries | — | | | 262 | | | — | |
| Other income (loss) | 23 | | | 61 | | | 17 | |
| Total revenues | 872 | | | 1,373 | | | 723 | |
| Expenses | | | | | |
| Loss and loss adjustment expenses (benefit) | (26) | | | 162 | | | 16 | |
| Interest expense | 91 | | | 90 | | | 81 | |
| Amortization of deferred acquisition costs | 20 | | | 13 | | | 14 | |
| Employee compensation and benefit expenses | 202 | | | 251 | | | 258 | |
| Other operating expenses | 159 | | | 217 | | | 167 | |
| Total expenses | 446 | | | 733 | | | 536 | |
| Income (loss) before income taxes and equity in earnings (losses) of investees | 426 | | | 640 | | | 187 | |
| Equity in earnings (losses) of investees | 62 | | | 28 | | | (39) | |
| Income (loss) before income taxes | 488 | | | 668 | | | 148 | |
| Provision (benefit) for income taxes | | | | | |
| Current | 100 | | | 63 | | | 14 | |
| Deferred | (4) | | | (156) | | | (3) | |
| Total provision (benefit) for income taxes | 96 | | | (93) | | | 11 | |
| Net income (loss) | 392 | | | 761 | | | 137 | |
| Less: Noncontrolling interests | 16 | | | 22 | | | 13 | |
| Net income (loss) attributable to Assured Guaranty Ltd. | $ | 376 | | | $ | 739 | | | $ | 124 | |
| | | | | |
| Earnings per share: | | | | | |
| Basic | $ | 7.01 | | | $ | 12.54 | | | $ | 1.95 | |
| Diluted | $ | 6.87 | | | $ | 12.30 | | | $ | 1.92 | |
The accompanying notes are an integral part of these consolidated financial statements.
Assured Guaranty Ltd.
Consolidated Statements of Comprehensive Income (Loss)
(in millions)
| | | | | | | | | | | | | | | | | |
| | Year Ended December 31, |
| | 2024 | | 2023 | | 2022 |
| Net income (loss) | $ | 392 | | | $ | 761 | | | $ | 137 | |
| Change in net unrealized gains (losses) on: | | | | | |
| Investments with no credit impairment, net of tax provision (benefit) of $(10), $14 and $(121) | (33) | | | 141 | | | (718) | |
| Investments with credit impairment, net of tax provision (benefit) of $1, $1 and $(20) | 5 | | | 6 | | | (86) | |
| Change in net unrealized gains (losses) on investments | (28) | | | 147 | | | (804) | |
| Change in instrument-specific credit risk on financial guaranty variable interest entities’ liabilities with recourse, net of tax provision (benefit) | 2 | | | 3 | | | (2) | |
| Other, net of tax provision (benefit) | — | | | 6 | | | (9) | |
| Other comprehensive income (loss) | (26) | | | 156 | | | (815) | |
| Comprehensive income (loss) | 366 | | | 917 | | | (678) | |
| Less: Comprehensive income (loss) attributable to noncontrolling interests | 16 | | | 22 | | | 13 | |
| Comprehensive income (loss) attributable to Assured Guaranty Ltd. | $ | 350 | | | $ | 895 | | | $ | (691) | |
The accompanying notes are an integral part of these consolidated financial statements.
Assured Guaranty Ltd.
Consolidated Statements of Shareholders’ Equity
(dollars in millions, except share data)
| | | | | | | | | | | | | | | | | | | | | | | | | | | | | | | | | | | | | | | | | | | | | | | | | | |
| | Common Shares Outstanding | | | Total Shareholders’ Equity Attributable to Assured Guaranty Ltd. | | Nonredeemable Noncontrolling Interests | | Total
Shareholders’ Equity |
| | Common Shares Par Value | | Retained Earnings | | Accumulated
Other
Comprehensive Income (Loss) | | Deferred
Equity Compensation | | Total | |
| As of December 31, 2021 | 67,518,424 | | | | $ | 1 | | | $ | 5,990 | | | $ | 300 | | | $ | 1 | | | $ | 6,292 | | | $ | 186 | | | $ | 6,478 | |
| Net income | — | | | | — | | | 124 | | | — | | | — | | | 124 | | | 14 | | | 138 | |
| Dividends ($1.00 per share) | — | | | | — | | | (64) | | | — | | | — | | | (64) | | | — | | | (64) | |
| Common shares repurchases | (8,847,981) | | | | — | | | (503) | | | — | | | — | | | (503) | | | — | | | (503) | |
| Share-based compensation | 342,597 | | | | — | | | 30 | | | — | | | — | | | 30 | | | — | | | 30 | |
| Contributions | — | | | | — | | | — | | | — | | | — | | | — | | | 89 | | | 89 | |
| Distributions | — | | | | — | | | — | | | — | | | — | | | — | | | (61) | | | (61) | |
| Other comprehensive loss | — | | | | — | | | — | | | (815) | | | — | | | (815) | | | — | | | (815) | |
| As of December 31, 2022 | 59,013,040 | | | | 1 | | | 5,577 | | | (515) | | | 1 | | | 5,064 | | | 228 | | | 5,292 | |
| Net income | — | | | | — | | | 739 | | | — | | | — | | | 739 | | | 22 | | | 761 | |
| Dividends ($1.12 per share) | — | | | | — | | | (68) | | | — | | | — | | | (68) | | | — | | | (68) | |
| Common shares repurchases | (3,215,893) | | | | — | | | (199) | | | — | | | — | | | (199) | | | — | | | (199) | |
| Share-based compensation | 420,158 | | | | — | | | 21 | | | — | | | — | | | 21 | | | — | | | 21 | |
| Reclassification to liabilities | — | | | | — | | | — | | | — | | | — | | | — | | | (16) | | | (16) | |
| Contributions | — | | | | — | | | — | | | — | | | — | | | — | | | 20 | | | 20 | |
| Distributions | — | | | | — | | | — | | | — | | | — | | | — | | | (70) | | | (70) | |
| Other comprehensive income | — | | | | — | | | — | | | 156 | | | — | | | 156 | | | — | | | 156 | |
| Deconsolidation of investment vehicles | — | | | | — | | | — | | | — | | | — | | | — | | | (132) | | | (132) | |
| As of December 31, 2023 | 56,217,305 | | | | 1 | | | 6,070 | | | (359) | | | 1 | | | 5,713 | | | 52 | | | 5,765 | |
| Net income | — | | | | — | | | 376 | | | — | | | — | | | 376 | | | 16 | | | 392 | |
| Dividends ($1.24 per share) | — | | | | — | | | (68) | | | — | | | — | | | (68) | | | — | | | (68) | |
| Common shares repurchases | (6,180,774) | | | | — | | | (508) | | | — | | | — | | | (508) | | | — | | | (508) | |
| Share-based compensation | 468,789 | | | | — | | | 8 | | | — | | | — | | | 8 | | | — | | | 8 | |
| Distributions | — | | | | — | | | — | | | — | | | — | | | — | | | (10) | | | (10) | |
| Other comprehensive loss | — | | | | — | | | — | | | (26) | | | — | | | (26) | | | — | | | (26) | |
| As of December 31, 2024 | 50,505,320 | | | | $ | 1 | | | $ | 5,878 | | | $ | (385) | | | $ | 1 | | | $ | 5,495 | | | $ | 58 | | | $ | 5,553 | |
The accompanying notes are an integral part of these consolidated financial statements.
Assured Guaranty Ltd.
Consolidated Statements of Cash Flows
(in millions)
| | | | | | | | | | | | | | | | | |
| | Year Ended December 31, |
| | 2024 | | 2023 | | 2022 |
| Cash flows from operating activities: | | | | | |
| Net income (loss) | $ | 392 | | | $ | 761 | | | $ | 137 | |
| Adjustments to reconcile net income to net cash flows provided by operating activities: | | | | | |
| Non-cash interest and operating expenses | 66 | | | 58 | | | 65 | |
| Net amortization of premium (discount) on investments | (23) | | | (37) | | | 5 | |
| Provision (benefit) for deferred income taxes | (4) | | | (156) | | | (3) | |
| Net realized investment losses (gains) | (9) | | | 14 | | | 56 | |
| Equity in (earnings) losses of investees | (62) | | | (28) | | | 39 | |
| Fair value losses (gains) on committed capital securities | 10 | | | 35 | | | (24) | |
| Fair value losses (gains) on trading securities | (52) | | | (74) | | | 34 | |
| Gain on sale of asset management subsidiaries | — | | | (262) | | | — | |
| Change in premiums receivable, net of premiums and commissions payable | (80) | | | (157) | | | 74 | |
| Change in unearned premium reserve, net | 62 | | | 26 | | | (93) | |
| Change in loss and loss adjustment expense reserve and salvage and subrogation recoverable, net | (202) | | | 35 | | | (1,207) | |
| Change in current income taxes | (6) | | | 72 | | | (106) | |
| Change in credit derivative assets and liabilities, net | (21) | | | (112) | | | 8 | |
| Distributions from equity method investments | 47 | | | 7 | | | 10 | |
| Other | (19) | | | (97) | | | (47) | |
| Cash flows from consolidated investment vehicles: | | | | | |
| Purchases of securities | (97) | | | (340) | | | (3,201) | |
| Sales of securities | 41 | | | 675 | | | 1,513 | |
| Maturities and paydowns of securities | — | | | 60 | | | 156 | |
| Proceeds from (purchases of) money market funds | — | | | 66 | | | 6 | |
| Purchases to cover securities sold short | — | | | — | | | (223) | |
| Proceeds from securities sold short | — | | | — | | | 188 | |
| Other changes in consolidated investment vehicles | 4 | | | (85) | | | 134 | |
| Net cash flows provided by (used in) operating activities | 47 | | | 461 | | | (2,479) | |
(continued)
The accompanying notes are an integral part of these consolidated financial statements.
Assured Guaranty Ltd.
Consolidated Statements of Cash Flows, Continued
(in millions)
| | | | | | | | | | | | | | | | | |
| Year Ended December 31, |
| 2024 | | 2023 | | 2022 |
| Cash flows from investing activities: | | | | | |
| Fixed-maturity securities, available for sale: | | | | | |
| Purchases | (1,354) | | | (540) | | | (371) | |
| Sales | 649 | | | 862 | | | 717 | |
| Maturities and paydowns | 853 | | | 746 | | | 682 | |
| Short-term investments with original maturities of over three months: | | | | | |
| Purchases | (1) | | | (16) | | | (63) | |
| Sales | — | | | 4 | | | — | |
| Maturities and paydowns | 5 | | | 36 | | | 36 | |
| Net sales (purchases) of short-term investments with original maturities of less than three months | 437 | | | (872) | | | 439 | |
| Sales of fixed-maturity securities, trading | 233 | | | — | | | 121 | |
| Maturities and paydowns of fixed-maturity securities, trading | 21 | | | 63 | | | 87 | |
| Purchases of and contributions to other invested assets | (119) | | | (198) | | | (25) | |
| Sales of and return of capital from other invested assets | 41 | | | 29 | | | 36 | |
| Paydowns on financial guaranty variable interest entities’ assets | 23 | | | 175 | | | 84 | |
| Other | (8) | | | (3) | | | (3) | |
| Net cash flows provided by (used in) investing activities | 780 | | | 286 | | | 1,740 | |
| | | | | |
| Cash flows from financing activities: | | | | | |
| Dividends paid | $ | (68) | | | $ | (67) | | | $ | (64) | |
| Repurchases of common shares | (502) | | | (199) | | | (500) | |
| Net paydowns of financial guaranty variable interest entities’ liabilities | (375) | | | (149) | | | (99) | |
| Issuance of long-term debt, net of issuance costs | — | | | 345 | | | — | |
| Redemptions and purchases of debt, including make-whole payment | — | | | (330) | | | (2) | |
| Payments related to tax withholding for share-based compensation | (30) | | | (20) | | | (14) | |
| Other | 2 | | | 1 | | | 8 | |
| Cash flows from consolidated investment vehicles: | | | | | |
| Proceeds from issuance of collateralized loan obligations | — | | | — | | | 1,372 | |
| Repayment of collateralized loan obligations | — | | | (1) | | | (373) | |
| Proceeds from issuance of warehouse financing debt | — | | | — | | | 991 | |
| Repayment of warehouse financing debt | — | | | (166) | | | (796) | |
| Contributions from noncontrolling interests to consolidated investment vehicles | — | | | — | | | 74 | |
| Distributions to noncontrolling interests from consolidated investment vehicles | (10) | | | (80) | | | (26) | |
| Borrowing (payment) under credit facility | — | | | (4) | | | 41 | |
| Net cash flows provided by (used in) financing activities | (983) | | | (670) | | | 612 | |
| Effect of foreign exchange rate changes | (2) | | | 2 | | | (8) | |
| Increase (decrease) in cash and cash equivalents and restricted cash | (158) | | | 79 | | | (135) | |
| Cash and cash equivalents and restricted cash at beginning of period | 286 | | | 207 | | | 342 | |
| Cash and cash equivalents and restricted cash at end of period | $ | 128 | | | $ | 286 | | | $ | 207 | |
(continued)
The accompanying notes are an integral part of these consolidated financial statements.
Assured Guaranty Ltd.
Consolidated Statements of Cash Flows, Continued
(in millions)
| | | | | | | | | | | | | | | | | |
| Year Ended December 31, |
| 2024 | | 2023 | | 2022 |
| Supplemental cash flow information | | | | | |
| Income taxes paid (received) | $ | 90 | | | $ | 4 | | | $ | 105 | |
| Interest paid on long-term debt | 88 | | | 77 | | | 77 | |
| | | | | |
| Supplemental disclosure of non-cash activities: | | | | | |
| Puerto Rico Salvage | | | | | |
| Fixed-maturity securities, available-for-sale, received as salvage | $ | — | | | $ | 1 | | | $ | 986 | |
| Fixed-maturity securities, available-for-sale, ceded to a reinsurer | — | | | — | | | 27 | |
| Fixed-maturity securities, trading, received as salvage | — | | | — | | | 549 | |
| Fixed-maturity securities, trading, ceded to a reinsurer | — | | | — | | | 6 | |
| Debt securities of financial guaranty variable interest entities received as salvage | — | | | — | | | 234 | |
| Contributions from noncontrolling interests | — | | | 20 | | | 36 | |
| Distributions to noncontrolling interests | — | | | 27 | | | 56 | |
| Sale of asset management subsidiaries (See Note 1) | | | | | |
| Assets acquired | — | | | 437 | | | — | |
| Assets transferred | — | | | 240 | | | — | |
| Liabilities transferred | — | | | 66 | | | — | |
| | | | | |
| As of December 31, |
| 2024 | | 2023 | | 2022 |
| Reconciliation of cash and cash equivalents and restricted cash to the consolidated balance sheets: | | | | | |
| Cash | $ | 121 | | | $ | 97 | | | $ | 107 | |
| Restricted cash (included in other assets) | 5 | | | — | | | 1 | |
| Cash of financial guaranty variable interest entities (see Note 8) | — | | | 154 | | | 2 | |
| Cash and cash equivalents of consolidated investment vehicles (see Note 8) | 2 | | | 35 | | | 97 | |
| Cash and cash equivalents and restricted cash at the end of period | $ | 128 | | | $ | 286 | | | $ | 207 | |
The accompanying notes are an integral part of these consolidated financial statements.
Assured Guaranty Ltd.
Notes to Consolidated Financial Statements
1.Business and Basis of Presentation
Business
Assured Guaranty Ltd. (AGL and, together with its subsidiaries, Assured Guaranty or the Company) is a Bermuda-based holding company that provides, through its wholly-owned operating subsidiaries, credit protection products to the United States (U.S.) and non-U.S. public finance (including infrastructure) and structured finance markets. Assured Guaranty also participates in the asset management business.
Insurance
Through its insurance subsidiaries, the Company applies its credit underwriting judgment, risk management skills and capital markets experience primarily to offer financial guaranty insurance that protects holders of debt instruments and other monetary obligations from defaults in scheduled payments. If an obligor defaults on a scheduled payment due on an obligation, including a scheduled principal or interest payment (collectively, debt service), the Company is required under its unconditional and irrevocable financial guaranty to pay the amount of the shortfall to the holder of the obligation. The Company markets its financial guaranty insurance directly to issuers and underwriters of public finance and structured finance securities as well as to investors in such obligations. The Company guarantees obligations issued principally in the U.S. and the United Kingdom (U.K.), and also guarantees obligations issued in other countries and regions, including Western Europe. The Company also provides specialty insurance and reinsurance on transactions with risk profiles similar to those of its structured finance exposures written in financial guaranty form. The Company’s principal insurance subsidiaries are:
•Assured Guaranty Inc. (AG), domiciled in Maryland and formerly known as Assured Guaranty Corp., and its insurance subsidiaries:
•Assured Guaranty UK Limited (AGUK), organized in the U.K.;
•Assured Guaranty (Europe) SA (AGE), organized in France;
•Assured Guaranty Re Ltd. (AG Re), domiciled in Bermuda, and its insurance subsidiary:
•Assured Guaranty Re Overseas Ltd. (AGRO), domiciled in Bermuda.
Effective August 1, 2024, Assured Guaranty Municipal Corp. (AGM) merged with and into AG, with AG as the surviving company. Prior to the merger, AGM was a principal insurance subsidiary of the Company. As a result of the merger, the Company wrote-off the $6 million carrying value of AGM’s insurance licenses in the third quarter of 2024, which was recorded in “other operating expenses” in the Insurance segment. In connection with the merger, the Maryland Insurance Administration (MIA) approved, and in the third quarter of 2024 AG implemented, the redemption of approximately $300 million of AG’s shares of common stock from its parent, Assured Guaranty Municipal Holdings Inc. (AGMH), in exchange for cash of $167 million and the remainder in alternative investments.
In May 2024, the New York State Department of Financial Services (NYDFS) approved, and AGM implemented, the redemption of approximately $100 million of AGM’s shares of common stock from its then parent, AGMH.
The Company designated certain assets and liabilities supporting the Insurance segment as held for sale in the first quarter of 2023. The held for sale assets and liabilities were $28 million (reported in “other assets”) and $3 million (reported in “other liabilities”), respectively, as of December 31, 2024.
Asset Management
Until July 1, 2023, the Company served as an investment adviser to primarily collateralized loan obligations (CLOs) and opportunity funds, through Assured Investment Management LLC (AssuredIM LLC) and its investment management affiliates (together with AssuredIM LLC, AssuredIM). Beginning July 1, 2023, the Company participates in the asset management business through its ownership interest in Sound Point Capital Management, LP (Sound Point, LP) and certain of its investment management affiliates (together with Sound Point, LP, Sound Point), as described below.
On July 1, 2023, Assured Guaranty contributed to Sound Point, LP most of its asset management business, other than that conducted by Assured Healthcare Partners LLC (AHP) (AssuredIM Contributed Business), as contemplated by the transaction agreement entered into with Sound Point on April 5, 2023 (Transaction Agreement). Assured Guaranty received, subject to certain potential post-closing adjustments, approximately 30% of the common interests in Sound Point, LP, and certain other interests in Sound Point.
Assured Guaranty Ltd.
Notes to Consolidated Financial Statements, Continued
In addition, in accordance with the terms of a letter agreement (Letter Agreement), effective July 1, 2023, AG (i) engaged Sound Point as its sole alternative credit manager, and (ii) transitioned to Sound Point the management of certain existing alternative investments and related commitments. The Letter Agreement also provides that, within the first two years of Sound Point’s engagement, AG, including through its investment subsidiary AG Asset Strategies LLC (AGAS), would, subject to regulatory approval, cure terms and other terms of the Letter Agreement, make new investments in funds, other vehicles and separately managed accounts managed by Sound Point which, when aggregated with the alternative investments and commitments transitioned from AssuredIM and any reinvestments (collectively, Sound Point Investments), and investments made by other Assured Guaranty affiliates, will total $1 billion. The Letter Agreement contemplates a long-term investment partnership between Sound Point and Assured Guaranty, whereby AG has agreed to reinvest all returns of capital from Sound Point Investments for a period of 15 years, until July 1, 2038. Similarly, the Letter Agreement provides that AG will reinvest all gains and dividends from Sound Point Investments for the first two years of Sound Point’s engagement, and reinvest half of all such gains and dividends thereafter until July 1, 2033 (the transactions contemplated under the Transaction Agreement and the Letter Agreement, the Sound Point Transaction). On July 1, 2028, AG may choose to reduce the amounts invested or required to be reinvested in certain Sound Point Investments under the Letter Agreement, subject to adjustment of Assured Guaranty’s portion of its ownership interest in Sound Point. To the extent not required to be reinvested by the Letter Agreement, all proceeds from Sound Point Investments received in accordance with their operative investment documents can be distributed to AG. See Note 7, Investments and Cash.
In July 2023, Assured Guaranty sold all of its equity interests in AHP, which manages healthcare funds, to an entity owned and controlled by the managing partner of AHP (AHP Transaction). In connection with the AHP Transaction, the Company agreed to remain a strategic investor in certain AHP managed funds, retain its portion of carried interest in certain AHP managed funds, and receive other consideration.
Upon closing of the Sound Point Transaction and the AHP Transaction, the Company deconsolidated most of the corresponding AssuredIM entities (which had previously been classified as held-for-sale) and reported an ownership interest in Sound Point that is accounted for under the equity method. In connection with the Sound Point Transaction and AHP Transaction, the Company reevaluated its consolidation conclusion for each consolidated investment vehicle (CIV) and deconsolidated all but three CIVs. See Note 8, Financial Guaranty Variable Interest Entities and Consolidated Investment Vehicles. After the Sound Point Transaction and AHP Transaction, the Company continues to consolidate the general partner of a fund that Sound Point now manages and reports any performance fees in “other income.”
The following table presents the calculation of the gain associated with the Sound Point Transaction and AHP Transaction in 2023.
Gain on Sound Point Transaction and AHP Transaction
| | | | | |
| | (in millions) |
| Fair value of ownership interest in Sound Point | $ | 425 | |
| Fair value of other consideration (1) | 25 | |
| Total consideration | 450 | |
| Less net asset carrying value of transferred AssuredIM subsidiaries (2) | 188 | |
| Gain on sale of asset management subsidiaries (3) | $ | 262 | |
____________________
(1) Included $13 million of cash and a receivable reported in other assets of $12 million.
(2) Included goodwill and intangible assets of $155 million.
(3) Consisted of a $255 million gain on the Sound Point Transaction and a $7 million gain on the AHP Transaction, which were both reported in the Corporate division (as described in Note 2, Segment Information).
The Company recognized expenses of $46 million during 2023 associated with the Sound Point Transaction and AHP Transaction.
U.S. Holding Companies
AGL directly or indirectly owns several holding companies, two of which - Assured Guaranty US Holdings Inc. (AGUS) and AGMH (collectively, the U.S. Holding Companies) - have public debt outstanding.
Assured Guaranty Ltd.
Notes to Consolidated Financial Statements, Continued
Basis of Presentation
The consolidated financial statements have been prepared in conformity with accounting principles generally accepted in the United States of America (GAAP). In management’s opinion, all material adjustments necessary for a fair statement of the financial condition, results of operations and cash flows of the Company, including its consolidated variable interest entities (VIEs), are reflected in the periods presented and are of a normal, recurring nature. The preparation of financial statements in conformity with GAAP requires management to make estimates and assumptions that affect the reported amounts of assets and liabilities and disclosure of contingent assets and liabilities as of the date of the financial statements, and the reported amounts of revenues and expenses during the reporting period. Actual results could differ from those estimates. Certain prior year balances have been reclassified to conform to the current year’s presentation.
The consolidated financial statements include the accounts of AGL, its direct and indirect subsidiaries, and its consolidated financial guaranty VIEs (FG VIEs) and CIVs. See Note 8, Financial Guaranty Variable Interest Entities and Consolidated Investment Vehicles. Intercompany accounts and transactions between and among all consolidated entities have been eliminated. All amounts are reported in U.S. dollars, unless otherwise specified.
Significant Accounting Policies
The Company revalues foreign currency denominated assets, liabilities, revenue, and expenses, into U.S. dollars using the applicable exchange rates prescribed by GAAP. For subsidiaries where the functional currency is the U.S. dollar, gains and losses generated by the remeasurement of foreign currency transactions are reported in the consolidated statements of operations. For consolidated entities whose functional currency is not the U.S. dollar, amounts generated by translating foreign currency financial statements to the Company’s U.S. dollar reporting currency, are reported in the consolidated statements of comprehensive income (loss).
Other accounting policies are included in the following notes to the consolidated financial statements.
| | | | | |
| Note Name | Note Number |
| Expected loss to be paid (recovered) | Note 4 |
| Contracts accounted for as insurance | Note 5 |
| Contracts accounted for as credit derivatives | Note 6 |
| Investments and cash | Note 7 |
| Financial guaranty variable interest entities and consolidated investment vehicles | Note 8 |
| Fair value measurement | Note 9 |
| Asset management fees | Note 10 |
| Long-term debt and credit facilities | Note 11 |
| Employee benefit plans | Note 12 |
| Income taxes | Note 13 |
| Related parties | Note 15 |
| Leases | Note 16 |
| Contingencies | Note 17 |
| Shareholders' equity | Note 18 |
| Earnings per share | Note 20 |
Recent Accounting Standards Adopted
In November 2023, the Financial Accounting Standards Board (FASB) issued Accounting Standards Update (ASU) 2023-07, Segment Reporting (Topic 280): Improvements to Reportable Segment Disclosures. The amendments in this ASU require disclosure of significant segment expenses regularly provided to the chief operating decision maker (CODM), extend certain annual disclosures to interim periods, and permit more than one measure of segment profit or loss to be reported under certain conditions. This ASU is effective in fiscal years beginning after December 15, 2023, and interim periods within fiscal years beginning after December 15, 2024. Early adoption is permitted. The Company adopted this ASU during the fourth quarter of 2024 and applied its amendments retrospectively to all prior periods presented in its consolidated financial statements. See Note 2, Segment Information.
Assured Guaranty Ltd.
Notes to Consolidated Financial Statements, Continued
Recent Accounting Standards Not Yet Adopted
In December 2023, the FASB issued ASU 2023-09, Income Taxes (Topic 740): Improvements to Income Tax Disclosures. The amendments require enhanced annual disclosures regarding the rate reconciliation and income taxes paid. This ASU is effective for fiscal years beginning after December 15, 2024. The Company will apply the amendments in this ASU prospectively to all annual periods beginning after December 15, 2024. The adoption of this ASU will affect certain of the Company’s income tax disclosures.
In November 2024, the FASB issued ASU 2024-03, Income Statement—Reporting Comprehensive Income—Expense Disaggregation Disclosures (Subtopic 220-40). The amendments in this ASU require disclosure about specific expense categories, including employee compensation, depreciation and intangible asset amortization, in the notes to financial statements at interim and annual reporting periods. This ASU is effective in fiscal years beginning after December 15, 2026, and interim periods within fiscal years beginning after December 15, 2027. Early adoption is permitted. Prospective application is required, and retrospective application is permitted. The Company is evaluating when and how it will adopt this ASU and the effect that the amendments in this ASU may have on its expense disclosures.
2. Segment Information
The Company reports its results of operations in two segments: Insurance and Asset Management. The Company separately reports the results of its Corporate division and the effects of consolidating FG VIEs and CIVs. This presentation is consistent with the manner in which the Chief Executive Officer and President, the CODM, reviews the business to assess performance and allocate resources. The CODM uses adjusted operating income to allocate resources for each segment predominantly in the annual budget and forecasting process and to assess the performance for each segment.
The Company analyzes the operating performance of each segment using “segment adjusted operating income (loss).” Results for each segment and division include specifically identifiable expenses as well as intersegment expense allocations, as applicable, based on time studies and other cost allocation methodologies based on headcount or other metrics. Segment adjusted operating income is defined as “net income (loss) attributable to AGL,” adjusted for the following items, which primarily affect the Insurance segment and Corporate division:
•Elimination of realized gains (losses) on the Company’s investments, except for gains and losses on securities classified as trading.
•Elimination of non-credit impairment-related unrealized fair value gains (losses) on credit derivatives that are recognized in net income, which is the amount of unrealized fair value gains (losses) in excess of the present value of the expected estimated economic credit losses, and non-economic payments.
•Elimination of fair value gains (losses) on the Company’s committed capital securities (CCS) that are recognized in net income.
•Elimination of foreign exchange gains (losses) on remeasurement of net premium receivables and loss and loss adjustment expense (LAE) reserves that are recognized in net income.
•The tax effects related to the above adjustments, which are determined by applying the statutory tax rate in each of the jurisdictions that generate these adjustments.
In addition to the adjustments listed above, segment adjusted operating income (loss) differs from GAAP in other respects. The Insurance segment includes: (i) premiums and losses from the financial guaranty insurance policies issued by AG that guarantees the FG VIEs’ debt; and (ii) the insurance subsidiaries’ share of earnings from investments in funds managed by Sound Point and AHP funds (prior to July 1, 2023, AssuredIM) in “equity in earnings (losses) of investees.” Under GAAP, (i) FG VIEs are consolidated by AG and the premiums and losses/recoveries associated with the financial guaranty policies in respect of the FG VIEs’ debt are eliminated (the reconciliation tables below present the FG VIEs and related eliminations in “other”); and (ii) certain investments in funds managed by Sound Point (prior to July 1, 2023, AssuredIM) and AHP funds are, or were in prior periods, accounted for as CIVs, (in the reconciliation tables below, the CIVs and related eliminations of the Insurance segment’s “equity in earnings (losses) of investees” associated with the Company’s ownership interest in CIVs are presented in “other”). Until July 1, 2023, under GAAP, reimbursable fund expenses were shown as a component of “asset management fees” and included in total revenues, whereas in the Asset Management segment in the tables below these expenses were netted in “segment expenses.”
The Company does not report assets by reportable segment as the CODM does not assess performance and allocate resources based on assets.
Assured Guaranty Ltd.
Notes to Consolidated Financial Statements, Continued
The Insurance segment primarily consists of the adjusted operating income (loss) of: (i) the Company’s insurance subsidiaries; and (ii) AGAS.
Prior to July 1, 2023, the Asset Management segment consisted of the adjusted operating income (loss) of AssuredIM. Since July 2023, the Company participates in the asset management business through its ownership interest in Sound Point as described in Note 1, Business and Basis of Presentation. Beginning in the third quarter of 2023, the Asset Management segment primarily includes the results of the Company’s equity method ownership interest in Sound Point.
The Corporate division primarily consists of: (i) interest expense and any losses on the extinguishment of the U.S. Holding Companies’ debt; (ii) other corporate operating expenses of AGL and the U.S. Holding Companies, and (iii) beginning in the third quarter of 2024, equity in earnings from certain alternative investments that were transferred from AG to AGMH as part of the share redemption that occurred on August 5, 2024. The Corporate division also included the gain, net of transaction expenses, associated with the Sound Point Transaction and the AHP Transaction in 2023.
The Other category in the tables below primarily includes the effect of consolidating FG VIEs, CIVs, intersegment eliminations and, prior to July 1, 2023, the reclassification of reimbursable fund expenses. See Note 8, Financial Guaranty Variable Interest Entities and Consolidated Investment Vehicles.
The following table presents information for the Company’s operating segments. Intersegment revenues include transactions between and among the segments, the Corporate division and other.
Segment Information
| | | | | | | | | | | | | | | | | | | | | | | | | | | | | | | | | | | | | | |
| | Years Ended December 31, |
| | 2024 | | 2023 (3) | | 2022 |
| | Insurance | | Asset Management | | Insurance | | Asset Management | | Insurance | | Asset Management |
| | (in millions) |
| Third-party revenues | | $ | 811 | | | $ | 8 | | | $ | 845 | | | $ | 49 | | | $ | 748 | | | $ | 78 | |
| Intersegment revenues | | 10 | | | 2 | | | 10 | | | 27 | | | 9 | | | 34 | |
| Segment revenues | | 821 | | | 10 | | | 855 | | | 76 | | | 757 | | | 112 | |
| Segment loss and LAE (benefit) | | (18) | | | — | | | 161 | | | — | | | 12 | | | — | |
| Segment employee compensation and benefit expenses | | 170 | | | — | | | 154 | | | 59 | | | 148 | | | 80 | |
| Segment amortization of DAC | | 20 | | | — | | | 13 | | | — | | | 14 | | | — | |
| Other segment items (1) | | 117 | | | 6 | | | 107 | | | 19 | | | 85 | | | 39 | |
| Segment expenses | | 289 | | | 6 | | | 435 | | | 78 | | | 259 | | | 119 | |
| Segment equity in earnings (losses) of investees | | 102 | | | 2 | | | 82 | | | 5 | | | (51) | | | — | |
| Less: Segment provision (benefit) for income taxes | | 109 | | | 1 | | | (119) | | | — | | | 34 | | | (1) | |
| Segment adjusted operating income (loss) | | $ | 525 | | | $ | 5 | | | $ | 621 | | | $ | 3 | | | $ | 413 | | | $ | (6) | |
| | | | | | | | | | | | |
| Selected components of segment adjusted operating income: | | | | | | | | | | | | |
| Net investment income | | $ | 339 | | | $ | — | | | $ | 370 | | | $ | — | | | $ | 278 | | | $ | — | |
| Non-cash compensation and operating expenses (2) | | 60 | | | — | | | 38 | | | 8 | | | 41 | | | 18 | |
_____________________
(1) Other segment items include professional services expenses, maintenance, depreciation expense, lease expense, investment management expenses and certain overhead expenses.
(2) Consists of depreciation and amortization, share-based compensation (see Note 12, Employee Benefit Plans) and the write-off of long-lived intangible assets related to AGM licenses (see Note 1, Business and Basis of Presentation).
(3) In 2023, the Corporate division had revenues of $275 million primarily consisting of a gain on the Sound Point and AHP transactions. Expenses for the Corporate division consisted of $99 million of interest expense, $38 million of employee compensation and benefit expenses, and $79 million of other expenses.
Assured Guaranty Ltd.
Notes to Consolidated Financial Statements, Continued
The tables below present a reconciliation of significant components of segment information to the comparable consolidated amounts.
Reconciliation of Segment Information to Consolidated Information
Year Ended December 31, 2024
| | | | | | | | | | | | | | | | | | | | | | | | | | | | | | | | | | | |
| | | | | | | Less: | | Net Income (Loss) Attributable to AGL |
| | Revenues | | Expenses | | Equity in Earnings (Losses) of Investees | | Provision (Benefit) for Income Taxes | | Noncontrolling Interests | |
| | (in millions) |
| Segments: | | | | | | | | | | | |
| Insurance | $ | 821 | | | $ | 289 | | | $ | 102 | | | $ | 109 | | | $ | — | | | $ | 525 | |
| Asset Management | 10 | | | 6 | | | 2 | | | 1 | | | — | | | 5 | |
| Total segments | 831 | | | 295 | | | 104 | | | 110 | | | — | | | 530 | |
| Corporate division | 17 | | | 169 | | | 5 | | | (12) | | | — | | | (135) | |
| Other | 38 | | | (17) | | | (47) | | | (2) | | | 16 | | | (6) | |
| Subtotal | 886 | | | 447 | | | 62 | | | 96 | | | 16 | | | 389 | |
| Reconciling items: | | | | | | | | | | | |
| Realized gains (losses) on investments | 9 | | | — | | | — | | | — | | | — | | | 9 | |
| Non-credit impairment-related unrealized fair value gains (losses) on credit derivatives | 13 | | | (1) | | | — | | | — | | | — | | | 14 | |
| Fair value gains (losses) on CCS | (10) | | | — | | | — | | | — | | | — | | | (10) | |
| Foreign exchange gains (losses) on remeasurement of premiums receivable and loss and LAE reserves | (26) | | | — | | | — | | | — | | | — | | | (26) | |
| Tax effect | — | | | — | | | — | | | — | | | — | | | — | |
| Total consolidated | $ | 872 | | | $ | 446 | | | $ | 62 | | | $ | 96 | | | $ | 16 | | | $ | 376 | |
Assured Guaranty Ltd.
Notes to Consolidated Financial Statements, Continued
Reconciliation of Segment Information to Consolidated Information
Year Ended December 31, 2023
| | | | | | | | | | | | | | | | | | | | | | | | | | | | | | | | | | | |
| | | | | | | Less: | | Net Income (Loss) Attributable to AGL |
| | Revenues | | Expenses | | Equity in Earnings (Losses) of Investees | | Provision (Benefit) for Income Taxes (1) | | Noncontrolling Interests | |
| | (in millions) |
| Segments: | | | | | | | | | | | |
| Insurance | $ | 855 | | | $ | 435 | | | $ | 82 | | | $ | (119) | | | $ | — | | | $ | 621 | |
| Asset Management | 76 | | | 78 | | | 5 | | | — | | | — | | | 3 | |
| Total segments | 931 | | | 513 | | | 87 | | | (119) | | | — | | | 624 | |
| Corporate division | 275 | | | 216 | | | — | | | 14 | | | — | | | 45 | |
| Other | 61 | | | 6 | | | (59) | | | (5) | | | 22 | | | (21) | |
| Subtotal | 1,267 | | | 735 | | | 28 | | | (110) | | | 22 | | | 648 | |
| Reconciling items: | | | | | | | | | | | |
| Realized gains (losses) on investments | (14) | | | — | | | — | | | — | | | — | | | (14) | |
| Non-credit impairment-related unrealized fair value gains (losses) on credit derivatives | 104 | | | (2) | | | — | | | — | | | — | | | 106 | |
| Fair value gains (losses) on CCS | (35) | | | — | | | — | | | — | | | — | | | (35) | |
| Foreign exchange gains (losses) on remeasurement of premiums receivable and loss and LAE reserves | 51 | | | — | | | — | | | — | | | — | | | 51 | |
| Tax effect | — | | | — | | | — | | | 17 | | | — | | | (17) | |
| Total consolidated | $ | 1,373 | | | $ | 733 | | | $ | 28 | | | $ | (93) | | | $ | 22 | | | $ | 739 | |
_____________________
(1) Includes $189 million of tax benefit related to a Bermuda tax law change, which is included in the Insurance segment. See Note 13, Income Taxes.
Assured Guaranty Ltd.
Notes to Consolidated Financial Statements, Continued
Reconciliation of Segment Information to Consolidated Information
Year Ended December 31, 2022
| | | | | | | | | | | | | | | | | | | | | | | | | | | | | | | | | | | |
| | | | | | | Less: | | Net Income (Loss) Attributable to AGL |
| | Revenues | | Expenses | | Equity in Earnings (Losses) of Investees | | Provision (Benefit) for Income Taxes | | Noncontrolling Interests | |
| | (in millions) |
| Segments: | | | | | | | | | | | |
| Insurance | $ | 757 | | | $ | 259 | | | $ | (51) | | | $ | 34 | | | $ | — | | | $ | 413 | |
| Asset Management | 112 | | | 119 | | | — | | | (1) | | | — | | | (6) | |
| Total segments | 869 | | | 378 | | | (51) | | | 33 | | | — | | | 407 | |
| Corporate division | 4 | | | 143 | | | — | | | (5) | | | — | | | (134) | |
| Other | 14 | | | 19 | | | 12 | | | — | | | 13 | | | (6) | |
| Subtotal | 887 | | | 540 | | | (39) | | | 28 | | | 13 | | | 267 | |
| Reconciling items: | | | | | | | | | | | |
| Realized gains (losses) on investments | (56) | | | — | | | — | | | — | | | — | | | (56) | |
| Non-credit impairment-related unrealized fair value gains (losses) on credit derivatives | (22) | | | (4) | | | — | | | — | | | — | | | (18) | |
| Fair value gains (losses) on CCS | 24 | | | — | | | — | | | — | | | — | | | 24 | |
| Foreign exchange gains (losses) on remeasurement of premiums receivable and loss and LAE reserves | (110) | | | — | | | — | | | — | | | — | | | (110) | |
| Tax effect | — | | | — | | | — | | | (17) | | | — | | | 17 | |
| Total consolidated | $ | 723 | | | $ | 536 | | | $ | (39) | | | $ | 11 | | | $ | 13 | | | $ | 124 | |
Supplemental Information
Year Ended December 31, 2024
| | | | | | | | | | | | | | | | | | | | | | | | | | | | | |
| | Net Earned Premiums | | Net Investment Income | | Loss and LAE (Benefit) | | Amortization of DAC | | Other Expenses(1) |
| | (in millions) |
| Segments: | | | | | | | | | |
| Insurance | $ | 406 | | | $ | 339 | | | $ | (18) | | | $ | 20 | | | $ | 287 | |
| Asset Management | — | | | — | | | — | | | — | | | 6 | |
| Total segments | 406 | | | 339 | | | (18) | | | 20 | | | 293 | |
| Corporate division | — | | | 14 | | | — | | | — | | | 68 | |
| Other | (3) | | | (13) | | | (7) | | | — | | | — | |
| Subtotal | 403 | | | 340 | | | (25) | | | 20 | | | 361 | |
| Reconciling items: | | | | | | | | | |
| Credit derivative impairment (recoveries) (2) | — | | | — | | | (1) | | | — | | | — | |
| Total consolidated | $ | 403 | | | $ | 340 | | | $ | (26) | | | $ | 20 | | | $ | 361 | |
_____________________
(1) Consists of “employee compensation and benefit expenses” and “other operating expenses.”
(2) Credit derivative impairment (recoveries) are included in “fair value gains (losses) on credit derivatives” in the Company’s consolidated statements of operations and in loss and LAE (benefit) on a segment basis.
Assured Guaranty Ltd.
Notes to Consolidated Financial Statements, Continued
Supplemental Information
Year Ended December 31, 2023
| | | | | | | | | | | | | | | | | | | | | | | | | | | | | |
| | Net Earned Premiums | | Net Investment Income | | Loss and LAE (Benefit) | | Amortization of DAC | | Other Expenses(1) |
| | (in millions) |
| Segments: | | | | | | | | | |
| Insurance | $ | 347 | | | $ | 370 | | | $ | 161 | | | $ | 13 | | | $ | 261 | |
| Asset Management | — | | | — | | | — | | | — | | | 77 | |
| Total segments | 347 | | | 370 | | | 161 | | | 13 | | | 338 | |
| Corporate division | — | | | 8 | | | — | | | — | | | 117 | |
| Other | (3) | | | (13) | | | 3 | | | — | | | 13 | |
| Subtotal | 344 | | | 365 | | | 164 | | | 13 | | | 468 | |
| Reconciling items: | | | | | | | | | |
| Credit derivative impairment (recoveries) (2) | — | | | — | | | (2) | | | — | | | — | |
| Total consolidated | $ | 344 | | | $ | 365 | | | $ | 162 | | | $ | 13 | | | $ | 468 | |
_____________________
(1) Consists of “employee compensation and benefit expenses” and “other operating expenses.”
(2) Credit derivative impairment (recoveries) are included in “fair value gains (losses) on credit derivatives” in the Company’s consolidated statements of operations and in loss and LAE (benefit) on a segment basis.
Supplemental Information
Year Ended December 31, 2022
| | | | | | | | | | | | | | | | | | | | | | | | | | | | | |
| | Net Earned Premiums | | Net Investment Income | | Loss and LAE (Benefit) | | Amortization of DAC | | Other Expenses(1) |
| | (in millions) |
| Segments: | | | | | | | | | |
| Insurance | $ | 497 | | | $ | 278 | | | $ | 12 | | | $ | 14 | | | $ | 232 | |
| Asset Management | — | | | — | | | — | | | — | | | 118 | |
| Total segments | 497 | | | 278 | | | 12 | | | 14 | | | 350 | |
| Corporate division | — | | | 4 | | | — | | | — | | | 54 | |
| Other | (3) | | | (13) | | | 8 | | | — | | | 21 | |
| Subtotal | 494 | | | 269 | | | 20 | | | 14 | | | 425 | |
| Reconciling items: | | | | | | | | | |
| Credit derivative impairment (recoveries) (2) | — | | | — | | | (4) | | | — | | | — | |
| Total consolidated | $ | 494 | | | $ | 269 | | | $ | 16 | | | $ | 14 | | | $ | 425 | |
_____________________
(1) Consists of “employee compensation and benefit expenses” and “other operating expenses.”
(2) Credit derivative impairment (recoveries) are included in “fair value gains (losses) on credit derivatives” in the Company’s consolidated statements of operations and in loss and LAE (benefit) on a segment basis.
The table below summarizes revenues for the operating segments, Corporate division and Other category by country of domicile for each period indicated, based on the country of domicile of the Company’s subsidiaries that generated the revenues.
Assured Guaranty Ltd.
Notes to Consolidated Financial Statements, Continued
Segment, Corporate Division and Other
Revenues by Country of Domicile
| | | | | | | | | | | | | | | | | | | | |
| | | Year Ended December 31, |
| Country of Domicile | | 2024 | | 2023 | | 2022 |
| | | (in millions) |
| U.S. | | $ | 685 | | | $ | 1,064 | | | $ | 727 | |
| Bermuda | | 168 | | | 166 | | | 129 | |
| U.K. | | 32 | | | 36 | | | 32 | |
| Other | | 1 | | | 1 | | | (1) | |
| Total | | $ | 886 | | | $ | 1,267 | | | $ | 887 | |
3. Outstanding Exposure
The Company sells credit protection primarily in financial guaranty insurance form. The Company may also sell credit protection by issuing policies that guarantee payment obligations under credit default swaps (CDS). The Company’s guaranties of CDS are generally structured such that the circumstances giving rise to the Company’s obligation to make loss payments are similar to those for its financial guaranty insurance contracts.
The Company seeks to limit its exposure to losses by underwriting obligations that it views to be investment grade at inception, although on occasion it may underwrite new issuances that it views to be below-investment grade (BIG), typically as part of its loss mitigation strategy for existing troubled exposures. The Company also seeks to acquire portfolios of insurance from financial guarantors that are no longer writing new business by acquiring such companies, providing reinsurance on or novating a portfolio of insurance; in such instances, it evaluates the risk characteristics of the target portfolio, which may include some BIG exposures, as a whole in the context of the proposed transaction. The Company diversifies its insured portfolio across sector and geography and, in the structured finance portfolio, generally requires subordination or collateral to protect it from loss. Reinsurance may be used in order to reduce net exposure to certain insured transactions.
Public finance obligations insured by the Company primarily consist of general obligation bonds supported by the taxing powers of U.S. state or municipal governmental authorities, as well as tax-supported bonds, revenue bonds and other obligations supported by covenants from state or municipal governmental authorities or other municipal obligors to impose and collect fees and charges for public services or specific infrastructure projects. The Company includes within public finance obligations those obligations backed by the cash flow from leases or other revenues from projects serving substantial public purposes, including utilities, toll roads, healthcare facilities and government office buildings as well as obligations issued by U.S. and non-U.S. sovereign and sub-sovereign issuers and governmental authorities.
Structured finance obligations insured by the Company are generally issued by special purpose entities, including VIEs, and backed by pools of assets having an ascertainable cash flow or market value or other specialized financial obligations. Some of these VIEs are consolidated as described in Note 8, Financial Guaranty Variable Interest Entities and Consolidated Investment Vehicles. Unless otherwise specified, the outstanding par and debt service amounts presented in this note include outstanding exposures on these VIEs whether or not they are consolidated.
The Company also provides specialty insurance and reinsurance that are consistent with its risk profile and benefit from its underwriting experience and other types of financial guaranties.
Significant Risk Management Activities
The Portfolio Risk Management Committee, which includes members of senior management and senior risk and surveillance officers, is responsible for enterprise risk management for the Company’s insurance business and focuses on measuring and managing credit, market and liquidity risk for the Company’s insurance business. This committee establishes company-wide credit policy for the Company’s direct and assumed insurance business. It implements specific underwriting procedures and limits and allocates underwriting capacity among the Company’s insurance subsidiaries. All insurance transactions in new asset classes or new jurisdictions, or otherwise outside the Company’s Board-approved risk appetite statement or its risk limits, must be approved by this committee.
The risk management committees of the insurance subsidiaries conduct in-depth reviews of the insured portfolios of the relevant subsidiaries, focusing on varying portions of the portfolio at each meeting. They review and may revise internal
Assured Guaranty Ltd.
Notes to Consolidated Financial Statements, Continued
ratings assigned to the insured transactions and review sector reports, monthly product line surveillance reports and compliance reports.
All transactions in the insured portfolio are assigned internal credit ratings by the relevant underwriting committee at inception, and such credit ratings are updated by the relevant risk management committee based on changes in transaction credit quality. As part of the surveillance process, the Company monitors trends and changes in transaction credit quality, and recommends such remedial actions as may be necessary or appropriate. The Company also develops strategies to enforce its contractual rights and remedies and to mitigate its losses, engage in negotiation discussions with transaction participants and, when necessary, manage the Company’s litigation proceedings.
Surveillance Categories
The Company segregates its insured portfolio into investment grade and BIG surveillance categories to facilitate the appropriate allocation of resources to monitoring and loss mitigation efforts and to aid in establishing the appropriate cycle for periodic review of each exposure. BIG exposures include all exposures with internal credit ratings below BBB-.
The Company’s internal credit ratings are based on internal assessments of the likelihood of default and loss severity in the event of default. Internal credit ratings are expressed on a ratings scale similar to that used by the rating agencies and generally reflect an approach similar to that employed by the rating agencies, except that the Company’s internal credit ratings focus on future performance rather than lifetime performance.
The Company monitors its insured portfolio and refreshes its internal credit ratings on individual exposures in quarterly, semi-annual or annual cycles based on the Company’s view of the exposure’s credit quality, future loss potential, volatility and sector. More extensive monitoring and intervention are employed for all BIG surveillance categories, with internal credit ratings reviewed quarterly. Exposures identified as BIG are subjected to further review to determine (i) the probability of a future loss, (ii) the calculation of the expected future loss to be paid, and (iii) whether the Company has paid a claim for which it expects to be reimbursed within one year (liquidity claim) or a claim for which it does not expect to be reimbursed within one year.
Ratings on exposures in sectors identified as under the most stress or with the most potential volatility are also reviewed every quarter, although the Company may also review a rating in response to developments impacting a credit when a ratings review is not scheduled. For assumed exposures, the Company may use the ceding company’s credit ratings of transactions where it is impractical for it to assign its own rating.
The Company assigns each BIG exposure to one of the three BIG surveillance categories below, which generally represent the following:
•BIG 1: Below-investment-grade exposures for which there are possible future losses, on a present value basis, and the aggregate probability weighting of scenarios with future losses is less than 50%, regardless of whether the Company has or has not paid a liquidity claim.
•BIG 2: Below-investment-grade exposures for which there are possible future losses, on a present value basis, and the aggregate probability weighting of scenarios with future losses is 50% or more, but for which no claims (other than liquidity claims) have yet been paid.
•BIG 3: Below-investment-grade exposures for which future losses are expected, on a present value basis, and the aggregate probability weighting of scenarios with future losses is 50% or more, and for which claims, other than liquidity claims, have been paid.
For purposes of classifying BIG exposures into one of the three BIG categories, the Company calculates the present value of projected claim payments and recoveries using the pre-tax book yield of the relevant insurance subsidiary’s investment portfolio as the applicable discount rate.
As discussed in Note 4, Expected Loss to be Paid (Recovered), for financial statement measurement purposes, the Company uses risk-free rates (as determined each quarter) for discounting, rather than pre-tax book yield of the investment portfolio, to calculate the expected losses to be paid. Expected losses to be paid (recovered) are based on probability weighted scenarios and serve as the basis for the loss reserves reported in accordance with U.S. GAAP.
Assured Guaranty Ltd.
Notes to Consolidated Financial Statements, Continued
Financial Guaranty Exposure
The Company measures its financial guaranty exposure in terms of: (i) gross and net par outstanding; and (ii) gross and net debt service.
The Company typically guarantees the payment of debt service when due. Since most of these payments are due in the future, the Company generally uses gross and net par outstanding as a proxy for its financial guaranty exposure. Gross par outstanding generally represents the principal amount of the insured obligation at a point in time. Net par outstanding equals gross par outstanding net of any reinsurance. The Company includes in its par outstanding calculation the impact of any consumer price index inflator to the reporting date as well as, in the case of accreting (zero-coupon) obligations, accretion to the reporting date. Non-U.S. dollar denominated par outstanding is translated at the spot rate at the end of the reporting period.
The Company has, from time to time, purchased securities that it has insured, and for which it had expected losses to be paid, in order to mitigate the economic effect of insured losses (Loss Mitigation Securities). The Company excludes amounts attributable to Loss Mitigation Securities from par and debt service outstanding, and instead reports Loss Mitigation Securities in the investment portfolio. The Company manages such securities as investments and not insurance exposure. As of both December 31, 2024 and December 31, 2023 the Company excluded net par outstanding of $1.2 billion attributable to Loss Mitigation Securities.
Gross debt service outstanding represents the sum of all estimated future debt service payments on the insured obligations, on an undiscounted basis. Net debt service outstanding equals gross debt service outstanding net of any reinsurance. Future debt service payments include the estimated impact of any consumer price index inflator after the reporting date, as well as, in the case of accreting (zero-coupon) obligations, accretion after the reporting date.
The Company calculates its debt service outstanding as follows:
•for insured obligations that are not supported by homogeneous pools of assets (which category includes most of the Company’s public finance transactions), as the total estimated contractual future debt service due through maturity, regardless of whether the obligations may be called and regardless of whether, in the case of obligations where principal payments are due when an underlying asset makes a principal payment, the Company believes the obligations will be repaid prior to contractual maturity; and
•for insured obligations that are supported by homogeneous pools of assets that are contractually permitted to prepay principal (which category includes, for example, residential mortgage-backed securities (RMBS)), as the total estimated expected future debt service due on insured obligations through their respective expected terms, which reflects the Company’s expectations as to whether the obligations may be called and, in the case of obligations where principal payments are due when an underlying asset makes a principal payment, when the Company expects principal payments to be made prior to contractual maturity.
The calculation of debt service requires the use of estimates, which the Company updates periodically, including estimates and assumptions for the expected remaining term of insured obligations supported by homogeneous pools of assets, updated interest rates for floating and variable rate insured obligations, behavior of consumer price indices for obligations with consumer price index inflators, foreign exchange rates and other assumptions based on the characteristics of each insured obligation. Debt service is a measure of the estimated maximum potential exposure to insured obligations before considering the Company’s various legal rights to the underlying collateral and other remedies available to it under its financial guaranty contract.
Actual debt service may differ from estimated debt service due to refundings, terminations, negotiated restructurings, prepayments, changes in interest rates on variable rate insured obligations, consumer price index behavior differing from that projected, changes in foreign exchange rates on non-U.S. dollar denominated insured obligations and other factors.
Assured Guaranty Ltd.
Notes to Consolidated Financial Statements, Continued
Financial Guaranty Portfolio
Debt Service and Par Outstanding
| | | | | | | | | | | | | | | | | | | | | | | |
| As of December 31, 2024 | | As of December 31, 2023 |
| | Gross | | Net | | Gross | | Net |
| | (in millions) |
| Debt Service | | | | | | | |
| Public finance | $ | 403,789 | | | $ | 403,718 | | | $ | 386,494 | | | $ | 386,419 | |
| Structured finance | 12,674 | | | 12,248 | | | 11,543 | | | 11,217 | |
| Total financial guaranty | $ | 416,463 | | | $ | 415,966 | | | $ | 398,037 | | | $ | 397,636 | |
| | | | | | | |
| Par Outstanding | | | | | | | |
| Public finance | $ | 250,429 | | | $ | 250,375 | | | $ | 239,352 | | | $ | 239,296 | |
| Structured finance | 11,603 | | | 11,177 | | | 10,183 | | | 9,857 | |
| Total financial guaranty | $ | 262,032 | | | $ | 261,552 | | | $ | 249,535 | | | $ | 249,153 | |
In addition to amounts shown in the table above, the Company had outstanding commitments to provide guaranties of $196 million of public finance gross par and $1.5 billion of structured finance gross par as of December 31, 2024. These commitments are contingent on the satisfaction of all conditions set forth in the guaranties and may expire unused or be canceled at the counterparty’s request. Therefore, the total commitment amount does not necessarily reflect actual future guaranteed amounts.
Also, in connection with a potential transaction that would accelerate the run-off of the insured portfolio of Financial Guaranty Insurance Company (FGIC) (the Proposed Transaction) pursuant to the First Amended Plan of Rehabilitation for FGIC, dated June 4, 2013, the Company and FGIC are parties to a novation agreement dated as of February 8, 2024 pursuant to which certain FGIC policies insuring approximately $353 million of public finance (including infrastructure) gross par and approximately $50 million of structured finance gross par as of December 31, 2023 may in the future be novated to the Company in accordance with the terms and conditions of the novation agreement. The Proposed Transaction, including the novation of certain FGIC policies to the Company, is subject in all respects to review and approval by NYDFS, the reopening of FGIC’s rehabilitation proceeding, and ultimate approval by the Supreme Court of the State of New York. On September 10, 2024, following the NYDFS’s review of the Proposed Transaction and information submitted by FGIC, FGIC received a written communication from the NYDFS stating that the NYDFS does not support the Proposed Transaction. In the event the Proposed Transaction does not occur on or prior to September 30, 2025, either the Company or FGIC has the right to terminate the novation agreement in accordance with its terms.
Financial Guaranty Portfolio by Internal Rating
As of December 31, 2024
| | | | | | | | | | | | | | | | | | | | | | | | | | | | | | | | | | | | | | | | | | | | | | | | | | | | | | | | | | | | | | |
| | | Public Finance
U.S. | | Public Finance
Non-U.S. | | Structured Finance
U.S. | | Structured Finance
Non-U.S. | | Total |
Rating
Category | | Net Par
Outstanding | | % | | Net Par
Outstanding | | % | | Net Par
Outstanding | | % | | Net Par
Outstanding | | % | | Net Par
Outstanding | | % |
| | | (dollars in millions) |
| AAA | | $ | 25 | | | — | % | | $ | 2,074 | | | 4.2 | % | | $ | 512 | | | 6.1 | % | | $ | 470 | | | 17.3 | % | | $ | 3,081 | | | 1.2 | % |
| AA | | 17,664 | | | 8.8 | | | 2,854 | | | 5.8 | | | 5,386 | | | 63.7 | | | 58 | | | 2.1 | | | 25,962 | | | 9.9 | |
| A | | 111,502 | | | 55.5 | | | 13,046 | | | 26.5 | | | 952 | | | 11.3 | | | 2,117 | | | 77.7 | | | 127,617 | | | 48.8 | |
| BBB | | 69,096 | | | 34.3 | | | 24,828 | | | 50.5 | | | 707 | | | 8.3 | | | 79 | | | 2.9 | | | 94,710 | | | 36.2 | |
| BIG | | 2,888 | | | 1.4 | | | 6,398 | | | 13.0 | | | 896 | | | 10.6 | | | — | | | — | | | 10,182 | | | 3.9 | |
| Total net par outstanding | | $ | 201,175 | | | 100.0 | % | | $ | 49,200 | | | 100.0 | % | | $ | 8,453 | | | 100.0 | % | | $ | 2,724 | | | 100.0 | % | | $ | 261,552 | | | 100.0 | % |
Assured Guaranty Ltd.
Notes to Consolidated Financial Statements, Continued
Financial Guaranty Portfolio by Internal Rating
As of December 31, 2023
| | | | | | | | | | | | | | | | | | | | | | | | | | | | | | | | | | | | | | | | | | | | | | | | | | | | | | | | | | | | | | |
| | | Public Finance
U.S. | | Public Finance
Non-U.S. | | Structured Finance
U.S. | | Structured Finance
Non-U.S. | | Total |
Rating
Category | | Net Par
Outstanding | | % | | Net Par
Outstanding | | % | | Net Par
Outstanding | | % | | Net Par
Outstanding | | % | | Net Par
Outstanding | | % |
| | | (dollars in millions) |
| AAA | | $ | 110 | | | 0.1 | % | | $ | 2,062 | | | 4.2 | % | | $ | 867 | | | 10.0 | % | | $ | 465 | | | 38.0 | % | | $ | 3,504 | | | 1.4 | % |
| AA | | 17,883 | | | 9.4 | | | 3,379 | | | 6.9 | | | 4,517 | | | 52.3 | | | 89 | | | 7.3 | | | 25,868 | | | 10.4 | |
| A | | 102,945 | | | 54.1 | | | 12,968 | | | 26.5 | | | 1,639 | | | 19.0 | | | 571 | | | 46.6 | | | 118,123 | | | 47.4 | |
| BBB | | 66,080 | | | 34.7 | | | 29,467 | | | 60.1 | | | 574 | | | 6.7 | | | 100 | | | 8.1 | | | 96,221 | | | 38.6 | |
| BIG | | 3,271 | | | 1.7 | | | 1,131 | | | 2.3 | | | 1,035 | | | 12.0 | | | — | | | — | | | 5,437 | | | 2.2 | |
| Total net par outstanding | | $ | 190,289 | | | 100.0 | % | | $ | 49,007 | | | 100.0 | % | | $ | 8,632 | | | 100.0 | % | | $ | 1,225 | | | 100.0 | % | | $ | 249,153 | | | 100.0 | % |
Assured Guaranty Ltd.
Notes to Consolidated Financial Statements, Continued
The following tables present net par outstanding by sector for the financial guaranty portfolio.
Financial Guaranty Portfolio
Net Par Outstanding by Sector
| | | | | | | | | | | | | | |
| | As of December 31, |
| Sector | | 2024 | | 2023 |
| | | (in millions) |
| Public finance: | | | | |
| U.S. public finance: | | | | |
| General obligation | | $ | 78,162 | | | $ | 74,609 | |
| Tax backed | | 33,288 | | | 33,060 | |
| Municipal utilities | | 30,036 | | | 29,300 | |
| Transportation | | 26,958 | | | 22,052 | |
| Healthcare | | 14,007 | | | 12,604 | |
| Infrastructure finance | | 8,663 | | | 8,796 | |
| Higher education | | 7,381 | | | 7,250 | |
| Housing revenue | | 1,272 | | | 1,152 | |
| Investor-owned utilities | | 325 | | | 329 | |
| Renewable energy | | 164 | | | 167 | |
| Other public finance | | 919 | | | 970 | |
| Total U.S. public finance | | 201,175 | | | 190,289 | |
| Non-U.S public finance: | | | | |
| Regulated utilities | | 22,361 | | | 20,545 | |
| Infrastructure finance | | 14,961 | | | 15,430 | |
| Sovereign and sub-sovereign | | 9,181 | | | 9,869 | |
| Renewable energy | | 1,596 | | | 2,030 | |
| Pooled infrastructure | | 1,101 | | | 1,133 | |
| Total non-U.S. public finance | | 49,200 | | | 49,007 | |
| Total public finance | | 250,375 | | | 239,296 | |
| Structured finance: | | | | |
| U.S. structured finance: | | | | |
| Insurance securitizations | | 4,495 | | | 4,379 | |
| RMBS | | 1,507 | | | 1,774 | |
| Pooled corporate obligations | | 607 | | | 631 | |
| Financial products | | 492 | | | 464 | |
| Consumer receivables | | 212 | | | 314 | |
| Subscription finance facilities | | 185 | | | 178 | |
| Other structured finance | | 955 | | | 892 | |
| Total U.S. structured finance | | 8,453 | | | 8,632 | |
| Non-U.S. structured finance: | | | | |
| Subscription finance facilities | | 1,385 | | | 444 | |
| Pooled corporate obligations | | 468 | | | 425 | |
| RMBS | | 221 | | | 252 | |
| Other structured finance | | 650 | | | 104 | |
| Total non-U.S structured finance | | 2,724 | | | 1,225 | |
| Total structured finance | | 11,177 | | | 9,857 | |
| Total net par outstanding | | $ | 261,552 | | | $ | 249,153 | |
Assured Guaranty Ltd.
Notes to Consolidated Financial Statements, Continued
Financial Guaranty Portfolio
Expected Amortization of Net Par Outstanding
As of December 31, 2024
| | | | | | | | | | | | | | | | | |
| | Public Finance | | Structured Finance | | Total |
| | (in millions) |
| 0 to 5 years | $ | 52,502 | | | $ | 5,720 | | | $ | 58,222 | |
| 5 to 10 years | 54,255 | | | 3,220 | | | 57,475 | |
| 10 to 15 years | 46,053 | | | 1,007 | | | 47,060 | |
| 15 to 20 years | 32,126 | | | 702 | | | 32,828 | |
| Over 20 years | 65,439 | | | 528 | | | 65,967 | |
| Total net par outstanding | $ | 250,375 | | | $ | 11,177 | | | $ | 261,552 | |
Actual amortization differs from expected maturities due to prepayments and terminations, and because interest rates, consumer price indices, foreign exchange rates and expected terms may be different than management had estimated. The expected maturities of structured finance obligations are, in general, shorter than their contractual maturities.
Financial Guaranty Portfolio
Components of BIG Net Par Outstanding
As of December 31, 2024
| | | | | | | | | | | | | | | | | | | | | | | | | | | | | |
| | BIG Net Par Outstanding | | Net Par |
| | BIG 1 | | BIG 2 | | BIG 3 | | Total BIG | | Outstanding |
| | | | | | (in millions) | | | | |
| Public finance: | | | | | | | | | |
| U.S. public finance | $ | 2,119 | | | $ | 137 | | | $ | 632 | | | $ | 2,888 | | | $ | 201,175 | |
| Non-U.S. public finance | 5,879 | | | 519 | | | — | | | 6,398 | | | 49,200 | |
| Public finance | 7,998 | | | 656 | | | 632 | | | 9,286 | | | 250,375 | |
| | | | | | | | | |
| Structured finance: | | | | | | | | | |
| U.S. RMBS | 104 | | | 29 | | | 686 | | | 819 | | | 1,507 | |
| Other structured finance | — | | | 21 | | | 56 | | | 77 | | | 9,670 | |
| Structured finance | 104 | | | 50 | | | 742 | | | 896 | | | 11,177 | |
| Total | $ | 8,102 | | | $ | 706 | | | $ | 1,374 | | | $ | 10,182 | | | $ | 261,552 | |
Financial Guaranty Portfolio
Components of BIG Net Par Outstanding
As of December 31, 2023 | | | | | | | | | | | | | | | | | | | | | | | | | | | | | |
| | BIG Net Par Outstanding | | Net Par |
| | BIG 1 | | BIG 2 | | BIG 3 | | Total BIG | | Outstanding |
| | | | | | (in millions) | | | | |
| Public finance: | | | | | | | | | |
| U.S. public finance | $ | 1,257 | | | $ | 926 | | | $ | 1,088 | | | $ | 3,271 | | | $ | 190,289 | |
| Non-U.S. public finance | 1,131 | | | — | | | — | | | 1,131 | | | 49,007 | |
| Public finance | 2,388 | | | 926 | | | 1,088 | | | 4,402 | | | 239,296 | |
| | | | | | | | | |
| Structured finance: | | | | | | | | | |
| U.S. RMBS | 22 | | | 36 | | | 883 | | | 941 | | | 1,774 | |
| Other structured finance | — | | | 27 | | | 67 | | | 94 | | | 8,083 | |
| Structured finance | 22 | | | 63 | | | 950 | | | 1,035 | | | 9,857 | |
| Total | $ | 2,410 | | | $ | 989 | | | $ | 2,038 | | | $ | 5,437 | | | $ | 249,153 | |
Assured Guaranty Ltd.
Notes to Consolidated Financial Statements, Continued
Financial Guaranty Portfolio
BIG Net Par Outstanding and Number of Risks
As of December 31, 2024
| | | | | | | | | | | | | | | | | | | | | | | | | | | | | | | | | | | | | | |
| | | Net Par Outstanding | | Number of Risks (2) |
| Description | | Financial Guaranty
Insurance (1) | | Credit
Derivatives | | Total | | Financial Guaranty
Insurance (1) | | Credit
Derivatives | | Total |
| | | (dollars in millions) |
| BIG 1 | | $ | 8,074 | | | $ | 28 | | | $ | 8,102 | | | 98 | | | 3 | | | 101 | |
| BIG 2 | | 702 | | | 4 | | | 706 | | | 12 | | | 1 | | | 13 | |
| BIG 3 | | 1,374 | | | — | | | 1,374 | | | 97 | | | 3 | | | 100 | |
| Total BIG | | $ | 10,150 | | | $ | 32 | | | $ | 10,182 | | | 207 | | | 7 | | | 214 | |
Financial Guaranty Portfolio
BIG Net Par Outstanding and Number of Risks
As of December 31, 2023
| | | | | | | | | | | | | | | | | | | | | | | | | | | | | | | | | | | | | | |
| | | Net Par Outstanding | | Number of Risks (2) |
| Description | | Financial
Guaranty
Insurance (1) | | Credit
Derivatives | | Total | | Financial
Guaranty
Insurance(1) | | Credit
Derivatives | | Total |
| | | (dollars in millions) |
| BIG 1 | | $ | 2,394 | | | $ | 16 | | | $ | 2,410 | | | 95 | | | 2 | | | 97 | |
| BIG 2 | | 979 | | | 10 | | | 989 | | | 13 | | | 2 | | | 15 | |
| BIG 3 | | 2,010 | | | 28 | | | 2,038 | | | 109 | | | 7 | | | 116 | |
| Total BIG | | $ | 5,383 | | | $ | 54 | | | $ | 5,437 | | | 217 | | | 11 | | | 228 | |
_____________________
(1) Includes FG VIEs.
(2) A risk represents the aggregate of the financial guaranty policies that share the same revenue source for purposes of making debt service payments.
When the Company insures an obligation, it assigns the obligation to a geographic location or locations based on its view of the geographic location of the risk. The Company seeks to maintain a diversified portfolio of insured obligations designed to spread its risk across a number of geographic areas.
Assured Guaranty Ltd.
Notes to Consolidated Financial Statements, Continued
Financial Guaranty Portfolio
Geographic Distribution of Net Par Outstanding
As of December 31, 2024
| | | | | | | | | | | | | | | | | |
| Number of Risks | | Net Par Outstanding | | Percent of Total Net Par Outstanding |
| | (dollars in millions) |
| U.S.: | | | | | |
| U.S. public finance: | | | | | |
| California | 1,182 | | | $ | 36,080 | | | 13.8 | % |
| Texas | 1,145 | | | 26,004 | | | 9.9 | |
| New York | 798 | | | 19,572 | | | 7.5 | |
| Pennsylvania | 533 | | | 18,448 | | | 7.1 | |
| Illinois | 479 | | | 12,536 | | | 4.8 | |
| Florida | 218 | | | 11,353 | | | 4.3 | |
| New Jersey | 248 | | | 8,824 | | | 3.4 | |
| Louisiana | 139 | | | 4,994 | | | 1.9 | |
| Michigan | 228 | | | 4,877 | | | 1.9 | |
| Colorado | 171 | | | 4,012 | | | 1.5 | |
| Other | 2,034 | | | 54,475 | | | 20.8 | |
| Total U.S. public finance | 7,175 | | | 201,175 | | | 76.9 | |
| U.S. structured finance (multiple states) | 328 | | | 8,453 | | | 3.2 | |
| Total U.S. | 7,503 | | | 209,628 | | | 80.1 | |
| | | | | |
| Non-U.S.: | | | | | |
| United Kingdom | 272 | | | 41,001 | | | 15.7 | |
| Australia | 7 | | | 1,740 | | | 0.7 | |
| Spain | 9 | | | 1,506 | | | 0.6 | |
| France | 7 | | | 1,477 | | | 0.5 | |
| Canada | 5 | | | 1,243 | | | 0.5 | |
| Other | 49 | | | 4,957 | | | 1.9 | |
| Total non-U.S. | 349 | | | 51,924 | | | 19.9 | |
| Total | 7,852 | | | $ | 261,552 | | | 100.0 | % |
Specialty Business
The Company also guarantees specialty business with risk profiles similar to those of its structured finance exposures written in financial guaranty form.
Specialty Business
| | | | | | | | | | | | | | | | | | | | | | | | | | |
| | As of December 31, 2024 | | As of December 31, 2023 |
| | Gross Exposure | | Net Exposure | | Gross Exposure | | Net Exposure |
| | (in millions) |
| Diversified real estate (1) | | $ | 2,004 | | | $ | 2,004 | | | $ | 1,569 | | | $ | 1,569 | |
| Insurance securitizations (2) | | 1,449 | | | 1,126 | | | 1,370 | | | 1,043 | |
| Pooled corporate obligations | | 868 | | | 868 | | | 488 | | | 488 | |
| Aircraft residual value insurance | | 147 | | | 87 | | | 355 | | | 200 | |
____________________
(1) Excess-of-loss guaranty of a minimum amount of billed rent on a diversified portfolio of real estate properties with an internal rating of AAA that matures in 2044. This guaranty is accounted for in accordance with Accounting Standards Codification (ASC) 460, Guarantees.
(2) Insurance securitizations exposure is projected to reach $1.5 billion gross and $1.2 billion net in 2025.
Assured Guaranty Ltd.
Notes to Consolidated Financial Statements, Continued
All exposures in the table above are rated investment-grade, except for aircraft residual value insurance gross and net exposure of $5 million as of December 31, 2024 and gross exposure of $144 million and net exposure of $84 million as of December 31, 2023.
In addition to the amounts shown in the table above, as of December 31, 2024, the Company had outstanding aggregate gross and net aircraft residual value insurance commitments of $90 million and $51 million, respectively. These commitments are contingent on the satisfaction of specified conditions and may expire unused or be cancelled at the request of the respective counterparty. Therefore, the total commitment amount does not necessarily reflect actual future covered amounts.
4. Expected Loss to be Paid (Recovered)
Accounting Policy
Net expected loss to be paid (recovered) is equal to the present value of expected future cash outflows for loss and LAE payments, net of: (i) inflows for expected salvage, subrogation and other recoveries; (ii) excess spread on underlying collateral, as applicable; and (iii) amounts ceded to reinsurers. Cash flows are discounted at current risk-free rates. The Company updates the discount rates each quarter and reflects the effect of such changes in economic loss development.
Expected cash outflows and inflows are probability weighted cash flows that reflect management’s assumptions about the likelihood of all possible outcomes based on all information available to the Company. Those assumptions consider the relevant facts and circumstances and are consistent with the information tracked and monitored through the Company’s surveillance and risk-management functions. Expected loss to be paid (recovered) is important in that it represents the present value of amounts that the Company expects to pay or recover in future periods.
The Company removes any related expected loss to be paid (recovered) associated with Loss Mitigation Securities. For Loss Mitigation Securities, the difference between the purchase price of the insured obligation and the fair value excluding the value of the Company’s insurance (on the date of acquisition) is treated as a paid loss. See Note 7, Investments and Cash, and Note 9, Fair Value Measurement.
Similarly, in cases where issuers of insured obligations elected (or where an issuer and the Company negotiated) to deliver the underlying collateral, insured obligation or a new security to the Company, expected loss to be paid (recovered) is adjusted accordingly and the asset received is prospectively accounted for under the applicable guidance for that instrument.
Economic loss development (benefit) represents the change in net expected loss to be paid (recovered) attributable to the effects of changes in the economic performance of insured transactions, changes in assumptions based on observed market trends, changes in discount rates, accretion of discount and the economic effects of loss mitigation efforts.
In order to effectively evaluate and manage the economics and liquidity of the entire insured portfolio, management assigns ratings and calculates expected loss to be paid (recovered), on a contract-by-contract basis, in the same manner for all its exposures regardless of form or differing accounting models. The exposure reported in Note 3, Outstanding Exposure, includes policies accounted for under various accounting models depending on the characteristics of the contract and the Company’s control rights. The three primary models are: (i) insurance, as described in Note 5, Contracts Accounted for as Insurance; (ii) derivatives, as described in Note 6, Contracts Accounted for as Credit Derivatives, and Note 9, Fair Value Measurement; and (iii) FG VIE consolidation, as described in Note 8, Financial Guaranty Variable Interest Entities and Consolidated Investment Vehicles. The Company has paid and may pay future claims and/or recover past claims on policies which fall under each of these accounting models. This note provides information regarding expected loss to be paid (recovered), regardless of the accounting method.
Loss Estimation Process
The financial guaranties issued by the Company insure the credit performance of the guaranteed obligations over an extended period of time, in some cases over 30 years, and in most circumstances the Company has no right to cancel such financial guaranties. As a result, the Company’s estimate of ultimate loss on a policy is subject to significant uncertainty over the life of the insured transaction. Credit performance can be affected by, among other things, economic, fiscal and financial market and political developments over the life of most contracts. The Company guarantees payment of interest and principal when those amounts are scheduled to be paid and cannot be required to pay on an accelerated basis, although in certain
Assured Guaranty Ltd.
Notes to Consolidated Financial Statements, Continued
circumstances it may elect to do so. When obligors default on their obligations, the Company is only required to pay the shortfall between the debt service due in any given period and the amount paid by the obligors.
The Company does not use traditional actuarial approaches to determine its estimates of expected losses. The determination of expected loss to be paid (recovered) is an inherently subjective process involving numerous estimates, assumptions and judgments by management, using both internal and external data sources with regard to frequency and severity of loss, economic projections, governmental actions, legal developments, negotiations, recovery rates, delinquency and prepayment rates, timing of cash flows and other factors that affect credit performance. These estimates, assumptions and judgments, and the factors on which they are based, may change materially over a reporting period, and have a material effect on the Company’s financial statements. Each quarter, the Company may revise its scenarios and update its assumptions, including the probability weightings of its scenarios, based on public as well as nonpublic information obtained through its surveillance and loss mitigation activities.
Changes over a reporting period in the Company’s loss estimates for public finance obligations supported by specified revenue streams, such as revenue bonds issued by toll road authorities, municipal utilities, airport authorities or healthcare systems, generally will be influenced by factors impacting their revenue levels, such as changes in demand; changing demographics; and other economic factors, especially if the obligations do not benefit from financial support from other tax revenues or governmental authorities. Changes over a reporting period in the Company’s loss estimates for its tax-supported and general obligation public finance transactions generally will be influenced by factors impacting the public issuer’s ability and willingness to pay, such as changes in the economy and population of the relevant area; changes in the issuer’s ability or willingness to raise taxes, decrease spending or receive federal assistance; new legislation; rating agency actions that affect the issuer’s ability to refinance maturing obligations or issue new debt at a reasonable cost; changes in the priority or amount of pensions and other obligations owed to workers; developments in restructuring or settlement negotiations; and other political and economic factors. Changes in loss estimates may also be affected by the Company’s loss mitigation efforts and other variables.
Changes in the Company’s loss estimates for structured finance transactions can be influenced by the performance of the assets supporting those transactions, by macroeconomic factors and by specific actions taken to mitigate losses. For example, changes over a reporting period in the Company’s loss estimates for its RMBS transactions may be influenced by factors such as prepayments, the level and timing of loan defaults experienced, changes in housing prices, discount rates and results from the Company’s loss mitigation activities. In recent years, expected losses to be paid (recovered) for U.S. RMBS have also been affected by changes in the amount of recoveries on first lien deferred principal balances and second-lien charged-off loans.
Actual losses will ultimately depend on future events, transaction performance or other factors that are difficult to predict. As a result, the Company’s current projections of certain losses may be subject to considerable uncertainty and may not reflect the Company’s ultimate claims paid.
In some instances, the terms of the Company’s policy or the terms of certain workout orders and resolutions give it the option to pay principal losses that have been recognized in the transaction but which it is not yet required to pay, thereby reducing the amount of guaranteed interest due in the future. The Company has sometimes exercised this option, which results in an acceleration of cash outflows but reduces overall losses paid.
The Company’s reserve committees estimate expected loss to be paid (recovered) by reviewing analyses that consider various scenarios with corresponding probabilities assigned to them. Depending upon the characteristics of the risk, the Company’s view of the potential size of any loss and the information available to the Company, that analysis may be based upon individually developed cash flow models, internal credit rating assessments, sector-driven loss severity assumptions and/or judgmental assessments. In the case of its assumed business, the Company may conduct its own analysis or use loss estimates provided by ceding insurers. Each quarter, the Company’s reserve committees review and refresh their loss projection assumptions, scenarios and the probabilities they assign to those scenarios based on developments during the period and their view of future performance.
Assured Guaranty Ltd.
Notes to Consolidated Financial Statements, Continued
Net Expected Loss to be Paid (Recovered) and Net Economic Loss Development (Benefit)
by Accounting Model
| | | | | | | | | | | | | | | | | | | | | | | | | | | | | | | | |
| | Net Expected Loss to be Paid (Recovered) | | Net Economic Loss Development (Benefit) |
| | As of December 31, | | Year Ended December 31, |
| Accounting Model | | 2024 | | 2023 | | 2024 | | 2023 | | 2022 |
| | | (in millions) | | |
| Insurance (see Note 5) | | $ | 90 | | | $ | 263 | | | $ | (1) | | | $ | 174 | | | $ | (112) | |
| FG VIEs (see Note 8) (1) | | 16 | | | 240 | | | (1) | | | (11) | | | (17) | |
| Credit derivatives (see Note 6) | | — | | | 2 | | | (1) | | | 1 | | | 4 | |
| Total | | $ | 106 | | | $ | 505 | | | $ | (3) | | | $ | 164 | | | $ | (125) | |
____________________
(1) In 2023, the net expected loss to be paid for FG VIEs primarily related to trusts established as a result of the Company’s resolution in 2022 of exposure to insured Puerto Rico credits experiencing payment default other than PREPA (2022 Puerto Rico Resolutions) (Puerto Rico Trusts), and in 2024 the Company satisfied its remaining direct insured obligations and deconsolidated the remaining Puerto Rico Trusts.
The following tables present a roll forward of net expected loss to be paid (recovered) for all contracts, which are accounted for under one of the following accounting models: insurance, derivative or FG VIE. The Company used risk-free rates that ranged from 1.98% to 5.22% with a weighted average of 4.38% as of December 31, 2024 and 1.90% to 5.40% with a weighted average of 4.09% as of December 31, 2023.
Net Expected Loss to be Paid (Recovered)
Roll Forward
| | | | | | | | | | | | | | | | | |
| Year Ended December 31, |
| | 2024 | | 2023 | | 2022 |
| | (in millions) |
| Net expected loss to be paid (recovered), beginning of period | $ | 505 | | | $ | 522 | | | $ | 411 | |
| Economic loss development (benefit) due to: | | | | | |
| Accretion of discount | 16 | | | 20 | | | 16 | |
| Changes in discount rates | 4 | | | 3 | | | (115) | |
| Changes in timing and assumptions | (23) | | | 141 | | | (26) | |
| Total economic loss development (benefit) | (3) | | | 164 | | | (125) | |
| Net (paid) recovered losses (1) | (396) | | | (181) | | | 236 | |
| Net expected loss to be paid (recovered), end of period | $ | 106 | | | $ | 505 | | | $ | 522 | |
____________________
(1) Net (paid) recovered losses includes (i) securities received as recoveries in 2022 in connection with the 2022 Puerto Rico Resolutions, and in 2023 in connection with the satisfaction of insurance obligations in the Puerto Rico Trusts, and (ii) claims paid in 2022, 2023 and 2024 to extinguish certain insured Puerto Rico exposures.
Assured Guaranty Ltd.
Notes to Consolidated Financial Statements, Continued
Net Expected Loss to be Paid (Recovered)
Roll Forward by Sector
| | | | | | | | | | | | | | | | | | | | | | | | | | |
| | Year Ended December 31, 2024 |
| Sector | | Net Expected Loss to be Paid (Recovered) as of December 31, 2023 | | Net Economic Loss
Development (Benefit) | | Net
(Paid)
Recovered
Losses (1) | | Net Expected Loss to be Paid (Recovered) as of December 31, 2024 |
| | | (in millions) |
| Public finance: | | | | | | | | |
| U.S. public finance | | $ | 398 | | | $ | (9) | | | $ | (371) | | | $ | 18 | |
| Non-U.S. public finance | | 20 | | | 81 | | | (3) | | | 98 | |
| Public finance | | 418 | | | 72 | | | (374) | | | 116 | |
| Structured finance: | | | | | | | | |
| U.S. RMBS | | 43 | | | (75) | | | (11) | | | (43) | |
| Other structured finance | | 44 | | | — | | | (11) | | | 33 | |
| Structured finance | | 87 | | | (75) | | | (22) | | | (10) | |
| Total | | $ | 505 | | | $ | (3) | | | $ | (396) | | | $ | 106 | |
| | | | | | | | | | | | | | | | | | | | | | | | | | |
| | Year Ended December 31, 2023 |
| Sector | | Net Expected Loss to be Paid (Recovered) as of December 31, 2022 | | Net Economic Loss
Development (Benefit) | | Net
(Paid)
Recovered
Losses (1) | | Net Expected Loss to be Paid (Recovered) as of December 31, 2023 |
| | | (in millions) |
| Public finance: | | | | | | | | |
| U.S. public finance | | $ | 403 | | | $ | 201 | | | $ | (206) | | | $ | 398 | |
| Non-U.S. public finance | | 9 | | | 11 | | | — | | | 20 | |
| Public finance | | 412 | | | 212 | | | (206) | | | 418 | |
| Structured finance: | | | | | | | | |
| U.S. RMBS | | 66 | | | (56) | | | 33 | | | 43 | |
| Other structured finance | | 44 | | | 8 | | | (8) | | | 44 | |
| Structured finance | | 110 | | | (48) | | | 25 | | | 87 | |
| Total | | $ | 522 | | | $ | 164 | | | $ | (181) | | | $ | 505 | |
| | | | | | | | | | | | | | | | | | | | | | | | | | |
| | Year Ended December 31, 2022 |
| Sector | | Net Expected Loss to be Paid (Recovered) as of December 31, 2021 | | Net Economic Loss
Development (Benefit) | | Net
(Paid)
Recovered
Losses (1) | | Net Expected Loss to be Paid (Recovered) as of December 31, 2022 |
| | | (in millions) |
| Public finance: | | | | | | | | |
| U.S. public finance | | $ | 197 | | | $ | 19 | | | $ | 187 | | | $ | 403 | |
| Non-U.S. public finance | | 12 | | | (2) | | | (1) | | | 9 | |
| Public finance | | 209 | | | 17 | | | 186 | | | 412 | |
| Structured finance: | | | | | | | | |
| U.S. RMBS | | 150 | | | (143) | | | 59 | | | 66 | |
| Other structured finance | | 52 | | | 1 | | | (9) | | | 44 | |
| Structured finance | | 202 | | | (142) | | | 50 | | | 110 | |
| Total | | $ | 411 | | | $ | (125) | | | $ | 236 | | | $ | 522 | |
____________________(1) Net of ceded paid losses, whether or not such amounts have been settled with reinsurers. Ceded paid losses are typically settled 45 days after the end of the reporting period. Such amounts are recorded as reinsurance recoverable on paid losses in “other assets.”
The tables above include (i) net LAE paid of $30 million, $25 million and $33 million for the years ended
Assured Guaranty Ltd.
Notes to Consolidated Financial Statements, Continued
December 31, 2024, 2023 and 2022, respectively, and, (ii) net expected LAE to be paid of $11 million as of December 31, 2024 and $22 million as of December 31, 2023.
Public Finance
The largest components of the public finance net expected losses to be paid (recovered) relate to certain healthcare and U.K. regulated utilities exposures. The total net expected loss to be paid for U.S. public finance exposures is net of an expected recovery of certain claims already paid of $262 million and $193 million as of December 31, 2024 and December 31, 2023, respectively. In 2024, the economic loss development for public finance transactions was primarily attributable to higher expected losses for certain U.K. regulated utilities and certain Puerto Rico exposures, as well as changes in discount rates.
U.K. Regulated Utilities and European Renewable Energy
In the third quarter of 2024, the Company internally downgraded to BIG certain U.K. regulated utilities and European renewable energy transactions that are experiencing operational strain, high financing costs and/or other capital constraints.
Healthcare
Certain BIG healthcare exposures are experiencing rising labor costs due to competition for labor and shortages in certain markets. Additionally, inflation has increased the cost of medical supplies, medical equipment, and pharmacy products, while U.S. hospitals with large Medicaid and Medicare payor mixes have not seen reimbursement levels keep pace with rising costs. The combined revenue and expense challenges have led to cash flow and liquidity stress in certain transactions. In addition, certain credits are struggling to make necessary capital expenditures and improvements to facilities.
Puerto Rico
All of the Company’s insured exposure to the Commonwealth of Puerto Rico (Puerto Rico or the Commonwealth) and its various authorities and public corporations is rated BIG. Puerto Rico net par and net debt service outstanding as of December 31, 2024 were $637 million and $756 million respectively, compared with net par and net debt service outstanding as of December 31, 2023 of $1,105 million and $1,508 million, respectively. In 2024, the Company satisfied its remaining direct PRHTA insured obligations.
Defaulting Puerto Rico Exposure
As of December 31, 2024, the Company’s only unresolved outstanding insured Puerto Rico exposure subject to a payment default was the Puerto Rico Electric Power Authority (PREPA), which had net par and debt service outstanding of $532 million and $629 million, respectively. As of December 31, 2023, PREPA net par and debt service outstanding were $624 million and $751 million, respectively. The PREPA bonds are secured by a lien on the net revenues of the electric system. The default of PREPA’s obligations has been the subject of restructuring negotiations, mediation and litigation since 2014.
Puerto Rico Litigation
Currently, there are numerous legal actions relating to defaults by PREPA on debt service payments, and related matters, and the Company is a party to a number of them. The Company has taken legal action, and may take additional legal action in the future, to enforce its rights with respect to the remaining Puerto Rico obligations it still insures. In addition, the Commonwealth, the Financial Oversight and Management Board (the FOMB) and others have taken legal action naming the Company as a party.
Certain legal actions involving the Company and relating to defaults by the Commonwealth and its authorities and public corporations were resolved in 2022. The remaining proceedings relate to PREPA’s default, including recently active proceedings and a number of proceedings that remain stayed pending the United States District Court of the District of Puerto Rico’s (Federal District Court of Puerto Rico) determination on the FOMB PREPA Plan, as described below.
Assured Guaranty Ltd.
Notes to Consolidated Financial Statements, Continued
PREPA – Current Proceedings
On April 8, 2022, the Federal District Court of Puerto Rico issued an order appointing three U.S. Bankruptcy Judges as members of a PREPA mediation team. The Federal District Court of Puerto Rico also entered a separate order establishing the terms and conditions of mediation.
Plan of Adjustment and Disclosure Statement. The FOMB which was established under the Puerto Rico Oversight, Management, and Economic Stability Act (PROMESA) filed an initial plan of adjustment and disclosure statement for PREPA with the Federal District Court of Puerto Rico on December 16, 2022. On November 17, 2023, the Federal District Court of Puerto Rico approved the supplemental disclosure statement (Supplemental Disclosure Statement) supporting the PREPA plan of adjustment filed by the FOMB (as amended or modified from time to time). On February 16, 2024, the FOMB filed with the Federal District Court of Puerto Rico its most recent plan of adjustment for PREPA, the Modified Fourth Amended Title III Plan of Adjustment (FOMB PREPA Plan). The Supplemental Disclosure Statement and the FOMB PREPA Plan are based on the last revised PREPA fiscal plan certified by the FOMB on June 23, 2023. The confirmation hearing for the FOMB PREPA Plan occurred in March 2024. At the end of the hearing, the Federal District Court of Puerto Rico stated that it was taking the confirmation of the FOMB PREPA Plan under advisement and gave no indication of timing for an opinion or order.
Lien Challenge Adversary Proceeding and Appeal. On March 22, 2023, the Federal District Court of Puerto Rico held that the PREPA bondholders had perfected liens only in revenues that had been deposited in the sinking fund established under the PREPA trust agreement and related funds over which the bond trustee had control but did not have a lien on future revenues until deposited in those funds. The Federal District Court of Puerto Rico also held, however, that PREPA bondholders do have recourse under the PREPA trust agreement in the form of an unsecured net revenue claim. At that time, the Federal District Court of Puerto Rico declined to value the unsecured net revenue claim or the method for its determination. The ultimate value of the claim, according to the Federal District Court of Puerto Rico, should be determined through a claim estimation proceeding.
On June 26, 2023 the Federal District Court of Puerto Rico issued an opinion and order estimating the unsecured net revenue claim to be $2.4 billion as of July 3, 2017. Subject to their appeal of the Federal District Court of Puerto Rico’s ruling on the scope of lien, PREPA bondholders had sought an unsecured net revenue claim of approximately $8.5 billion.
On November 28, 2023, the Federal District Court of Puerto Rico finally adjudicated all claims and counterclaims in the PREPA lien challenge adversary proceeding.
On November 30, 2023, the Company filed a notice of appeal with the United States Court of Appeals for the First Circuit (First Circuit) for portions of the March 22, 2023 decision, including the lien scope ruling and the need for a claim estimation proceeding, as well as the June 26, 2023 claim estimation ruling. On June 12, 2024, the First Circuit held that bondholders have a claim against PREPA for the full principal amount of the bonds, plus matured interest, that there was no need for a claim estimation proceeding because the PREPA bonds specify the amount that PREPA legally owes bondholders, and that the claim is secured by PREPA’s net revenues, including future net revenues.
The FOMB asked the First Circuit to reconsider its determination that bondholders’ security interest in future net revenues is perfected twice, once on June 26, 2024, and again on November 27, 2024. The First Circuit denied both requests, with the most recent denial published on December 31, 2024.
PREPA Mediation and Stayed Proceedings
On July 10, 2024, the Federal District Court of Puerto Rico ordered the FOMB and bondholders to resume mediation and instituted a 60-day stay of all PREPA litigation. The Federal District Court of Puerto Rico most recently extended the PREPA litigation stay through March 24, 2025 and the term of mediation through April 30, 2025.
The following proceedings involving the Company and relating to the default by PREPA remain stayed in the Federal District Court of Puerto Rico pending its determination on the FOMB PREPA Plan:
• AG motion to compel the FOMB to certify the PREPA restructuring support agreement executed in May 2019 (PREPA RSA) for implementation under Title VI of PROMESA.
• AG motion to dismiss PREPA’s Title III Bankruptcy proceeding or, in the alternative, to lift the PROMESA automatic stay to allow for the appointment of a receiver.
Assured Guaranty Ltd.
Notes to Consolidated Financial Statements, Continued
• Adversary complaint by certain fuel line lenders of PREPA against AG, among other parties, including various PREPA bondholders and bond insurers, seeking, among other things, declarations that there is no valid lien securing the PREPA bonds unless and until such lenders are paid in full, as well as orders subordinating the PREPA bondholders’ lien and claims to such lenders’ claims, and declaring the PREPA RSA null and void.
• AG motion to intervene in lawsuit by the retirement system for PREPA employees against, among others, the FOMB, PREPA, the Commonwealth, and the trustee for PREPA bondholders seeking, among other things, declarations that there is no valid lien securing the PREPA bonds other than on amounts in the sinking funds, and order subordinating the PREPA bondholders’ lien and claim to the PREPA employees’ claims.
Non-Defaulting Puerto Rico Exposure
As of December 31, 2024 and December 31, 2023, the Company had $92 million and $109 million, respectively, of remaining non-defaulting Puerto Rico net par outstanding related primarily to the Puerto Rico Municipal Finance Agency (MFA). The MFA exposures are secured by a lien on local tax revenues and remain current on debt service payments.
U.S. RMBS Loss Projections
The Company projects losses on its insured U.S. RMBS on a transaction-by-transaction basis by projecting the performance of the underlying pool of mortgages over time and then applying the structural features (e.g., payment priorities and tranching) of the RMBS and any expected representation and warranty recoveries/payables to the projected performance of the collateral over time. The resulting projected claim payments or reimbursements are then discounted using risk-free rates.
The rate at which borrowers from a particular delinquency category (number of monthly payments behind) eventually default is referred to as the “liquidation rate.” The Company derives its liquidation rate assumptions from observed roll rates, which are the rates at which loans progress from one delinquency category to the next and eventually to default and liquidation. The Company applies liquidation rates to the mortgage loan collateral in each delinquency category and makes certain timing assumptions to project near-term mortgage collateral defaults from loans that are currently delinquent. Each quarter the Company reviews recent third party data and (if necessary) adjusts its liquidation rates based on its observations.
Performing borrowers that eventually default will also need to progress through delinquency categories before any defaults occur. The Company projects how many of the currently performing loans will default and when they will default, by first converting the projected near term defaults of delinquent borrowers derived from liquidation rates into a vector of conditional default rates (CDR), then projecting how the CDR will develop over time. While the Company uses the liquidation rates to project defaults of non-performing loans (including current loans that were recently modified or delinquent), it projects defaults on presently current loans by applying a CDR curve. The start of that CDR curve is based on the defaults the Company projects will emerge from currently nonperforming, recently nonperforming and modified loans. The total amount of expected defaults from the non-performing loans is translated into a constant CDR (i.e., the CDR plateau), which, if applied for each of the next 36 months, results in the projection of the defaults that are expected to emerge from the various delinquency categories. The CDR thus calculated individually on the delinquent collateral pool for each RMBS is then used as the starting point for the CDR curve used to project defaults of the presently performing loans.
In order to derive collateral pool losses from the collateral pool defaults it has projected, the Company applies a loss severity. The loss severity is the amount of loss the transaction experiences on a defaulted loan after the application of net proceeds from the disposal of the underlying property. The Company projects loss severities by sector and vintage based on its experience to date. The Company continues to update its evaluation of these loss severities as new information becomes available.
The Company incorporates a recovery assumption into its loss modeling to reflect observed trends in recoveries of deferred principal balances of modified first lien loans that had been previously written off. For transactions where the Company has detailed loan information, the Company assumes that a percentage of the deferred loan balances will eventually be recovered upon sale of the collateral or refinancing of the loans. In 2024, due to observed trends and high levels of home equity, the Company increased its scenario-based recovery assumptions such that the weighted average recovery percentage increased from 30% to approximately 50%. The effect of these updated assumptions on expected losses was a benefit of $15 million in 2024.
Assured Guaranty Ltd.
Notes to Consolidated Financial Statements, Continued
When a second lien loan defaults, there is generally a low recovery. The Company assumed that it will generally recover 2% of future defaulting collateral at the time of charge-off. Additional amounts of post charge-off recoveries are projected to come in evenly over the next five years in instances where the Company is able to obtain information on the lien status and the second lien is still intact. The Company evaluates its assumptions quarterly based on actual recoveries of charged-off loans observed from period to period and reasonable expectations of future recoveries. During 2024, due to observed trends and high levels of home equity, the Company updated its assumptions of such recoveries to reflect a base scenario and a weighted average recovery of 50%, up from 40%, which resulted in a benefit of $29 million.
The Company projects the overall future cash flow from a collateral pool by adjusting the payment stream from the principal and interest contractually due on the underlying mortgages for the collateral losses it projects as described above; assumed voluntary prepayments; and servicer advances. The Company then applies an individual model of the structure of the transaction to the projected future cash flow from that transaction’s collateral pool to project the Company’s future claims and claim reimbursements for that individual transaction. Finally, the projected claims and reimbursements are discounted using risk-free rates. The Company runs several sets of assumptions regarding mortgage collateral performance, or scenarios, which are probability weighted.
Each period the Company reviews the assumptions it uses to make RMBS loss projections with consideration of updates on the performance of its insured transactions (including early-stage delinquencies, late-stage delinquencies and loss severity) as well as the residential property market and economy in general. To the extent it observes changes, it makes a judgment as to whether those changes are normal fluctuations or part of a more prolonged trend.
Expected losses are also a function of the structure of the transaction, the prepayment speeds of the collateral, the interest rate environment and assumptions about loss severity.
Net Economic Loss Development (Benefit)
U.S. RMBS
| | | | | | | | | | | | | | | | | |
| Year Ended December 31, |
| 2024 | | 2023 | | 2022 |
| | (in millions) |
| First lien U.S. RMBS | $ | (27) | | | $ | (7) | | | $ | (36) | |
| Second lien U.S. RMBS | (48) | | | (49) | | | (107) | |
| Total U.S. RMBS economic loss development (benefit) | $ | (75) | | | $ | (56) | | | $ | (143) | |
First Lien U.S. RMBS Loss Projections: Alt-A, Prime, Option ARM and Subprime
The majority of projected losses in first lien U.S. RMBS transactions are expected to come from non-performing mortgage loans (those that are or have recently been two or more payments behind, have been modified, are in foreclosure, or have been foreclosed upon). Collateral losses are projected to be offset by recoveries on deferred principal balances.
In the base scenario, the Company assumes the final CDR will be reached one year after the 36-month CDR plateau period. The Company then assumes that loss severities begin returning to levels consistent with underwriting assumptions beginning after the initial 18-month period, staying or trending, as applicable, to 40% in the base scenario over 2.5 years.
The following table shows the range as well as the average, weighted by outstanding net insured par, for key assumptions used in the calculation of expected loss to be paid (recovered) for individual transactions for vintage 2004 - 2008 first lien U.S. RMBS.
Assured Guaranty Ltd.
Notes to Consolidated Financial Statements, Continued
Key Assumptions in Base Scenario Expected Loss Estimates
First Lien U.S. RMBS
| | | | | | | | | | | | | | | | | | | | | | | | | | | | | | | | | | | |
| | As of December 31, 2024 | | As of December 31, 2023 |
| Range | | Weighted Average | | Range | | Weighted Average |
| Plateau CDR | 0.0 | % | – | 8.8% | | 3.4% | | 0.0 | % | – | 10.0% | | 4.2% |
| Final CDR | 0.0 | % | – | 0.4% | | 0.2% | | 0.0 | % | – | 0.5% | | 0.2% |
| Initial loss severity | 40.0 | % | – | 50.0% | | 43.1% | | 50% | | |
| Future recovery for deferred principal balances | 50% | | | | 30% | | |
| Liquidation rates (1) | 20 | % | – | 50% | | | | 20 | % | – | 65% | | |
____________________
(1) The liquidation rates range from current but recently delinquent loans to foreclosed loans.
Certain transactions benefit from excess spread (the amount by which the interest paid by the borrowers on the underlying loan exceeds the amount of interest owed on the insured obligations) when they are supported by large portions of fixed rate assets (either originally fixed or modified to be fixed) but have insured floating rate debt linked to the Secured Overnight Finance Rate (SOFR). An increase in projected SOFR decreases excess spread, while lower SOFR projections result in higher excess spread.
The Company establishes its scenarios by increasing and decreasing the periods and levels of stress from those used in the base scenario. In the Company’s most stressful scenario where 20% of deferred principal balances are assumed to be recovered, loss severities experience stress for nine years and the initial ramp-down of the CDR was assumed to occur over 16 months, expected loss to be paid would increase from current projections by approximately $31 million for all first lien U.S. RMBS transactions. In the Company’s least stressful scenario where 80% of deferred principal balances are assumed to be recovered, the CDR plateau was six months shorter (30 months, effectively assuming that liquidation rates would improve) and the CDR recovery was more pronounced (including an initial ramp-down of the CDR over eight months), expected loss to be paid would decrease from current projections by approximately $28 million for all first lien U.S. RMBS transactions.
Second Lien U.S. RMBS Loss Projections
Second lien U.S. RMBS transactions include both home equity lines of credit (HELOC) and closed end second lien mortgages. The Company believes the most important driver of its projected second lien U.S. RMBS losses is the performance of its HELOC transactions. The Company believes the primary variable affecting its expected losses in second lien U.S. RMBS transactions is the amount and timing of future losses or recoveries in the collateral pool supporting the transactions (including recoveries from previously charged-off loans).
For the base scenario, the CDR plateau is held constant for 36 months. Once the plateau period ends, the CDR is assumed to trend down in uniform increments for one year to its final long-term steady state CDR (5% of original plateau).
The following table shows the range as well as the average, weighted by net par outstanding, for key assumptions used in the calculation of expected loss to be paid (recovered) for individual transactions for vintage 2004 - 2008 HELOCs.
Key Assumptions in Base Scenario Expected Loss Estimates
HELOCs
| | | | | | | | | | | | | | | | | | | | | | | | | | | | | | | | | | | |
| As of December 31, 2024 | | As of December 31, 2023 |
| Range | | Weighted Average | | Range | | Weighted Average |
| Plateau CDR | 0.0 | % | – | 5.6% | | 2.2% | | 0.0 | % | – | 9.3% | | 2.6% |
| Final CDR | 0.0 | % | – | 0.3% | | 0.1% | | 0.0 | % | – | 0.5% | | 0.1% |
| Liquidation rates (1) | 20 | % | – | 55% | | | | 20 | % | – | 60% | | |
| Loss severity on future defaults | 98% | | | | 98% | | |
| Projected future recoveries on previously charged-off loans | 50% | | | | 40% | | |
____________________
(1) The liquidation rates range from current but recently delinquent loans to foreclosed loans.
Assured Guaranty Ltd.
Notes to Consolidated Financial Statements, Continued
The Company modeled scenarios with a longer period of elevated defaults and others with a shorter period of elevated defaults as well as various levels of assumed recoveries. In the Company’s most stressful scenario, assuming 20% recoveries on charged-off loans, increasing the CDR plateau to 42 months, increasing the ramp-down by four months to 16 months (for a total stress period of 58 months) and using the ultimate prepayment rate of 15% would decrease the expected recovery by approximately $78 million for HELOC transactions. On the other hand, in the Company’s least stressful scenario, assuming 80% recoveries on charged-off loans, reducing the CDR plateau to 30 months, decreasing the length of the CDR ramp-down to eight months (for a total stress period of 38 months) and lowering the ultimate prepayment rate to 10% would increase the expected recovery by approximately $78 million for HELOC transactions.
Recovery Litigation and Dispute Resolution
In the ordinary course of their respective businesses, certain of AGL’s subsidiaries are involved in litigation or other dispute resolution with third parties to recover insurance losses paid or return benefits received in prior periods or prevent or reduce losses in the future. The impact, if any, of these and other proceedings on the amount of recoveries the Company ultimately receives and losses it pays in the future is uncertain, and the impact of any one or more of these proceedings during any quarter or year could be material to the Company’s financial statements.
The Company has asserted claims in a number of legal proceedings in connection with its exposure to Puerto Rico. See above for a discussion of the Company’s exposure to Puerto Rico and related recovery litigation being pursued by the Company.
5. Contracts Accounted for as Insurance
The portfolio of outstanding exposures discussed in Note 3, Outstanding Exposure, and Note 4, Expected Loss to be Paid (Recovered), includes contracts that are accounted for as insurance contracts, derivatives and consolidated FG VIEs. Amounts presented in this note relate only to contracts accounted for as insurance, unless otherwise specified. See Note 6, Contracts Accounted for as Credit Derivatives, for amounts related to CDS and Note 8, Financial Guaranty Variable Interest Entities and Consolidated Investment Vehicles, for amounts related to consolidated FG VIEs.
Premiums
Accounting Policy
Financial guaranty contracts that meet the scope exception under derivative accounting guidance are subject to industry specific accounting guidance for financial guaranty insurance.
Premiums receivable represent the present value of contractual or expected future premium collections, discounted using risk-free rates. Unearned premium reserve represents deferred premium revenue less claim payments made (net of recoveries received) that have not yet been recognized in the statement of operations (i.e., contra-paid). The following discussion relates to the deferred premium revenue component of the unearned premium reserve, while the contra-paid is discussed below under “Losses and Recoveries.”
The amount of deferred premium revenue at contract inception is determined as follows:
•For premiums received upfront on financial guaranty insurance contracts that were originally underwritten by the Company, deferred premium revenue is equal to the amount of cash received. Upfront premiums typically relate to public finance transactions.
•For premiums received in installments on financial guaranty insurance contracts that were originally underwritten by the Company, deferred premium revenue is calculated as the present value (discounted at risk free rates) of either: (i) contractual premiums due; or (ii) in cases where the underlying collateral is composed of homogeneous pools of assets, the expected premiums to be collected over the life of the contract. To be considered a homogeneous pool of assets, prepayments must be contractually allowable, the amount of prepayments must be probable, and the timing and amount of prepayments must be reasonably estimable. Installment premiums typically relate to structured finance (e.g., securitized debt) and infrastructure transactions, where the insurance premium rate is determined at the inception of the contract, but the insured par is subject to prepayment throughout the life of the transaction.
Assured Guaranty Ltd.
Notes to Consolidated Financial Statements, Continued
•For financial guaranty insurance contracts acquired in a business combination, deferred premium revenue is equal to the fair value of the Company’s stand-ready obligation portion of the insurance contract, at the date of acquisition, based on what a hypothetical similarly rated financial guaranty insurer would have charged for the contract at that date (not the discounted future cash flows under the insurance contract). The amount of deferred premium revenue may differ significantly from cash collections primarily due to fair value adjustments recorded in connection with a business combination.
When the Company adjusts prepayment assumptions for expected premium collections for obligations backed by homogeneous pools of contractually prepayable assets, an adjustment is recorded to the deferred premium revenue, with a corresponding adjustment to premiums receivable. Premiums receivable are discounted at the risk-free rate at inception and such discount rate is updated only when changes to prepayment assumptions are made that change the expected date of final maturity. Accretion of the discount on premiums receivable is reported in “net earned premiums.”
The Company recognizes deferred premium revenue as earned premium over the contractual period or expected period of the contract in proportion to the amount of insurance protection provided. As premium revenue is recognized, a corresponding decrease to the deferred premium revenue is recorded. The amount of insurance protection provided is a function of the insured par amount outstanding. Accordingly, the proportionate share of premium revenue recognized in a given reporting period is a constant rate calculated based on the relationship between the insured par amounts outstanding in the reporting period compared with the sum of each of the insured par amounts outstanding for all periods. When an insured financial obligation is retired before its maturity, the financial guaranty insurance contract is extinguished, and any nonrefundable deferred premium revenue related to that contract is accelerated and recognized as premium revenue. Any unamortized acquisition costs are expensed. The Company assesses the need for an allowance for credit loss on premiums receivable each reporting period.
For assumed reinsurance contracts, net earned premiums reported in the consolidated statements of operations are calculated based upon data received from ceding companies; however, some ceding companies report premium data between 30 and 90 days after the end of the reporting period. The Company estimates net earned premiums for the lag period. Differences between such estimates and actual amounts are recorded in the period in which the actual amounts are determined. When installment premiums are related to assumed reinsurance contracts, the Company assesses the credit quality and available liquidity of the ceding companies and the impact of any potential regulatory constraints to determine the collectability of such amounts.
Ceded unearned premium reserve is recorded as an asset. Direct, assumed and ceded earned premiums are presented together as net earned premiums in the consolidated statements of operations. Any premiums related to FG VIEs are eliminated in consolidation.
Insurance Contracts’ Premium Information
Net Earned Premiums
| | | | | | | | | | | | | | | | | |
| | Year Ended December 31, |
| | 2024 | | 2023 | | 2022 |
| | (in millions) |
| Financial guaranty insurance: | | | | | |
| Scheduled net earned premiums | $ | 293 | | | $ | 285 | | | $ | 287 | |
| Accelerations from refundings and terminations (1) | 71 | | | 29 | | | 179 | |
| Accretion of discount on net premiums receivable | 31 | | | 26 | | | 24 | |
| Financial guaranty insurance net earned premiums | 395 | | | 340 | | | 490 | |
| Specialty net earned premiums | 8 | | | 4 | | | 4 | |
| Net earned premiums | $ | 403 | | | $ | 344 | | | $ | 494 | |
____________________(1) 2022 accelerations include $133 million related to 2022 Puerto Rico Resolutions. See Note 4, Expected Loss to be Paid (Recovered), for additional information.
Assured Guaranty Ltd.
Notes to Consolidated Financial Statements, Continued
Gross Premium Receivable, Net of Commissions Payable on Assumed Business
Roll Forward
| | | | | | | | | | | | | | | | | |
| | Year Ended December 31, |
| | 2024 | | 2023 | | 2022 |
| | (in millions) |
| Beginning of year | $ | 1,468 | | | $ | 1,298 | | | $ | 1,372 | |
| Less: Specialty insurance premium receivable | 1 | | | 1 | | | 1 | |
| Financial guaranty insurance premiums receivable | 1,467 | | | 1,297 | | | 1,371 | |
| New business and supplemental premiums, net of commissions | 467 | | | 353 | | | 356 | |
| Gross premiums received, net of commissions | (354) | | | (261) | | | (345) | |
| Adjustments: | | | | | |
| Changes in the expected term and debt service assumptions | (32) | | | 1 | | | 2 | |
| Accretion of discount, net of commissions on assumed business | 26 | | | 26 | | | 24 | |
| Foreign exchange gain (loss) on remeasurement | (24) | | | 51 | | | (111) | |
| Financial guaranty insurance premium receivable | 1,550 | | | 1,467 | | | 1,297 | |
| Specialty insurance premium receivable | 1 | | | 1 | | | 1 | |
| December 31, | $ | 1,551 | | | $ | 1,468 | | | $ | 1,298 | |
Approximately 69% and 70% of gross premiums receivable, net of commissions payable at December 31, 2024 and December 31, 2023, respectively, are denominated in currencies other than the U.S. dollar, primarily the pound sterling and euro.
The timing and cumulative amount of actual collections and net earned premiums may differ from those of expected collections and of expected net earned premiums in the table below due to factors such as foreign exchange rate fluctuations, counterparty collectability issues, accelerations, commutations, restructurings, changes in the consumer price indices, changes in expected lives and new business.
Assured Guaranty Ltd.
Notes to Consolidated Financial Statements, Continued
Financial Guaranty Insurance
Expected Future Premium Collections and Earnings
| | | | | | | | | | | | | | | | | | | | | | | |
| | As of December 31, 2024 |
| | | Future Net Premiums to be Earned (2) |
| Future Premiums
to be Collected (1) | | Earnings of Deferred Premium Revenue | | Accretion of
Discount | | Total |
| | (in millions) |
| 2025 (January 1 - March 31) | $ | 69 | | | $ | 76 | | | $ | 9 | | | $ | 85 | |
| 2025 (April 1 - June 30) | 48 | | | 75 | | | 9 | | | 84 | |
| 2025 (July 1 - September 30) | 33 | | | 74 | | | 9 | | | 83 | |
| 2025 (October 1 - December 31) | 38 | | | 72 | | | 8 | | | 80 | |
| Subtotal 2025 | 188 | | | 297 | | | 35 | | | 332 | |
| 2026 | 125 | | | 275 | | | 33 | | | 308 | |
| 2027 | 119 | | | 259 | | | 31 | | | 290 | |
| 2028 | 113 | | | 246 | | | 29 | | | 275 | |
| 2029 | 100 | | | 227 | | | 27 | | | 254 | |
| 2030-2034 | 407 | | | 917 | | | 115 | | | 1,032 | |
| 2035-2039 | 312 | | | 597 | | | 84 | | | 681 | |
| 2040-2044 | 239 | | | 389 | | | 55 | | | 444 | |
| 2045-2049 | 182 | | | 259 | | | 32 | | | 291 | |
| 2050-2054 | 113 | | | 137 | | | 15 | | | 152 | |
| After 2054 | 121 | | | 109 | | | 12 | | | 121 | |
| Total | $ | 2,019 | | | $ | 3,712 | | | $ | 468 | | | $ | 4,180 | |
____________________
(1) Net of assumed commissions payable.
(2) Net of reinsurance.
Selected Information for Financial Guaranty Insurance Policies with Premiums Paid in Installments
| | | | | | | | | | | |
| As of December 31, |
| | 2024 | | 2023 |
| | (dollars in millions) |
| Premiums receivable, net of commissions payable | $ | 1,550 | | $ | 1,467 |
| Deferred premium revenue | $ | 1,901 | | $ | 1,768 |
| Weighted average risk-free rate used to discount premiums | 2.5% | | 2.1% |
| Weighted average period of premiums receivable (in years) | 12.3 | | 12.5 |
Policy Acquisition Costs
Accounting Policy
Deferred acquisition costs (DAC) reported on the consolidated balance sheet represent the unamortized portion of (i) policy acquisition costs that are directly related and essential to the successful acquisition of an insurance contract and (ii) ceding commission income and expense. Deferred policy acquisition costs include the cost of underwriting personnel attributable to successful underwriting efforts. The Company conducts time studies, which requires the use of judgment, to estimate the amount of costs to be deferred.
DAC is generally amortized in proportion to net earned premiums. Amortization of deferred policy acquisition costs includes the accretion of discount on ceding commission receivable and payable. When an insured obligation is retired early, the remaining related DAC is expensed at that time.
Costs incurred for soliciting potential customers, market research, training, administration, unsuccessful acquisition efforts and product development as well as overhead costs are charged to expense as incurred.
Assured Guaranty Ltd.
Notes to Consolidated Financial Statements, Continued
Expected losses and LAE, investment income and the remaining costs of servicing the insured or reinsured business are considered in determining the recoverability of DAC.
Policy Acquisition Costs
Roll Forward of Deferred Acquisition Costs
| | | | | | | | | | | | | | | | | |
| Year Ended December 31, |
| 2024 | | 2023 | | 2022 |
| (in millions) |
| Beginning of year | $ | 161 | | | $ | 147 | | | $ | 131 | |
| Costs deferred during the period | 35 | | | 27 | | | 30 | |
| Costs amortized during the period | (20) | | | (13) | | | (14) | |
| December 31, | $ | 176 | | | $ | 161 | | | $ | 147 | |
Losses and Recoveries
Accounting Policies
Loss and LAE Reserve
Loss and LAE reserve reported on the consolidated balance sheets relates only to direct and assumed reinsurance contracts that are accounted for as insurance, substantially all of which are financial guaranty insurance contracts. The portion of any contract’s reserve that is ceded to a reinsurer is reported as reinsurance recoverable on unpaid losses and reported in “other assets.” Any loss and LAE reserves related to FG VIEs are eliminated upon consolidation. Any expected losses to be paid (recovered) on credit derivatives are reflected in the fair value of credit derivatives.
Under financial guaranty insurance accounting, the sum of unearned premium reserve and loss and LAE reserve represents the Company’s stand‑ready obligation. A loss and LAE reserve for a financial guaranty insurance contract is recorded only to the extent and for the amount that expected loss to be paid plus contra-paid (total losses) exceed the deferred premium revenue, on a contract-by-contract basis. As a result, the Company has expected loss to be paid that has not yet been expensed. Such amounts will be recognized in future periods as deferred premium revenue amortizes into income.
When a claim or LAE payment is made on a contract, the Company first reduces any recorded loss and LAE reserve. To the extent there is insufficient loss and LAE reserve on a contract, then such claim payment is recorded as contra-paid, which reduces the unearned premium reserve. The contra-paid is recognized in “loss and loss adjustment expenses (benefit)” in the consolidated statement of operations when and for the amount that total losses exceed the remaining deferred premium revenue on the insurance contract. “Loss and loss adjustment expenses (benefit)” in the consolidated statement of operations is presented net of cessions to reinsurers.
Salvage and Subrogation Recoverable
Expected loss to be paid is reduced when a claim payment (or estimated future claim payment) entitles the Company to cash flows associated with salvage and subrogation rights from the underlying collateral of, or other recoveries relating to, an insured exposure. Such reduction in expected loss to be paid can result in one of the following: (i) a reduction in the corresponding loss and LAE reserve with a benefit to the consolidated statement of operations; (ii) no effect on the consolidated balance sheets or statements of operations if total loss is not in excess of deferred premium revenue; or (iii) the recording of a salvage asset with a benefit to the consolidated statements of operations if the transaction is in a net recovery position at the reporting date. The ceded component of salvage and subrogation recoverable is reported in “other liabilities.”
Expected Loss to be Expensed
Expected loss to be expensed represents past or expected future financial guaranty insurance net claim payments that have not yet been expensed. Such amounts will be expensed in future periods as deferred premium revenue amortizes into income. Expected loss to be expensed is the Company’s projection of incurred losses that will be recognized in future periods, excluding accretion of discount.
Assured Guaranty Ltd.
Notes to Consolidated Financial Statements, Continued
Insurance Contracts’ Losses Reported in the Consolidated Financial Statements
Loss and LAE reserve and salvage and subrogation recoverable are discounted at risk-free rates for financial guaranty insurance obligations that ranged from 1.98% to 5.22% with a weighted average of 4.38% as of December 31, 2024, and 1.90% to 5.40% with a weighted average of 4.15% as of December 31, 2023.
The following table provides information on net reserve (salvage), which includes loss and LAE reserves and salvage and subrogation recoverable, both net of reinsurance.
Net Reserve (Salvage) by Sector
| | | | | | | | | | | | | | |
| | As of December 31, |
| Sector | | 2024 | | 2023 |
| | | (in millions) |
| Public finance: | | | | |
| U.S. public finance | | $ | (14) | | | $ | 119 | |
| Non-U.S. public finance | | 5 | | | 1 | |
| Public finance | | (9) | | | 120 | |
| Structured finance: | | | | |
| U.S. RMBS | | (151) | | | (87) | |
| Other structured finance | | 33 | | | 42 | |
| Structured finance | | (118) | | | (45) | |
| Total | | $ | (127) | | | $ | 75 | |
The table below provides a reconciliation of net expected loss to be paid (recovered) for financial guaranty insurance contracts to net expected loss to be expensed. Expected loss to be paid (recovered) for financial guaranty insurance contracts differs from expected loss to be expensed due to: (i) the contra-paid, which represents the claim payments made and recoveries received that have not yet been recognized in the statements of operations; (ii) salvage and subrogation recoverable for transactions that are in a net recovery position where the Company has not yet received recoveries on claims previously paid (and therefore recognized in income but not yet received); and (iii) loss reserves that have already been established (and therefore expensed but not yet paid).
Reconciliation of Net Expected Loss to be Paid (Recovered) to Net Expected Loss to be Expensed
Financial Guaranty Insurance Contracts
| | | | | |
| As of December 31, 2024 |
| | (in millions) |
| Net expected loss to be paid (recovered) - financial guaranty insurance | $ | 89 | |
| Contra-paid, net | 23 | |
| Salvage and subrogation recoverable, net | 393 | |
| Loss and LAE reserve - financial guaranty insurance contracts, net of reinsurance | (265) | |
| Net expected loss to be expensed (present value) | $ | 240 | |
The following table provides a schedule of the expected timing of financial guaranty net expected losses to be expensed. The amount and timing of actual loss and LAE may differ from the estimates shown below due to factors such as accelerations, commutations, changes in expected lives and updates to loss estimates. This table excludes amounts related to FG VIEs, which are eliminated in consolidation.
Assured Guaranty Ltd.
Notes to Consolidated Financial Statements, Continued
Net Expected Loss to be Expensed
Financial Guaranty Insurance Contracts
| | | | | |
| | As of December 31, 2024 |
| | (in millions) |
| 2025 (January 1 - March 31) | $ | 3 | |
| 2025 (April 1 - June 30) | 4 | |
| 2025 (July 1 - September 30) | 3 | |
| 2025 (October 1 - December 31) | 3 | |
| Subtotal 2025 | 13 | |
| 2026 | 13 | |
| 2027 | 16 | |
| 2028 | 18 | |
| 2029 | 17 | |
| 2030-2034 | 78 | |
| 2035-2039 | 37 | |
| 2040-2044 | 12 | |
| 2045-2049 | 20 | |
| 2050-2054 | 14 | |
| After 2054 | 2 | |
| Net expected loss to be expensed (present value) | 240 | |
| Future expected accretion | (49) | |
| Total expected future loss and LAE | $ | 191 | |
The following table presents the loss and LAE (benefit) reported in the consolidated statements of operations by sector for insurance contracts.
Loss and LAE (Benefit) by Sector
| | | | | | | | | | | | | | | | | | | | |
| | | Year Ended December 31, |
| Sector | | 2024 | | 2023 | | 2022 |
| | (in millions) |
| Public finance: | | | | | | |
| U.S. public finance | | $ | 12 | | | $ | 192 | | | $ | 125 | |
| Non-U.S. public finance | | 4 | | | — | | | — | |
| Public finance | | 16 | | | 192 | | | 125 | |
| Structured finance: | | | | | | |
| U.S. RMBS | | (43) | | | (34) | | | (112) | |
| Other structured finance | | 1 | | | 4 | | | 3 | |
| Structured finance | | (42) | | | (30) | | | (109) | |
| Loss and LAE (benefit) | | $ | (26) | | | $ | 162 | | | $ | 16 | |
Assured Guaranty Ltd.
Notes to Consolidated Financial Statements, Continued
The following tables provide information on financial guaranty insurance contracts categorized as BIG.
Financial Guaranty Insurance
BIG Transaction Loss Summary
As of December 31, 2024
| | | | | | | | | | | | | | | | | | | | | | | | | | | | | |
| | Gross | | Net Total BIG |
| | BIG 1 | | BIG 2 | | BIG 3 | | Total BIG | |
| (dollars in millions) |
| Number of risks (1) | 98 | | | 12 | | | 97 | | | 207 | | | 207 | |
| Remaining weighted average period (in years) | 18.6 | | 8.8 | | 6.1 | | 16.6 | | 16.6 |
| | | | | | | | | |
| Outstanding exposure: | | | | | | | | | |
| Par | $ | 8,080 | | | $ | 702 | | | $ | 1,382 | | | $ | 10,164 | | | $ | 10,150 | |
| Interest | 7,546 | | | 371 | | | 421 | | | 8,338 | | | 8,335 | |
| Total (2) | $ | 15,626 | | | $ | 1,073 | | | $ | 1,803 | | | $ | 18,502 | | | $ | 18,485 | |
| | | | | | | | | |
| Expected cash outflows (inflows) | $ | 4,016 | | | $ | 342 | | | $ | 1,307 | | | $ | 5,665 | | | $ | 5,656 | |
| Potential recoveries (3) | (4,201) | | | (293) | | | (1,132) | | | (5,626) | | | (5,616) | |
| Subtotal | (185) | | | 49 | | | 175 | | | 39 | | | 40 | |
| Discount | 43 | | | 29 | | | (23) | | | 49 | | | 49 | |
| Expected losses to be paid (recovered) | $ | (142) | | | $ | 78 | | | $ | 152 | | | $ | 88 | | | $ | 89 | |
| | | | | | | | | |
| Deferred premium revenue | $ | 333 | | | $ | 49 | | | $ | 116 | | | $ | 498 | | | $ | 498 | |
| Reserves (salvage) | $ | (226) | | | $ | 35 | | | $ | 62 | | | $ | (129) | | | $ | (128) | |
Assured Guaranty Ltd.
Notes to Consolidated Financial Statements, Continued
Financial Guaranty Insurance
BIG Transaction Loss Summary
As of December 31, 2023
| | | | | | | | | | | | | | | | | | | | | | | | | | | | | |
| | Gross | | Net Total BIG |
| | BIG 1 | | BIG 2 | | BIG 3 | | Total BIG | |
| (dollars in millions) |
| Number of risks (1) | 95 | | | 13 | | | 109 | | | 217 | | | 217 | |
| Remaining weighted average period (in years) | 9.6 | | 15.9 | | 7.5 | | 9.9 | | 10.0 |
| | | | | | | | | |
| Outstanding exposure: | | | | | | | | | |
| Par | $ | 2,400 | | | $ | 979 | | | $ | 2,019 | | | $ | 5,398 | | | $ | 5,383 | |
| Interest | 1,126 | | | 896 | | | 818 | | | 2,840 | | | 2,836 | |
| Total (2) | $ | 3,526 | | | $ | 1,875 | | | $ | 2,837 | | | $ | 8,238 | | | $ | 8,219 | |
| | | | | | | | | |
| Expected cash outflows (inflows) | $ | 176 | | | $ | 187 | | | $ | 1,585 | | | $ | 1,948 | | | $ | 1,938 | |
| Potential recoveries (3) | (376) | | | (78) | | | (1,214) | | | (1,668) | | | (1,659) | |
| Subtotal | (200) | | | 109 | | | 371 | | | 280 | | | 279 | |
| Discount | 56 | | | (22) | | | (53) | | | (19) | | | (19) | |
| Expected losses to be paid (recovered) | $ | (144) | | | $ | 87 | | | $ | 318 | | | $ | 261 | | | $ | 260 | |
| | | | | | | | | |
| Deferred premium revenue | $ | 100 | | | $ | 63 | | | $ | 142 | | | $ | 305 | | | $ | 305 | |
| Reserves (salvage) | $ | (181) | | | $ | 45 | | | $ | 209 | | | $ | 73 | | | $ | 72 | |
__________________
(1) A risk represents the aggregate of the financial guaranty policies that share the same revenue source for purposes of making debt service payments.
(2) Includes amounts related to FG VIEs. The increase in BIG in 2024 relates mainly to the downgrade of certain U.K. regulated utilities.
(3) Represents expected inflows from future payments by obligors pursuant to restructuring agreements, settlements, excess spread on any underlying collateral and other estimated recoveries. Potential recoveries also include recoveries on certain investment grade credits, related mainly to exposures that were previously BIG and for which claims have been paid in the past.
Reinsurance
The Company cedes portions of its gross insured financial guaranty exposure (Ceded Financial Guaranty Business) to third-party insurers. This Ceded Financial Guaranty Business represents $497 million, or approximately 0.1%, of the Company’s total gross insured debt service of $416.5 billion, as of December 31, 2024. The Company also cedes $383 million of its $4.5 billion in gross insured specialty business exposure.
The following table presents the components of premiums and losses reported in the consolidated statements of operations attributable to the Assumed and Ceded Businesses (both financial guaranty and specialty insurance).
Assured Guaranty Ltd.
Notes to Consolidated Financial Statements, Continued
Components of Premiums Written, Premiums Earned and Loss and LAE (Benefit)
| | | | | | | | | | | | | | | | | |
| | Year Ended December 31, |
| | 2024 | | 2023 | | 2022 |
| | (in millions) |
| Premiums Written: | | | | | |
| Direct | $ | 436 | | | $ | 307 | | | $ | 377 | |
| Assumed (1) | 4 | | | 50 | | | (17) | |
| Ceded | (6) | | | (16) | | | — | |
| Net | $ | 434 | | | $ | 341 | | | $ | 360 | |
| | | | | |
| Premiums Earned: | | | | | |
| Direct | $ | 378 | | | $ | 319 | | | $ | 469 | |
| Assumed | 32 | | | 28 | | | 28 | |
| Ceded | (7) | | | (3) | | | (3) | |
| Net | $ | 403 | | | $ | 344 | | | $ | 494 | |
| | | | | |
| Loss and LAE (benefit): | | | | | |
| Direct (2) | $ | (30) | | | $ | 157 | | | $ | 32 | |
| Assumed | 3 | | | 8 | | | (17) | |
| Ceded | 1 | | | (3) | | | 1 | |
| Net | $ | (26) | | | $ | 162 | | | $ | 16 | |
____________________
(1) Negative assumed premiums written were due to terminations and changes in expected debt service schedules.
(2) See Note 4, Expected Loss to be Paid (Recovered), for additional information on the economic loss development (benefit).
6. Contracts Accounted for as Credit Derivatives
The Company’s credit derivatives primarily consist of insured CDS contracts. The Company does not enter into CDS contracts with the intent to trade these contracts and may not unilaterally terminate a CDS contract absent an event or default or termination event that entitles the Company to terminate the contract. The Company and its counterparties have negotiated the termination of certain contracts from time to time. Transactions are generally terminated for an amount that approximates the present value of future premiums or a negotiated amount, rather than fair value.
The terms of the Company’s CDS contracts differ from more standardized credit derivative contracts sold by companies outside the financial guaranty industry. The non-standard terms generally include the absence of collateral support agreements or immediate settlement provisions, and the Company’s insured exposure benefits from relatively high attachment points or other protections.
The Company’s credit derivatives are generally governed by International Swaps and Derivatives Association, Inc. documentation and have certain characteristics that differ from financial guaranty insurance contracts. For example, the Company’s control rights with respect to a reference obligation under a CDS may be more limited than when the Company issues a financial guaranty insurance contract. In addition, there are more circumstances under which the Company may be obligated to make payments. Similar to a financial guaranty insurance contract, the Company would be obligated to pay if the obligor failed to make a scheduled payment of principal or interest in full. In certain credit derivative transactions, the Company also specifically agreed to pay if the obligor were to become bankrupt or if the reference obligation were restructured. Furthermore, in certain credit derivative transactions, the Company may be required to make a payment due to an event that is unrelated to the performance of the obligation referenced in the credit derivative. If events of default or termination events specified in the credit derivative documentation were to occur, the non-defaulting or the non-affected party, which may be either the Company or the counterparty, depending upon the circumstances, may decide to terminate a credit derivative prior to maturity. In that case, the Company may be required to make a termination payment to its swap counterparty upon such termination. Absent such an event of default or termination event, the Company may not unilaterally terminate a credit derivative contract; however, the Company on occasion has mutually agreed to terminate certain CDS with related counterparties.
Assured Guaranty Ltd.
Notes to Consolidated Financial Statements, Continued
Accounting Policy
The Company’s credit derivatives qualify as derivatives under GAAP and require fair value measurement, with changes in fair value reported in “fair value gains (losses) on credit derivatives” in the consolidated statement of operations. The fair value of credit derivatives is determined on a contract-by-contract basis and presented as either credit derivative assets reported in “other assets” or credit derivative liabilities reported in “other liabilities” in the consolidated balance sheets. See Note 9, Fair Value Measurement, for a discussion on the fair value methodology for credit derivatives.
Credit Derivatives Net Par Outstanding and Fair Value
The components of the Company’s credit derivative net par outstanding by sector are presented in the table below. The estimated remaining weighted average life of credit derivatives was 8.4 years and 11.1 years as of December 31, 2024 and December 31, 2023, respectively.
Credit Derivatives (1)
| | | | | | | | | | | | | | | | | | | | | | | | | | |
| | | As of December 31, 2024 | | As of December 31, 2023 |
| Sector | | Net Par
Outstanding | | Net Fair Value Asset (Liability) | | Net Par
Outstanding | | Net Fair Value Asset (Liability) |
| | | (in millions) |
| U.S. public finance | | $ | 1,025 | | | $ | (12) | | | $ | 1,149 | | | $ | (15) | |
| Non-U.S. public finance | | 2,044 | | | (15) | | | 1,522 | | | (20) | |
| U.S. structured finance | | 150 | | | (2) | | | 322 | | | (13) | |
| Non-U.S. structured finance | | 993 | | | — | | | 615 | | | (2) | |
| Total | | $ | 4,212 | | | $ | (29) | | | $ | 3,608 | | | $ | (50) | |
____________________
(1) See Note 4, Expected Loss to be Paid (Recovered), for expected loss to be paid on credit derivatives.
Fair Value Gains (Losses) on Credit Derivatives
| | | | | | | | | | | | | | | | | |
| Year Ended December 31, |
| | 2024 | | 2023 | | 2022 |
| | (in millions) |
| Realized gains (losses) and other settlements | $ | 3 | | | $ | 2 | | | $ | (2) | |
| Net unrealized gains (losses) | 21 | | | 112 | | | (9) | |
| Fair value gains (losses) on credit derivatives | $ | 24 | | | $ | 114 | | | $ | (11) | |
The impact of changes in credit spreads will vary based upon the volume, tenor, interest rates and other market conditions at the time these fair values are determined. In addition, since each transaction has unique collateral and structural terms, the change in fair value of each transaction may vary considerably. The fair value of credit derivative contracts generally also reflects the Company’s own credit cost based on the price to purchase credit protection on AG. The Company determines its own credit risk primarily based on quoted CDS prices traded on AG at each balance sheet date.
CDS Spread on AG (in basis points)
| | | | | | | | | | | | | | | | | |
| As of December 31, |
| | 2024 | | 2023 | | 2022 |
| Five-year CDS spread | 75 | | | 66 | | | 63 | |
| One-year CDS spread | 25 | | | 23 | | | 26 | |
Assured Guaranty Ltd.
Notes to Consolidated Financial Statements, Continued
Fair Value of Credit Derivative Assets (Liabilities) and Effect of AG Credit Spread
| | | | | | | | | | | |
| As of December 31, |
| | 2024 | | 2023 |
| | (in millions) |
| Fair value of credit derivatives before effect of AG credit spread | $ | (64) | | | $ | (76) | |
| Plus: Effect of AG credit spread | 35 | | | 26 | |
| Net fair value of credit derivatives | $ | (29) | | | $ | (50) | |
The fair value of CDS contracts as of December 31, 2024, before considering the benefit applicable to AG’s credit spread, is a direct result of the relatively wider credit spreads under current market conditions, sometimes related to downgrades, compared with those at the time of underwriting for certain underlying credits with longer tenor.
7. Investments and Cash
Accounting Policy
All fixed-maturity securities are reported on a trade date-basis, measured at fair value and classified as either trading or available-for-sale. Changes in the fair value of trading fixed-maturity securities are reported as a component of net income, while unrealized gains and losses on available-for-sale fixed-maturity securities are reported in “accumulated other comprehensive income” (AOCI). Loss Mitigation Securities, which are a component of available-for-sale fixed-maturity securities, are accounted for based on their underlying investment type, excluding the effects of the Company’s insurance.
Short-term investments, which are investments with a maturity of less than one year at the time of purchase, are carried at fair value and include amounts deposited in certain money market funds.
Other invested assets primarily consist of equity method investments; the Sound Point investment being the most significant. The Company reports its interest in the earnings of equity method investments in “equity in earnings (losses) of investees” in the consolidated statement of operations. Most equity method investments are reported on a one-quarter lag. At the time of acquisition, the difference between the Company’s cost of an equity method investment (fair value) and the Company’s proportionate share of the carrying value of the investee’s net assets is referred to as the basis difference. The basis difference includes amounts attributed to finite-lived intangible assets, is amortized over the assets’ remaining useful lives, and is reported in “equity in earnings (losses) of investees.”
The Company classifies distributions received from equity method investments using the cumulative earnings approach in the consolidated statements of cash flows. Under the cumulative earnings approach, distributions received up to the amount of cumulative equity in earnings recognized are treated as returns on investment within operating cash flows, and those in excess of that amount are treated as returns of investment within investing cash flows.
Sound Point managed funds (and prior to July 1, 2023, AssuredIM managed funds), in which the Company invests and where the Company has been deemed to be the primary beneficiary, are not reported in “investments” on the consolidated balance sheets, but rather in “assets of consolidated investment vehicles” and “other liabilities,” with the portion not owned by the Company presented as “nonredeemable noncontrolling interests”. See Note 8, Financial Guaranty Variable Interest Entities and Consolidated Investment Vehicles, for further information regarding the CIVs.
Cash consists of cash on hand and demand deposits. See Note 8, Financial Guaranty Variable Interest Entities and Consolidated Investment Vehicles, for the cash and cash equivalents of consolidated VIEs.
Net investment income primarily includes the income earned on fixed-maturity securities and short-term investments, including amortization of premiums and accretion of discounts. For mortgage-backed securities and any other securities for which there is prepayment risk, prepayment assumptions are evaluated quarterly and revised as necessary. For securities other than purchased credit deteriorated (PCD) securities, any necessary adjustments due to changes in effective yields and expected maturities are recognized in net investment income using the retrospective method. PCD securities are defined as financial assets that, as of the date of acquisition, have experienced a more-than-insignificant deterioration in credit quality since origination.
Realized gains and losses on sales of available-for-sale fixed-maturity securities and credit losses are reported in the consolidated statement of operations. Net realized investment gains (losses) include sales of investments, which are determined
Assured Guaranty Ltd.
Notes to Consolidated Financial Statements, Continued
using the specific identification method, reductions to amortized cost of available-for-sale investments that have been written down due to the Company’s intent to sell them or it being more-likely-than-not that the Company will be required to sell them, and the change in allowance for credit losses (including accretion) as discussed below.
For all fixed-maturity securities that were originally purchased with credit deterioration, accrued interest is not separately presented but rather is a component of the amortized cost of the instrument. For all other available-for-sale securities, a separate amount for accrued interest is reported in “other assets.”
Credit Losses
For an available-for-sale fixed-maturity security that has experienced a decline in fair value below its amortized cost due to credit related factors, an allowance is established for the difference between the estimated recoverable value and amortized cost with a corresponding charge to “net realized investment gains (losses)” in the consolidated statements of operations. The estimated recoverable value is the present value of cash flows expected to be collected. The allowance for credit losses is limited to the difference between amortized cost and fair value. Any difference between the security’s fair value and its amortized cost that is not associated with credit related factors is presented as a component of AOCI.
When estimating future cash flows for fixed-maturity securities, management considers the historical performance of underlying assets and available market information as well as bond-specific considerations. In addition, the process of estimating future cash flows includes, but is not limited to, the following critical inputs which vary by security type:
•the extent to which fair value is less than amortized cost;
•credit ratings;
•any adverse conditions specifically related to the security, industry, and/or geographic area;
•changes in the financial condition of the issuer, or underlying loan obligors;
•general economic and political factors;
•remaining payment terms of the security;
•prepayment speeds;
•expected defaults; and
•the value of any embedded credit enhancements.
The assessment of whether a credit loss exists is performed each reporting period.
The allowance for credit losses and the corresponding charge to net realized investment gains (losses) may be reversed if conditions change. However, the allowance for credit losses is never reduced below zero. When the Company determines that all or a portion of a fixed-maturity security is uncollectible, the uncollectible amortized cost amount is written off with a corresponding reduction to the allowance for credit losses. If cash flows that were previously written off are collected, the recovery is recognized in net realized investment gains (losses).
An allowance for credit losses is established upon initial recognition for available-for-sale PCD securities. On the date of acquisition, the amortized cost of a PCD security is equal to its purchase price plus the allowance for credit losses, with no credit loss expense recognized in the consolidated statements of operations. After the date of acquisition, deterioration (or improvement) in credit will result in an increase (or decrease) to the allowance and an offsetting credit loss expense (or benefit). To measure this, the Company performs a discounted cash flow analysis. For PCD securities that are also beneficial interests, favorable or adverse changes in expected cash flows are recognized as a change in the allowance for credit losses. Changes in expected cash flows that are not captured through the allowance are reflected as a prospective adjustment to the security’s yield within “net investment income” in the consolidated statements of operations.
The Company has elected to not measure credit losses on its accrued interest receivable and instead write off accrued interest when it is six months past due or on the date it is deemed uncollectible, if earlier. All write-offs of accrued interest are recorded as a reduction to “net investment income” in the consolidated statements of operations.
For impaired securities that (i) the Company intends to sell, or (ii) it is more-likely-than-not that the Company will be required to sell before recovering its amortized cost, the amortized cost is written down to fair value with a corresponding charge to net realized investment gains (losses). No allowance is established in these situations and any previously recorded allowance is reversed. The new cost basis is not adjusted for subsequent increases in estimated fair value.
Assured Guaranty Ltd.
Notes to Consolidated Financial Statements, Continued
The Company monitors its equity method investments for indicators of other-than-temporary declines in fair value on an ongoing basis. If such a decline occurs, an impairment charge is recorded, measured as the difference between the carrying value and the estimated fair value.
Investment Portfolio
The majority of the investment portfolio consists of investment grade fixed-maturity securities managed by outside managers. The Company has established investment guidelines for these investment managers regarding credit quality, exposure to a particular sector and exposure to a particular obligor within a sector.
Investment Portfolio
Carrying Value
| | | | | | | | | | | |
| As of December 31, |
| | 2024 | | 2023 |
| | (in millions) |
| Fixed-maturity securities, available-for-sale | $ | 6,369 | | | $ | 6,307 | |
| Fixed-maturity securities, trading | 147 | | | 318 | |
| Short-term investments | 1,221 | | | 1,661 | |
| Other invested assets: | | | |
| Equity method investments: | | | |
| Sound Point | 418 | | | 429 | |
| Funds and other investments | 496 | | | 394 | |
| Other | 12 | | | 6 | |
| Total (1) | $ | 8,663 | | | $ | 9,115 | |
____________________
(1) The aggregate carrying value of the Company’s investments in Sound Point managed investments, excluding the ownership interest in Sound Point of $418 million and $429 million as of December 31, 2024 and December 31, 2023, respectively, and excluding certain investments in funds that are consolidated and accounted for as CIVs, was $569 million and $202 million as of December 31, 2024 and December 31, 2023, respectively.
As of December 31, 2024 and December 31, 2023, 12.6% and 9.2%, respectively, of the available-for-sale fixed-maturity securities, were either rated BIG or not rated, primarily consisting of Loss Mitigation Securities and CLO equity tranches. As of December 31, 2024 and December 31, 2023, the carrying value of Loss Mitigation Securities was $479 million and $459 million, respectively. As of December 31, 2024 and December 31, 2023, the carrying value of CLO equity tranches was $277 million and $13 millions, respectively. Fixed-maturity securities classified as trading securities primarily include contingent value instruments (CVIs), and are not rated.
The investment portfolio includes $884 million in alternative investments primarily consisting of CLO equity securities, classified as available-for-sale fixed-maturity securities, and $508 million of investments across various asset classes that are reported in other invested assets. In addition, as of December 31, 2024 and December 31, 2023, $33 million and $305 million, respectively, of the Company’s alternative investments in Sound Point managed funds were consolidated and reported in “assets of CIVs,” “other liabilities,” and “nonredeemable noncontrolling interests.” As of December 31, 2024, one active fund in which the Company invests was accounted for as a CIV. See Note 8, Financial Guaranty Variable Interest Entities and Consolidated Investment Vehicles. The Company’s alternative investment commitments as of December 31, 2024 include $610 million in unfunded commitments, which together with its $884 million in funded commitments total $1.5 billion, including a $1 billion commitment to invest in Sound Point managed alternative investments. Capital allocated to alternative investments was committed to several funds pursuing various strategies, including private healthcare investing, asset-based/specialty finance, CLOs, and middle market direct lending. See Note 1, Business and Basis of Presentation, for a description of the Sound Point Transaction.
In addition to the commitments above, the Company has agreed to subscribe for liquidity bonds to be issued by a U.K. regulated utility to which it has insured exposure. At this time the Company estimates that it will purchase approximately £110 million (or $139 million) in liquidity bonds under this commitment.
Accrued investment income was $64 million and $71 million as of December 31, 2024 and December 31, 2023, respectively. In 2024, 2023 and 2022, the Company did not write off any accrued investment income.
Assured Guaranty Ltd.
Notes to Consolidated Financial Statements, Continued
Available-for-Sale Fixed-Maturity Securities by Security Type
As of December 31, 2024
| | | | | | | | | | | | | | | | | | | | | | | | | | | | | | | | | | | | | | |
| Security Type | | Percent
of
Total (1) | | Amortized
Cost | | Allowance for Credit Losses | | Gross
Unrealized
Gains | | Gross
Unrealized
Losses | | Estimated
Fair
Value |
| | | (dollars in millions) |
| Obligations of state and political subdivisions | | 30 | % | | $ | 2,032 | | | $ | (14) | | | $ | 25 | | | $ | (103) | | | $ | 1,940 | |
| U.S. government and agencies | | 1 | | | 72 | | | — | | | 1 | | | (6) | | | 67 | |
| Corporate securities (2) | | 38 | | | 2,586 | | | (7) | | | 9 | | | (206) | | | 2,382 | |
| Mortgage-backed securities (3): | | | | | | | | | | | | |
| RMBS | | 9 | | | 657 | | | (21) | | | 2 | | | (71) | | | 567 | |
| Commercial mortgage-backed securities (CMBS) | | 3 | | | 189 | | | — | | | — | | | (3) | | | 186 | |
| Asset-backed securities: | | | | | | | | | | | | |
| CLOs | | 9 | | | 615 | | | (1) | | | 6 | | | (9) | | | 611 | |
| Other (4) | | 9 | | | 593 | | | (17) | | | 1 | | | (30) | | | 547 | |
| Non-U.S. government securities | | 1 | | | 83 | | | — | | | — | | | (14) | | | 69 | |
| Total available-for-sale fixed-maturity securities | | 100 | % | | $ | 6,827 | | | $ | (60) | | | $ | 44 | | | $ | (442) | | | $ | 6,369 | |
Available-for-Sale Fixed-Maturity Securities by Security Type
As of December 31, 2023
| | | | | | | | | | | | | | | | | | | | | | | | | | | | | | | | | | | | | | |
| Security Type | | Percent
of
Total (1) | | Amortized
Cost | | Allowance for Credit Losses | | Gross
Unrealized
Gains | | Gross
Unrealized
Losses | | Estimated
Fair
Value |
| | | (dollars in millions) |
| Obligations of state and political subdivisions | | 41 | % | | $ | 2,733 | | | $ | (13) | | | $ | 33 | | | $ | (92) | | | $ | 2,661 | |
| U.S. government and agencies | | 1 | | | 65 | | | — | | | 1 | | | (6) | | | 60 | |
| Corporate securities (2) | | 34 | | | 2,327 | | | (6) | | | 17 | | | (197) | | | 2,141 | |
| Mortgage-backed securities (3): | | | | | | | | | | | | |
| RMBS | | 6 | | | 428 | | | (21) | | | 3 | | | (68) | | | 342 | |
| CMBS | | 2 | | | 157 | | | — | | | — | | | (6) | | | 151 | |
| Asset-backed securities: | | | | | | | | | | | | |
| CLOs | | 7 | | | 456 | | | — | | | 1 | | | (7) | | | 450 | |
| Other (4) | | 7 | | | 465 | | | (37) | | | — | | | (26) | | | 402 | |
| Non-U.S. government securities | | 2 | | | 115 | | | — | | | — | | | (15) | | | 100 | |
| Total available-for-sale fixed-maturity securities | | 100 | % | | $ | 6,746 | | | $ | (77) | | | $ | 55 | | | $ | (417) | | | $ | 6,307 | |
____________________
(1) Based on amortized cost.
(2) Includes securities issued by taxable universities and hospitals.
(3) U.S. government-agency obligations were approximately 68% of mortgage-backed securities as of December 31, 2024 and 42% as of December 31, 2023, based on fair value.
(4) Includes a security with an affiliated entity with amortized cost and fair value of $41 million and $42 million, respectively, as of December 31, 2024, and amortized cost and fair value of $21 million as of December 31, 2023.
Assured Guaranty Ltd.
Notes to Consolidated Financial Statements, Continued
Gross Unrealized Loss by Length of Time
for Available-for-Sale Fixed-Maturity Securities for Which a Credit Loss was Not Recorded
As of December 31, 2024
| | | | | | | | | | | | | | | | | | | | | | | | | | | | | | | | | | | |
| | Less than 12 months | | 12 months or more | | Total |
| | Fair
Value | | Gross Unrealized
Loss | | Fair
Value | | Gross Unrealized
Loss | | Fair
Value | | Gross Unrealized
Loss |
| | (dollars in millions) |
| Obligations of state and political subdivisions | $ | 624 | | | $ | (7) | | | $ | 964 | | | $ | (96) | | | $ | 1,588 | | | $ | (103) | |
| U.S. government and agencies | 5 | | | — | | | 28 | | | (6) | | | 33 | | | (6) | |
| Corporate securities | 762 | | | (20) | | | 1,046 | | | (150) | | | 1,808 | | | (170) | |
| Mortgage-backed securities: | | | | | | | | | | | |
| RMBS | 255 | | | (4) | | | 123 | | | (10) | | | 378 | | | (14) | |
| CMBS | 83 | | | — | | | 103 | | | (3) | | | 186 | | | (3) | |
| Asset-backed securities: | | | | | | | | | | | |
| CLOs | 151 | | | (5) | | | 107 | | | (1) | | | 258 | | | (6) | |
| Other | 60 | | | (1) | | | 16 | | | — | | | 76 | | | (1) | |
| Non-U.S. government securities | 35 | | | (3) | | | 30 | | | (11) | | | 65 | | | (14) | |
| Total | $ | 1,975 | | | $ | (40) | | | $ | 2,417 | | | $ | (277) | | | $ | 4,392 | | | $ | (317) | |
| Number of securities (1) | | | 569 | | | | | 1,065 | | | | | 1,591 | |
Gross Unrealized Loss by Length of Time
for Available-for-Sale Fixed-Maturity Securities for Which a Credit Loss was Not Recorded
As of December 31, 2023
| | | | | | | | | | | | | | | | | | | | | | | | | | | | | | | | | | | |
| | Less than 12 months | | 12 months or more | | Total |
| | Fair
Value | | Gross Unrealized
Loss | | Fair
Value | | Gross Unrealized
Loss | | Fair
Value | | Gross Unrealized
Loss |
| | (dollars in millions) |
| Obligations of state and political subdivisions | $ | 641 | | | $ | (4) | | | $ | 931 | | | $ | (87) | | | $ | 1,572 | | | $ | (91) | |
| U.S. government and agencies | — | | | — | | | 33 | | | (6) | | | 33 | | | (6) | |
| Corporate securities | 72 | | | (1) | | | 1,426 | | | (152) | | | 1,498 | | | (153) | |
| Mortgage-backed securities: | | | | | | | | | | | |
| RMBS | 27 | | | (1) | | | 124 | | | (8) | | | 151 | | | (9) | |
| CMBS | 3 | | | — | | | 148 | | | (6) | | | 151 | | | (6) | |
| Asset-backed securities: | | | | | | | | | | | |
| CLOs | 22 | | | (1) | | | 379 | | | (6) | | | 401 | | | (7) | |
| Other | 1 | | | — | | | 26 | | | (1) | | | 27 | | | (1) | |
| Non-U.S. government securities | — | | | — | | | 95 | | | (15) | | | 95 | | | (15) | |
| Total | $ | 766 | | | $ | (7) | | | $ | 3,162 | | | $ | (281) | | | $ | 3,928 | | | $ | (288) | |
| Number of securities (1) | | | 274 | | | | | 1,266 | | | | | 1,525 | |
___________________
(1) The number of securities does not add across because lots consisting of the same securities have been purchased at different times and appear in both categories above (i.e., less than 12 months and 12 months or more). If a security appears in both categories, it is counted only once in the total column.
The Company considered the credit quality, cash flows, interest rate movements, ability to hold a security to recovery and intent to sell a security in determining whether a security had a credit loss. The Company has determined that the unrealized losses recorded as of December 31, 2024 and December 31, 2023 were primarily related to higher interest rates rather than credit quality. As of December 31, 2024, the Company did not intend to, and was not required to, sell investments in an unrealized loss position prior to expected recovery in value. As of December 31, 2024, of the securities in an unrealized loss position for which an allowance for credit loss was not recorded, 438 securities had unrealized losses in excess of 10% of their carrying value, whereas as of December 31, 2023, 409 securities had unrealized losses in excess of 10% of their carrying
Assured Guaranty Ltd.
Notes to Consolidated Financial Statements, Continued
value. The total unrealized loss for these securities was $223 million as of December 31, 2024 and $200 million as of December 31, 2023.
The amortized cost and estimated fair value of available-for-sale fixed-maturity securities by contractual maturity as of December 31, 2024 are shown below. Expected maturities will differ from contractual maturities because borrowers may have the right to call or prepay obligations with or without call or prepayment penalties.
Distribution of Available-for-Sale Fixed-Maturity Securities by Contractual Maturity
As of December 31, 2024
| | | | | | | | | | | |
| | Amortized
Cost | | Estimated
Fair Value |
| | (in millions) |
| Due within one year | $ | 382 | | | $ | 370 | |
| Due after one year through five years | 1,168 | | | 1,122 | |
| Due after five years through 10 years | 1,974 | | | 1,888 | |
| Due after 10 years | 2,457 | | | 2,236 | |
| Mortgage-backed securities: | | | |
| RMBS | 657 | | | 567 | |
| CMBS | 189 | | | 186 | |
| Total | $ | 6,827 | | | $ | 6,369 | |
Based on fair value, fixed-maturity securities, short-term investments and cash that are either held in trust for the benefit of third-party ceding insurers in accordance with statutory requirements, placed on deposit to fulfill state licensing requirements, or otherwise pledged or restricted, totaled $79 million as of December 31, 2024 and $234 million as of December 31, 2023. The investment portfolio also contains securities that are held in trust by certain AGL subsidiaries or are otherwise restricted for the benefit of other AGL subsidiaries in accordance with statutory and regulatory requirements with a fair value of $1,135 million and $1,154 million as of December 31, 2024 and December 31, 2023, respectively.
The fair value of investments that were non-income producing during twelve-month period ending December 31, 2024 was $42 million. No material investments of the Company were non-income producing during the twelve-month period ending December 31, 2023.
Assured Guaranty Ltd.
Notes to Consolidated Financial Statements, Continued
Income from Investments
The components of income derived from the investment portfolio are presented in the following tables.
Income from Investments
| | | | | | | | | | | | | | | | | |
| | Year Ended December 31, |
| | 2024 | | 2023 | | 2022 |
| | (in millions) |
| Investment income: | | | | | |
| Fixed-maturity securities, available-for-sale (1) | $ | 261 | | | $ | 294 | | | $ | 258 | |
| Short-term investments | 83 | | | 73 | | | 15 | |
| Other invested assets | 1 | | | 3 | | | 1 | |
| Investment income | 345 | | | 370 | | | 274 | |
| Investment expenses | (5) | | | (5) | | | (5) | |
| Net investment income | $ | 340 | | | $ | 365 | | | $ | 269 | |
| | | | | |
| Fair value gains (losses) on trading securities (2) | $ | 52 | | | $ | 74 | | | $ | (34) | |
| | | | | |
| Equity in earnings (losses) of investees | | | | | |
| Sound Point (3) | $ | 6 | | | $ | 5 | | | $ | — | |
| Funds and other (4) | 56 | | | 23 | | | (39) | |
| Equity in earnings (losses) of investees | $ | 62 | | | $ | 28 | | | $ | (39) | |
____________________
(1) Includes $28 million, $55 million and $31 million income on Loss Mitigation Securities for 2024, 2023 and 2022, respectively.
(2) Fair value gains on trading securities pertaining to securities still held as of December 31, 2024 were $15 million for 2024. Fair value gains on trading securities pertaining to securities still held as of December 31, 2023 were $31 million for 2023. Fair value losses on trading securities pertaining to securities still held as of December 31, 2022 were $29 million for 2022.
(3) Beginning in the fourth quarter of 2023, equity in earnings (losses) of investees includes the Company’s share of the earnings of Sound Point, which is reported on a one-quarter lag.
(4) Includes Sound Point and AHP funds and, prior to July 1, 2023, AssuredIM funds.
Fair Value Gains (Losses) on Trading Securities
Substantially all of the trading securities are Puerto Rico CVIs. In 2022, as a result of the 2022 Puerto Rico Resolutions, the Company received cash, new general obligation bonds, new bonds backed by toll revenues (together, New Recovery Bonds) and CVIs. The CVIs are intended to provide creditors with additional recoveries tied to the outperformance of the Puerto Rico 5.5% Sales and Use Tax receipts against May 2020 certified fiscal plan projections, subject to annual and lifetime caps. As of December 31, 2024, all but $123 million of the CVIs (at fair value), and substantially all of the New Recovery Bonds had been sold or redeemed. The Company may sell in the future any CVIs it continues to hold.
Equity in Earnings (Losses) of Investees
As of December 31, 2024, the carrying value of the Company’s ownership interest in Sound Point was $418 million, and includes a basis difference related principally to goodwill and indefinite-lived intangible assets of $245 million, and finite-lived intangible assets of $31 million which had an average estimated term of 5.5 years.
The table below presents summarized financial information for equity method investments that meet, in aggregate, the requirements for reporting summarized disclosures. Such requirements were met in 2024, and the information for 2023 and 2022 is presented for comparative purposes.
Assured Guaranty Ltd.
Notes to Consolidated Financial Statements, Continued
Aggregate Equity Method Investments’
Summarized Balance Sheet Data
| | | | | | | | | | | |
| As of December, 31 |
| 2024 | | 2023 |
| (in millions) |
| Investments | $ | 2,324 | | | $ | 1,735 | |
| Assets of consolidated funds and CLOs | 1,611 | | | 1,449 | |
| Other assets | 754 | | | 792 | |
| Total assets | $ | 4,689 | | | $ | 3,976 | |
| | | |
| Liabilities of consolidated funds and CLOs | $ | 1,494 | | | $ | 1,342 | |
| Other liabilities | 526 | | | 365 | |
| Total liabilities | $ | 2,020 | | | $ | 1,707 | |
| | | |
| Equity attributable to investees | $ | 2,629 | | | $ | 2,234 | |
| Noncontrolling interest | 40 | | | 35 | |
| Total equity | $ | 2,669 | | | $ | 2,269 | |
Aggregate Equity Method Investments’
Summarized Statement of Operations Data
| | | | | | | | | | | | | | | | | |
| Year Ended December 31, |
| 2024 | | 2023 | | 2022 |
| (in millions) |
| Fee income | $ | 196 | | | $ | 57 | | | $ | 15 | |
| Net gains (losses) on investments and investment income | 400 | | | 129 | | | (365) | |
| Income of consolidated funds and CLOs | 138 | | | 37 | | | — | |
| Other income | 48 | | | 39 | | | 35 | |
| Total revenues | $ | 782 | | | $ | 262 | | | $ | (315) | |
| | | | | |
| Expenses of consolidated funds and CLOs | $ | 93 | | | $ | 25 | | | $ | — | |
| Other expenses | 279 | | | 108 | | | 49 | |
| Total expenses | $ | 372 | | | $ | 133 | | | $ | 49 | |
| | | | | |
| Net income (loss) | $ | 410 | | | $ | 129 | | | $ | (364) | |
| Net income (loss) attributable to investees | $ | 400 | | | $ | 127 | | | $ | (364) | |
Assured Guaranty Ltd.
Notes to Consolidated Financial Statements, Continued
Realized Investment Gains (Losses)
The table below presents the components of net realized investment gains (losses).
Net Realized Investment Gains (Losses)
| | | | | | | | | | | | | | | | | |
| | Year Ended December 31, |
| | 2024 | | 2023 | | 2022 |
| | (in millions) |
| Gross realized gains on sales of available-for-sale securities (1) | $ | 3 | | | $ | 21 | | | $ | 3 | |
| Gross realized losses on sales of available-for-sale securities (2) | (12) | | | (19) | | | (45) | |
| Net foreign currency gains (losses) | (2) | | | (1) | | | (4) | |
| Change in the allowance for credit losses and intent to sell (3) | 18 | | | (14) | | | (21) | |
| Other net realized gains (losses) | 2 | | | (1) | | | 11 | |
| Net realized investment gains (losses) | $ | 9 | | | $ | (14) | | | $ | (56) | |
____________________
(1)Amounts in 2023 related primarily to sales of New Recovery Bonds received as part of the 2022 Puerto Rico Resolutions.
(2)Amounts in 2022 related primarily to sales of New Recovery Bonds received as part of the 2022 Puerto Rico Resolutions.
(3)Change in the allowance for credit losses for all periods was primarily related to Loss Mitigation Securities.
The following table presents the roll forward of the allowance for the credit losses on available-for-sale fixed-maturity securities.
Roll Forward of Allowance for Credit Losses
for Available-for-Sale Fixed-Maturity Securities
| | | | | | | | | | | | | | | | | |
| | Year Ended December 31, |
| | 2024 | | 2023 | | 2022 |
| | (in millions) |
| Balance, beginning of period | $ | 77 | | | $ | 65 | | | $ | 42 | |
| Additions for securities for which credit losses were not previously recognized | 4 | | | — | | | 7 | |
| Additions for purchases of securities accounted for as purchased financial assets with credit deterioration | — | | | — | | | 2 | |
| Additions (reductions) for securities for which credit losses were previously recognized | (21) | | | 12 | | | 14 | |
| | | | | |
| Balance, end of period | $ | 60 | | | $ | 77 | | | $ | 65 | |
During 2022, the Company purchased a Loss Mitigation Security with a fair value of $22 million that was accounted for as a PCD security. At acquisition, this security had unpaid principal on remaining collateral of $31 million, an allowance for credit losses of $2 million, and a non-credit related discount of $7 million. The Company did not purchase any other securities with credit deterioration during the periods presented. Most of the Company’s securities with credit deterioration are Loss Mitigation Securities.
8. Financial Guaranty Variable Interest Entities and Consolidated Investment Vehicles
Accounting Policy
The types of entities that the Company assesses for consolidation principally include: (i) financial guaranty variable interest entities, which include entities whose debt obligations the Company insures in its financial guaranty business and Puerto Rico Trusts, and (ii) investment vehicles in which the Company has a variable interest and which Sound Point manages, including (1) Sound Point funds since July 1, 2023 and (2) CLOs that are collateralized financing entities (CFEs), and CLO warehouses managed by AssuredIM prior to July 1, 2023.
For each of these types of entities, the Company first determines whether the entity is a VIE or a voting interest entity (VOE) which involves assessing, among other conditions, (i) whether the equity investment at risk is sufficient to cover the
Assured Guaranty Ltd.
Notes to Consolidated Financial Statements, Continued
entity’s expected losses and (ii) whether the holders of the equity investment at risk (as a group) have substantive voting rights. The Company reassesses whether an entity is a VIE upon the occurrence of certain significant events.
If the entity being evaluated for consolidation is not initially determined to be a VIE (or, later, if a significant event occurs that causes an entity to no longer qualify as a VIE), then the entity is a VOE. Consolidation generally is required when the Company, directly or indirectly, has a controlling financial interest of the VOE being assessed.
For entities determined to be a VIE and in which the Company has a variable interest, the Company assesses whether it is the primary beneficiary of the VIE at the time it becomes involved with the entity and performs this assessment quarterly. In determining whether it is the primary beneficiary, the Company considers all facts and circumstances, including an evaluation of economic interests in the VIE held directly and indirectly through related parties. The Company is the primary beneficiary of a VIE when it has both: (i) the power to direct the activities of a VIE that most significantly impact the entity’s economic performance; and (ii) the obligation to absorb losses (or the right to receive benefits) from the entity that could potentially be significant to the VIE.
If the Company concludes that it is the primary beneficiary of the VIE, the VIE is consolidated in the Company’s consolidated financial statements. If, as part of its continual reassessment of the primary beneficiary determination, the Company concludes that it is no longer the primary beneficiary of a VIE, the Company deconsolidates the VIE and recognizes the impact of that change on the consolidated financial statements.
FG VIEs
For FG VIEs other than the Puerto Rico Trusts, the Company elected the fair value option (FVO) for all assets and liabilities. Upon initial adoption of the accounting guidance for VIEs in 2010, the Company elected to fair value its structured finance FG VIEs’ assets and liabilities as the carrying amount transition method was not practical. To allow for consistency in the accounting for the assets and liabilities of its consolidated FG VIEs other than the Puerto Rico Trusts, the Company elected the FVO.
The consolidated Puerto Rico Trusts described below primarily included (i) cash or fixed-maturity debt securities that were carried at fair value and classified as either available-for-sale or trading securities similar to the fixed-maturity debt securities received pursuant to the 2022 Puerto Rico Resolutions and reported in the investment portfolio, and (ii) Puerto Rico Trust liabilities for which the Company elected the FVO in order to simplify the accounting for these instruments
The change in fair value of FG VIEs’ assets and liabilities is reported in “fair value gains (losses) on FG VIEs” in the consolidated statement of operations, except for (i) the change in fair value attributable to change in instrument-specific credit risk (ISCR) on FG VIEs’ liabilities, and (ii) unrealized gains and losses on the New Recovery Bonds that were held in the Puerto Rico Trusts, which are both reported in “other comprehensive income (loss)” (OCI) in the consolidated statements of comprehensive income (loss). Interest income and interest expense are derived from the trustee reports and also included in “fair value gains (losses) on FG VIEs.” Investment income on the New Recovery Bonds and changes in fair value on the CVIs that were held in the Puerto Rico Trusts were all reported in “fair value gains (losses) on FG VIEs” on the consolidated statement of operations.
For those FG VIE liabilities with recourse to the Company, the portion of the inception-to-date change in fair value, attributable to ISCR, is calculated by holding all current period assumptions constant for each security and isolating the effect of the change in AG’s CDS spread from the most recent date of consolidation to the current period. In general, if the Company’s CDS spread tightens, more value will be assigned to AG’s credit; however, if AG’s CDS spread widens, less value is assigned to the Company’s credit.
The Company has limited contractual rights to obtain the financial records of its consolidated structured finance FG VIEs. The structured finance FG VIEs do not prepare separate GAAP financial statements; therefore, the Company compiles the FG VIE GAAP financial information based on trustee reports prepared by and received from third parties. Such trustee reports are not available to the Company in time for quarterly reporting and therefore FG VIEs other than the Puerto Rico Trusts are reported on a one-quarter lag. As a result of the lag, cash and short-term investments do not reflect any cash outflows (due to claim payments made by the Company) to the holders of the FG VIEs’ debt until the subsequent reporting period.
The cash flows generated by the FG VIEs’ assets, except for interest income, are classified as cash flows from investing activities. Paydowns of FG VIEs’ liabilities are supported by the cash flows generated by FG VIEs’ assets and, for liabilities with recourse, possibly claim payments made by AGM or AG under their financial guaranty insurance
Assured Guaranty Ltd.
Notes to Consolidated Financial Statements, Continued
contracts. Paydowns of FG VIEs’ liabilities both with and without recourse are classified as cash flows used in financing activities. Interest income, interest expense and other expenses of the FG VIEs’ assets and liabilities are classified as operating cash flows. Claim payments made by AGM and AG under the financial guaranty contracts issued to the FG VIEs are eliminated upon consolidation. Therefore, such claim payments are treated as paydowns of the FG VIEs’ liabilities and as a financing activity as opposed to an operating activity.
The Company’s exposure provided through its financial guaranties with respect to debt obligations of FG VIEs is included within net par outstanding in Note 3, Outstanding Exposure.
CIVs
CIVs consist of certain Sound Point (and prior to July 1, 2023, AssuredIM) funds, CLOs and CLO warehouses in which the Company is the primary beneficiary. The consolidated funds are investment companies for accounting purposes and, therefore, account for their underlying investments at fair value. All CLOs and CLO warehouses (collectively, the consolidated CLOs) were deconsolidated by the Company on July 1, 2023. Changes in the fair value of assets and liabilities of CIVs, interest income and interest expense are reported in “fair value gains (losses) on consolidated investment vehicles” in the consolidated statements of operations. Interest income from CLO assets is recorded based on contractual rates. All CIVs are reported on a one-quarter lag.
Upon consolidation of a Sound Point (and prior to July 1, 2023, AssuredIM) fund, the Company records noncontrolling interest (NCI) for the portion of each fund owned by any third-party investors and employees.
Investment transactions in the consolidated Sound Point (and prior to July 1, 2023, AssuredIM) funds are recorded on a trade/contract date basis. Money market investments held by these consolidated funds are classified as cash equivalents and carried at cost, consistent with those funds’ separately issued financial statements. Therefore, the Company has included these amounts in the total amount of cash and cash equivalents on the consolidated statements of cash flows. Cash flows of the CIVs attributable to such entities’ investment purchases and dispositions, as well as operating expenses of the investment vehicles, are presented as cash flows from operating activities in the consolidated statements of cash flows. Borrowings under credit facilities, debt issuances and repayments and capital cash flows to and from investors are presented as financing activities, consistent with investment company guidelines.
FG VIEs
Structured Finance FG VIEs
The insurance subsidiaries provide financial guaranties with respect to debt obligations of special purpose entities, including VIEs, but do not act as the servicer or collateral manager for any VIE obligations they guarantee. The transaction structure generally provides certain financial protections to the insurance subsidiaries. This financial protection can take several forms, the most common of which are overcollateralization, first loss protection (or subordination) and excess spread. In the case of overcollateralization (i.e., the principal amount of the securitized assets exceeds the principal amount of the structured finance obligations), the structure allows defaults of the securitized assets before a default is experienced on the structured finance obligation guaranteed by the insurance subsidiaries. In the case of first loss, the insurance subsidiaries’ financial guaranty insurance policy only covers a senior layer of losses experienced by multiple obligations issued by the VIEs. The first loss exposure with respect to the assets is either retained by the seller or sold off in the form of equity or mezzanine debt to other investors. In the case of excess spread, the financial assets contributed to VIEs generate interest income that is in excess of the interest payments on the debt issued by the VIE. Such excess spread is typically distributed through the transaction’s cash flow waterfall and may be used to create additional credit enhancement, applied to redeem debt issued by the VIE (thereby, creating additional overcollateralization), or distributed to equity or other investors in the transaction.
The insurance subsidiaries are not primarily liable for the insured debt obligations issued by the structured finance FG VIEs (which excludes the Puerto Rico Trusts described below) and would only be required to make payments on those insured debt obligations in the event that the issuer of such debt obligations defaults on any principal or interest due and only for the amount of the shortfall. AGL’s and its insurance subsidiaries’ creditors do not have any rights with regard to the collateral supporting the debt issued by the structured finance FG VIEs. Proceeds from sales, maturities, prepayments and interest from such underlying collateral may only be used to pay debt service on the respective FG VIEs’ liabilities.
As part of the terms of its financial guaranty contracts, the insurance subsidiaries obtain certain protective rights with respect to the VIE that give them additional controls over a VIE. These protective rights are triggered by the occurrence of
Assured Guaranty Ltd.
Notes to Consolidated Financial Statements, Continued
certain events, such as failure to be in compliance with a covenant due to poor deal performance or a deterioration in a servicer’s or collateral manager’s financial condition. At deal inception, the insurance subsidiaries typically are not deemed to control the VIE; however, once a trigger event occurs, the insurance subsidiaries’ control of the VIE typically increases. The Company continuously evaluates its power to direct the activities that most significantly impact the economic performance of VIEs that have debt obligations insured by the insurance subsidiaries and, accordingly, where they are obligated to absorb VIE losses or receive benefits that could potentially be significant to the VIE. The insurance subsidiaries are deemed to be the control party for certain VIEs under GAAP, typically when their protective rights give them the power to both terminate and replace the transaction’s servicer or collateral manager, which are characteristics specific to the Company’s financial guaranty contracts. If the protective rights that could make the insurance subsidiaries the control party have not been triggered, then the VIE is not consolidated. If the insurance subsidiaries are deemed to no longer have those protective rights, the VIE is deconsolidated.
The structured finance FG VIEs’ liabilities that are guaranteed by the insurance subsidiaries are considered to be with recourse, because the insurance subsidiaries guarantee the payment of principal and interest regardless of the performance of the related FG VIEs’ assets. The structured finance FG VIEs’ liabilities that are not guaranteed by the insurance subsidiaries are considered to be without recourse, because the payment of principal and interest of these liabilities is wholly dependent on the performance of the FG VIEs’ assets.
Number of Consolidated
Structured Finance FG VIEs
| | | | | | | | | | | | | | | | | |
| | Year Ended December 31, |
| | 2024 | | 2023 | | 2022 |
| | |
| Beginning of year | 24 | | | 25 | | | 25 | |
| Consolidated | — | | | — | | | 2 | |
| Deconsolidated | (1) | | | (1) | | | (2) | |
| December 31 | 23 | | | 24 | | | 25 | |
Puerto Rico Trusts
With respect to certain insured securities covered by the 2022 Puerto Rico Resolutions, insured bondholders were permitted to elect to receive custody receipts that represented an interest in the legacy insurance policy plus cash and investments. For those who made the election above, distributions of assets in the trusts were passed through to insured bondholders under the custody receipts to the extent of any cash or proceeds of new securities held in the custodial trust and were applied to make payments and/or prepayments of amounts due under the legacy insured bonds.
As of December 31, 2023, substantially all of the securities in the Puerto Rico Trusts had been called, and the assets in the Puerto Rico Trusts consisted primarily of cash. In 2024, after notice to the remaining holders of the PRHTA custody receipts, the Company satisfied its remaining direct insured obligations and deconsolidated the 24 custodial trusts that had been consolidated as of December 31, 2023.
Components of FG VIEs’ Assets and Liabilities
Net fair value gains and losses on FG VIEs are expected to reverse to zero by the maturity of the FG VIEs’ debt, except for net premiums received and net claims paid by the insurance subsidiaries under the financial guaranty insurance contracts. The Company’s estimate of expected loss to be paid (recovered) for FG VIEs is included in Note 4, Expected Loss to be Paid (Recovered).
Assured Guaranty Ltd.
Notes to Consolidated Financial Statements, Continued
The table below shows the carrying value of FG VIEs’ assets and liabilities, segregated by type of collateral.
Consolidated FG VIEs by Type of Collateral
| | | | | | | | | | | |
| As of December 31, |
| | 2024 | | 2023 |
| | (in millions) |
| FG VIEs’ assets: | | | |
| U.S. RMBS | $ | 147 | | | $ | 173 | |
| Puerto Rico Trusts’ assets (includes $1 at fair value in 2023) (1) | — | | | 155 | |
| | | |
| Total FG VIEs’ assets | $ | 147 | | | $ | 328 | |
| FG VIEs’ liabilities with recourse: | | | |
| U.S. RMBS | $ | 155 | | | $ | 177 | |
| Puerto Rico Trusts’ liabilities | — | | | 366 | |
| | | |
| Total FG VIEs’ liabilities with recourse | $ | 155 | | | $ | 543 | |
| FG VIEs’ liabilities without recourse: | | | |
| U.S. RMBS | $ | 9 | | | $ | 11 | |
| Total FG VIEs’ liabilities without recourse | $ | 9 | | | $ | 11 | |
____________________
(1) Includes $154 million of cash as of December 31, 2023.
The change in the ISCR of the FG VIEs’ assets for which the Company elected the FVO (FG VIEs’ assets at FVO) held as of December 31, 2024, 2023 and 2022 that was reported in the consolidated statements of operations was a loss of $5 million in 2024, gain of $3 million in 2023 and gain of $10 million in 2022. The ISCR amount is determined by using expected cash flows at the most recent date of consolidation, discounted at the effective yield, less current expected cash flows discounted at that same original effective yield.
Selected Information for FG VIEs’ Assets and Liabilities
Measured under the FVO
| | | | | | | | | | | |
| As of December 31, |
| | 2024 | | 2023 |
| | (in millions) |
| Excess of unpaid principal over fair value of: | | | |
| FG VIEs’ assets | $ | 264 | | | $ | 259 | |
| FG VIEs’ liabilities with recourse | 38 | | | 25 | |
| FG VIEs’ liabilities without recourse | 16 | | | 16 | |
| Unpaid principal balance for FG VIEs’ assets that were 90 days or more past due | 27 | | | 29 | |
| Unpaid principal for FG VIEs’ liabilities with recourse (1) | 193 | | | 568 | |
____________________
(1) FG VIEs’ liabilities with recourse will mature at various dates ranging from 2025 through 2038.
CIVs
CIVs consist of certain Sound Point funds for which the Company is the primary beneficiary or has a controlling interest. The Company consolidates investment vehicles that are VIEs when it is deemed to be the primary beneficiary based on its power to direct the most significant activities of each VIE and its level of economic interest in the entities.
As a result of the Sound Point Transaction and AHP Transaction, the Company deconsolidated CIV assets of $4.7 billion and CIV liabilities of $4.4 billion in 2023, and recognized a loss on deconsolidation of $16 million, which was reported in “fair value gains (losses) on CIVs.” In addition, at the time of deconsolidation, NCI decreased by $132 million. During 2022, the Company deconsolidated a CLO with assets and liabilities of $417 million.
The assets and liabilities of the Company’s CIVs are held within separate legal entities. The assets of the CIVs are not available to creditors of the Company, other than creditors of the applicable CIVs. In addition, creditors of the CIVs have no recourse against the assets of the Company, other than the assets of such applicable CIVs. Liquidity available at the Company’s
Assured Guaranty Ltd.
Notes to Consolidated Financial Statements, Continued
CIVs is not available for corporate liquidity needs, except to the extent of the Company’s investment in the funds, subject to redemption provisions.
In 2024, two CIVs distributed substantially all of their invested assets. After the distributions, as of December 31, 2024, the Company classifies the $293 million of the distributed investments as either (i) available-for-sale fixed-maturity securities (CLOs with a carrying value of $263 million), (ii) trading securities, (iii) equity method investments, or (iv) other invested assets.
The table below summarizes the change in the number of consolidated CIVs during each of the periods. During 2022, two consolidated CLO warehouses became CLOs.
Roll Forward of Number of Consolidated CIVs
| | | | | | | | | | | | | | | | | |
| | Year Ended December 31, |
| | 2024 | | 2023 | | 2022 |
| Beginning of year | 3 | | | 22 | | | 20 | |
| Consolidated | — | | | — | | | 4 | |
| Deconsolidated | (1) | | | (19) | | | (2) | |
| December 31 | 2 | | | 3 | | | 22 | |
Assets and Liabilities of CIVs
| | | | | | | | | | | |
| As of December 31, |
| 2024 | | 2023 |
| | (in millions) |
| Assets: | | | |
| Cash and cash equivalents | $ | 2 | | | $ | 35 | |
| Equity securities and warrants | 99 | | | 83 | |
| Structured products | — | | | 248 | |
| Total assets (1) | $ | 101 | | | $ | 366 | |
| | | |
| Liabilities (2) | $ | — | | | $ | 4 | |
____________________
(1) Include investments with Sound Point affiliated entities of $99 million and $281 million as of December 31, 2024 and December 31, 2023, respectively.
(2) Includes $3 million with Sound Point affiliated entities as of December 31, 2023.
As of December 31, 2024, there were no derivative contracts in CIVs. As of December 31, 2023, the CIVs included derivative contracts with average notional amounts of $41 million. Derivative instruments, which included forward foreign currency contracts, served as a component of the CIVs’ investment strategies.
NCI in CIVs
NCI represents the portion of the consolidated funds not owned by the Company and includes ownership interests of third parties and former employees. The NCI is non-redeemable and presented on the statement of shareholders’ equity.
Other Consolidated VIEs
In certain instances where the Company consolidates a VIE that was established as part of a loss mitigation negotiated settlement that results in the termination of the obligations under the original financial guaranty insurance or insured credit derivative contract, the Company classifies the assets and liabilities of that VIE in the line items that most accurately reflect the nature of such assets and liabilities, as opposed to within FG VIEs’ assets and FG VIEs’ liabilities. The largest of these VIEs had assets of $92 million and liabilities of $7 million as of December 31, 2023, which were reported in “investments” and “other liabilities,” respectively, on the consolidated balance sheets. In the first quarter of 2024, the Company deconsolidated the largest of these VIEs.
Assured Guaranty Ltd.
Notes to Consolidated Financial Statements, Continued
Non-Consolidated VIEs
As described in Note 3, Outstanding Exposure, the Company monitors all policies in the insured portfolio. Of the approximately 15 thousand policies monitored as of December 31, 2024, approximately 14 thousand policies are not within the scope of FASB ASC 810, Consolidation, because these financial guaranties relate to the debt obligations of governmental organizations or financing entities established by a governmental organization. The majority of the remaining policies involve transactions where the Company is not deemed to currently have control over the FG VIEs’ most significant activities. As of December 31, 2024 and 2023, the Company identified 50 and 68 policies, respectively, that contain provisions and experienced events that may trigger consolidation.
The Company holds variable interests in non-FG VIEs which are not consolidated, as the Company is not the primary beneficiary. As of December 31, 2024 the Company’s maximum exposure to losses relating to these VIEs was $761 million, which is limited to the carrying value of these assets.
9. Fair Value Measurement
Accounting Policy
The Company carries a significant portion of its assets and liabilities at fair value. Fair value is defined as the price that would be received to sell an asset or paid to transfer a liability in an orderly transaction between market participants at the measurement date (i.e., exit or transfer price). The price represents the price available in the principal market for the asset or liability. If there is no principal market, then the price is based on a hypothetical market that maximizes the value received for an asset or minimizes the amount paid for a liability (i.e., the most advantageous market).
Fair value is based on quoted market prices, where available. If listed prices or quotes are not available, fair value is based on either (i) internally developed models that primarily use, as inputs, market-based or independently sourced market parameters (including, but not limited to, yield curves, interest rates, and debt prices) or (ii) discounted cash flows, using a third party’s proprietary pricing models. In addition to market information, when applicable, the models also incorporate transaction details, such as the instrument’s maturity, and contractual features that reduce the Company’s credit exposure (e.g., collateral rights).
Valuation adjustments may be made to ensure that financial instruments are recorded at fair value. These adjustments include amounts to reflect counterparty credit quality, the Company’s creditworthiness and constraints on liquidity. As markets and products develop and the pricing transparency for certain products changes, the Company may refine its methodologies and assumptions. During 2024, no changes were made to the Company’s valuation models that had (or are expected to have) a material impact on the Company’s consolidated balance sheets or statements of operations and comprehensive income.
The Company’s valuation methods produce fair values that may not be indicative of net realizable value or future fair values. The use of different methodologies or assumptions to determine fair value of certain financial instruments could result in a materially different estimate of fair value at the reporting date.
The categorization within the fair value hierarchy is determined based on whether the inputs to valuation techniques used to measure fair value are observable or unobservable. Observable inputs reflect market data obtained from independent sources, while unobservable inputs reflect Company estimates of market assumptions. The fair value hierarchy prioritizes model inputs into three broad levels, with Level 1 being the highest and Level 3 the lowest. The categorization, of an asset or liability, within the hierarchy is based on the lowest level of significant input to its valuation.
Level 1—Quoted prices for identical instruments in active markets. The Company generally defines an active market as a market in which trading occurs at significant volumes. Active markets generally are more liquid and have a lower bid-ask spread than an inactive market.
Level 2—Quoted prices for similar instruments in active markets; quoted prices for identical or similar instruments in markets that are not active; and observable inputs other than quoted prices, such as interest rates or yield curves and other inputs derived from, or corroborated by, observable market inputs.
Level 3—Model derived valuations in which one or more significant inputs or significant value drivers are unobservable. Financial instruments are considered Level 3 when their values are (i) determined using pricing models, discounted cash flow methodologies or similar techniques and (ii) at least one significant model assumption or input is
Assured Guaranty Ltd.
Notes to Consolidated Financial Statements, Continued
unobservable. Level 3 financial instruments also include those for which the determination of fair value requires significant management judgment or estimation.
There were transfers of securities into Level 3 in the investment portfolio and CIVs, due to changes in observability of pricing inputs, and in CIVs, in connection with the distribution of assets from the CIV during 2024. There was a transfer of a fixed-maturity security in the investment portfolio from Level 3 to Level 2 during 2023. There was also a transfer of fixed-maturity securities in the investment and FG VIE portfolios from Level 2 to Level 3 during 2023. There were no other transfers from or into Level 3 during the periods presented.
Carried at Fair Value
Fixed-Maturity Securities
The fair value of fixed-maturity securities is generally based on prices received from third-party pricing services or alternative pricing sources that provide reasonable levels of price transparency. The pricing services prepare estimates of fair value using their pricing models, which take into account: benchmark yields, reported trades, broker/dealer quotes, issuer spreads, two-sided markets, benchmark securities, bids, offers, reference data, industry and economic events and sector groupings. Additional valuation factors that can be taken into account are nominal spreads and liquidity adjustments. The pricing services evaluate each asset class based on relevant market and credit information, perceived market movements and sector news.
In many cases, benchmark yields have proven to be more reliable indicators of the market for a security, as compared to reported trades for infrequently traded securities and distressed transactions. The extent of the use of each input is dependent on the asset class and the market conditions. The valuation of fixed-maturity securities is more subjective when markets are less liquid due to the lack of market-based inputs.
As of December 31, 2024, the Company used models to price 179 securities. All Level 3 securities were priced with the assistance of independent third parties. The pricing is based on a discounted cash flow approach using the third party’s proprietary pricing models. The models use inputs such as projected prepayment speeds; severity assumptions; recovery lag assumptions; estimated default rates (determined based on an analysis of collateral attributes, historical collateral performance, borrower profiles and other features relevant to the evaluation of collateral credit quality); home price appreciation/depreciation rates based on macroeconomic forecasts; and recent trading activity. The yield used to discount the projected cash flows is determined by reviewing various attributes of the security including collateral type, weighted average life, sensitivity to losses, vintage and convexity, in conjunction with market data on comparable securities. Significant changes to any of these inputs could have materially changed the expected timing of cash flows within these securities, which could have significantly affected the fair value of the securities.
Short-Term Investments
Short-term investments that are traded in active markets are classified as Level 1 as their value is based on quoted market prices. Securities such as discount notes are classified as Level 2 because these securities are typically not actively traded. Due to their approaching maturity, the cost of discount notes approximates fair value.
Other Assets
Committed Capital Securities
The fair value of CCS, which is reported in “other assets” in the consolidated balance sheets, represents the difference between the present value of the remaining expected put option premium payments under the put agreements and the estimated present value of the amounts that the Company would hypothetically have to pay as of the reporting date for a comparable security (see Note 11, Long-Term Debt and Credit Facilities). The change in fair value of the CCS is reported in “fair value gains (losses) on committed capital securities” in the consolidated statements of operations. The estimated current cost of the Company’s CCS as of the reporting date is based on several factors, including AG CDS spreads, the Company’s publicly traded debt and an estimation of the securities’ remaining term. The CCS are classified as Level 3.
Assured Guaranty Ltd.
Notes to Consolidated Financial Statements, Continued
Supplemental Executive Retirement Plans
The Company classified assets included in the Company’s various supplemental executive retirement plans as either Level 1 or Level 2. The fair value of these assets is based on the observable published daily values of the underlying mutual funds included in the plans (Level 1) or based upon the net asset value (NAV) of the funds if a published daily value is not available (Level 2). The NAVs are based on observable information. The change in fair value of these assets is reported in “other operating expenses” in the consolidated statements of operations.
Contracts Accounted for as Credit Derivatives
There is no established market where financial guaranty insured credit derivatives are actively traded; therefore, management has determined that the exit market for the Company’s credit derivatives is a hypothetical one based on its entry market. Due to the lack of quoted prices and other observable inputs for its instruments or for similar instruments, the Company determines the fair value of its credit derivative contracts primarily through internally developed, proprietary models that use both observable and unobservable market data inputs, and such contracts are therefore classified as Level 3 in the fair value hierarchy. There are multiple unobservable inputs deemed significant to the valuation model, most importantly the Company’s estimate of the value of the non-standard terms and conditions of its credit derivative contracts and how the Company’s own credit spread affects the pricing of its transactions.
The fair value of the Company’s credit derivative contracts generally represents the difference between the present value of remaining premiums the Company expects to receive and the estimated present value of premiums that a financial guarantor of comparable credit-worthiness would hypothetically charge at the reporting date for the same protection. The fair value of the Company’s credit derivatives depends on a number of factors, including notional amount of the contract, expected term, credit spreads, changes in interest rates, the credit ratings of referenced entities, the Company’s own credit risk and remaining contractual cash flows. The expected remaining contractual premium cash flows are the most readily observable inputs since they are based on the credit derivatives contractual terms. Credit spreads capture the effect of recovery rates and performance of underlying assets of these contracts, among other factors. A credit derivative liability on protection sold is the result of contractual cash inflows on in-force transactions that are lower than what a hypothetical financial guarantor could receive if it sold protection on the same risk as of the reporting date. Consistent with previous years, market conditions at December 31, 2024 were such that market prices of the Company’s CDS contracts were not available.
Assumptions and Inputs
The main inputs and assumptions to the measurement of fair value for CDS contracts are the gross spread, the allocation of gross spread among the bank profit, net spread and hedge cost and the weighted average life (which is based on debt service schedules).
The primary sources of information used to determine gross spread and the fair value for CDS contracts include actual collateral credit spreads (if up-to-date and reliable market-based spreads are available), transactions priced or closed during a specific quarter within a specific asset class and specific rating and information provided by the counterparty of the CDS. Credit spreads may also be interpolated based upon market indices adjusted to reflect the non-standard terms of the Company’s CDS contracts or extrapolated based upon transactions of similar asset classes, similar ratings, and similar time to maturity.
The Company’s own credit risk is factored into the determination of the current premium. Such credit risk is based on the quoted market price for credit protection bought on the Company as reflected by quoted market prices on CDS contracts referencing AG. The Company obtains the quoted price of CDS contracts traded on AG from market data sources published by third parties. The amount of premium a financial guaranty insurance market participant can demand (or “current premium”) is inversely related to the cost of credit protection on the insurance company as measured by market credit spreads assuming all other assumptions remain constant. This is because the buyers of credit protection typically hedge a portion of their risk to the financial guarantor because the contractual terms of the Company’s contracts typically do not require the posting of collateral by the guarantor. The extent of the hedge depends on the types of instruments insured and current market conditions.
In the Company’s valuation model, the current premium is not permitted to go below the minimum rate that the Company would charge to assume similar risks in the reporting period. This assumption can have the effect of limiting the amount of unrealized gains that are recognized on certain CDS contracts. The minimum premium assumption had no effect on the fair value of CDS contracts as of December 31, 2024 or December 31, 2023.
Assured Guaranty Ltd.
Notes to Consolidated Financial Statements, Continued
FG VIEs’ Assets and Liabilities
Structured finance FG VIEs’ assets and liabilities are carried at fair value under the FVO and are classified as Level 3. The Company elected the FVO for the Puerto Rico Trusts’ liabilities and they were classified as Level 3.
The fair value of the residential mortgage loans in the FG VIEs’ assets is generally sensitive to changes in estimated prepayment speeds; estimated default rates (determined on the basis of an analysis of collateral attributes such as: historical collateral performance, borrower profiles and other features relevant to the evaluation of collateral credit quality); yields implied by market prices for similar securities; and, as applicable, house price depreciation/appreciation rates based on macroeconomic forecasts. Significant changes to some of these inputs could have materially changed the fair value of the FG VIEs’ assets and the implied collateral losses within these transactions. In general, the fair value of the FG VIEs’ assets is most sensitive to changes in the projected collateral losses, where an increase in collateral losses typically leads to a potential decrease in the fair value of FG VIEs’ assets, while a decrease in collateral losses typically leads to an increase in the fair value of FG VIEs’ assets.
The prices of the assets and liabilities of the FG VIEs are generally determined with the assistance of an independent third party and based on a discounted cash flow approach. The third party pricing service utilizes an internal model to determine an appropriate yield at which to discount the cash flows of the security by factoring in collateral types, weighted average lives and other structural attributes specific to the security being priced. The expected yield is further calibrated by utilizing algorithms designed to aggregate market color, received by the independent third party, on comparable bonds.
The models used to price the FG VIEs’ liabilities (other than the liabilities of the Puerto Rico Trusts) generally apply the same inputs used in determining fair value of FG VIEs’ assets. For those liabilities insured by the Company, the benefit of the Company’s insurance policy guaranteeing the timely payment of debt service is also taken into account. The liabilities of the Puerto Rico Trusts were priced based on the value of the assets in the Puerto Rico Trusts including the value of the Company’s financial guaranty policy.
The timing of expected losses within an insured transaction is a significant factor in determining the implied benefit of the Company’s insurance policy, which guarantees the timely payment of principal and interest for the insured tranches of debt issued by the FG VIEs. In general, a longer time period until the Company’s expected loss payments typically leads to a decrease in the value of the Company’s insurance and a decrease in the fair value of the Company’s FG VIEs’ liabilities with recourse, while a shorter time period until the Company’s expected loss payments typically could lead to an increase in the value of the Company’s insurance and an increase in the fair value of the Company’s FG VIEs’ liabilities with recourse.
Assets and Liabilities of CIVs
Investments held by CIVs which are quoted on a national securities exchange are valued at their last reported sale price on the date of determination. Investments held by CIVs which are traded over-the-counter reflect third-party data and generally reflect the average of dealer offer and bid prices. The valuation methodology may include, but is not limited to: (i) performing price comparisons with similar investments; (ii) obtaining valuation-related information from issuers; (iii) calculating the present value of future cash flows; (iv) assessing other data related to the investment that is an indication of value; (v) obtaining information provided by third parties; and/or (vi) evaluating information provided by the investment manager. Inputs may include dealer price quotations, yield curves, credit curves, forward/CDS/index spreads, prepayments rates, strike and expiry dates, volatility statistics and other factors.
Significant changes to any of the inputs described above could have a material effect on the fair value of the CIV’s assets and liabilities.
Assured Guaranty Ltd.
Notes to Consolidated Financial Statements, Continued
Amounts recorded at fair value in the Company’s financial statements are presented in the tables below.
Fair Value Hierarchy of Financial Instruments Carried at Fair Value
As of December 31, 2024
| | | | | | | | | | | | | | | | | | | | | | | |
| | Fair Value Hierarchy | | |
| | Level 1 | | Level 2 | | Level 3 | | Total |
| | (in millions) |
| Assets: | | | | | | | |
| Fixed-maturity securities, available-for-sale: | | | | | | | |
| Obligations of state and political subdivisions | $ | — | | | $ | 1,930 | | | $ | 10 | | | $ | 1,940 | |
| U.S. government and agencies | — | | | 67 | | | — | | | 67 | |
| Corporate securities | — | | | 2,382 | | | — | | | 2,382 | |
| Mortgage-backed securities: | | | | | | | |
| RMBS | — | | | 422 | | | 145 | | | 567 | |
| CMBS | — | | | 186 | | | — | | | 186 | |
| Asset-backed securities | — | | | 127 | | | 1,031 | | | 1,158 | |
| Non-U.S. government securities | — | | | 69 | | | — | | | 69 | |
| Total fixed-maturity securities, available-for-sale | — | | | 5,183 | | | 1,186 | | | 6,369 | |
| Fixed-maturity securities, trading | — | | | 142 | | | 5 | | | 147 | |
| Short-term investments | 1,218 | | | 3 | | | — | | | 1,221 | |
| Other invested assets (1) | — | | | — | | | 4 | | | 4 | |
| FG VIEs’ assets | — | | | — | | | 147 | | | 147 | |
| Assets of CIVs, equity securities | — | | | — | | | 99 | | | 99 | |
| Other assets | 65 | | | 59 | | | 7 | | | 131 | |
| Total assets carried at fair value | $ | 1,283 | | | $ | 5,387 | | | $ | 1,448 | | | $ | 8,118 | |
| Liabilities: | | | | | | | |
| FG VIEs’ liabilities (2) | $ | — | | | $ | — | | | $ | 164 | | | $ | 164 | |
| Other liabilities | — | | | — | | | 34 | | | 34 | |
| Total liabilities carried at fair value | $ | — | | | $ | — | | | $ | 198 | | | $ | 198 | |
Assured Guaranty Ltd.
Notes to Consolidated Financial Statements, Continued
Fair Value Hierarchy of Financial Instruments Carried at Fair Value
As of December 31, 2023
| | | | | | | | | | | | | | | | | | | | | | | |
| | Fair Value Hierarchy | | |
| | Level 1 | | Level 2 | | Level 3 | | Total |
| | (in millions) |
| Assets: | | | | | | | |
| Fixed-maturity securities, available-for-sale: | | | | | | | |
| Obligations of state and political subdivisions | $ | — | | | $ | 2,655 | | | $ | 6 | | | $ | 2,661 | |
| U.S. government and agencies | — | | | 60 | | | — | | | 60 | |
| Corporate securities | — | | | 2,141 | | | — | | | 2,141 | |
| Mortgage-backed securities: | | | | | | | |
| RMBS | — | | | 188 | | | 154 | | | 342 | |
| CMBS | — | | | 151 | | | — | | | 151 | |
| Asset-backed securities | — | | | 49 | | | 803 | | | 852 | |
| Non-U.S. government securities | — | | | 100 | | | — | | | 100 | |
| Total fixed-maturity securities, available-for-sale | — | | | 5,344 | | | 963 | | | 6,307 | |
| Fixed-maturity securities, trading | — | | | 318 | | | — | | | 318 | |
| Short-term investments | 1,657 | | | 4 | | | — | | | 1,661 | |
| Other invested assets (1) | — | | | — | | | 3 | | | 3 | |
| FG VIEs’ assets | — | | | — | | | 174 | | | 174 | |
| Assets of CIVs: | | | | | | | |
| Equity securities | — | | | 3 | | | 80 | | | 83 | |
| Structured products | — | | | 59 | | | 189 | | | 248 | |
| Total assets of CIVs | — | | | 62 | | | 269 | | | 331 | |
| Other assets | 55 | | | 52 | | | 16 | | | 123 | |
| Total assets carried at fair value | $ | 1,712 | | | $ | 5,780 | | | $ | 1,425 | | | $ | 8,917 | |
| Liabilities: | | | | | | | |
| FG VIEs’ liabilities (2) | $ | — | | | $ | — | | | $ | 554 | | | $ | 554 | |
| Other liabilities | — | | | — | | | 53 | | | 53 | |
| Total liabilities carried at fair value | $ | — | | | $ | — | | | $ | 607 | | | $ | 607 | |
____________________
(1) Includes Level 3 mortgage loans that are recorded at fair value on a non-recurring basis.
(2) Includes FG VIEs’ liabilities with recourse and FG VIEs’ liabilities without recourse. See Note 8, Financial Guaranty Variable Interest Entities and Consolidated Investment Vehicles.
Assured Guaranty Ltd.
Notes to Consolidated Financial Statements, Continued
Changes in Level 3 Fair Value Measurements
The tables below present a roll forward of the Company’s Level 3 financial instruments carried at fair value on a recurring basis during the years ended December 31, 2024 and 2023.
Roll Forward of Level 3 Assets (Liabilities) at Fair Value on a Recurring Basis
Year Ended December 31, 2024
| | | | | | | | | | | | | | | | | | | | | | | | | | | | | | | | | | | | | | | | | | | | | | | | | | |
| Fixed-Maturity Securities, Available-for-Sale | | | | | | Assets of CIVs | | | |
| | Obligations
of State and
Political
Subdivisions | | RMBS | | Asset-
Backed
Securities | | Fixed-Maturity Securities, Trading | | FG VIEs’
Assets | | Equity Securities | | Structured Products | | Other
(7) | |
| | (in millions) |
| Fair value as of December 31, 2023 | $ | 6 | | | $ | 154 | | | $ | 803 | | | $ | — | | | $ | 174 | | | $ | 80 | | | $ | 189 | | | $ | 14 | | |
| Total pre-tax realized and unrealized gains (losses) recorded in: | | | | | | | | | | | | | | | | |
| Net income (loss) | — | | | 14 | | (1) | 48 | | (1) | — | | | (3) | | (2) | 29 | | (4) | (16) | | (4) | (10) | | (3) |
| Other comprehensive income (loss) | 4 | | | 2 | | | 1 | | | — | | | (1) | | | — | | | — | | | 1 | | |
| Purchases | — | | | — | | | 63 | | | — | | | — | | | — | | | 102 | | | — | | |
| Sales | — | | | — | | | — | | | — | | | — | | | (10) | | | (28) | | | — | | |
| Settlements | — | | | (25) | | | (149) | | | (3) | | | (23) | | | — | | | — | | | — | | |
| Reclassifications (10) | — | | | — | | | 245 | | | 8 | | | — | | | — | | | (253) | | | — | | |
| Deconsolidations | — | | | — | | | — | | | — | | | — | | | (1) | | | (2) | | | — | | |
| Transfers into Level 3 | — | | | — | | | 20 | | | — | | | — | | | 3 | | | 10 | | | — | | |
| Transfers out of Level 3 | — | | | — | | | — | | | — | | | — | | | (2) | | | (2) | | | — | | |
| Fair value as of December 31, 2024 | $ | 10 | | | $ | 145 | | | $ | 1,031 | | | $ | 5 | | | $ | 147 | | | $ | 99 | | | $ | — | | | $ | 5 | | |
| Change in unrealized gains (losses) related to financial instruments held as of December 31, 2024 included in: | | | | | | | | | | | | | | | | |
| Earnings | | | | | | | $ | — | | | $ | (7) | | (2) | $ | 29 | | (4) | $ | — | | | $ | (10) | | (3) |
| OCI | $ | 4 | | | $ | 2 | | | $ | (2) | | | | | $ | (1) | | | | | | | $ | 1 | | |
Roll Forward of Level 3 Assets (Liabilities) at Fair Value on a Recurring Basis
Year Ended December 31, 2024
| | | | | | | | | | | | | | |
| | Credit Derivative Liability, net (5) | | FG VIEs’ Liabilities (8) | |
| | (in millions) |
| Fair value as of December 31, 2023 | $ | (50) | | | $ | (554) | | |
| Total pre-tax realized and unrealized gains (losses) recorded in: | | | | |
| Net income (loss) | 24 | | (6) | | 12 | | (2) | |
| Other comprehensive income (loss) | — | | | 3 | | |
| Issuances | (2) | | | — | | |
| Settlements | (1) | | | 375 | | |
| Fair value as of December 31, 2024 | $ | (29) | | | $ | (164) | | |
| Change in unrealized gains (losses) related to financial instruments held as of December 31, 2024 included in: | | | | |
| Earnings | $ | 13 | | (6) | | $ | 3 | | (2) | |
| OCI | | | $ | 3 | | |
Assured Guaranty Ltd.
Notes to Consolidated Financial Statements, Continued
Roll Forward of Level 3 Assets (Liabilities) at Fair Value on a Recurring Basis
Year Ended December 31, 2023
| | | | | | | | | | | | | | | | | | | | | | | | | | | | | | | | | | | | | | | | | | | | | | | | | | |
| Fixed-Maturity Securities, Available-For-Sale | | | | Assets of CIVs | | | |
| Obligations
of State and
Political
Subdivisions | | RMBS | | Asset-
Backed
Securities | | FG VIEs’
Assets | | Equity Securities and Warrants | | Corporate Securities | | Structured Products | | Other
(7) | |
| (in millions) |
| Fair value as of December 31, 2022 | $ | 47 | | | $ | 179 | | | $ | 794 | | | $ | 204 | | | $ | 297 | | | $ | 96 | | | $ | 46 | | | $ | 50 | | |
| Total pre-tax realized and unrealized gains (losses) recorded in: | | | | | | | | | | | | | | | | |
| Net income (loss) | 1 | | (1) | | 13 | | (1) | | 32 | | (1) | | 9 | | (2) | | 51 | | (4) | | (3) | | (4) | | 21 | | (4) | (32) | | (3) | |
| Other comprehensive income (loss) | (2) | | | (8) | | | (8) | | | — | | | — | | | — | | | — | | | — | | |
| Purchases | — | | | — | | | 23 | | | — | | | 42 | | | 6 | | | 5 | | | — | | |
| Sales | — | | | — | | | (2) | | | — | | | (91) | | | (15) | | | (48) | | | — | | |
| Settlements | (3) | | | (30) | | | (36) | | | (33) | | | — | | | — | | | — | | | (4) | | |
| Deconsolidations | — | | | — | | | — | | | (7) | | | (219) | | | (84) | | | 165 | | | — | | |
| Transfers into Level 3 | 3 | | | — | | | — | | | 1 | | | — | | | — | | | — | | | — | | |
| Transfers out of Level 3 | (40) | | | — | | | — | | | — | | | — | | | — | | | — | | | — | | |
| Fair value as of December 31, 2023 | $ | 6 | | | $ | 154 | | | $ | 803 | | | $ | 174 | | | $ | 80 | | | $ | — | | | $ | 189 | | | $ | 14 | | |
| Change in unrealized gains (losses) related to financial instruments held as of December 31, 2023 included in: | | | | | | | | | | | | | | | | |
| Earnings | | | | | | | $ | 4 | | (2) | | $ | 11 | | (4) | | $ | — | | | $ | 10 | | (4) | | $ | (32) | | (3) | |
| OCI | $ | — | | | $ | (7) | | | $ | 9 | | | | | | | | | | | $ | — | | |
Roll Forward of Level 3 Assets (Liabilities) at Fair Value on a Recurring Basis
Year Ended December 31, 2023
| | | | | | | | | | | | | | | | | | | | |
| Credit Derivative Liability, net (5) | | FG VIEs’ Liabilities (8) | | Liabilities of CIVs (9) | |
| (in millions) | |
| Fair value as of December 31, 2022 | $ | (162) | | | $ | (715) | | | $ | (4,154) | | |
| Total pre-tax realized and unrealized gains (losses) recorded in: | | | | | | |
| Net income (loss) | 114 | | (6) | | 2 | | (2) | | (45) | | (4) | |
| Other comprehensive income (loss) | — | | | 3 | | | (13) | | |
| Issuances | (1) | | | — | | | — | | |
| Settlements | (1) | | | 149 | | | 13 | | |
| Deconsolidations | — | | | 7 | | | 4,199 | | |
| Fair value as of December 31, 2023 | $ | (50) | | | $ | (554) | | | $ | — | | |
| Change in unrealized gains (losses) related to financial instruments held as of December 31, 2023 included in: | | | | | | |
| Earnings | $ | 112 | | (6) | | $ | — | | | $ | — | | |
| OCI | | | $ | 3 | | | $ | — | | |
__________________(1)Included in “net realized investment gains (losses)” and “net investment income.”
(2)Reported in “fair value gains (losses) on FG VIEs.”
(3)Reported in “fair value gains (losses) on CCS,” “net investment income” and “other income (loss).”
(4)Reported in “fair value gains (losses) on CIVs.”
(5)Represents the net position of credit derivatives. Credit derivative assets (reported in “other assets”) and credit derivative liabilities (reported in “other liabilities”) are shown as either assets or liabilities in the consolidated balance sheets.
(6)Reported in “fair value gains (losses) on credit derivatives.”
(7)Includes CCS and other invested assets.
(8)Includes FG VIEs’ liabilities with recourse and FG VIEs’ liabilities without recourse.
(9)Includes primarily various tranches of CLO debt. The CLOs were CFEs that were consolidated until the Sound Point Transaction occurred on July 1, 2023.
(10)Represents securities transferred from two of the CIVs to the investment portfolio due to the distribution of assets of these CIVs. See Note 8, Financial Guaranty Variable Interest Entities and Consolidated Investment Vehicles, for additional information.
Assured Guaranty Ltd.
Notes to Consolidated Financial Statements, Continued
Level 3 Fair Value Disclosures
Quantitative Information About Level 3 Fair Value Inputs
As of December 31, 2024
| | | | | | | | | | | | | | | | | | | | | | | | | | | | | | | | |
| Financial Instrument Description | | Fair Value
Assets (Liabilities)
(in millions) | | Significant Unobservable
Inputs | | Range | | Weighted Average (4) |
| Investments (2): | | | | | | | | | | |
| Fixed-maturity securities, available-for-sale (1): | | | | | | | | | | |
| Obligations of state and political subdivisions | | $ | 10 | | | Yield | | 5.5 | % | - | 22.0% | | 7.5% |
| RMBS | | 145 | | | Conditional prepayment rate (CPR) | | 1.8 | % | - | 17.0% | | 2.8% |
| | | | CDR | | 1.8 | % | - | 18.7% | | 5.4% |
| | | | Loss severity | | 50.0 | % | - | 125.0% | | 79.9% |
| | | | Yield | | 7.7 | % | - | 10.8% | | 9.1% |
| Asset-backed securities: | | | | | | | | | | |
| CLOs | | 611 | | | Discount margin | | 0.8 | % | - | 2.9% | | 1.9% |
| | | | Yield | | 12.5 | % | - | 22.5% | | 17.9% |
| Others | | 420 | | | Yield | | 6.4 | % | - | 9.1% | | 6.7% |
| Fixed-maturity securities, trading (1) | | 5 | | | Yield | | 19.8 | % | - | 169.5% | | 163.8% |
| FG VIEs’ assets (1) | | 147 | | | CPR | | 2.2 | % | - | 25.0% | | 5.7% |
| | | | CDR | | 1.3 | % | - | 41.0% | | 10.7% |
| | | | Loss severity | | 45.0 | % | - | 100.0% | | 83.2% |
| | | | Yield | | 6.8 | % | - | 10.8% | | 9.3% |
| Assets of CIVs - equity securities (3) | | 99 | | | Discount rate | | 24.3% | | |
| | | | Market multiple-price to book | | 1.05x | | |
| | | | Market multiple-price to earnings | | 5.25x | | |
| | | | Terminal growth rate | | 4.0% | | |
| | | | Exit multiple-price to book | | 1.05x | | |
| | | | Exit multiple-price to earnings | | 5.50x | | |
| Other assets (1) | | 2 | | | Implied Yield | | 6.5 | % | - | 7.0% | | 6.8% |
| | | | Term (years) | | 10 years | | |
| Credit derivative liabilities, net (1) | | (29) | | | Hedge cost (in basis points)( bps) | | 12.8 | - | 30.1 | | 16.8 |
| | | | Bank profit (in bps) | | 73.2 | - | 275.9 | | 139.3 |
| | | | Internal floor (in bps) | | 10.0 | - | 85.5 | | 29.7 |
| | | | Internal credit rating | | AAA | - | CCC | | A |
| | | | Discount rates of future expected premium cash flows | | 3.9 | % | - | 4.4% | | 4.3% |
| FG VIEs’ liabilities (1) | | (164) | | | CPR | | 2.2 | % | - | 25.0% | | 5.7% |
| | | | CDR | | 1.3 | % | - | 41.0% | | 10.7% |
| | | | Loss severity | | 45.0 | % | - | 100.0% | | 83.2% |
| | | | Yield | | 5.5 | % | - | 10.8% | | 7.0% |
____________________
(1) Discounted cash flow is used as the primary valuation technique.
(2) Excludes several investments reported in “other invested assets” with a fair value of $4 million.
(3) The primary valuation technique uses the income and/or market approach.
(4) Weighted average is calculated as a percentage of current par outstanding for all categories except for assets of CIVs, for which it is calculated as a percentage of fair value.
Assured Guaranty Ltd.
Notes to Consolidated Financial Statements, Continued
Quantitative Information About Level 3 Fair Value Inputs
As of December 31, 2023
| | | | | | | | | | | | | | | | | | | | | | | | | | | | | | | | |
| Financial Instrument Description | | Fair Value
Assets (Liabilities)
(in millions) | | Significant Unobservable
Inputs | | Range | | Weighted Average (4) |
| Investments (2): | | | | | | | | | | |
| Fixed-maturity securities, available-for-sale (1): | | | | | | | | | | |
| Obligations of state and political subdivisions | | $ | 6 | | | Yield | | 7.4 | % | - | 22.5% | | 7.8% |
| RMBS | | 154 | | | CPR | | 0.1 | % | - | 15.0% | | 3.4% |
| | | | CDR | | 1.5 | % | - | 18.8% | | 5.6% |
| | | | Loss severity | | 50.0 | % | - | 125.0% | | 82.6% |
| | | | Yield | | 7.5 | % | - | 11.3% | | 8.9% |
| Asset-backed securities: | | | | | | | | | | |
| CLOs | | 450 | | | Discount margin | | 1.1 | % | - | 9.5% | | 2.6% |
| Others | | 353 | | | Yield | | 6.2 | % | - | 11.7% | | 7.8% |
| FG VIEs’ assets (1) | | 174 | | | CPR | | 0.2 | % | - | 21.4% | | 7.8% |
| | | | CDR | | 1.3 | % | - | 41.0% | | 10.4% |
| | | | Loss severity | | 45.0 | % | - | 100.0% | | 82.9% |
| | | | Yield | | 5.5 | % | - | 10.9% | | 9.4% |
| Assets of CIVs (3): | | | | | | | | | | |
| Equity securities | | 80 | | | Discount rate | | 20.9% | | |
| | | | Market multiple-price to book | | 1.10x | | |
| | | | Market multiple-price to earnings | | 5.50x | | |
| | | | Terminal growth rate | | 4.0% | | |
| | | | Exit multiple-price to book | | 1.10x | | |
| | | | Exit multiple-price to earnings | | 5.50x | | |
| Structured products | | 189 | | | Yield | | 14.7% | - | 21.4% | | 18.0% |
| Other assets (1) | | 13 | | | Implied Yield | | 7.8 | % | - | 8.4% | | 8.1% |
| | | | Term (years) | | 10 years | | |
| Credit derivative liabilities, net (1) | | (50) | | | Hedge cost (in bps) | | 10.2 | - | 26.5 | | 15.8 |
| | | | Bank profit (in bps) | | 105.6 | - | 302.6 | | 158.6 |
| | | | Internal floor (in bps) | | 10.0 | | |
| | | | Internal credit rating | | AAA | - | CCC | | A |
| | | | Discount rates of future expected premium cash flows | | 3.3 | % | - | 4.8% | | 3.6% |
| FG VIEs’ liabilities (1) | | (554) | | | CPR | | 0.2 | % | - | 21.4% | | 7.8% |
| | | | CDR | | 1.3 | % | - | 41.0% | | 10.4% |
| | | | Loss severity | | 45.0 | % | - | 100.0% | | 82.9% |
| | | | Yield | | 5.0 | % | - | 10.7% | | 5.8% |
____________________
(1) Discounted cash flow is used as the primary valuation technique.
(2) Excludes several investments reported in “other invested assets” with a fair value of $3 million.
(3) The primary valuation technique uses the income and/or market approach.
(4) Weighted average is calculated as a percentage of current par outstanding for all categories except for assets of CIVs, for which it is calculated as a percentage of fair value.
Assured Guaranty Ltd.
Notes to Consolidated Financial Statements, Continued
Not Carried at Fair Value
Financial Guaranty Insurance Contracts
Fair value is based on management’s estimate of the consideration that would be paid to, or received from, a similarly rated financial guaranty insurance company to acquire the Company’s in-force book of financial guaranty insurance business. It is based upon the ratio of current trends in premium pricing to risk-based expected loss for investment grade portions of the portfolio and stressed loss pricing for BIG transactions. The Company classified the fair value of financial guaranty insurance contracts as Level 3.
Long-Term Debt
Long-term debt issued by the U.S. Holding Companies is valued by broker-dealers using independent third-party pricing sources and standard market conventions and classified as Level 2 in the fair value hierarchy. The market conventions utilize market quotations, market transactions for the Company’s comparable instruments, and to a lesser extent, similar instruments in the broader insurance industry.
Assets of CIVs
Cash equivalents are recorded at cost which approximates fair value and are considered Level 1 in the fair value hierarchy.
The carrying amount and estimated fair value of the Company’s financial instruments not carried at fair value are presented in the following table.
Fair Value of Financial Instruments Not Carried at Fair Value
| | | | | | | | | | | | | | | | | | | | | | | |
| | As of December 31, 2024 | | As of December 31, 2023 |
| | Carrying
Amount | | Estimated
Fair Value | | Carrying
Amount | | Estimated
Fair Value |
| | (in millions) |
| Assets (liabilities): | | | | | | | |
| Assets of CIVs | $ | — | | | $ | — | | | $ | 19 | | | $ | 19 | |
| Other assets (including other invested assets) | 115 | | | 116 | | | 79 | | | 80 | |
| Financial guaranty insurance contracts (1) | (2,029) | | | (1,136) | | | (2,244) | | | (1,811) | |
| Long-term debt | (1,699) | | | (1,579) | | | (1,694) | | | (1,593) | |
| Other liabilities | (16) | | | (16) | | | (15) | | | (15) | |
____________________
(1) Carrying amount includes the assets and liabilities related to financial guaranty insurance contract premiums, losses and salvage and subrogation and other recoverables net of reinsurance.
10. Asset Management Fees
Prior to the Sound Point Transaction and AHP Transaction, the Company received management fees, as well as performance fees, incentive allocations or carried interest (collectively referred to as performance fees) in exchange for AssuredIM providing investment advisory services to manage investment funds and CLOs. After the Sound Point Transaction and AHP Transaction, the Company continues to consolidate the general partner of a fund that Sound Point now manages and reports any performance fees in “other income.”
Accounting Policy
All management, CLO and performance fees earned by the Company are accounted for as contracts with customers. The Company recognizes revenue when the contractual performance criteria are met and only to the extent that it is probable that a significant reversal in the amount of cumulative revenue recognized would not occur when the uncertainty associated with the variable consideration is resolved. Performance fee contractual provisions are evaluated on an individual basis to determine the timing of revenue recognition.
Assured Guaranty Ltd.
Notes to Consolidated Financial Statements, Continued
Asset Management Fees
The following table presents the sources of asset management fees on a consolidated basis.
Asset Management Fees
| | | | | | | | | | | | | | | | | |
| Year Ended December 31, |
| | 2024 | | 2023 (1) | | 2022 |
| | (in millions) |
| Management fees | $ | — | | | $ | 21 | | | $ | 53 | |
| Performance fees | — | | | 18 | | | 19 | |
| Reimbursable fund expenses | — | | | 14 | | | 21 | |
| Total asset management fees | $ | — | | | $ | 53 | | | $ | 93 | |
____________________
(1) Represents asset management fees associated with the AssuredIM consolidated business for the first half of 2023, prior to the Sound Point Transaction and AHP Transaction.
In the second half of 2023, after the consummation of the Sound Point Transaction, one AssuredIM general partnership is still consolidated in the Company’s financial statements, which had $10 million of revenues and $6 million of expenses in 2024, and $5 million of revenues and $3 million of expenses in 2023.
11. Long-Term Debt and Credit Facilities
Accounting Policy
Long-term debt is recorded at principal amounts net of any: (i) unamortized original issue discount or premium; (ii) unamortized acquisition date fair value adjustments for AGMH debt; and (iii) debt issuance costs. Original issue discount and premium, acquisition date fair value adjustments for AGMH debt, and debt issuance costs are accreted into interest expense over the contractual term of the applicable debt. When long-term debt is redeemed, the difference between the cash paid to redeem the debt and the carrying value of the debt is reported as a “loss on extinguishment of debt” in the consolidated statements of operations.
CCS are carried at fair value with changes in fair value reported in the consolidated statement of operations. See Note 9, Fair Value Measurement, – Other Assets – Committed Capital Securities, for a discussion of the fair value measurement of the CCS.
Long-Term Debt
The Company’s long-term debt outstanding consists of debt issued by the U.S. Holding Companies. All of the U.S. Holding Companies’ long-term debt is fully and unconditionally guaranteed by AGL; AGL’s guarantee of the junior subordinated debentures is on a junior subordinated basis.
Assured Guaranty Ltd.
Notes to Consolidated Financial Statements, Continued
Principal and Carrying Amounts of Debt
The principal and carrying values of the Company’s debt are presented in the table below.
Principal and Carrying Amounts of Long-Term Debt
| | | | | | | | | | | | | | | | | | | | | | | |
| | As of December 31, 2024 | | As of December 31, 2023 |
| | Principal | | Carrying
Value | | Principal | | Carrying
Value |
| | (in millions) |
| AGUS 6.125% Senior Notes | $ | 350 | | | $ | 346 | | | $ | 350 | | | $ | 345 | |
| AGUS 3.15% Senior Notes | 500 | | | 496 | | | 500 | | | 496 | |
| AGUS 7% Senior Notes | 200 | | | 198 | | | 200 | | | 198 | |
| AGUS 3.6% Senior Notes | 400 | | | 396 | | | 400 | | | 395 | |
| AGUS Series A Enhanced Junior Subordinated Debentures | 150 | | | 150 | | | 150 | | | 150 | |
| AGMH Junior Subordinated Debentures (1) | 146 | | | 113 | | | 146 | | | 110 | |
| Total | $ | 1,746 | | | $ | 1,699 | | | $ | 1,746 | | | $ | 1,694 | |
____________________
(1) Carrying amounts are different than principal amounts primarily due to fair value adjustments at the date of the AGMH acquisition, which are accreted into interest expense over the remaining terms of these obligations. Net of AGMH’s long-term debt purchased by AGUS.
Debt Issued by AGUS
6.125% Senior Notes. On August 21, 2023, AGUS issued $350 million of 6.125% Senior Notes due 2028 (6.125% Senior Notes) for net proceeds of $345 million. The net proceeds from the issuance were used for the redemption on September 25, 2023, of $330 million of AGUS’s debt maturing in 2024. AGUS may redeem all or part of the 6.125% Senior Notes at any time or from time to time prior to August 15, 2028 (the date that is one month prior to the maturity of the 6.125% Senior Notes), at its option, at a redemption price equal to the greater of: (i) the sum of the present values of the remaining scheduled payments of principal and interest on the 6.125% Senior Notes being redeemed (excluding interest accrued to the redemption date) from the redemption date to August 15, 2028 discounted to the date of redemption on a semi-annual basis (assuming a 360-day year consisting of twelve 30-day months) at a discount rate equal to the Treasury Rate plus 30 bps; and (ii) 100% of the principal amount of the 6.125% Senior Notes being redeemed; plus, in each case, accrued and unpaid interest on the 6.125% Senior Notes to be redeemed to, but excluding, the redemption date. AGUS may redeem all or part of the 6.125% Senior Notes at any time or from time to time on and after August 15, 2028, at its option, at a redemption price equal to 100% of the principal amount of the 6.125% Senior Notes being redeemed, plus accrued and unpaid interest on the 6.125% Senior Notes to be redeemed to, but excluding, the redemption date. The 6.125% Senior Notes are senior unsecured obligations of AGUS and rank equal in right of payment with all of AGUS’s other unsecured and unsubordinated indebtedness outstanding. The 6.125% Senior Notes are fully and unconditionally guaranteed on a senior unsecured basis by AGL and ranks equal in right of payment with all of AGL’s other unsecured and unsubordinated indebtedness outstanding.
3.15% Senior Notes. On May 26, 2021, AGUS issued $500 million of 3.150% Senior Notes due 2031 (3.15% Senior Notes) for net proceeds of $494 million. The net proceeds from the issuance were used for the partial redemption of AGMH’s debt, with the balance being used for general corporate purposes, including share repurchases. AGUS may redeem all or part of the 3.15% Senior Notes at any time or from time to time prior to March 15, 2031 (the date that is three months prior to the maturity of the 3.15% Senior Notes), at its option, at a redemption price equal to the greater of: (i) 100% of the principal amount of the 3.15% Senior Notes being redeemed; or (ii) the sum of the present values of the remaining scheduled payments of principal and interest on the Notes being redeemed (excluding interest accrued to the redemption date) from the redemption date to March 15, 2031 discounted to the date of redemption on a semi-annual basis (assuming a 360-day year consisting of twelve 30-day months) at a discount rate equal to the Treasury Rate plus 25 bps; plus, in each case, accrued and unpaid interest on the 3.15% Senior Notes to be redeemed to, but excluding, the redemption date. AGUS may redeem all or part of the 3.15% Senior Notes at any time or from time to time on and after March 15, 2031, at its option, at a redemption price equal to 100% of the principal amount of the 3.15% Senior Notes being redeemed, plus accrued and unpaid interest on the 3.15% Senior Notes to be redeemed to, but excluding, the redemption date. The 3.15% Senior Notes are fully and unconditionally guaranteed on a senior unsecured basis by AGL. The 3.15% Senior Notes are senior unsecured obligations of AGUS and rank equal in right of payment with all of AGUS’s other unsecured and unsubordinated indebtedness outstanding. The guarantee is a senior
Assured Guaranty Ltd.
Notes to Consolidated Financial Statements, Continued
unsecured obligation of AGL and ranks equal in right of payment with all of AGL’s other unsecured and unsubordinated indebtedness outstanding.
7% Senior Notes. On May 18, 2004, AGUS issued $200 million of 7% Senior Notes due 2034 (7% Senior Notes) for net proceeds of $197 million. Although the coupon on the Senior Notes is 7%, the effective rate is approximately 6.4%, taking into account the effect of a cash flow hedge executed by the Company in March 2004. The notes are redeemable, in whole or in part, at their principal amount plus accrued and unpaid interest to the date of redemption or, if greater, the make-whole redemption price.
3.6% Senior Notes. On August 20, 2021, AGUS issued $400 million of 3.6% Senior Notes due 2051 (3.6% Senior Notes) for net proceeds of $395 million. The net proceeds from the issuance were used for the redemption on September 27, 2021, of certain AGMH’s debt and a portion of AGUS’s debt maturing in 2024, as described below. AGUS may redeem all or part of the 3.6% Senior Notes at any time or from time to time prior to March 15, 2051 (the date that is six months prior to the maturity of the 3.6% Senior Notes), at its option, at a redemption price equal to the greater of: (i) 100% of the principal amount of the 3.6% Senior Notes being redeemed; or (ii) the sum of the present values of the remaining scheduled payments of principal and interest on the Notes being redeemed (excluding interest accrued to the redemption date) from the redemption date to March 15, 2051 discounted to the date of redemption on a semi-annual basis (assuming a 360-day year consisting of twelve 30-day months) at a discount rate equal to the Treasury Rate plus 30 bps; plus, in each case, accrued and unpaid interest on the 3.6% Senior Notes to be redeemed to, but excluding, the redemption date. AGUS may redeem all or part of the 3.6% Senior Notes at any time or from time to time on and after March 15, 2051, at its option, at a redemption price equal to 100% of the principal amount of the 3.6% Senior Notes being redeemed, plus accrued and unpaid interest on the 3.6% Senior Notes to be redeemed to, but excluding, the redemption date. The 3.6% Senior Notes are fully and unconditionally guaranteed on a senior unsecured basis by AGL. The 3.6% Senior Notes are senior unsecured obligations of AGUS and rank equal in right of payment with all of AGUS’s other unsecured and unsubordinated indebtedness outstanding. The guarantee is a senior unsecured obligation of AGL and ranks equal in right of payment with all of AGL’s other unsecured and unsubordinated indebtedness outstanding.
Series A Enhanced Junior Subordinated Debentures. On December 20, 2006, AGUS issued $150 million of Debentures due 2066. The Debentures pay a floating rate of interest, reset quarterly, at a rate equal to three month Chicago Mercantile Exchange (CME) Term SOFR plus a margin equal to 2.64%. AGUS may select at one or more times to defer payment of interest for one or more consecutive periods for up to ten years. Any unpaid interest bears interest at the then applicable rate. AGUS may not defer interest past the maturity date. The debentures are redeemable, in whole or in part, at their principal amount plus accrued and unpaid interest to the date of redemption.
Debt Issued by AGMH
Junior Subordinated Debentures. On November 22, 2006, AGMH issued $300 million face amount of Junior Subordinated Debentures with a scheduled maturity date of December 15, 2036 and a final repayment date of December 15, 2066. The final repayment date of December 15, 2066 may be automatically extended up to four times in five-year increments provided certain conditions are met. The debentures are redeemable, in whole or in part, at any time prior to December 15, 2036 at their principal amount plus accrued and unpaid interest to the date of redemption or, if greater, the make-whole redemption price. Interest on the debentures will accrue from November 22, 2006 to December 15, 2036 at the annual rate of 6.4%. If any amount of the debentures remains outstanding after December 15, 2036, then the principal amount of the outstanding debentures will bear interest at a floating interest rate equal to one-month CME Term SOFR plus 2.33% until repaid. AGMH may elect at one or more times to defer payment of interest on the debentures for one or more consecutive interest periods that do not exceed ten years. In connection with the completion of this offering, AGMH entered into a replacement capital covenant for the benefit of persons that buy, hold or sell a specified series of AGMH long-term indebtedness ranking senior to the debentures. Under the covenant, the debentures will not be repaid, redeemed, repurchased or defeased by AGMH or any of its subsidiaries on or before the date that is 20 years prior to the final repayment date, except to the extent that AGMH has received proceeds from the sale of replacement capital securities. The proceeds from this offering were used to pay a dividend to the shareholders of AGMH. Over the past several years AGUS purchased, and as of December 31, 2024 and 2023, AGUS holds approximately $154 million in principal of the AGMH Subordinated Debentures.
Assured Guaranty Ltd.
Notes to Consolidated Financial Statements, Continued
Debt Maturity and Interest Expense
Scheduled principal payments of the Company’s debt are as follows:
Debt Maturity Schedule (1)
As of December 31, 2024
| | | | | | | | |
| Year | | Principal |
| | | (in millions) |
| 2028 | | $ | 350 | |
| 2031 | | 500 | |
| 2034 | | 200 | |
| 2051 | | 400 | |
| 2066 | | 296 | |
| Total | | $ | 1,746 | |
____________________
(1) Includes eliminations of AGMH’s debt purchased by AGUS.
The Company’s interest expense was $91 million, $90 million and $81 million for the years ended December 31, 2024, 2023 and 2022, respectively.
Committed Capital Securities
AG has entered into put agreements with eight separate custodial trusts allowing it to issue an aggregate of $400 million of non-cumulative redeemable perpetual preferred securities to the trusts in exchange for cash.
The arrangement entails eight custodial trusts (Woodbourne Capital Trust I, II, III and IV and Sutton Capital Trust I, II, III and IV), each of which issued $50 million face amount of “committed capital securities” and invested the proceeds of that issuance in eligible assets that would enable the trust to have the cash necessary to respond to AG’s exercise of a put option.
The put option consists of a right that AG has, pursuant to separate put agreements that AG entered into with each of the trusts, to issue to each trust $50 million of non-cumulative redeemable perpetual preferred stock, in exchange for an equivalent amount of cash (i.e., an aggregate of $400 million). When AG exercises its put option, the relevant trust(s) must liquidate the portfolio of high-quality, liquid assets that it currently maintains and use the liquidation proceeds to purchase AG preferred stock. The put agreements have no scheduled termination date or maturity, but may be terminated upon the occurrence of certain specified events. None of the events that would give rise to a termination of the put agreements have occurred.
12. Employee Benefit Plans
Assured Guaranty Ltd. Long-Term Incentive Plan
The Company maintains the Assured Guaranty Ltd. 2024 Long-Term Incentive Plan (the Incentive Plan), which is the successor plan to the Assured Guaranty Ltd. 2004 Long-Term Incentive Plan (the Prior Plan). The number of AGL common shares that may be delivered under the Incentive Plan include (i) 1,750,000 shares; plus (ii) any shares that were granted under the Prior Plan that are forfeited, expire, or are cancelled without delivery of shares or which result in the forfeiture of the shares back to the Company to the extent that such shares would have been added back to the reserve under the terms of the Prior Plan. As of December 31, 2024, 1,731,773 common shares were available to grant under the Incentive Plan. In the event of certain transactions affecting AGL’s common shares, the number or type of shares subject to the Incentive Plan, the number and type of shares subject to outstanding awards under the Incentive Plan, and the exercise price of awards under the Incentive Plan, may be adjusted.
The Incentive Plan provides for the grant of full value awards, which may be granted in return for a participant's previously performed services, or in return for the participant surrendering other compensation that may be due, or may be contingent on the achievement of performance or other objectives during a specified period. The grant of full value awards are subject to a risk of forfeiture or other restrictions that will lapse upon the achievement of one or more goals relating to completion of service by the participant, or achievement of performance or other objectives. In addition to full value awards,
Assured Guaranty Ltd.
Notes to Consolidated Financial Statements, Continued
the Incentive Plan also provides for the grant of incentive stock options, non-qualified stock options and stock appreciation rights.
The Incentive Plan is administered by the Compensation Committee of AGL’s Board of Directors (the Board), except as otherwise determined by the Board. The Board may amend or terminate the Incentive Plan. The Company issues new shares to settle share-based awards.
Accounting Policy
Share-based compensation expense is based on the grant date fair value using the grant date closing price or the Monte Carlo or Black-Scholes-Merton (Black-Scholes) pricing models. For retirement-eligible employees, the Company expenses the portion of the unvested time-based awards that fully vest upon retirement eligibility. Except for the time-based awards to retirement-eligible employees, the Company amortizes the fair value of share-based awards on a straight-line basis over the requisite service periods of the awards, which are generally the vesting periods.
The fair value of each award under the Assured Guaranty Ltd. Employee Stock Purchase Plan is estimated at the beginning of the offering period using the Black-Scholes option valuation model and are expensed over the period which the employee participates in the plan and pays for the shares.
Long-Term Incentive Plan
Restricted Share Units
Restricted share units are valued based on the closing price of the underlying shares at the date of grant. These restricted share units generally vest pro rata over a four-year period or all at once after a three-year period. The shares are delivered on the vesting date.
Restricted Share Unit Activity
| | | | | | | | | | | | | | |
| Nonvested Share Units | | Number of Share Units | | Weighted Average Grant Date Fair Value Per Share |
| Nonvested at December 31, 2023 | 932,728 | | | $ | 54.16 | |
| Granted | 192,362 | | | 84.59 | |
| Vested | (337,274) | | | 48.49 | |
| Forfeited | (7,335) | | | 54.81 | |
| Nonvested at December 31, 2024 | 780,481 | | | $ | 64.03 | |
As of December 31, 2024, the total unrecognized compensation cost related to outstanding non-vested restricted share units was $14 million, which the Company expects to recognize over the weighted average remaining service period of 1.6 years. The total fair value of restricted share units vested during the years ended December 31, 2024, 2023 and 2022 was $16 million, $18 million and $12 million, respectively. The weighted average grant-date fair value per share of restricted share units granted during the years ended December 31, 2024, 2023 and 2022 was $84.59, $61.26, and $56.46, respectively.
Performance-Based Restricted Share Units
Each performance-based restricted share unit represents a contingent right to receive up to a certain number of the Company’s common shares. Awards tied to core adjusted book value per share represent the right to receive up to two shares at the end of a three-year performance period, depending on the growth in core adjusted book value per share over the three-year performance period. Performance-based restricted share units tied to total shareholder return (TSR) relative to the TSR of the 55th percentile of the Russell Midcap Index - Financials (Index) represent the right to receive up to 2.5 shares at the end of a three-year performance period. The shares related to awards tied to core adjusted book value per share are delivered on the vesting date and the shares related to awards tied to relative TSR are generally delivered on the fourth anniversary of the grant date.
Assured Guaranty Ltd.
Notes to Consolidated Financial Statements, Continued
Performance-Based Restricted Share Unit Activity
| | | | | | | | | | | | | | |
| Performance-Based Restricted Share Units | | Number of Performance-Based Share Units | | Weighted Average Grant Date Fair Value Per Share |
| Nonvested at December 31, 2023 | 677,856 | | | $ | 64.62 | |
| Granted (1) | 478,324 | | | 94.56 | |
| Vested (2) | (404,114) | | | 41.91 | |
| Forfeited | — | | | — | |
| Nonvested at December 31, 2024 (3) | 752,066 | | | $ | 72.39 | |
____________________
(1) Includes 118,086 adjusted book value performance-based restricted share units and 177,130 TSR performance-based restricted share units that were granted prior to 2024 at a weighted average grant date fair value of $44.01 and $60.06, respectively, but met performance hurdles and vested during 2024. The weighted average grant date fair value per share excludes these shares.
(2) Excludes 295,216 TSR performance-based restricted share units that vested during 2024 but were not delivered.
(3) Excludes 157,854 performance-based restricted share units that have met performance hurdles and vest in February 2025. Includes 295,216 TSR performance-based restricted share units that vested during 2024 but will be delivered in 2025.
As of December 31, 2024, the total unrecognized compensation cost related to outstanding non-vested performance-based share units was $18 million, which the Company expects to recognize over the weighted average remaining service period of 1.9 years. The total value of performance-based restricted share units vested during the years ended December 31, 2024, 2023 and 2022 was based on grant date fair value and was $17 million, $11 million and $8 million, respectively.
For the 2024, 2023 and 2022 awards, the grant-date fair value of the performance-based restricted share units tied to relative TSR was calculated using a Monte Carlo simulation in order to determine the total return of the Company’s shares relative to the total return of financial companies in the Index. The inputs to the simulation include the beginning share price and historical share price volatility of each company in the Index as well as the historical correlation coefficient between the share price of each company in the Index and the Index itself. In addition, the simulation also uses the risk-free rate and a discount for liquidity. Because the simulation is calculating the total rate of return for each company in the Index, the simulation assumes that all dividends for all companies are reinvested. As a result, all dividends within the simulation are set to zero regardless of any actual (real world) dividends paid by any of the companies in the Index, so actual dividend data are not used as inputs.
The following are significant assumptions used in determining the fair value of the performance-based restricted share units tied to relative TSR.
| | | | | | | | | | | | | | | | | | | | | | | | | | | | | | | | | | | | | | |
| | Years Ended December 31, |
| | 2024 | | 2023 | | 2022 |
| Expected term | | 3.00 years | | 3.00 years | | 2.85 years |
| Expected volatility | | 20.72 | % | – | 87.00% | | 29.22 | % | – | 110.25% | | 27.19 | % | – | 78.96% |
| Dividend yield | | 0.00% | | 0.00% | | 0.00% |
| Risk-free-rates | | 4.38% | | 4.38% | | 1.74% |
| Grant-date fair value per share | | $104.27 | | $80.80 | | $83.97 |
For the 2024, 2023 and 2022 awards, the grant-date fair value of the performance-based restricted share units tied to core adjusted book value was based on the grant date closing price. The weighted average grant-date fair values per share of all performance-based awards in 2024, 2023 and 2022 were $94.56, $71.34 and $62.89, respectively.
Restricted Share Awards
Restricted share awards are valued based on the closing price of the underlying shares at the date of grant. The Company awards restricted share awards to non-executive directors, and vest after one year. The shares are delivered on the vesting date.
Assured Guaranty Ltd.
Notes to Consolidated Financial Statements, Continued
Restricted Share Award Activity
| | | | | | | | | | | | | | |
| Nonvested Shares | | Number of Shares | | Weighted Average Grant Date Fair Value Per Share |
| Nonvested at December 31, 2023 | 38,464 | | | $ | 52.26 | |
| Granted | 21,413 | | | 77.54 | |
| Vested | (38,464) | | | 52.26 | |
| Forfeited | — | | | — | |
| Nonvested at December 31, 2024 | 21,413 | | | $ | 77.54 | |
As of December 31, 2024, the total unrecognized compensation cost related to outstanding non-vested restricted share awards was $0.5 million, which the Company expects to recognize over the weighted average remaining service period of 0.3 years. The total fair value of shares vested during the years ended December 31, 2024, 2023 and 2022 was $2.0 million, $2.2 million and $2.3 million, respectively. The weighted average grant-date fair values per share of shares granted during the years ended December 31, 2024, 2023 and 2022 was $77.54, $52.26 and $59.47, respectively.
Employee Stock Purchase Plan
The Company established the AGL Employee Stock Purchase Plan (ESPP) in accordance with Internal Revenue Code of 1986 (the Code) Section 423, and participation is available to all eligible employees. Maximum annual purchases by participants are limited to the number of whole shares that can be purchased with an amount equal to 10% of the participant's compensation or, if less, shares having a value of $25,000. Participants may purchase shares at a purchase price equal to 85% of the lesser of the fair market value of the stock on the first day or the last day of the subscription period. The Company has reserved for issuance and purchases under the ESPP 1,200,000 AGL common shares. As of December 31, 2024, 334,490 common shares were available for grant under the ESPP. The Company issues new shares to settle share-based awards.
The fair value of each award under the ESPP is estimated using the following assumptions: (i) the expected dividend yield is based on the current expected annual dividend and share price on the grant date; (ii) the expected volatility is estimated at the date of grant based on the historical share price volatility, calculated on a daily basis; (iii) the risk-free rate for periods within the contractual life of the option is based on the U.S. Treasury yield curve in effect at the time of grant; and (iv) the expected life is based on the term of the offering period.
AGL Employee Stock Purchase Plan
| | | | | | | | | | | | | | | | | |
| Year Ended December 31, |
| 2024 | | 2023 | | 2022 |
| (dollars in millions) |
| Proceeds from purchase of shares by employees | $ | 2.2 | | | $ | 2.2 | | | $ | 2.4 | |
| Number of shares issued by the Company | 33,348 | | | 47,204 | | | 53,453 | |
Share-Based Compensation Expense
The following table presents share-based compensation costs and the amount of such costs that are deferred as policy acquisition costs, pre-tax. Amortization of previously deferred share compensation costs is not shown in the table below.
Share-Based Compensation Expense Summary
| | | | | | | | | | | | | | | | | |
| Year Ended December 31, |
| 2024 | | 2023 | | 2022 |
| (in millions) |
| Share‑based compensation expense | $ | 34 | | | $ | 36 | | | $ | 39 | |
| Share‑based compensation capitalized as DAC | 2 | | | 3 | | | 3 | |
| Income tax benefit | 5 | | | 5 | | | 6 | |
Assured Guaranty Ltd.
Notes to Consolidated Financial Statements, Continued
Defined Contribution Plan
The Company maintains a savings incentive plan, which is qualified under Section 401(a) of the Code for U.S. employees. Eligible participants may contribute a percentage of their eligible compensation subject to U.S. Internal Revenue Service (IRS) limitations. The Company’s matching contribution is an amount equal to 100% of each participant’s contributions up to 7% of such participant’s eligible compensation, subject to IRS limitations. Certain eligible participants may also contribute a percentage of eligible compensation over the IRS limitations to a nonqualified supplemental executive retirement plan. The Company's matching contribution in the nonqualified plan is an amount equal to 100% of each participant’s contributions up to 6% of participant’s eligible compensation above the IRS limitations for the qualified plan. The Company also makes core contributions of 7% of the participant’s eligible compensation to the qualified plan, subject to IRS limitations, regardless of whether the employee otherwise contributes to the plan, and a core contribution of 6% of the participant’s eligible compensation above the IRS limitations for the qualified plan to the nonqualified plan for eligible employees. Employees become fully vested in Company contributions to the qualified and nonqualified plans after one year of service, as defined in the plan (or upon reaching age 65 for the nonqualified plan, if earlier). Plan eligibility is immediate upon hire. The Company also maintains similar non-qualified plans for non-U.S. employees. The Company recognized defined contribution expenses of $18 million, $16 million and $20 million for the years ended December 31, 2024, 2023 and 2022, respectively.
Payable to Sound Point and AHP
As of December 31, 2024 and December 31, 2023, the Company had $3 million and $8 million payable for compensation to former employees of AssuredIM in accordance with the Sound Point Transaction and the AHP Transaction, respectively.
13. Income Taxes
AGL is a tax resident in the U.K. although it remains a Bermuda-based company and its administrative and head office functions continue to be carried on in Bermuda.
Under Bermuda law, there was no Bermuda income, corporate or profits tax or withholding tax, capital gains tax or capital transfer tax payable by AGL or the Bermuda Subsidiaries (collectively, AG Re, AGRO and Cedar Personnel Ltd.) in 2024 and 2023. AGL’s U.S., U.K. and French subsidiaries are subject to income taxes imposed by U.S., U.K. and French authorities, respectively, and file applicable tax returns. In addition, AGRO, a Bermuda domiciled company, has elected under Section 953(d) of the IRS to be taxed as a U.S. domestic corporation.
In July of 2023, the U.K. government passed legislation to implement the Organization for Economic Co-Operation and Development’s (OECD) Base Erosion and Profit Shifting (BEPS) Pillar Two income inclusion rule. This includes a multinational top-up tax which will apply to large multinational corporations for accounting periods beginning on or after December 31, 2023. This applies to AGL and its subsidiaries, requiring a minimum effective rate of 15% in all jurisdictions in which they operate.
On December 27, 2023, the Bermuda government enacted a corporate income tax at the rate of 15% which will apply to the Bermuda Subsidiaries for accounting periods starting on or after January 1, 2025. The enactment of the corporate income tax regime required the Company to recognize Bermuda deferred taxes for the first time in the fourth quarter of 2023. An economic transition adjustment (ETA) equal to the difference between the fair market value and the carrying value of assets and liabilities of each of the Company’s Bermuda insurance subsidiaries as of September 30, 2023 resulted in the establishment of a deferred tax asset and corresponding benefit of $189 million reported in the fourth quarter of 2023 consolidated statement of operations. The ETA is expected to be utilized over 10 to 15 years, beginning in 2025.
AGUS files a consolidated federal income tax return with all of its U.S. subsidiaries. Assured Guaranty Overseas US Holdings Inc. and its subsidiaries, AGRO and AG Intermediary Inc., file their own consolidated federal income tax return.
Accounting Policy
The provision for income taxes consists of an amount for taxes currently payable and an amount for deferred taxes. Deferred income taxes are provided for temporary differences between the financial statement carrying amounts and tax bases of assets and liabilities, using enacted rates in effect for the year in which the differences are expected to reverse.
Assured Guaranty Ltd.
Notes to Consolidated Financial Statements, Continued
The Company recognizes tax benefits only if a tax position is “more likely than not” to prevail.
The Company elected to account for tax associated with Global Intangible Low-Taxed Income (GILTI) as a current-period expense when incurred.
Deferred and current tax assets and liabilities are reported in “other assets” or ”other liabilities” on the consolidated balance sheets.
Tax Assets (Liabilities)
Deferred and Current Tax Assets (Liabilities)
| | | | | | | | | | | |
| As of December 31, |
| 2024 | | 2023 |
| (in millions) |
| Deferred tax assets (liabilities) | $ | 262 | | | $ | 250 | |
| Current tax assets | 10 | | | — | |
| Current tax liabilities | (13) | | | (9) | |
Components of Net Deferred Tax Assets (Liabilities)
| | | | | | | | | | | |
| As of December 31, |
| 2024 | | 2023 |
| (in millions) |
| Deferred tax assets: | | | |
| | | |
| Net unrealized investment losses | $ | 54 | | | $ | 49 | |
| Intangible assets | 149 | | | 149 | |
| Value of in-force business | 45 | | | 45 | |
| | | |
| | | |
| Net operating loss | 31 | | | 30 | |
| Depreciation | 47 | | | 45 | |
| Deferred compensation | 38 | | | 32 | |
| | | |
| FG VIEs | 49 | | | — | |
| Other | 25 | | | 32 | |
| Total deferred tax assets | 438 | | | 382 | |
| | | |
| Deferred tax liabilities: | | | |
| Investments | 127 | | | 65 | |
| | | |
| | | |
| | | |
| Other | 49 | | | 67 | |
| Total deferred tax liabilities | 176 | | | 132 | |
| | | |
| Net deferred tax assets (liabilities) | $ | 262 | | | $ | 250 | |
As part of the acquisition of CIFG Holding Inc. (CIFGH, and together with its subsidiaries, CIFG), the Company acquired $189 million of net operating losses (NOL). The NOL has been limited under the Code Section 382 due to a change in control as a result of the acquisition. As of December 31, 2024, AG, a U.S. subsidiary, had gross deferred tax assets of approximately $21 million for federal NOL carryforwards which will begin to expire in 2033. In addition, as of December 31, 2024, the Company had gross deferred tax assets for certain non-U.S. NOL carryforwards of approximately $10 million which do not expire.
Valuation Allowance
During 2022, the Company recorded a return to provision adjustment, which included the utilization of $19 million in foreign tax credits (FTC), thereby reducing the Company’s FTC from $24 million as of December 31, 2021 to $5 million as of December 31, 2022. FTC were established under the 2017 Tax Cuts and Jobs Act (TCJA) for use against regular tax in future years, and would expire in 2027. In analyzing the future realizability of FTC, the Company notes limitations on future foreign source income due to overall foreign losses as negative evidence. As of December 31, 2022, the Company came to the
Assured Guaranty Ltd.
Notes to Consolidated Financial Statements, Continued
conclusion that, after reviewing positive and negative evidence, it is more likely than not that the FTC would not be utilized, and therefore, maintained a valuation allowance of $5 million with respect to this tax attribute.
During 2023, the Company recorded a return to provision adjustment, which included the utilization of $3 million in FTC, thereby reducing the Company’s FTC to $2 million. As of December 31, 2023, the Company believed that the weight of the positive evidence outweighed the negative evidence regarding the realization of the Company’s FTC, resulting in the release of the corresponding $2 million valuation allowance and bringing it to zero.
The Company came to the conclusion that it is more likely than not that the deferred tax assets will be fully realized after weighing all positive and negative evidence available as required under GAAP. The positive evidence that was considered included the cumulative income the Company has earned over the last three years, and the significant unearned premium income to be included in taxable income. The positive evidence outweighs any negative evidence that exists. As such, the Company believes that no valuation allowance is necessary in connection with the remaining deferred tax assets. The Company will continue to analyze the need for a valuation allowance on a quarterly basis.
Changes in market conditions since 2022, including rising interest rates, resulted in the recording of deferred tax assets related to net unrealized tax capital losses that remained as of December 31, 2024 and December 31, 2023. When assessing recoverability of these deferred tax assets, the Company considers the ability and intent to hold the underlying securities to recovery in value, if necessary, as well as other factors as noted above. As of December 31, 2024, based on all available evidence, including capital loss carryback capacity, the Company concluded that the deferred tax assets related to the unrealized tax capital losses on the available-for-sale securities portfolios are, more likely than not, expected to be realized.
Provision for Income Taxes
The components of the provision (benefit) for income taxes were as follows:
Current and Deferred Provision (Benefit) for Income Taxes
| | | | | | | | | | | | | | | | | |
| Year Ended December 31, |
| 2024 | | 2023 | | 2022 |
| (in millions) |
| Current provision (benefit) for income taxes: | | | | | |
| Federal | $ | 70 | | | $ | 76 | | | $ | (1) | |
| State and local | 17 | | | (13) | | | 15 | |
| Foreign | 13 | | | — | | | — | |
| Total current | 100 | | | 63 | | | 14 | |
| Deferred provision (benefit) for income taxes: | | | | | |
| Federal | 3 | | | 31 | | | 12 | |
| | | | | |
| Foreign | (7) | | | (187) | | | (15) | |
| Total deferred | (4) | | | (156) | | | (3) | |
| Total provision (benefit) for income taxes | $ | 96 | | | $ | (93) | | | $ | 11 | |
The Company’s overall effective tax rate fluctuates based on the distribution of income across jurisdictions. The effective tax rates reflect the proportion of income recognized by each of the Company’s operating subsidiaries, with:
•U.S. subsidiaries taxed at the U.S. marginal corporate income tax rate of 21%;
•French subsidiary taxed at the French marginal corporate tax rate of 25%;
•Bermuda Subsidiaries taxed at the Bermuda marginal corporate tax rate of 0%, unless subject to U.S. tax by election; and
•U.K. subsidiaries taxed at the U.K. marginal corporate tax rate of 25% for periods starting April 1, 2023 and 19% for periods ending on or before March 31, 2023. Effective January 1, 2024, the U.K. adopted a global minimum tax rate of 15% under the OECD’s BEPS Pillar Two rules.
Controlled foreign corporations (CFCs) apply the local marginal corporate tax rate. In addition, the TCJA created a new requirement that a portion of the GILTI earned by CFCs must be included currently in the gross income of the CFCs’ U.S. shareholder.
Assured Guaranty Ltd.
Notes to Consolidated Financial Statements, Continued
A reconciliation of the difference between the provision for income taxes and the expected tax provision at statutory rates in taxable jurisdictions is presented below.
Effective Tax Rate Reconciliation
| | | | | | | | | | | | | | | | | |
| | Year Ended December 31, |
| | 2024 | | 2023 | | 2022 |
| | (in millions) |
| Expected tax provision (benefit) | $ | 82 | | | $ | 122 | | | $ | 23 | |
| Tax-exempt interest | (10) | | | (15) | | | (14) | |
| Return to provision adjustment | (1) | | | (6) | | | (20) | |
| Noncontrolling interest | (3) | | | (5) | | | (3) | |
| State taxes, net of federal benefit | 13 | | | (10) | | | 12 | |
| | | | | |
| Foreign taxes | 5 | | | 11 | | | 6 | |
| Stock based compensation | 1 | | | 2 | | | 5 | |
| Bermuda ETA | (1) | | | (189) | | | — | |
| Global minimum tax | 13 | | | — | | | — | |
| Other | (3) | | | (3) | | | 2 | |
| Total provision (benefit) for income taxes | $ | 96 | | | $ | (93) | | | $ | 11 | |
| | | | | |
| Effective tax rate | 19.7 | % | | (13.9) | % | | 7.2 | % |
The expected tax provision (benefit) is calculated as the sum of pre-tax income in each jurisdiction multiplied by the statutory tax rate of the jurisdiction by which it will be taxed. Where there is a pre-tax loss in one jurisdiction and pre-tax income in another, the total combined expected tax rate may be higher or lower than any of the individual statutory rates.
The following tables present pre-tax income and revenue by jurisdiction.
Pre-tax Income (Loss) by Tax Jurisdiction
| | | | | | | | | | | | | | | | | |
| | Year Ended December 31, |
| | 2024 | | 2023 | | 2022 |
| | (in millions) |
| U.S. | $ | 445 | | | $ | 622 | | | $ | 189 | |
| Bermuda | 90 | | | 79 | | | 44 | |
| U.K. | (33) | | | (25) | | | (69) | |
| France | (14) | | | (8) | | | (16) | |
| Total | $ | 488 | | | $ | 668 | | | $ | 148 | |
Revenue by Tax Jurisdiction
| | | | | | | | | | | | | | | | | |
| | Year Ended December 31, |
| | 2024 | | 2023 | | 2022 |
| | (in millions) |
| U.S. | $ | 720 | | | $ | 1,169 | | | $ | 661 | |
| Bermuda | 130 | | | 165 | | | 84 | |
| U.K. | 23 | | | 37 | | | (15) | |
| France | (1) | | | 2 | | | (8) | |
| Other | — | | | — | | | 1 | |
| Total | $ | 872 | | | $ | 1,373 | | | $ | 723 | |
Pre-tax income by jurisdiction may be disproportionate to revenue by jurisdiction to the extent that insurance losses incurred are disproportionate.
Assured Guaranty Ltd.
Notes to Consolidated Financial Statements, Continued
Audits
As of December 31, 2024, AGUS had open tax years with the U.S. IRS for 2018 forward and is currently under audit for the 2018 and 2019 tax years. As of December 31, 2024, Assured Guaranty Overseas US Holdings Inc. had open tax years with the IRS for 2021 forward and is not currently under audit with the IRS. In September 2022, His Majesty’s Revenue & Customs (HMRC) completed a business risk review of Assured Guaranty that commenced in July 2022 and assigned a low-risk rating for corporate taxes in the U.K. In December 2023, HMRC issued an inquiry into the Company’s 2021 U.K. tax returns. As of December 31, 2024, the Company’s U.K. subsidiaries had open tax years with HMRC for 2021 forward. The Company’s French subsidiary is not currently under examination and has open tax years of 2020 forward.
Uncertain Tax Positions
During the years ended December 31, 2024, 2023, and 2022, there were no unrecognized tax benefits. There were no accruals for the payment of interest and penalties related to income taxes as of each of December 31, 2024, 2023, and 2022.
14. Insurance Company Regulatory Requirements
The following table summarizes the policyholder’s surplus and net income amounts reported to local regulatory bodies in the U.S. and Bermuda for insurance subsidiaries within the group. The discussion that follows describes the basis of accounting and differences to GAAP.
Insurance Regulatory Amounts Reported
U.S. and Bermuda
| | | | | | | | | | | | | | | | | | | | | | | | | | | | | |
| Policyholders’ Surplus | | Net Income (Loss) |
| As of December 31, | | Year Ended December 31, |
| 2024 | | 2023 | | 2024 | | 2023 | | 2022 |
| (in millions) |
| AG (U.S. domiciled) (1)(2) | $ | 3,524 | | | $ | 3,997 | | | $ | 355 | | | $ | 289 | | | $ | 225 | |
| Bermuda statutory companies: | | | | | | | | | |
| AG Re | 1,087 | | | 905 | | | 98 | | | 95 | | | 53 | |
| AGRO | 452 | | | 412 | | | 22 | | | 16 | | | 9 | |
____________________
(1) Effective August 1, 2024, AGM merged with and into AG, with AG as the surviving company. Furthermore, in accordance with the National Association of Insurance Commissioners (NAIC) Annual Statement instructions, the prior year numbers have been restated to reflect the merger of AGM with and into AG.
(2) Policyholders’ surplus is net of contingency reserves of $1,392 million and $1,296 million as of December 31, 2024 and December 31, 2023, respectively.
Basis of Regulatory Financial Reporting
United States
AG’s ability to pay dividends depends, among other things, upon its financial condition, results of operations, cash requirements, compliance with rating agency requirements, and is also subject to restrictions contained in the insurance laws and related regulations of its state of domicile and other states. Financial statements prepared in accordance with accounting practices prescribed or permitted by local insurance regulatory authorities differ in certain respects from GAAP.
AG prepares statutory financial statements in accordance with accounting practices prescribed or permitted by the NAIC and its respective insurance department. Prescribed statutory accounting practices (SAP) are set forth in the NAIC Accounting Practices and Procedures Manual. AG has no permitted accounting practices on a statutory basis.
GAAP differs in certain significant respects from AG’s SAP prescribed or permitted by insurance regulatory authorities. The principal differences result from the SAP listed below.
•Upfront premiums are earned upon expiration of risk and installment premiums are earned on a pro-rata basis over the installment period, rather than in proportion to the amount of insurance protection provided under GAAP. The timing of premium accelerations may also differ between SAP and GAAP. Under GAAP, premiums are
Assured Guaranty Ltd.
Notes to Consolidated Financial Statements, Continued
accelerated only upon the legal defeasance of an insured obligation, whereas statutory premiums may be accelerated earlier if an insured obligation is economically defeased prior to legal defeasance.
•Acquisition costs are charged to expense as incurred rather than expensed over the period that the related premiums are earned under GAAP. Ceding commission income is earned immediately except for amounts in excess of acquisition costs, which are deferred, rather than fully deferred under GAAP.
•A contingency reserve is established according to applicable insurance laws, whereas no such reserve is required under GAAP.
•Certain assets designated as “non-admitted assets” are charged directly to statutory surplus, rather than reflected as assets under GAAP.
•Investments in subsidiaries are carried on the balance sheet on the equity basis, to the extent admissible, rather than consolidated with the parent under GAAP.
•The amount of admitted deferred tax assets are subject to an adjusted surplus threshold and subject to a limitation calculated in accordance with SAP. Under GAAP, there is no non-admitted asset determination, rather a valuation allowance is recorded to reduce the deferred tax asset to an amount that is more likely than not to be realized.
•Insured credit derivatives are accounted for as insurance contracts rather than accounted for as derivative contracts that are measured at fair value under GAAP.
•Bonds are reported at either amortized cost or the lower of amortized cost or fair value, rather than classified as available-for-sale or trading securities and carried at fair value under GAAP.
•The impairment model for fixed-maturity securities classified as available-for-sale under GAAP differs from the statutory impairment model. Under SAP, fixed-maturity securities that have been determined to be other-than-temporarily impaired are written down to fair value or the present value of cash flows. Under GAAP, an allowance for credit losses is established, and can be reversed for subsequent increases in expected cash flows.
•Insured obligations of VIEs, where the Company is deemed the primary beneficiary, are accounted for as insurance contracts. Under GAAP, such VIEs are consolidated and any transactions with the Company are eliminated.
•Acquisitions are accounted for as either statutory purchases or statutory mergers, rather than under the purchase method under GAAP.
•Losses are discounted at pre-tax book yields and recorded when there is a significant credit deterioration on specific insured obligations and the obligations are in default or a default is probable. Under GAAP, expected losses are discounted at the risk-free rate at the end of each reporting period and are recorded only to the extent they exceed deferred premium revenue.
•The present value of contractual or expected installment premiums and commissions are not recorded on the balance sheet as they are under GAAP.
•The put options in CCS are not accounted for as derivatives as they are under GAAP.
•Non-U.S. dollar denominated unearned premiums reserve is remeasured at current exchange rates rather than carried at historical rates under GAAP.
Bermuda
AG Re, a Bermuda regulated Class 3B insurer, and AGRO, a Bermuda regulated Class 3A and Class C insurer, prepare their statutory financial statements in conformity with the accounting principles set forth in the Insurance Act 1978, amendments thereto and related regulations. As of December 31, 2016, the Bermuda Monetary Authority (the Authority) requires insurers to prepare statutory financial statements in accordance with the particular accounting principles adopted by the insurer (which, in the case of AG Re and AGRO, are GAAP), subject to certain adjustments. The adjustments relate to certain assets designated as “non-admitted assets” which are charged directly to statutory surplus rather than reflected as assets as they are under GAAP.
United Kingdom
AGUK prepares its Solvency and Financial Condition Report based on Solvency UK Regulations. As of December 31, 2024, AGUK’s eligible own funds were an estimated £439 million (or $549 million). As of December 31, 2023, AGUK’s own funds were an estimated £528 million (or $672 million).
France
AGE prepares its Solvency and Financial Condition Report and other required regulatory financial reports based on Autorité de Contrôle Prudentiel et de Résolution (ACPR) regulations and Solvency II. As of December 31, 2024, AGE’s own
Assured Guaranty Ltd.
Notes to Consolidated Financial Statements, Continued
funds were an estimated €35 million (or $36 million). As of December 31, 2023, AGE’s own funds were an estimated €44 million (or $49 million).
Dividend Restrictions and Capital Requirements
United States
Under Maryland’s insurance law, AG may, with prior notice to the Commissioner of its domiciliary regulator, the MIA, pay an ordinary dividend in an amount that, together with all dividends and distributions paid in the prior 12 months, does not exceed the lesser of 10% of its policyholders’ surplus (as of the prior December 31) or 100% of its adjusted net investment income during that period. “Adjusted net investment income” means the sum of (x) AG’s net investment income during the 12-month period ending December 31 of the preceding year (excluding realized capital gains and pro rata distributions of its own securities), and (y) AG’s net investment income (excluding realized capital gains) from the three calendar years prior to the preceding calendar year that has not already been paid out as dividends. The maximum amount available during 2025 for AG to distribute as ordinary dividends is approximately $287 million. Such payments would be payable in the second half of 2025 because AG’s ordinary dividends were concentrated in the second half of 2024 following the August 1, 2024 merger of AGM with and into AG. However, in order to enable AG to make payments over the course of the year, AG has put in place for 2025 a quarterly process with the MIA, pursuant to which AG will confirm that the MIA does not object to AG dividending $71.8 million (i.e., 25%) of the $287 million amount in each calendar quarter of 2025. Pursuant to this process, AG obtained the MIA’s non-objection to pay, and expects to pay, a $71.8 million dividend on March 7, 2025.
Bermuda
For AG Re, any distribution (including repurchase of shares) of any share capital, contributed surplus or other statutory capital that would reduce its total statutory capital by 15% or more of its total statutory capital as set out in its previous year's financial statements requires the prior approval of the Authority. Separately, dividends are paid out of an insurer’s statutory surplus and cannot exceed that surplus. Furthermore, annual dividends cannot exceed 25% of total statutory capital and surplus as set out in its previous year’s financial statements, which is $272 million, without AG Re certifying to the Authority that it will continue to meet required margins. Based on the foregoing limitations, in 2025 AG Re has the capacity to: (i) make capital distributions in an aggregate amount up to $129 million without the prior approval of the Authority; and (ii) declare and pay dividends in an aggregate amount up to approximately $272 million as of December 31, 2024. Such dividend capacity is further limited by: (i) the actual amount of AG Re’s unencumbered assets, which amount changes from time to time due in part to collateral posting requirements and which was approximately $192 million as of December 31, 2024; and (ii) the amount of statutory surplus, which as of December 31, 2024 was $229 million.
For AGRO, a subsidiary of AG Re, annual dividends cannot exceed $113 million, without AGRO certifying to the Authority that it will continue to meet required margins. Based on the foregoing limitations, in 2025 AGRO has the capacity to: (i) make capital distributions in an aggregate amount up to $21 million without the prior approval of the Authority; and (ii) declare and pay dividends in an aggregate amount up to approximately $113 million as of December 31, 2024. Such dividend capacity is further limited by: (i) the actual amount of AGRO’s unencumbered assets, which amount changes from time to time due in part to collateral posting requirements and which was approximately $397 million as of December 31, 2024; and (ii) the amount of statutory surplus, which as of December 31, 2024 was $315 million.
United Kingdom
U.K. company law prohibits AGUK from declaring a dividend to its shareholders unless it has “profits available for distribution.” The determination of whether a company has profits available for distribution is based on its accumulated realized profits less its accumulated realized losses. While the U.K. insurance regulatory laws impose no statutory restrictions on a general insurer’s ability to declare a dividend, the Prudential Regulation Authority’s capital requirements may in practice act as a restriction on dividends for AGUK. In 2024 and 2023, AGUK made cash distributions and plans to make further distributions of excess capital in the future.
France
French company law prohibits AGE from declaring a dividend to its shareholders unless it has “profits and/or reserves available for distribution.” The determination of whether a company has profits available for distribution is based on its accumulated realized profits less its accumulated realized losses. While French law imposes no statutory restrictions on an
Assured Guaranty Ltd.
Notes to Consolidated Financial Statements, Continued
insurer’s ability to declare a dividend, the ACPR’s capital requirements may, in practice, act as a restriction on dividends for AGE.
Dividend Restrictions and Capital Requirements
Distributions from Insurance Subsidiaries
| | | | | | | | | | | | | | | | | |
| Year Ended December 31, |
| 2024 | | 2023 | | 2022 |
| (in millions) |
| Dividends paid by AG Re to AGL | $ | 97 | | | $ | 53 | | | $ | — | |
| Distributions from AGUK to its parent | 128 | | | 127 | | | — | |
| Dividends paid by AG to U.S. Holding Companies (1) | 400 | | | 358 | | | 473 | |
| Stock redemptions by insurance subsidiaries | 400 | | | 200 | | | — | |
___________________
(1) Effective as of August 1, 2024, AGM merged with and into AG, with AG as the surviving company. Prior to the merger, AG had been directly owned by AGUS. As a result of the merger, AG is directly owned by AGMH, a subsidiary of AGUS.
15. Related Party Transactions
Accounting Policy
The Company follows ASC 850, “Related Party Transactions,” for the identification and disclosure of related party transactions. Pursuant to ASC 850, related parties include: (i) the Company’s affiliates; (ii) entities for which investments in their equity securities would be required, absent the election of the FVO, to be accounted for by the equity method; (iii) trusts for the benefit of employees, such as pension and profit sharing trusts that are managed by or under the trusteeship of the Company’s management; (iv) the Company’s principal owners; (v) the Company’s management; (vi) other parties with which the Company may deal if one party controls or can significantly influence the management or operating policies of the other to an extent that one of the transacting parties might be prevented from fully pursuing its own separate interests; and (vii) other parties that can significantly influence the management or operating policies of the transacting parties or that have an ownership interest in one of the transacting parties and can significantly influence the other to an extent that one or more of the transacting parties might be prevented from fully pursuing its own separate interests.
Related party amounts and transactions disclosed in this note include transactions with “Related Persons” as defined in Item 404 of SEC’s Regulation S-K as well as “related parties” as defined in ASC 850.
Related Party Transactions
As of December 31, 2024 and December 31, 2023, each of Wellington Management Company, LLP (together with its affiliates, Wellington) and BlackRock Financial Management Inc. (together with its affiliates, BlackRock) directly or indirectly owned more than 5% of the Company’s common shares. Both Wellington and BlackRock are Related Persons. Wellington is one of the Company’s investment managers, and BlackRock was also one of the Company’s investment managers until September 2020. BlackRock also provides investment reporting software to the Company.
The investment management fees and reporting software expense incurred from transactions with Wellington and BlackRock were approximately $1.8 million in 2024, $1.9 million in 2023 and $2.0 million in 2022. The Company reported payables to Wellington and BlackRock in connection with these fees and transactions of less than $1 million as of both December 31, 2024 and December 31, 2023.
Throughout the notes to these consolidated financial statements, the Company describes several affiliated balances and transactions.
In Note 1, Business and Basis of Presentation, and Note 7, Investments and Cash, the Company includes a discussion of, and amounts related to, its various equity method investments, including an equity method ownership interest in Sound Point and several Sound Point managed funds. Certain of the Sound Point (and prior to July 1, 2023, AssuredIM) managed funds in which the Company invests are reported as CIVs as described in Note 8, Financial Guaranty Variable Interest Entities and Consolidated Investment Vehicles.
Assured Guaranty Ltd.
Notes to Consolidated Financial Statements, Continued
Prior to the Sound Point Transaction and AHP Transaction, the Company owned and consolidated AssuredIM and earned management and performance fees for its investment advisory and management services in respect of AssuredIM Funds. Amounts earned in respect of such services are presented in Note 10, Asset Management Fees, along with the related receivables and payables.
Amounts contributed to employee retirement and savings plans, and amounts payable to Sound Point and AHP, are disclosed in Note 12, Employee Benefit Plans.
16. Leases
The Company is party to various non-cancelable lease agreements, all of which are operating leases as of December 31, 2024. The majority of the Company’s leases relate to office space dedicated to the Company’s operations in various locations (primarily Hamilton, Bermuda, New York City, London, and Paris) with expiration dates ranging from 2025 to 2032. The Company subleases certain properties that are not used in its operations.
Accounting Policy
The Company determines if an arrangement is a lease at inception. For operating leases with an original term of more than 12 months, where the Company is the lessee, it recognizes a right-of-use (ROU) asset in “other assets” and a lease liability in “other liabilities” on the consolidated balance sheets. An ROU asset represents the Company’s right to use an underlying asset for the lease term, and a lease liability represents the Company’s obligation to make lease payments arising from the lease. At the inception of a lease, the total fixed payments under a lease agreement are discounted utilizing an incremental borrowing rate that represents the Company’s collateralized borrowing rate. The rate is determined based on the lease term as of the lease commencement date. Some of the Company’s leases include renewal options, which are not included in the lease terms unless the Company is reasonably certain it will exercise the option.
The Company elected the practical expedient to account for all lease components and their associated non-lease components (i.e., common area maintenance, real estate taxes, building insurance, etc.) as a single lease component and include all fixed payments in the measurement of ROU assets and lease liabilities. Operating lease expense is recognized on a straight-line basis over the lease term. Costs related to variable lease and non-lease components for the Company’s leases are expensed in the period incurred. Sublease income is earned on a straight-line basis over the term of the lease.
The Company assesses ROU assets for impairment when certain events occur or when there are changes in circumstances including potential alternative uses. If circumstances require an ROU asset to be tested for possible impairment and the carrying value of the ROU asset is not recoverable on an undiscounted cash flow basis, an impairment is recognized to the extent that the carrying value exceeds its fair value. Any impairment is reported in “other operating expenses” in the consolidated statement of operations.
Assured Guaranty Ltd.
Notes to Consolidated Financial Statements, Continued
Lease Assets and Liabilities
ROU Assets and Lease Liabilities
| | | | | | | | | | | |
| As of December 31, |
| | 2024 | | 2023 |
| | (dollars in millions) |
| ROU assets | $ | 60 | | $ | 71 |
| Lease liabilities | $ | 84 | | $ | 97 |
| Weighted average discount rate | 2.65% | | 2.60% |
| Weighted average remaining lease term (in years) | 7.1 | | 7.8 |
Lease Expense and Other Information
| | | | | | | | | | | | | | | | | | | | |
| | Year Ended December 31, |
| | 2024 | | 2023 | | 2022 |
| | (in millions) |
| Operating lease costs (1) | | $ | 14 | | | $ | 20 | | | $ | 16 | |
| Variable and short-term lease costs | | 2 | | | 2 | | | 3 | |
| Sublease income | | (3) | | | (7) | | | (7) | |
| Total lease costs | | $ | 13 | | | $ | 15 | | | $ | 12 | |
| Cash paid for amounts included in the measurement of lease liabilities | | | | | | |
| Operating cash outflows for operating leases | | $ | 16 | | | $ | 24 | | | $ | 23 | |
____________________
(1) Includes an ROU asset impairment of $2 million in 2024 and $3 million in 2023.
Future Minimum Rental Payments
Operating Leases
| | | | | | | | |
| | As of December 31, 2024 |
| Year | | (in millions) |
| 2025 | | $ | 13 | |
| 2026 | | 13 | |
| 2027 | | 12 | |
| 2028 | | 12 | |
| 2029 | | 13 | |
| Thereafter | | 29 | |
| Total lease payments | | 92 | |
| Less: Imputed interest | | 8 | |
| Total lease liabilities | | $ | 84 | |
17. Contingencies
Legal Proceedings
Lawsuits arise in the ordinary course of the Company’s business. It is the opinion of the Company’s management, based upon the information available, that the expected outcome of litigation against the Company, individually or in the aggregate, will not have a material adverse effect on the Company’s financial position, although an adverse resolution of litigation against the Company in a fiscal quarter or year could have a material adverse effect on the Company’s results of operations or liquidity in that particular quarter or year.
In addition, in the ordinary course of their respective businesses, certain of AGL’s insurance subsidiaries are involved in litigation with third parties to recover insurance losses paid in prior periods or prevent or reduce losses in the future. For example, the Company is involved in a number of legal actions in the Federal District Court of Puerto Rico to enforce or defend its rights with respect to the obligations it insures of Puerto Rico and its related PREPA. There remains one active proceeding related to PREPA, while there are a number of unresolved proceedings related to PREPA that remain stayed pending the
Assured Guaranty Ltd.
Notes to Consolidated Financial Statements, Continued
Federal District Court of Puerto Rico’s determination on the FOMB PREPA Plan. See Note 4, Expected Loss to be Paid (Recovered), Loss Estimation Process, Public Finance, Puerto Rico, for a description of such actions. The impact, if any, of these and other proceedings on the amount of recoveries the Company receives and losses it pays in the future is uncertain, and the impact of any one or more of these proceedings during any quarter or year could be material to the Company’s results of operations in that particular quarter or year.
The Company also receives subpoenas and interrogatories from regulators from time to time.
Accounting Policy
The Company establishes accruals for litigation and regulatory matters to the extent it is probable that a loss has been incurred and the amount of that loss can be reasonably estimated. Additionally, it discloses such amounts if material to the financial position of the Company. For litigation and regulatory matters where a loss may be reasonably possible but not probable, or is probable but not reasonably estimable, no accrual is established, but the matter would be disclosed below if material. The Company reviews relevant information with respect to its litigation and regulatory matters on a quarterly basis and updates its accruals, disclosures, and estimates of reasonably possible loss based on such reviews.
Litigation
On November 28, 2011, Lehman Brothers International (Europe) (in administration) (LBIE) sued AG Financial Products Inc. (AGFP), an affiliate of AG, which, in the past, had provided credit protection to counterparties under CDS. Following defaults by LBIE under transaction documents governing CDS between LBIE and AGFP, AGFP terminated the CDS in compliance with the transaction documents and properly calculated that LBIE owed AGFP approximately $25 million in connection with the termination, whereas LBIE asserted in its complaint filed in the Supreme Court of the State of New York (the Court) that AGFP owed LBIE a termination payment of approximately $1.4 billion. Following a bench trial, on March 8, 2023, the Court rendered its decision and found in favor of AGFP. Accordingly, in the first quarter of 2023, the Company reduced its previously recorded accrual of $20 million to zero, in connection with developments in litigation. Following the exhaustion of LBIE’s appeals, the Company will recognize a gain in the first quarter of 2025 of approximately $103 million, which represents the full satisfaction of the judgment it was awarded and its claims for attorneys’ fees, expenses and interest in connection with this litigation.
18. Shareholders’ Equity
Accounting Policy
The Company records share repurchases as a reduction to “common shares” and “additional paid-in capital.” Once additional paid-in capital has been exhausted, share repurchases are recorded as a reduction to common shares and retained earnings. Any excise taxes incurred related to share repurchases are charged to additional paid-in-capital or retained earnings, as appropriate.
Share Issuances
AGL has authorized share capital of $5 million divided into 500,000,000 shares with a par value $0.01 per share. Except as described below, AGL’s common shares have no preemptive rights or other rights to subscribe for additional common shares, no rights of redemption, conversion or exchange and no sinking fund rights. In the event of liquidation, dissolution or winding-up, the holders of AGL’s common shares are entitled to share equally, in proportion to the number of common shares held by such holder, in AGL’s assets, if any remain after the payment of all AGL’s debts and liabilities and the liquidation preference of any outstanding preferred shares. Under certain circumstances, AGL has the right to purchase all or a portion of the shares held by a shareholder at fair market value. All of the common shares are fully paid and non-assessable. Holders of AGL’s common shares are entitled to receive dividends as lawfully may be declared from time to time by the Board.
In general, and except as provided below, shareholders have one vote for each common share held by them and are entitled to vote with respect to their fully paid shares at all meetings of shareholders. However, if, and so long as, the common shares (and other of AGL’s shares) of a shareholder are treated as “controlled shares” (as determined pursuant to section 958 of the Code) of any U.S. Person and such controlled shares constitute 9.5% or more of the votes conferred by AGL’s issued and outstanding shares, the voting rights with respect to the controlled shares owned by such U.S. Person shall be limited, in the aggregate, to a voting power of less than 9.5% of the voting power of all issued and outstanding shares, under a formula specified in AGL’s Bye-Laws. The formula is applied repeatedly until there is no U.S. Person whose controlled shares
Assured Guaranty Ltd.
Notes to Consolidated Financial Statements, Continued
constitute 9.5% or more of the voting power of all issued and outstanding shares and who generally would be required to recognize income with respect to AGL under the Code if AGL were a CFC as defined in the Code and if the ownership threshold under the Code were 9.5% (as defined in AGL’s Bye-Laws as a 9.5% U.S. Shareholder).
Subject to AGL’s Bye-Laws and Bermuda law, AGL’s Board has the power to issue any of AGL’s unissued shares as it determines, including the issuance of any shares or class of shares with preferred, deferred or other special rights.
Under AGL’s Bye-Laws and subject to Bermuda law, if AGL’s Board determines that any ownership of AGL's shares may result in adverse tax, legal or regulatory consequences to the Company, any of the Company’s subsidiaries or any of AGL’s shareholders or indirect holders of shares or its affiliates (other than such as AGL’s Board considers de minimis), the Company has the option, but not the obligation, to require such shareholder to sell to AGL, or to a third party to whom AGL assigns the repurchase right, the minimum number of common shares necessary to avoid or cure any such adverse consequences at a price determined in the discretion of the Board to represent the shares’ fair market value (as defined in AGL’s Bye-Laws). In addition, AGL’s Board may determine that shares held carry different voting rights when it deems it appropriate to do so to: (i) avoid the existence of any 9.5% U.S. Shareholder; and (ii) avoid adverse tax, legal or regulatory consequences to AGL or any of its subsidiaries or any direct or indirect holder of shares or its affiliates. “Controlled shares” includes, among other things, all shares of AGL that such U.S. Person is deemed to own directly, indirectly or constructively (within the meaning of Section 958 of the Code). Further, these provisions do not apply in the event one shareholder owns greater than 75% of the voting power of all issued and outstanding shares.
Under these provisions, certain shareholders may have their voting rights limited to less than one vote per share, while other shareholders may have voting rights in excess of one vote per share. Moreover, these provisions could have the effect of reducing the votes of certain shareholders who would not otherwise be subject to the 9.5% limitation by virtue of their direct share ownership. AGL’s Bye-Laws provide that it will use its best efforts to notify shareholders of their voting interests prior to any vote to be taken by them.
Share Repurchases
On May 2, 2024, and November 8, 2024 AGL’s Board authorized the repurchase of an additional $300 million and $250 million, respectively, of the Company’s common shares. As of February 27, 2025, the remaining amount the Company was authorized to purchase was approximately $276 million of its common shares. The Company expects to repurchase shares from time to time in the open market or in privately negotiated transactions. The timing, form and amount of the share repurchases under the program are at the discretion of management and will depend on a variety of factors, including funds available at the parent company, other potential uses for such funds, market conditions, the Company’s capital position, legal requirements and other factors. The repurchase program may be modified, extended or terminated by the Board at any time. It does not have an expiration date.
Share Repurchases
| | | | | | | | | | | | | | | | | | | | |
| Year | | Number of Shares Repurchased | | Total Payments(1)
(in millions) | | Average Price Paid Per Share |
| 2022 | | 8,847,981 | | | $ | 503 | | | $ | 56.79 | |
| 2023 | | 3,215,893 | | | 199 | | | 61.95 | |
| 2024 | | 6,180,774 | | | 502 | | | 81.28 | |
| 2025 (through February 27, 2025 on a settlement date basis) | | 829,461 | | | 76 | | | 91.53 | |
____________________
(1) Excludes commissions and excise taxes.
Deferred Compensation
Certain executives of the Company elected to invest a portion of their AG US Group Services Inc. supplemental executive retirement plan (AGS SERP) accounts in the employer stock fund in the AGS SERP. Each unit in the employer stock fund represents the right to receive one AGL common share upon a distribution from the AGS SERP. Each unit equals the number of AGL common shares which could have been purchased with the value of the account deemed invested in the employer stock fund as of the date of such election. As of December 31, 2024 and 2023, there were 68,535 units and 74,309 units, respectively, in the AGS SERP.
Assured Guaranty Ltd.
Notes to Consolidated Financial Statements, Continued
Dividends
Any determination to pay dividends is at the discretion of the Board, and depends upon the Company’s results of operations, cash flows from operating activities, its financial position, capital requirements, general business conditions, legal, tax, regulatory, rating agency and contractual restrictions on the payment of dividends, other potential uses for such funds and any other factors the Board deems relevant. For more information concerning regulatory constraints that affect the Company’s ability to pay dividends, see Note 14, Insurance Company Regulatory Requirements.
On February 19, 2025, the Company declared a quarterly dividend of $0.34 per common share compared with $0.31 per common share paid in 2024, an increase of 10%.
19. Other Comprehensive Income
The following tables present the changes in each component of AOCI and the effect of reclassifications out of AOCI into the respective lines in the consolidated statements of operations.
Changes in Accumulated Other Comprehensive Income (Loss) by Component
Year Ended December 31, 2024
| | | | | | | | | | | | | | | | | | | | | | | | | | | | | | | | | | | |
| | Net Unrealized Gains (Losses) on Investments with: | | ISCR on FG VIEs’ Liabilities with Recourse | | Cumulative
Translation
Adjustment | | Cash
Flow
Hedge | | Total
AOCI |
| No Credit Impairment | | Credit Impairment |
| (in millions) |
| Balance, December 31, 2023 | $ | (202) | | | $ | (104) | | | $ | (20) | | | $ | (38) | | | $ | 5 | | | $ | (359) | |
| Other comprehensive income (loss) before reclassifications | (43) | | | 20 | | | — | | | 1 | | | — | | | (22) | |
| Less: Amounts reclassified from AOCI to: | | | | | | | | | | | |
| Net realized investment gains (losses) | (10) | | | 18 | | | — | | | — | | | — | | | 8 | |
| Fair value gains (losses) on FG VIEs | — | | | — | | | (3) | | | — | | | — | | | (3) | |
| Interest expense | — | | | — | | | — | | | — | | | 1 | | | 1 | |
| Total before tax | (10) | | | 18 | | | (3) | | | — | | | 1 | | | 6 | |
| Tax (provision) benefit | — | | | (3) | | | 1 | | | — | | | — | | | (2) | |
| Total amount reclassified from AOCI, net of tax | (10) | | | 15 | | | (2) | | | — | | | 1 | | | 4 | |
| Other comprehensive income (loss) | (33) | | | 5 | | | 2 | | | 1 | | | (1) | | | (26) | |
| Balance, December 31, 2024 | $ | (235) | | | $ | (99) | | | $ | (18) | | | $ | (37) | | | $ | 4 | | | $ | (385) | |
Assured Guaranty Ltd.
Notes to Consolidated Financial Statements, Continued
Changes in Accumulated Other Comprehensive Income (Loss) by Component
Year Ended December 31, 2023
| | | | | | | | | | | | | | | | | | | | | | | | | | | | | | | | | | | |
| | Net Unrealized Gains (Losses) on Investments with: | | ISCR on FG VIEs’ Liabilities with Recourse | | Cumulative
Translation
Adjustment | | Cash
Flow
Hedge | | Total
AOCI |
| No Credit Impairment | | Credit Impairment |
| (in millions) |
| Balance, December 31, 2022 | $ | (343) | | | $ | (110) | | | $ | (23) | | | $ | (45) | | | $ | 6 | | | $ | (515) | |
| Other comprehensive income (loss) before reclassifications | 139 | | | (5) | | | — | | | 2 | | | — | | | 136 | |
| Less: Amounts reclassified from AOCI to: | | | | | | | | | | | |
| Net realized investment gains (losses) | (1) | | | (13) | | | — | | | — | | | — | | | (14) | |
| Fair value gains (losses) on FG VIEs | — | | | — | | | (3) | | | — | | | — | | | (3) | |
| Fair value gains (losses) on CIVs | — | | | — | | | — | | | (6) | | | — | | | (6) | |
| Interest expense | — | | | — | | | — | | | — | | | 1 | | | 1 | |
| Total before tax | (1) | | | (13) | | | (3) | | | (6) | | | 1 | | | (22) | |
| Tax (provision) benefit | (1) | | | 2 | | | — | | | 1 | | | — | | | 2 | |
| Total amount reclassified from AOCI, net of tax | (2) | | | (11) | | | (3) | | | (5) | | | 1 | | | (20) | |
| Other comprehensive income (loss) | 141 | | | 6 | | | 3 | | | 7 | | | (1) | | | 156 | |
| Balance, December 31, 2023 | $ | (202) | | | $ | (104) | | | $ | (20) | | | $ | (38) | | | $ | 5 | | | $ | (359) | |
Changes in Accumulated Other Comprehensive Income (Loss) by Component
Year Ended December 31, 2022
| | | | | | | | | | | | | | | | | | | | | | | | | | | | | | | | | | | |
| Net Unrealized Gains (Losses) on Investments with: | | ISCR on FG VIEs’ Liabilities with Recourse | | Cumulative
Translation
Adjustment | | Cash
Flow
Hedge | | Total
AOCI |
| No Credit Impairment | | Credit Impairment |
| (in millions) |
| Balance, December 31, 2021 | $ | 375 | | | $ | (24) | | | $ | (21) | | | $ | (36) | | | $ | 6 | | | $ | 300 | |
| Other comprehensive income (loss) before reclassifications | (755) | | | (103) | | | (4) | | | (9) | | | — | | | (871) | |
| Less: Amounts reclassified from AOCI to: | | | | | | | | | | | |
| Net realized investment gains (losses) | (44) | | | (21) | | | — | | | — | | | — | | | (65) | |
| Fair value gains (losses) on FG VIEs | — | | | — | | | (3) | | | — | | | — | | | (3) | |
| Total before tax | (44) | | | (21) | | | (3) | | | — | | | — | | | (68) | |
| Tax (provision) benefit | 7 | | | 4 | | | 1 | | | — | | | — | | | 12 | |
| Total amount reclassified from AOCI, net of tax | (37) | | | (17) | | | (2) | | | — | | | — | | | (56) | |
| Other comprehensive income (loss) | (718) | | | (86) | | | (2) | | | (9) | | | — | | | (815) | |
| Balance, December 31, 2022 | $ | (343) | | | $ | (110) | | | $ | (23) | | | $ | (45) | | | $ | 6 | | | $ | (515) | |
20. Earnings Per Share
Accounting Policy
The Company computes earnings per share (EPS) using the two-class method, which is an earnings allocation formula that determines EPS for: (i) each class of common shares (the Company has a single class of common shares); and (ii) participating securities according to dividends declared (or accumulated) and participation rights in undistributed earnings. Awards and share units under the AGS SERP with non-forfeitable dividends are considered participating securities.
Assured Guaranty Ltd.
Notes to Consolidated Financial Statements, Continued
Basic EPS is computed by dividing net income (loss) available to common shareholders of Assured Guaranty by the weighted average number of common shares outstanding during the period. Diluted EPS adjusts basic EPS for the effects of restricted stock, restricted stock units, stock options and other potentially dilutive financial instruments (dilutive securities) only in the periods in which such effect is dilutive. The effect of the dilutive securities is reflected in diluted EPS by application of the more dilutive of: (1) the treasury stock method; or (2) the two-class method assuming nonvested shares are not converted into common shares.
Computation of Earnings Per Share
| | | | | | | | | | | | | | | | | |
| | Year Ended December 31, |
| | 2024 | | 2023 | | 2022 |
| | (in millions, except per share amounts) |
| Basic EPS: | | | | | |
| Net income (loss) attributable to AGL | $ | 376 | | | $ | 739 | | | 124 | |
| Less: Distributed and undistributed income (loss) available to nonvested shareholders | 3 | | | 6 | | | 1 | |
| Distributed and undistributed income (loss) available to common shareholders of AGL and subsidiaries, basic | $ | 373 | | | $ | 733 | | | 123 | |
| Basic shares | 53.3 | | | 58.4 | | | 62.9 | |
| Basic EPS | $ | 7.01 | | | $ | 12.54 | | | $ | 1.95 | |
| | | | | |
| Diluted EPS: | | | | | |
| Distributed and undistributed income (loss) available to common shareholders of AGL and subsidiaries, basic | $ | 373 | | | $ | 733 | | | $ | 123 | |
| Plus: Re-allocation of undistributed income (loss) available to nonvested shareholders of AGL and subsidiaries | — | | | — | | | — | |
| Distributed and undistributed income (loss) available to common shareholders of AGL and subsidiaries, diluted | $ | 373 | | | $ | 733 | | | $ | 123 | |
| Basic shares | 53.3 | | | 58.4 | | | 62.9 | |
| Dilutive securities: | | | | | |
| Restricted stock awards | 1.0 | | | 1.2 | | | 1.0 | |
| Diluted shares | 54.3 | | | 59.6 | | | 63.9 | |
| Diluted EPS | $ | 6.87 | | | $ | 12.30 | | | $ | 1.92 | |
| Potentially dilutive securities excluded from computation of EPS because of antidilutive effect | 0.1 | | | 0.1 | | | 0.6 | |
Assured Guaranty Ltd.
Notes to Consolidated Financial Statements, Continued
21. Parent Company
The following tables present the condensed financial statements of Assured Guaranty Ltd.
Assured Guaranty Ltd. (Parent Company)
Condensed Balance Sheets
(in millions)
| | | | | | | | | | | |
| As of December 31, |
| | 2024 | | 2023 |
| Assets | | | |
| Investments | $ | 66 | | | $ | 40 | |
| Investments in subsidiaries | 5,237 | | | 5,553 | |
| Dividends receivable from subsidiaries | 150 | | | 80 | |
| Other assets (1) | 69 | | | 64 | |
| Total assets | $ | 5,522 | | | $ | 5,737 | |
| | | |
| Liabilities | | | |
| Other liabilities (1) | $ | 27 | | | $ | 24 | |
| Total liabilities | $ | 27 | | | $ | 24 | |
| | | |
| Total shareholders’ equity attributable to AGL | $ | 5,495 | | | $ | 5,713 | |
| Total liabilities and shareholders’ equity | $ | 5,522 | | | $ | 5,737 | |
____________________
(1) Mainly consists of due from and due to affiliates.
Assured Guaranty Ltd. (Parent Company)
Condensed Statements of Operations and Comprehensive Income
(in millions)
| | | | | | | | | | | | | | | | | |
| | Year Ended December 31, |
| | 2024 | | 2023 | | 2022 |
| Revenues | | | | | |
| Net investment income | $ | 2 | | | $ | 1 | | | $ | 3 | |
| Net realized investment gains (losses) | — | | | (1) | | | (4) | |
| Total revenues | 2 | | | — | | | (1) | |
| Expenses | | | | | |
| Other expenses (1) | 42 | | | 45 | | | 45 | |
| Total expenses | 42 | | | 45 | | | 45 | |
| Income (loss) before equity in earnings of subsidiaries | (40) | | | (45) | | | (46) | |
| Equity in earnings of subsidiaries | 416 | | | 784 | | | 170 | |
| Net income attributable to AGL | 376 | | | 739 | | | 124 | |
| Other comprehensive income (loss) attributable to AGL | (26) | | | 156 | | | (815) | |
| Comprehensive income (loss) attributable to AGL | $ | 350 | | | $ | 895 | | | $ | (691) | |
____________________
(1) Includes expense allocations from subsidiaries.
Assured Guaranty Ltd.
Notes to Consolidated Financial Statements, Continued
Assured Guaranty Ltd. (Parent Company)
Condensed Statements of Cash Flows
(in millions)
| | | | | | | | | | | | | | | | | |
| | Year Ended December 31, |
| | 2024 | | 2023 | | 2022 |
| Cash flows from operating activities: | | | | | |
| Net income attributable to AGL | $ | 376 | | | $ | 739 | | | $ | 124 | |
| Adjustments to reconcile net income to net cash flows provided by operating activities: | | | | | |
| Equity in earnings of subsidiaries | (416) | | | (784) | | | (170) | |
| Net realized investment losses (gains) | — | | | 1 | | | 4 | |
| Cash dividends from subsidiaries | 637 | | | 306 | | | 437 | |
| Other | 28 | | | 36 | | | 32 | |
| Net cash flows provided by (used in) operating activities | 625 | | | 298 | | | 427 | |
| | | | | |
| Cash flows from investing activities: | | | | | |
| Fixed-maturity securities, available for sale: | | | | | |
| Maturities and paydowns | 3 | | | — | | | — | |
| Short-term investments with maturities of over three months: | | | | | |
| Sales | — | | | 4 | | | 52 | |
| Maturities and paydowns | — | | | — | | | 5 | |
| Net sales (purchases) of short-term investments with original maturities of less than three months | (29) | | | (18) | | | 92 | |
| Net cash flows provided by (used in) investing activities | (26) | | | (14) | | | 149 | |
| | | | | |
| Cash flows from financing activities: | | | | | |
| Dividends paid | (68) | | | (67) | | | (64) | |
| Repurchases of common shares | (502) | | | (199) | | | (500) | |
| Payments related to tax withholding for share-based compensation | (30) | | | (20) | | | (14) | |
| Other | 2 | | | 2 | | | 2 | |
| Net cash flows provided by (used in) financing activities | (598) | | | (284) | | | (576) | |
| | | | | |
| Increase (decrease) in cash and restricted cash | 1 | | | — | | | — | |
| Cash and restricted cash at beginning of period | — | | | — | | | — | |
| Cash and restricted cash at end of period | $ | 1 | | | $ | — | | | $ | — | |
| | | | | |
| As of December 31, |
| 2024 | | 2023 | | 2022 |
| Reconciliation of cash and restricted cash to the balance sheets: | | | | | |
| Cash | $ | — | | | $ | — | | | $ | — | |
| Restricted cash (included in other assets) | 1 | | | — | | | — | |
| Cash and restricted cash at the end of period | $ | 1 | | | $ | — | | | $ | — | |
Basis of Presentation
These condensed financial statements of AGL should be read in conjunction with the Company’s consolidated financial statements and notes thereto. AGL is a Bermuda-based holding company that provides, through its wholly-owned operating subsidiaries, credit protection products to the U.S. and non-U.S. public finance (including infrastructure) and structured finance markets. Assured Guaranty also participates in the asset management business. See Note 1, Business and Basis of Presentation, for further information regarding the basis of presentation.
Assured Guaranty Ltd.
Notes to Consolidated Financial Statements, Continued
Guaranties of Obligations of Affiliates
AGL fully and unconditionally guarantees all of the U.S. Holding Companies’ debt. See Note 11, Long-Term Debt and Credit Facilities, for additional information.
Credit Facility with Affiliate
On October 25, 2013, AGL, as borrower, and AGUS, as lender, entered into a revolving credit facility pursuant to which AGL may, from time to time, borrow for general corporate purposes. Under the credit facility, AGUS committed to lend a principal amount not exceeding $225 million in the aggregate. In October 2023, the commitment was extended until October 25, 2033 (the loan commitment termination date). The unpaid principal amount of each loan will bear interest at a fixed rate equal to 100% of the then applicable interest rate as determined under Section 1274(d) of the Code, and interest on all loans will be computed for the actual number of days elapsed on the basis of a year consisting of 360 days. Accrued interest on all loans will be paid on the last day of each June and December, and at maturity. AGL must repay the then unpaid principal amounts of the loans by the third anniversary of the loan commitment termination date. No amounts are currently outstanding under the credit facility.
Income Taxes
AGL is not subject to any income, withholding or capital gains taxes under current Bermuda law. In November 2013, AGL became tax resident in the U.K. although it remains a Bermuda-based company and its administrative and head office functions continue to be carried on in Bermuda. In July of 2023, the U.K. government passed legislation to implement the OECD BEPS Pillar Two income inclusion rule, which includes a multinational top-up tax which will apply to large multinational corporations for accounting periods beginning on or after December 31, 2023. It is expected this will apply to AGL, requiring a minimum effective rate of 15% in all jurisdictions in which it operates. See Note 13, Income Taxes, for further information regarding AGL’s income taxes.
ITEM 9. CHANGES IN AND DISAGREEMENTS WITH ACCOUNTANTS ON ACCOUNTING AND FINANCIAL DISCLOSURE
None.
ITEM 9A. CONTROLS AND PROCEDURES
Evaluation of Disclosure Controls and Procedures
Assured Guaranty’s management, with the participation of AGL’s Chief Executive Officer (CEO) and Chief Financial Officer (CFO), has evaluated the effectiveness of AGL’s disclosure controls and procedures (as such term is defined in Rules 13a-15(e) and 15d-15(e) under the Securities Exchange Act of 1934, as amended (the Exchange Act)), as of December 31, 2024. The controls and procedures are designed to ensure that information required to be disclosed by the Company in the reports that it files or submits under the Exchange Act is accumulated and communicated to management, including AGL’s CEO and CFO, as appropriate, to allow timely decisions regarding required disclosures. Based on this evaluation, AGL’s CEO and CFO have concluded that, as of December 31, 2024, AGL’s disclosure controls and procedures are effective in recording, processing, summarizing and reporting, within the time periods specified in the U.S. Securities and Exchange Commission’s rules and forms, information required to be disclosed by AGL (including its consolidated subsidiaries) in the reports that it files or submits under the Exchange Act.
Changes in Internal Control over Financial Reporting
There has been no change in the Company’s internal control over financial reporting during the Company’s quarter ended December 31, 2024, that has materially affected, or is reasonably likely to materially affect, the Company’s internal control over financial reporting.
Management’s Annual Report on Internal Control over Financial Reporting
The management of AGL is responsible for establishing and maintaining adequate internal control over financial reporting, as such term is defined in Exchange Act Rule 13a-15(f). Internal control over financial reporting is a process designed by, or under the supervision of, the Company’s CEO and CFO to provide reasonable assurance regarding the
reliability of financial reporting and the preparation of the Company’s consolidated financial statements for external purposes in accordance with GAAP.
Because of inherent limitations, internal control over financial reporting may not prevent or detect misstatements. Projections of any evaluation of effectiveness to future periods are subject to the risks that controls may become inadequate because of changes in conditions, or that the degree of compliance with the policies or procedures may deteriorate.
Management of the Company has assessed the effectiveness of the Company’s internal control over financial reporting as of December 31, 2024 using the criteria set forth by the Committee of Sponsoring Organizations of the Treadway Commission (COSO) in the 2013 Internal Control-Integrated Framework. Based on this evaluation, management concluded that the Company’s internal control over financial reporting was effective as of December 31, 2024 based on criteria in the 2013 Internal Control-Integrated Framework issued by the COSO.
The effectiveness of the Company’s internal control over financial reporting as of December 31, 2024 has been audited by PricewaterhouseCoopers LLP, an independent registered public accounting firm, as stated in their “Report of Independent Registered Public Accounting Firm” included in Item 8, Financial Statements and Supplementary Data.
ITEM 9B. OTHER INFORMATION
Insider Trading Arrangements
During the fourth quarter of 2024, none of the Company’s directors or officers (as defined in Rule 16a-1(f) of the Exchange Act) adopted, terminated or modified a Rule 10b5-1 trading arrangement or non-Rule 10b5-1 trading arrangement (as such terms are defined in Item 408 of Regulation S-K of the Securities Act).
ITEM 9C. DISCLOSURE REGARDING FOREIGN JURISDICTIONS THAT PREVENT INSPECTIONS
Not applicable.
PART III
ITEM 10. DIRECTORS, EXECUTIVE OFFICERS AND CORPORATE GOVERNANCE
Information pertaining to this item is incorporated by reference to the definitive proxy statement for the 2025 Annual General Meeting of Shareholders, which will be filed with the SEC not later than 120 days after the close of the fiscal year covered by this Form 10-K.
Information about the executive officers of AGL is set forth at the end of Part I of this Form 10-K and is hereby incorporated by reference.
Code of Ethics
The Company has adopted a Global Code of Ethics, which sets forth standards by which all employees, officers and directors of the Company must abide as they work for the Company. The Global Code of Ethics is available at www.assuredguaranty.com/governance. The Company intends to disclose on its internet site any amendments to, or waivers from, its Global Code of Ethics that are required to be publicly disclosed pursuant to the rules of the SEC or the NYSE.
Insider Trading Policy
The Company has established an insider trading policy that sets out guidelines for its officers, directors and employees with respect to transactions in the Company’s securities that it believes is reasonably designed to promote compliance with insider trading laws, rules and regulations, and NYSE listing standards. The policy details the circumstances under which such individuals may, after obtaining consent, buy and sell such securities. The policy also sets out the circumstances under which such individuals are authorized to enter into, amend or terminate equity trading plans established according to Section 10b5-1 of the Exchange Act with an independent broker-dealer. An equity trading plan is a written document that preestablishes the amounts, prices and dates (or formula for determining the amounts, prices and dates) of future purchases or sales of the Company’s securities, including sales of shares acquired under the Company’s equity plans. Under a Rule 10b5-1 trading arrangement, a broker-dealer executes trades pursuant to parameters established by the officer, director or employee when entering into the plan, without further direction from such person. The Company’s officers, directors and employees may buy or sell the Company’s securities outside of a Rule 10b5-1 trading arrangement only when they are not in possession of material nonpublic information.
ITEM 11. EXECUTIVE COMPENSATION
This item is incorporated by reference to the definitive proxy statement for the 2025 Annual General Meeting of Shareholders, which will be filed with the SEC not later than 120 days after the close of the fiscal year covered by this Form 10-K.
ITEM 12. SECURITY OWNERSHIP OF CERTAIN BENEFICIAL OWNERS AND MANAGEMENT AND RELATED STOCKHOLDER MATTERS
This item is incorporated by reference to the definitive proxy statement for the 2025 Annual General Meeting of Shareholders, which will be filed with the SEC not later than 120 days after the close of the fiscal year covered by this Form 10-K.
ITEM 13. CERTAIN RELATIONSHIPS AND RELATED TRANSACTIONS, AND DIRECTOR INDEPENDENCE
This item is incorporated by reference to the definitive proxy statement for the 2025 Annual General Meeting of Shareholders, which will be filed with the SEC not later than 120 days after the close of the fiscal year covered by this Form 10-K.
ITEM 14. PRINCIPAL ACCOUNTANT FEES AND SERVICES
This item is incorporated by reference to the definitive proxy statement for the 2025 Annual General Meeting of Shareholders, which will be filed with the SEC not later than 120 days after the close of the fiscal year covered by this Form 10-K.
PART IV
ITEM 15. EXHIBITS AND FINANCIAL STATEMENT SCHEDULES
(a) Financial Statements, Financial Statement Schedules and Exhibits
1. Financial Statements
The following financial statements of Assured Guaranty Ltd. have been included in, Part II, Item 8, Financial Statements and Supplementary Data, hereof:
2. Financial Statement Schedules
The financial statement schedules are omitted because they are not applicable or the required information is shown in the consolidated financial statements or notes thereto.
3. Exhibits*
| | | | | |
| Description of Document |
| 2.1 | |
| 3.1 | |
| 3.2 | |
| 4.1 | |
| 4.2 | |
| 4.3 | |
| 4.4 | |
| 4.5 | |
| 4.6 | |
| 4.7 | |
| 4.8 | |
| | | | | |
| Description of Document |
| 4.9 | |
| 4.10 | |
| 4.11 | |
| 4.12 | |
| 4.13 | |
| 4.14 | |
| 4.15 | |
| 4.16 | |
| 4.17 | |
| 10.1 | |
| 10.2 | |
| 10.3 | |
| 10.4 | |
| 10.5 | |
| 10.6 | |
| 10.7 | |
| 10.8 | |
| 10.9 | |
| 10.10 | |
| 10.11 | |
| 10.12 | |
| 10.13 | |
| | | | | |
| Description of Document |
| 10.14 | |
| 10.15 | |
| 10.16 | |
| 10.17 | |
| 10.18 | |
| 10.19 | |
| 10.20 | |
| 10.21 | Pledge and Administration Agreement, dated as of June 30, 2009, among Dexia SA, Dexia Crédit Local S.A., Dexia Bank Belgium SA, Dexia FP Holdings Inc., Financial Security Assurance Inc., FSA Asset Management LLC, FSA Portfolio Asset Limited, FSA Capital Markets Services LLC, FSA Capital Markets Services (Caymans) Ltd., FSA Capital Management Services LLC and The Bank of New York Mellon Trust Company, National Association (Incorporated by reference to Exhibit 10.8 to Form 8-K filed on July 8, 2009) |
| 10.22 | |
| 10.23 | |
| 10.24 | |
| 10.25 | |
| 10.26 | Pledge and Administration Annex Amendment Agreement dated as of July 1, 2009 among Dexia SA, Dexia Crédit Local S.A., Dexia Bank Belgium SA, Dexia FP Holdings Inc., Financial Security Assurance Inc., FSA Asset Management LLC, FSA Portfolio Asset Limited, FSA Capital Markets Services LLC, FSA Capital Markets Services (Caymans) Ltd., FSA Capital Management Services LLC and The Bank of New York Mellon Trust Company, National Association (Incorporated by reference to Exhibit 10.14 to Form 8-K filed on July 8, 2009) |
| 10.27 | |
| 10.28 | |
| 10.29 | |
| 10.30 | |
| 10.31 | |
| | | | | |
| Description of Document |
| 10.32 | |
| 10.33 | |
| 10.34 | |
| 10.35 | |
| 10.36 | |
| 10.37 | |
| 10.38 | |
| 10.39 | |
| 10.40 | |
| 10.41 | |
| 10.42 | |
| 10.43 | |
| 10.44 | |
| 10.45 | |
| 10.46 | |
| 10.47 | |
| 10.48 | |
| 10.49 | |
| 10.50 | Purchase Agreement, dated as of August 7, 2019, among BlueMountain Capital Management, LLC, BlueMountain GP Holdings, LLC, BlueMountain CLO Management, LLC, Assured Guaranty US Holdings Inc., Assured Guaranty Ltd., Affiliated Managers Group, Inc. and the sellers named therein (Incorporated by reference to Exhibit 2.1 to Form 10-Q for the quarter ended June 30, 2019)* |
| 10.51 | |
| 10.52 | |
| 10.53 | |
| 10.54 | |
| 10.55 | |
| | | | | |
| Description of Document |
| 10.56 | |
| 10.57 | |
| 10.58 | |
| 10.59 | |
| 10.60 | |
| 10.61 | |
| 10.62 | |
| 10.63 | |
| 10.64 | |
| 10.65 | |
| 10.66 | |
| 10.67 | |
| 10.68 | |
| 10.69 | |
| 10.70 | |
| 10.71 | |
| 10.72 | |
| 10.73 | |
| 10.74 | |
| 10.75 | |
| 10.76 | |
| 10.77 | |
| 19.1 | |
| 21.1 | |
| 22.0 | |
| 23.1 | |
| 31.1 | |
| | | | | |
| Description of Document |
| 31.2 | |
| 32.1 | |
| 32.2 | |
| 97.1 | |
| 101.1 | The following financial information from Assured Guaranty Ltd.’s Annual Report on Form 10-K for the year ended December 31, 2024 formatted in inline XBRL: (i) Consolidated Balance Sheets at December 31, 2024 and 2023; (ii) Consolidated Statements of Operations for the years ended December 31, 2024, 2023 and 2022; (iii) Consolidated Statements of Comprehensive Income for the years ended December 31, 2024, 2023 and 2022; (iv) Consolidated Statements of Shareholders’ Equity for the years ended December 31, 2024, 2023 and 2022; (v) Consolidated Statements of Cash Flows for the years ended December 31, 2024, 2023 and 2022; and (vi) Notes to Consolidated Financial Statements. |
| 104.1 | The Cover Page Interactive Data File from Assured Guaranty Ltd.’s Annual Report on Form 10-K for the year ended December 31, 2024 formatted, in Inline XBRL (the cover page XBRL tags are embedded in the Inline XBRL document and included in Exhibit 101). |
* Management contract or compensatory plan
ITEM 16. FORM 10-K SUMMARY
None.
SIGNATURES
Pursuant to the requirements of Section 13 or 15(d) of the Securities Exchange Act of 1934, the Registrant has caused this report to be signed on its behalf by the undersigned, thereunto duly authorized.
| | | | | | | | |
| Assured Guaranty Ltd. |
| |
| |
| By: | /s/ Dominic J. Frederico |
| | Name: Dominic J. Frederico Title: President and Chief Executive Officer |
Date: February 28, 2025
Pursuant to the requirements of the Securities Exchange Act of 1934, this report has been signed below by the following persons on behalf of the Registrant and in the capacities and on the dates indicated.
| | | | | | | | | | | | | | | | | | | | |
| Name | | Position | | Date | |
| | | | | | |
| /s/ Francisco L. Borges | | Chairman of the Board; Director | | February 28, 2025 | |
| Francisco L. Borges |
| | | | | | |
| /s/ Dominic J. Frederico | | President and Chief Executive Officer; Director | | February 28, 2025 | |
| Dominic J. Frederico |
| | | | | | |
| /s/ Benjamin G. Rosenblum | | Chief Financial Officer (Principal Financial Officer) | | February 28, 2025 | |
| Benjamin G. Rosenblum |
| | | | | | |
| /s/ Laura Bieling | | Chief Accounting Officer (Principal Accounting Officer) | | February 28, 2025 | |
| Laura Bieling |
| | | | | | |
| /s/ Mark C. Batten | | Director | | February 28, 2025 | |
| Mark C. Batten | | | |
| | | | | | |
| /s/ Bonnie L. Howard | | Director | | February 28, 2025 | |
| Bonnie L. Howard |
| | | | | | |
| /s/ Thomas W. Jones | | Director | | February 28, 2025 | |
| Thomas W. Jones |
| | | | | | |
| /s/ Alan J. Kreczko | | Director | | February 28, 2025 | |
| Alan J. Kreczko |
| | | | | | |
| /s/ Yukiko Omura | | Director | | February 28, 2025 | |
| Yukiko Omura |
| | | | | | |
| /s/ Lorin P.T. Radtke | | Director | | February 28, 2025 | |
| Lorin P.T. Radtke |
| | | | | | |
| | | | | | | | | | | | | | | | | | | | |
| Name | | Position | | Date | |
| /s/ Courtney C. Shea | | Director | | February 28, 2025 | |
| Courtney C. Shea |
| | | | | | |
| | | | | | |
| | | | | | |
