Exhibit 99.1
InfosonicsTM It pays to be well connected President and Chief Executive Officer September 2006 Joseph Ram |
Safe Harbor Statement This presentation contains forward-looking statements made in reliance upon the safe harbor provisions of the Private Securities Litigation Reform Act of 1995. Forward-looking statements include, but are not limited to, IFON's views on future fundraising plans, profitability, revenues, market growth, capital requirements and new product introductions and any other statements identified by phrases such as "thinks," "anticipates," "believes," "estimates," "expects,“ "intends," "plans," "goals" or similar words. The forward-looking statements contained herein are subject to certain risks and uncertainties that could cause actual results to differ materially from those reflected in the forward-looking statements. Some of these uncertainties and risks include, but are not limited to, the demand for our products, our ability to obtain our products from our suppliers, our ability to maintain commercially feasible margins given significant competition, and other factors. In addition, references to past operating results should not be considered to be indicative of future performance. Readers, attendees and those listening are cautioned not to place undue reliance on these forward-looking statements, which reflect management's analysis only as of the date hereof. InfoSonics undertakes no obligation to publicly revise these forward-looking statements to reflect events or circumstances that arise after the date hereof. Readers, attendees and listeners should carefully review the risks described in other documents that InfoSonics files from time to time with the Securities and Exchange Commission ("SEC"), including our Form 10-K for the year ended December 31, 2005 and our Forms 10-Q for the quarter ended June 30, 2006 and prior periods. |
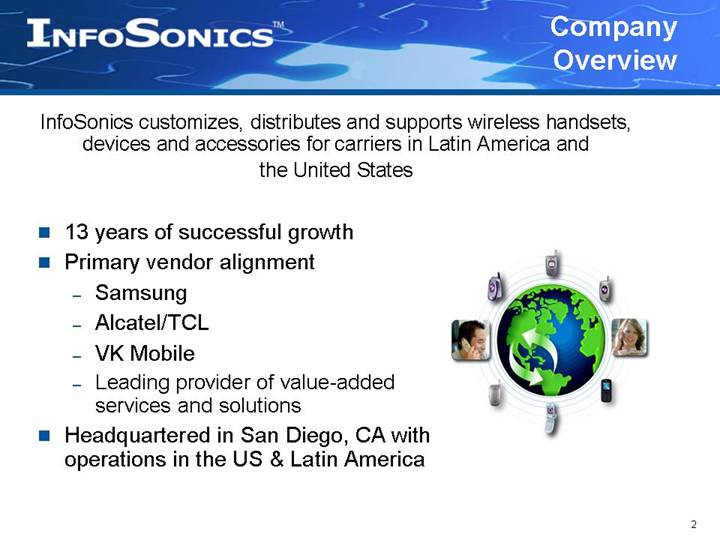
Company Overview InfoSonics customizes, distributes and supports wireless handsets, devices and accessories for carriers in Latin America and the United States 13 years of successful growth Primary vendor alignment Samsung Alcatel/TCL VK Mobile Leading provider of value-added services and solutions Headquartered in San Diego, CA with operations in the US & Latin America |
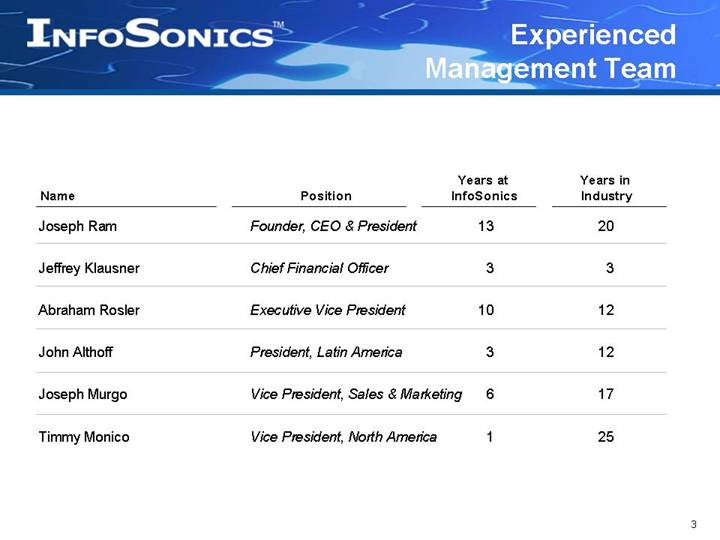
Joseph Ram Founder, CEO & President 13 20 Jeffrey Klausner Chief Financial Officer 3 3 Abraham Rosler Executive Vice President 10 12 John Althoff President, Latin America 3 12 Joseph Murgo Vice President, Sales & Marketing 6 17 Timmy Monico Vice President, North America 1 25 Name Position Years in Industry Years at InfoSonics Experienced Management Team |
Investment Highlights Proven track record of growth and profitability Business model produces stronger margins & profitability, relative to peers Positive industry dynamics Latin America is one of the top three regions in terms of handset growth Strong replacement/upgrade rates in both US and Latin America Substantial growth opportunities Continue to expand product offerings Geographic expansion Further market penetration Experienced management team Over 80 years of combined industry experience |
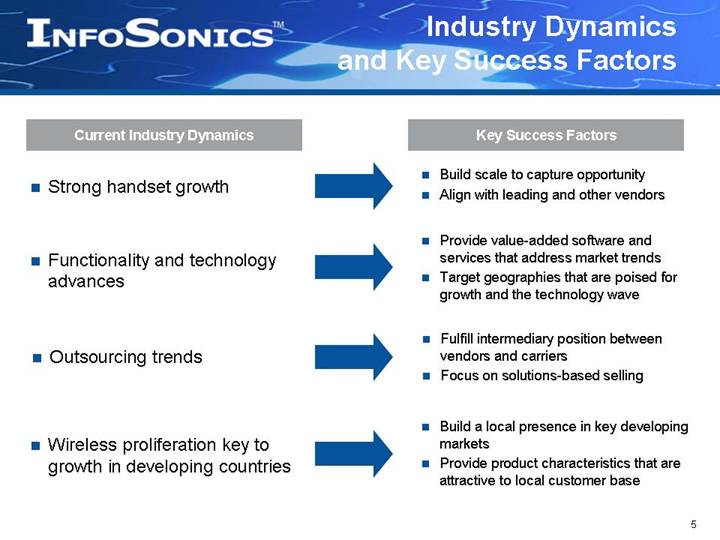
Industry Dynamics and Key Success Factors Strong handset growth Current Industry Dynamics Key Success Factors Functionality and technology advances Outsourcing trends Wireless proliferation key to growth in developing countries Build scale to capture opportunity Align with leading and other vendors Provide value-added software and services that address market trends Target geographies that are poised for growth and the technology wave Fulfill intermediary position between vendors and carriers Focus on solutions-based selling Build a local presence in key developing markets Provide product characteristics that are attractive to local customer base |
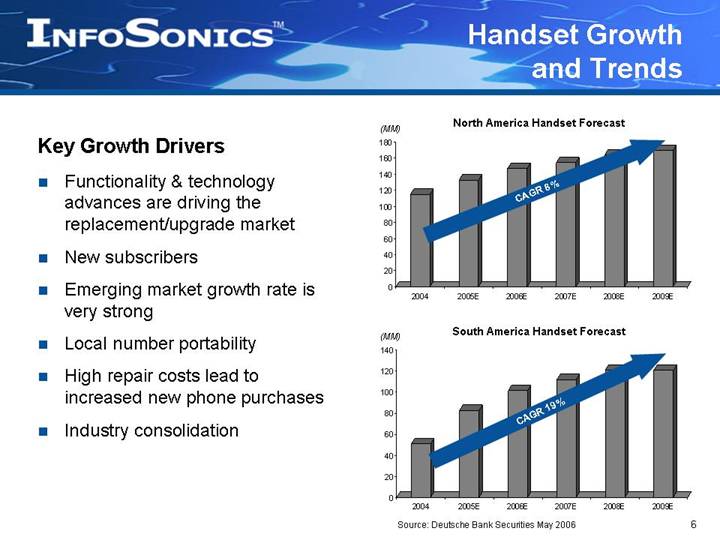
Handset Growth and Trends Key Growth Drivers Functionality & technology advances are driving the replacement/upgrade market New subscribers Emerging market growth rate is very strong Local number portability High repair costs lead to increased new phone purchases Industry consolidation CAGR 8% South America Handset Forecast North America Handset Forecast Source: Deutsche Bank Securities May 2006 CAGR 19% (MM) (MM) 0 20 40 60 80 100 120 140 160 180 2004 2005E 2006E 2007E 2008E 2009E 0 20 40 60 80 100 120 140 2004 2005E 2006E 2007E 2008E 2009E |
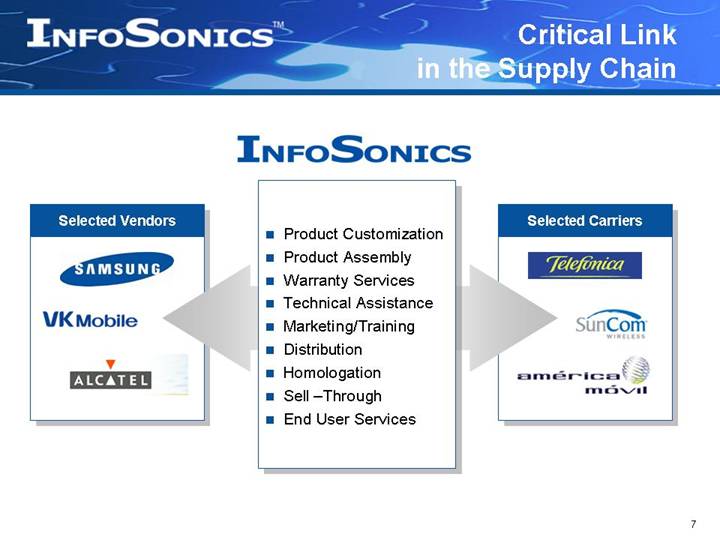
Selected Carriers Selected Vendors Critical Link in the Supply Chain Product Customization Product Assembly Warranty Services Technical Assistance Marketing/Training Distribution Homologation Sell –Through End User Services |
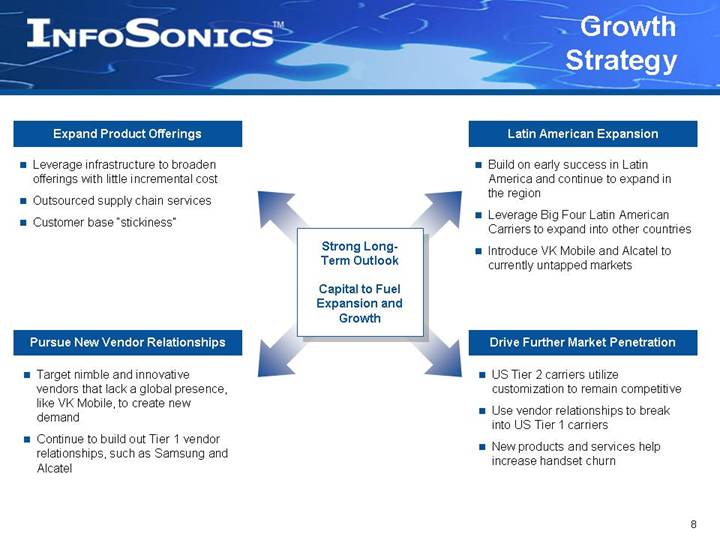
Target nimble and innovative vendors that lack a global presence, like VK Mobile, to create new demand Continue to build out Tier 1 vendor relationships, such as Samsung and Alcatel Growth Strategy Leverage infrastructure to broaden offerings with little incremental cost Outsourced supply chain services Customer base “stickiness” US Tier 2 carriers utilize customization to remain competitive Use vendor relationships to break into US Tier 1 carriers New products and services help increase handset churn Build on early success in Latin America and continue to expand in the region Leverage Big Four Latin American Carriers to expand into other countries Introduce VK Mobile and Alcatel to currently untapped markets Expand Product Offerings Drive Further Market Penetration Latin American Expansion Pursue New Vendor Relationships Strong Long-Term Outlook Capital to Fuel Expansion and Growth |
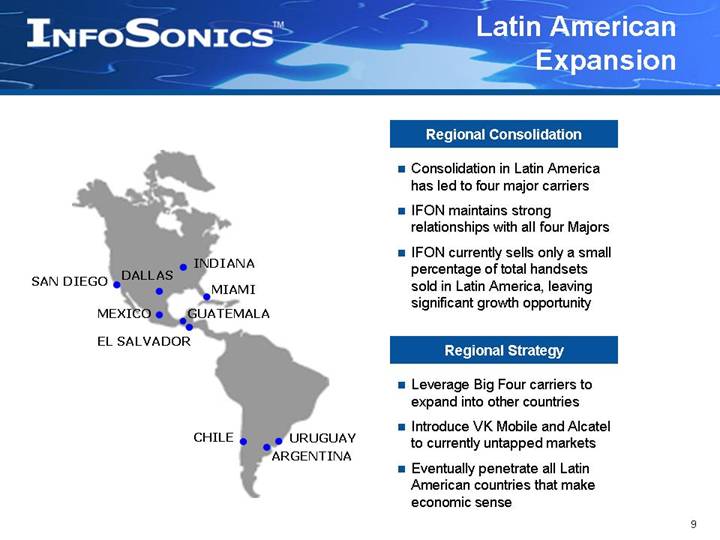
SAN DIEGO MEXICO EL SALVADOR GUATEMALA MIAMI INDIANA URUGUAY ARGENTINA CHILE Regional Consolidation Consolidation in Latin America has led to four major carriers IFON maintains strong relationships with all four Majors IFON currently sells only a small percentage of total handsets sold in Latin America, leaving significant growth opportunity Leverage Big Four carriers to expand into other countries Introduce VK Mobile and Alcatel to currently untapped markets Eventually penetrate all Latin American countries that make economic sense Regional Strategy Latin American Expansion DALLAS |
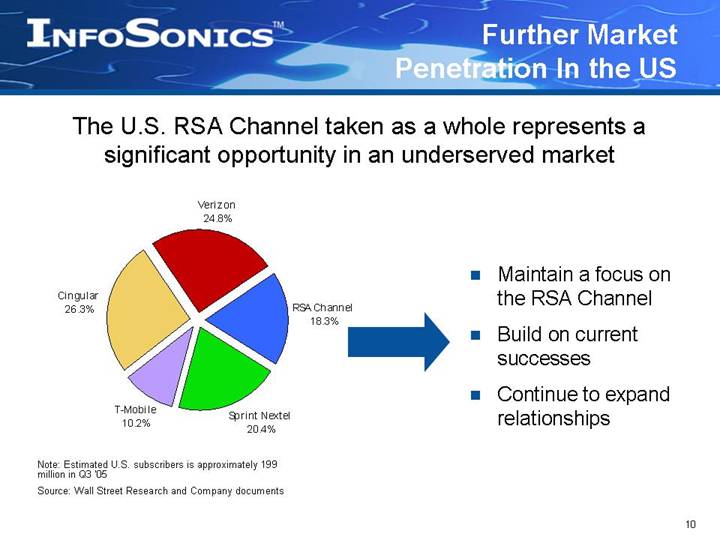
Further Market Penetration In the US The U.S. RSA Channel taken as a whole represents a significant opportunity in an underserved market Maintain a focus on the RSA Channel Build on current successes Continue to expand relationships Note: Estimated U.S. subscribers is approximately 199 million in Q3 ‘05 Source: Wall Street Research and Company documents RSA Channel 18.3% Verizon 24.8% Sprint Nextel 20.4% Cingular 26.3% T-Mobile 10.2% |
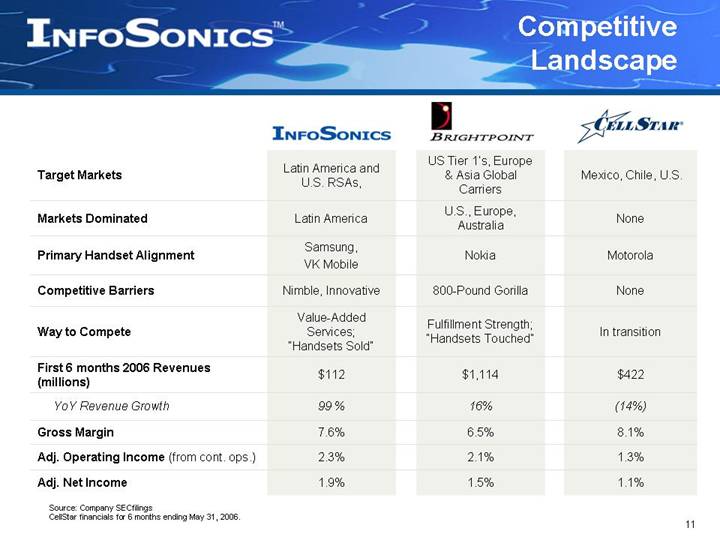
1.5% 2.1% 6.5% 16% $1,114 Fulfillment Strength; “Handsets Touched” 800-Pound Gorilla Nokia U.S., Europe, Australia US Tier 1’s, Europe & Asia Global Carriers Motorola Samsung, VK Mobile Primary Handset Alignment 1.1% 1.3% 8.1% (14%) $422 In transition None None Mexico, Chile, U.S. Latin America and U.S. RSAs, Target Markets Latin America Markets Dominated Nimble, Innovative Competitive Barriers Value-Added Services; “Handsets Sold” Way to Compete 2.3% Adj. Operating Income (from cont. ops.) 7.6% Gross Margin 1.9% Adj. Net Income 99 % YoY Revenue Growth $112 First 6 months 2006 Revenues (millions) Competitive Landscape Source: Company SECfilings CellStar financials for 6 months ending May 31, 2006. |
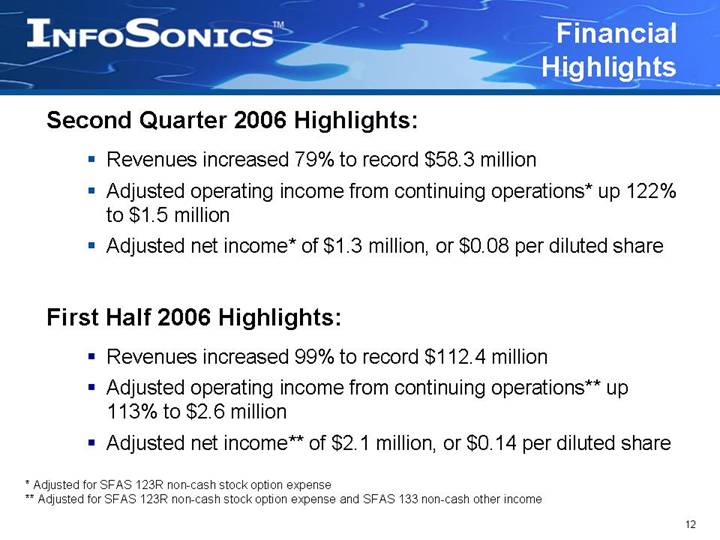
Second Quarter 2006 Highlights: Revenues increased 79% to record $58.3 million Adjusted operating income from continuing operations* up 122% to $1.5 million Adjusted net income* of $1.3 million, or $0.08 per diluted share First Half 2006 Highlights: Revenues increased 99% to record $112.4 million Adjusted operating income from continuing operations** up 113% to $2.6 million Adjusted net income** of $2.1 million, or $0.14 per diluted share Financial Highlights * Adjusted for SFAS 123R non-cash stock option expense ** Adjusted for SFAS 123R non-cash stock option expense and SFAS 133 non-cash other income |
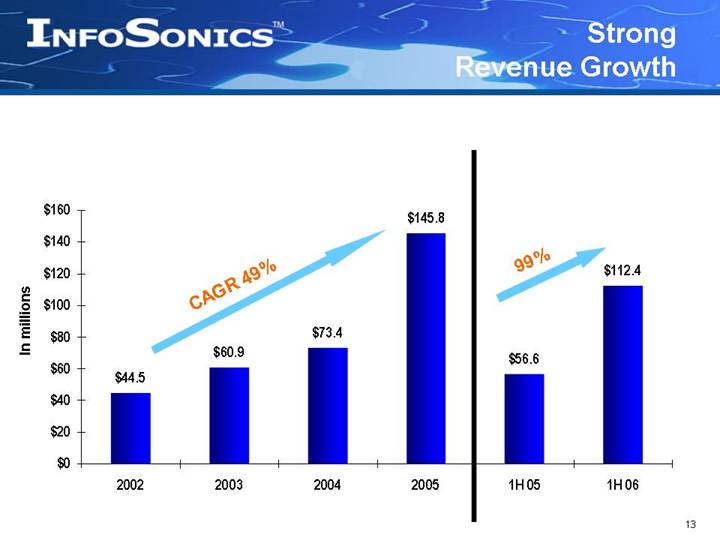
99% CAGR 49% Strong Revenue Growth In millions $44.5 $60.9 $73.4 $145.8 $56.6 $112.4 $0 $20 $40 $60 $80 $100 $120 $140 $160 2002 2003 2004 2005 1H 05 1H 06 |
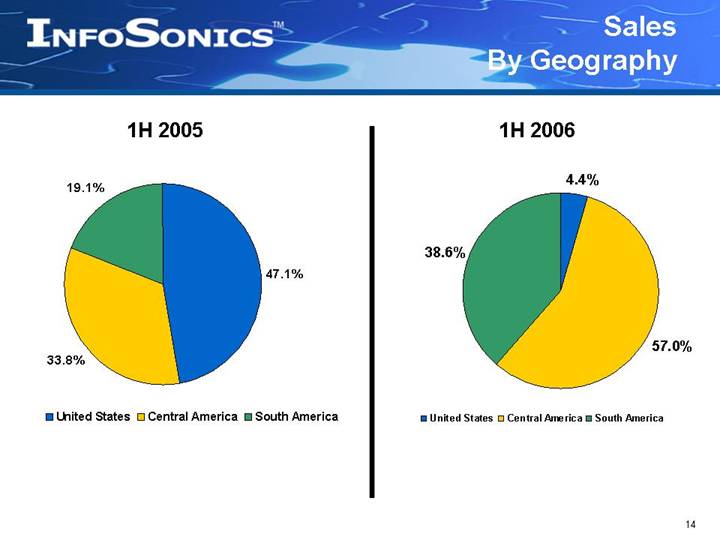
Sales By Geography 1H 2006 1H 2005 4.4% 57.0% 38.6% United States Central America South America 47.1% 33.8% 19.1% United States Central America South America |
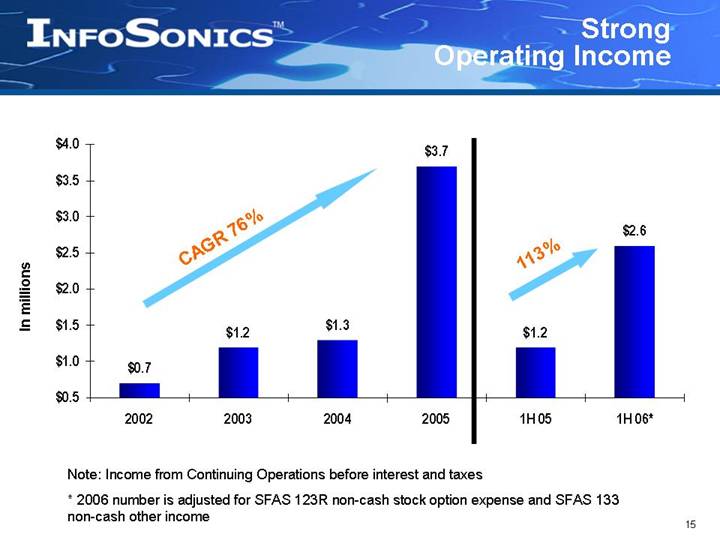
113% CAGR 76% Strong Operating Income In millions Note: Income from Continuing Operations before interest and taxes * 2006 number is adjusted for SFAS 123R non-cash stock option expense and SFAS 133 non-cash other income $0.7 $1.2 $1.3 $3.7 $1.2 $2.6 $0.5 $1.0 $1.5 $2.0 $2.5 $3.0 $3.5 $4.0 2002 2003 2004 2005 1H 05 1H 06* |
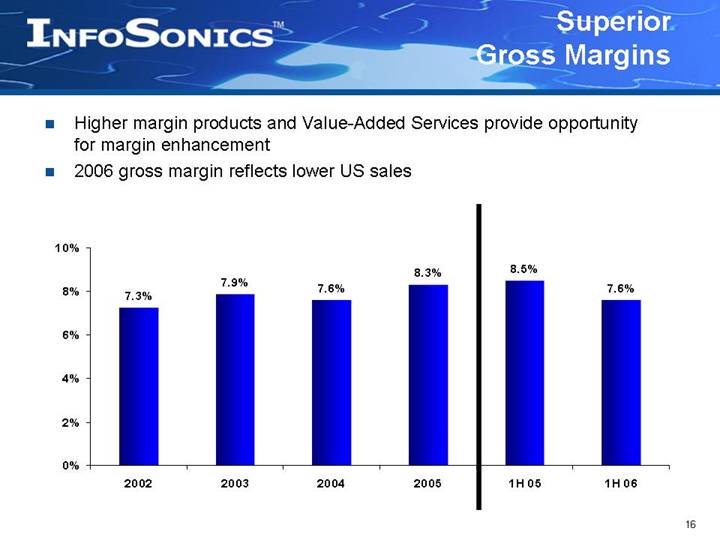
Superior Gross Margins Higher margin products and Value-Added Services provide opportunity for margin enhancement 2006 gross margin reflects lower US sales 7.3% 7.9% 7.6% 8.3% 8.5% 7.6% 0% 2% 4% 6% 8% 10% 2002 2003 2004 2005 1H 05 1H 06 |
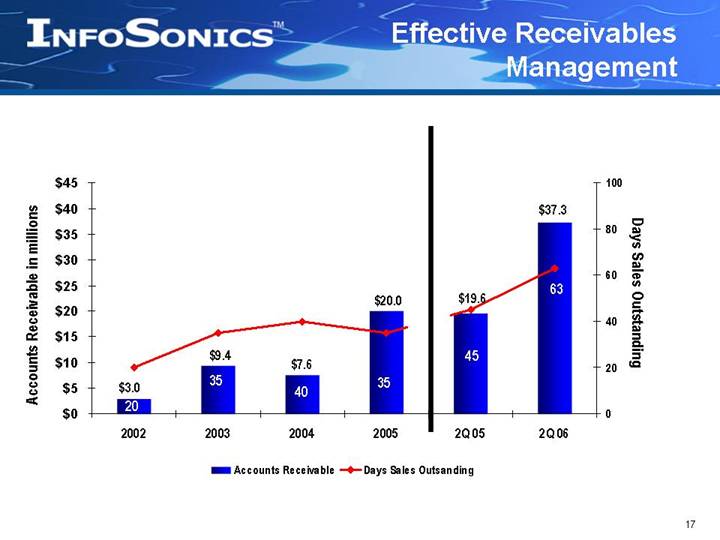
Effective Receivables Management Days Sales Outstanding Accounts Receivable in millions $37.3 $20.0 $19.6 $7.6 $3.0 $9.4 35 20 40 35 45 63 $0 $5 $10 $15 $20 $25 $30 $35 $40 $45 2002 2003 2004 2005 2Q 05 2Q 06 0 20 40 60 80 100 Accounts Receivable Days Sales Outsanding |
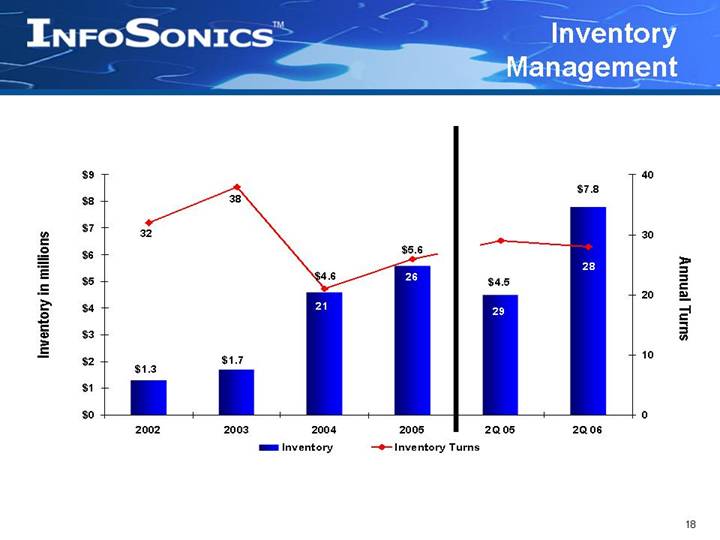
Inventory Management Inventory in millions Annual Turns $4.5 $7.8 $5.6 $4.6 $1.7 $1.3 28 32 38 21 26 29 $0 $1 $2 $3 $4 $5 $6 $7 $8 $9 2002 2003 2004 2005 2Q 05 2Q 06 0 10 20 30 40 Inventory Inventory Turns |
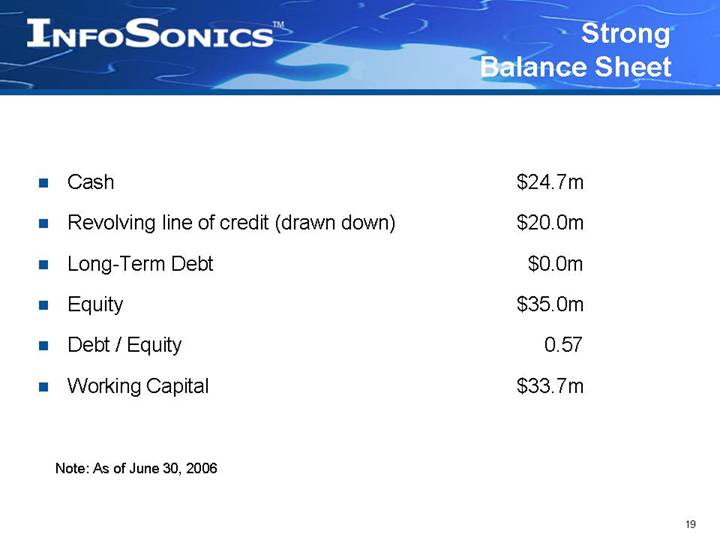
Strong Balance Sheet Cash $24.7m Revolving line of credit (drawn down) $20.0m Long-Term Debt $0.0m Equity $35.0m Debt / Equity 0.57 Working Capital $33.7m Note: As of June 30, 2006 |
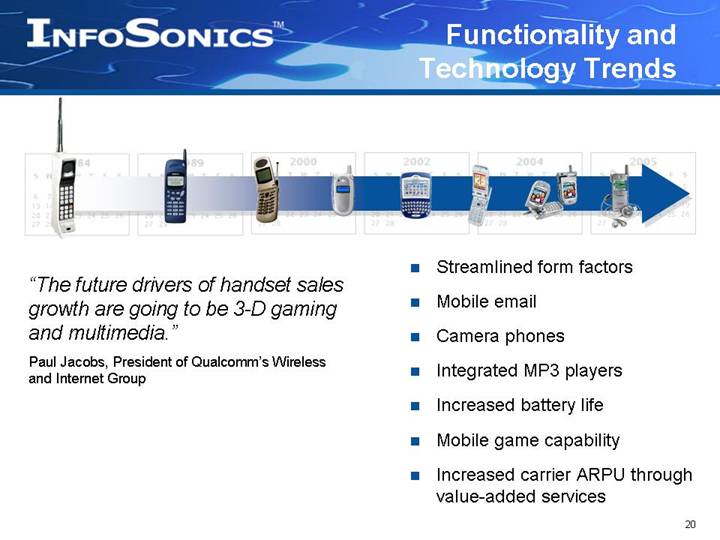
Functionality and Technology Trends Streamlined form factors Mobile email Camera phones Integrated MP3 players Increased battery life Mobile game capability Increased carrier ARPU through value-added services “The future drivers of handset sales growth are going to be 3-D gaming and multimedia.” Paul Jacobs, President of Qualcomm’s Wireless and Internet Group |
Why InfoSonics? Wireless industry dynamics very positive Business model produces superior margins & profitability Solid financial track record Sound growth strategy for US and Latin America Critical Link in supply chain Experienced and bottom-line focused management team |
InfosonicsTM It pays to be well connected The Premier Wireless Handset and Data Products Distributor for the Americas September 2006 |