Table of Contents
UNITED STATES
SECURITIES AND EXCHANGE COMMISSION
Washington, D.C. 20549
FORM 10-K
| | |
| ý | | ANNUAL REPORT PURSUANT TO SECTION 13 OR 15(d) OF THE SECURITIES EXCHANGE ACT OF 1934 FOR THE FISCAL YEAR ENDED DECEMBER 31, 2010 |
o |
|
TRANSITION REPORT PURSUANT TO SECTION 13 OR 15(d) OF THE SECURITIES EXCHANGE ACT OF 1934 |
Commission File Number: 1-31946
HOSPIRA, INC.
(Exact name of registrant as specified in its charter)
| | |
| Delaware | | 20-0504497 |
(State or other jurisdiction
of incorporation or organization) | | (I.R.S. Employer
Identification No.) |
275 North Field Drive
Lake Forest, Illinois 60045
(Address of principal executive offices, including zip code)
(224) 212-2000
(Registrant's telephone number, including area code)
Securities registered pursuant to Section 12(b) of the Act:
| | |
Title of Class | | Name of Exchange on which each class is registered |
|---|
| Common Stock, par value $0.01 per share | | New York Stock Exchange |
| Preferred Stock Purchase Rights | | New York Stock Exchange |
Securities registered pursuant to Section 12(g) of the Act: Common Stock:None
Indicate by check mark if the registrant is a well-known seasoned issuer, as defined in Rule 405 of the Securities Act. Yesý Noo
Indicate by check mark if the registrant is not required to file reports pursuant to Section 13 or Section 15(d) of the Act. Yeso Noý
Indicate by check mark whether the registrant: (1) has filed all reports required to be filed by Section 13 or 15(d) of the Securities Exchange Act of 1934 during the preceding 12 months (or for such shorter period that the registrant was required to file such reports), and (2) has been subject to such filing requirements for the past 90 days. Yesý Noo
Indicate by check mark whether the registrant has submitted electronically and posted on its corporate Web site, if any, every Interactive Data File required to be submitted and posted pursuant to Rule 405 of Regulation S-T (§229.405 of this chapter) during the preceding 12 months (or for such shorter period that the registrant was required to submit and post such files). Yesý Noo
Indicate by check mark if disclosure of delinquent filers pursuant to Item 405 of Regulation S-K is not contained herein, and will not be contained, to the best of registrant's knowledge, in definitive proxy or information statements incorporated by reference in Part III of this Form 10-K or any amendment to this Form 10-K.ý
Indicate by check mark whether the registrant is a large accelerated filer, an accelerated filer, a non-accelerated filer, or a smaller reporting company. See definitions of "large accelerated filer," "accelerated filer," and "smaller reporting company" in Rule 12b-2 of the Exchange Act.
| | | | | | |
| Large accelerated filerý | | Accelerated filero | | Non-accelerated filero
(Do not check if a smaller
reporting company) | | Smaller reporting companyo |
Indicate by check mark whether the registrant is a shell company (as defined in Rule 12b-2 of the Act). Yeso Noý
The aggregate market value of registrant's common stock held by non-affiliates of the registrant on June 30, 2010 (the last business day of the registrant's most recently completed second fiscal quarter), was approximately $9,593.7 million.
Registrant had 166,646,244 shares of common stock outstanding as of February 9, 2011.
DOCUMENTS INCORPORATED BY REFERENCE
Certain sections of the registrant's definitive Proxy Statement to be filed in connection with the 2011 Annual Meeting of Shareholders are incorporated by reference into Part III of this Form 10-K where indicated. The definitive 2011 Proxy Statement will be filed on or about March 25, 2011.
Table of Contents
HOSPIRA, INC.
ANNUAL REPORT ON FORM 10-K
TABLE OF CONTENTS
| | | | |
| |
| | Page Number |
|---|
PART I | | 1 |
Item 1 | | Business | |
1 |
Item 1A | | Risk Factors | |
14 |
Item 1B | | Unresolved Staff Comments | |
25 |
Item 2 | | Properties | |
26 |
Item 3 | | Legal Proceedings | |
26 |
| | Executive Officers of Hospira | |
28 |
PART II | |
30 |
Item 5 | | Market for Registrant's Common Equity, Related Stockholder Matters and Issuer Purchases of Equity Securities | |
30 |
Item 6 | | Selected Financial Data | |
32 |
Item 7 | | Management's Discussion and Analysis of Financial Condition and Results of Operations | |
33 |
Item 7A | | Quantitative and Qualitative Disclosures About Market Risk | |
54 |
Item 8 | | Financial Statements and Supplementary Data | |
56 |
Item 9 | | Changes in and Disagreements With Accountants on Accounting and Financial Disclosure | |
106 |
Item 9A | | Controls and Procedures | |
106 |
Item 9B | | Other Information | |
106 |
PART III | |
107 |
Item 10 | | Directors, Executive Officers and Corporate Governance | |
107 |
Item 11 | | Executive Compensation | |
107 |
Item 12 | | Security Ownership of Certain Beneficial Owners and Management and Related
Stockholder Matters | |
107 |
Item 13 | | Certain Relationships and Related Transactions, and Director Independence | |
108 |
Item 14 | | Principal Accountant Fees and Services | |
108 |
PART IV | |
109 |
Item 15 | | Exhibits and Financial Statement Schedules | |
109 |
Table of Contents
FORWARD-LOOKING STATEMENTS
This annual report contains forward-looking statements within the meaning of the federal securities laws. Hospira intends that these forward-looking statements be covered by the safe harbor provisions for forward-looking statements in the federal securities laws. In some cases, these statements can be identified by the use of forward-looking words such as "may," "will," "should," "anticipate," "estimate," "expect," "plan," "believe," "predict," "potential," "project," "intend," "could" or similar expressions. In particular, statements regarding Hospira's plans, strategies, prospects and expectations regarding its business and industry are forward-looking statements. You should be aware that these statements and any other forward-looking statements in this document only reflect Hospira's expectations and are not guarantees of performance. These statements involve risks, uncertainties and assumptions. Many of these risks, uncertainties and assumptions are beyond Hospira's control, and may cause actual results and performance to differ materially from its expectations. Important factors that could cause Hospira's actual results to be materially different from its expectations include (i) the risks and uncertainties described in "Item 1A. Risk Factors" and (ii) the factors described in "Part II, Item 7. Management's Discussion and Analysis of Financial Condition and Results of Operations." Accordingly, you should not place undue reliance on the forward-looking statements contained in this annual report. These forward-looking statements speak only as of the date on which the statements were made. Hospira undertakes no obligation to update or revise publicly any forward-looking statements, whether as a result of new information, future events or otherwise.
PART I
Item 1. Business
Overview
Hospira, Inc. ("Hospira") is a global specialty pharmaceutical and medication delivery company that develops, manufactures and markets products that help improve the safety, cost and productivity of patient care. Hospira's portfolio includes generic acute-care and oncology injectables, as well as integrated infusion therapy and medication management products. Hospira products are used by hospitals and alternate site providers, such as clinics, home healthcare providers and long-term care facilities.
Hospira conducts operations worldwide and is managed in three reportable segments: Americas; Europe, Middle East and Africa ("EMEA"); and Asia Pacific ("APAC"). The Americas segment includes the United States ("U.S."), Canada and Latin America; the EMEA segment includes Europe, the Middle East and Africa; and the APAC segment includes Asia, Japan, Australia and New Zealand. In all segments, Hospira sells a broad line of products, including specialty injectable and other pharmaceuticals and medication management products. For financial information relating to Hospira's segments and principal product lines and other geographic information, see Note 23 to the consolidated financial statements included in Part II, Item 8 of this document, which is incorporated herein by reference. Unless the context requires otherwise, the disclosures in Items 1 and 1A relate to all three reportable segments.
General Development of Business
Hospira was incorporated in Delaware on September 16, 2003, as a wholly owned subsidiary of Abbott Laboratories ("Abbott"). Hospira's business first began operation as part of Abbott in the 1930s. As part of a plan to spin off its core hospital products business ("spin-off"), Abbott transferred the assets and liabilities relating to Hospira's business to Hospira and, on April 30, 2004, distributed Hospira's common stock to Abbott's shareholders. On that date, Hospira began operating as an
1
Table of Contents
independent company, and on May 3, 2004, Hospira's common stock began trading on the New York Stock Exchange under the symbol "HSP."
In March 2009, Hospira announced details of a restructuring and optimization plan ("Project Fuel"), which has been ongoing over the last two years. Project Fuel has included the following activities: optimizing the product portfolio, evaluating non-strategic assets and streamlining the organizational structure. For further information related to Project Fuel, including the financial impact of the project, see the section captioned Project Fuel in "Item 7. Management's Discussion and Analysis of Financial Condition and Results of Operations," which is incorporated herein by reference. In addition to Project Fuel, Hospira is actively working to maintain a culture of continuous improvement as part of its strategy to improve margins and cash flows, reduce operating costs and optimize operations.
In March 2010, Hospira completed its acquisition of the generic injectable pharmaceuticals business of Orchid Chemicals & Pharmaceuticals Ltd. ("Orchid Pharma") for $381.0 million, which was purchased by and operates under the name Hospira Healthcare India Private Limited ("Hospira India"), a wholly-owned subsidiary of Hospira. The acquisition included a beta-lactam antibiotic formulations manufacturing complex and pharmaceutical research and development facility, as well as a generic injectable dosage-form product portfolio and pipeline. Hospira also acquired some of Orchid Pharma's long-term land leases in India, which were held by Orchid Pharma for their anticipated future expansion. To ensure Hospira's manufacturing capacity aligns with expected future commercial growth and demand, Hospira may be taking steps in India over the next few years to prepare for the expansion of Hospira's global manufacturing footprint.
Products
Hospira offers the following types of products and services:
| | |
Product Line | | Description |
|---|
| Specialty Injectable Pharmaceuticals | | • Approximately 200 injectable generic drugs in multiple dosages and formulations |
| | | • Proprietary specialty injectables, including PrecedexTM (dexmedetomidine HCl), a proprietary drug for sedation |
| | | • Biosimilars, including RetacritTM (erythropoietin zeta), a biosimilar erythropoietin, used primarily in the treatment of anemia in dialysis and in certain oncology applications, and NivestimTM , a biosimilar filgrastim used for the treatment of low white blood cells in patients who have received a chemotherapeutic agent |
Other Pharmaceuticals | | • Large volume intravenous ("I.V.") solutions and nutritional products |
| | | • Contract manufacturing services |
Medication Management | | • Infusion pumps and dedicated administration sets |
| | | • Hospira MedNetTM safety software system and related services |
| | | • Software applications and devices that support point-of-care medication administration |
| | | • Gravity administration sets |
| | | • Other device products |
2
Table of Contents
Specialty Injectable Pharmaceuticals
Hospira's specialty injectable pharmaceutical products primarily consist of generic injectable pharmaceuticals. These products provide customers with a lower-cost alternative to branded products, when the patent protection has expired, when patents have been declared invalid, or when the products do not infringe the patents of others. These drugs' therapeutic areas include analgesia, anesthesia, anti-infectives, cardiovascular, oncology, and other areas. All of Hospira's generic injectable pharmaceuticals in the U.S. include unit-of-use bar-code labels that can be used to support safer medication delivery. Hospira primarily procures the active pharmaceutical ingredients in these products from third-party suppliers.
Beginning in 2009 and for the first half of 2010, Hospira's specialty injectable pharmaceutical products included oxaliplatin, a major oncolytic drug used in the treatment of colon cancer. Hospira exited the U.S. oxaliplatin market on June 30, 2010, pursuant to a settlement agreement related to ongoing patent litigation. Hospira intends to re-launch its oxaliplatin products pursuant to a royalty-free license on August 9, 2012. Also during 2010, Hospira continued to broaden its global portfolio with the introduction into new markets of 11 drugs that the company had previously launched in other markets. Hospira launched several new generic injectable pharmaceutical products in the U.S. including a 2 gram freeze-dried powder presentation of gemcitabine (an oncolytic drug used to treat a variety of cancers) and piperacillin/tazobactam for injection (an antibiotic used to treat patients with moderate to severe infections). In the U.S., Hospira also launched meropenem for injection, a beta-lactam anti-infective and the first product to launch in the U.S. that was manufactured by Hospira India. In EMEA, Hospira launched the oncolytic drug, docetaxel, and in APAC, Hospira launched two oncolytic drugs, gemcitabine and irinotecan in certain markets.
Hospira's specialty injectable pharmaceuticals also include biosimilar products, which are large complex molecules derived from cells that are demonstrated to be similar to an approved biologic product. Hospira's first biosimilar, RetacritTM, was originally launched in 2008 and is currently available in 19 EMEA countries. In 2010, Hospira announced the start of a U.S. Phase I clinical trial for RetacritTM in patients with renal dysfunction who have anemia. Also, Hospira launched its second biosimilar, NivestimTM , in Europe in mid-2010. In 2010, NivestimTM received approval for the Australian market by the Australian Therapeutic Goods Administration.
Hospira believes that novel drug delivery formulations and formats are key points of product differentiation for generic injectable pharmaceuticals. Hospira offers a wide variety of drug delivery options, and believes that its products assist its customers' efforts to enhance safety, increase productivity and reduce waste. Hospira's drug delivery formats include standard offerings in ampoules and flip-top vials, which clinicians can use with standard syringes. Hospira's proprietary drug delivery options include CarpujectTM and iSecureTM prefilled syringes, AnsyrTM prefilled needleless emergency syringe systems, First ChoiceTM ready-to-use premixed formulations and the ADD-VantageTM system for preparing drug solutions from prepackaged drug powders or concentrates.
Hospira's specialty injectable pharmaceutical products also include PrecedexTM (dexmedetomidine HCl), a proprietary sedative. PrecedexTM is licensed to Hospira in the Americas and APAC segments, and in the Middle East and Africa. Hospira sells and markets PrecedexTM for use in non-intubated patients requiring sedation, as well as intubated and mechanically ventilated patients. During 2010, Hospira received approval for the long-term use of PrecedexTM in Japan.
During 2010, Hospira completed its acquisition of Javelin Pharmaceuticals Inc. ("Javelin Pharma"). The acquisition will enable Hospira to take advantage of synergies between Hospira's PrecedexTM and Javelin Pharma's main product candidate, DylojectTM, a post-operative pain management drug currently awaiting U.S. Food and Drug Administration ("FDA") approval. In October 2010, Hospira received a
3
Table of Contents
complete response letter from the FDA regarding DylojectTM and Hospira is working to respond to the letter. Hospira and its third party manufacturer continue to work closely with FDA to address any items raised as part of the regulatory process and the timing of resolution is uncertain.
During 2010, Hospira also entered into two collaborative agreements. Hospira entered into a licensing agreement with DURECT Corporation to develop and market DURECT's POSIDURTM, a long-acting version of the anesthetic bupivacaine currently in Phase III clinical trials. Hospira will co-develop the drug and will have exclusive marketing rights in the U.S. and Canada following regulatory approval. Hospira and Kiadis Pharma B.V. ("Kiadis") entered into a collaborative agreement to develop, license, and commercialize Kiadis' ATIRTM drug candidate. ATIRTM is a personalized hematology product designed for blood cancer patients in need of allogeneic bone marrow transplantation who cannot locate a matched donor. The product is designed to enable any family member to act as a donor and is being developed to reduce transplant related mortality caused by infections and graft-versus-host disease. Hospira was granted exclusive marketing rights to ATIRTM for Europe, the Middle East, Africa, Australia, Japan and parts of Asia. Hospira will be responsible for regulatory approval and sales and marketing of the product.
Other Pharmaceuticals
Hospira's other pharmaceuticals primarily consist of large volume I.V. solutions, nutritionals and contract manufacturing services.
Hospira offers infusion therapy solutions and related supplies that include I.V. solutions for general use, I.V. nutrition products, and solutions for the washing and cleansing of wounds or surgical sites. All of Hospira's injectable I.V. solutions in the U.S. include unit-of-use bar-code labels that can be used to support medication management efforts. Hospira also offers infusion therapy solutions in its VisIVTM next-generation non-PVC, non-DEHP I.V. container, an I.V. bag with advanced safety and environmentally friendly features.
Hospira's One2One services group provides formulation development, filling and finishing of injectable and oral drugs worldwide. Hospira works with its proprietary pharmaceutical and biotechnology customers to develop stable injectable forms of their drugs, and Hospira fills and finishes those and other drugs into containers and packaging selected by the customer. The customer then sells the finished products under its own label. Hospira's One2One manufacturing services group does not generally manufacture active pharmaceutical ingredients, but offers a wide range of filling and finishing services in a variety of delivery systems. As part of Project Fuel, in 2009 and early 2010, Hospira sold its facilities in Salisbury, Australia, and Wasserburg, Germany, respectively, which primarily performed contract manufacturing.
Medication Management
Medication management includes electronic drug delivery pumps, safety software and disposable administration sets dedicated to Hospira pumps. These sets are used to deliver I.V. fluids and medications. Hospira also offers software maintenance agreements and other service offerings. Hospira estimates that approximately 575,000 of its electronic drug delivery pumps were in use on a global basis as of December 31, 2010. Hospira's electronic drug delivery pumps include Hospira's general infusion system, SymbiqTM; the Plum A+TM line of infusion pumps; Hospira's patient-controlled analgesia device, LifeCare PCATM; the GemStarTM ambulatory infusion pump; and the PlumTM XLD infusion pump.
Hospira believes that electronic drug delivery pumps with enhanced systems capabilities have become a key contributor in efforts to improve medication management programs and reduce the
4
Table of Contents
incidence of medication errors. Some of Hospira's pumps use bar coding to read drug labels that are compatible with other Hospira products, reducing the opportunity for drug infusion errors. Hospira offers the Hospira MedNetTM safety software system, which has been designed to enable hospitals to customize intravenous drug dosage limits and track drug delivery to prevent medication errors. Through its drug library and programmable drug dosage limits, the system can help ensure that medication is infused within hospital-defined dose guidelines and best practices. The wireless network version of the Hospira MedNetTM system establishes real-time send-and-receive capability and can interface with select hospital and pharmacy information systems. Hospira continues to work with hospital information technology companies to integrate the Hospira MedNetTM system with other systems.
The Hospira MedNetTM system is standard in the SymbiqTM infusion system, and is also available as an additional feature for the Plum A+TM line, and LifeCare PCATM devices, which, when aggregated represent the majority of Hospira's line of electronic drug delivery pumps. Hospira also offers safety software with its GemStarTM pump.
Medication management includes TheraDoc, Inc. and its Infection Control AssistantTM and Antibiotic AssistantTM products, which are software applications that automate hospital-wide surveillance for infection-related events and optimize the utilization of antimicrobials. In 2010, Hospira introduced the Anticoagulation AssistantTM knowledge module, which helps reduce the risk of adverse events associated with anticoagulation therapy.
Medication management also includes gravity administration sets and other device products, including needlestick safety products and programs to support Hospira's customers' needlestick prevention initiatives. LifeShieldTM, CLAVETM and MicroCLAVETM connectors are one-piece valves that directly connect syringes filled with medications to a patient's I.V. line without the use of needles. ICU Medical's CLAVETM connectors are a component of administration sets sold by Hospira to its customers in the U.S. and select markets outside the U.S.
Sales, Customers and Distribution
Sales. Net sales (gross sales less reductions for wholesaler chargebacks, rebates, returns and other allowances) in the Americas segment accounted for approximately 80% of Hospira's 2010 net sales. Net sales in the EMEA and APAC segments comprised approximately 12% and 8%, respectively, of 2010 net sales. Hospira's sales organizations include sales professionals who sell across its major product lines, as well as product specialists who promote its medication management products, or who market and sell PrecedexTM and select other products. Hospira also has extensive experience contracting with, marketing to and servicing members of the major group purchasing organizations ("GPOs") in the U.S.
Customers. Hospira's primary customers in the Americas segment include hospitals, wholesalers, integrated delivery networks ("IDN") and alternate site facilities. In the U.S., a substantial portion of Hospira's product is sold to GPO member hospitals and through wholesalers and distributors. Net sales through the largest four wholesalers that supply products to many end-users accounted for approximately 40% of global net sales during 2010. As end-users have multiple ways to access Hospira's products, including through more than one wholesaler or distributor, and, in some cases, from Hospira directly, Hospira believes that it is not dependent on any single wholesaler or distributor for distribution of its products. Hospira has no single end-use customer that accounts for more than 10% of net sales. Hospira has pricing agreements for specified products with the major GPOs in the U.S., including Amerinet, Inc.; HealthTrust Purchasing Group LP; MedAssets, Inc.; Novation, LLC; PACT, LLC; and Premier Purchasing Partners, LP. The scope of products included in these agreements varies by GPO.
5
Table of Contents
Hospira's primary customers in the EMEA and APAC segments are hospitals and wholesalers that Hospira serves through its own sales force and its distributors. The majority of Hospira's business in the EMEA and APAC segments is conducted through contracting with individual hospitals or through regional or national tenders whereby Hospira submits bids to sell its products.
Distribution. In the Americas segment, Hospira's products are primarily distributed in the U.S. through a network of company-operated distribution facilities and public warehouses, as well as through external distributors. The U.S. distribution facilities Hospira operates are located in Atlanta, Georgia; Dallas, Texas; King of Prussia, Pennsylvania; Los Angeles, California; and Pleasant Prairie, Wisconsin. For the remainder of the Americas segment outside the U.S., Hospira utilizes third-party logistics providers, including operations in Toronto, Canada, and several smaller warehouses in Canada and Latin America.
In the EMEA and APAC segments, Hospira manages its distribution operations mainly through third-party logistics providers. Hospira's regional headquarters are located in Royal Leamington Spa, United Kingdom, for EMEA and Melbourne, Australia, for APAC. Hospira has direct commercial infrastructure in some countries and operates through distributors in others.
Seasonal Aspects, Backlog and Renegotiation
There are no significant seasonal aspects to Hospira's consolidated net sales. Hospira believes that backlogged orders do not represent a material portion of its sales or provide a meaningful indication of future sales. During 2010, Hospira experienced an increase in backlogs due to supply constraints which decreased by year-end. No material portion of Hospira's business is subject to renegotiation of profits or termination of contracts at the election of the government.
Product Development and Manufacturing
Hospira's product development programs are concentrated in the areas of specialty injectable pharmaceuticals and medication management. Hospira's research and development expenses were $300.5 million in 2010, $240.5 million in 2009, and $211.9 million in 2008. Hospira also maintains an active development program to support its injectable pharmaceutical contract manufacturing relationships. Hospira engages in programs to bring new products to market that are unique or that enhance the effectiveness, ease of use, productivity, safety or reliability of existing product lines. Hospira also engages in programs to expand the use of products in new markets or new applications. Hospira operates significant product development facilities in Lake Forest, Illinois; McPherson, Kansas; San Diego, California; Mulgrave, Victoria, Australia; Adelaide, South Australia, Australia; and Irungattukottai, India.
In Hospira's specialty injectable pharmaceuticals product line, Hospira is actively working to develop small molecule compounds. For certain of these compounds, Hospira is actively pursuing a strategy of challenging the intellectual property of proprietary pharmaceutical companies in an effort to be the first generic company to the market. Hospira is also actively working to develop and commercialize biosimilars. For a discussion of Hospira's developments in 2010 related to biosimilars, see the discussion of Hospira's products under "Item 1. Business." In 2009, Hospira acquired worldwide rights to the biosimilar version of filgrastim and a biologic manufacturing facility from PLIVA Hrvatska d.o.o. This is in alignment with Hospira's biosimilars strategy, which is to expand its biosimilars portfolio and capabilities with measured investment and risk. In 2008, Hospira entered into a process development and bulk drug manufacturing relationship with Human Genome Sciences ("HGS") for biosimilar products for the U.S. market. In 2009, Hospira entered into an agreement with Celltrion, Inc. and Celltrion Healthcare, Inc. to develop and market eight biosimilar molecules, five of
6
Table of Contents
which are new to Hospira's biosimilar portfolio. Hospira's biosimilar pipeline has 11 biosimilar products.
Hospira continues to invest in PrecedexTM for expansion of clinical use and has selectively invested in various other proprietary systems and molecules that align with its business strategy. In 2009, Hospira and ChemGenex Pharmaceuticals Limited ("ChemGenex") entered into a collaborative agreement to develop, license, and commercialize a ChemGenex proprietary oncology product candidate in EMEA. In 2010, Hospira acquired Javelin Pharma and entered into a licensing agreement with DURECT Corporation to develop and market DURECT's POSIDURTM. For further information related to those developments, see the discussion of Hospira's products under "Item 1. Business."
Hospira's key programs in the area of medication management products include the development of advanced infusion platforms and systems, including its Hospira MedNetTM safety software system, and systems that emphasize ease of use for clinicians, including its SymbiqTM infusion pump. Hospira has entered into alliances with several leading information technology companies to develop interfaces that enable the Hospira MedNetTM system to be used with a variety of hospital information systems and to improve cost efficiencies in patient management. Hospira expects to continue entering into strategic alliances as part of its "open architecture system" strategy for the Hospira MedNetTM system.
As of December 31, 2010, Hospira operated 12 manufacturing facilities globally. Hospira's principal manufacturing facilities are identified in Item 2 of this report. Hospira's largest facilities, located in Rocky Mount, North Carolina; Austin, Texas; LaAurora, Costa Rica; McPherson, Kansas; and Mulgrave, Victoria, Australia, account for a significant portion of Hospira's manufacturing output. Hospira's manufacturing facility in Irungattukottai, India and its joint venture manufacturing facility near Ahmedabad, India may also be significant manufacturing facilities for Hospira in 2011. During 2010, Hospira temporarily shut down certain of its production lines to respond to certain quality issues cited in a 2010 warning letter as described in "Quality Assurance" in Item 1. If Hospira experiences any further significant interruption of manufacturing at any of the foregoing facilities, such an interruption could materially and adversely affect Hospira's ability to manufacture and sell its products.
Hospira has a joint venture with Cadila Healthcare Limited, an Indian domestic pharmaceutical company located in Ahmedabad, India. The joint venture, Zydus Hospira Oncology Pvt. Ltd. ("ZHOPL"), operates a manufacturing facility in a special economic zone outside of Ahmedabad, India, that has been inspected and approved by the United Kingdom's Medicines and Healthcare Products Regulatory Agency and the FDA. Since 2009, the facility has been manufacturing a number of cytotoxic drugs for sale by both Cadila and Hospira in their respective exclusive territories in the United States, Europe and other countries. In addition, in 2010 and 2011, Hospira has entered into separate and independent contract manufacturing agreements with ZHOPL for the production of numerous other cytotoxic drugs that Hospira will sell under its own label throughout the world.
Raw Materials and Components
While Hospira produces some materials, components and active pharmaceutical ingredients at its manufacturing sites, the majority are sourced on a global basis from third-party suppliers.
Although many of the materials and components Hospira uses to produce its products are readily available from multiple suppliers, Hospira relies on supply from a single source for many raw materials and components. For example, Hospira relies on certain proprietary components available exclusively from ICU Medical. ICU Medical's CLAVETM and MicroCLAVETM connector products are components of administration sets that represented approximately 15% of Hospira's 2010 U.S. net sales. In addition, Hospira purchases some of its other raw materials, components and active pharmaceutical ingredients
7
Table of Contents
from single suppliers for reasons of quality assurance, sole-source availability, cost effectiveness or constraints resulting from regulatory requirements.
To manage risk, Hospira works closely with its suppliers to ensure continuity of supply. In addition, Hospira attempts to diversify its sources of materials and continually evaluates alternate-source suppliers. In certain circumstances, it may pursue regulatory qualification of alternative sources, depending upon the strength of its existing supplier relationships, the reliability of its current supplier base, and the time and expense associated with the regulatory process. A change in suppliers could require significant effort or investment by Hospira in circumstances where the items supplied are integral to the performance of its products or incorporate unique technology. The loss of certain supply arrangements, including certain arrangements for active pharmaceutical ingredients, certain commodities, and the CLAVETM supply arrangement with ICU Medical (which continues through 2014) would have a material adverse effect on its business.
Quality Assurance
Hospira has developed and implemented quality systems and concepts throughout its organization. Hospira is actively involved in setting quality policies and managing internal and external quality performance. Its quality assurance department provides quality leadership and supervises its quality systems. An active audit program, utilizing both internal and external auditors, monitors compliance with applicable regulations, standards and internal policies. In addition, Hospira's facilities are subject to periodic inspection by the FDA and other regulatory authorities. Hospira has received notices from regulatory authorities alleging violations of applicable regulations and standards, and Hospira has developed definitive action plans, implemented remedial programs and modified its practices to address these issues.
During 2009, Hospira received a warning letter from the FDA related to Hospira's corrective action plans with respect to the failure of certain AC power cords manufactured by a third party. The recall was limited to device power cords with a certain prong design that could crack and fail at/or inside the plug. In October 2010, the FDA notified Hospira that it appeared that Hospira had addressed the warning letter deficiencies and that future FDA inspections would further assess the adequacy and sustainability of these corrections. In December 2010, the FDA notified Hospira that the AC power cord recall activities were completed and the FDA considered the recall terminated.
During 2010, Hospira received a warning letter from the FDA in connection with the FDA's inspection of Hospira's pharmaceutical and device manufacturing facilities located in Rocky Mount, North Carolina, and Clayton, North Carolina (the "2010 warning letter"). In the warning letter, the FDA cites current good manufacturing practice deficiencies related to particulate in certain emulsion products at the Clayton facility and the failure to adequately validate the processes used to manufacture products at the Rocky Mount facility. The warning letter also asserts other inadequacies, including procedures related to the Quality Control unit, investigations, and medical reporting obligations. The warning letter asserts that some of the deficiencies were repeat observations from a prior inspection conducted in April 2009, and include a similar violation cited in the August 2009 warning letter related to the AC power cords. The FDA did not believe that Hospira had identified the root cause(s) of the problems and had adequately resolved them. The warning letter also questioned whether Hospira's interim plans ensured the quality of products that were manufactured at the facilities while implementing the corrective actions and validation activities. Hospira has made significant progress on completing a comprehensive review of its manufacturing operations to ensure compliance with applicable regulations. In January 2011, the FDA completed an inspection of the Clayton facility with no observations noted by the inspector.
8
Table of Contents
Nothing in either the October or December 2010 letters precludes any future regulatory action by the FDA should violations be observed in subsequent inspections or through other means, and these letters do not relieve Hospira from the responsibility to assure compliance with the Food, Drug and Cosmetic Act in the future. The FDA's warning letters are publicly available on the FDA's Web site. Hospira has responded to the 2010 warning letter and is working closely with the FDA to conclude this matter.
In April 2010, Hospira placed a voluntary hold on all shipments to new customers of SymbiqTM, a large volume infusion device. Hospira initiated this hold after it received an unexplained increase in customer complaints related to the failure of the SymbiqTM to alarm at the end of infusion therapy under certain use conditions. In June 2010, Hospira notified customers on interim steps to be taken by customers to mitigate this issue and to avoid the use conditions that can lead to the failure of the SymbiqTM to alarm at the end of infusion therapy. In August 2010, Hospira initiated a set recall related to the issue. Additionally, Hospira notified customers of reports of unrestricted flow when the SymbiqTM infusion set cassette is improperly removed from the pump before the pump's cassette door is fully opened. Hospira cautioned customers to allow the pump's cassette door to fully open before removing the infusion set as the pump may not alarm when the infusion set is improperly removed. The FDA has classified each of these actions as a Class I recall and Hospira is working closely with the FDA to conclude these matters. Further, Hospira is developing a solution to improve the performance of the pump and the issues therewith. Hospira has not asked customers to return or cease using their SymbiqTM pumps.
In December 2010, Hospira informed the FDA that Hospira had received a small number of customer reports associated with the PlumTM pumps regarding failure of the pump's audible alarm under certain conditions. Hospira has provided notice to customers notifying them of the corrective action plan. For the Plum A+TM pumps, the alarm failures are associated with the alarm assembly which will need to be replaced. For the Plum XLTM pumps, the alarm failure is associated with fluid ingress and physical damage to the alarm assembly over time. Plum XLTM customers are being asked to follow the proper cleaning procedure and inspect the alarm assembly for physical damage during routine maintenance. This action is classified as a field recall and FDA is not requiring Hospira to remove PlumTM pumps from the market or halt production.
For further discussion of these other remedial actions, Hospira's responses to the warning letters, and the resulting financial impact, see the section captioned "Certain Quality and Product Related Matters" in "Item 7. Management's Discussion and Analysis of Financial Condition and Results of Operations."
Competition
Hospira's industry is highly competitive. Hospira believes that the most effective competitors in its industry are those focused on product quality and performance, breadth of product offering, and manufacturing efficiency as well as the ability to develop and deliver cost-effective products that help hospitals improve the safety of patient care, reduce medication errors and provide high quality care. These are increasingly important factors in a healthcare environment that requires increasing levels of efficiency and productivity.
Hospira's most significant competitors in pharmaceuticals include Baxter International Inc. ("Baxter"), Bedford Laboratories (a division of Boehringer Ingelheim), Fresenius Medical Care AG, Sandoz, Teva Pharmaceuticals ("Teva"), as well as divisions of several multinational pharmaceutical companies. Local manufacturers of pharmaceuticals also compete with Hospira on a country-by-country basis. Hospira's most significant competitors in medication management include Baxter, B. Braun Melsungen AG, CareFusion and Fresenius Medical Care AG. Hospira believes that it is one of the
9
Table of Contents
leading competitors, in terms of U.S. market share, in each of its major product lines, and believes that its size, scale, customer relationships and breadth of product line are significant contributors to its market positions. Hospira believes that to further its competitive position it must continue to invest significantly in, and successfully execute, its research and product development activities, and optimize its manufacturing efficiency and productivity. Particularly, for its pharmaceutical products, Hospira seeks to maximize its opportunity to establish a "first-to-market" position for its generic injectable drugs, and for its medication management products, Hospira seeks to differentiate its products through technological innovation and an integrated approach to drug delivery. These efforts will depend heavily on the success of Hospira's research and development programs.
In the EMEA segment, competitors include Teva, Sandoz, Actavis, Fresenius Kabi, Mylan Inc., Stada Arzneimittel AG, and Baxter. The use of generic pharmaceuticals is subject to variations in the structure of health care systems (including purchasing practices) and government policies regarding the use of generic products and pricing, which all lead to differing levels of customer acceptance. There are different policies and levels of generic penetration in each country in EMEA, causing the competition for generic pharmaceuticals to differ widely. In EMEA, competitors tend to vary by country and are often smaller in scale than those in the U.S., although some consolidation and geographic expansion is now occurring. Teva is the largest company that competes with Hospira in the generic oncology market across Europe. Hospira's other key competitors vary from country to country.
The use of generic pharmaceuticals in the APAC segment is subject to variations in government policies and public perception. In Australia, generic penetration is moderate and growing primarily due to changes in government support. Competitors include Sandoz and Teva, a number of smaller competitors and the innovator companies. In Asia, Hospira sells its products primarily to hospitals. Hospira's competition in Asia tends to be with the originator companies and multinational companies such as Teva and Actavis. In Japan, the market share of generic pharmaceutical products traditionally has been low because of quality perceptions, product format and other regulatory differences in comparison to other markets. The Japanese government is actively pursuing a program to double generic usage. Laws in Japan have been introduced to allow for easier substitution of generics for branded pharmaceuticals and to change financial incentives for hospitals and clinics to use generics, in a government sponsored effort to reduce costs, which is believed to have resulted in an increased acceptance of generic pharmaceutical products.
Patents, Trademarks and Other Intellectual Property
When possible, Hospira seeks patent and trademark protection for its products. Hospira owns, or has licenses under, a substantial number of patents, patent applications, trademarks and trademark applications. Principal products and their related trademarks are discussed in "Item 1. General Development of Business." Hospira believes that no single patent, trademark, or related group of patents or trademarks are material in relation to Hospira's business as a whole. Hospira is in patent litigation concerning its proprietary product, PrecedexTM. The patents at issue in that litigation are detailed in "Item 3. Legal Proceedings." While this drug is not material to Hospira's business as a whole or its segments, it is significant to Hospira's specialty injectable pharmaceutical product line. PrecedexTM is licensed to Hospira in the Americas and APAC segments, and in the Middle East and Africa.
Employees
As of December 31, 2010, Hospira had approximately 14,000 employees. Hospira believes that it generally has a good relationship with its employees and the works councils and unions that represent certain employees.
10
Table of Contents
Governmental Regulation and Other Matters
Hospira's operations and business activities are subject to extensive legal and regulatory requirements that are enforced by numerous governmental agencies in the countries in which it does business. If it were determined that Hospira was not in compliance with these laws and regulations, Hospira could be subject to criminal and/or civil liability and other material adverse effects. Hospira has compliance programs in place to ensure compliance with these laws and believes that it is in compliance in all material respects with applicable laws and regulations, including those described below.
Drug and Medical Device Laws
Most of Hospira's products and facilities and those of Hospira's suppliers are subject to drug and medical device laws and regulations promulgated by the FDA and national and supranational regulatory authorities outside the U.S., including Health Canada's Health Products and Foods Branch, the U.K.'s Medicines and Healthcare Products Regulatory Agency, the European Medicines Agency for the Evaluation of Medicinal Products for Human Use and Australia's Therapeutic Goods Agency. These authorities regulate a range of activities including, among other matters, manufacturing, post-marketing studies in humans, advertising and promotion, product labeling, post-marketing surveillance and reporting of adverse events.
All aspects of Hospira's manufacturing and distribution of regulated products and those of Hospira's suppliers are subject to substantial governmental oversight. Facilities used for the production, packaging, labeling, storage and distribution of drugs and medical devices must be registered with the FDA and other regulatory authorities. All manufacturing activities for these products must be conducted in compliance with current good manufacturing practices. Hospira's manufacturing facilities and those of Hospira's suppliers are subject to periodic, routine and for-cause inspections to verify compliance with current good manufacturing practices. New manufacturing facilities or the expansion of existing facilities require inspection and approval by the FDA and other regulatory authorities before products produced at that site can enter commercial distribution. If, upon inspection, the FDA or another regulatory agency finds that a manufacturer has failed to comply with current good manufacturing practices, it may take various enforcement actions, including, but not limited to, issuing a warning letter or similar correspondence, mandating a product recall, seizing violative product, imposing civil penalties, and referring the matter to a law enforcement authority for criminal prosecution. These actions could result in, among other things, substantial modifications to Hospira's business practices and operations; a total or partial shutdown of production in one or more of Hospira's facilities while Hospira or Hospira's suppliers remedy the alleged violation; the inability to obtain future pre-market clearances or approvals; and withdrawals or suspensions of current products from the market. Any of these events could disrupt Hospira's business and have a material adverse effect on Hospira's revenues, profitability and financial condition. For information related to the 2009 and 2010 warning letters received by Hospira and other voluntary recalls and corrective actions in 2009 and 2010, see the sections captioned "Quality Assurance" above, and "Certain Quality and Product Related Matters" in "Item 7. Management's Discussion and Analysis of Financial Condition and Results of Operations."
Hospira continues to make improvements to our products to further reduce patient safety issues. Based upon our consultations with the FDA and other regulatory authorities, these improvements may require Hospira to initiate recalls or corrective actions if the improvement reduces the health risk posed by the product and not making the improvements to the on-market product is deemed a patient safety issue. See discussion regarding corrective actions to Hospira's pumps under the section captioned "Certain Quality and Product Related Matters" in "Item 7. Management's Discussion and Analysis of Financial Condition and Results of Operations."
11
Table of Contents
Hospira's sales and marketing activities for its products, particularly its prescription drugs and medical devices, are also highly regulated. Regulatory authorities have the power to mandate the discontinuation of promotional materials, practices and programs that include information beyond the scope of the indications in the approved or cleared labeling or that are not in compliance with specific regulatory requirements.
Some of Hospira's drug products are considered controlled substances and are subject to additional regulation by the U.S. Drug Enforcement Administration ("DEA") and various state and international authorities. These drugs, which have varying degrees of potential for abuse, require specialized controls for production, storage and distribution to prevent theft and diversion.
Hospira continues investing in the development of generic and/or similar versions of currently marketed biopharmaceuticals. Since 2005, the European Medicines Agency has implemented guidelines which provided a pathway for the approval of certain biosimilars in the European Union. In 2010, the "Patient Protection and Affordable Care Act" ("PPACA") was passed and signed into law in the U.S. This legislation includes new authorization for the FDA to approve companies to market these products in the U.S. In addition, other provisions, such as the medical device excise tax of the PPACA, will also have an impact on Hospira in the future.
Healthcare Fraud and Abuse Laws
As a manufacturer and distributor of prescription drugs and medical products to hospitals and other healthcare providers, Hospira and its customers are subject to laws which apply to Medicare, Medicaid, and other federal and state healthcare programs in the U.S. One such law, the Anti-kickback Statute, prohibits the solicitation, offer, payment or receipt of remuneration in return for referral or purchase, or in return for the recommending or arranging for the referral or purchase, of products covered by the programs. The Anti-kickback Statute provides a number of exceptions or "safe harbors" for particular types of transactions. While Hospira generally does not file claims for reimbursement from government payors, the U.S. federal government has asserted theories of liability against manufacturers under the Federal False Claims Act, which prohibits the submission of false claims to Medicare, Medicaid, and other state and federal programs. Many states have similar fraud and abuse laws which apply to Hospira.
Anti-bribery Laws
Hospira's global activities are subject to the U.S. Foreign Corrupt Practices Act ("U.S. FCPA") and other countries' anti-bribery laws that have been enacted in support of the Organization for Economic Cooperation and Development's Anti-bribery Convention. These laws prohibit companies and individuals from offering or providing anything of value to government officials with the intent of inappropriately gaining a business advantage. They also require companies to maintain accurate books and records and internal financial controls. A new anti-bribery law that will become effective in April 2011 is the U.K. Bribery Act of 2010. In addition to prohibitions similar to the U.S. FCPA, this law also prohibits commercial bribery and makes it a crime for a company to fail to prevent bribery. Companies have the burden of proving that they have adequate procedures in place to prevent bribery. The enforcement of such laws in the U.S. and elsewhere has increased dramatically in the past few years, and authorities have indicated that the pharmaceutical and medical device industry will be a significant focus for enforcement efforts. Hospira has a compliance program in place to ensure compliance with these laws by its employees and agents and to communicate its expectations of compliance to third parties, including its distributors.
Environmental Laws
Hospira's manufacturing operations are subject to many requirements under environmental laws. In the U.S., the Environmental Protection Agency and similar state agencies administer laws which
12
Table of Contents
restrict the emission of pollutants into the air, the discharge of pollutants into bodies of water and the disposal of hazardous substances. The failure to obtain a permit for certain activities may be a violation of environmental laws. Most environmental agencies also have the power to shut down an operation if it is operating in violation of environmental laws. U.S. laws also allow citizens to bring private enforcement actions in some situations. Outside the U.S., the environmental laws and their enforcement vary, and can be more burdensome. For example, in some European countries, there are environmental taxes and laws requiring manufacturers to take back used products at the end of their useful life. This does not currently have a significant impact on Hospira's products, but such laws are expanding rapidly in Europe. Hospira has management systems in place that are intended to minimize the potential for violation of these laws.
Other environmental laws address the contamination of land and groundwater, and require the clean-up of such contamination. Hospira has been involved with a number of sites at which clean-up has been required, some as the sole owner and responsible party, and some as a contributor in conjunction with other parties. Hospira believes that environmental compliance has not had, and will not have, a material adverse effect on our operations, results or competitive position.
Safety and Health Laws
In the U.S., the Occupational Safety and Health Act sets forth requirements for conditions of the workplace. Hospira's operations are subject to many of these requirements, particularly in connection with Hospira's employees' use of equipment and chemicals at manufacturing sites that pose a potential health or safety hazard.
Transportation Laws
Hospira's operations include transporting materials defined as "hazardous" over land, sea and through the air. All of these activities are regulated under laws administered by the U.S. Department of Transportation and similar agencies outside the U.S. They include complex requirements for packing, labeling and recordkeeping.
Customs, Export and Anti-boycott Laws
The import and export of products, technology, equipment and other business materials across national borders are subject to regulation by U.S. agencies, including the U.S. Customs and Border Protection, the Bureau of Industry and Security, Department of Commerce and the Office of Foreign Assets Control—Treasury Department, as well as other national and supranational regulatory authorities. As the importer and exporter of products and technologies, Hospira must comply with all applicable customs, export and anti-boycott laws and regulations and must pay fees and duties on certain shipments.
State Laws
There are numerous legal and regulatory requirements imposed by individual states in the U.S. on pharmaceutical and medical device companies doing business in those states. For example, several states and the District of Columbia either require the tracking and reporting of specific types of interactions which pharmaceutical and medical device companies have with healthcare professionals or restrict such interactions. A similar requirement arose under the PPACA to track spending on physicians and teaching institutions, beginning on January 1, 2012. The 2012 data will be reportable to an agency of the federal government in 2013. This reporting requirement is expected to preempt some but not all of the state disclosure requirements.
13
Table of Contents
Other Laws
Hospira is also subject to a variety of other laws, directives and regulations in and outside of the U.S., including income, value added and excise taxes. Hospira stays abreast of, and plans for, proposed legislation that could significantly affect our operations.
Available Information
Copies of Hospira's Annual Report on Form 10-K, Quarterly Reports on Form 10-Q, Current Reports on Form 8-K, and amendments to those reports filed or furnished pursuant to Section 13(a) or 15(d) of the Securities Exchange Act of 1934, are available free of charge through the Investor Relations section of Hospira's Web site (www.hospira.com) as soon as reasonably practicable after Hospira electronically files or furnishes such material to the Securities and Exchange Commission ("SEC").
Hospira's corporate governance guidelines, code of business conduct and the charters of its audit, compensation, governance and public policy, and science, technology and quality committees are all available in the Investor Relations section of Hospira's Web site (www.hospira.com) or by sending a request to: Corporate Governance Materials Request, Hospira General Counsel and Secretary, Hospira, Inc., 275 North Field Drive, Dept. NLEG, Bldg. H1, Lake Forest, Illinois 60045.
Hospira also routinely posts important information for investors on its Web site (www.hospira.com) in its Investor Relations section. Hospira may use this Web site as a means of disclosing material, non-public information and for complying with its disclosure obligations under SEC Regulation FD. Accordingly, investors should monitor the Investor Relations portion of Hospira's Web site, in addition to following Hospira's press releases, SEC filings, and public conference calls and webcasts.
Information contained on Hospira's Web site shall not be deemed incorporated into, or to be a part of, this Annual Report on Form 10-K.
Item 1A. Risk Factors
Hospira's business, financial condition, results of operations and cash flows are subject to various risks and uncertainties, including those described below. These risks and uncertainties may cause (1) Hospira's sales and results of operations to fluctuate significantly; (2) Hospira's past performance to not be indicative of future performance; and (3) Hospira's actual performance to differ materially from Hospira's expectations or projections. The risks described below may not be the only risks Hospira faces. Additional risks that Hospira does not yet know of or that Hospira currently thinks are immaterial may also impair its business operations. This Form 10-K also contains forward-looking statements that involve risks and uncertainties. Hospira's results could materially differ from those anticipated in these forward-looking statements as a result of certain factors, including the risks described below. See the section captioned "Forward-Looking Statements."
Hospira faces significant competition and may not be able to compete effectively.
The healthcare industry is highly competitive. Hospira competes with many companies that range from small, highly focused companies to large diversified healthcare manufacturers that have access to greater financial, marketing, technical and other resources. There has been consolidation by Hospira's competitors and customer base, which has resulted in pricing and sales pressures, causing competition to become more intense. Hospira's present or future products could be rendered obsolete or uneconomical by technological advances by competitors or by the introduction of competing products by one or more of its competitors. To remain competitive and bolster its competitive position, Hospira believes that it must successfully execute various strategic plans, including expanding its research and development initiatives and productivity, lowering its operating costs, and improving its business processes. These initiatives may result in significant expenditures and ultimately may not be successful. Hospira's failure to compete effectively could cause it to lose market share to its competitors and have a material adverse effect on its sales and profitability.
14
Table of Contents
If Hospira does not successfully introduce new products in a timely manner, its sales and operating results may decline.
A key component to Hospira's strategy is effective execution of its research and development activities. Without the timely introduction of new products and enhancements, Hospira's products may become obsolete over time, causing its sales and operating results to suffer. If Hospira does not continue to develop generic injectable pharmaceuticals in a timely manner, its competitors may develop products that are more competitive than Hospira's, and Hospira could find it more difficult to renew or expand GPO pricing agreements or to obtain new agreements. The ability to launch a generic pharmaceutical product at or before generic market formation is important to that product's profitability. Prices for generic products typically decline, sometimes dramatically, following market formation, as additional companies receive approvals to market that product and competition intensifies. If a company can be "first to market," such that the branded drug is the only other competition for a period of time, higher levels of sales and profitability can be achieved. With increasing competition in the generic product market, the timeliness with which Hospira can market new generic products will increase in importance. If Hospira is unable to bring its generic products to market on a timely basis, and secure "first to market" positions, its sales and profitability could be adversely impacted.
Hospira is also actively working to develop and commercialize biosimilar products. Hospira has entered into several agreements described under "Product Development and Manufacturing" related to expanding its biosimilars portfolio and capabilities. The success of our biosimilars activities depends on several factors, including among other factors, the adoption of certain laws and regulations, ability to obtain regulatory approvals, and the success of the arrangements with third parties. These activities will require a substantial investment of the company's resources, which may not result in commercially successful products.
In 2010, the Patient Protection Affordable Care Act was passed and signed into law in the U.S. This legislation includes new authorization to the FDA to approve companies to market biosimilar products in the U.S. The regulations under this law have not been developed yet. Those regulations may delay or prevent generic drug producers such as Hospira from offering certain products, such as biosimilar products in key territories, which could harm Hospira's ability to grow its business. Hospira may not be able to generate future sales of such products in certain jurisdictions and may not realize the anticipated benefits of its investments in the development, manufacture and sale of such products. Delays in receipt of, or failure to obtain, approvals for product candidates could result in delayed realization of product revenues and in substantial additional costs.
Hospira faces similar risks if it does not introduce new versions or upgrades to its medication management portfolio. Innovations generally require a substantial investment in product development before Hospira can determine their commercial viability, and Hospira may not have the financial resources necessary to fund these innovations. Even if Hospira succeeds in creating new product candidates from these innovations, such innovations may still fail to result in commercially successful products.
The success of new product offerings will depend on several factors, including Hospira's ability to properly anticipate customer needs, obtain timely regulatory approvals, and manufacture quality products in an economic and timely manner. Even if Hospira is able to successfully develop new products or enhancements, they may not produce sales equal to or greater than the costs of development or may not avoid infringing the proprietary rights of third parties. They may be quickly rendered obsolete by changing customer preferences or the introduction by competitors of products embodying new technologies or features. Moreover, innovations may not become successful because of difficulties encountered in achieving positive clinical outcomes, meeting safety, efficacy or other regulatory requirements of government agencies, or obtaining favorable pricing on such products.
15
Table of Contents
Finally, innovations may not be accepted quickly in the marketplace because of, among other things, entrenched patterns of clinical practice, and uncertainty over third-party reimbursement.
Failure to effectively manage efforts or to realize the benefits under product collaboration agreements may harm Hospira's business and profitability.
Hospira collaborates with other companies for the development, regulatory approval, manufacturing and marketing of new products in both the specialty injectable pharmaceutical and medication management product lines. Hospira has entered into collaboration agreements relating to the long-term development and commercialization of proprietary and biosimilar products, which Hospira views as an important long-term opportunity for its specialty injectable pharmaceutical product line. Hospira's ability to benefit from these arrangements will depend on its ability to successfully manage these arrangements and the performance of the other parties to these arrangements. Hospira and the other parties to these arrangements may not efficiently work together, leading to higher-than-anticipated costs and delays in important activities under the arrangements. The other parties to these arrangements may not devote the resources that are required for the arrangement to be successful. These arrangements are often governed by complex agreements that may be subject to differing interpretations by the parties, which may result in disputes.
The development of proprietary and biosimilar products may require substantial investment by Hospira. Hospira may not be able to realize the expected benefits of such investment. These factors are often beyond the control of Hospira, and could harm Hospira's sales, product development efforts and profitability.
Hospira is subject to the cost-containment efforts of wholesalers, distributors, third-party payors and government organizations, which could have a material adverse effect on our sales and profitability.
Hospira relies on drug wholesalers to assist in the distribution of its generic injectable pharmaceutical products. While Hospira has business arrangements in place with its major drug wholesalers, if Hospira is required to pay fees not contemplated by its existing arrangements, Hospira will incur additional costs to distribute its products, which may harm Hospira's profitability.
Hospira's products and services are sold to hospitals and alternate site providers, such as clinics, home healthcare providers and long-term care facilities which receive reimbursement for the healthcare services provided to their patients from third-party payors, such as government programs, private insurance plans and managed-care programs. These third-party payors are increasingly attempting to contain healthcare costs by limiting both coverage and the level of reimbursement for medical products and services. Levels of reimbursement, if any, may be decreased in the future, and future healthcare reform legislation, regulations or changes to reimbursement policies of third-party payors may otherwise adversely affect the demand for and price levels of Hospira's products, which could have a material adverse effect on Hospira's sales and profitability.
In markets outside the U.S., Hospira's business has experienced downward pressure on product pricing as a result of the concentrated buying power of governments as principal customers and the use of bid-and-tender sales methods whereby Hospira is required to submit a bid for the sale of its products. Hospira's failure to offer acceptable prices to these customers could have a material adverse effect on its sales and profitability in these markets.
If Hospira is unable to obtain or maintain its GPO and IDN pricing agreements, sales of its products could decline.
Many existing and potential customers for Hospira's products have combined to form GPOs, and IDNs in an effort to lower costs. A small number of GPOs influence a majority of sales to Hospira's hospital customers in the U.S. GPOs and IDNs negotiate pricing arrangements with medical supply
16
Table of Contents
manufacturers and distributors, and these negotiated prices are made available to a GPO's or an IDN's affiliated hospitals and other members. Failure to negotiate advantageous pricing and purchasing arrangements could cause Hospira to lose market share to its competitors and have a material adverse effect on its sales and profitability.
Hospira has pricing agreements for certain products with the major GPOs in the U.S., including Amerinet, Inc.; HealthTrust Purchasing Group LP; MedAssets, Inc.; Novation, LLC; PACT, LLC; and Premier Purchasing Partners, LP. It is important for Hospira to continue to maintain pricing arrangements with major GPOs. In order to maintain these relationships, Hospira must offer a reliable supply of high-quality, regulatory-compliant products. Hospira also needs to maintain a broad product line and be price-competitive. Several GPO contracts are up for renewal or extension each year. Moreover, some of the agreements may be terminated on 60 or 90 days' notice, while others may not be terminated without breach until the end of their contracted term. If Hospira is unable to renew or extend one or more of those contracts, or one or more of the contracts are terminated, and Hospira cannot replace lost business, Hospira's sales and profitability will decline. There has been consolidation among major GPOs, and further consolidation may occur. The effect of consolidation is uncertain, and consolidation may impair Hospira's ability to contract with GPOs in the future.
The GPOs also have a variety of business relationships with Hospira's competitors and may decide to enter into pricing agreements for, or otherwise prefer, products other than Hospira's. While GPOs negotiate incentives for members to purchase specified products from a given manufacturer or distributor, GPO pricing agreements allow customers to choose between the products covered by the arrangement and another manufacturer's products, whether or not purchased under a negotiated pricing agreement. As a result, Hospira may face competition for its products even within the context of its GPO pricing agreements.
Changes in the buying patterns of Hospira's customers could adversely affect Hospira's operating results.
During 2010, sales through the four largest wholesalers that supply products to many end-users accounted for approximately 40% of Hospira's global net sales. Hospira's profitability may be impacted by changes in the buying patterns of these wholesalers, or any other major distributor, or wholesale customer. Their buying patterns may change as a result of end-use buyer purchasing decisions, end-use customer demand, pricing, or other factors, which could adversely affect Hospira's results of operations.
Hospira and its suppliers and customers are subject to various governmental regulations, and it could be costly to comply with these regulations and to develop compliant products and processes. In addition, failure to comply with these regulations could subject us to sanctions which could adversely affect our business, results of operations and financial condition.
Hospira's products are subject to rigorous regulation by the FDA, and numerous other national, supranational, federal and state governmental authorities. The process of obtaining regulatory approvals to market a drug or medical device, particularly from the FDA and governmental authorities outside the U.S., can be costly and time-consuming, and approvals might not be granted for future products on a timely basis, if at all. To ensure ongoing customer safety, regulatory agencies such as the FDA may re-evaluate their current approval processes and may impose additional requirements. In addition, the FDA and others may impose increased or enhanced regulatory inspections for domestic or foreign plants.
The FDA, along with other regulatory agencies around the world, has been experiencing a backlog of generic drug and medical device applications, which has delayed approvals of new products. Those delays have become longer, and may continue to increase in the future. These delays can result in higher levels of unapproved inventory and increased costs due to excess and obsolescence exposures.
17
Table of Contents
Hospira's collaborative partners and suppliers may not be able to remain in compliance with applicable FDA and other material regulatory requirements once it has obtained clearance or approval for a product. These requirements include, among other things, regulations regarding manufacturing practices, product labeling, advertising and postmarketing reporting, and adverse event reports and field alerts. In addition, manufacturing flaws, component failures, design defects, off-label uses or inadequate disclosure of product related information could result in an unsafe condition or the injury or death of a patient. Hospira may be required by regulatory authorities, or determine on its own, to issue a safety alert, recall or temporarily cease production and sale of certain products to resolve manufacturing and product quality concerns. All of these events could harm Hospira's sales, margins and profitability in the affected periods and may have a material adverse effect on Hospira's business.
For information related to the 2009 and 2010 FDA warning letters received by Hospira and other voluntary recalls and corrective actions, including those related to Hospira's pumps , see the section captioned "Quality Assurance" under Item 1 above and "Management's Discussion and Analysis of Financial Condition and Results of Operation" in Part II, Item 7. In response to certain quality issues, Hospira placed a voluntary hold on all shipments to new customers of SymbiqTM. Also during 2010, Hospira temporarily shut down certain of its production lines to respond to the quality issues cited in the 2010 warning letter. Hospira has also been working with third-party consultants in connection with the 2010 warning letter, who have been overseeing Hospira's activities to ensure it is developing compliant processes and procedures. These activities have increased the time to get product to market. If the FDA is not satisfied with Hospira's progress, this could result in longer delays to market or additional production line shut-downs. The FDA could find additional violations in subsequent inspections or through other means. In some circumstances, adverse events arising from or associated with the design, manufacture or marketing of our products could result in the suspension or delay of regulatory reviews of our applications for new product approvals or clearances. Any of the foregoing could disrupt our business and harm our reputation, resulting in an adverse effect on our results of operations and financial condition.
Hospira is also subject to various federal, state, and foreign laws pertaining to foreign corrupt practices and healthcare fraud and abuse, including anti-kickback and false claims laws. Violations of these laws are punishable by criminal and/or civil sanctions, including, in some instances, substantial fines, imprisonment and exclusion from participation in national, federal and state healthcare programs, including Medicare, Medicaid, and Veterans' Administration health programs and health programs outside the U.S. These laws and regulations are broad in scope and are subject to evolving interpretations, which could require Hospira to alter one or more of its sales or marketing practices. In addition, violations of these laws, or allegations of such violations, could disrupt Hospira's business and result in a material adverse effect on Hospira's sales, profitability and financial condition.
For a more detailed listing of the laws and regulations that significantly affect Hospira's business and operations, see the section captioned in Item 1. "Governmental Regulation and Other Matters." Any adverse regulatory action, or action taken by Hospira to maintain appropriate regulatory compliance, with respect to these laws and regulations could disrupt Hospira's business and have a material adverse effect on its sales, profitability and financial condition. Furthermore, an adverse regulatory action with respect to any Hospira product, operating procedure or manufacturing facility could materially harm Hospira's reputation in the marketplace.
Proposed changes in FDA regulations or actions related to infusion pumps and medical devices may lead to increased costs and delays, which could negatively impact Hospira's business.
In April 2010, the FDA issued a draft guidance document entitled "Total Product Life Cycle: Infusion Pump-Premarket Notification [510(k)] Submissions." Through this new draft guidance, the FDA has established additional pre-market requirements for infusion pumps. The proposed guidance is subject to further revisions by the FDA, but the FDA's expectation is that the guidelines should be
18
Table of Contents
followed in the interim. At the same time, the FDA is also enhancing its pre-market requirements for medical devices generally. Although Hospira cannot predict with certainty the future impact of these initiatives, it appears that the process for obtaining regulatory approvals to market infusion pumps and medical devices will become more costly and time consuming. In addition, the new requirements could result in longer delays for the approval of new products as well as remediation of existing products in the market. Future delays in the receipt of, or failure to obtain, approvals could result in delayed or no realization of product revenues.
Hospira may continue to acquire other businesses and assets, license rights to technologies or products from third parties, form alliances, or dispose of businesses and assets, and any of these actions may not be completed in a timely or cost-effective manner, or at all.
As part of Hospira's business strategy, Hospira may continue to acquire other businesses and assets, license rights to technologies or products from third parties, form alliances, or dispose of businesses and assets, and any of these actions may not be completed in a timely or cost-effective manner, or at all. Hospira also may pursue strategic alliances to expand its product offerings and geographic presence, as recently evidenced by Hospira's expanding its manufacturing presence in India. Hospira may not identify or complete these transactions in a timely manner, on a cost-effective basis, or at all, and may not realize the expected benefits of any acquisition, license arrangement, strategic alliance, or disposition. Other companies, including those with substantially greater resources, may compete with Hospira for opportunities. If Hospira is successful in securing certain opportunities, the products and technologies that Hospira acquires may not be successful or may require significantly greater resources and investments than originally anticipated. Hospira may not be able to integrate acquisitions successfully into its existing business.
To finance acquisitions or other investments, Hospira has incurred, and may continue to incur or assume significant debt. This significant indebtedness may require Hospira to dedicate a substantial portion of its cash flow from operations to servicing its debt, thereby reducing the availability of cash flow to fund capital expenditures, to pursue other acquisitions or investments, and for general corporate purposes. In addition, this significant indebtedness may increase Hospira's vulnerability to general adverse economic conditions, including increases in interest rates. In addition, this may limit Hospira's flexibility in planning for, or reacting to, changes in or challenges relating to its business and industry. Hospira may incur greater than expected costs in connection with these transactions if it encounters difficulties or issues not known to it at the time of entering into the transaction. In addition, Hospira may enter markets in which it has no or limited prior experience. Hospira could experience negative effects on its reported results of operations from acquisition or disposition-related charges. Any of these negative effects could cause a downgrade of Hospira's credit rating, which would affect Hospira's ability to obtain new financing and negatively impact Hospira's cost of financing and credit.
The Company is increasingly dependent on its outsourcing and third-party provider arrangements.
Hospira is increasing its dependence on third-party providers for certain services, including certain information technology, research and development, third party manufacturing, and finance and accounting outsourcing arrangements. The failure of these service providers to meet their obligations or the development of significant disagreements or other factors may materially disrupt Hospira's ongoing relationship with these providers or the services they provide could negatively affect operations.
Challenging economic conditions could adversely affect our operations.
The securities and credit markets have experienced volatility in the past, and in some cases, exerted negative pressure on the availability of liquidity and credit capacity for certain companies. Hospira's ability to access the credit and capital markets, and the related cost of borrowings, will depend on a variety of factors, including market conditions, the availability of credit and the strength of
19
Table of Contents
Hospira's credit rating. In addition, lending institutions, including those associated with Hospira's $700 million revolving credit facility which expires in 2012, may suffer losses due to their lending and other financial relationships. As a result, lenders may become insolvent, which could affect the actual availability of credit under Hospira's revolving credit facility, or Hospira's ability to obtain other financing on equally favorable terms. Moreover, insurance companies and other financial institutions may suffer losses, which could affect the cost and availability of insurance coverage. If one or more of these events occurred, Hospira's liquidity may prove to be insufficient, cost of borrowing may increase and Hospira's financial condition or results of operations could be adversely affected.
In addition, demand for Hospira's products may decrease due to adverse economic conditions, resulting in the loss of jobs or healthcare coverage, thereby affecting an individual's ability to pay for elective healthcare. In addition, adverse economic conditions may increase Hospira's customers' cost-containment efforts, and affect Hospira's customers' solvency or their ability to obtain credit to finance their purchases of Hospira's products, which could reduce Hospira's revenue and cause a decrease in Hospira's profitability. These economic conditions may also adversely affect certain of our suppliers, which could cause a disruption in our ability to produce our products.
Acquisitions have increased Hospira's investment balances, intangible assets and goodwill balances, and a decline in the value of assets may adversely affect Hospira's financial position or results of operation.
As a result of Hospira's acquisitions, intangible assets and goodwill have become significant. The values for these assets can be affected by factors, such as increased competition, development discontinuation, delay in regulatory approval, product quality, changes in business strategies and the impact of restructurings, disposition transactions, and business combinations. As a result of these factors or other events, Hospira may have to impair these assets or change estimated useful lives, which may have a material adverse effect on Hospira's financial position or results of operations.
In addition, Hospira regularly reviews its investments, including equity and cost-based investments, to determine when a significant event or change in circumstance has occurred that may have an adverse effect on the fair value of each investment. Hospira considers numerous factors, including factors affecting the investee, factors affecting the industry of the investee, and general equity market trends. Hospira also considers the length of time an investment's market value has been below carrying value and the near-term prospects for recovery to carrying value. Volatility in the global equity markets and other factors could adversely impact the fair value of Hospira's investments and, as a consequence, could result in a charge for an other than temporary decline in value, which could have an adverse effect on Hospira's financial position and results of operations.
The manufacture of Hospira's products is highly exacting and complex, and if Hospira or its suppliers encounter problems manufacturing, storing or distributing products, Hospira's business could suffer.
The manufacture of Hospira's products and products Hospira produces for third parties is highly exacting and complex, due in part to strict regulatory requirements governing the manufacture of drugs and medical devices. Problems may arise during manufacturing, storage or distribution of Hospira's products and products Hospira manufactures for third parties for a variety of reasons, including equipment malfunction, failure to follow specific protocols and procedures, manufacturing quality concerns, or problems with raw materials, electromechanical, software and other components, supplier issues, and natural disaster related events or other environmental factors. If problems arise during the production, storage or distribution of a batch of product, that batch of product may have to be discarded. Problems could also lead to increased costs, lost sales, damage to customer relations, failure to supply penalties, time and expense spent investigating the cause and, depending on the cause, similar losses with respect to other batches or products. If problems are not discovered before the product is released to the market, voluntary recalls, corrective actions or product liability related costs may also be
20
Table of Contents
incurred. Problems with respect to the manufacture, storage or distribution of its products could materially disrupt Hospira's business and harm its sales and profitability.
Hospira can experience higher costs to produce its products as a result of rising oil and gas prices.
Hospira uses resins and other petroleum-based materials as raw materials in many of its products. Prices of oil, fuel, and other gases also significantly affect Hospira's costs for freight and utilities. Oil, fuel, and other gas prices are volatile. If costs increase and Hospira is unable to fully recover these costs through price increases or offset these increases through other cost reductions, Hospira could experience lower margins and profitability.
Hospira depends on third parties to supply raw materials, electromechanical and other components, and third-party finished goods. Hospira may not be able to obtain sufficient quantities of these materials, which could limit Hospira's ability to manufacture or sell products on a timely basis and could harm its profitability.
The manufacture of Hospira's products requires raw materials, active pharmaceutical ingredient and electromechanical and other components that must meet stringent FDA and other regulatory requirements. While efforts are made to diversify our sources of materials and components, some of these raw materials and other components are currently available from a limited number of suppliers. For example, Hospira relies on certain proprietary components available exclusively from ICU Medical. For a description of that relationship, see the section captioned "Raw Materials and Components" in Item 1.
In addition, Hospira purchases from single sources certain compounding material, polyvinyl-chloride resin and laminate film components for Hospira's production of certain flexible bags that it uses with its I.V. and pre-mixed solutions, as well as rubber components that it uses with some of its injectable pharmaceuticals. Hospira also obtains from single sources certain active pharmaceutical ingredients and finished products. Identifying alternative suppliers and obtaining approval to change or substitute a raw material or component, or the supplier of a finished product, raw material or component, can be time-consuming and expensive, as testing, validation and regulatory approval are necessary.
While we work closely with our suppliers to ensure the continuity of supply, we cannot guarantee that these efforts will be successful. In the past, Hospira's business has experienced shortages in some of the raw materials and components of its products. Continuous supply of petroleum-based products is especially risky due to the limited number of capable suppliers, limited production capacity and the effect of natural disasters. If suppliers are unable to deliver sufficient quantities of these materials on a timely basis or if supply is otherwise disrupted, including by suppliers exiting the market, the manufacture and sale of Hospira's products may be disrupted, and its sales and profitability could be adversely affected.
Hospira's cost-reduction and optimization activities have resulted, and may continue to result, in significant charges and cash expenditures. These activities may disrupt Hospira's business and may not result in the intended cost savings.
Hospira's strategy, in part, relies on the establishment of a low-cost operating infrastructure to improve margins and cash flow to drive sustained growth. In addition to the several initiatives under Project Fuel, Hospira has taken various other actions to dispose of, or close, certain manufacturing, research and development, and other facilities. These actions have resulted in, and are expected to continue to result in, significant charges to Hospira's results of operations and cash expenditures. Cost-reduction and optimization activities are complex, and if Hospira does not successfully manage these activities, its operations and business could be disrupted and Hospira may incur more costs than
21
Table of Contents
anticipated. In connection with these activities, the company's failure to hire or retain personnel with the right expertise and experience in operations that are critical to its business functions could adversely impact the execution of its business strategy. Future cost reduction and optimization activities, if taken, may result in additional charges and cash expenditures, which may be material. If Hospira does not realize the expected savings from its cost-reduction and optimization efforts, its profitability may be adversely affected.
Hospira's manufacturing capacity could limit its ability to expand its business without significant capital investment.
From time to time, Hospira may need to invest substantial capital resources to expand its manufacturing capacity if Hospira introduces new products, demand increases significantly for its products, or if it is successful in obtaining significant additional customers for its injectable pharmaceuticals contract manufacturing services business. These efforts may not be completed in a timely or cost-effective manner, and Hospira may not realize the desired benefits of these efforts. To ensure Hospira's manufacturing capacity aligns with expected future commercial growth and demand, Hospira may be taking steps in India over the next few years to prepare for the expansion of Hospira's global footprint.
As a result of cost-reduction efforts, Hospira has announced the closing of, or has sold, certain of its facilities. While Hospira believes it has available manufacturing capacity to absorb, or has had the ability to outsource, the production at these closed or sold facilities, there may be less available capacity at Hospira's facilities. If Hospira experiences an interruption in manufacturing at any of its primary manufacturing facilities, it may not be able to produce sufficient products for its customers. As a result, Hospira's sales, margins and profitability may be adversely impacted.
Hospira relies on the performance of its information technology systems, the failure of which could have an adverse effect on Hospira's business and performance.
Hospira operates in a highly regulated industry that requires the continued operation of sophisticated information technology systems and network infrastructure. These systems are vulnerable to interruption by fire, power loss, system malfunction and other such events, which are beyond Hospira's control. Systems interruptions could reduce Hospira's ability to manufacture its products, and could have a material adverse effect on Hospira's operations and financial performance. The level of Hospira's protection and disaster-recovery capability varies from site to site, and there can be no guarantee that any such plans, to the extent they are in place, will be totally effective.
Hospira conducts operations outside of the U.S. and is subject to additional risks, including fluctuations in foreign currency exchange rates, that may cause its sales and profitability to decline.
Sales in markets outside the U.S. comprised approximately 28% of 2010 net sales. Hospira anticipates that sales from outside the U.S. will continue to represent a significant portion of net sales. The additional risks associated with Hospira's operations outside the United States include:
- (i)
- fluctuations in foreign currency exchange rates (for a discussion of the ways and extent to which Hospira attempts to mitigate such risk, see Part II, Item 7A. "Quantitative and Qualitative Disclosures About Market Risk.");
- (ii)
- multiple regulatory requirements that are subject to change, which may delay or deter Hospira's international product commercialization efforts;
- (iii)
- differing local medical practices, product preferences and product requirements;
- (iv)
- trade protection measures and import or export licensing requirements or other controls or restrictions;
22
Table of Contents
- (v)
- difficulty in establishing, staffing and managing operations outside the U.S.;
- (vi)
- differing labor regulations or work stoppages or strikes at Hospira's union facilities;
- (vii)
- complying with U.S. regulations that apply to international operations, including trade laws, the U.S. FCPA and anti-boycott laws;
- (viii)
- loss of business through government tenders that are held annually in many cases;
- (ix)
- potentially negative consequences from changes in tax laws, including legislative changes in the U.S. and international taxation of income earned outside of the U.S.;
- (x)
- political and economic instability;
- (xi)
- disruption or destruction of operations in a significant geographic area, due to the location of manufacturing facilities, distribution facilities or customers, caused by natural or man-made disasters or other causes; and
- (xii)
- diminished or insufficient protection of intellectual property in some countries outside of the U.S.
In addition, Hospira operates in many countries outside the U.S. through distributors. Its success will depend on the efforts and performance of such distributors, which are beyond Hospira's control. If certain of those distributor relationships are unsuccessful, the costs to terminate such distributor relationship and/or to re-establish a customer base could adversely affect Hospira's profitability in certain regions. These risks could have an adverse effect on Hospira's ability to distribute and sell its products in markets outside the U.S. and could adversely affect Hospira's profitability.
Hospira is involved in various lawsuits and proceedings that could negatively affect its business.
Hospira is involved in various claims and legal proceedings, as well as product liability claims and proceedings related to Hospira's business, including in some instances when Hospira operated as part of Abbott. In some instances, these claims and proceedings could preclude the continued sale and marketing of Hospira's products or otherwise adversely affect operations, profitability or liquidity. These claims and proceedings include those described in Item 3 "Legal Proceedings." These matters could have an adverse effect on Hospira's business, profitability or financial condition. In addition, there could be an increase in scope of these matters and there could be additional lawsuits, claims, proceedings or investigations in the future.
In the past, Hospira has been involved in investigations related to improper marketing and pricing practices with respect to certain Medicare and Medicaid reimbursable products. Hospira could be subject to these investigations or lawsuits again in the future, and these matters could have an adverse impact on Hospira.
Hospira may incur product liability losses and insurance coverage could be inadequate or unavailable to cover these losses.
Hospira's business is subject to potential product liability risks that are inherent in the design, development, manufacture and marketing of drugs and medical devices and products. In the ordinary course of business, Hospira is the subject of product liability claims and lawsuits, including those described in Item 3 "Legal Proceedings," alleging that its products have resulted or could result in an unsafe condition or injury to patients. Product liability claims and lawsuits, safety alerts, recalls or corrective actions, regardless of their ultimate outcome, could have a material adverse effect on Hospira's business and reputation and on its ability to attract and retain customers.
Hospira is responsible for all liabilities, including liabilities for claims and lawsuits, related to its business, whether they arose before or after the spin-off, other than certain liabilities relating to allegations that it engaged in improper marketing and pricing practices in connection with federal, state
23
Table of Contents
or private reimbursement for its products. As part of Hospira's risk management policy, Hospira carries third-party product liability insurance coverage, which includes a substantial retention or deductible which provides that Hospira will not receive insurance proceeds until the losses incurred exceed the amount of that retention or deductible. To the extent that any losses are within these retentions or deductibles, Hospira will be responsible for the administration and payment of these losses. Product liability claims in excess of applicable insurance could have a material adverse effect on Hospira's profitability and financial condition.
If Hospira is unable to protect its intellectual property rights, its business and prospects could be harmed.
Hospira relies on trade secrets, confidentiality agreements, continuing technological innovation and, in some cases, patent, trademark and service mark protection to preserve its competitive position. A failure to protect Hospira's intellectual property could harm its business and prospects, and its efforts to protect its proprietary rights may not be adequate.
Most of Hospira's products are not protected by patents or other proprietary rights, and have limited or no market exclusivity. Patent filings by third parties could render Hospira's intellectual property less valuable. In addition, intellectual property rights may be unavailable or limited in certain countries outside the U.S., which could make it easier for competitors to capture market position. Competitors may also harm sales of Hospira's products by designing products that mirror the capabilities of those products or technology without infringing Hospira's intellectual property rights. If Hospira does not obtain sufficient protection for its intellectual property, Hospira's competitiveness in international markets could be impaired, which could limit its growth and future sales.
If Hospira infringes the intellectual property rights of third parties, Hospira may face legal action, increased costs and delays in marketing new products.
Hospira seeks to launch generic pharmaceutical products either where patent protection of equivalent branded products has expired, where patents have been declared invalid or where products do not infringe the patents of others. To achieve a "first-to-market" position for generic pharmaceutical products, Hospira may take action, such as litigation, to seek to assert that its products do not infringe patents of existing products or that those patents are invalid or unenforceable. These actions and litigation could be costly and time consuming, and may not be successful.
Hospira has made abbreviated new drug applications and certifications (known as "Paragraph IV certifications" in the U.S.) that the relevant patents for existing products would not be infringed by a Hospira product, or were invalid or unenforceable, in the U.S. and equivalent filings in Canada. Claims filed by innovators challenging these Paragraph IV certifications may delay or prevent the launch of the relevant products and result in additional costs.
Hospira is currently involved in patent-related disputes with companies with branded products over Hospira's attempts to market generic pharmaceutical products. Once Hospira has final approval of the related generic pharmaceuticals in the U.S., Hospira may decide to commercially market these products while the ultimate disposition of legal proceedings has not concluded. If Hospira's products are ultimately found to infringe the patent rights of another company, Hospira may be subject to significant damages, which may be based on the lost profits from the sale of the branded product and/or an injunction preventing Hospira from further sales.
Third parties may claim that Hospira's products are infringing their intellectual property rights. Claims of intellectual property infringement could be costly and time-consuming and might require Hospira to enter into costly royalty or license agreements, if Hospira is able to obtain royalty or license agreements on acceptable terms. Hospira also may be subject to significant damages or an injunction preventing it from manufacturing, selling or using some of its products in the event of a successful claim of patent or other intellectual property infringement. Any of these adverse consequences could have a material adverse effect on Hospira's profitability and financial condition.
24
Table of Contents
Changes in the funded status or costs of Hospira's pension or post-retirement benefit plans could adversely affect Hospira's financial position and results of operations.
The funded status of Hospira's pension and post-retirement benefit plans is subject to developments and changes in actuarial and other related assumptions. Decreases in the valuation of plan assets, particularly with respect to equity securities, and a change in the actual rate of return on plan assets can result in significant changes to the expected return on plan assets in the following year and, as a consequence, could result in higher funding requirements and net periodic benefit costs. In addition, changes in assumptions, such as discount rates, mortality rates, retirement rates, healthcare cost trend rates and other factors, may lead to significant increases in the value of the respective obligations. Assumption changes could affect the reported funded status of Hospira's plans and, as a result, could result in higher funding requirements and net periodic benefit costs. All of these factors could have an adverse effect on Hospira's financial position and results of operations.
Income taxes can have an unpredictable effect on Hospira's results of operations and result in greater-than-anticipated liabilities.
Hospira is subject to income taxes in a variety of jurisdictions, and its tax structure is subject to review by both domestic and foreign taxation authorities. Because Hospira's income tax expense for any period depends heavily on the mix of income derived from the various taxing jurisdictions during that period, which is inherently uncertain, its income tax expense and reported net income may fluctuate significantly, and may be materially different than forecasted. Moreover, changes in or interpretations of tax laws and regulations (including laws related to the remittance of foreign earnings), changes in investments in foreign countries with favorable tax rates, and settlements of federal, state and foreign tax audits, may affect Hospira's profitability and financial condition.
Hospira is the beneficiary of tax exemptions in certain jurisdictions outside the U.S., where a portion of its income is earned. These tax exemptions have a significant impact on reducing Hospira's overall effective tax rate. If Hospira is unable to maintain these tax exemptions, Hospira's future profitability may be reduced. Changes in laws or governmental policies can affect the availability of these exemptions.
Significant judgment is required in determining the provision for income taxes and in evaluating tax positions that are subject to audits and adjustments. Liabilities for unrecognized tax benefits are established when, despite Hospira's belief that the tax return positions are fully supportable, positions taken by Hospira are likely to be challenged based on the applicable tax authority's determination of the positions. Although Hospira believes its tax provisions and related liability balances are reasonable, the ultimate tax outcome may differ from the amounts recorded in its financial statements and may materially affect its financial results in the period or periods for which such determination is made.
The stock market can be volatile and fluctuations in Hospira's operating results, as well as other factors, could cause its stock price to decline.
During the past few years, the stock market has experienced fluctuations, which has significantly impacted the market prices of securities issued by many companies for reasons unrelated to their operating performance. Market fluctuations could adversely affect Hospira's stock price. Moreover, Hospira's sales and operating results may vary from quarter to quarter due to the risk factors set forth herein. Hospira's stock price could fluctuate significantly in response to its quarterly results and the impact of these risk factors on Hospira's operating results or financial position.
Item 1B. Unresolved Staff Comments
None.
25
Table of Contents
Item 2. Properties
Hospira's corporate headquarters and the locations and uses of Hospira's principal manufacturing and research and development ("R&D") properties as of December 31, 2010, are as follows:
| | | | |
Location* | | Use | | Owned/Leased |
|---|
Adelaide, South Australia, Australia | | R&D | | Owned |
Austin, Texas | | Manufacturing | | Owned |
Buffalo, New York | | Manufacturing | | Owned |
Boulder, Colorado** | | Manufacturing and R&D | | Owned/Leased (expires 2011) |
Clayton, North Carolina | | Manufacturing and R&D | | Owned |
Finisklin, Sligo, Ireland | | Manufacturing | | Leased (expires 2013) |
Irungattukottai, India | | Manufacturing and R&D | | Owned/Leased (expires 2102) |
La Aurora, Costa Rica | | Manufacturing | | Owned |
Lake Forest, Illinois*** | | Corporate Headquarters and R&D | | Owned/Leased (expires 2016) |
Liscate, Italy | | Manufacturing | | Owned |
McPherson, Kansas | | Manufacturing and R&D | | Owned |
Mulgrave, Victoria, Australia | | Manufacturing and R&D | | Owned |
Rocky Mount, North Carolina | | Manufacturing | | Owned |
San Cristobal, Dominican Republic | | Manufacturing | | Owned |
San Diego, California | | R&D | | Leased (expires 2019) |
- *
- The locations listed above generally support all of Hospira's segments.
- **
- The Boulder facilities consist of nine buildings, one of which is owned and eight of which are leased.
- ***
- The Lake Forest facilities consist of four buildings, three of which are owned and one of which is leased.
Hospira ceased manufacturing operations at its Morgan Hill, California plant and the transfer of product manufacturing was completed in 2010. Production of the primary products at this facility has been moved to other Hospira facilities or has been outsourced to third-party suppliers. For further details regarding the financial impact of these activities, see Note 3, to the consolidated financial statements included in Part II, Item 8.
Hospira has a joint venture with Cadila Healthcare Limited, a pharmaceutical company located in Ahmedabad, Gujarat State, India. The joint venture, ZHOPL operates a manufacturing facility in a special economic zone outside of Ahmedabad, India, that has been inspected and approved by the Medicines and Healthcare Products Regulatory Agency and the FDA. The facility is now manufacturing a number of cytotoxic drugs for sale by both Cadila and Hospira in their respective exclusive territories in the United States and Europe.
In addition, Hospira acquired some of Orchid Pharma's long-term land leases in India, which were held by Orchid Pharma for their anticipated future expansion. To ensure Hospira's manufacturing capacity aligns with expected future commercial growth and demand, Hospira may be taking steps in India over the next few years to prepare for the expansion of Hospira's global manufacturing footprint.
Hospira believes that its facilities and equipment are in good operating condition and are well maintained. Hospira believes that it has adequate capacity to meet its current business needs.
Item 3. Legal Proceedings
Hospira is involved in various claims and legal proceedings, as well as product liability claims and proceedings related to Hospira's business, including in some instances when Hospira operated as part of Abbott.
26
Table of Contents
Hospira has been named as a defendant in a lawsuit alleging generally that the spin-off of Hospira from Abbott resulted in a mass termination of employees so as to interfere with the future attainment of benefits in violation of the Employee Retirement Income Security Act of 1974 ("ERISA"). The lawsuit was filed on November 8, 2004 in the U.S. District Court for the Northern District of Illinois, and is captioned:Myla Nauman, Jane Roller and Michael Loughery v. Abbott Laboratories and Hospira, Inc. Plaintiffs generally seek reinstatement in Abbott benefit plans, disgorgement of profits and attorneys fees. On November 18, 2005, the complaint was amended to assert an additional claim against Abbott and Hospira for breach of fiduciary duty under ERISA. Hospira has been dismissed as a defendant with respect to the fiduciary duty claim. By Order dated December 30, 2005, the Court granted class action status to the lawsuit. As to the sole claim against Hospira, the court certified a class defined as: "all employees of Abbott who were participants in the Abbott Benefit Plans and whose employment with Abbott was terminated between August 22, 2003 and April 30, 2004, as a result of the spin-off of the HPD [Hospital Products Division] /creation of Hospira announced by Abbott on August 22, 2003, and who were eligible for retirement under the Abbott Benefit Plans on the date of their terminations." Hospira denies all material allegations asserted against it in the complaint. Trial of this matter has concluded. On April 22, 2010, the court issued a ruling in favor of Hospira and Abbott on all counts. Plaintiffs have appealed that verdict. In 2008, Hospira received notice from Abbott requesting that Hospira indemnify Abbott for all liabilities that Abbott may incur in connection with this litigation. Hospira denies any obligation to indemnify Abbott for the claims asserted against Abbott in this litigation.
Hospira and Abbott are defendants in a number of lawsuits brought by individual plaintiffs alleging that plaintiffs developed Post-arthroscopic Glenohumeral Chondrolysis ("PAGCL") from the use of certain continuous infusion pain pumps to deliver local anesthetic into the intra-articular joint space following shoulder surgeries. In each case, Hospira and/or Abbott is alleged, singularly or with other anesthetic medication defendants, to have provided the medication delivered by continuous infusion pain pumps manufactured by other (non-Hospira/non-Abbott) defendants. The analgesic medications at issue include MarcaineTM (bupivacaine) and lidocaine. As of December 31, 2010, there are a total of 11 cases, involving 11 plaintiffs, in which Hospira is a party. 5 cases are pending in federal court and 6 cases are pending in state court. Pursuant to its separation agreement with Abbott, Hospira is defending those lawsuits which relate to sales of products prior to Hospira's spin-off from Abbott. Hospira and Abbott deny all material allegations asserted against them in the complaints. Generally, plaintiffs seek compensatory damages and, in some cases, punitive damages and costs. Hospira has successfully achieved dismissals in hundreds of these lawsuits. Given the few lawsuits that remain and absent a significant change in this litigation, Hospira no longer believes this litigation is material and no longer intends to report on this litigation.
Hospira is involved in two patent lawsuits concerning PrecedexTM (dexmedetomidine hydrochloride), a proprietary sedation agent. On September 4, 2009, Hospira brought suit against Sandoz International GmbH and Sandoz, Inc. for patent infringement. The lawsuit, which alleges infringement of U.S. Patents 4,910,214 (expires July 15, 2013) and 6,716,867 (expires March 31, 2019), is pending in the U.S. District Court for the District of New Jersey:Hospira, Inc. and Orion Corp. v. Sandoz International GmbH and Sandoz, Inc. (D. N.J. 2009). The lawsuit is based on Sandoz's "Paragraph IV" notice indicating that Sandoz has filed an abbreviated new drug application ("ANDA") with the FDA for a generic version of PrecedexTM. Hospira seeks a judgment of infringement, injunctive relief and costs. On November 12, 2010, Hospira brought suit against Caraco Pharmaceutical Laboratories, Ltd. for patent infringement. The lawsuit, which alleges infringement of U.S. Patent No. 6,716,867 (referred to above) is pending in the U.S. District Court for the Eastern District of Michigan:Hospira, Inc. and Orion Corporation v. Caraco Pharmaceutical Laboratories, Ltd., No. 10-cv-14514 (E.D. Mich. 2010). The lawsuit is based on Caraco's "Paragraph IV" notice indicating that Caraco has filed an abbreviated new drug application ("ANDA") with the FDA for a generic version of PrecedexTM. Hospira seeks a judgment of infringement, injunctive relief and costs.
27
Table of Contents
Hospira's litigation exposure, including product liability claims, is evaluated each reporting period. Hospira's reserves, which are not significant at December 31, 2010 and 2009, are the best estimate of loss, as defined by Accounting Standards Codification ("ASC") Topic 450, "Contingencies." Based upon information that is currently available, management believes that the likelihood of a material loss in excess of recorded amounts is remote.
Additional legal proceedings may occur that may result in a change in the estimated reserves recorded by Hospira. It is not feasible to predict the outcome of such proceedings with certainty and there can be no assurance that their ultimate disposition will not have a material adverse effect on Hospira's financial position, cash flows, or results of operations.
Executive Officers of Hospira
The executive officers of Hospira are set forth below. Their ages as of February 16, 2011, and the positions and offices held by them in the past are also indicated. There are no family relationships between any corporate officers or directors.
Christopher B. Begley, age 58, is Hospira's Chairman of the Board and Chief Executive Officer. He has served as Chief Executive Officer and as a director since the spin-off in April 2004 and as the Chairman of the Board since May 2007. Mr. Begley had previously provided 18 years of service to Abbott, a global broad-based healthcare company. In August 2010, Mr. Begley announced his intention to retire as CEO once a successor had been named. At that time, he would remain an employee of Hospira as Executive Chairman of the Board. Mr. Begley is a director of Sara Lee Corporation and AdvaMed.
Francois (Frans) L. Dubois, age 57, is Hospira's Senior Vice President, Quality. Mr. Dubois has served in that position since January 2011. Mr. Dubois served as the Vice President of Quality for Tengion, Inc. (a regenerative medicine company) from 2009 to 2010. From 2008 to 2009, Mr. Dubois was Vice President of Global External Manufacturing and Supplier Quality Operations at Global Pharmaceutical Supply Group (a fully owned subsidiary of Johnson & Johnson, a global pharmaceutical, medical device and consumer packaged goods manufacturer). From 2006 to 2008, Mr. Dubois was Vice President, Worldwide Quality at Global Biologics Supply Chain (a fully owned subsidiary of Johnson & Johnson).
James H. Hardy, Jr., age 51, is Hospira's Senior Vice President, Operations. Mr. Hardy has served in that position since January 2011. Mr. Hardy was Hospira's Corporate Vice President, Supply Chain, from 2009 to 2010. From 2007 to 2009, Mr. Hardy served as the Senior Vice President, Supply Chain, at Dial Corporation (a maker of personal care and household cleaning products). Prior to that, he served as the Executive Vice President, Product Supply (2006-2007) and as the Senior Vice President, Manufacturing (2006) at ConAgra Foods, Inc. (a packaged foods company).
Daphne E. Jones, age 53, is Hospira's Senior Vice President and Chief Information Officer. Ms. Jones has served in that position since November 2009. Ms. Jones served as the Worldwide Vice President of Information Technology ("IT") and Chief Information Officer for Johnson & Johnson's Ortho-Clinical Diagnostics, Inc. from 2007 to 2009. During 2006, she served in other IT roles at Johnson & Johnson (a global pharmaceutical, medical device and consumer packaged goods manufacturer).
Kenneth F. Meyers, age 49, is Hospira's Senior Vice President, Organizational Transformation and People Development. Mr. Meyers has served in that position since November 2008. From 2006 to 2008, Mr. Meyers served as a partner of Oliver-Wyman-Delta Executive Learning Center (a global management consulting firm).
Sumant Ramachandra, M.D., Ph.D., age 42, is Hospira's Senior Vice President and Chief Scientific Officer. Dr. Ramachandra has served in that position since July 2008. Dr. Ramachandra served as Vice
28
Table of Contents
President and Senior Project Leader, Global Development, at Schering-Plough, a global healthcare company, from 2006 to 2008.
Brian J. Smith, age 59, is Hospira's Senior Vice President, General Counsel and Secretary. He has served in such position since the spin-off in April 2004.
Ron Squarer, age 44, is Hospira's Senior Vice President, Chief Commercial Officer. He has served in such position since February 2010. From 2009 to 2010, Mr. Squarer served as Senior Vice President, Global Marketing and Corporate Development. Mr. Squarer served as Hospira's Corporate Vice President, Global Strategy and Business Development from 2007 to 2008, and as Senior Vice President, Global Corporate and Business Development at Mayne Pharma, Ltd. (an Australia-based specialty injectable pharmaceutical company) from 2006 to 2007.
Thomas E. Werner, age 53, is Hospira's Senior Vice President, Finance and Chief Financial Officer. He has served in such position since August 2006. Prior to joining Hospira, Mr. Werner served as Senior Vice President, Finance and Chief Financial Officer of Böwe Bell + Howell, a service, manufacturing and software company that provides document processing and postal solutions.
Richard J. Hoffman, age 44, is Hospira's Corporate Vice President, Controller and Chief Accounting Officer. He has served in such position since August 2009. From August 2007 to August 2009, he served as Hospira's Vice President, Corporate Controller and Chief Accounting Officer. From 2006 until his appointment by Hospira, Mr. Hoffman was employed by CNH Global N.V. (Case New Holland—a global agricultural and construction equipment manufacturer with a captive financial services company).
29
Table of Contents
PART II
Item 5. Market for Registrant's Common Equity, Related Stockholder Matters and Issuer Purchases of Equity Securities
Market for Common Stock
Hospira's common stock is listed and traded on the New York Stock Exchange ("NYSE") under the symbol "HSP." The following table sets forth the high and low closing prices for Hospira's common stock on the NYSE for each period indicated.
| | | | | | | | | | | | | |
| | Market Price Per Share | |
|---|
| | 2010 | | 2009 | |
|---|
For the quarter ended: | | High | | Low | | High | | Low | |
|---|
March 31 | | $ | 57.38 | | $ | 48.56 | | $ | 30.86 | | $ | 21.38 | |
June 30 | | $ | 57.97 | | $ | 50.11 | | $ | 38.82 | | $ | 30.44 | |
September 30 | | $ | 59.75 | | $ | 50.26 | | $ | 44.87 | | $ | 36.12 | |
December 31 | | $ | 59.65 | | $ | 54.83 | | $ | 51.11 | | $ | 43.25 | |
As of February 9, 2011, Hospira had approximately 35,678 shareholders of record. Hospira has not paid any dividends on its common stock.
Issuer Purchases of Equity Securities
The following table gives information on a monthly basis regarding purchases made by Hospira of its common stock during the fourth quarter of 2010.
| | | | | | | | | | | | | |
Period | | Total Number of
Shares Purchased(1)(2) | | Average
Price Paid
per Share | | Total
Number of
Shares
Purchased as
Part of
Publicly
Announced
Plans or
Programs(2) | | Maximum Number
(or Approximate Dollar
Value) of Shares that
May Yet be Purchased
Under the Plans or
Programs(2) | |
|---|
October 1 - October 31, 2010 | | | 51,603 | | $ | 57.00 | | | — | | $ | 50,233,606 | |
November 1 - November 30, 2010 | | | 190,749 | | | 58.55 | | | 169,344 | | | 50,233,606 | |
December 1 - December 31, 2010 | | | 684,645 | | | 56.92 | | | 680,704 | | | — | |
| | | | | | | | | | |
Total | | | 926,997 | | $ | 57.26 | | | 850,048 | | $ | — | |
- (1)
- In addition to the shares purchased as part of the publicly announced Plan, these shares represent the shares deemed surrendered to Hospira to pay the exercise price and to satisfy minimum statutory tax withholding obligations in connection with the exercise of employee stock options. For further details regarding employee stock options, see Note 21, to the consolidated financial statements included in Item 8. These shares include the shares purchased on the open market for the benefit of participants in the Hospira Healthcare Corporation ("Hospira Canada") Stock Purchase Plan—1,150 in October, 1,000 in November, and 1,800 in December.
- (2)
- In February 2006, Hospira's board of directors authorized the repurchase of up to $400.0 million of Hospira's common stock in accordance with Rule 10b-18 under the Securities Exchange Act of 1934. As of December 31, 2010, Hospira has repurchased 9.2 million shares for $400.0 million in the aggregate under the 2006 board authorization. In August 2010, Hospira entered into an accelerated share repurchase ("ASR") contract with a third party financial institution to repurchase $50.0 million of Hospira's common stock. Under the ASR, Hospira received 0.9 million shares. In December 2010, Hospira entered into a second ASR contract with a third party financial
30
Table of Contents
institution to repurchase $50.0 million of Hospira's common stock. Under the second ASR, Hospira received 0.7 million shares based on seventy-five percent of the $50.0 million repurchased on the trade date, with the remaining shares to be delivered over the next three months subject to adjustment based on the average stock price during the period. The second ASR was completed and Hospira received an incremental 0.2 million shares on February 7, 2011.
Performance Graph
The following graph compares the performance of Hospira common stock for the periods indicated with the performance of the S&P 500 Stock Index and the S&P Health Care Index.
Comparison of Cumulative Total Return
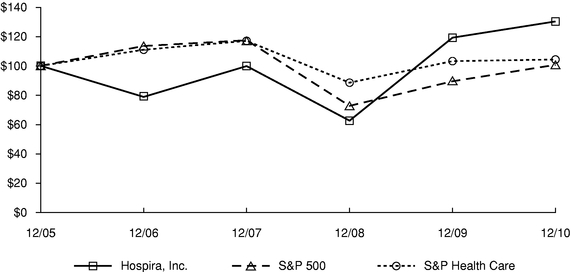
Assumes $100 was invested on December 31, 2005 in Hospira common stock and each index. Values are as of the close of the U.S. stock markets on December 31, 2006, 2007, 2008, 2009 and 2010, and assume dividends are reinvested. No cash dividends have been declared or paid on Hospira common stock. Returns over the indicated period may not be indicative of future returns.
31
Table of Contents
Item 6. Selected Financial Data
The following tables set forth Hospira's selected financial information derived from its audited consolidated financial statements as of, and for the years ended, December 31, 2010, 2009, 2008, 2007 and 2006.
The selected financial information should be read in conjunction with "Item 7. Management's Discussion and Analysis of Financial Condition and Results of Operations" and Hospira's audited financial statements included in Item 8.
| | | | | | | | | | | | | | | | | |
| | For the Years Ended December 31, | |
|---|
(dollars in millions, except per share amounts) | | 2010 | | 2009 | | 2008 | | 2007 | | 2006 | |
|---|
Statements of Income Data: | | | | | | | | | | | | | | | | |
Net sales(1) | | $ | 3,917.2 | | $ | 3,879.3 | | $ | 3,629.5 | | $ | 3,436.2 | | $ | 2,688.5 | |
Gross profit(2) | | | 1,514.4 | | | 1,456.4 | | | 1,342.7 | | | 1,195.7 | | | 974.9 | |
Income from operations(1) | | | 519.2 | | | 502.9 | | | 517.8 | | | 302.6 | | | 339.6 | |
Income before income taxes | | | 391.5 | | | 384.8 | | | 407.5 | | | 187.8 | | | 324.7 | |
Net income | | $ | 357.2 | | $ | 403.9 | | $ | 320.9 | | $ | 136.8 | | $ | 237.7 | |
Earnings per common share: | | | | | | | | | | | | | | | | |
| | Basic | | $ | 2.15 | | $ | 2.51 | | $ | 2.02 | | $ | 0.87 | | $ | 1.51 | |
| | Diluted | | $ | 2.11 | | $ | 2.47 | | $ | 1.99 | | $ | 0.85 | | $ | 1.48 | |
Weighted average common shares outstanding: | | | | | | | | | | | | | | | | |
| | Basic | | | 166.0 | | | 161.0 | | | 159.2 | | | 156.9 | | | 157.4 | |
| | Diluted | | | 169.5 | | | 163.2 | | | 161.3 | | | 160.2 | | | 160.4 | |
- (1)
- As Mayne Pharma was acquired in February 2007, there are no Mayne Pharma net sales in 2006. Income from operations includes acquired in-process research and development charge of $0.5 million, $88.0 million and $10.0 million in 2008, 2007 and 2006, respectively.
- (2)
- Gross profit is defined as Net sales less Cost of products sold.
| | | | | | | | | | | | | | | | |
| | December 31, | |
|---|
(dollars in millions) | | 2010 | | 2009 | | 2008 | | 2007 | | 2006 | |
|---|
Balance Sheet Data: | | | | | | | | | | | | | | | | |
Total assets | | $ | 6,046.3 | | $ | 5,502.9 | | $ | 5,074.1 | | $ | 5,084.7 | | $ | 2,847.6 | |
Long-term debt | | $ | 1,714.4 | | $ | 1,707.3 | | $ | 1,834.0 | | $ | 2,184.4 | | $ | 702.0 | |
32
Table of Contents
Item 7. Management's Discussion and Analysis of Financial Condition and Results of Operations
Overview
Hospira is a global specialty pharmaceutical and medication delivery company that develops, manufactures and markets products that help improve the safety, cost and productivity of patient care. Hospira's portfolio includes generic acute-care and oncology injectables, as well as integrated infusion therapy and medication management products. Hospira's portfolio of products is used by hospitals and alternate site providers, such as clinics, home healthcare providers and long-term care facilities.
Acquisitions
In July 2010, Hospira completed the acquisition of Javelin Pharmaceuticals, Inc. ("Javelin Pharma") for a purchase price of $161.9 million. The purchase price was comprised of $145.2 million, in cash, paid on July 2, 2010 for the outstanding shares of Javelin Pharma and additional consideration provided to Javelin Pharma of $16.7 million in the quarter ended June 30, 2010 in connection with various pre-close operating costs and other liabilities incurred by Javelin Pharma. The acquisition will enable Hospira to take advantage of synergies between Hospira's PrecedexTM and Javelin Pharma's main product candidate, DylojectTM, a post-operative pain management drug currently awaiting U.S. Food and Drug Administration ("FDA") approval. In October 2010, Hospira received a complete response letter from the FDA regarding DylojectTM and Hospira is working to respond to the letter. Hospira and its third party manufacturer continue to work closely with FDA to address any items raised as part of the regulatory process and timing of resolution is uncertain. The future impact of DylojectTM on Hospira depends on the various product development and commercialization efforts, and the timing of resolution of the regulatory process in connection therewith.
In March 2010, Hospira completed its acquisition of the generic injectable pharmaceutical business of Orchid Chemicals & Pharmaceuticals Ltd. ("Orchid Pharma") for $381.0 million which was purchased by and operates under the name Hospira Healthcare India Private Limited ("Hospira India"), a wholly owned subsidiary of Hospira. The acquisition included a beta-lactam antibiotic formulations manufacturing complex and pharmaceutical research and development facility, as well as a generic injectable dosage-form product portfolio and pipeline. Hospira also acquired some of Orchid Pharma's long-term land leases in India, which were held by Orchid Pharma for their anticipated future expansion.
Acquisition related pre-tax charges were recognized, the majority of which was in Selling, general and administrative, during the year ended December 31, 2010 of approximately $20.2 million related to the Javelin Pharma and Hospira India acquisitions. The impact of these acquisitions was not material to Hospira's results of operations for the year ended December 31, 2010, exclusive of the acquisition related charges. For further details, see Note 2 to the consolidated financial statements included in Item 8.
Acquisitions and related transactions are subject to various risks and uncertainties, including risks relating to the integration and risks relating to incurring substantial indebtedness in connection with an acquisition. Please see Part I, "Item 1A. Risk Factors—Hospira may continue to acquire other businesses and assets, license rights to technologies or products from third parties, form alliances or dispose of businesses and assets, and any of these actions may not be completed in a timely or cost-effective manner, or at all."
33
Table of Contents
Governmental Regulation
Hospira's operations and business activities are subject to extensive legal and regulatory requirements. The enactment of the "Patient Protection and Affordable Care Act" on March 23, 2010 and the "Health Care and Education Affordability Reconciliation Act of 2010" on March 30, 2010 (collectively the "Acts") is expected to affect Hospira's business. The Acts increase access to healthcare and establish a United States ("U.S.") pathway for biosimilars. Hospira does not expect a material impact to our business from the proprietary pharmaceutical fee or the closure of the "doughnut hole" components of the Acts. The medical device excise tax will not impact Hospira until 2013. As enacted, Hospira expects the medical device excise tax to have an overall, after-tax impact of approximately $0.10 per share annually. The Acts eliminated the future tax deduction for prescription drug costs associated with Hospira's post-retirement medical and dental plans for which Hospira receives Medicare Part D subsidies. The impact to Hospira was not material. Hospira will continue to evaluate any change to our post-retirement liabilities if new interpretations or final regulations are published.
Cost-Reduction and Optimization Activities
As part of its strategy to improve margins and cash flows, Hospira has taken a number of actions to reduce operating costs and optimize operations. The costs related to these actions consist primarily of severance pay and other employee benefits, accelerated depreciation resulting from the decreased useful lives of buildings and certain equipment, impairments, relocation of production, process optimization implementation, other asset charges, exit costs and gain on disposal of assets. For further details regarding the financial impact of these cost-reduction activities, see Note 3 to the consolidated financial statements included in Item 8.
2009 Actions. In March 2009, Hospira announced details of Project Fuel which has been ongoing over the last two years. Project Fuel has included the following activities: optimizing the product portfolio, evaluating non-strategic assets and streamlining the organizational structure. Hospira expects to incur aggregate charges related to these actions in the range of $140 million to $160 million on a pre-tax basis, of which now approximately $60 million to $70 million are expected to be reported as restructuring costs and other asset charges. The range for restructuring costs and other asset charges was reduced from the originally announced range of $100 million to $110 million, primarily related to reduced inventory write-offs and a decrease in employee-benefit costs. These decreases are off-set by an expected increase in process optimization costs resulting in no change to the aggregate charges related to Project Fuel. During 2010 and 2009, Hospira incurred charges of $39.2 million and $83.7 million with $12.9 million and $50.6 million reported as restructuring and other asset charges, respectively.
As part of Project Fuel initiatives, Hospira committed to dispose of certain non-strategic businesses and the underlying assets. As a result of these decisions and measurement of the fair value of these businesses, non-cash, pre-tax impairment charges of $52.8 million were recognized in Restructuring, impairment and (gain) on disposition of assets, net in 2009. Hospira received cash of $46.6 million upon completion of the disposals of the critical care business and oral pharmaceutical contract manufacturing facility in Salisbury, Australia. In February 2010, Hospira completed the disposal of a facility in Wasserburg, Germany for $69.3 million, which primarily performed contract manufacturing in the EMEA segment. This was comprised of cash proceeds of $62.6 million and an additional $6.7 million due in twelve months from the close of the transaction. Hospira recognized a gain of $11.4 million included in Restructuring, impairment and (gain) on disposition of assets, net.
As Hospira continues to consider each cost reduction and optimization initiative, the amount, timing and recognition of charges will be affected by the occurrence of commitments and triggering
34
Table of Contents
events as defined under accounting principles generally accepted in the United States ("GAAP"), among other factors.
2008 Actions. In April 2008, Hospira announced plans to exit manufacturing operations at its Morgan Hill, California, plant over the next two to three years from the date of announcement. During 2010, 2009 and 2008, Hospira incurred charges of $16.9 million, $15.7 million and $8.8 million, respectively. Hospira now expects to incur aggregate charges through 2011 related to this action in the range of $42 million to $45 million on a pre-tax basis, of which approximately $28 million to $30 million are expected to be reported as restructuring charges. The range for this action was increased from the originally announced range of $29 million to $35 million, primarily related to an increase in accelerated depreciation on the facility due to the deterioration in real estate market value. Hospira has completed the process of transferring related operations and production of products to other Hospira facilities or outsourcing certain product components to third-party suppliers.
2006 Actions. In February 2006, Hospira announced plans to close plants in Ashland, Ohio, Montreal, Canada, and North Chicago, Illinois and completed these plans in 2007, 2008, and 2009, respectively. During 2009 and 2008, Hospira incurred charges of $12.7 million and $26.6 million, respectively.
Restructuring, impairment, optimization costs and gain on disposition of assets incurred for Project Fuel and Facilities Optimization collectively were reported in the consolidated statements of income line items included in Item 8 as follows:
| | | | | | | | | | |
Years Ended December 31 (dollars in millions) | | 2010 | | 2009 | | 2008 | |
|---|
Cost of products sold | | $ | 26.4 | | $ | 40.7 | | $ | 12.4 | |
Restructuring, impairment, and (gain) on diposition of assets, net | | | 7.0 | | | 94.2 | | | 22.4 | |
Research and development | | | 0.1 | | | 3.3 | | | 0.6 | |
Selling, general and administrative | | | 11.2 | | | 26.7 | | | — | |
| | | | | | | | |
Total pre-tax Project Fuel and Facilities Optimization | | $ | 44.7 | | $ | 164.9 | | $ | 35.4 | |
| | | | | | | | |
Hospira aims to achieve a culture of continuous improvement that will enhance its efficiency, effectiveness and competitiveness and substantially improve its cost base. Cost-reduction and optimization activities involve risks and uncertainties. Hospira may incur more charges and cash expenditures than estimated and may not realize the expected cost savings on its planned time frame or at all. See "Part 1, Item 1A. Risk Factors—Hospira's cost-reduction and optimization activities have resulted, and may continue to result, in significant charges and cash expenditures. These activities may disrupt Hospira's business and may not result in the intended cost savings."
Certain Quality and Product Related Matters
Warning Letter (August 2009)
During 2009, Hospira received a warning letter from the FDA related to Hospira's corrective action plans with respect to the failure of certain AC power cords manufactured by a third party. Hospira had recognized charges in 2009 in Cost of products sold for quality assessment and testing, materials, labor and freight to remediate this matter, which were not significant to date to Hospira. The recall was limited to device power cords with a certain prong design that could crack and fail at/or inside the plug. In October 2010, the FDA notified Hospira that it appeared that Hospira had addressed the warning letter deficiencies and that future FDA inspections would further assess the adequacy and sustainability of these corrections. In December 2010, the FDA notified Hospira that the AC power cord recall activities were completed and the FDA considered the recall terminated. Nothing
35
Table of Contents
in either the October or December 2010 letters precludes any future regulatory action by the FDA should violations be observed in subsequent inspections, and these letters do not relieve Hospira from the responsibility to assure compliance with the Food, Drug and Cosmetic Act in the future.
Warning Letter (April 2010)
In April 2010, Hospira received a Warning Letter from the FDA in connection with the FDA's inspection of Hospira's pharmaceutical and device manufacturing facilities located in Rocky Mount, North Carolina and Clayton, North Carolina. In the Warning Letter, the FDA cites Current Good Manufacturing Practice deficiencies related to particulate in certain emulsion products at the Clayton facility and the failure to adequately validate the processes used to manufacture products at the Rocky Mount facility. The Warning Letter also asserts other inadequacies, including procedures related to the Quality Control unit, investigations, and medical reporting obligations. The Warning Letter asserts that some of the deficiencies were repeat observations from a prior inspection conducted in April 2009, and include a similar violation cited in the August 2009 Warning Letter related to the AC power cords. The FDA did not believe that Hospira had identified the root cause(s) of the problems and had adequately resolved them. The Warning Letter also questioned whether Hospira's interim plans ensured the quality of products that were manufactured at the facilities while implementing the corrective actions and validation activities. Hospira has made significant progress on completing a comprehensive review of its manufacturing operations to ensure compliance with applicable regulations.
Hospira has responded to the April 2010 Warning Letter and is working closely with the FDA to conclude these matters. As part of Hospira's response, Hospira took immediate actions to address the FDA's concerns, including recalling the propofol and liposyn products manufactured at the Clayton facility and the fosphenytoin sodium injection products manufactured at the Rocky Mount facility. Hospira is also working with several third party experts to assist with the ongoing activities at both facilities. Hospira has implemented certain interim controls, including third party oversight, to ensure products manufactured at both facilities meet their specifications prior to release. The Warning Letter does not restrict production or shipment of Hospira's products from these facilities but Hospira is holding shipment of certain products pending its further investigation and discussions with the FDA. Hospira resumed shipment of certain products placed on voluntary shipping hold, but cannot predict when all products on voluntary hold will be reintroduced to the market.
During 2010, Hospira recognized pre-tax charges, in Cost of products sold, of $54.3 million for third party oversight and consulting, idle facility costs and penalties for failure to supply product to certain customers under various contracts, all directly associated with Hospira's response to the FDA's Warning Letter received in April 2010. These costs include activities associated with the matters cited above for the Rocky Mount and Clayton facilities as well as Hospira's assessment of the status of its quality operations on a holistic basis throughout its global manufacturing facilities.
SymbiqTM Pumps
In April 2010, Hospira placed a voluntary hold on all shipments to new customers of SymbiqTM, a large volume infusion device. Hospira initiated this hold after it received an unexplained increase in customer complaints related to the failure of the SymbiqTM to alarm at the end of infusion therapy under certain use conditions. In June 2010, Hospira notified customers on interim steps to be taken by customers to mitigate this issue and to avoid the use conditions that can lead to the failure of the SymbiqTM to alarm at the end of infusion therapy. In August 2010, Hospira initiated a set recall related to the issue. Additionally, Hospira notified customers of reports of unrestricted flow when the SymbiqTM infusion set cassette is improperly removed from the pump before the pump's cassette door is fully opened. Hospira cautioned customers to allow the pump's cassette door to fully open before removing the infusion set as the pump may not alarm when the infusion set is improperly removed. The FDA has classified each of these actions as a Class I recall and Hospira is working closely with the
36
Table of Contents
FDA to conclude these matters. Hospira has not asked customers to return or cease using their SymbiqTM pumps. Hospira has recognized charges in Cost of products sold for quality assessment and testing, materials, and labor to remediate these matters, which have not been significant to date to Hospira.
Additionally, Hospira is working to address the failure to alarm issue with a software upgrade package. The software upgrade package submission will be one of the first to follow the guidelines of the new 510K process of the FDA, thus approval timing remains uncertain. New pump placements for SymbiqTM will remain on voluntary hold until we receive FDA approval of our 510K submission. Further, costs for long-term solutions and product improvements will depend on various product development efforts and corresponding regulatory outcomes in connection therewith.
PlumTM Pumps
In December 2010, Hospira informed the FDA that we had received a small number of customer reports associated with the PlumTM pumps regarding failure of the pump's audible alarm under certain conditions. Hospira has provided notice to customers notifying them of the corrective action plan. For the Plum A+TM pumps, the alarm failures are associated with the alarm assembly which will need to be replaced. For the Plum XLTM pumps, the alarm failure is associated with fluid ingress and physical damage to the alarm assembly over time. Plum XLTM customers are being asked to follow the proper cleaning procedure and inspect the alarm assembly for physical damage during routine maintenance. This action is classified as a field recall and FDA is not requiring Hospira to remove PlumTM pumps from the market or halt production. Hospira will service the pumps in the field, for which Hospira recognized a charge of $25.0 million for the estimate of the field recall as of December 31, 2010.
Regulatory Environment and Related Impact
These quality matters have impacted, and may impact further, Hospira's ability to market and sell certain products including Hospira's pumps and certain emulsion products primarily in the Americas segment. Additionally, these quality matters have resulted in, and may further result in, higher customer backlog orders and penalties for failure to supply products, which historically have not been material.
The FDA's Warning Letters are publicly available on the FDA's website. Hospira takes all of these matters seriously and responds fully, and in a timely manner, to the FDA's Warning Letters. Hospira cannot, however, give any assurances as to the expected date of resolution of the matters related to pumps or the matters included in the Warning Letters. While Hospira continues to work to resolve the remaining matters described above, there can be no assurance that additional costs or penalties will not be incurred, and that additional regulatory actions with respect to Hospira will not occur. Until the violations and other product matters are corrected, Hospira may be subject to additional regulatory actions by the FDA, including the withholding of approval of new drug applications, product seizure, injunction, and/or civil monetary penalties. Changes in and stricter enforcement of the laws and regulations impacting Hospira's industry may result in changes to customer buying patterns, increased investment in quality systems and personnel and additional on-market remediation activities being classified as recalls, including improvement related activities that are deemed by the FDA to reduce the risk to health posed by the products. Any such additional FDA actions, or further adverse developments related to pumps, could significantly disrupt our ongoing business and operations and have a material adverse impact on our financial position and operating results. There can be no assurance that the FDA or customers will be satisfied with Hospira's response and corrective actions.
37
Table of Contents
Patent Related Product Matters
Hospira is involved in patent-related disputes with companies with branded products over our attempts to market generic pharmaceutical products. In April 2010, Hospira reached an agreement to settle the U.S. litigation related to oxaliplatin. Pursuant to the settlement, Hospira exited the U.S. market with its oxaliplatin products on June 30, 2010 and is expected to re-launch its products pursuant to a royalty-free license on August 9, 2012.
Hospira is currently awaiting final approvals for an oncolytic drug docetaxel (a generic version of Sanofi-Aventis's Taxotere®) in the U.S. that is the subject of ongoing patent litigation. Once Hospira has final approval for its generic pharmaceuticals in the U.S., we may decide to commercially market these products while the ultimate disposition of legal proceedings has not concluded. Additionally, Hospira received final approval in the U.S. and launched in November 2010 a 2 gram freeze dried powder presentation of gemcitabine (a generic version of Eli Lilly's Gemzar®), that is subject to ongoing patent litigation. If Hospira's products are ultimately found to infringe the patent rights of another company, Hospira may be subject to significant damages, which may be based on the lost profits from the sale of the branded product and/or an injunction preventing Hospira from further sales.
Results of Operations
Net Sales
A comparison of product line net sales is as follows:
| | | | | | | | | | | | | | | | | | | | | | | |
| |
| |
| |
| | Percentage
Change at
Actual
Currency Rates | | Percentage
Change at
Constant
Currency Rates(1) | |
|---|
Years Ended December 31
(dollars in millions) | | 2010 | | 2009 | | 2008 | | 2010 | | 2009 | | 2010 | | 2009 | |
|---|
Americas— | | | | | | | | | | | | | | | | | | | | | | |
| | Specialty Injectable Pharmaceuticals | | $ | 1,829.0 | | $ | 1,589.9 | | $ | 1,328.9 | | | 15.0 | % | | 19.6 | % | | 14.0 | % | | 20.3 | % |
| | Medication Management | | | 827.5 | | | 917.0 | | | 927.4 | | | (9.8 | )% | | (1.1 | )% | | (10.8 | )% | | (0.2 | )% |
| | Other Pharma | | | 481.4 | | | 556.4 | | | 522.0 | | | (13.5 | )% | | 6.6 | % | | (13.7 | )% | | 7.8 | % |
| | | | | | | | | | | | | | | | | | | | |
Total Americas | | | 3,137.9 | | | 3,063.3 | | | 2,778.3 | | | 2.4 | % | | 10.3 | % | | 1.5 | % | | 11.1 | % |
Europe, Middle East & Africa ("EMEA")— | | | | | | | | | | | | | | | | | | | | | | |
| | Specialty Injectable Pharmaceuticals | | | 283.2 | | | 272.0 | | | 287.4 | | | 4.1 | % | | (5.4 | )% | | 7.6 | % | | 2.1 | % |
| | Medication Management | | | 126.6 | | | 142.4 | | | 144.3 | | | (11.1 | )% | | (1.3 | )% | | (7.0 | )% | | 4.9 | % |
| | Other Pharma | | | 78.7 | | | 128.4 | | | 152.1 | | | (38.7 | )% | | (15.6 | )% | | (37.0 | )% | | (8.8 | )% |
| | | | | | | | | | | | | | | | | | | | |
Total EMEA | | | 488.5 | | | 542.8 | | | 583.8 | | | (10.0 | )% | | (7.0 | )% | | (6.8 | )% | | (0.1 | )% |
Asia Pacific ("APAC")— | | | | | | | | | | | | | | | | | | | | | | |
| | Specialty Injectable Pharmaceuticals | | | 237.3 | | | 211.4 | | | 205.4 | | | 12.3 | % | | 2.9 | % | | 0.7 | % | | 7.2 | % |
| | Medication Management | | | 45.0 | | | 45.4 | | | 46.8 | | | (0.9 | )% | | (3.0 | )% | | (9.0 | )% | | (0.4 | )% |
| | Other Pharma | | | 8.5 | | | 16.4 | | | 15.2 | | | (48.2 | )% | | 7.9 | % | | (54.9 | )% | | 17.8 | % |
| | | | | | | | | | | | | | | | | | | | |
Total APAC | | | 290.8 | | | 273.2 | | | 267.4 | | | 6.4 | % | | 2.2 | % | | (4.3 | )% | | 6.5 | % |
| | | | | | | | | | | | | | | | | | | | |
Net Sales | | $ | 3,917.2 | | $ | 3,879.3 | | $ | 3,629.5 | | | 1.0 | % | | 6.9 | % | | — | % | | 9.0 | % |
| | | | | | | | | | | | | | | | | | | | |
- Specialty Injectable Pharmaceuticals include generic injectables and proprietary specialty injectables. As part of Project Fuel, Hospira disposed of the non-strategic critical care business, during 2009. As a result, the former Other Devices product line is now included in a single device product line, Medication Management. Medication Management includes infusion pumps, related
38
Table of Contents
software and services, dedicated administration sets, gravity administration sets, critical care products (through August 2009) and other device products. Other Pharma includes large volume I.V. solutions, nutritionals and contract manufacturing services.
- (1)
- The comparisons at constant currency rates reflect comparative local currency balances at prior years' foreign exchange rates. We have calculated these percentages by taking years ended net sales for the three years presented less the respective prior years ended reported net sales, divided by the respective prior years ended reported net sales, all at the respective prior years' foreign exchange rates. This measure provides information on the change in net sales assuming that foreign currency exchange rates have not changed between the prior and the current period. Management believes the use of this measure aids in the understanding of our change in net sales without the impact of foreign currency and provides greater transparency into Hospira's results of operations. Management uses these measures internally to monitor business unit performance and in evaluating management performance. These measures are intended to supplement the applicable GAAP measures and should not be considered in isolation from or a replacement for, financial measures prepared in accordance with GAAP.
2010 compared to 2009:
Net sales increased 1.0%, or were flat compared to 2009 excluding the impact of changes in foreign exchange rates.
Net sales were impacted by various disposals of non-strategic businesses and underlying assets. These disposals were part of Hospira's commitment to dispose of certain non-strategic businesses and underlying assets as part of Project Fuel and affected the Other Pharma and Medication Management product lines. Other Pharma net sales in all segments decreased due to the disposal of the contract manufacturing facilities in Salisbury, Australia in October 2009 and Wasserburg, Germany in February 2010. Medication Management net sales in all segments decreased due to the disposal of the critical care business in August 2009.
The following discussion, except as noted, reflects changes from the prior period excluding the impact of changes in foreign exchange rates.
Net sales in the Americas segment increased 2.4%, or 1.5% excluding the impact of changes in foreign exchange rates. Net sales of Specialty Injectable Pharmaceuticals ("SIP") increased primarily due to increased volume for PrecedexTM, the launch of generic meropenem and gemcitabine and high-dose heparin introduced in late 2009. The increase was partially offset by a decrease in volume due to a voluntary hold on shipments of certain emulsion products. Other Pharma net sales decreased primarily due to the dispositions noted above and lower volumes in nutritional products. Net sales in Medication Management were lower driven by decreased volumes related to the voluntary hold on shipments of SymbiqTM to new customers, decreased sales of PlumTM and the disposal of the critical care business, partly offset by increased sales of dedicated administration sets.
Net sales in the EMEA segment decreased (10.0)%, or (6.8)% excluding the impact of changes in foreign exchange rates. SIP net sales increased with the introduction of generic docetaxel in a number of European countries during 2010, as well as other oncology product introductions, and continued growth of a biosimilar product, RetacritTM. The increase was partially offset by a decrease in volume and prices for certain oncology products. Other Pharma net sales decreased primarily due to the dispositions noted above. Medication Management net sales decreased due to the disposal of the critical care business and lower volumes of large volume infusion and ambulatory systems partly offset by increased sales in dedicated administration sets.
39
Table of Contents
Net sales in the APAC segment increased 6.4%, but decreased (4.3)% excluding the impact of changes in foreign exchange rates. SIP net sales slightly increased due to higher volumes in Hospira's proprietary sedation drug, PrecedexTM, offset by decreased volume in anti-infective products and decreased prices in oncology products. Other Pharma net sales decreased primarily due to the dispositions noted above. Medication Management net sales decreased due to the disposal of the critical care business, partly offset by higher volumes in dedicated administration sets.
2009 compared to 2008:
Net sales increased 6.9%, or 9.0% excluding the impact of changes in foreign exchange rates. The following discussion, except as noted, reflects changes from the prior period excluding the impact of changes in foreign exchange rates.
Net sales in the Americas segment increased 10.3%, or 11.1% excluding the impact of changes in foreign exchange rates. Net sales of SIP increased primarily due to the product launch of generic oxaliplatin in the U.S. In addition, SIP net sales were higher due to other new product introductions and increased volume for Hospira's proprietary sedation drug PrecedexTM, partially offset by lower anti-infectives volume due to temporary capacity constraints. Other Pharma net sales increased due to higher demand from certain contract manufacturing customers and increased large volume I.V. solutions sales due to additional Group Purchasing Organization ("GPO") contract awards. Net sales in Medication Management were essentially flat with increased volumes in ambulatory and large volume infusion systems, primarily Plum A+TM, and dedicated administration sets, offset by the impact of the disposal of the non-strategic critical care business.
Net sales in the EMEA segment decreased (7.0)%, or (0.1)% excluding the impact of changes in foreign exchange rates. SIP net sales were slightly higher with increases from new product introductions, including RetacritTM, offset by lower price and volume declines on certain existing oncology products. Net sales of Other Pharma were lower due to a decline in demand from certain contract manufacturing customers and a decline in certain low margin compounding products. Net sales in Medication Management increased due to higher sales volume of large volume infusion systems, primarily Plum A+TM and GemStarTM, and dedicated administration sets, offset by the impact of the disposal of the non-strategic critical care business.
Net sales in the APAC segment increased 2.2%, or 6.5% excluding the impact of changes in foreign exchange rates. SIP net sales increased due to higher volume in Hospira's proprietary sedation drug PrecedexTM, cardiovascular-related products, a new oncology product launch and higher other proprietary and differentiated product sales in Australia. Net sales in Medication Management were essentially flat due to higher sales volume of ambulatory infusion systems and dedicated administration sets, offset by the impact of the disposal of the non-strategic critical care business.
Gross Profit (Net sales less Cost of products sold)
| | | | | | | | | | | | | | | | |
| |
| |
| |
| | Percent
change | |
|---|
Years ended December 31 (dollars in millions)
| | 2010
| | 2009
| | 2008
| | 2010
| | 2009
| |
|---|
| | |
Gross profit | | $ | 1,514.4 | | $ | 1,456.4 | | $ | 1,342.7 | | | 4.0 | % | | 8.5 | % |
As a percent of net sales | | | 38.7 | % | | 37.5 | % | | 37.0 | % | | | | | | |
| | |
40
Table of Contents
2010 compared to 2009:
Gross profit increased $58.0 million, or 4.0%, in 2010, compared to 2009.
The gross profit increase was the result of higher sales volume primarily driven by growth in PrecedexTM and new product launches. In addition, cost reductions associated with Project Fuel initiatives and the impact of changes in foreign exchange rates contributed to the increase. These were partly offset by activities and related charges directly associated with the 2010 Warning Letter received from the FDA and voluntary shipment holds on certain products as well as penalties for failure to supply customers and increased product correction charges on these and other products.
2009 compared to 2008:
Gross profit increased $113.7 million, or 8.5%, in 2009, compared to 2008.
The gross profit increase is primarily the result of higher sales volume and favorable product mix including the impact of the U.S. product launch of generic oxaliplatin and higher anesthesia-related product sales, primarily PrecedexTM. In addition, higher production volume and cost reductions associated with Project Fuel and Facilities Optimization initiatives contributed to manufacturing efficiency gains. These increases were partially offset by the impact of changes in foreign exchange rates, costs associated with certain product corrective actions and inventory charges including those related with the Project Fuel product line complexity reduction initiative.
Restructuring, impairment and (gain) on disposition of assets, net
| | | | | | | | | | | | | | | | |
| |
| |
| |
| | Percent
change | |
|---|
Years ended December 31 (dollars in millions)
| | 2010
| | 2009
| | 2008
| | 2010
| | 2009
| |
|---|
| | |
|---|
Restructuring, impairment and (gain) on disposition of assets, net | | $ | 19.7 | | $ | 94.2 | | $ | 22.4 | | | (79.1 | )% | | 320.5 | % |
As a percent of net sales | | | 0.5 | % | | 2.4 | % | | 0.6 | % | | | | | | |
| | |
2010 compared to 2009:
Restructuring, impairment and (gain) on disposition of assets, net were $19.7 million in 2010, compared with $94.2 million in 2009. In February 2010, Hospira completed the disposal of a facility in Wasserburg, Germany, and recognized a gain of $11.4 million. Excluding the gain on the disposal of Wasserburg, restructuring charges were $18.4 million in 2010. In addition, Hospira incurred a charge of $12.7 million in 2010 for the impairment of an anti-infective product right intangible asset. In 2009, Hospira incurred higher impairment charges due to Hospira's commitment to dispose of certain non-strategic businesses and underlying assets. In addition, restructuring charges, primarily severance costs, were higher in 2009 related to Project Fuel and Facilities Optimization.
2009 compared to 2008:
Restructuring, impairment and (gain) on disposition of assets, net were $94.2 million in 2009, compared with $22.4 million in 2008. The increase in Restructuring and impairment was due to non-cash, pre-tax impairment charges of $52.8 million related to property and equipment, allocated goodwill and intangible asset impairments associated with non-strategic businesses and related assets associated with Project Fuel initiatives. In addition to the impairment charges in 2009, restructuring charges of $41.4 million, primarily severance costs, relate to Project Fuel and Facilities Optimization. Restructuring incurred in 2008 was related to Facilities Optimization initiatives.
41
Table of Contents
Research and Development
| | | | | | | | | | | | | | | | |
| |
| |
| |
| | Percent
change | |
|---|
Years ended December 31 (dollars in millions)
| | 2010
| | 2009
| | 2008
| | 2010
| | 2009
| |
|---|
| | |
|---|
Research and development | | $ | 300.5 | | $ | 240.5 | | $ | 212.4 | | | 24.9 | % | | 13.2 | % |
As a percent of net sales | | | 7.7 | % | | 6.2 | % | | 5.9 | % | | | | | | |
| | |
2010 compared to 2009:
Research and development ("R&D") expenses increased $60.0 million, or 24.9%, in 2010, compared to 2009. The increase was primarily related to initial milestone payments for collaborative agreements for research and development of $27.5 million for an anesthetic product and $21.3 million for a hematology product, that have not yet reached regulatory approval. In addition, investments in various new product development programs, including biosimilars and clinical trials, contributed to the increase.
2009 compared to 2008:
R&D expenses increased $28.1 million, or 13.2%, in 2009, compared to 2008. The increase was primarily related to investments in various new product development programs, including biosimilars, and charges of $16.0 million related to a third party agreement and corresponding milestone reached for development of an oncology product that has not yet reached regulatory approval. These increases were partially offset by the impact of changes in foreign exchange rates and productivity improvements associated with Project Fuel initiatives.
Selling, General and Administrative
| | | | | | | | | | | | | | | | |
| |
| |
| |
| | Percent
change | |
|---|
Years ended December 31 (dollars in millions)
| | 2010
| | 2009
| | 2008
| | 2010
| | 2009
| |
|---|
| | |
|---|
Selling, general and administrative | | $ | 675.0 | | $ | 618.8 | | $ | 590.1 | | | 9.1 | % | | 4.9 | % |
As a percent of net sales | | | 17.2 | % | | 16.0 | % | | 16.3 | % | | | | | | |
| | |
2010 compared to 2009:
Selling, general and administrative ("SG&A") expenses increased $56.2 million, or 9.1%, in 2010, compared to 2009. The increase was primarily due to acquisition and integration charges associated with the Orchid Pharma and Javelin Pharma acquisitions, higher legal costs, and the RTI litigation settlement and related charges. Higher costs associated with certain sales and promotional expenses, also contributed to the increase, offset by decreased annual incentive compensation provisions.
2009 compared to 2008:
SG&A expenses increased $28.7 million, or 4.9%, in 2009, compared to 2008. The increase was primarily due to higher sales force and annual incentive compensation provisions and costs associated with Project Fuel initiatives offset by the impact of changes in foreign exchange rates. In 2008, SG&A includes costs related to Mayne Pharma integration.
Interest Expense
Hospira incurred interest expense of $101.1 million in 2010, $106.3 million in 2009 and $116.2 million in 2008. The decreases in 2010 compared to 2009 and 2009 compared to 2008 were primarily due to lower average outstanding debt and the impact of variable interest rate swaps on fixed rate notes. Refer to the Liquidity and Capital Resources section below, as well as Note 16 to the
42
Table of Contents
consolidated financial statements included in Item 8, for further information regarding Hospira's debt and credit facilities.
Other Expense (Income), Net
Other expense (income), net was $26.6 million in 2010, $11.8 million in 2009 and $(5.9) million in 2008. Other expense (income), net primarily includes amounts relating to foreign currency transaction gains and losses, interest income, equity (income) loss and other items. The increase in 2010 from 2009 was primarily due to the $36.8 million charge incurred for the early extinguishment of 5.55% notes due in 2012 and $8.8 million of impairment charges for certain cost-method investments. The increase of expense in 2009 from 2008 was primarily due to an other-than-temporary impairment charge of $16.6 million. Interest (income) for 2010, 2009 and 2008 was $(9.9) million, $(7.6) million and $(9.3) million, respectively.
Income Tax Expense (Benefit)
The effective tax rate was an expense of 8.8% in 2010, compared to a benefit of (5.0)% in 2009 and an expense of 21.3% in 2008. In 2010, a favorable mix of income in lower tax jurisdictions and substantial increase of expenditures in higher tax jurisdictions resulted in a lower effective tax rate. In 2009, the Internal Revenue Service ("IRS") audit of Hospira's 2004 and 2005 tax returns was completed and the years were effectively settled. The outcome of the IRS audit settlement resulted in a $91.9 million discrete income tax benefit. Excluding the effect of the IRS audit settlement, the 2009 effective tax rate was an expense of 18.9%. The effective tax rates for all three years include certain items such as purchase accounting, integration and restructuring charges and interest expense generating benefits in higher tax rate jurisdictions. The effective tax rates are less than the statutory U.S. federal income tax rate principally due to the benefit of tax exemptions, of varying durations, in certain jurisdictions outside the U.S. as well as lower statutory tax rates in substantially all non-U.S. jurisdictions in which Hospira operates. Additionally in 2009, the effective tax rate was impacted by income tax benefits recognized upon the expiration of statutes of limitation on certain unrecognized tax benefits and lower unrecognized tax benefit accruals. These benefits were partially offset by the establishment of a valuation allowance on certain deferred tax assets associated with the disposal of certain non-strategic assets, the impairment of non-deductible goodwill, as well as the impairment of marketable equity securities without the availability of a statutory tax benefit. On December 17, 2010, U.S. tax legislation was enacted that provided an extension for the 2010 and 2011 tax years of certain expired business tax provisions affecting Hospira which generated a favorable impact in our fourth quarter and full year 2010 U.S. tax expense of $28.0 million.
Liquidity and Capital Resources
Net cash provided by operating activities continues to be Hospira's primary source of funds to finance operating needs, certain acquisitions, capital expenditures and repay debt. Other capital resources include cash on hand, borrowing availability under a revolving credit facility and access to the capital markets. Hospira believes that its current capital resources will be sufficient to finance its operations, including debt service obligations, capital expenditures, acquisitions, product development and investments in cost reduction and optimization activities for the foreseeable future.
Further, Hospira has reviewed its needs in the U.S. for possible repatriation of foreign subsidiary earnings, and continues to indefinitely invest all earnings outside of the U.S. of all foreign subsidiaries to fund foreign investments or meet foreign working capital and plant, property and equipment acquisition needs. Future changes in U.S. tax legislation may require Hospira to reevaluate the need for possible repatriation of foreign subsidiary earnings.
Hospira has incurred and may incur further charges related to certain quality and product related matters that will require cash outflows in the future. These matters are further discussed under the
43
Table of Contents
section "Certain Quality and Product Related Matters" in Item 7. Hospira currently believes current capital resources will be sufficient to fund development costs and charges associated therewith.
Summary of Sources and (Uses) of Cash
| | | | | | | | | | |
Years ended December 31 (dollars in millions)
| | 2010
| | 2009
| | 2008
| |
|---|
| | |
|---|
Operating activities | | $ | 314.9 | | $ | 944.9 | | $ | 584.1 | |
Investing activities | | | (705.4 | ) | | (211.1 | ) | | (264.9 | ) |
Financing activities | | | 35.1 | | | (308.6 | ) | | (60.1 | ) |
| | |
Operating Activities
In 2010, Net Cash Provided by Operating Activities was $314.9 million. The decrease from 2009 is primarily due to the timing of payments of chargebacks and rebates related to 2009 sales of oxaliplatin, increased inventory associated with new product launches and strategic opportunities, and higher income tax payments. Additionally, quality initiatives and employee related payments contributed to the decrease, partially offset by higher trade payables in 2010. Hospira also made a discretionary contribution of $92.0 million to the Hospira Annuity Retirement Plan, the frozen U.S. pension plan, resulting in fully funded status under regulatory guidelines.
In 2009, Net Cash Provided by Operating Activities of $944.9 million was driven by net income of $403.9 million, adjusted for non-cash impairments and inventory charges of $95.8 million. Non-cash depreciation, amortization and stock-based compensation expense and tax-related adjustment totaled $204.3 million. Net cash provided by operating assets and liabilities and Other, net of $240.9 million was primarily associated with the timing of receipt and payments related to 2009 sales of oxaliplatin and lower inventories. Hospira also made a discretionary contribution of $30.0 million to the Hospira Annuity Retirement Plan.
In 2008, Net Cash Provided by Operating Activities of $584.1 million was driven by net income of $320.9 million. Non-cash adjustments to net income primarily consisted of depreciation, amortization, stock-based compensation expense and tax-related adjustments and the net gains on sales of assets and totaled $334.9 million. Net cash used in operating assets and liabilities and Other, net of $(71.7) million was driven by higher trade receivables and higher inventories for planned product launches and increased GPO contract awards, partially offset by higher trade payables.
Investing Activities
In 2010, Net Cash Used in Investing Activities of $705.4 million, an increase from 2009 primarily due to payments of $540.8 million for acquisitions, in addition to higher capital expenditures. Hospira received proceeds of $62.6 million on the disposal of a facility in Wasserburg, Germany in 2010.
In 2009, Net Cash Used in Investing Activities of $211.1 million included capital expenditures of $159.4 million and $86.6 million of payments for acquisitions, contingent consideration on prior acquisitions and other investments, offset by $49.2 million of proceeds from dispositions of businesses and related assets.
In 2008, Net Cash Used in Investing Activities of $264.9 million included capital expenditures of $164.3 million and $50.8 million of payments for certain intangible assets including product rights, primarily acquired in 2007 but paid in 2008, and other investments. Hospira paid $26.1 million for acquisitions and deferred consideration related to acquisitions made by Mayne Pharma in prior years. Also, Hospira purchased $24.5 million of marketable equity securities.
Financing Activities
Net Cash Provided by Financing Activities totaled $35.1 million in 2010, an increase from 2009 primarily due to proceeds received from stock options exercised including the related excess tax benefit
44
Table of Contents
of $174.6 million, partially offset by payments of $100.0 million related to the repurchase of common stock and $36.8 million for the early extinguishment of 5.55% notes due in 2012.
Net Cash Used in Financing Activities totaled $308.6 million in 2009. During 2009, Hospira paid $300.0 million on the maturity of the notes due June 2009 and paid $375.0 million on the notes due in March 2010. Financing activities also include proceeds from the issuance of $250.0 million aggregate principal amount notes and employee stock option exercises and related tax benefits of $123.3 million.
Net Cash Used in Financing Activities totaled $60.1 million in 2008. During 2008, Hospira prepaid $70.7 million in principal amount of the term loan, in addition to the revised required $24.3 million in principal, for a total of $95.0 million. Financing activities also include proceeds from employee stock option exercises and related tax benefits of $28.8 million.
Summary of Financial Position
| | | | | | | |
Years ended December 31 (dollars in millions)
| | 2010
| | 2009
| |
|---|
| | |
|---|
Cash and cash equivalents | | $ | 604.3 | | $ | 946.0 | |
Working capital | | | 1,545.9 | | | 1,644.3 | |
Short-term borrowings and long-term debt | | | 1,747.9 | | | 1,730.9 | |
| | |
Working Capital
The decrease in working capital in 2010 was primarily due to decrease in cash and cash equivalents and an increase in trade account payables, offset by a decrease in chargeback and rebate liabilities associated with generic oxaliplatin due to timing of 2009 claim submissions from wholesalers and the temporary exit from the U.S. market mid-year 2010 pursuant to the litigation settlement. Higher inventory in 2010 was due to inventory build for new product launches and future strategic opportunities. Assets held for sale, net also decreased working capital in 2010 related to Hospira's disposal of a facility in Wasserburg, Germany in 2010.
The increase in working capital in 2009 was primarily due to an increase in cash and cash equivalents and decrease in short-term borrowings due to the payment of $300.0 million on the maturity of the notes due June 2009 and payment of $375.0 million on the notes due in March 2010. Higher collections of gross trade receivables were associated with the launch of generic oxaliplatin while related chargeback and rebate liabilities increased due to timing of end-use customer and claim submissions from wholesalers. In addition, lower inventory in 2009 was due to product portfolio optimization initiatives, higher volume throughput, and planned facility shutdowns in December. Assets held for sale, net and cash received to date also increased working capital in 2009 related to Hospira's commitment to dispose of non-strategic businesses and related assets.
Debt and Capital
Senior Notes. Hospira has $1,700.0 million aggregate principal amount of senior unsecured notes outstanding, including $400.0 million principal amount of 5.90% notes due in June 2014, $250.0 million principal amount of 6.40% notes due May 2015, $550.0 million principal amount of 6.05% notes due in March 2017, and $500.0 million principal amount of 5.60% notes due in September 2040.
In September 2010, Hospira issued in a registered public offering $500.0 million principal amount of 5.60% notes due on September 15, 2040 in a registered public offering. The net proceeds of the notes, after deducting approximately $2.6 million of bond discounts and underwriting fees of $4.4 million, plus cash on-hand were used to extinguish $500.0 million principal amount of 5.55% notes originally due March 2012 and accrued interest in October 2010. Hospira incurred $36.8 million in charges associated with the early extinguishment of the notes. In December 2009, the $375.0 million aggregate principal amount due in March 2010 plus accrued interest was fully paid. In June 2009, Hospira repaid in full the $300.0 million aggregate principal amount of 4.95% notes upon maturity.
45
Table of Contents
In December 2010, Hospira entered into interest rate swaps contracts whereby $250.0 million of the $400.0 million principal amount of 5.90% note due in June 2014 and $150.0 million of the $250.0 million principal amount of 6.40% note due in May 2015 were effectively converted from fixed to floating rate debt. In addition, in June 2010, Hospira terminated interest rate swap contracts originally entered into in 2009 with a total notional amount of $300.0 million, which had effectively converted from fixed to variable rate debt $200.0 million of the $400.0 million principal amount notes due in June 2014 and $100.0 million of the $250.0 million principal amount notes due in May 2015. As a result of the swap terminations, Hospira received $15.4 million in cash, including accrued interest. The corresponding gains related to the basis adjustment of the debt associated with the terminated swap contracts is deferred and amortized as a reduction of interest expense over the remaining term of the related notes. The cash flows from these contracts are reported as operating activities in the Consolidated Statements of Cash Flows. There were no penalties associated with the termination of the interest rate swap agreements.
The senior notes contain customary covenants that limit Hospira's ability to incur secured indebtedness and liens and merge or consolidate with other companies.
Other Borrowings. In connection with acquisitions, facility expansions, international capital structure optimization and equipment lease requirements, Hospira enters into other borrowings including mortgages, lease arrangements and promissory notes. Additionally, Hospira enters into uncommitted lines of credits in certain international countries, available for general entity purposes in their respective countries that are subject to banks' approval. These borrowings bore a weighted average interest rate of approximately 8.3% in 2010, with principal and interest due in various intervals, and are primarily unsecured. As of December 31, 2010 and 2009, Hospira had $33.5 million and $26.5 million, respectively, of other borrowings outstanding, of which $29.0 million and $22.6 million, respectively, were classified as short-term.
Revolving Credit Facility. In 2009, Hospira entered into a new $700.0 million unsecured revolving credit facility (the "Revolver") maturing in October 2012. The Revolver replaced Hospira's prior revolving credit agreement that was scheduled to expire in December 2010. The Revolver is available for general corporate purposes. Borrowings under the Revolver bear interest at LIBOR or a base rate plus, in each case, a margin. Hospira also pays a facility fee on the aggregate amount of the commitments under the Revolver. The annual percentage rates for the LIBOR margin, the base rate margin and the facility fee are 2.5%, 1.5% and 0.5%, respectively, and are subject to increase or decrease if there is a change in Hospira's credit ratings. The amount of available borrowings may be increased to a maximum of $825.0 million, under certain circumstances. As of December 31, 2010, Hospira has not borrowed any amounts under the Revolver.
Debt Covenants. The Revolver has financial covenants that require Hospira to maintain (i) a maximum leverage ratio (consolidated total debt to consolidated net earnings before financing expense, taxes and depreciation, amortization, adjusted for certain non-cash items and agreed-upon restructuring charges ("Adjusted EBITDA")) of not more than 3.25 to 1.0 and (ii) a minimum interest coverage ratio (Adjusted EBITDA to consolidated financing expense) of not less than 5.0 to 1.0. As of December 31, 2010, Hospira was in compliance with all applicable covenants.
46
Table of Contents
Short-Term Borrowings. Hospira entered into short-term borrowings including the Revolver and current portion of Other borrowings as described above. The following table is a summary of additional information related to Hospira's short-term borrowings:
| | | | | | | |
(dollars in millions)
| | Revolver(1)
| | Other
Borrowings
| |
|---|
| | |
|---|
Year ended December 31, 2010, | | | | | | | |
Outstanding balance at year-end | | $ | — | | $ | 29.0 | |
Weighted average interest rate at year-end | | | | | | 10.9 | % |
Average monthly balance during the year-end | | $ | — | | $ | 25.7 | |
Weighted average interest rate during the year-end | | | | | | 8.3 | % |
Maximum month-end balance during the year-end | | $ | — | | $ | 38.6 | |
Three months ended December 31, 2010, | | | | | | | |
Outstanding balance at period end | | $ | — | | $ | 29.0 | |
Weighted average interest rate at period end | | | | | | 10.9 | % |
Average monthly balance during the period end | | $ | — | | $ | 35.3 | |
Weighted average interest rate during the period end | | | | | | 8.7 | % |
Maximum month-end balance during the period end | | $ | — | | $ | 38.6 | |
| | |
- (1)
- During the year ended and three months ended December 31, 2010, Hospira has not borrowed any amounts under the Revolver.
Share Repurchase. In February 2006, Hospira's Board of Directors authorized the repurchase of up to $400.0 million of Hospira's common stock in accordance with Rule 10b-18 under the Securities Exchange Act of 1934. As of December 31, 2010, Hospira has repurchased 9.2 million shares for approximately $400.0 million in the aggregate under the 2006 board authorization. In August 2010, Hospira entered into an accelerated share repurchase ("ASR") contract with a third party financial institution to repurchase $50.0 million of Hospira's common stock. Under the ASR, Hospira received 0.9 million shares. In December 2010, Hospira entered into a second ASR contract with a third party financial institution to repurchase $50.0 million of Hospira's common stock. Under the second ASR, Hospira received 0.7 million shares based on seventy-five percent of the $50.0 million repurchased on the trade date, with the remaining shares to be delivered over the next three months subject to adjustment based on the average stock price during the period. The second ASR was completed and Hospira received an incremental 0.2 million shares on February 7, 2011.
Contractual Obligations and Off-Balance Sheet Arrangements
The following table summarizes Hospira's estimated contractual obligations as of December 31, 2010:
| | | | | | | | | | | | | | | | |
| | Payment Due by Period | |
|---|
(dollars in millions) | | Total | | 2011 | | 2012-2013 | | 2014-2015 | | 2016 and
Thereafter | |
|---|
Debt and interest payments | | $ | 2,951.6 | | $ | 130.3 | | $ | 204.8 | | $ | 822.3 | | $ | 1,794.2 | |
Lease obligations | | | 154.7 | | | 34.3 | | | 54.7 | | | 36.1 | | | 29.6 | |
Purchase commitments(1) | | | 568.0 | | | 537.9 | | | 30.1 | | | — | | | — | |
Other long-term liabilities reflected on the consolidated balance sheet(2) | | | 128.3 | | | — | | | 101.2 | | | 27.1 | | | — | |
Pension funding requirements(3) | | | 1.6 | | | 1.6 | | | — | | | — | | | — | |
| | | | | | | | | | | | |
Total | | $ | 3,804.2 | | $ | 704.1 | | $ | 390.8 | | $ | 885.5 | | $ | 1,823.8 | |
| | | | | | | | | | | | |
- (1)
- Purchase obligations for purchases made in the normal course of business to meet operational and capital requirements. Hospira has committed to make potential future "milestone" payments to third parties as part of in-licensing and development agreements. Payments under these agreements are contingent upon achievement of certain developmental, regulatory and/or
47
Table of Contents
commercial milestones and are not included in the table above. For further details regarding the collaborative arrangements, see Note 4 to the consolidated financial statements included in Item 8.
- (2)
- Includes liability of $83.4 million relating to unrecognized tax benefits, penalties and interest; excludes approximately $84.7 million of other long-term liabilities related primarily to pension and post-retirement benefit obligations.
- (3)
- While Hospira's funding policy requires contributions to Hospira's defined benefit plans equal to the amounts necessary to, at a minimum, satisfy the funding requirements as prescribed by the laws and regulations of each country, Hospira does make discretionary contributions when management determines it is prudent to do so. As of December 31, 2010, the frozen U.S. pension plan is in fully funded status under regulatory guidelines.
Hospira's other commercial commitments as of December 31, 2010, representing commitments not recorded on the balance sheet but potentially triggered by future events, primarily consist of non-debt letters of credit to provide credit support for certain transactions as requested by third parties. In the normal course of business, Hospira provides indemnification for guarantees it arranges in the form of bonds guaranteeing the payment of value added taxes, performance bonds, custom bonds and bid bonds. As of December 31, 2010, Hospira had $34.8 million of these commitments, with a majority expiring in 2011. No amounts have been drawn on these letters of credit or bonds.
Hospira has no material exposures to off-balance sheet arrangements, no special purpose entities and no activities that include non-exchange-traded contracts accounted for at fair value.
Critical Accounting Policies
Critical accounting policies are those policies that require management to make the most difficult, subjective or complex judgments, often because they must estimate the effects of matters that are inherently uncertain and may change in subsequent periods. Critical accounting policies involve judgments and uncertainties that are sufficiently sensitive to result in materially different results under different assumptions and conditions. Hospira believes its most critical accounting policies are those described below. For a detailed discussion of these and other accounting policies, see Note 1 to the consolidated financial statements included in Item 8.
Revenue Recognition
Hospira recognizes revenues from product sales when persuasive evidence of an arrangement exists, delivery has occurred (or services have been rendered), the price is fixed or determinable and collectibility is reasonably assured. For other than certain drug delivery pumps and contract manufacturing, product revenue is recognized when products are delivered to customers and title passes. In certain circumstances, Hospira enters into arrangements in which it commits to provide multiple elements (deliverables) to its customers. Contract manufacturing involves filling customers' active pharmaceutical ingredients ("API") into delivery systems. Under these arrangements, customers' API is often consigned to Hospira and revenue is recorded for the materials and labor provided by Hospira, plus a profit, upon shipment to the customer. Upon recognizing revenue from a sale, Hospira records an estimate for certain items that reduce gross sales in arriving at its reported net sales for each period. These items include chargebacks, rebates and other items (such as cash discounts and returns). Provisions for chargebacks and rebates represent the most significant and complex of these estimates.
Arrangements with Certain Multiple Deliverables—Hospira accounts for sales of drug delivery pumps (pumps) and server-based suite of software applications (software), inclusive of certain software related services, under multi-element arrangements, depending on the functionality of the software associated with the pump, as one or two units of accounting.
48
Table of Contents
Hospira allocates revenue to arrangements with multiple deliverables based on their relative selling prices. In such circumstances, Hospira applies a hierarchy to determine the selling price to be used for allocating revenue to deliverables as follows: (i) vendor-specific objective evidence ("VSOE") of fair value, (ii) third-party evidence of selling price ("TPE"), and (iii) best estimate of the selling price ("ESP"). VSOE generally exists only when Hospira sells the deliverable separately and is the price actually charged by Hospira for that deliverable. Where VSOE and TPE are not available, Hospira's process for determining ESP includes multiple factors that may vary depending upon the unique facts and circumstances related to each deliverable. Key factors considered in developing the ESP for pumps, software and software related services include prices charged by Hospira for similar offerings, historical pricing practices, the market and nature of the deliverable and the relative ESP of certain deliverables compared to the total selling price of the arrangement.
For certain arrangements where the software is not essential to the functionality of the pump, Hospira has identified three primary deliverables. The first deliverable is the pump which is recognized as delivered, the second deliverable is the related sale of disposable products (sets) which are recognized as the products are delivered and the third deliverable is the software and software related services. Revenue recognition for the third deliverable is further described below in the Software section. The allocation of revenue for the first and second deliverable is based on VSOE and for the third deliverable is based on Hospira's ESP.
For other arrangements where the software is essential to the functionality of the pump, Hospira has also identified three primary deliverables. The first deliverable is the pump and software essential to the functionality of the pump which is delivered and recognized at the time of installation. The second deliverable is the related sale of sets which are recognized as the products are delivered and the third deliverable is software related services. Revenue recognition for the third deliverable is further described below in the Software section. The allocation of revenue for the first deliverable is based on Hospira's ESP. The allocation of revenue for the second deliverable is based on VSOE and for the third deliverable is based on Hospira's ESP.
Software—Hospira accounts for the server-based suite of software applications not essential to the functionality of a pump and related maintenance and implementation services in accordance with industry specific accounting guidance for software and software-related transactions. For such transactions, revenue on arrangements that include multiple elements is allocated to each element based on the relative fair value of each element, and fair value is generally determined by VSOE. If Hospira cannot objectively determine the fair value of any undelivered element included in such multiple-element arrangements, Hospira defers revenue until all elements are delivered and services have been performed. Perpetual software license revenue and implementation service revenue are generally recognized as obligations are completed. Software subscription license and software maintenance revenue is recognized ratably over the applicable contract period.
Chargebacks—Hospira sells a significant portion of its specialty injectable pharmaceutical products through wholesalers, which maintain inventories of Hospira products and later sell those products to end customers. In connection with its sales and marketing efforts, Hospira negotiates prices with end customers for certain products under pricing agreements (including, for example, group purchasing organization contracts). Consistent with industry practice, the negotiated end customer prices are typically lower than the prices charged to the wholesalers. When an end customer purchases a Hospira product that is covered by a pricing agreement from a wholesaler, the end customer pays the wholesaler the price determined under the pricing agreement. The wholesaler is then entitled to charge Hospira back for the difference between the price the wholesaler paid Hospira and the contract price paid by the end customer (a "chargeback").
Hospira records the initial sale to a wholesaler at the price invoiced to the wholesaler and at the same time, records a provision equal to the estimated amount the wholesaler will later charge back to
49
Table of Contents
Hospira, reducing gross sales and trade receivables. This provision must be estimated because the actual end customer and applicable pricing terms may vary at the time of the sale to the wholesaler. Accordingly, the most significant estimates inherent in the initial chargeback provision relate to the volume of sales to the wholesalers that will be subject to chargeback and the ultimate end customer contract price. These estimates are based primarily on an analysis of Hospira's product sales and most recent historical average chargeback credits by product, estimated wholesaler inventory levels, current contract pricing, anticipated future contract pricing changes and claims processing lag time. Hospira estimates the levels of inventory at the wholesalers through analysis of wholesaler purchases and inventory data obtained directly from certain wholesalers. Hospira regularly monitors the provision for chargebacks and makes adjustments when it believes the actual chargebacks may differ from earlier estimates. The methodology used to estimate and provide for chargebacks was consistent across all periods presented.
Hospira's total chargeback accrual for all products was $129.7 million and $177.0 million at December 31, 2010 and 2009, respectively, and included in Trade receivables. Settlement of chargebacks generally occurs between 25 and 35 days after the sale to wholesalers. A one percent decrease in end customer contract prices for sales pending chargeback at December 31, 2010, would decrease net sales and income before income taxes by approximately $1.8 million. A one percent increase in units sold subject to chargebacks held by wholesalers at December 31, 2010, would decrease net sales and income before income taxes by approximately $1.1 million.
Rebates—Hospira offers rebates to direct customers, customers who purchase from certain wholesalers at end customer contract prices and government agencies, which administer various programs such as Medicaid. Direct rebates are generally rebates paid to direct purchasing customers based on a contracted discount applied to the direct customer's purchases. Indirect rebates are rebates paid to "indirect customers" that have purchased Hospira products from a wholesaler under a pricing agreement with Hospira. Governmental agency rebates are amounts owed based on legal requirements with public sector benefit providers (such as Medicaid), after the final dispensing of the product by a pharmacy to a benefit plan participant. Rebate amounts are usually based upon the volume of purchases. Hospira estimates the amount of the rebate due at the time of sale, and records the liability and a reduction of gross sales at the same time the product sale is recorded. Settlement of the rebate generally occurs from 1 to 15 months after sale.
In determining provisions for rebates to direct customers, Hospira considers the volume of eligible purchases by these customers and the rebate terms. In determining rebates on sales through wholesalers, Hospira considers the volume of eligible contract purchases, the rebate terms and the estimated level of inventory at the wholesalers that would be subject to a rebate, which is estimated as described above under "Chargebacks." Upon receipt of a chargeback, due to the availability of product and customer specific information, Hospira can then establish a specific provision for fees or rebates based on the specific terms of each agreement. Rebates under governmental programs are based on the estimated volume of products sold subject to these programs. Each period the estimates are reviewed and revised, if necessary, in conjunction with a review of contract volumes within the period.
Hospira regularly analyzes the historical rebate trends and makes adjustments to recorded reserves for changes in trends and terms of rebate programs. At December 31, 2010 and 2009, accrued rebates of $137.0 million and $156.0 million, respectively, are included in Other accrued liabilities on the consolidated balance sheet. The methodology used to estimate and provide for rebates was consistent across all periods presented.
50
Table of Contents
The following table is an analysis of chargebacks and rebates for years ended 2010 and 2009:
| | | | | | | |
(dollars in millions) | | Chargebacks | | Rebates | |
|---|
Balance at January 1, 2009 | | $ | 60.2 | | $ | 107.4 | |
Provisions | | | 1,041.1 | | | 269.2 | |
Payments | | | (924.3 | ) | | (220.6 | ) |
| | | | | | |
Balance at December 31, 2009(1) | | | 177.0 | | | 156.0 | |
| | | | | | |
Provisions | | | 934.5 | | | 273.0 | |
Payments and releases(2) | | | (981.8 | ) | | (292.0 | ) |
| | | | | | |
Balance at December 31, 2010(1) | | $ | 129.7 | | $ | 137.0 | |
| | | | | | |
- (1)
- Hospira's generic oxaliplatin sales, launched in the U.S. in 2009 and temporarily exited the market in June 2010, contributed to the increase and subsequent decrease in the chargebacks and rebate accrual.
- (2)
- Hospira released $33.8 million for a portion of the chargeback accrual relating to 2009 in 2010 for oxaliplatin sales as the expected rate of price decrease was less than estimated and typically experienced in generic product launches. Adjustments for rebates related to prior period sales have not been material in any period.
Returns—Provisions for returns are provided for at the time the related sales are recognized, and are reflected as a reduction of sales. The estimate of the provision for returns is primarily based on historical experience of actual returns. Additionally, Hospira considers other factors such as levels of inventory in the distribution channel, product dating and expiration period, whether products have been discontinued and entrance in the market of additional competition. This estimate is reviewed periodically and, if necessary, revised, with any revisions recognized immediately as adjustments to net sales.
Inventories
Inventories are stated at the lower of cost (first-in, first-out basis) or market. Inventory cost includes material and conversion costs. Hospira monitors inventories for exposures related to obsolescence, excess and date expiration, non-conformance, product recalls and loss and damage, and recognizes a charge to cost of products sold for the amount required to reduce the carrying value of inventory to estimated net realizable value. If conditions are less favorable than estimated, additional charges may be required. Such reserves were $100.0 million and $110.7 million at December 31, 2010 and 2009, respectively.
Stock-Based Compensation
In accordance with the provisions of Accounting Standards Codification ("ASC") Topic 718, "Compensation—Stock Compensation," ("ASC 718"), share-based payment transactions are recognized as compensation cost over the vesting period based on the fair value of the instrument on the date of grant. Hospira uses the Black-Scholes option valuation model and the Monte Carlo simulation model to determine the fair value of stock options and performance share awards, respectively. The fair value models include various assumptions, including the expected volatility and expected life of the awards. These assumptions reflect Hospira's best estimates, but they involve inherent uncertainties based on market conditions generally outside of Hospira's control. As a result, if other assumptions had been used, stock-based compensation expense, as calculated could have been materially impacted. Furthermore, if Hospira uses different assumptions in future periods, stock-based compensation
51
Table of Contents
expense could be materially impacted in future periods. See Note 21 to the consolidated financial statements included in Item 8 for additional information regarding stock-based compensation.
Pension and Other Post-Retirement Benefits
Hospira provides pension and other post-retirement medical and dental benefits to certain of its active and retired employees based both in and outside of the U.S. Hospira develops assumptions, the most significant of which are the discount rate, the expected rate of return on plan assets and healthcare cost trend rate. For these assumptions, management consults with actuaries, monitors plan provisions and demographics and reviews public market data and general economic information. These assumptions reflect Hospira's best estimates, but they involve inherent uncertainties based on market conditions generally outside of Hospira's control. Assumption changes could affect the reported funded status of Hospira's plans and, as a result, could result in higher funding requirements and net periodic benefit costs.
The U.S. discount rate estimates were developed with the assistance of actuarially developed yield curves. For non-U.S. plans, benchmark yield data for high-quality fixed income investments for which the timing and amounts of payments match the timing and amounts of projected benefit payments is used to derive discount rate assumptions.
The expected return on assets for the pension plan represents the average rate of return to be earned on plan assets over the period the benefits are expected to be paid. The expected return on assets is developed from the expected future return of each asset class, weighted by the expected allocation of pension assets to that asset class. Hospira considers historical performance for the types of assets in which the plans invest, independent market forecasts and economic and capital market conditions.
Sensitivity analysis for U.S. plans which represent the primary portion of obligations is as follows:
| | | | | | | | | | | | | |
| | Year Ended December 31,
2010 Net Benefit Cost
(Income)/Expense | | As of December 31, 2010
Benefit Obligation
Increase/(Decrease) | |
|---|
(dollars in millions) | | One
Percentage-
Point
Increase | | One
Percentage-
Point
Decrease | | One
Percentage-
Point
Increase | | One
Percentage-
Point
Decrease | |
|---|
Pension Plan—U.S. | | | | | | | | | | | | | |
Discount rate | | $ | (3.1 | ) | $ | 3.6 | | $ | (55.2 | ) | $ | 67.5 | |
Expected long-term return on assets | | | (3.7 | ) | | 3.7 | | | — | | | — | |
Medical and Dental Plan—U.S. | | | | | | | | | | | | | |
Discount rate | | | (0.2 | ) | | 0.2 | | | (4.6 | ) | | 5.5 | |
Expected health care cost trend rate (initial and ultimate) | | | 0.7 | | | (0.6 | ) | | 5.1 | | | (4.4 | ) |
Impairment of Long-Lived and Other Assets
Property and Equipment and Intangible Assets, Net—In accordance with provision of ASC Subtopic 360-10, "Property, Plant, and Equipment: Overall" and ASC Subtopic 350-30, "Intangibles—Goodwill and Other: General Intangibles Other than Goodwill", the carrying value of long-lived assets, including amortizable intangible assets and property and equipment, are reviewed whenever events or changes in circumstances indicate that the related carrying amounts may not be recoverable. Impairment of assets with definite-lives is generally determined by comparing projected undiscounted cash flows to be generated by the asset, or appropriate grouping of assets, to its carrying value. Indefinite-lived intangible asset are tested for impairment at least annually, or more frequently if an event occurs or circumstances change that would reduce the fair value below its carrying value. If an
52
Table of Contents
impairment is identified, a loss is recorded equal to the excess of the asset's net book value over its fair value, and the cost basis is adjusted. Determining the extent of an impairment, if any, typically requires various estimates and assumptions including using management's judgment, cash flows directly attributable to the asset, the useful life of the asset and residual value, if any. When necessary, Hospira uses internal cash flow estimates, quoted market prices and appraisals as appropriate to determine fair value. Actual results could vary from these estimates. In addition, the remaining useful life of the impaired asset is revised, if necessary. Hospira reports assets and related liabilities held for sale at the lower of its carrying value or its estimated net realizable value.
Goodwill—In accordance with the provisions of ASC Subtopic 350-20, "Intangibles—Goodwill and Other: Goodwill" goodwill is not amortized but is tested for impairment at least annually, or more frequently if an event occurs or circumstances change that would reduce the fair value of a reporting unit below its carrying value. Hospira's reporting units are the U.S., Canada, Latin America, EMEA and APAC. The evaluation is based upon the estimated fair value of Hospira's reporting units compared to the net carrying value of assets and liabilities. Hospira uses internal discounted cash flow estimates and market value comparisons to determine estimated fair value. The annual assessment occurs in the third quarter of each year. As of the latest assessment, no impairment was indicated.
Investments—Hospira regularly reviews its investments to determine whether an impairment or other-than-temporary decline in market value exists. Hospira considers factors affecting the investee, factors affecting the industry the investee operates in and general equity market trends. Hospira considers the length of time an investment's market value has been below carrying value and the prospects for recovery to carrying value. When Hospira determines that an impairment or other-than-temporary decline has occurred, the carrying basis of the investment is written down to fair value and the amount of the write-down is included in Other expense (income), net. See Note 5 for more details.
Loss Contingencies
In accordance with the provisions of ASC Topic 450, "Contingencies," loss contingency provisions are recorded for probable losses at management's best estimate of a loss, or when a best estimate cannot be made, a minimum loss contingency amount is recorded. These estimates are often initially developed substantially earlier than the ultimate loss is known, and the estimates are refined each accounting period, as additional information is known. Accordingly, if Hospira is initially unable to develop a best estimate of loss, the minimum amount, which could be zero, is recorded.
Income Taxes
Hospira's provision for income taxes is based on taxable income at statutory tax rates in effect in the various jurisdictions in which Hospira operates. Significant judgment is required in determining the provision for income taxes and in evaluating tax positions that are subject to audits and adjustments. Liabilities for unrecognized tax benefits are established when, despite Hospira's belief that the tax return positions are fully supportable, certain positions are likely to be challenged based on the applicable tax authority's determination of the positions. Such liabilities are based on management's judgment, utilizing internal and external tax advisors and represent management's best estimate as to the likely outcome of tax audits. The provision for income taxes includes the impact of changes to unrecognized tax benefits. Each quarter, Hospira reviews the anticipated mix of income derived from the various taxing jurisdictions and its associated liabilities in accordance with the provisions of ASC Topic 740, "Income Taxes," ("ASC 740"), including the provisions of Accounting for Uncertainty in Income Taxes. ASC 740 prescribes a recognition threshold and measurement attribute for financial statement recognition and measurement of a tax position taken or expected to be taken in a tax return. Deferred income taxes are provided for the tax effect of temporary differences between the tax basis of assets and liabilities and their reported amounts in the financial statements at the enacted statutory rate expected to be in effect when the taxes are paid. Provision for income taxes and foreign
53
Table of Contents
withholding taxes are not provided for undistributed earnings for certain foreign subsidiaries when Hospira intends to reinvest these earnings indefinitely to fund foreign acquisitions or meet working capital and plant and equipment acquisition needs.
Recently Issued and Adoption of New Accounting Standards
The disclosure provided in Note 1 to the consolidated financial statements included in Item 8 hereof is incorporated herein by reference.
Private Securities Litigation Reform Act of 1995—A Caution Concerning Forward-Looking Statements
Under the safe harbor provisions of the Private Securities Litigation Reform Act of 1995, Hospira cautions investors that any forward-looking statements or projections made by Hospira, including those made in this document, are subject to risks and uncertainties that may cause actual results to differ materially from those projected. Economic, competitive, governmental, legal, regulatory, technological and other factors that may affect Hospira's operations are discussed in Part I, Item 1A. Risk Factors, to this Annual Report on Form 10-K.
Item 7A. Quantitative and Qualitative Disclosures About Market Risk
Financial Instrument and Risk Management
Hospira operates globally, and earnings and cash flows are exposed to market risk from changes in currency exchange rates and interest rates. Upon consideration of management objectives, costs and opportunities, Hospira uses derivative instruments, including foreign currency forward exchange contracts and interest rate swaps to manage these risks. Hospira enters into derivative instrument contracts with a diversified group of major financial institutions to limit the amount of credit exposure to nonperformance by any one institution. Hospira does not utilize derivative instruments for trading or speculative purposes.
Foreign Currency Sensitive Financial Instruments
Hospira's operations are exposed to currency exchange-rate risk, which is mitigated by Hospira's use of foreign currency forward exchange contracts ("forward contracts"). The objective is to reduce volatility of earnings and cash flows associated with foreign currency exchange-rate changes. Currency exposures primarily in Euros, Australian dollars, Canadian dollars and British pounds include foreign currency denominated assets and liabilities, commitments and anticipated foreign currency revenue and expenses, including inter-company payables, receivables and loans. These forward contracts are not designated as hedges in accordance with the provisions of ASC Topic 815, "Derivatives and Hedging", and, therefore, changes in the fair value are recognized in earnings in Other expense (income), net, during the term of the forward contract. As of December 31, 2010, Hospira had $31.0 million net notional value of forward contracts purchased primarily dominated in Euros, Australian dollars, Canadian dollars and British pounds that mature within one to six months. Net forward contract income for the years ended December 31, 2010, 2009 and 2008 was $15.3 million, $5.6 million and $1.8 million, respectively. The carrying value and fair value of forward contracts was a net payable of $0.1 million and net receivable of $3.9 million as of December 31, 2010 and 2009, respectively.
As part of its risk management program, Hospira performs a sensitivity analysis of changes in the fair value of foreign currency forward exchange contracts outstanding at December 31, 2010 and, while not predictive in nature, indicated that if the U.S. dollar uniformly fluctuates unfavorably by 10% against all currencies, the net liability balance of $(0.1) million would increase by $(0.8) million.
The sensitivity analysis recalculates the fair value of the foreign currency forward exchange contracts outstanding at December 31, 2010 by replacing the actual exchange rates at December 31,
54
Table of Contents
2010 with exchange rates that are 10% unfavorable to the actual exchange rates for each applicable currency. All other factors are held constant. The sensitivity analysis disregards the possibility that currency exchange rates can move in opposite directions and that gains from one currency may or may not be offset by losses from another currency. The analysis also disregards the offsetting change in value of the underlying hedged transactions and balances.
Interest Rate Sensitive Financial Instruments
Hospira's primary interest rate exposures relate to cash and cash equivalents, and fixed and variable rate debt. The objective in managing exposure to changes in interest rates is to reduce volatility on earnings and cash flows associated with these changes. Hospira utilizes a mix of debt maturities along with both fixed-rate and variable-rate debt to manage changes in interest rates. In 2010, Hospira entered into interest rate swap contracts whereby $200.0 million of the $400.0 million principal amount of 5.90% note due June 2014 and $200.0 million of the $250.0 million principal amount of 6.40% note due in May 2015 were effectively converted from fixed to floating-rate debt.
As part of its risk management program, Hospira performs sensitivity analyses to assess potential gains and losses in earnings relating to hypothetical movements in interest rates associated with outstanding interest rates swap contracts. A 10 basis-point change in interest rates affecting Hospira's interest rate swap contracts, would have an immaterial effect on the annual earnings over the term of the related instruments.
Hospira's investment portfolio of $669.0 million at December 31, 2010, consists of cash and cash equivalents, equity investments in affiliated companies and marketable and cost-method investments. Marketable investments consist of marketable securities classified as available-for-sale. The carrying value of the investment portfolio approximates fair market value at December 31, 2010, and the value at maturity, as the majority of investments consist of securities with maturities of less than three months. Because Hospira's investments consist principally of cash and cash equivalents, a hypothetical one percentage point increase/(decrease) in interest rates, based on average cash and cash equivalents during the year, would increase/(decrease) interest income by approximately $7.8 million.
Hospira has a Revolver that allows borrowings up to $700.0 million for general corporate purposes at variable interest rates. The amount of available borrowings under the Revolver may be increased to a maximum of $825.0 million, under certain circumstances. As of December 31, 2010, Hospira has not borrowed any amounts under the Revolver.
Refer to the Liquidity and Capital Resources section above, as well as Notes 5, 6, 7 and 16 to the consolidated financial statements included in this Annual Report on Form 10-K in Item 8, for further information.
55
Table of Contents
Item 8. Financial Statements and Supplementary Data
INDEX TO CONSOLIDATED FINANCIAL STATEMENTS AND SCHEDULE
| | | | |
Management Report On Internal Control Over Financial Reporting | | | 57 | |
Reports of Independent Registered Public Accounting Firm | | |
58 | |
Consolidated Statements of Income and Comprehensive Income (Loss) for the Years Ended December 31, 2010, 2009 and 2008 | | |
60 | |
Consolidated Statements of Cash Flows for the Years Ended December 31, 2010, 2009 and 2008 | | |
61 | |
Consolidated Balance Sheets as of December 31, 2010 and 2009 | | |
62 | |
Consolidated Statements of Changes in Shareholders' Equity for the Years Ended December 31, 2010, 2009 and 2008 | | |
63 | |
Notes to Consolidated Financial Statements | | |
64 | |
Schedule II—Valuation and Qualifying Accounts | | |
112 | |
56
Table of Contents
MANAGEMENT REPORT ON INTERNAL CONTROL OVER FINANCIAL REPORTING
The management of Hospira, Inc. (the "Company") is responsible for establishing and maintaining adequate internal control over financial reporting. The Company's internal control system was designed to provide reasonable assurance to the Company's management and board of directors regarding the preparation and fair presentation of published financial statements.
All internal control systems, no matter how well designed, have inherent limitations. Therefore, even those systems determined to be effective can provide only reasonable assurance with respect to financial statement preparation and presentation.
Company management assessed the effectiveness of its internal control over financial reporting as of December 31, 2010. In making this assessment, it used the criteria established inInternal Control—Integrated Frameworkissued by the Committee of Sponsoring Organizations of the Treadway Commission. Based on our assessment, we believe that, as of December 31, 2010, the Company's internal control over financial reporting was effective based on those criteria.
The Company's independent registered public accounting firm has issued an audit report on their assessment of the Company's internal control over financial reporting as of December 31, 2010, which is included herein.
| | |
/s/ CHRISTOPHER B. BEGLEY
Chairman of the Board and
Chief Executive Officer
February 16, 2011 | | /s/ THOMAS E. WERNER
Senior Vice President, Finance, and
Chief Financial Officer
February 16, 2011 |
57
Table of Contents
REPORT OF INDEPENDENT REGISTERED PUBLIC ACCOUNTING FIRM
To the Board of Directors and Shareholders of Hospira, Inc.
Lake Forest, Illinois
We have audited the accompanying consolidated balance sheets of Hospira, Inc. and subsidiaries (the "Company") as of December 31, 2010 and 2009, and the related consolidated statements of income and comprehensive income (loss), changes in shareholders' equity, and cash flows for each of the three years in the period ended December 31, 2010. Our audits also included the financial statement schedule listed in the Index at Item 15. These financial statements and financial statement schedule are the responsibility of the Company's management. Our responsibility is to express an opinion on the financial statements and financial statement schedule based on our audits.
We conducted our audits in accordance with the standards of the Public Company Accounting Oversight Board (United States). Those standards require that we plan and perform the audit to obtain reasonable assurance about whether the financial statements are free of material misstatement. An audit includes examining, on a test basis, evidence supporting the amounts and disclosures in the financial statements. An audit also includes assessing the accounting principles used and significant estimates made by management, as well as evaluating the overall financial statement presentation. We believe that our audits provide a reasonable basis for our opinion.
In our opinion, such consolidated financial statements present fairly, in all material respects, the financial position of Hospira, Inc. and subsidiaries as of December 31, 2010 and 2009, and the results of their operations and their cash flows for each of the three years in the period ended December 31, 2010, in conformity with accounting principles generally accepted in the United States of America. Also, in our opinion, such financial statement schedule, when considered in relation to the basic consolidated financial statements taken as a whole, presents fairly, in all material respects, the information set forth therein.
We have also audited, in accordance with the standards of the Public Company Accounting Oversight Board (United States), the Company's internal control over financial reporting as of December 31, 2010, based on the criteria established inInternal Control—Integrated Frameworkissued by the Committee of Sponsoring Organizations of the Treadway Commission and our report dated February 16, 2011 expressed an unqualified opinion on the Company's internal control over financial reporting.
/s/ DELOITTE & TOUCHE LLP
Chicago, Illinois
February 16, 2011
58
Table of Contents
REPORT OF INDEPENDENT REGISTERED PUBLIC ACCOUNTING FIRM
To the Board of Directors and Shareholders of Hospira, Inc.
Lake Forest, Illinois
We have audited the internal control over financial reporting of Hospira, Inc. and subsidiaries (the "Company") as of December 31, 2010, based on criteria established inInternal Control—Integrated Frameworkissued by the Committee of Sponsoring Organizations of the Treadway Commission. The Company's management is responsible for maintaining effective internal control over financial reporting and for its assessment of the effectiveness of internal control over financial reporting, included in the accompanying Management Report on Internal Control Over Financial Reporting. Our responsibility is to express an opinion on the Company's internal control over financial reporting based on our audit.
We conducted our audit in accordance with the standards of the Public Company Accounting Oversight Board (United States). Those standards require that we plan and perform the audit to obtain reasonable assurance about whether effective internal control over financial reporting was maintained in all material respects. Our audit included obtaining an understanding of internal control over financial reporting, assessing the risk that a material weakness exists, testing and evaluating the design and operating effectiveness of internal control based on the assessed risk, and performing such other procedures as we considered necessary in the circumstances. We believe that our audit provides a reasonable basis for our opinion.
A company's internal control over financial reporting is a process designed by, or under the supervision of, the company's principal executive and principal financial officers, or persons performing similar functions, and effected by the company's board of directors, management, and other personnel to provide reasonable assurance regarding the reliability of financial reporting and the preparation of financial statements for external purposes in accordance with generally accepted accounting principles. A company's internal control over financial reporting includes those policies and procedures that (1) pertain to the maintenance of records that, in reasonable detail, accurately and fairly reflect the transactions and dispositions of the assets of the company; (2) provide reasonable assurance that transactions are recorded as necessary to permit preparation of financial statements in accordance with generally accepted accounting principles, and that receipts and expenditures of the company are being made only in accordance with authorizations of management and directors of the company; and (3) provide reasonable assurance regarding prevention or timely detection of unauthorized acquisition, use, or disposition of the company's assets that could have a material effect on the financial statements.
Because of the inherent limitations of internal control over financial reporting, including the possibility of collusion or improper management override of controls, material misstatements due to error or fraud may not be prevented or detected on a timely basis. Also, projections of any evaluation of the effectiveness of the internal control over financial reporting to future periods are subject to the risk that the controls may become inadequate because of changes in conditions, or that the degree of compliance with the policies or procedures may deteriorate.
In our opinion, the Company maintained, in all material respects, effective internal control over financial reporting as of December 31, 2010, based on the criteria established inInternal Control—Integrated Frameworkissued by the Committee of Sponsoring Organizations of the Treadway Commission.
We have also audited, in accordance with the standards of the Public Company Accounting Oversight Board (United States), the consolidated financial statements and financial statement schedule as of and for the year ended December 31, 2010 of the Company and our report dated February 16, 2011 expressed an unqualified opinion on those financial statements and financial statement schedule.
/s/ DELOITTE & TOUCHE LLP
Chicago, Illinois
February 16, 2011
59
Table of Contents
Hospira, Inc.
Consolidated Statements of Income and Comprehensive Income (Loss)
(dollars and shares in millions, except for per share amounts)
| | | | | | | | | | | | |
| | Years Ended December 31, | |
|---|
| | 2010 | | 2009 | | 2008 | |
|---|
Net sales | | $ | 3,917.2 | | $ | 3,879.3 | | $ | 3,629.5 | |
| | | | | | | | |
Cost of products sold | | | 2,402.8 | | | 2,422.9 | | | 2,286.8 | |
Restructuring, impairment and (gain) on disposition of assets, net | | | 19.7 | | | 94.2 | | | 22.4 | |
Research and development | | | 300.5 | | | 240.5 | | | 212.4 | |
Selling, general and administrative | | | 675.0 | | | 618.8 | | | 590.1 | |
| | | | | | | | |
| | Total operating costs and expenses | | | 3,398.0 | | | 3,376.4 | | | 3,111.7 | |
| | | | | | | | |
| | | Income From Operations | | | 519.2 | | | 502.9 | | | 517.8 | |
Interest expense | | | 101.1 | | | 106.3 | | | 116.2 | |
Other expense (income), net | | | 26.6 | | | 11.8 | | | (5.9 | ) |
| | | | | | | | |
| | | Income Before Income Taxes | | | 391.5 | | | 384.8 | | | 407.5 | |
Income tax expense (benefit) | | | 34.3 | | | (19.1 | ) | | 86.6 | |
| | | | | | | | |
| | | Net Income | | $ | 357.2 | | $ | 403.9 | | $ | 320.9 | |
| | | | | | | | |
Earnings Per Common Share: | | | | | | | | | | |
| | | Basic | | $ | 2.15 | | $ | 2.51 | | $ | 2.02 | |
| | | | | | | | |
| | | Diluted | | $ | 2.11 | | $ | 2.47 | | $ | 1.99 | |
| | | | | | | | |
Weighted Average Common Shares Outstanding: | | | | | | | | | | |
| | | Basic | | | 166.0 | | | 161.0 | | | 159.2 | |
| | | | | | | | |
| | | Diluted | | | 169.5 | | | 163.2 | | | 161.3 | |
| | | | | | | | |
Comprehensive Income (Loss): | | | | | | | | | | |
Foreign currency translation adjustments, net of taxes of $0.0 | | $ | 64.5 | | $ | 249.3 | | $ | (307.6 | ) |
Retirement plans liability adjustments, net of taxes of $2.2, $1.4 and $25.3, respectively | | | (3.4 | ) | | (5.4 | ) | | (40.1 | ) |
Unrealized gains (losses) on marketable equity securities, net of taxes of $0.0 | | | 8.6 | | | 6.6 | | | (16.5 | ) |
Reclassification of other-than-temporary impairment charge included in net income | | | — | | | 16.6 | | | — | |
Reclassification of losses on terminated cash flow hedges, net of taxes of $(0.3), $(0.6) and $(0.4), respectively | | | 0.4 | | | 1.0 | | | 0.7 | |
| | | | | | | | |
Other comprehensive income (loss) | | | 70.1 | | | 268.1 | | | (363.5 | ) |
Net Income | | | 357.2 | | | 403.9 | | | 320.9 | |
| | | | | | | | |
Comprehensive Income (Loss) | | $ | 427.3 | | $ | 672.0 | | $ | (42.6 | ) |
| | | | | | | | |
The accompanying notes are an integral part of these consolidated financial statements.
60
Table of Contents
Hospira, Inc.
Consolidated Statements of Cash Flows
(dollars in millions)
| | | | | | | | | | | | |
| | Years Ended December 31, | |
|---|
| | 2010 | | 2009 | | 2008 | |
|---|
Cash Flow From Operating Activities: | | | | | | | | | | |
| | Net income | | $ | 357.2 | | $ | 403.9 | | $ | 320.9 | |
| | Adjustments to reconcile net income to net cash from operating activities | | | | | | | | | | |
| | | Depreciation | | | 164.3 | | | 168.6 | | | 183.2 | |
| | | Amortization of intangible assets | | | 81.6 | | | 61.5 | | | 68.7 | |
| | | Loss on early debt extinguishment | | | 36.8 | | | — | | | — | |
| | | Stock-based compensation expense | | | 47.5 | | | 40.5 | | | 42.0 | |
| | | Deferred income tax and other tax adjustments | | | (14.0 | ) | | (66.3 | ) | | 43.5 | |
| | | Impairment and other asset charges | | | 25.1 | | | 95.8 | | | — | |
| | | Net gains on disposition of assets | | | (11.4 | ) | | — | | | (3.0 | ) |
| | Changes in assets and liabilities | | | | | | | | | | |
| | | Trade receivables | | | (94.5 | ) | | 97.2 | | | (55.4 | ) |
| | | Inventories | | | (201.8 | ) | | 54.4 | | | (117.9 | ) |
| | | Prepaid expenses and other assets | | | (18.5 | ) | | 8.2 | | | 12.9 | |
| | | Trade accounts payable | | | 84.6 | | | (4.2 | ) | | 49.5 | |
| | | Other liabilities | | | (76.0 | ) | | 107.5 | | | 15.8 | |
| | Other, net | | | (66.0 | ) | | (22.2 | ) | | 23.9 | |
| | | | | | | | |
| | | Net Cash Provided by Operating Activities | | | 314.9 | | | 944.9 | | | 584.1 | |
| | | | | | | | |
Cash Flow From Investing Activities: | | | | | | | | | | |
| | Capital expenditures (including instruments placed with or leased to customers of $25.0, $23.0 and $30.5 in 2010, 2009 and 2008, respectively) | | | (208.5 | ) | | (159.4 | ) | | (164.3 | ) |
| | Acquisitions, net of cash acquired, and payments for contingent consideration | | | (540.8 | ) | | (86.6 | ) | | (26.1 | ) |
| | Purchases of intangibles and other investments | | | (18.7 | ) | | (14.3 | ) | | (50.8 | ) |
| | Purchases of marketable securities | | | — | | | — | | | (24.5 | ) |
| | Proceeds from disposition of businesses and assets | | | 62.6 | | | 49.2 | | | 0.8 | |
| | | | | | | | |
| | | Net Cash Used in Investing Activities | | | (705.4 | ) | | (211.1 | ) | | (264.9 | ) |
| | | | | | | | |
Cash Flow From Financing Activities: | | | | | | | | | | |
| | Issuance of long-term debt, net of fees paid | | | 492.5 | | | 246.7 | | | — | |
| | Repayment of long-term debt | | | (500.3 | ) | | (681.2 | ) | | (95.2 | ) |
| | Payment on early debt extinguishment | | | (36.8 | ) | | — | | | — | |
| | Other borrowings, net | | | 5.1 | | | 2.6 | | | 6.3 | |
| | Common stock repurchased | | | (100.0 | ) | | — | | | — | |
| | Excess tax benefit from stock-based compensation arrangements | | | 21.3 | | | 0.8 | | | 1.0 | |
| | Proceeds from stock options exercised | | | 153.3 | | | 122.5 | | | 27.8 | |
| | | | | | | | |
| | | Net Cash Provided by (Used in) Financing Activities | | | 35.1 | | | (308.6 | ) | | (60.1 | ) |
| | | | | | | | |
Effect of exchange rate changes on cash and cash equivalents | | | 13.7 | | | 37.0 | | | (16.4 | ) |
| | | | | | | | |
Net change in cash and cash equivalents | | | (341.7 | ) | | 462.2 | | | 242.7 | |
Cash and cash equivalents at beginning of year | | | 946.0 | | | 483.8 | | | 241.1 | |
| | | | | | | | |
Cash and cash equivalents at end of year | | $ | 604.3 | | $ | 946.0 | | $ | 483.8 | |
| | | | | | | | |
Supplemental Cash Flow Information: | | | | | | | | | | |
Cash paid during the year | | | | | | | | | | |
| | Interest | | $ | 101.8 | | $ | 108.7 | | $ | 120.8 | |
| | Income taxes, net of refunds | | $ | 78.8 | | $ | 28.4 | | $ | 14.9 | |
The accompanying notes are an integral part of these consolidated financial statements.
61
Table of Contents
Hospira, Inc.
Consolidated Balance Sheets
(dollars in millions)
| | | | | | | | | | |
| | December 31, | |
|---|
| | 2010 | | 2009 | |
|---|
Assets | | | | | | | |
Current Assets: | | | | | | | |
| | | Cash and cash equivalents | | $ | 604.3 | | $ | 946.0 | |
| | | Trade receivables, less allowances of $8.2 in 2010 and $6.2 in 2009 | | | 605.0 | | | 498.1 | |
| | | Inventories | | | 955.5 | | | 755.4 | |
| | | Deferred income taxes | | | 165.2 | | | 185.9 | |
| | | Prepaid expenses | | | 43.6 | | | 34.3 | |
| | | Other receivables | | | 103.9 | | | 41.5 | |
| | | Assets held for sale | | | — | | | 65.0 | |
| | | | | | |
| | | | Total Current Assets | | | 2,477.5 | | | 2,526.2 | |
| | | | | | |
Property and equipment, net | | | 1,279.2 | | | 1,147.8 | |
Intangible assets, net | | | 527.7 | | | 406.5 | |
Goodwill | | | 1,471.2 | | | 1,243.4 | |
Deferred income taxes | | | 161.0 | | | 54.5 | |
Investments | | | 64.7 | | | 49.3 | |
Other assets | | | 65.0 | | | 75.2 | |
| | | | | | |
| | | | Total Assets | | $ | 6,046.3 | | $ | 5,502.9 | |
| | | | | | |
Liabilities and Shareholders' Equity | | | | | | | |
Current Liabilities: | | | | | | | |
| | | Short-term borrowings | | $ | 33.5 | | $ | 23.6 | |
| | | Trade accounts payable | | | 320.7 | | | 229.5 | |
| | | Salaries, wages and commissions | | | 136.0 | | | 176.5 | |
| | | Deferred income taxes | | | 0.1 | | | 0.1 | |
| | | Other accrued liabilities | | | 441.3 | | | 438.3 | |
| | | Liabilities related to assets held for sale | | | — | | | 13.9 | |
| | | | | | |
| | | | Total Current Liabilities | | | 931.6 | | | 881.9 | |
| | | | | | |
Long-term debt | | | 1,714.4 | | | 1,707.3 | |
Deferred income taxes | | | 4.4 | | | 18.6 | |
Post-retirement obligations and other long-term liabilities | | | 212.4 | | | 271.4 | |
Commitments and Contingencies | | | | | | | |
Shareholders' Equity: | | | | | | | |
| | Common stock | | | 1.8 | | | 1.7 | |
| | Preferred stock | | | — | | | — | |
| | Treasury stock, at cost | | | (399.8 | ) | | (299.8 | ) |
| | Additional paid-in capital | | | 1,641.9 | | | 1,409.5 | |
| | Retained earnings | | | 1,897.3 | | | 1,540.1 | |
| | Accumulated other comprehensive income (loss) | | | 42.3 | | | (27.8 | ) |
| | | | | | |
Total Shareholders' Equity | | | 3,183.5 | | | 2,623.7 | |
| | | | | | |
Total Liabilities and Shareholders' Equity | | $ | 6,046.3 | | $ | 5,502.9 | |
| | | | | | |
The accompanying notes are an integral part of these consolidated financial statements.
62
Table of Contents
Hospira, Inc.
Consolidated Statements of Changes in Shareholders' Equity
(dollars and shares in millions)
| | | | | | | | | | | | | | | | | | | | | | |
| | Common Stock | |
| |
| |
| | Accumulated
Other
Comprehensive
Income (Loss) | |
| |
|---|
| | Treasury
Stock, at cost | | Additional
Paid-in
Capital | | Retained
Earnings | |
| |
|---|
| | Shares | | Amount | | Total | |
|---|
Balances at January 1, 2008 | | | 158.6 | | $ | 1.7 | | $ | (299.8 | ) | $ | 1,160.2 | | $ | 815.5 | | $ | 67.6 | | $ | 1,745.2 | |
Net income | | | — | | | — | | | — | | | — | | | 320.9 | | | — | | | 320.9 | |
Other comprehensive loss | | | — | | | — | | | — | | | — | | | — | | | (363.5 | ) | | (363.5 | ) |
ASC Topic 718, "Compensation—Retirement Benefits" transition amount, net of tax of $0.1 | | | — | | | — | | | — | | | — | | | (0.2 | ) | | — | | | (0.2 | ) |
Changes in shareholders' equity related to incentive stock programs | | | 1.0 | | | — | | | — | | | 74.0 | | | — | | | — | | | 74.0 | |
| | | | | | | | | | | | | | | | |
Balances at December 31, 2008 | | | 159.6 | | | 1.7 | | | (299.8 | ) | | 1,234.2 | | | 1,136.2 | | | (295.9 | ) | | 1,776.4 | |
| | | | | | | | | | | | | | | | |
Net income | | | — | | | — | | | — | | | — | | | 403.9 | | | — | | | 403.9 | |
Other comprehensive income | | | — | | | — | | | — | | | — | | | — | | | 268.1 | | | 268.1 | |
Changes in shareholders' equity related to incentive stock programs | | | 3.9 | | | — | | | — | | | 175.3 | | | — | | | — | | | 175.3 | |
| | | | | | | | | | | | | | | | |
Balances at December 31, 2009 | | | 163.5 | | | 1.7 | | | (299.8 | ) | | 1,409.5 | | | 1,540.1 | | | (27.8 | ) | | 2,623.7 | |
| | | | | | | | | | | | | | | | |
Net income | | | — | | | — | | | — | | | — | | | 357.2 | | | — | | | 357.2 | |
Other comprehensive income | | | — | | | — | | | — | | | — | | | — | | | 70.1 | | | 70.1 | |
Common stock repurchased | | | (1.6 | ) | | — | | | (100.0 | ) | | — | | | — | | | — | | | (100.0 | ) |
Changes in shareholders' equity related to incentive stock programs | | | 4.8 | | | 0.1 | | | — | | | 232.4 | | | — | | | — | | | 232.5 | |
| | | | | | | | | | | | | | | | |
Balances at December 31, 2010 | | | 166.7 | | $ | 1.8 | | $ | (399.8 | ) | $ | 1,641.9 | | $ | 1,897.3 | | $ | 42.3 | | $ | 3,183.5 | |
| | | | | | | | | | | | | | | | |
The accompanying notes are an integral part of these consolidated financial statements.
63
Table of Contents
Hospira, Inc.
Notes to Consolidated Financial Statements
Note 1—Summary of Significant Accounting Policies
Description of Business
Hospira, Inc. ("Hospira") is a global specialty pharmaceutical and medication delivery company that develops, manufactures and markets products that help improve the safety, cost and productivity of patient care. Hospira's portfolio includes generic acute-care and oncology injectables, as well as integrated infusion therapy and medication management products. Hospira's portfolio of products is used by hospitals and alternate site providers, such as clinics, home healthcare providers and long-term care facilities.
Basis of Presentation
The consolidated financial statements, prepared in conformity with United States ("U.S.") generally accepted accounting principles ("GAAP"), include the accounts of Hospira and all of its controlled majority-owned subsidiaries. All intercompany balances and transactions have been eliminated.
Reclassifications
For comparative purposes, Hospira made certain reclassifications to prior year amounts. In 2010, Hospira reclassified costs that were previously reported in Acquired in-process research and development to Research and development, a separate operating expense line item. Hospira also reclassified amounts previously reported in Write-off of acquired in-process research and development to Other, net, a separate cash flow line item. The reclassifications did not affect net income, net cash provided by operating activities or shareholders' equity.
Use of Estimates
The financial statements include amounts based on estimates and assumptions by management. Actual results could differ from those amounts. Significant estimates include, but are not limited to, provisions for chargebacks and rebates, inventory exposure reserves, income tax liabilities, pension and other post-retirement benefit liabilities and loss contingencies and other costs.
Revenue Recognition
Hospira recognizes revenues from product sales when persuasive evidence of an arrangement exists, delivery has occurred (or services have been rendered), the price is fixed or determinable and collectibility is reasonably assured. For other than certain drug delivery pumps and contract manufacturing, product revenue is recognized when products are delivered to customers and title passes. In certain circumstances, Hospira enters into arrangements in which it commits to provide multiple elements (deliverables) to its customers. Contract manufacturing involves filling customers' active pharmaceutical ingredients ("API") into delivery systems. Under these arrangements, customers' API is often consigned to Hospira and revenue is recorded for the materials and labor provided by Hospira, plus a profit, upon shipment to the customer. Upon recognizing revenue from a sale, Hospira records an estimate for certain items that reduce gross sales in arriving at its reported net sales for each period. These items include chargebacks, rebates and other items (such as cash discounts and returns). Provisions for chargebacks and rebates represent the most significant and complex of these estimates.
64
Table of Contents
Arrangements with Certain Multiple Deliverables—Hospira accounts for sales of drug delivery pumps (pumps) and server-based suite of software applications (software), inclusive of certain software related services, under multi-element arrangements, depending on the functionality of the software associated with the pump, as one or two units of accounting.
Hospira allocates revenue to arrangements with multiple deliverables based on their relative selling prices. In such circumstances, Hospira applies a hierarchy to determine the selling price to be used for allocating revenue to deliverables as follows: (i) vendor-specific objective evidence ("VSOE") of fair value, (ii) third-party evidence of selling price ("TPE"), and (iii) best estimate of the selling price ("ESP"). VSOE generally exists only when Hospira sells the deliverable separately and is the price actually charged by Hospira for that deliverable. Where VSOE and TPE are not available, Hospira's process for determining ESP includes multiple factors that may vary depending upon the unique facts and circumstances related to each deliverable. Key factors considered in developing the ESP for pumps, software and software related services include prices charged by Hospira for similar offerings, historical pricing practices, the market and nature of the deliverable and the relative ESP of certain deliverables compared to the total selling price of the arrangement.
For certain arrangements where the software is not essential to the functionality of the pump, Hospira has identified three primary deliverables. The first deliverable is the pump which is recognized as delivered, the second deliverable is the related sale of disposable products (sets) which are recognized as the products are delivered and the third deliverable is the software and software related services. Revenue recognition for the third deliverable is further described below in the Software section of this Note 1. The allocation of revenue for the first and second deliverable is based on VSOE and for the third deliverable is based on Hospira's ESP.
For other arrangements where the software is essential to the functionality of the pump, Hospira has also identified three primary deliverables. The first deliverable is the pump and software essential to the functionality of the pump which is delivered and recognized at the time of installation. The second deliverable is the related sale of sets which are recognized as the products are delivered and the third deliverable is software related services. Revenue recognition for the third deliverable is further described below in the Software section of this Note 1. The allocation of revenue for the first deliverable is based on Hospira's ESP. The allocation of revenue for the second deliverable is based on VSOE and for the third deliverable is based on Hospira's ESP.
Software—Hospira accounts for the server-based suite of software applications not essential to the functionality of a pump and related maintenance and implementation services in accordance with industry specific accounting guidance for software and software-related transactions. For such transactions, revenue on arrangements that include multiple elements is allocated to each element based on the relative fair value of each element, and fair value is generally determined by VSOE. If Hospira cannot objectively determine the fair value of any undelivered element included in such multiple-element arrangements, Hospira defers revenue until all elements are delivered and services have been performed. Perpetual software license revenue and implementation service revenue are generally recognized as obligations are completed. Software subscription license and software maintenance revenue is recognized ratably over the applicable contract period.
Chargebacks—Hospira sells a significant portion of its specialty injectable pharmaceutical products through wholesalers, which maintain inventories of Hospira products and later sell those products to end customers. In connection with its sales and marketing efforts, Hospira negotiates prices with end customers for certain products under pricing agreements (including, for example, group purchasing organization contracts). Consistent with industry practice, the negotiated end customer prices are typically lower than the prices charged to the wholesalers. When an end customer purchases a Hospira product that is covered by a pricing agreement from a wholesaler, the end customer pays the wholesaler the price determined under the pricing agreement. The wholesaler is then entitled to charge
65
Table of Contents
Hospira back for the difference between the price the wholesaler paid Hospira and the contract price paid by the end customer (a "chargeback").
Hospira records the initial sale to a wholesaler at the price invoiced to the wholesaler and at the same time, records a provision equal to the estimated amount the wholesaler will later charge back to Hospira, reducing gross sales and trade receivables. This provision must be estimated because the actual end customer and applicable pricing terms may vary at the time of the sale to the wholesaler. Accordingly, the most significant estimates inherent in the initial chargeback provision relate to the volume of sales to the wholesalers that will be subject to chargeback and the ultimate end customer contract price. These estimates are based primarily on an analysis of Hospira's product sales and most recent historical average chargeback credits by product, estimated wholesaler inventory levels, current contract pricing, anticipated future contract pricing changes and claims processing lag time. Hospira estimates the levels of inventory at the wholesalers through analysis of wholesaler purchases and inventory data obtained directly from certain wholesalers. Hospira regularly monitors the provision for chargebacks and makes adjustments when it believes the actual chargebacks may differ from earlier estimates. The methodology used to estimate and provide for chargebacks was consistent across all periods presented.
Hospira's total chargeback accrual for all products was $129.7 million and $177.0 million at December 31, 2010 and 2009, respectively, and included in trade receivables. Settlement of chargebacks generally occurs between 25 and 35 days after the sale to wholesalers. A one percent decrease in end customer contract prices for sales pending chargeback at December 31, 2010, would decrease net sales and income before income taxes by approximately $1.8 million. A one percent increase in units sold subject to chargebacks held by wholesalers at December 31, 2010, would decrease net sales and income before income taxes by approximately $1.1 million.
Rebates—Hospira offers rebates to direct customers, customers who purchase from certain wholesalers at end customer contract prices and government agencies, which administer various programs such as Medicaid. Direct rebates are generally rebates paid to direct purchasing customers based on a contracted discount applied to the direct customer's purchases. Indirect rebates are rebates paid to "indirect customers" that have purchased Hospira products from a wholesaler under a pricing agreement with Hospira. Governmental agency rebates are amounts owed based on legal requirements with public sector benefit providers (such as Medicaid), after the final dispensing of the product by a pharmacy to a benefit plan participant. Rebate amounts are usually based upon the volume of purchases. Hospira estimates the amount of the rebate due at the time of sale, and records the liability as a reduction of gross sales at the same time the product sale is recorded. Settlement of the rebate generally occurs from 1 to 15 months after sale.
In determining provisions for rebates to direct customers, Hospira considers the volume of eligible purchases by these customers and the rebate terms. In determining rebates on sales through wholesalers, Hospira considers the volume of eligible contract purchases, the rebate terms and the estimated level of inventory at the wholesalers that would be subject to a rebate, which is estimated as described above under "Chargebacks." Upon receipt of a chargeback, due to the availability of product and customer specific information, Hospira can then establish a specific provision for fees or rebates based on the specific terms of each agreement. Rebates under governmental programs are based on the estimated volume of products sold subject to these programs. Each period the estimates are reviewed and revised, if necessary, in conjunction with a review of contract volumes within the period.
Hospira regularly analyzes the historical rebate trends and makes adjustments to recorded reserves for changes in trends and terms of rebate programs. At December 31, 2010 and 2009, accrued rebates of $137.0 million and $156.0 million, respectively, are included in Other accrued liabilities on the consolidated balance sheet. The methodology used to estimate and provide for rebates was consistent across all periods presented.
66
Table of Contents
Returns—Provisions for returns are provided for at the time the related net sales are recognized, and are reflected as a reduction of sales. The estimate of the provision for returns is primarily based on historical experience of actual returns. Additionally, Hospira considers other factors such as levels of inventory in the distribution channel, product dating and expiration period, whether products have been discontinued, and entrance in the market of additional competition. This estimate is reviewed periodically and, if necessary, revised, with any revisions recognized immediately as adjustments to net sales. Returns reserves were $20.6 million and $18.5 million as of December 31, 2010 and 2009, respectively, and included in Other accrued liabilities on the consolidated balance sheet.
Warranties and other costs
Hospira offers warranties on certain products and generally determines the warranty liability by applying historical claims rate experience and the cost to replace or repair products under warranty. Product warranty reserves were not material at December 31, 2010 and 2009. In addition to product warranties, Hospira accrues for costs of product recalls, corrective actions, and other related costs based on management's best estimates when it is probable a liability has been incurred, management commits to a plan, and/or regulatory requirement dictates the need for corrective action and the amount of loss can be reasonably estimated. Reserves for various product recalls, corrective actions, and other related costs were $38.7 million and $20.4 million as of December 31, 2010 and 2009, respectively, and are included in Other accrued liabilities on the consolidated balance sheet.
Concentration of Risk
Financial instruments that are subject to concentrations of credit risk consist primarily of cash and cash equivalents, marketable securities and trade receivables. Hospira holds cash and invests in cash equivalents and marketable securities with a diversified group of major financial institutions to limit the amount of credit exposure to non-performance by any one institution.
In 2010, 2009 and 2008, no end use customer accounted for more than 10% of net sales (gross sales less reductions for wholesaler chargebacks, rebates, returns and other allowances). For 2010 and 2009, the largest four wholesalers accounted for approximately 38% and 40%, respectively, of net trade receivables. Net sales through the same four wholesalers noted above accounted for approximately 40%, 42% and 38% of global net sales in 2010, 2009 and 2008, respectively. Global net sales related to group purchasing organizations ("GPO") contracts amounted to $1,732.5 million in 2010, $1,705.1 million in 2009 and $1,564.7 million in 2008.
Loss Contingencies
In accordance with the provisions of Accounting Standards Codification ("ASC') Topic 450, "Contingencies" ("ASC 450"), loss contingency provisions are recorded for probable losses at management's best estimate of a loss, or when a best estimate cannot be made, a minimum loss contingency amount is recorded. These estimates are often initially developed substantially earlier than the ultimate loss is known, and the estimates are refined each accounting period, as additional information becomes known. Accordingly, if Hospira is initially unable to develop a best estimate of loss, the minimum amount, which could be zero, is recorded.
Collaborative Arrangements
Hospira enters into collaborative arrangements with third parties for product development and commercialization. These arrangements typically involve two (or more) parties who are active participants in the collaboration and are exposed to significant risks and rewards dependent on the commercial success of the activities. Hospira's rights and obligations under these collaborative
67
Table of Contents
arrangements vary. These collaborations usually involve various activities including research and development, marketing and selling, and distribution.
In general, the income statement presentation for these collaborations is as follows:
| | |
Nature / Type of Collaboration | | Consolidated Statement of
Income Presentation |
|---|
Third party sale of product | | Net sales |
Royalties / milestones paid to collaborative partner (post-regulatory approval)(1) | | Cost of products sold |
Royalties received from collaborative partner | | Net sales |
Upfront payments and milestones paid to collaborative partner (pre-regulatory approval) | | Research and development |
Refundable upfront payments paid to collaborative partner (pre-regulatory approval)(2) | | Research and development or
Cost of products sold |
Research and development payments to collaborative partner | | Research and development |
- (1)
- Milestones are capitalized as intangible assets and amortized to Cost of products sold over the useful life.
- (2)
- Refundable payments for which the contingency is resolved prior to regulatory approval are expensed to Research and development as the contingency becomes probable of being resolved. For refundable payments for which the contingency is regulatory approval, payments are capitalized as intangible assets and amortized to Cost of products sold over the useful life upon receiving regulatory approval.
Each arrangement tends to be unique in nature and Hospira's most significant arrangements are discussed in Note 4.
Research and Development Costs
Internal research and development costs are expensed as incurred. Clinical trial costs incurred by third parties are expensed as the contracted work is performed. Services provided to third parties for research and development is recorded upon completion of all obligations under the contract in Research and development for products in development. Revenue from third-party research and development is not significant.
Income Taxes
Hospira's provision for income taxes is based on taxable income at statutory tax rates in effect in the various jurisdictions in which Hospira operates. Significant judgment is required in determining the provision for income taxes and in evaluating tax positions that are subject to audits and adjustments. Liabilities for unrecognized tax benefits are established when, despite Hospira's belief that the tax return positions are fully supportable, certain positions are likely to be challenged based on the applicable tax authority's determination of the positions. Such liabilities are based on management's judgment, utilizing internal and external tax advisors and represent management's best estimate as to the likely outcome of tax audits. The provision for income taxes includes the impact of changes to unrecognized tax benefits. Each quarter, Hospira reviews the anticipated mix of income derived from the various taxing jurisdictions and its associated liabilities in accordance with the provisions of ASC Topic 740, "Income Taxes," ("ASC 740"), including the provisions of Accounting for Uncertainty in Income Taxes. ASC 740 prescribes a recognition threshold and measurement attribute for financial statement recognition and measurement of a tax position taken or expected to be taken in a tax return. Deferred income taxes are provided for the tax effect of temporary differences between the tax basis of
68
Table of Contents
assets and liabilities and their reported amounts in the financial statements at the enacted statutory rate expected to be in effect when the taxes are paid. Provision for income taxes and foreign withholding taxes are not provided for on undistributed earnings for certain foreign subsidiaries when Hospira intends to reinvest these earnings indefinitely to fund foreign investments or meet working capital and plant and equipment acquisition needs.
Cash and Cash Equivalents
Hospira considers all cash investments purchased with an original maturity of three months or less to be cash equivalents.
Inventories
Inventories are stated at the lower of cost (first-in, first-out basis) or market. Inventory cost includes material and conversion costs. Hospira monitors inventories for exposures related to obsolescence, excess and date expiration, non-conformance, product recalls and loss and damage, and recognizes a charge to cost of products sold for the amount required to reduce the carrying value of inventory to estimated net realizable value. If conditions are less favorable than estimated, additional charges may be required. Such reserves were $100.0 million and $110.7 million at December 31, 2010 and 2009, respectively.
Property and Equipment
Property and equipment are stated at cost and depreciation is provided on a straight-line basis over the estimated useful lives or lease term of the assets. Instruments placed with customers are drug delivery systems placed with or leased to customers under operating leases. See Note 10 for more details.
Capitalized Interest
Hospira follows the provisions of ASC Subtopic 835-20, "Interest: Capitalization of Interest," to determine the interest to be capitalized during the construction period for projects under construction. Hospira recorded capitalized interest of $8.4 million, $5.8 million and $8.0 million in 2010, 2009 and 2008, respectively.
Goodwill and Intangible Assets, Net
Goodwill represents the excess of the purchase price of an acquired business over the amounts assigned to assets and liabilities assumed in the business combination. Goodwill is not amortized. Acquired-in-process research and development ("IPR&D") is accounted for as an indefinite-lived intangible asset until completion, regulatory approval or discontinuation. Upon successful completion or regulatory approval of each project, Hospira will make a determination as to the useful life of the intangible asset and begin amortization. Intangible assets with definite lives are amortized on a straight-line basis over their estimated useful lives.
Capitalized Software Costs
Costs incurred during the application development stage of software projects that are developed or obtained for internal use are capitalized. At December 31, 2010 and 2009, un-depreciated capitalized software costs totaled $85.2 million and $78.1 million, respectively. Such capitalized amounts will be depreciated ratably over the expected useful lives of the projects when they become operational, not to exceed 10 years. Depreciation was $14.5 million, $19.4 million and $16.1 million for the years ended 2010, 2009 and 2008, respectively, and is included in Depreciation in the consolidated statements of cash flows.
69
Table of Contents
Costs incurred during the application development stage for software held for sale are capitalized once a project has reached the point of technological feasibility. Completed projects are amortized after reaching the point of general availability using the straight-line method based on an estimated useful life. Hospira monitors the net realizable value of capitalized software held for sale to ensure that the investment will be recovered through future sales. Unamortized capitalized software cost held for sale was not material at December 31, 2010 and 2009.
Investments
Investments in companies in which Hospira has significant influence, but less than a majority owned controlling interest, are accounted for using the equity method. Significant influence is generally deemed to exist if Hospira has an ownership interest in the voting stock of the investee of between 20% and 50%, although other factors, such as representations on the investee's Board of Directors, are considered in determining whether the equity method of accounting is appropriate.
Investments in companies in which Hospira does not have a controlling interest or is unable to exert significant influence are accounted for at market value if the investments have readily determinable fair values ("available-for-sale investments") or using the cost method if not practicable to estimate the fair value of the investment. Unrealized gains and losses on available-for-sale investments accounted for at market value are reported, net-of-tax, in accumulated other comprehensive income (loss) until the investment is sold or considered other-than-temporarily impaired, at which time the realized gain or loss is charged to Other expense (income), net.
Impairment of Long-Lived Assets and Other Assets
Property and Equipment and Intangible Assets, Net—In accordance with provision of ASC Subtopic 360-10, "Property, Plant, and Equipment: Overall" and ASC Subtopic 350-30, "Intangibles—Goodwill and Other: General Intangibles Other than Goodwill", the carrying value of long-lived assets, including amortizable intangible assets and property and equipment, are reviewed whenever events or changes in circumstances indicate that the related carrying amounts may not be recoverable. Impairment of assets with definite-lives is generally determined by comparing projected undiscounted cash flows to be generated by the asset, or appropriate grouping of assets, to its carrying value. Indefinite-lived intangible asset are tested for impairment at least annually, or more frequently if an event occurs or circumstances change that would reduce the fair value below its carrying value. If an impairment is identified, a loss is recorded equal to the excess of the asset's net book value over its fair value, and the cost basis is adjusted. Determining the extent of an impairment, if any, typically requires various estimates and assumptions including using management's judgment, cash flows directly attributable to the asset, the useful life of the asset and residual value, if any. When necessary, Hospira uses internal cash flow estimates, quoted market prices and appraisals as appropriate to determine fair value. Actual results could vary from these estimates. In addition, the remaining useful life of the impaired asset is revised, if necessary. Hospira reports assets and related liabilities held for sale at the lower of its carrying value or its estimated net realizable value.
Goodwill—In accordance with the provisions of ASC Subtopic 350-20, "Intangibles—Goodwill and Other: Goodwill" goodwill is not amortized but is tested for impairment at least annually, or more frequently if an event occurs or circumstances change that would reduce the fair value of a reporting unit below its carrying value. Hospira's reporting units are the U.S., Canada, Latin America, EMEA and APAC. The evaluation is based upon the estimated fair value of Hospira's reporting units compared to the net carrying value of assets and liabilities. Hospira uses internal discounted cash flow estimates and market value comparisons to determine estimated fair value. The annual assessment occurs in the third quarter of each year. As of the latest assessment, no impairment was indicated.
70
Table of Contents
Investments—Hospira regularly reviews its investments to determine whether an impairment or other-than-temporary decline in market value exists. Hospira considers factors affecting the investee, factors affecting the industry the investee operates in and general equity market trends. Hospira considers the length of time an investment's market value has been below carrying value and the prospects for recovery to carrying value. When Hospira determines that an impairment or other-than-temporary decline has occurred, the carrying basis of the investment is written down to fair value and the amount of the write-down is included in Other expense (income), net. See Note 5 for more details.
Pension and Post-Retirement Benefits
Hospira develops assumptions, the most significant of which are the discount rate, the expected return on plan assets and healthcare cost trend rate. For these assumptions, management consults with actuaries, monitors plan provisions and demographics and reviews public market data and general economic information. These assumptions involve inherent uncertainties based on market conditions generally outside of Hospira's control.
The U.S. discount rate estimates were developed with the assistance of actuarially developed yield curves. For non-U.S. plans, benchmark yield data for high-quality fixed income investments for which the timing and amounts of payments match the timing and amounts of projected benefit payments is used to derive discount rate assumptions.
The expected return on assets for the pension plan represents the average rate of return to be earned on plan assets over the period the benefits are expected to be paid. The expected return on assets is developed from the expected future return of each asset class, weighted by the expected allocation of pension assets to that asset class. Hospira considers historical performance for the types of assets in which the plans invest, independent market forecasts and economic and capital market conditions.
Stock-Based Compensation
In accordance with the provisions of ASC Topic 718, "Compensation—Stock Compensation," ("ASC 718"), share-based payment transactions are recognized as compensation cost over the vesting period based on the fair value of the instrument on the date of grant. Hospira uses the Black-Scholes option valuation model and the Monte Carlo simulation model to determine the fair value of stock options and performance share awards, respectively. The fair value models include various assumptions, including the expected volatility and expected life of the awards. These assumptions involve inherent uncertainties based on market conditions generally outside of Hospira's control. As a result, if other assumptions had been used, stock-based compensation expense, as calculated could have been materially impacted. Furthermore, if Hospira uses different assumptions in future periods, stock-based compensation expense could be materially impacted in future periods.
Translation Adjustments
For foreign operations in highly inflationary economies, translation gains and losses are included in foreign exchange loss (gain), net. For remaining foreign operations, translation adjustments are included as a component of accumulated other comprehensive income (loss).
Recently Issued Accounting Standards
In December 2010, the Financial Accounting Standards Board ("FASB") issued Accounting Standards Update ("ASU") No. 2010-29, Business Combinations (Topic 805), "Disclosure of Supplementary Pro Forma Information for Business Combinations" ("ASU No. 2010-29"). ASU No. 2010-29 requires revenues and earnings of the combined entity be disclosed as if the business
71
Table of Contents
combination occurred as of the beginning of the comparable prior annual reporting period. The ASU also requires additional disclosures about adjustments included in the reported pro forma revenues and earnings. ASU No. 2010-29 is effective prospectively for business combinations for which the acquisition date is on or after fiscal years beginning on or after December 15, 2010. Early adoption is permitted. Hospira is currently evaluating the potential impact of ASU No. 2010-29 on the financial statements disclosures.
In December 2010, the FASB issued ASU No. 2010-27, Other Expenses (Topic 720), "Fees Paid to the Federal Government by Pharmaceutical Manufacturers" ("ASU No. 2010-27"). ASU No. 2010-27 specifies the accounting for annual fees imposed on the pharmaceutical manufacturing industry by the Patient Protection and Affordable Care Acts as amended by the Health Care and Education Reconciliation Act (collectively, the "Acts"). The ASU specify that a liability for the fee should be estimated and recorded in full upon the first qualifying sale with deferred costs amortized to expense on a straight-line basis, unless another method of allocation is more appropriate. ASU No. 2010-27 is effective for calendar years beginning after December 31, 2010. Hospira is currently evaluating the potential impact of ASU No. 2010-27 on the financial statements and related disclosures but does not anticipate a material impact to Hospira.
Adoption of New Accounting Standards
In December 2010, Hospira adopted the provisions of the FASB ASU No. 2010-20, Receivables (Topic 310), "Disclosures about the Credit Quality of Financing Receivables and the Allowance for Credit Losses" ("ASU No. 2010-20"). ASU No. 2010-20 requires disclosures about financing receivables and related credit risk on a disaggregated basis, excluding short-term trade accounts receivables. There was no material impact to Hospira's consolidated financial position, results of operations or cash flows upon adoption of this guidance.
In April 2010, the FASB issued ASU No. 2010-17, Revenue Recognition (Topic 605), "Milestone Method of Revenue Recognition" ("ASU No. 2010-17"). ASU No. 2010-17 establishes a revenue recognition method for contingent consideration that is payable upon the achievement of an uncertain future event, referred to as a milestone. The scope of ASU No. 2010-17 is limited to research and development agreements and is applicable to milestones in multiple-deliverable arrangements involving research and development transactions. The guidance does not preclude the application of any other applicable revenue guidance. The new ASU permits prospective or retrospective adoption, and Hospira elected prospective adoption during the third quarter of 2010. Prospective adoption required Hospira to apply the new ASU to milestones achieved beginning January 1, 2010. There was no material impact to Hospira's consolidated financial position, results of operations or cash flows upon adoption of this guidance.
In March 2010, Hospira adopted the provisions of ASU No. 2010-12, Income Taxes (Topic 740), "Accounting for Certain Tax Effects of the 2010 Health Care Reform Acts" ("ASU No. 2010-12"). On March 30, 2010, the President of the U.S. signed the Health Care and Education Reconciliation Act of 2010, which is a reconciliation bill that amends the Patient Protection and Affordable Act that was signed on March 23, 2010 (collectively, the "Acts"). ASU No. 2010-12 allows entities to consider the two Acts together for accounting purposes. The Acts' elimination of the future tax deduction for prescription drug costs associated with Hospira's post-retirement medical and dental plans for which Hospira receives a Medicare Part D drug subsidy was not material to Hospira's consolidated financial position, results of operations or cash flows upon adoption of this guidance.
In February 2010, Hospira adopted the provisions of ASU No. 2010-09, Subsequent Events (Topic 855), "Amendments to Certain Recognition and Disclosure Requirements" ("ASU No. 2010-09"). ASU No. 2010-09 removes the requirement for an SEC filer to disclose the date through which
72
Table of Contents
subsequent events have been evaluated. There was no material impact to Hospira's consolidated financial position, results of operations or cash flows upon adoption of this guidance.
In January 2010, the FASB issued ASU No. 2010-06, Fair Value Measurements and Disclosures (Topic 820), "Improving Disclosures about Fair Value Measurements" ("ASU No. 2010-06"). ASU No. 2010-06 requires new disclosures about significant transfers in and out of Level 1 and Level 2 fair value measurements and the reasons for such transfers and in the reconciliation for Level 3 fair value measurements to disclose separately information about purchases, sales, issuances and settlements. Hospira adopted the provisions of ASU No. 2010-06 on January 1, 2010, except for disclosures about purchases, sales, issuances and settlements in the reconciliation for Level 3 fair value measurements. Those disclosures will be effective for financial statements issued for fiscal years beginning after December 15, 2010. There was no material impact to Hospira's consolidated financial position, results of operations or cash flows upon adoption of this guidance.
In October 2009, the FASB issued ASU No. 2009-14, Software (Topic 985), "Certain Revenue Arrangements That Include Software Elements" and No. 2009-13, Revenue Recognition (Topic 605), "Multiple-Deliverable Revenue Arrangements" related to revenue recognition for arrangements with multiple deliverables and arrangements that include software elements. The new ASUs permit prospective or retrospective adoption, and Hospira elected prospective adoption during the first quarter of 2010. Prospective adoption required Hospira to apply the new ASUs to revenue arrangements entered into or materially modified beginning January 1, 2010. Upon adoption of this guidance, the timing of revenue recognition has not significantly changed and the impact to Hospira's consolidated financial position, results of operations or cash flows was not material.
Note 2—Business Acquisitions
In July 2010, Hospira completed the acquisition of Javelin Pharmaceuticals, Inc. ("Javelin Pharma") for a purchase price of $161.9 million. The purchase price was comprised of $145.2 million, in cash, paid on July 2, 2010 for the outstanding shares of Javelin Pharma and additional consideration provided to Javelin Pharma of $16.7 million in the quarter ended June 30, 2010 in connection with various pre-close operating costs and other liabilities incurred by Javelin Pharma. The acquisition will enable Hospira to take advantage of synergies between Hospira's PrecedexTM and Javelin Pharma's main product candidate, DylojectTM, a post-operative pain management drug currently awaiting U.S. Food and Drug Administration ("FDA") approval. The impact of this acquisition was not material to Hospira's results of operations in 2010, exclusive of the acquisition charges. During the year ended December 31, 2010, $7.9 million of acquisition related pre-tax charges were recognized in Selling, general and administrative. In October 2010, Hospira received a complete response letter from the FDA regarding DylojectTM and Hospira is working to respond to the letter. Hospira and its third party manufacturer continue to work closely with FDA to address any items, including visual inspection methods and a product particulate matter identified at the acquisition date, raised as part of the regulatory process. Timing of resolution and expected launch of the product is uncertain.
The allocation of the purchase price is preliminary, based on the initial accounting of the assets acquired and liabilities assumed at their respective estimated fair values on the acquisition date of July 2, 2010. In December 2010, Hospira adjusted the preliminary values assigned to certain assets for a product matter which existed as of the acquisition date, based on additional information, obtained since July 2, 2010. The opening balance sheet has been adjusted to reflect these changes, which included an increase to goodwill of $43.2 million, an increase to deferred income taxes, net of $25.9 million, a decrease to IPR&D of $67.7 million and a decrease to intangible assets of $1.4 million. The allocation of the purchase price for intangible assets and IPR&D is pending finalization of the valuation and allocation of goodwill among reporting units. The final allocation of the purchase price may result in
73
Table of Contents
adjustments to the recognized amounts of assets and liabilities, which could be significant. Hospira expects to finalize the preliminary allocation as soon as possible. The preliminary allocation based on management's best estimate is as follows:
| | | | | |
(dollars in millions) | |
| |
|---|
Intangible assets | | $ | 5.4 | |
IPR&D | | | 53.8 | |
Goodwill | | | 68.2 | |
Deferred income taxes, net | | | 39.3 | |
Other liabilities, net | | | (4.8 | ) |
| | | | |
| | Total allocation of purchase price | | $ | 161.9 | |
| | | | |
The $5.4 million of acquired intangible assets includes $4.6 million of developed product rights and $0.8 million of trademarks that will be amortized over their estimated useful lives (10 years). The amount allocated to IPR&D is being accounted for as an indefinite-lived intangible asset until completion, regulatory approval or discontinuation. Upon successful completion or regulatory approval of the project, Hospira will make a determination as to the useful life of the intangible asset and begin amortization. The majority of goodwill, $68.2 million, was assigned to the U.S., Canada, and Latin America ("Americas") segment. Goodwill recorded as part of the acquisition includes the expected synergies and other benefits that Hospira believes will result from the combined operations. Goodwill is not expected to be deductible for tax purposes.
On March 30, 2010, Hospira completed its acquisition of the generic injectable pharmaceutical business of Orchid Chemicals & Pharmaceuticals Ltd. ("Orchid Pharma") for $381.0 million which was purchased by and operates under the name Hospira Healthcare India Private Limited ("Hospira India"), a wholly owned subsidiary of Hospira. The acquisition included a beta-lactam antibiotic formulations manufacturing complex and pharmaceutical research and development facility, as well as a generic injectable dosage-form product portfolio and pipeline. Primarily acquisition related pre-tax charges of $12.3 million were recognized, majority of which was in Selling, general and administrative, during 2010. The impact of this acquisition was not material to Hospira's results of operations in 2010, exclusive of the acquisition related charges.
During the second quarter of 2010, Hospira finalized the allocation of the purchase price for the acquisition by Hospira India based on the assets acquired and liabilities assumed at their respective fair values on the acquisition date of March 30, 2010. The allocation of the purchase price is as follows:
| | | | | |
(dollars in millions) | |
| |
|---|
Current assets, net | | $ | 13.3 | |
Property and equipment | | | 88.0 | |
Intangible assets | | | 88.1 | |
IPR&D | | | 13.3 | |
Goodwill | | | 171.1 | |
Deferred income taxes, net | | | 7.2 | |
| | | | |
| | Total allocation of purchase price | | $ | 381.0 | |
| | | | |
The $88.1 million of acquired intangible assets includes $83.4 million of developed product rights and $4.7 million of customer relationships that will be amortized over their estimated useful lives (5 to 9 years, weighted average 8 years). The amount allocated to IPR&D is being accounted for as an indefinite-lived intangible asset until completion, regulatory approval or discontinuation. Upon successful completion or regulatory approval of each project, Hospira will make a determination as to the useful life of the intangible asset and begin amortization. Of the $171.1 million of goodwill,
74
Table of Contents
$121.5 million was assigned to the Americas segment, $18.4 million was assigned to the EMEA segment, and $31.2 million was assigned to the APAC segment. Goodwill recorded as part of the acquisition includes the expected synergies and other benefits that Hospira believes will result from the combined operations. Goodwill is not expected to be deductible for tax purposes.
In December 2009, Hospira acquired TheraDoc, Inc. and its Infection Control AssistantTM and Antibiotic AssistantTM products, software applications that automate hospital-wide surveillance for infection-related events and optimize the utilization of antimicrobials. The purchase price was $63.3 million, net of cash acquired. The purchase price was allocated to the Americas segment as follows: intangible assets of $17.1 million, mostly technology based, that will be amortized over their estimated useful lives (5 to 8 years, weighted average 6 years); non-tax deductible goodwill of $47.9 million; and other assets, net of $5.1 million. The impact of this acquisition was not material to Hospira's results of operations in 2009.
Hospira acquired Sculptor Developmental Technologies and its VeriScanTM Rx product, a software application that supports bar code medication administration at the point of care. Additionally, Hospira acquired the EndoToolTM glucose management system, a software system that helps establish and maintain patient glycemic control in acute, critical care and operating room settings. The purchase price for the acquisitions combined was allocated to the Americas segment as follows: intangible assets of $10.4 million, mostly technology based, that will be amortized over their estimated useful lives (3 to 7 years, weighted average 5 years); IPR&D of $0.5 million that was expensed at the date of acquisition; non-tax deductible goodwill of $23.3 million; and other (liabilities), net of $(1.7) million. Approximately $15.0 million of deferred consideration related to one of the 2008 acquisitions was paid in 2009. The impact of these acquisitions was not material to Hospira's results of operations in 2008.
Note 3—Restructuring Actions and Asset Impairments
As part of its strategy to improve margins and cash flows, Hospira has taken a number of actions to reduce operating costs and optimize operations. The costs related to these actions consist primarily of severance and other employee benefits, accelerated depreciation resulting from the decreased useful lives of the buildings and certain equipment, impairments, other asset charges, exit costs and gain on disposal of assets.
In March 2009, Hospira announced details of a restructuring and optimization plan, ("Project Fuel,"), which has been ongoing over the last two years. Project Fuel has included the following activities: optimizing the product portfolio, evaluating non-strategic assets and streamlining the organizational structure. Hospira now expects to incur aggregate restructuring costs and other asset charges related to these actions in the range of $60 million to $70 million on a pre-tax basis, a reduction from the originally announced range of $100 million to $110 million, primarily related to reduced inventory write-offs and a decrease in employee-related benefit costs. These decreases are off-set by an increase in process optimization costs, non-restructuring and other asset charges, resulting in no change to the projected aggregate charges related to Project Fuel.
75
Table of Contents
The following summarizes the Project Fuel pre-tax restructuring costs and inventory charges (included in Cost of products sold) for the years ended December 31:
| | | | | | | | | | | | | | | | | | | |
| | Restructuring costs | | Inventory charges | |
|---|
(dollars in millions) | | Aggregrate
to date | | 2010 | | 2009 | | Aggregrate
to date | | 2010 | | 2009 | |
|---|
Americas | | $ | 27.4 | | $ | 4.7 | | $ | 22.7 | | $ | 14.3 | | $ | (4.4 | ) | $ | 18.7 | |
EMEA | | | 6.7 | | | 4.9 | | | 1.8 | | | 6.0 | | | 1.4 | | | 4.6 | |
APAC | | | 4.5 | | | 1.7 | | | 2.8 | | | 4.6 | | | 4.6 | | | — | |
| | | | | | | | | | | | | | |
Total | | $ | 38.6 | | $ | 11.3 | | $ | 27.3 | | $ | 24.9 | | $ | 1.6 | | $ | 23.3 | |
| | | | | | | | | | | | | | |
As part of the Project Fuel initiatives, Hospira committed to dispose of certain non-strategic businesses and the underlying assets. As a result of these commitments, non-cash, pre-tax impairment charges of $52.8 million were recognized in Restructuring, impairment and (gain) on disposition of assets, net during 2009. Additionally, pre-tax inventory charges of $3.1 million were recognized in Cost of products sold. Hospira received cash of $46.6 million upon completion of the disposal of the critical care business and the oral pharmaceutical contract manufacturing facility in Salisbury, Australia ("Salisbury"), and provided certain limited transition services related to critical care products through 2010. Subsequent to the Salisbury transaction close, Hospira will receive contingent consideration based on sales for each of the next six years. In 2010, Hospira completed the disposal of a facility in Wasserburg, Germany for $69.3 million, which primarily performed contract manufacturing in the EMEA segment. This was comprised of cash proceeds of $62.6 million and an additional $6.7 million due in twelve months from the close of the transaction. Hospira recognized a gain of $11.4 million included in Restructuring, impairment and (gain) on disposition of assets, net. As of December 31, 2009, assets held for sale, net related to this facility were as follows:
| | | | | |
(dollars in millions) | |
| |
|---|
Property and equipment, net | | $ | 26.2 | |
Goodwill | | | 17.9 | |
Other assets, net | | | 20.9 | |
| | | | |
| | Total assets held for sale | | $ | 65.0 | |
| | | | |
Post-retirement obligations | | | 7.1 | |
Other liabilities | | | 6.8 | |
| | | | |
| | Total liabilities related to assets held for sale | | $ | 13.9 | |
| | | | |
The following summarizes the Project Fuel asset impairment activity related to the disposal of certain non-strategic businesses and the underlying assets for the year ended December 31, 2009:
| | | | | | | | | | |
(dollars in millions) | | By Segment: | |
| | By Asset: | |
|---|
Americas | | $ | 42.9 | | Property and equipment, net | | $ | 22.7 | |
EMEA | | | 7.6 | | Goodwill | | | 7.6 | |
APAC | | | 2.3 | | Intangible asset | | | 22.5 | |
| | | | | | | | |
| | Total | | $ | 52.8 | | Total | | $ | 52.8 | |
| | | | | | | | |
76
Table of Contents
The following summarizes the Project Fuel restructuring and asset impairment activity for the years ended December 31:
| | | | | | | | | | | | | | | | |
(dollars in millions) | | Employee-Related
Benefit Costs | | Accelerated
Depreciation | | Impairment
Charges | | Other | | Total | |
|---|
Balance at January 1, 2009 | | $ | — | | $ | — | | $ | — | | $ | — | | $ | — | |
Costs incurred | | | 21.1 | | | 2.3 | | | 52.8 | | | 3.9 | | | 80.1 | |
Payments | | | (12.0 | ) | | — | | | — | | | — | | | (12.0 | ) |
Non cash items | | | — | | | (2.3 | ) | | (52.8 | ) | | — | | | (55.1 | ) |
| | | | | | | | | | | | |
Balance at December 31, 2009 | | | 9.1 | | | — | | | — | | | 3.9 | | | 13.0 | |
Costs incurred | | | 8.2 | | | 0.9 | | | — | | | 2.2 | | | 11.3 | |
Payments | | | (15.5 | ) | | — | | | — | | | (2.5 | ) | | (18.0 | ) |
Non cash items | | | — | | | (0.9 | ) | | — | | | (0.2 | ) | | (1.1 | ) |
| | | | | | | | | | | | |
Balance at December 31, 2010 | | $ | 1.8 | | $ | — | | $ | — | | $ | 3.4 | | $ | 5.2 | |
| | | | | | | | | | | | |
In April 2008, Hospira announced a plan to exit manufacturing operations at its Morgan Hill, California, plant over the next two to three years from the date of announcement. Hospira now expects to incur aggregate restructuring charges related to these actions in the range of $28 million to $30 million, an increase from the originally announced range of $20 million to $24 million, primarily related to an increase in accelerated depreciation due to the deterioration in real estate market value. Hospira has completed the process of transferring related operations and production of products to other Hospira facilities or outsourcing certain product components to third-party suppliers. Hospira has incurred $27.5 million, pre-tax, to date for restructuring charges in the Americas segment, primarily employee-related, associated with this action. During 2010, 2009 and 2008, Hospira incurred in the Americas segment pre-tax restructuring costs of $7.1 million, $11.6 million and $8.8 million, respectively.
In February 2006, Hospira announced plans to close plants in Ashland, Ohio, Montreal, Canada and North Chicago, Illinois, and completed these plans in 2007, 2008, and in 2009, respectively. Hospira incurred $51.5 million, pre-tax, in aggregate for restructuring costs associated with these actions. During 2009 and 2008, Hospira incurred in the Americas segment pre-tax Restructuring costs of $2.5 million and $13.6 million, respectively.
77
Table of Contents
The following summarizes the Facilities Optimization (Morgan Hill, California; Montreal, Canada; North Chicago, Illinois) restructuring activity for the years ended December 31:
| | | | | | | | | | | | | |
(dollars in millions) | | Employee-Related
Benefit Costs | | Accelerated
Depreciation | | Other | | Total | |
|---|
Balance at January 1, 2008 | | $ | 17.8 | | $ | — | | $ | 0.6 | | $ | 18.4 | |
Costs incurred | | | 15.2 | | | 4.2 | | | 3.0 | | | 22.4 | |
Payments | | | (13.9 | ) | | — | | | (5.1 | ) | | (19.0 | ) |
Non cash items | | | (1.7 | ) | | (4.2 | ) | | 2.5 | | | (3.4 | ) |
| | | | | | | | | | |
Balance at December 31, 2008 | | | 17.4 | | | — | | | 1.0 | | | 18.4 | |
Costs incurred | | | 11.8 | | | 2.3 | | | — | | | 14.1 | |
Payments | | | (15.3 | ) | | — | | | (0.1 | ) | | (15.4 | ) |
Non cash items | | | — | | | (2.3 | ) | | (0.4 | ) | | (2.7 | ) |
| | | | | | | | | | |
Balance at December 31, 2009 | | | 13.9 | | | — | | | 0.5 | | | 14.4 | |
Costs incurred | | | — | | | 7.1 | | | — | | | 7.1 | |
Payments | | | (6.2 | ) | | — | | | — | | | (6.2 | ) |
Non cash items | | | (1.7 | ) | | (7.1 | ) | | (0.5 | ) | | (9.3 | ) |
| | | | | | | | | | |
Balance at December 31, 2010 | | $ | 6.0 | | $ | — | | $ | — | | $ | 6.0 | |
| | | | | | | | | | |
Note 4—Collaborative Arrangements
Hospira has numerous collaborative arrangements, none of which are in the aggregate or individually significant or exceed 5.0% of annual Research and development costs, except for the following.
During 2010, Hospira and Kiadis Pharma B.V. ("Kiadis") entered into a collaborative agreement to develop, license, and commercialize Kiadis' ATIR™ drug candidate. ATIR™ is a personalized hematology product designed for blood cancer patients in need of allogeneic bone marrow transplantation who cannot locate a matched donor. The product is designed to enable any family member to act as a donor and is being developed to reduce transplant related mortality caused by infections and graft-versus-host disease. Hospira was granted exclusive marketing rights to ATIR™ for Europe, the Middle East, Africa, Australia, Japan and parts of Asia. Hospira will be responsible for regulatory approval and sales and marketing of the product. Kiadis is responsible for clinical development and supply of certain product components and related equipment for the product. The parties share responsibility for various costs associated with the development and approval of ATIR™. For Hospira, certain costs of development and regulatory approval of the products that exceed $3.7 million will reduce future regulatory approval milestones. In 2010, Hospira recorded a charge of $21.3 million in Research and development related to an initial payment and development milestone. Hospira may be required to pay up to approximately $5.0 million for a pre-regulatory approval milestone, approximately $25.0 million upon reaching regulatory approval milestones and up to approximately $95.0 million in milestones tied to achievement of certain levels of commercial sales. Hospira will also make royalty payments based upon commercial sales.
During 2010, Hospira and DURECT Corporation entered into a collaborative agreement to develop, license, and market DURECT's POSIDUR™ (SABER™-bupivacaine) a long-acting version of the anesthetic bupivacaine currently in Phase III clinical trials. Hospira will co-develop the drug and has exclusive marketing rights in the U.S. and Canada following regulatory approval. For the U.S. and Canada, the two companies will equally fund the remaining development costs, while Hospira will have sole funding responsibility for commercialization of the product. In 2010, Hospira recorded a charge of $27.5 million in Research and development related to an initial payment and development milestone. Hospira may be required to pay approximately $5 million for a pre-regulatory approval milestone,
78
Table of Contents
approximately $30 million upon reaching regulatory approval and up to approximately $150 million in milestones tied to achievement of certain levels of commercial sales. Hospira will also make royalty payments based upon commercial sales. During 2010, Hospira recognized charges of $3.4 million in Research and development.
During 2009, Hospira and ChemGenex Pharmaceuticals Limited ("ChemGenex") entered into a collaborative agreement to develop, license, and commercialize ChemGenex's oncology product candidate in EMEA. Hospira will be responsible for sales and marketing. ChemGenex is responsible for development, regulatory approval and manufacturing. In 2009, Hospira recorded a charge of $16.0 million in Research and development related to an initial payment and development milestone charge. Hospira may be required to pay up to approximately $12.0 million upon reaching regulatory approval and up to approximately $87.0 million tied to achievement of certain commercial sales levels. Hospira will also make royalty payments based upon commercial sales. Costs recognized by Hospira during 2010 were not material.
During 2010, Hospira terminated the collaborative agreement with Altea Therapeutics Corporation ("Altea") to develop, license, and commercialize a new delivery system for a hematology related product. During 2010, 2009 and 2008, costs directly associated with the collaborative agreement were not material.
Hospira and Bioceuticals Arzneimittel AG ("Bioceuticals") have a licensing and marketing agreement for RetacritTM, a biosimilar version of erythropoietin, to be sold in certain countries in Europe and the U.S. Hospira is responsible for global sales and marketing. Bioceuticals is responsible for development, regulatory approval, and manufacturing. In 2006, Hospira recorded a charge of $20.6 million related to an initial payment primarily for EMEA segment-related development milestones. In 2007, Hospira recognized a product right intangible of $16.8 million upon reaching an EMEA segment regulatory approval milestone. Upon U.S. regulatory pathway approval, among other factors, Hospira could be required to pay milestones of up to approximately $22 million. In addition, Hospira will make royalty payments based upon commercial sales. During 2010, 2009 and 2008, Hospira recognized $1.6 million, $1.6 million and $1.6 million, respectively, in Cost of products sold. During 2010, Hospira recognized expenses of $2.7 million in Research and development, which were not material in 2009 and 2008.
Note 5—Investments
Investments as of December 31, consist of the following:
| | | | | | | |
(dollars in millions) | | 2010 | | 2009 | |
|---|
Investments, at cost(1) | | $ | 12.9 | | $ | 19.2 | |
Investments, at fair value(2) | | | 21.9 | | | 12.7 | |
Investments, equity-method(3) | | | 29.9 | | | 17.4 | |
| | | | | | |
| | $ | 64.7 | | $ | 49.3 | |
| | | | | | |
- (1)
- Cost investments consist of investments in companies over which Hospira does not have significant influence or ownership of more than 20%.
- (2)
- Fair value investments consist of marketable securities classified as available-for-sale.
- (3)
- Equity investments consist of investments in affiliated companies over which Hospira has significant influence but not the majority of the equity or risks and rewards. Hospira has a joint venture with Cadila Healthcare Limited, a pharmaceutical company located in India, which began commercial manufacturing of injectable cytotoxic drugs in the first half of 2009. Hospira's share of (earnings) or losses of the investees included in Other expense (income), net was $(12.5) million, $(1.9) million and $4.7 million for 2010, 2009 and 2008, respectively.
79
Table of Contents
In 2010, Hospira recognized a non-cash, impairment charge of $8.8 million in Other expense (income), net to impair cost-method investments, primarily due to a decline in market value based on internal management's assessment of future cash flows or earnings from the investments, a non-recurring Level 3 fair value measurement. There are no identified events or changes in circumstances that may have a significant adverse effect on the fair value of the remaining cost-method investments held by Hospira as of December 31, 2010.
In 2009, Hospira assessed the decline in the market value of marketable equity securities to be other-than-temporary, primarily due to the duration and severity of the investment's decline in market value and the near-term prospects for recovery to the original invested value. Accordingly, Hospira recognized a non-cash, impairment charge of $16.6 million in Other expense (income), net. The changes in market value are reported, net-of-tax, in accumulated other comprehensive income (loss) until the investment is sold or considered other-than-temporarily impaired in periods subsequent to the 2009 impairment.
Note 6—Fair Value Measures
The following table summarizes the basis used to measure certain assets and liabilities at fair value on a recurring basis in the balance sheet as of December 31:
| | | | | | | | | | | | | |
| |
| | Fair Value Measurements at
Reporting Date, Using: | |
|---|
Description (dollars in millions) | | 2010 | | Quoted Prices
in Active
Markets for
Identical Items
(Level 1) | | Significant
Other
Observable
Inputs
(Level 2) | | Significant
Unobservable
Inputs
(Level 3) | |
|---|
Financial Assets: | | | | | | | | | | | | | |
Interest rate swap contracts | | $ | 1.5 | | $ | — | | $ | 1.5 | | $ | — | |
Available-for-sale marketable equity securities | | | 21.9 | | | 21.9 | | | — | | | — | |
Foreign currency forward exchange contracts | | | 2.4 | | | — | | | 2.4 | | | — | |
Financial Liabilities: | | | | | | | | | | | | | |
Foreign currency forward exchange contracts | | | 2.5 | | | — | | | 2.5 | | | — | |
| | | | | | | | | | | | | |
| |
| | Fair Value Measurements at
Reporting Date, Using: | |
|---|
Description (dollars in millions) | | 2009 | | Quoted Prices
in Active
Markets for
Identical Items
(Level 1) | | Significant
Other
Observable
Inputs
(Level 2) | | Significant
Unobservable
Inputs
(Level 3) | |
|---|
Financial Assets: | | | | | | | | | | | | | |
Interest rate swap contracts | | $ | 2.5 | | $ | — | | $ | 2.5 | | $ | — | |
Available-for-sale marketable equity securities | | | 12.7 | | | 12.7 | | | — | | | — | |
Foreign currency forward exchange contracts | | | 5.4 | | | — | | | 5.4 | | | — | |
Financial Liabilities: | | | | | | | | | | | | | |
Foreign currency forward exchange contracts | | | 1.4 | | | — | | | 1.4 | | | — | |
The fair value of the Level 1 assets is based on quoted market prices of the identical underlying security in an active market. The fair value of the Level 2 assets and liabilities is primarily based on market observable inputs to quoted market prices, benchmark yields and broker/dealer quotes. Level 3 inputs, as applicable, are unobservable inputs which reflect assumptions developed by management to measure assets and liabilities at fair value.
The carrying values of certain financial instruments, including primarily cash and cash equivalents, accounts receivable, accounts payable and short-term borrowings, approximate their estimated fair
80
Table of Contents
values due to their short-term nature. The carrying value and estimated aggregate fair value, based primarily on market prices (Level 1), of the senior unsecured notes as of December 31, are as follows:
| | | | | | | | | | | | | |
| | 2010 | | 2009 | |
|---|
(dollars in millions) | | Carrying
Value | | Fair Value | | Carrying
Value | | Fair Value | |
|---|
Senior unsecured notes | | $ | 1,700.0 | | $ | 1,824.0 | | $ | 1,700.0 | | $ | 1,838.4 | |
Note 7—Financial Instruments and Derivatives
Hospira accounts for derivatives in accordance with ASC Topic 815, "Derivatives and Hedging" ("ASC 815"). Hospira's operations are exposed to currency exchange-rate risk, which is mitigated by Hospira's use of foreign currency forward exchange contracts ("forward contracts"). The objective is to reduce volatility of earnings and cash flows associated with foreign currency exchange-rate changes. Currency exposures primarily in Euros, Australian dollars, Canadian dollars and British pounds include foreign currency denominated assets and liabilities, commitments and anticipated foreign currency revenue and expenses, including inter-company payables, receivables and loans. These forward contracts are not designated as hedges in accordance with the provisions of ASC 815, and, therefore, changes in the fair value are recognized in earnings in Other expense (income), net, during the term of the forward contract. As of December 31, 2010, Hospira has $31.0 million net notional value of forward contracts purchased primarily denominated in Euros, Australian dollars, Canadian dollars and British pounds that mature within one to six months.
Hospira is exposed to the impact of interest rate changes. Hospira's objective is to manage interest rate changes on cash flows and reduce volatility on earnings. Hospira utilizes a mix of debt maturities along with both fixed-rate and variable-rate debt to manage changes in interest rates. Hospira may use interest rate swap contracts on certain borrowing transactions to manage its net exposure to interest rate changes and to reduce its overall cost of borrowing.
In December 2010, Hospira entered into interest rate swap contracts whereby $200.0 million of the $400.0 million principal amount of 5.90% note due June 2014 and $200.0 million of the $250.0 million principal amount of 6.40% note due in May 2015 were effectively converted from fixed to floating-rate debt. In June 2010, Hospira terminated interest rate swap contracts originally entered into in 2009 with a total notional amount of $300.0 million, which had effectively converted from fixed to variable rate debt $200.0 million of the $400.0 million principal amount notes due June 2014 and $100.0 million of the $250.0 million principal amount notes due May 2015. For further details, see Note 16.
For these fair value hedges, changes in the fair value of the interest rate swaps offset changes in the fair value of the fixed-rate debt due to changes in market interest rates. Interest rate swap contract gains and losses are included in Interest expense. There was no ineffectiveness during the calendar year ended December 31, 2010 and 2009.
The following table summarizes Hospira's fair value of outstanding derivatives as of December 31:
| | | | | | | | | |
(dollars in millions) | | Consolidated Balance
Sheet Presentation | | 2010 | | 2009 | |
|---|
Derivatives not designated as hedging instruments | | | | | | | | | |
Foreign currency forward exchange contracts: | | Other receivables | | $ | 2.4 | | $ | 5.4 | |
| | Other accrued liabilities | | | 2.5 | | | 1.4 | |
Derivatives designated as hedging instruments | | | | | | | | | |
Interest rate swap contracts: | | Other receivables | | | 0.2 | | | 0.6 | |
| | Other assets | | | 1.3 | | | 1.9 | |
81
Table of Contents
The impact on earnings for the years ended December 31, from derivative activity was as follows:
| | | | | | | | | | | | |
(dollars in millions) | | Presentation of Gain
Recognized on Derivatives | | 2010 | | 2009 | | 2008 | |
|---|
Derivatives not designated as hedging instruments | | | | | | | | | | | | |
Foreign currency forward exchange contracts | | Other expense (income), net | | $ | 15.3 | | $ | 5.6 | | $ | 1.8 | |
Derivatives designated as hedging instruments | | | | | | | | | | | | |
Interest rate swap contracts | | Interest expense | | | 4.1 | | | 3.4 | | | 0.4 | |
Note 8—Inventories
Inventories as of December 31, consist of the following:
| | | | | | | | |
(dollars in millions) | | 2010 | | 2009 | |
|---|
Finished products | | $ | 495.1 | | $ | 405.3 | |
Work in process | | | 194.3 | | | 143.9 | |
Materials | | | 266.1 | | | 206.2 | |
| | | | | | |
| | Total | | $ | 955.5 | | $ | 755.4 | |
| | | | | | |
Note 9—Other receivables
Other receivables as of December 31, consist of the following:
| | | | | | | | |
(dollars in millions) | | 2010 | | 2009 | |
|---|
Income tax | | $ | 50.1 | | $ | 10.1 | |
All other | | | 53.8 | | | 31.4 | |
| | | | | | |
| | Total | | $ | 103.9 | | $ | 41.5 | |
| | | | | | |
Note 10—Property and equipment, net
Property and equipment at cost as of December 31, consists of the following:
| | | | | | | | |
Classification (dollars in millions) | | 2010 | | 2009 | | Estimated Useful Life |
|---|
Land | | $ | 56.9 | | $ | 44.2 | | N/A |
Buildings | | | 532.4 | | | 490.5 | | 10 to 50 years (weighted average 29 years) |
Equipment | | | 1,690.4 | | | 1,557.1 | | 3 to 20 years (weighted average 8 years) |
Construction in progress | | | 172.5 | | | 117.2 | | N/A |
Instruments placed with customers | | | 238.0 | | | 256.2 | | 3 to 7 years (weighted average 5 years) |
| | | | | | | |
Property and equipment at cost | | | 2,690.2 | | | 2,465.2 | | |
Less: accumulated depreciation | | | (1,411.0 | ) | | (1,317.4 | ) | |
| | | | | | | |
Property and equipment, net | | $ | 1,279.2 | | $ | 1,147.8 | | |
| | | | | | | |
82
Table of Contents
Note 11—Goodwill and Intangible assets, net
The following summarizes goodwill and intangible assets, net activity:
| | | | | | | | |
(dollars in millions) | | Goodwill | | Intangible
assets, net | |
|---|
Balances at January 1, 2009 | | $ | 1,167.4 | | $ | 404.4 | |
| | Acquisitions | | | 47.9 | | | 22.1 | |
| | Amortization | | | — | | | (61.5 | ) |
| | Impairments | | | (7.6 | ) | | (22.5 | ) |
| | Re-classified as held for sale | | | (17.9 | ) | | — | |
| | Currency translation effect and other | | | 53.6 | | | 64.0 | |
| | | | | | |
Balances at December 31, 2009 | | | 1,243.4 | | | 406.5 | |
| | Acquisitions | | | 239.3 | | | 187.3 | |
| | Amortization | | | — | | | (81.6 | ) |
| | Impairments | | | — | | | (12.7 | ) |
| | Currency translation effect and other | | | (11.5 | ) | | 28.2 | |
| | | | | | |
Balances at December 31, 2010 | | $ | 1,471.2 | | $ | 527.7 | |
| | | | | | |
2010 Activity. The additions to goodwill and intangible assets are primarily related to the acquisitions of Javelin Pharma and a generic injectable pharmaceutical business by Hospira India. See Note 2 for more details. Hospira also acquired other intangible assets, primarily product rights for a cardiovascular product marketed in Japan. In 2010, Hospira recorded an impairment charge of $12.7 million related to an anti-infective product right, primarily in the EMEA reporting segment, due to increased competition. The charge was based on internal discounted cash flow analysis, a non-recurring level 3 fair value measurement, and is included in Restructuring, impairment and (gain) on disposition of assets, net.
2009 Activity. The impairments are related to the disposal of certain non-strategic businesses and the underlying assets. See Note 3 for more information on the circumstances leading to the impairments. The additions to goodwill and intangible assets, net are primarily related to the acquisition in the Americas segment. See Note 2 for more details.
Additionally, intangible assets, net as of December 31, consist of the following:
| | | | | | | | | | | | | | | | | | | |
| | 2010 | | 2009 | |
|---|
(dollars in millions) | | Gross
Carrying
Amount | | Accumulated
Amortization | | Net
Intangible
Assets | | Gross
Carrying
Amount | | Accumulated
Amortization | | Net
Intangible
Assets | |
|---|
Product rights and other | | $ | 656.2 | | $ | (240.4 | ) | $ | 415.8 | | $ | 524.6 | | $ | (159.0 | ) | $ | 365.6 | |
Customer relationships | | | 31.8 | | | (11.0 | ) | | 20.8 | | | 27.6 | | | (7.1 | ) | | 20.5 | |
IPR&D | | | 68.6 | | | — | | | 68.6 | | | — | | | — | | | — | |
Technology | | | 34.0 | | | (11.5 | ) | | 22.5 | | | 26.7 | | | (6.3 | ) | | 20.4 | |
| | | | | | | | | | | | | | |
| | $ | 790.6 | | $ | (262.9 | ) | $ | 527.7 | | $ | 578.9 | | $ | (172.4 | ) | $ | 406.5 | |
| | | | | | | | | | | | | | |
Intangible assets have definite lives and are amortized on a straight-line basis over their estimated useful lives (1 to 16 years, weighted average 9 years). Intangible asset amortization expense was $81.6 million, $61.5 million and $68.7 million in 2010, 2009 and 2008, respectively. Intangible asset amortization for each of the five succeeding fiscal years is estimated at $81 million for 2011, $70 million for 2012, $69 million for 2013, $58 million for 2014, and $47 million for 2015.
83
Table of Contents
Note 12—Sales-Type Leases
The net investment in sales-type leases of certain medication management products as of December 31, consists of the following:
| | | | | | | |
(dollars in millions) | | 2010 | | 2009 | |
|---|
Minimum lease payments receivable | | $ | 23.4 | | $ | 31.7 | |
Unearned interest income | | | (3.0 | ) | | (3.8 | ) |
| | | | | | |
Net investment in sales-type leases | | | 20.4 | | | 27.9 | |
Current portion(1) | | | (7.6 | ) | | (11.4 | ) |
| | | | | | |
Net investment in sales-type leases, less current portion(1) | | $ | 12.8 | | $ | 16.5 | |
| | | | | | |
- (1)
- The current and long-term portions are recorded in Trade receivables and Other assets, respectively, in the consolidated balance sheets.
Future minimum amounts due under customer agreements accounted for as sales-type leases as of December 31, 2010 are as follows:
| | | | |
(dollars in millions) | | Sales-Type
Leases | |
|---|
2011 | | $ | 8.6 | |
2012 | | | 6.2 | |
2013 | | | 4.4 | |
2014 | | | 2.0 | |
2015 and thereafter | | | 2.2 | |
| | | | |
| | $ | 23.4 | |
| | | | |
Hospira monitors the credit quality of sales-type leases and recognizes an allowance for credit loss based on historical loss experience. As of December 31, 2010 and 2009, allowance for credit losses and amount past due 90 days for sales-type leases were not material.
Note 13—Other Accrued Liabilities
Other accrued liabilities as of December 31, consist of the following:
| | | | | | | | |
(dollars in millions) | | 2010 | | 2009 | |
|---|
Accrued rebates | | $ | 137.0 | | $ | 156.0 | |
Income taxes payable | | | 5.9 | | | 29.1 | |
All other | | | 298.4 | | | 253.2 | |
| | | | | | |
| | Total | | $ | 441.3 | | $ | 438.3 | |
| | | | | | |
84
Table of Contents
Note 14—Post-retirement Obligations and Other Long-term Liabilities
Post-retirement obligations and other long-term liabilities as of December 31, consist of the following:
| | | | | | | | |
(dollars in millions) | | 2010 | | 2009 | |
|---|
Accrued post-retirement medical and dental costs(1) | | $ | 49.7 | | $ | 54.2 | |
Pension liabilities(1) | | | 34.4 | | | 115.3 | |
Unrecognized tax benefits, including penalties and interest | | | 83.4 | | | 73.6 | |
All other | | | 44.9 | | | 28.3 | |
| | | | | | |
| | Total | | $ | 212.4 | | $ | 271.4 | |
| | | | | | |
- (1)
- See Note 15 regarding changes in accrued post-retirement medical and dental costs and pension liabilities.
Note 15—Pension and Post-Retirement Benefits
Retirement plans consist of defined benefit and legislated obligations such as employee severance indemnity plans ("pension plans"), post-retirement medical and dental plans ("medical and dental plans") and defined contribution plans. Plans cover certain employees both in and outside of the U.S.
Net Pension and Medical and Dental Benefit Cost
Net benefit cost recognized for the years ended December 31, for Hospira's pension and post-retirement medical and dental benefit plans, is as follows:
| | | | | | | | | | | | | | | | | | | |
| | Pension Plans | | Medical and Dental
Plans | |
|---|
(dollars in millions) | | 2010 | | 2009 | | 2008 | | 2010 | | 2009 | | 2008 | |
|---|
Service cost for benefits earned during the year | | $ | 1.0 | | $ | 1.2 | | $ | 1.2 | | $ | 0.1 | | $ | 0.1 | | $ | 0.2 | |
Interest cost on projected benefit obligations | | | 26.2 | | | 26.3 | | | 25.5 | | | 3.2 | | | 3.3 | | | 3.7 | |
Expected return on plans' assets | | | (29.7 | ) | | (27.7 | ) | | (28.9 | ) | | — | | | — | | | — | |
Net amortization | | | 7.0 | | | 3.6 | | | 2.4 | | | 0.7 | | | 0.5 | | | 1.3 | |
Curtailment of benefits | | | — | | | — | | | 1.7 | | | — | | | — | | | 0.6 | |
| | | | | | | | | | | | | | |
Net cost | | $ | 4.5 | | $ | 3.4 | | $ | 1.9 | | $ | 4.0 | | $ | 3.9 | | $ | 5.8 | |
| | | | | | | | | | | | | | |
85
Table of Contents
Changes in Benefit Obligations and Plan Assets
Information about the changes in benefit obligations and plan assets for the years ended December 31, and the funded status as of December 31, for Hospira's U.S. and international plans is as follows:
| | | | | | | | | | | | | |
| | Pension Plans | | Medical and
Dental Plans | |
|---|
(dollars in millions) | | 2010 | | 2009 | | 2010 | | 2009 | |
|---|
Projected benefit obligations at beginning of year | | $ | 456.7 | | $ | 429.0 | | $ | 58.0 | | $ | 53.9 | |
Service cost | | | 1.0 | | | 1.2 | | | 0.1 | | | 0.1 | |
Interest cost | | | 26.2 | | | 26.3 | | | 3.2 | | | 3.3 | |
(Gains) losses, primarily changes in discount rates and medical trend rates, plan design changes, and differences between actual and estimated health care costs | | | 33.0 | | | 27.1 | | | (4.1 | ) | | 3.2 | |
Benefits paid | | | (23.1 | ) | | (19.7 | ) | | (3.3 | ) | | (3.1 | ) |
Other(1) | | | 0.2 | | | (7.2 | ) | | (0.4 | ) | | 0.6 | |
| | | | | | | | | | |
Projected benefit obligations at end of year | | $ | 494.0 | | $ | 456.7 | | $ | 53.5 | | $ | 58.0 | |
| | | | | | | | | | |
Plans' assets at fair value at beginning of year | | $ | 340.1 | | $ | 282.3 | | $ | — | | $ | — | |
Actual return on plans' assets | | | 47.2 | | | 45.8 | | | — | | | — | |
Company contributions | | | 94.1 | | | 31.7 | | | 3.3 | | | 3.1 | |
Benefits paid | | | (23.1 | ) | | (19.7 | ) | | (3.3 | ) | | (3.1 | ) |
| | | | | | | | | | |
Plans' assets at fair value at end of year | | $ | 458.3 | | $ | 340.1 | | $ | — | | $ | — | |
| | | | | | | | | | |
Funded status | | $ | (35.7 | ) | $ | (116.6 | ) | $ | (53.5 | ) | $ | (58.0 | ) |
| | | | | | | | | | |
Amount recognized in the consolidated balance sheet: | | | | | | | | | | | | | |
Prepaid benefit cost | | $ | 0.1 | | $ | — | | $ | — | | $ | — | |
Accrued benefit cost | | | (35.8 | ) | | (116.6 | ) | | (53.5 | ) | | (58.0 | ) |
| | | | | | | | | | |
Net accrued benefit cost | | $ | (35.7 | ) | $ | (116.6 | ) | $ | (53.5 | ) | $ | (58.0 | ) |
| | | | | | | | | | |
Recognized in accumulated other comprehensive income (loss): | | | | | | | | | | | | | |
Net actuarial loss | | $ | 165.7 | | $ | 156.6 | | $ | 10.0 | | $ | 15.0 | |
Net prior service cost | | | — | | | — | | | (0.3 | ) | | (0.4 | ) |
Transitional asset | | | (0.2 | ) | | (0.4 | ) | | — | | | — | |
| | | | | | | | | | |
Total recognized | | $ | 165.5 | | $ | 156.2 | | $ | 9.7 | | $ | 14.6 | |
| | | | | | | | | | |
- (1)
- Includes addition of other plans, foreign currency translation and reclassification to liabilities related to assets held for sale. See Note 3 for information regarding liabilities related to assets held for sale.
The estimated actuarial loss that will be amortized from accumulated other comprehensive income (loss) into net periodic pension cost and medical and dental benefit cost during 2011 is $10.4 million and $0.4 million, respectively.
86
Table of Contents
Other changes in plan assets and benefit obligations recognized in Other Comprehensive Income (Loss) under the provisions of ASC 715 for the years ended December 31, for Hospira's pension and post-retirement medical and dental benefit plans, are as follows:
| | | | | | | | | | | | | |
| | 2010 | | 2009 | |
|---|
(dollars in millions) | | Pension Plans | | Medical and
Dental Plans | | Pension Plans | | Medical and
Dental Plans | |
|---|
Net loss (gain) arising during the year | | $ | 15.5 | | $ | (4.1 | ) | $ | 8.9 | | $ | 3.3 | |
Prior service credit during the year | | | 0.1 | | | — | | | — | | | — | |
Net amortization | | | (7.0 | ) | | (0.7 | ) | | (3.6 | ) | | (0.5 | ) |
Exchange rate (loss) gain recognized during the year | | | — | | | (0.1 | ) | | — | | | (0.4 | ) |
| | | | | | | | | | |
Net cost (benefit) | | $ | 8.6 | | $ | (4.9 | ) | $ | 5.3 | | $ | 2.4 | |
| | | | | | | | | | |
Actuarial Assumptions
Actuarial weighted average assumptions for Hospira's plans used in determining pension and medical and dental plan information, using a measurement date of December 31, 2010, 2009 and 2008, are as follows:
| | | | | | | | | | | | | | | | | | | |
| | 2010 | | 2009 | | 2008 | |
|---|
| | U.S.
Plans | | Non-U.S.
Plans | | U.S.
Plans | | Non-U.S.
Plans | | U.S.
Plans | | Non-U.S.
Plans | |
|---|
Weighted average assumptions used to determine benefit obligations at the measurement date: | | | | | | | | | | | | | | | | | | | |
Discount rate | | | 5.2 | % | | 6.3 | % | | 5.8 | % | | 6.2 | % | | 6.2 | % | | 7.2 | % |
Expected aggregate average long-term change in compensation | | | 0.0 | % | | 2.7 | % | | 0.0 | % | | 4.3 | % | | 0.0 | % | | 3.2 | % |
Weighted average assumptions used to determine net benefit cost for the year: | | | | | | | | | | | | | | | | | | | |
Discount rate | | | 5.8 | % | | 6.8 | % | | 6.2 | % | | 7.2 | % | | 5.9 | % | | 5.4 | % |
Expected aggregate average long-term change in compensation | | | 0.0 | % | | 3.4 | % | | 0.0 | % | | 4.0 | % | | 0.0 | % | | 1.0 | % |
Expected long-term rate of return on plan assets | | | 8.0 | % | | 6.2 | % | | 8.3 | % | | 5.4 | % | | 8.3 | % | | 4.3 | % |
The overall expected long-term rate of return on plan assets is developed from the expected future return of each asset class, weighted by the expected allocation of pension assets to that asset class. Hospira considers historical performance for the types of assets in which the plans invest, independent market forecasts, and economic and capital market conditions.
87
Table of Contents
The assumed healthcare cost trend rates for the years ended December 31, for Hospira's major medical and dental plans are as follows:
| | | | | | | | | | | |
| | 2010 | | 2009 | | 2008 | |
|---|
Healthcare cost trend rate assumed for the next year (initial): | | | | | | | | | | |
| | Pre-65 years of age | | | 7.5 | % | | 7.5 | % | | 7.5 | % |
| | Post-65 years of age | | | 8.5 | % | | 8.5 | % | | 8.5 | % |
Rate that the cost trend rate gradually declines to (ultimate): | | | | | | | | | | |
| | Pre-65 years of age | | | 5.0 | % | | 5.0 | % | | 5.0 | % |
| | Post-65 years of age | | | 5.0 | % | | 5.0 | % | | 5.0 | % |
Year that rate reaches the assumed ultimate rate: | | | | | | | | | | |
| | Pre-65 years of age | | | 2016 | | | 2015 | | | 2013 | |
| | Post-65 years of age | | | 2018 | | | 2017 | | | 2015 | |
Sensitivity analysis for the U.S. plans which represent the primary portion of obligations is as follows:
| | | | | | | | | | | | | |
| | Year Ended December 31,
2010 Net Benefit Cost
(Income)/Expense | | As of December 31, 2010
Benefit Obligation
Increase/(Decrease) | |
|---|
(dollars in millions) | | One
Percentage-
Point
Increase | | One
Percentage-
Point
Decrease | | One
Percentage-
Point
Increase | | One
Percentage-
Point
Decrease | |
|---|
Pension Plan—U.S. | | | | | | | | | | | | | |
Discount rate | | $ | (3.1 | ) | $ | 3.6 | | $ | (55.2 | ) | $ | 67.5 | |
Expected long-term return on assets | | | (3.7 | ) | | 3.7 | | | — | | | — | |
Medical and Dental Plan—U.S. | | | | | | | | | | | | | |
Discount rate | | | (0.2 | ) | | 0.2 | | | (4.6 | ) | | 5.5 | |
Expected health care cost trend rate (initial and ultimate) | | | 0.7 | | | (0.6 | ) | | 5.1 | | | (4.4 | ) |
Pension Plan Assets
The weighted average asset allocation for Hospira's U.S. pension plan as of December 31, and target allocation by asset category are as follows:
| | | | | | | | | | |
| |
| | Percentage
of Plan
Assets | |
|---|
| | Target
Allocation | |
|---|
Asset Category | | 2010 | | 2009 | |
|---|
Corporate debt securities | | | 60 | % | | 60 | % | | 44 | % |
Equity securities | | | 40 | % | | 40 | % | | 55 | % |
Other and Cash and cash equivalents | | | 0 | % | | 0 | % | | 1 | % |
| | | | | | | | |
Total | | | 100 | % | | 100 | % | | 100 | % |
| | | | | | | | |
The investment mix between corporate debt securities, equity securities, and other securities is based upon achieving a desired return, balancing higher return, more volatile equity securities, and lower return, less volatile corporate debt securities. In addition, the mix is consistent with the long-term nature of the plans' benefit obligations. Investment allocations are made across a range of markets, industry sectors, capitalization sizes, and, in the case of debt securities, maturities and credit quality. The plan holds no direct investments in securities of Hospira. Due to fluctuations in market conditions, allocation percentages may temporarily deviate from target allocation percentages, particularly before a
88
Table of Contents
rebalancing occurs. At December 31, 2010, the plan held a significant concentration of plan assets in equity securities which are subject to fluctuation in market conditions. Effective January 31, 2011, Hospira revised the investment mix to 32% equity and 68% fixed income based on the current funded status of the plan with the goal of removing funded status risk to investments that better match the plan liability. Investment risks and returns are measured and monitored on an on-going basis through annual liability measurements and no less than quarterly investment portfolio reviews to determine whether the asset allocation targets continue to represent an appropriate balance of expected risk and reward.
Fair Value Measurements of Plan Assets
The following table presents the basis used to measure Hospira's pension plans' assets at fair value as of December 31:
| | | | | | | | | | | | | |
| |
| | Fair Value Measurements at
Reporting Date, Using: | |
|---|
Description (dollars in millions) | | 2010 | | Quoted Prices
in Active
Markets for
Identical Items
(Level 1) | | Significant
Other
Observable
Inputs
(Level 2) | | Significant
Unobservable
Inputs
(Level 3) | |
|---|
Corporate debt securities | | $ | 272.0 | | $ | 272.0 | | $ | — | | $ | — | |
Equity securities | | | 185.7 | | | 183.6 | | | 2.1 | | | — | |
Other and Cash and cash equivalents | | | 0.6 | | | 0.4 | | | 0.2 | | | — | |
| | | | | | | | | | |
| | $ | 458.3 | | $ | 456.0 | | $ | 2.3 | | $ | — | |
| | | | | | | | | | |
| | | | | | | | | | | | | |
| |
| | Fair Value Measurements at
Reporting Date, Using: | |
|---|
Description (dollars in millions) | | 2009 | | Quoted Prices
in Active
Markets for
Identical Items
(Level 1) | | Significant
Other
Observable
Inputs
(Level 2) | | Significant
Unobservable
Inputs
(Level 3) | |
|---|
Corporate debt securities | | $ | 149.1 | | $ | 149.1 | | $ | — | | $ | — | |
Equity securities | | | 187.9 | | | 184.3 | | | 3.6 | | | — | |
Other and Cash and cash equivalents | | | 3.1 | | | 3.1 | | | — | | | — | |
| | | | | | | | | | |
| | $ | 340.1 | | | 336.5 | | $ | 3.6 | | $ | — | |
| | | | | | | | | | |
The fair value of the Level 1 assets is based on quoted market prices of the identical underlying security in an active market. The fair value of the Level 2 assets is primarily based on market-observable inputs to quoted market prices, benchmark yields and broker/dealer quotes. Specific to Level 2 equity securities, the fair value is based on the net asset value ("NAV") unit price, redeemable at the measurement date, as quoted on a private market that is not active and provided by the administrator of the trust. Level 3 inputs, as applicable, are unobservable inputs which reflect assumptions developed by management to measure assets at fair value.
Cash Funding and Benefit Payments
Hospira has no estimated minimum required contribution for 2011 to meet the funding rules of the Pension Protection Act of 2006, giving consideration to the Worker, Retiree, and Employer Recovery Act of 2008. While Hospira's funding policy requires contributions to our defined benefit plans equal to the amounts necessary to, at a minimum, satisfy the funding requirements as prescribed
89
Table of Contents
by Federal laws and regulations, Hospira does make discretionary contributions when management deem it is prudent to do so. During 2010, 2009 and 2008, Hospira made a discretionary funding contribution of $92.0 million, $30.0 million and $5.5 million, respectively, to the U.S. pension plan. As of December 31, 2010, the frozen U.S. pension plan is in fully funded status under regulatory guidelines.
The U.S. pension plan is subject to the Employee Retirement Income Security Act of 1974 ("ERISA"). Under ERISA, the Pension Benefit Guaranty Corporation ("PBGC") has the authority to terminate underfunded pension plans under limited circumstances. In the event our U.S. pension plan is terminated for any reason, while the plan is underfunded, we will incur a liability to the PBGC that may be equal to the entire amount of the U.S. plan underfunding.
The Acts related to healthcare reform eliminated the future tax deduction for prescription drug costs associated with Hospira's post-retirement medical and dental plans for which Hospira receives Medicare Part D subsidies, which was not material to Hospira. Hospira will continue to evaluate any change to our post-retirement liabilities if new interpretations or final regulations are published.
Total benefit payments expected to be paid to participants for the next ten years, which include payments funded from company assets for medical and dental benefits as well as paid from the trusts which hold the pension plan assets, are as follows:
| | | | | | | |
(dollars in millions) | | Pension
Plans | | Medical and
Dental Plans | |
|---|
2011 | | $ | 24.1 | | $ | 3.7 | |
2012 | | | 25.3 | | | 3.8 | |
2013 | | | 26.5 | | | 3.7 | |
2014 | | | 27.5 | | | 3.7 | |
2015 | | | 28.7 | | | 3.6 | |
Years 2016 through 2020 | | | 156.8 | | | 17.1 | |
Defined Contribution Plans
Certain Hospira employees in the U.S. and Puerto Rico participate in the Hospira 401(k) Retirement Savings Plan. For the years ended December 31, 2010, 2009 and 2008, Hospira's expenses were $33.3 million, $35.5 million and $37.4 million, respectively.
Non-qualified Deferred Compensation Plan
Hospira's non-qualified deferred compensation plan went into effect on January 1, 2008. Certain executive officers and other employees are eligible to participate in the plan. The plan allows participants to defer amounts in excess of the limits imposed on 401(k) plans by the Internal Revenue Code. This plan is not funded. Hospira's expenses were not significant in the years ended December 31, 2010, 2009 and 2008.
90
Table of Contents
Note 16—Short-term Borrowings and Long-term Debt
Hospira's debt as of December 31, consists of the following:
| | | | | | | | | |
(dollars in millions) | | 2010 | | 2009 | |
|---|
Long-term debt: | | | | | | | |
| | 5.55% Notes due March 2012 | | $ | — | | | 500.0 | |
| | 5.90% Notes due June 2014 | | | 400.0 | | | 400.0 | |
| | 6.40% Notes due May 2015 | | | 250.0 | | | 250.0 | |
| | 6.05% Notes due March 2017 | | | 550.0 | | | 550.0 | |
| | 5.60% Notes due September 2040 | | | 500.0 | | | — | |
| | Other, due 2015 | | | 4.5 | | | 3.9 | |
| | Deferred gains on terminated interest rate swap instruments | | | 12.2 | | | 3.5 | |
| | Fair value of interest rate swap instruments | | | 1.5 | | | 1.9 | |
| | Unamortized debt discount | | | (3.8 | ) | | (2.0 | ) |
| | | | | | |
| | | Total long-term debt | | | 1,714.4 | | | 1,707.3 | |
Short-term borrowings: | | | | | | | |
| | Deferred gains on terminated interest rate swap instruments | | | 4.5 | | | 1.0 | |
| | Other | | | 29.0 | | | 22.6 | |
| | | | | | |
| | | Total short-term borrowings | | | 33.5 | | | 23.6 | |
| | | | | | |
Total debt | | $ | 1,747.9 | | $ | 1,730.9 | |
| | | | | | |
The aggregate maturities of debt, excluding deferred gains on terminated interest rate swap instruments, fair value of interest rate swap instruments and unamortized debt discount, for each of the next five years are as follows: $29.0 million in 2011, $0.0 million in 2012, $0.0 million in 2013, $400.0 million in 2014, $254.5 million in 2015 and $1,050.0 million thereafter.
Senior Notes and Other Borrowings
In September 2010, Hospira issued in a registered public offering $500.0 million principal amount of 5.60% notes due on September 15, 2040. The net proceeds of the notes after deducting approximately $2.6 million of bond discounts and underwriting fees of $4.4 million plus cash on-hand were used to extinguish $500.0 million principal amount of 5.55% notes originally due March 2012 and accrued interest in October 2010. Hospira incurred $36.8 million in charges associated with the early extinguishment of the notes.
In December 2009, the $375.0 million aggregate principal amount due in March 2010 plus accrued interest was fully paid. In June 2009, Hospira repaid in full the $300.0 million aggregate principal amount of 4.95% notes upon maturity. In January 2009, the remaining $5.0 million in principal outstanding as of December 31, 2008, under the $500.0 million three-year term loan facility due in March 2010, was paid.
In May 2009, Hospira issued $250.0 million aggregate principal amount of 6.40% notes which are due May 15, 2015, with interest due semi-annually, for general corporate purposes. This issuance contains covenants consistent with other existing borrowings.
In connection with acquisitions, facility expansions, international capital structure optimization and equipment lease requirements, Hospira enters into other borrowings including mortgages, lease arrangements and promissory notes. Additionally, Hospira enters into uncommitted lines of credits in certain international countries, available for general entity purposes in their respective countries that are subject to banks' approval. These borrowings bear a weighted average interest rate of approximately 10.9% and 7.3% at December 31, 2010 and 2009, respectively, with principal and interest due in various
91
Table of Contents
intervals, and are primarily unsecured. As of December 31, 2010 and 2009, Hospira had $33.5 million and $26.5 million, respectively, of other borrowings outstanding, of which $29.0 million and $22.6 million, respectively, were classified as short-term.
In June 2010, Hospira terminated interest rate swap contracts originally entered into in 2009 with a total notional amount of $300.0 million, which had effectively converted from fixed to variable rate debt, $200.0 million of the $400.0 million principal amount notes due in June 2014 and $100.0 million of the $250.0 million principal amount notes due in May 2015. As a result of the swap terminations, Hospira received $15.4 million in cash, including accrued interest. During 2008, Hospira terminated a total notional amount of $600.0 million, which had effectively converted from fixed to variable rate debt, $300.0 million of the $300.0 million principal amount notes due in 2009 and $300.0 million of the $400.0 million principal amount notes due in 2014 and received proceeds of $9.2 million.
The corresponding gains related to the basis adjustment of the debt associated with the terminated swap contracts will be deferred and amortized as a reduction of interest expense over the remaining term of the related notes. The cash flows from these contracts are reported as operating activities in the Consolidated Statements of Cash Flows. There were no penalties associated with the termination of the interest rate swap agreements. The proceeds are being recognized against interest expense over the remaining term of the underlining notes, of which approximately $2.8 million, $2.1 million and $0.8 million, pre-tax, was recognized in 2010, 2009 and 2008, respectively.
See Note 7 for information regarding active interest rate swap contracts activity.
Revolving Credit Facility
On October 14, 2009, Hospira entered into a new $700.0 million unsecured revolving credit facility (the "Revolver") maturing in October 2012. The Revolver replaced Hospira's prior revolving credit agreement that was scheduled to expire in December 2010. The Revolver is available for general corporate purposes. Borrowings under the Revolver bear interest at LIBOR or a base rate plus, in each case, a margin. Hospira also pays a facility fee on the aggregate amount of the commitments under the Revolver. The annual percentage rates for the LIBOR margin, the base rate margin and the facility fee are 2.5%, 1.5% and 0.5%, respectively, and are subject to increase or decrease if there is a change in Hospira's credit ratings. The amount of available borrowings may be increased to a maximum of $825.0 million, under certain circumstances. As of December 31, 2010, Hospira had no amounts borrowed or otherwise outstanding under the Revolver.
Debt Covenants
The Revolver and the indenture governing Hospira's senior notes contain, among other provisions, covenants with which Hospira must comply while they are in force. The covenants in the Revolver limit Hospira's ability to, among other things, sell assets, incur secured indebtedness and liens, incur indebtedness at the subsidiary level and merge or consolidate with other companies. The covenants in the indenture governing Hospira's senior unsecured notes limit Hospira's ability, among other things, to incur secured indebtedness, enter into certain sales and lease transactions and merge or consolidate with other companies. Hospira's debt instruments also include customary events of default, which would permit amounts borrowed to be accelerated and would permit the lenders under the revolving credit agreement to terminate their lending commitments. A description of certain covenants is set forth below.
Change of Control. The senior unsecured notes include covenants that require Hospira to offer to repurchase those notes at 101% of their principal amount if: (1) there is a change of control of Hospira and (2) Hospira is rated below investment grade by both Moody's and Standard & Poor's at or within a specified time after the time of announcement of the change-of-control transaction. A change
92
Table of Contents
of control, as described above, would constitute an event of cross default under the term loan agreement and Hospira's revolving credit agreement.
Financial Covenants. The Revolver has financial covenants that require Hospira to maintain (i) a maximum leverage ratio of not more than 3.25 to 1.0 and (ii) a minimum interest coverage of not less than 5.0 and 1.0.
As of December 31, 2010, Hospira was in compliance with all applicable covenants.
Note 17—Other Expense (Income), Net
Other expense (income), net for the years ended December 31, consisted of the following:
| | | | | | | | | | | |
(dollars in millions) | | 2010 | | 2009 | | 2008 | |
|---|
Interest income | | $ | (9.9 | ) | $ | (7.6 | ) | $ | (9.3 | ) |
Foreign exchange loss (gain), net | | | 0.2 | | | 1.0 | | | (2.1 | ) |
Loss on early debt extinguishment(1) | | | 36.8 | | | — | | | — | |
All other (income) expense(2) | | | (0.5 | ) | | 18.4 | | | 5.5 | |
| | | | | | | | |
| | Total | | $ | 26.6 | | $ | 11.8 | | $ | (5.9 | ) |
| | | | | | | | |
- (1)
- See Note 16 for details regarding loss on early debt extinguishment.
- (2)
- Includes net income from equity-method investments and other-than-temporary impairment of a cost-method investments in 2010 and marketable equity securities in 2009. See Note 5 for details.
Note 18—Taxes on Earnings
Earnings before taxes, and the related provisions for taxes on earnings, for the years ended December 31, were as follows:
| | | | | | | | | | | | |
(dollars in millions) | | 2010 | | 2009 | | 2008 | |
|---|
Earnings Before Taxes | | | | | | | | | | |
| | Domestic | | $ | 36.4 | | $ | 74.8 | | $ | 190.5 | |
| | Foreign | | | 355.1 | | | 310.0 | | | 217.0 | |
| | | | | | | | |
| | | Total | | $ | 391.5 | | $ | 384.8 | | $ | 407.5 | |
| | | | | | | | |
| | | | | | | | | | | | | |
Taxes on Earnings | | | | | | | | | | |
Current: | | | | | | | | | | |
| | U.S. Federal | | $ | 34.5 | | $ | (104.5 | ) | $ | 13.3 | |
| | State | | | 3.5 | | | 4.0 | | | 6.0 | |
| | Foreign | | | 37.4 | | | 21.3 | | | 8.0 | |
| | | | | | | | |
| | | Total current | | | 75.4 | | | (79.2 | ) | | 27.3 | |
| | | | | | | | |
Deferred: | | | | | | | | | | |
| | Domestic | | | (24.4 | ) | | 33.4 | | | 49.5 | |
| | Foreign | | | (16.7 | ) | | 26.7 | | | 9.8 | |
| | | | | | | | |
| | | Total deferred | | | (41.1 | ) | | 60.1 | | | 59.3 | |
| | | | | | | | |
| | | | Total | | $ | 34.3 | | $ | (19.1 | ) | $ | 86.6 | |
| | | | | | | | |
Operating loss carryforwards at December 31, 2010 amounted to $249.9 million, which are subject to expiration in periods from 2015 through 2030, or are unlimited. There was a significant increase in loss carryforwards in 2010 due to the Javelin Pharma acquisition.
93
Table of Contents
The gross amount of unrecognized tax benefits at December 31, 2010, 2009 and 2008 was $83.4 million, $73.6 million and $174.9 million, respectively. The amount, if recognized, that would affect the effective tax rate was $74.8 million, $65.5 million and $157.3 million at December 31, 2010, 2009 and 2008, respectively. Hospira recognizes interest and penalties accrued in relation to unrecognized tax benefits in income tax expense, which is consistent with the reporting in prior periods. As of December 31, 2010, 2009 and 2008, Hospira has recorded liabilities of $7.4 million, $5.7 million and $18.7 million, respectively, for the payment of interest and penalties.
In 2009, the Internal Revenue Service ("IRS") audit of Hospira's 2004 and 2005 tax returns was concluded and the years were effectively settled. The outcome of the audit settlement is a reduction in the gross unrecognized tax benefits for both the audit years settled and resultant impact on tax years 2006 through 2008 in aggregate totaling $100.7 million, of which $91.9 million is recognized in the results for year ended December 31, 2009, as a discrete income tax benefit.
During the fourth quarter of 2010, Hospira received a Revenue Agent's Report for the IRS audit of its 2006 and 2007 tax years, and has agreed to the proposed changes to its tax returns which result in a tax refund. The case is subject to review by the Joint Committee on Taxation of the U.S. Congress prior to final approval. Hospira estimates that within the next twelve months a decrease of up to $35 million in the current balance of unrecognized tax benefits could occur, resulting from the conclusion of the IRS administrative processes noted, potential adjustments resulting from the settlement of various other audits and lapsing of various statutes of limitation around the world.
Hospira remains open to tax examination in the following major tax-paying jurisdictions: for years 2005 forward in Canada, for years 2006 forward for the U.S. and Italy, for years 2007 forward for Australia, and for years 2008 forward for the United Kingdom.
The following table summarizes the activity for the years ended December 31, related to Hospira's unrecognized tax benefits:
| | | | | | | | | | |
(dollars in millions) | | 2010 | | 2009 | | 2008 | |
|---|
Balance at January 1, | | $ | 73.6 | | $ | 174.9 | | $ | 144.5 | |
Current year increases | | | 13.6 | | | 20.4 | | | 30.5 | |
Audit settlements | | | (0.9 | ) | | (110.1 | ) | | (0.1 | ) |
Statute lapses | | | (3.8 | ) | | (15.9 | ) | | — | |
Adjustments to prior amounts | | | 0.9 | | | 4.3 | | | — | |
| | | | | | | | |
Balance at December 31, | | $ | 83.4 | | $ | 73.6 | | $ | 174.9 | |
| | | | | | | | |
U.S. income taxes and foreign withholding taxes were not provided for undistributed earnings of certain foreign subsidiaries of $1,348.5 million, $1,036.9 million and $612.7 million at December 31, 2010, 2009 and 2008, respectively. These undistributed earnings, which are considered to be permanently invested, would be subject to taxes if they were remitted as dividends. At December 31, 2010, these undistributed earnings are intended to be permanently reinvested overseas; accordingly, it is not practical to determine the deferred tax liability on these permanently invested earnings.
94
Table of Contents
Differences between the effective income tax rate and the U.S. statutory tax rate for the years ended December 31, are as follows:
| | | | | | | | | | |
| | 2010 | | 2009 | | 2008 | |
|---|
Statutory tax rate | | | 35.0 | % | | 35.0 | % | | 35.0 | % |
Benefit of tax exemptions in Costa Rica and the Dominican Republic | | | (16.5 | )% | | (11.2 | )% | | (9.9 | )% |
State taxes, net of federal benefit | | | (0.3 | )% | | 1.4 | % | | 0.9 | % |
Foreign rate differential | | | (7.3 | )% | | (6.7 | )% | | (4.7 | )% |
Capital loss valuation allowance (benefit) | | | 0.0 | % | | 1.6 | % | | (1.3 | )% |
Research credit | | | (1.3 | )% | | (0.8 | )% | | (1.0 | )% |
Resolution of certain tax positions | | | 0.0 | % | | (23.9 | )% | | — | % |
All other, net | | | (0.8 | )% | | (0.4 | )% | | 2.3 | % |
| | | | | | | | |
Effective tax rate | | | 8.8 | % | | (5.0 | )% | | 21.3 | % |
| | | | | | | | |
The temporary differences that give rise to deferred tax assets and liabilities as of December 31, are as follows:
| | | | | | | | | | | | | |
| | 2010 | | 2009 | |
|---|
(dollars in millions) | | Assets | | Liabilities | | Assets | | Liabilities | |
|---|
Compensation, employee benefits and benefit plan liabilities | | $ | 70.5 | | $ | — | | $ | 92.9 | | $ | — | |
Trade receivable reserves and chargeback accruals | | | 46.5 | | | — | | | 38.6 | | | — | |
Inventories | | | 85.7 | | | — | | | 85.1 | | | — | |
State income taxes | | | 15.2 | | | — | | | 9.7 | | | — | |
Foreign income taxes | | | 31.3 | | | — | | | 7.3 | | | — | |
Property and equipment | | | — | | | 94.7 | | | — | | | 88.9 | |
Intangibles | | | 24.5 | | | — | | | 19.2 | | | — | |
Investments | | | 11.4 | | | — | | | 0.6 | | | — | |
Net operating losses | | | 84.1 | | | — | | | 24.8 | | | — | |
Capital losses | | | 24.5 | | | — | | | 19.1 | | | — | |
Other accruals, carryforwards, and reserves not currently deductible | | | 54.1 | | | — | | | 41.1 | | | — | |
Valuation allowance | | | (31.4 | ) | | — | | | (26.4 | ) | | — | |
| | | | | | | | | | |
Total | | $ | 416.4 | | $ | 94.7 | | $ | 312.0 | | $ | 88.9 | |
| | | | | | | | | | |
Valuation allowance consists of $31.4 million and $26.4 million for certain tax credits and capital losses at December 31, 2010, and 2009, respectively.
Note 19—Shareholders' Equity
Common Stock
Hospira is authorized to issue 400.0 million shares of common stock, par value $0.01 per share, and 50.0 million shares of preferred stock, par value $0.01 per share, of which four million shares are designated as Series A Junior Participating Preferred Stock for issuance in connection with the exercise of preferred share purchase rights as described below. At December 31, 2010 and 2009, approximately 13.7 million and 15.0 million shares of common stock were reserved for issuance under various employee incentive programs, respectively. As of December 31, 2010 and 2009, 175.9 million and 171.1 million shares are issued and 166.7 million and 163.5 million shares are outstanding, respectively.
95
Table of Contents
Treasury Stock
In February 2006, Hospira's Board of Directors authorized the repurchase of up to $400.0 million of Hospira's common stock in accordance with Rule 10b-18 under the Securities Exchange Act of 1934. As of December 31, 2010, Hospira had repurchased 9.2 million shares for approximately $400.0 million in the aggregate under the 2006 board authorization. In August 2010, Hospira entered into an accelerated share repurchase ("ASR") contract with a third party financial institution to repurchase $50.0 million of Hospira's common stock. Under the ASR, Hospira received 0.9 million shares. In December 2010, Hospira entered into a second ASR contract with a third party financial institution to repurchase $50.0 million of Hospira's common stock. Under the second ASR, Hospira received 0.7 million shares based on seventy-five percent of the $50.0 million repurchase on the trade date, with the remaining shares to be delivered over the next three months subject to adjustment based on the average stock price during the period. The second ASR was completed and Hospira received an incremental 0.2 million shares on February 7, 2011.
Preferred Share Purchase Rights
Each outstanding share of common stock provides the holder with one Preferred Share Purchase Right ("Right"). Upon exercise, each Right entitles the holder to purchase 1/100th of a share of Series A Junior Participating Preferred Stock of Hospira at a price initially set at $100, subject to amendment or adjustment. The Rights will become exercisable only if a person or group (an "acquirer") acquires, or obtains the rights to acquire, without prior approval of the Board of Directors, more than 15% of Hospira's common stock, or an acquirer announces a tender offer that may result in the acquisition of such percentage (a "Triggering Event"). After a Triggering Event, Rights held by an acquirer are not exercisable or exchangeable as described below.
If a Triggering Event occurs, each Right will generally be exercisable for common stock of Hospira having a value equal to twice the exercise price of the Right. If the Triggering Event involves an acquisition of Hospira or over 50% of its assets or earning power, each Right will be exercisable for common stock of the acquirer having a value equal to twice the exercise price of the Right. If a Triggering Event occurs in which the acquirer acquires or obtains the right to acquire less than 50% of Hospira's common stock, Hospira's Board of Directors, in its discretion, may require that each Right be exchanged for one share of Hospira's common stock or for preferred stock having a value equal to one share of common stock.
The Rights will expire on April 11, 2014, unless earlier exchanged or redeemed at $0.01 per Right or unless that date is extended by the Board of Directors. The Board of Directors may amend the rights agreement, and may approve acquisitions of Hospira or its securities such that the Rights would not apply to such approved acquisitions. The Rights are intended to have anti-takeover effects and may have the effect of substantially increasing the cost of acquiring Hospira in a transaction not approved by the Board of Directors.
96
Table of Contents
Accumulated Other Comprehensive Income (Loss)
Accumulated other comprehensive income (loss), net of taxes as of December 31, consisted of the following:
| | | | | | | |
(dollars in millions) | | 2010 | | 2009 | |
|---|
Cumulative foreign currency translation adjustments, net taxes of $0.0 | | $ | 135.9 | | $ | 71.4 | |
Cumulative retirement plans unrealized loss, net of taxes $66.6 million and $65.3 million, respectively | | | (108.8 | ) | | (105.4 | ) |
Cumulative unrealized gains on marketable equity securities, net of taxes $0.0 | | | 15.0 | | | 6.4 | |
Cumulative gains (losses) on terminated cash flow hedges, net of taxes $(0.2) million and $0.1 million, respectively | | | 0.2 | | | (0.2 | ) |
| | | | | | |
Accumulated Other Comprehensive Income (Loss) | | $ | 42.3 | | $ | (27.8 | ) |
| | | | | | |
Note 20—Earnings Per Share
Basic earnings per share are computed by dividing net income by the number of weighted average common shares outstanding during the reporting period. Diluted earnings per share are calculated to give effect to all potentially dilutive common shares that were outstanding during the reporting period. The following table shows basic and diluted earnings per share and the effect of stock-based awards on the weighted average number of shares outstanding used in calculating diluted earnings per share as of December 31:
| | | | | | | | | | | |
(shares in millions, except per share amounts) | | 2010 | | 2009 | | 2008 | |
|---|
Weighted average basic common shares outstanding | | | 166.0 | | | 161.0 | | | 159.2 | |
Incremental shares outstanding related to stock-based awards | | | 3.5 | | | 2.2 | | | 2.1 | |
| | | | | | | | |
Weighted average dilutive common shares outstanding | | | 169.5 | | | 163.2 | | | 161.3 | |
| | | | | | | | |
Earnings Per Common Share: | | | | | | | | | | |
| | Basic | | $ | 2.15 | | $ | 2.51 | | $ | 2.02 | |
| | | | | | | | |
| | Diluted | | $ | 2.11 | | $ | 2.47 | | $ | 1.99 | |
| | | | | | | | |
For 2010, 2009 and 2008, the number of outstanding stock-based awards to purchase Hospira stock for which the exercise price of the award exceeded the average stock price was approximately 0.2 million, 5.3 million and 7.5 million, respectively. Accordingly, these share-based awards are excluded from the diluted earnings per share calculation for these periods.
Note 21—Incentive Stock Program
Plan Overview
Hospira's 2004 Long-Term Stock Incentive Plan ("2004 Plan"), as amended, provides for the grant of shares of stock options, stock appreciation rights, stock awards (restricted stock, restricted stock units, performance shares, and performance units) and cash-based awards to employees and non-employee directors. In May 2009, shareholders approved amendments primarily to extend the Plan by ten years to May 14, 2019, and to increase the number of shares that may be granted during the life of the 2004 Plan by 13.0 million shares. The option exercise price generally may not be less than the underlying stock's fair market value at the date of grant, and the maximum term of an option is ten years. The amounts granted each calendar year to any one employee or non-employee director is limited depending on the type of award. Stock options comprise the majority of awards granted since
97
Table of Contents
inception of the 2004 Plan. As of December 31, 2010, approximately 13.7 million shares remain available for grant under the 2004 Plan.
Stock-Based Compensation
Stock-based compensation expense of $47.5 million, $40.5 million and $42.0 million was recognized under ASC 718 for the years ended December 31, 2010, 2009 and 2008, respectively. The related income tax benefit recognized was $16.2 million, $14.0 million and $15.6 million for the years ended December 31, 2010, 2009 and 2008, respectively. For options exercised during 2010, 2009 and 2008, excess tax benefit was $21.3 million, $0.8 million and $1.0 million, respectively.
As of December 31, 2010, there was $48.1 million of total unrecognized compensation cost related to non-vested share-based compensation arrangements. That cost is expected to be recognized over a weighted average period of 1.4 years. The total fair value of shares that became fully vested during 2010, 2009 and 2008 was $30.6 million, $23.5 million and $9.9 million, respectively.
Option Activity and Outstanding Options
In February 2010, March 2009 and 2008, 1.9 million, 3.5 million, 2.3 million options were granted to certain employees for the annual stock option grants, respectively. For the years ended December 31, 2010, 2009 and 2008, an additional 0.5 million, 0.3 million and 0.3 million options were granted, respectively. These options were awarded at the fair market value at the time of grant, generally vest over three years and have either a seven or a ten-year term. A summary of information related to stock options for the years ended is as follows:
| | | | | | | | | | | | | |
Hospira Stock Options | | Shares | | Weighted
Average
Exercise
Price | | Weighted
Average
Remaining
Life (Years) | | Aggregate
Intrinsic
Value
(dollars in
millions) | |
|---|
Outstanding at January 1, 2009 | | | 14,093,255 | | $ | 36.52 | | | | | | | |
Granted | | | 3,754,732 | | | 23.54 | | | | | | | |
Exercised | | | (3,987,623 | ) | | 32.89 | | | | | | | |
Lapsed | | | (742,528 | ) | | 37.03 | | | | | | | |
| | | | | | | | | | | | |
Outstanding at December 31, 2009 | | | 13,117,836 | | | 33.87 | | | | | | | |
Granted | | | 2,365,719 | | | 50.65 | | | | | | | |
Exercised | | | (5,064,453 | ) | | 34.21 | | | | | | | |
Lapsed | | | (800,931 | ) | | 35.68 | | | | | | | |
| | | | | | | | | | | | |
Outstanding at December 31, 2010(1) | | | 9,618,171 | | $ | 37.68 | | | 4.1 | | $ | 173.6 | |
| | | | | | | | | | | | |
Exercisable at December 31, 2010 | | | 4,761,872 | | $ | 38.04 | | | 2.7 | | $ | 84.0 | |
| | | | | | | | | | | | |
- (1)
- The difference between options outstanding and those expected to vest is not significant.
The total intrinsic value of options exercised during 2010, 2009 and 2008 was $105.8 million, $31.7 million and $12.9 million, respectively.
98
Table of Contents
Summarized information about Hospira stock options outstanding and exercisable as of December 31, 2010, is as follows:
| | | | | | | | | | | | | | | | |
| | Options Outstanding | | Exercisable Options | |
|---|
Range of Exercise Prices | | Shares | | Weighted
Average
Remaining
Life (Years) | | Weighted
Average
Exercise
Price | | Shares | | Weighted
Average
Exercise
Price | |
|---|
$20.01 - $25.00 | | | 2,478,468 | | | 5.0 | | $ | 22.18 | | | 425,391 | | $ | 22.33 | |
$25.01 - $30.00 | | | 232,708 | | | 0.3 | | | 28.15 | | | 227,707 | | | 28.18 | |
$30.01 - $35.00 | | | 699,582 | | | 1.4 | | | 32.41 | | | 690,017 | | | 32.43 | |
$35.01 - $40.00 | | | 1,481,235 | | | 3.1 | | | 39.46 | | | 1,419,972 | | | 39.49 | |
$40.01 - $45.00 | | | 2,433,326 | | | 3.5 | | | 42.65 | | | 1,797,696 | | | 42.45 | |
$45.01 - $50.00 | | | 1,883,904 | | | 6.0 | | | 49.61 | | | 48,231 | | | 48.38 | |
$50.01 - $55.00 | | | 141,742 | | | 2.6 | | | 51.54 | | | 80,756 | | | 51.22 | |
$55.01 - $60.00 | | | 267,206 | | | 3.6 | | | 56.85 | | | 72,102 | | | 55.65 | |
| | | | | | | | | | | | |
$20.01 - $60.00 | | | 9,618,171 | | | 4.1 | | $ | 37.68 | | | 4,761,872 | | $ | 38.04 | |
| | | | | | | | | | | | |
The fair value was estimated using the Black-Scholes option-pricing model, based on the average market price at the grant date and the weighted average assumptions specific to the underlying options. Expected volatility assumptions are based on historical volatility of Hospira's stock. For 2010, the expected life assumption of the options is based on the expected amount of time that options granted are expected to be outstanding, based on historical and forecasted exercise behavior of employees' post-vesting forfeitures and exercises. For 2009 and 2008, the expected life assumption of the options is based on the "simplified" method as described in ASC 718, which is the midpoint between the vesting date and the end of the contractual term. The risk-free interest rate was selected based upon yields of U.S. Treasury issues with a term equal to the expected life of the option being valued. The weighted average assumptions utilized for option grants during the years ended December 31, are as follows:
| | | | | | | | | | |
| | 2010 | | 2009 | | 2008 | |
|---|
Hospira Stock Options Black-Scholes assumptions (weighted average): | | | | | | | | | | |
Expected volatility | | | 30.2 | % | | 30.2 | % | | 28.0 | % |
Expected life (years) | | | 4.5 | | | 4.4 | | | 4.5 | |
Risk-free interest rate | | | 1.9 | % | | 1.9 | % | | 2.3 | % |
Expected dividend yield | | | 0.0 | % | | 0.0 | % | | 0.0 | % |
Fair value per stock option | | $ | 14.21 | | $ | 6.54 | | $ | 11.64 | |
Performance Share Awards
The Performance share awards vest based on a formula that measures performance using relative total shareholder return over the three-year performance cycle compared to an industry peer group. Based on the actual performance, at interim periods, and at the end of the performance cycle, the number of performance share awards earned, which can range between 0% and 200% of the target awards granted, will be satisfied with Hospira common stock. The performance share awards vest at the end of the three-year performance cycle.
99
Table of Contents
A summary of performance share awards activity for the years ended is as follows:
| | | | | | | |
Hospira Performance Share Awards | | Awards | | Weighted
Average
Grant Date
Fair Value | |
|---|
Outstanding at January 1, 2009 | | | 207,350 | | $ | 63.29 | |
Granted | | | 545,866 | | | 26.13 | |
Lapsed | | | (35,475 | ) | | 45.54 | |
| | | | | | |
Outstanding at December 31, 2009 | | | 717,741 | | | 35.64 | |
Granted | | | 240,273 | | | 69.82 | |
Lapsed | | | (27,526 | ) | | 37.94 | |
| | | | | | |
Outstanding at December 31, 2010 | | | 930,488 | | $ | 44.39 | |
| | | | | | |
The weighted average fair value using the Monte Carlo simulation model and the corresponding weighted average assumptions for the performance share award grants during the years ended December 31, are as follows:
| | | | | | | | | | |
| | 2010 | | 2009 | | 2008 | |
|---|
Hospira Performance share awards Monte Carlo assumptions (weighted average): | | | | | | | | | | |
Expected volatility | | | 36.2 | % | | 37.2 | % | | 27.9 | % |
Risk-free interest rate | | | 1.4 | % | | 1.2 | % | | 2.0 | % |
Expected dividend yield | | | 0.0 | % | | 0.0 | % | | 0.0 | % |
Fair value per performance share award | | $ | 69.43 | | $ | 24.98 | | $ | 62.39 | |
Restricted Stock and Units
Hospira issues restricted stock and units with a vesting period ranging from one to three years. A summary of restricted stock and unit activity for the years ended is as follows:
| | | | | | | |
Hospira Restricted Stock and Units | | Stock and
Units | | Weighted
Average
Grant Date
Fair Value | |
|---|
Outstanding at January 1, 2009 | | | 171,610 | | $ | 39.03 | |
Granted | | | 114,210 | | | 32.70 | |
Vested | | | (22,240 | ) | | 39.84 | |
Lapsed | | | (15,000 | ) | | 35.91 | |
| | | | | | |
Outstanding at December 31, 2009 | | | 248,580 | | | 36.24 | |
Granted | | | 65,212 | | | 53.35 | |
Vested | | | (67,661 | ) | | 36.19 | |
Lapsed | | | (9,000 | ) | | 31.74 | |
| | | | | | |
Outstanding at December 31, 2010 | | | 237,131 | | $ | 41.13 | |
| | | | | | |
The fair value of restricted stock awards and units vested in 2010, 2009 and 2008 was $2.4 million, $0.9 million and $0.5 million, respectively. Compensation expense recognized for the years ended December 31, 2010, 2009 and 2008 was $3.4 million, $3.8 million and $2.0 million, respectively.
100
Table of Contents
Note 22—Commitments and Contingencies
Other Commercial Commitments
Hospira's other commercial commitments as of December 31, 2010, representing commitments not recorded on the balance sheet, but potentially triggered by future events, primarily consist of non-debt letters of credit to provide credit support for certain transactions as requested by third parties. In the normal course of business, Hospira provides indemnification for guarantees it arranges in the form of bonds guaranteeing the payment of value added taxes, performance bonds, custom bonds and bid bonds. As of December 31, 2010, Hospira had $34.8 million of these commitments, with a majority expiring in 2011. No amounts have been drawn under these letters of credit or bonds.
Leases
Minimum future operating lease payments, including lease payments for real estate, vehicles, computers and office equipment, as of December 31, 2010, are:
| | | | |
(dollars in millions) | |
| |
|---|
2011 | | $ | 29.8 | |
2012 | | | 27.0 | |
2013 | | | 21.1 | |
2014 | | | 17.7 | |
2015 | | | 14.3 | |
Remaining Years | | | 28.0 | |
| | | | |
Total minimum future lease payments | | $ | 137.9 | |
| | | | |
Lease expense under operating leases totaled $27.3 million, $30.0 million and $26.3 million for the years ended December 31, 2010, 2009 and 2008, respectively.
Litigation
Hospira is involved in various claims and legal proceedings, as well as product liability claims, regulatory matters and proceedings related to Hospira's business, including in some instances when Hospira operated as part of Abbott Laboratories.
Hospira has been named as a defendant in a lawsuit alleging generally that the spin-off of Hospira from Abbott resulted in a mass termination of employees so as to interfere with the future attainment of benefits in violation of the Employee Retirement Income Security Act of 1974 ("ERISA"). The lawsuit was filed on November 8, 2004 in the U.S. District Court for the Northern District of Illinois, and is captioned:Myla Nauman, Jane Roller and Michael Loughery v. Abbott Laboratories and Hospira, Inc. Plaintiffs generally seek reinstatement in Abbott benefit plans, disgorgement of profits and attorneys fees. On November 18, 2005, the complaint was amended to assert an additional claim against Abbott and Hospira for breach of fiduciary duty under ERISA. Hospira has been dismissed as a defendant with respect to the fiduciary duty claim. By Order dated December 30, 2005, the Court granted class action status to the lawsuit. As to the sole claim against Hospira, the court certified a class defined as: "all employees of Abbott who were participants in the Abbott Benefit Plans and whose employment with Abbott was terminated between August 22, 2003 and April 30, 2004, as a result of the spin-off of the HPD [Hospital Products Division] /creation of Hospira announced by Abbott on August 22, 2003, and who were eligible for retirement under the Abbott Benefit Plans on the date of their terminations." Hospira denies all material allegations asserted against it in the complaint. Trial of this matter has concluded. On April 22, 2010, the court issued a ruling in favor of Hospira and Abbott on all counts. Plaintiffs have appealed that verdict. In 2008, Hospira received notice from Abbott requesting that Hospira indemnify Abbott for all liabilities that Abbott may incur in
101
Table of Contents
connection with this litigation. Hospira denies any obligation to indemnify Abbott for the claims asserted against Abbott in this litigation.
Hospira and Abbott are defendants in a number of lawsuits brought by individual plaintiffs alleging that plaintiffs developed Post-arthroscopic Glenohumeral Chondrolysis ("PAGCL") from the use of certain continuous infusion pain pumps to deliver local anesthetic into the intra-articular joint space following shoulder surgeries. In each case, Hospira and/or Abbott is alleged, singularly or with other anesthetic medication defendants, to have provided the medication delivered by continuous infusion pain pumps manufactured by other (non-Hospira/non-Abbott) defendants. The analgesic medications at issue include MarcaineTM (bupivacaine) and lidocaine. As of December 31, 2010, there are a total of 11 cases, involving 11 plaintiffs, in which Hospira is a party. 5 cases are pending in federal court and 6 cases are pending in state court. Pursuant to its separation agreement with Abbott, Hospira is defending those lawsuits which relate to sales of products prior to Hospira's spin-off from Abbott. Hospira and Abbott deny all material allegations asserted against them in the complaints. Generally, plaintiffs seek compensatory damages and, in some cases, punitive damages and costs. Hospira has successfully achieved dismissals in hundreds of these lawsuits. Given the few lawsuits that remain and absent a significant change in this litigation, Hospira no longer believes this litigation is material and no longer intends to report on this litigation.
Hospira is involved in two patent lawsuits concerning PrecedexTM (dexmedetomidine hydrochloride), a proprietary sedation agent. On September 4, 2009, Hospira brought suit against Sandoz International GmbH and Sandoz, Inc. for patent infringement. The lawsuit, which alleges infringement of U.S. Patents 4,910,214 (expires July 15, 2013) and 6,716,867 (expires March 31, 2019), is pending in the U.S. District Court for the District of New Jersey:Hospira, Inc. and Orion Corp. v. Sandoz International GmbH and Sandoz, Inc. (D. N.J. 2009). The lawsuit is based on Sandoz's "Paragraph IV" notice indicating that Sandoz has filed an abbreviated new drug application ("ANDA") with the FDA for a generic version of PrecedexTM. Hospira seeks a judgment of infringement, injunctive relief and costs. On November 12, 2010, Hospira brought suit against Caraco Pharmaceutical Laboratories, Ltd. for patent infringement. The lawsuit, which alleges infringement of U.S. Patent No. 6,716,867 (referred to above) is pending in the U.S. District Court for the Eastern District of Michigan:Hospira, Inc. and Orion Corporation v. Caraco Pharmaceutical Laboratories, Ltd., No. 10-cv-14514 (E.D. Mich. 2010). The lawsuit is based on Caraco's "Paragraph IV" notice indicating that Caraco has filed an abbreviated new drug application ("ANDA") with the FDA for a generic version of PrecedexTM. Hospira seeks a judgment of infringement, injunctive relief and costs.
Hospira is subject to certain regulatory matters. Regulatory matters may lead to voluntary or involuntary product recalls, injunctions to halt manufacture and distribution of products, monetary sanctions and other restrictions on operations.
Hospira's litigation exposure, including product liability claims, is evaluated each reporting period. Hospira's reserves, which are not significant at December 31, 2010 and 2009, are the best estimate of loss, as defined by ASC 450. Based upon information that is currently available, management believes that the likelihood of a material loss in excess of recorded amounts is remote.
Additional legal proceedings may occur that may result in a change in the estimated reserves recorded by Hospira. It is not feasible to predict the outcome of such proceedings with certainty and there can be no assurance that their ultimate disposition will not have a material adverse effect on Hospira's financial position, cash flows, or results of operations.
Note 23—Segment and Geographic Information
Hospira conducts operations worldwide and is managed in three reportable segments: Americas, EMEA and APAC. The Americas segment includes the U.S., Canada and Latin America; the EMEA segment includes Europe, the Middle East and Africa; and the APAC segment includes Asia, Japan
102
Table of Contents
and Australia. Hospira has five operating segments: U.S., Canada, Latin America, EMEA and APAC. Hospira has aggregated U.S., Canada, and Latin America within the America's reportable segment in accordance with the provisions of ASC Topic 280 "Segment Reporting." In all segments, Hospira sells a broad line of products, including specialty injectable pharmaceuticals, other pharmaceuticals, and medication management. Specialty Injectable Pharmaceuticals include generic injectables and proprietary specialty injectables. Other Pharmaceuticals include large volume intravenous solutions, nutritionals and contract manufacturing services. As part of Project Fuel, Hospira disposed of the non-strategic critical care business during 2009. As a result, the former Other Device product line is now included in a single device product line, Medication Management. Medication Management includes infusion pumps, related software and services, dedicated administration sets, gravity administration sets, critical care products (through August 2009) and other device products.
Hospira's underlying accounting records are maintained on a legal-entity basis for government and public reporting requirements. Segment disclosures are on a performance basis consistent with internal management reporting. For internal management reporting, intersegment transfers of inventory are recorded at standard cost and are not a measure of segment income from operations. The costs of certain corporate functions, stock-based compensation, interest expense, and other expense (income), net that benefit the entire organization are not allocated. The following segment information has been prepared in accordance with the internal accounting policies of Hospira, as described above.
Reportable segment information:
| | | | | | | | | | | | | | | | | | | | |
| | Net Sales for the Years
Ended December 31, | | Income (Loss) from
Operations for the Years
Ended December 31, | |
|---|
(dollars in millions) | | 2010 | | 2009 | | 2008 | | 2010 | | 2009 | | 2008 | |
|---|
Americas | | $ | 3,137.9 | | $ | 3,063.3 | | $ | 2,778.3 | | $ | 674.9 | | $ | 625.5 | | $ | 598.0 | |
EMEA | | | 488.5 | | | 542.8 | | | 583.8 | | | (13.9 | ) | | 1.8 | | | 12.8 | |
APAC | | | 290.8 | | | 273.2 | | | 267.4 | | | 14.4 | | | 7.0 | | | 23.0 | |
| | | | | | | | | | | | | | |
| | Total reportable segments | | $ | 3,917.2 | | $ | 3,879.3 | | $ | 3,629.5 | | | 675.4 | | | 634.3 | | | 633.8 | |
| | | | | | | | | | | | | | | | | |
Corporate functions | | | | | | | | | | | | (108.7 | ) | | (90.9 | ) | | (74.0 | ) |
Stock-based compensation | | | | | | | | | | | | (47.5 | ) | | (40.5 | ) | | (42.0 | ) |
| | | | | | | | | | | | | | | | | |
Income from operations | | | | | | | | | | | | 519.2 | | | 502.9 | | | 517.8 | |
Interest expense and other expense, net | | | | | | | | | | | | (127.7 | ) | | (118.1 | ) | | (110.3 | ) |
| | | | | | | | | | | | | | | | | |
Income before income taxes | | | | | | | | | | | $ | 391.5 | | $ | 384.8 | | $ | 407.5 | |
| | | | | | | | | | | | | | | | | |
| | | | | | | | | | | | | | | | | | | |
| | Depreciation and
Amortization for the
Years Ended December 31, | | Additions to Long-Lived
Assets for the
Years Ended December 31, | |
|---|
(dollars in millions) | | 2010 | | 2009 | | 2008 | | 2010 | | 2009 | | 2008 | |
|---|
Americas | | $ | 167.9 | | $ | 153.8 | | $ | 162.1 | | $ | 167.7 | | $ | 135.0 | | $ | 137.4 | |
EMEA | | | 43.7 | | | 42.4 | | | 50.9 | | | 24.6 | | | 13.6 | | | 16.0 | |
APAC | | | 34.3 | | | 33.9 | | | 38.9 | | | 17.4 | | | 9.8 | | | 9.4 | |
| | | | | | | | | | | | | | |
Total reportable segments | | $ | 245.9 | | $ | 230.1 | | $ | 251.9 | | $ | 209.7 | | $ | 158.4 | | $ | 162.8 | |
| | | | | | | | | | | | | | |
103
Table of Contents
| | | | | | | | | | | | | |
| | Goodwill at
December 31, | | Total Assets at
December 31, | |
|---|
(dollars in millions) | | 2010 | | 2009 | | 2010 | | 2009 | |
|---|
Americas | | $ | 998.5 | | $ | 817.2 | | $ | 4,114.7 | | $ | 3,633.0 | |
EMEA | | | 255.7 | | | 228.8 | | | 974.2 | | | 1,050.6 | |
APAC | | | 217.0 | | | 197.4 | | | 957.4 | | | 819.3 | |
| | | | | | | | | | |
Total reportable segments | | $ | 1,471.2 | | $ | 1,243.4 | | $ | 6,046.3 | | $ | 5,502.9 | |
| | | | | | | | | | |
Enterprise-wide information:
| | | | | | | | | | | | | | | | |
| | Net Sales for the Years
Ended December 31, | | Long-Lived Asset at
December 31, | |
|---|
(dollars in millions) | | 2010 | | 2009 | | 2008 | | 2010 | | 2009 | |
|---|
U.S. | | $ | 2,811.1 | | $ | 2,740.0 | | $ | 2,470.7 | | $ | 985.7 | | $ | 985.8 | |
Non-U.S. | | | 1,106.1 | | | 1,139.3 | | | 1,158.8 | | | 358.5 | | | 237.2 | |
| | | | | | | | | | | | |
Total | | $ | 3,917.2 | | $ | 3,879.3 | | $ | 3,629.5 | | | 1,344.2 | | | 1,223.0 | |
| | | | | | | | | | | | | | |
Deferred income taxes and Investments | | | | | | | | | | | | 225.7 | | | 103.8 | |
Goodwill and intangible assets, net | | | | | | | | | | | | 1,998.9 | | | 1,649.9 | |
| | | | | | | | | | | | | | | |
Total | | | | | | | | | | | $ | 3,568.8 | | $ | 2,976.7 | |
| | | | | | | | | | | | | | | |
| | | | | | | | | | |
| | Net Sales by Product Line for the
Years Ended December 31, | |
|---|
(dollars in millions) | | 2010 | | 2009 | | 2008 | |
|---|
Specialty Injectable Pharmaceuticals | | $ | 2,349.5 | | $ | 2,073.3 | | $ | 1,821.7 | |
Medication Management | | | 999.1 | | | 1,104.8 | | | 1,118.5 | |
Other Pharma | | | 568.6 | | | 701.2 | | | 689.3 | |
| | | | | | | | |
Total | | $ | 3,917.2 | | $ | 3,879.3 | | $ | 3,629.5 | |
| | | | | | | | |
Note 24—Quarterly Data (Unaudited)
| | | | | | | | | | | | | | |
(dollars in millions, except for per share amounts) | | 1st Quarter | | 2nd Quarter | | 3rd Quarter | | 4th Quarter | |
|---|
2010 | | | | | | | | | | | | | |
| | Net Sales | | $ | 1,007.6 | | $ | 968.2 | | $ | 949.3 | | $ | 992.1 | |
| | Gross Profit(1) | | | 430.3 | | | 369.2 | | | 367.0 | | | 347.9 | |
| | Income From Operations | | | 207.6 | | | 116.3 | | | 141.7 | | | 53.6 | |
| | Net Income | | | 141.7 | | | 83.5 | | | 71.4 | | | 60.6 | |
| | Earnings per common share, basic | | $ | 0.86 | | $ | 0.50 | | $ | 0.43 | | $ | 0.36 | |
| | Earnings per common share, diluted | | $ | 0.84 | | $ | 0.49 | | $ | 0.42 | | $ | 0.36 | |
| | Weighted average common shares outstanding, basic | | | 164.1 | | | 165.8 | | | 166.9 | | | 167.0 | |
| | Weighted average common shares outstanding, diluted | | | 169.3 | | | 169.1 | | | 170.0 | | | 170.1 | |
104
Table of Contents
Note 24—Quarterly Data (Unaudited) (Continued)
| | | | | | | | | | | | | | |
| | 1st Quarter | | 2nd Quarter | | 3rd Quarter | | 4th Quarter | |
|---|
2009 | | | | | | | | | | | | | |
| | Net Sales | | $ | 859.7 | | $ | 956.9 | | $ | 1,007.5 | | $ | 1,055.2 | |
| | Gross Profit(1) | | | 319.6 | | | 346.2 | | | 395.6 | | | 395.0 | |
| | Income From Operations | | | 114.7 | | | 91.1 | | | 161.5 | | | 135.6 | |
| | Net Income | | | 165.5 | | | 25.5 | | | 116.2 | | | 96.7 | |
| | Earnings per common share, basic | | $ | 1.04 | | $ | 0.16 | | $ | 0.72 | | $ | 0.59 | |
| | Earnings per common share, diluted | | $ | 1.03 | | $ | 0.16 | | $ | 0.71 | | $ | 0.58 | |
| | Weighted average common shares outstanding, basic | | | 159.5 | | | 160.5 | | | 161.1 | | | 162.6 | |
| | Weighted average common shares outstanding, diluted | | | 160.6 | | | 162.4 | | | 163.7 | | | 165.9 | |
- (1)
- Gross profit is defined as Net sales less Cost of products sold.
105
Table of Contents
Item 9. Changes in and Disagreements With Accountants on Accounting and Financial Disclosure
Not applicable.
Item 9A. Controls and Procedures
Evaluation of disclosure controls and procedures. The Chairman of the Board and Chief Executive Officer, Christopher B. Begley, and Chief Financial Officer, Thomas E. Werner, evaluated the effectiveness of Hospira's disclosure controls and procedures (as defined in Rules 13a-15(e) and 15d-15(e) under the Securities Exchange Act of 1934) as of the end of the period covered by this report, and concluded that Hospira's disclosure controls and procedures were effective.
Internal control over financial reporting. Management's report on our internal control over financial reporting is included on page 57 hereof, and the related report of our independent registered public accounting firm is included on page 59 hereof. Both reports are incorporated herein by reference.
Changes in internal controls. During the fourth quarter of 2010, Hospira continued to transition certain finance and information technology processes under various outsourcing arrangements, which include various general ledger, accounts payable, credit collections and cash application processes, as well as information technology application and infrastructure processes. Internal controls over financial reporting related to these areas have been added or modified accordingly. There have been no other changes in internal control over financial reporting that occurred during the fourth quarter of 2010 that have materially affected or are reasonably likely to materially affect Hospira's internal control over financial reporting.
Item 9B. Other Information
106
Table of Contents
PART III
Item 10. Directors, Executive Officers and Corporate Governance
Incorporated herein by reference is the text to be included under the captions "Election of Directors—Our Board of Directors" (including all sub-captions thereunder), "Corporate Governance—Committees of the Board of Directors—Audit Committee" and "Section 16(a) Beneficial Ownership Reporting Compliance" to be included in the 2011 Hospira Proxy Statement. The 2011 Definitive Proxy Statement will be filed on or about March 25, 2011. Also incorporated herein by reference is the text found under the caption, "Executive Officers of Hospira," in Part I of this Form 10-K.
Hospira has adopted a code of ethics (as defined in Item 406(b) of Regulation S-K) that applies to its principal executive officer, principal financial officer, principal accounting officer and controller. That code is part of Hospira's Code of Business Conduct, which is available free of charge on Hospira's Web site (www.hospira.com) or by sending a request to: Corporate Governance Materials Request, Hospira General Counsel and Secretary, Hospira, Inc., 275 North Field Drive, Dept. NLEG, Bldg. H1, Lake Forest, Illinois 60045. Hospira intends to include on its Web site any amendment to, or waiver from, a provision of its code of ethics that applies to Hospira's principal executive officer, principal financial officer or principal accounting officer and controller.
Item 11. Executive Compensation
Incorporated herein by reference is the text to be included under the captions "Director Compensation," (including all sub-captions thereunder), "2010 Compensation Discussion and Analysis," (including all sub-captions thereunder), "Executive Compensation" (including all sub-captions thereunder and tables and accompanying text and notes included therein) and "Compensation Committee Report" in the 2011 Definitive Proxy Statement.
Item 12. Security Ownership of Certain Beneficial Owners and Management and Related Stockholder Matters
Incorporated herein by reference is the text to be included under the caption "Ownership of our Stock" in the 2011 Definitive Proxy Statement.
Equity Compensation Plan Information
The following table gives information, as of December 31, 2010, about Hospira's common stock that may be issued upon the exercise of options and other equity awards under the Hospira 2004
107
Table of Contents
Long-Term Stock Incentive Plan, as amended, which is the only equity compensation plan pursuant to which Hospira's equity securities are authorized for issuance.
| | | | | | | | | | |
Plan Category | | Number of securities
to be issued upon
exercise of
outstanding options,
warrants and rights
(#)(1) | | Weighted-average
exercise price of
outstanding options,
warrants and
rights
($)(2) | | Number of securities
remaining available
for future issuance
under equity
compensation plans
(excluding securities
reflected in the
first column)
(#)(3) | |
|---|
Equity compensation plans approved by security holders | | | 11,716,278 | | $ | 37.68 | | | 13,449,375 | |
Equity compensation plans not approved by security holders(4)(5) | | | — | | | — | | | 250,000 | |
| | | | | | | | |
Total | | | 11,716,278 | | $ | 37.68 | | | 13,699,375 | |
- (1)
- Includes 132,665 shares of restricted stock, 104,466 stock units, and 1,860,976 shares of performance share awards (which assume maximum payouts on 930,488 shares) under Hospira's 2004 Long-Term Stock Incentive Plan.
- (2)
- The weighted average exercise price does not take restricted stock, stock units, and performance share awards into account.
- (3)
- This number reflects a target payout of 930,488 performance share awards.
- (4)
- Hospira Equity-Based Award/Recognition Plan. Hospira may use this plan to motivate and reward non-officer employee performance. If Hospira make awards under this plan Hospira will purchase the shares on the open market.
- (5)
- Hospira Stock Purchase Plan. Eligible Employees of Hospira Healthcare Corporation ("Hospira Canada") may participate in the plan. Each eligible employee may contribute an amount equal to 2% of eligible compensation up to an annual maximum of $4,000 (Canadian). Hospira Canada matches the employee contributions using a formula that takes into account employee contributions. In addition, the employee can also contribute to a supplementary plan in an amount up to 8% of eligible compensation. There is no matching of employee supplementary contributions. All contributions are combined and used to make monthly purchases of Hospira common shares on the open market based on individual contributions and the average open market purchase price for a given day. The plan is managed by the Hospira Canada Regional Director, Director of Human resources and Director of Finance.
Item 13. Certain Relationships and Related Transactions, and Director Independence
Incorporated herein by reference is the text to be included under the captions "Election of Directors—Our Board of Directors," "Corporate Governance—Independence," "Corporate Governance—Committees of the Board of Directors," and "Policy Regarding Approval of Related Person Transactions" in the 2011 Definitive Proxy Statement.
Item 14. Principal Accountant Fees and Services
Incorporated herein by reference is the text to be included under the caption "Ratification of Independent Registered Public Accountants—Accounting Matters—Fees to Independent Registered Public Accountants" (including all sub-captions thereunder) in the 2011 Definitive Proxy Statement.
108
Table of Contents
PART IV
Item 15. Exhibits and Financial Statement Schedules
- (a)
- Documents filed as part of this Form 10-K.
- 1.
- Financial Statements: See Item 8, "Financial Statements and Supplementary Data," for a list of financial statements.
- 2.
- Financial Statement Schedules:
| | | | |
Item | | Page | |
|---|
| Schedule II (Valuation and Qualifying Accounts) | | | 112 | |
Schedules I, III, IV and V are not included because they are not required | | | | |
- 3.
- Exhibits Required by Item 601 of Regulation S-K: The information called for by this paragraph is incorporated herein by reference to the Exhibit Index included on pages 113 through 117.
- (b)
- Exhibits filed: See Exhibit Index from pages 113 through 117.
- (c)
- Financial Statement Schedules filed: See page 112.
109
Table of Contents
SIGNATURES
Pursuant to the requirements of Section 13 or 15(d) of the Securities Exchange Act of 1934, Hospira, Inc. has duly caused this report to be signed on its behalf by the undersigned, thereunto duly authorized.
| | | | |
| | | HOSPIRA, INC. |
|
|
By: |
|
/s/ CHRISTOPHER B. BEGLEY
Christopher B. Begley
Chairman of the Board of Directors and
Chief Executive Officer
Date: February 16, 2011
|
Pursuant to the requirements of the Securities Exchange Act of 1934, this report has been signed below by the following persons on behalf of Hospira, Inc. on February 16, 2011 in the capacities indicated below.
| | |
| | | /s/ CHRISTOPHER B. BEGLEY
Christopher B. Begley
Chairman and Chief Executive Officer
(Principal Executive Officer) |
|
|
/s/ THOMAS E. WERNER
Thomas E. Werner
Senior Vice President, Finance
and Chief Financial Officer
(Principal Financial Officer) |
|
|
/s/ RICHARD J. HOFFMAN
Richard J. Hoffman
Corporate Vice President, Controller and
Chief Accounting Officer
(Principal Accounting Officer) |
|
|
/s/ IRVING W. BAILEY, II
Irving W. Bailey, II
Director |
|
|
/s/ BARBARA L. BOWLES
Barbara L. Bowles
Director |
|
|
/s/ CONNIE R. CURRAN
Connie R. Curran
Director |
110
Table of Contents
| | |
|
|
/s/ ROGER W. HALE
Roger W. Hale
Director |
|
|
/s/ JACQUE J. SOKOLOV M.D.
Jacque J. Sokolov M.D.
Director |
|
|
/s/ JOHN C. STALEY
John C. Staley
Director |
|
|
/s/ MARK F. WHEELER M.D.
Mark F. Wheeler M.D.
Director |
|
|
/s/ HEINO VON PRONDZYNSKI
Heino von Prondzynski
Director |
111
Table of Contents
Hospira, Inc.
Schedule II—Valuation and Qualifying Accounts
For the Three Years Ended December 31, 2010
(dollars in millions)
Allowance for doubtful accounts:
| | | | | | | | | | | | | |
| Column A | | Column B | | Column C | | Column D | | Column E | |
|---|
Description | | Balance at
beginning
of year | | Additions
charged to
costs and
expenses | | Deductions(1) | | Balance at
end of
year | |
|---|
Year ended December 31, 2010 | | $ | 6.2 | | $ | 3.8 | | $ | (1.8 | ) | $ | 8.2 | |
Year ended December 31, 2009 | | | 6.7 | | | 2.2 | | | (2.7 | ) | | 6.2 | |
Year ended December 31, 2008 | | | 14.1 | | | 7.9 | | | (15.3 | ) | | 6.7 | |
- (1)
- Represents accounts written off as uncollectible, net of collections on accounts previously written off. 2008 includes $4.0 million of certain reclassifications.
Inventory reserves:
| | | | | | | | | | | | | |
| Column A | | Column B | | Column C | | Column D | | Column E | |
|---|
Description | | Balance at
beginning
of year | | Additions
charged to
costs and
expenses(1) | | Deductions | | Balance at
end of
year | |
|---|
Year ended December 31, 2010 | | $ | 110.7 | | $ | 91.6 | | $ | (102.3 | ) | | 100.0 | |
Year ended December 31, 2009 | | | 67.8 | | | 125.1 | | | (82.2 | ) | | 110.7 | |
Year ended December 31, 2008 | | | 64.8 | | | 62.3 | | | (59.3 | ) | | 67.8 | |
- (1)
- The increase in 2010 and 2009 relates to product portfolio optimization charges associated with Project Fuel and product corrective action related charges.
112
Table of Contents
EXHIBIT INDEX
| | | | |
| | Exhibit No. | | Exhibit |
|---|
| | | 2.1 | | Separation and Distribution Agreement, dated as of April 12, 2004, between Abbott Laboratories and Hospira, Inc. (filed as Exhibit 2.1 to the Hospira, Inc. Quarterly Report on Form 10-Q for the quarter ended March 31, 2004 and incorporated herein by reference). |
|
|
3.1 |
|
Restated Certificate of Incorporation of Hospira, Inc. (filed as Exhibit 3.1 to the Hospira, Inc. Annual Report on Form 10-K for the year ended December 31, 2008, and incorporated herein by reference). |
|
|
3.2 |
|
Amended and Restated Bylaws of Hospira, Inc. (filed as Exhibit 3.1 to Hospira, Inc.'s Current Report on Form 8-K filed on February 11, 2010 and incorporated herein by reference). |
|
|
4.1 |
|
Rights Agreement, effective as of April 12, 2004, between Hospira, Inc. and EquiServe Trust Company, N.A., as Rights Agent (filed as Exhibit 4.1 to the Hospira, Inc. Quarterly Report on Form 10-Q for the quarter ended March 31, 2004, and incorporated herein by reference). |
|
|
4.1(a) |
|
Form of Certificate of Designations of Series A Junior Participating Preferred Stock (attached as Exhibit A to the Rights Agreement filed as Exhibit 4.1 to the Hospira, Inc. Quarterly Report on Form 10-Q for the quarter ended March 31, 2004, and incorporated herein by reference). |
|
|
4.1(b) |
|
Form of Rights Certificate (attached as Exhibit B to the Rights Agreement filed as Exhibit 4.1 to the Hospira, Inc. Quarterly Report on Form 10-Q for the quarter ended March 31, 2004, and incorporated herein by reference). |
|
|
4.2 |
|
Indenture, dated as of June 14, 2004, between Hospira, Inc. and LaSalle Bank National Association, as Trustee (filed as Exhibit 4.2 to Hospira, Inc.'s Registration Statement on Form S-4 (File No. 333-117379) filed with the SEC on July 15, 2004, and incorporated herein by reference). |
|
|
4.3 |
|
Supplemental Indenture No. 1, dated as of June 14, 2004, between Hospira, Inc. and LaSalle Bank National Association, as Trustee (filed as Exhibit 4.3 to Hospira, Inc.'s Registration Statement on Form S-4 (File No. 333-117379) filed with the SEC on July 15, 2004, and incorporated herein by reference). |
|
|
4.4 |
|
Second Supplemental Indenture, dated as of April 30, 2009 between Hospira, Inc. and Union Bank, N.A., as Successor Trustee and Bank of America, N.A., as successor by merger to LaSalle Bank National Association, as Resigning Trustee (filed as Exhibit 4.2 to Hospira, Inc.'s Registration Statement on Form S-3 (File No. 333-158939) filed with the SEC on May 1, 2009, and incorporated herein by reference). |
|
|
4.5 |
|
Form of 5.90% Notes due 2014 (attached as Exhibit A2 to the Supplemental Indenture filed as Exhibit 4.3 to Hospira, Inc.'s Registration Statement on Form S-4 (File No. 333-117379) filed with the SEC on July 15, 2004, and incorporated herein by reference). |
|
|
4.6 |
|
Form of 6.40% Notes Due 2015 (filed as Exhibit 99.3 to the Hospira, Inc. Current Report on Form 8-K filed on May 7, 2009, and incorporated herein by reference). |
113
Table of Contents
| | | | |
| | Exhibit No. | | Exhibit |
|---|
| | | 4.7 | | Form of 6.05% Notes Due 2017 (filed as Exhibit 4.3 to the Hospira, Inc. Quarterly Report on Form 10-Q for the quarter ended March 31, 2007, and incorporated herein by reference). |
|
|
4.8 |
|
Form of 5.60% Notes due 2040 (filed as Exhibit 99.3 to the Hospira, Inc. Current Report on Form 8-K filed on September 10, 2010, and incorporated herein by reference). |
|
|
4.9 |
|
Actions of Authorized Officers with respect to the 2017 Notes (filed as Exhibit 4.4 to the Hospira, Inc. Quarterly Report on Form 10-Q for the quarter ended March 31, 2007, and incorporated herein by reference). |
|
|
4.10 |
|
Officers' Certificate and Company Order with respect to the 2017 Notes (filed as Exhibit 4.5 to the Hospira, Inc. Quarterly Report on Form 10-Q for the quarter ended March 31, 2007, and incorporated herein by reference). |
|
|
4.11 |
|
Actions of Authorized Officers with respect to the 2015 Notes (filed as Exhibit 99.2 to the Hospira, Inc. Current Report on Form 8-K filed on May 7, 2009, and incorporated herein by reference). |
|
|
4.12 |
|
Officers' Certificate and Company Order with respect to the 2015 Notes (filed as Exhibit 4.3 to the Hospira, Inc. Quarterly Report on Form 10-Q for the quarter ended June 30, 2009, and incorporated herein by reference). |
|
|
4.13 |
|
Actions of Authorized Officers with respect to the 2040 Notes (filed as Exhibit 99.2 to the Hospira Current Report on Form 8-K filed on September 10, 2010, and incorporated herein by reference). |
|
|
4.14 |
|
Officers' Certificate and Company Order with respect to the 2040 Notes (filed as Exhibit 4.3 to the Hospira, Inc. Quarterly Report on Form 10-Q for the quarter ended September 30, 2010, and incorporated herein by reference). |
|
|
10.1 |
|
Summary of Terms of Employment for Named Executive Officers (filed as Exhibit 10.1 to the Hospira, Inc. Quarterly Report on Form 10-Q for the quarter ended March 31, 2010, and incorporated herein by reference).* |
|
|
10.2 |
|
Hospira 2004 Long-Term Stock Incentive Plan, as amended.* |
|
|
10.3(a) |
|
Form of Conversion Incentive Option Terms (filed as Exhibit 10.8(a) to the Hospira, Inc. Quarterly Report on Form 10-Q for the quarter ended March 31, 2004, and incorporated herein by reference).* |
|
|
10.3(b) |
|
Form of Conversion Non-Qualified Stock Option Terms (filed as Exhibit 10.8(b) to the Hospira, Inc. Quarterly Report on Form 10-Q for the quarter ended March 31, 2004, and incorporated herein by reference).* |
|
|
10.3(c) |
|
Form of Conversion Replacement Non-Qualified Stock Option Terms (filed as Exhibit 10.8(c) to the Hospira, Inc. Quarterly Report on Form 10-Q for the quarter ended March 31, 2004, and incorporated herein by reference).* |
|
|
10.3(d) |
|
Form of Non-Qualified Stock Option Terms for awards made prior to May 9, 2005 (10-year term) (filed as Exhibit 10.8(d) to the Hospira, Inc. Quarterly Report on Form 10-Q for the quarter ended March 31, 2004, and incorporated herein by reference).* |
114
Table of Contents
| | | | |
| | Exhibit No. | | Exhibit |
|---|
| | | 10.3(d)(i) | | Form of Non-Qualified Stock Option Terms for awards made on or after May 9, 2005 (filed as Exhibit 10.1 to the Hospira, Inc. Current Report on Form 8-K filed on May 12, 2005, and incorporated herein by reference).* |
|
|
10.3(e) |
|
Form of Non-Qualified Stock Option Terms (five-year term) (filed as Exhibit 10.8(e) to the Hospira, Inc. Quarterly Report on Form 10-Q for the quarter ended March 31, 2004, and incorporated herein by reference).* |
|
|
10.3(f) |
|
Form of Non-Employee Director Restricted Stock Award Agreement (filed as Exhibit 10.2 to the Hospira, Inc. Quarterly Report on Form 10-Q for the quarter ended June 30, 2008, and incorporated herein by reference).* |
|
|
10.3(f)(i) |
|
Form of Amendment of Non-Employee Director Restricted Stock Award Agreement (filed as Exhibit 10.8(f)(i) to the Hospira, Inc. Annual Report on Form 10-K for the year ended December 31, 2007, and incorporated herein by reference).* |
|
|
10.3(g) |
|
Form of Non-Employee Director Non-Qualified Stock Option Terms (filed as Exhibit 10.8(g) to the Hospira, Inc. Quarterly Report on Form 10-Q for the quarter ended March 31, 2004, and incorporated herein by reference).* |
|
|
10.3(h) |
|
Form of Non-Qualified Stock Option Terms for awards made on or after March 6, 2008 (filed as Exhibit 10.2 to the Hospira, Inc. Quarterly Report on Form 10-Q for the quarter ended March 31, 2008, and incorporated herein by reference).* |
|
|
10.3(h)(i) |
|
Form of Non-Qualified Option Terms for awards made to those officers subject to the Executive Compensation Recovery Policy on or after February 11, 2010 (filed as Exhibit 10.3(h)(i) to the Hospira, Inc. Annual Report on Form 10-K for the year ended December 31, 2009, and incorporated herein by reference).* |
|
|
10.3(i)(i) |
|
Form of Notice of Award and Award Agreement for Restricted Stock Units and Election Deferral Form (filed as Exhibit 10.3 to the Hospira, Inc. Quarterly Report on Form 10-Q for the quarter ended March 31, 2008, and incorporated herein by reference).* |
|
|
10.3(i)(ii) |
|
Form of Notice of Award and Award Agreement for Restricted Stock Units and Election Deferral Form for awards made on or after March 5, 2009 (filed as Exhibit 10.1 to the Hospira, Inc. Quarterly Report on Form 10-Q for the quarter ended March 31, 2009, and incorporated herein by reference).* |
|
|
10.3(i)(iii) |
|
Form of Notice of Award and Award Agreement for Restricted Stock Units and Election Deferral Form for awards made to those officers subject to the Executive Compensation Recovery Policy on or after February 11, 2010 (filed as Exhibit 10.3(i)(iii) to the Hospira, Inc. Annual Report on Form 10-K for the year ended December 31, 2009, and incorporated herein by reference).* |
|
|
10.4 |
|
Hospira, Inc. 2004 Performance Incentive Plan as amended.* |
|
|
10.5 |
|
Hospira, Inc. Non-Employee Directors' Fee Plan, as amended.* |
|
|
10.6(a) |
|
Form of Agreement between Hospira, Inc. and each of Christopher B. Begley, Terrence C. Kearney and Brian J. Smith, regarding Change in Control (filed as Exhibit 10.12 to the Hospira, Inc. Quarterly Report on Form 10-Q for the quarter ended March 31, 2004, and incorporated herein by reference).* |
115
Table of Contents
| | | | |
| | Exhibit No. | | Exhibit |
|---|
| | | 10.6(a)(i) | | Form of Agreement between Hospira, Inc. and each of Christopher B. Begley, Terrence C. Kearney and Brian J. Smith, regarding Amendment to Change in Control (filed as Exhibit 10.12(a)(i) to the Hospira, Inc. Annual Report on Form 10-K for the year ended December 31, 2007, and incorporated herein by reference).* |
|
|
10.6(b) |
|
Form of Agreement between Hospira, Inc. and Thomas E. Werner regarding Change in Control (filed as Exhibit 10.1 to the Current Report on Form 8-K filed on August 11, 2006, and incorporated herein by reference).* |
|
|
10.6(b)(i) |
|
Form of Agreement between Hospira, Inc. and Thomas E. Werner regarding Amendment to Change in Control (filed as Exhibit 10.12(b)(i) to the Hospira, Inc. Annual Report on Form 10-K for the year ended December 31, 2007, and incorporated herein by reference).* |
|
|
10.6(c) |
|
Form of Agreement between Hospira, Inc. and Sumant Ramachandra regarding Change in Control (filed as Exhibit 10.6(c) to the Hospira, Inc. Annual Report on Form 10-K for the year ended December 31, 2008, and incorporated by reference).* |
|
|
10.6(d) |
|
Form of Restricted Stock Agreement between Hospira, Inc. and Sumant Ramachandra (filed as Exhibit 10.6(d) to the Hospira, Inc. Annual Report on Form 10-K for the year ended December 31, 2008, and incorporated herein by reference).* |
|
|
10.6(e) |
|
Form of Agreement between Hospira, Inc. and each of Ron Squarer and Ken Meyers regarding Change in Control (filed as Exhibit 10.6(e) to the Hospira, Inc. Annual Report on Form 10-K for the year ended December 31, 2009, and incorporated herein by reference).* |
|
|
10.6(f) |
|
Form of Agreement between Hospira, Inc. and each of James H. Hardy, Jr., Daphne E. Jones and Richard J. Hoffman regarding Change in Control (filed as Exhibit 10.1 to the Current Report on Form 8-K filed on January 4, 2011, and incorporated herein by reference).* |
|
|
10.6(g) |
|
Form of Agreement between Hospira, Inc. and Francois Dubois regarding Change in Control.* |
|
|
10.7 |
|
Form of Grantor Trust Arrangement by and among Abbott Laboratories, Hospira, Inc. and each of Christopher B. Begley and Terrence C. Kearney (filed as Exhibit 10.13 to the Hospira, Inc. Quarterly Report on Form 10-Q for the quarter ended March 31, 2004, and incorporated herein by reference).* |
|
|
10.8 |
|
The Hospira Supplemental Pension Plan, as amended.* |
|
|
10.9 |
|
Hospira Non-Qualified Savings and Investment Plan, as amended.* |
|
|
10.10 |
|
Hospira Corporate Officer Severance Plan, as amended (filed as Exhibit 10.2 to the Hospira, Inc. Quarterly Report on Form 10-Q for the quarter ended June 30, 2010, and incorporated herein by reference).* |
|
|
10.11 |
|
Form of Agreement regarding Executive Compensation Recovery Policy (filed as Exhibit 10.11 to the Hospira, Inc. Annual Report on Form 10-K for the year ended December 31, 2009 and incorporated herein by reference).* |
|
|
10.12 |
|
Credit Agreement and Guaranty, dated October 14, 2009, between Hospira and the Lenders and Agents named therein (filed as Exhibit 10.1 to the Hospira, Inc. Quarterly Report on Form 10-Q for the quarter ended September 30, 2009, and incorporated herein by reference). |
116
Table of Contents
| | | | |
| | Exhibit No. | | Exhibit |
|---|
| | | 10.13 | | Business Transfer Agreement, dated December 15, 2009, by and among Orchid Chemicals & Pharmaceuticals Ltd., Mr. K. Raghavendra Rao and Ojas Pharmaceuticals India Private Limited (to be renamed Hospira Healthcare India Private Limited). (filed as Exhibit 10.13 to the Hospira, Inc. Annual Report on Form 10-K for the year ended December 31, 2009, and incorporated herein by reference).** |
|
|
10.14 |
|
Amendment No. 1 to the Business Transfer Agreement, dated March 30, 2010, by and between Orchid Chemicals & Pharmaceuticals Ltd. and Hospira Healthcare India Private Limited. (filed as Exhibit 10.1 to the Current Report on Form 8-K filed on April 1, 2010, and incorporated herein by reference).** |
|
|
12.1 |
|
Computation of Ratio of Earnings to Fixed Charges. |
|
|
21.1 |
|
List of Subsidiaries of Hospira, Inc. |
|
|
23.1 |
|
Consent of Deloitte & Touche LLP. |
|
|
31.1 |
|
Certification of Christopher B. Begley under Rule 13a-14(a) under the 1934 Act. |
|
|
31.2 |
|
Certification of Thomas E. Werner under Rule 13a-14(a) under the 1934 Act. |
|
|
32.1 |
|
Certification of Christopher B. Begley under 18 U.S.C. 1350 (Section 906 of the Sarbanes-Oxley Act of 2002). |
|
|
32.2 |
|
Certification of Thomas E. Werner under 18 U.S.C. 1350 (Section 906 of the Sarbanes-Oxley Act of 2002). |
|
|
101 |
|
The following financial statements from the Hospira, Inc. Annual Report on Form 10-K for the year ended December 31, 2010, filed on February 16, 2011, formatted in Extensive Business Reporting Language (XBRL): (i) consolidated statements of income, (ii) consolidated statements of cash flows, (iii) consolidated balance sheets, (iv) consolidated statement of changes in shareholders' equity, (v) the notes to the consolidated financial statements and (vi) Schedule II—Valuation and Qualifying Accounts. |
| | | | | |
- *
- Management compensatory plan or arrangement.
- **
- Confidential treatment requested for portions of this exhibit.
Hospira will furnish copies of any of the above exhibits to a shareholder upon written request to the Corporate Secretary, Hospira, Hospira, Inc., 275 North Field Drive, Department NLEG, Building H1, Lake Forest, Illinois 60045.
117