Table of Contents
UNITED STATES
SECURITIES AND EXCHANGE COMMISSION
WASHINGTON, D.C. 20549
FORM 10-K
☒ | ANNUAL REPORT PURSUANT TO SECTION 13 OR 15(d) OF THE SECURITIES EXCHANGE ACT OF 1934 |
For the fiscal year ended December 31, 2024
OR
☐ | TRANSITION REPORT PURSUANT TO SECTION 13 OR 15(d) OF THE SECURITIES EXCHANGE ACT OF 1934 |
For the transition period from to
Commission File Number 001-38103
JANUS HENDERSON GROUP PLC
(Exact name of registrant as specified in its charter)
Jersey, Channel Islands
(State or other jurisdiction of
incorporation or organization) | 98-1376360
(I.R.S. Employer Identification No.) |
201 Bishopsgate London, United Kingdom
(Address of principal executive offices) | EC2M3AE
(Zip Code) |
+44 (0) 20 7818 1818
(Registrant’s telephone number, including area code)
Securities registered pursuant to Section 12(b) of the Act:
Title of each class | Trading Symbol(s) | Name of each exchange on which registered |
Common Stock, $1.50 Per Share Par Value | JHG | New York Stock Exchange |
Securities registered pursuant to Section 12(g) of the Act: None
Indicate by check mark if the registrant is a well-known seasoned issuer, as defined in Rule 405 of the Securities Act. Yes ☐ No ☒
Indicate by check mark if the registrant is not required to file reports pursuant to Section 13 or Section 15(d) of the Act. Yes ☐ No ☒
Indicate by check mark whether the registrant: (1) has filed all reports required to be filed by Section 13 or 15(d) of the Securities Exchange Act of 1934 during the preceding 12 months (or for such shorter period that the registrant was required to file such reports), and (2) has been subject to the filing requirements for the past 90 days. Yes ☒ No ☐
Indicate by check mark whether the registrant has submitted electronically every Interactive Data File required to be submitted pursuant to Rule 405 of Regulation S-T (§232.405 of this chapter) during the preceding 12 months (or for such shorter period that the registrant was required to submit such files). Yes ☒ No ☐
Indicate by check mark whether the registrant is a large accelerated filer, an accelerated filer, a non-accelerated filer, smaller reporting company, or an emerging growth company. See the definitions of “large accelerated filer,” “accelerated filer,” “smaller reporting company,” and “emerging growth company” in Rule 12b-2 of the Exchange Act.
Large accelerated filer ☒ | Accelerated filer ☐ | Non-accelerated filer ☐ | Smaller reporting company ☐ |
| | | Emerging growth company ☐ |
If an emerging growth company, indicate by check mark if the registrant has elected not to use the extended transition period for complying with any new or revised financial accounting standards provided pursuant to Section 13(a) of the Exchange Act. ☐
Indicate by check mark whether the registrant has filed a report on and attestation to its management's assessment of the effectiveness of its internal control over financial reporting under Section 404(b) of the Sarbanes-Oxley Act (15 U.S.C. 7262(b)) by the registered public accounting firm that prepared or issued its audit report. ☒
If securities are registered pursuant to Section 12(b) of the Act, indicate by check mark whether the financial statements of the registrant included in the filing reflect the correction of an error to previously issued financial statements. ☐
Indicate by check mark whether any of those error corrections are restatements that required a recovery analysis of incentive-based compensation received by any of the registrant’s executive officers during the relevant recovery period pursuant to §240.10D-1(b). ☐
Indicate by check mark whether the registrant is a shell company (as defined in Rule 12b-2 of the Exchange Act). Yes ☐ No ☒
As of June 30, 2024, the aggregate market value of common equity held by non-affiliates was $5,381,586,868.43. As of February 25, 2025, there were 157,557,812 shares of the Company’s common stock, $1.50 par value per share, issued and outstanding.
DOCUMENTS INCORPORATED BY REFERENCE
Part III of this report incorporates by reference portions of the registrant's definitive proxy statement relating to its 2025 Annual General Meeting of Shareholders (the “Proxy Statement”) to be filed with the Securities and Exchange Commission within 120 days after the end of the fiscal year to which this report relates.
JANUS HENDERSON GROUP PLC
2024 FORM 10-K ANNUAL REPORT
TABLE OF CONTENTS
PART I
FORWARD-LOOKING STATEMENTS
Certain statements in this report not based on historical facts are “forward-looking statements” within the meaning of the federal securities laws, including the Private Securities Litigation Reform Act of 1995, as amended, Section 21E of the Securities Exchange Act of 1934, as amended (“Exchange Act”), and Section 27A of the Securities Act of 1933, as amended (“Securities Act”). Such forward-looking statements involve known and unknown risks and uncertainties that are difficult to predict and could cause our actual results, performance or achievements to differ materially from those discussed. These include statements as to our future expectations, beliefs, plans, strategies, objectives, events, conditions, financial performance, prospects or future events. In some cases, forward-looking statements can be identified by the use of words such as “may,” “could,” “expect,” “intend,” “plan,” “seek,” “anticipate,” “believe,” “estimate,” “predict,” “potential,” “continue,” “likely,” “will,” “would” and similar words and phrases. Forward-looking statements are necessarily based on estimates and assumptions that, while considered reasonable by us and our management, are inherently uncertain. Accordingly, you should not place undue reliance on forward-looking statements, which speak only as of the date they are made and are not guarantees of future performance. We do not undertake any obligation to publicly update or revise these forward-looking statements.
Various risks, uncertainties, assumptions and factors that could cause our future results to differ materially from those expressed by the forward-looking statements included in this report include, but are not limited to, recent changes in interest rates and inflation, volatility or disruption in financial markets, our investment performance as compared to third-party benchmarks or competitive products, redemptions and other withdrawals from the funds and accounts we manage, and other risks, uncertainties, assumptions, and factors discussed under headings such as “Risk Factors,” “Management’s Discussion and Analysis of Financial Condition and Results of Operations,” and “Quantitative and Qualitative Disclosures About Market Risk,” and in other filings or furnishings made by the Company with the Securities and Exchange Commission (“SEC”) from time to time.
Overview
Janus Henderson Group plc (“JHG,” the “Company,” “we,” “us,” “our” and similar terms), a company incorporated and registered in Jersey, Channel Islands, is an independent global asset manager, specializing in investment management across all major asset classes. Through its predecessor companies, JHG traces its linage back to 1934 when Henderson Group plc (“Henderson”) was founded.
We are a client-focused global business with approximately 2,300 employees worldwide and assets under management (“AUM”) of $378.7 billion as of December 31, 2024. We have operations in North America, the United Kingdom (“UK”), continental Europe, Latin America, Japan, Asia and Australia. Our mission is to help clients define and achieve superior financial outcomes through differentiated insights, disciplined investments and world-class service. We are mindful that our thinking and investments help shape the futures of millions of people as we fulfill our purpose of “Investing in a brighter future together.” We manage a broad range of investment products for institutional and retail investors across four capabilities: Equities, Fixed Income, Multi-Asset and Alternatives.
Clients entrust money to us, either their own or money they manage or advise on for their clients, and expect us to deliver the benefits specified in their mandate or by the prospectus for the fund in which they invest. We measure the amount of these funds as AUM. AUM increases or decreases primarily depending on our ability to attract and retain client investments, on investment performance and as a function of market and currency movements. AUM is also impacted when we invest in new asset management teams or businesses or divest from existing businesses.
Clients pay a management fee, which is usually calculated as a percentage of AUM. Certain investment products are also subject to performance fees, which vary based on when performance hurdles or other specified criteria are achieved. The level of assets subject to such fees can positively or negatively affect our revenue. Management and performance fees are generated from a diverse group of funds and other investment products and are the primary drivers of our revenue. We believe that the more diverse the range of investment strategies from which management and performance fees are derived, the more successful our business model will be through market cycles.
Strategy
Our strategy is based on three strategic pillars: Protect & Grow, Amplify and Diversify. Our strategy is centered on the belief that a combination of relentless focus and disciplined execution across our core business will drive future success as a global active asset manager. Specifically, our strategy lays a strong foundation for sustained organic growth and opportunistic inorganic growth to create value for all of our stakeholders: clients, shareholders and employees. Each of our three strategic pillars is further detailed below.
| | ● | Protect and grow our core business: We have identified existing opportunities in our core business where we believe we can increase market share, including regional intermediary distribution and good-performing smaller strategies. |
| | ● | Amplify strengths not fully leveraged: Our investment and client service strengths can be amplified with adjacent products, channels, geographies and vehicles (e.g., Institutional and development and expansion of other products). |
| | ● | Diversify where clients give us the right to win: We are seeking to expand our investment capabilities in areas where our clients are seeking more solutions from us and new investment capabilities that can open new client types (e.g., private credit and emerging market debt). |
Financial Highlights
We present our financial results in accordance with accounting principles generally accepted in the United States of America (“U.S. GAAP”); however, JHG management evaluates the profitability of the Company and its ongoing operations using non-GAAP financial measures that are consistent with internal management reporting. See Part II, Item 7, Management’s Discussion and Analysis of Financial Condition and Results of Operations, for additional information on non-GAAP adjusted measures, including a reconciliation to the comparable GAAP measure.
| | | Year ended December 31, | |
| | | 2024 | | | 2023 | | | 2022 | |
GAAP basis (in millions, except per share data): | | | | | | | | | | | | |
Revenue | | $ | 2,473.2 | | | $ | 2,101.8 | | | $ | 2,203.6 | |
Operating expenses | | $ | 1,827.5 | | | $ | 1,618.1 | | | $ | 1,713.8 | |
Operating income | | $ | 645.7 | | | $ | 483.7 | | | $ | 489.8 | |
Operating margin | | | 26.1 | % | | | 23.0 | % | | | 22.2 | % |
Net income attributable to JHG | | $ | 408.9 | | | $ | 392.0 | | | $ | 372.4 | |
Diluted earnings per share | | $ | 2.56 | | | $ | 2.37 | | | $ | 2.23 | |
| | | | | | | | | | | | | |
Adjusted basis (in millions, except per share data): | | | | | | | | | | | | |
Revenue | | $ | 1,940.8 | | | $ | 1,645.9 | | | $ | 1,705.3 | |
Operating expenses | | $ | 1,272.7 | | | $ | 1,137.2 | | | $ | 1,128.6 | |
Operating income | | $ | 668.1 | | | $ | 508.7 | | | $ | 576.7 | |
Operating margin | | | 34.4 | % | | | 30.9 | % | | | 33.8 | % |
Net income attributable to JHG | | $ | 563.7 | | | $ | 435.2 | | | $ | 433.8 | |
Diluted earnings per share | | $ | 3.53 | | | $ | 2.63 | | | $ | 2.60 | |
Assets Under Management
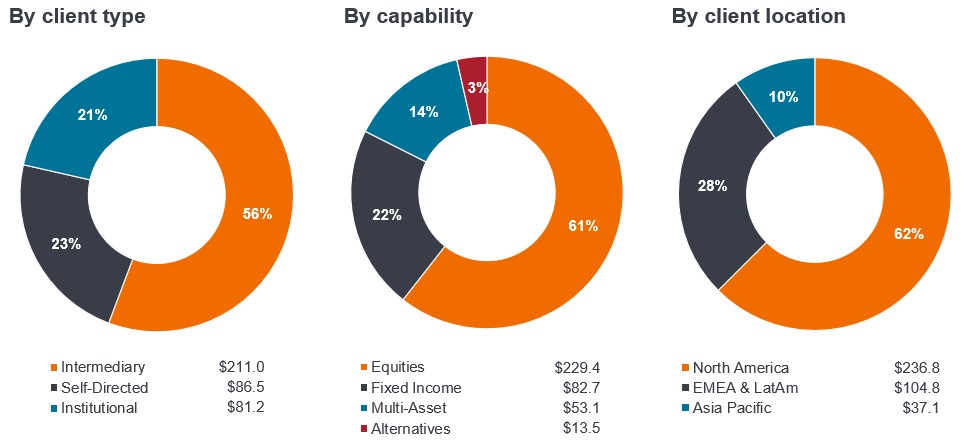
Our AUM by client type, capability and client location as of December 31, 2024, is presented below (in billions).
Client Type and Distribution Channel
We have a diverse group of intermediary, self-directed and institutional clients around the globe. While we seek to leverage our global model where possible, we also recognize the importance of tailoring our services to the needs of clients in different regions. For this reason, we maintain a local presence in most of the markets in which we operate and provide investment material that takes into account local customs, preferences and language needs. We have a global distribution team of approximately 400 staff members. A description of each client type and distribution channel is presented below.
Intermediary Channel
The intermediary channel distributes U.S. mutual funds, separately managed accounts (“SMAs”), exchange-traded funds (“ETFs”), UK Open Ended Investment Companies (“OEICs”), Société d’Investissement À Capital Variable (“SICAVs”), Collective Investment Trusts (“CITs”) and Undertakings for Collective Investments in Transferable Securities (“UCITS”) through financial intermediaries, including banks, broker-dealers, financial advisors, fund platforms and discretionary wealth managers. We have made significant investments to grow our presence in the financial advisor subchannel, including enhancing our technology platform and recruiting highly seasoned leaders and client relationship managers. At December 31, 2024, AUM in our intermediary channel totaled $211.0 billion, or 56% of total AUM.
Self-Directed Channel
The self-directed channel serves individual investors who invest in our products through a mutual fund supermarket or directly with us. At December 31, 2024, AUM in our self-directed channel totaled $86.5 billion, or 23% of total AUM.
Institutional Channel
The institutional channel serves corporations, endowments, pension funds, foundations, Taft-Hartley funds, public fund clients and sovereign entities, with distribution direct to the plan sponsor and through consultants. At December 31, 2024, AUM in our institutional channel totaled $81.2 billion, or 21% of total AUM.
Investment Capabilities
Equities
We offer a wide range of equity strategies encompassing different geographic focuses and investment styles. The Equities teams include those with a global perspective, those with a regional focus (including the U.S., Europe and Asia) and those invested in specialist sectors. A range of growth, value and absolute return styles are employed. These teams generally apply processes based on fundamental research and bottom-up stock picking. As of December 31, 2024, AUM in our Equities capability totaled $229.4 billion, or 61% of total AUM.
Fixed Income
Our Fixed Income teams provide coverage across the asset class, applying a wide range of innovative and differentiated techniques in support of a variety of investment objectives and risk criteria. Our fixed income offering includes teams that apply global unconstrained approaches as well as teams with more focused mandates — based in the U.S., Europe, Asia and Australia. The capabilities of these teams are available through individual strategies and, where appropriate, combined to create multi-strategy offerings. As of December 31, 2024, AUM in our Fixed Income capability totaled $82.7 billion, or 22% of total AUM.
Multi-Asset
Our Multi-Asset capability includes teams in the U.S. and UK that focus on balanced, multi-asset income and strategic asset allocation, as well as multiple adaptive asset allocation strategies. As of December 31, 2024, AUM in our Multi-Asset capability totaled $53.1 billion, or 14% of total AUM.
Alternatives
Our Alternatives capability includes teams with various areas of focus and approach. Alternatives brings together a cross-asset class combination of alpha generation, risk management and efficient beta replication strategies. These include Global Multi-Strategy, Managed Futures, Risk Premia and Global Commodities, Private Credit, and Long/Short Equity. As of December 31, 2024, AUM in our Alternatives capability totaled $13.5 billion, or 3% of total AUM.
Client Locations
North America
Our North America region serves clients throughout North America and represents our largest geographical concentration of AUM. The North America distribution network serves a diverse set of clients across financial intermediaries, institutions and self-directed channels. As of December 31, 2024, total North America AUM was $236.8 billion, and we employed 173 and 190 investment and distribution professionals, respectively.
EMEA and Latin America
Our EMEA (“Europe, the Middle East and Africa”) and Latin America region serves clients throughout the UK and Continental Europe and supports our evolving business in Latin America and the Middle East. The region includes a strong retail and institutional client base in the UK; strong relationships with global distributors in Continental Europe; and an organic build-out of our Latin America business, which is gaining momentum. As of December 31, 2024, total EMEA and Latin America AUM was $104.8 billion, and the region employed 165 and 156 investment and distribution professionals, respectively.
Asia Pacific
Our Asia Pacific region serves clients throughout Australia, Japan and other regions of Asia. Australian distribution offers a suite of global and domestic capabilities. Our broader business in the Asia Pacific region continues to evolve with growing brand presence. As of December 31, 2024, Asia Pacific AUM was $37.1 billion, and the region employed 42 and 73 investment and distribution professionals, respectively.
Human Capital
With approximately 2,300 employees worldwide, we are proud of our global presence and our wide array of backgrounds and viewpoints, alongside a broad range of skills and experiences, are critical to achieving our purpose of Investing in a Brighter Future Together. We aim to create a workplace characterized by accountability, excellence and innovation by living our Values — Clients Come First - Always, Execution Supersedes Intention, Together We Win, Diversity Improves Results and Truth Builds Trust — and to encourage a sense of belonging and common objective across our employee base.
Our people-focused culture is driven by collaboration and connection. We recognize that the success of JHG is dependent on the unique talents and contributions of our workforce, and we are invested in our employees’ success. We are committed to:
| | ● | Attracting great people into roles with a sense of purpose; |
| | ● | Helping them realize their highest potential and make a real impact; and |
| | ● | Supporting their ambitions throughout their career. |
Headcount
As of December 31, 2024 and 2023, we had 2,340 and 2,196 employees, respectively. Our workforce includes trainees, apprentices and fixed-term employees working alongside our permanent part- and full-time employees. Contractors and other temporary employees are excluded in the tables below.
2024 Headcount | Permanent | Fixed-Term Worker | Trainee & Apprentice | Total |
EMEA | 1,037 | 25 | 18 | 1,080 |
North America | 1,065 | — | 3 | 1,068 |
Asia Pacific | 183 | 7 | 2 | 192 |
Total | 2,285 | 32 | 23 | 2,340 |
2023 Headcount | Permanent | Fixed-Term Worker | Trainee & Apprentice | Total |
EMEA | 980 | 31 | 22 | 1,033 |
North America | 977 | — | 1 | 978 |
Asia Pacific | 174 | 9 | 2 | 185 |
Total | 2,131 | 40 | 25 | 2,196 |
Talent Acquisition
We build our workforce from within our existing talent pool whenever possible. If we are unable to identify the right candidate for an open position from within, we look externally for the best talent. We search for candidates through a variety of different channels to ensure we access the highest potential candidates who will drive innovation and sustain our competitive edge. Where possible, our internal talent acquisition team will source for this talent directly. Where necessary, we will engage the support of external recruitment consultants or search firms, whose values and methods of recruitment align with our goals of finding the best talent in the market.
Professional Development
We are committed to helping people realize their highest potential and fostering a culture that prioritizes and supports personal and professional development for individuals, leaders and teams across the organization. Employees own their individual development, and we are invested in a wide variety of programs to support their ambitions. Ongoing development opportunities include business acumen (our industry and products), understanding our clients, leadership development, mentoring schemes, global collaboration and culture, career development, interpersonal communication, presentation skills and technology training. We encourage and financially support continuing education through a tuition reimbursement program for employees wishing to pursue approved degree programs.
Employee Engagement
We value feedback from our employees. We look for opportunities to solicit their opinions and insights to help us understand what we are doing well and potential areas of improvement. In 2024, approximately 86% of our employees responded to our annual employee opinion survey. Results are shared with our Board of Directors and are cascaded from senior leaders to all employees. Managers and employees develop action plans to address topics of concern and continually improve our workplace. In addition to the 2024 employee opinion survey, we:
| | ● | Placed significant focus on the adoption and embedding of our rearticulated mission, values and purpose to encourage a sense of belonging and common objective across our employee base; |
| | ● | Continued to dedicate time and resources to employee career progression by hosting a career week where employees participated in live learning events and discussions; invested in our high potential talent through the Leadership Excellence and Development program (“LEAD”); and relaunched our early careers initiatives across the globe; and |
| | ● | Added to or enhanced our benefits and wellbeing offerings across the globe, including improving our employee share purchase plans and increasing our family-friendly leave policies globally with increased paternity pay and enhanced “equal/shared leave” policies. |
Our People
Diversity Improves Results is embedded as a core value in our Mission, Values and Purpose and is a guiding principle towards creating an inclusive environment that promotes true meritocracy, cultural awareness and respect. For many years, we have believed that organizations, and the clients they serve, benefit greatly from a diversity of viewpoints, experiences and backgrounds. That diversity of thought leads to better business decision making for our clients and their clients. We believe that diversification of viewpoints among our people is just as important as diversification within our investment portfolios and helps to produce the best results, outcomes and service for our global client base.
Employee Compensation and Benefits
Our compensation framework is designed to recognize great work and reinforce the alignment of interests among our employees, clients and shareholders. We regularly review industry benchmark data and maintain competitive compensation levels to ensure we are able to attract and retain top talent. Variable incentive compensation for most of our employees is funded based on JHG profits. While individual awards are fully discretionary, performance assessments take into account financial and strategic (non-financial) factors, including company, department, team and individual performance.
The ongoing health and well-being of our employees is important to us, and we offer a wide array of benefits, resources and tools to help our employees and their families to live healthy, balanced and happy lifestyles. We support our employees’ financial goals and retirement saving by making contributions toward their retirement and pension plans and offering an employee stock purchase plan.
Turnover
We monitor and analyze turnover, including voluntary, involuntary and reduction in force (“RIF”)/layoffs. Our voluntary turnover rates are consistent with a certain benchmark for our industry. We develop talent profiles and succession plans to ensure we are cultivating the next generation of leaders to contribute to our long-term business success. These provide us with the ability to effectively manage turnover and to retain and develop our most highly skilled employees.
Intellectual Property
We have used, registered and/or applied to register certain trademarks, service marks and trade names to distinguish our sponsored investment products and services from those of our competitors in the jurisdictions in which we operate, including the U.S., the UK, the European Union (“EU”), Australia, China, Japan and Singapore. These trademarks, service marks and trade names are important to us and, accordingly, we actively enforce our trademarks, service marks and trade name rights. Our brand has been, and continues to be, extremely well-received both in the asset management industry and with clients.
Seasonality
Our revenue streams are not seasonal in nature, with management fees and other income generally accruing evenly throughout the year. However, performance fee revenue is the exception. Performance fees are specified in certain fund and client contracts and are based on investment performance either on an absolute basis or compared to an established index over a specified period of time. These fees are often subject to a high-water mark (“HWM”). Performance fees are recognized at the end of the contractual period (typically monthly, quarterly or annually) if the stated performance criteria are achieved. Certain fund and client contracts allow for negative performance fees where there is underperformance against the relevant index. Given the uncertain nature of performance fees, they tend to fluctuate from period to period.
Competition
The investment management industry is relatively mature and saturated with competitors that provide similar services. As such, we encounter significant competition in all areas of our business. We compete with other investment managers, mutual fund advisers, brokerage and investment banking firms, insurance companies, hedge funds, venture capitalists, banks and other financial institutions, many of which have proprietary access to certain distribution channels and are larger, have greater capital resources and have a broader range of product choices and investment capabilities than we do. In addition, the marketplace for investment products is rapidly changing, investors are becoming more sophisticated, the demand for and access to investment advice and information are becoming more widespread, passive investment strategies are more prevalent, and more investors are demanding investment vehicles that are customized to their individual requirements.
We believe our ability to successfully compete in the investment management industry depends upon our ability to achieve consistently strong investment performance, provide exceptional client service, and develop and innovate products that will best serve our clients.
Regulation
The investment management industry is subject to extensive federal, state and international laws and regulations intended to benefit and protect investment advisory clients and investors in pooled investment vehicles, such as those managed, advised or subadvised by us. The costs of complying with such laws and regulations have grown significantly in recent years and may continue to grow in the future, which could significantly increase our costs of doing business as a global asset manager. These laws and regulations generally grant supervisory agencies broad administrative powers, including the power to limit or restrict the conduct of businesses and to impose sanctions for failure to comply with laws and regulations. Possible consequences for failure to comply include voiding of investment advisory and subadvisory agreements, suspension of individual employees (particularly investment management and sales personnel), limitations on engaging in certain lines of business for specified periods of time, revocation of registrations, disgorgement of profits, and imposition of censures and fines. Further, failure to comply with such laws and regulations may provide the basis for civil litigation that may also result in significant costs and reputational harm to us.
U.S. Regulation
Certain of our U.S. subsidiaries are subject to laws and regulations from a number of government agencies and self-regulatory bodies, including the SEC, U.S. Department of Justice, U.S. Department of Labor (“DOL”), Financial Industry Regulatory Authority (“FINRA”), Internal Revenue Service, U.S. Commodity Futures Trading Commission (“CFTC”) and National Futures Association (“NFA”). We continue to see enhanced legislative and regulatory interest in the regulation of financial services and investment products in the U.S. through existing and proposed rules and regulations, regulatory priorities and pronouncements, enforcement actions and general discussions around expanded and updated requirements. For example, the SEC has recently proposed and/or adopted a number of new rules covering a wide range of topics, including derivatives usage; liquidity management; marketing; swing pricing; safeguarding of client assets; outsourcing of covered functions; cybersecurity; predictive analytics; shareholder and regulatory reporting; fund names; and environmental, social and governance (“ESG”) disclosures. We also continue to see continued enforcement of, and changes in enforcement practices around, existing laws, rules and regulations, including new applications of the compliance program rule to address current regulatory gaps (e.g., maintenance of electronic records and “off-channel” communications). While the nature, pace and scope of regulatory change and enforcement may change, it will remain an area of uncertainty and potential risk and cost for us and other regulated entities.
Investment Advisory Laws and Regulations
Our subsidiaries, Janus Henderson Investors US LLC (“JHIUS”), Privacore Capital Advisors, LLC (“PCA”) and Victory Park Capital Advisors, LLC (“VPC”), are registered investment advisers under the Investment Advisers Act of 1940, as amended (“Advisers Act”), and regulated by the SEC. The Advisers Act requires registered investment advisers to comply with numerous and pervasive obligations, including fiduciary duties, disclosure obligations, recordkeeping requirements, custodial obligations, operational and marketing restrictions, and registration and reporting requirements. Certain of our employees may also be registered with regulatory authorities in various states and subject to oversight and regulation by such states’ regulatory agencies where consistent with the Advisers Act.
Investment Company Laws and Regulations
Our subsidiaries, JHIUS and PCA, act as adviser or subadviser to mutual funds, ETFs and other types of registered investment companies, which are registered with the SEC pursuant to the Investment Company Act of 1940, as amended (“1940 Act”). Certain of our subsidiaries, such as JHIUS and VPC, also serve as adviser or subadviser to investment products that are not required to be registered under the 1940 Act. As an adviser or subadviser to pooled investment vehicles that operate under exemptions to the 1940 Act and related regulations, we are subject to various requirements relating to operations, fees charged, sales, accounting, recordkeeping, disclosure and governance. In addition, the adviser or subadviser to a registered investment company generally has obligations with respect to the qualification of the registered investment company under the Internal Revenue Code of 1986, as amended (“Code”).
Broker-Dealer Regulations
Our subsidiary, Janus Henderson Distributors US LLC (“JHD”), is registered with the SEC under the Exchange Act and is a member of FINRA, the U.S. securities industry’s self-regulatory organization. JHD is a limited-purpose broker-dealer, which acts as the general distributor and/or agent for the sale and distribution of shares of U.S. mutual funds that are sponsored by certain of our subsidiaries, as well as the distribution of certain exchange-traded products (“ETPs”) and other pooled investment vehicles. The SEC imposes various requirements on registered broker-dealers’ operations, including disclosure, recordkeeping and accounting. FINRA has established conduct rules for all securities transactions among broker-dealers and private investors, trading rules for the over-the-counter (“OTC”) markets and operational rules for its member firms. The SEC and FINRA also impose net capital requirements on registered broker-dealers.
JHD is subject to regulation under state law. The federal securities laws prohibit states from imposing substantive requirements on broker-dealers that exceed those under federal law. This does not preclude the states from imposing registration requirements on broker-dealers that operate within their jurisdiction or from sanctioning broker-dealers and their employees for engaging in misconduct.
Employee Retirement Income Security Act
Certain of our subsidiaries are also subject to the Employee Retirement Income Security Act (“ERISA”) and related regulations to the extent they are considered fiduciaries under ERISA with respect to some of their investment advisory clients. ERISA-related provisions of the Code and regulations issued by the DOL impose duties on persons who are fiduciaries under ERISA and prohibit some transactions involving the assets of each ERISA plan that is a client of a subsidiary of ours, as well as some transactions by the fiduciaries and various other related parties of such plans.
U.S. Commodity Futures Trading Commission
Certain of our subsidiaries are registered with the CFTC as commodity pool operators (“CPOs”) and/or commodity trading advisers (“CTAs”), and certain of our subsidiaries have become members of the NFA in connection with the operation of certain of our products. The Commodity Exchange Act and related regulations generally impose certain registration, reporting and disclosure requirements on CPOs; CTAs; and products that utilize the futures, swaps and other derivatives that are subject to CFTC regulation. These rules adopted by the CFTC eliminated or limited previously available exemptions and exclusions from many CFTC requirements and impose additional registration and reporting requirements for operators of certain registered investment companies and certain other pooled vehicles that use or trade in futures, swaps and other derivatives that are subject to CFTC regulation. The CFTC or NFA may institute proceedings to enforce applicable rules and regulations, and violations may result in fines, censure or the termination of CPO and/or CTA registration and NFA membership.
State Laws and Regulations
As reflected above, certain of our activities, products, entities and employees are also subject to state laws and regulations. Those laws and regulations reinforce, supplement and, in certain cases, extend beyond the federal laws and regulations in various respects. For instance, the processing of personal information of California residents is subject to the California Consumer Privacy Act (“CCPA”), as amended by the California Privacy Rights Act (“CPRA”). Similar to the EU Global Data Protection Regulation, the CCPA and CPRA create rights in favor of natural persons and impose obligations on businesses for the handling, disclosure and deletion of personal information. Other U.S. states have adopted similarly comprehensive data privacy laws over the past several years. The failure to comply with applicable state laws and regulations may result in fines, heightened regulatory scrutiny, litigation and/or reputational harm.
International Regulation
UK
The Financial Conduct Authority (“FCA”) regulates certain of our subsidiaries, as well as products and services we offer and manage in the UK. The FCA’s powers are derived from the Financial Services and Markets Act 2000 (“FSMA”), and FCA authorization is required to conduct any investment management business in the UK under the FSMA. The FCA’s Handbook of Rules and Guidance governs UK-authorized firms’ capital resources requirements, senior management arrangements, systems and controls, conduct of business and interaction with clients and the markets. The FCA also regulates the design and manufacture of UK-domiciled investment funds intended for public distribution and, on a more limited basis, those that are for investment by professional investors.
Europe
Certain of our UK-regulated entities previously (until December 31, 2020) had to comply with a range of EU regulatory measures and are required to comply with EU law, which was transposed into UK legislation under the European Union (Withdrawal) Act of 2018 (“EUWA”). These measures include the Markets in Financial Instruments Directive (“MiFID II”). MiFID II regulates the provision of investment services and the conduct of investment activities throughout the European Economic Area (“EEA”), and the UK version of MiFID II (implemented through UK primary and secondary legislation under the EUWA and FCA rules) regulates the provision of similar services in the UK. MiFID II establishes detailed requirements for the governance, organization and conduct of business of investment firms and regulated markets. It also includes pre- and post-trade transparency requirements for equity markets and extensive transaction reporting requirements.
The EU’s Alternative Investment Fund Managers Directive (“AIFMD”) was transposed into EU member state law. AIFMD regulates managers of, and service providers to, alternative investment funds (“AIFs”) that are domiciled and offered in the EU and that are not authorized as retail funds under the UCITS directive discussed below. The AIFMD also regulates the marketing within the EU of all AIFs, including those domiciled outside the EU. Compliance with the AIFMD’s requirements may restrict AIF marketing and imposes compliance obligations in the form of remuneration policies; capital requirements; reporting requirements; leverage oversight; valuation; reporting stakes in EU companies; the domicile, duties and liability of custodians; and liquidity management. The UK has adopted the AIFMD rules principally via secondary legislation FCA rules.
UCITS are investment funds regulated at the EU level under the UCITS Directive V. UCITS are capable of being freely marketed throughout the EU on the basis of a single authorization in a member state — so-called passporting. UCITS covers a range of matters relating to UCITS, including the fund structure and domicile of UCITS, service providers to UCITS and marketing arrangements. In addition, UCITS funds are distributed in other jurisdictions outside the EU where marketing and sales are governed by local country-specific regulations. The UK has adopted the UCITS rules through the framework of secondary legislation and FCA rules, although UCITS established in the UK cannot benefit from the passporting arrangement described below.
Following the UK’s withdrawal from the EU (“Brexit”) on January 31, 2020, the UK and the EU entered into a transition period (“Transition Period”) during which directly effective EU law continued to apply in the UK, and the UK continued to be treated as a member state of the EU. The Transition Period ended on December 31, 2020, and since then, directly effective EU law is no longer applicable in the UK, although the UK has retained certain EU legislation governing financial services under the EUWA. One of the effects of the end of the Transition Period (irrespective of the retention of EU law under the EUWA) is that financial services firms authorized in the UK lost their passporting rights. “Passporting” is an arrangement under which firms authorized in an EU member state (or a non-EU state that is an EEA member) can rely on authorization in their “home” EEA member state to provide regulated services throughout the EEA. Because UK-authorized firms can no longer passport their services throughout the EEA, the extent to which UK-authorized firms can continue to provide services to customers in the EEA will now be dependent on regulatory requirements and regulators’ expectations in the individual EEA member states in which the UK-authorized firm wishes to provide services. Discussions between the EU and UK regarding equivalence of the EU and UK regulatory frameworks are ongoing. The way in which UK firms provide services in EEA member states may change depending on the outcome of these discussions.
Luxembourg
In Luxembourg, our subsidiary, Janus Henderson Investors Europe S.A. (“JHIESA”), is authorized and regulated by the Commission de Surveillance du Secteur Financier as a UCITS management company, with additional regulatory permissions to provide portfolio management services regulated under MiFID II. JHIESA has established six branches: Italy (Milan), Germany (Frankfurt), Spain (Madrid), France (Paris), the Netherlands (Amsterdam) and Denmark (Copenhagen). The main objective of these branches is the distribution of JHG products within the EU. Since September 2022, the Danish branch has also made use of JHIESA’s extended portfolio management permissions under MiFID II. JHIESA has been appointed management company of the following funds and fund structures:
| | ● | Two UCITS umbrella funds, incorporated under the laws of Luxembourg in the form of a SICAV; |
| | ● | One UCITS umbrella fund, incorporated under the laws of Ireland in the form of an umbrella investment company with segregated liability between funds with variable capital; and |
| | ● | One AIF umbrella fund, incorporated under the laws of Ireland in the form of an open-ended unit trust. |
Jersey
Janus Henderson Investors (Jersey) Limited is registered under Article 9 of the Financial Services (Jersey) Law 1998, as amended (“Law”) in respect of Fund Services Business. The company was established to operate a fund management business in Jersey, providing portfolio management services to funds and segregated mandates. The company is authorized and supervised by the Jersey Financial Services Commission in respect of its activities.
Switzerland
Janus Henderson Investors (Schweiz) AG (“JHI Schweiz”) is regulated by the Swiss Federal Act on Financial Services (“FinSA”). JHI Schweiz performs fund distribution of JHG funds in Switzerland and acts as the Swiss Representative Office for one of the JHG UK-authorized investment managers when marketing investment management services to Swiss investors. Under FinSA, the main requirements for JHI Schweiz are the affiliation to an ombudsman’s office, the client adviser registration, compliance manual, certain disclosures to investors and client segmentation.
United Arab Emirates
Janus Henderson Emerging Markets Private Investments Limited (“JHEMPIL”) is authorized and regulated by the Financial Services Regulatory Authority (“FSRA”) in the Abu Dhabi Global Market (“ADGM”) financial center. JHEMPIL conducts the regulated activities of managing collective investment funds, arranging deals in investments and advising on investments or credit. JHEMPIL is subject to the ADGM legal framework which includes the Abu Dhabi Law No 4 of 2013, which sets out the governance, legislative and regulatory framework and activities to be carried on in the ADGM and the Financial Services and Markets Regulations, which establishes the legislative and regulatory framework for financial services in ADGM. The investment strategies managed by JHEMPIL are private credit, private equity and regional real estate.
Singapore
In Singapore, our subsidiary, Janus Henderson Investors (Singapore) Limited (“JHISL”), is licensed with the Monetary Authority of Singapore (“MAS”) as a Capital Market Services License holder and an exempt financial adviser to conduct regulated activities in fund management and dealing in capital market products. It is subject to various laws, including the Securities and Futures Act, the Financial Advisers Act and the subsidiary legislation promulgated pursuant to these acts, which are administered by the MAS. Our asset management subsidiary and its employees conducting regulated activities specified in the Securities and Futures Act or the Financial Advisers Act are required to be licensed with the MAS. JHISL is also registered with South Korea’s Financial Services Commission (“FSC”) as a cross-border discretionary investment manager and investment advisor.
Australia
In Australia, several of our subsidiaries operate under an Australian Financial Services license, and their activities are governed primarily by the Corporations Act 2001 (Cth) and its associated regulations. Their main regulator is the Australian Securities and Investments Commission (“ASIC”), which is Australia’s integrated corporate, markets, financial services and consumer credit regulator. ASIC imposes certain conditions on licensed financial services organizations that apply to our subsidiaries, including requirements relating to capital resources, operational capability and controls. Multiple subsidiaries also act as product issuers for ETFs that are Quoted Managed Funds on the Cboe exchange (“Cboe”) and the AQUA market of the Australian Securities Exchange (“ASX”). Therefore, our subsidiaries must comply with the Cboe operating rules and procedures as well as the ASX Operating Rules and the ASX Operating Rules Procedures. Another key regulator is the Australian Transaction Reports and Analysis Centre (“AUSTRAC”), which applies a number of reporting and other obligations under the Anti-Money Laundering and Countering Financing of Terrorism Act 2006 (“AML/CFT Act”).
Hong Kong
In Hong Kong, our subsidiary, Janus Henderson Investors Hong Kong Limited, is subject to the Securities and Futures Ordinance (“SFO”) and related legislation, which govern the securities and futures markets and regulate the offerings of investments to the public. This legislation is administered by the Securities and Futures Commission (“SFC”), which is also empowered under the SFO to establish standards for compliance as well as codes and guidelines. Our subsidiary and its employees conducting any of the regulated activities specified in the SFO are required to be licensed with the SFC and are subject to the rules, codes and guidelines issued by the SFC from time to time.
Japan
In Japan, our subsidiary, Janus Henderson Investors (Japan) Limited, is subject to the Financial Instruments and Exchange Act and the Act on Investment Trusts and Investment Corporations. These laws are administered and enforced by the Japanese Financial Services Agency, which establishes standards for compliance, including capital adequacy and financial soundness requirements, customer protection requirements and conduct of business rules.
This regulatory agency has broad supervisory and disciplinary powers, including, among others, the power to temporarily or permanently revoke the authorization to conduct regulated business, suspend registered employees, and censure and fine both regulated businesses and their registered employees.
Other
Our operations in Ireland are regulated by the Central Bank of Ireland.
Many of the non-U.S. securities exchanges and regulatory authorities have imposed rules (and others may impose rules) relating to capital requirements applicable to our foreign subsidiaries. These rules, which specify minimum capital requirements, are designed to measure general financial integrity and liquidity, and require that a minimum amount of assets be kept in relatively liquid form.
ESG and Climate Disclosure Regulations
ESG topics and climate-related disclosures continue to be the focus of increased regulatory scrutiny across jurisdictions. While there is uncertainty regarding federal regulations on ESG disclosure under the new administration in the U.S., we expect state laws and regulations regarding these topics to continue to evolve and impose new and additional requirements. Outside of the U.S., the EU has published the corporate sustainability reporting directive (“CSRD”) which requires EU businesses to report on the environmental and social impact of their business activities, and on the business impact of their ESG efforts and initiatives. In the UK, the FCA published a new regime on sustainability disclosure requirements (“SDR”) and investment labels, which will be applicable to our UK subsidiaries in 2024. We are continuing to evaluate how the evolving regulations will impact JHG and its subsidiaries.
Available Information
We make available free of charge our Annual Reports on Form 10-K, Quarterly Reports on Form 10-Q and Current Reports on Form 8-K and amendments thereto as soon as reasonably practicable after such filings are made with the SEC. These reports may be obtained through our Investor Relations website (ir.janushenderson.com) and are available in print at no charge upon request by any shareholder. The contents of our website are not incorporated herein for any purpose. The SEC also maintains a website that contains reports, proxy and information statements, and other information regarding issuers that file electronically with the SEC at www.sec.gov.
Charters for the Audit Committee, Human Capital and Compensation Committee, Governance and Nominations Committee, and Risk Committee of our Board of Directors, as well as our Corporate Governance Guidelines, Code of Business Conduct and Code of Ethics for Senior Financial Officers (our “Senior Officer Code”) are posted on the Investor Relations website (ir.janushenderson.com) and are available in print at no charge upon request by any shareholder. Within the time period prescribed by the SEC and New York Stock Exchange (“NYSE”) regulations, we will post on our website any amendment to our Senior Officer Code or our Code of Business Conduct and any waivers thereof for directors or executive officers. The information on our website is not incorporated by reference into this report.
Corporate Information
We are a public limited company incorporated in Jersey, Channel Islands, and tax resident in the UK. Our registered address in Jersey, Channel Islands is 13 Castle Street, St Helier, Jersey JE1 1ES. Our principal business address is 201 Bishopsgate, London, EC2M 3AE, United Kingdom, and our telephone number is +44 (0) 20 7818 1818.
An investment in our common stock involves various risks, including those mentioned below and those that are discussed from time to time in our periodic filings with the SEC. Investors should carefully consider these risks, along with the other information contained in this report, before making an investment decision regarding our common stock. There may be additional risks of which we are currently unaware, or which we currently consider immaterial. Any of these risks could have a material adverse effect on our financial condition, results of operations and value of our common stock.
Market and Investment Performance Risks
Our results of operations and financial condition are primarily dependent on the value, composition and relative investment performance of our AUM, all of which are subject to fluctuation caused by factors outside of our control.
We derive our revenues primarily from investment management and related services we provide to institutional and retail investors worldwide through our investment products. Our investment management fees typically are calculated as a percentage of the market value of our AUM. Certain of our investment products are also subject to performance fees, which vary based on a product’s relative performance as compared to a benchmark index. As a result, our revenues are dependent on the value, composition and investment performance of our AUM, all of which are subject to fluctuation caused by factors outside of our control.
Factors that could cause our AUM and revenue to decline include the following:
| | ● | Declines in equity markets. Our AUM is concentrated in the U.S. and European equity markets. Equity securities may decline in value as a result of many factors, including an issuer’s actual or perceived financial condition and growth prospects, investor perception of an industry or sector, changes in currency exchange rates, changes in regulations, inflation, labor disputes or shortages, supply chain issues, natural disasters, and geopolitical and economic risks. Declines in the equity markets, or in the market segments in which our investment products are concentrated, have in the past, and could in the future, cause our AUM to decrease. |
| | ● | Declines in fixed income markets. Fixed income investment products also constitute a large portion of our AUM. Fixed income securities may decline in value as a result of various factors, principally increases in interest rates (partly due to inflationary expectations), changes in currency exchange rates, changes in relative yield among instruments with different maturities (including as a result of shifts in the U.S. treasury yield curve), geopolitical and general economic risks, available liquidity in the markets in which a security trades, an issuer’s actual or perceived creditworthiness, or an issuer’s ability to meet its obligations. Declines in the fixed income markets, or in the market segments in which our investment products are concentrated, have in the past, and could in the future, cause our AUM to decrease. |
| | ● | Investment performance. Our investment performance, along with achieving and maintaining superior distribution and client service, is critical to the success of our business. Strong investment performance has historically stimulated sales of our investment products. Poor investment performance as compared to third-party benchmarks or competitive products has in the past, and could in the future, lead to a decrease in sales of investment products we manage and stimulate redemptions from existing products, generally lowering the overall level of our AUM and reducing our management fees, and may have an adverse effect on our revenue and net income. In addition, certain of our investment products are subject to performance fees that are based either on investment performance as compared to an established benchmark index or on positive absolute return over a specified period of time. If our investment products that are subject to performance fees underperform, our revenue, results of operations and financial condition may be adversely affected. In addition, performance fees subject our revenue to increased volatility. No assurance can be given that past or present investment performance in the investment products we manage is indicative of future performance. |
Our revenue and profitability would be adversely affected by any reduction in our AUM as a result of redemptions and other withdrawals from the funds and accounts we manage.
Investors may reduce their investments in the funds and accounts we manage, or reduce their investments generally, for many reasons, including:
| | ● | In response to adverse market conditions; |
| | ● | To pursue other investment opportunities; |
| | ● | To reallocate investments to lower-fee strategies; |
| | ● | To take profits from their investments; |
| | ● | As a result of poor investment performance of the funds and accounts we manage; |
| | ● | As a result of the failure or negative performance of investment products offered by competitors that could lead investors to lose confidence in similar investment products we manage, irrespective of the investment performance of such products; |
| | ● | As a consequence of damage to our reputation; |
| | ● | Due to portfolio risk characteristics, which could cause investors to move assets to other investment managers; or |
| | ● | As a result of changes to the investor’s business model that could cause them to reduce their investments with us, such as moving away from a sub-advised business model or exiting the mutual fund business. |
In addition, the loss of key personnel or significant investment management professionals could reduce the attractiveness of our products to current and potential clients and adversely affect our revenues and profitability.
Volatility and disruption of the capital and credit markets, and adverse changes in the global economy, may significantly affect our results of operations and may put pressure on our financial results.
The capital and credit markets may, from time to time, experience volatility and disruption worldwide. Declines in global financial market conditions have in the past, and could in the future, result in significant decreases in our AUM, revenues and income. Such declines have had, and may in the future have, an adverse impact on our results of operations. We may need to modify our business, strategies or operations, and we may be subject to additional constraints or costs in order to compete in a changing global economy and business environment.
Disruptions in the markets, to market participants and to the operations of third parties whose functions are integral to our ETF platforms may adversely affect the prices at which ETFs trade, particularly during periods of market volatility.
The trading price of an ETF’s shares or units fluctuates continuously throughout trading hours. While an ETF’s creation/redemption feature and the arbitrage mechanism are designed to make it more likely that the ETF’s shares or units normally will trade at prices close to the ETF’s net asset value (“NAV”), exchange prices may deviate significantly from the NAV. ETF market prices are subject to numerous potential risks, including:
| | ● | Significant market volatility; |
| | ● | Imbalances in supply and demand; |
| | ● | Trading halts invoked by a stock exchange; and |
| | ● | Inability or unwillingness of market markers, authorized participants, settlement systems or other market participants to perform functions necessary for an ETF’s arbitrage mechanism to function effectively. |
If market events lead to instances where an ETF trades at prices that deviate significantly from the ETF’s NAV or indicative value, or trading halts are invoked by the relevant stock exchange or market, investors may lose confidence in ETF products and sell their holdings, which may cause the ETF’s AUM, revenue and earnings to decline.
Illiquidity in certain securities in which we invest may negatively impact the financial condition of our investment products and may impede our ability to effect redemptions.
Some of our funds or mandates invest in certain securities or other assets in which the secondary trading market is illiquid or does not exist. Illiquidity may occur with respect to the securities of a specific issuer, based on industry, sector or geographic region, or with respect to an asset class or an investment type. An illiquid trading market may increase market volatility and may make it difficult to sell investments promptly without suffering a loss. This may have an adverse impact on the investment performance of such funds and mandates, and on our AUM, revenues and results of operations.
Investors in certain funds we manage have contractual terms that provide for a shorter notice period for redemptions or withdrawals than the time period during which these funds may be able to sell underlying investments within the fund. This liquidity mismatch may be exacerbated during periods of market illiquidity and, in circumstances in which there are high levels of investor redemptions, it may be necessary for us to impose restrictions on redeeming investors or suspend redemptions. Such actions could increase the risk of legal claims by investors and regulatory investigations and/or fines and may adversely affect our reputation.
Changes in the value of our seeded investment products could adversely affect our earnings and financial condition.
We have a significant seed portfolio. Periodically, we add new investment strategies to our investment product offering and provide the initial cash investment, or seeding, to facilitate the launch of the new product. We may also provide substantial supplemental capital to an existing investment product to accelerate the growth of a strategy and attract outside investment in the product. A decline in the valuation of these seeded investments could negatively impact our earnings and financial condition.
We could be adversely impacted by changes in assumptions used to calculate pension assets and liabilities.
We provide retirement benefits for our current and former employees in the UK through the Janus Henderson Group Pension Scheme (“UK Pension Scheme”). The UK Pension Scheme operates a number of defined benefit sections, which closed to new entrants on November 15, 1999, and a money purchase section. As of December 31, 2024, the UK Pension Scheme had a net pension asset of $68.3 million. Our funding obligations for the UK Pension Scheme may be adversely affected by many factors, including poorer than expected long-term return on plan assets; longer life expectancy; changes in actuarial assumptions by reference to which our contributions are assessed, such as changes to assumptions on interest rates and inflation; changes to the regulatory regime for funding defined benefit pension schemes in the UK; and other factors. We may also be subject to obligations to contribute funds or take other action imposed by the Pension Protection Fund in connection with the UK Pension Scheme. If we were required to increase our contributions in the future to cover any increased funding shortfall, levy by the Pension Protection Fund and/or expenses in the UK Pension Scheme, our results and financial condition could be adversely affected.
The global scope of our business subjects us to currency exchange rate risk that may adversely impact revenue and income.
We generate a substantial portion of our revenue in Great British pounds (“GBP”), euros (“EUR”) and Australian dollars (“AUD”). As a result, we are subject to foreign currency exchange risk relative to the U.S. dollar (“USD”), our financial reporting currency, through our non-U.S. operations, including through our exposure to non-USD income, expenses, assets and liabilities of our overseas subsidiaries, as well as net assets and liabilities denominated in a currency other than USD. Fluctuations in the exchange rates to the USD have adversely affected, and may continue to adversely affect, our financial results from one period to the next. In addition, there is risk associated with the foreign exchange revaluation of balances held by certain of our subsidiaries for which the local currency is different from our functional currency.
We could be impacted by counterparty or client defaults.
In periods of significant market volatility, the deteriorating financial condition of one financial institution may materially and adversely impact the performance of others. We, and the funds and accounts we manage, have exposure to many different counterparties, and routinely execute transactions with counterparties across the financial industry. As a result, we and our managed funds and accounts may be exposed to credit, operational or other risks in the event of a default by a counterparty or client, or in the event of other unrelated systemic market failures.
Business and Strategic Risks
We operate in a highly competitive environment, and revenue from fees may be reduced.
The investment management business is highly competitive. In recent years, established firms and new entrants to the asset management industry have expanded their application of technology, including the use of robo advisers and artificial intelligence (“AI”), to provide services to clients. Our traditional fee structures may be subject to downward pressure due to these factors. Moreover, the asset management industry is facing transformative pressures and trends from a variety of different sources, including a trend toward lower fee investment products, as evidenced by the movement toward passively managed mutual funds and the growth of lower cost funds such as exchange-traded, smart beta and quantitative funds. Fees for actively managed investment products may continue to come under increased pressure if such products fail to outperform returns for comparable passively managed products or as a consequence of regulatory intervention. Fee reductions on existing or future new business, as well as changes in regulations pertaining to fees, could adversely affect our results of operations and financial condition. Additionally, we compete with investment management companies on the basis of investment performance, fees, diversity of products, distribution capability, scope and quality of services, reputation and the ability to develop new investment products to meet the changing needs and preferences of investors. Failure to adequately compete could adversely affect our AUM, results of operations and financial condition.
Our success depends on our key personnel, and our financial performance could be negatively affected by the loss of their services.
The success of our business is highly dependent on our ability to attract, retain and motivate highly skilled and often highly specialized technical, executive, sales and investment management personnel. The market for qualified investment and sales professionals is extremely competitive and is characterized by the frequent movement of portfolio managers, analysts and salespeople among different firms. Any changes to management structure, shifts in corporate culture, changes to corporate governance authority, or adjustments or reductions to compensation could affect our ability to retain key personnel and could result in legal claims. To retain certain key personnel, we may be required to increase compensation to such individuals, resulting in additional expense. Laws and regulations could impose restrictions on the amount of compensation paid by financial institutions, as well as the processes for paying and deferring compensation, which could restrict our ability to compete effectively for qualified professionals. In addition, technological advancements in our industry, including with respect to AI and machine learning technologies, could result in increased demand and competition for qualified professionals with such skills and technological knowledge. There can be no assurance that we will be successful in finding, attracting and retaining qualified individuals, and the departure of key personnel, particularly those personnel responsible for managing client funds that account for a high proportion of our revenue, could cause us to lose clients, which could have a material adverse effect on our AUM, results of operations and financial condition. Effective succession planning is also important to our long-term success. Failure to ensure effective transfer of knowledge and smooth transitions involving key employees could hinder our strategic planning and execution.
We are dependent upon third-party distribution channels to access clients and potential clients.
Our ability to market and distribute our investment products is significantly dependent on access to the client base of financial intermediaries, such as insurance companies, defined contribution plan administrators, securities firms, broker-dealers, financial advisors, multi-managers, banks and other distribution channels. These companies generally offer their clients’ various investment products in addition to, and competitive with, products offered by us. In addition, our existing relationships with third-party distributors and access to new distributors could be adversely affected by recent consolidation within the financial services industry. Consolidation may result in increased distribution costs, a reduction in the number of third parties distributing our investment products or increased competition to access third-party distribution channels. Moreover, fiduciary regulations have led to significant shifts in distributors’ business models and more limited product offerings, and additional fiduciary or other regulations could lead to further changes, potentially resulting in reduced distribution of certain of our products. Our inability to access clients through third-party distribution channels could adversely affect our business prospects, AUM, results of operations and financial condition.
The global scope of our business subjects us to market-specific political, economic and other risks that may adversely impact our revenue and income generated overseas.
Our global portfolios and revenue derived from managing these portfolios are subject to significant risks of loss as a result of political, economic and diplomatic developments; currency fluctuations; social instability; global hostilities; changes in governmental policies, regulation and enforcement; expropriation; nationalization; asset confiscation; and changes in legislation related to ownership of non-U.S. securities.
Individual financial, equity, debt and commodity markets may be adversely affected by financial, economic, political, electoral, diplomatic or other instabilities that are particular to the country or region in which a market is located, and such events may also adversely impact other markets. Global economic conditions also affect the mix, market values and levels of our AUM and are difficult to predict. Political, economic and environmental events in any country or region could result in significant declines in equity and/or fixed income securities with exposure to such a country or region and, to the extent that we have a concentration of AUM in such a country or region, could result in a material adverse effect on our AUM, results of operations and financial condition. For example, the ongoing conflicts in Ukraine and the Middle East have significantly impacted the global economy and financial markets and may continue to have an adverse impact on our investment performance and flows in certain products. There is a risk that these conflicts, as well as any future conflicts, may spread more broadly, increasing the potential adverse impact on our AUM, results of operations and financial condition. We will continue to monitor any direct and indirect impacts of these circumstances on our business, financial results and operations, although it is not possible to predict the broader consequences of these ongoing conflicts at this time.
In addition, international trading markets, particularly in some emerging market countries, are often smaller, less liquid, less regulated and significantly more volatile than those in the U.S. Local regulatory environments may vary widely in terms of scope, adequacy and sophistication. Moreover, regulators in non-U.S. jurisdictions could change their policies or laws in a manner that might restrict or otherwise impede our ability to distribute or authorize products or maintain our authorizations in their respective markets. Similarly, local distributors and their policies and practices, as well as financial viability, may also vary widely or be inconsistent, less developed or less mature than other, more internationally focused distributors. As our business grows in non-U.S. markets, any ongoing and future business, political, economic or social unrest affecting these markets may have a negative impact on the long-term investment climate in these and other areas, and, as a result, our AUM and the revenue and income we generate from these markets may be negatively affected.
Our reputation is critical to the success of our business. Harm to our reputation could reduce our AUM and impact sales, which could adversely affect our revenue and net income.
We believe that our brand name is well-received both in the asset management industry and with our clients, reflecting the fact that our brand, like our business, is based in part on trust and confidence. If our reputation is harmed, existing clients may reduce their investments or withdraw from funds we manage, or funds may terminate or reduce AUM under their management agreements with us, which could reduce our AUM and negatively impact our revenue and profitability.
As part of our business, we are required to continuously manage actual and potential conflicts of interest, including situations where our services to a particular client conflict, or are perceived to conflict, with the interests of another client or those of JHG or our employees. The willingness of clients to enter into transactions in which such a conflict might arise may be affected if we fail, or appear to fail, to deal appropriately with conflicts of interest. In addition, failure to appropriately manage potential, perceived or actual conflicts could damage our reputation and give rise to litigation or regulatory enforcement actions.
Our reputation could also be damaged by factors such as:
| | ● | Litigation; |
| | ● | Regulatory action; |
| | ● | Loss of key personnel; |
| | ● | Operational failures; |
| | ● | Underperformance of our investment products; |
| | ● | Fraud, misconduct or mismanagement, theft, loss or misuse of client data by our personnel or third parties; |
| | ● | Failure to manage conflicts of interest or satisfy fiduciary responsibilities; and |
| | ● | Negative publicity or press speculation (whether or not any such allegations or claims are valid or ultimately disproved, dismissed or withdrawn). |
Reputational harm may cause us to lose current clients and we may be unable to continue to attract new clients or develop new business. If we fail to effectively address the underlying causes of any harm to our reputation, our financial results and future business prospects would likely be adversely affected.
The carrying value of goodwill and other intangible assets on our balance sheet could become impaired, which would adversely affect our results of operations.
At December 31, 2024, our goodwill and intangible assets totaled $4,023.7 million. The value of these assets may not be realized for a variety of reasons, including significant redemptions, loss of clients, damage to brand name and unfavorable economic conditions. We have recorded goodwill and intangible asset impairments in the past and could incur similar charges in the future. Under U.S. GAAP, goodwill and intangible assets with indefinite lives are not amortized but are tested for impairment annually or more often if an event or circumstance indicates that an impairment loss may have been incurred. Other intangible assets with finite lives are amortized on a straight-line basis over their estimated useful lives and reviewed whenever there is an indication of impairment. Should such reviews indicate impairment, a reduction of the carrying value of the intangible asset could occur, resulting in a charge that may, in turn, adversely affect our results of operations and financial condition.
Our business depends on investment management agreements that are subject to termination, non-renewal or reductions in fees.
We derive revenue from investment management agreements with investment funds, institutional investors and other investors. These agreements generally provide investors or, in some cases, the independent directors of applicable investment funds, with significant latitude to terminate such contracts, withdraw funds or liquidate funds, or to remove Janus Henderson as a fund's investment advisor (or equivalent). We also manage our U.S. mutual funds under management agreements that may be terminated by either party with notice, or in the event of an “assignment” (as defined in the Investment Company Act), and must be approved and renewed annually by the independent members of each fund’s board of directors or trustees or its shareholders, as required by law. U.S. mutual funds, investment funds or other investors may choose to exercise such termination rights at any time. The annual review of investment management agreements with U.S. mutual funds, as required by law, could result in a reduction in our advisory fee revenues. The termination of, or failure to renew, one or more of these agreements could have a material adverse effect on our AUM, results of operations and financial condition.
Our expenses are subject to fluctuations that could materially affect our operating results.
Our results of operations are dependent on our level of expenses, which can vary significantly for many reasons, including:
| | ● | Changes in the level and scope of our operating expenses in response to market conditions or regulations; |
| | ● | Variations in the level of total compensation expense due to changes in bonuses and stock-based awards, changes in employee benefit costs due to regulatory or plan design changes, changes in our employee count and mix, competitive factors, market performance and other factors; |
| | ● | Expenses incurred to support distribution of our investment strategies and services, develop new strategies and services, and enhance our technology, compliance and other infrastructure; |
| | ● | Impairments of intangible assets or goodwill; and |
| | ● | Impact of inflation and interest rate changes. |
Increases in the level of our expenses, or our inability to reduce the level of expenses when necessary, could materially affect our operating results.
We may engage in strategic transactions that could pose risks to our business, financial condition and global operations.
As part of our global business strategy, we regularly consider, and have discussions with respect to, potential strategic transactions, including acquisitions, dispositions, consolidations, joint ventures or similar transactions, some of which may be deemed material. There can be no assurance that we will find suitable candidates for strategic transactions at acceptable prices or other terms, have sufficient capital resources to accomplish our strategy or be successful in entering into agreements for strategic transactions.
We have made acquisitions and divestitures in the past and may pursue similar transactions in the future. Such transactions typically involve a number of risks and present financial, managerial and operational challenges, including:
| | ● | Difficulties in the integration of acquired businesses into our operations and control environment (including our risk management policies and procedures); |
| | ● | Assumed or unforeseen liabilities that arise in connection with the acquired businesses; |
| | ● | Disputes with counterparties, including the possible failure of counterparties to satisfy any obligations to indemnify us against liabilities arising from the acquired businesses; |
| | ● | Adverse effects on our earnings if acquired intangible assets or goodwill become impaired; and |
| | ● | The possible need for us to increase our firm's leverage or, if we issue equity securities to pay for acquisitions, dilute the holdings of our existing shareholders. |
Acquisitions also pose the risk that any business we acquire may lose customers, intermediaries or employees or could underperform relative to growth expectations or expected synergies from the acquired businesses. Additionally, the loss of investment personnel poses the risk that we may lose the AUM we expected to manage, which could adversely affect our results of operations.
Entries into definitive agreements for material transactions typically are announced publicly even though completion of these transactions may remain subject to numerous closing conditions, contingencies and approvals, and there is no assurance that any announced transaction will actually be consummated.
In addition, from time to time, we may enter into joint ventures or take minority stakes in companies in which we do not have control. These investments may involve risks, including the risk that the controlling stakeholder or joint venture partner may have business interests, strategies or goals that are inconsistent with ours. The business decisions or other actions or omissions of the controlling stakeholder, joint venture partner or the entity itself may result in liability to us or harm to our reputation, or adversely affect the value of our investment in the entity.
Operational and Technology Risks
We could be subject to losses and reputational harm if we, or our agents, fail to properly safeguard sensitive and confidential information against cyberattacks or other security breaches, or if our business processes are not sufficiently resilient.
We depend on the continued effectiveness of our information and cybersecurity policies, procedures and capabilities to protect our computer and telecommunications systems and the data that resides in or is transmitted through such systems.
As part of our normal operations, we maintain and transmit confidential information about our clients and employees as well as proprietary information relating to our business operations. We maintain a system of internal controls designed to secure and protect such information. Nevertheless, all technology systems remain susceptible to unauthorized access and may be corrupted by cyberattacks, computer viruses or other malicious software code. In addition, authorized persons could inadvertently or intentionally misappropriate or release confidential or proprietary information. Any breach or other failure of our technology or operational controls, including those of third parties with which we do business, or any failure to timely and effectively identify and respond to a breach or failure, could result in the loss of valuable information, liability for stolen assets or information, remediation costs to repair damage caused by the incident, additional costs to mitigate against future incidents and litigation costs resulting from the incident. Our use of mobile and cloud technologies and AI applications could heighten these and other operational risks, and any failure by the providers of these services to prevent cyberattacks could disrupt our operations and result in misappropriation, corruption or loss of confidential or proprietary information. Moreover, any loss of confidential customer identification information could harm our reputation, result in the termination of certain contracts by our existing customers and subject us to liability under laws that protect confidential personal data, resulting in increased costs or loss of revenue.
Security breaches, including cyberattacks and phishing attacks, have become increasingly sophisticated. Cyberattacks can originate from a variety of sources, including third parties affiliated with foreign governments, organized crime or terrorist organizations. Third parties may also attempt to place individuals within our firm, or induce employees, clients or other users of our systems, to disclose sensitive information or provide access to our data, and these types of risks may be difficult to detect or prevent. Also, increasing use of AI may heighten these risks. There can be no assurance that our investments in precautions and safeguards will protect our business from all attempted cyberattacks or other incidents. Recent well-publicized security breaches at other companies have exposed failures to keep pace with the threats posed by cyberattackers and have led to increased government and regulatory scrutiny, including investigations and enforcement actions, which could lead to increased costs or fines or public censure. In addition, although we maintain insurance coverage that may, subject to terms and conditions, cover certain aspects of cyber and information security risks, such insurance coverage may be insufficient to cover all losses, such as litigation costs or financial losses that exceed our policy limits or are not covered under any of our current insurance policies.
Due to our interconnectivity with third-party vendors, advisors, central agents, exchanges, clearing organizations and other financial institutions, we may be adversely affected if any of them are subject to a successful cyberattack or other information security event, including those arising from the use of mobile technology, a third-party cloud environment or AI applications. Certain software applications that we use in our business are licensed by, and supported, upgraded and maintained by, third-party vendors. A suspension or termination of certain of these licenses or the related support, upgrades and maintenance could cause temporary system delays or interruption that could adversely impact our business. Also, such third-party applications may include confidential and proprietary data provided by vendors and by us. We may be subject to indemnification costs and liability to third parties if we breach any confidentiality obligations regarding vendor data for losses related to the data, or if data we provide is deemed to infringe upon the rights of others.
Finally, cybersecurity, data privacy and AI have become high priorities for regulators, and many jurisdictions are enacting laws and regulations in these areas. Our failure to comply with these and other applicable requirements could result in regulatory investigations and penalties as well as negative publicity, which could materially adversely affect our business, results of operations and financial condition.
Initiatives to upgrade our information technology systems and business processes involve many risks, and our failure to execute these upgrades successfully could have an adverse impact on our business.
From time to time, we undertake significant projects to upgrade our information technology systems and business processes intended to optimize our operational and financial performance. Transitioning to these new or upgraded systems and processes may require significant capital investments and personnel resources. These projects may be subject to cost overruns and delays, and the transition to these new or upgraded systems and processes may cause disruptions in our daily business operations. There is also no guarantee that we will realize the anticipated synergies and benefits related to these initiatives. Any material disruptions in our information technology systems or business processes could have a material adverse effect on our business.
We are incorporating artificial intelligence into some of our business workflows and processes, and challenges with properly managing its use could result in reputational harm, competitive harm and legal liability, and adversely affect our results of operations.
We have begun using AI and machine learning technologies to enhance certain workflows and processes used in our business, and our research into and continued deployment of such capabilities remain ongoing. AI is still in its early stages, and the introduction and incorporation of AI technologies may result in unintended consequences or other new or expanded risks and liabilities. If the content, analyses or recommendations that AI applications assist in producing are, or are alleged to be, deficient, inaccurate or biased, such as due to limitations in AI algorithms, insufficient or biased base data or flawed training methodologies, our business, financial condition, results of operations and reputation may be adversely affected. Additionally, AI technology is continuously evolving, and we may incur costs to adopt and deploy AI technologies that could become obsolete earlier than expected, and there can be no assurance that we will realize the desired or anticipated benefits from AI. Also, our competitors or other third parties may incorporate AI into their products and services more quickly or more successfully than us, which could impair our ability to compete effectively and adversely affect our results of operations.
The use of AI applications to support business processes carries inherent risks related to data privacy and security, such as unintended or inadvertent transmission of proprietary or sensitive information, including personal data. AI presents emerging ethical issues, and we may be unsuccessful in identifying and resolving these issues before they arise. If our use of AI becomes controversial, we may experience brand or reputational harm, competitive harm, or legal liability. There is uncertainty in the legal and regulatory landscape for AI, which is not fully developed, and any laws, regulations or industry standards adopted in response to the emergence of AI may be burdensome, could entail significant costs, and may restrict or impede our ability to successfully develop, adopt and deploy AI technologies efficiently and effectively.
Failure to maintain adequate controls and risk management policies, the circumvention of controls and policies, or fraud, as well as failure to maintain adequate infrastructure or failures in operational or risk management processes and systems could have an adverse effect on our AUM, results of operations and financial condition.
Although we have a comprehensive risk management process, there can be no assurances that our controls, procedures, policies and systems will successfully identify and manage internal and external risks to our business. For example, our employees, contractors or other third parties may deliberately seek to circumvent established controls to commit fraud or act in ways that are inconsistent with our controls, policies and procedures. Any operational errors or negligence by our employees, or others acting on our behalf, or weaknesses in the internal controls over those processes could result in losses for us, and we may be required to compensate clients for losses suffered and/or regulatory fines. Persistent or repeated incidents involving conflicts of interest, circumvention of policies and controls, fraud or insider trading could have a materially adverse impact on our reputation and could lead to costly regulatory inquiries.
Our business is also highly dependent on the integrity, security and reliability of our information technology systems and infrastructure. If any of our critical systems or infrastructure do not operate properly or are disabled, our ability to perform effective investment management on behalf of our clients could be impaired. In addition, if we fail to maintain our information technology systems and an infrastructure commensurate with the size, scope and technological requirements of our business, our productivity, growth and reputation could be negatively affected, which could have an adverse impact on our AUM, results of operations and financial condition.
Insurance may not be available on a cost-effective basis to protect us from potential liabilities.
We face the inherent risk of liability and costs related to or arising from claims from clients, employees and other third parties; actions taken by regulatory agencies; losses arising from fraud or other criminal activity; and costs and losses associated with cyber incidents. To help protect against these and other potential liabilities, we have purchased insurance in amounts, and against risks, that we consider appropriate, where such insurance is available at prices we deem reasonable. There can be no assurance, however, that a claim or claims will be covered by insurance or, if covered, will not exceed coverage limits; that an insurer will meet its obligations regarding coverage; or that insurance coverage will continue to be available on a cost-effective basis. Insurance costs are impacted by market conditions and the risk profile of the insured, and may increase significantly over relatively short periods. In addition, certain types of insurance coverage may not be available or may only be available at prohibitive cost. Renewals of insurance policies may expose us to additional costs through higher premiums or the assumption of higher deductibles or co-insurance liability.
Our business may be vulnerable to failures of support systems and client service functions provided by third-party vendors.
Our client service capabilities as well as our ability to obtain prompt and accurate securities pricing information and to process client transactions and reports are significantly dependent on communication and information systems and services provided by third-party vendors. The ability to consistently and reliably obtain securities pricing information, process client transactions, and provide reports and other client services to the shareholders of funds and other investment products we manage is essential to our operations. Any delays, errors or inaccuracies in pricing information, processing client transactions, or providing reports, and any other inadequacies in other client service functions could impact client relationships, result in financial losses and potentially give rise to regulatory actions and claims against us.
We depend on third-party service providers and other key vendors for various fund administration, accounting, custody, risk analytics, market data, market indices and transfer agent roles, and other distribution and operational needs. If our third-party service providers or other key vendors fail to fulfill their obligations, experience service interruptions, cease providing their services on short notice or otherwise provide inadequate service, operational and regulatory problems could occur, including with respect to certain of our products, which could result in losses, enforcement actions or reputational harm, and which could negatively impact our AUM, results of operations and financial condition.
Our inability to recover successfully, should we experience a disaster or other business continuity problem, could cause material financial loss, regulatory actions, legal liability and/or reputational harm.
Significant portions of our business operations and those of our critical third-party service providers are concentrated in a few geographic areas, including the UK, the U.S., Luxembourg and Australia. Should we, or any of our critical service providers, experience a significant local or regional disaster or other event that disrupts business continuity, such as an earthquake, hurricane, tsunami, wildfire, terrorist attack, epidemic or pandemic, or other natural or man-made disaster, our continued success will depend in part on the safety and availability of our personnel, our office facilities and the proper functioning of our technology, computer, telecommunications and other systems and operations that are critical to our business. We have developed various backup systems and contingency plans, but no assurance can be given that they will be adequate in all circumstances that could arise or that material interruptions and disruptions will not occur. In addition, we will rely to varying degrees on outside vendors for disaster recovery support, and no assurance can be given that these vendors will be able to perform in an adequate and timely manner. If we, or any of our critical service providers, are unable to respond adequately to such an event in a timely manner, we may be unable to continue our business operations, which could damage our reputation and lead to a loss of customers and have an adverse effect on our AUM, revenue and net income.
Climate change-related risks could adversely affect our business, products, operations and clients, which may cause our AUM, revenue and earnings to decline.
Our business and those of our clients could be impacted by risks related to climate change. Climate change may present risk to us through changes in the physical climate or from the process of transitioning to a lower-carbon economy. Climate-related physical risks arise from the direct impacts of a changing climate over the short, medium and long term. Such risks may include extreme weather events, rising sea levels, water scarcity, and changes in temperature, which may damage infrastructure and facilities, as well as disrupt connectivity or supply chains. Climate-related transition risks arise from our exposure to the transition to a lower-carbon economy through policy, regulatory, technology and market changes. For instance, new regulations or guidance relating to climate change, as well as the perspectives of stakeholders regarding climate change, may impact our investment products, business processes and reputation, which could increase our costs of doing business. At times, regulations and market demands regarding climate impact in one region may be in direct conflict with regulations and market demands in another region, which may create risk that our activity in one region adversely impacts activity in the other. Climate-related physical and transition risks could impact us both directly and indirectly through adverse impacts on our clients, including as a result of declines in asset values, changes in client investing preferences, increased regulatory and compliance costs, and significant business disruptions. Any of these risks may cause our AUM, revenue and earnings to decline.
Negative changes in our credit ratings and global market volatility may impair our ability to obtain financing and may increase our borrowing costs.
Our ability to access the capital markets, as well as our borrowing costs under our credit facility, depends significantly on our credit ratings and credit outlook. Changes in our credit ratings or credit outlook, which are determined by rating agencies such as Standard & Poor’s (“S&P’s”) and Moody’s Investors Service, as well as global market volatility and interest rate increases, could cause us to incur higher borrowing costs or to have greater difficulty in accessing the capital markets. In addition, volatility in global financial and capital markets may also affect our ability to access the capital markets in a timely manner.
Legal and Regulatory Risks
We operate in an industry that is subject to extensive, complex, overlapping and sometimes conflicting regulation and supervision around the world, and any enforcement action or changes in the laws or regulations governing our business could adversely affect our AUM, results of operations or financial condition.
Like all investment management firms, our activities, products and services are highly regulated in almost all markets in which we conduct business, including the U.S., the UK, Continental Europe, Australia, Singapore and other international markets. Compliance with these regulations is costly and complex.
Laws and regulations applied at the international, national, state or provincial, and local levels generally grant governmental agencies and industry self-regulatory authorities broad administrative discretion over our activities, including the power to limit or restrict our business activities; conduct examinations, risk assessments, investigations and capital adequacy reviews; and impose remedial programs to address perceived deficiencies. As a result of regulatory oversight, we could face requirements that negatively impact the way in which we conduct business, increase compliance costs, impose additional capital requirements and/or involve enforcement actions that could lead to sanctions, including the potential revocation of licenses to operate certain businesses, the suspension or expulsion from a particular jurisdiction or market of any of our business organizations or key personnel, or the imposition of increasingly substantial fines and censures on us or our employees. Judgments or findings of wrongdoing by regulatory or governmental authorities, or in private litigation against us, could affect our reputation, increase our costs of doing business and/or negatively impact our AUM and revenues, any of which could have an adverse impact on our results of operations or financial condition.
The regulatory environment in which we operate changes frequently and has seen a significant increase in proposed and adopted regulations in recent years. Certain enacted provisions and proposals for new regulation are potentially far-reaching and, depending upon their implementation, could increase the cost of offering investment products and services in the markets where we conduct business and have material adverse effects on our business, results of operations or financial condition. Additionally, challenges associated with interpreting regulations issued in numerous countries in a globally consistent manner may add to such risks and impacts if regulators in different jurisdictions have inconsistent views or provide only limited regulatory guidance. The aggressive pace, scope and complexity of regulatory change place additional demands on resources and introduce additional operational strains, which may impact our ability to fully and timely satisfy those regulatory requirements or constrain our ability to pursue other strategic projects and business priorities.
In the U.S., government agencies like the SEC have proposed or adopted several new regulations that have increased our regulatory burdens and related compliance costs. These include the Dodd-Frank Act, ERISA fiduciary obligations, cybersecurity risk management, the investment company names rule, ESG disclosures for investment advisers and investment companies, outsourcing and fund liquidity risk management programs, and swing pricing. The SEC and other agencies and institutions have taken action, and may continue to take further action, in response to global financial market developments, internal political dynamics and perennial industry challenges, such as conflicts of interest. Further actions by regulatory authorities could include new rules and requirements that may be applicable to us, the effect of which could have additional adverse consequences to our business, results of operations or financial condition. In addition, there remains uncertainty about the ultimate impact of recent changes to the leadership within the U.S. government under the current administration, including changes to policy or priorities that could impact the current regulatory landscape.
The EU has promulgated or is considering various new or revised legislation pertaining to financial services firms, including investment managers. On November 10, 2023, the EU published the final compromise text amending the Alternative Investment Funds Managers Directive (“AIFMD II”). Key changes include a new pan-European regime for loan origination funds, amendments to delegation and depositary processes, and enhanced reporting and transparency requirements. Such regulatory changes may have a direct impact on the revenue of our business should they result in structural or operational changes and may increase operational or compliance costs. We do not believe implementation of these requirements will fundamentally change the asset management industry or cause us to reconsider our fundamental strategy, but certain provisions may require us to change or impose new limitations on the manner in which we conduct business and may result in increased fee and margin pressure from clients.
The full extent of the impact on us of any laws, regulations or initiatives that may be proposed, and regulatory reform initiatives and enforcement agendas pursued by regulators such as the SEC and the DOL (which have separately expressed support for investor protection initiatives that may impact how and to whom certain investment products can be distributed in the U.S.), is impossible to determine. Recent changes have imposed, and may continue to impose, new compliance costs and/or capital requirements or impact us in other ways that could have a material adverse impact on our business, results of operations or financial condition. Moreover, certain legal or regulatory changes could require us to modify our strategies, businesses or operations, and these changes may result in the incurrence of other new constraints or costs, including the investment of significant management time and resources in order to satisfy new regulatory requirements or to compete in a changed business environment.
Regulatory and governmental examinations and/or investigations, litigation and the legal risks associated with our business could adversely impact our AUM, increase costs and negatively impact our profitability and/or our future financial results.
From time to time, we receive and respond to regulatory and governmental requests for documents or other information, subpoenas, examinations and investigations in connection with our business activities. In addition, from time to time, we are named as a party in litigation. Even if claims made against us are without merit, litigation typically is an expensive process. Risks associated with legal liability often are difficult to assess or quantify and their existence and magnitude can remain unknown for significant periods of time. Among other things, such matters may result in substantial fines, censure, legal damages, suspension of personnel, revocation of licenses and reputational damage, which may reduce our sales and increase redemptions. Eventual exposures from and expenses incurred relating to any examinations, investigations, litigation and/or settlements could adversely impact our AUM, increase costs and/or negatively impact our profitability and financial results. Allegations, findings or judgments of wrongdoing by regulatory or governmental authorities or in litigation against us, or settlements with respect thereto, could affect our reputation, increase our costs of doing business and/or negatively impact our revenues, any of which could have a material negative impact on our financial results.
Regulators may impose increased capital requirements on our subsidiaries, which could negatively impact our ability to return capital or pay dividends to our shareholders and adversely affect our results of operations and financial condition.
Regulators typically have broad discretion to impose increased regulatory capital requirements on the regulated entities within their jurisdiction. It is possible that the regulatory capital requirements that currently apply to our subsidiaries could be increased. The imposition of increased regulatory capital requirements could negatively impact our ability to return capital or pay dividends to shareholders, restrict our ability to make future acquisitions or, should we be required to raise additional capital, negatively impact our results of operations and financial condition.
Failure to comply with client contractual requirements and/or investment guidelines could negatively impact our AUM, results of operations and financial condition.
Many of the investment management agreements under which we manage assets or provide services specify investment guidelines or requirements that we are required to observe. Laws and regulations also impose similar requirements for certain accounts. A failure to follow these guidelines or requirements, or implement them appropriately, could result in damage to our reputation or in clients seeking to recover losses, withdrawing their assets or terminating their contracts, any one of which could cause revenues and profitability to decline. In addition, a breach of these investment guidelines or requirements could result in regulatory investigation, censure and/or fines.
We may be subject to claims of lack of suitability.
If our clients suffer losses on funds or investment mandates we manage, they may seek compensation from us on the basis of allegations that these funds or mandates were not suitable for them or that the fund prospectuses or other marketing materials contained material errors or were misleading. Despite the controls relating to disclosure in fund prospectuses and marketing materials, it is possible that such action may be successful, which in turn could adversely affect our business, financial condition and results of operations. Any claim for lack of suitability could also result in a regulatory investigation, censure or fines, and may damage our reputation.
Changes to tax laws could adversely affect us.
The determination of our provision for income taxes requires judgment, the use of estimates and the interpretation and application of complex tax laws. Our provision for income taxes reflects a combination of income earned and taxed in the various U.S. federal and state, UK and other jurisdictions. Jurisdictional tax law changes, increases or decreases in permanent differences between book and tax items, accruals or adjustments of accruals for unrecognized tax benefits or valuation allowances, and any changes in our mix of earnings from these taxing jurisdictions affect the overall effective tax rate and the amount of taxes payable.
Our tax affairs will, in the ordinary course of business, be reviewed by tax authorities, which may disagree with certain positions that we have taken or will take in the future and assess additional taxes. We regularly assess the likely outcomes of such tax inquiries, investigations or audits in order to determine the appropriateness of their respective tax provisions. However, there can be no assurance that we will accurately predict the outcomes of these inquiries, investigations or audits, and the actual outcomes of these inquiries, investigations or audits could have a material impact on our financial results.
In addition, changes to tax laws or income tax rates could materially impact our tax provision, cash tax liability, deferred income tax balances and effective tax rate.
Jersey Company Risks
Our ordinary shares, which we refer to as our common stock, are governed by the laws of Jersey, Channel Islands, which may not provide the level of legal certainty and transparency afforded by incorporation in a U.S. state.
We are organized under the laws of Jersey, Channel Islands, a British crown dependency that is an island located off the coast of Normandy, France. Jersey is not a member of the EU. Jersey, Channel Islands, legislation regarding companies is largely based on English corporate law principles. However, there can be no assurance that the laws of Jersey, Channel Islands, will not change in the future or that it will serve to protect investors in a similar fashion afforded under corporate law principles in the U.S., which could adversely affect the rights of investors.
U.S. shareholders may not be able to enforce civil liabilities against us.
Certain of our directors and executive officers are not residents of the U.S. A substantial portion of the assets of such persons are located outside the U.S. As a result, it may not be possible for investors to effect service of process within the U.S. upon such persons.
Judgments of U.S. courts may not be directly enforceable outside of the U.S., and the enforcement of judgments of U.S. courts outside of the U.S. may be subject to limitations. Investors may also have difficulties pursuing an original action brought in a court in a jurisdiction outside the U.S. for liabilities under the securities laws of the U.S.
| ITEM 1B. | UNRESOLVED STAFF COMMENTS |
None.
Risk Management and Strategy
To effectively manage the cyber risk posed to our organization and to remain within our risk appetite, we maintain a cybersecurity strategy and risk management program to identify, assess and manage material risks from cybersecurity threats with the aim of protecting the confidentiality, integrity and availability of our critical systems and information.
Our cybersecurity program takes a cyberthreat and risk-based approach and was developed to align with ISO 27001, an international standard for information security, and we also assess ourselves against the National Institute of Standards and Technology (“NIST”) Cybersecurity Framework. In addition, our cybersecurity risk management program aligns with ISO 31000, the international standard for risk management. The foregoing does not imply that we meet all technical standards, specifications or requirements, or that we have been certified on these requirements in any respect, only that we have used these industry standards as guides when designing our cybersecurity and risk management programs.
Our cybersecurity risk management program is integrated into our overall enterprise risk management program and shares common methodologies, reporting channels and governance processes that apply across our enterprise risk management program to other legal, compliance, strategic, operational and financial risk areas. For example, cybersecurity threats are subject to our firm-wide Risk Events Policy, which sets forth procedures for the identification, escalation, recording, investigation and approval of handling of such risk events.
Our cybersecurity risk management program includes a cybersecurity incident response plan. Major incidents emanating from cybersecurity threats are communicated to our Operational Risk team through our enterprise risk management system and escalated in accordance with our incident response plan. In addition, cybersecurity has been designated as a principal risk by the Risk Committee of our Board of Directors (the “Risk Committee”), which requires regular monitoring and reporting.
We identify material risks from cybersecurity threats through various sources, including, but not limited to, controls testing, compliance testing of our security standards, independent penetration testing, open-source threat intelligence feeds, and lessons learned and assessments against control frameworks. These threats are assessed by applying our Risk and Control Self-Assessment (“RCSA”), information technology risk and cybersecurity risk management processes, each of which we review regularly. Based on the RCSA, risks from cybersecurity threats that exceed established risk tolerance thresholds are recorded and incorporated into our reporting to the Risk Committee and senior management as described in more detail below. We also engage third-party assessors, consultants and auditors to assist in the administration, assessment and improvement of our cybersecurity risk management program.
To help bring risks from cybersecurity threats within an acceptable risk appetite and tolerance level, we created a cybersecurity strategy and associated program of necessary activities. The program mitigates the risks through the effective design and implementation of compensating controls or remediation actions, commensurate with the assessed risk level from such threats.
With respect to third-party service providers with access to our information systems, assets or data, our security policies, standards and procedures are designed so that periodic due diligence is conducted as appropriate on the cybersecurity controls maintained by such third parties. The aim is to ensure the third-party service provider has adequate and appropriate cybersecurity measures in place commensurate to the risk their access to our information systems, assets or data presents.
We have not identified any risks from cybersecurity threats or incidents that have materially affected or are reasonably likely to materially affect the business strategy, results of operations or financial condition of the Company. Please refer to the risk factor captioned “We could be subject to losses and reputational harm if we, or our agents, fail to properly safeguard sensitive and confidential information against cyberattacks or other security breaches or if our business processes are not sufficiently resilient.” in Part I, Item 1A. Risk Factors, for additional description of cybersecurity risks and potential related impacts on the Company.
Governance
Our Board of Directors has established a Risk Committee to assist the Board in its oversight of risk. As part of its responsibilities, the Risk Committee oversees management’s implementation of our cybersecurity and risk management program.
The Risk Committee receives regular reports from our Information Security leadership on our cybersecurity risks, including key status updates, security issues, current and future priorities, independent assurance, threat landscape and audit findings. The Risk Committee regularly reports to the full Board regarding its activities, including those related to cybersecurity oversight.
Our Information Security team, including our Information Security leadership, has primary responsibility for identifying, assessing and managing material risks to the Company from cybersecurity threats, including our overall cybersecurity risk management program and supervision of our internal cybersecurity personnel and our external cybersecurity consultants. Our Chief Information Security Officer (“CISO”) has over 20 years of information security/cybersecurity experience, working in a variety of roles within PricewaterhouseCoopers LLP, as the Director of Cyber Operations for Nationwide Building Society, the CISO at The Crown Estate and the CISO at Insight Investment.
Our Information Security team supervises efforts to prevent, detect, mitigate and remediate cybersecurity risks and incidents through various means, including receiving regular briefings from internal security personnel; threat intelligence and other information obtained from governmental, public or private sources, including external consultants engaged by us; and alerts and reports produced by security tools deployed in the IT environment.
Our Information Security leadership regularly briefs our Global Chief Operating Officer and Chief Technology Officer on cybersecurity issues, the scope of which is similar to the information presented by the Information Security leadership to the Risk Committee as described above. Major risks from cybersecurity threats determined following application of an RCSA are escalated by our Information Security leadership to the Risk Committee, Global Chief Operating Officer, Chief Technology Officer and other senior management.
We have 27 offices across the UK, Europe, North America, Asia and Australia. Our corporate headquarters is located in London, where it occupies approximately 116,000 square feet on a long-term lease that expires in 2028. We also have significant operations in Denver, Colorado, occupying approximately 161,000 square feet of office space, and its lease expires in 2032. The remaining 25 offices total approximately 103,000 square feet and are all leased. In the opinion of management, the space and equipment we lease is adequate for existing operating needs. See Note 9 — Leases, in Part II, Item 8, Financial Statements and Supplementary Data, for further information on our property leases.
The information set forth in response to Item 103 of Regulation S-K under “Legal Proceedings” is incorporated by reference from Part II, Item 8, Financial Statements and Supplementary Data, Note 19 — Commitments and Contingencies: Litigation and Other Regulatory Matters.
| ITEM 4. | MINE SAFETY DISCLOSURES |
Not applicable.
PART II
| ITEM 5. | MARKET FOR REGISTRANT’S COMMON EQUITY, RELATED STOCKHOLDER MATTERS AND ISSUER PURCHASES OF EQUITY SECURITIES |
JHG Common Stock
Our common stock is traded on the NYSE (symbol: JHG). On February 25, 2025, there were approximately 4,382 holders of record of our common stock.
Dividends
On January 30, 2025, our Board of Directors declared a cash dividend of $0.39 per share. The quarterly dividend will be paid on February 27, 2025, to shareholders of record at the close of business February 11, 2025.
Performance Graph
The following graph illustrates the cumulative total shareholder return of our common stock over the five-year period ending December 31, 2024, the last trading day of 2024, and compares it to the cumulative total return on the S&P 500 Index(1) and to the S&P U.S. BMI Asset Management & Custody Banks Index.(2) The S&P 500 Index consists of 500 stocks chosen for market size, liquidity and industry group representation and is one of the most widely used benchmarks of U.S. equity performance. The S&P U.S. BMI Asset Management & Custody Banks Index is a market-value weighted index of 40 asset management companies. The comparison assumes a $100 investment on December 31, 2019, in our common stock and in each of the foregoing indices, and assumes reinvestment of dividends, if any. This data is not intended to forecast future performance of our common stock.
(1) STANDARD & POOR’S®, S&P® and S&P 500® are registered trademarks of Standard & Poor’s Financial Services LLC.
(2) As of December 31, 2024, the S&P U.S. BMI Asset Management & Custody Banks Index comprised the following companies: Affiliated Managers Group, Inc.; AlTi Global, Inc.; Ameriprise Financial, Inc.; Ares Management Corporation; Artisan Partners Asset Management Inc.; BlackRock, Inc.; Blackstone Inc.; Blue Owl Capital Inc.; Bridge Investment Group Holdings Inc.; Cohen & Steers, Inc.; Diamond Hill Investment Group, Inc.; DigitalBridge Group, Inc.; Ellington Credit Company; Federated Hermes, Inc.; Franklin Resources, Inc.; Galaxy Digital Holdings Ltd.; GCM Grosvenor Inc.; GQG Partners Inc.; Hamilton Lane Incorporated; Heritage Global Inc.; Invesco Ltd.; Janus Henderson Group plc; KKR & Co. Inc.; Northern Trust Corporation; P10, Inc.; SEI Investments Company; Silvercrest Asset Management Group Inc.; State Street Corporation; StepStone Group Inc.; T. Rowe Price Group, Inc.; The Bank of New York Mellon Corporation; The Carlyle Group Inc.; TPG Inc.; Victory Capital Holdings, Inc.; Virtus Investment Partners, Inc.; WisdomTree, Inc.
(3) Data source: S&P Global Market Intelligence.
Common Stock Purchases — Corporate Buyback Program
On October 31, 2023, our Board of Directors approved the 2023 Corporate Buyback Program pursuant to which we were authorized to repurchase up to $150.0 million of our common stock on the NYSE at any time prior to the date of our 2024 Annual General Meeting of Shareholders, which was held on May 1, 2024. During 2024, we repurchased 2,876,189 shares of common stock for $88.2 million under the 2023 Corporate Buyback Program.
On May 1, 2024, our Board of Directors approved the 2024 Corporate Buyback Program pursuant to which we are authorized to repurchase up to $150.0 million of our common stock, and on October 30, 2024, our Board of Directors approved an incremental share buyback authorization to repurchase up to an additional $50.0 million of our common stock at any time prior to the date of our 2025 Annual General Meeting of Shareholders. As of December 31, 2024, cumulative shares repurchased under the 2024 Corporate Buyback Program were 3,159,199 shares for $120.0 million.
Common Stock Purchases — Share Plan Purchases
Some of our executives and employees obtain rights to receive our common stock as part of their remuneration arrangements and employee entitlements. We satisfy these entitlements by transferring shares of existing common stock that we repurchase on-market for this purpose (“Share Plan Repurchases”). These repurchases are in addition to the repurchases under the Corporate Buyback Program discussed above.
On October 31, 2023, our Board of Directors approved the repurchase of up to 4 million additional shares of common stock for the purpose of making grants to executives and employees at any time prior to the date of our 2024 Annual General Meeting of Shareholders, which was held on May 1, 2024. During 2024, we repurchased 2,268,376 shares of common stock for $70.0 million.
On May 1, 2024, our Board of Directors also approved the repurchase of up to 5 million additional shares of common stock to make grants to executives and employees at any time prior to the date of our 2025 Annual General Meeting of Shareholders. As of December 31, 2024, cumulative shares repurchased under the 2024 Share Plan Repurchases were 250,001 shares for $8.6 million.
The following table summarizes our common stock repurchases by month during the three months ended December 31, 2024.
| | | | | | | | | Total number of | | | Approximate U.S. dollar | |
| | Total | | | | | | | shares purchased | | | value of shares that may | |
| | | number of | | | Average | | | as part of | | | yet be purchased | |
| | shares | | | price paid | | | publicly announced | | | under the programs | |
Period | | purchased | | | per share | | | programs | | | (end of month, in millions) | |
October 1, 2024, through October 31, 2024 | | | 416,768 | | | $ | 39.45 | | | | 416,768 | | | $ | 117 | |
November 1, 2024, through November 30, 2024 | | | 393,487 | | | | 44.28 | | | | 393,487 | | | $ | 99 | |
December 1, 2024, through December 31, 2024 | | | 440,471 | | | | 43.69 | | | | 440,471 | | | $ | 80 | |
Total | | | 1,250,726 | | | $ | 42.47 | | | | 1,250,726 | | | | |
ITEM 6. [RESERVED]
| ITEM 7. | MANAGEMENT’S DISCUSSION AND ANALYSIS OF FINANCIAL CONDITION AND RESULTS OF OPERATIONS |
Business Overview
We are an independent global asset manager, specializing in active investment across all major asset classes. We actively manage a broad range of investment products for institutional and retail investors across four capabilities: Equities, Fixed Income, Multi-Asset and Alternatives. Our strategy revolves around three strategic pillars: Protect & Grow, Amplify, and Diversify, emphasizing relentless focus and disciplined execution in our core business for future success as a global active asset manager. Our strategy aims to foster sustained organic growth while also capitalizing on opportunistic inorganic growth opportunities to generate value for all of our stakeholders. We serve a diverse clientele worldwide, comprising intermediaries, institutional investors and self-directed clients. To cater to regional needs effectively, we maintain local presence across most markets and provide investment materials tailored to local customs, preferences and languages supported by our global distribution team.
Segment Considerations
We are a global asset manager and manage a range of investment products, operating across various product lines, distribution channels and geographic regions. However, information is reported to the chief operating decision-maker, our Chief Executive Officer (“CEO”), on an aggregated basis. Strategic and financial management decisions are determined centrally by our CEO and, on this basis, we operate as a single-segment investment management business.
Revenue
Revenue primarily consists of management fees and performance fees. Management fees are generally based on a percentage of the market value of our AUM and are calculated using either the daily, month-end or quarter-end average asset balance in accordance with contractual agreements. Accordingly, fluctuations in the financial markets have a direct effect on our operating results. Additionally, our AUM may outperform or underperform the financial markets and, therefore, may fluctuate in varying degrees from that of the general market.
Performance fees are specified in certain fund and client contracts, and are based on investment performance either on an absolute basis or compared to an established index over a specified period of time. These fees are often subject to an HWM. Performance fees are recognized at the end of the contractual period (typically monthly, quarterly or annually) if the stated performance criteria are achieved. Certain fund contracts allow for negative performance fees where there is underperformance against the relevant index.
2024 SUMMARY
2024 Financial Highlights
| | ● | Solid long-term investment performance, with 65%, 72%, 55% and 73% of our AUM outperforming benchmarks on a one-, three-, five- and 10-year basis, respectively, as of December 31, 2024. |
| | ● | AUM increased to $378.7 billion, up 13% from the year ended December 31, 2023, primarily due to positive market performance. |
| | ● | Net inflows for the year ended December 31, 2024, were $2.4 billion, compared to $(0.7) billion of net outflows for the year ended December 31, 2023. |
| | ● | 2024 diluted earnings per share was $2.56, or $3.53 on an adjusted basis. Refer to the Non-GAAP Financial Measures section for information on adjusted non-GAAP figures. |
| | ● | Strong balance sheet and cash generation, with $1.2 billion in cash and cash equivalents and $694.6 million of cash provided by operating activities in the year ended December 31, 2024. |
| | ● | During the year ended December 31, 2024, the Board of Directors declared and paid dividends of $1.56 per share. |
| | ● | During the year ended December 31, 2024, we acquired 6,035,388 shares of our common stock for $208.2 million as part of the share buyback program. |
Financial Summary
Results are reported on a U.S. GAAP basis. Adjusted non-GAAP figures are presented in the Non-GAAP Financial Measures section.
Revenue for the year ended December 31, 2024, was $2,473.2 million, an increase of $371.4 million, or 18%, compared to the year ended December 31, 2023. The key drivers of the increase were:
| | ● | An increase of $257.6 million in management fees primarily due to the impact of higher average AUM. |
| | ● | An increase of $65.3 million in performance fees due to an improvement in the performance of U.S. mutual funds, SICAVs and absolute return funds and other funds. |
Total operating expenses for the year ended December 31, 2024, were $1,827.5 million, an increase of $209.4 million, or 13%, compared to operating expenses for the year ended December 31, 2023. Key drivers of the increase include the following:
| | ● | An increase of $65.0 million in distribution expenses primarily due to higher average AUM. |
| | ● | An increase of $122.8 million in employee compensation and benefits primarily due to higher variable compensation expenses. |
Operating income for the year ended December 31, 2024, was $645.7 million, an increase of $162.0 million, or 33%, compared to the year ended December 31, 2023. Our operating margin was 26.1% in 2024 compared to 23.0% in 2023.
Net income attributable to JHG for the year ended December 31, 2024, was $408.9 million, an increase of $16.9 million, or 4%, compared to the year ended December 31, 2023. In addition to the aforementioned factors affecting revenue and operating expenses, key drivers of the variance include the following:
| | ● | A favorable movement of $27.4 million in investment gains (losses), net. Movements in investment gains (losses), net are primarily due to market movements in relation to our seeded investment products and derivative instruments and the consolidation or deconsolidation of third-party ownership interests in seeded investment products. |
| | ● | An unfavorable movement of $99.2 million in other non-operating income (expense), net, primarily due to a $138.1 million reclassification of accumulated foreign currency translation adjustments to net income related to liquidated JHG entities. |
| | ● | A $66.0 million increase in our income tax provision, primarily due to higher operating income in 2024. |
Investment Performance of Assets Under Management
The following table is a summary of our investment performance as of December 31, 2024:
Percentage of AUM outperforming benchmark(1): | | 1 year | | | 3 years | | | 5 years | | | 10 years | |
Equities | | | 50 | % | | | 62 | % | | | 37 | % | | | 62 | % |
Fixed Income | | | 91 | % | | | 84 | % | | | 86 | % | | | 94 | % |
Multi-Asset | | | 93 | % | | | 96 | % | | | 97 | % | | | 97 | % |
Alternatives | | | 85 | % | | | 85 | % | | | 100 | % | | | 100 | % |
Total | | | 65 | % | | | 72 | % | | | 55 | % | | | 73 | % |
(1) | Outperformance is measured based on composite performance gross of fees versus primary benchmark, except where a strategy has no benchmark index or corresponding composite in which case the most relevant metric is used: (1) composite gross fees versus zero for absolute return strategies, (2) fund net of fees versus primary index or (3) fund net of fees versus Morningstar peer group average or median. Non-discretionary and separately managed account assets are included with a corresponding composite where applicable. Cash management vehicles, ETF-enhanced beta strategies, legacy Tabula passive ETFs, Fixed Income Buy & Maintain mandates, legacy NBK Capital Partners and Victory Park Capital funds, Managed CDOs, Private Equity funds and custom non-discretionary accounts with no corresponding composite are excluded from the analysis. Excluded assets represent 4% of AUM for the period ended December 31, 2024. |
Assets Under Management
Our AUM as of December 31, 2024, was $378.7 billion, an increase of $43.8 billion, or 13%, from December 31, 2023, driven primarily by positive market movements of $41.8 billion.
Our non-USD AUM is primarily denominated in GBP, EUR and AUD. During the year ended December 31, 2024, the USD strengthened against GBP, EUR and AUD, resulting in a $4.7 billion decrease in our AUM. As of December 31, 2024, approximately 26% of our AUM was non-USD-denominated.
Our AUM and flows by capability for the years ended December 31, 2024, 2023 and 2022, were as follows (in billions):
| | Closing AUM | | | | | | | | | | | | | | | | | | | | | | | | | Closing AUM | |
| | | December 31, | | | | | | | | | | | Net sales | | | | | | | | | | | Acquisitions and | | | December 31, | |
| | 2023 | | | Sales | | | Redemptions(1) | | | (redemptions) | | | Markets | | | FX(2) | | | reclassifications(3) | | | 2024 | |
By capability: | | | | | | | | | | | | | | | | | | | | | | | | | | | | | |
Equities | | $ | 205.1 | | | $ | 31.1 | | | $ | (37.6 | ) | | $ | (6.5 | ) | | $ | 32.7 | | | $ | (1.9 | ) | | $ | — | | | $ | 229.4 | |
Fixed Income | | | 71.5 | | | | 29.5 | | | | (18.7 | ) | | | 10.8 | | | | 1.9 | | | | (2.4 | ) | | | 0.9 | | | | 82.7 | |
Multi-Asset | | | 48.9 | | | | 6.3 | | | | (8.2 | ) | | | (1.9 | ) | | | 6.4 | | | | (0.2 | ) | | | (0.1 | ) | | | 53.1 | |
Alternatives | | | 9.4 | | | | 3.6 | | | | (3.6 | ) | | | — | | | | 0.8 | | | | (0.2 | ) | | | 3.5 | | | | 13.5 | |
Total | | $ | 334.9 | | | $ | 70.5 | | | $ | (68.1 | ) | | $ | 2.4 | | | $ | 41.8 | | | $ | (4.7 | ) | | $ | 4.3 | | | $ | 378.7 | |
| | Closing AUM | | | | | | | | | | | | | | | | | | | | | Closing AUM | |
| | December 31, | | | | | | | | | Net sales | | | | | | | | | | | | December 31, | |
| | 2022 | | | Sales | | | Redemptions(1) | | | (redemptions) | | | Markets | | | FX(2) | | | Reclassifications(3) | | | 2023 | |
By capability: | | | | | | | | | | | | | | | | | | | | | | | | | | | | | | | | |
Equities | | $ | 171.3 | | | $ | 31.0 | | | $ | (33.2 | ) | | $ | (2.2 | ) | | $ | 34.8 | | | $ | 2.1 | | | $ | (0.9 | ) | | $ | 205.1 | |
Fixed Income | | | 59.8 | | | | 24.1 | | | | (16.9 | ) | | | 7.2 | | | | 3.8 | | | | 0.7 | | | | — | | | | 71.5 | |
Multi-Asset | | | 45.5 | | | | 4.1 | | | | (7.7 | ) | | | (3.6 | ) | | | 6.2 | | | | 0.2 | | | | 0.6 | | | | 48.9 | |
Alternatives | | | 10.7 | | | | 1.7 | | | | (3.8 | ) | | | (2.1 | ) | | | 0.3 | | | | 0.2 | | | | 0.3 | | | | 9.4 | |
Total | | $ | 287.3 | | | $ | 60.9 | | | $ | (61.6 | ) | | $ | (0.7 | ) | | $ | 45.1 | | | $ | 3.2 | | | $ | — | | | $ | 334.9 | |
| | Closing AUM | | | | | | | | | | | | | | | | | | | | | Closing AUM | |
| | December 31, | | | | | | | | | Net sales | | | | | | | | | Reclassifications | | | December 31, | |
| | 2021 | | | Sales | | | Redemptions(1) | | | (redemptions) | | | Markets | | | FX(2) | | | and disposals(3) | | | 2022 | |
By capability: | | | | | | | | | | | | | | | | | | | | | | | | | | | | | | | | |
Equities | | $ | 244.3 | | | $ | 24.4 | | | $ | (45.6 | ) | | $ | (21.2 | ) | | $ | (47.2 | ) | | $ | (5.9 | ) | | $ | 1.3 | | | $ | 171.3 | |
Fixed Income | | | 79.6 | | | | 23.0 | | | | (29.4 | ) | | | (6.4 | ) | | | (8.9 | ) | | | (4.5 | ) | | | — | | | | 59.8 | |
Multi-Asset | | | 59.7 | | | | 6.5 | | | | (10.8 | ) | | | (4.3 | ) | | | (9.3 | ) | | | (0.6 | ) | | | — | | | | 45.5 | |
Alternatives | | | 10.7 | | | | 6.4 | | | | (5.3 | ) | | | 1.1 | | | | (0.3 | ) | | | (0.8 | ) | | | — | | | | 10.7 | |
Quantitative Equities | | | 38.0 | | | | 0.2 | | | | (5.9 | ) | | | (5.7 | ) | | | (2.6 | ) | | | (0.1 | ) | | | (29.6 | ) | | | — | |
Total | | $ | 432.3 | | | $ | 60.5 | | | $ | (97.0 | ) | | $ | (36.5 | ) | | $ | (68.3 | ) | | $ | (11.9 | ) | | $ | (28.3 | ) | | $ | 287.3 | |
(1) | Redemptions include the impact of client transfers. |
(2) | FX reflects movements in AUM resulting from changes in foreign currency rates as non-USD-denominated AUM is translated into USD. |
(3) | Acquisitions relate to the acquisition of Tabula Investment Management (“Tabula”) and NBK Capital Partners (“NBK”), both completed in the third quarter 2024, and the acquisition of Victory Park Capital Advisors, LLC (“VPC”), which was completed in the fourth quarter 2024. Reclassifications relate to the reclassification of existing funds between capabilities. Disposal activity in 2022 relates to the sale of Intech Investment Management LLC (“Intech”). |
Our AUM and flows by client type for the years ended December 31, 2024, 2023 and 2022, were as follows (in billions):
| | | Closing AUM | | | | | | | | | | | | | | | | | | | | | | | | | | | Closing AUM | |
| | | December 31, | | | | | | | | | | | Net sales | | | | | | | | | | | Acquisitions and | | | December 31, | |
| | | 2023 | | | Sales | | | Redemptions(1) | | | (redemptions) | | | Markets | | | FX(2) | | | reclassifications(3) | | | 2024 | |
By client type: | | | | | | | | | | | | | | | | | | | | | | | | | | | | | | | | |
Intermediary | | $ | 183.4 | | | $ | 55.0 | | | $ | (46.3 | ) | | $ | 8.7 | | | $ | 20.4 | | | $ | (2.2 | ) | | $ | 0.7 | | | $ | 211.0 | |
Self-directed | | | 76.1 | | | | 2.0 | | | | (5.8 | ) | | | (3.8 | ) | | | 14.2 | | | | — | | | | — | | | | 86.5 | |
Institutional | | | 75.4 | | | | 13.5 | | | | (16.0 | ) | | | (2.5 | ) | | | 7.2 | | | | (2.5 | ) | | | 3.6 | | | | 81.2 | |
Total | | $ | 334.9 | | | $ | 70.5 | | | $ | (68.1 | ) | | $ | 2.4 | | | $ | 41.8 | | | $ | (4.7 | ) | | $ | 4.3 | | | $ | 378.7 | |
| | | Closing AUM | | | | | | | | | | | | | | | | | | | | | | | | | | | Closing AUM | |
| | | December 31, | | | | | | | | | | | Net sales | | | | | | | | | | | | | | December 31, | |
| | | 2022 | | | Sales | | | Redemptions(1) | | | (redemptions) | | | Markets | | | FX(2) | | | Reclassifications(3) | | | 2023 | |
By client type: | | | | | | | | | | | | | | | | | | | | | | | | | | | | | | | | |
Intermediary | | $ | 162.0 | | | $ | 39.5 | | | $ | (43.1 | ) | | $ | (3.6 | ) | | $ | 22.8 | | | $ | 2.1 | | | $ | 0.1 | | | $ | 183.4 | |
Self-directed | | | 64.3 | | | | 1.3 | | | | (4.8 | ) | | | (3.5 | ) | | | 14.9 | | | | 0.2 | | | | 0.2 | | | | 76.1 | |
Institutional | | | 61.0 | | | | 20.1 | | | | (13.7 | ) | | | 6.4 | | | | 7.4 | | | | 0.9 | | | | (0.3 | ) | | | 75.4 | |
Total | | $ | 287.3 | | | $ | 60.9 | | | $ | (61.6 | ) | | $ | (0.7 | ) | | $ | 45.1 | | | $ | 3.2 | | | $ | — | | | $ | 334.9 | |
| | | Closing AUM | | | | | | | | | | | | | | | | | | | | | | | | | | | Closing AUM | �� |
| | | December 31, | | | | | | | | | | | Net sales | | | | | | | | | | | Reclassifications | | | December 31, | |
| | | 2021 | | | Sales | | | Redemptions(1) | | | (redemptions) | | | Markets | | | FX(2) | | | and disposals(3) | | | 2022 | |
By client type: | | | | | | | | | | | | | | | | | | | | | | | | | | | | | | | | |
Intermediary | | $ | 215.0 | | | $ | 39.9 | | | $ | (53.3 | ) | | $ | (13.4 | ) | | $ | (32.8 | ) | | $ | (5.9 | ) | | $ | (0.9 | ) | | $ | 162.0 | |
Self-directed | | | 90.1 | | | | 1.5 | | | | (5.1 | ) | | | (3.6 | ) | | | (21.6 | ) | | | (0.6 | ) | | | — | | | | 64.3 | |
Institutional | | | 127.2 | | | | 19.1 | | | | (38.6 | ) | | | (19.5 | ) | | | (13.9 | ) | | | (5.4 | ) | | | (27.4 | ) | | | 61.0 | |
Total | | $ | 432.3 | | | $ | 60.5 | | | $ | (97.0 | ) | | $ | (36.5 | ) | | $ | (68.3 | ) | | $ | (11.9 | ) | | $ | (28.3 | ) | | $ | 287.3 | |
(1) | Redemptions include the impact of client transfers. |
(2) | FX reflects movements in AUM resulting from changes in foreign currency rates as non-USD-denominated AUM is translated into USD. |
(3) | Acquisitions relate to the acquisition of Tabula and NBK, both completed in the third quarter 2024, and the acquisition of VPC, which was completed in the fourth quarter 2024. Reclassifications relate to the reclassification of existing funds between client types. Disposal activity in 2022 relates to the sale of Intech. |
Average Assets Under Management
The following table presents our average AUM by capability for the years ended December 31, 2024, 2023 and 2022 (in billions):
| | | Average AUM | | | | | | | | | |
| | | Year ended December 31, | | | 2024 vs. | | | 2023 vs. | |
By capability: | | 2024 | | | 2023 | | | 2022 | | | 2023 | | | 2022 | |
Equities | | $ | 224.7 | | | $ | 191.6 | | | $ | 193.2 | | | | 17 | % | | | (1 | )% |
Fixed Income | | | 75.6 | | | | 65.5 | | | | 67.2 | | | | 15 | % | | | (3 | )% |
Multi-Asset | | | 51.6 | | | | 47.1 | | | | 49.2 | | | | 10 | % | | | (4 | )% |
Alternatives | | | 10.2 | | | | 9.6 | | | | 11.5 | | | | 6 | % | | | (17 | )% |
Quantitative Equities(1) | | | — | | | | — | | | | 7.7 | | | | — | % | | | (100 | )% |
Total | | $ | 362.1 | | | $ | 313.8 | | | $ | 328.8 | | | | 15 | % | | | (5 | )% |
(1) On March 31, 2022, we completed the sale of our 97%-owned Quantitative Equities subsidiary, Intech.
Closing Assets Under Management
The following table presents our closing AUM by client location, as of December 31, 2024, 2023 and 2022 (in billions):
| | Closing AUM | | | | | | | | | |
| | December 31, | | | 2024 vs. | | | 2023 vs. | |
By client location: | | 2024 | | | 2023 | | | 2022 | | | 2023 | | | 2022 | |
North America | | $ | 236.8 | | | $ | 198.6 | | | $ | 168.6 | | | | 19 | % | | | 18 | % |
EMEA and Latin America | | | 104.8 | | | | 102.9 | | | | 85.7 | | | | 2 | % | | | 20 | % |
Asia Pacific | | | 37.1 | | | | 33.4 | | | | 33.0 | | | | 11 | % | | | 1 | % |
Total | | $ | 378.7 | | | $ | 334.9 | | | $ | 287.3 | | | | 13 | % | | | 17 | % |
Valuation of Assets Under Management
The fair value of our AUM is based on the value of the underlying cash and investments securities of our funds, trusts and segregated mandates. A significant proportion of these securities is listed or quoted on a recognized securities exchange or market and is regularly traded thereon; these investments are valued based on unadjusted quoted market prices. However, for non-U.S. equity securities held by U.S. mutual funds, excluding ETFs, the quoted market prices may be adjusted to capture market movement between the time the local market closes and the NYSE closes. Other investments, including OTC derivative contracts (which are dealt in or through a clearing firm, exchanges or financial institutions), are valued by reference to the most recent official settlement price quoted by the appointed market vendor, and in the event no price is available from this source, a broker quotation may be used. Physical property held is valued monthly by a specialist independent appraiser.
When a readily ascertainable market value does not exist for an investment, the fair value is calculated using a variety of methodologies, including the expected cash flows of its underlying net asset base, taking into account applicable discount rates and other factors; comparable securities or relevant indices; recent financing rounds; revenue multiples; or a combination thereof. Judgment is used to ascertain if a formerly active market has become inactive and to determine fair values when markets have become inactive. Our Fair Value Pricing committees are responsible for determining or approving these unquoted prices, which are reported to those charged with governance of the funds and trusts. For funds that invest in markets that are closed at their valuation point, an assessment is made daily to determine whether a fair value pricing adjustment is required to the fund’s valuation. This may be due to significant market movements in other correlated open markets, scheduled market closures or unscheduled market closures as a result of natural disaster or government intervention.
Our private credit investments are valued using a variety of methodologies and approaches, including the cost method, the market approach and the income approach, which in many cases leverage unobservable inputs and assumptions, depending on the nature of the investment.
Third-party administrators hold a key role in the collection and validation of prices used in the valuation of the securities. Daily price validation is completed using techniques such as day-on-day tolerance movements, invariant prices, excessive movement checks and intra-vendor tolerance checks. Our data management team performs oversight of this process and completes annual due diligence on the processes of third parties.
In other cases, we and the sub-administrators perform a number of procedures to validate the pricing received from third-party providers. For actively traded equity and fixed income securities, prices are received daily from both a primary and secondary vendor. Prices from the primary and secondary vendors are compared to identify any discrepancies. In the event of a discrepancy, a price challenge may be issued to both vendors. Securities with significant day-to-day price changes require additional research, which may include a review of all news pertaining to the issue and issuer, and any corporate actions. All fixed income prices are reviewed by our fixed income trading desk to incorporate market activity information available to our traders. In the event the traders have received price indications from market makers for a particular issue, this information is transmitted to the pricing vendors.
We leverage the expertise of our fund management teams across the business to cross-invest assets and create value for our clients. Where cross investment occurs, assets and flows are identified, and the duplication is removed.
Results of Operations
Foreign Currency Translation
Foreign currency translation impacts our Results of Operations. Revenue is impacted by foreign currency translation, but the impact is generally determined by the primary currency of the individual funds. Expenses are also impacted by foreign currency translation, primarily driven by the translation of GBP to USD. The GBP weakened against the USD during the year ended December 31, 2024, compared to the year ended December 31, 2023, and the GBP strengthened against the USD during the year ended December 31, 2023, compared to the year ended December 31, 2022. Meaningful foreign currency translation impacts to our operating expenses are discussed in the Operating Expenses section below.
Revenue
| | | Year ended December 31, | | | 2024 vs. | | | 2023 vs. | |
| | | 2024 | | | 2023 | | | 2022 | | | 2023 | | | 2022 | |
Revenue (in millions): | | | | | | | | | | | | | | | | | | | | |
Management fees | | $ | 1,957.7 | | | $ | 1,700.1 | | | $ | 1,799.4 | | | | 15 | % | | | (6 | )% |
Performance fees | | | 70.4 | | | | 5.1 | | | | (10.7 | ) | | n/m* | | | n/m* | |
Shareowner servicing fees | | | 240.7 | | | | 213.3 | | | | 224.0 | | | | 13 | % | | | (5 | )% |
Other revenue | | | 204.4 | | | | 183.3 | | | | 190.9 | | | | 12 | % | | | (4 | )% |
Total revenue | | $ | 2,473.2 | | | $ | 2,101.8 | | | $ | 2,203.6 | | | | 18 | % | | | (5 | )% |
* n/m - Not meaningful.
Management fees
Management fees increased $257.6 million during the year ended December 31, 2024, compared to the year ended December 31, 2023, primarily due to an improvement in average AUM.
Management fees decreased $99.3 million during the year ended December 31, 2023, compared to the year ended December 31, 2022, primarily due to a decline in average AUM.
Average net management fee margins, by capability, consisted of the following for the years ended December 31, 2024, 2023 and 2022:
| | Year ended December 31, | | | 2024 vs. | | | 2023 vs. | |
| | 2024 | | | 2023 | | | 2022 | | | 2023 | | | 2022 | |
Average net management fee margin (bps)(1): | | | | | | | | | | | | | | | | | | | | |
Equities | | | 53.7 | | | | 54.4 | | | | 55.2 | | | | (1 | )% | | | (1 | )% |
Fixed Income | | | 26.2 | | | | 27.8 | | | | 29.6 | | | | (6 | )% | | | (6 | )% |
Multi-Asset | | | 53.2 | | | | 52.9 | | | | 53.1 | | | | 1 | % | | | (0 | )% |
Alternatives | | | 75.6 | | | | 61.9 | | | | 60.4 | | | | 22 | % | | | 2 | % |
Quantitative Equities(2) | | | — | | | | — | | | | 15.8 | | | n/m* | | | | (100 | )% |
Total average | | | 48.6 | | | | 48.9 | | | | 48.9 | | | | (1 | )% | | | — | % |
(1) | Net management fee margins are based on management fees net of distribution expenses. |
(2) | On March 31, 2022, we completed the sale of our 97%-owned Quantitative Equities subsidiary, Intech. |
| * | n/m - Not meaningful. |
Performance fees
Performance fees are derived across a number of product ranges. U.S. mutual fund performance fees are recognized on a monthly basis, while all other performance fees are recognized on a quarterly or annual basis. The investment management fee paid by each U.S. mutual fund subject to a performance fee is the base management fee plus or minus a performance fee adjustment, as determined by the relative investment performance of the fund, over a 36-month rolling period, compared to a specified benchmark index. Performance fees by product type consisted of the following for the years ended December 31, 2024, 2023 and 2022:
| | Year ended December 31, | | | 2024 vs. | | | 2023 vs. | |
| | 2024 | | | 2023 | | | 2022 | | | 2023 | | | 2022 | |
Performance fees (in millions): | | | | | | | | | | | | | | | | | | | |
SICAVs | | $ | 26.3 | | | $ | 2.1 | | | $ | 2.0 | | | n/m* | | | | 5 | % |
UK OEICs and unit trusts | | | 6.2 | | | | — | | | | 0.1 | | | | — | % | | | (100 | )% |
Absolute return funds and other funds | | | 70.8 | | | | 56.9 | | | | 33.5 | | | | 24 | % | | | 70 | % |
Segregated mandates | | | 4.9 | | | | 3.1 | | | | 10.0 | | | | 58 | % | | | (69 | )% |
Investment trusts | | | 0.7 | | | | 9.1 | | | | 6.7 | | | | (92 | )% | | | 36 | % |
Private capital funds | | | 1.0 | | | | — | | | | — | | | | — | % | | | — | % |
U.S. mutual funds | | | (39.5 | ) | | | (66.1 | ) | | | (63.0 | ) | | | 40 | % | | | (5 | )% |
Total performance fees | | $ | 70.4 | | | $ | 5.1 | | | $ | (10.7 | ) | | n/m* | | | n/m* | |
* n/m - Not meaningful.
For the year ended December 31, 2024, performance fees increased $65.3 million compared to the year ended December 31, 2023, due to an improvement in the performance of U.S. mutual funds, SICAVs and absolute return funds and other funds.
For the year ended December 31, 2023, performance fees increased $15.8 million compared to the year ended December 31, 2022, due to an improvement in the performance of absolute return funds and other funds primarily driven by performance fees generated from a certain fund. This increase was partially offset by a decline in segregated mandates due to the relative performance of certain funds being below the established HWM.
The following table outlines performance fees by product type and includes information on fees earned, number of funds generating performance fees, AUM generating performance fees, number of funds eligible to earn performance fees, AUM with an uncrystallized performance fee, performance fee participation rate, performance fee frequency and performance fee methodology (dollars in millions, except where noted):
| | | | | | | | | | | Absolute | | | | | | | | | | | | | | | | | |
| | | | | | | UK OEICs | | | Return Funds | | | | | | | | | | | Private | | | | | |
| | | | | | | and | | | and | | | Segregated | | | Investment | | | Capital | | | U.S. Mutual | |
| | | SICAVs | | | Unit Trusts | | | Other Funds | | | Mandates | | | Trusts | | | Funds | | | Funds | |
Performance fees: | | | | | | | | | | | | | | | | | | | | | | | | | | | | |
Year ended December 31, 2024 | | $ | 26.3 | | | $ | 6.2 | | | $ | 70.8 | | | $ | 4.9 | | | $ | 0.7 | | | $ | 1.0 | | | $ | (39.5 | ) |
Year ended December 31, 2023 | | $ | 2.1 | | | $ | — | | | $ | 56.9 | | | $ | 3.1 | | | $ | 9.1 | | | | n/a | | | $ | (66.1 | ) |
Year ended December 31, 2022 | | $ | 2.0 | | | $ | 0.1 | | | $ | 33.5 | | | $ | 10.0 | | | $ | 6.7 | | | | n/a | | | $ | (63.0 | ) |
| | | | | | | | | | | | | | | | | | | | | | | | | | | | | |
Number of funds that earned performance fees: | | | | | | | | | | | | | | | | | | | | | | | | | | | | |
Year ended December 31, 2024(1) | | | 11 | | | | 2 | | | | 5 | | | | 9 | | | | 1 | | | | 3 | | | | 15 | |
Year ended December 31, 2023(1) | | | 8 | | | | — | | | | 5 | | | | 8 | | | | 1 | | | | n/a | | | | 15 | |
Year ended December 31, 2022(1) | | | 8 | | | | 2 | | | | 8 | | | | 11 | | | | 1 | | | | n/a | | | | 15 | |
| | | | | | | | | | | | | | | | | | | | | | | | | | | | | |
AUM generating performance fees (in billions): | | | | | | | | | | | | | | | | | | | | | | | | | | | | |
AUM at December 31, 2024, generating FY24 performance fees | | $ | 12.4 | | | $ | 1.2 | | | $ | 2.9 | | | $ | 6.9 | | | $ | 0.9 | | | $ | 0.1 | | | $ | 66.1 | |
AUM at December 31, 2023, generating FY23 performance fees | | $ | 4.9 | | | $ | — | | | $ | 1.2 | | | $ | 5.8 | | | $ | 1.0 | | | | n/a | | | $ | 56.7 | |
AUM at December 31, 2022, generating FY22 performance fees | | $ | 5.1 | | | $ | 1.5 | | | $ | 2.3 | | | $ | 9.3 | | | $ | 0.8 | | | | n/a | | | $ | 45.1 | |
| | | | | | | | | | | | | | | | | | | | | | | | | | | | | |
Number of funds eligible to earn performance fees: | | | | | | | | | | | | | | | | | | | | | | | | | | | | |
As of December 31, 2024 | | | 18 | | | | 2 | | | | 6 | | | | 18 | | | | 2 | | | | 4 | | | | 15 | |
As of December 31, 2023 | | | 18 | | | | 2 | | | | 4 | | | | 19 | | | | 3 | | | | n/a | | | | 15 | |
As of December 31, 2022 | | | 19 | | | | 2 | | | | 10 | | | | 15 | | | | 4 | | | | n/a | | | | 15 | |
| | | | | | | | | | | | | | | | | | | | | | | | | | | | | |
AUM subject to performance fees (in billions): | | | | | | | | | | | | | | | | | | | | | | | | | | | | |
AUM at December 31, 2024, subject to FY24 performance fees | | $ | 13.9 | | | $ | 1.2 | | | $ | 2.9 | | | $ | 23.9 | | | $ | 1.7 | | | $ | 0.3 | | | $ | 66.1 | |
AUM at December 31, 2023, subject to FY23 performance fees | | $ | 11.0 | | | $ | 1.2 | | | $ | 1.6 | | | $ | 22.1 | | | $ | 1.9 | | | | n/a | | | $ | 56.7 | |
AUM at December 31, 2022, subject to FY22 performance fees | | $ | 10.7 | | | $ | 1.5 | | | $ | 2.6 | | | $ | 12.7 | | | $ | 2.1 | | | | n/a | | | $ | 45.1 | |
| | | | | | | | | | | | | | | | | | | | | | | | | | | | | |
Uncrystallized performance fees (in billions): | | | | | | | | | | | | | | | | | | | | | | | | | | | | |
AUM at December 31, 2024, with an uncrystallized performance fee at December 31, 2024, vesting in 2025(2) | | $ | 0.5 | | | $ | 1.5 | | | $ | — | | | | n/a | | | $ | 0.4 | | | $ | 0.8 | | | | n/a | |
AUM at December 31, 2023, with an uncrystallized performance fee at December 31, 2023, vesting in 2024(2) | | $ | 2.8 | | | $ | 1.1 | | | $ | — | | | | n/a | | | $ | — | | | | n/a | | | | n/a | |
AUM at December 31, 2022, with an uncrystallized performance fee at December 31, 2022, vesting in 2023(2) | | $ | 0.1 | | | $ | — | | | $ | — | | | | n/a | | | $ | 0.8 | | | | n/a | | | | n/a | |
| | | | | | | | | | | | | | | | | | | | | | | | | | | | | |
Performance fee participation rate percentage(3) | | | 10% - 20% | | | | 15% - 20% | | | | 10% - 20% | | | | 5% - 28% | | | | 15 | % | | | 15% - 25% | | | +/− 0.15% | |
| | | | | | | | | | | | | | | | | | | | | | | | | | | | | |
Performance fee frequency | | Annually | | | Annually | | | Annually and quarterly | | | Annually and quarterly | | | Annually | | | Various | | | Monthly | |
| | | | | | | | | | | | | | | | | | | | | | | | | | | | | |
Performance fee methodology(4) | | Relative plus HWM | | | Relative/absolute plus HWM | | | Absolute plus HWM | | | Bespoke | | | Relative plus HWM | | | Relative plus HWM | | | Relative | |
(1) | For absolute return funds, this excludes funds earning a performance fee on redemption and only includes those with a period-end crystallization date. Also, the number of funds that earned a performance fee during the year can exceed the number of funds eligible to earn a performance fee at the end of the year due to fund closures. |
(2) | Reflects the total AUM of all funds with a performance fee opportunity at any point in the relevant year. |
(3) | Participation rate related to non-U.S. mutual fund products reflects our share of outperformance. Participation rate related to U.S. mutual funds represents an adjustment to the management fee. |
(4) | Relative performance is measured versus applicable benchmarks and is subject to an HWM for relevant funds. |
Shareowner servicing fees
Shareowner servicing fees are primarily composed of U.S. mutual fund servicing fees, which are driven by AUM. Shareowner servicing fees increased by $27.4 million during the year ended December 31, 2024, compared to the year ended December 31, 2023, and decreased by $10.7 million during the year ended December 31, 2023, compared to the year ended December 31, 2022, primarily due to movements in average mutual fund AUM.
Other revenue
Other revenue is primarily composed of 12b-1 distribution fees, general administration charges and other fee revenue. General administration charges include reimbursements from funds for various fees and expenses paid for by the investment manager on behalf of the funds. Other revenue increased by $21.1 million during the year ended December 31, 2024, compared to the year ended December 31, 2023, primarily due to an improvement in average AUM.
Other revenue decreased by $7.6 million during the year ended December 31, 2023, compared to the year ended December 31, 2022, primarily due to a decline in average AUM.
Operating Expenses
| | | Year ended December 31, | | | 2024 vs. | | | 2023 vs. | |
| | | 2024 | | | 2023 | | | 2022 | | | 2023 | | | 2022 | |
Operating expenses (in millions): | | | | | | | | | | | | | | | | | | | | |
Employee compensation and benefits | | $ | 716.1 | | | $ | 593.3 | | | $ | 611.5 | | | | 21 | % | | | (3 | )% |
Long-term incentive plans | | | 166.6 | | | | 167.4 | | | | 180.7 | | | | (0 | )% | | | (7 | )% |
Distribution expenses | | | 520.9 | | | | 455.9 | | | | 498.3 | | | | 14 | % | | | (9 | )% |
Investment administration | | | 58.2 | | | | 47.4 | | | | 49.4 | | | | 23 | % | | | (4 | )% |
Marketing | | | 40.4 | | | | 36.6 | | | | 27.1 | | | | 10 | % | | | 35 | % |
General, administrative and occupancy | | | 300.8 | | | | 294.6 | | | | 279.3 | | | | 2 | % | | | 5 | % |
Impairment of intangible assets | | | — | | | | — | | | | 35.8 | | | n/m* | | | | (100 | )% |
Depreciation and amortization | | | 24.5 | | | | 22.9 | | | | 31.7 | | | | 7 | % | | | (28 | )% |
Total operating expenses | | $ | 1,827.5 | | | $ | 1,618.1 | | | $ | 1,713.8 | | | | 13 | % | | | (6 | )% |
* n/m - Not meaningful.
Employee compensation and benefits
Employee compensation and benefits increased $122.8 million during the year ended December 31, 2024, compared to the year ended December 31, 2023, primarily driven by an increase of $95.0 million in variable compensation, mainly due to higher profitability, an $11.8 million increase in fixed compensation costs due to higher average headcount, $9.6 million of base-pay increases and unfavorable foreign currency translation of $6.1 million.
Employee compensation and benefits decreased $18.2 million during the year ended December 31, 2023, compared to the year ended December 31, 2022, primarily driven by a decrease of $18.1 million in variable compensation, primarily due to lower profitability, and a $13.7 million decline in fixed compensation costs due to lower average headcount. These decreases were partially offset by $7.5 million of base-pay increases, unfavorable foreign currency translation of $3.6 million and a $2.4 million increase in project charges driven by less capitalization of internal labor costs related to the order management system transformation project, which was completed in the second quarter of 2023.
Long-term incentive plans
Long-term incentive plan expenses decreased $0.8 million during the year ended December 31, 2024, compared to the year ended December 31, 2023, primarily due to a decrease of $8.3 million for the roll-off of vested awards and the forfeiture of awards related to departed employees exceeding the roll-on of new awards and the acceleration of expense related to departed employees. This decrease was partially offset by an increase of $6.4 million driven by market appreciation of mutual fund share awards and certain long-term incentive awards.
Long-term incentive plan expenses decreased $13.3 million during the year ended December 31, 2023, compared to the year ended December 31, 2022, primarily due to a decrease of $42.4 million for the roll-off of vested awards and the forfeiture of expense related to departed employees exceeding the roll-on of new awards and the acceleration of expense related to departed employees. This decline was partially offset by an increase of $27.6 million driven by market appreciation of mutual fund share awards and certain long-term incentive awards.
2025 Compensation expenses
For the year ending December 31, 2025, we anticipate an adjusted compensation to revenue ratio in the range of 43% to 44%.
Distribution expenses
Distribution expenses are paid to financial intermediaries for the distribution of our retail investment products and are typically calculated based on the amount of the intermediary-sourced AUM. Distribution expenses increased by $65.0 million during the year ended December 31, 2024, compared to the year ended December 31, 2023, primarily due to an improvement in average AUM subject to distribution charges.
Distribution expenses decreased by $42.4 million during the year ended December 31, 2023, compared to the year ended December 31, 2022, primarily driven by a decline in average AUM subject to distribution charges.
Marketing
Marketing expenses increased by $3.8 million during the year ended December 31, 2024, compared to the year ended December 31, 2023, and increased by $9.5 million during the year ended December 31, 2023, compared to the year ended December 31, 2022. Year-over-year fluctuations in marketing expenses were primarily driven by changes in the level of advertising campaigns and sponsored events.
Investment administration
Investment administration expenses, which represent fund administration and fund accounting, increased by $10.8 million during the year ended December 31, 2024, compared to the year ended December 31, 2023, primarily due to contractual changes with a third-party vendor.
Investment administration expenses decreased by $2.0 million during the year ended December 31, 2023, compared to the year ended December 31, 2022. There were no significant movements contributing to the year over year variance.
General, administrative and occupancy
General, administrative and occupancy expenses increased $6.2 million during the year ended December 31, 2024, compared to the year ended December 31, 2023, primarily due to a $8.2 million increase in the amortization of capitalized cloud computing costs, primarily related to the order management system transformation project, which was completed in the second quarter of 2023, a $7.7 million increase in legal and professional fees primarily due to consultancy fees related to certain acquisition and other project costs, and a $4.2 million increase in hardware and software licensing costs. These increases were partially offset by a $9.3 million charge related to a separately managed account trade error recognized during 2023 and a subsequent insurance reimbursement of $4.7 million recognized during 2024.
General, administrative and occupancy expenses increased $15.3 million during the year ended December 31, 2023, compared to the year ended December 31, 2022, primarily due to a $9.6 million increase in the amortization of capitalized cloud computing costs, primarily related to the order management system transformation project, which was completed in the second quarter of 2023, a $9.3 million charge related to a separately managed account trade error and a $4.0 million increase in software costs primarily related to application licensing fees. These increases were partially offset by a $4.6 million reduction in rent-related expenses and a $3.2 million decrease in recruitment fees.
Impairment of intangible assets
Intangible asset impairment charges decreased by $35.8 million during the year ended December 31, 2023, compared to the year ended December 31, 2022. The decrease is due to no impairment charges being recognized during 2023, compared to a $35.8 million impairment of certain mutual fund investment management agreements, client relationships and trademarks recognized during the year ended December 31, 2022. There were no intangible asset impairment charges recognized during the year ended December 31, 2024.
Depreciation and amortization
Depreciation and amortization expenses increased $1.6 million during the year ended December 31, 2024, compared to the year ended December 31, 2023. There were no significant movements contributing to the year over year variance.
Depreciation and amortization expenses decreased $8.8 million during the year ended December 31, 2023, compared to the year ended December 31, 2022, primarily due to a $3.6 million decline in the amortization of internally developed software as assets became fully amortized during the current year, a $3.5 million decrease in the amortization of prepaid commissions and a $1.2 million reduction in the amortization of intangible assets resulting from the sale of Intech, which was recognized during the first quarter 2022.
2025 Non-compensation operating expenses
For the year ending December 31, 2025, we anticipate adjusted non-compensation expense growth in the mid- to high-single digits. The anticipated growth in our non-compensation expense is due to planned investments supporting our strategic initiatives and operational efficiencies, as well as anticipated inflation and the full-year impact of the consolidation of VPC, NBK and Tabula.
Non-Operating Income and Expenses
| | | Year ended December 31, | | | 2024 vs. | | | 2023 vs. | |
| | | 2024 | | | 2023 | | | 2022 | | | 2023 | | | 2022 | |
Non-operating income and expenses (in millions): | | | | | | | | | | | | | | | | | | | | |
Interest expense | | $ | (18.0 | ) | | $ | (12.7 | ) | | $ | (12.6 | ) | | | (42 | )% | | | (1 | )% |
Investment gains (losses), net | | | 70.8 | | | | 43.4 | | | | (113.3 | ) | | | 63 | % | | n/m* | |
Other non-operating income (expense), net | | | (86.6 | ) | | | 12.6 | | | | 11.5 | | | n/m* | | | | 10 | % |
Income tax provision | | | (166.3 | ) | | | (100.3 | ) | | | (100.9 | ) | | | (66 | )% | | | 1 | % |
* n/m - Not meaningful.
Interest expense
Interest expense increased by $5.3 million during the year ended December 31, 2024, compared to the year ended December 31, 2023, primarily due to the issuance of the 5.450% Senior Notes due 2034 (“2034 Senior Notes”) in the fourth quarter 2024. Proceeds from the 2034 Senior Notes were used to redeem the 4.875% Senior Notes due 2025 (“2025 Senior Notes”).
Investment gains (losses), net
The components of investment gains (losses), net for the years ended December 31, 2024, 2023 and 2022, were as follows:
| | | Year ended December 31, | |
| | | 2024 | | | 2023 | | | 2022 | |
Investment gains (losses), net (in millions): | | | | | | | | | | | | |
Seeded investment products and hedges, net | | $ | 36.4 | | | $ | 20.3 | | | $ | (15.2 | ) |
Third-party ownership interests in seeded investment products | | | 37.5 | | | | 34.7 | | | | (97.9 | ) |
Equity method investments | | | (5.6 | ) | | | (13.5 | ) | | | 2.9 | |
Other | | | 2.5 | | | | 1.9 | | | | (3.1 | ) |
Investment gains (losses), net | | $ | 70.8 | | | $ | 43.4 | | | $ | (113.3 | ) |
Investment gains (losses), net moved favorably by $27.4 million during the year ended December 31, 2024, compared to the year ended December 31, 2023, and favorably by $156.7 million during the year ended December 31, 2023, compared to the year ended December 31, 2022. Movements in investment gains (losses), net are primarily due to consolidation and deconsolidation of third-party ownership interests in seeded investment products and market adjustments in relation to our seeded investment products. In addition, a $12.5 million charge due to a correction of an error of previously recognized earnings associated with an equity method investment impacted investment gains (losses), net for the year ended December 31, 2023.
Gains and losses attributable to third-party ownership interests in seeded investment products are noncontrolling interests and are not included in net income attributable to JHG.
Other non-operating income (expense), net
Other non-operating income (expense), net declined $99.2 million during the year ended December 31, 2024, compared to the year ended December 31, 2023. The decrease was primarily due to a year over year change of $133.4 million in the reclassification of accumulated foreign currency translation adjustments to net income related to liquidated JHG entities. This decrease was partially offset by a $13.4 million provision for a credit loss and an $11.9 million contingent consideration fair value adjustment, both recognized during 2023, and an $8.8 million increase in interest income primarily driven by higher interest rates on cash balances.
For the year ending December 31, 2025, we expect significant foreign currency translation adjustments to be reclassified from accumulated other comprehensive loss on the Consolidated Balance Sheets to other non-operating income (expense), net on the Consolidated Statements of Comprehensive Income due to the anticipated liquidation of certain non-operating JHG entities. The timing of the reclassifications is uncertain and dependent on the progression of the liquidation process. Our current estimate is $53 million, net, which would unfavorably impact other non-operating income (expense), net on the Consolidated Statements of Comprehensive Income. However, the reclassifications could be significantly lower or higher than this amount due to the progression of the liquidation process and, to a lesser extent, changes in foreign currency rates. The reclassification activity is not part of our ongoing operations and will not be included in our adjusted results.
Other non-operating income (expense), net improved $1.1 million during the year ended December 31, 2023, compared to the year ended December 31, 2022. The increase was primarily due to a $33.8 million increase in interest income primarily driven by higher interest rates on cash balances and a loss of $9.1 million related to the sale of Intech, which was recognized in the first quarter 2022. These increases were partially offset by unfavorable foreign currency revaluation of $15.2 million, a $13.4 million provision for a credit loss, an $11.9 million contingent consideration fair value adjustment and a $4.7 million reclassification of accumulated foreign currency translation adjustments to net income related to liquidated JHG entities.
Income tax provision
Our effective tax rates for the years ended December 31, 2024, 2023 and 2022, were as follows:
| | | Year ended December 31, | |
| | | 2024 | | | 2023 | | | 2022 | |
Effective tax rate | | | 27.2 | % | | | 19.0 | % | | | 26.9 | % |
The effective tax rate for the year ended December 31, 2024, compared to the same period in 2023, was impacted by the reclassification of accumulated foreign currency translation adjustments to net income from liquidated JHG entities that are treated as non-deductible for tax purposes. The effective tax rate for the year ended December 31, 2023, was also impacted by a reduction in the state income tax rate. As a result of the reduction in the state income tax rate, the U.S. deferred tax assets and liabilities were revalued from 23.9% to 23.5% creating a non-cash deferred tax benefit of $8.8 million.
The effective tax rate for the year ended December 31, 2023, compared to the same period in 2022, was impacted by the disallowed noncontrolling interests from certain seeded investment products and a reduction in the state income tax rate, as discussed above.
For the year ending December 31, 2025, we expect our tax rate on adjusted net income attributable to JHG to be in the range of 23% to 25%.
The Organization for Economic Co-operation and Development (OECD) has a framework to implement a global minimum corporate tax of 15% for companies with global revenues and profits above certain thresholds (Pillar 2). Some aspects of Pillar 2 took effect on January 1, 2024, and others became effective as of January 1, 2025. On June 20, 2023, Finance (No. 2) Act 2023 was enacted in the UK, introducing a global minimum effective tax rate of 15%. This legislation includes a domestic top-up tax and a multinational top-up tax, effective for accounting periods starting on or after December 31, 2023. While it is uncertain whether the U.S. will adopt Pillar 2, several countries where we operate have enacted or are introducing similar legislation. As of December 31, 2024, the impact of Pillar 2 on our effective tax rate, results of operations, financial position, and cash flows was not significant to the financial statements.
Non-GAAP Financial Measures
We report our financial results in accordance with GAAP. However, we evaluate our profitability and our ongoing operations using additional non-GAAP financial measures that exclude costs or benefits that are not part of our ongoing operations. These measures are not in accordance with, or a substitute for, GAAP, and our financial measures may be different from non-GAAP financial measures used by other companies. Management uses these performance measures to evaluate the business, and adjusted values are consistent with internal management reporting. We have provided a reconciliation below of our non-GAAP financial measures to the most directly comparable GAAP measures.
Alternative performance measures
The following is a reconciliation of revenue, operating expenses, operating income, net income attributable to JHG and diluted earnings per share to adjusted revenue, adjusted operating expenses, adjusted operating income, adjusted net income attributable to JHG and adjusted diluted earnings per share, respectively, for the years ended December 31, 2024, 2023 and 2022 (in millions, except per share and operating margin data):
| | Year ended December 31, | |
| | 2024 | | | 2023 | | | 2022 | |
Reconciliation of revenue to adjusted revenue: | | | | | | | | | | | | |
Revenue | | $ | 2,473.2 | | | $ | 2,101.8 | | | $ | 2,203.6 | |
Management fees | | | (198.9 | ) | | | (164.8 | ) | | | (193.2 | ) |
Shareowner servicing fees | | | (194.4 | ) | | | (172.4 | ) | | | (185.2 | ) |
Other revenue | | | (139.1 | ) | | | (118.7 | ) | | | (119.9 | ) |
Adjusted revenue(1) | | | 1,940.8 | | | $ | 1,645.9 | | | $ | 1,705.3 | |
Reconciliation of operating expenses to adjusted operating expenses: | | | | | | | | | | | | |
Operating expenses | | $ | 1,827.5 | | | $ | 1,618.1 | | | $ | 1,713.8 | |
Employee compensation and benefits(2) | | | (20.0 | ) | | | (5.8 | ) | | | (16.8 | ) |
Long-term incentive plans(2) | | | (8.1 | ) | | | (1.2 | ) | | | (21.1 | ) |
Distribution expenses(1) | | | (520.9 | ) | | | (455.9 | ) | | | (498.3 | ) |
General, administrative and occupancy(2) | | | (2.7 | ) | | | (16.3 | ) | | | (9.5 | ) |
Impairment of intangible assets(3) | | | — | | | | — | | | | (35.8 | ) |
Depreciation and amortization(3) | | | (3.1 | ) | | | (1.7 | ) | | | (3.7 | ) |
Adjusted operating expenses | | $ | 1,272.7 | | | $ | 1,137.2 | | | $ | 1,128.6 | |
Adjusted operating income | | $ | 668.1 | | | $ | 508.7 | | | $ | 576.7 | |
Operating margin(4) | | | 26.1 | % | | | 23.0 | % | | | 22.2 | % |
Adjusted operating margin(5) | | | 34.4 | % | | | 30.9 | % | | | 33.8 | % |
Reconciliation of net income attributable to JHG to adjusted net income attributable to JHG: | | | | | | | | | | | | |
Net income attributable to JHG | | $ | 408.9 | | | $ | 392.0 | | | $ | 372.4 | |
Employee compensation and benefits(2) | | | 8.5 | | | | 5.8 | | | | 16.8 | |
Long-term incentive plans(2) | | | 8.1 | | | | 1.2 | | | | 21.1 | |
General, administrative and occupancy(2) | | | 2.7 | | | | 16.3 | | | | 9.5 | |
Impairment of intangible assets(3) | | | — | | | | — | | | | 35.8 | |
Depreciation and amortization(3) | | | 3.1 | | | | 1.7 | | | | 3.7 | |
Interest expense(6) | | | 0.3 | | | | — | | | | — | |
Investment gains (losses), net(6) | | | 0.8 | | | | 12.5 | | | | 0.4 | |
Other non-operating income (expense), net(6) | | | 136.9 | | | | 28.6 | | | | 0.3 | |
Income tax provision(7) | | | (4.4 | ) | | | (22.9 | ) | | | (26.2 | ) |
Net loss (income) attributable to noncontrolling interests(8) | | | (1.2 | ) | | | — | | | | — | |
Adjusted net income attributable to JHG | | | 563.7 | | | | 435.2 | | | | 433.8 | |
Less: allocation of earnings to participating stock-based awards | | | (13.6 | ) | | | (12.4 | ) | | | (13.1 | ) |
Adjusted net income attributable to JHG common shareholders | | $ | 550.1 | | | $ | 422.8 | | | $ | 420.7 | |
Weighted-average common shares outstanding — diluted | | $ | 155.8 | | | $ | 160.5 | | | $ | 162.0 | |
Diluted earnings per share(9) | | $ | 2.56 | | | $ | 2.37 | | | $ | 2.23 | |
Adjusted diluted earnings per share(10) | | $ | 3.53 | | | $ | 2.63 | | | $ | 2.60 | |
(1) | We contract with third-party intermediaries to distribute and service certain of our investment products. Fees for distribution and servicing related activities are either provided for separately in an investment product’s prospectus or are part of the management fee. Under both arrangements, the fees are collected by us and passed through to third-party intermediaries who are responsible for performing the applicable services. The majority of distribution and servicing fees we collect are passed through to third-party intermediaries. JHG management believes that the deduction of distribution and service fees from revenue in the computation of adjusted revenue reflects the pass-through nature of these revenues. In certain arrangements, we perform the distribution and servicing activities and retain the applicable fees. Revenues for distribution and servicing activities performed by us are not deducted from GAAP revenue. In addition to the adjustments related to distribution and servicing activities, other revenue for the year ended December 31, 2024, includes an adjustment related to an employee secondment arrangement with a joint venture. The arrangement is pass-through in nature, and we believe the costs do not represent our ongoing operations. |
(2) | Adjustments for the year ended December 31, 2024, include acquisition related expenses, the acceleration of long-term incentive plan expense and redundancy expense related to the departure of certain employees, and a $4.7 million insurance reimbursement related to a separately managed account trade error that occurred in 2023. Adjustments for the year ended December 31, 2023 and 2022, include rent expense, rent income, other rent-related adjustments associated with subleased office space and the acceleration of long-term incentive plan expense and redundancy expense related to the departure of certain employees. Adjustments for the year ended December 31, 2023, also includes a $9.3 million charge related to a separately managed account trade error. JHG management believes these costs do not represent our ongoing operations. Additionally, within the reconciliation of operating expenses to adjusted operating expenses for the year ended December 31, 2024, employee compensation and benefits include an adjustment related to an employee secondment arrangement with a joint venture. The arrangement is pass-through in nature, and we believe the costs do not represent our ongoing operations. |
(3) | Investment management contracts have been identified as a separately identifiable intangible asset arising on the acquisition of subsidiaries and businesses. Such contracts are recognized at the net present value of the expected future cash flows arising from the contracts at the date of acquisition. For segregated mandate contracts, the intangible asset is amortized on a straight-line basis over the expected life of the contracts. Adjustments for the year ended December 31, 2022, also includes impairment charges of certain mutual fund investment management contracts, client relationships and trademarks. JHG management believes these non-cash acquisition-related costs do not represent our ongoing operations. |
(4) | Operating margin is operating income divided by revenue. |
(5) | Adjusted operating margin is adjusted operating income divided by adjusted revenue. |
(6) | Adjustments for the year ended December 31, 2024, include the reclassification of accumulated foreign currency translation adjustments to net income related to JHG liquidated entities. Adjustments for the year ended December 31, 2023, include a provision for a credit loss and a contingent consideration fair value adjustment related to the 2022 sale of Intech, a correction due to an error of previously recognized earnings associated with an equity method investment and the reclassification of accumulated foreign currency translation adjustments to net income related to JHG liquidated entities. JHG management believes these expenses do not represent our ongoing operations. |
(7) | The tax impact of the adjustments is calculated based on the U.S. or foreign statutory tax rate as they relate to each adjustment. Certain adjustments are either not taxable or not tax-deductible. Adjustments for the year ended December 31, 2023, were also impacted by the change to our state tax rate. As a result, the U.S. deferred tax assets and liabilities were revalued from 23.9% to 23.5%, creating a non-cash deferred tax benefit of $8.8 million. |
(8) | Adjustments for the year ended December 31, 2024, include the noncontrolling interest on amortization of acquisition related intangible assets. JHG management believes these non-cash and acquisition-related costs do not represent our ongoing operations. |
(9) | Diluted earnings per share is net income attributable to JHG common shareholders divided by weighted-average diluted common shares outstanding. |
(10) | Adjusted diluted earnings per share is adjusted net income attributable to JHG common shareholders divided by weighted-average diluted common shares outstanding. |
Liquidity and Capital Resources
Our capital structure, together with available cash balances, cash flows generated from operations, and further capital and credit market activities, if necessary, should provide us with sufficient resources to meet present and future cash needs, including operating and other obligations as they fall due and anticipated future capital requirements.
The following table summarizes key balance sheet data relating to our liquidity and capital resources as of December 31, 2024 and 2023 (in millions):
| | December 31, | |
| | 2024 | | | 2023 | |
Cash and cash equivalents held by the Company | | $ | 1,190.9 | | | $ | 1,145.9 | |
Investments held by the Company | | $ | 474.1 | | | $ | 399.2 | |
Fees and other receivables | | $ | 356.6 | | | $ | 294.0 | |
Long-term debt | | $ | 395.0 | | | $ | 304.6 | |
Cash and cash equivalents primarily consist of cash held at banks, on-demand deposits, investments in money market instruments, highly liquid short-term debt securities and commercial paper with a maturity date of three months or less. Cash and cash equivalents exclude cash held by consolidated variable interest entities (“VIEs”) and consolidated voting rights entities (“VREs”), and investments exclude noncontrolling interests as these assets are not available to us under any circumstance.
Investments held by us represent seeded investment products (exclusive of noncontrolling interests), investments related to deferred compensation plans and other less significant investments classified as current assets in our Consolidated Balance Sheets.
We believe that existing cash and cash from operations should be sufficient to satisfy our short-term capital requirements. Expected short-term uses of cash include ordinary operating expenditures, seed capital investments, interest expense, dividend payments, income tax payments and common stock repurchases. We may also use available cash for other general corporate purposes and acquisitions.
Cash Flows
A summary of cash flow data for the years ended December 31, 2024, 2023 and 2022, was as follows (in millions):
| | Year ended December 31, | |
| | 2024 | | | 2023 | | | 2022 | |
Cash flows provided by (used for): | | | | | | | | | | | | |
Operating activities | | $ | 694.6 | | | $ | 441.6 | | | $ | 473.3 | |
Investing activities | | | (285.4 | ) | | | (328.9 | ) | | | 58.5 | |
Financing activities | | | (324.4 | ) | | | (151.9 | ) | | | (419.1 | ) |
Effect of exchange rate changes on cash and cash equivalents | | | (18.1 | ) | | | 30.9 | | | | (54.9 | ) |
Net change in cash and cash equivalents | | | 66.7 | | | | (8.3 | ) | | | 57.8 | |
Cash balance at beginning of period | | | 1,168.1 | | | | 1,176.4 | | | | 1,118.6 | |
Cash balance at end of period | | $ | 1,234.8 | | | $ | 1,168.1 | | | $ | 1,176.4 | |
Operating Activities
Fluctuations in operating cash flows are attributable to changes in net income and working capital items, which can vary from period to period based on the amount and timing of cash receipts and payments.
Investing Activities
Cash provided by (used for) investing activities for the years ended December 31, 2024, 2023 and 2022, was as follows (in millions):
| | Year ended December 31, | |
| | 2024 | | | 2023 | | | 2022 | |
Sales (purchases) of investments, net | | $ | (37.0 | ) | | $ | (59.7 | ) | | $ | 44.6 | |
Purchases of investments by consolidated seeded investment products, net | | | (101.4 | ) | | | (224.9 | ) | | | (43.9 | ) |
Purchases of property, equipment and software | | | (10.1 | ) | | | (10.8 | ) | | | (17.6 | ) |
Cash received (paid) on settled seed capital hedges, net | | | (10.7 | ) | | | (37.5 | ) | | | 75.9 | |
Acquisitions, net of cash acquired | | | (126.9 | ) | | | — | | | | — | |
Long-term note with Intech | | | — | | | | 3.1 | | | | (15.9 | ) |
Proceeds from sale of subsidiaries | | | — | | | | — | | | | 14.9 | |
Other | | | 0.7 | | | | 0.9 | | | | 0.5 | |
Cash provided by (used for) investing activities | | $ | (285.4 | ) | | $ | (328.9 | ) | | $ | 58.5 | |
We consolidate certain seeded investment products into our group financial statements. The purchases and sales of investments within consolidated seeded investment products are disclosed separately from our capital contributions to seed a product. We also maintain an economic hedge program that uses derivative instruments to mitigate against market exposure of certain seeded investments. The cash received and paid as part of this program is reflected in the table above.
We periodically add new investment strategies to our investment product offerings by providing the initial cash investment, or seeding, in a product. The primary purpose of seeded investment products is to generate an investment performance track record in these products, and leverage that track record to attract third-party investors. We may redeem our seed capital investments for a variety of reasons, including when third-party investments in the relevant product are sufficient to sustain the investment strategy. The cash associated with seeding and redeeming seeded investment products is reflected in the above table as sales (purchases) of investments, net.
The transactions discussed above represent a majority of the activity within investing activities on our Consolidated Statements of Cash Flows. Additionally, for the year ended December 31, 2024, cash used for investing activities was also driven by acquisitions. Refer to Note 3 — Acquisitions and Dispositions, in Part II, Item 8, Financial Statements and Supplementary Data, for further information on our acquisitions.
Financing Activities
Cash used for financing activities for the years ended December 31, 2024, 2023 and 2022, was as follows (in millions):
| | Year ended December 31, | |
| | 2024 | | | 2023 | | | 2022 | |
Dividends paid to shareholders | | $ | (250.1 | ) | | $ | (258.7 | ) | | $ | (259.4 | ) |
Third-party capital invested into consolidated seeded investment products, net | | | 123.1 | | | | 227.2 | | | | 51.1 | |
Purchase of common stock for stock-based compensation plans | | | (79.8 | ) | | | (57.4 | ) | | | (113.8 | ) |
Purchase of common stock for the share buyback program | | | (208.2 | ) | | | (61.9 | ) | | | (98.9 | ) |
Issuance of long-term debt | | | 394.9 | | | | — | | | | — | |
Repayment of current portion of long-term debt | | | (304.0 | ) | | | — | | | | — | |
Other | | | (0.3 | ) | | | (1.1 | ) | | | 1.9 | |
Cash used for financing activities | | $ | (324.4 | ) | | $ | (151.9 | ) | | $ | (419.1 | ) |
The majority of cash flows within financing activities are driven by the payment of dividends to shareholders, the purchases of common stock as part of the Corporate Buyback Program and for stock-based compensation plans, and third-party capital invested into consolidated seeded investment products. For the year ended December 31, 2024, cash flows within financing activities were also driven by the repayment of the 2025 Senior Notes and the issuance of the 2034 Senior Notes.
Third-party capital invested into consolidated seeded investment products, net represents the cash received from third-party investors in a seeded investment product that is consolidated into our group financial statements. When a third-party investor redeems the investment, a cash outflow is disclosed as a distribution.
Other Sources of Liquidity
On June 30, 2023, we entered into a $200 million unsecured, revolving credit facility (“Credit Facility”). The Credit Facility includes an option for us to request an increase to our borrowing capacity under the Credit Facility of up to an additional $50.0 million. The maturity date of the Credit Facility is June 30, 2029.
The Credit Facility may be used for general corporate purposes and bears interest on borrowings outstanding at the relevant interbank offer rate plus a spread.
The Credit Facility contains a financial covenant related to our long-term credit rating and financing leverage. If our long-term credit rating falls below a predefined threshold, our financing leverage ratio cannot exceed 3.00x EBITDA. At the latest practicable date before the date of this report, we were in compliance with all covenants, and there were no outstanding borrowings under the Credit Facility. Refer to Note 11 — Debt, in Part II, Item 8, Financial Statements and Supplementary Data, for further information on the Credit Facility.
Regulatory Capital
We are subject to regulatory oversight by the SEC, FINRA, CFTC, FCA and other international regulatory bodies. We strive to ensure that we are compliant with our regulatory obligations at all times. Our primary capital requirement relates to the FCA-supervised regulatory group (a sub-group of our company), comprising Janus Henderson (UK) Holdings Limited, all of its subsidiaries and Janus Henderson Investors International Limited (“JHIIL”). JHIIL is included as a connected undertaking to meet the requirements of the Investment Firm Prudential Regime (“IFPR”) for MiFID investment firms (“MIFIDPRU”). The combined capital requirement is £159.2 million ($199.4 million), resulting in £275.8 million ($345.4 million) of capital above the requirement as of December 31, 2024, based upon internal calculations and taking into account the effect of foreseeable dividends. Capital requirements in other jurisdictions are not significant in aggregate. The FCA-supervised regulatory group is also subject to liquidity requirements and holds a sufficient surplus above these requirements.
Contractual Obligations
Contractual obligations and associated maturities relate to debt, interest payments and finance and operating leases. As of December 31, 2024, our contractual obligations related to debt and interest payments totaled $611.3 million, with $21.8 million of interest payable within 12 months. As of December 31, 2024, we had operating and finance lease payment obligations of $106.3 million, with $18.0 million payable within 12 months.
Short-Term Liquidity Considerations
Common Stock Purchases — Corporate Buyback Program
On October 31, 2023, our Board of Directors approved the 2023 Corporate Buyback Program pursuant to which we were authorized to repurchase up to $150.0 million of our common stock on the NYSE at any time prior to the date of our 2024 Annual General Meeting of Shareholders, which was held on May 1, 2024. During 2024, we repurchased 2,876,189 shares of common stock for $88.2 million under the 2023 Corporate Buyback Program.
On May 1, 2024, our Board of Directors approved the 2024 Corporate Buyback Program pursuant to which we are authorized to repurchase up to $150.0 million of our common stock, and on October 30, 2024, our Board of Directors approved an incremental share buyback authorization to repurchase up to an additional $50.0 million of our common stock at any time prior to the date of our 2025 Annual General Meeting of Shareholders. As of December 31, 2024, cumulative shares repurchased under the 2024 Corporate Buyback Program were 3,159,199 shares for $120.0 million.
Common Stock Purchases — Share Plan Purchases
Some of our executives and employees obtain rights to receive our common stock as part of their remuneration arrangements and employee entitlements. We satisfy these entitlements by transferring shares of existing common stock that we repurchase on-market for this purpose (“Share Plan Repurchases”). These repurchases are in addition to the repurchases under the Corporate Buyback Program discussed above.
On October 31, 2023, our Board of Directors approved the repurchase of up to 4 million additional shares of common stock for the purpose of making grants to executives and employees at any time prior to the date of our 2024 Annual General Meeting of Shareholders, which was held on May 1, 2024. During 2024, we repurchased 2,268,376 shares of common stock for $70.0 million.
On May 1, 2024, our Board of Directors also approved the repurchase of up to 5 million additional shares of common stock to make grants to executives and employees at any time prior to the date of our 2025 Annual General Meeting of Shareholders. As of December 31, 2024, cumulative shares repurchased under the 2024 Share Plan Repurchases were 250,001 shares for $8.6 million.
Dividends
The payment of cash dividends is within the discretion of our Board of Directors and depends on many factors, including our results of operations, financial condition, capital requirements, general business conditions and legal requirements.
Dividends declared and paid during the year ended December 31, 2024, were as follows:
Dividend | | | Date | | Dividends paid | | | Date |
per share | | | declared | | (in US$ millions) | | | paid |
| $ | 0.39 | | | January 31, 2024 | | $ | 63.2 | | | February 28, 2024 |
| $ | 0.39 | | | May 1, 2024 | | $ | 62.6 | | | May 29, 2024 |
| $ | 0.39 | | | July 31, 2024 | | $ | 62.3 | | | August 28, 2024 |
| $ | 0.39 | | | October 30, 2024 | | $ | 62.0 | | | November 27, 2024 |
On January 30, 2025, our Board of Directors declared a cash dividend of $0.39 per share. The quarterly dividend will be paid on February 27, 2025, to shareholders of record at the close of business on February 11, 2025.
Long-Term Liquidity Considerations
Expected long-term commitments as of December 31, 2024, include principal and interest payments related to our 2034 Senior Notes, operating and finance lease payments, and acquisition related contingent consideration. We expect to fund our long-term commitments with existing cash and cash generated from operations or by accessing capital and credit markets as necessary.
Off-Balance Sheet Arrangements
As of December 31, 2024, we had no off-balance sheet arrangements.
CRITICAL ACCOUNTING POLICIES AND ESTIMATES
Our consolidated financial statements and accompanying notes have been prepared in accordance with U.S. GAAP. The preparation of financial statements in conformity with U.S. GAAP requires management to make estimates and assumptions that affect the reported amounts of assets and liabilities and the disclosure of contingent assets and liabilities at the date of the financial statements, and the reported amounts of revenues and expenses during the reporting periods.
We continually evaluate the accounting policies and estimates used to prepare the consolidated financial statements. In general, management’s estimates are based on historical experience, information from third-party professionals, as appropriate, and various other assumptions that are believed to be reasonable under current facts and circumstances. Actual results could differ from those estimates made by management. The critical accounting policies and estimates management considers critical to understanding the consolidated financial statements relate to the areas of consolidated investment products, investments, goodwill and intangible assets, retirement benefit plans and income taxes. These policies and estimates are considered critical because they have a material impact, or are reasonably likely to have a material impact, on the Company’s consolidated financial statements because they require management to make significant judgments, assumptions or estimates. For additional information about our accounting policies, see Note 2 — Summary of Significant Accounting Policies, in Part II, Item 8, Financial Statements and Supplementary Data.
Consolidated Investment Products
We consolidate our seeded investment products in which we have a controlling financial interest. We have a controlling financial interest when we own a majority of the VRE or we are the primary beneficiary of a VIE. Assessing whether a product is a VIE or a VRE involves judgment and analysis on a structure-by-structure basis. Factors considered in this assessment include the product’s legal organization, the product’s capital structure and equity ownership, and any de facto agent implications of our involvement with the product. We consolidate seeded investment products accounted for as VREs when we are considered to control such products, which generally exists if we have a greater than 50% voting equity interest. We consolidate a VIE if we are the VIE’s primary beneficiary. The primary beneficiary of a VIE is defined as the variable interest holder that has a controlling financial interest in the VIE. A controlling financial interest is defined as (i) the power to direct the activities of the VIE that most significantly impact its economic performance and (ii) the obligation to absorb losses of the product or the right to receive benefits from the product that potentially could be significant to the VIE. VIEs are generally subject to consolidation by us when we hold an economic interest of greater than 9% and we deconsolidate such VIEs once equity ownership falls at or below 9%. VIEs are also subject to specific disclosure requirements. See Note 4 — Consolidation, in Part II, Item 8, Financial Statements and Supplementary Data, for more information.
Accounting for Goodwill and Intangible Assets
The recognition and measurement of goodwill and intangible assets require significant management estimates and judgment, including the valuation and expected life determination in connection with the initial purchase price allocation and the ongoing evaluation for impairment. The initial estimated fair value of indefinite lived and definite lived intangible assets is based on the present value of estimated future cash flows attributable to the agreements and contracts. Significant assumptions used to determine estimated fair value include AUM, investment management fee rates, discount rates, and expenses. The estimated fair value of trade names is determined using the relief from royalty on the present value of estimated future cash flows. Significant assumptions used to determine fair value align with the aforementioned assumptions for indefinite lived and definite lived intangible assets, however, assumptions also include the royalty rate to determine the estimated fair value of trade names. We believe the assumptions used to determine the estimated fair value are reasonable, however, they are inherently uncertain and unpredictable and thus they may differ from actual results.
Goodwill represents the excess of cost over the fair value of the identifiable net assets of acquired businesses and is not amortized.
Indefinite lived intangible assets primarily represent investment management agreements and trademarks. Investment management agreements without a contractual termination date are classified as indefinite-lived intangible assets based upon the following: (i) there is no legal or statutory limitation on the contract period to manage these investment products; (ii) we expect to, and have the ability to, operate these investment products indefinitely; (iii) the investment products have multiple investors and are not reliant on an individual investor or small group of investors for their continued operation; (iv) the current competitive environment does not indicate a finite life; and (v) there is a high likelihood of continued renewal based on historical experience. The assumption that investment management agreements are indefinite lived assets is reviewed at least annually or more frequently if facts and circumstances indicate that the useful life is no longer indefinite.
Definite-lived intangible assets represent certain other investment management contracts and trademarks, which are amortized over their estimated lives using the straight-line method.
Impairment Assessment
Goodwill and indefinite-lived intangible assets are reviewed for impairment annually or more frequently if changes in circumstances indicate that the carrying value may be impaired. We perform our annual impairment assessment of goodwill and indefinite-lived intangible assets as of October 1. If the fair value of the sole reporting unit or intangible asset is less than the carrying amount, an impairment is recognized. Any impairment is recognized immediately through net income and cannot subsequently be reversed.
We performed our annual assessment as of October 1, 2024. We initially assess goodwill for impairment using qualitative factors to determine whether it is necessary to perform a quantitative impairment test. As part of our qualitative test, along with considering macroeconomic conditions and the unadjusted book value per share, we performed a quantitative calculation to estimate the enterprise value of the reporting unit, comparing it to our equity balance (carrying value). The results of the goodwill assessment revealed it is more likely than not that the estimated fair value of the reporting unit was greater than the carrying value as of October 1, 2024. The most significant inputs into the enterprise value assessment are our stock price and an assumed control premium.
We also assessed the indefinite-lived intangible assets for impairment as of October 1. We used a qualitative approach to determine the likelihood of impairment, with AUM being the focus of the assessment. After reviewing the results of the qualitative assessment, there were no indicators of impairment.
Our definite-lived intangible assets are tested for impairment whenever events or changes in circumstances indicate that the carrying amount may not be recoverable. There were no events or changes in circumstances during the year ended December 31, 2024.
Retirement Benefit Plans
We provide certain employees with retirement benefits through defined benefit plans.
The defined benefit obligation is determined annually by independent qualified actuaries using the projected unit credit method and is measured at the present value of the estimated future cash outflows using a discount rate based on AA-rated corporate bond yields of appropriate duration. The plan assets are recognized at fair value. The funded status of the defined benefit pension plan (“plan”), being the resulting surplus or deficit of defined benefit assets less liabilities, is recognized in the Consolidated Balance Sheets, net of any taxes that would be deducted at source.
Actuarial gains and losses arise as a result of differences between actual experience and actuarial assumptions. We have adopted the “10% corridor” method for recognizing actuarial gains and losses. This means that cumulative actuarial gains or losses up to an amount equal to 10% of the higher of the liabilities and the assets of the scheme (“corridor”) have no immediate impact on net income and are instead recognized through other comprehensive income. Cumulative gains or losses greater than this corridor are amortized to net income over the average future lifetime of inactive members of the plan on the grounds that there are no further active members of the plans remaining.
Net periodic benefit cost is recorded as a component of net income in the Consolidated Statements of Comprehensive Income and includes service cost, interest cost and the expected return on plan assets.
The net periodic benefit costs and period-end obligations under defined benefit pension plans are determined using actuarial valuations. The actuarial valuation involves making a number of assumptions, including those related to the discount rate, the expected rate of return on assets, future salary increases, mortality rates and future pension increases. Due to the long-term nature of these plans, such estimates are subject to significant uncertainty.
The table below shows the movement in funded status that would result from certain sensitivity changes (in millions):
| | Hypothetical decrease | |
| | in funded status at | |
| | December 31, 2024 | |
Discount rate: -0.1% | | $ | 5.0 | |
Inflation: +0.1% | | $ | 1.1 | |
Life expectancy: +1 year at age 65 | | $ | 15.0 | |
Market value of return seeking portfolio falls 25% | | $ | 0.3 | |
Income Taxes
We operate in several countries, states and other taxing jurisdictions through various subsidiaries and branches, and must allocate income, expenses and earnings under the various laws and regulations of each of these taxing jurisdictions. Accordingly, the provision for income taxes represents the total estimate of the liability that we have incurred for doing business each year in all of the locations. We file tax returns annually that represent filing positions within each jurisdiction and settle return liabilities. Each jurisdiction has the right to audit those returns and may take different positions with respect to income and expense allocations and taxable earnings determinations. Because the determinations of the annual provisions are subject to judgments and estimates, it is possible that actual results will vary from those recognized in the Consolidated Financial Statements. As a result, it is likely that additions to, or reductions of, income tax expense will occur each year for prior reporting periods as actual tax returns and tax audits are settled.
In the assessment of uncertain tax positions, significant management judgment is required to estimate the range of possible outcomes and determine the probability, on a more likely than not basis, of favorable or unfavorable tax outcomes and the potential interest and penalties related to such unfavorable outcomes. Actual future tax consequences on settlement of our uncertain tax positions may be materially different than management’s current estimates. As of December 31, 2024, unrecognized tax benefits were $28.9 million.
Deferred tax assets, net of any associated valuation allowance, have been recognized based on management’s belief that taxable income of the appropriate character, more likely than not, will be sufficient to realize the benefits of these assets over time. In the event that actual results differ from expectations, or if historical trends of positive operating income change, we may be required to record a valuation allowance on some or all of these deferred tax assets, which may have a significant effect on our financial condition and results of operations. In assessing whether a valuation allowance should be established against a deferred income tax asset, we consider the nature, frequency and severity of recent losses, forecasts of future profitability and the duration of statutory carryback and carryforward periods, among other factors.
| ITEM 7A. | QUANTITATIVE AND QUALITATIVE DISCLOSURES ABOUT MARKET RISK |
The following information describes the key aspects of certain items for which we are exposed to market risk.
Management Fees
Management fee revenues are generally based upon a percentage of the market value of AUM and are calculated as a percentage of either the daily, month-end or quarter-end average asset balance in accordance with contractual agreements. Accordingly, fluctuations in the financial markets have a direct effect on our operating results. Although fluctuations in the financial markets have a direct effect on our operating results, AUM may outperform or underperform the financial markets. As such, quantifying the impact of correlation between AUM and our operating results would be misleading.
Performance Fees
Performance fee revenue is derived from a number of funds and clients. As a result, our revenues are subject to volatility beyond market-based fluctuations discussed in the Management Fees section above. Performance fees are specified in certain fund and client contracts and are based on investment performance either on an absolute basis or compared to an established index over a specified period of time. Certain U.S. mutual funds contracts allow for negative performance fees where there is underperformance against the relevant index. In many cases, performance fees are subject to a HWM. Performance fees are recognized at the end of the contractual period (typically monthly, quarterly or annually). Our performance fees depend on internal performance and market trends, and are, therefore, subject to volatility year-over-year. We recognized performance fees of $70.4 million, $5.1 million, and $(10.7) million for the years ended December 31, 2024, 2023 and 2022, respectively. At December 31, 2024 and 2023, our AUM subject to performance fees totaled $110.0 billion and $94.5 billion, respectively.
Investments
At December 31, 2024, we were exposed to market price risk as a result of investments in our Consolidated Balance Sheets. The following is a summary of the effect that a hypothetical 10% increase or decrease in market prices would have on our current investments subject to market price fluctuations as of December 31, 2024 (in millions):
| | | | | Fair value | | | Fair value | |
| | | | | assuming a 10% | | | assuming a 10% | |
| | Fair value | | | increase | | | decrease | |
Current investments: | | | | | | | | | | | | |
Seeded investment products (including VIEs) | | $ | 803.6 | | | $ | 884.0 | | | $ | 723.2 | |
Investments related to deferred compensation plans | | | 29.8 | | | | 32.8 | | | | 26.8 | |
Other investments | | | 5.8 | | | | 6.4 | | | | 5.2 | |
Total current investments | | $ | 839.2 | | | $ | 923.1 | | | $ | 755.3 | |
Certain investments include debt securities that contribute to the achievement of defined investment objectives. Debt securities are exposed to interest rate risk and credit risk. Movement in interest rates and credit risk would be reflected in the value of the securities; refer to the quantitative analysis above.
Derivative Instruments
Derivative Instruments Used to Hedge Seeded Investment Products
We maintain an economic hedge program that uses derivative instruments to mitigate against market exposure of certain seeded investments by using index and commodity futures (“futures”), contracts for difference, credit default swaps and total return swaps. Certain foreign currency exposures associated with our seeded investment products are also hedged by using foreign currency forward contracts.
We were party to the following derivative instruments as of December 31, 2024 and 2023 (in millions):
| | Notional value | |
| | December 31, 2024 | | | December 31, 2023 | |
Futures and contracts for difference | | $ | 789.0 | | | $ | 1,018.0 | |
Credit default swaps | | $ | 148.5 | | | $ | 199.7 | |
Total return swaps | | $ | 69.7 | | | $ | 51.8 | |
Foreign currency forward contracts | | $ | 328.2 | | | $ | 176.2 | |
Changes in fair value of derivative instruments are recognized during the period in which they occur in investment gains (losses), net in the Consolidated Statements of Comprehensive Income.
Derivative Instruments — Foreign Currency Hedging Program
We maintain a foreign currency hedging program to take reasonable measures to minimize the income statement effects of foreign currency remeasurement of monetary balance sheet accounts. The program uses foreign currency forward contracts and swaps to achieve its objectives, and it is considered an economic hedge for accounting purposes.
The notional value of the foreign currency forward contracts and swaps was $38.4 million and $65.3 million at December 31, 2024 and 2023, respectively. Changes in fair value of the derivatives are recognized in other non-operating income (expense), net in our Consolidated Statements of Comprehensive Income.
Foreign Currency Exchange Risk
Foreign currency risk is the risk that we will sustain losses through adverse movements in foreign currency exchange rates, where we transact in currencies that are different from our functional currency. Our foreign currency exposure is primarily associated with GBP, AUD and EUR.
As our functional currency is USD, we are exposed to foreign currency risk through our exposure to non-USD income, expenses, assets and liabilities of our overseas subsidiaries, as well as net assets and liabilities denominated in a currency other than USD. We manage our currency exposure by monitoring foreign currency positions. We seek to naturally offset exposures where possible and actively hedge certain exposures on a case-by-case basis.
| ITEM 8. | FINANCIAL STATEMENTS AND SUPPLEMENTARY DATA |
Index to Financial Statements
Report of Independent Registered Public Accounting Firm
To the Board of Directors and Shareholders of Janus Henderson Group plc
Opinions on the Financial Statements and Internal Control over Financial Reporting
We have audited the accompanying consolidated balance sheets of Janus Henderson Group plc and its subsidiaries (the "Company") as of December 31, 2024 and 2023, and the related consolidated statements of comprehensive income, of changes in equity and of cash flows for each of the three years in the period ended December 31, 2024, including the related notes (collectively referred to as the "consolidated financial statements"). We also have audited the Company's internal control over financial reporting as of December 31, 2024, based on criteria established in Internal Control - Integrated Framework (2013) issued by the Committee of Sponsoring Organizations of the Treadway Commission (COSO).
In our opinion, the consolidated financial statements referred to above present fairly, in all material respects, the financial position of the Company as of December 31, 2024 and 2023, and the results of its operations and its cash flows for each of the three years in the period ended December 31, 2024 in conformity with accounting principles generally accepted in the United States of America. Also in our opinion, the Company maintained, in all material respects, effective internal control over financial reporting as of December 31, 2024, based on criteria established in Internal Control - Integrated Framework (2013) issued by the COSO.
Basis for Opinions
The Company's management is responsible for these consolidated financial statements, for maintaining effective internal control over financial reporting, and for its assessment of the effectiveness of internal control over financial reporting, included in the accompanying Management’s Report on Internal Control Over Financial Reporting. Our responsibility is to express opinions on the Company’s consolidated financial statements and on the Company's internal control over financial reporting based on our audits. We are a public accounting firm registered with the Public Company Accounting Oversight Board (United States) (PCAOB) and are required to be independent with respect to the Company in accordance with the U.S. federal securities laws and the applicable rules and regulations of the Securities and Exchange Commission and the PCAOB.
We conducted our audits in accordance with the standards of the PCAOB. Those standards require that we plan and perform the audits to obtain reasonable assurance about whether the consolidated financial statements are free of material misstatement, whether due to error or fraud, and whether effective internal control over financial reporting was maintained in all material respects.
Our audits of the consolidated financial statements included performing procedures to assess the risks of material misstatement of the consolidated financial statements, whether due to error or fraud, and performing procedures that respond to those risks. Such procedures included examining, on a test basis, evidence regarding the amounts and disclosures in the consolidated financial statements. Our audits also included evaluating the accounting principles used and significant estimates made by management, as well as evaluating the overall presentation of the consolidated financial statements. Our audit of internal control over financial reporting included obtaining an understanding of internal control over financial reporting, assessing the risk that a material weakness exists, and testing and evaluating the design and operating effectiveness of internal control based on the assessed risk. Our audits also included performing such other procedures as we considered necessary in the circumstances. We believe that our audits provide a reasonable basis for our opinions.
Definition and Limitations of Internal Control over Financial Reporting
A company’s internal control over financial reporting is a process designed to provide reasonable assurance regarding the reliability of financial reporting and the preparation of financial statements for external purposes in accordance with generally accepted accounting principles. A company’s internal control over financial reporting includes those policies and procedures that (i) pertain to the maintenance of records that, in reasonable detail, accurately and fairly reflect the transactions and dispositions of the assets of the company; (ii) provide reasonable assurance that transactions are recorded as necessary to permit preparation of financial statements in accordance with generally accepted accounting principles, and that receipts and expenditures of the company are being made only in accordance with authorizations of management and directors of the company; and (iii) provide reasonable assurance regarding prevention or timely detection of unauthorized acquisition, use, or disposition of the company’s assets that could have a material effect on the financial statements.
Because of its inherent limitations, internal control over financial reporting may not prevent or detect misstatements. Also, projections of any evaluation of effectiveness to future periods are subject to the risk that controls may become inadequate because of changes in conditions, or that the degree of compliance with the policies or procedures may deteriorate.
Critical Audit Matters
The critical audit matter communicated below is a matter arising from the current period audit of the consolidated financial statements that was communicated or required to be communicated to the audit committee and that (i) relates to accounts or disclosures that are material to the consolidated financial statements and (ii) involved our especially challenging, subjective, or complex judgments. The communication of critical audit matters does not alter in any way our opinion on the consolidated financial statements, taken as a whole, and we are not, by communicating the critical audit matter below, providing a separate opinion on the critical audit matter or on the accounts or disclosures to which it relates.
Acquisition of Victory Park Capital Advisors, LLC (VPC) - Valuation of Certain Investment Management Contracts
As described in Notes 3 and 10 to the consolidated financial statements, on October 1, 2024, the Company completed the acquisition of VPC. The purchase price for the VPC acquisition was allocated to the assets acquired and liabilities assumed based upon their estimated fair values at the date of the transaction. The fair value of the net intangible assets acquired in the VPC acquisition was $54.0 million, of which a significant portion relates to certain investment management contracts. Management measured the fair value of intangible assets on initial recognition based on the present value of estimated future cash flows. Significant assumptions used by management to determine estimated fair value include assets under management (AUM), investment management fee rates, discount rates, and expenses.
The principal considerations for our determination that performing procedures relating to the valuation of certain investment management contracts acquired in the acquisition of VPC is a critical audit matter are (i) the significant judgment by management when developing the fair value estimate of certain investment management contracts acquired; (ii) a high degree of auditor judgment, subjectivity, and effort in performing procedures and evaluating management’s significant assumptions related to AUM, the investment management fee rate, the discount rate, and expenses; and (iii) the audit effort involved the use of professionals with specialized skill and knowledge.
Addressing the matter involved performing procedures and evaluating audit evidence in connection with forming our overall opinion on the consolidated financial statements. These procedures included testing the effectiveness of controls relating to management’s valuation of certain investment management contracts acquired in the VPC acquisition. These procedures also included, among others (i) reading the purchase agreement; (ii) testing management’s process for developing the fair value estimate of certain investment management contracts acquired; (iii) evaluating the appropriateness of the present value method; (iv) testing the completeness and accuracy of the underlying data used in present value method; and (v) evaluating the reasonableness of the significant assumptions used by management related to AUM, the investment management fee rate, the discount rate, and expenses. Evaluating management’s assumptions related to related to AUM, the investment management fee rate, and expenses involved considering (i) industry knowledge and data; (ii) current and past performance on the certain investment management contracts; and (iii) whether the assumptions were consistent with evidence obtained in the other areas of the audit. Professionals with specialized skill and knowledge were used to assist in evaluating (i) the appropriateness of the present value method and (ii) the reasonableness of the discount rate assumption.
/s/ PricewaterhouseCoopers LLP
Denver, Colorado
February 27, 2025
We have served as the Company’s auditor since 2019.
Management’s Report on Internal Control Over Financial Reporting
JHG management is responsible for establishing and maintaining adequate internal control over JHG’s financial reporting, as defined in Rules 13a-15(f) and 15d-15(f) under the Securities Exchange Act of 1934. JHG’s internal control over financial reporting is a process designed to provide reasonable assurance regarding the reliability of financial reporting and the preparation of financial statements for external purposes in accordance with generally accepted accounting principles. Because of its inherent limitations, internal control over financial reporting may not prevent or detect misstatements. Also, projections of any evaluation of effectiveness to future periods are subject to the risk that controls may become inadequate because of changes in conditions, or that the degree of compliance with the policies or procedures may deteriorate.
JHG management has assessed the effectiveness of JHG’s internal control over financial reporting as of December 31, 2024. In making its assessment of internal control over financial reporting, JHG management used the framework set forth in the Committee of Sponsoring Organizations of the Treadway Commission in Internal Control — Integrated Framework (2013). Based on the assessment using those criteria, JHG management determined that as of December 31, 2024, JHG’s internal control over financial reporting was effective.
JHG’s independent registered public accounting firm, PricewaterhouseCoopers LLP, audited the effectiveness of JHG’s internal control over financial reporting as of December 31, 2024, as stated in Item 8 of this Annual Report on Form 10-K.
February 27, 2025
JANUS HENDERSON GROUP PLC
CONSOLIDATED BALANCE SHEETS
(Dollars in Millions, Except Share Data)
| | December 31, | | | December 31, | |
| | 2024 | | | 2023 | |
ASSETS | | | | | | |
Current assets: | | | | | | |
Cash and cash equivalents | | $ | 1,217.2 | | | $ | 1,152.4 | |
Investments | | | 337.1 | | | | 334.2 | |
Fees and other receivables | | | 356.6 | | | | 294.0 | |
OEIC and unit trust receivables | | | 68.7 | | | | 94.6 | |
Assets of consolidated VIEs: | | | | | | |
Cash and cash equivalents | | | 17.6 | | | | 15.7 | |
Investments | | | 502.1 | | | | 382.4 | |
Other current assets | | | 5.7 | | | | 7.8 | |
Other current assets | | | 134.5 | | | | 174.5 | |
Total current assets | | | 2,639.5 | | | | 2,455.6 | |
Non-current assets: | | | | | | |
Property, equipment and software, net | | | 39.4 | | | | 44.2 | |
Intangible assets, net | | | 2,473.3 | | | | 2,431.3 | |
Goodwill | | | 1,550.4 | | | | 1,290.3 | |
Retirement benefit asset, net | | | 70.3 | | | | 87.6 | |
Other non-current assets | | | 190.2 | | | | 187.6 | |
Total assets | | $ | 6,963.1 | | | $ | 6,496.6 | |
| | | | | | |
LIABILITIES | | | | | | |
Current liabilities: | | | | | | |
Accounts payable and accrued liabilities | | $ | 266.1 | | | $ | 231.4 | |
Current portion of accrued compensation, benefits and staff costs | | | 388.6 | | | | 297.9 | |
OEIC and unit trust payables | | | 75.6 | | | | 98.5 | |
Liabilities of consolidated VIEs: | | | | | | |
Accounts payable and accrued liabilities | | | 4.7 | | | | 3.2 | |
Total current liabilities | | | 735.0 | | | | 631.0 | |
| | | | | | |
Non-current liabilities: | | | | | | |
Accrued compensation, benefits and staff costs | | | 38.8 | | | | 45.0 | |
Long-term debt | | | 395.0 | | | | 304.6 | |
Deferred tax liabilities, net | | | 569.3 | | | | 570.8 | |
Other non-current liabilities | | | 141.9 | | | | 89.7 | |
Total liabilities | | | 1,880.0 | | | | 1,641.1 | |
| | | | | | |
Commitments and contingencies (See Note 19) | | | | | | |
| | | | | | |
REDEEMABLE NONCONTROLLING INTERESTS | | | 365.0 | | | | 317.2 | |
| | | | | | |
EQUITY | | | | | | |
Common stock, $1.50 par value; 480,000,000 shares authorized, and 158,126,855 and 163,338,035 shares issued and outstanding as of December 31, 2024, and December 31, 2023, respectively | | | 237.2 | | | | 245.0 | |
Additional paid-in-capital | | | 3,745.3 | | | | 3,722.3 | |
Treasury shares, 36,171 and 41,444 shares held at December 31, 2024, and December 31, 2023, respectively | | | (0.9 | ) | | | (1.1 | ) |
Accumulated other comprehensive loss, net of tax | | | (485.2 | ) | | | (563.6 | ) |
Retained earnings | | | 1,095.1 | | | | 1,135.5 | |
Total shareholders’ equity | | | 4,591.5 | | | | 4,538.1 | |
Nonredeemable noncontrolling interests | | | 126.6 | | | | 0.2 | |
Total equity | | | 4,718.1 | | | | 4,538.3 | |
Total liabilities, redeemable noncontrolling interests and equity | | $ | 6,963.1 | | | $ | 6,496.6 | |
The accompanying notes are an integral part of these consolidated financial statements.
JANUS HENDERSON GROUP PLC
CONSOLIDATED STATEMENTS OF COMPREHENSIVE INCOME
(Dollars in Millions, Except Per Share Data)
| | Year ended December 31, | |
| | 2024 | | | 2023 | | | 2022 | |
Revenue: | | | | | | | | | |
Management fees | | $ | 1,957.7 | | | $ | 1,700.1 | | | $ | 1,799.4 | |
Performance fees | | | 70.4 | | | | 5.1 | | | | (10.7 | ) |
Shareowner servicing fees | | | 240.7 | | | | 213.3 | | | | 224.0 | |
Other revenue | | | 204.4 | | | | 183.3 | | | | 190.9 | |
Total revenue | | | 2,473.2 | | | | 2,101.8 | | | | 2,203.6 | |
Operating expenses: | | | | | | | | | |
Employee compensation and benefits | | | 716.1 | | | | 593.3 | | | | 611.5 | |
Long-term incentive plans | | | 166.6 | | | | 167.4 | | | | 180.7 | |
Distribution expenses | | | 520.9 | | | | 455.9 | | | | 498.3 | |
Investment administration | | | 58.2 | | | | 47.4 | | | | 49.4 | |
Marketing | | | 40.4 | | | | 36.6 | | | | 27.1 | |
General, administrative and occupancy | | | 300.8 | | | | 294.6 | | | | 279.3 | |
Impairment of intangible assets | | | — | | | | — | | | | 35.8 | |
Depreciation and amortization | | | 24.5 | | | | 22.9 | | | | 31.7 | |
Total operating expenses | | | 1,827.5 | | | | 1,618.1 | | | | 1,713.8 | |
Operating income | | | 645.7 | | | | 483.7 | | | | 489.8 | |
Interest expense | | | (18.0 | ) | | | (12.7 | ) | | | (12.6 | ) |
Investment gains (losses), net | | | 70.8 | | | | 43.4 | | | | (113.3 | ) |
Other non-operating income (expense), net | | | (86.6 | ) | | | 12.6 | | | | 11.5 | |
Income before taxes | | | 611.9 | | | | 527.0 | | | | 375.4 | |
Income tax provision | | | (166.3 | ) | | | (100.3 | ) | | | (100.9 | ) |
Net income | | | 445.6 | | | | 426.7 | | | | 274.5 | |
Net loss (income) attributable to noncontrolling interests | | | (36.7 | ) | | | (34.7 | ) | | | 97.9 | |
Net income attributable to JHG | | $ | 408.9 | | | $ | 392.0 | | | $ | 372.4 | |
| | | | | | | | | |
Earnings per share attributable to JHG common shareholders: | | | | | | | | | |
Basic | | $ | 2.57 | | | $ | 2.37 | | | $ | 2.23 | |
Diluted | | $ | 2.56 | | | $ | 2.37 | | | $ | 2.23 | |
Other comprehensive income (loss), net of tax: | | | | | | | | | |
Foreign currency translation gains (losses) | | $ | (52.6 | ) | | $ | 96.8 | | | $ | (221.0 | ) |
Reclassification of foreign currency translation to net income | | | 138.1 | | | | 4.7 | | | | (4.1 | ) |
Actuarial losses | | | (12.6 | ) | | | (14.3 | ) | | | (37.6 | ) |
Other comprehensive income (loss), net of tax | | | 72.9 | | | | 87.2 | | | | (262.7 | ) |
Other comprehensive loss (income) attributable to noncontrolling interests | | | 5.5 | | | | (3.1 | ) | | | 2.0 | |
Other comprehensive income (loss) attributable to JHG | | $ | 78.4 | | | $ | 84.1 | | | $ | (260.7 | ) |
Total comprehensive income | | $ | 518.5 | | | $ | 513.9 | | | $ | 11.8 | |
Total comprehensive loss (income) attributable to noncontrolling interests | | | (31.2 | ) | | | (37.8 | ) | | | 99.9 | |
Total comprehensive income attributable to JHG | | $ | 487.3 | | | $ | 476.1 | | | $ | 111.7 | |
The accompanying notes are an integral part of these consolidated financial statements.
JANUS HENDERSON GROUP PLC
CONSOLIDATED STATEMENTS OF CASH FLOWS
(Dollars in Millions)
| | Year ended December 31, | |
| | 2024 | | | 2023 | | | 2022 | |
CASH FLOWS PROVIDED BY (USED FOR): | | | | | | | | | |
Operating activities: | | | | | | | | | |
Net income | | $ | 445.6 | | | $ | 426.7 | | | $ | 274.5 | |
Adjustments to reconcile net income to net cash provided by operating activities: | | | | | | | | | |
Depreciation and amortization | | | 24.5 | | | | 22.9 | | | | 31.7 | |
Impairment of intangible assets | | | — | | | | — | | | | 35.8 | |
Deferred income taxes | | | 2.4 | | | | (6.1 | ) | | | (14.3 | ) |
Stock-based compensation plan expense | | | 71.7 | | | | 77.4 | | | | 90.6 | |
Reclassification of foreign currency translation to net income | | | 138.1 | | | | 4.7 | | | | (4.1 | ) |
Loss on sale of Intech | | | — | | | | — | | | | 9.1 | |
Provision for credit losses and contingent consideration adjustments | | | — | | | | 23.7 | | | | — | |
Investment losses (gains), net | | | (70.8 | ) | | | (43.4 | ) | | | 113.3 | |
Other, net | | | (11.1 | ) | | | (9.1 | ) | | | (8.2 | ) |
Changes in operating assets and liabilities: | | | | | | | | | |
OEIC and unit trust receivables and payables | | | 3.0 | | | | (3.2 | ) | | | (0.7 | ) |
Other assets | | | (12.2 | ) | | | (25.2 | ) | | | 41.6 | |
Other accruals and liabilities | | | 103.4 | | | | (26.8 | ) | | | (96.0 | ) |
Net operating activities | | | 694.6 | | | | 441.6 | | | | 473.3 | |
Investing activities: | | | | | | | | | |
Sales (purchases) of: | | | | | | | | | |
Investments, net | | | (37.0 | ) | | | (59.7 | ) | | | 44.6 | |
Property, equipment and software | | | (10.1 | ) | | | (10.8 | ) | | | (17.6 | ) |
Investments by consolidated seeded investment products, net | | | (101.4 | ) | | | (224.9 | ) | | | (43.9 | ) |
Cash received (paid) on settled seed capital hedges, net | | | (10.7 | ) | | | (37.5 | ) | | | 75.9 | |
Acquisitions, net of cash acquired | | | (126.9 | ) | | | — | | | | — | |
Long-term note with Intech | | | — | | | | 3.1 | | | | (15.9 | ) |
Proceeds from sale of subsidiaries | | | — | | | | — | | | | 14.9 | |
Other | | | 0.7 | | | | 0.9 | | | | 0.5 | |
Net investing activities | | | (285.4 | ) | | | (328.9 | ) | | | 58.5 | |
Financing activities: | | | | | | | | | |
Purchase of common stock for stock-based compensation plans | | | (79.8 | ) | | | (57.4 | ) | | | (113.8 | ) |
Purchase of common stock for the share buyback program | | | (208.2 | ) | | | (61.9 | ) | | | (98.9 | ) |
Dividends paid to shareholders | | | (250.1 | ) | | | (258.7 | ) | | | (259.4 | ) |
Issuance of long-term debt | | | 394.9 | | | | — | | | | — | |
Repayment of current portion of long-term debt | | | (304.0 | ) | | | — | | | | — | |
Third-party capital invested into consolidated seeded investment products, net | | | 123.1 | | | | 227.2 | | | | 51.1 | |
Other, net | | | (0.3 | ) | | | (1.1 | ) | | | 1.9 | |
Net financing activities | | | (324.4 | ) | | | (151.9 | ) | | | (419.1 | ) |
Cash and cash equivalents: | | | | | | | | | |
Effect of foreign exchange rate changes | | | (18.1 | ) | | | 30.9 | | | | (54.9 | ) |
Net change | | | 66.7 | | | | (8.3 | ) | | | 57.8 | |
At beginning of period | | | 1,168.1 | | | | 1,176.4 | | | | 1,118.6 | |
At end of period | | $ | 1,234.8 | | | $ | 1,168.1 | | | $ | 1,176.4 | |
Supplemental cash flow information: | | | | | | | | | |
Cash paid for interest | | $ | 18.5 | | | $ | 14.6 | | | $ | 14.6 | |
Cash paid for income taxes, net of refunds | | $ | 133.3 | | | $ | 104.3 | | | $ | 140.7 | |
Reconciliation of cash and cash equivalents: | | | | | | | | | |
Cash and cash equivalents | | $ | 1,217.2 | | | $ | 1,152.4 | | | $ | 1,162.3 | |
Cash and cash equivalents held in consolidated VIEs | | | 17.6 | | | | 15.7 | | | | 14.1 | |
Total cash and cash equivalents | | $ | 1,234.8 | | | $ | 1,168.1 | | | $ | 1,176.4 | |
The accompanying notes are an integral part of these consolidated financial statements.
JANUS HENDERSON GROUP PLC
CONSOLIDATED STATEMENTS OF CHANGES IN EQUITY
(Amounts in Millions)
| | | | | | | | | | | | | | Accumulated | | | | | | | | | | |
| | | | | | | | Additional | | | | | | other | | | | | | Nonredeemable | | | | |
| | Number of | | | Common | | | paid-in | | | Treasury | | | comprehensive | | | Retained | | | noncontrolling | | | Total | |
| | shares | | | stock | | | capital | | | shares | | | loss | | | earnings | | | interests | | | equity | |
Balance at January 1, 2022 | | | 169.0 | | | $ | 253.6 | | | $ | 3,771.8 | | | $ | (55.1 | ) | | $ | (387.0 | ) | | $ | 1,040.2 | | | $ | 15.4 | | | $ | 4,638.9 | |
Net income | | | — | | | | — | | | | — | | | | — | | | | — | | | | 372.4 | | | | — | | | | 372.4 | |
Other comprehensive loss | | | — | | | | — | | | | — | | | | — | | | | (256.6 | ) | | | — | | | | — | | | | (256.6 | ) |
Reclassification of foreign currency translation to net income | | | — | | | | — | | | | — | | | | — | | | | (4.1 | ) | | | — | | | | — | | | | (4.1 | ) |
Dividends paid to shareholders ($1.55 per share) | | | — | | | | — | | | | 0.1 | | | | — | | | | — | | | | (259.5 | ) | | | — | | | | (259.4 | ) |
Purchase of common stock for the share buyback program | | | (3.3 | ) | | | (5.1 | ) | | | — | | | | — | | | | — | | | | (93.8 | ) | | | — | | | | (98.9 | ) |
Distributions to noncontrolling interests | | | — | | | | — | | | | — | | | | — | | | | — | | | | — | | | | (1.0 | ) | | | (1.0 | ) |
Sale of Intech | | | — | | | | — | | | | — | | | | — | | | | — | | | | — | | | | (11.6 | ) | | | (11.6 | ) |
Fair value adjustments to redeemable noncontrolling interests | | | — | | | | — | | | | — | | | | — | | | | — | | | | 1.4 | | | | — | | | | 1.4 | |
Purchase of common stock for stock-based compensation plans | | | — | | | | — | | | | (105.0 | ) | | | (8.8 | ) | | | — | | | | — | | | | — | | | | (113.8 | ) |
Vesting of stock-based compensation plans | | | — | | | | — | | | | (55.2 | ) | | | 55.6 | | | | — | | | | — | | | | — | | | | 0.4 | |
Stock-based compensation plan expense | | | — | | | | — | | | | 90.6 | | | | — | | | | — | | | | — | | | | — | | | | 90.6 | |
Proceeds from stock-based compensation plans | | | — | | | | — | | | | 4.3 | | | | — | | | | — | | | | — | | | | — | | | | 4.3 | |
Balance at December 31, 2022 | | | 165.7 | | | $ | 248.5 | | | $ | 3,706.6 | | | $ | (8.3 | ) | | $ | (647.7 | ) | | $ | 1,060.7 | | | $ | 2.8 | | | $ | 4,362.6 | |
Net income | | | — | | | | — | | | | — | | | | — | | | | — | | | | 392.0 | | | | — | | | | 392.0 | |
Other comprehensive income | | | — | | | | — | | | | — | | | | — | | | | 79.4 | | | | — | | | | — | | | | 79.4 | |
Reclassification of foreign currency translation to net income | | | — | | | | — | | | | — | | | | — | | | | 4.7 | | | | — | | | | — | | | | 4.7 | |
Dividends paid to shareholders ($1.56 per share) | | | — | | | | — | | | | 0.1 | | | | — | | | | — | | | | (258.8 | ) | | | — | | | | (258.7 | ) |
Purchase of common stock for the share buyback program | | | (2.4 | ) | | | (3.5 | ) | | | — | | | | — | | | | — | | | | (58.4 | ) | | | — | | | | (61.9 | ) |
Distributions to noncontrolling interests | | | — | | | | — | | | | — | | | | — | | | | — | | | | — | | | | (2.6 | ) | | | (2.6 | ) |
Purchase of common stock for stock-based compensation plans | | | — | | | | — | | | | (56.4 | ) | | | (1.0 | ) | | | — | | | | — | | | | — | | | | (57.4 | ) |
Vesting of stock-based compensation plans | | | — | | | | — | | | | (8.4 | ) | | | 8.2 | | | | — | | | | — | | | | — | | | | (0.2 | ) |
Stock-based compensation plan expense | | | — | | | | — | | | | 77.4 | | | | — | | | | — | | | | — | | | | — | | | | 77.4 | |
Proceeds from stock-based compensation plans | | | — | | | | — | | | | 3.0 | | | | — | | | | — | | | | — | | | | — | | | | 3.0 | |
Balance at December 31, 2023 | | | 163.3 | | | $ | 245.0 | | | $ | 3,722.3 | | | $ | (1.1 | ) | | $ | (563.6 | ) | | $ | 1,135.5 | | | $ | 0.2 | | | $ | 4,538.3 | |
Net income (loss) | | | — | | | | — | | | | — | | | | — | | | | — | | | | 408.9 | | | | (0.9 | ) | | | 408.0 | |
Other comprehensive loss | | | — | | | | — | | | | — | | | | — | | | | (59.7 | ) | | | — | | | | — | | | | (59.7 | ) |
Reclassification of foreign currency translation to net income | | | — | | | | — | | | | — | | | | — | | | | 138.1 | | | | — | | | | — | | | | 138.1 | |
Dividends paid to shareholders ($1.56 per share) | | | — | | | | — | | | | — | | | | — | | | | — | | | | (250.1 | ) | | | — | | | | (250.1 | ) |
Purchase of common stock for the share buyback program | | | (6.0 | ) | | | (9.0 | ) | | | — | | | | — | | | | — | | | | (199.2 | ) | | | — | | | | (208.2 | ) |
Acquisition of VPC | | | 0.8 | | | | 1.2 | | | | 29.9 | | | | — | | | | — | | | | — | | | | 127.3 | | | | 158.4 | |
Purchase of common stock for stock-based compensation plans | | | — | | | | — | | | | (78.6 | ) | | | (1.2 | ) | | | — | | | | — | | | | — | | | | (79.8 | ) |
Vesting of stock-based compensation plans | | | — | | | | — | | | | (1.4 | ) | | | 1.4 | | | | — | | | | — | | | | — | | | | 0.0 | |
Stock-based compensation plan expense | | | — | | | | — | | | | 71.7 | | | | — | | | | — | | | | — | | | | — | | | | 71.7 | |
Proceeds from stock-based compensation plans | | | — | | | | — | | | | 1.4 | | | | — | | | | — | | | | — | | | | — | | | | 1.4 | |
Balance at December 31, 2024 | | | 158.1 | | | $ | 237.2 | | | $ | 3,745.3 | | | $ | (0.9 | ) | | $ | (485.2 | ) | | $ | 1,095.1 | | | $ | 126.6 | | | $ | 4,718.1 | |
The accompanying notes are an integral part of these consolidated financial statements.
JANUS HENDERSON GROUP PLC
NOTES TO THE CONSOLIDATED FINANCIAL STATEMENTS
Note 1 — Description of the Business
As used herein, “JHG,” “we,” “us,” “our” and similar terms refer to Janus Henderson Group plc and its subsidiaries, unless indicated otherwise.
JHG is an independent global asset manager, specializing in active investment across all major asset classes. We actively manage a broad range of investment products for institutional and retail investors across four capabilities: Equities, Fixed Income, Multi-Asset and Alternatives.
JHG is a public limited company incorporated in Jersey, Channel Islands, and is tax-resident and domiciled in the UK. Our common stock is traded on the NYSE.
Note 2 — Summary of Significant Accounting Policies
Basis of Presentation
Our consolidated financial statements have been prepared according to U.S. GAAP and include all majority-owned subsidiaries and consolidated seeded investment products. Intercompany accounts and transactions have been eliminated in consolidation. Events subsequent to the balance sheet date have been evaluated for inclusion in the accompanying consolidated financial statements through the issuance date. Certain prior year amounts have been reclassified to conform to current year presentation with no effect on our consolidated net income or cash flows.
Recent Accounting Pronouncements
Recently adopted accounting pronouncements
In November 2023, the Financial Accounting Standards Board (“FASB”) issued ASU 2023-07, “Segment Reporting (Topic 280): Improvements to Reportable Segment Disclosures,” to require disclosure of certain significant segment expenses. ASU 2023-07 is effective for our annual periods beginning January 1, 2024, and interim periods beginning January 1, 2025. We have adopted this standard for our fiscal year 2024 annual financial statements and interim financial statements thereafter and have applied this standard retrospectively for all prior periods presented in the financial statements.
Recently issued accounting pronouncements not yet adopted
In December 2023, the FASB issued ASU 2023-09, “Income Taxes (Topic 740): Improvements to Income Tax Disclosures,” to expand the disclosure requirements for income taxes, specifically related to the rate reconciliation and income taxes paid. ASU 2023-09 is effective for our annual periods beginning January 1, 2025. We do not expect the adoption of this new guidance to have a material impact on the consolidated financial statements.
In November 2024, the FASB issued ASU 2024-03, “Income Statement—Reporting Comprehensive Income—Expense Disaggregation Disclosures (Subtopic 220-40): Disaggregation of Income Statement Expenses,” to expand disclosure requirements about specific expense categories within the notes to the financial statements. ASU 2024-03 is effective for our annual period beginning January 1, 2027 and interim periods beginning January 1, 2028. Adoption of this ASU can either be applied prospectively to consolidated financial statements issued for reporting periods after the effective date of this ASU or retrospectively to any or all prior periods presented in the consolidated financial statements. Early adoption is also permitted. We are currently evaluating the impact this guidance will have on the disclosures included in the Notes to the Consolidated Financial Statements.
Accounting Estimates
The preparation of consolidated financial statements in conformity with U.S. GAAP requires management to make estimates and assumptions that affect the reported amounts of assets and liabilities, the disclosure of contingent assets and liabilities at the date of the consolidated financial statements, and the reported amounts of revenues and expenses during the reporting period. Actual results could differ from those estimates, and the differences could be material. Our significant estimates relate to investments, goodwill and intangible assets, retirement benefit assets and obligations, and income taxes.
Segment Information
We are a global asset manager and manage a range of investment products, operating across various product lines, distribution channels and geographic regions. However, resources are allocated and the business is managed by the chief operating decision-maker, the CEO, on an aggregated basis. Strategic and financial management decisions are determined centrally by the CEO and, on this basis, we operate as a single-segment investment management business.
Consolidation of Investment Products
We perform periodic consolidation analyses of our seeded investment products to determine if the product is a VIE or a VRE. Factors considered in this assessment include the product’s legal organization, the product’s capital structure and equity ownership, and any de facto agent implications of our involvement with the product. Investment products that are determined to be VIEs are consolidated if we are the primary beneficiary of the products. VREs are consolidated if we hold the majority voting interest. Upon the occurrence of certain events (such as contributions and redemptions, either by JHG or third parties, or amendments to the governing documents of our investment products), management reviews and reconsiders its previous conclusion regarding the status of a product as a VIE or a VRE. Additionally, management continually reconsiders whether we are considered a VIE’s primary beneficiary and thus would be required to consolidate such product or discontinue consolidation of the VIE if we are no longer considered the primary beneficiary.
Variable Interest Entities
Certain investment products for which a controlling financial interest is achieved through arrangements that do not involve or are not directly linked to voting interests are considered VIEs. We review factors, including whether or not (i) the product has equity that is sufficient to permit it to finance its activities without additional subordinated support from other parties and (ii) the equity holders at risk have the obligation to absorb losses, the right to receive residual returns and the right to direct the activities of the product that most significantly impact the product’s economic performance, to determine if the investment product is a VIE. We reevaluate such factors as facts and circumstances change.
We consolidate a VIE if we are the VIE’s primary beneficiary. The primary beneficiary of a VIE is defined as the variable interest holder that has a controlling financial interest in the VIE. A controlling financial interest is defined as (i) the power to direct the activities of the VIE that most significantly impact its economic performance and (ii) the obligation to absorb losses of the product or the right to receive benefits from the product that potentially could be significant to the VIE.
We are the manager of various types of seeded investment products, which may be considered VIEs. Our involvement in financing the operations of the VIEs is generally limited to our investments in the products.
VIEs are generally subject to consolidation by us when we hold an economic interest of greater than 9% and we deconsolidate such VIEs once equity ownership equals or falls below 9%. VIEs are subject to specific disclosure requirements.
Voting Rights Entities
We consolidate seeded investment products accounted for as VREs when we are considered to control such products, which generally exist if we have a greater than 50% voting equity interest.
Property, Equipment and Software
Property, equipment and software are recorded at cost. Depreciation is recorded using the straight-line method over the estimated useful life of the related assets (or the lease term, if shorter).
Computer software is recorded at cost and depreciated over its estimated useful life. Internal and external costs incurred in connection with researching or obtaining computer software for internal use are expensed as incurred during the preliminary project stage, as are post-implementation training and maintenance costs. Internal and external costs incurred for internal use software during the application development stage are capitalized until such time that the software is substantially complete and ready for its intended use. Application development stage costs are depreciated on a straight-line basis over the estimated useful life of the software.
An impairment loss is recognized if the carrying value of the asset exceeds the fair value of the asset. The amount of the impairment loss is equal to the excess of the carrying amount over the fair value. The evaluation is based on an estimate of the future cash flows expected to result from the use of the asset and its eventual disposal. If expected future undiscounted cash flows are less than the carrying amount of the asset, an impairment loss is recognized in an amount equal to the excess of the carrying amount of the asset over the fair value of the asset. There were no impairments of property, equipment and software for the years ended December 31, 2024, 2023 and 2022.
Cloud Computing Arrangements
Costs paid to vendors for third-party cloud-based hosting services are capitalized and recorded to other current assets or other non-current assets and subsequently amortized to general, administrative and occupancy expense on a straight-line basis over the life of the contract. Implementation costs incurred related to the cloud hosting arrangement are capitalized or expensed depending on the nature of the costs and the project stage during which they are incurred. We capitalize costs incurred during the application development stage to other assets and other non-current assets and subsequently amortize those costs to general, administrative and occupancy expense on a straight-line basis over the life of the contract beginning when the asset is ready for its intended use.
Debt
Long-term debt consists of senior notes and is stated at amortized cost using the effective interest rate method. Amortized cost is calculated by taking into account any issuance costs and any discount or premium on settlement. Debt will cease to be recognized when the obligation under the liability has been discharged or cancelled or has expired.
Investments
Seeded Investment Products
We periodically add new investment strategies to our investment product offerings by providing the initial cash investment (“seed capital”). The primary purpose of seed capital is to generate an investment performance track record in a product to attract third-party investors. Seeded investment products are initially assessed for consolidation. If it is determined consolidation is required, the individual securities within the portfolio are accounted for as investments on the Consolidated Balance Sheets. If consolidation is not required, the fair value is determined using the number of shares held multiplied by the share price of the respective fund. The change in fair value of seeded investment products is recorded within investment gains (losses), net in our Consolidated Statements of Comprehensive Income. Noncontrolling interests in consolidated seeded investment products represent third-party ownership interests and are included within investments in our Consolidated Balance Sheets. These assets are not available for general corporate purposes and may be redeemed by the third parties at any time.
Refer to the Consolidation of Investment Products section in this note for information regarding the consolidation of certain seeded investment products.
We may redeem invested seed capital for a variety of reasons, including when third-party investments in the relevant product are sufficient to sustain the given investment strategy. The length of time we hold a majority interest in a product varies based on a number of factors, including market demand, market conditions, investment performance and internal policies.
Investments in Advised Mutual Funds and Investments Related to the Economic Hedging of Deferred Compensation
We grant mutual fund share awards to employees that are indexed to certain funds managed by us. Upon vesting, participants receive the value of the mutual fund share awards adjusted for gains or losses attributable to the mutual funds to which the award was indexed, subject to tax withholding, or participants receive shares in the mutual fund. When investments in our fund products are purchased and held against deferred compensation liabilities, any movement in the fair value of the assets and corresponding movements in the deferred compensation liability are recognized within the Consolidated Statements of Comprehensive Income.
We maintain deferred compensation plans for certain highly compensated employees and members of the Board of Directors. Eligible participants may defer a portion of their compensation and have the ability to earn a return by indexing their deferrals to mutual funds managed by us and our subsidiaries. We make no contributions to the plans. To protect against market variability of the liability, we create an economic hedge by investing in mutual funds that are consistent with the deferred amounts and mutual fund elections of the participants. Such investments remain assets of JHG. Changes in market value of the liability to participants are recognized as long-term incentive plans within our Consolidated Statements of Comprehensive Income, and changes in the market value of the mutual fund securities are recognized within investment gains (losses), net in our Consolidated Statements of Comprehensive Income.
Equity Method Investments
Our investment in equity method investees, where we do not control the investee but can exert significant influence over the financial and operating policies (generally considered to be ownership between 20% and 50%), is accounted for using the equity method of accounting.
Investments are initially recognized at cost when purchased for cash or at the fair value of shares received where acquired as part of a wider transaction. The investments are subsequently carried at cost adjusted for our share of net income or loss and other changes in comprehensive income of the equity method investee, less any dividends or distributions received by us. The Consolidated Statements of Comprehensive Income includes our share of net income or loss for the year, or period of ownership, if shorter, within investment gains (losses), net.
Trade Receivables
Trade receivables are initially recognized at fair value, which is normally equivalent to the invoice amount. When the time value of money is material, the fair value is discounted. Provision for specific doubtful accounts is made when there is evidence that we may not be able to recover balances in full. Balances are written off when the receivable amount is deemed uncollectable.
OEIC and Unit Trust Receivables and Payables
OEIC and unit trust receivables and payables are in relation to the purchase of units/shares (by investors) and the liquidation of units/shares (owned by trustees). The amounts are dependent on the level of trading and fund switches in the four working days leading up to the end of the period. Since they are held with different counterparties, the amounts are presented gross on our Consolidated Balance Sheets.
Cash and Cash Equivalents
Cash and cash equivalents primarily consist of cash held at banks, on-demand deposits, investments in money market instruments, highly liquid short-term debt securities and commercial paper with a maturity date of three months or less. Cash balances maintained by consolidated VREs are not considered legally restricted and are included within cash and cash equivalents on the Consolidated Balance Sheets while cash balances held by consolidated VIEs are disclosed separately as a component of assets of consolidated VIEs in the Consolidated Balance Sheets. Cash held in consolidated VREs and VIEs is not available to us to use in our operations.
Derivative Instruments
We may, from time to time, use derivative financial instruments to mitigate price, interest rate, foreign currency and credit risk. We do not designate derivative instruments as hedges for accounting purposes.
Derivative instruments are measured at fair value and classified as either other current assets or accounts payable and accrued liabilities in our Consolidated Balance Sheets. Changes in the fair value of derivative instruments are recorded within investment gains (losses), net in our Consolidated Statements of Comprehensive Income.
Our consolidated seed investments may also be party to derivative instruments. These derivative instruments are disclosed separately from our corporate derivative instruments.
Leases
We determine if an arrangement is a lease at inception. Operating lease right-of-use (“ROU”) assets are included in other non-current assets within our Consolidated Balance Sheets. The current and non-current portions of operating lease liabilities are included within accounts payable and accrued liabilities and within other non-current liabilities, respectively.
Finance lease ROU assets are included within property, equipment and software, net. The current and non-current portions of finance lease liabilities are included within accounts payable and accrued liabilities and within other non-current liabilities, respectively.
ROU assets represent our right to use an underlying asset for the lease term, and lease liabilities represent our obligation to make lease payments arising from the lease. Operating lease ROU assets and liabilities are recognized at commencement date based on the present value of lease payments over the lease term. As most of our leases do not provide a stated rate, we use our incremental borrowing rate based on the information available at commencement date in determining the present value of lease payments. The operating lease ROU asset also includes any lease payments made and excludes lease incentives. Our lease terms may include options to extend or terminate the lease when it is reasonably certain that the option will be exercised. Lease expense for lease payments is recognized on a straight-line basis over the lease term within general, administrative and occupancy expense within our Consolidated Statements of Comprehensive Income.
Nonredeemable Noncontrolling Interests and Redeemable Noncontrolling Interests
Nonredeemable noncontrolling interests that are not subject to redemption rights are classified in equity. Redeemable noncontrolling interests are classified outside of equity on the Consolidated Balance Sheets and are measured at the estimated fair value as of the balance sheet date. Noncontrolling interests in consolidated seed investments are classified as redeemable noncontrolling interests where there is an obligation on the fund to repurchase units at the investor’s request.
Fair Value Measurements
Fair value is the price that would be received to sell an asset or transfer a liability in an orderly transaction between market participants at the measurement date. The fair value of financial instruments traded in active markets (such as publicly traded securities and derivatives) is based on quoted market prices at the reporting date. The quoted market price used for financial instruments is the last traded market price for both financial assets and financial liabilities where the last traded price falls within the bid ask spread. In circumstances where the last traded price is not within the bid ask spread, management will determine the point within the bid ask spread that is most representative of fair value current bid price. The fair value of financial instruments that are not traded in an active market is determined using valuation techniques commonly used by market participants, including the use of comparable recent arm’s length transactions, discounted cash flow (“DCF”) analysis and option pricing models. Estimating fair value requires significant management judgment, including benchmarking to similar instruments with observable market data and applying appropriate discounts that reflect differences between the securities that we are valuing and the selected benchmark.
Measurements of fair value are classified within a hierarchy that prioritizes the inputs to valuation techniques used to measure fair value based on whether the inputs to those valuation techniques are observable or unobservable.
The valuation hierarchy contains three levels:
| | ● | Level 1 — Valuation inputs are unadjusted quoted market prices for identical assets or liabilities in active markets; |
| | ● | Level 2 — Valuation inputs are quoted market prices for identical assets or liabilities in markets that are not active, quoted market prices for similar assets and liabilities in active markets, and other observable inputs directly or indirectly related to the asset or liability being measured; and |
| | ● | Level 3 — Valuation inputs are unobservable and significant to the fair value measurement. |
The valuation of an asset or liability may involve inputs from more than one level of the hierarchy. The level in the fair value hierarchy within which a fair value measurement in its entirety falls is determined based on the lowest level input that is significant to the fair value measurement.
Level 1 Fair Value Measurements
Our Level 1 fair value measurements consist mostly of seeded investment products, investments in advised mutual funds, cash equivalents and investments related to deferred compensation plans with quoted market prices in active markets. The fair value level of consolidated investments held by seeded investment products is determined by the underlying securities of the product. The fair value level of unconsolidated seeded investment products is determined by the NAV, which is considered a quoted price in an active market.
Level 2 Fair Value Measurements
Our Level 2 fair value measurements consist mostly of consolidated seeded investment products and our long-term debt. The fair value of consolidated seeded investment products is determined by the underlying securities of the product. The fair value of our long-term debt is determined using broker quotes and recent trading activity, which are considered Level 2 inputs.
Level 3 Fair Value Measurements
Our assets and liabilities measured at Level 3 are primarily deferred compensation liabilities that are held against investments in our fund products where the significant valuation inputs are unobservable.
Details of inputs used to calculate the fair value of contingent deferred consideration can be found in Note 10 — Fair Value Measurements in Part II, Item 8, Financial Statements and Supplementary Data.
Nonrecurring Fair Value Measurements
Nonrecurring Level 3 fair value measurements include goodwill and intangible assets. We measure the fair value of goodwill and intangible assets on initial recognition using DCF analysis that requires assumptions regarding projected future earnings and discount rates. Because of the significance of the unobservable inputs in the fair value measurements of these assets and liabilities, such measurements are classified as Level 3. See the Goodwill and Intangible Assets accounting policy set forth within this note for further information.
Investments Measured at Net Asset Values
As a practical expedient, the Company uses the NAV as the fair value for certain investments. Investments in fund products for which fair value is estimated using the NAV as a practical expedient (when the NAV is available to the Company as an investor but is not publicly available) are not classified in the fair value hierarchy.
Income Taxes
We provide for current tax expense according to the tax laws in each jurisdiction in which we operate, using tax rates and laws that have been enacted by the balance sheet date.
Deferred income tax assets and liabilities are recorded for temporary differences between the financial statement and income tax basis of assets and liabilities as measured by the enacted income tax rates that may be in effect when these differences reverse. The effect of changes in tax rates on our deferred tax assets and liabilities is recognized as income tax within net income in the period that includes the enactment date. Significant management judgment is required in developing our provision for income taxes, including the valuation allowances that might be required against deferred tax assets and the evaluation of unrecognized tax benefits resulting from uncertain tax positions taken or expected to be taken in a tax return.
We periodically assess the recoverability of our deferred tax assets and the need for valuation allowances on these assets. We make these assessments based on the weight of available evidence regarding possible sources of future taxable income and estimates relating to the future performance of the business that results in taxable income.
In evaluating uncertain tax positions, we consider the probability that the tax benefit can be sustained on examination by a taxing authority on the basis of its technical merits (“the recognition threshold”). For tax positions meeting this threshold, the amount recognized within the financial statements is the benefit expected to be realized upon settlement with the taxing authority on the basis of a cumulative-probability assessment of the possible outcomes. For tax positions not meeting the recognition threshold, no financial statement benefit is recognized. We recognize the accrual of interest and penalties on uncertain tax positions as a component of the income tax provision.
Revenue Recognition
Revenue is determined based on the transaction price negotiated with the customer, net of rebates. Management fees, performance fees, shareowner servicing fees and other revenue are derived from providing professional services to manage investment products.
Management fees are earned over time as services are provided and are generally based on a percentage of the market value of AUM. These fees are calculated as a percentage of either the daily, month-end or quarter-end average asset balance in accordance with contractual agreements.
Performance fees are specified in certain fund and client contracts and are based on investment performance either on an absolute basis or compared to an established index over a specified period of time. Performance fees are generated on certain management contracts when performance hurdles or other specified criteria are achieved. Performance fees for all fund ranges and other investment products are recognized when it is probable that a significant reversal of revenue recognized will not occur in future periods. Certain fund contracts allow for negative performance fees where there is underperformance against the relevant index. There are no performance fee contracts where revenue can be clawed back. There are no cumulative revenues recognized that would be reversed if all of the existing investments became worthless.
Management fees are primarily earned monthly or quarterly, while performance fees are usually earned monthly, quarterly or annually, although the frequency of receipt varies between agreements. Management and performance fee revenue earned but not yet received is recognized within fees and other receivables on our Consolidated Balance Sheets.
Shareowner servicing fees are earned for services rendered related to transfer agent and administrative activities performed for investment products. These services are transferred over time and are generally based on a percentage of the market value of AUM.
Other revenue includes distribution and servicing fees earned from U.S. mutual funds associated with mutual fund transfer agent, accounting, shareholder servicing and participant recordkeeping activities. These services are transferred over time and are generally based on a percentage of the market value of AUM.
U.S. Mutual Fund Performance Fees
The investment management fee paid by each U.S. mutual fund subject to a performance fee is the base management fee plus or minus a performance fee adjustment as determined by the relative investment performance of the fund compared to a specified benchmark index. Under the performance-based fee structure, the investment advisory fee paid by each fund consists of two components: (i) a base fee calculated by applying the contractual fixed rate of the advisory fee to the fund’s average daily net assets during the previous month, plus or minus (ii) a performance fee adjustment calculated by applying a variable rate of up to 0.15% to the fund’s average daily net assets during the performance measurement period. The performance measurement period is a rolling 36-month period.
The addition of performance fees to all funds without such fees is subject to the approval of both a majority of the shareholders of such funds and the funds’ independent board of trustees.
Principal Versus Agent
We use third-party intermediaries to fulfill certain performance obligations in our revenue agreements. Generally, we are considered the principal in these arrangements because we control the investment management and other related services before they are transferred to customers. Such control is evidenced by our primary responsibility to customers, the ability to negotiate the third-party contract price and select and direct third-party service providers, or a combination of these factors. Therefore, distribution and service fee revenues and the related third-party distribution and service expenses are reported on a gross basis.
Operating Expenses
Operating expenses are accrued and recognized as incurred.
Stock-Based Compensation
We grant stock-based awards to certain employees, all of which are classified as equity settled stock-based payments. Equity settled stock-based payments are measured at the fair value of the shares at the grant date. The awards are expensed, with a corresponding increase in equity, on a graded basis over the vesting period. Forfeitures are recognized as they occur.
The grant date fair value for stock options is determined using the Black-Scholes option pricing model, and the grant date fair value of restricted stock is determined from the market price on the date of grant. The Black-Scholes model requires management to determine certain variables; the assumptions used in the Black-Scholes option pricing model include dividend yield, expected volatility, risk-free interest rate and expected life. The dividend yield and expected volatility are determined using historical Company data. The risk-free interest rate for options granted is based on the three-year UK treasury coupon at the time of the grant. The expected life of the stock options is generally three years.
We generally use the Monte Carlo model to determine the fair value of performance-based awards with market conditions. The assumptions used in the Monte Carlo model include dividend yield, share price volatility and discount rate.
Commissions
Commissions on management fees are accounted for on an accrual basis and are recognized in the accounting period in which the associated management fee is earned.
Earnings Per Share
Basic earnings per share attributable to our shareholders is calculated by dividing net income (adjusted for the allocation of earnings to participating restricted stock awards) by the weighted-average number of shares outstanding. We calculate earnings per share using the two-class method. We have certain participating restricted stock awards that are paid non-forfeitable dividends. Under the two-class method, net income attributable to JHG is adjusted for the allocation of earnings to participating restricted stock awards.
Diluted earnings per share is calculated in a similar way to basic earnings per share but is adjusted for the effect of potential common shares unless they are anti-dilutive.
Goodwill and Intangible Assets
Goodwill represents the excess of cost over the fair value of the identifiable net assets of acquired companies and is capitalized within the Consolidated Balance Sheets.
Intangible assets consist primarily of investment management contracts and trademarks acquired as part of business combinations. Investment management contracts have been identified as separately identifiable intangible assets arising on the acquisition of subsidiaries or businesses. Such contracts are recognized at the present value of the expected future cash flows of the investment management contracts at the date of acquisition. Investment management contracts may be classified as either indefinite-lived investment management contracts or definite-lived client relationships.
Indefinite-lived intangible assets comprise investment management agreements where the agreements are with investment companies themselves and not with underlying investors. Such contracts are typically renewed indefinitely and, therefore, we consider the contract life to be indefinite and, as a result, the contracts are not amortized. Definite-lived intangible assets comprise certain other investment management contracts, client relationships and trademarks. Definite-lived client relationships are amortized on a straight-line basis over their remaining useful lives.
Goodwill and indefinite-lived intangible assets are reviewed for impairment annually or more frequently if changes in circumstances indicate that the carrying value may be impaired. Intangible assets subject to amortization are tested for impairment whenever events or circumstances indicate that the carrying value may not be recoverable. If the fair value of our sole reporting unit or intangible asset is less than the carrying value, an impairment is recognized. Any impairment is recognized immediately through net income and cannot subsequently be reversed. We have determined that we have one reporting unit for goodwill impairment testing purposes, which is consistent with internal management reporting and management’s oversight of operations. We may first assess goodwill for impairment using qualitative factors to determine whether it is necessary to perform a quantitative impairment test.
Goodwill and intangible assets require significant management estimates and judgment, including the valuation and expected life determination upon inception and the ongoing evaluation for impairment.
Foreign Currency
Transactions in foreign currencies are recorded at the appropriate exchange rate prevailing at the date of the transaction. Foreign currency monetary balances at the reporting date are converted at the prevailing exchange rate. Foreign currency non-monetary balances carried at fair value or cost are translated at the rates prevailing at the date when the fair value or cost is determined. Gains and losses arising on remeasurement are recognized as a component of net income.
On consolidation, the assets and liabilities of our operations for which the functional currency is not USD are translated at exchange rates prevailing at the reporting date. Income and expense items are recognized at the appropriate exchange rate prevailing at the date of the transaction. Foreign currency translation differences arising, if any, are recorded to accumulated other comprehensive income. In the period in which an operation is liquidated, translation differences previously recognized within accumulated other comprehensive income are recognized as a component of net income.
Post-Employment Retirement Benefits
We provide employees with retirement benefits through a defined contribution plan. Additionally, we provide a defined benefit contribution to certain employees; however, the defined benefit contribution plan is closed to new members. The assets of these plans are held separately from our general assets in trustee-administered funds.
Contributions to the defined contribution plan are expensed to employee compensation and benefits on the Consolidated Statements of Comprehensive Income when they become payable.
Defined benefit obligations and the cost of providing benefits are determined annually by independent qualified actuaries using the projected unit credit method. Our annual measurement date of the defined benefit plan is December 31. The defined benefit obligation is measured as the present value of the estimated future cash outflows using a discount rate based on AA-rated corporate bond yields of appropriate duration. The plan assets are recognized at fair value. The funded status of the defined benefit pension plans (the resulting surplus or deficit of defined benefit assets less liabilities) is recognized within retirement benefit asset, net on the Consolidated Balance Sheets, net of any taxes that would be deducted at source.
Actuarial gains and losses arise as a result of the difference between actual experience and actuarial assumptions. We have adopted the 10% corridor method for recognizing actuarial gains and losses, which means that cumulative actuarial gains or losses up to an amount equal to 10% of the higher of the liabilities or assets of the scheme (the corridor) have no immediate impact on net income and are instead recognized through other comprehensive income. Cumulative gains or losses greater than the corridor are amortized to net income over the average future lifetime of inactive members of the plan on the grounds that there are no further active members of the plans remaining.
Net periodic benefit cost is recorded as a component of net income within the Consolidated Statements of Comprehensive Income and includes service cost, interest cost, expected return on plan assets and any actuarial gains and losses previously recognized as a component of other comprehensive income that have been amortized in the period. Net periodic benefit costs, with the exception of service costs, are recognized within other non-operating income (expense), net on the Consolidated Statements of Comprehensive Income; service costs are recognized within employee compensation and benefits.
Common Stock
JHG’s ordinary shares, par value $1.50 per share, are classified as equity instruments. Equity shares issued by us are recorded at the fair value of the proceeds received or the market price on the day of issue. Direct issue costs, net of tax, are deducted from additional paid-in-capital within equity.
Treasury shares held are equity shares of JHG acquired by or issued to employee benefit trusts. Treasury shares held are recorded at cost and are deducted from equity. No gain or loss is recognized within the Consolidated Statements of Comprehensive Income on the purchase, issue, sale or cancellation of our own equity shares.
Note 3 — Acquisitions and Dispositions
Victory Park Capital Advisors, LLC
On October 1, 2024, JHG completed the acquisition of VPC, a global private credit manager. VPC expands our capabilities into the private markets for our clients.
JHG acquired 55% of the voting equity interests for $114.0 million, using existing cash resources, and 824,208 shares of JHG common stock which had a closing market price of $37.74 on October 1, 2024. In addition, subject to achieving certain revenue targets, JHG will deliver earnout consideration to be payable in 2027. As of October 1, 2024 the fair value of the contingent consideration related to the acquisition of VPC was $25.5 million. The maximum total contingent consideration per the agreement is $111.4 million.
The purchase price for the VPC acquisition was allocated to the assets acquired and liabilities assumed based upon their estimated fair values at the date of the transaction. The goodwill recognized in connection with the acquisition is primarily attributable to anticipated growth opportunities and synergies from the transaction. The amount of goodwill expected to be deductible for tax purposes is approximately $130 million. A summary of the fair values of the assets acquired and liabilities assumed in this acquisition is as follows:
| | Fair Value | |
Fees and other receivables | | $ | 20.8 | |
Other current assets | | | 0.8 | |
Property, equipment and software, net | | | 2.8 | |
Intangible assets, net(1) | | | 54.0 | |
Goodwill | | | 251.3 | |
Other non-current assets | | | 3.6 | |
Accounts payable and other liabilities | | | (26.8 | ) |
Current portion of accrued compensation | | | (8.5 | ) |
Other non-current liabilities | | | (4.3 | ) |
Noncontrolling interest(2) | | | (127.3 | ) |
Total consideration, net of cash acquired | | $ | 166.4 | |
Summary of consideration, net of cash acquired: | | | | |
Cash paid | | $ | 114.0 | |
Common stock issued | | | 31.1 | |
Contingent consideration recorded | | | 25.5 | |
Cash acquired | | | (4.2 | ) |
Total consideration, net of cash acquired | | $ | 166.4 | |
(1) The fair value of the intangible assets is comprised of investment management contracts with a fair value of $28.0 million, client relationships with a fair value of $20.5 million and a trademark with a fair value of $5.5 million as of the acquisition date. The fair value of the investment management contracts was determined based on the multi-period excess earnings method (a Level 3 input), has a useful life of approximately 4 years. The fair value of the client relationships was determined based on the multi-period excess earnings method (a Level 3 input) and has a useful life of approximately 4-10 years. The fair value of the trademark was determined based on the relief-from-royalty method (a Level 3 input) and has a useful life of 9 years. The useful lives are based on the individual contractual terms and the period over which the majority of cashflows would be realized. The definite lived intangibles are amortized on a straight-line basis over the useful life and have a weighted-average useful life of approximately 6 years.
(2) The fair value of the noncontrolling interest was determined based on an extrapolation of consideration method.
Further, in addition to our acquisition of VPC, we closed on our acquisition of a 55% voting equity interest in Triumph Capital Markets Holdco, LP (“TCM”), which represents VPC's broker-dealer business, on February 3, 2025. The TCM acquisition is not material to the financial statements.
Tabula Investment Management
On July 1, 2024, JHG completed the acquisition of Tabula, a leading independent ETF provider in Europe with an existing focus on fixed income and sustainable investment solutions. JHG acquired 98.8% of the voting equity interests of Tabula. Prior to the acquisition, we held a 1.2% investment in Tabula. The Tabula acquisition is not material to the financial statements.
NBK Capital Partners
On September 19, 2024, JHG completed the acquisition of NBK, the wealth management arm of the National Bank of Kuwait Group, whereby NBK’s private investments team will join JHG as the firm’s new emerging markets private capital division. JHG has acquired 100% of the voting equity interests of NBK. Following the closing of the acquisition, NBK was rebranded as Janus Henderson Emerging Markets Private Investments Limited. The acquisition is not material to the financial statements.
Management-Led Buyout of Quantitative Equities Subsidiary Intech
On February 3, 2022, we announced the strategic decision to sell our 97%-owned Quantitative Equities subsidiary, Intech, to a consortium composed of Intech management and certain Intech non-executive directors (“Management Buyout”). On March 31, 2022, the Management Buyout closed, and we recognized a $9.1 million loss on disposal of Intech. The loss is recognized in other non-operating income (expense), net in our Consolidated Statements of Comprehensive Income. Consideration received as part of the Management Buyout included cash proceeds of $14.9 million; contingent consideration of up to $17.5 million, which is based on future Intech revenue; and an option agreement that provides JHG the option to purchase a certain equity stake in Intech at a predetermined price on or before the seventh anniversary of the Management Buyout. As of December 31, 2024, the fair value of the contingent consideration and option agreement is nil.
Note 4 — Consolidation
Variable Interest Entities
Consolidated Variable Interest Entities
Our consolidated VIEs as of December 31, 2024 and 2023, include certain consolidated seeded investment products in which we have an investment and act as the investment manager. Third-party assets held in consolidated VIEs are not available to us or to our creditors. We may not, under any circumstances, access third-party assets held by consolidated VIEs to use in our operating activities or otherwise. In addition, the investors in these VIEs have no recourse to the credit of JHG.
Unconsolidated Variable Interest Entities
The following table presents the carrying value of investments included in our Consolidated Balance Sheets pertaining to unconsolidated VIEs as of December 31, 2024 and 2023 (in millions):
| | December 31, |
| | 2024 | | | 2023 | |
Unconsolidated VIEs | | $ | 53.6 | | | $ | 17.2 | |
Our total exposure to unconsolidated VIEs represents the value of our economic ownership interest in the investments.
Voting Rights Entities
Consolidated Voting Rights Entities
The following table presents the balances related to consolidated VREs that were recorded in our Consolidated Balance Sheets, including our net interest in these products, as of December 31, 2024 and 2023 (in millions):
| | December 31, | |
| | 2024 | | | 2023 | |
Investments | | $ | 132.5 | | | $ | 242.9 | |
Cash and cash equivalents | | | 26.3 | | | | 6.5 | |
Other current assets | | | 2.7 | | | | 21.6 | |
Accounts payable and accrued liabilities | | | (0.9 | ) | | | (1.1 | ) |
Total | | $ | 160.6 | | | $ | 269.9 | |
Redeemable noncontrolling interests in consolidated VREs | | | (22.7 | ) | | | (100.9 | ) |
JHG’s net interest in consolidated VREs | | $ | 137.9 | | | $ | 169.0 | |
Third-party assets held in consolidated VREs are not available to us or to our creditors. We may not, under any circumstances, access third-party assets held by consolidated VREs to use in our operating activities or otherwise. In addition, the investors in the VREs have no recourse to the credit of JHG.
Our total exposure to consolidated VREs represents the value of our economic ownership interest in these seeded investment products.
Unconsolidated Voting Rights Entities
The following table presents the carrying value of investments included in our Consolidated Balance Sheets pertaining to unconsolidated VREs as of December 31, 2024 and 2023 (in millions):
| | December 31, | |
| | 2024 | | | 2023 | |
Unconsolidated VREs | | $ | 73.5 | | | $ | 9.9 | |
Our total exposure to unconsolidated VREs represents the value of our economic ownership interest in the investments.
Note 5 — Investments
Our investments as of December 31, 2024 and 2023, are summarized as follows (in millions):
| | December 31, | |
| | 2024 | | | 2023 | |
Current investments: | | | | | | | | |
Seeded investment products: | | | | | | |
Consolidated VIEs | | $ | 502.1 | | | $ | 382.4 | |
Consolidated VREs | | | 132.5 | | | | 242.9 | |
Unconsolidated VIEs and VREs | | | 127.1 | | | | 27.1 | |
Separately managed accounts | | | 41.9 | | | | 44.1 | |
Total seeded investment products | | | 803.6 | | | | 696.5 | |
Investments related to deferred compensation plans | | | 29.8 | | | | 12.0 | |
Other investments | | | 5.8 | | | | 8.1 | |
Total current investments | | $ | 839.2 | | | $ | 716.6 | |
Non-current investments: | | | | | | | | |
Equity method investments | | | 23.1 | | | | 29.5 | |
Total investments | | $ | 862.3 | | | $ | 746.1 | |
Investment Gains (Losses), Net
Investment gains (losses), net in our Consolidated Statements of Comprehensive Income included the following for the years ended December 31, 2024, 2023 and 2022 (in millions):
| | Year ended December 31, | |
| | 2024 | | | 2023 | | | 2022 | |
Seeded investment products and hedges, net | | $ | 36.4 | | | $ | 20.3 | | | $ | (15.2 | ) |
Third-party ownership interests in seeded investment products | | | 37.5 | | | | 34.7 | | | | (97.9 | ) |
Equity method investments | | | (5.6 | ) | | | (13.5 | ) | | | 2.9 | |
Other | | | 2.5 | | | | 1.9 | | | | (3.1 | ) |
Investment gains (losses), net | | $ | 70.8 | | | $ | 43.4 | | | $ | (113.3 | ) |
Net unrealized gains (losses), excluding noncontrolling interests, on seeded investments products and associated derivative instruments still held at period end for the years ended December 31, 2024, 2023 and 2022, were $40.0 million, $2.8 million and $(21.7) million, respectively.
Gains and losses attributable to third-party ownership interests in seeded investment products are noncontrolling interests and are not included in net income attributable to JHG.
Equity Method Investments
Our equity method investments (other than investments in seeded investment products) include a 49% interest in Privacore Capital and a 20% interest in Long Tail Alpha.
Cash Flows
Cash flows related to our investments for the years ended December 31, 2024, 2023 and 2022, are summarized as follows (in millions):
| | Year ended December 31, | |
| | 2024 | | | 2023 | | | 2022 | |
| | Purchases | | | Sales, | | | | | | | Purchases | | | Sales, | | | | | | | Purchases | | | Sales, | | | | | |
| | and | | | settlements and | | | Net | | | and | | | settlements and | | | Net | | | and | | | settlements and | | | Net | |
| | settlements | | | maturities | | | cash flow | | | settlements | | | maturities | | | cash flow | | | settlements | | | maturities | | | cash flow | |
Investments by consolidated seeded investment products | | $ | (127.8 | ) | | $ | 26.4 | | | $ | (101.4 | ) | | $ | (227.3 | ) | | $ | 2.4 | | | $ | (224.9 | ) | | $ | (88.4 | ) | | $ | 44.5 | | | $ | (43.9 | ) |
Investments | | | (211.0 | ) | | | 174.0 | | | | (37.0 | ) | | | (180.6 | ) | | | 120.9 | | | | (59.7 | ) | | | (143.1 | ) | | | 187.7 | | | | 44.6 | |
Note 6 — Derivative Instruments
Derivative Instruments Used to Hedge Seeded Investment Products
We maintain an economic hedge program that uses derivative instruments to mitigate against market exposure of certain seeded investments by using index and commodity futures (“futures”), contracts for difference, credit default swaps and total return swaps. Certain foreign currency exposures associated with our seeded investment products are also hedged by using foreign currency forward contracts.
We were party to the following derivative instruments as of December 31, 2024 and 2023 (in millions):
| | Notional value | |
| | December 31, 2024 | | | December 31, 2023 | |
Futures and contracts for difference | | $ | 789.0 | | | $ | 1,018.0 | |
Credit default swaps | | | 148.5 | | | | 199.7 | |
Total return swaps | | | 69.7 | | | | 51.8 | |
Foreign currency forward contracts | | | 328.2 | | | | 176.2 | |
The derivative instruments are not designated as hedges for accounting purposes. Changes in fair value of the derivatives are recognized in investment gains (losses), net in our Consolidated Statements of Comprehensive Income. The changes in fair value of the derivative instruments for the years ended December 31, 2024, 2023 and 2022, are summarized as follows (in millions):
| | Year ended December 31, | |
| | 2024 | | | 2023 | | | 2022 | |
Futures and contracts for difference | | $ | (10.5 | ) | | $ | (7.0 | ) | | $ | 40.8 | |
Credit default swaps | | | (3.0 | ) | | | (6.5 | ) | | | 3.7 | |
Total return swaps | | | (9.3 | ) | | | (12.8 | ) | | | 21.3 | |
Foreign currency forward contracts | | | 6.4 | | | | 8.4 | | | | (9.6 | ) |
Total gains (losses) from derivative instruments | | $ | (16.4 | ) | | $ | (17.9 | ) | | $ | 56.2 | |
Derivative assets and liabilities are generally recognized on a gross basis and included in other current assets or in accounts payable and accrued liabilities in our Consolidated Balance Sheets. The derivative assets and liabilities as of December 31, 2024 and 2023, are summarized as follows (in millions):
| | | Fair value | |
| | December 31, 2024 | | | December 31, 2023 | |
Derivative assets | | $ | 8.8 | | | $ | 1.8 | |
Derivative liabilities | | | 8.5 | | | | 16.7 | |
Derivative Instruments Used in Consolidated Seeded Investment Products
Certain of our consolidated seeded investment products use derivative instruments to contribute to the achievement of defined investment objectives. These derivative instruments are classified within other current assets or in accounts payable and accrued liabilities in our Consolidated Balance Sheets. Gains and losses on these derivative instruments are classified within investment gains (losses), net in our Consolidated Statements of Comprehensive Income.
Our consolidated seeded investment products were party to the following derivative instruments as of December 31, 2024 and 2023 (in millions):
| | Notional value | |
| | December 31, 2024 | | | December 31, 2023 | |
Futures and contracts for difference | | $ | 160.5 | | | $ | 1,555.1 | |
Credit default swaps | | | 4.3 | | | | 13.2 | |
Total return swaps | | | 10.3 | | | | 0.3 | |
Interest rate swaps | | | 13.9 | | | | 2.2 | |
Foreign currency forward contracts | | | 196.6 | | | | 135.3 | |
Other | | | — | | | | 0.3 | |
As of December 31, 2024 and 2023, the derivative assets and liabilities in our Consolidated Balance Sheets were insignificant.
Derivative Instruments — Foreign Currency Hedging Program
We maintain a foreign currency hedging program to take reasonable measures to minimize the income statement effects of foreign currency remeasurement of monetary balance sheet accounts. The program uses foreign currency forward contracts and swaps to achieve its objectives, and it is considered an economic hedge for accounting purposes.
The notional value of the foreign currency forward contracts and swaps as of December 31, 2024 and 2023, is summarized as follows (in millions):
| | Notional value | |
| | December 31, 2024 | | | December 31, 2023 | |
Foreign currency forward contracts and swaps | | $ | 38.4 | | | $ | 65.3 | |
The derivative assets and liabilities are generally recognized on a gross basis and included in other current assets or in accounts payable and accrued liabilities in our Consolidated Balance Sheets. As of December 31, 2024 and 2023, the derivative assets and liabilities in our Consolidated Balance Sheets were insignificant.
Changes in fair value of the derivatives are recognized in other non-operating income (expense), net in our Consolidated Statements of Comprehensive Income. Foreign currency remeasurement is also recognized in other non-operating income (expense), net in our Consolidated Statements of Comprehensive Income. For the years ended December 31, 2024, 2023 and 2022, the change in fair value of the foreign currency forward contracts and swaps was insignificant.
Note 7 — Property, Equipment and Software
The following table presents depreciation expense for the years ended December 31, 2024, 2023 and 2022 (in millions):
| | Year ended December 31, | |
| | 2024 | | | 2023 | | | 2022 | |
Depreciation expense | | $ | 17.4 | | | $ | 18.4 | | | $ | 21.6 | |
Property, equipment and software as of December 31, 2024 and 2023, are summarized as follows (in millions):
| | Depreciation | | December 31, | |
| | period | | 2024 | | | 2023 | |
Furniture, fixtures and computer equipment | | 3 - 5 years | | $ | 53.0 | | | $ | 50.1 | |
Leasehold improvements | | Over the shorter of the useful life or the lease term | | | 53.7 | | | | 47.7 | |
Computer software | | 3 years | | | 95.2 | | | | 103.3 | |
Property, equipment and software, gross | | | | $ | 201.9 | | | $ | 201.1 | |
Accumulated depreciation | | | | | (162.5 | ) | | | (156.9 | ) |
Property, equipment and software, net | | | | $ | 39.4 | | | $ | 44.2 | |
Note 8 — Goodwill and Intangible Assets
The following tables present movements in our intangible assets and goodwill during years ended December 31, 2024 and 2023 (in millions):
| | | | | | | | | | | | Foreign | | | | | |
| | | December 31, | | | | | | | | | | | currency | | | December 31, | |
| | 2023 | | | Amortization | | | Additions | | | translation | | | 2024 | |
Indefinite-lived intangible assets: | | | | | | | | | | | | | | | |
Investment management agreements | | $ | 2,064.8 | | | $ | — | | | $ | — | | | $ | (8.3 | ) | | $ | 2,056.5 | |
Trademarks | | | 360.0 | | | | — | | | | — | | | | — | | | | 360.0 | |
Definite-lived intangible assets: | | | | | | | | | | | | | | | |
Client relationships | | | 68.6 | | | | — | | | | 20.5 | | | | (3.0 | ) | | | 86.1 | |
Investment management agreements | | | — | | | | — | | | | 28.0 | | | | — | | | | 28.0 | |
Trademarks | | | — | | | | — | | | | 5.5 | | | | — | | | | 5.5 | |
Accumulated amortization | | | (62.1 | ) | | | (3.1 | ) | | | — | | | | 2.4 | | | | (62.8 | ) |
Net intangible assets | | $ | 2,431.3 | | | $ | (3.1 | ) | | $ | 54.0 | | | $ | (8.9 | ) | | $ | 2,473.3 | |
| | | | | | | | | | | | | | | | | | | | | |
Goodwill | | $ | 1,290.3 | | | $ | — | | | $ | 276.6 | | | $ | (16.5 | ) | | $ | 1,550.4 | |
| | | | | | | | | | | | Foreign | | | | | |
| | | December 31, | | | | | | | | | | | currency | | | December 31, | |
| | 2022 | | | Amortization | | | Disposal | | | translation | | | 2023 | |
Indefinite-lived intangible assets: | | | | | | | | | | | | | | | |
Investment management agreements | | $ | 2,046.5 | | | $ | — | | | $ | — | | | $ | 18.3 | | | $ | 2,064.8 | |
Trademarks | | | 360.0 | | | | — | | | | — | | | | — | | | | 360.0 | |
Definite-lived intangible assets: | | | | | | | | | | | | | | | |
Client relationships | | | 68.9 | | | | — | | | | (2.6 | ) | | | 2.3 | | | | 68.6 | |
Accumulated amortization | | | (60.7 | ) | | | (1.7 | ) | | | 2.6 | | | | (2.3 | ) | | | (62.1 | ) |
Net intangible assets | | $ | 2,414.7 | | | $ | (1.7 | ) | | $ | — | | | $ | 18.3 | | | $ | 2,431.3 | |
| | | | | | | | | | | | | | | | | | | | | |
Goodwill | | $ | 1,253.1 | | | $ | — | | | $ | — | | | $ | 37.2 | | | $ | 1,290.3 | |
Indefinite-lived intangible assets represent certain investment management contracts where we expect both the renewal of the contracts and the cash flows generated by them to continue indefinitely. Indefinite-lived trademarks relate to the Janus brand, which was acquired as a result of the Merger and subsequently rebranded as Janus Henderson.
Definite-lived intangible assets represent client relationships, investment management contracts and trademarks, which are amortized over their estimated lives using the straight-line method. Definite-lived trademarks were acquired as a result of the 2024 acquisition of VPC. The remaining estimated weighted-average useful life of definite-lived client relationships, investment management contracts and trademarks is 6.5 years.
Foreign currency translation movements in the table primarily relate to the translation of the intangible assets and goodwill balances denominated in non-USD currencies to our functional and presentational currency of USD using the closing foreign currency exchange rate at the end of each reporting period.
Impairment Assessment
Goodwill and indefinite-lived intangible assets are reviewed for impairment annually or more frequently if changes in circumstances indicate that the carrying value may be impaired. We perform our annual impairment assessment of goodwill and indefinite-lived intangible assets as of October 1 of each year by performing a qualitative impairment (step 0) test to determine if it is necessary to perform a quantitative impairment test. To assess our goodwill balance, our qualitative impairment test is inclusive of consideration of macroeconomic conditions along with performing a quantitative calculation, to estimate the enterprise value of the reporting unit, under a market value approach, and compared it to the carrying value of the reporting unit. The results of the assessment revealed it is more likely than not that the fair value estimate of the reporting unit was greater than the carrying value. The most significant inputs into the estimated enterprise value were our stock price and an assumed control premium, which required significant judgment.
We also assessed our indefinite-lived intangible assets as part of our annual impairment assessment. We used a qualitative approach to determine the likelihood of impairment, with AUM being the focus of the assessment. The results of the indefinite-lived intangible assessment revealed it is more likely than not that the fair values of our intangible assets exceeded their carrying values; no impairment was recorded.
Our definite-lived intangible assets are tested for impairment whenever events or changes in circumstances indicate that the carrying amount may not be recoverable. There were no events or changes in circumstances that would have a triggered an assessment of the definite-lived intangibles assets.
Future Amortization
Expected future amortization expense related to definite-lived intangible assets is summarized below (in millions):
Future amortization: | | Amount | |
2025 | | $ | 11.1 | |
2026 | | | 11.1 | |
2027 | | | 11.1 | |
2028 | | | 8.9 | |
2029 | | | 2.6 | |
Thereafter | | | 12.0 | |
Total | | $ | 56.8 | |
Note 9 — Leases
Our leases include operating and finance leases for property and equipment. Property leases include office space in the UK, Europe, the U.S. and the Asia Pacific region. Equipment leases include copiers and server equipment located throughout our office space and off-site. Our leases have remaining lease terms of one year to nine years. Certain leases include options to extend or early terminate the leases; however, we currently have not exercised these options, and they are not reflected in our lease assets and liabilities. The impact of operating and financing leases on our financial statements is summarized below.
Balance Sheet
Operating lease assets and liabilities in our Consolidated Balance Sheets as of December 31, 2024 and 2023, consisted of the following (in millions)(1):
| | | December 31, | |
| | | 2024 | | | 2023 | |
Operating lease ROU assets: | | | | | | |
Other non-current assets | | $ | 84.1 | | | $ | 69.5 | |
| | | | | | |
Operating lease liabilities: | | | | | | |
Accounts payable and accrued liabilities | | $ | 16.5 | | | $ | 23.0 | |
Other non-current liabilities | | | 74.9 | | | | 54.8 | |
Total operating lease liabilities | | $ | 91.4 | | | $ | 77.8 | |
(1) | As of December 31, 2024 and 2023, financing lease assets and liabilities were insignificant. |
Statement of Comprehensive Income
The components of lease expense in our Consolidated Statements of Comprehensive Income during the years ended December 31, 2024, 2023 and 2022, are summarized below (in millions)(1):
| | Year ended December 31, | |
| | 2024 | | | 2023 | | | 2022 | |
Operating lease cost(2) | | $ | 19.9 | | | $ | 22.6 | | | $ | 27.5 | |
(1) | For the years ended December 31, 2024, 2023 and 2022, finance lease costs were insignificant. |
(2) | Included in general, administrative and occupancy in our Consolidated Statements of Comprehensive Income. |
We sublease certain office buildings in the UK. For the years ended December 31, 2024, 2023 and 2022, sublease income received from tenants was insignificant.
For the years ended December 31, 2024, 2023 and 2022, the impairment of subleased ROU operating assets was insignificant.
Supplemental Information
Cash payments for operating leases included in our Consolidated Statements of Cash Flows for the years ended December 31, 2024, 2023 and 2022, consisted of the following (in millions):
| | Year ended December 31, | |
| | 2024 | | | 2023 | | | 2022 | |
Operating cash flows from operating leases | | $ | 27.7 | | | $ | 29.4 | | | $ | 26.9 | |
For the years ended December 31, 2024, 2023 and 2022, financing cash flows from finance leases were insignificant.
Supplemental non-cash lease information, which includes changes in ROU assets related to modified operating lease liabilities, was insignificant for the years ended December 31, 2024, 2023 and 2022.
The weighted-average remaining lease term, weighted-average discount rate and future lease obligations are summarized below.
| | As of December 31, | |
Weighted-average remaining lease term (in months): | | 2024 | | | 2023 | |
Operating leases | | | 63 | | | | 51 | |
Finance leases | | | 39 | | | | 37 | |
| | As of December 31, | |
Weighted-average discount rate(1): | | 2024 | | | 2023 | |
Operating leases | | | 4.3 | % | | | 2.5 | % |
Finance leases | | | 5.3 | % | | | 4.0 | % |
(1) | Discounted using incremental borrowing rates determined for each lease as of the date of adoption, including consideration for specific interest rate environments. |
Future lease obligations (in millions)(1): | | Operating leases | |
2025 | | $ | 17.9 | |
2026 | | 19.3 | |
2027 | | | 18.7 | |
2028 | | 19.7 | |
2029 | | | 10.5 | |
Thereafter | | | 19.8 | |
Total lease payments | | | 105.9 | |
Less interest | | | 14.5 | |
Total | | $ | 91.4 | |
| (1) | Future lease obligations for finance leases were insignificant as of December 31, 2024. |
Note 10 — Fair Value Measurements
The following table presents assets and liabilities in our consolidated financial statements or disclosed in the notes to our consolidated financial statements at fair value on a recurring basis as of December 31, 2024 (in millions):
| | Fair value measurements using: | | | | | | | | |
| | Quoted prices | | | | | | | | | | | | | | |
| | in active | | | Significant | | | | | | | | | | | |
| | | markets for | | | other | | | Significant | | | Investments | | | | | |
| | identical assets | | | observable | | | unobservable | | | valued at | | | | | |
| | and liabilities | | | inputs | | | inputs | | | practical | | | | | |
| | (Level 1) | | | (Level 2) | | | (Level 3) | | | expedient(1) | | | Total | |
Assets: | | | | | | | | | | | | | | | | |
Cash equivalents | | $ | 821.7 | | | $ | — | | | $ | — | | | $ | — | | | $ | 821.7 | |
Current investments: | | | | | | | | | | | | | | | | |
Consolidated VIEs | | | 260.6 | | | | 241.5 | | | | — | | | | — | | | | 502.1 | |
Other investments | | | 273.8 | | | | 33.7 | | | | 2.0 | | | | 27.6 | | | | 337.1 | |
Total current investments | | | 534.4 | | | | 275.2 | | | | 2.0 | | | | 27.6 | | | | 839.2 | |
Other | | | — | | | | 10.2 | | | | 2.5 | | | | — | | | | 12.7 | |
Total assets | | $ | 1,356.1 | | | $ | 285.4 | | | $ | 4.5 | | | $ | 27.6 | | | $ | 1,673.6 | |
Liabilities: | | | | | | | | | | | | | | | | |
Long-term debt(2) | | $ | — | | | $ | 383.3 | | | $ | — | | | $ | — | | | $ | 383.3 | |
Deferred bonuses | | | — | | | | — | | | | 115.7 | | | | — | | | | 115.7 | |
Contingent consideration | | | — | | | | — | | | | 30.4 | | | | — | | | | 30.4 | |
Other | | | 1.9 | | | | 11.7 | | | | — | | | | — | | | | 13.6 | |
Total liabilities | | $ | 1.9 | | | $ | 395.0 | | | $ | 146.1 | | | $ | — | | | $ | 543.0 | |
| (1) | Certain seeded investment products that do not have a readily determinable fair value have been measured at fair value using the NAV as a practical expedient and have not been categorized in the fair value hierarchy. |
(2) | Carried at amortized cost in our Consolidated Balance Sheets and disclosed in this table at fair value. |
The following table presents assets and liabilities in our consolidated financial statements or disclosed in the notes to the consolidated financial statements at fair value on a recurring basis as of December 31, 2023 (in millions):
| | Fair value measurements using: | | | | |
| | Quoted prices | | | | | | | | | | |
| | in active | | | Significant | | | | | | | |
| | | markets for | | | other | | | Significant | | | | | |
| | identical assets | | | observable | | | unobservable | | | | |
| | and liabilities | | | inputs | | | inputs | | | | |
| | (Level 1) | | | (Level 2) | | | (Level 3) | | | Total | |
Assets: | | | | | | | | | | | | |
Cash equivalents | | $ | 894.4 | | | $ | — | | | $ | — | | | $ | 894.4 | |
Current investments: | | | | | | | | | | | | |
Consolidated VIEs | | | 317.6 | | | | 64.7 | | | | 0.1 | | | | 382.4 | |
Other investments | | | 212.2 | | | | 122.0 | | | | — | | | | 334.2 | |
Total current investments | | | 529.8 | | | | 186.7 | | | | 0.1 | | | | 716.6 | |
Other | | | — | | | | 8.5 | | | | 1.0 | | | | 9.5 | |
Total assets | | $ | 1,424.2 | | | $ | 195.2 | | | $ | 1.1 | | | $ | 1,620.5 | |
Liabilities: | | | | | | | | | | | | |
Long-term debt(1) | | $ | — | | | $ | 298.0 | | | $ | — | | | $ | 298.0 | |
Deferred bonuses | | | — | | | | — | | | | 117.6 | | | | 117.6 | |
Other | | | 1.7 | | | | 18.6 | | | | — | | | | 20.3 | |
Total liabilities | | $ | 1.7 | | | $ | 316.6 | | | $ | 117.6 | | | $ | 435.9 | |
(1) | Carried at amortized cost in our Consolidated Balance Sheets and disclosed in this table at fair value. |
Level 1 Fair Value Measurements
Our Level 1 fair value measurements consist mostly of investments held by consolidated and unconsolidated seeded investment products and cash equivalents with quoted market prices in active markets. The fair value level of consolidated investments held by seeded investment products is determined by the underlying securities of the product. The fair value level of unconsolidated investments held in seeded investment products is determined by the NAV, which is considered a quoted price in an active market.
Level 2 Fair Value Measurements
Our Level 2 fair value measurements consist mostly of investments held by consolidated investment products and our long-term debt. The fair value level of consolidated investments held by seeded investment products is determined by the underlying securities of the product. The fair value level of our long-term debt is determined using recent trading activity, which is considered a Level 2 input.
Level 3 Fair Value Measurements
Investments
As of December 31, 2024 and 2023, certain investments within consolidated VIEs and VREs were valued using significant unobservable inputs, resulting in Level 3 classification.
Deferred Bonuses
Deferred bonuses represent liabilities to employees over the vesting period that will be settled by investments in our products or cash. Upon vesting, employees receive the value of the investment product selected by the participant, adjusted for gains or losses attributable to the product. The significant unobservable inputs used to value the liabilities are investment designations and vesting periods.
Changes in Fair Value
Changes in fair value of our Level 3 assets for the years ended December 31, 2024 and 2023, were as follows (in millions):
| | Year ended December 31, | |
| | 2024 | | | 2023 | |
Beginning of period fair value | | $ | 1.1 | | | $ | 18.3 | |
Settlement of contingent consideration | | | — | | | | (0.2 | ) |
Fair value adjustments | | | 1.4 | | | | (12.1 | ) |
Transfers from (to) Level 1, net | | | — | | | | (4.6 | ) |
Purchases (sales) of securities, net | | | 2.0 | | | | (0.3 | ) |
End of period fair value | | $ | 4.5 | | | $ | 1.1 | |
Changes in fair value of our Level 3 liabilities for the years ended December 31, 2024 and 2023, were as follows (in millions):
| | Year ended December 31, | |
| | 2024 | | | 2023 | |
Beginning of period fair value | | $ | 117.6 | | | $ | 46.5 | |
Fair value adjustments | | | 13.1 | | | | 9.0 | |
Settlement of contingent consideration | | | (0.3 | ) | | | — | |
Vesting of deferred bonuses | | | (85.7 | ) | | | (34.7 | ) |
Amortization of deferred bonuses | | | 70.8 | | | | 58.6 | |
Foreign currency translation | | | 0.4 | | | | 2.4 | |
Additions | | | 30.2 | | | | 35.8 | |
End of period fair value | | $ | 146.1 | | | $ | 117.6 | |
Nonrecurring Fair Value Measurements
Nonrecurring Level 3 fair value measurements include goodwill and intangible assets and contingent consideration liabilities. We measure the fair value of goodwill and intangible assets on initial recognition based on the present value of estimated future cash flows. Significant assumptions used to determine estimated fair value include AUM, investment management fee rates, discount rates, and expenses. Refer to Note 8 — Goodwill and Intangible Assets, in Part II, Item 8, Financial Statements and Supplementary Data, for additional information on the impairment assessments. We measure the fair value of the contingent consideration liabilities on initial recognition using the Monte Carlo method that requires assumptions regarding projected future earnings and discount rate. Because of the significance of the unobservable inputs in the fair value measurements of these assets and liabilities, such measurements are classified as Level 3.
Investments Valued at Practical Expedient
As a practical expedient to value certain investments that do not have a readily determinable fair value and have attributes of an investment, we use the NAV as the fair value. As such, investments in private investment funds with a fair value of $27.6 million are excluded from the fair value hierarchy as of December 31, 2024. Further, the respective fund’s investment portfolio may contain debt investments that are in the form of revolving lines of credit and unfunded delayed draw commitments, which require the fund to provide funding when requested by portfolio companies in accordance with the terms of the underlying loan agreements. As of December 31, 2024, the investments valued at the practical expedient had $12.7 million of associated unfunded commitments.
Note 11 — Debt
Our debt as of December 31, 2024 and 2023, consisted of the following (in millions):
| | Carrying Value | |
| | December 31, 2024 | | | December 31, 2023 | |
4.875% Senior Notes due 2025 | | $ | — | | | $ | 304.6 | |
5.450% Senior Notes due 2034 | | | 395.0 | | | | - | |
5.450% Senior Notes Due 2034
On September 10, 2024, JHG's wholly-owned subsidiary, Janus Henderson US (Holdings) Inc., completed a private placement of $400.0 million aggregate principal amount of 2034 Senior Notes. The 2034 Senior Notes have a principal amount of $400.0 million as of December 31, 2024, pay interest at 5.450% semiannually on March 10 and September 10 of each year, and mature on September 10, 2034. The 2034 Senior Notes include unamortized debt discount and issuance costs of $5.0 million at December 31, 2024, which will be accreted over the remaining life of the notes. The unamortized debt discount and issuance costs are recorded as a non-current contra liability in long-term debt on our Consolidated Balance Sheets.
4.875% Senior Notes Due 2025
JHG's wholly-owned subsidiary, Janus Henderson US (Holdings) Inc., redeemed its 2025 Senior Notes on November 7, 2024, at the redemption price as outlined in the Fifth Supplemental Indenture, dated May 30, 2017. The notice of redemption was issued to the holders of the 2025 Senior Notes, and the $300.0 million outstanding principal balance and accrued but unpaid interest through the redemption date was settled with existing cash on hand from our balance sheet.
Credit Facility
On June 30, 2023, we entered into a $200 million, unsecured, revolving Credit Facility. The Credit Facility includes an option for us to request an increase to our borrowing capacity under the Credit Facility of up to an additional $50.0 million. The Credit Facility had a maturity date of June 30, 2028, with two one-year extension options that can be exercised at the discretion of JHG with the lender’s consent on the first and second anniversary of the date of the agreement. We exercised the option to extend the term of the Credit Facility on the first anniversary of the agreement. The revised maturity date of the Credit Facility is June 30, 2029. JHG and its subsidiaries may use the Credit Facility for general corporate purposes. The rate of interest for each interest period is the aggregate of the applicable margin, which is based on our long-term credit rating and the Secured Overnight Financing Rate (“SOFR”) in relation to any loan in USD, the Sterling Overnight Index Average (“SONIA”) in relation to any loan in GBP, the Euro Interbank Offered Rate (“EURIBOR”) in relation to any loan in EUR or the Bank Bill Swap Rate (“BBSW”) in relation to any loan in AUD. We are also required to pay a quarterly commitment fee on any unused portion of the Credit Facility, which is based on our long-term credit rating. If our credit rating falls below a certain threshold, as defined in the Credit Facility, our financing leverage ratio, cannot exceed 3.00x EBITDA. At December 31, 2024, we were in compliance with all covenants contained in, and there were no borrowings under, the Credit Facility.
Note 12 — Income Taxes
The components of our provision for income taxes for the years ended December 31, 2024, 2023 and 2022, are as follows (in millions):
| | Year ended December 31, | |
| | 2024 | | | 2023 | | | 2022 | |
Current income taxes: | | | | | | | | | |
UK | | $ | 14.3 | | | $ | 15.2 | | | $ | 10.5 | |
U.S., including state and local | | | 143.2 | | | | 88.1 | | | | 95.9 | |
International | | | 6.4 | | | | 3.0 | | | | 8.8 | |
Total current income taxes | | | 163.9 | | | | 106.3 | | | | 115.2 | |
Deferred income taxes: | | | | | | | | | |
UK | | | 2.2 | | | | (4.0 | ) | | | (10.3 | ) |
U.S., including state and local | | | 1.0 | | | | (2.0 | ) | | | 10.0 | |
International | | | (0.8 | ) | | | — | | | | (14.0 | ) |
Total deferred income benefits | | | 2.4 | | | | (6.0 | ) | | | (14.3 | ) |
Total income tax expense | | $ | 166.3 | | | $ | 100.3 | | | $ | 100.9 | |
The components of our total income before taxes for the years ended December 31, 2024, 2023 and 2022, are as follows (in millions):
| | Year ended December 31, | |
| | 2024 | | | 2023 | | | 2022 | |
UK | | $ | 57.4 | | | $ | 86.4 | | | $ | (44.1 | ) |
U.S. | | | 595.6 | | | | 423.4 | | | | 428.7 | |
International | | | (41.1 | ) | | | 17.2 | | | | (9.2 | ) |
Total income before taxes | | $ | 611.9 | | | $ | 527.0 | | | $ | 375.4 | |
We are a tax resident in the UK and a reconciliation is required from the UK statutory rate to the effective tax rate. The following is a reconciliation between the UK statutory corporation tax rate and the effective tax rate on our income from operations for the years ended December 31, 2024, 2023 and 2022:
| | Year ended December 31, | |
| | 2024 | | | 2023 | | | 2022 | |
UK statutory corporation tax rate | | | 25.0 | % | | | 23.5 | % | | | 19.0 | % |
Effect of foreign tax rates | | | (1.7 | ) | | | 0.1 | | | | 6.3 | |
Equity-based compensation | | | 0.4 | | | | 0.3 | | | | 0.7 | |
Tax adjustments | | | 0.9 | | | | 0.5 | | | | 2.0 | |
Impact of changes in statutory tax rates on deferred taxes | | | — | | | | (1.9 | ) | | | (1.3 | ) |
Foreign currency translation reserves reclassification | | | 5.6 | | | | 1.6 | | | | (0.3 | ) |
Taxes applicable to prior years | | | (1.2 | ) | | | (1.9 | ) | | | (4.5 | ) |
Other, net | | | (1.7 | ) | | | (3.4 | ) | | | 0.3 | |
Effective income tax rate, controlling interest | | | 27.3 | % | | | 18.8 | % | | | 22.2 | % |
Net loss (income) attributable to noncontrolling interests | | | (0.1 | ) | | | 0.2 | | | | 4.7 | |
Total effective income tax rate | | | 27.2 | % | | | 19.0 | % | | | 26.9 | % |
We operate in several tax jurisdictions around the world, each with its own statutory tax rate and set of tax laws and regulations. As a result, our future blended average statutory tax rate will be influenced by any changes to such laws and regulations and the mix of profits and losses of our subsidiaries.
Tax Legislation
Any legislative changes and new or proposed tax regulations may result in additional income tax impacts, which could be material in the period any such changes are enacted.
Deferred Taxes
The significant components of our deferred tax assets and liabilities as of December 31, 2024 and 2023, are as follows (in millions):
| | December 31, | |
| | 2024 | | | 2023 | |
Deferred tax assets: | | | | | | |
Compensation and staff benefits | | $ | 64.5 | | | $ | 59.8 | |
Loss carryforwards(1) | | | 127.6 | | | | 88.4 | |
Accrued liabilities | | | 8.0 | | | | 7.0 | |
Lease liabilities | | | 18.7 | | | | 16.8 | |
Other | | | (2.1 | ) | | | 5.3 | |
Gross deferred tax assets | | | 216.7 | | | | 177.3 | |
Valuation allowance | | | (119.4 | ) | | | (76.8 | ) |
Deferred tax assets, net of valuation allowance | | $ | 97.3 | | | $ | 100.5 | |
Deferred tax liabilities: | | | | | | |
Retirement benefits | | $ | (17.4 | ) | | $ | (21.4 | ) |
Goodwill and acquired intangible assets | | | (628.9 | ) | | | (628.6 | ) |
Lease ROU assets | | | (18.0 | ) | | | (16.2 | ) |
Other | | | (1.3 | ) | | | (3.5 | ) |
Gross deferred tax liabilities | | | (665.6 | ) | | | (669.7 | ) |
Total deferred tax liabilities(2) | | $ | (568.3 | ) | | $ | (569.2 | ) |
(1) | The majority of the 2024 loss carryforward relates to the UK capital loss of $283.4 million and U.S. capital loss of $164.0 million, before tax effects. The capital loss in the UK can be carried forward indefinitely, while the capital loss in the U.S. will begin to expire in 2029. There is a full valuation allowance against UK capital losses and a valuation allowance of $37.0 million after tax effects against U.S. capital losses. |
(2) | The change in the net deferred tax liabilities does not equal the deferred tax expense due to the foreign currency translation adjustment on deferred tax liabilities booked through equity. |
Deferred tax assets and liabilities that relate to the same jurisdiction are recorded net on our Consolidated Balance Sheets as non-current balances and as of December 31, 2024 and 2023, are as follows (in millions):
| | December 31, | |
| | 2024 | | | 2023 | |
Deferred tax assets, net (included in other non-current assets) | | $ | 1.0 | | | $ | 1.6 | |
Deferred tax liabilities, net | | | (569.3 | ) | | | (570.8 | ) |
Total deferred tax liabilities | | $ | (568.3 | ) | | $ | (569.2 | ) |
A valuation allowance has been established against the deferred tax assets related to our tax loss carryforward where a history of losses in the respective tax jurisdiction makes it unlikely that the deferred tax asset will be realized or where it is unlikely that we would generate sufficient taxable income of the appropriate character to realize the full benefit of the deferred tax asset. The valuation allowance for deferred tax assets increased by $42.6 million in 2024. The increase is primarily attributable to allowance on capital losses during the current year.
Unrecognized Tax Benefits
We operate in several tax jurisdictions and a number of years may elapse before an uncertain tax position, for which we have unrecognized tax benefits, is finally resolved. A reconciliation of the beginning and ending liability for the years ended December 31, 2024, 2023 and 2022, is as follows (in millions):
| | Year ended December 31, | |
| | 2024 | | | 2023 | | | 2022 | |
Beginning balance | | $ | 28.4 | | | $ | 26.7 | | | $ | 19.2 | |
Additions for tax positions of current year | | | 5.7 | | | | 6.9 | | | | 9.7 | |
Reduction due to settlement with taxing authorities | | | (0.8 | ) | | | (0.3 | ) | | | (1.4 | ) |
Reduction due to statute expirations | | | (4.3 | ) | | | (4.6 | ) | | | (0.5 | ) |
Total change due to true up | | | — | | | | (0.1 | ) | | | — | |
Total removed due to audit payment | | | — | | | | (0.4 | ) | | | — | |
Foreign currency translation | | | (0.1 | ) | | | 0.2 | | | | (0.3 | ) |
Ending balance | | $ | 28.9 | | | $ | 28.4 | | | $ | 26.7 | |
If the balance in the table above is recognized, the balance would favorably affect our effective tax rate in future periods.
We recognize interest and penalties on uncertain tax positions as a component of the income tax provision. At December 31, 2024, 2023 and 2022, the total accrued interest balance relating to uncertain tax positions was $7.4 million, $5.8 million and $3.9 million, respectively. Potential penalties at December 31, 2024, 2023 and 2022, were insignificant and have not been accrued.
We are subject to U.S. federal, state, and local income tax, UK income tax, and income tax in several other jurisdictions. All these can be examined by the relevant taxing authorities. Significant tax jurisdictions that remain open for examination include: U.S. federal and state tax authorities for tax years starting with 2021 and 2013, respectively and for UK tax authorities for tax years starting with 2020.
It is reasonably possible that the total amounts of unrecognized tax benefits will change within the next 12 months due to completion of tax authorities’ exams or the expiration of statutes of limitations. Management estimates that the existing liability for uncertain tax positions could decrease by approximately $7.0 million within the next 12 months, excluding changes due to foreign currency translation.
Note 13 — Other Financial Statement Captions
Other current assets on our Consolidated Balance Sheets at December 31, 2024 and 2023, are composed of the following (in millions):
| | December 31, | |
| | 2024 | | | 2023 | |
Prepaid expenses | | $ | 82.3 | | | $ | 69.9 | |
Current corporation tax | | | 7.4 | | | | 26.5 | |
Derivatives (including collateral and margin) | | | 25.6 | | | | 41.5 | |
Other current assets | | | 19.2 | | | | 36.6 | |
Total other current assets | | $ | 134.5 | | | $ | 174.5 | |
Other non-current assets on our Consolidated Balance Sheets of $190.2 million and $187.6 million as of December 31, 2024 and 2023, respectively, primarily relate to operating leases, capitalized cloud services implementation costs and equity-method investments.
Accounts payable and accrued liabilities on our Consolidated Balance Sheets at December 31, 2024 and 2023, comprise the following (in millions):
| | December 31, | |
| | 2024 | | | 2023 | |
Accrued distribution commissions | | $ | 71.2 | | | $ | 58.6 | |
Accrued rebates | | | 17.9 | | | | 17.2 | |
Other accrued liabilities | | | 62.6 | | | | 63.6 | |
Total other accrued liabilities | | $ | 151.7 | | | $ | 139.4 | |
Current corporation tax (including interest) | | 19.2 | | | | 11.9 | |
Operating and financing leases | | | 16.6 | | | | 23.1 | |
Derivatives | | | 8.6 | | | | 17.5 | |
Other current liabilities | | | 70.0 | | | | 39.5 | |
Total accounts payable and accrued liabilities | | $ | 266.1 | | | $ | 231.4 | |
Other non-current liabilities on our Consolidated Balance Sheets at December 31, 2024 and 2023, comprise the following (in millions):
| | December 31, | |
| | 2024 | | | 2023 | |
Non-current tax liabilities (including interest) | | $ | 26.9 | | | $ | 22.9 | |
Operating leases | | | 74.9 | | | | 54.8 | |
Contingent consideration | | | 29.4 | | | | — | |
Other non-current liabilities | | | 10.7 | | | | 12.0 | |
Total other non-current liabilities | | $ | 141.9 | | | $ | 89.7 | |
Other non-current liabilities include provisions for retirement obligations of leased office space and deferred compensation for certain members of the board of directors.
Other non-operating income (expense), net on our Consolidated Statements of Comprehensive Income for the years ended December 31, 2024, 2023 and 2022, comprise the following (in millions):
| | | Year ended December 31, | |
| | 2024 | | | 2023 | | | 2022 | |
Foreign currency remeasurement gains (losses) | | $ | (4.1 | ) | | $ | (2.9 | ) | | $ | 8.2 | |
Reclassification of foreign currency translation to net income | | | (138.1 | ) | | | (4.7 | ) | | | 4.1 | |
Interest income | | | 52.3 | | | | 44.7 | | | | 7.7 | |
Other | | | 3.3 | | | | (24.5 | ) | | | (8.5 | ) |
Total other non-operating income (expense), net | | $ | (86.6 | ) | | $ | 12.6 | | | $ | 11.5 | |
Note 14 — Noncontrolling Interests
Redeemable Noncontrolling Interests
Redeemable noncontrolling interests as of December 31, 2024 and 2023, consisted of the following (in millions):
| | December 31, | |
| | 2024 | | | 2023 | |
Consolidated seeded investment products | | $ | 365.0 | | | $ | 317.2 | |
Consolidated Seeded Investment Products
Noncontrolling interests in consolidated seeded investment products are classified as redeemable noncontrolling interests when there is an obligation to repurchase units at the investor’s request.
Redeemable noncontrolling interests in consolidated seeded investment products may fluctuate from period to period and are impacted by changes in our relative ownership, changes in the amount of third-party investment in seeded products and volatility in the market value of the seeded products’ underlying securities. Third-party redemption of investments in any particular seeded product is redeemed from the respective product’s net assets and cannot be redeemed from the assets of other seeded products or from our other assets.
The following table presents the movement in redeemable noncontrolling interests in consolidated seeded investment products for the years ended December 31, 2024, 2023 and 2022 (in millions):
| | Year ended December 31, | |
| | 2024 | | | 2023 | | | 2022 | |
Opening balance | | $ | 317.2 | | | $ | 233.9 | | | $ | 148.5 | |
Changes in market value | | | 37.5 | | | | 34.8 | | | | (97.9 | ) |
Changes in ownership | | | 15.8 | | | | 46.5 | | | | 184.2 | |
Foreign currency translation | | | (5.5 | ) | | | 2.0 | | | | (0.9 | ) |
Closing balance | | $ | 365.0 | | | $ | 317.2 | | | $ | 233.9 | |
Nonredeemable Noncontrolling Interests
Nonredeemable noncontrolling interests as of December 31, 2024 and 2023, consisted of the following (in millions):
| | December 31, | |
| | 2024 | | | 2023 | |
VPC | | $ | 126.5 | | | $ | — | |
Note 15 — Long-Term Incentive Compensation
We operate the following stock and mutual fund-based compensation plans:
| | ● | Deferred Incentive Plan (“DIP”); |
| | ● | Other less significant plans (includes: Restricted Share Plan (“RSP”), Deferred Equity Plan (“DEP”), Saveshare Plan (“SAYE”), Long-Term Incentive Plan (“LTIP”), Buy As You Earn Share Plan (“BAYE”), Employee Stock Purchase Plan (“ESPP”), Restricted Stock Awards (“RSAs”) and Mutual Fund Share Awards (“MFSAs”). |
Further details on the material plans in operation during 2024 are discussed below.
Deferred Incentive Plan
Starting in 2020 as part of our effort to consolidate how awards are issued, DIP awards are generally issued as part of annual variable compensation and for recruitment and retention purposes in accordance with the 2022 Deferred Incentive Plan and the Third Amended and Restated 2010 Deferred Incentive Plan. Awards are issued as stock or as mutual fund awards and generally vest over a three- or four-year period. At December 31, 2024, the cost basis of unvested mutual fund awards totaled $142.8 million. The awards are indexed to certain mutual funds managed by us. Upon vesting, participants receive the value of the award adjusted for gains or losses attributable to the mutual funds to which the award was indexed and are subject to tax withholding.
Performance Share Units (“PSUs”) are issued under the DIP and may or may not vest in whole or in part three years after the date of grant based on performance measures.
The expense of deferred short-term incentive awards is recognized in net income over the period of deferral on a graded basis, the fair value of which is determined by prevailing share price or unit price at grant date.
Compensation Expense
The components of our long-term incentive compensation expense for the years ended December 31, 2024, 2023 and 2022, are summarized as follows (in millions):
| | Year ended December 31, | |
| | 2024 | | | 2023 | | | 2022 | |
DIP | | $ | 66.4 | | | $ | 70.6 | | | $ | 84.0 | |
Other | | | 4.4 | | | | 4.3 | | | | 6.3 | |
Stock-based payments expense | | $ | 70.8 | | | $ | 74.9 | | | $ | 90.3 | |
DIP funds — liability settled | | | 84.7 | | | | 81.5 | | | | 84.7 | |
Social Security costs | | | 10.2 | | | | 9.5 | | | | 10.5 | |
Profits interests and other, net | | | 0.9 | | | | 1.5 | | | | (4.8 | ) |
Total long-term incentive compensation expense | | $ | 166.6 | | | $ | 167.4 | | | $ | 180.7 | |
Unrecognized and unearned compensation expense based on expected vesting outcomes as of December 31, 2024, including the weighted-average number of years over which the compensation cost will be recognized, is summarized as follows (in millions):
| | Unrecognized | | | Weighted-average | |
| | compensation | | | years | |
DIP | | $ | 50.8 | | | | 1.8 | |
Other | | | 2.4 | | | | 1.2 | |
Stock-based payments expense | | | 53.2 | | | | 1.8 | |
DIP funds — liability settled | | | 41.4 | | | | 1.8 | |
Social Security costs | | | 16.2 | | | | 0.7 | |
Total unrecognized long-term incentive compensation expense | | $ | 110.8 | | | | 1.6 | |
We generally grant long-term incentive awards in February in relation to annual awards but also throughout the year due to seasonality of performance fee bonuses.
Stock Options
Stock options were granted under the SAYE plan to employees in 2024, 2023 and 2022. The fair value of stock options granted were estimated on the date of each grant using the Black-Scholes option pricing model, with the following assumptions:
Black-Scholes Option Pricing Model
| | Year ended December 31, | |
| | 2024 | | | 2023 | | | 2022 | |
Fair value of options granted | | £ | 7.2 | | | £ | 6.2 | | | £ | 9.3 | |
Assumptions: | | | | | | | | | | | | |
Dividend yield | | | 4.82 | % | | | 5.89 | % | | | 4.27 | % |
Expected volatility | | | 33.95 | % | | | 45.33 | % | | | 41.82 | % |
Risk-free interest rate | | | 4.06 | % | | | 3.47 | % | | | 1.43 | % |
Expected life (years) | | | 3.2 | | | | 3.2 | | | | 3.2 | |
The table below summarizes our outstanding options, exercisable options and options vested or expected to vest for the years ended December 31, 2024, 2023 and 2022:
| | 2024 | | | 2023 | | | 2022 | |
| | | | | Weighted-average | | | | | | Weighted-average | | | | | | Weighted-average | |
| | Shares | | | price | | | Shares | | | price | | | Shares | | | price | |
Outstanding at January 1 | | | 284,954 | | | $ | 22.82 | | | | 386,584 | | | $ | 19.18 | | | | 492,889 | | | $ | 20.83 | |
Granted | | | 100,151 | | | $ | 25.29 | | | | 137,019 | | | $ | 21.67 | | | | 127,903 | | | $ | 24.83 | |
Exercised | | | (66,592 | ) | | $ | 22.30 | | | | (201,795 | ) | | $ | 14.95 | | | | (193,821 | ) | | $ | 24.34 | |
Forfeited | | | (25,118 | ) | | $ | 23.21 | | | | (36,854 | ) | | $ | 23.37 | | | | (40,387 | ) | | $ | 22.78 | |
Outstanding at December 31 | | | 293,395 | | | $ | 23.75 | | | | 284,954 | | | $ | 22.82 | | | | 386,584 | | | $ | 19.18 | |
Exercisable(1) | | | 4,823 | | | $ | 23.56 | | | | 5,954 | | | $ | 8.23 | | | | 32,710 | | | $ | 10.46 | |
Vested or expected to vest | | | 293,395 | | | $ | 23.75 | | | | 284,954 | | | $ | 22.82 | | | | 386,584 | | | $ | 19.18 | |
(1) | The number of exercisable options represents instruments for which all vesting criteria have been satisfied and whose exercise price was below the closing price of our common stock as of the end of the period. |
The following table summarizes the intrinsic value of exercised, outstanding and exercisable options at December 31, 2024, 2023 and 2022 (in millions):
| | Year ended December 31, | |
| | 2024 | | | 2023 | | | 2022 | |
Exercised | | $ | 0.9 | | | $ | 2.4 | | | $ | 1.3 | |
Outstanding | | $ | 5.8 | | | $ | 2.3 | | | $ | 2.4 | |
Exercisable | | $ | 0.1 | | | $ | 0.1 | | | $ | 0.5 | |
Deferred Incentive Plan, Deferred Equity Plan and Restricted Stock Awards
The table below summarizes unvested DIP, DEP and RSA, excluding PSUs detailed separately, for the years ended December 31, 2024, 2023 and 2022:
| | 2024 | | | 2023 | | | 2022 | |
| | | | | Weighted-average | | | | | | Weighted-average | | | | | | Weighted-average | |
| | Shares | | | price | | | Shares | | | price | | | Shares | | | price | |
Unvested at January 1 | | | 4,884,487 | | | $ | 29.86 | | | | 5,641,839 | | | $ | 29.99 | | | | 4,949,927 | | | $ | 26.42 | |
Granted | | | 1,996,676 | | | $ | 32.48 | | | | 2,141,254 | | | $ | 27.08 | | | | 3,581,420 | | | $ | 32.44 | |
Vested | | | (2,647,424 | ) | | $ | 30.25 | | | | (2,669,197 | ) | | $ | 27.93 | | | | (2,733,825 | ) | | $ | 26.29 | |
Forfeited | | | (136,067 | ) | | $ | 30.96 | | | | (229,409 | ) | | $ | 29.70 | | | | (155,683 | ) | | $ | 31.48 | |
Unvested at December 31 | | | 4,097,672 | | | $ | 30.85 | | | | 4,884,487 | | | $ | 29.86 | | | | 5,641,839 | | | $ | 29.99 | |
Performance Share Units
The table below summarizes unvested PSUs granted to our CEO, Executive Committee members and select other employees for the years ended December 31, 2024, 2023 and 2022(1):
| | 2024 | | | 2023 | | | 2022 | |
| | | | | Weighted-average | | | | | | Weighted-average | | | | | | Weighted-average | |
| | Shares | | | price | | | Shares | | | price | | | Shares | | | price | |
Unvested at January 1 | | | 276,537 | | | $ | 27.44 | | | | 50,900 | | | $ | 29.38 | | | | 258,024 | | | $ | 24.31 | |
Granted | | | 247,624 | | | $ | 32.12 | | | | 333,389 | | | $ | 27.44 | | | | - | | | $ | - | |
Adjustment to shares granted due to performance measures | | | - | | | $ | - | | | | - | | | $ | - | | | | 39,837 | | | $ | 24.55 | |
Vested | | | - | | | $ | - | | | | (50,900 | ) | | $ | 29.38 | | | | (246,961 | ) | | $ | 22.28 | |
Forfeited | | | (8,441 | ) | | $ | 31.10 | | | | (56,852 | ) | | $ | 27.44 | | | | - | | | $ | - | |
Unvested at December 31 | | | 515,720 | | | $ | 29.63 | | | | 276,537 | | | $ | 27.44 | | | | 50,900 | | | $ | 29.38 | |
(1) | PSUs granted in 2023 and 2024 generally may or may not vest in whole or in part three years after the date of grant, based on JHG annual net new revenue and adjusted operating margin for final grant year, and in 2024, our three-year Total Shareholder Return (“TSR”) performance relative to a peer group. Vesting of the PSUs issued prior to 2023 was subject to our three-year TSR performance relative to a peer group over a three-year period following the grant date. Performance related to shares vesting in 2022 and 2023 was determined as of June 30, 2022. |
Note 16 — Retirement Benefit Plans
Defined Contribution Plans
We operate two main separate defined contribution retirement benefit plans: a 401(k) plan for U.S. employees and a separate plan for the majority of our international employees.
Substantially all of our U.S. full-time employees are eligible to participate in our 401(k) plan. During the year ended December 31, 2024, we matched 5.0% of employee-eligible compensation in our 401(k) plan. In addition, we offered an additional 1% one-time retrospective 401(k) match to all eligible employees as of December 31, 2024. Effective January 1, 2025, the 401(k) plan match will be 6% of employee-eligible compensation.
Expenses related to our 401(k) plan are included in employee compensation and benefits on our Consolidated Statements of Comprehensive Income and were $10.1 million, $8.1 million and $8.6 million during the years ended December 31, 2024, 2023 and 2022, respectively. The assets of the plan are held in trustee-administered funds separately from our assets.
Substantially all of our non-U.S. full-time employees are eligible to participate in our defined contribution plans. The total amounts included in our Consolidated Statements of Comprehensive Income for the years ended December 31, 2024, 2023 and 2022, in respect to our non-U.S. defined contribution plan were $17.3 million, $14.0 million and $15.7 million, respectively, which represents contributions paid or payable to this plan by us.
Defined Benefit Plans
The main defined benefit pension plan sponsored by us is the defined benefit section of the JHGPS, previously the Henderson Group Pension Scheme, which closed to new members on November 15, 1999. The JHGPS is funded by contributions to a separately administered fund.
Benefits in the defined benefit section of the JHGPS are based on service and final salary. The plan is approved by His Majesty’s Revenue and Customs (“HMRC”) for tax purposes and is operated separately from the Company and managed by an independent trustee board. The trustee is responsible for payment of the benefits and management of the JHGPS assets. We also have a contractual obligation to provide certain members of the JHGPS with additional defined benefits on an unfunded basis.
The JHGPS is subject to UK regulations, which require us and the trustee to agree to a funding strategy and contribution schedule for the scheme.
Our latest triennial valuation of the JHGPS resulted in a surplus on a technical provisions basis of $2.4 million.
Plan Assets and Benefit Obligations
The Plan assets and defined benefit obligations of the JHGPS, including money purchase benefits subject to a reference scheme test, and the unapproved pension plan were valued as of December 31, 2024 and 2023. Our plan assets, benefit obligations and funded status as of the December 31 measurement date were as follows (in millions):
| | 2024 | | | 2023 | |
Change in plan assets: | | | | | | | | |
Fair value of plan assets as of January 1 | | $ | 696.4 | | | $ | 660.5 | |
Return on plan assets | | | (32.9 | ) | | | 15.2 | |
Employer contributions | | | 2.4 | | | | 2.2 | |
Benefits paid | | | (19.5 | ) | | | (17.9 | ) |
Settlements | | | (9.6 | ) | | | (3.2 | ) |
Foreign currency translation | | | (11.7 | ) | | | 39.6 | |
Fair value of plan assets as of December 31 | | | 625.1 | | | | 696.4 | |
Change in benefit obligation: | | | | | | | | |
Benefit obligation as of January 1 | | | (611.1 | ) | | | (565.6 | ) |
Interest cost | | | (27.2 | ) | | | (27.6 | ) |
Settlements | | | 9.6 | | | | 3.2 | |
Benefits paid | | 19.5 | | | | 17.9 | |
Actuarial gain/(loss) | | | 42.1 | | | | (5.1 | ) |
Foreign currency translation | | | 10.3 | | | | (33.9 | ) |
Benefit obligation as of December 31 | | | (556.8 | ) | | | (611.1 | ) |
Funded status as of year-end | | | 68.3 | | | | 85.3 | |
Net retirement benefit asset recognized in the Consolidated Balance Sheets | | $ | 68.3 | | | $ | 85.3 | |
Actuarial gains on the obligations during the year ended December 31, 2024, were primarily due to changes in financial assumptions over the year, including an increase in the discount rate resulting from higher bond yields, leading to a decrease in the benefit obligation. These gains were partially offset by decreases in the asset value, also resulting from higher bond yields, leading to a decrease in the fair value of the assets. During the year ended December 31, 2024, $9.6 million was paid to members transferring their benefits out of the scheme, reducing the benefit obligation.
The JHGPS contains a money purchase section (“MPS”) that operates in a similar way to a defined contribution plan, but also provides for a minimum benefit to members of the JHGPS if the investment performance of their MPS investments falls below defined thresholds. The minimum benefit is referred to as a reference scheme test (“RST”) underpin. The RST underpin serves as a defined benefit guarantee in the case that investment returns of the MPS do not meet statutorily defined returns. As the MPS is providing a defined benefit in the form of the RST underpin, disclosure of the related plan assets and liabilities are made on a gross basis, similar to that of a defined benefit plan, and are included in the plan assets and benefit obligations of the retirement benefit asset.
Amounts recognized on our Consolidated Balance Sheets, net of tax at source, as of December 31, 2024 and 2023, consist of the following (in millions):
| | December 31, | |
| | 2024 | | | 2023 | |
Retirement benefit assets recognized in the Consolidated Balance Sheets: | | | | | | | | |
Janus Henderson Group UK Pension Scheme | | $ | 70.3 | | | $ | 87.6 | |
Retirement benefit obligations recognized in the Consolidated Balance Sheets: | | | | | | |
Janus Henderson Group unapproved pension scheme | | | (2.0 | ) | | | (2.3 | ) |
Net retirement benefit asset recognized in the Consolidated Balance Sheets | | $ | 68.3 | | | $ | 85.3 | |
We used the following key assumptions in determining the defined benefit obligation as of December 31, 2024 and 2023:
| | December 31, | |
| | 2024 | | | 2023 | |
Discount rate | | | 5.5 | % | | | 4.5 | % |
Inflation — Retail Price Index (“RPI”) | | | 3.2 | % | | | 3.1 | % |
Inflation — Consumer Price Index (“CPI”) | | | 2.5 | % | | | 2.5 | % |
Pension increases (RPI capped at 5% per annum (“p.a.”)) | | | 3.1 | % | | | 3.0 | % |
Pension increases (RPI capped at 2.5% p.a.) | | | 2.1 | % | | | 2.1 | % |
Life expectancy of male aged 60 at accounting date | | | 29.0 | | | | 29.1 | |
Life expectancy of male aged 60 in 15 years’ time | | | 30.0 | | | | 30.1 | |
The discount rate applied to the plan obligations is based on AA-rated corporate bond yields with similar maturities.
The Company is aware of a court decision in the UK regarding the validity of certain historical modifications to pension scheme rules, including with regard to benefits. More specifically, the judgment voided certain benefit modifications and the original benefits were reinstated, resulting in increased liabilities for the scheme and ultimately for the sponsoring employer. Although the Company was not party to this litigation, the UK court’s decision may have a material impact to other UK pension schemes, including our UK pension scheme. The impact, if any, that this litigation may have on our UK pension scheme is unknown at this time.
Plan Assets
The fair values of the JHGPS plan assets as of December 31, 2024 and 2023, by major asset class are as follows (in millions):
| | December 31, | |
| | 2024 | | | 2023 | |
Cash and cash equivalents | | $ | 2.9 | | | $ | 19.9 | |
Money market instruments | | | 7.1 | | | | 7.8 | |
Bulk annuity policy | | | 217.7 | | | | 240.7 | |
Fixed income investments | | | 269.0 | | | | 300.6 | |
Equity investments | | | 128.4 | | | | 127.4 | |
Total assets at fair value | | $ | 625.1 | | | $ | 696.4 | |
As of December 31, 2024 and 2023, $93.9 million and $103.4 million, respectively, of JHGPS assets were held in JHG-managed funds.
The bulk annuity contract represents an agreement that provides JHGPS a monthly contractual payment stream to satisfy pension obligations payable to certain plan participants. The agreement does not relieve JHGPS or JHG (as plan sponsor) of the primary responsibility for the pension obligations.
The remaining assets of the JHGPS plan are allocated to a portfolio of fixed income assets. This portfolio aims to broadly match movements in the value of liabilities caused by changes in interest rates and inflation. Excluding the bulk annuity policy, the strategic asset allocation as of December 31, 2024 and 2023, was 100% fixed income.
The following table presents JHGPS plan assets at fair value on a recurring basis as of December 31, 2024 (in millions):
| | Fair value measurements using: | | | | |
| | Quoted prices in | | | Significant | | | | | | | |
| | active markets for | | | other | | | Significant | | | | |
| | identical assets | | | observable | | | unobservable | | | | |
| | and liabilities | | | inputs | | | inputs | | | | |
| | (Level 1) | | | (Level 2) | | | (Level 3) | | | Total | |
Cash and cash equivalents | | $ | 2.9 | | | $ | — | | | $ | — | | | $ | 2.9 | |
Money market instruments | | | 7.1 | | | | — | | | | — | | | | 7.1 | |
Bulk annuity contract | | | — | | | | — | | | | 217.7 | | | | 217.7 | |
Fixed income investments | | | 269.0 | | | | — | | | | — | | | | 269.0 | |
Equity investments | | | 128.4 | | | | — | | | | — | | | | 128.4 | |
Total | | $ | 407.4 | | | $ | — | | | $ | 217.7 | | | $ | 625.1 | |
The following table presents JHGPS plan assets at fair value on a recurring basis as of December 31, 2023 (in millions):
| | Fair value measurements using: | | | | |
| | Quoted prices in | | | Significant | | | | | | | |
| | active markets for | | | other | | | Significant | | | | |
| | identical assets | | | observable | | | unobservable | | | | |
| | and liabilities | | | inputs | | | inputs | | | | |
| | (Level 1) | | | (Level 2) | | | (Level 3) | | | Total | |
Cash and cash equivalents | | $ | 19.9 | | | $ | — | | | $ | — | | | $ | 19.9 | |
Money market instruments | | | 7.8 | | | | — | | | | — | | | | 7.8 | |
Bulk annuity contract | | | — | | | | — | | | | 240.7 | | | | 240.7 | |
Fixed income investments | | | 300.6 | | | | — | | | | — | | | | 300.6 | |
Equity investments | | | 127.4 | | | | — | | | | — | | | | 127.4 | |
Total | | $ | 455.7 | | | $ | — | | | $ | 240.7 | | | $ | 696.4 | |
The value of the bulk annuity contracts decreased from $240.7 million at December 31, 2023, to $217.7 million at December 31, 2024. The decrease was due changes in financial conditions resulting in a decrease of $21.9 million, foreign currency translation of $4.2 million, combined with cash payments received under the contract resulting in a decrease of $14.5 million. These decreases were partially offset by $9.9 million of interest on the bulk annuity asset, a $7.6 million gain on financial assumptions, and a $0.1 million gain due to changes in demographic assumptions.
The expected rate of return on assets for the financial period ending December 31, 2024, was 4.1% p.a. based on financial conditions as of December 31, 2023 (2023: 4.4% p.a.). This rate is derived by taking the weighted-average of the long-term expected rate of return on each of the asset classes in JHGPS’s target asset allocation. The expected rate of return has been determined based on yields on either long-dated government bonds or relevant corporate bonds, dependent on the class of asset in question, adjusted where appropriate based on the individual characteristics of each asset class.
Actuarial Gains and Losses
Cumulative amounts recognized in accumulated other comprehensive income and the actuarial loss, net of tax deducted at source, credited to other comprehensive income for the years ended December 31, 2024 and 2023, are shown below (in millions):
| | 2024 | | | 2023 | |
Opening accumulated unamortized actuarial loss as of January 1 | | $ | (84.7 | ) | | $ | (70.4 | ) |
Actuarial loss | | | (17.5 | ) | | | (18.8 | ) |
Tax at source on current year actuarial gain | | | 3.2 | | | | 3.5 | |
Prior service cost | | | 0.4 | | | | 0.5 | |
Amortization of actuarial loss | | | 1.3 | | | | 0.5 | |
Closing accumulated unamortized actuarial loss as of December 31 | | $ | (97.3 | ) | | $ | (84.7 | ) |
Net Periodic Benefit Cost
The components of net periodic benefit cost in respect to defined benefit plans for the years ended December 31, 2024, 2023 and 2022, include the following (in millions):
| | Year ended December 31, | |
| | 2024 | | | 2023 | | | 2022 | |
Interest cost | | $ | (27.2 | ) | | $ | (27.6 | ) | | $ | (16.9 | ) |
Amortization of actuarial loss | | | (1.3 | ) | | | (0.5 | ) | | | — | |
Amortization of prior service cost | | | (0.4 | ) | | | (0.4 | ) | | | (0.4 | ) |
Expected return on plan assets | | | 26.7 | | | | 28.7 | | | | 13.8 | |
Net periodic benefit credit (cost) | | | (2.2 | ) | | | 0.2 | | | | (3.5 | ) |
Contributions to money purchase section | | | (12.5 | ) | | | (11.6 | ) | | | (11.5 | ) |
Total cost | | $ | (14.7 | ) | | $ | (11.4 | ) | | $ | (15.0 | ) |
The following key assumptions were used in determining the net periodic benefit cost for the years ended December 31, 2024, 2023 and 2022 (in millions):
| | Year ended December 31, | |
| | 2024 | | | 2023 | | | 2022 | |
Discount rate | | | 4.5 | % | | | 4.8 | % | | | 1.9 | % |
Inflation — RPI | | | 3.1 | % | | | 3.3 | % | | | 3.4 | % |
Inflation — CPI | | | 2.5 | % | | | 2.7 | % | | | 2.8 | % |
Pension increases (RPI capped at 5% p.a.) | | | 3.0 | % | | | 3.2 | % | | | 3.3 | % |
Pension increases (RPI capped at 2.5% p.a.) | | | 2.1 | % | | | 2.1 | % | | | 2.2 | % |
Expected return on plan assets | | | 4.1 | % | | | 4.4 | % | | | 1.6 | % |
Amortization period for net actuarial gains at beginning of the year | | | 27.0 | | | | 28.0 | | | | 29.0 | |
Cash Flows
Employer contributions of $2.4 million were paid in relation to our defined benefit pension plans during 2024 (excluding credits to members’ money purchase accounts). We expect to contribute approximately $2.4 million to the JHGPS (excluding credits to members’ money purchase accounts) in the year ended December 31, 2025.
The expected future benefit payments for our pension plan are as follows (in millions):
2025 | | | $ | 21.7 | |
2026 | | | $ | 22.9 | |
2027 | | | $ | 24.0 | |
2028 | | | $ | 24.7 | |
2029 | | | $ | 26.2 | |
| 2030-2034 | | | $ | 138.5 | |
Note 17 — Accumulated Other Comprehensive Loss
Changes in accumulated other comprehensive loss, net of tax, for the years ended December 31, 2024 and 2023, are as follows (in millions):
| | Year ended December 31, | |
| | 2024 | | | 2023 | |
| | | | | | Retirement | | | | | | | | | | Retirement | | | | |
| | | Foreign | | | benefit | | | | | | | Foreign | | | benefit | | | | | |
| | currency | | | asset, net | | | Total | | | currency | | | asset, net | | | Total | |
Beginning balance | | $ | (478.9 | ) | | $ | (84.7 | ) | | $ | (563.6 | ) | | $ | (577.3 | ) | | $ | (70.4 | ) | | $ | (647.7 | ) |
Other comprehensive income (loss) | | | (52.6 | ) | | | (14.3 | ) | | | (66.9 | ) | | | 96.8 | | | | (15.2 | ) | | | 81.6 | |
Reclassifications to net income(1) | | | 138.1 | | | | 1.7 | | | | 139.8 | | | | 4.7 | | | | 0.9 | | | | 5.6 | |
Total other comprehensive income (loss) | | | 85.5 | | | | (12.6 | ) | | | 72.9 | | | | 101.5 | | | | (14.3 | ) | | | 87.2 | |
Less: other comprehensive loss (income) attributable to noncontrolling interests | | | 5.5 | | | | — | | | | 5.5 | | | | (3.1 | ) | | | — | | | | (3.1 | ) |
Ending balance | | $ | (387.9 | ) | | $ | (97.3 | ) | | $ | (485.2 | ) | | $ | (478.9 | ) | | $ | (84.7 | ) | | $ | (563.6 | ) |
(1) Reclassifications to net income are primarily related to the release of accumulated foreign currency translation reserves during the period in which a JHG entity is disposed of.
The components of other comprehensive income (loss), net of tax, for the years ended December 31, 2024, 2023 and 2022, are as follows (in millions):
| | Pre-tax | | | Tax | | | | |
Year ended December 31, 2024 | | amount | | | expense | | | Net amount | |
Foreign currency translation adjustments | | $ | (55.1 | ) | | $ | 2.5 | | | $ | (52.6 | ) |
Retirement benefit asset, net | | | (17.5 | ) | | | 3.2 | | | | (14.3 | ) |
Reclassifications to net income(1) | | | 139.8 | | | | — | | | | 139.8 | |
Total other comprehensive income | | $ | 67.2 | | | $ | 5.7 | | | $ | 72.9 | |
| | Pre-tax | | | Tax | | | | |
Year ended December 31, 2023 | | amount | | | expense | | | Net amount | |
Foreign currency translation adjustments | | $ | 94.4 | | | $ | 2.4 | | | $ | 96.8 | |
Retirement benefit asset, net | | | (18.7 | ) | | | 3.5 | | | | (15.2 | ) |
Reclassifications to net income(1) | | | 5.6 | | | | — | | | | 5.6 | |
Total other comprehensive income | | $ | 81.3 | | | $ | 5.9 | | | $ | 87.2 | |
| | Pre-tax | | | Tax | | | | |
Year ended December 31, 2022 | | amount | | | expense | | | Net amount | |
Foreign currency translation adjustments | | $ | (224.2 | ) | | $ | 3.2 | | | $ | (221.0 | ) |
Retirement benefit asset, net | | | (46.8 | ) | | | 8.8 | | | | (38.0 | ) |
Reclassifications to net income(1) | | | (3.7 | ) | | | — | | | | (3.7 | ) |
Total other comprehensive income (loss) | | $ | (274.7 | ) | | $ | 12.0 | | | $ | (262.7 | ) |
(1) Reclassifications to net income are primarily related to the release of accumulated foreign currency translation reserves during the period in which a JHG entity is disposed of.
Note 18 — Earnings and Dividends Per Share
Earnings Per Share
The following is a summary of the earnings per share calculation for the years ended December 31, 2024, 2023 and 2022 (in millions, except per share data):
| | Year ended December 31, | |
| | 2024 | | | 2023 | | | 2022 | |
Net income attributable to JHG | | $ | 408.9 | | | $ | 392.0 | | | $ | 372.4 | |
Allocation of earnings to participating stock-based awards | | | (9.9 | ) | | | (11.2 | ) | | | (11.3 | ) |
Net income attributable to JHG common shareholders | | $ | 399.0 | | | $ | 380.8 | | | $ | 361.1 | |
| | | | | | | | | |
Weighted-average common shares outstanding — basic | | | 155.4 | | | | 160.4 | | | | 161.7 | |
Dilutive effect of nonparticipating stock-based awards | | | 0.4 | | | | 0.1 | | | | 0.3 | |
Weighted-average common shares outstanding — diluted | | | 155.8 | | | | 160.5 | | | | 162.0 | |
| | | | | | | | | |
Earnings per share: | | | | | | | | | |
Basic | | $ | 2.57 | | | $ | 2.37 | | | $ | 2.23 | |
Diluted | | $ | 2.56 | | | $ | 2.37 | | | $ | 2.23 | |
Dividends Per Share
The payment of cash dividends is within the discretion of our Board of Directors and depends on many factors, including, but not limited to, our results of operations, financial condition, capital requirements, legal requirements and general business conditions.
The following is a summary of cash dividends declared and paid for the years ended December 31, 2024, 2023 and 2022:
| | Year ended December 31, | |
| | 2024 | | | 2023 | | | 2022 | |
Dividends paid per share | | $ | 1.56 | | | $ | 1.56 | | | $ | 1.55 | |
On January 30, 2025, our Board of Directors declared a cash dividend of $0.39 per share. The quarterly dividend will be paid on February 27, 2025, to shareholders of record at the close of business on February 11, 2025.
Note 19 — Commitments and Contingencies
Commitments and contingencies may arise in the normal course of business. Commitments and contingencies as of December 31, 2024, are discussed below.
Operating and Finance Leases
As of December 31, 2024, we had future minimum rental commitments under non-cancelable operating and finance leases. Refer to Note 9 — Leases, in Part II, Item 8, Financial Statements and Supplementary Data, for information related to operating and financing lease commitments.
Litigation and Other Regulatory Matters
We are periodically involved in various legal proceedings and other regulatory matters.
Sandra Schissler v. Janus Henderson US (Holdings) Inc., Janus Henderson Advisory Committee, and John and Jane Does 1-30
On September 9, 2022, a class action complaint, captioned Schissler v. Janus Henderson US (Holdings) Inc., et al., was filed in the United States District Court for the District of Colorado. Named as defendants are Janus Henderson US (Holdings) Inc. (“Janus US Holdings”) and the Advisory Committee to the Janus 401(k) and Employee Stock Ownership Plan (the “Plan”). The complaint purports to be brought on behalf of a class consisting of participants and beneficiaries of the Plan that invested in Janus Henderson funds on or after September 9, 2016. On January 10, 2023, in response to the defendants’ motion to dismiss filed on November 23, 2022, an amended complaint was filed against the same defendants. The amended complaint names two additional plaintiffs, Karly Sissel and Derrick Hittson. As amended, the complaint alleges that for the period September 9, 2016, through September 9, 2022, among other things, the defendants breached fiduciary duties of loyalty and prudence by (i) selecting higher-cost Janus Henderson funds over less expensive investment options, (ii) retaining Janus Henderson funds despite their alleged underperformance and (iii) failing to consider actively managed funds outside of Janus Henderson to add as investment options. The amended complaint also alleges that Janus US Holdings failed to monitor the Advisory Committee with respect to the foregoing. The amended complaint seeks various declaratory, equitable and monetary relief in unspecified amounts. On February 9, 2023, the defendants filed an amended motion to dismiss the amended complaint. On March 13, 2023, the plaintiffs filed an opposition to the amended motion to dismiss. The defendants filed their reply to the plaintiffs’ opposition on March 28, 2023. On September 7, 2023, a magistrate judge issued a report and recommendation, which recommended that the motion to dismiss be granted in part and denied in part. On September 21, 2023, the parties filed objections to the report and recommendation. Briefing on the parties’ objections concluded on October 12, 2023. On January 22, 2024, the district court judge adopted the magistrate judge’s report and recommendation and entered an order granting in part and denying in part Janus US Holdings’ motion to dismiss. The parties are currently engaged in discovery. Janus US Holdings believes that it has substantial defenses and intends to vigorously defend against these claims.
Note 20 — Related Party Transactions
Disclosures relating to equity method investments and our pension scheme can be found in Note 5 — Investments and Note 16 — Retirement Benefit Plans, respectively, in Part II, Item 8, Financial Statements and Supplementary Data. Transactions between JHG and our consolidated subsidiaries have been eliminated on consolidation and are not disclosed in this note.
Certain managed funds are considered to be related parties of JHG under the related party guidance. We earn fees from the funds and investment products for which we act as investment manager, and the balance sheet includes amount due from these managed funds.
During the years ended December 31, 2024, 2023 and 2022, we recognized revenues of $2,298.9 million, $1,946.5 million and $2,017.2 million, respectively, from the funds and investment products we manage that are related parties and not consolidated in our Consolidated Statements of Comprehensive Income.
The following table reflects amounts in our Consolidated Balance Sheets relating to fees receivable from managed funds as of December 31, 2024 and 2023 (in millions):
| | December 31, | |
| | 2024 | | | 2023 | |
Accrued income | | $ | 228.5 | | | $ | 171.6 | |
Accounts receivable | | | 77.0 | | | | 68.9 | |
Seed investments held in managed funds are discussed in Note 4 — Consolidation, in Part II, Item 8, Financial Statements and Supplementary Data.
Note 21 — Geographic and Segment Information
Geographic Information
The following table provides our operating revenues by principal geographic area for the years ended December 31, 2024, 2023 and 2022 (in millions):
| | Year ended December 31, | |
Operating revenues: | | 2024 | | | 2023 | | | 2022 | |
U.S. | | $ | 1,582.2 | | | $ | 1,304.3 | | | $ | 1,324.6 | |
UK | | | 391.2 | | | | 350.4 | | | | 315.1 | |
Luxembourg | | | 452.2 | | | | 400.6 | | | | 512.5 | |
Australia and other | | | 47.6 | | | | 46.5 | | | | 51.4 | |
Total | | $ | 2,473.2 | | | $ | 2,101.8 | | | $ | 2,203.6 | |
Operating revenues are attributed to countries based on the location in which revenues are earned.
The following table provides our long-lived assets by principal geographic area as of December 31, 2024 and 2023 (in millions):
| | December 31, | |
Long-lived assets: | | 2024 | | | 2023 | |
U.S. | | $ | 2,143.6 | | | $ | 2,093.9 | |
UK | | | 334.1 | | | | 343.0 | |
Australia and other | | | 35.0 | | | | 38.6 | |
Total | | $ | 2,512.7 | | | $ | 2,475.5 | |
Long-lived assets include property, equipment, software and intangible assets. As of December 31, 2024, intangible assets in the U.S., UK and Australia were $2,125.5 million, $316.0 million and $31.8 million, respectively. As of December 31, 2023, intangible assets in the U.S., UK and Australia were $2,074.2 million, $321.7 million and $35.4 million, respectively.
Segment Information
We are a global asset manager and manage a range of investment products, operating across various product lines, distribution channels and geographic regions. However, information is reported to the chief operating decision-maker (“CODM”), our CEO, on an aggregated basis. Strategic and financial management decisions are determined centrally by our CEO and, on this basis, we operate as a single-segment investment management business.
Our investment management segment primarily derives revenues from management fees. Clients pay a management fee, which is usually calculated as a percentage of AUM. Certain investment products are also subject to performance fees, which vary based on when performance hurdles or other specified criteria are achieved. The level of assets subject to such fees can positively or negatively affect our revenue. Management and performance fees are generated from a diverse group of funds and other investment products and are the primary drivers of our revenue.
The accounting policies of the investment management segment are the same as those described in Note 2 — Summary of Significant Accounting Policies. The CODM assesses performance for the investment management segment and decides how to allocate resources based on net income attributable to JHG on the Consolidated Statements of Comprehensive Income. Refer to the Consolidated Statements of Comprehensive Income for information on our significant segment expenses. All of our revenue is earned from external customers.
The measure of segment assets is reported on the Consolidated Balance Sheets as total assets. Segment assets are identical to the total assets on our Consolidated Balance Sheets. Significant noncash items include depreciation and amortization, stock-based compensation plan expense and investment gains and losses. Refer to our Consolidated Statements of Cash Flows for a comprehensive listing of our noncash adjustments.
| ITEM 9. | CHANGES IN AND DISAGREEMENTS WITH ACCOUNTANTS ON ACCOUNTING AND FINANCIAL DISCLOSURE |
None.
| ITEM 9A. | CONTROLS AND PROCEDURES |
Evaluation of Disclosure Controls and Procedures
As of December 31, 2024, our management evaluated the effectiveness of the design and operation of our disclosure controls and procedures (as such term is defined in Rules 13a-15(e) and 15d-15(e) under the Exchange Act). Disclosure controls and procedures include, without limitation, controls and procedures designed to ensure that information required to be disclosed by us in the reports that we file or submit under the Exchange Act is accumulated and communicated to our management, including our principal executive and principal financial officers, or persons performing similar functions, as appropriate to allow timely decisions regarding required disclosure. Disclosure controls and procedures are designed by us to ensure that we record, process, summarize and report within the time periods specified in the SEC’s rule and forms the information we must disclose in reports that we file with or submit to the SEC. Ali Dibadj, Chief Executive Officer, and Roger Thompson, Chief Financial Officer, reviewed and participated in management’s evaluation of the disclosure controls and procedures. Based on this evaluation, Mr. Dibadj and Mr. Thompson concluded that as of December 31, 2024, our disclosure controls and procedures were effective.
Management’s Report on Internal Control Over Financial Reporting
Our Management’s Report on Internal Control Over Financial Reporting and our registered public accounting firm’s Report of Independent Registered Public Accounting Firm, which contains its attestation on our internal control over financial reporting, are incorporated by reference from Part II, Item 8, Financial Statements and Supplementary Data.
Changes in Internal Control Over Financial Reporting
There were no changes in our internal control over financial reporting (as that term is defined in Rule 13a-15(f) under the Exchange Act) that occurred during the fiscal quarter ended December 31, 2024, that have materially affected, or are reasonably likely to materially affect, our internal control over financial reporting.
| ITEM 9B. | OTHER INFORMATION |
None.
| ITEM 9C. | DISCLOSURE REGARDING FOREIGN JURISDICTIONS THAT PREVENT INSPECTIONS |
Not applicable.
PART III
| Item 10. | DIRECTORS, EXECUTIVE OFFICERS AND CORPORATE GOVERNANCE |
The information required by this Item will be included in the Proxy Statement under the captions “Board of Directors”, “Corporate Governance” and “Our Executive Officers” and is incorporated herein by reference.
| Item 11. | EXECUTIVE COMPENSATION |
The information required by this Item will be included in the Proxy Statement under the captions “Board Compensation”, “Executive Compensation” and “Executive Compensation Tables” and is incorporated herein by reference.
| Item 12. | SECURITY OWNERSHIP OF CERTAIN BENEFICIAL OWNERS AND MANAGEMENT AND RELATED STOCKHOLDER MATTERS |
The information required by this Item will be included in the Proxy Statement under the captions “Security Ownership of Certain Beneficial Owners and Management” and “Equity Compensation Plan Information” and is incorporated herein by reference.
| Item 13. | CERTAIN RELATIONSHIPS AND RELATED TRANSACTIONS, AND DIRECTOR INDEPENDENCE |
The information required by this Item will be included in the Proxy Statement under the captions “Related Party Transactions” and “Director Independence” and is incorporated herein by reference.
| Item 14. | PRINCIPAL ACCOUNTANT FEES AND SERVICES |
The information required by this Item will be included in the Proxy Statement under the caption “Reappointment and Remuneration of Auditors” and is incorporated herein by reference.
PART IV
| ITEM 15. | EXHIBITS AND FINANCIAL STATEMENT SCHEDULES |
(a) List of Documents Filed as Part of This Report
(1) Financial Statements
The financial statements and related notes, together with the report of PricewaterhouseCoopers LLP dated February 27, 2025, appear in Part II, Item 8, Financial Statements and Supplementary Data.
(2) Financial Statement Schedules
No financial statement schedules are required.
(3) List of Exhibits
(b) Exhibits
Exhibit No. | | Document |
| | (2) Plan of acquisition, reorganization, arrangement, liquidation or succession |
| | | |
2.1 | | Agreement and Plan of Merger, dated October 3, 2016, by and among Janus Capital Group Inc., Henderson Group plc and Horizon Orbit Corp, is hereby incorporated by reference from Exhibit 2.1 to JCG’s Current Report on Form 8-K, dated October 3, 2016 (File No. 001-15253) |
| | | |
| | (3) Articles of Incorporation and Bylaws |
| | | |
3.1.1 | | Memorandum of Association of Janus Henderson Group plc, is hereby incorporated by reference from Exhibit 3.1 to JHG’s Current Report on Form 8-K, dated May 30, 2017 (File No. 001-38103) |
| | | |
3.1.2 | | Articles of Association of Janus Henderson Group plc, is hereby incorporated by reference from Exhibit 3.2 to JHG’s Current Report on Form 8-K, dated May 30, 2017 (File No. 001-38103) |
| | | |
| | (4) Instruments Defining the Rights of Security Holders, Including Indentures |
| | | |
4.1 | | Specimen of Common Stock Certificate is hereby incorporated by reference from Exhibit 4.1 to JHG’s Registration Statement on Form S-3, filed on February 4, 2021 (File No. 333-252714) |
| | | |
4.2 | | Indenture dated as of November 6, 2001 (the “Base Indenture”), between Janus Capital Group Inc. and The Bank of New York Trust Company N.A. (as successor to The Chase Manhattan Bank), is hereby incorporated by reference from Exhibit 4.1 to JCG’s Current Report on Form 8-K, dated November 6, 2001 (File No. 001-15253) |
| | | |
4.2.2 | | Officer's Certificate pursuant to the Base Indenture establishing the terms of the 2025 Senior Notes is hereby incorporated by reference from Exhibit 4.1 to JCG's Current Report on Form 8-K, dated July 28, 2015 (File No. 001-15253) |
| | | |
4.2.3 | | Fifth Supplemental Indenture to the Base Indenture, dated as of May 30, 2017, among Janus Capital Group Inc., Henderson Group plc and The Bank of New York Mellon Trust Company N.A., is hereby incorporated by reference from Exhibit 4.5 to JHG’s Current Report on Form 8-K, dated May 30, 2017 (File No. 001-38103) |
| | | |
4.3 | | Form of Global Notes for the 2025 Senior Notes, is hereby incorporated by reference from Exhibit 4.2 to JCG’s Current Report on Form 8-K, dated July 31, 2015 (File No. 001-15253) |
| | | |
4.4 | | Form of Indenture for debt securities between Janus Henderson Group plc and the trustee to be named therein is hereby incorporated by reference from Exhibit 4.2 to JHG’s Registration Statement on Form S-3, filed on February 4, 2021 (File No. 333-252714) |
| | | |
| 4.5 | | Senior Indenture, dated as of September 10, 2024, by and among Janus Henderson US Holdings Inc., as Issuer, Janus Henderson Group plc, as Guarantor, and The Bank of New York Mellon Trust Company, N.A., as Trustee, is hereby incorporated by reference from Exhibit 4.1 to JHG's Current Report on Form 8-K, dated September 10, 2024 (File No. 333-252714) |
| | | |
| 4.6 | | Registration Rights Agreement, dated September 10, 2024, by and among Janus Henderson US Holdings Inc., Janus Henderson Group plc, and Citigroup Global Markets Inc., BofA Securities, Inc. and Morgan Stanley & Co. LLC, as representatives of the initial purchasers of the 2034 Senior Notes, is hereby incorporated by reference from Exhibit 4.2 to JHG's Current Report on Form 8-K, dated September 10, 2024 (File No. 333-252714) |
| | | |
| 4.7 | | Form of Note for the 2034 Senior Notes is hereby incorporated by reference from Exhibit 4.3 to JHG's Current Report on Form 8-K, dated September 10, 2024 (File No. 333-252714) |
| | | |
| 4.8 | | Description of Securities |
| | | |
| | (10) Material Contracts |
| | | |
10.1 | | Facility Agreement, US$200,000,000 Revolving Credit Facility, dated as of June 30, 2023, among Janus Henderson Group plc, as borrower, Janus Henderson US Holdings Inc., as guarantor, Bank of America Europe Designated Activity Company, as coordinator, bookrunner and mandated lead arranger, and facility agent, Citibank, N.A., as bookrunner and mandated lead arranger, BNP Paribas, London Branch, NatWest Markets plc, State Street Bank and Trust Company, and Well Fargo Bank, National Association, as mandated lead arrangers, and other lenders party thereto is hereby incorporated by reference from Exhibit 10.1 to JHG's Current report on Form 8-K, filed on July 5, 2023 (File No.: 001-38103) |
| | | |
10.2 | | Form of Instrument of Indemnity, is hereby incorporated by reference from Exhibit 10.16 to JHG’s Registration Statement on Form F-4, filed on March 20, 2017 (File No. 333-216824) |
10.3 | | Second Amended and Restated 2012 Employment Inducement Award Plan, effective May 30, 2017, is hereby incorporated by reference from Exhibit 4.9 to JHG’s Registration Statement on Form S-8, filed on May 31, 2017 (File No. 333-218365)* |
| | | |
10.4 | | Janus Henderson Group plc Second Amended and Restated Income Deferral Program, effective May 30, 2017, is hereby incorporated by reference from Exhibit 10.9 to JHG’s Form 10-Q, filed on August 8, 2017 (File No. 001-38103)* |
| | | |
10.5 | | Janus Henderson Group plc Fourth Amended and Restated Director Deferred Fee Plan, effective May 30, 2017, is hereby incorporated by reference from Exhibit 10.10 to JHG’s Form 10-Q, filed on August 8, 2017 (File No. 001-38103)* |
| | | |
10.6 | | Amended and Restated Investment and Strategic Cooperation Agreement, dated October 3, 2016, by and among Henderson Group plc, Janus Capital Group Inc. and Dai-ichi Life Holdings, Inc., is hereby incorporated by reference from Exhibit 10.1 to JHG’s Registration Statement on Form F-4, filed on March 20, 2017 (File No. 333-216824) |
| | | |
10.7 | | Termination and Amendment Agreement, dated as of February 4, 2021, by and between Janus Henderson Group plc and Dai-ichi Life Holdings, Inc., is hereby incorporated by reference from Exhibit 10.1 to JHG’s Current Report on Form 8-K, dated February 4, 2021 (File No. 333-38103) |
| | | |
10.8 | | Service Agreement between Henderson Group plc and Roger Thompson, effective from June 26, 2013, is hereby incorporated by reference from Exhibit 10.5 to JHG’s Registration Statement on Form F-4, filed on March 20, 2017 (File No. 333-216824)* |
| | | |
10.9 | | CEO Offer letter, dated March 23, 2022, between Janus Henderson Group plc and Ali Dibadj is hereby incorporated by reference from Exhibit 10.1 to JHG’s Quarterly Report on Form 10-Q for the quarter ended March 31, 2022 (File No. 001-38103)* |
| | | |
10.10 | | Severance Rights Agreement, dated March 23, 2022, between Janus Henderson Investors US LLC and Ali Dibadj is hereby incorporated by reference from Exhibit 10.2 to JHG’s Quarterly Report on Form 10-Q for the quarter ended March 31, 2022 (File No. 001-38103)* |
| | | |
10.11 | | Service Agreement between Henderson Administrative Limited and James R. Lowry, effective from May 21, 2021* ** |
| | | |
10.12 | | Janus Henderson Group plc 2022 Deferred Incentive Plan is hereby incorporated by reference from Exhibit 10.2 to JHG’s Quarterly Report on Form 10-Q for the quarter ended June 30, 2022 (File No. 001-38103)* |
| | | |
10.13 | | Janus Henderson Group plc 2022 Global Employee Stock Purchase Plan is hereby incorporated by reference from Exhibit 10.3 to JHG’s Quarterly Report on Form 10-Q for the quarter ended June 30, 2022 (File No. 001-38103)* |
| | | |
| 10.14 | | Janus Henderson Group Global Remuneration Policy Statement* ** |
| 10.15 | | Form of US DIP Share Unit (RSU) Award Agreement for grants to executive officers under the Janus Henderson Group 2022 Deferred Incentive Plan on or after January 1, 2023, is hereby incorporated by reference to Exhibit 10.26 of JHG's Annual Report on Form 10-K for the year ended December 31, 2022 (File No. 333-38103)* |
| | | |
| 10.16 | | Form of US DIP Fund Award Agreement for grants to executive officers under the Janus Henderson Group 2022 Deferred Incentive Plan on or after January 1, 2023, is hereby incorporated by reference to Exhibit 10.27 of JHG's Annual Report on Form 10-K for the year ended December 31, 2022 (File No. 333-38103)* |
| | | |
| 10.17 | | Form of US DIP Performance-Based Share Unit (PSU) Award Agreement for grants to executive officers under the Janus Henderson Group 2022 Deferred Incentive Plan on or after January 1, 2023, is hereby incorporated by reference to Exhibit 10.28 of JHG's Annual Report on Form 10-K for the year ended December 31, 2023 (File No. 333-38103)* |
| | | |
| 10.18 | | Form of US DIP Matching Restricted Stock Unit (RSU) Award Agreement for matching grants under the Janus Henderson Group 2022 Deferred Incentive Plan on or after January 1, 2023, is hereby incorporated by reference to Exhibit 10.29 of JHG's Annual Report on Form 10-K for the year ended December 31, 2022 (File No. 333-38103)* |
| | | |
| 19.1 | | Janus Henderson Group plc Share Trading Policy** |
| | | |
21.1 | | List of the Subsidiaries of the company prepared pursuant to Item 601(b)(21) of Regulation S-K** |
| | | |
23.1 | | Consent of Independent Registered Public Accounting Firm – PricewaterhouseCoopers LLP** |
| | | |
| 24.1 | | Power of Attorney (included as a part of the Signature pages to this report) |
| | | |
| 31.1 | | Certification of Ali Dibadj, Chief Executive Officer of Registrant** |
| | | |
| 31.2 | | Certification of Roger Thompson, Chief Financial Officer of Registrant** |
| | | |
| 32.1 | | Certification of Ali Dibadj, Chief Executive Officer of Registrant, pursuant to 18 U.S.C. Section 1350, as adopted pursuant to Section 906 of the Sarbanes-Oxley Act of 2002** |
| | | |
| 32.2 | | Certification of Roger Thompson, Chief Financial Officer of Registrant, pursuant to 18 U.S.C. Section 1350, as adopted pursuant to Section 906 of the Sarbanes-Oxley Act of 2002** |
| | | |
| 97.1 | | Janus Henderson Group plc Clawback Policy for Executive Officers is hereby incorporated by reference to Exhibit 97.1 of JHG’s Annual Report on Form 10-K for the year ended December 31, 2023 (File No. 333-38103)* |
| | | |
| 101.INS | | Inline XBRL Insurance Document – the instance document does not appear in the Interactive Data File because its XBRL tags are embedded within the Inline XBRL document. |
| | | |
| 101.SCH | | Inline XBRL Taxonomy Extension Schema Document |
| | | |
| 101.CAL | | Inline XBRL Taxonomy Extension Calculation Linkbase Document |
| | | |
| 101.DEF | | Inline XBRL Taxonomy Extension Definition Linkbase Document |
| | | |
| 101.LAB | | Inline XBRL Taxonomy Extension Label Linkbase Document |
| | | |
| 101.PRE | | Inline XBRL Taxonomy Extension Presentation Linkbase Document |
| | | |
| 104 | | Cover Page Interactive Data File (the cover page XBRL tags are embedded in the Inline XBRL document) |
| | | |
| | * Management contract or compensatory plan or agreement. |
| | | |
| | | ** Filed with this Report. |
| ITEM 16. | FORM 10-K SUMMARY |
None.
Signatures
Pursuant to the requirements of Section 13 or 15(d) of the Securities Exchange Act of 1934, the Registrant has duly caused this report to be signed on its behalf by the undersigned, thereunto duly authorized.
| Janus Henderson Group plc |
| |
| By: | /s/ ALI DIBADJ |
| | Ali Dibadj, |
| | Chief Executive Officer |
February 27, 2025
Known all persons by these presents, that each person whose signatures appear below, hereby constitute and appoint Ali Dibadj and Michelle Rosenberg, and each of them individually (with full power to act alone), as their true and lawful attorneys-in-fact and agents to sign and execute and file with the Securities Exchange Commission on behalf of the undersigned, any amendments to Janus Henderson Group plc’s Annual Report on Form 10-K for the year ended December 31, 2024, and any instrument or document filed as part of, as an exhibit to, or in connection with any amendment, and each of the undersigned does hereby ratify and confirm as his or her own act and deed all that said attorneys shall lawfully do or cause to be done by virtue thereof.
Pursuant to the requirements of the Securities Exchange Act of 1934, this report has been signed below by the following persons on behalf of the Registrant and in the capacities indicated on February 27, 2025.
Signature/Name | | Title |
| | |
/s/ JOHN CASSADAY | | Chairman of the Board |
John Cassaday | | |
| | |
/s/ ALI DIBADJ | | Director and Chief Executive Officer |
Ali Dibadj | | (Principal Executive Officer) |
| | |
/s/ ROGER THOMPSON | | Chief Financial Officer |
Roger Thompson | | (Principal Financial Officer) |
| | |
/s/ BERG CRAWFORD | | Chief Accounting Officer |
Berg Crawford | | (Principal Accounting Officer) |
Signature/Name | | Title |
| | |
/s/ BRIAN BALDWIN | | Director |
Brian Baldwin | | |
| | |
/s/ KALPANA DESAI | | Director |
| Kalpana Desai | | |
| | |
/s/ KEVIN DOLAN | | Director |
Kevin Dolan | | |
| | |
/s/ EUGENE FLOOD JR | | Director |
Eugene Flood Jr | | |
| | |
/s/ JOSH FRANK | | Director |
Josh Frank | | |
| | |
/s/ ALISON QUIRK | | Director |
Alison Quirk | | |
| | |
/s/ LESLIE F. SEIDMAN | | Director |
Leslie F. Seidman | | |
| | |
/s/ ANGELA SEYMOUR-JACKSON | | Director |
Angela Seymour-Jackson | | |
| | |
/s/ ANNE SHEEHAN | | Director |
Anne Sheehan | | |