Exhibit 99.2
| Dick Weil Chief Executive Officer Roger Thompson Chief Financial Officer Janus Henderson Group 2Q20 results presentation Wednesday 29 July 2020 |

| 1 Progress since the merger Next steps: ‘Simple Excellence’ ✓ While growth and net flows have not met expectations, recent results are showing positive momentum Building on the encouraging signs of growth, powered by the execution of our Simple Excellence strategy ✓ Successfully created a unified company with a strong culture, common systems and a simplified operating model Further modernising and simplifying our platform across products, capabilities and global client servicing ✓ Delivered over US$125m of merger-related cost savings, along with continued expense management discipline Pursuing Simple Excellence, balancing strategic investments with further efficiencies Strategy journey: three years into the merger Strengthening our foundation as we enter our next growth phase |

| Roger Thompson Chief Financial Officer 2Q20 results presentation Business and financial update |

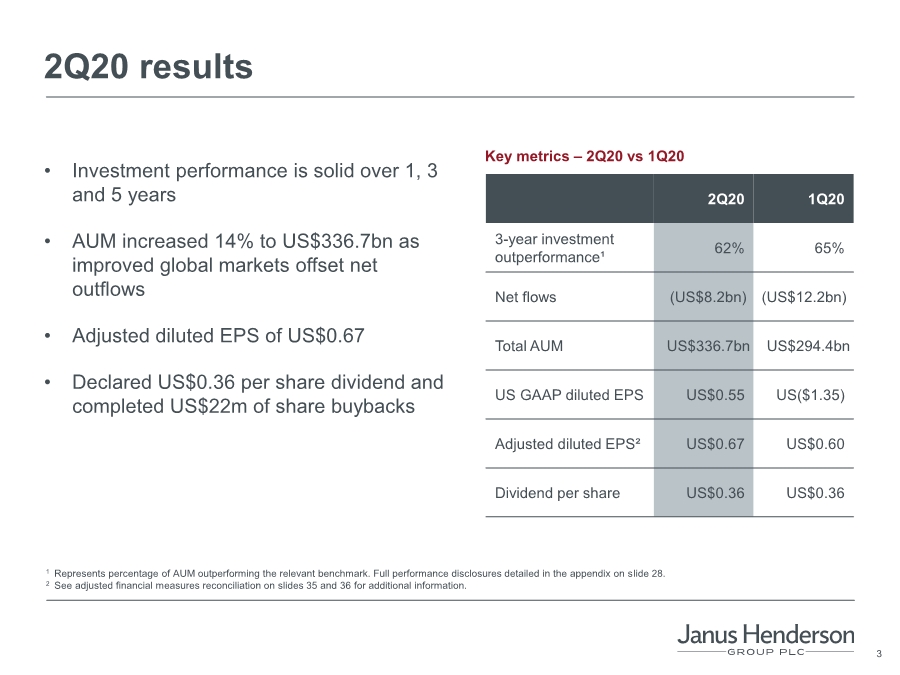
| 3 2Q20 results • Investment performance is solid over 1, 3 and 5 years • AUM increased 14% to US$336.7bn as improved global markets offset net outflows • Adjusted diluted EPS of US$0.67 • Declared US$0.36 per share dividend and completed US$22m of share buybacks 2Q20 1Q20 3-year investment outperformance¹ 62% 65% Net flows (US$8.2bn) (US$12.2bn) Total AUM US$336.7bn US$294.4bn US GAAP diluted EPS US$0.55 US($1.35) Adjusted diluted EPS² US$0.67 US$0.60 Dividend per share US$0.36 US$0.36 Key metrics – 2Q20 vs 1Q20 1 Represents percentage of AUM outperforming the relevant benchmark. Full performance disclosures detailed in the appendix on slide 28. 2 See adjusted financial measures reconciliation on slides 35 and 36 for additional information. |
| 4 Capability 1 year 3 years 5 years Equities Fixed Income Quantitative Equities Multi-Asset Alternatives Total Capability 1 year 3 years 5 years Equities Fixed Income Quantitative Equities Multi-Asset Alternatives Total Investment performance Firmwide investment performance remains solid; 1-year improved since March % of mutual fund AUM in top 2 Morningstar quartiles (as at 30 Jun 2020) % of AUM outperforming benchmark (as at 30 Jun 2020) Note: Full performance disclosures detailed in the appendix on slides 28 and 29. Past performance is no guarantee of future results. The top two Morningstar quartiles represent funds in the top half of their category based on total return. Refer to slide 29 for the 10-year period, percent of funds in the top 2 quartiles for all periods, and description and quantity of funds included in the analysis. 99% 68% 54% 62% 60% 96% 9% 96% 78% 92% 67% 90% 92% 48% 96% 76% 74% 52% 23% 83% 94% 91% 93% 22% 64% 59% 86% 77% 98% 60% 96% 87% 56% 3% 8% 100% 67% |

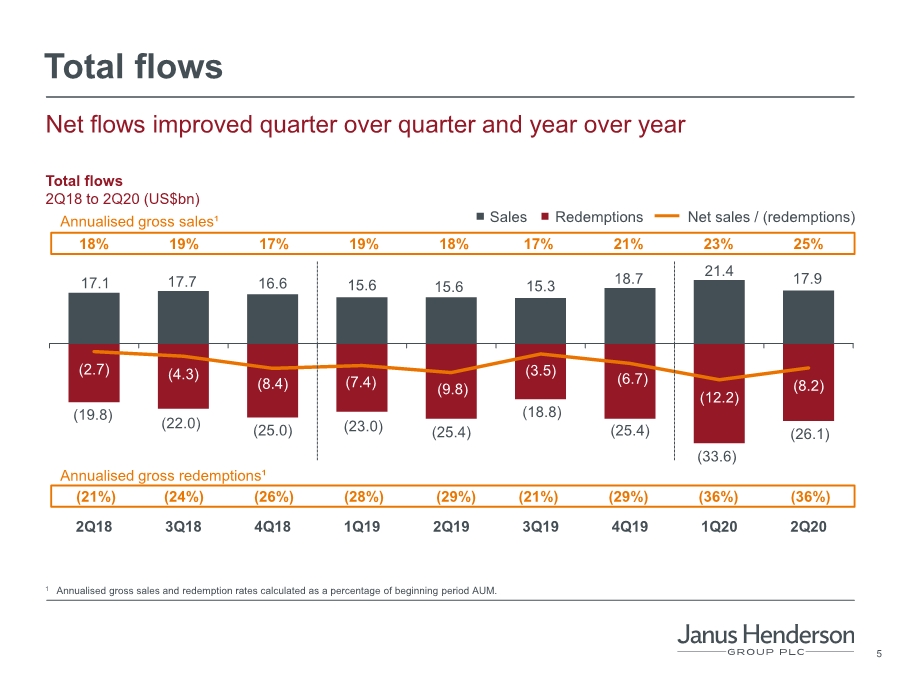
| 5 17.1 17.7 16.6 15.6 15.6 15.3 18.7 21.4 17.9 (19.8) (22.0) (25.0) (23.0) (25.4) (18.8) (25.4) (33.6) (26.1) (2.7) (4.3) (8.4) (7.4) (9.8) (3.5) (6.7) (12.2) (8.2) 2Q18 3Q18 4Q18 1Q19 2Q19 3Q19 4Q19 1Q20 2Q20 Total flows Total flows 2Q18 to 2Q20 (US$bn) Redemptions Sales Net sales / (redemptions) 18% 19% 17% 19% 18% 17% 21% 23% 25% Annualised gross sales¹ Annualised gross redemptions¹ Net flows improved quarter over quarter and year over year 1 Annualised gross sales and redemption rates calculated as a percentage of beginning period AUM. (21%) (24%) (26%) (28%) (29%) (21%) (29%) (36%) (36%) |
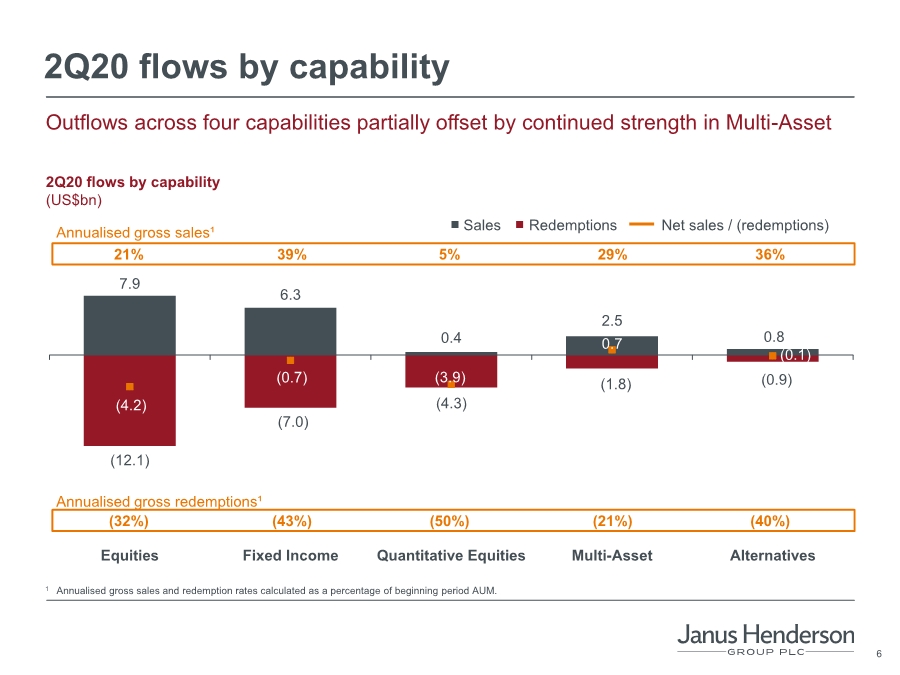
| 6 7.9 6.3 0.4 2.5 0.8 (12.1) (7.0) (4.3) (1.8) (0.9) (4.2) (0.7) (3.9) 0.7 (0.1) Equities Fixed Income Quantitative Equities Multi-Asset Alternatives 2Q20 flows by capability 2Q20 flows by capability (US$bn) Annualised gross sales¹ Redemptions Sales Net sales / (redemptions) 21% 39% 5% 29% 36% (32%) (43%) (50%) (21%) (40%) Annualised gross redemptions¹ Outflows across four capabilities partially offset by continued strength in Multi-Asset 1 Annualised gross sales and redemption rates calculated as a percentage of beginning period AUM. |
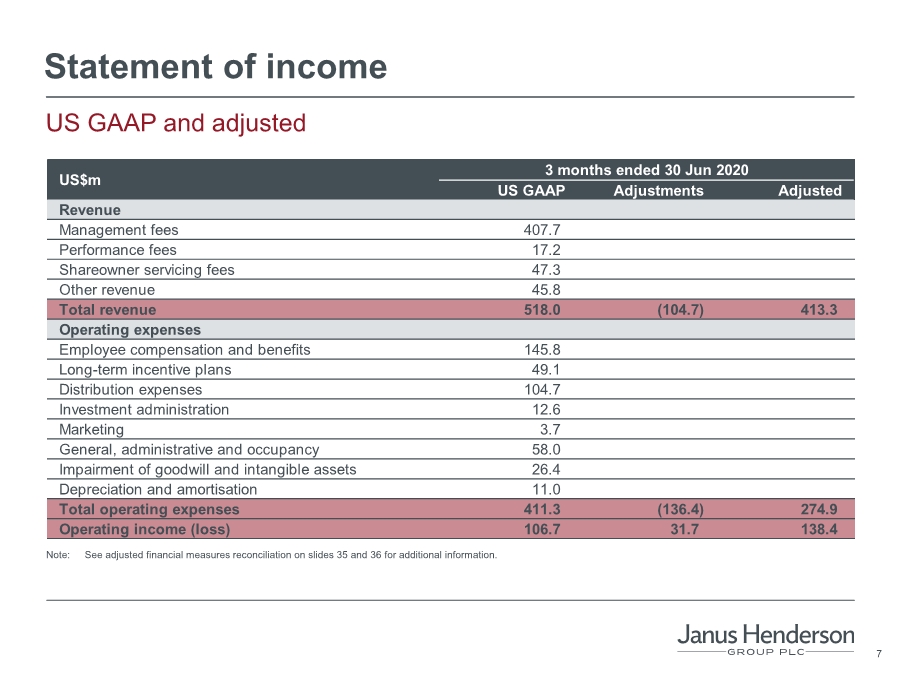
| 7 Statement of income US GAAP and adjusted US GAAP Adjustments Adjusted Revenue Management fees 407.7 Performance fees 17.2 Shareowner servicing fees 47.3 Other revenue 45.8 Total revenue 518.0 (104.7) 413.3 Operating expenses Employee compensation and benefits 145.8 Long-term incentive plans 49.1 Distribution expenses 104.7 Investment administration 12.6 Marketing 3.7 General, administrative and occupancy 58.0 Impairment of goodwill and intangible assets 26.4 Depreciation and amortisation 11.0 Total operating expenses 411.3 (136.4) 274.9 Operating income (loss) 106.7 31.7 138.4 US$m 3 months ended 30 Jun 2020 Note: See adjusted financial measures reconciliation on slides 35 and 36 for additional information. |
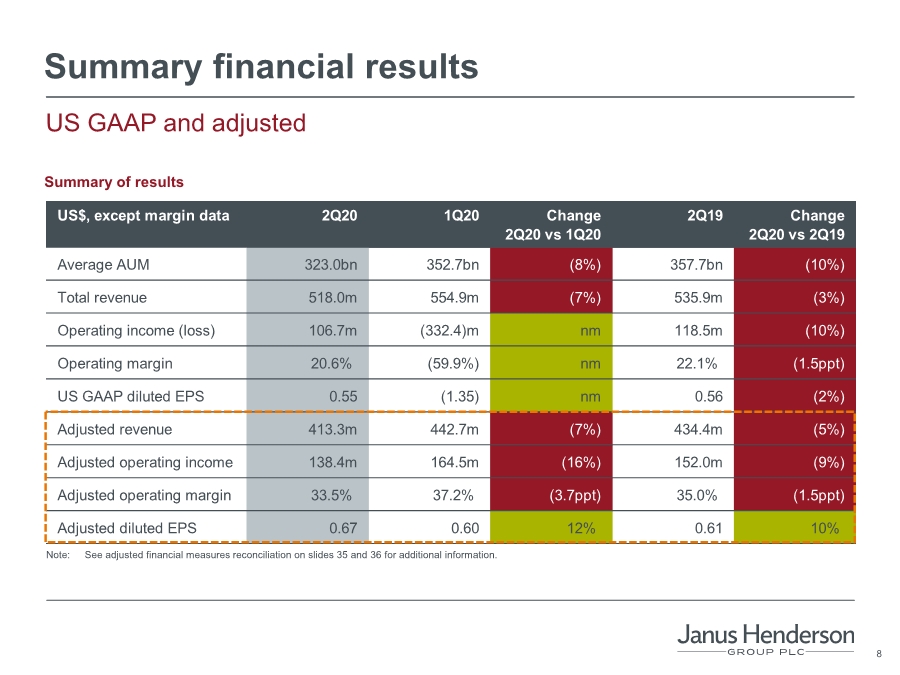
| 8 US$, except margin data 2Q20 1Q20 Change 2Q20 vs 1Q20 2Q19 Change 2Q20 vs 2Q19 Average AUM 323.0bn 352.7bn (8%) 357.7bn (10%) Total revenue 518.0m 554.9m (7%) 535.9m (3%) Operating income (loss) 106.7m (332.4)m nm 118.5m (10%) Operating margin 20.6% (59.9%) nm 22.1% (1.5ppt) US GAAP diluted EPS 0.55 (1.35) nm 0.56 (2%) Adjusted revenue 413.3m 442.7m (7%) 434.4m (5%) Adjusted operating income 138.4m 164.5m (16%) 152.0m (9%) Adjusted operating margin 33.5% 37.2% (3.7ppt) 35.0% (1.5ppt) Adjusted diluted EPS 0.67 0.60 12% 0.61 10% Summary financial results Summary of results Note: See adjusted financial measures reconciliation on slides 35 and 36 for additional information. US GAAP and adjusted |
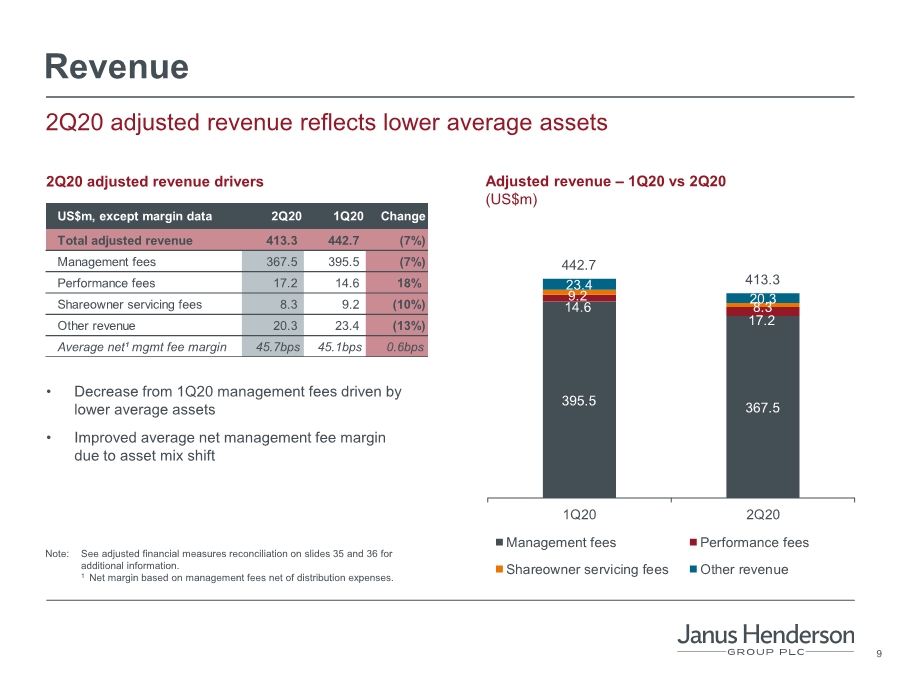
| 9 367.5 395.5 17.2 14.6 8.3 9.2 20.3 23.4 413.3 442.7 2Q20 1Q20 Management fees Performance fees Shareowner servicing fees Other revenue 2Q20 adjusted revenue drivers Revenue 2Q20 adjusted revenue reflects lower average assets Adjusted revenue – 1Q20 vs 2Q20 (US$m) Note: See adjusted financial measures reconciliation on slides 35 and 36 for additional information. 1 Net margin based on management fees net of distribution expenses. • Decrease from 1Q20 management fees driven by lower average assets • Improved average net management fee margin due to asset mix shift US$m, except margin data 2Q20 1Q20 Change Total adjusted revenue 413.3 442.7 (7%) Management fees 367.5 395.5 (7%) Performance fees 17.2 14.6 18% Shareowner servicing fees 8.3 9.2 (10%) Other revenue 20.3 23.4 (13%) Average net¹ mgmt fee margin 45.7bps 45.1bps 0.6bps |
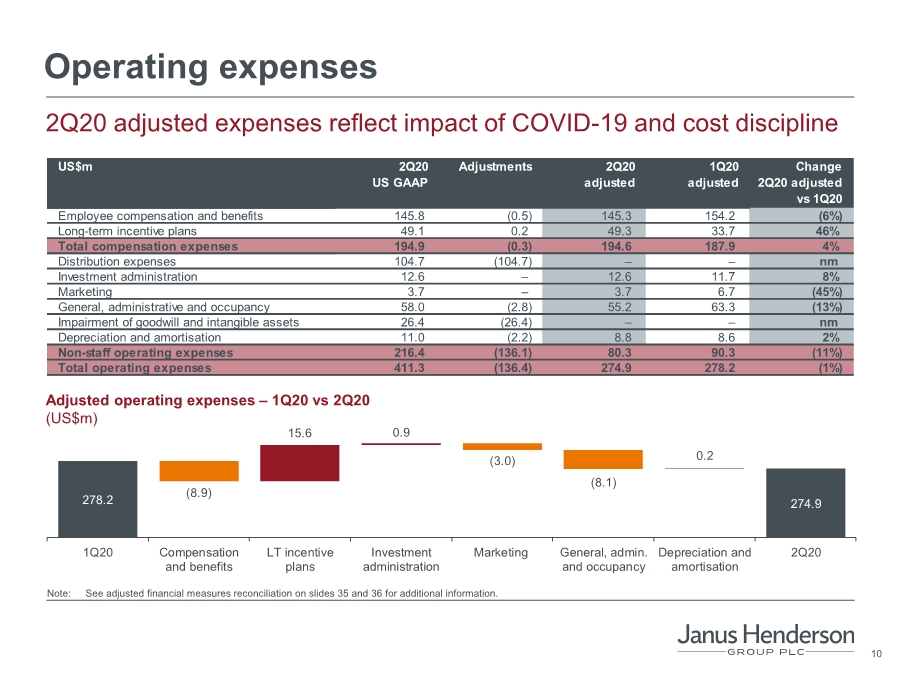
| 10 274.9 278.2 15.6 0.9 0.2 (8.9) (3.0) (8.1) 1Q20 Compensation and benefits LT incentive plans Investment administration Marketing General, admin. and occupancy Depreciation and amortisation 2Q20 Adjusted operating expenses – 1Q20 vs 2Q20 (US$m) Operating expenses Note: See adjusted financial measures reconciliation on slides 35 and 36 for additional information. 2Q20 adjusted expenses reflect impact of COVID-19 and cost discipline US$m 2Q20 US GAAP Adjustments 2Q20 adjusted 1Q20 adjusted Change 2Q20 adjusted vs 1Q20 adjusted Employee compensation and benefits 145.8 (0.5) 145.3 154.2 (6%) Long-term incentive plans 49.1 0.2 49.3 33.7 46% Total compensation expenses 194.9 (0.3) 194.6 187.9 4% Distribution expenses 104.7 (104.7) –– nm Investment administration 12.6 – 12.6 11.7 8% Marketing 3.7 – 3.7 6.7 (45%) General, administrative and occupancy 58.0 (2.8) 55.2 63.3 (13%) Impairment of goodwill and intangible assets 26.4 (26.4) –– nm Depreciation and amortisation 11.0 (2.2) 8.8 8.6 2% Non-staff operating expenses 216.4 (136.1) 80.3 90.3 (11%) Total operating expenses 411.3 (136.4) 274.9 278.2 (1%) |
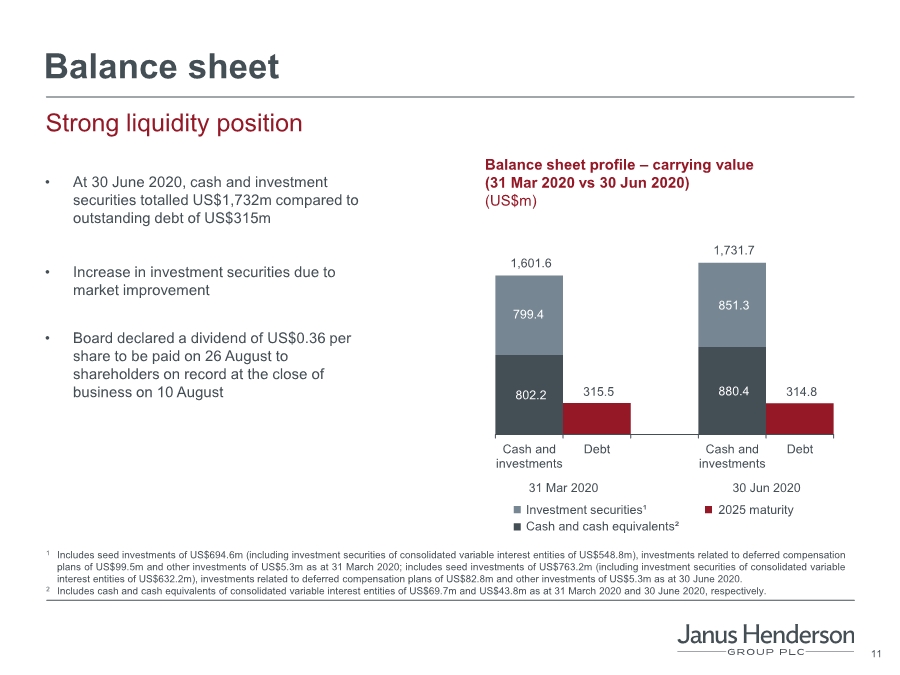
| 11 802.2 880.4 799.4 851.3 1,601.6 1,731.7 315.5 314.8 Cash and investments Debt Cash and investments Debt 1 Includes seed investments of US$694.6m (including investment securities of consolidated variable interest entities of US$548.8m), investments related to deferred compensation plans of US$99.5m and other investments of US$5.3m as at 31 March 2020; includes seed investments of US$763.2m (including investment securities of consolidated variable interest entities of US$632.2m), investments related to deferred compensation plans of US$82.8m and other investments of US$5.3m as at 30 June 2020. 2 Includes cash and cash equivalents of consolidated variable interest entities of US$69.7m and US$43.8m as at 31 March 2020 and 30 June 2020, respectively. Balance sheet • At 30 June 2020, cash and investment securities totalled US$1,732m compared to outstanding debt of US$315m • Increase in investment securities due to market improvement • Board declared a dividend of US$0.36 per share to be paid on 26 August to shareholders on record at the close of business on 10 August Strong liquidity position Investment securities¹ Cash and cash equivalents² 2025 maturity Balance sheet profile – carrying value (31 Mar 2020 vs 30 Jun 2020) (US$m) 30 Jun 2020 31 Mar 2020 |
| Dick Weil Chief Executive Officer Strategy Update |

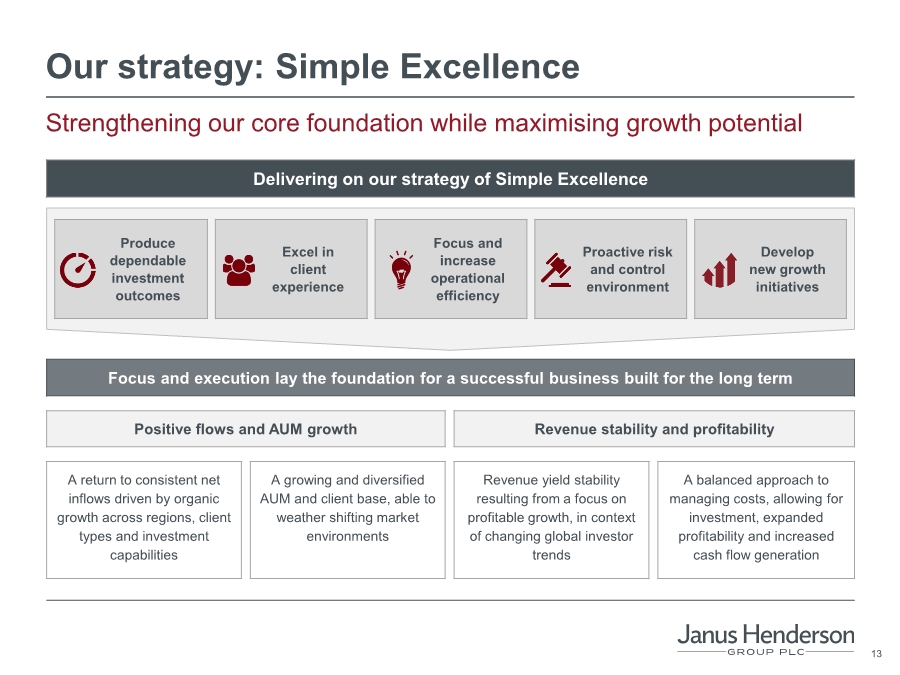
| 13 Delivering on our strategy of Simple Excellence Produce dependable investment outcomes Excel in client experience Focus and increase operational efficiency Proactive risk and control environment Develop new growth initiatives Our strategy: Simple Excellence Strengthening our core foundation while maximising growth potential Focus and execution lay the foundation for a successful business built for the long term Positive flows and AUM growth Revenue stability and profitability A return to consistent net inflows driven by organic growth across regions, client types and investment capabilities A growing and diversified AUM and client base, able to weather shifting market environments Revenue yield stability resulting from a focus on profitable growth, in context of changing global investor trends A balanced approach to managing costs, allowing for investment, expanded profitability and increased cash flow generation |
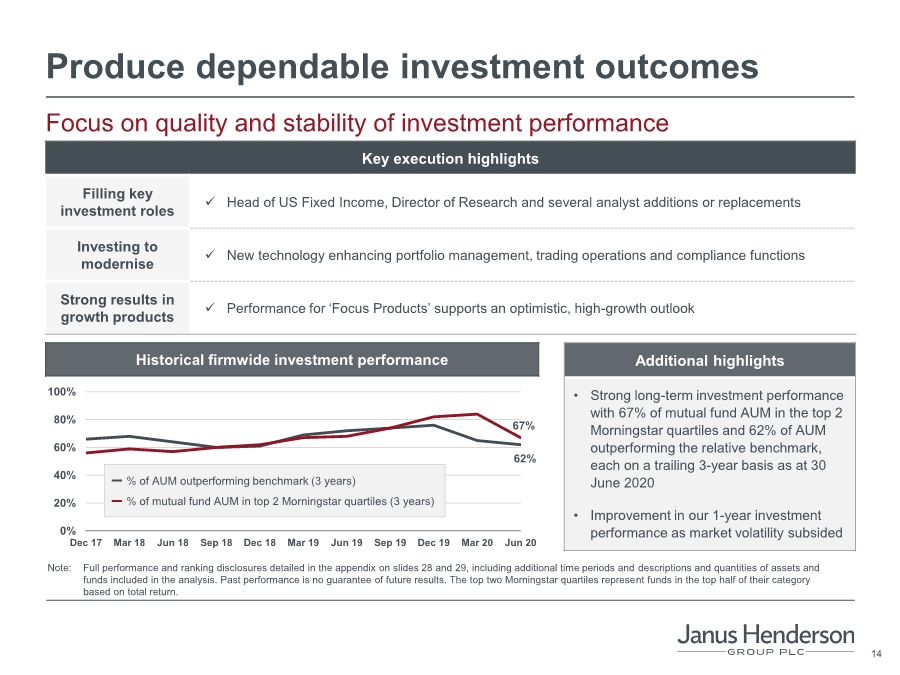
| 14 Produce dependable investment outcomes Focus on quality and stability of investment performance Key execution highlights Filling key investment roles ✓ Head of US Fixed Income, Director of Research and several analyst additions or replacements Investing to modernise ✓ New technology enhancing portfolio management, trading operations and compliance functions Strong results in growth products ✓ Performance for ‘Focus Products’ supports an optimistic, high-growth outlook Historical firmwide investment performance Additional highlights • Strong long-term investment performance with 67% of mutual fund AUM in the top 2 Morningstar quartiles and 62% of AUM outperforming the relative benchmark, each on a trailing 3-year basis as at 30 June 2020 • Improvement in our 1-year investment performance as market volatility subsided 62% 67% 0% 20% 40% 60% 80% 100% Dec 17 Mar 18 Jun 18 Sep 18 Dec 18 Mar 19 Jun 19 Sep 19 Dec 19 Mar 20 Jun 20 % of AUM outperforming benchmark (3 years) % of mutual fund AUM in top 2 Morningstar quartiles (3 years) Note: Full performance and ranking disclosures detailed in the appendix on slides 28 and 29, including additional time periods and descriptions and quantities of assets and funds included in the analysis. Past performance is no guarantee of future results. The top two Morningstar quartiles represent funds in the top half of their category based on total return. |
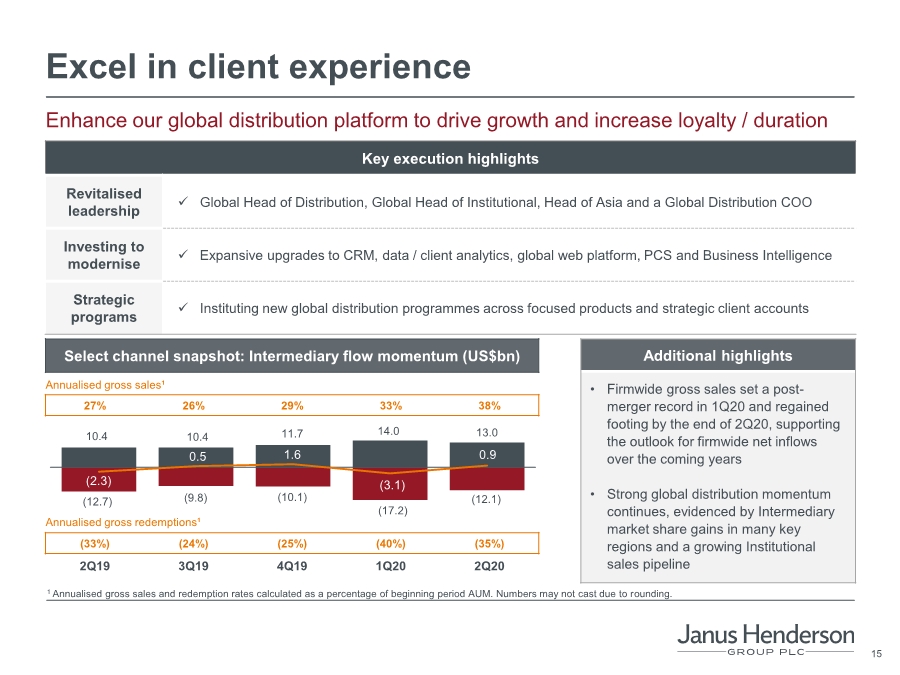
| 15 Excel in client experience Key execution highlights Revitalised leadership ✓ Global Head of Distribution, Global Head of Institutional, Head of Asia and a Global Distribution COO Investing to modernise ✓ Expansive upgrades to CRM, data / client analytics, global web platform, PCS and Business Intelligence Strategic programs ✓ Instituting new global distribution programmes across focused products and strategic client accounts Enhance our global distribution platform to drive growth and increase loyalty / duration 10.4 10.4 11.7 14.0 13.0 (12.7) (9.8) (10.1) (17.2) (12.1) (2.3) 0.5 1.6 (3.1) 0.9 Annualised gross sales¹ Annualised gross redemptions¹ 1 Annualised gross sales and redemption rates calculated as a percentage of beginning period AUM. Numbers may not cast due to rounding. 27% 26% 29% 33% 38% (33%) (24%) (25%) (40%) (35%) 2Q19 3Q19 4Q19 1Q20 2Q20 Additional highlights • Firmwide gross sales set a post- merger record in 1Q20 and regained footing by the end of 2Q20, supporting the outlook for firmwide net inflows over the coming years • Strong global distribution momentum continues, evidenced by Intermediary market share gains in many key regions and a growing Institutional sales pipeline Select channel snapshot: Intermediary flow momentum (US$bn) |
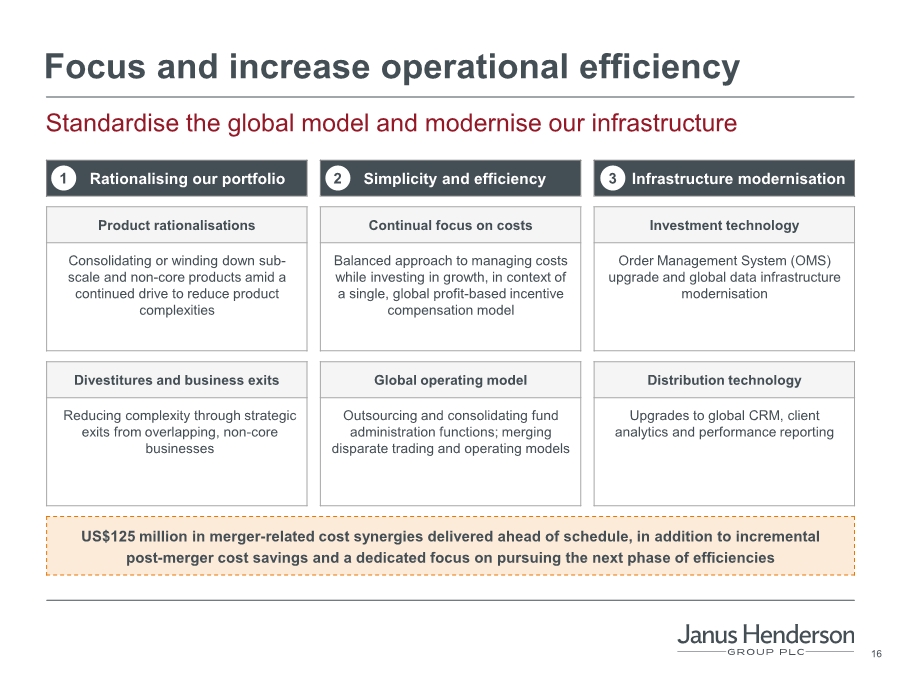
| 16 Focus and increase operational efficiency Standardise the global model and modernise our infrastructure Rationalising our portfolio Simplicity and efficiency Infrastructure modernisation Product rationalisations Continual focus on costs Investment technology Consolidating or winding down sub- scale and non-core products amid a continued drive to reduce product complexities Balanced approach to managing costs while investing in growth, in context of a single, global profit-based incentive compensation model Order Management System (OMS) upgrade and global data infrastructure modernisation Divestitures and business exits Global operating model Distribution technology Reducing complexity through strategic exits from overlapping, non-core businesses Outsourcing and consolidating fund administration functions; merging disparate trading and operating models Upgrades to global CRM, client analytics and performance reporting US$125 million in merger-related cost synergies delivered ahead of schedule, in addition to incremental post-merger cost savings and a dedicated focus on pursuing the next phase of efficiencies 1 2 3 |
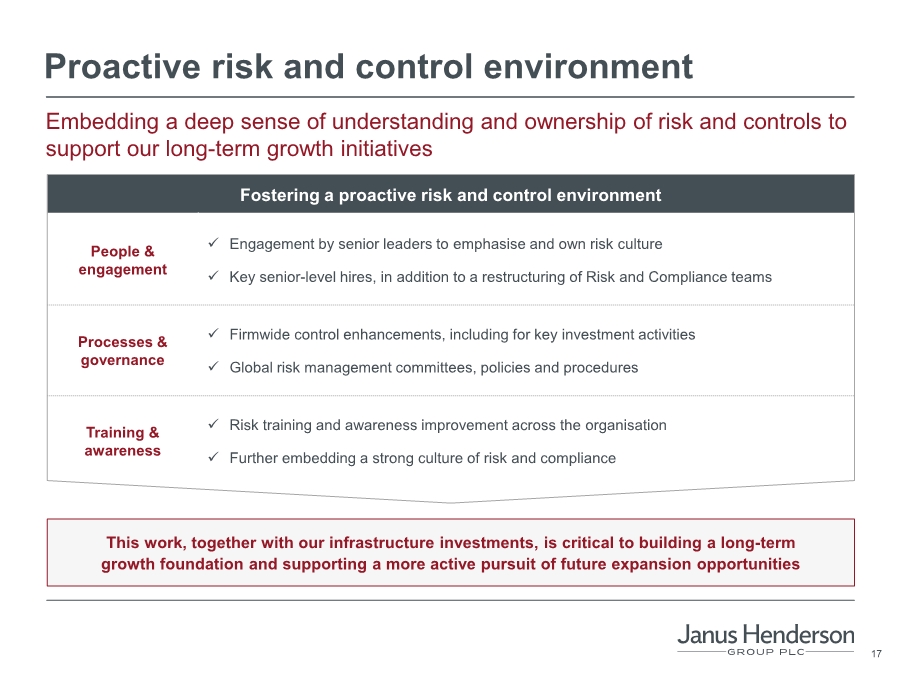
| 17 Proactive risk and control environment This work, together with our infrastructure investments, is critical to building a long-term growth foundation and supporting a more active pursuit of future expansion opportunities Embedding a deep sense of understanding and ownership of risk and controls to support our long-term growth initiatives Fostering a proactive risk and control environment People & engagement ✓ Engagement by senior leaders to emphasise and own risk culture ✓ Key senior-level hires, in addition to a restructuring of Risk and Compliance teams Processes & governance ✓ Firmwide control enhancements, including for key investment activities ✓ Global risk management committees, policies and procedures Training & awareness ✓ Risk training and awareness improvement across the organisation ✓ Further embedding a strong culture of risk and compliance |
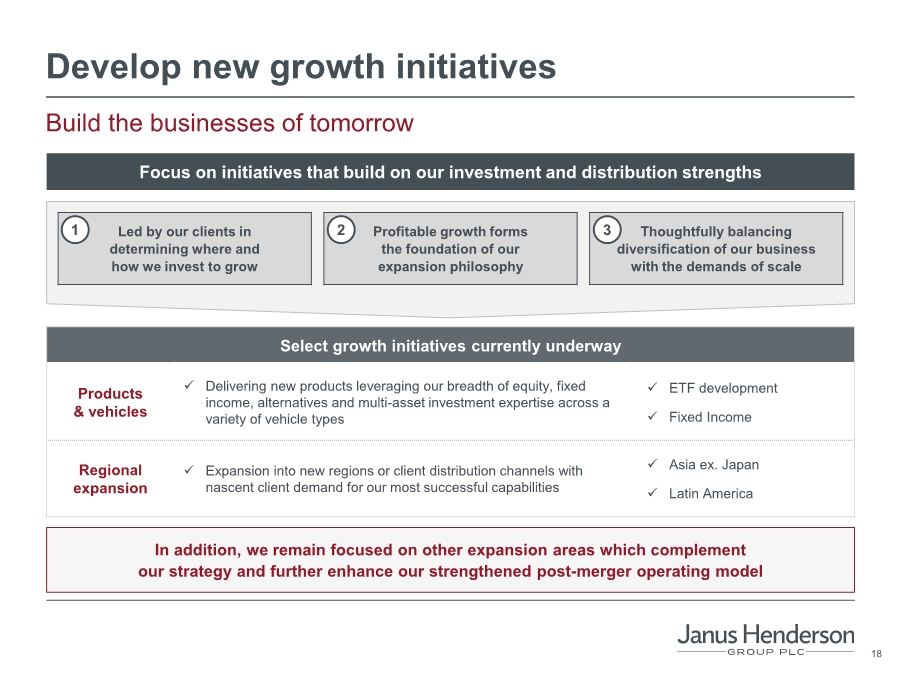
| 18 Develop new growth initiatives Build the businesses of tomorrow Focus on initiatives that build on our investment and distribution strengths Led by our clients in determining where and how we invest to grow Profitable growth forms the foundation of our expansion philosophy Thoughtfully balancing diversification of our business with the demands of scale Select growth initiatives currently underway Products & vehicles ✓ Delivering new products leveraging our breadth of equity, fixed income, alternatives and multi-asset investment expertise across a variety of vehicle types ✓ ETF development ✓ Fixed Income Regional expansion ✓ Expansion into new regions or client distribution channels with nascent client demand for our most successful capabilities ✓ Asia ex. Japan ✓ Latin America In addition, we remain focused on other expansion areas which complement our strategy and further enhance our strengthened post-merger operating model 1 2 3 |
| Q&A |

| Appendix |

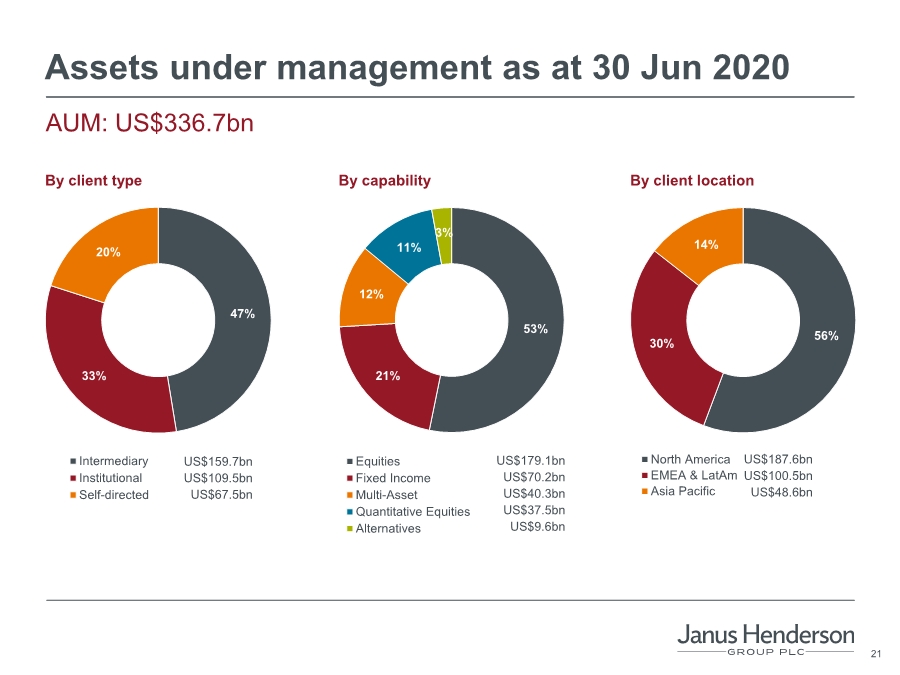
| 21 53% 21% 12% 11% 3% Equities Fixed Income Multi-Asset Quantitative Equities Alternatives Assets under management as at 30 Jun 2020 47% 33% 20% Intermediary Institutional Self-directed 56% 30% 14% North America EMEA & LatAm Asia Pacific By client type By capability By client location US$179.1bn US$70.2bn US$40.3bn US$37.5bn US$9.6bn US$159.7bn US$109.5bn US$67.5bn US$187.6bn US$100.5bn US$48.6bn AUM: US$336.7bn |
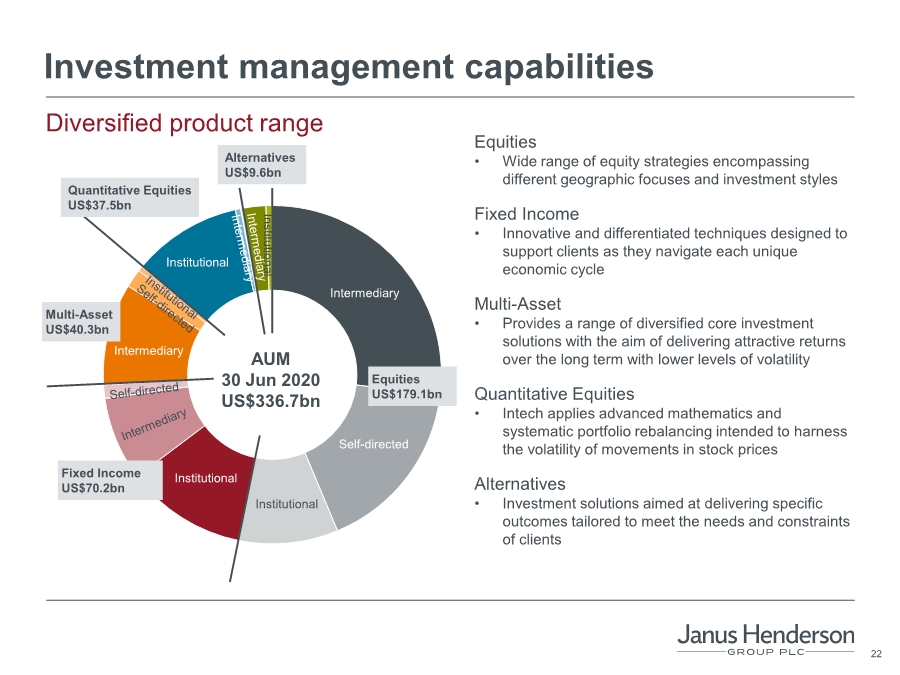
| 22 Investment management capabilities Diversified product range Equities US$179.1bn AUM 30 Jun 2020 US$336.7bn Fixed Income US$70.2bn Multi-Asset US$40.3bn Self-directed Intermediary Institutional Institutional Institutional Quantitative Equities US$37.5bn Institutional Alternatives US$9.6bn Equities • Wide range of equity strategies encompassing different geographic focuses and investment styles Fixed Income • Innovative and differentiated techniques designed to support clients as they navigate each unique economic cycle Multi-Asset • Provides a range of diversified core investment solutions with the aim of delivering attractive returns over the long term with lower levels of volatility Quantitative Equities • Intech applies advanced mathematics and systematic portfolio rebalancing intended to harness the volatility of movements in stock prices Alternatives • Investment solutions aimed at delivering specific outcomes tailored to meet the needs and constraints of clients Intermediary |
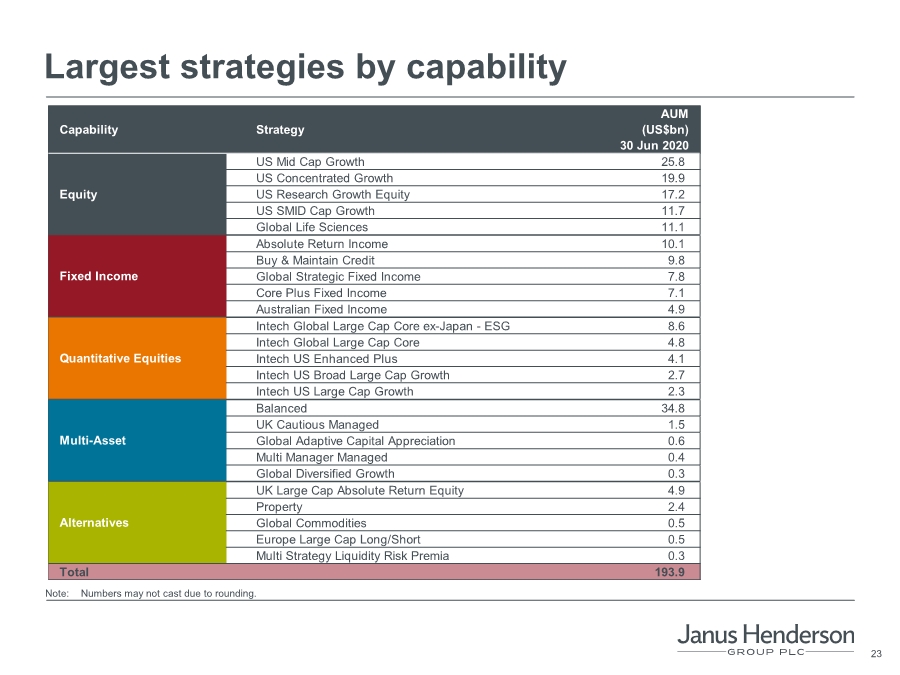
| 23 Capability Strategy AUM (US$bn) 30 Jun 2020 US Mid Cap Growth 25.8 US Concentrated Growth 19.9 US Research Growth Equity 17.2 US SMID Cap Growth 11.7 Global Life Sciences 11.1 Absolute Return Income 10.1 Buy & Maintain Credit 9.8 Global Strategic Fixed Income 7.8 Core Plus Fixed Income 7.1 Australian Fixed Income 4.9 Intech Global Large Cap Core ex-Japan - ESG 8.6 Intech Global Large Cap Core 4.8 Intech US Enhanced Plus 4.1 Intech US Broad Large Cap Growth 2.7 Intech US Large Cap Growth 2.3 Balanced 34.8 UK Cautious Managed 1.5 Global Adaptive Capital Appreciation 0.6 Multi Manager Managed 0.4 Global Diversified Growth 0.3 UK Large Cap Absolute Return Equity 4.9 Property 2.4 Global Commodities 0.5 Europe Large Cap Long/Short 0.5 Multi Strategy Liquidity Risk Premia 0.3 Total 193.9 Equity Fixed Income Multi-Asset Alternatives Quantitative Equities Largest strategies by capability Note: Numbers may not cast due to rounding. |
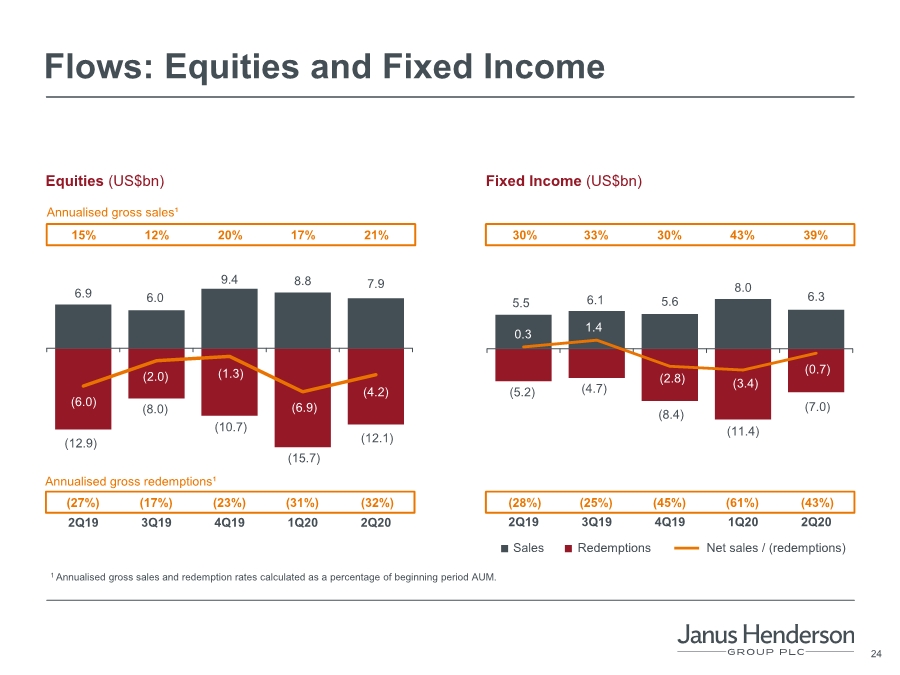
| 24 5.5 6.1 5.6 8.0 6.3 (5.2) (4.7) (8.4) (11.4) (7.0) 0.3 1.4 (2.8) (3.4) (0.7) 2Q19 3Q19 4Q19 1Q20 2Q20 6.9 6.0 9.4 8.8 7.9 (12.9) (8.0) (10.7) (15.7) (12.1) (6.0) (2.0) (1.3) (6.9) (4.2) 2Q19 3Q19 4Q19 1Q20 2Q20 (27%) (17%) (23%) (31%) (32%) Flows: Equities and Fixed Income Equities (US$bn) Fixed Income (US$bn) Redemptions Sales Net sales / (redemptions) Annualised gross sales¹ Annualised gross redemptions¹ 15% 12% 20% 17% 21% 30% 33% 30% 43% 39% (28%) (25%) (45%) (61%) (43%) 1 Annualised gross sales and redemption rates calculated as a percentage of beginning period AUM. |
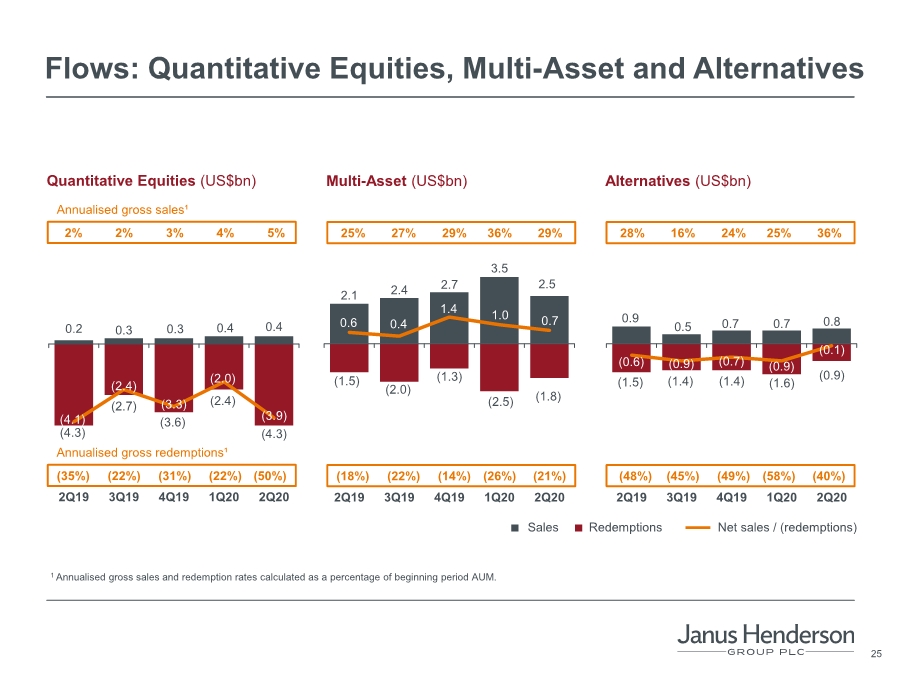
| 25 2.1 2.4 2.7 3.5 2.5 (1.5) (2.0) (1.3) (2.5) (1.8) 0.6 0.4 1.4 1.0 0.7 2Q19 3Q19 4Q19 1Q20 2Q20 0.2 0.3 0.3 0.4 0.4 (4.3) (2.7) (3.6) (2.4) (4.3) (4.1) (2.4) (3.3) (2.0) (3.9) 2Q19 3Q19 4Q19 1Q20 2Q20 0.9 0.5 0.7 0.7 0.8 (1.5) (1.4) (1.4) (1.6) (0.9) (0.6) (0.9) (0.7) (0.9) (0.1) 2Q19 3Q19 4Q19 1Q20 2Q20 Flows: Quantitative Equities, Multi-Asset and Alternatives Quantitative Equities (US$bn) Multi-Asset (US$bn) Alternatives (US$bn) 2% 2% 3% 4% 5% Annualised gross sales¹ Annualised gross redemptions¹ Redemptions Sales Net sales / (redemptions) 25% 27% 29% 36% 29% 28% 16% 24% 25% 36% (35%) (22%) (31%) (22%) (50%) (18%) (22%) (14%) (26%) (21%) (48%) (45%) (49%) (58%) (40%) 1 Annualised gross sales and redemption rates calculated as a percentage of beginning period AUM. |
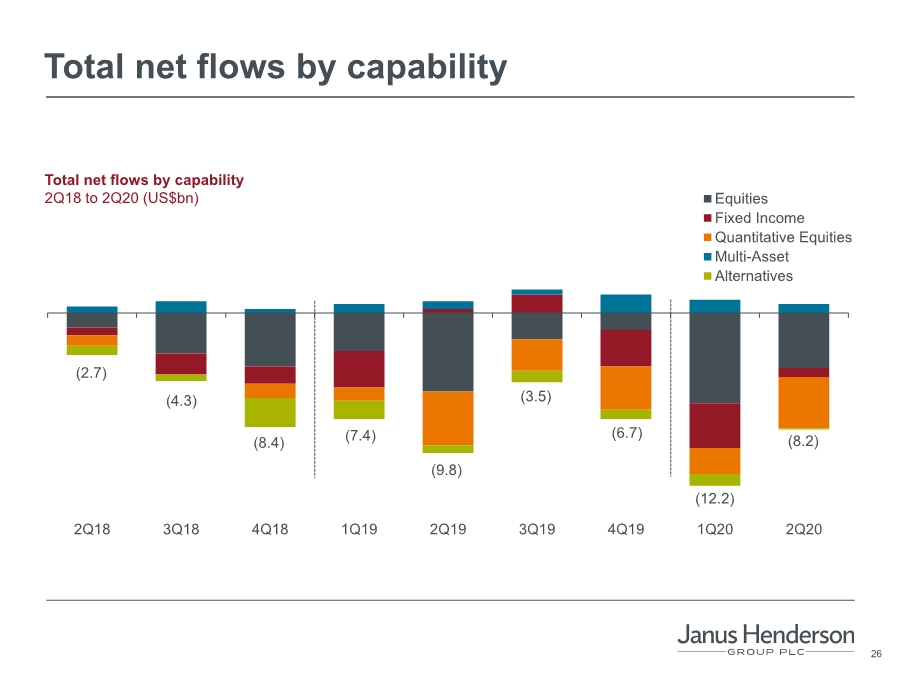
| 26 Total net flows by capability 2Q18 3Q18 4Q18 1Q19 2Q19 3Q19 4Q19 1Q20 2Q20 Equities Fixed Income Quantitative Equities Multi-Asset Alternatives Total net flows by capability 2Q18 to 2Q20 (US$bn) (12.2) (2.7) (4.3) (7.4) (8.4) (9.8) (3.5) (6.7) (8.2) |
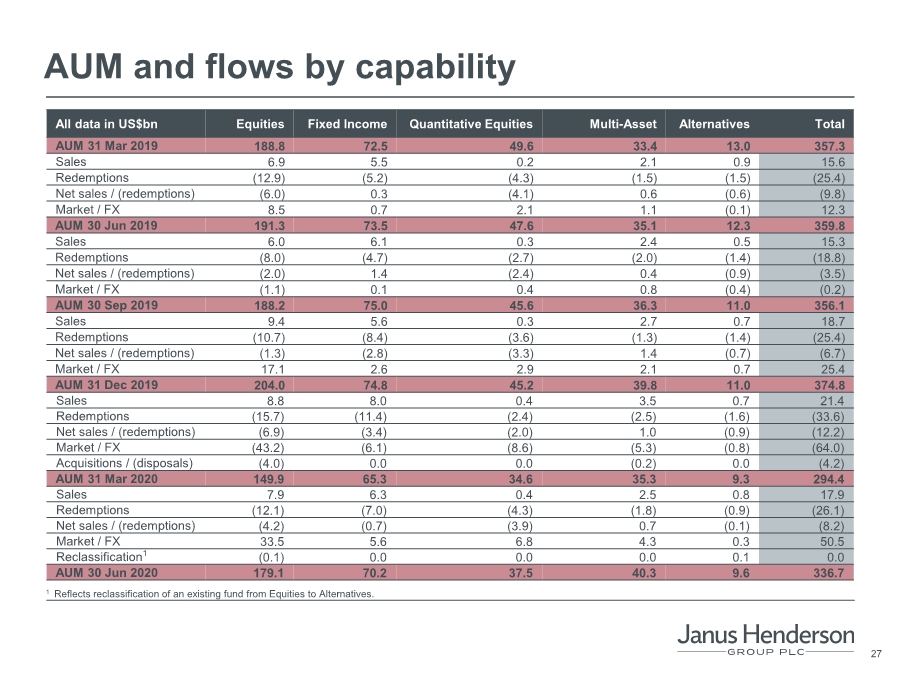
| 27 AUM and flows by capability All data in US$bn Equities Fixed Income Quantitative Equities Multi-Asset Alternatives Total AUM 31 Mar 2019 188.8 72.5 49.6 33.4 13.0 357.3 Sales 6.9 5.5 0.2 2.1 0.9 15.6 Redemptions (12.9) (5.2) (4.3) (1.5) (1.5) (25.4) Net sales / (redemptions) (6.0) 0.3 (4.1) 0.6 (0.6) (9.8) Market / FX 8.5 0.7 2.1 1.1 (0.1) 12.3 AUM 30 Jun 2019 191.3 73.5 47.6 35.1 12.3 359.8 Sales 6.0 6.1 0.3 2.4 0.5 15.3 Redemptions (8.0) (4.7) (2.7) (2.0) (1.4) (18.8) Net sales / (redemptions) (2.0) 1.4 (2.4) 0.4 (0.9) (3.5) Market / FX (1.1) 0.1 0.4 0.8 (0.4) (0.2) AUM 30 Sep 2019 188.2 75.0 45.6 36.3 11.0 356.1 Sales 9.4 5.6 0.3 2.7 0.7 18.7 Redemptions (10.7) (8.4) (3.6) (1.3) (1.4) (25.4) Net sales / (redemptions) (1.3) (2.8) (3.3) 1.4 (0.7) (6.7) Market / FX 17.1 2.6 2.9 2.1 0.7 25.4 AUM 31 Dec 2019 204.0 74.8 45.2 39.8 11.0 374.8 Sales 8.8 8.0 0.4 3.5 0.7 21.4 Redemptions (15.7) (11.4) (2.4) (2.5) (1.6) (33.6) Net sales / (redemptions) (6.9) (3.4) (2.0) 1.0 (0.9) (12.2) Market / FX (43.2) (6.1) (8.6) (5.3) (0.8) (64.0) Acquisitions / (disposals) (4.0) 0.0 0.0 (0.2) 0.0 (4.2) AUM 31 Mar 2020 149.9 65.3 34.6 35.3 9.3 294.4 Sales 7.9 6.3 0.4 2.5 0.8 17.9 Redemptions (12.1) (7.0) (4.3) (1.8) (0.9) (26.1) Net sales / (redemptions) (4.2) (0.7) (3.9) 0.7 (0.1) (8.2) Market / FX 33.5 5.6 6.8 4.3 0.3 50.5 Reclassification1 (0.1) 0.0 0.0 0.0 0.1 0.0 AUM 30 Jun 2020 179.1 70.2 37.5 40.3 9.6 336.7 1 Reflects reclassification of an existing fund from Equities to Alternatives. |
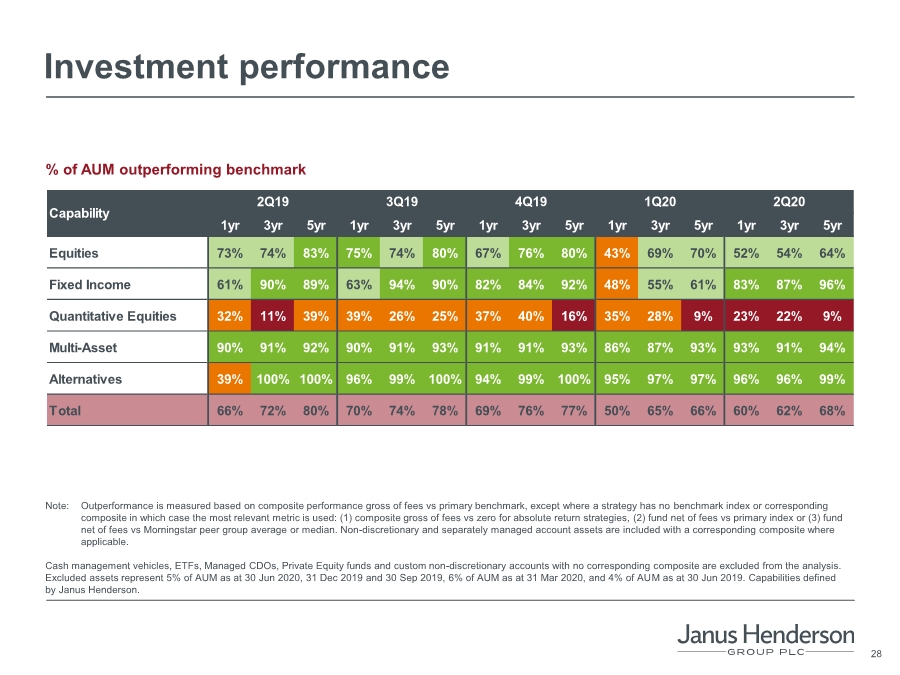
| 28 Investment performance % of AUM outperforming benchmark Note: Outperformance is measured based on composite performance gross of fees vs primary benchmark, except where a strategy has no benchmark index or corresponding composite in which case the most relevant metric is used: (1) composite gross of fees vs zero for absolute return strategies, (2) fund net of fees vs primary index or (3) fund net of fees vs Morningstar peer group average or median. Non-discretionary and separately managed account assets are included with a corresponding composite where applicable. Cash management vehicles, ETFs, Managed CDOs, Private Equity funds and custom non-discretionary accounts with no corresponding composite are excluded from the analysis. Excluded assets represent 5% of AUM as at 30 Jun 2020, 31 Dec 2019 and 30 Sep 2019, 6% of AUM as at 31 Mar 2020, and 4% of AUM as at 30 Jun 2019. Capabilities defined by Janus Henderson. 1yr 3yr 5yr 1yr 3yr 5yr 1yr 3yr 5yr 1yr 3yr 5yr 1yr 3yr 5yr Equities 73% 74% 83% 75% 74% 80% 67% 76% 80% 43% 69% 70% 52% 54% 64% Fixed Income 61% 90% 89% 63% 94% 90% 82% 84% 92% 48% 55% 61% 83% 87% 96% Quantitative Equities 32% 11% 39% 39% 26% 25% 37% 40% 16% 35% 28% 9% 23% 22% 9% Multi-Asset 90% 91% 92% 90% 91% 93% 91% 91% 93% 86% 87% 93% 93% 91% 94% Alternatives 39% 100% 100% 96% 99% 100% 94% 99% 100% 95% 97% 97% 96% 96% 99% Total 66% 72% 80% 70% 74% 78% 69% 76% 77% 50% 65% 66% 60% 62% 68% Capability 2Q19 3Q19 4Q19 1Q20 2Q20 |
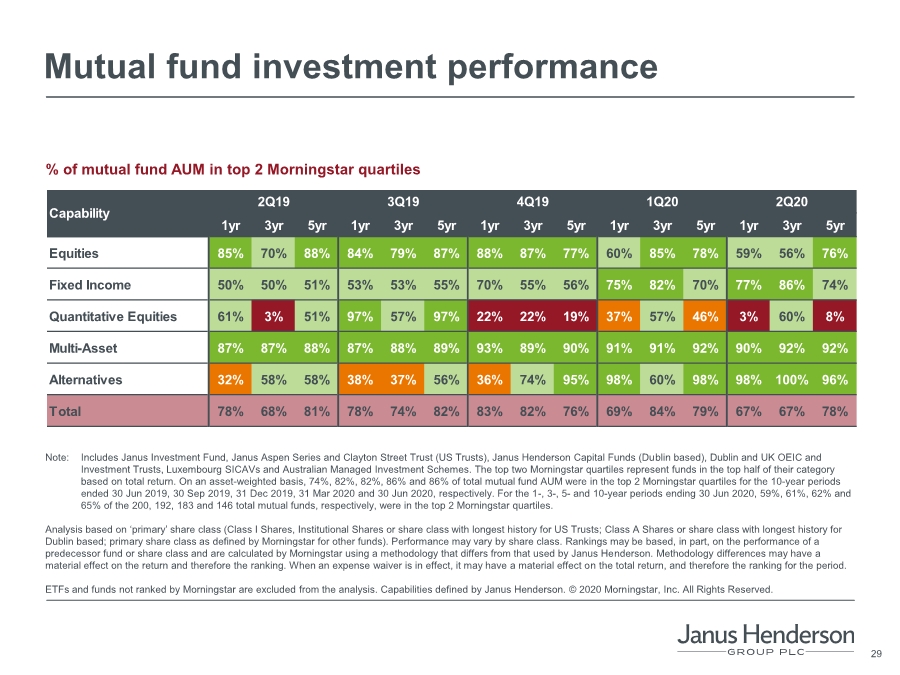
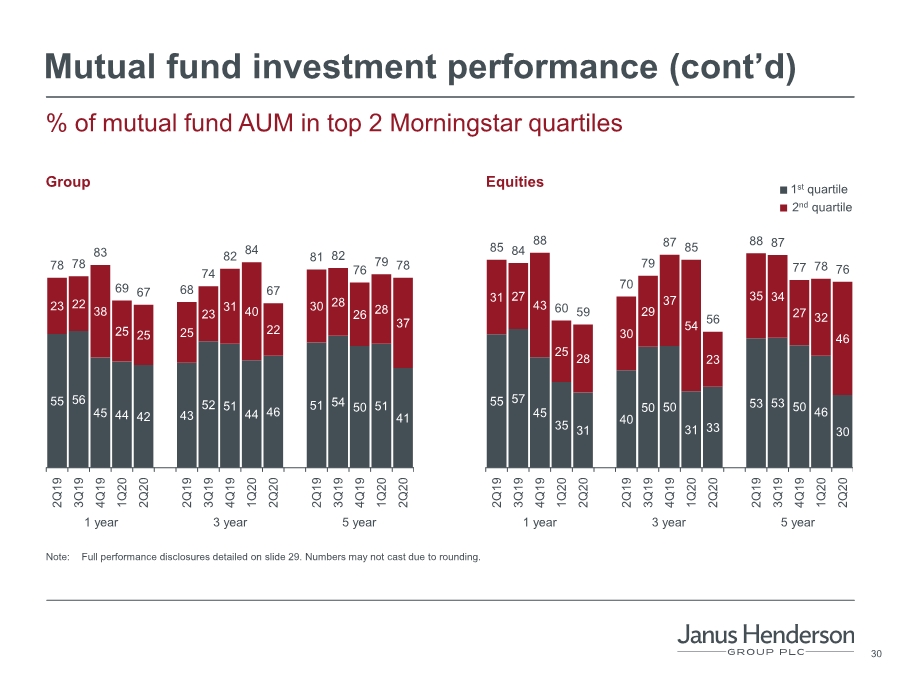
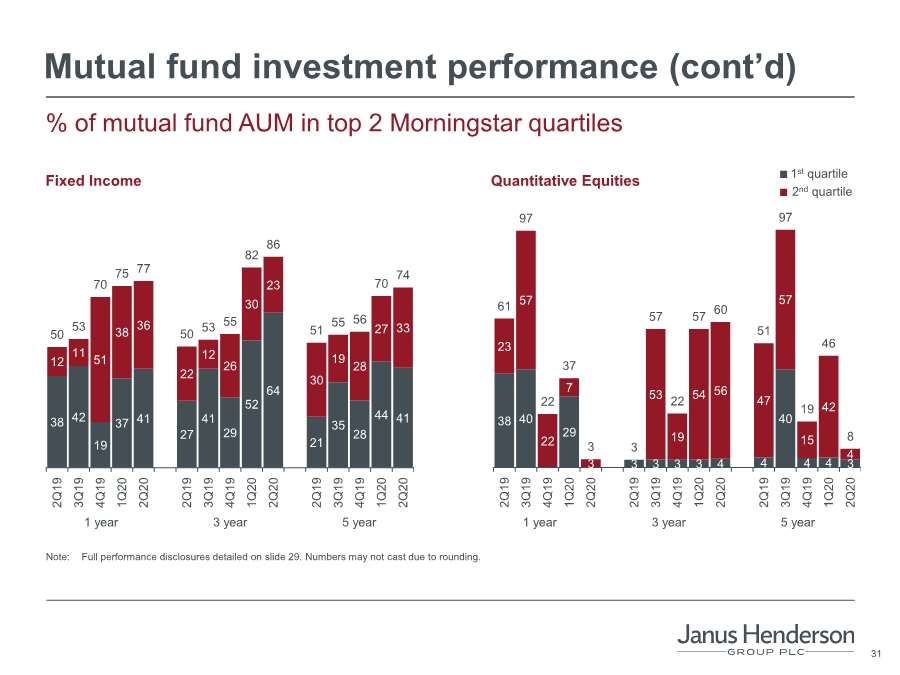
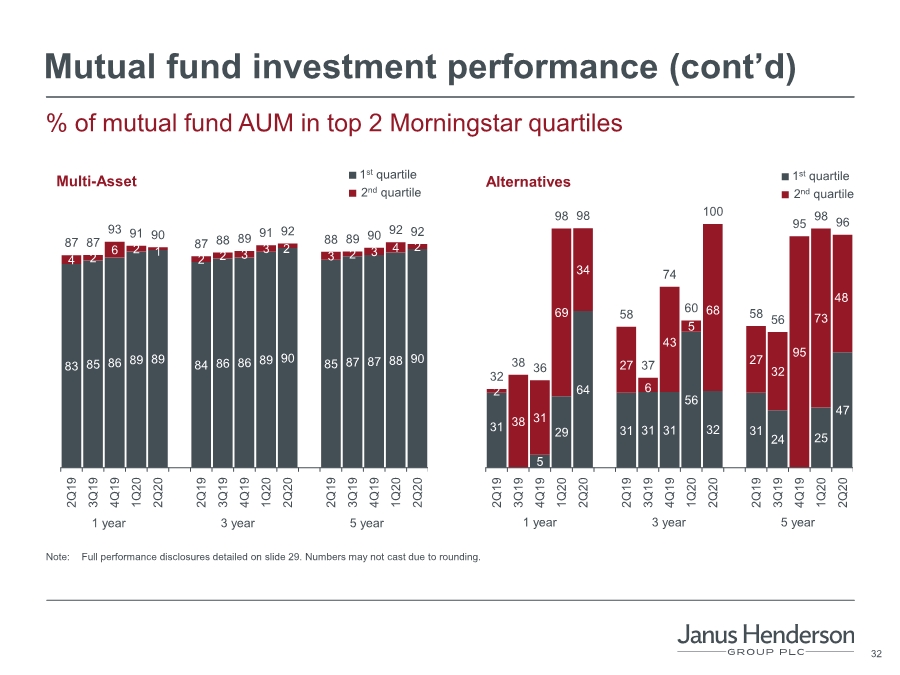
| 29 Mutual fund investment performance % of mutual fund AUM in top 2 Morningstar quartiles Note: Includes Janus Investment Fund, Janus Aspen Series and Clayton Street Trust (US Trusts), Janus Henderson Capital Funds (Dublin based), Dublin and UK OEIC and Investment Trusts, Luxembourg SICAVs and Australian Managed Investment Schemes. The top two Morningstar quartiles represent funds in the top half of their category based on total return. On an asset-weighted basis, 74%, 82%, 82%, 86% and 86% of total mutual fund AUM were in the top 2 Morningstar quartiles for the 10-year periods ended 30 Jun 2019, 30 Sep 2019, 31 Dec 2019, 31 Mar 2020 and 30 Jun 2020, respectively. For the 1-, 3-, 5- and 10-year periods ending 30 Jun 2020, 59%, 61%, 62% and 65% of the 200, 192, 183 and 146 total mutual funds, respectively, were in the top 2 Morningstar quartiles. Analysis based on ‘primary’ share class (Class I Shares, Institutional Shares or share class with longest history for US Trusts; Class A Shares or share class with longest history for Dublin based; primary share class as defined by Morningstar for other funds). Performance may vary by share class. Rankings may be based, in part, on the performance of a predecessor fund or share class and are calculated by Morningstar using a methodology that differs from that used by Janus Henderson. Methodology differences may have a material effect on the return and therefore the ranking. When an expense waiver is in effect, it may have a material effect on the total return, and therefore the ranking for the period. ETFs and funds not ranked by Morningstar are excluded from the analysis. Capabilities defined by Janus Henderson. © 2020 Morningstar, Inc. All Rights Reserved. 1yr 3yr 5yr 1yr 3yr 5yr 1yr 3yr 5yr 1yr 3yr 5yr 1yr 3yr 5yr Equities 85% 70% 88% 84% 79% 87% 88% 87% 77% 60% 85% 78% 59% 56% 76% Fixed Income 50% 50% 51% 53% 53% 55% 70% 55% 56% 75% 82% 70% 77% 86% 74% Quantitative Equities 61% 3% 51% 97% 57% 97% 22% 22% 19% 37% 57% 46% 3% 60% 8% Multi-Asset 87% 87% 88% 87% 88% 89% 93% 89% 90% 91% 91% 92% 90% 92% 92% Alternatives 32% 58% 58% 38% 37% 56% 36% 74% 95% 98% 60% 98% 98% 100% 96% Total 78% 68% 81% 78% 74% 82% 83% 82% 76% 69% 84% 79% 67% 67% 78% 2Q20 Capability 2Q19 3Q19 4Q19 1Q20 |
| 30 Mutual fund investment performance (cont’d) Group 55 56 45 44 42 43 52 51 44 46 51 54 50 51 41 23 22 38 25 25 25 23 31 40 22 30 28 26 28 37 78 78 83 69 67 68 74 82 84 67 81 82 76 79 78 2Q19 3Q19 4Q19 1Q20 2Q20 2Q19 3Q19 4Q19 1Q20 2Q20 2Q19 3Q19 4Q19 1Q20 2Q20 % of mutual fund AUM in top 2 Morningstar quartiles Equities 55 57 45 35 31 40 50 50 31 33 53 53 50 46 30 31 27 43 25 28 30 29 37 54 23 35 34 27 32 46 85 84 88 60 59 70 79 87 85 56 88 87 77 78 76 2Q19 3Q19 4Q19 1Q20 2Q20 2Q19 3Q19 4Q19 1Q20 2Q20 2Q19 3Q19 4Q19 1Q20 2Q20 1 year 3 year 5 year 1 year 3 year 5 year 2nd quartile 1st quartile Note: Full performance disclosures detailed on slide 29. Numbers may not cast due to rounding. |
| 31 38 40 29 3 3 3 3 4 4 40 4 4 3 23 57 22 7 3 53 19 54 56 47 57 15 42 4 61 97 22 37 3 3 57 22 57 60 51 97 19 46 8 2Q19 3Q19 4Q19 1Q20 2Q20 2Q19 3Q19 4Q19 1Q20 2Q20 2Q19 3Q19 4Q19 1Q20 2Q20 Mutual fund investment performance (cont’d) Fixed Income 38 42 19 37 41 27 41 29 52 64 21 35 28 44 41 12 11 51 38 36 22 12 26 30 23 30 19 28 27 33 50 53 70 75 77 50 53 55 82 86 51 55 56 70 74 2Q19 3Q19 4Q19 1Q20 2Q20 2Q19 3Q19 4Q19 1Q20 2Q20 2Q19 3Q19 4Q19 1Q20 2Q20 % of mutual fund AUM in top 2 Morningstar quartiles 1 year 3 year 5 year 1 year 3 year 5 year 2nd quartile 1st quartile Quantitative Equities Note: Full performance disclosures detailed on slide 29. Numbers may not cast due to rounding. |
| 32 Mutual fund investment performance (cont’d) % of mutual fund AUM in top 2 Morningstar quartiles Alternatives 31 5 29 64 31 31 31 56 32 31 24 25 47 2 38 31 69 34 27 6 43 5 68 27 32 95 73 48 32 38 36 98 98 58 37 74 60 100 58 56 95 98 96 2Q19 3Q19 4Q19 1Q20 2Q20 2Q19 3Q19 4Q19 1Q20 2Q20 2Q19 3Q19 4Q19 1Q20 2Q20 1 year 3 year 5 year 2nd quartile 1st quartile 1 year 3 year 5 year 2nd quartile 1st quartile 83 85 86 89 89 84 86 86 89 90 85 87 87 88 90 4 2 6 2 1 2 2 3 3 2 3 2 3 4 2 87 87 93 91 90 87 88 89 91 92 88 89 90 92 92 2Q19 3Q19 4Q19 1Q20 2Q20 2Q19 3Q19 4Q19 1Q20 2Q20 2Q19 3Q19 4Q19 1Q20 2Q20 Multi-Asset Note: Full performance disclosures detailed on slide 29. Numbers may not cast due to rounding. |
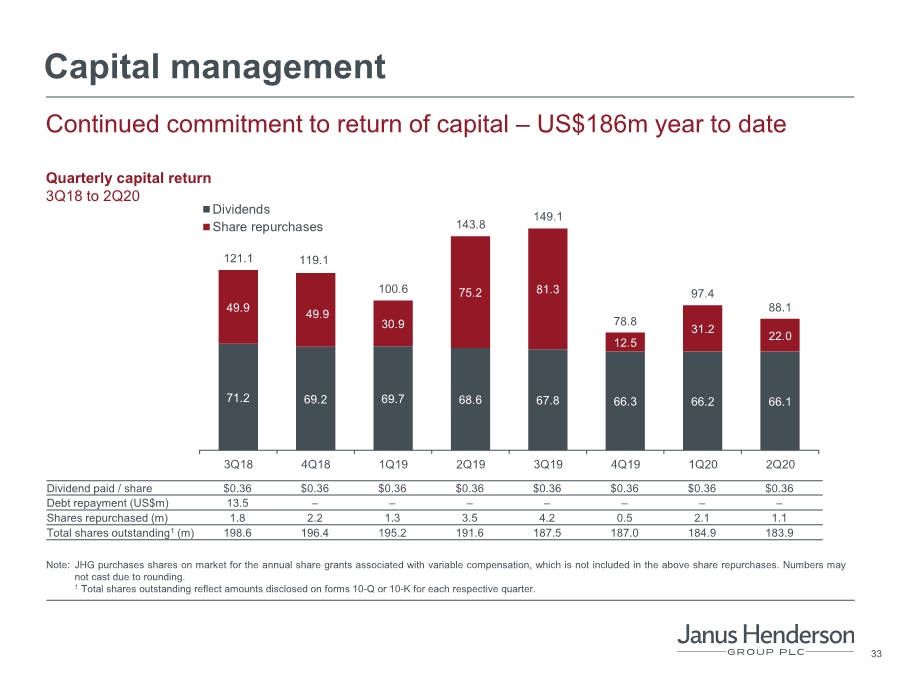
| 33 Capital management Continued commitment to return of capital – US$186m year to date Note: JHG purchases shares on market for the annual share grants associated with variable compensation, which is not included in the above share repurchases. Numbers may not cast due to rounding. 1 Total shares outstanding reflect amounts disclosed on forms 10-Q or 10-K for each respective quarter. Quarterly capital return 3Q18 to 2Q20 Dividend paid / share $0.36 $0.36 $0.36 $0.36 $0.36 $0.36 $0.36 $0.36 Debt repayment (US$m) 13.5 ––––––– Shares repurchased (m) 1.8 2.2 1.3 3.5 4.2 0.5 2.1 1.1 Total shares outstanding1 (m) 198.6 196.4 195.2 191.6 187.5 187.0 184.9 183.9 71.2 69.2 69.7 68.6 67.8 66.3 66.2 66.1 49.9 49.9 30.9 75.2 81.3 12.5 31.2 22.0 121.1 119.1 100.6 143.8 149.1 78.8 97.4 88.1 3Q18 4Q18 1Q19 2Q19 3Q19 4Q19 1Q20 2Q20 Dividends Share repurchases |
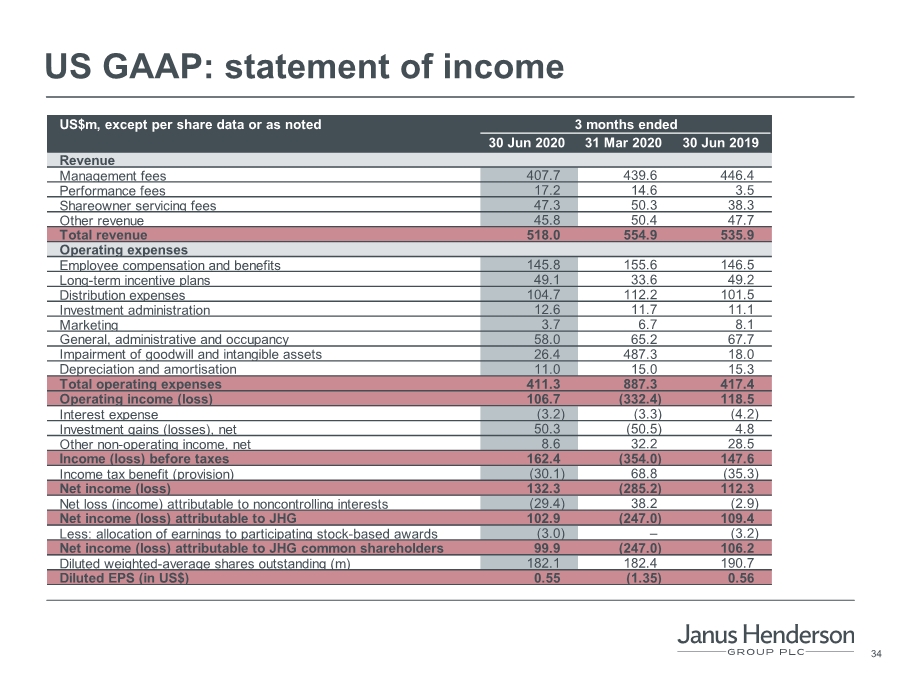
| 34 US GAAP: statement of income 3 months ended 30 Jun 2020 31 Mar 2020 30 Jun 2019 Revenue Management fees 407.7 439.6 446.4 Performance fees 17.2 14.6 3.5 Shareowner servicing fees 47.3 50.3 38.3 Other revenue 45.8 50.4 47.7 Total revenue 518.0 554.9 535.9 Operating expenses Employee compensation and benefits 145.8 155.6 146.5 Long-term incentive plans 49.1 33.6 49.2 Distribution expenses 104.7 112.2 101.5 Investment administration 12.6 11.7 11.1 Marketing 3.7 6.7 8.1 General, administrative and occupancy 58.0 65.2 67.7 Impairment of goodwill and intangible assets 26.4 487.3 18.0 Depreciation and amortisation 11.0 15.0 15.3 Total operating expenses 411.3 887.3 417.4 Operating income (loss) 106.7 (332.4) 118.5 Interest expense (3.2) (3.3) (4.2) Investment gains (losses), net 50.3 (50.5) 4.8 Other non-operating income, net 8.6 32.2 28.5 Income (loss) before taxes 162.4 (354.0) 147.6 Income tax benefit (provision) (30.1) 68.8 (35.3) Net income (loss) 132.3 (285.2) 112.3 Net loss (income) attributable to noncontrolling interests (29.4) 38.2 (2.9) Net income (loss) attributable to JHG 102.9 (247.0) 109.4 Less: allocation of earnings to participating stock-based awards (3.0) –(3.2) Net income (loss) attributable to JHG common shareholders 99.9 (247.0) 106.2 Diluted weighted-average shares outstanding (m) 182.1 182.4 190.7 Diluted EPS (in US$) 0.55 (1.35) 0.56 US$m, except per share data or as noted |
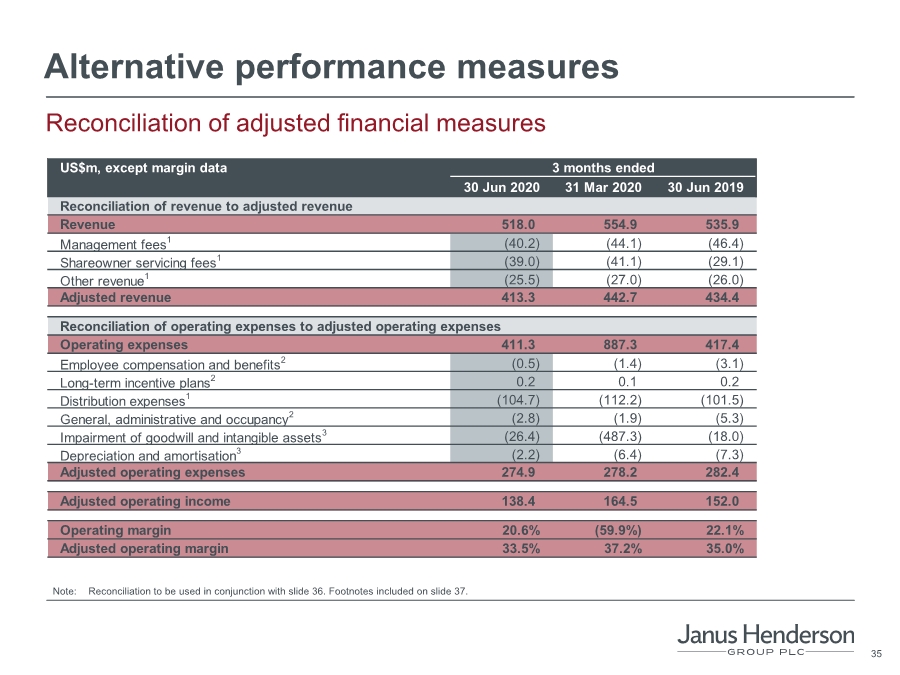
| 35 Alternative performance measures Reconciliation of adjusted financial measures Note: Reconciliation to be used in conjunction with slide 36. Footnotes included on slide 37. 3 months ended 30 Jun 2020 31 Mar 2020 30 Jun 2019 Reconciliation of revenue to adjusted revenue Revenue 518.0 554.9 535.9 Management fees1 (40.2) (44.1) (46.4) Shareowner servicing fees1 (39.0) (41.1) (29.1) Other revenue1 (25.5) (27.0) (26.0) Adjusted revenue 413.3 442.7 434.4 Reconciliation of operating expenses to adjusted operating expenses Operating expenses 411.3 887.3 417.4 Employee compensation and benefits2 (0.5) (1.4) (3.1) Long-term incentive plans2 0.2 0.1 0.2 Distribution expenses1 (104.7) (112.2) (101.5) General, administrative and occupancy2 (2.8) (1.9) (5.3) Impairment of goodwill and intangible assets3 (26.4) (487.3) (18.0) Depreciation and amortisation3 (2.2) (6.4) (7.3) Adjusted operating expenses 274.9 278.2 282.4 Adjusted operating income 138.4 164.5 152.0 Operating margin 20.6% (59.9%) 22.1% Adjusted operating margin 33.5% 37.2% 35.0% US$m, except margin data |
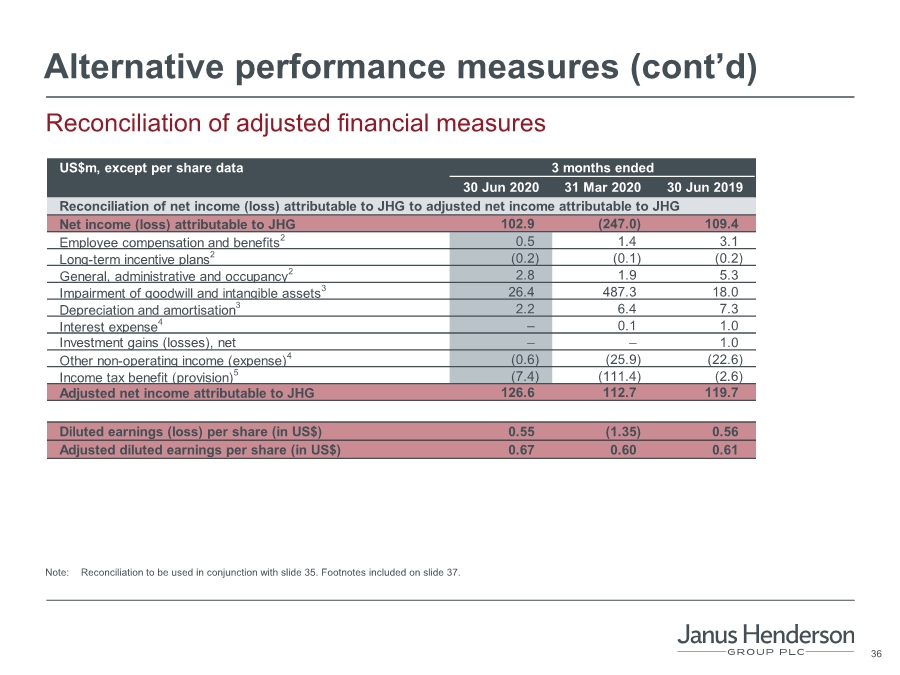
| 36 Alternative performance measures (cont’d) Reconciliation of adjusted financial measures Note: Reconciliation to be used in conjunction with slide 35. Footnotes included on slide 37. 3 months ended 30 Jun 2020 31 Mar 2020 30 Jun 2019 Reconciliation of net income (loss) attributable to JHG to adjusted net income attributable to JHG Net income (loss) attributable to JHG 102.9 (247.0) 109.4 Employee compensation and benefits2 0.5 1.4 3.1 Long-term incentive plans2 (0.2) (0.1) (0.2) General, administrative and occupancy2 2.8 1.9 5.3 Impairment of goodwill and intangible assets3 26.4 487.3 18.0 Depreciation and amortisation3 2.2 6.4 7.3 Interest expense4 – 0.1 1.0 Investment gains (losses), net –– 1.0 Other non-operating income (expense)4 (0.6) (25.9) (22.6) Income tax benefit (provision)5 (7.4) (111.4) (2.6) Adjusted net income attributable to JHG 126.6 112.7 119.7 Diluted earnings (loss) per share (in US$) 0.55 (1.35) 0.56 Adjusted diluted earnings per share (in US$) 0.67 0.60 0.61 US$m, except per share data |
| 37 Alternative performance measures (cont’d) Footnotes to reconciliation of adjusted financial measures 1 JHG contracts with third-party intermediaries to distribute and service certain of its investment products. Fees for distribution and JHG contracts with third-party intermediaries to distribute and service certain of its investment products. Fees for distribution and servicing related activities are either provided for separately in an investment product’s prospectus or are part of the management fee. Under both arrangements, the fees are collected by JHG and passed through to third-party intermediaries who are responsible for performing the applicable services. The majority of distribution and servicing fees collected by JHG are passed through to third-party intermediaries. JHG management believes that the deduction of distribution and service fees from revenue in the computation of adjusted revenue reflects the pass-through nature of these revenues. In certain arrangements, JHG performs the distribution and servicing activities and retains the applicable fees. Revenues for distribution and servicing activities performed by JHG are not deducted from GAAP revenue. 2 Adjustments primarily represent integration costs in relation to the Merger, including severance costs, legal costs and consulting fees. JHG management believes these costs are not representative of the ongoing operations of the Group. 3 Investment management contracts have been identified as a separately identifiable intangible asset arising on the acquisition of subsidiaries and businesses. Such contracts are recognised at the net present value of the expected future cash flows arising from the contracts at the date of acquisition. For segregated mandate contracts, the intangible asset is amortised on a straight-line basis over the expected life of the contracts. Adjustments also include impairment charges of our goodwill and certain mutual fund investment management agreements and client relationships. JHG management believes these non-cash and acquisition-related costs are not representative of the ongoing operations of the Group. 4 Adjustments for the three months ended 31 March 2020, primarily relate to the gain recognised on the disposal of Geneva during the quarter. Other adjustments include contingent consideration adjustments associated with prior acquisitions and increased debt expense as a consequence of the fair value uplift on debt due to acquisition accounting. JHG management believes these costs are not representative of the ongoing operations of the Group. 5 The tax impact of the adjustments is calculated based on the applicable US or foreign statutory tax rate as it relates to each adjustment. Certain adjustments are either not taxable or not tax-deductible. |
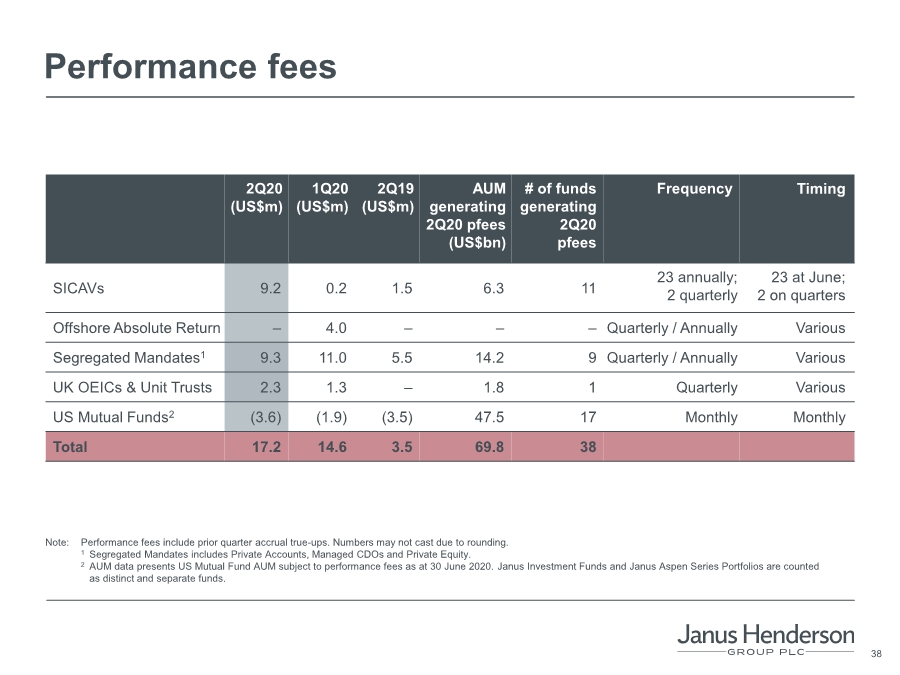
| 38 2Q20 (US$m) 1Q20 (US$m) 2Q19 (US$m) AUM generating 2Q20 pfees (US$bn) # of funds generating 2Q20 pfees Frequency Timing SICAVs 9.2 0.2 1.5 6.3 11 23 annually; 2 quarterly 23 at June; 2 on quarters Offshore Absolute Return – 4.0 ––– Quarterly / Annually Various Segregated Mandates1 9.3 11.0 5.5 14.2 9 Quarterly / Annually Various UK OEICs & Unit Trusts 2.3 1.3 – 1.8 1 Quarterly Various US Mutual Funds2 (3.6) (1.9) (3.5) 47.5 17 Monthly Monthly Total 17.2 14.6 3.5 69.8 38 Performance fees Note: Performance fees include prior quarter accrual true-ups. Numbers may not cast due to rounding. 1 Segregated Mandates includes Private Accounts, Managed CDOs and Private Equity. 2 AUM data presents US Mutual Fund AUM subject to performance fees as at 30 June 2020. Janus Investment Funds and Janus Aspen Series Portfolios are counted as distinct and separate funds. |
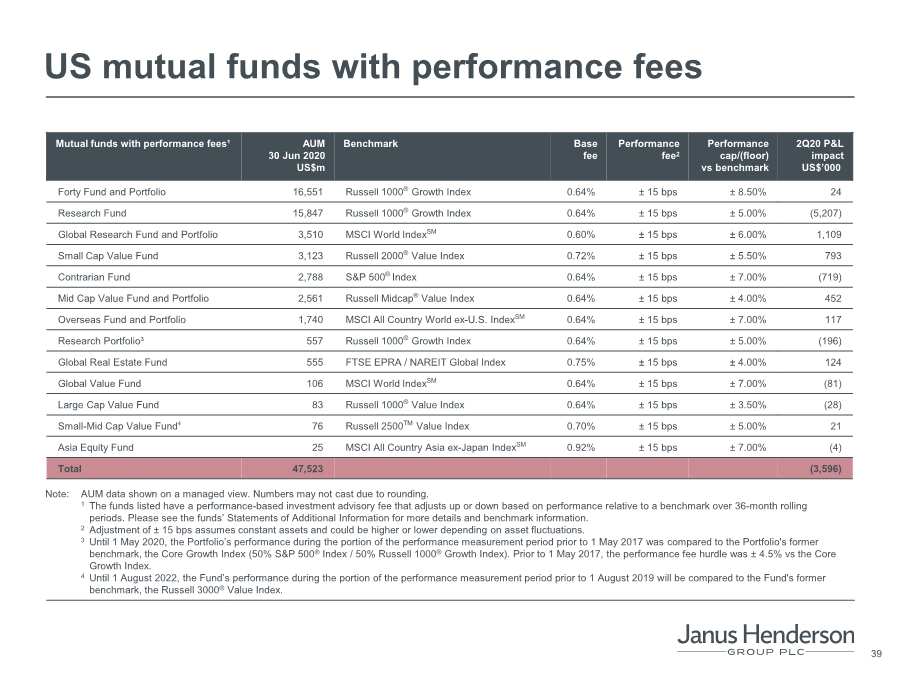
| 39 Mutual funds with performance fees¹ AUM 30 Jun 2020 US$m Benchmark Base fee Performance fee2 Performance cap/(floor) vs benchmark 2Q20 P&L impact US$’000 Forty Fund and Portfolio 16,551 Russell 1000® Growth Index 0.64% ± 15 bps ± 8.50% 24 Research Fund 15,847 Russell 1000® Growth Index 0.64% ± 15 bps ± 5.00% (5,207) Global Research Fund and Portfolio 3,510 MSCI World IndexSM 0.60% ± 15 bps ± 6.00% 1,109 Small Cap Value Fund 3,123 Russell 2000® Value Index 0.72% ± 15 bps ± 5.50% 793 Contrarian Fund 2,788 S&P 500® Index 0.64% ± 15 bps ± 7.00% (719) Mid Cap Value Fund and Portfolio 2,561 Russell Midcap® Value Index 0.64% ± 15 bps ± 4.00% 452 Overseas Fund and Portfolio 1,740 MSCI All Country World ex-U.S. IndexSM 0.64% ± 15 bps ± 7.00% 117 Research Portfolio³ 557 Russell 1000® Growth Index 0.64% ± 15 bps ± 5.00% (196) Global Real Estate Fund 555 FTSE EPRA / NAREIT Global Index 0.75% ± 15 bps ± 4.00% 124 Global Value Fund 106 MSCI World IndexSM 0.64% ± 15 bps ± 7.00% (81) Large Cap Value Fund 83 Russell 1000® Value Index 0.64% ± 15 bps ± 3.50% (28) Small-Mid Cap Value Fund4 76 Russell 2500TM Value Index 0.70% ± 15 bps ± 5.00% 21 Asia Equity Fund 25 MSCI All Country Asia ex-Japan IndexSM 0.92% ± 15 bps ± 7.00% (4) Total 47,523 (3,596) US mutual funds with performance fees Note: AUM data shown on a managed view. Numbers may not cast due to rounding. 1 The funds listed have a performance-based investment advisory fee that adjusts up or down based on performance relative to a benchmark over 36-month rolling periods. Please see the funds’ Statements of Additional Information for more details and benchmark information. 2 Adjustment of ± 15 bps assumes constant assets and could be higher or lower depending on asset fluctuations. 3 Until 1 May 2020, the Portfolio’s performance during the portion of the performance measurement period prior to 1 May 2017 was compared to the Portfolio's former benchmark, the Core Growth Index (50% S&P 500® Index / 50% Russell 1000® Growth Index). Prior to 1 May 2017, the performance fee hurdle was ± 4.5% vs the Core Growth Index. 4 Until 1 August 2022, the Fund’s performance during the portion of the performance measurement period prior to 1 August 2019 will be compared to the Fund's former benchmark, the Russell 3000® Value Index. |
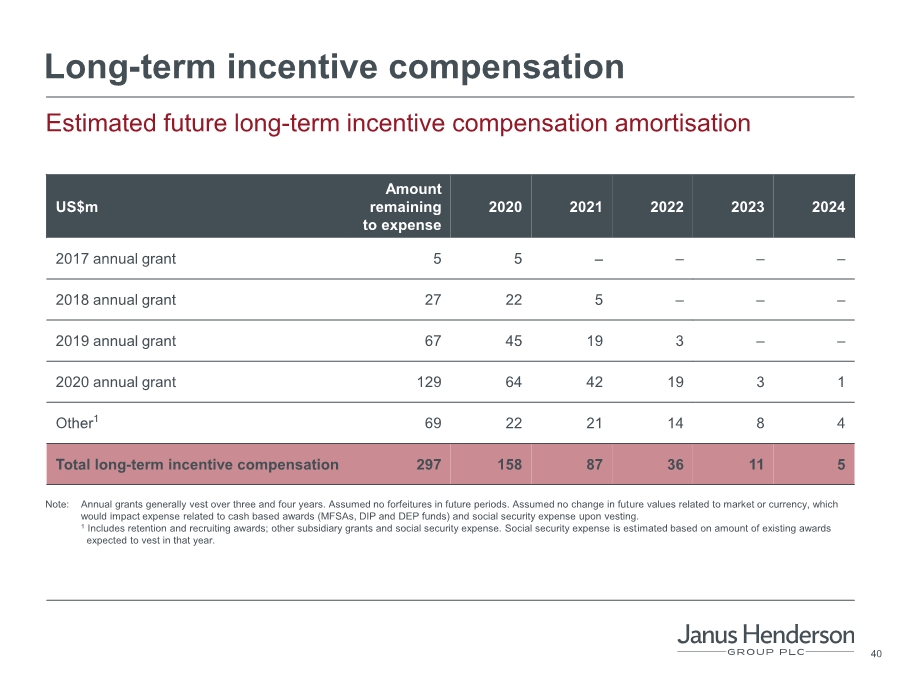
| 40 Long-term incentive compensation Estimated future long-term incentive compensation amortisation Note: Annual grants generally vest over three and four years. Assumed no forfeitures in future periods. Assumed no change in future values related to market or currency, which would impact expense related to cash based awards (MFSAs, DIP and DEP funds) and social security expense upon vesting. 1 Includes retention and recruiting awards; other subsidiary grants and social security expense. Social security expense is estimated based on amount of existing awards expected to vest in that year. US$m Amount remaining to expense 2020 2021 2022 2023 2024 2017 annual grant 5 5 –––– 2018 annual grant 27 22 5 ––– 2019 annual grant 67 45 19 3 –– 2020 annual grant 129 64 42 19 3 1 Other1 69 22 21 14 8 4 Total long-term incentive compensation 297 158 87 36 11 5 |
| 41 Contacts Investor enquiries Jim Kurtz US Investor Relations Manager +1 (303) 336 4529 jim.kurtz@janushenderson.com Melanie Horton Non-US Investor Relations Manager +44 (0) 20 7818 2905 melanie.horton@janushenderson.com Investor Relations investor.relations@janushenderson.com Media enquiries Stephen Sobey +44 (0) 20 7818 2523 stephen.sobey@janushenderson.com United Kingdom: FTI Consulting Tom Blackwell +44 (0) 20 3727 1051 tom.blackwell@FTIConsulting.com Asia Pacific: Honner Craig Morris +61 2 8248 3757 craig@honner.com.au |

| 42 Past performance is no guarantee of future results. Investing involves risk, including the possible loss of principal and fluctuation of value. Forward looking information This presentation includes statements concerning potential future events involving Janus Henderson Group plc that could differ materially from the events that actually occur. The differences could be caused by a number of factors including those factors identified in Janus Henderson Group’s Annual Report on Form 10-K for the fiscal year ended 31 December 2019 and the Company’s other filings and furnishings with the Securities and Exchange Commission (Commission file no. 001-38103), including those that appear under headings such as ‘Risk Factors’ and ‘Management’s Discussion and Analysis of Financial Condition and Results of Operations’. Many of these factors are beyond the control of the company and its management. Any forward-looking statements contained in this presentation are as of the date on which such statements were made. The company assumes no duty to update them, even if experience, unexpected events, or future changes make it clear that any projected results expressed or implied therein will not be realised. Annualised, pro forma, projected and estimated numbers are used for illustrative purposes only, are not forecasts and may not reflect actual results. No public offer The information, statements and opinions contained in this presentation do not constitute a public offer under any applicable legislation or an offer to sell or solicitation of any offer to buy any securities or financial instruments or any advice or recommendation with respect to such securities or other financial instruments. Not all products or services are available in all jurisdictions. Mutual funds in the US distributed by Janus Henderson Distributors. Please consider the charges, risks, expenses and investment objectives carefully before investing. For a US fund prospectus or, if available, a summary prospectus containing this and other information, please contact your investment professional or call 800.668.0434. Read it carefully before you invest or send money. Janus Henderson, Janus, Henderson, Intech and Knowledge Shared are trademarks of Janus Henderson Group plc or one of its subsidiaries. © Janus Henderson Group plc. Janus Henderson Investors 201 Bishopsgate, London EC2M 3AE Tel: 020 7818 1818 Fax: 020 7818 1819 |