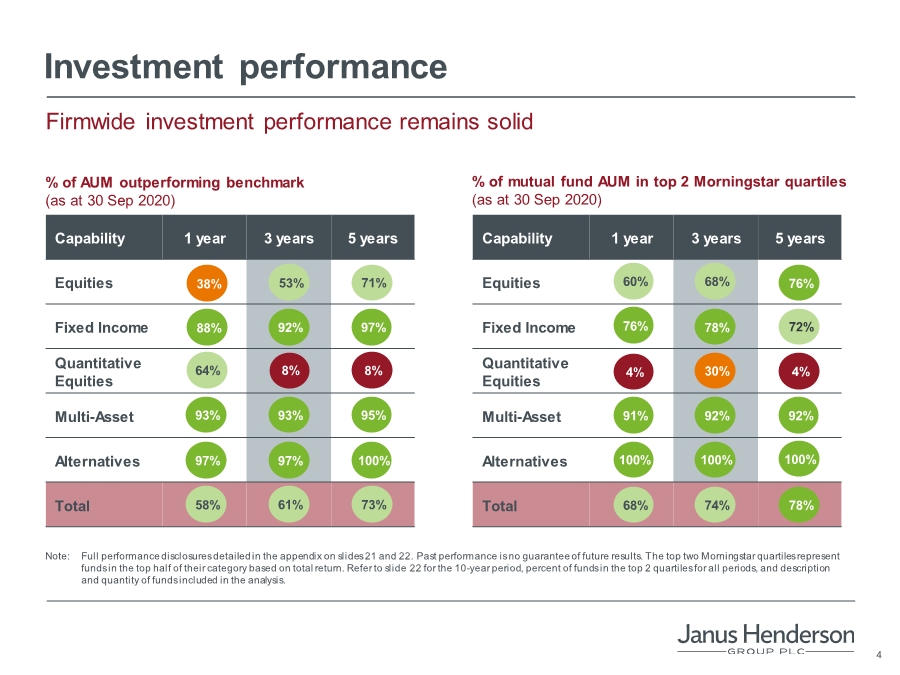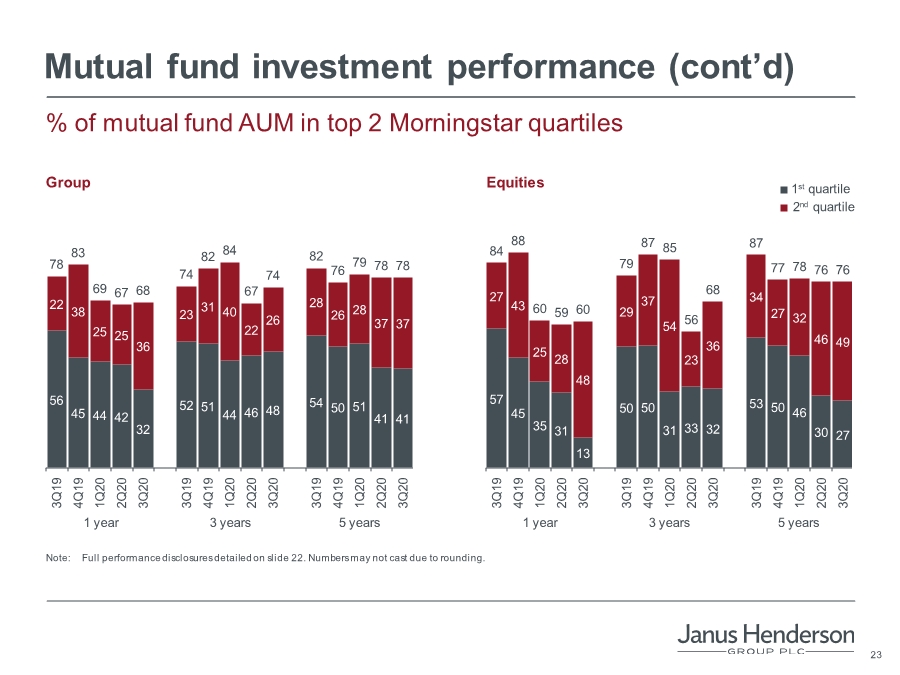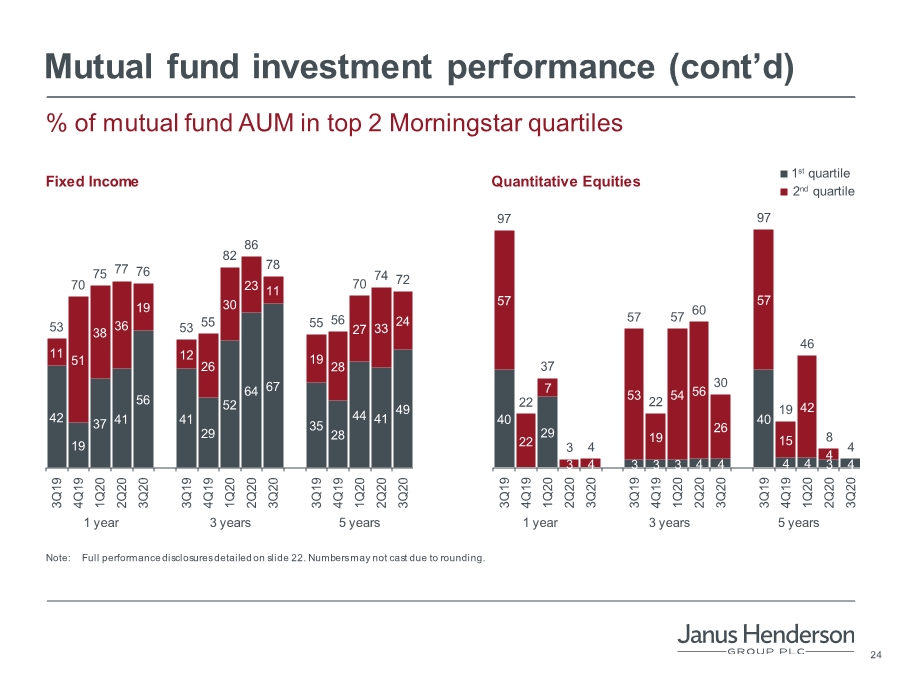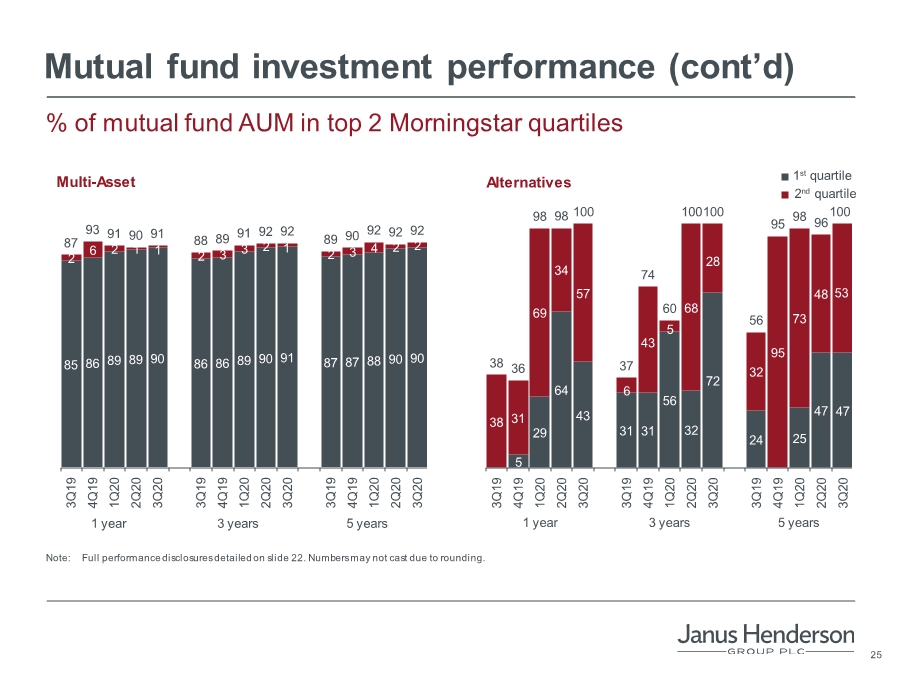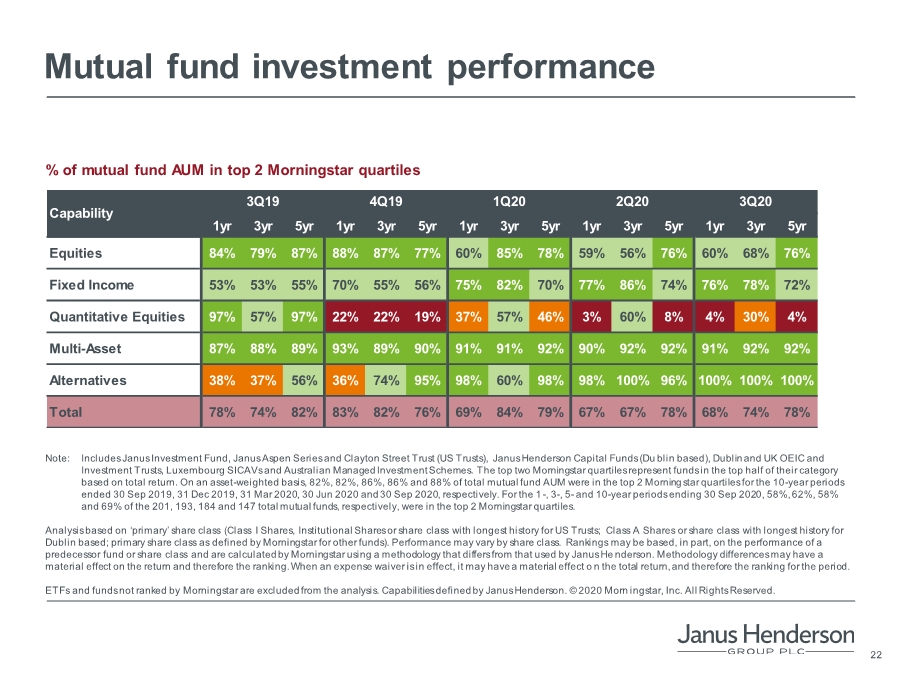
| 22 Mutual fund investment performance % of mutual fund AUM in top 2 Morningstar quartiles Note: Includes Janus Investment Fund, Janus Aspen Series and Clayton Street Trust (US Trusts), Janus Henderson Capital Funds (Du blin based), Dublin and UK OEIC and Investment Trusts, Luxembourg SICAVs and Australian Managed Investment Schemes. The top two Morningstar quartiles represent funds in the top half of their category based on total return. On an asset-weighted basis, 82%, 82%, 86%, 86% and 88% of total mutual fund AUM were in the top 2 Morningstar quartiles for the 10-year periods ended 30 Sep 2019, 31 Dec 2019, 31 Mar 2020, 30 Jun 2020 and 30 Sep 2020, respectively. For the 1 -, 3-, 5- and 10-year periods ending 30 Sep 2020, 58%, 62%, 58% and 69% of the 201, 193, 184 and 147 total mutual funds, respectively, were in the top 2 Morningstar quartiles. Analysis based on ‘primary’ share class (Class I Shares, Institutional Shares or share class with longest history for US Trusts; Class A Shares or share class with longest history for Dublin based; primary share class as defined by Morningstar for other funds). Performance may vary by share class. Rankings may be based, in part, on the performance of a predecessor fund or share class and are calculated by Morningstar using a methodology that differs from that used by Janus He nderson. Methodology differences may have a material effect on the return and therefore the ranking. When an expense waiver is in effect, it may have a material effect o n the total return, and therefore the ranking for the period. ETFs and funds not ranked by Morningstar are excluded from the analysis. Capabilities defined by Janus Henderson. © 2020 Morn ingstar, Inc. All Rights Reserved. 1yr 3yr 5yr 1yr 3yr 5yr 1yr 3yr 5yr 1yr 3yr 5yr 1yr 3yr 5yr Equities 84% 79% 87% 88% 87% 77% 60% 85% 78% 59% 56% 76% 60% 68% 76% Fixed Income 53% 53% 55% 70% 55% 56% 75% 82% 70% 77% 86% 74% 76% 78% 72% Quantitative Equities 97% 57% 97% 22% 22% 19% 37% 57% 46% 3% 60% 8% 4% 30% 4% Multi-Asset 87% 88% 89% 93% 89% 90% 91% 91% 92% 90% 92% 92% 91% 92% 92% Alternatives 38% 37% 56% 36% 74% 95% 98% 60% 98% 98% 100% 96% 100% 100% 100% Total 78% 74% 82% 83% 82% 76% 69% 84% 79% 67% 67% 78% 68% 74% 78% 3Q20 Capability 3Q19 4Q19 1Q20 2Q20 |