UNITED STATES
SECURITIES AND EXCHANGE COMMISSION
WASHINGTON, D.C. 20549
FORM N-CSR
CERTIFIED SHAREHOLDER REPORT OF REGISTERED
MANAGEMENT INVESTMENT COMPANIES
Investment Company Act file number: 811-21497
AB CORPORATE SHARES
(Exact name of registrant as specified in charter)
1345 Avenue of the Americas, New York, New York 10105
(Address of principal executive offices) (Zip code)
Joseph J. Mantineo
AllianceBernstein L.P.
1345 Avenue of the Americas
New York, New York 10105
(Name and address of agent for service)
Registrant’s telephone number, including area code: (800) 221-5672
Date of fiscal year end: April 30, 2020
Date of reporting period: April 30, 2020
ITEM 1. REPORTS TO STOCKHOLDERS.
APR 04.30.20

ANNUAL REPORT
AB CORPORATE INCOME SHARES

Beginning January 1, 2021, as permitted by new regulations adopted by the Securities and Exchange Commission, the Fund’s annual and semi-annual shareholder reports will no longer be sent by mail, unless you specifically request paper copies of the reports. Instead, the reports will be made available on a website, and you will be notified by mail each time a report is posted and provided with a website address to access the report.
If you already elected to receive shareholder reports electronically, you will not be affected by this change and you need not take any action. You may elect to receive shareholder reports and other communications from the Fund electronically at any time by contacting your financial intermediary (such as a broker-dealer or bank) or, if you are a direct investor, by calling the Fund at (800) 221 5672.
You may elect to receive all future reports in paper form free of charge. If you invest through a financial intermediary, you can contact your financial intermediary to request that you continue to receive paper copies of your shareholder reports; if you invest directly with the Fund, you can call the Fund at (800) 221 5672. Your election to receive reports in paper form will apply to all funds held in your account with your financial intermediary or, if you invest directly, to all AB Mutual Funds you hold.
| Investment Products Offered | • Are Not FDIC Insured • May Lose Value • Are Not Bank Guaranteed | |
Investors should consider the investment objectives, risks, charges and expenses of the Fund carefully before investing. For copies of our prospectus or summary prospectus, which contain this and other information, visit us online at www.abfunds.com or contact your AB representative. Please read the prospectus and/or summary prospectus carefully before investing.
This shareholder report must be preceded or accompanied by the Fund’s prospectus for individuals who are not current shareholders of the Fund.
You may obtain a description of the Fund’s proxy voting policies and procedures, and information regarding how the Fund voted proxies relating to portfolio securities during the most recent 12-month period ended June 30, without charge. Simply visit AB’s website at www.abfunds.com, or go to the Securities and Exchange Commission’s (the “Commission”) website at www.sec.gov, or call AB at (800) 227 4618.
The Fund files its complete schedule of portfolio holdings with the Commission for the first and third quarters of each fiscal year as an exhibit to its reports on Form N-PORT. The Fund’s Form N-PORT reports are available on the Commission’s website at www.sec.gov. The Fund’s Forms N-PORT may also be reviewed and copied at the Commission’s Public Reference Room in Washington, DC; information on the operation of the Public Reference Room may be obtained by calling (800) SEC 0330. AB publishes full portfolio holdings for the Fund monthly at www.abfunds.com.
AllianceBernstein Investments, Inc. (ABI) is the distributor of the AB family of mutual funds. ABI is a member of FINRA and is an affiliate of AllianceBernstein L.P., the Adviser of the funds.
The [A/B] logo is a registered service mark of AllianceBernstein and AllianceBernstein® is a registered service mark used by permission of the owner, AllianceBernstein L.P.
| FROM THE PRESIDENT |  |
Dear Shareholder,
We are pleased to provide this report for AB Corporate Income Shares (the “Fund”). Please review the discussion of Fund performance, the market conditions during the reporting period and the Fund’s investment strategy.
As always, AB strives to keep clients ahead of what’s next by:
| + | Transforming uncommon insights into uncommon knowledge with a global research scope |
| + | Navigating markets with seasoned investment experience and sophisticated solutions |
| + | Providing thoughtful investment insights and actionable ideas |
Whether you’re an individual investor or a multi-billion-dollar institution, we put knowledge and experience to work for you.
AB’s global research organization connects and collaborates across platforms and teams to deliver impactful insights and innovative products. Better insights lead to better opportunities—anywhere in the world.
For additional information about AB’s range of products and shareholder resources, please log on to www.abfunds.com.
Thank you for your investment in the AB Mutual Funds.
Sincerely,

Robert M. Keith
President and Chief Executive Officer, AB Mutual Funds
| abfunds.com | AB CORPORATE INCOME SHARES | 1 | |
ANNUAL REPORT
June 9, 2020
This report provides management’s discussion of fund performance for AB Corporate Income Shares for the annual reporting period ended April 30, 2020. Please note, shares of this Fund are available only to separately managed accounts or participants in “wrap fee” programs or other investment programs approved by the Adviser.
The Fund’s investment objective is to earn high current income.
NAV RETURNS AS OF APRIL 30, 2020 (unaudited)
| 6 Months | 12 Months | |||||||
| AB CORPORATE INCOME SHARES | 0.38% | 8.65% | ||||||
| Bloomberg Barclays US Credit Bond Index | 1.77% | 9.37% | ||||||
INVESTMENT RESULTS
The table above shows the Fund’s performance compared to its benchmark, the Bloomberg Barclays US Credit Bond Index, for the six- and 12-month periods ended April 30, 2020.
During the 12-month period, the Fund underperformed the benchmark. Security selection was the primary detractor, relative to the benchmark, mainly within the banking, energy, supranationals and real estate investment trusts (“REITs”) sectors. Yield-curve positioning in the three- to six-year parts of the curve contributed to performance, more than offsetting losses from positioning in the one- to two-year and longer-than-10-year parts of the curve. The Fund’s longer-than-benchmark duration was also positive, as rates rallied in the period. Industry exposure did not have a meaningful impact on performance during the period.
During the six-month period, the Fund underperformed the benchmark. Security selection detracted most, primarily within banking, REITs, energy and technology. Industry exposure detracted, due to positions in energy, REITs and several other small detractors, which more than offset gains in cash reserves and sovereigns. The Fund’s longer-than-benchmark duration contributed, as rates rallied in the period. Yield-curve positioning in the three- to six-year and seven- to 10-year parts of the curve also contributed, offsetting losses from one- to two-year and longer-than-10-year parts of the curve.
The Fund utilized derivatives in the form of futures and interest rate swaps for hedging purposes, and credit default swaps for investment purposes, which added to absolute returns for both periods.
| 2 | AB CORPORATE INCOME SHARES | abfunds.com | |
MARKET REVIEW AND INVESTMENT STRATEGY
Global fixed-income market returns were mixed over the 12-month period ended April 30, 2020. In July, the US Federal Reserve (the “Fed”) began a series of three 25-basis-point (b.p.) interest-rate cuts due to slowing global growth concerns. Numerous other central banks followed suit by lowering interest rates. The UK’s exit from the European Union and a US-China trade truce in January led markets higher until investor sentiment turned decidedly negative in March due to the spread of COVID-19. Investor uncertainty led to an unprecedented flight to quality as credit spreads on risk assets quickly widened to levels not seen since the 2008–2009 global financial crisis. The market rout was met by swift monetary and fiscal policy action. The Fed lowered interest rates 150 b.p. to zero, and most other major central banks followed suit with substantial rate cuts.
Markets began to recover in April as governments and central banks initiated over $9 trillion of monetary and fiscal stimulus measures to combat the economic fallout from the virus and governments began to relax social distancing and stay-at-home guidelines. Higher quality and longer maturity developed-market treasury returns were strong, along with US corporate bonds that rallied in April on the back of record new issuance. High-yield bonds had negative returns for the period, primarily from the March sell-off. Emerging-market returns fell as lower oil prices impacted emerging-market commodity exporters. The US dollar advanced against most developed- and emerging-market currencies. The Swiss franc and the yen, which are also considered safe haven currencies, advanced against the US dollar.
The Fund’s Senior Investment Management Team (the “Team”) continues to seek attractively priced securities through top-down and bottom-up research, while mitigating overall risk. The Team invests primarily in single-sector, investment-grade issues of global corporates, but has leeway to invest in below investment-grade bonds as well.
INVESTMENT POLICIES
The Fund invests, under normal circumstances, at least 80% of its net assets in US corporate bonds. The Fund may also invest in US government securities (other than US government securities that are mortgage-backed or asset-backed securities), repurchase agreements and forward contracts relating to US government securities. The Fund normally invests all of its assets in securities that are rated, at the time of purchase, at least BBB- or the equivalent. The Fund will not invest in unrated corporate debt securities. The Fund has the flexibility to invest in long- and short-term fixed-income securities. In making decisions about whether to buy or sell securities, the Adviser will consider, among other things, the strength of certain sectors of the fixed-income market relative to others, interest rates and other general market conditions and the credit quality of individual issuers.
(continued on next page)
| abfunds.com | AB CORPORATE INCOME SHARES | 3 | |
The Fund also may: invest in convertible debt securities; invest up to 10% of its assets in inflation-indexed securities; invest up to 5% of its net assets in preferred stock; purchase and sell interest rate futures contracts and options; enter into swap transactions; invest in zero-coupon securities and “payment-in-kind” debentures; make secured loans of portfolio securities; and invest in US dollar-denominated fixed-income securities issued by non-US companies.
| 4 | AB CORPORATE INCOME SHARES | abfunds.com | |
DISCLOSURES AND RISKS
Benchmark Disclosure
The Bloomberg Barclays US Credit Bond Index is unmanaged and does not reflect fees and expenses associated with the active management of a fund. The Bloomberg Barclays US Credit Bond Index represents the performance of the US credit securities within the US fixed-income market. An investor cannot invest directly in an index, and its results are not indicative of the performance for any specific investment, including the Fund.
A Word About Risk
Market Risk: The market value of a security may move up or down, sometimes rapidly and unpredictably. These fluctuations may cause a security to be worth less than the price originally paid for it, or less than it was worth at an earlier time. Market risk may affect a single issuer, industry, sector of the economy or the market as a whole. Global economies and financial markets are increasingly interconnected, which increases the probabilities that conditions in one country or region might adversely impact issuers in a different country or region. Conditions affecting the general economy, including political, social, or economic instability at the local, regional, or global level may also affect the market value of a security. Health crises, such as pandemic and epidemic diseases, as well as other incidents that interrupt the expected course of events, such as natural disasters, war or civil disturbance, acts of terrorism, power outages and other unforeseeable and external events, and the public response to or fear of such diseases or events, have and may in the future have an adverse effect on the Fund’s investments and net asset value and can lead to increased market volatility. For example, any preventative or protective actions that governments may take in respect of such diseases or events may result in periods of business disruption, inability to obtain raw materials, supplies and component parts, and reduced or disrupted operations for the Fund’s portfolio companies. The occurrence and pendency of such diseases or events could adversely affect the economies and financial markets either in specific countries or worldwide.
Credit Risk: An issuer or guarantor of a fixed-income security, or the counterparty to a derivatives or other contract, may be unable or unwilling to make timely payments of interest or principal, or to otherwise honor its obligations. The issuer or guarantor may default, causing a loss of the full principal amount of a security and any accrued interest. The degree of risk for a particular security may be reflected in its credit rating. There is the possibility that the credit rating of a fixed-income security may be downgraded after purchase, which may adversely affect the value of the security. Investments in fixed-income securities with lower ratings tend to have a higher probability that an issuer will default or fail to meet its payment obligations.
| abfunds.com | AB CORPORATE INCOME SHARES | 5 | |
DISCLOSURES AND RISKS (continued)
Interest-Rate Risk: Changes in interest rates will affect the value of investments in fixed-income securities. When interest rates rise, the value of existing investments in fixed-income securities tends to fall and this decrease in value may not be offset by higher income from new investments. Interest-rate risk is generally greater for fixed-income securities with longer maturities or durations.
Inflation Risk: This is the risk that the value of assets or income from investments will be less in the future as inflation decreases the value of money. As inflation increases, the value of the Fund’s assets can decline as can the value of the Fund’s distributions. This risk is significantly greater for fixed-income securities with longer maturities.
Foreign (Non-US) Risk: Investments in securities of non-US issuers may involve more risk than those of US issuers. These securities may fluctuate more widely in price and may be more difficult to trade due to adverse market, economic, political, regulatory or other factors.
Derivatives Risk: Derivatives may be difficult to price or unwind and leveraged so that small changes may produce disproportionate losses for the Fund. Derivatives, especially over-the-counter derivatives, are also subject to counterparty risk.
Management Risk: The Fund is subject to management risk because it is an actively managed investment fund. The Adviser will apply its investment techniques and risk analyses in making investment decisions, but there is no guarantee that its techniques will produce the intended results.
These risks are fully discussed in the Fund’s prospectus. As with all investments, you may lose money by investing in the Fund.
An Important Note About Historical Performance
The performance shown in this report represents past performance and does not guarantee future results. Current performance may be lower or higher than the performance information shown. You may obtain performance information current to the most recent month-end by calling (800) 227 4618. The investment return and principal value of an investment in the Fund will fluctuate, so that your shares, when redeemed, may be worth more or less than their original cost. Performance assumes reinvestment of distributions and does not account for taxes.
Investors should consider the investment objectives, risks, charges and expenses of the Fund carefully before investing. For copies of our prospectus and/or summary prospectus, which contain this and other information, visit us online at www.abfunds.com or contact your AllianceBernstein Investments representative. Please read the prospectus and/or summary prospectus carefully before investing.
| 6 | AB CORPORATE INCOME SHARES | abfunds.com | |
HISTORICAL PERFORMANCE
GROWTH OF A $10,000 INVESTMENT IN THE FUND (unaudited)
4/30/2010 TO 4/30/2020

This chart illustrates the total value of an assumed $10,000 investment in AB Corporate Income Shares (from 4/30/2010 to 4/30/2020) as compared to the performance of the Fund’s benchmark.
| abfunds.com | AB CORPORATE INCOME SHARES | 7 | |
HISTORICAL PERFORMANCE (continued)
AVERAGE ANNUAL RETURNS AS OF APRIL 30, 2020 (unaudited)
| NAV Returns | ||||
| 1 Year | 8.65% | |||
| 5 Years | 4.23% | |||
| 10 Years | 5.30% | |||
AVERAGE ANNUAL RETURNS
AS OF THE MOST RECENT CALENDAR QUARTER-END
MARCH 31, 2020 (unaudited)
| NAV Returns | ||||
| 1 Year | 3.13% | |||
| 5 Years | 2.90% | |||
| 10 Years | 4.89% | |||
The prospectus fee table shows the fees and the total operating expenses of the Fund as 0.00% because the Adviser does not charge any fees or expenses and reimburses Fund operating expenses, except certain extraordinary expenses, taxes, brokerage costs and the interest on borrowings or certain leveraged transactions. Participants in a wrap fee program or other investment program eligible to invest in the Fund pay fees to the program sponsor and should review the program brochure or other literature provided by the sponsor for a discussion of fees and expenses charged.
| 8 | AB CORPORATE INCOME SHARES | abfunds.com | |
EXPENSE EXAMPLE
(unaudited)
As a shareholder of the Fund, you may incur various ongoing non-operating and extraordinary costs. This example is intended to help you understand your ongoing costs (in dollars) of investing in the Fund and to compare these costs with the ongoing costs of investing in other mutual funds.
The Example is based on an investment of $1,000 invested at the beginning of the period and held for the entire period as indicated below.
Actual Expenses
The table below provides information about actual account values and actual expenses. You may use the information in this line, together with the amount you invested, to estimate the expenses that you paid over the period. Simply divide your account value by $1,000 (for example, an $8,600 account value divided by $1,000 = 8.6), then multiply the result by the number in the first line under the heading entitled “Expenses Paid During Period” to estimate the expenses you paid on your account during this period.
Hypothetical Example for Comparison Purposes
The table below provides information about hypothetical account values and hypothetical expenses based on the Fund’s actual expense ratio and an assumed annual rate of return of 5% before expenses, which is not the Fund’s actual return. The hypothetical account values and expenses may not be used to estimate the actual ending account balance or expenses you paid for the period. You may use this information to compare the ongoing costs of investing in the Fund and other funds by comparing this 5% hypothetical example with the 5% hypothetical examples that appear in the shareholder reports of other funds.
Please note that the expenses shown in the table are meant to highlight your ongoing costs only and do not reflect any transactional costs, such as sales charges (loads), or contingent deferred sales charges on redemptions. Therefore, the hypothetical example is useful in comparing ongoing costs only, and will not help you determine the relative total costs of owning different funds. In addition, if these transactional costs were included, your costs would have been higher.
| Beginning Account Value November 1, 2019 | Ending Account Value April 30, 2020 | Expenses Paid During Period* | Annualized Expense Ratio* | |||||||||||||
Actual | $ | 1,000 | $ | 1,003.80 | $ | – 0 – | 0.00 | % | ||||||||
Hypothetical** | $ | 1,000 | $ | 1,024.86 | $ | – 0 – | 0.00 | % | ||||||||
| * | Expenses are equal to the Fund’s annualized expense ratio, multiplied by the average account value over the period, multiplied by 182/366 (to reflect the one-half year period). The Fund’s operating expenses are borne by the Adviser or its affiliates. |
| ** | Assumes 5% annual return before expenses. |
| abfunds.com | AB CORPORATE INCOME SHARES | 9 | |
PORTFOLIO SUMMARY
April 30, 2020 (unaudited)
PORTFOLIO STATISTICS
Net Assets ($mil): $114.5
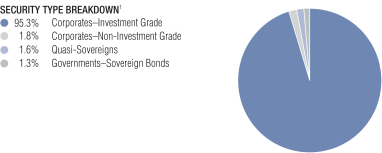
| 1 | All data are as of April 30, 2020. The Fund’s security type breakdown is expressed as a percentage of total investments and may vary over time. The Fund also enters into derivative transactions, which may be used for hedging or investment purposes (see “Portfolio of Investments” section of the report for additional details). |
| 10 | AB CORPORATE INCOME SHARES | abfunds.com | |
PORTFOLIO OF INVESTMENTS
April 30, 2020
| Principal Amount (000) | U.S. $ Value | |||||||
|
|
| ||||||
CORPORATES - INVESTMENT GRADE – 92.7% |
| |||||||
Industrial – 50.1% | ||||||||
Basic – 2.4% |
| |||||||
Anglo American Capital PLC | $ | 315 | $ | 337,913 | ||||
Celulosa Arauco y Constitucion SA | 246 | 234,622 | ||||||
4.50%, 08/01/2024 | 200 | 202,125 | ||||||
DuPont de Nemours, Inc. | 58 | 74,705 | ||||||
Glencore Funding LLC | ||||||||
4.125%, 05/30/2023(a) | 125 | 127,416 | ||||||
4.625%, 04/29/2024(a) | 175 | 183,720 | ||||||
Inversiones CMPC SA | 210 | 203,700 | ||||||
LYB International Finance III LLC | 340 | 343,733 | ||||||
LyondellBasell Industries NV | 102 | 107,907 | ||||||
Reliance Steel & Aluminum Co. | 848 | 877,460 | ||||||
Sherwin-Williams Co. (The) | 62 | 65,174 | ||||||
|
| |||||||
| 2,758,475 | ||||||||
|
| |||||||
Capital Goods – 1.3% |
| |||||||
General Electric Co. | 26 | 26,471 | ||||||
3.625%, 05/01/2030 | 42 | 42,206 | ||||||
4.25%, 05/01/2040 | 130 | 130,395 | ||||||
5.875%, 01/14/2038 | 274 | 312,719 | ||||||
Series G | ||||||||
3.10%, 01/09/2023 | 374 | 380,668 | ||||||
Masco Corp. | 508 | 535,178 | ||||||
|
| |||||||
| 1,427,637 | ||||||||
|
| |||||||
Communications - Media – 5.5% |
| |||||||
Charter Communications Operating LLC/Charter Communications Operating Capital | 249 | 298,217 | ||||||
5.375%, 05/01/2047 | 374 | 451,844 | ||||||
Comcast Corp. | 410 | 446,605 | ||||||
3.90%, 03/01/2038 | 215 | 250,666 | ||||||
4.60%, 10/15/2038 | 85 | 107,053 | ||||||
4.65%, 07/15/2042 | 375 | 478,166 | ||||||
6.45%, 03/15/2037 | 329 | 479,185 | ||||||
| abfunds.com | AB CORPORATE INCOME SHARES | 11 | |
PORTFOLIO OF INVESTMENTS (continued)
| Principal Amount (000) | U.S. $ Value | |||||||
|
|
| ||||||
Fox Corp. | $ | 23 | $ | 24,400 | ||||
5.576%, 01/25/2049 | 270 | 368,113 | ||||||
Interpublic Group of Cos., Inc. (The) | 178 | 184,349 | ||||||
Omnicom Group, Inc. | 93 | 98,788 | ||||||
Prosus NV | 210 | 209,934 | ||||||
Time Warner Entertainment Co. LP | 987 | 1,141,485 | ||||||
ViacomCBS, Inc. | 21 | 21,181 | ||||||
3.70%, 06/01/2028 | 332 | 330,616 | ||||||
Walt Disney Co. (The) | 131 | 142,946 | ||||||
4.00%, 10/01/2023 | 40 | 43,607 | ||||||
5.40%, 10/01/2043 | 180 | 246,222 | ||||||
6.15%, 02/15/2041 | 110 | 158,445 | ||||||
6.40%, 12/15/2035 | 161 | 231,905 | ||||||
8.875%, 04/26/2023 | 125 | 152,434 | ||||||
Weibo Corp. | 373 | 378,362 | ||||||
|
| |||||||
| 6,244,523 | ||||||||
|
| |||||||
Communications - Telecommunications – 3.3% | ||||||||
AT&T, Inc. | 234 | 263,552 | ||||||
4.75%, 05/15/2046 | 89 | 102,688 | ||||||
4.85%, 03/01/2039-07/15/2045 | 194 | 223,264 | ||||||
5.35%, 09/01/2040 | 415 | 501,399 | ||||||
5.45%, 03/01/2047 | 168 | 212,921 | ||||||
6.55%, 01/15/2028-02/15/2039 | 350 | 458,307 | ||||||
Corning, Inc. | 465 | 530,184 | ||||||
Rogers Communications, Inc. | 4 | 4,691 | ||||||
Verizon Communications, Inc. | 586 | 702,069 | ||||||
4.862%, 08/21/2046 | 571 | 773,631 | ||||||
|
| |||||||
| 3,772,706 | ||||||||
|
| |||||||
Consumer Cyclical - Automotive – 2.3% |
| |||||||
BMW US Capital LLC | 270 | 286,397 | ||||||
General Motors Co. | 95 | 80,719 | ||||||
General Motors Financial Co., Inc. | 921 | 873,946 | ||||||
| 12 | AB CORPORATE INCOME SHARES | abfunds.com | |
PORTFOLIO OF INVESTMENTS (continued)
| Principal Amount (000) | U.S. $ Value | |||||||
|
|
| ||||||
3.50%, 11/07/2024 | $ | 599 | $ | 551,469 | ||||
4.15%, 06/19/2023 | 116 | 112,523 | ||||||
4.30%, 07/13/2025 | 314 | 295,107 | ||||||
Hyundai Capital America | 160 | 170,376 | ||||||
Lear Corp. | 82 | 70,492 | ||||||
3.80%, 09/15/2027 | 246 | 228,163 | ||||||
|
| |||||||
| 2,669,192 | ||||||||
|
| |||||||
Consumer Cyclical - Entertainment – 0.3% |
| |||||||
Carnival Corp. | 361 | 377,101 | ||||||
|
| |||||||
Consumer Cyclical - Other – 1.1% |
| |||||||
Las Vegas Sands Corp. | 695 | 646,753 | ||||||
3.20%, 08/08/2024 | 573 | 556,847 | ||||||
Marriott International, Inc./MD | 53 | 55,410 | ||||||
|
| |||||||
| 1,259,010 | ||||||||
|
| |||||||
Consumer Cyclical - Restaurants – 0.6% |
| |||||||
McDonald’s Corp. | 74 | 80,704 | ||||||
4.70%, 12/09/2035 | 305 | 380,613 | ||||||
Starbucks Corp. | 225 | 266,179 | ||||||
|
| |||||||
| 727,496 | ||||||||
|
| |||||||
Consumer Cyclical - Retailers – 1.3% |
| |||||||
Advance Auto Parts, Inc. | 385 | 386,116 | ||||||
Dollar General Corp. | 61 | 64,551 | ||||||
Home Depot, Inc. (The) | 40 | 57,652 | ||||||
Ross Stores, Inc. | 132 | 144,162 | ||||||
5.45%, 04/15/2050 | 215 | 245,508 | ||||||
TJX Cos., Inc. (The) | 66 | 71,190 | ||||||
4.50%, 04/15/2050 | 105 | 129,229 | ||||||
VF Corp. | 88 | 89,470 | ||||||
2.80%, 04/23/2027 | 101 | 103,602 | ||||||
2.95%, 04/23/2030 | 170 | 175,573 | ||||||
|
| |||||||
| 1,467,053 | ||||||||
|
| |||||||
| abfunds.com | AB CORPORATE INCOME SHARES | 13 | |
PORTFOLIO OF INVESTMENTS (continued)
| Principal Amount (000) | U.S. $ Value | |||||||
|
|
| ||||||
Consumer Non-Cyclical – 10.1% |
| |||||||
AbbVie, Inc. | $ | 80 | $ | 89,169 | ||||
4.25%, 11/21/2049(a) | 135 | 155,671 | ||||||
4.40%, 11/06/2042 | 185 | 217,057 | ||||||
4.875%, 11/14/2048 | 375 | 468,686 | ||||||
Altria Group, Inc. | 288 | 322,013 | ||||||
5.95%, 02/14/2049 | 190 | 238,083 | ||||||
Amgen, Inc. | 215 | 234,505 | ||||||
4.663%, 06/15/2051 | 240 | 313,891 | ||||||
Anheuser-Busch InBev Finance, Inc. | 320 | 355,267 | ||||||
Anheuser-Busch InBev Worldwide, Inc. | 323 | 357,612 | ||||||
4.95%, 01/15/2042 | 490 | 561,270 | ||||||
BAT Capital Corp. | 250 | 254,967 | ||||||
Baxter International, Inc. | 215 | 239,936 | ||||||
Biogen, Inc. | 374 | 487,419 | ||||||
Bristol-Myers Squibb Co. | 445 | 598,445 | ||||||
Cigna Corp. | 71 | 73,922 | ||||||
4.80%, 08/15/2038 | 377 | 458,971 | ||||||
4.80%, 07/15/2046(a) | 263 | 326,215 | ||||||
7.875%, 05/15/2027(a) | 53 | 69,313 | ||||||
CommonSpirit Health | 44 | 42,177 | ||||||
CVS Health Corp. | 308 | 337,688 | ||||||
4.10%, 03/25/2025 | 45 | 49,632 | ||||||
4.78%, 03/25/2038 | 727 | 859,547 | ||||||
Danaher Corp. | 260 | 319,667 | ||||||
Gilead Sciences, Inc. | 170 | 219,667 | ||||||
4.80%, 04/01/2044 | 145 | 192,959 | ||||||
5.65%, 12/01/2041 | 105 | 150,779 | ||||||
Kraft Heinz Foods Co. | 480 | 504,533 | ||||||
Leggett & Platt, Inc. | 773 | 801,578 | ||||||
Mylan, Inc. | 1,177 | 1,227,787 | ||||||
| 14 | AB CORPORATE INCOME SHARES | abfunds.com | |
PORTFOLIO OF INVESTMENTS (continued)
| Principal Amount (000) | U.S. $ Value | |||||||
|
|
| ||||||
Perrigo Finance Unlimited Co. | $ | 420 | $ | 448,703 | ||||
Smithfield Foods, Inc. | 65 | 63,367 | ||||||
Sysco Corp. | 46 | 51,582 | ||||||
Thermo Fisher Scientific, Inc. | 116 | 130,913 | ||||||
Wyeth LLC | 188 | 275,010 | ||||||
Zimmer Biomet Holdings, Inc. | 92 | 92,315 | ||||||
|
| |||||||
| 11,590,316 | ||||||||
|
| |||||||
Energy – 8.6% |
| |||||||
Boardwalk Pipelines LP | 304 | 267,605 | ||||||
BP Capital Markets America, Inc. | 215 | 204,643 | ||||||
3.194%, 04/06/2025 | 206 | 216,300 | ||||||
Columbia Pipeline Group, Inc. | 867 | 921,976 | ||||||
Ecopetrol SA | 89 | 87,254 | ||||||
Enable Midstream Partners LP | 41 | 25,962 | ||||||
Energy Transfer Operating LP | 47 | 44,115 | ||||||
5.875%, 01/15/2024 | 539 | 559,584 | ||||||
6.25%, 04/15/2049 | 295 | 290,088 | ||||||
Eni SpA | 247 | 252,301 | ||||||
Enterprise Products Operating LLC | 210 | 198,131 | ||||||
3.75%, 02/15/2025 | 140 | 148,996 | ||||||
3.90%, 02/15/2024 | 59 | 62,457 | ||||||
4.20%, 01/31/2050 | 320 | 325,795 | ||||||
4.80%, 02/01/2049 | 85 | 92,732 | ||||||
4.90%, 05/15/2046 | 45 | 48,672 | ||||||
EOG Resources, Inc. | 74 | 82,392 | ||||||
Equinor ASA | 320 | 335,280 | ||||||
Exxon Mobil Corp. | 279 | 297,944 | ||||||
4.114%, 03/01/2046 | 524 | 623,775 | ||||||
Husky Energy, Inc. | 475 | 385,862 | ||||||
| abfunds.com | AB CORPORATE INCOME SHARES | 15 | |
PORTFOLIO OF INVESTMENTS (continued)
| Principal Amount (000) | U.S. $ Value | |||||||
|
|
| ||||||
Marathon Petroleum Corp. | $ | 370 | $ | 375,461 | ||||
Newfield Exploration Co. | 610 | 425,274 | ||||||
Noble Energy, Inc. | 113 | 90,010 | ||||||
ONEOK, Inc. | 99 | 89,489 | ||||||
3.10%, 03/15/2030 | 290 | 234,923 | ||||||
5.20%, 07/15/2048 | 295 | 261,131 | ||||||
Plains All American Pipeline LP/PAA Finance Corp. | 146 | 124,570 | ||||||
3.60%, 11/01/2024 | 461 | 434,068 | ||||||
Sabine Pass Liquefaction LLC | 843 | 879,156 | ||||||
Shell International Finance BV | 116 | 119,683 | ||||||
Sunoco Logistics Partners Operations LP | 170 | 159,278 | ||||||
5.35%, 05/15/2045 | 145 | 129,365 | ||||||
TransCanada PipeLines Ltd. | 50 | 53,695 | ||||||
Transcontinental Gas Pipe Line Co. LLC | 325 | 381,518 | ||||||
Valero Energy Corp. | 280 | 278,404 | ||||||
7.50%, 04/15/2032 | 225 | 276,129 | ||||||
|
| |||||||
| 9,784,018 | ||||||||
|
| |||||||
Other Industrial – 0.2% |
| |||||||
Alfa SAB de CV | 200 | 198,865 | ||||||
|
| |||||||
Services – 1.4% |
| |||||||
Booking Holdings, Inc. | 54 | 57,251 | ||||||
4.625%, 04/13/2030 | 215 | 238,558 | ||||||
eBay, Inc. | 62 | 63,813 | ||||||
3.60%, 06/05/2027 | 265 | 286,502 | ||||||
Expedia Group, Inc. | 179 | 182,938 | ||||||
IHS Markit Ltd. | 76 | 80,734 | ||||||
Moody’s Corp. | 165 | 179,028 | ||||||
5.25%, 07/15/2044 | 255 | 345,760 | ||||||
| 16 | AB CORPORATE INCOME SHARES | abfunds.com | |
PORTFOLIO OF INVESTMENTS (continued)
| Principal Amount (000) | U.S. $ Value | |||||||
|
|
| ||||||
Verisk Analytics, Inc. | $ | 165 | $ | 217,465 | ||||
|
| |||||||
| 1,652,049 | ||||||||
|
| |||||||
Technology – 10.0% |
| |||||||
Analog Devices, Inc. | 36 | 37,614 | ||||||
Apple, Inc. | 620 | 812,485 | ||||||
Autodesk, Inc. | 605 | 663,866 | ||||||
Baidu, Inc. | 265 | 270,752 | ||||||
Broadcom Corp./Broadcom Cayman Finance Ltd. | 857 | 873,052 | ||||||
3.625%, 01/15/2024 | 251 | 262,363 | ||||||
3.875%, 01/15/2027 | 205 | 213,901 | ||||||
Broadcom, Inc. | 265 | 279,199 | ||||||
4.25%, 04/15/2026(a) | 549 | 589,791 | ||||||
CA, Inc. | 837 | 848,626 | ||||||
Dell International LLC/EMC Corp. | 411 | 426,602 | ||||||
6.02%, 06/15/2026(a) | 386 | 418,451 | ||||||
Fiserv, Inc. | 215 | 260,907 | ||||||
Intel Corp. | 195 | 271,210 | ||||||
KLA Corp. | 215 | 213,228 | ||||||
Lam Research Corp. | 273 | 272,282 | ||||||
3.75%, 03/15/2026 | 142 | 158,782 | ||||||
4.875%, 03/15/2049 | 415 | 559,507 | ||||||
Microchip Technology, Inc. | 175 | 177,742 | ||||||
Microsoft Corp. | 429 | 567,777 | ||||||
NXP BV/NXP Funding LLC/NXP USA, Inc. | 24 | 24,262 | ||||||
3.15%, 05/01/2027(a) | 180 | 182,302 | ||||||
4.30%, 06/18/2029(a) | 260 | 276,156 | ||||||
Oracle Corp. | 210 | 221,531 | ||||||
3.85%, 04/01/2060 | 94 | 108,774 | ||||||
| abfunds.com | AB CORPORATE INCOME SHARES | 17 | |
PORTFOLIO OF INVESTMENTS (continued)
| Principal Amount (000) | U.S. $ Value | |||||||
|
|
| ||||||
4.00%, 11/15/2047 | $ | 310 | $ | 369,049 | ||||
6.125%, 07/08/2039 | 254 | 371,945 | ||||||
QUALCOMM, Inc. | 308 | 373,789 | ||||||
Seagate HDD Cayman | 19 | 19,636 | ||||||
4.875%, 03/01/2024 | 485 | 504,318 | ||||||
Tech Data Corp. | 432 | 426,440 | ||||||
VMware, Inc. | 422 | 431,913 | ||||||
|
| |||||||
| 11,488,252 | ||||||||
|
| |||||||
Transportation - Airlines – 0.2% |
| |||||||
Southwest Airlines Co. | 190 | 189,202 | ||||||
|
| |||||||
Transportation - Railroads – 0.3% |
| |||||||
Burlington Northern Santa Fe LLC | 85 | 106,318 | ||||||
CSX Corp. | 12 | 13,864 | ||||||
Union Pacific Corp. | 200 | 222,862 | ||||||
|
| |||||||
| 343,044 | ||||||||
|
| |||||||
Transportation - Services – 1.2% |
| |||||||
Aviation Capital Group LLC | 215 | 178,506 | ||||||
4.375%, 01/30/2024(a) | 230 | 207,994 | ||||||
ERAC USA Finance LLC | 145 | 148,927 | ||||||
FedEx Corp. | 63 | 67,544 | ||||||
4.05%, 02/15/2048 | 246 | 242,406 | ||||||
Penske Truck Leasing Co. Lp/PTL Finance Corp. | 300 | 309,870 | ||||||
United Parcel Service, Inc. | 231 | 259,759 | ||||||
|
| |||||||
| 1,415,006 | ||||||||
|
| |||||||
| 57,363,945 | ||||||||
|
| |||||||
Financial Institutions – 37.5% |
| |||||||
Banking – 22.9% |
| |||||||
Banco Santander SA | 400 | 433,908 | ||||||
Bank of America Corp. | 455 | 467,067 | ||||||
Series L 3.95%, 04/21/2025 | 1,134 | 1,221,091 | ||||||
| 18 | AB CORPORATE INCOME SHARES | abfunds.com | |
PORTFOLIO OF INVESTMENTS (continued)
| Principal Amount (000) | U.S. $ Value | |||||||
|
|
| ||||||
Series X | $ | 175 | $ | 182,038 | ||||
Series Z | 53 | 57,198 | ||||||
Barclays PLC | 635 | 686,289 | ||||||
BBVA Bancomer SA/Texas | 330 | 289,575 | ||||||
BBVA USA | 481 | 486,969 | ||||||
BPCE SA | 200 | 214,236 | ||||||
Capital One Financial Corp. | 570 | 562,362 | ||||||
Citigroup, Inc. | 850 | 890,026 | ||||||
3.875%, 03/26/2025 | 441 | 470,503 | ||||||
4.45%, 09/29/2027 | 635 | 696,112 | ||||||
5.50%, 09/13/2025 | 595 | 681,477 | ||||||
Citizens Financial Group, Inc. | 895 | 957,757 | ||||||
Commonwealth Bank of Australia | 415 | 445,067 | ||||||
Cooperatieve Rabobank UA | 525 | 552,909 | ||||||
Credit Suisse Group AG | 265 | 288,808 | ||||||
Deutsche Bank AG/New York NY | 334 | 328,389 | ||||||
3.95%, 02/27/2023 | 635 | 633,139 | ||||||
3.961%, 11/26/2025 | 555 | 542,851 | ||||||
Discover Bank | 385 | 393,220 | ||||||
Discover Financial Services | 670 | 671,280 | ||||||
DNB Bank ASA | 200 | 202,584 | ||||||
Goldman Sachs Group, Inc. (The) | 138 | 147,151 | ||||||
3.75%, 05/22/2025 | 225 | 240,916 | ||||||
4.25%, 10/21/2025 | 325 | 346,973 | ||||||
4.411%, 04/23/2039 | 148 | 167,791 | ||||||
5.95%, 01/15/2027 | 40 | 47,551 | ||||||
HSBC Holdings PLC | 432 | 461,540 | ||||||
4.95%, 03/31/2030 | 205 | 242,952 | ||||||
6.875%, 06/01/2021(b) | 205 | 205,303 | ||||||
| abfunds.com | AB CORPORATE INCOME SHARES | 19 | |
PORTFOLIO OF INVESTMENTS (continued)
| Principal Amount (000) | U.S. $ Value | |||||||
|
|
| ||||||
ING Groep NV | $ | 200 | $ | 199,842 | ||||
Intesa Sanpaolo SpA | 650 | 641,634 | ||||||
JPMorgan Chase & Co. | 280 | 283,931 | ||||||
3.882%, 07/24/2038 | 557 | 629,867 | ||||||
8.00%, 04/29/2027 | 530 | 712,394 | ||||||
Series FF | 175 | 163,905 | ||||||
Series HH | 135 | 121,511 | ||||||
Lloyds Banking Group PLC | 265 | 278,756 | ||||||
4.50%, 11/04/2024 | 592 | 629,189 | ||||||
4.582%, 12/10/2025 | 200 | 216,188 | ||||||
Mizuho Financial Group Cayman 3 Ltd. | 1,295 | 1,374,630 | ||||||
Morgan Stanley | 143 | 144,682 | ||||||
3.622%, 04/01/2031 | 145 | 159,638 | ||||||
3.95%, 04/23/2027 | 345 | 368,205 | ||||||
Series F | 55 | 59,265 | ||||||
Royal Bank of Scotland Group PLC | 591 | 627,151 | ||||||
6.10%, 06/10/2023 | 724 | 781,334 | ||||||
6.125%, 12/15/2022 | 247 | 264,137 | ||||||
Santander Holdings USA, Inc. | 65 | 62,599 | ||||||
3.40%, 01/18/2023 | 239 | 240,606 | ||||||
4.40%, 07/13/2027 | 576 | 583,885 | ||||||
4.50%, 07/17/2025 | 577 | 593,589 | ||||||
Santander UK Group Holdings PLC | 390 | 407,429 | ||||||
Societe Generale SA | 243 | 251,396 | ||||||
4.75%, 11/24/2025(a) | 200 | 211,418 | ||||||
State Street Corp. | 29 | 31,721 | ||||||
Truist Bank | 279 | 296,594 | ||||||
UBS Group AG | 205 | 207,501 | ||||||
Wells Fargo & Co. | 245 | 246,590 | ||||||
| 20 | AB CORPORATE INCOME SHARES | abfunds.com | |
PORTFOLIO OF INVESTMENTS (continued)
| Principal Amount (000) | U.S. $ Value | |||||||
|
|
| ||||||
5.606%, 01/15/2044 | $ | 400 | $ | 518,172 | ||||
Series G | 640 | 696,128 | ||||||
|
| |||||||
| 26,218,919 | ||||||||
|
| |||||||
Brokerage – 0.7% | ||||||||
Charles Schwab Corp. (The) | 196 | 220,823 | ||||||
Series G | 129 | 133,029 | ||||||
Jefferies Financial Group, Inc. | 454 | 476,904 | ||||||
|
| |||||||
| 830,756 | ||||||||
|
| |||||||
Finance – 1.5% | ||||||||
Aircastle Ltd. | 342 | 301,812 | ||||||
GE Capital International Funding Co. Unlimited Co. | 275 | 286,569 | ||||||
Harborwalk Funding Trust | 170 | 201,419 | ||||||
International Lease Finance Corp. | 867 | 837,219 | ||||||
Synchrony Financial | 58 | 56,458 | ||||||
|
| |||||||
| 1,683,477 | ||||||||
|
| |||||||
Insurance – 3.6% | ||||||||
Aetna, Inc. | 175 | 190,407 | ||||||
Allstate Corp. (The) | 260 | 261,703 | ||||||
American International Group, Inc. | 280 | 299,009 | ||||||
Guardian Life Insurance Co. of America (The) | 210 | 218,618 | ||||||
Humana, Inc. | 270 | 301,736 | ||||||
MetLife Capital Trust IV | 150 | 184,538 | ||||||
MetLife, Inc. | ||||||||
Series C | 205 | 187,175 | ||||||
Series D | 170 | 174,971 | ||||||
Nationwide Mutual Insurance Co. | 120 | 199,314 | ||||||
New York Life Insurance Co. | 180 | 228,078 | ||||||
| abfunds.com | AB CORPORATE INCOME SHARES | 21 | |
PORTFOLIO OF INVESTMENTS (continued)
| Principal Amount (000) | U.S. $ Value | |||||||
|
|
| ||||||
Peachtree Corners Funding Trust | $ | 110 | $ | 115,111 | ||||
Prudential Financial, Inc. | 437 | 437,179 | ||||||
5.375%, 05/15/2045 | 260 | 264,540 | ||||||
5.625%, 06/15/2043 | 474 | 489,196 | ||||||
5.875%, 09/15/2042 | 235 | 246,705 | ||||||
Voya Financial, Inc. | 335 | 330,732 | ||||||
|
| |||||||
| 4,129,012 | ||||||||
|
| |||||||
REITS – 8.8% | ||||||||
Alexandria Real Estate Equities, Inc. | 87 | 92,787 | ||||||
4.70%, 07/01/2030 | 240 | 279,691 | ||||||
American Homes 4 Rent LP | 5 | 4,974 | ||||||
American Tower Corp. | 275 | 291,033 | ||||||
5.00%, 02/15/2024 | 375 | 419,621 | ||||||
Digital Realty Trust LP | 255 | 287,479 | ||||||
EPR Properties | 5 | 4,256 | ||||||
5.25%, 07/15/2023 | 175 | 156,893 | ||||||
Equinix, Inc. | 425 | 444,520 | ||||||
Essex Portfolio LP | 125 | 125,935 | ||||||
GLP Capital LP/GLP Financing II, Inc. | 323 | 317,328 | ||||||
5.375%, 04/15/2026 | 114 | 113,569 | ||||||
5.75%, 06/01/2028 | 220 | 216,720 | ||||||
Healthpeak Properties, Inc. | 51 | 51,222 | ||||||
3.50%, 07/15/2029 | 105 | 104,787 | ||||||
Host Hotels & Resorts LP | 728 | 703,284 | ||||||
Kilroy Realty LP | 40 | 41,081 | ||||||
Kimco Realty Corp. | 95 | 90,742 | ||||||
LifeStorage LP/CA | 680 | 690,635 | ||||||
Omega Healthcare Investors, Inc. | 108 | 106,327 | ||||||
5.25%, 01/15/2026 | 1,208 | 1,216,372 | ||||||
| 22 | AB CORPORATE INCOME SHARES | abfunds.com | |
PORTFOLIO OF INVESTMENTS (continued)
| Principal Amount (000) | U.S. $ Value | |||||||
|
|
| ||||||
Prologis LP | $ | 215 | $ | 217,432 | ||||
Regency Centers LP | 33 | 33,641 | ||||||
4.125%, 03/15/2028 | 195 | 205,916 | ||||||
Sabra Health Care LP | 710 | 689,872 | ||||||
5.125%, 08/15/2026 | 565 | 547,604 | ||||||
Service Properties Trust | 1,135 | 964,932 | ||||||
SITE Centers Corp. | 260 | 264,490 | ||||||
Spirit Realty LP | 132 | 116,596 | ||||||
4.45%, 09/15/2026 | 238 | 234,156 | ||||||
VEREIT Operating Partnership LP | 1,036 | 1,031,866 | ||||||
WP Carey, Inc. | 44 | 45,835 | ||||||
|
| |||||||
| 10,111,596 | ||||||||
|
| |||||||
| 42,973,760 | ||||||||
|
| |||||||
Utility – 5.1% | ||||||||
Electric – 4.7% | ||||||||
Abu Dhabi National Energy Co. PJSC | 215 | 228,236 | ||||||
Berkshire Hathaway Energy Co. | 199 | 223,449 | ||||||
4.25%, 10/15/2050(a) | 25 | 31,991 | ||||||
6.125%, 04/01/2036 | 100 | 141,383 | ||||||
Consolidated Edison Co. of New York, Inc. | 25 | 30,041 | ||||||
Dominion Energy, Inc. | 110 | 120,970 | ||||||
Duke Energy Corp. | 302 | 371,668 | ||||||
4.875%, 09/16/2024(b) | 112 | 111,966 | ||||||
Empresas Publicas de Medellin ESP | 200 | 187,812 | ||||||
Enel Americas SA | 53 | 54,193 | ||||||
Enel Chile SA | 62 | 66,030 | ||||||
Entergy Louisiana LLC | 133 | 141,207 | ||||||
Exelon Corp. | 94 | 97,125 | ||||||
| abfunds.com | AB CORPORATE INCOME SHARES | 23 | |
PORTFOLIO OF INVESTMENTS (continued)
| Principal Amount (000) | U.S. $ Value | |||||||
|
|
| ||||||
Florida Power & Light Co. | $ | 41 | $ | 44,464 | ||||
3.95%, 03/01/2048 | 460 | 594,619 | ||||||
Georgia Power Co. | 340 | 398,636 | ||||||
Nevada Power Co. | 215 | 228,597 | ||||||
NextEra Energy Capital Holdings, Inc. | 75 | 79,860 | ||||||
5.65%, 05/01/2079 | 194 | 207,087 | ||||||
PacifiCorp | 210 | 234,879 | ||||||
PSEG Power LLC | 388 | 517,119 | ||||||
Public Service Co. of New Hampshire | 127 | 149,968 | ||||||
Sempra Energy | 215 | 229,902 | ||||||
Southern Power Co. | 77 | 81,161 | ||||||
Southwestern Public Service Co. | 305 | 362,395 | ||||||
Virginia Electric & Power Co. | 273 | 461,288 | ||||||
|
| |||||||
| 5,396,046 | ||||||||
|
| |||||||
Natural Gas – 0.3% |
| |||||||
GNL Quintero SA | 200 | 207,000 | ||||||
NiSource, Inc. | 60 | 84,253 | ||||||
|
| |||||||
| 291,253 | ||||||||
|
| |||||||
Other Utility – 0.1% |
| |||||||
American Water Capital Corp. | 80 | 92,140 | ||||||
|
| |||||||
| 5,779,439 | ||||||||
|
| |||||||
Total Corporates - Investment Grade | 106,117,144 | |||||||
|
| |||||||
CORPORATES - NON-INVESTMENT GRADE – 2.3% | ||||||||
Industrial – 2.0% |
| |||||||
Consumer Cyclical - Automotive – 0.5% |
| |||||||
Ford Motor Credit Co. LLC | 395 | 350,626 | ||||||
4.14%, 02/15/2023 | 200 | 184,448 | ||||||
|
| |||||||
| 535,074 | ||||||||
|
| |||||||
| 24 | AB CORPORATE INCOME SHARES | abfunds.com | |
PORTFOLIO OF INVESTMENTS (continued)
| Principal Amount (000) | U.S. $ Value | |||||||
|
|
| ||||||
Consumer Non-Cyclical – 0.5% |
| |||||||
Newell Brands, Inc. | $ | 548 | $ | 558,039 | ||||
|
| |||||||
Energy – 0.9% |
| |||||||
EQM Midstream Partners LP | 295 | 278,793 | ||||||
Occidental Petroleum Corp. | 319 | 239,263 | ||||||
3.50%, 08/15/2029 | 55 | 38,198 | ||||||
Western Midstream Operating LP | 350 | 319,371 | ||||||
4.65%, 07/01/2026 | 81 | 72,192 | ||||||
5.45%, 04/01/2044 | 149 | 111,567 | ||||||
|
| |||||||
| 1,059,384 | ||||||||
|
| |||||||
Technology – 0.1% |
| |||||||
Xerox Corp. | 95 | 94,906 | ||||||
|
| |||||||
| 2,247,403 | ||||||||
|
| |||||||
Financial Institutions – 0.3% |
| |||||||
REITS – 0.3% |
| |||||||
Diversified Healthcare Trust | 407 | 350,297 | ||||||
|
| |||||||
Total Corporates - Non-Investment Grade | 2,597,700 | |||||||
|
| |||||||
QUASI-SOVEREIGNS – 1.5% |
| |||||||
Quasi-Sovereign Bonds – 1.5% |
| |||||||
Chile – 0.5% |
| |||||||
Corp. Nacional del Cobre de Chile | 200 | 200,750 | ||||||
3.70%, 01/30/2050(a) | 200 | 181,313 | ||||||
Empresa Nacional del Petroleo | 200 | 192,500 | ||||||
|
| |||||||
| 574,563 | ||||||||
|
| |||||||
Malaysia – 0.2% |
| |||||||
Petronas Capital Ltd. | 225 | 247,050 | ||||||
|
| |||||||
Mexico – 0.4% |
| |||||||
Petroleos Mexicanos | 240 | 188,226 | ||||||
6.75%, 09/21/2047 | 140 | 96,635 | ||||||
6.95%, 01/28/2060(a) | 169 | 118,300 | ||||||
7.69%, 01/23/2050(a) | 80 | 58,800 | ||||||
|
| |||||||
| 461,961 | ||||||||
|
| |||||||
| abfunds.com | AB CORPORATE INCOME SHARES | 25 | |
PORTFOLIO OF INVESTMENTS (continued)
| Principal Amount (000) | U.S. $ Value | |||||||
|
|
| ||||||
Panama – 0.4% |
| |||||||
Aeropuerto Internacional de Tocumen SA | $ | 200 | $ | 205,812 | ||||
Empresa de Transmision Electrica SA | 246 | 249,844 | ||||||
|
| |||||||
| 455,656 | ||||||||
|
| |||||||
Total Quasi-Sovereigns | 1,739,230 | |||||||
|
| |||||||
GOVERNMENTS - SOVEREIGN BONDS – 1.3% |
| |||||||
Colombia – 0.2% |
| |||||||
Colombia Government International Bond | 200 | 206,500 | ||||||
|
| |||||||
Mexico – 0.5% |
| |||||||
Mexico Government International Bond | 285 | 287,707 | ||||||
4.60%, 01/23/2046 | 200 | 181,625 | ||||||
4.75%, 03/08/2044 | 150 | 139,594 | ||||||
|
| |||||||
| 608,926 | ||||||||
|
| |||||||
Peru – 0.1% |
| |||||||
Peruvian Government International Bond | 53 | 53,795 | ||||||
|
| |||||||
Qatar – 0.2% |
| |||||||
Qatar Government International Bond | 228 | 274,313 | ||||||
|
| |||||||
Saudi Arabia – 0.3% |
| |||||||
Saudi Government International Bond | 330 | 340,230 | ||||||
|
| |||||||
Total Governments - Sovereign Bonds | 1,483,764 | |||||||
|
| |||||||
Total Investments – 97.8% | 111,937,838 | |||||||
Other assets less liabilities – 2.2% | 2,517,529 | |||||||
|
| |||||||
Net Assets – 100.0% | $ | 114,455,367 | ||||||
|
| |||||||
| 26 | AB CORPORATE INCOME SHARES | abfunds.com | |
PORTFOLIO OF INVESTMENTS (continued)
FUTURES (see Note C)
| Description | Number of Contracts | Expiration Month | Current Notional | Value and Unrealized Appreciation/ (Depreciation) | ||||||||||||
Purchased Contracts | ||||||||||||||||
U.S. 10 Yr Ultra Futures | 56 | June 2020 | $ | 8,793,750 | $ | 469,547 | ||||||||||
U.S. Long Bond (CBT) Futures | 6 | June 2020 | 1,086,188 | 2,086 | ||||||||||||
U.S. T-Note 2 Yr (CBT) Futures | 21 | June 2020 | 4,629,023 | 86,763 | ||||||||||||
U.S. T-Note 10 Yr (CBT) Futures | 7 | June 2020 | 973,438 | 46,006 | ||||||||||||
U.S. Ultra Bond (CBT) Futures | 2 | June 2020 | 449,563 | 2,903 | ||||||||||||
Sold Contracts | ||||||||||||||||
U.S. T-Note 5 Yr (CBT) Futures | 36 | June 2020 | 4,517,438 | (141,195 | ) | |||||||||||
|
| |||||||||||||||
| $ | 466,110 | |||||||||||||||
|
| |||||||||||||||
CENTRALLY CLEARED CREDIT DEFAULT SWAPS (see Note C)
Description | Fixed Rate (Pay)/ Receive | Payment Frequency | Implied Credit Spread at April 30, 2020 | Notional | Market Value | Upfront Premiums Paid/ (Received) | Unrealized Appreciation/ (Depreciation) | |||||||||||||||||||||||||
Sale Contracts | ||||||||||||||||||||||||||||||||
CDX-NAIG Series 34, 5 Year Index, 06/20/2025* | 1.00 | % | Quarterly | 1.09 | % | USD | 5,020 | $ | 35,822 | $ | (10,933 | ) | $ | 46,755 | ||||||||||||||||||
| * | Termination date |
CENTRALLY CLEARED INTEREST RATE SWAPS (see Note C)
| Rate Type | ||||||||||||||||||||||||||||||
Notional | Termination Date | Payments made by the Fund | Payments received by the Fund | Payment Frequency Paid/ Received | Market Value | Upfront Premiums Paid/ (Received) | Unrealized Appreciation/ (Depreciation) | |||||||||||||||||||||||
| USD | 1,170 | 09/09/2021 | 1.132% | | 3 Month LIBOR | | Semi-Annual/ Quarterly | $ | (12,587 | ) | $ | — | $ | (12,587 | ) | |||||||||||||||
| USD | 1,070 | 03/27/2022 | 2.058% | | 3 Month LIBOR | | Semi-Annual/ Quarterly | (35,359 | ) | — | (35,359 | ) | ||||||||||||||||||
| USD | 60 | 11/04/2044 | | 3 Month LIBOR | | 3.049% | Quarterly/Semi-Annual | 31,712 | — | 31,712 | ||||||||||||||||||||
| USD | 60 | 05/05/2045 | | 3 Month LIBOR | | 2.562% | Quarterly/Semi-Annual | 25,265 | — | 25,265 | ||||||||||||||||||||
| USD | 60 | 06/02/2046 | | 3 Month LIBOR | | 2.186% | Quarterly/Semi-Annual | 20,528 | — | 20,528 | ||||||||||||||||||||
| USD | 690 | 07/15/2046 | | 3 Month LIBOR | | 1.783% | Quarterly/Semi-Annual | 167,246 | — | 167,246 | ||||||||||||||||||||
| USD | 270 | 09/02/2046 | | 3 Month LIBOR | | 1.736% | Quarterly/Semi-Annual | 61,510 | — | 61,510 | ||||||||||||||||||||
| USD | 50 | 11/02/2046 | | 3 Month LIBOR | | 2.086% | Quarterly/Semi-Annual | 16,128 | — | 16,128 | ||||||||||||||||||||
|
|
|
|
|
| |||||||||||||||||||||||||
| $ | 274,443 | $ | — | $ | 274,443 | |||||||||||||||||||||||||
|
|
|
|
|
| |||||||||||||||||||||||||
| abfunds.com | AB CORPORATE INCOME SHARES | 27 | |
PORTFOLIO OF INVESTMENTS (continued)
| (a) | Security is exempt from registration under Rule 144A of the Securities Act of 1933. These securities are considered restricted, but liquid and may be resold in transactions exempt from registration, normally to qualified institutional buyers. At April 30, 2020, the aggregate market value of these securities amounted to $16,973,412 or 14.8% of net assets. |
| (b) | Securities are perpetual and, thus, do not have a predetermined maturity date. The date shown, if applicable, reflects the next call date. |
Glossary:
CBT – Chicago Board of Trade
CDX-NAIG – North American Investment Grade Credit Default Swap Index
LIBOR – London Interbank Offered Rates
PJSC – Public Joint Stock Company
REIT – Real Estate Investment Trust
See notes to financial statements.
| 28 | AB CORPORATE INCOME SHARES | abfunds.com | |
STATEMENT OF ASSETS & LIABILITIES
April 30, 2020
| Assets | ||||
Investments in securities, at value (cost $109,626,377) | $ | 111,937,838 | ||
Cash | 1,731,123 | |||
Cash collateral due from broker | 619,374 | |||
Interest receivable | 1,102,956 | |||
Receivable for shares of beneficial interest sold | 218,444 | |||
Receivable for investment securities sold | 122,700 | |||
|
| |||
Total assets | 115,732,435 | |||
|
| |||
| Liabilities | ||||
Payable for investment securities purchased | 844,541 | |||
Dividends payable | 359,215 | |||
Payable for shares of beneficial interest redeemed | 49,588 | |||
Payable for variation margin on futures | 18,658 | |||
Payable for variation margin on centrally cleared swaps | 3,736 | |||
Other liabilities | 1,330 | |||
|
| |||
Total liabilities | 1,277,068 | |||
|
| |||
Net Assets | $ | 114,455,367 | ||
|
| |||
| Composition of Net Assets | ||||
Shares of beneficial interest, at par | $ | 99 | ||
Additional paid-in capital | 109,539,551 | |||
Distributable earnings | 4,915,717 | |||
|
| |||
| $ | 114,455,367 | |||
|
| |||
Net Asset Value Per Share—unlimited shares of beneficial interest authorized, $.00001 par value (based on 9,897,312 common shares outstanding) | $ | 11.56 | ||
|
|
See notes to financial statements.
| abfunds.com | AB CORPORATE INCOME SHARES | 29 | |
STATEMENT OF OPERATIONS
Year Ended April 30, 2020
| Investment Income | ||||||||
Interest | $ | 4,934,219 | ||||||
Other income | 1,260 | |||||||
|
| |||||||
Total investment income | $ | 4,935,479 | ||||||
|
| |||||||
| Realized and Unrealized Gain (Loss) on Investment Transactions | ||||||||
Net realized gain (loss) on: | ||||||||
Investment transactions | 3,258,394 | |||||||
Futures | 843,650 | |||||||
Swaps | (9,764 | ) | ||||||
Net change in unrealized appreciation/depreciation of: | ||||||||
Investments(a) | 95,791 | |||||||
Futures | 428,380 | |||||||
Swaps | 468,775 | |||||||
|
| |||||||
Net gain on investment transactions | 5,085,226 | |||||||
|
| |||||||
Net Increase in Net Assets from Operations | $ | 10,020,705 | ||||||
|
|
| (a) | Net of decrease in accrued foreign capital gains taxes of $205. |
See notes to financial statements.
| 30 | AB CORPORATE INCOME SHARES | abfunds.com | |
STATEMENT OF CHANGES IN NET ASSETS
| Year Ended April 30, 2020 | Year Ended April 30, 2019 | |||||||
| Increase (Decrease) in Net Assets from Operations | ||||||||
Net investment income | $ | 4,935,479 | $ | 3,598,990 | ||||
Net realized gain (loss) on investment transactions | 4,092,280 | (1,603,725 | ) | |||||
Net change in unrealized appreciation/depreciation of investments | 992,946 | 4,265,898 | ||||||
|
|
|
| |||||
Net increase in net assets from operations | 10,020,705 | 6,261,163 | ||||||
Distribution to Shareholders | (5,640,743 | ) | (3,601,284 | ) | ||||
| Transactions in Shares of Beneficial Interest | ||||||||
Net increase | 11,394,931 | 11,280,835 | ||||||
|
|
|
| |||||
Total increase | 15,774,893 | 13,940,714 | ||||||
| Net Assets | ||||||||
Beginning of period | 98,680,474 | 84,739,760 | ||||||
|
|
|
| |||||
End of period | $ | 114,455,367 | $ | 98,680,474 | ||||
|
|
|
| |||||
See notes to financial statements.
| abfunds.com | AB CORPORATE INCOME SHARES | 31 | |
NOTES TO FINANCIAL STATEMENTS
April 30, 2020
NOTE A
Significant Accounting Policies
AB Corporate Shares (the “Trust”) was organized as a Massachusetts business trust under the laws of The Commonwealth of Massachusetts by an Agreement and Declaration of Trust dated January 26, 2004. The Trust is registered under the Investment Company Act of 1940, as an open-end, diversified management investment company. The Trust operates as a “series” company currently offering five separate portfolios: AB Corporate Income Shares, AB Municipal Income Shares, AB Taxable Multi-Sector Income Shares, AB Impact Municipal Income Shares and AB Tax-Aware Real Return Income Shares. Each portfolio is considered to be a separate entity for financial reporting and tax purposes. This report relates only to AB Corporate Income Shares (the “Fund”).
Shares of the Fund are offered exclusively to holders of accounts established under wrap-fee programs sponsored and maintained by certain registered investment advisers approved by AllianceBernstein L.P. (the “Adviser”). The Fund’s shares may be purchased at the relevant net asset value without a sales charge or other fee. The financial statements have been prepared in conformity with U.S. generally accepted accounting principles (“U.S. GAAP”) which require management to make certain estimates and assumptions that affect the reported amounts of assets and liabilities in the financial statements and amounts of income and expenses during the reporting period. Actual results could differ from those estimates. The Fund is an investment company under U.S. GAAP and follows the accounting and reporting guidance applicable to investment companies. The following is a summary of significant accounting policies followed by the Fund.
1. Security Valuation
Portfolio securities are valued at their current market value determined on the basis of market quotations or, if market quotations are not readily available or are deemed unreliable, at “fair value” as determined in accordance with procedures established by and under the general supervision of the Trust’s Board of Trustees (the “Board”).
In general, the market values of securities which are readily available and deemed reliable are determined as follows: securities listed on a national securities exchange (other than securities listed on the NASDAQ Stock Market, Inc. (“NASDAQ”)) or on a foreign securities exchange are valued at the last sale price at the close of the exchange or foreign securities exchange. If there has been no sale on such day, the securities are valued at the last traded price from the previous day. Securities listed on more than one exchange are valued by reference to the principal exchange on
| 32 | AB CORPORATE INCOME SHARES | abfunds.com | |
NOTES TO FINANCIAL STATEMENTS (continued)
which the securities are traded; securities listed only on NASDAQ are valued in accordance with the NASDAQ Official Closing Price; listed or over the counter (“OTC”) market put or call options are valued at the mid level between the current bid and ask prices. If either a current bid or current ask price is unavailable, the Adviser will have discretion to determine the best valuation (e.g., last trade price in the case of listed options); open futures are valued using the closing settlement price or, in the absence of such a price, the most recent quoted bid price. If there are no quotations available for the day of valuation, the last available closing settlement price is used; U.S. Government securities and any other debt instruments having 60 days or less remaining until maturity are generally valued at market by an independent pricing vendor, if a market price is available. If a market price is not available, the securities are valued at amortized cost. This methodology is commonly used for short term securities that have an original maturity of 60 days or less, as well as short term securities that had an original term to maturity that exceeded 60 days. In instances when amortized cost is utilized, the Valuation Committee (the “Committee”) must reasonably conclude that the utilization of amortized cost is approximately the same as the fair value of the security. Such factors the Committee will consider include, but are not limited to, an impairment of the creditworthiness of the issuer or material changes in interest rates. Fixed-income securities, including mortgage-backed and asset-backed securities, may be valued on the basis of prices provided by a pricing service or at a price obtained from one or more of the major broker-dealers. In cases where broker-dealer quotes are obtained, the Adviser may establish procedures whereby changes in market yields or spreads are used to adjust, on a daily basis, a recently obtained quoted price on a security. Swaps and other derivatives are valued daily, primarily using independent pricing services, independent pricing models using market inputs, as well as third party broker-dealers or counterparties. Open end mutual funds are valued at the closing net asset value per share, while exchange traded funds are valued at the closing market price per share.
Securities for which market quotations are not readily available (including restricted securities) or are deemed unreliable are valued at fair value as deemed appropriate by the Adviser. Factors considered in making this determination may include, but are not limited to, information obtained by contacting the issuer, analysts, analysis of the issuer’s financial statements or other available documents. In addition, the Fund may use fair value pricing for securities primarily traded in non-U.S. markets because most foreign markets close well before the Fund values its securities at 4:00 p.m., Eastern Time. The earlier close of these foreign markets gives rise to the possibility that significant events, including broad market moves, may have occurred in the interim and may materially affect the value of those securities. To account for this, the Fund generally values many of its foreign
| abfunds.com | AB CORPORATE INCOME SHARES | 33 | |
NOTES TO FINANCIAL STATEMENTS (continued)
equity securities using fair value prices based on third party vendor modeling tools to the extent available.
2. Fair Value Measurements
In accordance with U.S. GAAP regarding fair value measurements, fair value is defined as the price that the Fund would receive to sell an asset or pay to transfer a liability in an orderly transaction between market participants at the measurement date. U.S. GAAP establishes a framework for measuring fair value, and a three-level hierarchy for fair value measurements based upon the transparency of inputs to the valuation of an asset or liability (including those valued based on their market values as described in Note A.1 above). Inputs may be observable or unobservable and refer broadly to the assumptions that market participants would use in pricing the asset or liability. Observable inputs reflect the assumptions market participants would use in pricing the asset or liability based on market data obtained from sources independent of the Fund. Unobservable inputs reflect the Fund’s own assumptions about the assumptions that market participants would use in pricing the asset or liability based on the best information available in the circumstances. Each investment is assigned a level based upon the observability of the inputs which are significant to the overall valuation. The three-tier hierarchy of inputs is summarized below.
| • | Level 1—quoted prices in active markets for identical investments |
| • | Level 2—other significant observable inputs (including quoted prices for similar investments, interest rates, prepayment speeds, credit risk, etc.) |
| • | Level 3—significant unobservable inputs (including the Fund’s own assumptions in determining the fair value of investments) |
The fair value of debt instruments, such as bonds, and over-the-counter derivatives is generally based on market price quotations, recently executed market transactions (where observable) or industry recognized modeling techniques and are generally classified as Level 2. Pricing vendor inputs to Level 2 valuations may include quoted prices for similar investments in active markets, interest rate curves, coupon rates, currency rates, yield curves, option adjusted spreads, default rates, credit spreads and other unique security features in order to estimate the relevant cash flows which are then discounted to calculate fair values. If these inputs are unobservable and significant to the fair value, these investments will be classified as Level 3.
Other fixed income investments, including non-U.S. government and corporate debt, are generally valued using quoted market prices, if available, which are typically impacted by current interest rates, maturity dates and any perceived credit risk of the issuer. Additionally, in the absence of
| 34 | AB CORPORATE INCOME SHARES | abfunds.com | |
NOTES TO FINANCIAL STATEMENTS (continued)
quoted market prices, these inputs are used by pricing vendors to derive a valuation based upon industry or proprietary models which incorporate issuer specific data with relevant yield/spread comparisons with more widely quoted bonds with similar key characteristics. Those investments for which there are observable inputs are classified as Level 2. Where the inputs are not observable, the investments are classified as Level 3.
The following table summarizes the valuation of the Fund’s investments by the above fair value hierarchy levels as of April 30, 2020:
Investments in | Level 1 | Level 2 | Level 3 | Total | ||||||||||||
Assets: | ||||||||||||||||
Corporates – Investment Grade | $ | – 0 | – | $ | 106,117,144 | $ | – 0 | – | $ | 106,117,144 | ||||||
Corporates – Non-Investment Grade | – 0 | – | 2,597,700 | – 0 | – | 2,597,700 | ||||||||||
Quasi-Sovereigns | – 0 | – | 1,739,230 | – 0 | – | 1,739,230 | ||||||||||
Governments – Sovereign Bonds | – 0 | – | 1,483,764 | – 0 | – | 1,483,764 | ||||||||||
|
|
|
|
|
|
|
| |||||||||
Total Investments in Securities | – 0 | – | 111,937,838 | – 0 | – | 111,937,838 | ||||||||||
Other Financial Instruments(a): | ||||||||||||||||
Assets: | ||||||||||||||||
Futures | 607,305 | – 0 | – | – 0 | – | 607,305 | (b) | |||||||||
Centrally Cleared Credit Default Swaps | – 0 | – | 35,822 | – 0 | – | 35,822 | (b) | |||||||||
Centrally Cleared Interest Rate Swaps | – 0 | – | 322,389 | – 0 | – | 322,389 | (b) | |||||||||
Liabilities: | ||||||||||||||||
Futures | (141,195 | ) | – 0 | – | – 0 | – | (141,195 | )(b) | ||||||||
Centrally Cleared Interest Rate Swaps | – 0 | – | (47,946 | ) | – 0 | – | (47,946 | )(b) | ||||||||
|
|
|
|
|
|
|
| |||||||||
Total | $ | 466,110 | $ | 112,248,103 | $ | – 0 | – | $ | 112,714,213 | |||||||
|
|
|
|
|
|
|
| |||||||||
| (a) | Other financial instruments are derivative instruments, such as futures, forwards and swaps, which are valued at the unrealized appreciation/(depreciation) on the instrument. Other financial instruments may also include swaps with upfront premiums, options written and swaptions written which are valued at market value. |
| (b) | Only variation margin receivable/(payable) at period end is reported within the statement of assets and liabilities. This amount reflects cumulative unrealized appreciation/(depreciation) on futures and centrally cleared swaps as reported in the portfolio of investments. Where applicable, centrally cleared swaps with upfront premiums are presented here at market value. |
3. Taxes
It is the Fund’s policy to meet the requirements of the Internal Revenue Code applicable to regulated investment companies and to distribute all of its investment company taxable income and net realized gains, if any, to shareholders. Therefore, no provisions for federal income or excise taxes are required.
In accordance with U.S. GAAP requirements regarding accounting for uncertainties in income taxes, management has analyzed the Fund’s tax positions taken or expected to be taken on federal and state income tax returns for all open tax years (the current and the prior three tax years) and has concluded that no provision for income tax is required in the Fund’s financial statements.
| abfunds.com | AB CORPORATE INCOME SHARES | 35 | |
NOTES TO FINANCIAL STATEMENTS (continued)
4. Investment Income and Investment Transactions
Dividend income is recorded on the ex-dividend date or as soon as the Fund is informed of the dividend. Interest income is accrued daily. Investment transactions are accounted for on the date the securities are purchased or sold. Investment gains or losses are determined on the identified cost basis. The Fund amortizes premiums and accretes discounts as adjustments to interest income.
5. Dividends and Distributions
Dividends and distributions to shareholders, if any, are recorded on the ex-dividend date. Income dividends and capital gains distributions are determined in accordance with federal tax regulations and may differ from those determined in accordance with U.S. GAAP. To the extent these differences are permanent, such amounts are reclassified within the capital accounts based on their federal tax basis treatment; temporary differences do not require such reclassification.
NOTE B
Advisory Fee and Other Transactions with Affiliates
Under the terms of the advisory agreement, the Fund pays no advisory fee to the Adviser and the Adviser reimburses or pays for the Fund’s operating expenses. The Fund is an integral part of separately managed accounts in wrap-fee programs and other investment programs. Typically, participants in these programs pay a fee to their investment adviser for all costs and expenses of the separately managed account, including costs and expenses associated with the Fund, and a fee is paid by their investment adviser to the Adviser. In certain cases, participants may have a direct relationship with the Adviser without the involvement of a third party investment adviser, in which case the participant would pay a fee directly to the Adviser. The Adviser serves as investment manager and adviser of the Fund and continuously furnishes an investment program for the Fund and manages, supervises and conducts the affairs of the Fund, subject to the supervisions of the Fund’s Board. The advisory agreement provides that the Adviser or an affiliate will furnish, or pay the expenses of the Fund for, office space, facilities and equipment, services of executive and other personnel of the Fund and certain administrative services.
The Fund has entered into a distribution agreement with AllianceBernstein Investments, Inc., the Fund’s principal underwriter (the “Underwriter”), to permit the Underwriter to distribute the Fund’s shares, which are sold at their net asset value without any sales charge. The Fund does not pay a fee for this service. The Underwriter is a wholly owned subsidiary of the Adviser.
AllianceBernstein Investor Services, Inc. (“ABIS”), a wholly-owned subsidiary of the Adviser, acts as the Fund’s registrar, transfer agent and
| 36 | AB CORPORATE INCOME SHARES | abfunds.com | |
NOTES TO FINANCIAL STATEMENTS (continued)
dividend-disbursing agent. ABIS registers the transfer, issuance and redemption of Fund shares and disburses dividends and other distributions to Fund shareholders. The Fund does not pay a fee for this service.
During the second quarter of 2018, AXA S.A. (“AXA”), a French holding company for the AXA Group, completed the sale of a minority stake in its subsidiary, AXA Equitable Holdings, Inc. (now named Equitable Holdings, Inc.)(“Equitable”), through an initial public offering. Equitable is the holding company for a diverse group of financial services companies, including an approximately 64.9% economic interest in the Adviser and a 100% interest in AllianceBernstein Corporation, the general partner of the Adviser. Since the initial sale, AXA has completed additional offerings, most recently during the fourth quarter of 2019. As a result, AXA currently owns less than 10% of the outstanding shares of common stock of Equitable, and no longer owns a controlling interest in Equitable. AXA previously announced its intention to sell its entire interest in Equitable over time, subject to market conditions and other factors (the “Plan”). Most of AXA’s remaining Equitable shares are to be delivered on redemption of AXA bonds mandatorily exchangeable into Equitable shares and maturing in May 2021. AXA retains sole discretion to determine the timing of any future sales of its remaining shares of Equitable common stock.
Sales under the Plan that were completed on November 13, 2019 resulted in the indirect transfer of a “controlling block” of voting securities of the Adviser (a “Change of Control Event”) and may have been deemed to have been an “assignment” causing a termination of the Fund’s investment advisory and administration agreements. In order to ensure that investment advisory and administration services could continue uninterrupted in the event of a Change of Control Event, the Board previously approved new investment advisory and administration agreements with the Adviser, and shareholders of the Fund subsequently approved the new investment advisory agreement. These agreements became effective on November 13, 2019.
NOTE C
Investment Transactions
Purchases and sales of investment securities (excluding short-term investments) for the year ended April 30, 2020 were as follows:
| Purchases | Sales | |||||||
Investment securities (excluding | $ | 120,260,780 | $ | 107,560,950 | ||||
U.S. government securities | – 0 | – | – 0 | – | ||||
| abfunds.com | AB CORPORATE INCOME SHARES | 37 | |
NOTES TO FINANCIAL STATEMENTS (continued)
The cost of investments for federal income tax purposes, gross unrealized appreciation and unrealized depreciation are as follows:
Cost | $ | 109,626,377 | ||
|
| |||
Gross unrealized appreciation | $ | 5,966,645 | ||
Gross unrealized depreciation | (3,384,730 | ) | ||
|
| |||
Net unrealized appreciation | $ | 2,581,915 | ||
|
|
1. Derivative Financial Instruments
The Fund may use derivatives in an effort to earn income and enhance returns, to replace more traditional direct investments, to obtain exposure to otherwise inaccessible markets (collectively, “investment purposes”), or to hedge or adjust the risk profile of its portfolio.
The principal types of derivatives utilized by the Fund, as well as the methods in which they may be used are:
| • | Futures |
The Fund may buy or sell futures for investment purposes or for the purpose of hedging its portfolio against adverse effects of potential movements in the market. The Fund bears the market risk that arises from changes in the value of these instruments and the imperfect correlation between movements in the price of the futures and movements in the price of the assets, reference rates or indices which they are designed to track. Among other things, the Fund may purchase or sell futures for foreign currencies or options thereon for non-hedging purposes as a means of making direct investment in foreign currencies.
At the time the Fund enters into futures, the Fund deposits and maintains as collateral an initial margin with the broker, as required by the exchange on which the transaction is effected. Such amount is shown as cash collateral due from broker on the statement of assets and liabilities. Pursuant to the contract, the Fund agrees to receive from or pay to the broker an amount of cash equal to the daily fluctuation in the value of the contract. Such receipts or payments are known as variation margin and are recorded by the Fund as unrealized gains or losses. Risks may arise from the potential inability of a counterparty to meet the terms of the contract. The credit/counterparty risk for exchange-traded futures is generally less than privately negotiated futures, since the clearinghouse, which is the issuer or counterparty to each exchange-traded future, has robust risk mitigation standards, including the requirement to provide initial and variation margin. When the contract is closed, the Fund records a realized gain or loss equal to the difference between the value of the contract at the time it was opened and the time it was closed.
| 38 | AB CORPORATE INCOME SHARES | abfunds.com | |
NOTES TO FINANCIAL STATEMENTS (continued)
Use of long futures subjects the Fund to risk of loss in excess of the amounts shown on the statement of assets and liabilities, up to the notional value of the futures. Use of short futures subjects the Fund to unlimited risk of loss. Under some circumstances, futures exchanges may establish daily limits on the amount that the price of futures can vary from the previous day’s settlement price, which could effectively prevent liquidation of unfavorable positions.
During the year ended April 30, 2020, the Fund held futures for hedging purposes.
| • | Swaps |
The Fund may enter into swaps to hedge its exposure to interest rates or credit risk. A swap is an agreement that obligates two parties to exchange a series of cash flows at specified intervals based upon or calculated by reference to changes in specified prices or rates for a specified amount of an underlying asset. The payment flows are usually netted against each other, with the difference being paid by one party to the other. In addition, collateral may be pledged or received by the Fund in accordance with the terms of the respective swaps to provide value and recourse to the Fund or its counterparties in the event of default, bankruptcy or insolvency by one of the parties to the swap.
Risks may arise as a result of the failure of the counterparty to the swap to comply with the terms of the swap. The loss incurred by the failure of a counterparty is generally limited to the net interim payment to be received by the Fund, and/or the termination value at the end of the contract. Therefore, the Fund considers the creditworthiness of each counterparty to a swap in evaluating potential counterparty risk. This risk is mitigated by having a netting arrangement between the Fund and the counterparty and by the posting of collateral by the counterparty to the Fund to cover the Fund’s exposure to the counterparty. Additionally, risks may arise from unanticipated movements in interest rates or in the value of the underlying securities. The Fund accrues for the interim payments on swaps on a daily basis, with the net amount recorded within unrealized appreciation/depreciation of swaps on the statement of assets and liabilities, where applicable. Once the interim payments are settled in cash, the net amount is recorded as realized gain/(loss) on swaps on the statement of operations, in addition to any realized gain/(loss) recorded upon the termination of swaps. Upfront premiums paid or received for OTC swaps are recognized as cost or proceeds on the statement of assets and liabilities and are amortized on a straight line basis over the life of the contract. Amortized upfront premiums are included in net realized gain/(loss) from swaps on the statement of operations. Fluctuations in
| abfunds.com | AB CORPORATE INCOME SHARES | 39 | |
NOTES TO FINANCIAL STATEMENTS (continued)
the value of swaps are recorded as a component of net change in unrealized appreciation/depreciation of swaps on the statement of operations.
Certain standardized swaps, including certain interest rate swaps and credit default swaps, are (or soon will be) subject to mandatory central clearing. Cleared swaps are transacted through futures commission merchants (“FCMs”) that are members of central clearinghouses, with the clearinghouse serving as central counterparty, similar to transactions in futures contracts. Centralized clearing will be required for additional categories of swaps on a phased-in basis based on requirements published by the Securities and Exchange Commission and Commodity Futures Trading Commission.
At the time the Fund enters into a centrally cleared swap, the Fund deposits and maintains as collateral an initial margin with the broker, as required by the clearinghouse on which the transaction is effected. Such amount is shown as cash collateral due from broker on the statement of assets and liabilities. Pursuant to the contract, the Fund agrees to receive from or pay to the broker an amount of cash equal to the daily fluctuation in the value of the contract. Such receipts or payments are known as variation margin and are recorded by the Fund as unrealized gains or losses. Risks may arise from the potential inability of a counterparty to meet the terms of the contract. The credit/counterparty risk for centrally cleared swaps is generally less than non-centrally cleared swaps, since the clearinghouse, which is the issuer or counterparty to each centrally cleared swap, has robust risk mitigation standards, including the requirement to provide initial and variation margin. When the contract is closed, the Fund records a realized gain or loss equal to the difference between the value of the contract at the time it was opened and the time it was closed.
Interest Rate Swaps:
The Fund is subject to interest rate risk exposure in the normal course of pursuing its investment objectives. Because the Fund holds fixed rate bonds, the value of these bonds may decrease if interest rates rise. To help hedge against this risk and to maintain its ability to generate income at prevailing market rates, the Fund may enter into interest rate swaps. Interest rate swaps are agreements between two parties to exchange cash flows based on a notional amount. The Fund may elect to pay a fixed rate and receive a floating rate, or, receive a fixed rate and pay a floating rate on a notional amount.
In addition, the Fund may also enter into interest rate swap transactions to preserve a return or spread on a particular investment or portion of its portfolio, or protecting against an increase in the price of securities the Fund anticipates purchasing at a later date. Interest
| 40 | AB CORPORATE INCOME SHARES | abfunds.com | |
NOTES TO FINANCIAL STATEMENTS (continued)
rate swaps involve the exchange by a Fund with another party of their respective commitments to pay or receive interest (e.g., an exchange of floating rate payments for fixed rate payments) computed based on a contractually-based principal (or “notional”) amount. Interest rate swaps are entered into on a net basis (i.e., the two payment streams are netted out, with the Fund receiving or paying, as the case may be, only the net amount of the two payments).
During the year ended April 30, 2020, the Fund held interest rate swaps for hedging purposes.
Credit Default Swaps:
The Fund may enter into credit default swaps, including to manage its exposure to the market or certain sectors of the market, to reduce its risk exposure to defaults by corporate and sovereign issuers held by the Fund, or to create exposure to corporate or sovereign issuers to which it is not otherwise exposed. The Fund may purchase credit protection (“Buy Contract”) or provide credit protection (“Sale Contract”) on the referenced obligation of the credit default swap. During the term of the swap, the Fund receives/(pays) fixed payments from/(to) the respective counterparty, calculated at the agreed upon rate applied to the notional amount. If the Fund is a buyer/(seller) of protection and a credit event occurs, as defined under the terms of the swap, the Fund will either (i) receive from the seller/(pay to the buyer) of protection an amount equal to the notional amount of the swap (the “Maximum Payout Amount”) and deliver/(take delivery of) the referenced obligation or (ii) receive/(pay) a net settlement amount in the form of cash or securities equal to the notional amount of the swap less the recovery value of the referenced obligation. In certain circumstances Maximum Payout Amounts may be partially offset by recovery values of the respective referenced obligations, upfront premium received upon entering into the agreement, or net amounts received from settlement of buy protection credit default swaps entered into by the Fund for the same referenced obligations with the same counterparty.
Credit default swaps may involve greater risks than if a Fund had invested in the referenced obligation directly. Credit default swaps are subject to general market risk, liquidity risk, counterparty risk and credit risk. If the Fund is a buyer of protection and no credit event occurs, it will lose the payments it made to its counterparty. If the Fund is a seller of protection and a credit event occurs, the value of the referenced obligation received by the Fund coupled with the periodic payments previously received, may be less than the Maximum Payout Amount it pays to the buyer, resulting in a net loss to the Fund.
| abfunds.com | AB CORPORATE INCOME SHARES | 41 | |
NOTES TO FINANCIAL STATEMENTS (continued)
Implied credit spreads over U.S. Treasuries of comparable maturity utilized in determining the market value of credit default swaps on issuers as of period end are disclosed in the portfolio of investments. The implied spreads serve as an indicator of the current status of the payment/performance risk and typically reflect the likelihood of default by the issuer of the referenced obligation. The implied credit spread of a particular reference obligation also reflects the cost of buying/selling protection and may reflect upfront payments required to be made to enter into the agreement. Widening credit spreads typically represent a deterioration of the referenced obligation’s credit soundness and greater likelihood of default or other credit event occurring as defined under the terms of the agreement. A credit spread identified as “Defaulted” indicates a credit event has occurred for the referenced obligation.
During the year ended April 30, 2020, the Fund held credit default swaps for non-hedging purposes.
The Fund typically enters into International Swaps and Derivatives Association, Inc. Master Agreements (“ISDA Master Agreement”) with its OTC derivative contract counterparties in order to, among other things, reduce its credit risk to OTC counterparties. ISDA Master Agreements include provisions for general obligations, representations, collateral and events of default or termination. Under an ISDA Master Agreement, the Fund typically may offset with the OTC counterparty certain derivative financial instruments’ payables and/or receivables with collateral held and/or posted and create one single net payment (close-out netting) in the event of default or termination. In the event of a default by an OTC counterparty, the return of collateral with market value in excess of the Fund’s net liability, held by the defaulting party, may be delayed or denied.
The Fund’s ISDA Master Agreements may contain provisions for early termination of OTC derivative transactions in the event the net assets of the Fund decline below specific levels (“net asset contingent features”). If these levels are triggered, the Fund’s OTC counterparty has the right to terminate such transaction and require the Fund to pay or receive a settlement amount in connection with the terminated transaction. If OTC derivatives were held at period end, please refer to netting arrangements by the OTC counterparty table below for additional details.
| 42 | AB CORPORATE INCOME SHARES | abfunds.com | |
NOTES TO FINANCIAL STATEMENTS (continued)
During the year ended April 30, 2020, the Fund had entered into the following derivatives:
Asset Derivatives | Liability Derivatives | |||||||||||
Derivative Type | Statement of | Fair Value | Statement of | Fair Value | ||||||||
Interest rate contracts | Receivable/Payable for variation margin on futures | $ | 607,305 | * | Receivable/Payable for variation margin on futures | $ | 141,195 | * | ||||
Credit contracts | Receivable/Payable for variation margin on centrally cleared swaps | 46,755 | * | |||||||||
Interest rate contracts | Receivable/Payable for variation margin on centrally cleared swaps |
| 322,389 | * | Receivable/Payable for variation margin on centrally cleared swaps |
| 47,946 | * | ||||
|
|
|
| |||||||||
Total | $ | 976,449 | $ | 189,141 | ||||||||
|
|
|
| |||||||||
| * | Only variation margin receivable/payable at period end is reported within the statement of assets and liabilities. This amount reflects cumulative unrealized appreciation/(depreciation) on futures and centrally cleared swaps as reported in the portfolio of investments. |
Derivative Type | Location of Gain | Realized Gain or (Loss) on Derivatives | Change in Unrealized Appreciation or (Depreciation) | |||||||
Interest rate contracts | Net realized gain (loss) on futures; Net change in unrealized appreciation/depreciation of futures | $ | 843,650 | $ | 428,380 | |||||
Interest rate contracts | Net realized gain (loss) on swaps; Net change in unrealized appreciation/depreciation of swaps | 12,839 | 422,117 | |||||||
Credit contracts | Net realized gain (loss) on swaps; Net change in unrealized appreciation/depreciation of swaps | (22,603 | ) | 46,658 | ||||||
|
|
|
| |||||||
Total | $ | 833,886 | $ | 897,155 | ||||||
|
|
|
| |||||||
| abfunds.com | AB CORPORATE INCOME SHARES | 43 | |
NOTES TO FINANCIAL STATEMENTS (continued)
The following table represents the average monthly volume of the Fund’s derivative transactions during the year ended April 30, 2020:
Futures: | ||||
Average notional amount of buy contracts | $ | 12,714,256 | ||
Average notional amount of sale contracts | $ | 4,477,011 | ||
Centrally Cleared Interest Rate Swaps: | ||||
Average notional amount | $ | 3,430,000 | ||
Credit Default Swaps: | ||||
Average notional amount of sale contracts | $ | 33,934 | (a) | |
Centrally Cleared Credit Default Swaps: | ||||
Average notional amount of sale contracts | $ | 4,276,250 | (b) |
| (a) | Positions were open for two months during the year. |
| (b) | Positions were open for eight months during the year. |
NOTE D
Shares of Beneficial Interest
Transactions in shares of beneficial interest were as follows:
| Shares | Amount | |||||||||||||||||||||||
| Year Ended April 30, 2020 | Year Ended April 30, 2019 | Year Ended April 30, 2020 | Year Ended April 30, 2019 | |||||||||||||||||||||
|
| |||||||||||||||||||||||
Shares sold | 5,009,033 | 3,322,790 | $ | 57,284,749 | $ | 35,696,079 | ||||||||||||||||||
| ||||||||||||||||||||||||
Shares issued in reinvestment of dividends and distributions | 6 | – 0 | – | 71 | – 0 | – | ||||||||||||||||||
| ||||||||||||||||||||||||
Shares redeemed | (3,990,723 | ) | (2,282,342 | ) | (45,889,889 | ) | (24,415,244 | ) | ||||||||||||||||
| ||||||||||||||||||||||||
Net increase | 1,018,316 | 1,040,448 | $ | 11,394,931 | $ | 11,280,835 | ||||||||||||||||||
| ||||||||||||||||||||||||
NOTE E
Risks Involved in Investing in the Fund
Market Risk—The market value of a security may move up or down, sometimes rapidly and unpredictably. These fluctuations may cause a security to be worth less than the price originally paid for it, or less than it was worth at an earlier time. Market risk may affect a single issuer, industry, sector of the economy or the market as a whole. Global economies and financial markets are increasingly interconnected, which increases the probabilities that conditions in one country or region might adversely impact issuers in a different country or region. Conditions affecting the general economy, including political, social, or economic instability at the local, regional, or global level may also affect the market value of a security. Health crises, such as pandemic and epidemic diseases, as well as other incidents that interrupt the expected course of events, such as natural disasters, war or civil disturbance, acts of terrorism, power outages and other unforeseeable and external events, and the public response to or fear of such diseases or events, have and may in the future have an
| 44 | AB CORPORATE INCOME SHARES | abfunds.com | |
NOTES TO FINANCIAL STATEMENTS (continued)
adverse effect on the Fund’s investments and net asset value and can lead to increased market volatility. For example, any preventative or protective actions that governments may take in respect of such diseases or events may result in periods of business disruption, inability to obtain raw materials, supplies and component parts, and reduced or disrupted operations for the Fund’s portfolio companies. The occurrence and pendency of such diseases or events could adversely affect the economies and financial markets either in specific countries or worldwide.
Credit Risk—An issuer or guarantor of a fixed-income security, or the counterparty to a derivatives or other contract, may be unable or unwilling to make timely payments of interest or principal, or to otherwise honor its obligations. The issuer or guarantor may default, causing a loss of the full principal amount of a security and any accrued interest. The degree of risk for a particular security may be reflected in its credit rating. There is the possibility that the credit rating of a fixed-income security may be downgraded after purchase, which may adversely affect the value of the security. Investments in fixed-income securities with lower ratings tend to have a higher probability that an issuer will default or fail to meet its payment obligations.
Interest Rate Risk—Changes in interest rates will affect the value of investments in fixed-income securities. When interest rates rise, the value of existing investments in fixed-income securities tends to fall and this decrease in value may not be offset by higher income from new investments. Interest rate risk is generally greater for fixed-income securities with longer maturities or durations.
Inflation Risk—This is the risk that the value of assets or income from investments will be less in the future as inflation decreases the value of money. As inflation increases, the value of the Fund’s assets can decline as can the value of the Fund’s distributions. This risk is significantly greater for fixed-income securities with longer maturities.
Foreign (Non-U.S.) Risk—Investments in securities of non-U.S. issuers may involve more risk than those of U.S. issuers. These securities may fluctuate more widely in price and may be more difficult to trade due to adverse market, economic, political, regulatory or other factors.
Derivatives Risk—The Fund may enter into derivative transactions such as forwards, options, futures and swaps. Derivatives may be illiquid, difficult to price, and leveraged so that small changes may produce disproportionate losses for the Fund, and subject to counterparty risk to a greater degree than more traditional investments. Derivatives may result in significant losses, including losses that are far greater than the value of the derivatives reflected on the statement of assets and liabilities.
| abfunds.com | AB CORPORATE INCOME SHARES | 45 | |
NOTES TO FINANCIAL STATEMENTS (continued)
LIBOR Risk—The Fund may invest in certain debt securities, derivatives or other financial instruments that utilize the London Interbank Offered Rate, or “LIBOR,” as a “benchmark” or “reference rate” for various interest rate calculations. In July 2017, the United Kingdom Financial Conduct Authority, which regulates LIBOR, announced a desire to phase out the use of LIBOR by the end of 2021. Although financial regulators and industry working groups have suggested alternative reference rates, such as European Interbank Offer Rate (“EURIBOR”), Sterling Overnight Interbank Average Rate (“SONIA”) and Secured Overnight Financing Rate (“SOFR”), global consensus on alternative rates is lacking and the process for amending existing contracts or instruments to transition away from LIBOR remains unclear. The elimination of LIBOR or changes to other reference rates or any other changes or reforms to the determination or supervision of reference rates could have an adverse impact on the market for, or value of, any securities or payments linked to those reference rates, which may adversely affect the Fund’s performance and/or net asset value. Uncertainty and risk also remain regarding the willingness and ability of issuers and lenders to include revised provisions in new and existing contracts or instruments. Consequently, the transition away from LIBOR to other reference rates may lead to increased volatility and illiquidity in markets that are tied to LIBOR, fluctuations in values of LIBOR-related investments or investments in issuers that utilize LIBOR, increased difficulty in borrowing or refinancing and diminished effectiveness of hedging strategies, adversely affecting the Fund’s performance. Furthermore, the risks associated with the expected discontinuation of LIBOR and transition may be exacerbated if the work necessary to effect an orderly transition to an alternative reference rate is not completed in a timely manner. Because the usefulness of LIBOR as a benchmark could deteriorate during the transition period, these effects could occur prior to the end of 2021.
Indemnification Risk—In the ordinary course of business, the Fund enters into contracts that contain a variety of indemnifications. The Fund’s maximum exposure under these arrangements is unknown. However, the Fund has not had prior claims or losses pursuant to these indemnification provisions and expects the risk of loss thereunder to be remote. Therefore, the Fund has not accrued any liability in connection with these indemnification provisions.
Management Risk—The Fund is subject to management risk because it is an actively-managed investment fund. The Adviser will apply its investment techniques and risk analyses in making investment decisions, but there is no guarantee that its techniques will produce the intended results.
| 46 | AB CORPORATE INCOME SHARES | abfunds.com | |
NOTES TO FINANCIAL STATEMENTS (continued)
NOTE F
Joint Credit Facility
A number of open-end mutual funds managed by the Adviser, including the Fund, participate in a $325 million revolving credit facility (the “Facility”) intended to provide short-term financing, if necessary, subject to certain restrictions in connection with abnormal redemption activity. Commitment fees related to the Facility are paid by the Adviser. The Fund did not utilize the Facility during the year ended April 30, 2020.
NOTE G
Distributions to Shareholders
The tax character of distributions paid during the fiscal years ended April 30, 2020 and April 30, 2019 were as follows:
| 2020 | 2019 | |||||||
Distributions paid from: | ||||||||
Ordinary income | $ | 5,640,743 | $ | 3,601,284 | ||||
|
|
|
| |||||
Total distributions paid | $ | 5,640,743 | $ | 3,601,284 | ||||
|
|
|
| |||||
As of April 30, 2020, the components of accumulated earnings/(deficit) on a tax basis were as follows:
Undistributed ordinary income | $ | 2,099,643 | ||
Accumulated capital and other losses | 598,788 | (a) | ||
Unrealized appreciation/(depreciation) | 2,577,135 | (b) | ||
|
| |||
Total accumulated earnings/(deficit) | $ | 5,275,566 | (c) | |
|
|
| (a) | During the fiscal year, the Fund utilized $1,595,243 of capital loss carryforwards to offset current year net realized gains. |
| (b) | The differences between book-basis and tax-basis unrealized appreciation/(depreciation) are attributable primarily to the recognition for tax purposes of unrealized gains/losses on certain derivative instruments and the tax treatment of swaps. |
| (c) | The differences between book-basis and tax-basis components of accumulated earnings/(deficit) are attributable primarily to the accrual of foreign capital gains tax and dividends payable. |
For tax purposes, net capital losses may be carried over to offset future capital gains, if any. Funds are permitted to carry forward realized capital losses for an indefinite period, and such losses will retain their character as either short-term or long-term capital losses. As of April 30, 2020, the Fund did not have any capital loss carryforwards.
During the current fiscal year, there were no permanent differences that resulted in adjustments to distributable earnings or additional paid-in capital.
| abfunds.com | AB CORPORATE INCOME SHARES | 47 | |
NOTES TO FINANCIAL STATEMENTS (continued)
NOTE H
Recent Accounting Pronouncements
In March 2017, the Financial Accounting Standards Board issued an Accounting Standards Update, ASU 2017-08, Receivables—Nonrefundable Fees and Other Costs (Subtopic 310-20), Premium Amortization on Purchased Callable Debt Securities which amends the amortization period for certain purchased callable debt securities held at a premium, shortening such period to the earliest call date. ASU 2017-08 does not require any accounting change for debt securities held at a discount; the discount continues to be amortized to maturity. ASU 2017-08 is effective for fiscal years, and interim periods within those fiscal years, beginning after December 15, 2018. The Fund has adopted ASU 2017-08, which did not have a material impact on the Fund’s financial position or the results of its operations, and had no impact on the Fund’s net assets.
NOTE I
Subsequent Events
Management has evaluated subsequent events for possible recognition or disclosure in the financial statements through the date the financial statements are issued. Management has determined that there are no material events that would require disclosure in the Fund’s financial statements through this date.
| 48 | AB CORPORATE INCOME SHARES | abfunds.com | |
FINANCIAL HIGHLIGHTS
Selected Data For A Share Of Beneficial Interest Outstanding Throughout Each Period
| Year Ended April 30, | ||||||||||||||||||||
| 2020 | 2019 | 2018 | 2017 | 2016 | ||||||||||||||||
|
| |||||||||||||||||||
Net asset value, beginning of period | $ 11.11 | $ 10.81 | $ 11.14 | $ 11.19 | $ 11.36 | |||||||||||||||
|
| |||||||||||||||||||
Income From Investment Operations | ||||||||||||||||||||
Net investment income(a) | .44 | .44 | .39 | .38 | .39 | |||||||||||||||
Net realized and unrealized gain (loss) on investment transactions | .51 | .30 | (.33 | ) | (.04 | ) | (.16 | ) | ||||||||||||
|
| |||||||||||||||||||
Net increase in net asset value from operations | .95 | .74 | .06 | .34 | .23 | |||||||||||||||
|
| |||||||||||||||||||
Less: Dividends and Distributions | ||||||||||||||||||||
Dividends from net investment income | (.45 | ) | (.44 | ) | (.39 | ) | (.39 | ) | (.40 | ) | ||||||||||
Distributions from net realized gain on investment transactions | (.05 | ) | – 0 | – | – 0 | – | – 0 | – | – 0 | – | ||||||||||
|
| |||||||||||||||||||
Total dividends and distributions | (.50 | ) | (.44 | ) | (.39 | ) | (.39 | ) | (.40 | ) | ||||||||||
|
| |||||||||||||||||||
Net asset value, end of period | $ 11.56 | $ 11.11 | $ 10.81 | $ 11.14 | $ 11.19 | |||||||||||||||
|
| |||||||||||||||||||
Total Return | ||||||||||||||||||||
Total investment return based on net asset value(b)* | 8.65 | % | 7.03 | % | .50 | % | 3.08 | % | 2.12 | % | ||||||||||
Ratios/Supplemental Data | ||||||||||||||||||||
Net assets, end of period (000’s omitted) | $114,455 | $98,680 | $84,740 | $74,191 | $63,342 | |||||||||||||||
Ratio to average net assets of: |
| |||||||||||||||||||
Net investment income | 3.83 | % | 4.06 | % | 3.47 | % | 3.43 | % | 3.60 | % | ||||||||||
Portfolio turnover rate | 87 | % | 140 | % | 73 | % | 79 | % | 59 | % | ||||||||||
| (a) | Based on average shares outstanding. |
| (b) | Total investment return is calculated assuming an initial investment made at the net asset value at the beginning of the period, reinvestment of all dividends and distributions at net asset value during the period, and redemption on the last day of the period. Total return does not reflect the deduction of taxes that a shareholder would pay on fund distributions or the redemption of fund shares. Total investment return calculated for a period of less than one year is not annualized. |
| * | Includes the impact of proceeds received and credited to the Fund resulting from class action settlements, which enhanced the Fund’s performance for the year ended April 30, 2017 by .01%. |
See notes to financial statements.
| abfunds.com | AB CORPORATE INCOME SHARES | 49 | |
REPORT OF INDEPENDENT REGISTERED
PUBLIC ACCOUNTING FIRM
To the Board of Trustees of AB Corporate Shares
and Shareholders of AB Corporate Income Shares:
Opinion on the Financial Statements
We have audited the accompanying statement of assets and liabilities of AB Corporate Income Shares (the “Fund”) (one of the series constituting AB Corporate Shares (the “Trust”)), including the portfolio of investments, as of April 30, 2020, and the related statement of operations for the year then ended, the statements of changes in net assets for each of the two years in the period then ended, the financial highlights for each of the five years in the period then ended and the related notes (collectively referred to as the “financial statements”). In our opinion, the financial statements present fairly, in all material respects, the financial position of the Fund (one of the series constituting AB Corporate Shares) at April 30, 2020, the results of its operations for the year then ended, the changes in its net assets for each of the two years in the period then ended and its financial highlights for each of the five years in the period then ended, in conformity with U.S. generally accepted accounting principles.
Basis for Opinion
These financial statements are the responsibility of the Trust’s management. Our responsibility is to express an opinion on the Fund’s financial statements based on our audits. We are a public accounting firm registered with the Public Company Accounting Oversight Board (United States) (“PCAOB”) and are required to be independent with respect to the Fund in accordance with the U.S. federal securities laws and the applicable rules and regulations of the Securities and Exchange Commission and the PCAOB.
We conducted our audits in accordance with the standards of the PCAOB. Those standards require that we plan and perform the audit to obtain reasonable assurance about whether the financial statements are free of material misstatement, whether due to error or fraud. The Trust is not required to have, nor were we engaged to perform, an audit of the Trust’s internal control over financial reporting. As part of our audits, we are required to obtain an understanding of internal control over financial reporting, but not for the purpose of expressing an opinion on the effectiveness of the Trust’s internal control over financial reporting. Accordingly, we express no such opinion.
Our audits included performing procedures to assess the risks of material misstatement of the financial statements, whether due to error or fraud, and performing procedures that respond to those risks. Such procedures included examining, on a test basis, evidence regarding the amounts and
| 50 | AB CORPORATE INCOME SHARES | abfunds.com | |
REPORT OF INDEPENDENT REGISTERED
PUBLIC ACCOUNTING FIRM (continued)
disclosures in the financial statements. Our procedures included confirmation of securities owned as of April 30, 2020, by correspondence with the custodian and others or by other appropriate auditing procedures where replies from others were not received. Our audits also included evaluating the accounting principles used and significant estimates made by management, as well as evaluating the overall presentation of the financial statements. We believe that our audits provide a reasonable basis for our opinion.

We have served as the auditor of one or more of the AB investment companies since 1968.
New York, New York
June 26, 2020
| abfunds.com | AB CORPORATE INCOME SHARES | 51 | |
2020 FEDERAL TAX INFORMATION
(unaudited)
For Federal income tax purposes, the following information is furnished with respect to the distributions paid by the Fund during the taxable year ended April 30, 2020.
For foreign shareholders, 55.66% of ordinary dividends paid may be considered to be qualifying to be taxed as interest-related dividends.
Shareholders should not use the above information to prepare their income tax returns. The information necessary to complete your income tax returns will be included with your Form 1099-DIV which will be sent to you separately in January 2021.
| 52 | AB CORPORATE INCOME SHARES | abfunds.com | |
BOARD OF TRUSTEES
Marshall C. Turner, Jr.(1), Chairman Jorge A. Bermudez(1) Michael J. Downey(1) Nancy P. Jacklin(1) Robert M. Keith, President and Chief Executive Officer | Jeanette Loeb(1) Carol C. McMullen(1) Garry L. Moody(1) Earl D. Weiner(1) |
OFFICERS
Shawn E. Keegan(2), Vice President Tiffanie Wong(2), Vice President Emilie D. Wrapp, Secretary Michael B. Reyes, Senior Analyst | Joseph J. Mantineo, Treasurer and Chief Financial Officer Phyllis J. Clarke, Controller Vincent S. Noto, Chief Compliance Officer |
Custodian and Accounting Agent State Street Bank and Trust Company
Principal Underwriter AllianceBernstein Investments, Inc.
| Legal Counsel Seward & Kissel LLP One Battery Park Plaza New York, NY 10004
Independent Registered Public Accounting Firm Ernst & Young LLP 5 Times Square New York, NY 10036 | |
Transfer Agent AllianceBernstein Investor Services, Inc. | ||
| 1 | Member of the Audit Committee, the Governance and Nominating Committee, and the Independent Directors Committee. |
| 2 | The day-to-day management of, and investment decisions for, the Fund’s Portfolio are made by the Adviser’s Corporate Income Shares Investment Team. Mr. Keegan and Ms. Wong are the investment professionals primarily responsible for the day-to-day management of the Fund’s Portfolio. |
| abfunds.com | AB CORPORATE INCOME SHARES | 53 | |
TRUSTEES AND OFFICERS INFORMATION
Board of Trustees Information
The business and affairs of the Trust are managed under the direction of the Board of Trustees. Certain information concerning the Trust’s Trustees is set forth below.
| NAME, ADDRESS*, AGE AND (YEAR FIRST ELECTED)** | PRINCIPAL OCCUPATION(S), DURING PAST FIVE YEARS AND OTHER INFORMATION*** | PORTFOLIOS IN AB FUND COMPLEX OVERSEEN BY TRUSTEE | OTHER PUBLIC COMPANY DIRECTORSHIPS CURRENTLY HELD BY TRUSTEE | |||||
| INTERESTED TRUSTEE | ||||||||
Robert M. Keith,# (2010) | Senior Vice President of AllianceBernstein L.P. (the “Adviser”) and the head of AllianceBernstein Investments, Inc. (“ABI”) since July 2008; Director of ABI and President of the AB Mutual Funds. Previously, he served as Executive Managing Director of ABI from December 2006 to June 2008. Prior to joining ABI in 2006, Executive Managing Director of Bernstein Global Wealth Management, and prior thereto, Senior Managing Director and Global Head of Client Service and Sales of the Adviser’s institutional investment management business since 2004. Prior thereto, he was Managing Director and Head of North American Client Service and Sales in the Adviser’s institutional investment management business with which he had been associated since prior to 2004. | 90 | None | |||||
| 54 | AB CORPORATE INCOME SHARES | abfunds.com | |
TRUSTEES AND OFFICERS INFORMATION (continued)
| NAME, ADDRESS*, AGE AND (YEAR FIRST ELECTED)** | PRINCIPAL OCCUPATION(S), DURING PAST FIVE YEARS AND OTHER INFORMATION*** | PORTFOLIOS IN AB FUND COMPLEX OVERSEEN BY TRUSTEE | OTHER PUBLIC COMPANY DIRECTORSHIPS CURRENTLY HELD BY TRUSTEE | |||||
| INDEPENDENT TRUSTEE | ||||||||
| Marshall C. Turner, Jr.,## Chairman of the Board 78 (2005) | Private Investor since prior to 2015. Former Chairman and CEO of Dupont Photomasks, Inc. (components of semi-conductor manufacturing). He has extensive operating leadership, and venture capital investing experience, including five interim or full-time CEO roles, and prior service as general partner of institutional venture capital partnerships. He also has extensive non-profit board leadership experience, and currently serves on the boards of two education and science-related non-profit organizations. He has served as a director of one AB Fund since 1992, and director or trustee of all AB Funds since 2005. He has been Chairman of the AB Funds since January 2014, and the Chairman of the Independent Directors Committees of such AB Funds since February 2014. | 90 | Xilinx, Inc. (programmable logic semi-conductors) since 2007 | |||||
| abfunds.com | AB CORPORATE INCOME SHARES | 55 | |
TRUSTEES AND OFFICERS INFORMATION (continued)
| NAME, ADDRESS*, AGE AND (YEAR FIRST ELECTED)** | PRINCIPAL OCCUPATION(S), DURING PAST FIVE YEARS AND OTHER INFORMATION*** | PORTFOLIOS IN AB FUND COMPLEX OVERSEEN BY TRUSTEE | OTHER PUBLIC COMPANY DIRECTORSHIPS CURRENTLY HELD BY TRUSTEE | |||||
INDEPENDENT TRUSTEES (continued) | ||||||||
Jorge A. Bermudez,## 69 (2020) | Private investor since prior to 2015. Former Chief Risk Officer of Citigroup, Inc., a global financial services company, from November 2007 to March 2008, Chief Executive Officer of Citigroup’s Commercial Business Group in North America and Citibank Texas from 2005 to 2007, and a variety of other executive and leadership roles at various businesses within Citigroup prior to then; Chairman (2018) of the Texas A&M Foundation Board of Trustees (Trustee since 2013) and Chairman of the Smart Grid Center Board at Texas A&M University since 2012; director of, among others, Citibank N.A. from 2005 to 2008, the Federal Reserve Bank of Dallas, Houston Branch from 2009 to 2011, the Federal Reserve Bank of Dallas from 2011 to 2017, and the Electric Reliability Council of Texas from 2010 to 2016. He has served as director or trustee of the AB Funds since January 2020. | 90 | Moody’s Corporation since April 2011 | |||||
| Michael J. Downey,## 76 (2005) | Private Investor since prior to 2015. Formerly, Chairman of The Asia Pacific Fund, Inc. (registered investment company) since prior to 2015 until January 2019. From 1987 until 1993, Chairman and CEO of Prudential Mutual Fund Management, director of the Prudential mutual funds, and member of the Executive Committee of Prudential Securities, Inc. He has served as a director or trustee of the AB Funds since 2005. | 90 | None | |||||
| 56 | AB CORPORATE INCOME SHARES | abfunds.com | |
TRUSTEES AND OFFICERS INFORMATION (continued)
| NAME, ADDRESS*, AGE AND (YEAR FIRST ELECTED)** | PRINCIPAL OCCUPATION(S), DURING PAST FIVE YEARS AND OTHER INFORMATION*** | PORTFOLIOS IN AB FUND COMPLEX OVERSEEN BY TRUSTEE | OTHER PUBLIC COMPANY DIRECTORSHIPS CURRENTLY HELD BY TRUSTEE | |||||
INDEPENDENT TRUSTEES (continued) | ||||||||
| Nancy P. Jacklin,## 72 (2006) | Private Investor since prior to 2015. Professorial Lecturer at the Johns Hopkins School of Advanced International Studies (2008-2015). U.S. Executive Director of the International Monetary Fund (which is responsible for ensuring the stability of the international monetary system), (December 2002-May 2006); Partner, Clifford Chance (1992-2002); Sector Counsel, International Banking and Finance, and Associate General Counsel, Citicorp (1985-1992); Assistant General Counsel (International), Federal Reserve Board of Governors (1982-1985); and Attorney Advisor, U.S. Department of the Treasury (1973-1982). Member of the Bar of the District of Columbia and of New York; and member of the Council on Foreign Relations. She has served as a director or trustee of the AB Funds since 2006 and has been Chair of the Governance and Nominating Committees of the AB Funds since August 2014. | 90 | None | |||||
| Jeanette Loeb,## 68 (2020) | Chief Executive Officer of PetCareRx (e-commerce pet pharmacy) from 2002 to 2011 and 2015 to present. Director of New York City Center since 2005. She was a director of AB Multi-Manager Alternative Fund, Inc. (fund of hedge funds) from 2012 to 2018. Formerly, affiliated with Goldman Sachs Group, Inc. (financial services) from 1977 to 1994, including as a partner thereof from 1986 to 1994. She has served as a Director of the AB Funds since April 2020. | 90 | Apollo Investment Corp. (business development company) since August 2011 | |||||
| abfunds.com | AB CORPORATE INCOME SHARES | 57 | |
TRUSTEES AND OFFICERS INFORMATION (continued)
| NAME, ADDRESS*, AGE AND (YEAR FIRST ELECTED)** | PRINCIPAL OCCUPATION(S), DURING PAST FIVE YEARS AND OTHER INFORMATION*** | PORTFOLIOS IN AB FUND COMPLEX OVERSEEN BY TRUSTEE | OTHER PUBLIC COMPANY DIRECTORSHIPS CURRENTLY HELD BY TRUSTEE | |||||
INDEPENDENT TRUSTEES (continued) | ||||||||
| Carol C. McMullen,## 64 (2016) | Managing Director of Slalom Consulting (consulting) since 2014, private investor and member of the Advisory Board of Butcher Box (since 2018). Formerly, member, Partners Healthcare Investment Committee (2010-2019); Director of Norfolk & Dedham Group (mutual property and casualty insurance) from 2011 until November 2016; Director of Partners Community Physicians Organization (healthcare) from 2014 until December 2016; and Managing Director of The Crossland Group (consulting) from 2012 until 2013. She has held a number of senior positions in the asset and wealth management industries, including at Eastern Bank (where her roles included President of Eastern Wealth Management), Thomson Financial (Global Head of Sales for Investment Management), and Putnam Investments (where her roles included Chief Investment Officer, Core and Growth and Head of Global Investment Research). She has served on a number of private company and non-profit boards, and as a director or trustee of the AB Funds since June 2016. | 90 | None | |||||
| 58 | AB CORPORATE INCOME SHARES | abfunds.com | |
TRUSTEES AND OFFICERS INFORMATION (continued)
| NAME, ADDRESS*, AGE AND (YEAR FIRST ELECTED)** | PRINCIPAL OCCUPATION(S), DURING PAST FIVE YEARS AND OTHER INFORMATION*** | PORTFOLIOS IN AB FUND COMPLEX OVERSEEN BY TRUSTEE | OTHER PUBLIC COMPANY DIRECTORSHIPS CURRENTLY HELD BY TRUSTEE | |||||
INDEPENDENT TRUSTEES (continued) | ||||||||
| Garry L. Moody,## 68 (2008) | Private Investor since prior to 2015. Formerly, Partner, Deloitte & Touche LLP (1995-2008) where he held a number of senior positions, including Vice Chairman, and U.S. and Global Investment Management Practice Managing Partner; President, Fidelity Accounting and Custody Services Company (1993-1995), where he was responsible for accounting, pricing, custody and reporting for the Fidelity mutual funds; and Partner, Ernst & Young LLP (1975-1993), where he served as the National Director of Mutual Fund Tax Services and Managing Partner of its Chicago Office Tax department. He is a member of the Trustee Advisory Board of BoardIQ, a biweekly publication focused on issues and news affecting directors of mutual funds. He is also a member of the Investment Company Institute’s Board of Governors and the Independent Directors Council Governing Council. He has served as a director or trustee, and as Chairman of the Audit Committees, of the AB Funds since 2008. | 90 | None | |||||
| abfunds.com | AB CORPORATE INCOME SHARES | 59 | |
TRUSTEES AND OFFICERS INFORMATION (continued)
| NAME, ADDRESS*, AGE AND (YEAR FIRST ELECTED)** | PRINCIPAL OCCUPATION(S), DURING PAST FIVE YEARS AND OTHER INFORMATION*** | PORTFOLIOS IN AB FUND COMPLEX OVERSEEN BY TRUSTEE | OTHER PUBLIC COMPANY DIRECTORSHIPS CURRENTLY HELD BY TRUSTEE | |||||
INDEPENDENT TRUSTEES (continued) | ||||||||
| Earl D. Weiner,## 80 (2007) | Senior Counsel since 2017, Of Counsel from 2007 to 2016, and Partner prior to then, of the law firm Sullivan & Cromwell LLP. He is a former member of the ABA Federal Regulation of Securities Committee Task Force to draft editions of the Fund Director’s Guidebook. He also serves as a director or trustee of various non-profit organizations and has served as Chairman or Vice Chairman of a number of them. He has served as a director or trustee of the AB Funds since 2007 and served as Chairman of the Governance and Nominating Committees of the AB Funds from 2007 until August 2014. | 90 | None | |||||
| * | The address for each of the Trust’s disinterested Trustees is c/o AllianceBernstein L.P., Attention: Legal and Compliance Department, Mutual Fund Legal, 1345 Avenue of the Americas, New York, NY 10105. |
| ** | There is no stated term of office for the Trust’s Trustees. |
| *** | The information above includes each Trustee’s principal occupation during the last five years and other information relating to the experience, attributes, and skills relevant to each Trustee’s qualifications to serve as a Trustee, which led to the conclusion that each Trustee should serve as a Trustee for the Trust. |
| # | Mr. Keith is an “interested person” of the Trust, as defined in the 1940 Act, due to his position as a Senior Vice President of the Adviser. |
| ## | Member of the Audit Committee, the Governance and Nominating Committee, and the Independent Directors Committee. |
| 60 | AB CORPORATE INCOME SHARES | abfunds.com | |
TRUSTEES AND OFFICERS INFORMATION (continued)
Officer Information
Certain information concerning the Trust’s officers is set forth below.
NAME, ADDRESS,* AND AGE | POSITION(S) HELD WITH FUND | PRINCIPAL OCCUPATION DURING PAST FIVE YEARS | ||
Robert M. Keith 60 | President and Chief Executive Officer | See biography above. | ||
Douglas J. Peebles^ 54 | Senior Vice President | Senior Vice President of the Adviser,** with which he has been associated since prior to 2015. He is also Chief Investment Officer of Fixed Income. | ||
| Shawn E. Keegan 48 | Vice President | Senior Vice President of the Adviser,** with which he has been associated since prior to 2015. | ||
Tiffanie Wong 34 | Vice President | Senior Vice President of the Adviser,** with which she has been associated since prior to 2015. She is also Director of Investment Grade Credit. | ||
| Emilie D. Wrapp 64 | Secretary | Senior Vice President, Assistant General Counsel and Assistant Secretary of ABI,** with which she has been associated since prior to 2015. | ||
| Michael B. Reyes 43 | Senior Analyst | Vice President of the Adviser,** with which he has been associated since prior to 2015. | ||
| Joseph J. Mantineo 61 | Treasurer and Chief Financial Officer | Senior Vice President of AllianceBernstein Investor Services, Inc. (“ABIS”),** with which he has been associated since prior to 2015. | ||
Phyllis J. Clarke 59 | Controller | Vice President of ABIS,** with which she has been associated since prior to 2015. | ||
Vincent S. Noto 55 | Chief Compliance Officer | Senior Vice President since 2015 and Mutual Fund Chief Compliance Officer of the Adviser** since prior to 2015. |
| * | The address for each of the Trust’s Officers is 1345 Avenue of the Americas, New York, NY 10105. |
| ** | The Adviser, ABI and ABIS are affiliates of the Trust. |
| ^ | Mr. Peebles is expected to retire from the Adviser effective December 30, 2020. |
The Fund’s Statement of Additional Information (“SAI”) has additional information about the Trust’s Trustees and Officers and is available without charge upon request. Contact your financial representative or ABI at (800)-227-4618, or visit www.abfunds.com, for a free prospectus or SAI.
| abfunds.com | AB CORPORATE INCOME SHARES | 61 | |
Operation and Effectiveness of the Fund’s Liquidity Risk Management Program:
In October 2016, the Securities and Exchange Commission (“SEC”) adopted the open-end fund liquidity rule (the “Liquidity Rule”). In June 2018 the SEC adopted a requirement that funds disclose information about the operation and effectiveness of their Liquidity Risk Management Program (“LRMP”) in their reports to shareholders.
One of the requirements of the Liquidity Rule is for the Fund to designate an Administrator of the Fund’s Liquidity Risk Management Program. The Administrator of the Fund’s LRMP is AllianceBernstein L.P., the Fund’s investment adviser (the “Adviser”). The Adviser has delegated the responsibility to its Liquidity Risk Management Committee (the “Committee”). Another requirement of the Liquidity Rule is for the Fund’s Board of Directors (the “Fund Board”) to receive an annual written report from the Administrator of the LRMP, which addresses the operation of the Fund’s LRMP and assesses its adequacy and effectiveness. The Adviser provided the Fund’s Board with such annual report during the first quarter of 2020, which covered the period December 1, 2018 through December 31, 2019 (the “Program Reporting Period”).
The LRMP’s principal objectives include supporting the Fund’s compliance with limits on investments in illiquid assets and mitigating the risk that the Fund will be unable to meet its redemption obligations in a timely manner. Pursuant to the LRMP, the Fund classifies the liquidity of its portfolio investments into one of the four categories defined by the SEC: Highly Liquid, Moderately Liquid, Less Liquid, and Illiquid. These classifications are reported to the SEC on Form N-PORT.
During the Program Reporting Period, the Committee reviewed whether the Fund’s strategy is appropriate for an open-end structure, taking into account any holdings of less liquid and illiquid assets. The Committee also performed an analysis to determine whether the Fund is required to maintain a Highly Liquid Investment Minimum (“HLIM”). If the Fund participated in derivative transactions, the exposure from such transactions were considered in the LRMP. The Committee also incorporated the following information when determining the Fund’s reasonably anticipated trading size for purposes of liquidity monitoring: historical net redemption activity, a Fund’s concentration in an issuer, shareholder concentration, investment performance, total net assets, and distribution channels.
The Adviser informed the Fund Board that the Committee believes the Fund’s LRMP is adequately designed, has been implemented as intended, and has operated effectively since its inception. No material exceptions have been noted since the implementation of the LRMP, and there were no liquidity events that impacted the Fund or its ability to timely meet redemptions during the Program Reporting Period.
| 62 | AB CORPORATE INCOME SHARES | abfunds.com | |
Information Regarding the Review and Approval of the Fund’s Advisory Agreement
The disinterested trustees (the “directors”) of AB Corporate Shares (the “Company”) unanimously approved the continuance of the Company’s Advisory Agreement with the Adviser in respect of AB Corporate Income Shares (the “Fund”) at a meeting held on November 4-6, 2019 (the “Meeting”).*
Prior to approval of the continuance of the Advisory Agreement, the directors had requested from the Adviser, and received and evaluated, extensive materials. They reviewed the proposed continuance of the Advisory Agreement with the Adviser and with experienced counsel who are independent of the Adviser, who advised on the relevant legal standards. The directors also reviewed additional materials, including comparative analytical data prepared by the Senior Analyst for the Fund. The directors also discussed the proposed continuance in private sessions with counsel.
The directors noted that the Fund is designed as a vehicle for the wrap fee account market (where investors pay fees to a wrap fee sponsor which pays investment fees and expenses from such fee). The directors also noted that no advisory fee is payable by the Fund, that the Advisory Agreement does not include the reimbursement provision for certain administrative expenses included in the advisory agreements of most of the open-end AB Funds, and that the Adviser is responsible for payment of the Fund’s ordinary expenses. The directors noted that the Company acknowledges in the Advisory Agreement that the Adviser and its affiliates expect to receive compensation from third parties in connection with services provided under the Advisory Agreement. The directors further noted that the Adviser receives payments from the wrap fee program sponsors (the “Sponsors”) that use the Fund as an investment vehicle for their clients.
The directors considered their knowledge of the nature and quality of the services provided by the Adviser to the Fund gained from their experience as directors or trustees of most of the registered investment companies advised by the Adviser, their overall confidence in the Adviser’s integrity and competence they have gained from that experience, the Adviser’s initiative in identifying and raising potential issues with the directors and its responsiveness, frankness and attention to concerns raised by the directors in the past, including the Adviser’s willingness to consider and implement organizational and operational changes designed to improve investment results and the services provided to the AB Funds. The directors noted that they have four regular meetings each year, at each of which they review extensive materials and information from the Adviser, including information on the investment performance of the Fund.
| * | Following transactions completed on November 13, 2019 that may have been deemed to have been an“assignment” causing termination of the Fund’s investment advisory agreement, a new investment advisory agreement, having the same terms as the prior one, was entered into by the Fund and the Adviser. |
| abfunds.com | AB CORPORATE INCOME SHARES | 63 | |
The directors also considered all factors they believed relevant, including the specific matters discussed below. During the course of their deliberations, the directors evaluated, among other things, the reasonableness of the advisory fee. The directors did not identify any particular information that was all-important or controlling, and different directors may have attributed different weights to the various factors. The directors determined that the selection of the Adviser to manage the Fund and the overall arrangements between the Fund and the Adviser, as provided in the Advisory Agreement, including the advisory fee, were fair and reasonable in light of the services performed, expenses incurred and such other matters as the directors considered relevant in the exercise of their business judgment. The material factors and conclusions that formed the basis for the directors’ determinations included the following:
Nature, Extent and Quality of Services Provided
The directors considered the scope and quality of services provided by the Adviser under the Advisory Agreement, including the quality of the investment research capabilities of the Adviser and the other resources it has dedicated to performing services for the Fund. The directors noted that the Adviser from time to time reviews the Fund’s investment strategies and from time to time proposes changes intended to improve the Fund’s relative or absolute performance for the directors’ consideration. They also noted the professional experience and qualifications of the Fund’s portfolio management team and other senior personnel of the Adviser. The quality of administrative and other services, including the Adviser’s role in coordinating the activities of the Fund’s other service providers, also was considered. The directors concluded that, overall, they were satisfied with the nature, extent and quality of services provided to the Fund under the Advisory Agreement.
Costs of Services Provided and Profitability
The directors reviewed a schedule of the revenues and expenses and related notes indicating the profitability of the Fund to the Adviser for calendar years 2017 and 2018 that had been prepared with an expense allocation methodology arrived at in consultation with an independent consultant retained by the Fund’s former Senior Officer/Independent Compliance Officer. The directors noted the assumptions and methods of allocation used by the Adviser in preparing fund-specific profitability data and understood that there are a number of potentially acceptable allocation methodologies for information of this type. The directors noted that the profitability information reflected all revenues and expenses of the Adviser’s relationship with the Fund. The directors recognized that it is difficult to make comparisons of the profitability of the Advisory Agreement with the profitability of fund advisory contracts for unaffiliated funds because comparative information is not generally publicly available and is affected by numerous factors. The directors focused on the profitability of the Adviser’s relationship with the Fund before taxes and distribution expenses. The directors concluded that the Adviser’s level of profitability from its relationship with the Fund was not unreasonable.
| 64 | AB CORPORATE INCOME SHARES | abfunds.com | |
Fall-Out Benefits
The directors considered the other benefits to the Adviser and its affiliates from their relationships with the Fund. The directors noted that the Adviser is compensated by the Sponsors. The directors understood that the Adviser also might derive reputational and other benefits from its association with the Fund.
Investment Results
In addition to the information reviewed by the directors in connection with the Meeting, the directors receive detailed performance information for the Fund at each regular Board meeting during the year.
At the Meeting, the directors reviewed performance information prepared by an independent service provider (the “15(c) service provider”), showing the performance of the Fund against a group of similar funds (“peer group”) and a larger group of similar funds (“peer universe”), each selected by the 15(c) service provider, and information prepared by the Adviser showing the Fund’s performance against a broad-based securities market index, in each case for the 1-, 3-, 5- and 10-year periods ended July 31, 2019 and (in the case of comparisons with the broad-based securities market index) for the period from inception. The directors were cognizant that the Fund was neither designed nor offered as a standalone investment and was intended to serve solely as a component of certain separately managed accounts (“SMAs”). The Adviser had explained that this attribute made it difficult to select an appropriate benchmark for the Fund. At the directors’ request, the Adviser provided information showing the weighting of the Fund in a current SMA and the overall performance of the SMA versus its stated benchmark. Based on their review, the directors concluded that the Fund’s investment performance was acceptable.
Advisory Fees
The directors considered the advisory fee rate payable by the Fund to the Adviser (zero) and information provided by the 15(c) service provider showing the fees payable by other fund families used in wrap fee programs similar to that of the Fund. The directors recognized that it is difficult to make comparisons of advisory fees because there are variations in the services that are included in the fees payable by other funds.
The directors noted the unusual arrangements in the Advisory Agreement providing for no advisory fee but were cognizant that the Adviser is indirectly compensated by the Sponsors for its services to the Fund. The directors reviewed the fee arrangements between the Adviser and each of the current Sponsors and noted that such fees were negotiated on an arm’s length basis and were within the range of fees paid by wrap fee sponsors to other advisers of similar funds. While the Adviser’s fee arrangements with the Sponsors vary, the directors acknowledged the Adviser’s view that a portion of such fees (less the expenses of the Fund
| abfunds.com | AB CORPORATE INCOME SHARES | 65 | |
paid by the Adviser) may reasonably be viewed as compensating the Adviser for advisory services it provides to the Fund (the “implied fee”) and that the Adviser believes that while the Sponsors pay the Adviser different fee rates, the rate of fee attributable to Fund management at the Fund level is the same for all Sponsors. The directors also considered the fee rate schedules used by other registered investment companies that invest in fixed income securities that are advised by the Adviser.
The directors also considered the Adviser’s fee schedule for other clients utilizing investment strategies similar to those of the Fund. For this purpose, they reviewed the relevant advisory fee information from the Adviser’s Form ADV and in a report from the Fund’s Senior Analyst and noted the differences between the Fund’s fee schedule, on the one hand, and the Adviser’s institutional fee schedule, on the other. The directors recognized that such information was of limited utility in light of the Fund’s unusual fee arrangement. The directors noted that the Adviser may, in some cases, agree to fee rates with large institutional clients that are lower than those reviewed by the directors and that they had previously discussed with the Adviser its policies in respect of such arrangements. The directors previously discussed these matters with an independent fee consultant.
The Adviser reviewed with the directors the significantly greater scope of the services it provides to the Fund relative to institutional clients. In this regard, the Adviser noted, among other things, that, compared to institutional accounts, the Fund (i) demands considerably more portfolio management, research and trading resources due to significantly higher daily cash flows; (ii) has more tax and regulatory restrictions and compliance obligations; (iii) must prepare and file or distribute regulatory and other communications about fund operations; and (iv) must provide shareholder servicing to retail investors. The Adviser also reviewed the greater legal risks presented by the large and changing population of Fund shareholders who may assert claims against the Adviser in individual or class actions, and the greater entrepreneurial risk in offering new fund products, which require substantial investment to launch, may not succeed, and generally must be priced to compete with larger, more established funds resulting in lack of profitability to the Adviser until a new fund achieves scale. In light of the substantial differences in services rendered by the Adviser to institutional clients as compared to the Fund, and the different risk profile, the directors considered these fee comparisons inapt and did not place significant weight on them in their deliberations.
The directors did not consider comparative expense information for the Fund because the Fund does not bear ordinary expenses.
| 66 | AB CORPORATE INCOME SHARES | abfunds.com | |
Economies of Scale
The directors did not consider the extent to which fee levels in the Advisory Agreement for the Fund reflect economies of scale because the Advisory Agreement does not provide for any compensation to be paid to the Adviser by the Fund and the Fund’s expense ratio is zero. They did note, however, that the fee payable to the Adviser by the current Sponsors declines at a breakpoint based on either individual account sizes or on total assets managed by the Adviser for the Sponsor.
| abfunds.com | AB CORPORATE INCOME SHARES | 67 | |
This page is not part of the Shareholder Report or the Financial Statements.
AB FAMILY OF FUNDS
US EQUITY
CORE
Core Opportunities Fund
FlexFee™ US Thematic Portfolio
Select US Equity Portfolio
GROWTH
Concentrated Growth Fund
Discovery Growth Fund
FlexFee™ Large Cap Growth Portfolio
Growth Fund
Large Cap Growth Fund
Small Cap Growth Portfolio
VALUE
Discovery Value Fund
Equity Income Fund
Relative Value Fund
Small Cap Value Portfolio
Value Fund
INTERNATIONAL/ GLOBAL EQUITY
CORE
FlexFee™ International Strategic Core Portfolio
Global Core Equity Portfolio
International Portfolio
International Strategic Core Portfolio
Sustainable Global Thematic Fund
Tax-Managed International Portfolio
Tax-Managed Wealth Appreciation Strategy
Wealth Appreciation Strategy
INTERNATIONAL/ GLOBAL EQUITY (continued)
GROWTH
Concentrated International Growth Portfolio
FlexFee™ Emerging Markets Growth Portfolio
Sustainable International Thematic Fund
VALUE
All China Equity Portfolio
International Value Fund
FIXED INCOME
MUNICIPAL
High Income Municipal Portfolio
Intermediate California Municipal Portfolio
Intermediate Diversified Municipal Portfolio
Intermediate New York Municipal Portfolio
Municipal Bond Inflation Strategy
Tax-Aware Fixed Income Opportunities Portfolio1
National Portfolio
Arizona Portfolio
California Portfolio
Massachusetts Portfolio
Minnesota Portfolio
New Jersey Portfolio
New York Portfolio
Ohio Portfolio
Pennsylvania Portfolio
Virginia Portfolio
FIXED INCOME (continued)
TAXABLE
Bond Inflation Strategy
FlexFee™ High Yield Portfolio
FlexFee™ International Bond Portfolio
Global Bond Fund
High Income Fund
Income Fund
Intermediate Duration Portfolio
Limited Duration High Income Portfolio
Short Duration Income Portfolio
Short Duration Portfolio
Total Return Bond Portfolio1
ALTERNATIVES
All Market Real Return Portfolio
Global Real Estate Investment Fund
Select US Long/Short Portfolio
Unconstrained Bond Fund
MULTI-ASSET
All Market Income Portfolio
All Market Total Return Portfolio
Conservative Wealth Strategy
Emerging Markets Multi-Asset Portfolio
Global Risk Allocation Fund
Tax-Managed All Market Income Portfolio
CLOSED-END FUNDS
AllianceBernstein Global High Income Fund
AllianceBernstein National Municipal Income Fund
We also offer Government Money Market Portfolio, which serves as the money market fund exchange vehicle for the AB mutual funds. You could lose money by investing in the Fund. Although the Fund seeks to preserve the value of your investment at $1.00 per share, it cannot guarantee it will do so. The Fund may impose a fee upon sale of your shares or may temporarily suspend your ability to sell shares if the Fund’s liquidity falls below required minimums because of market conditions or other factors. An investment in the Fund is not insured or guaranteed by the Federal Deposit Insurance Corporation or any other government agency. The Fund’s sponsor has no legal obligation to provide financial support to the Fund, and you should not expect that the sponsor will provide financial support to the Fund at any time.
Investors should consider the investment objectives, risks, charges and expenses of the Fund carefully before investing. For copies of our prospectus or summary prospectus, which contain this and other information, visit us online at www.abfunds.com or contact your AB representative. Please read the prospectus and/or summary prospectus carefully before investing.
| 1 | Prior to July 12, 2019, Total Return Bond Portfolio was named Intermediate Bond Portfolio; prior to February 5, 2020, Tax-Aware Fixed Income Opportunities Portfolio was named Tax-Aware Fixed Income Portfolio. |
| 68 | AB CORPORATE INCOME SHARES | abfunds.com | |
AB CORPORATE INCOME SHARES
1345 Avenue of the Americas
New York, NY 10105
800 221 5672
CIS-0151-0420 
APR 04.30.20

ANNUAL REPORT
AB IMPACT MUNICIPAL INCOME SHARES

Beginning January 1, 2021, as permitted by new regulations adopted by the Securities and Exchange Commission, the Fund’s annual and semi-annual shareholder reports will no longer be sent by mail, unless you specifically request paper copies of the reports. Instead, the reports will be made available on a website, and you will be notified by mail each time a report is posted and provided with a website address to access the report.
If you already elected to receive shareholder reports electronically, you will not be affected by this change and you need not take any action. You may elect to receive shareholder reports and other communications from the Fund electronically at any time by contacting your financial intermediary (such as a broker-dealer or bank) or, if you are a direct investor, by calling the Fund at (800) 221 5672.
You may elect to receive all future reports in paper form free of charge. If you invest through a financial intermediary, you can contact your financial intermediary to request that you continue to receive paper copies of your shareholder reports; if you invest directly with the Fund, you can call the Fund at (800) 221 5672. Your election to receive reports in paper form will apply to all funds held in your account with your financial intermediary or, if you invest directly, to all AB Mutual Funds you hold.
| Investment Products Offered | • Are Not FDIC Insured • May Lose Value • Are Not Bank Guaranteed | |
Investors should consider the investment objectives, risks, charges and expenses of the Fund carefully before investing. For copies of our prospectus or summary prospectus, which contain this and other information, visit us online at www.abfunds.com or contact your AB representative. Please read the prospectus and/or summary prospectus carefully before investing.
This shareholder report must be preceded or accompanied by the Fund’s prospectus for individuals who are not current shareholders of the Fund.
You may obtain a description of the Fund’s proxy voting policies and procedures, and information regarding how the Fund voted proxies relating to portfolio securities during the most recent 12-month period ended June 30, without charge. Simply visit AB’s website at www.abfunds.com, or go to the Securities and Exchange Commission’s (the “Commission”) website at www.sec.gov, or call AB at (800) 227 4618.
The Fund files its complete schedule of portfolio holdings with the Commission for the first and third quarters of each fiscal year as an exhibit to its reports on Form N-PORT. The Fund’s Form N-PORT reports are available on the Commission’s website at www.sec.gov. The Fund’s Forms N-PORT may also be reviewed and copied at the Commission’s Public Reference Room in Washington, DC; information on the operation of the Public Reference Room may be obtained by calling (800) SEC 0330. AB publishes full portfolio holdings for the Fund monthly at www.abfunds.com.
AllianceBernstein Investments, Inc. (ABI) is the distributor of the AB family of mutual funds. ABI is a member of FINRA and is an affiliate of AllianceBernstein L.P., the Adviser of the funds.
The [A/B] logo is a registered service mark of AllianceBernstein and AllianceBernstein® is a registered service mark used by permission of the owner, AllianceBernstein L.P.
| FROM THE PRESIDENT |  |
Dear Shareholder,
We are pleased to provide this report for AB Impact Municipal Income Shares (the “Fund”). Please review the discussion of Fund performance, the market conditions during the reporting period and the Fund’s investment strategy.
As always, AB strives to keep clients ahead of what’s next by:
| + | Transforming uncommon insights into uncommon knowledge with a global research scope |
| + | Navigating markets with seasoned investment experience and sophisticated solutions |
| + | Providing thoughtful investment insights and actionable ideas |
Whether you’re an individual investor or a multi-billion-dollar institution, we put knowledge and experience to work for you.
AB’s global research organization connects and collaborates across platforms and teams to deliver impactful insights and innovative products. Better insights lead to better opportunities—anywhere in the world.
For additional information about AB’s range of products and shareholder resources, please log on to www.abfunds.com.
Thank you for your investment in the AB Mutual Funds.
Sincerely,

Robert M. Keith
President and Chief Executive Officer, AB Mutual Funds
| abfunds.com | AB IMPACT MUNICIPAL INCOME SHARES | 1 | |
ANNUAL REPORT
June 10, 2020
This report provides management’s discussion of fund performance for AB Impact Municipal Income Shares for the annual reporting period ended April 30, 2020. Please note, shares of this Fund are available only to separately managed accounts or participants in “wrap fee” programs or other investment programs approved by the Adviser.
The investment objective of the Fund is to earn the highest level of current income, exempt from federal taxation, that is available consistent with what the Adviser considers to be an appropriate level of risk.
NAV RETURNS AS OF APRIL 30, 2020 (unaudited)
| 6 Months | 12 Months | |||||||
| AB IMPACT MUNICIPAL INCOME SHARES | -4.70% | 0.40% | ||||||
| Bloomberg Barclays Municipal Bond Index | -1.33% | 2.16% | ||||||
INVESTMENT RESULTS
The table above shows the Fund’s performance compared to its benchmark, the Bloomberg Barclays Municipal Bond Index, for the six- and 12-month periods ended April 30, 2020.
During both periods, the Fund underperformed its benchmark, primarily due to off-benchmark lower credit-quality exposures. While these securities were positive contributors in 2019, the first quarter of 2020 was an exceptionally volatile period due to the capital markets’ reaction to the economic implications of the novel coronavirus pandemic. Security selection within the health care and education sectors were the largest detractors, relative to the benchmark. For the 12-month period, the Fund’s longer-than-benchmark duration positioning contributed as yields fell. There were no significant contributors for the six-month period.
The Fund did not utilize derivatives during either period.
MARKET REVIEW AND INVESTMENT STRATEGY
US, international and emerging-market stocks recorded negative returns during the 12-month period ended April 30, 2020. After historically strong 2019 returns, municipals continued their exceptional pace for the first two months of 2020. The themes of 2019 continued; demand was strong, supply was light and credit fundamentals remained supportive. However, March was a month for the history books due to extreme price movements that occurred over very compressed periods. The coronavirus pandemic—the primary cause of the volatility—quickly prompted stay-at-home orders
| 2 | AB IMPACT MUNICIPAL INCOME SHARES | abfunds.com | |
and a sharp economic contraction. In this environment, investors fled to cash, and stocks and many bonds fell sharply as investors pulled money from the capital markets. The municipal market, which under normal circumstances tends to offset equity volatility, was hit particularly hard as investors pulled an unprecedented amount of money out of municipal mutual funds. The flight to cash caused $42 billion in net municipal mutual fund outflows and trumped the previous monthly record of $13 billion set in June 2013. The policy response has been swift, coordinated and large. The US Federal Reserve quickly injected liquidity into the bond markets, starting first with government securities and later adding corporate and municipal securities while signaling that it would be the buyer of last resort, if needed. Additionally, the US Congress passed the Coronavirus Aid, Relief, and Economic Security Act (“CARES Act”), a $2.2 trillion relief package that provided direct assistance and loans to municipal issuers as well as to most households and corporations. These quick policy responses, coupled with the sharp fall in municipal bond prices relative to US Treasuries, eventually enticed investors to reenter the market as relative valuations favored municipals to an extent The Fund’s Senior Investment Management Team (‘the Team”) has never seen before. A sharp rebound in municipal bond prices followed.
Underperformance during the 12-month period was primarily due to the Fund’s exposure to municipal credit, which came under pressure as credit spreads widened and investors moved to cash during the month of March. The Team believes this weakness is short-term and remains confident in the longer-term creditworthiness of Fund holdings. Where appropriate, the Team has selectively added to credit positions trading at significant discounts to their underlying fundamental value due to the market sell-off. By incorporating in-depth environmental, social and governance research into the investment process, the Team aims to construct portfolios with exceptional risk-adjusted return profiles and drive impact in historically marginalized communities. Health care holdings, one of the Fund’s largest sector weights, are especially exposed to the global pandemic. Many health care systems maintain infectious disease protocols and standard operating procedures during emergencies. While the Team is concerned about large local outbreaks leading to higher operating expenses, most of the Fund’s hospitals have stable operating margins, cash on hand to withstand prolonged operating volatility from COVID-19 and debt service reserve funds in the event of a worst-case scenario. Additionally, the CARES Act passed by Congress includes approximately $120 billion of relief allocated to hospitals as well as $150 billion to state and local municipalities—both of which are huge credit positives.
The underlying goal of the Fund is to make environmentally, socially and financially productive investments in historically marginalized and underserved communities to reduce gaps that exist in such areas as academic achievement, economic development or the provision of health care.
| abfunds.com | AB IMPACT MUNICIPAL INCOME SHARES | 3 | |
Essentially, the Team is looking to create a better tomorrow. Inherent in these goals is to make investments toward improving the quality of life for all by enhancing and promoting civic engagement, an informed citizenry, culture and the physical and natural sciences.
The Fund may purchase municipal securities that are insured under policies issued by certain insurance companies. Historically, insured municipal securities typically received a higher credit rating, which meant that the issuer of the securities paid a lower interest rate. As a result of declines in the credit quality and associated downgrades of most bond insurers, insurance has less value than it did in the past. The market now values insured municipal securities primarily based on the credit quality of the issuer of the security with little value given to the insurance feature. In purchasing such insured securities, the Adviser evaluates the risk and return of municipal securities through its own research. If an insurance company’s rating is downgraded or the company becomes insolvent, the prices of municipal securities insured by the insurance company may decline. As of April 30, 2020, the Fund’s percentages of investments in municipal bonds that are insured and in insured municipal bonds that have been pre-refunded or escrowed to maturity were 18.55% and 0.00%, respectively.
INVESTMENT POLICIES
The Fund pursues its objective by investing principally in high-yielding municipal securities of any credit quality that (i) score highly on the Adviser’s environmental, social and corporate governance (“ESG”) criteria and (ii) are deemed by the Adviser to have an environmental or social impact in underserved or low socio-economic communities. As a matter of fundamental policy, the Fund invests, under normal circumstances, at least 80% of its net assets in municipal securities that pay interest that is exempt from federal income tax. These securities may pay interest that is subject to the federal alternative minimum tax for certain taxpayers.
The Adviser evaluates each security in which the Fund invests using both a traditional municipal bond credit analysis and a consideration of the security’s overall ESG score under the Adviser’s ESG evaluation criteria. Under this ESG evaluation, to arrive at an overall ESG score, each security is scored on environmental, social and governance factors, and the scores are weighted based on the Adviser’s assessment of the relevance of each factor within a given sector (e.g., education, health care, renewable energy and mass transit). For example, social factors are weighted more heavily in the overall ESG score for a security of an issuer in the education sector than they are for a security of an issuer in the mass transit sector, where environmental factors
(continued on next page)
| 4 | AB IMPACT MUNICIPAL INCOME SHARES | abfunds.com | |
predominate. The Adviser regularly reviews the overall ESG scores assigned to securities under consideration for purposes of determining the securities in which to invest for the Fund.
The Adviser’s ESG evaluation is conducted on an industry sector basis and includes the use of key performance indicators that vary in materiality by sector. The Adviser’s environmental evaluation covers issues such as clean and renewable energy, climate change and water conservation. The Adviser’s social evaluation covers issues such as economic impact, high quality safety-net health care and overall community health needs, and the reduction of achievement gaps between wealthy and poor school districts. The Adviser’s governance evaluation covers issues such as stewardship of debt and capital, board governance and transparency.
The Adviser also assesses a security’s risk and return characteristics as well as a security’s impact on the overall risk and return characteristics of the Fund. In making this assessment, the Adviser takes into account various factors including the credit quality, maturity, sensitivity to interest rates and the expected after-tax returns of the security under consideration and of the Fund’s other holdings.
The Fund may invest without limit in lower-rated securities (“junk bonds”), which may include securities having the lowest rating, and in unrated securities that, in the Adviser’s judgment, would be lower-rated securities if rated. The Fund may invest in fixed-income securities with any maturity or duration. The Fund will seek to increase income for shareholders by investing in longer-maturity bonds. Consistent with its objective of seeking a higher level of income, the Fund may experience greater volatility and a higher risk of loss of principal than other municipal funds.
The Fund may also invest in: tender option bond transactions (“TOBs”); forward commitments; zero-coupon municipal securities and variable, floating and inverse floating-rate municipal securities; certain types of mortgage-related securities; and derivatives, such as options, futures contracts, forwards and swaps.
The Fund may make short sales of securities or maintain a short position, and may use other investment techniques. The Fund may use leverage for investment purposes to increase income through the use of TOBs and derivative instruments, such as interest rate swaps.
| abfunds.com | AB IMPACT MUNICIPAL INCOME SHARES | 5 | |
DISCLOSURES AND RISKS
Benchmark Disclosure
The Bloomberg Barclays Municipal Bond Index is unmanaged and does not reflect fees and expenses associated with the active management of a fund. The Bloomberg Barclays Municipal Bond Index represents the performance of the long-term tax-exempt bond market consisting of investment-grade bonds. An investor cannot invest directly in an index, and its results are not indicative of the performance for any specific investment, including the Fund.
A Word About Risk
Market Risk: The market value of a security may move up or down, sometimes rapidly and unpredictably. These fluctuations may cause a security to be worth less than the price originally paid for it, or less than it was worth at an earlier time. Market risk may affect a single issuer, industry, sector of the economy or the market as a whole. Global economies and financial markets are increasingly interconnected, which increases the probabilities that conditions in one country or region might adversely impact issuers in a different country or region. Conditions affecting the general economy, including political, social, or economic instability at the local, regional, or global level may also affect the market value of a security. Health crises, such as pandemic and epidemic diseases, as well as other incidents that interrupt the expected course of events, such as natural disasters, war or civil disturbance, acts of terrorism, power outages and other unforeseeable and external events, and the public response to or fear of such diseases or events, have and may in the future have an adverse effect on the Fund’s investments and net asset value and can lead to increased market volatility. For example, any preventative or protective actions that governments may take in respect of such diseases or events may result in periods of business disruption, inability to obtain raw materials, supplies and component parts, and reduced or disrupted operations for the Fund’s portfolio companies. The occurrence and pendency of such diseases or events could adversely affect the economies and financial markets either in specific countries or worldwide.
ESG Risk: Applying ESG and sustainability criteria to the investment process may exclude securities of certain issuers for non-investment reasons and, therefore, the Fund may forgo some market opportunities available to funds that do not use ESG or sustainability criteria. Securities selected based on ESG factors may shift into and out of favor depending on market and economic conditions, and the Fund’s performance may at times be better or worse than the performance of funds that do not use ESG or sustainability criteria.
Credit Risk: An issuer or guarantor of a fixed-income security, or the counterparty to a derivatives or other contract, may be unable or unwilling to make timely payments of interest or principal, or to otherwise honor its
| 6 | AB IMPACT MUNICIPAL INCOME SHARES | abfunds.com | |
DISCLOSURES AND RISKS (continued)
obligations. The issuer or guarantor may default, causing a loss of the full principal amount of a security and any accrued interest. The degree of risk for a particular security may be reflected in its credit rating. There is the possibility that the credit rating of a fixed-income security may be downgraded after purchase, which may adversely affect the value of the security. Investments in fixed-income securities with lower ratings tend to have a higher probability that an issuer will default or fail to meet its payment obligations.
Municipal Market Risk: This is the risk that special factors may adversely affect the value of municipal securities and have a significant effect on the yield or value of the Fund’s investments in municipal securities. These factors include economic conditions, political or legislative changes, uncertainties related to the tax status of municipal securities, or the rights of investors in these securities. To the extent that the Fund invests more of its assets in a particular state’s municipal securities, the Fund may be vulnerable to events adversely affecting that state, including economic, political and regulatory occurrences, court decisions, terrorism and catastrophic natural disasters, such as hurricanes or earthquakes. The Fund’s investments in certain municipal securities with principal and interest payments that are made from the revenues of a specific project or facility, and not general tax revenues, may have increased risks. Factors affecting the project or facility, such as local business or economic conditions, could have a significant effect on the project’s ability to make payments of principal and interest on these securities.
Congress has previously considered making changes to the municipal securities provisions of the Internal Revenue Code that could change the US federal income tax treatment of certain types of municipal securities.
Tax Risk: There is no guarantee that all of the Fund’s income will remain exempt from federal or state income taxes. From time to time, the US government and the US Congress consider changes in federal tax law that could limit or eliminate the federal tax exemption for municipal bond income, which would in effect reduce the income received by shareholders from the Fund by increasing taxes on that income. In such event, the Fund’s net asset value (“NAV”) could also decline as yields on municipal bonds, which are typically lower than those on taxable bonds, would be expected to increase to approximately the yield of comparable taxable bonds. Actions or anticipated actions affecting the tax-exempt status of municipal bonds could also result in significant shareholder redemptions of Fund shares as investors anticipate adverse effects on the Fund or seek higher yields to offset the potential loss of the tax deduction. As a result, the Fund would be required to maintain higher levels of cash to meet the redemptions, which would negatively affect the Fund’s yield. The federal
| abfunds.com | AB IMPACT MUNICIPAL INCOME SHARES | 7 | |
DISCLOSURES AND RISKS (continued)
income tax treatment of payments in respect of certain derivative contracts is unclear.
Below Investment-Grade Securities Risk: Investments in fixed-income securities with lower ratings (commonly known as “junk bonds”) tend to have a higher probability that an issuer will default or fail to meet its payment obligations. These securities may be subject to greater price volatility due to such factors as specific corporate developments, interest-rate sensitivity, negative perceptions of the junk bond market generally and may be more difficult to trade than other types of securities.
Interest-Rate Risk: Changes in interest rates will affect the value of investments in fixed-income securities. When interest rates rise, the value of existing investments in fixed-income securities tends to fall and this decrease in value may not be offset by higher income from new investments. Interest-rate risk is generally greater for fixed-income securities with longer maturities or durations.
Inflation Risk: This is the risk that the value of assets or income from investments will be less in the future as inflation decreases the value of money. As inflation increases, the value of the Fund’s assets can decline as can the value of the Fund’s distributions. This risk is significantly greater for fixed-income securities with longer maturities.
Leverage Risk: To the extent the Fund uses leveraging techniques, its NAV may be more volatile because leverage tends to exaggerate the effect of changes in interest rates and any increase or decrease in the value of the Fund’s investments.
Illiquid Investments Risk: Illiquid investments risk exists when particular investments, such as lower-rated securities, are or become difficult to purchase or sell, possibly preventing the Fund from selling such investments at an advantageous price. The Fund is subject to illiquid investments risk because the market for municipal securities is generally smaller than many other markets. Derivatives and securities involving substantial market and credit risk tend to involve greater illiquid investments risk than most other types of investments.
Derivatives Risk: Derivatives may be difficult to price or unwind and leveraged so that small changes may produce disproportionate losses for the Fund. Derivatives, especially over-the-counter derivatives, are also subject to counterparty risk.
Management Risk: The Fund is subject to management risk because it is an actively managed investment fund. The Adviser will apply its investment techniques and risk analyses in making investment decisions, but there is no guarantee that its techniques will produce the intended results.
| 8 | AB IMPACT MUNICIPAL INCOME SHARES | abfunds.com | |
DISCLOSURES AND RISKS (continued)
These risks are fully discussed in the Fund’s prospectus. As with all investments, you may lose money by investing in the Fund.
An Important Note About Historical Performance
The performance shown in this report represents past performance and does not guarantee future results. Current performance may be lower or higher than the performance information shown. You may obtain performance information current to the most recent month-end by calling (800) 227 4618. The investment return and principal value of an investment in the Fund will fluctuate, so that your shares, when redeemed, may be worth more or less than their original cost. Performance assumes reinvestment of distributions and does not account for taxes.
Investors should consider the investment objectives, risks, charges and expenses of the Fund carefully before investing. For copies of our prospectus and/or summary prospectus, which contain this and other information, visit us online at www.abfunds.com or contact your AllianceBernstein Investments representative. Please read the prospectus and/or summary prospectus carefully before investing.
| abfunds.com | AB IMPACT MUNICIPAL INCOME SHARES | 9 | |
HISTORICAL PERFORMANCE
GROWTH OF A $10,000 INVESTMENT IN THE FUND (unaudited)
9/12/20171 TO 4/30/2020
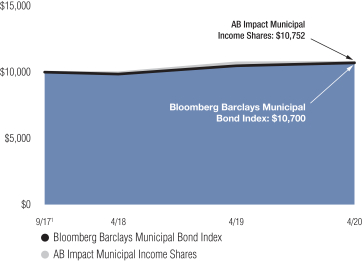
This chart illustrates the total value of an assumed $10,000 investment in AB Impact Municipal Income Shares (from 9/12/20171 to 4/30/2020) as compared to the performance of its benchmark. The chart assumes the reinvestment of dividends and capital gains distributions.
| 1 | Inception date: 9/12/2017. |
| 10 | AB IMPACT MUNICIPAL INCOME SHARES | abfunds.com | |
HISTORICAL PERFORMANCE (continued)
AVERAGE ANNUAL RETURNS AS OF APRIL 30, 2020 (unaudited)
| NAV Returns | ||||
| 1 Year | 0.40% | |||
| Since Inception1 | 2.79% | |||
AVERAGE ANNUAL RETURNS
AS OF THE MOST RECENT CALENDAR QUARTER-END
MARCH 31, 2020 (unaudited)
| NAV Returns | ||||
| 1 Year | 4.48% | |||
| Since Inception1 | 4.23% | |||
The prospectus fee table shows the fees and the total operating expenses of the Fund as 0.01% because the Adviser does not charge any fees or expenses and reimburses Fund operating expenses except certain extraordinary expenses, taxes, brokerage costs and the interest on borrowings or certain leveraged transactions. Participants in a wrap fee program or other investment program eligible to invest in the Fund pay fees to the program sponsor and should review the program brochure or other literature provided by the sponsor for a discussion of fees and expenses charged.
| 1 | Inception date: 9/12/2017. |
| abfunds.com | AB IMPACT MUNICIPAL INCOME SHARES | 11 | |
EXPENSE EXAMPLE
(unaudited)
As a shareholder of the Fund, you may incur various ongoing non-operating and extraordinary costs. This example is intended to help you understand your ongoing costs (in dollars) of investing in the Fund and to compare these costs with the ongoing costs of investing in other mutual funds.
The Example is based on an investment of $1,000 invested at the beginning of the period and held for the entire period as indicated below.
Actual Expenses
The table below provides information about actual account values and actual expenses. You may use the information, together with the amount you invested, to estimate the expenses that you paid over the period. Simply divide your account value by $1,000 (for example, an $8,600 account value divided by $1,000 = 8.6), then multiply the result by the number under the heading entitled “Expenses Paid During Period” to estimate the expenses you paid on your account during this period.
Hypothetical Example for Comparison Purposes
The table below also provides information about hypothetical account values and hypothetical expenses based on the Fund’s actual expense ratio and an assumed annual rate of return of 5% before expenses, which is not the Fund’s actual return. The hypothetical account values and expenses may not be used to estimate the actual ending account balance or expenses you paid for the period. You may use this information to compare the ongoing costs of investing in the Fund and other funds by comparing this 5% hypothetical example with the 5% hypothetical examples that appear in the shareholder reports of other funds.
Please note that the expenses shown in the table are meant to highlight your ongoing costs only and do not reflect any transactional costs, such as sales charges (loads), or contingent deferred sales charges on redemptions. Therefore, the hypothetical example is useful in comparing ongoing costs only, and will not help you determine the relative total costs of owning different funds. In addition, if these transactional costs were included, your costs would have been higher.
| Beginning Account Value November 1, 2019 | Ending Account Value April 30, 2020 | Expenses Paid During Period* | Annualized Expense Ratio* | |||||||||||||
Actual | $ | 1,000 | $ | 953.00 | $ | – 0 | – | 0.00 | % | |||||||
Hypothetical** | $ | 1,000 | $ | 1,024.86 | $ | – 0 | – | 0.00 | % | |||||||
| * | Expenses are equal to the Fund’s annualized expense ratio, multiplied by the average account value over the period, multiplied by 182/366 (to reflect the one-half year period). The Fund’s operating expenses are borne by the Adviser or its affiliates. |
| ** | Assumes 5% annual return before expenses. |
| 12 | AB IMPACT MUNICIPAL INCOME SHARES | abfunds.com | |
PORTFOLIO SUMMARY
April 30, 2020 (unaudited)
PORTFOLIO STATISTICS
Net Assets ($mil): $245.3
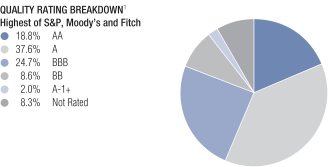
| 1 | All data are as of April 30, 2020. The Fund’s quality rating breakdown is expressed as a percentage of the Fund’s total investments in municipal securities and may vary over time. The quality ratings are determined by using the S&P Global Ratings (“S&P”), Moody’s Investors Services, Inc.(“Moody’s”) and Fitch Ratings, Ltd.(“Fitch”). The Fund considers the credit ratings issued by S&P, Moody’s and Fitch and uses the highest rating issued by the agencies. These ratings are a measure of the quality and safety of a bond or portfolio, based on the issuer’s financial condition. AAA is the highest (best) and D is the lowest (worst). If applicable, the pre-refunded category includes bonds which are secured by U.S. Government securities and therefore are deemed high-quality investment-grade by the Adviser. If applicable, Not Applicable (N/A) includes non-creditworthy investments, such as equities, currency contracts, futures and options. If applicable, the Not Rated category includes bonds that are not rated by a nationally recognized statistical rating organization. The Adviser evaluates the creditworthiness of non-rated securities based on a number of factors including, but not limited to, cash flows, enterprise value and economic environment. |
| abfunds.com | AB IMPACT MUNICIPAL INCOME SHARES | 13 | |
PORTFOLIO OF INVESTMENTS
April 30, 2020
| Principal Amount (000) | U.S. $ Value | |||||||
| ||||||||
MUNICIPAL OBLIGATIONS – 86.5% |
| |||||||
Long-Term Municipal Bonds – 85.7% |
| |||||||
American Samoa – 0.7% |
| |||||||
American Samoa Economic Development Authority | $ | 1,565 | $ | 1,627,318 | ||||
|
| |||||||
Arizona – 0.7% |
| |||||||
Maricopa County Industrial Development Authority | 1,815 | 1,609,112 | ||||||
|
| |||||||
California – 11.2% |
| |||||||
Alameda Corridor Transportation Authority | ||||||||
Series 2016A | 725 | 757,226 | ||||||
Series 2016B | 2,095 | 2,231,988 | ||||||
California Educational Facilities Authority | 3,155 | 3,472,330 | ||||||
California Municipal Finance Authority | 5,275 | 5,184,306 | ||||||
California School Finance Authority | 850 | 827,245 | ||||||
California School Finance Authority | 250 | 223,975 | ||||||
California School Finance Authority | 2,085 | 1,905,009 | ||||||
California School Finance Authority | 3,750 | 3,575,925 | ||||||
California School Finance Authority | 1,125 | 1,079,711 | ||||||
| 14 | AB IMPACT MUNICIPAL INCOME SHARES | abfunds.com | |
PORTFOLIO OF INVESTMENTS (continued)
| Principal Amount (000) | U.S. $ Value | |||||||
| ||||||||
California School Finance Authority | $ | 1,000 | $ | 1,004,260 | ||||
California Statewide Communities Development Authority | ||||||||
5.25%, 12/01/2048(a) | 500 | 496,940 | ||||||
Series 2016A | 1,190 | 1,183,717 | ||||||
Series 2018A | 2,640 | 2,648,210 | ||||||
5.50%, 12/01/2058(a) | 660 | 668,507 | ||||||
Coalinga-Huron Joint Unified School District BAM | 500 | 570,770 | ||||||
Golden Empire Schools Financing Authority | 1,195 | 1,239,633 | ||||||
Port of Los Angeles | 355 | 369,772 | ||||||
|
| |||||||
| 27,439,524 | ||||||||
|
| |||||||
Colorado – 1.1% |
| |||||||
Denver Health & Hospital Authority | 2,770 | 2,803,177 | ||||||
|
| |||||||
Connecticut – 1.7% |
| |||||||
City of Bridgeport CT | ||||||||
Series 2017A | 525 | 609,289 | ||||||
BAM Series 2018C | 1,620 | 1,893,166 | ||||||
BAM Series 2019A | 1,500 | 1,778,505 | ||||||
|
| |||||||
| 4,280,960 | ||||||||
|
| |||||||
District of Columbia – 1.4% |
| |||||||
District of Columbia | ||||||||
Series 2017A | 785 | 814,398 | ||||||
Series 2017B | 625 | 655,750 | ||||||
| abfunds.com | AB IMPACT MUNICIPAL INCOME SHARES | 15 | |
PORTFOLIO OF INVESTMENTS (continued)
| Principal Amount (000) | U.S. $ Value | |||||||
| ||||||||
District of Columbia | $ | 1,000 | $ | 921,850 | ||||
District of Columbia Water & Sewer Authority | 820 | 958,252 | ||||||
|
| |||||||
| 3,350,250 | ||||||||
| ||||||||
Florida – 1.7% |
| |||||||
School District of Broward County/FL | ||||||||
Series 2017B | 500 | 603,685 | ||||||
Series 2019B | 2,750 | 3,524,235 | ||||||
|
| |||||||
| 4,127,920 | ||||||||
|
| |||||||
Georgia – 0.1% |
| |||||||
Atlanta Development Authority (The) | 230 | 231,750 | ||||||
|
| |||||||
Illinois – 0.5% |
| |||||||
Cook County Community College District No. 508 | ||||||||
Series 2013 | 605 | 601,043 | ||||||
BAM Series 2017 | 620 | 694,171 | ||||||
|
| |||||||
| 1,295,214 | ||||||||
|
| |||||||
Kansas – 0.3% |
| |||||||
Seward County Unified School District No. 480 Liberal | 555 | 655,916 | ||||||
|
| |||||||
Maryland – 0.4% |
| |||||||
Maryland Economic Development Corp. | 1,200 | 1,075,452 | ||||||
|
| |||||||
Massachusetts – 6.6% |
| |||||||
Massachusetts Development Finance Agency | ||||||||
Series 2015D | 7,165 | 7,471,590 | ||||||
Series 2016E | 765 | 826,720 | ||||||
| 16 | AB IMPACT MUNICIPAL INCOME SHARES | abfunds.com | |
PORTFOLIO OF INVESTMENTS (continued)
| Principal Amount (000) | U.S. $ Value | |||||||
| ||||||||
Series 2017F | $ | 1,475 | $ | 1,683,536 | ||||
Massachusetts Development Finance Agency | 4,895 | 5,361,285 | ||||||
Massachusetts Development Finance Agency | 825 | 936,606 | ||||||
|
| |||||||
| 16,279,737 | ||||||||
|
| |||||||
Michigan – 11.7% |
| |||||||
Center Line Public Schools | 895 | 1,060,047 | ||||||
City of Detroit MI | 5,590 | 5,539,868 | ||||||
Downriver Utility Wastewater Authority | 1,515 | 1,747,810 | ||||||
Ferris State University | 6,185 | 7,111,497 | ||||||
Flint Hospital Building Authority | ||||||||
4.00%, 07/01/2041 | 3,500 | 3,437,245 | ||||||
5.00%, 07/01/2031 | 2,405 | 2,746,919 | ||||||
Flint Public Library | 2,260 | 2,452,581 | ||||||
Grand Rapids Public Schools | ||||||||
AGM | 1,800 | 2,169,810 | ||||||
AGM Series 2017 | 200 | 246,632 | ||||||
Great Lakes Water Authority Water Supply System Revenue | ||||||||
Series 2016B | 1,225 | 1,395,998 | ||||||
Series 2016C | 695 | 828,690 | ||||||
|
| |||||||
| 28,737,097 | ||||||||
|
| |||||||
Minnesota – 0.4% |
| |||||||
Housing & Redevelopment Authority of The City of St. Paul Minnesota | 1,000 | 892,690 | ||||||
|
| |||||||
| abfunds.com | AB IMPACT MUNICIPAL INCOME SHARES | 17 | |
PORTFOLIO OF INVESTMENTS (continued)
| Principal Amount (000) | U.S. $ Value | |||||||
| ||||||||
Missouri – 0.1% |
| |||||||
St. Louis Community College District | $ | 200 | $ | 221,860 | ||||
|
| |||||||
Montana – 1.0% |
| |||||||
City of Missoula MT Water System Revenue | 2,180 | 2,365,640 | ||||||
|
| |||||||
Nevada – 0.9% |
| |||||||
Clark County School District | 2,000 | 2,305,438 | ||||||
|
| |||||||
New Jersey – 6.4% |
| |||||||
New Jersey Economic Development Authority | 1,000 | 999,520 | ||||||
New Jersey Economic Development Authority | ||||||||
4.00%, 11/01/2037-11/01/2038 | 4,875 | 4,496,272 | ||||||
5.00%, 11/01/2033-11/01/2044 | 3,730 | 3,699,673 | ||||||
New Jersey Economic Development Authority | 1,170 | 1,187,761 | ||||||
New Jersey Economic Development Authority | 3,205 | 3,735,748 | ||||||
New Jersey Economic Development Authority | 1,645 | 1,663,247 | ||||||
|
| |||||||
| 15,782,221 | ||||||||
|
| |||||||
New York – 6.6% |
| |||||||
Build NYC Resource Corp. | 1,150 | 1,271,825 | ||||||
| 18 | AB IMPACT MUNICIPAL INCOME SHARES | abfunds.com | |
PORTFOLIO OF INVESTMENTS (continued)
| Principal Amount (000) | U.S. $ Value | |||||||
| ||||||||
Build NYC Resource Corp. | $ | 500 | $ | 477,360 | ||||
Build NYC Resource Corp. | ||||||||
5.00%, 06/01/2052(a) | 2,260 | 2,055,832 | ||||||
Series 2017A | 725 | 668,486 | ||||||
Metropolitan Transportation Authority | ||||||||
Series 2014D | 4,000 | 4,004,760 | ||||||
Series 2018B | 4,335 | 4,344,069 | ||||||
Series 2019F | 2,000 | 1,986,560 | ||||||
New York City Housing Development Corp. | 230 | 231,546 | ||||||
New York State Dormitory Authority | ||||||||
Series 2018 | 750 | 794,130 | ||||||
Series 2020 | 500 | 474,350 | ||||||
|
| |||||||
| 16,308,918 | ||||||||
|
| |||||||
North Carolina – 2.0% |
| |||||||
North Carolina Central University | ||||||||
4.00%, 04/01/2049 | 2,270 | 2,270,159 | ||||||
5.00%, 04/01/2044 | 2,500 | 2,722,150 | ||||||
|
| |||||||
| 4,992,309 | ||||||||
|
| |||||||
Ohio – 3.8% |
| |||||||
American Municipal Power, Inc. | 2,150 | 2,516,016 | ||||||
County of Cuyahoga/OH | ||||||||
Series 2017 | 4,365 | 4,453,566 | ||||||
5.25%, 02/15/2047 | 1,500 | 1,563,030 | ||||||
County of Darke OH | 690 | 669,244 | ||||||
|
| |||||||
| 9,201,856 | ||||||||
|
| |||||||
| abfunds.com | AB IMPACT MUNICIPAL INCOME SHARES | 19 | |
PORTFOLIO OF INVESTMENTS (continued)
| Principal Amount (000) | U.S. $ Value | |||||||
| ||||||||
Oklahoma – 2.0% |
| |||||||
Oklahoma County Finance Authority | $ | 1,120 | $ | 1,295,907 | ||||
Oklahoma Development Finance Authority | 3,365 | 3,495,932 | ||||||
|
| |||||||
| 4,791,839 | ||||||||
|
| |||||||
Oregon – 0.6% |
| |||||||
Tri-County Metropolitan Transportation District of Oregon | ||||||||
Series 2017A | 865 | 1,051,139 | ||||||
Series 2018A | 250 | 308,185 | ||||||
|
| |||||||
| 1,359,324 | ||||||||
|
| |||||||
Pennsylvania – 10.1% |
| |||||||
Capital Region Water Water Revenue | 1,510 | 1,790,375 | ||||||
City of Philadelphia PA Water & Wastewater Revenue | ||||||||
Series 2018A | 3,050 | 3,555,019 | ||||||
Series 2019B | 3,095 | 3,633,530 | ||||||
Delaware County Authority | 825 | 804,622 | ||||||
Hospitals & Higher Education Facilities Authority of Philadelphia (The) | 1,115 | 1,185,403 | ||||||
Philadelphia Authority for Industrial Development | ||||||||
Series 2018 | 4,010 | 4,294,801 | ||||||
AGM Series 2017 | 200 | 235,338 | ||||||
| 20 | AB IMPACT MUNICIPAL INCOME SHARES | abfunds.com | |
PORTFOLIO OF INVESTMENTS (continued)
| Principal Amount (000) | U.S. $ Value | |||||||
| ||||||||
Pittsburgh Water & Sewer Authority AGM | $ | 2,000 | $ | 2,385,120 | ||||
School District of the City of Erie (The) | ||||||||
AGM Series 2019A | 405 | 500,932 | ||||||
AGM Series 2019C | 2,850 | 3,534,880 | ||||||
State Public School Building Authority | 1,000 | 1,042,020 | ||||||
Wilkes-Barre Area School District/PA | 1,620 | 1,876,576 | ||||||
|
| |||||||
| 24,838,616 | ||||||||
|
| |||||||
Rhode Island – 4.0% |
| |||||||
Providence Public Building Authority | 8,000 | 9,858,019 | ||||||
|
| |||||||
Texas – 0.5% |
| |||||||
El Paso County Hospital District | 370 | 399,814 | ||||||
Newark Higher Education Finance Corp. | 735 | 707,379 | ||||||
|
| |||||||
| 1,107,193 | ||||||||
|
| |||||||
Utah – 1.6% |
| |||||||
Ogden City School District Municipal Building Authority | 3,490 | 3,968,200 | ||||||
|
| |||||||
Washington – 1.6% |
| |||||||
Pend Oreille County Public Utility District No. 1 Box Canyon | 3,600 | 4,048,704 | ||||||
|
| |||||||
| abfunds.com | AB IMPACT MUNICIPAL INCOME SHARES | 21 | |
PORTFOLIO OF INVESTMENTS (continued)
| Principal Amount (000) | U.S. $ Value | |||||||
| ||||||||
West Virginia – 2.0% |
| |||||||
Morgantown Utility Board, Inc. | $ | 2,555 | $ | 3,008,845 | ||||
West Virginia Hospital Finance Authority | 1,775 | 1,909,758 | ||||||
|
| |||||||
| 4,918,603 | ||||||||
|
| |||||||
Wisconsin – 4.0% |
| |||||||
Milwaukee Redevelopment Authority | 200 | 237,374 | ||||||
Wisconsin Health & Educational Facilities Authority | 1,175 | 1,278,847 | ||||||
Wisconsin Public Finance Authority | 4,230 | 3,798,751 | ||||||
Wisconsin Public Finance Authority | 4,450 | 4,438,296 | ||||||
|
| |||||||
| 9,753,268 | ||||||||
|
| |||||||
Total Long-Term Municipal Bonds | 210,228,125 | |||||||
|
| |||||||
SHORT-TERM MUNICIPAL NOTES – 0.8% |
| |||||||
California – 0.8% |
| |||||||
California Infrastructure & Economic Development Bank | 2,000 | 1,971,980 | ||||||
|
| |||||||
Total Municipal Obligations | 212,200,105 | |||||||
|
| |||||||
| 22 | AB IMPACT MUNICIPAL INCOME SHARES | abfunds.com | |
PORTFOLIO OF INVESTMENTS (continued)
| Principal Amount (000) | U.S. $ Value | |||||||
| ||||||||
CORPORATES – INVESTMENT GRADE – 4.8% | ||||||||
Financial Institutions – 2.5% | ||||||||
Finance – 2.5% | ||||||||
BlueHub Loan Fund, Inc. | $ | 1,000 | $ | 1,085,900 | ||||
Low Income Investment Fund | 5,000 | 5,006,369 | ||||||
|
| |||||||
| 6,092,269 | ||||||||
|
| |||||||
Industrial – 2.3% | ||||||||
Consumer Cyclical – Other – 1.4% | ||||||||
Conservation Fund A Nonprofit Corp. (The) | 3,267 | 3,470,629 | ||||||
|
| |||||||
Consumer Non-Cyclical – 0.5% |
| |||||||
YMCA of Greater New York | ||||||||
Series 2020 | 650 | 650,578 | ||||||
Series 2018 | 500 | 529,974 | ||||||
|
| |||||||
| 1,180,552 | ||||||||
|
| |||||||
Other Industrial – 0.4% |
| |||||||
Howard University Series 2020 | 1,000 | 1,041,510 | ||||||
|
| |||||||
| 5,692,691 | ||||||||
|
| |||||||
Total Corporates – Investment Grade | 11,784,960 | |||||||
|
| |||||||
| Shares | ||||||||
SHORT-TERM INVESTMENTS – 6.5% | ||||||||
Investment Companies – 6.5% | ||||||||
AB Fixed Income Shares, Inc. – Government Money Market Portfolio – Class AB, | 15,949,726 | 15,949,726 | ||||||
|
| |||||||
Total Investments – 97.8% | 239,934,791 | |||||||
Other assets less liabilities – 2.2% | 5,361,868 | |||||||
|
| |||||||
Net Assets – 100.0% | $ | 245,296,659 | ||||||
|
| |||||||
| abfunds.com | AB IMPACT MUNICIPAL INCOME SHARES | 23 | |
PORTFOLIO OF INVESTMENTS (continued)
| (a) | Security is exempt from registration under Rule 144A of the Securities Act of 1933. These securities are considered restricted, but liquid and may be resold in transactions exempt from registration, normally to qualified institutional buyers. At April 30, 2020, the aggregate market value of these securities amounted to $29,927,354 or 12.2% of net assets. |
| (b) | Floating Rate Security. Stated interest/floor/ceiling rate was in effect at April 30, 2020. |
| (c) | Affiliated investments. |
| (d) | The rate shown represents the 7-day yield as of period end. |
| (e) | To obtain a copy of the fund’s shareholder report, please go to the Securities and Exchange Commission’s website at www.sec.gov, or call AB at (800) 227-4618. |
As of April 30, 2020, the Fund’s percentages of investments in municipal bonds that are insured and in insured municipal bonds that have been pre-refunded or escrowed to maturity are 18.6% and 0.0%, respectively.
Glossary:
AGM – Assured Guaranty Municipal
BAM – Build American Mutual
COP – Certificate of Participation
DOT – Department of Transportation
LIBOR – London Interbank Offered Rates
See notes to financial statements.
| 24 | AB IMPACT MUNICIPAL INCOME SHARES | abfunds.com | |
STATEMENT OF ASSETS & LIABILITIES
April 30, 2020
| Assets | ||||
Investments in securities, at value | ||||
Unaffiliated issuers (cost $229,574,905) | $ | 223,985,065 | ||
Affiliated issuers (cost $15,949,726) | 15,949,726 | |||
Receivable for shares of beneficial interest sold | 3,541,655 | |||
| Interest receivable | 2,823,378 | |||
| Affiliated dividends receivable | 4,704 | |||
| Receivable due from Adviser | 1,081 | |||
|
| |||
Total assets | 246,305,609 | |||
|
| |||
| Liabilities | ||||
Dividends payable | 610,568 | |||
Payable for shares of beneficial interest redeemed | 398,382 | |||
|
| |||
Total liabilities | 1,008,950 | |||
|
| |||
Net Assets | $ | 245,296,659 | ||
|
| |||
| Composition of Net Assets | ||||
Shares of beneficial interest, at par | $ | 248 | ||
Additional paid-in capital | 251,355,649 | |||
Accumulated loss | (6,059,238 | ) | ||
|
| |||
| $ | 245,296,659 | |||
|
| |||
Net Asset Value Per Share—unlimited shares of beneficial interest authorized, $.00001 par value (based on 24,761,308 common shares outstanding) | $ | 9.91 | ||
|
|
See notes to financial statements.
| abfunds.com | AB IMPACT MUNICIPAL INCOME SHARES | 25 | |
STATEMENT OF OPERATIONS
Year Ended April 30, 2020
| Investment Income | ||||||||
Interest | $ | 5,673,837 | ||||||
Dividends—Affiliated issuers | 159,491 | |||||||
Other income(a) | 10,031 | |||||||
|
| |||||||
Total investment income | $ | 5,843,359 | ||||||
|
| |||||||
| Realized and Unrealized Loss on Investment Transactions | ||||||||
Net realized loss on investment transactions | (284,986 | ) | ||||||
Net change in unrealized appreciation/depreciation of investments | (9,721,429 | ) | ||||||
|
| |||||||
Net loss on investment transactions | (10,006,415 | ) | ||||||
|
| |||||||
Net Decrease in Net Assets from Operations | $ | (4,163,056 | ) | |||||
|
|
| (a) | Other income includes a reimbursement for investment in affiliated issuer (see Note B). |
See notes to financial statements.
| 26 | AB IMPACT MUNICIPAL INCOME SHARES | abfunds.com | |
STATEMENT OF CHANGES IN NET ASSETS
| Year Ended April 30, 2020 | Year Ended April 30, 2019 | |||||||
| Increase (Decrease) in Net Assets from Operations | ||||||||
Net investment income | $ | 5,843,359 | $ | 3,099,712 | ||||
Net realized loss on investment transactions | (284,986 | ) | (152,868 | ) | ||||
Net change in unrealized appreciation/depreciation of investments | (9,721,429 | ) | 4,774,022 | |||||
|
|
|
| |||||
Net increase (decrease) in net assets from operations | (4,163,056 | ) | 7,720,866 | |||||
Distribution to Shareholders | (5,843,379 | ) | (3,099,693 | ) | ||||
| Transactions in Shares of Beneficial Interest | ||||||||
Net increase | 122,339,075 | 91,001,459 | ||||||
|
|
|
| |||||
Total increase | 112,332,640 | 95,622,632 | ||||||
| Net Assets |
| |||||||
Beginning of period | 132,964,019 | 37,341,387 | ||||||
|
|
|
| |||||
End of period | $ | 245,296,659 | $ | 132,964,019 | ||||
|
|
|
| |||||
See notes to financial statements.
| abfunds.com | AB IMPACT MUNICIPAL INCOME SHARES | 27 | |
NOTES TO FINANCIAL STATEMENTS
April 30, 2020
NOTE A
Significant Accounting Policies
AB Corporate Shares (the “Trust”) was organized as a Massachusetts business trust under the laws of The Commonwealth of Massachusetts by an Agreement and Declaration of Trust dated January 26, 2004. The Trust is registered under the Investment Company Act of 1940, as an open-end, diversified management investment company. The Trust operates as a “series” company currently offering five separate portfolios: AB Corporate Income Shares, AB Municipal Income Shares, AB Taxable Multi-Sector Income Shares, AB Impact Municipal Income Shares and AB Tax-Aware Real Return Income Shares. Each portfolio is considered to be a separate entity for financial reporting and tax purposes. This report relates only to AB Impact Municipal Income Shares (the “Fund”).
Shares of the Fund are offered exclusively to holders of accounts established under wrap-fee programs sponsored and maintained by certain registered investment advisers approved by AllianceBernstein L.P. (the “Adviser”). The Fund’s shares may be purchased at the relevant net asset value without a sales charge or other fee. The financial statements have been prepared in conformity with U.S. generally accepted accounting principles (“U.S. GAAP”) which require management to make certain estimates and assumptions that affect the reported amounts of assets and liabilities in the financial statements and amounts of income and expenses during the reporting period. Actual results could differ from those estimates. The Fund is an investment company under U.S. GAAP and follows the accounting and reporting guidance applicable to investment companies. The following is a summary of significant accounting policies followed by the Fund.
1. Security Valuation
Portfolio securities are valued at their current market value determined on the basis of market quotations or, if market quotations are not readily available or are deemed unreliable, at “fair value” as determined in accordance with procedures established by and under the general supervision of the Trust’s Board of Trustees (the “Board”).
In general, the market values of securities which are readily available and deemed reliable are determined as follows: securities listed on a national securities exchange (other than securities listed on the NASDAQ Stock Market, Inc. (“NASDAQ”)) or on a foreign securities exchange are valued at the last sale price at the close of the exchange or foreign securities exchange. If there has been no sale on such day, the securities are valued at the last traded price from the previous day. Securities listed on more than one exchange are valued by reference to the principal exchange on which the securities are traded; securities listed only on NASDAQ are valued in accordance with the NASDAQ Official Closing Price; listed or over
| 28 | AB IMPACT MUNICIPAL INCOME SHARES | abfunds.com | |
NOTES TO FINANCIAL STATEMENTS (continued)
the counter (“OTC”) market put or call options are valued at the mid level between the current bid and ask prices. If either a current bid or current ask price is unavailable, the Adviser will have discretion to determine the best valuation (e.g., last trade price in the case of listed options); open futures are valued using the closing settlement price or, in the absence of such a price, the most recent quoted bid price. If there are no quotations available for the day of valuation, the last available closing settlement price is used; U.S. Government securities and any other debt instruments having 60 days or less remaining until maturity are generally valued at market by an independent pricing vendor, if a market price is available. If a market price is not available, the securities are valued at amortized cost. This methodology is commonly used for short term securities that have an original maturity of 60 days or less, as well as short term securities that had an original term to maturity that exceeded 60 days. In instances when amortized cost is utilized, the Valuation Committee (the “Committee”) must reasonably conclude that the utilization of amortized cost is approximately the same as the fair value of the security. Such factors the Committee will consider include, but are not limited to, an impairment of the creditworthiness of the issuer or material changes in interest rates. Fixed-income securities, including mortgage-backed and asset-backed securities, may be valued on the basis of prices provided by a pricing service or at a price obtained from one or more of the major broker-dealers. In cases where broker-dealer quotes are obtained, the Adviser may establish procedures whereby changes in market yields or spreads are used to adjust, on a daily basis, a recently obtained quoted price on a security. Swaps and other derivatives are valued daily, primarily using independent pricing services, independent pricing models using market inputs, as well as third party broker-dealers or counterparties. Open end mutual funds are valued at the closing net asset value per share, while exchange traded funds are valued at the closing market price per share.
Securities for which market quotations are not readily available (including restricted securities) or are deemed unreliable are valued at fair value as deemed appropriate by the Adviser. Factors considered in making this determination may include, but are not limited to, information obtained by contacting the issuer, analysts, analysis of the issuer’s financial statements or other available documents. In addition, the Fund may use fair value pricing for securities primarily traded in non-U.S. markets because most foreign markets close well before the Fund values its securities at 4:00 p.m., Eastern Time. The earlier close of these foreign markets gives rise to the possibility that significant events, including broad market moves, may have occurred in the interim and may materially affect the value of those securities. To account for this, the Fund generally values many of its foreign equity securities using fair value prices based on third party vendor modeling tools to the extent available.
| abfunds.com | AB IMPACT MUNICIPAL INCOME SHARES | 29 | |
NOTES TO FINANCIAL STATEMENTS (continued)
2. Fair Value Measurements
In accordance with U.S. GAAP regarding fair value measurements, fair value is defined as the price that the Fund would receive to sell an asset or pay to transfer a liability in an orderly transaction between market participants at the measurement date. U.S. GAAP establishes a framework for measuring fair value, and a three-level hierarchy for fair value measurements based upon the transparency of inputs to the valuation of an asset or liability (including those valued based on their market values as described in Note A.1 above). Inputs may be observable or unobservable and refer broadly to the assumptions that market participants would use in pricing the asset or liability. Observable inputs reflect the assumptions market participants would use in pricing the asset or liability based on market data obtained from sources independent of the Fund. Unobservable inputs reflect the Fund’s own assumptions about the assumptions that market participants would use in pricing the asset or liability based on the best information available in the circumstances. Each investment is assigned a level based upon the observability of the inputs which are significant to the overall valuation. The three-tier hierarchy of inputs is summarized below.
| • | Level 1—quoted prices in active markets for identical investments |
| • | Level 2—other significant observable inputs (including quoted prices for similar investments, interest rates, prepayment speeds, credit risk, etc.) |
| • | Level 3—significant unobservable inputs (including the Fund’s own assumptions in determining the fair value of investments) |
The fair value of debt instruments, such as bonds, and over-the-counter derivatives is generally based on market price quotations, recently executed market transactions (where observable) or industry recognized modeling techniques and are generally classified as Level 2. Pricing vendor inputs to Level 2 valuations may include quoted prices for similar investments in active markets, interest rate curves, coupon rates, currency rates, yield curves, option adjusted spreads, default rates, credit spreads and other unique security features in order to estimate the relevant cash flows which are then discounted to calculate fair values. If these inputs are unobservable and significant to the fair value, these investments will be classified as Level 3.
Other fixed income investments, including non-U.S. government and corporate debt, are generally valued using quoted market prices, if available, which are typically impacted by current interest rates, maturity dates and any perceived credit risk of the issuer. Additionally, in the absence of quoted market prices, these inputs are used by pricing vendors to derive a valuation based upon industry or proprietary models which incorporate issuer specific data with relevant yield/spread comparisons with more
| 30 | AB IMPACT MUNICIPAL INCOME SHARES | abfunds.com | |
NOTES TO FINANCIAL STATEMENTS (continued)
widely quoted bonds with similar key characteristics. Those investments for which there are observable inputs are classified as Level 2. Where the inputs are not observable, the investments are classified as Level 3.
The following table summarizes the valuation of the Fund’s investments by the above fair value hierarchy levels as of April 30, 2020:
Investments in Securities: | Level 1 | Level 2 | Level 3 | Total | ||||||||||||
Assets: | ||||||||||||||||
Long-Term Municipal Bonds | $ | — | $ | 210,228,125 | $ | — | $ | 210,228,125 | ||||||||
Short-Term Municipal Notes | — | 1,971,980 | — | 1,971,980 | ||||||||||||
Corporates – Investment Grade | — | 11,784,960 | — | 11,784,960 | ||||||||||||
Short-Term Investments | 15,949,726 | — | — | 15,949,726 | ||||||||||||
|
|
|
|
|
|
|
| |||||||||
Total Investments in Securities | 15,949,726 | 223,985,065 | — | 239,934,791 | ||||||||||||
Other Financial Instruments(a) | — | — | — | — | ||||||||||||
|
|
|
|
|
|
|
| |||||||||
Total | $ | 15,949,726 | $ | 223,985,065 | $ | — | $ | 239,934,791 | (b) | |||||||
|
|
|
|
|
|
|
| |||||||||
| (a) | Other financial instruments are derivative instruments, such as futures, forwards and swaps, which are valued at the unrealized appreciation/(depreciation) on the instrument. Other financial instruments may also include swaps with upfront premiums, options written and swaptions written which are valued at market value. |
| (b) | The amount of $9,624,673 for Long-Term Municipal Bonds was transferred out of Level 3 into Level 2 as improved transparency of price inputs received from pricing vendors has increased the observability during the reporting period. |
3. Taxes
It is the Fund’s policy to meet the requirements of the Internal Revenue Code applicable to regulated investment companies and to distribute all of its investment company taxable income and net realized gains, if any, to shareholders. Therefore, no provisions for federal income or excise taxes are required.
In accordance with U.S. GAAP requirements regarding accounting for uncertainties in income taxes, management has analyzed the Fund’s tax positions taken or expected to be taken on federal and state income tax returns for all open tax years (the current and the prior tax year) and has concluded that no provision for income tax is required in the Fund’s financial statements.
4. Investment Income and Investment Transactions
Dividend income is recorded on the ex-dividend date or as soon as the Fund is informed of the dividend. Interest income is accrued daily. Investment transactions are accounted for on the date the securities are purchased or sold. Investment gains or losses are determined on the
| abfunds.com | AB IMPACT MUNICIPAL INCOME SHARES | 31 | |
NOTES TO FINANCIAL STATEMENTS (continued)
identified cost basis. The Fund amortizes premiums and accretes discounts as adjustments to interest income.
5. Dividends and Distributions
Dividends and distributions to shareholders, if any, are recorded on the ex-dividend date. Income dividends and capital gains distributions are determined in accordance with federal tax regulations and may differ from those determined in accordance with U.S. GAAP. To the extent these differences are permanent, such amounts are reclassified within the capital accounts based on their federal tax basis treatment; temporary differences do not require such reclassification.
NOTE B
Advisory Fee and Other Transactions with Affiliates
Under the terms of the advisory agreement, the Fund pays no advisory fee to the Adviser and the Adviser reimburses or pays for the Fund’s operating expenses. The Fund is an integral part of separately managed accounts in wrap-fee programs and other investment programs. Typically, participants in these programs pay a fee to their investment adviser for all costs and expenses of the separately managed account, including costs and expenses associated with the Fund, and a fee is paid by their investment adviser to the Adviser. In certain cases, participants may have a direct relationship with the Adviser without the involvement of a third party investment adviser, in which case the participant would pay a fee directly to the Adviser. The Adviser serves as investment manager and adviser of the Fund and continuously furnishes an investment program for the Fund and manages, supervises and conducts the affairs of the Fund, subject to the supervisions of the Fund’s Board. The advisory agreement provides that the Adviser or an affiliate will furnish, or pay the expenses of the Fund for, office space, facilities and equipment, services of executive and other personnel of the Fund and certain administrative services.
The Fund has entered into a distribution agreement with AllianceBernstein Investments, Inc., the Fund’s principal underwriter (the “Underwriter”), to permit the Underwriter to distribute the Fund’s shares, which are sold at their net asset value without any sales charge. The Fund does not pay a fee for this service. The Underwriter is a wholly owned subsidiary of the Adviser.
AllianceBernstein Investor Services, Inc. (“ABIS”), a wholly-owned subsidiary of the Adviser, acts as the Fund’s registrar, transfer agent and dividend-disbursing agent. ABIS registers the transfer, issuance and redemption of Fund shares and disburses dividends and other distributions to Fund shareholders. The Fund does not pay a fee for this service.
| 32 | AB IMPACT MUNICIPAL INCOME SHARES | abfunds.com | |
NOTES TO FINANCIAL STATEMENTS (continued)
The Fund may invest in AB Government Money Market Portfolio (the “Government Money Market Portfolio”) which has a contractual annual advisory fee rate of ..20% of the portfolio’s average daily net assets and bears its own expenses. The Adviser has contractually agreed to waive .10% of the advisory fee of Government Money Market Portfolio (resulting in a net advisory fee of .10%) until August 31, 2020. In connection with the investment by the Fund in Government Money Market Portfolio, the Adviser has contractually agreed to reimburse the Fund in an amount equal to the Fund’s pro rata share of the effective advisory fee of Government Money Market Portfolio, as borne indirectly by the Fund as an acquired fund fee and expense. For the year ended April 30, 2020, such reimbursement amounted to $10,031.
A summary of the Fund’s transactions in AB mutual funds for the year ended April 30, 2020 is as follows:
Fund | Market Value 4/30/19 (000) | Purchases at Cost (000) | Sales Proceeds (000) | Market Value 4/30/20 (000) | Dividend Income (000) | |||||||||||||||
Government Money Market Portfolio | $ | 5,190 | $ | 113,955 | $ | 103,195 | $ | 15,950 | $ | 159 | ||||||||||
During the second quarter of 2018, AXA S.A. (“AXA”), a French holding company for the AXA Group, completed the sale of a minority stake in its subsidiary, AXA Equitable Holdings, Inc. (now named Equitable Holdings, Inc.)(“Equitable”), through an initial public offering. Equitable is the holding company for a diverse group of financial services companies, including an approximately 64.9% economic interest in the Adviser and a 100% interest in AllianceBernstein Corporation, the general partner of the Adviser. Since the initial sale, AXA has completed additional offerings, most recently during the fourth quarter of 2019. As a result, AXA currently owns less than 10% of the outstanding shares of common stock of Equitable, and no longer owns a controlling interest in Equitable. AXA previously announced its intention to sell its entire interest in Equitable over time, subject to market conditions and other factors (the “Plan”). Most of AXA’s remaining Equitable shares are to be delivered on redemption of AXA bonds mandatorily exchangeable into Equitable shares and maturing in May 2021. AXA retains sole discretion to determine the timing of any future sales of its remaining shares of Equitable common stock.
Sales under the Plan that were completed on November 13, 2019 resulted in the indirect transfer of a “controlling block” of voting securities of the Adviser (a “Change of Control Event”) and may have been deemed to have been an “assignment” causing a termination of the Fund’s investment
| abfunds.com | AB IMPACT MUNICIPAL INCOME SHARES | 33 | |
NOTES TO FINANCIAL STATEMENTS (continued)
advisory and administration agreements. In order to ensure that investment advisory and administration services could continue uninterrupted in the event of a Change of Control Event, the Board previously approved new investment advisory and administration agreements with the Adviser, and shareholders of the Funds subsequently approved the new investment advisory agreement. These agreements became effective on November 13, 2019.
NOTE C
Investment Transactions
Purchases and sales of investment securities (excluding short-term investments) for the year ended April 30, 2020 were as follows:
| Purchases | Sales | |||||||
Investment securities (excluding U.S. government securities) | $ | 106,937,665 | $ | 4,119,825 | ||||
U.S. government securities | – 0 | – | – 0 | – | ||||
The cost of investments for federal income tax purposes, gross unrealized appreciation and unrealized depreciation are as follows:
Cost | $ | 245,524,631 | ||
|
| |||
Gross unrealized appreciation | $ | 3,505,163 | ||
Gross unrealized depreciation | (9,095,003 | ) | ||
|
| |||
Net unrealized depreciation | $ | (5,589,840 | ) | |
|
|
1. Derivative Financial Instruments
The Fund may use derivatives in an effort to earn income and enhance returns, to replace more traditional direct investments, to obtain exposure to otherwise inaccessible markets (collectively, “investment purposes”), or to hedge or adjust the risk profile of its portfolio.
The Fund did not engage in derivatives transactions for the year ended April 30, 2020.
NOTE D
Shares of Beneficial Interest
Transactions in shares of beneficial interest were as follows:
| Shares | Amount | |||||||||||||||||||||||
Year Ended 2020 | Year Ended April 30, 2019 | Year Ended April 30, 2020 | Year Ended 2019 | |||||||||||||||||||||
|
| |||||||||||||||||||||||
Shares sold | 13,186,982 | 10,105,211 | $ | 137,610,295 | $ | 99,653,683 | ||||||||||||||||||
| ||||||||||||||||||||||||
Shares redeemed | (1,472,619 | ) | (873,773 | ) | (15,271,220 | ) | (8,652,224 | ) | ||||||||||||||||
| ||||||||||||||||||||||||
Net increase | 11,714,363 | 9,231,438 | $ | 122,339,075 | $ | 91,001,459 | ||||||||||||||||||
| ||||||||||||||||||||||||
| 34 | AB IMPACT MUNICIPAL INCOME SHARES | abfunds.com | |
NOTES TO FINANCIAL STATEMENTS (continued)
NOTE E
Risks Involved in Investing in the Fund
Market Risk—The market value of a security may move up or down, sometimes rapidly and unpredictably. These fluctuations may cause a security to be worth less than the price originally paid for it, or less than it was worth at an earlier time. Market risk may affect a single issuer, industry, sector of the economy or the market as a whole. Global economies and financial markets are increasingly interconnected, which increases the probabilities that conditions in one country or region might adversely impact issuers in a different country or region. Conditions affecting the general economy, including political, social, or economic instability at the local, regional, or global level may also affect the market value of a security. Health crises, such as pandemic and epidemic diseases, as well as other incidents that interrupt the expected course of events, such as natural disasters, war or civil disturbance, acts of terrorism, power outages and other unforeseeable and external events, and the public response to or fear of such diseases or events, have and may in the future have an adverse effect on the Fund’s investments and net asset value and can lead to increased market volatility. For example, any preventative or protective actions that governments may take in respect of such diseases or events may result in periods of business disruption, inability to obtain raw materials, supplies and component parts, and reduced or disrupted operations for the Fund’s portfolio companies. The occurrence and pendency of such diseases or events could adversely affect the economies and financial markets either in specific countries or worldwide.
ESG Risk—Applying environmental, social and corporate governance (“ESG”) and sustainability criteria to the investment process may exclude securities of certain issuers for non-investment reasons and, therefore, the Fund may forgo some market opportunities available to funds that do not use ESG or sustainability criteria. Securities selected based on ESG factors may shift into and out of favor depending on market and economic conditions, and the Fund’s performance may at times be better or worse than the performance of funds that do not use ESG or sustainability criteria.
Credit Risk—An issuer or guarantor of a fixed-income security, or the counterparty to a derivatives or other contract, may be unable or unwilling to make timely payments of interest or principal, or to otherwise honor its obligations. The issuer or guarantor may default, causing a loss of the full principal amount of a security and any accrued interest. The degree of risk for a particular security may be reflected in its credit rating. There is the possibility that the credit rating of a fixed-income security may be downgraded after purchase, which may adversely affect the value of the security. Investments in fixed-income securities with lower ratings tend to have
| abfunds.com | AB IMPACT MUNICIPAL INCOME SHARES | 35 | |
NOTES TO FINANCIAL STATEMENTS (continued)
a higher probability that an issuer will default or fail to meet its payment obligations.
Municipal Market Risk—This is the risk that special factors may adversely affect the value of municipal securities and have a significant effect on the yield or value of the Fund’s investments in municipal securities. These factors include economic conditions, political or legislative changes, uncertainties related to the tax status of municipal securities, or the rights of investors in these securities. To the extent that the Fund invests more of its assets in a particular state’s municipal securities, the Fund may be vulnerable to events adversely affecting that state, including economic, political and regulatory occurrences, court decisions, terrorism and catastrophic natural disasters, such as hurricanes or earthquakes. The Fund’s investments in certain municipal securities with principal and interest payments that are made from the revenues of a specific project or facility, and not general tax revenues, may have increased risks. Factors affecting the project or facility, such as local business or economic conditions, could have a significant effect on the project’s ability to make payments of principal and interest on these securities.
Congress has previously considered making changes to the municipal securities provisions of the Internal Revenue Code that could change the U.S. federal income tax treatment of certain types of municipal securities
Tax Risk—There is no guarantee that all of the Fund’s income will remain exempt from federal or state income taxes. From time to time, the U.S. Government and the U.S. Congress consider changes in federal tax law that could limit or eliminate the federal tax exemption for municipal bond income, which would in effect reduce the income received by shareholders from the Fund by increasing taxes on that income. In such event, the Fund’s net asset value, or NAV, could also decline as yields on municipal bonds, which are typically lower than those on taxable bonds, would be expected to increase to approximately the yield of comparable taxable bonds. Actions or anticipated actions affecting the tax exempt status of municipal bonds could also result in significant shareholder redemptions of Fund shares as investors anticipate adverse effects on the Fund or seek higher yields to offset the potential loss of the tax deduction. As a result, the Fund would be required to maintain higher levels of cash to meet the redemptions, which would negatively affect the Fund’s yield. The federal income tax treatment of payments in respect of certain derivative contracts is unclear.
Below Investment Grade Securities Risk—Investments in fixed-income securities with lower ratings (“junk bonds”) tend to have a higher probability that an issuer will default or fail to meet its payment obligations. These
| 36 | AB IMPACT MUNICIPAL INCOME SHARES | abfunds.com | |
NOTES TO FINANCIAL STATEMENTS (continued)
securities may be subject to greater price volatility due to such factors as specific corporate developments, interest rate sensitivity, negative perceptions of the junk bond market generally and may be more difficult to trade than other types of securities.
Interest Rate Risk—Changes in interest rates will affect the value of investments in fixed-income securities. When interest rates rise, the value of existing investments in fixed-income securities tends to fall and this decrease in value may not be offset by higher income from new investments. Interest rate risk is generally greater for fixed-income securities with longer maturities or durations.
Inflation Risk—This is the risk that the value of assets or income from investments will be less in the future as inflation decreases the value of money. As inflation increases, the value of the Fund’s assets can decline as can the value of the Fund’s distributions. This risk is significantly greater for fixed-income securities with longer maturities.
Leverage Risk—When the Fund borrows money or otherwise leverages its investments, its performance may be volatile because leverage tends to exaggerate the effect of any increase or decrease in the value of the Fund’s investments. The Fund may create leverage through the use of reverse repurchase arrangements, forward currency exchange contracts, forward commitments, dollar rolls or futures or by borrowing money. The use of other types of derivative instruments by the Fund, such as options and swaps, may also result in a form of leverage. Leverage may result in higher returns to the Fund than if the Fund were not leveraged, but may also adversely affect returns, particularly if the market is declining.
Illiquid Investments Risk —Illiquid investments risk exists when particular investments, such as lower-rated securities, are or become difficult to purchase or sell, possibly preventing the Fund from selling such investments at an advantageous price. The Fund is subject to illiquid investments risk because the market for municipal securities is generally smaller than many other markets. Derivatives and securities involving substantial market and credit risk tend to involve greater illiquid investments risk than most other types of investments.
Derivatives Risk—The Fund may enter into derivative transactions such as forwards, options, futures and swaps. Derivatives may be illiquid, difficult to price, and leveraged so that small changes may produce disproportionate losses for the Fund, and subject to counterparty risk to a greater degree than more traditional investments. Derivatives may result in significant losses, including losses that are far greater than the value of the derivatives reflected on the statement of assets and liabilities.
| abfunds.com | AB IMPACT MUNICIPAL INCOME SHARES | 37 | |
NOTES TO FINANCIAL STATEMENTS (continued)
LIBOR Risk—The Fund may invest in certain debt securities, derivatives or other financial instruments that utilize the London Interbank Offered Rate, or “LIBOR,” as a “benchmark” or “reference rate” for various interest rate calculations. In July 2017, the United Kingdom Financial Conduct Authority, which regulates LIBOR, announced a desire to phase out the use of LIBOR by the end of 2021. Although financial regulators and industry working groups have suggested alternative reference rates, such as European Interbank Offer Rate (“EURIBOR”), Sterling Overnight Interbank Average Rate (“SONIA”) and Secured Overnight Financing Rate (“SOFR”), global consensus on alternative rates is lacking and the process for amending existing contracts or instruments to transition away from LIBOR remains unclear. The elimination of LIBOR or changes to other reference rates or any other changes or reforms to the determination or supervision of reference rates could have an adverse impact on the market for, or value of, any securities or payments linked to those reference rates, which may adversely affect the Fund’s performance and/or net asset value. Uncertainty and risk also remain regarding the willingness and ability of issuers and lenders to include revised provisions in new and existing contracts or instruments. Consequently, the transition away from LIBOR to other reference rates may lead to increased volatility and illiquidity in markets that are tied to LIBOR, fluctuations in values of LIBOR-related investments or investments in issuers that utilize LIBOR, increased difficulty in borrowing or refinancing and diminished effectiveness of hedging strategies, adversely affecting the Fund’s performance. Furthermore, the risks associated with the expected discontinuation of LIBOR and transition may be exacerbated if the work necessary to effect an orderly transition to an alternative reference rate is not completed in a timely manner. Because the usefulness of LIBOR as a benchmark could deteriorate during the transition period, these effects could occur prior to the end of 2021.
Indemnification Risk—In the ordinary course of business, the Fund enters into contracts that contain a variety of indemnifications. The Fund’s maximum exposure under these arrangements is unknown. However, the Fund has not had prior claims or losses pursuant to these indemnification provisions and expects the risk of loss thereunder to be remote. Therefore, the Fund has not accrued any liability in connection with these indemnification provisions.
Management Risk—The Fund is subject to management risk because it is an actively-managed investment fund. The Adviser will apply its investment techniques and risk analyses in making investment decisions, but there is no guarantee that its techniques will produce the intended results.
| 38 | AB IMPACT MUNICIPAL INCOME SHARES | abfunds.com | |
NOTES TO FINANCIAL STATEMENTS (continued)
NOTE F
Joint Credit Facility
A number of open-end mutual funds managed by the Adviser, including the Fund, participate in a $325 million revolving credit facility (the “Facility”) intended to provide short-term financing, if necessary, subject to certain restrictions in connection with abnormal redemption activity. Commitment fees related to the Facility are paid by the Adviser. The Fund did not utilize the Facility during the year ended April 30, 2020.
NOTE G
Distributions to Shareholders
The tax character of distributions paid during the fiscal year ended April 30, 2020 and the period ended April 30, 2019 were as follows:
| 2020 | 2019 | |||||||
Distributions paid from: | ||||||||
Ordinary income… | $ | 169,666 | $ | 125,019 | ||||
|
|
|
| |||||
Total taxable distributions… | 169,666 | 125,019 | ||||||
Tax exempt distributions… | 5,673,713 | 2,974,674 | ||||||
|
|
|
| |||||
Total distributions paid… | $ | 5,843,379 | $ | 3,099,693 | ||||
|
|
|
| |||||
As of April 30, 2020, the components of accumulated earnings/(deficit) on a tax basis were as follows:
Undistributed tax-exempt income | $ | 610,567 | ||
Accumulated capital and other losses | (469,397 | )(a) | ||
Unrealized appreciation/(depreciation) | (5,589,840 | ) | ||
|
| |||
Total accumulated earnings/(deficit) | $ | (5,448,670 | ) (b) |
| (a) | As of April 30, 2020, the Fund had a net capital loss carryforward of $469,397. |
| (b) | The difference between book-basis and tax-basis components of accumulated earnings/(deficit) is attributable primarily to dividends payable. |
For tax purposes, net realized capital losses may be carried over to offset future capital gains, if any. Funds are permitted to carry forward capital losses for an indefinite period, and such losses will retain their character as either short-term or long-term capital losses. As of April 30, 2020, the Fund had a net short-term capital loss carryforward of $397,886 and a net long-term capital loss carryforward of $71,511, which may be carried forward for an indefinite period.
During the current fiscal year, there were no permanent differences that resulted in adjustments to accumulated loss or additional paid-in capital.
NOTE H
Recent Accounting Pronouncements
In March 2017, the Financial Accounting Standards Board issued an Accounting Standards Update, ASU 2017-08, Receivables—Nonrefundable Fees and Other Costs (Subtopic 310-20), Premium Amortization on Purchased Callable Debt Securities which amends the
| abfunds.com | AB IMPACT MUNICIPAL INCOME SHARES | 39 | |
NOTES TO FINANCIAL STATEMENTS (continued)
amortization period for certain purchased callable debt securities held at a premium, shortening such period to the earliest call date. ASU 2017-08 does not require any accounting change for debt securities held at a discount; the discount continues to be amortized to maturity. ASU 2017-08 is effective for fiscal years, and interim periods within those fiscal years, beginning after December 15, 2018. The Fund has adopted ASU 2017-08, which did not have a material impact on the Fund’s financial position or the results of its operations, and had no impact on the Fund’s net assets.
NOTE I
Subsequent Events
Management has evaluated subsequent events for possible recognition or disclosure in the financial statements through the date the financial statements are issued. Management has determined that there are no material events that would require disclosure in the Fund’s financial statements through this date.
| 40 | AB IMPACT MUNICIPAL INCOME SHARES | abfunds.com | |
FINANCIAL HIGHLIGHTS
Selected Data For A Share Of Beneficial Interest Outstanding Throughout Each Period
| Year Ended April 30, | September 12, April 30, 2018 | |||||||||||
| 2020 | 2019 | |||||||||||
|
|
|
|
|
| |||||||
Net asset value, beginning of period | $ 10.19 | $ 9.79 | $ 10.00 | |||||||||
|
| |||||||||||
Income From Investment Operations | ||||||||||||
Net investment income(b) | .33 | .33 | .18 | |||||||||
Net realized and unrealized gain (loss) on investment transactions | (.27 | ) | .40 | (.22 | ) | |||||||
|
| |||||||||||
Net increase (decrease) in net asset value from operations | .06 | .73 | (.04 | ) | ||||||||
|
| |||||||||||
Less: Dividends | ||||||||||||
Dividends from net investment income | (.34 | ) | (.33 | ) | (.17 | ) | ||||||
|
| |||||||||||
Net asset value, end of period | $ 9.91 | $ 10.19 | $ 9.79 | |||||||||
|
| |||||||||||
Total Return | ||||||||||||
Total investment return based on net asset value(c) | .40 | % | 7.56 | % | (.44 | ) % | ||||||
Ratios/Supplemental Data | ||||||||||||
Net assets, end of period (000’s omitted) | $245,297 | $132,964 | $37,341 | |||||||||
Ratio to average net assets of: | ||||||||||||
Net investment income | 3.18 | % | 3.35 | % | 2.89 | %^ | ||||||
Portfolio turnover rate | 2 | % | 23 | % | 8 | % | ||||||
| (a) | Commencement of operations. |
| (b) | Based on average shares outstanding. |
| (c) | Total investment return is calculated assuming an initial investment made at the net asset value at the beginning of the period, reinvestment of all dividends and distributions at net asset value during the period, and redemption on the last day of the period. Total return does not reflect the deduction of taxes that a shareholder would pay on fund distributions or the redemption of fund shares. Total investment return calculated for a period of less than one year is not annualized. |
| ^ | Annualized. |
| abfunds.com | AB IMPACT MUNICIPAL INCOME SHARES | 41 | |
REPORT OF INDEPENDENT REGISTERED
PUBLIC ACCOUNTING FIRM
To the Board of Trustees of AB Corporate Shares and Shareholders
of AB Impact Municipal Income Shares:
Opinion on the Financial Statements
We have audited the accompanying statement of assets and liabilities of AB Impact Municipal Income Shares (the “Fund”) (one of the series constituting AB Corporate Shares (the “Trust”)), including the portfolio of investments, as of April 30, 2020, and the related statement of operations for the year then ended, the statements of changes in net assets for each of the two years in the period then ended, the financial highlights for each of the two years in the period then ended and the period from September 12, 2017 (commencement of operations) to April 30, 2018 and the related notes (collectively referred to as the “financial statements”). In our opinion, the financial statements present fairly, in all material respects, the financial position of the Fund (one of the series constituting AB Corporate Shares) at April 30, 2020, the results of its operations for the year then ended, the changes in its net assets for each of the two years in the period then ended and its financial highlights for each of the two years in the period then ended and the period from September 12, 2017 (commencement of operations) to April 30, 2018, in conformity with U.S. generally accepted accounting principles.
Basis for Opinion
These financial statements are the responsibility of the Trust’s management. Our responsibility is to express an opinion on the Fund’s financial statements based on our audits. We are a public accounting firm registered with the Public Company Accounting Oversight Board (United States) (“PCAOB”) and are required to be independent with respect to the Fund in accordance with the U.S. federal securities laws and the applicable rules and regulations of the Securities and Exchange Commission and the PCAOB.
We conducted our audits in accordance with the standards of the PCAOB. Those standards require that we plan and perform the audit to obtain reasonable assurance about whether the financial statements are free of material misstatement, whether due to error or fraud. The Trust is not required to have, nor were we engaged to perform, an audit of the Trust’s internal control over financial reporting. As part of our audits, we are required to obtain an understanding of internal control over financial reporting, but not for the purpose of expressing an opinion on the effectiveness of the Trust’s internal control over financial reporting. Accordingly, we express no such opinion.
Our audits included performing procedures to assess the risks of material misstatement of the financial statements, whether due to error or fraud,
| 42 | AB IMPACT MUNICIPAL INCOME SHARES | abfunds.com | |
REPORT OF INDEPENDENT REGISTERED
PUBLIC ACCOUNTING FIRM (continued)
and performing procedures that respond to those risks. Such procedures included examining, on a test basis, evidence regarding the amounts and disclosures in the financial statements. Our procedures included confirmation of securities owned as of April 30, 2020, by correspondence with the custodian and others or by other appropriate auditing procedures where replies from others were not received. Our audits also included evaluating the accounting principles used and significant estimates made by management, as well as evaluating the overall presentation of the financial statements. We believe that our audits provide a reasonable basis for our opinion.

We have served as the auditor of one or more of the AB investment companies since 1968.
New York, New York
June 26, 2020
| abfunds.com | AB IMPACT MUNICIPAL INCOME SHARES | 43 | |
BOARD OF TRUSTEES
Marshall C. Turner, Jr.(1), Chairman Jorge A. Bermudez(1) Michael J. Downey(1) Nancy P. Jacklin(1) | Robert M. Keith, President and Chief Executive Officer Jeanette Loeb(1) Carol C. McMullen(1) Garry L. Moody(1) Earl D. Weiner(1) |
OFFICERS
R.B. “Guy” Davidson III(2),^, Vice President Eric A. Glass(2), Vice President Matthew J. Norton(2), Vice President Emilie D. Wrapp, Secretary | Michael B. Reyes, Senior Analyst Joseph J. Mantineo, Treasurer and Chief Financial Officer Phyllis J. Clarke, Controller Vincent S. Noto, Chief Compliance Officer |
Custodian and Accounting Agent State Street Bank and Trust Company
Principal Underwriter AllianceBernstein Investments, Inc.
| Legal Counsel Seward & Kissel LLP One Battery Park Plaza New York, NY 10004
Independent Registered Public Accounting Firm Ernst & Young LLP 5 Times Square New York, NY 10036 | |
Transfer Agent AllianceBernstein Investor Services, P.O. Box 786003 | ||
| 1 | Member of the Audit Committee, the Governance and Nominating Committee, and the Independent Directors Committee. |
| 2 | The day-to-day management of, and investment decisions for, the Fund’s Portfolio are made by the Adviser’s Municipal Impact Investment Team. Messrs. Davidson, Glass and Norton are the investment professionals primarily responsible for the day-to-day management of the Fund’s Portfolio. |
| ^ | Mr. Davidson is expected to retire from the Adviser effective December 30, 2020. |
| 44 | AB IMPACT MUNICIPAL INCOME SHARES | abfunds.com | |
MANAGEMENT OF THE FUND
Board of Trustees Information
The business and affairs of the Trust are managed under the direction of the Board of Trustees. Certain information concerning the Trust’s Trustee is set forth below.
NAME, ADDRESS*, AGE AND (YEAR FIRST ELECTED**) | PRINCIPAL OCCUPATION(S), DURING PAST FIVE YEARS AND OTHER INFORMATION*** | PORTFOLIOS IN AB FUND COMPLEX OVERSEEN BY TRUSTEE | OTHER TRUSTEE | |||||
| INTERESTED TRUSTEE | ||||||||
Robert M. Keith,# 1345 Avenue of the Americas New York, NY 10105 (2010) | Senior Vice President of AllianceBernstein L.P. (the “Adviser”) and the head of AllianceBernstein Investments, Inc. (“ABI”) since July 2008; Director of ABI and President of the AB Mutual Funds. Previously, he served as Executive Managing Director of ABI from December 2006 to June 2008. Prior to joining ABI in 2006, Executive Managing Director of Bernstein Global Wealth Management, and prior thereto, Senior Managing Director and Global Head of Client Service and Sales of the Adviser’s institutional investment management business since 2004. Prior thereto, he was Managing Director and Head of North American Client Service and Sales in the Adviser’s institutional investment management business with which he had been associated since prior to 2004. | 90 | None | |||||
| abfunds.com | AB IMPACT MUNICIPAL INCOME SHARES | 45 | |
MANAGEMENT OF THE FUND (continued)
NAME, ADDRESS*, AGE AND (YEAR FIRST ELECTED**) | PRINCIPAL OCCUPATION(S), DURING PAST FIVE YEARS AND OTHER INFORMATION*** | PORTFOLIOS IN AB FUND COMPLEX OVERSEEN BY TRUSTEE | OTHER TRUSTEE | |||||
| INDEPENDENT TRUSTEES | ||||||||
| Marshall C. Turner, Jr.,## Chairman of the Board 78 (2005) | Private Investor since prior to 2015. Former Chairman and CEO of Dupont Photomasks, Inc. (components of semi-conductor manufacturing). He has extensive operating leadership, and venture capital investing experience, including five interim or full-time CEO roles, and prior service as general partner of institutional venture capital partnerships. He also has extensive non-profit board leadership experience, and currently serves on the boards of two education and science-related non-profit organizations. He has served as a director of one AB Fund since 1992, and director or trustee of all AB Funds since 2005. He has been Chairman of the AB Funds since January 2014, and the Chairman of the Independent Directors Committees of such AB Funds since February 2014. | 90 | Xilinx, Inc. (programmable logic semi-conductors) since 2007 | |||||
| 46 | AB IMPACT MUNICIPAL INCOME SHARES | abfunds.com | |
MANAGEMENT OF THE FUND (continued)
NAME, ADDRESS*, AGE AND (YEAR FIRST ELECTED**) | PRINCIPAL OCCUPATION(S), DURING PAST FIVE YEARS AND OTHER INFORMATION*** | PORTFOLIOS IN AB FUND COMPLEX OVERSEEN BY TRUSTEE | OTHER TRUSTEE | |||||
| INDEPENDENT TRUSTEES (continued) | ||||||||
| Jorge A. Bermudez,## 69 (2020) | Private investor since prior to 2015. Former Chief Risk Officer of Citigroup, Inc., a global financial services company, from November 2007 to March 2008, Chief Executive Officer of Citigroup’s Commercial Business Group in North America and Citibank Texas from 2005 to 2007, and a variety of other executive and leadership roles at various businesses within Citigroup prior to then; Chairman (2018) of the Texas A&M Foundation Board of Trustees (Trustee since 2013) and Chairman of the Smart Grid Center Board at Texas A&M University since 2012; director of, among others, Citibank N.A. from 2005 to 2008, the Federal Reserve Bank of Dallas, Houston Branch from 2009 to 2011, the Federal Reserve Bank of Dallas from 2011 to 2017, and the Electric Reliability Council of Texas from 2010 to 2016. He has served as director or trustee of the AB Funds since January 2020. | 90 | Moody’s Corporation since April 2011 | |||||
Michael J. Downey,## (2005) | Private Investor since prior to 2015. Formerly, Chairman of The Asia Pacific Fund, Inc. (registered investment company) since prior to 2015 until 2019. From 1987 until 1993, Chairman and CEO of Prudential Mutual Fund Management, director of the Prudential mutual funds, and member of the Executive Committee of Prudential Securities, Inc. He has served as a director or trustee of the AB Funds since 2005. | 90 | None | |||||
| abfunds.com | AB IMPACT MUNICIPAL INCOME SHARES | 47 | |
MANAGEMENT OF THE FUND (continued)
NAME, ADDRESS*, AGE AND (YEAR FIRST ELECTED**) | PRINCIPAL OCCUPATION(S), DURING PAST FIVE YEARS AND OTHER INFORMATION*** | PORTFOLIOS IN AB FUND COMPLEX OVERSEEN BY TRUSTEE | OTHER TRUSTEE | |||||
INDEPENDENT TRUSTEES (continued) | ||||||||
| Nancy P. Jacklin,## 72 (2006) | Private Investor since prior to 2015. Professorial Lecturer at the Johns Hopkins School of Advanced International Studies (2008-2015). U.S. Executive Director of the International Monetary Fund (which is responsible for ensuring the stability of the international monetary system), (December 2002-May 2006); Partner, Clifford Chance (1992-2002); Sector Counsel, International Banking and Finance, and Associate General Counsel, Citicorp (1985-1992); Assistant General Counsel (International), Federal Reserve Board of Governors (1982-1985); and Attorney Advisor, U.S. Department of the Treasury (1973-1982). Member of the Bar of the District of Columbia and of New York; and member of the Council on Foreign Relations. She has served as a director or trustee of the AB Funds since 2006 and has been Chair of the Governance and Nominating Committees of the AB Funds since August 2014. | 90 | None | |||||
| Jeanette Loeb,## 68 (2020) | Chief Executive Officer of PetCareRx (e-commerce pet pharmacy) from 2002 to 2011 and 2015 to present. Director of New York City Center since 2005. She was a director of AB Multi-Manager Alternative Fund, Inc. (fund of hedge funds) from 2012 to 2018. Formerly, affiliated with Goldman Sachs Group, Inc. (financial services) from 1977 to 1994, including as a partner thereof from 1986 to 1994. She has served as a Director of the AB Funds since April 2020. | 90 | Apollo Investment Corp. (business development company) since August 2011 | |||||
| 48 | AB IMPACT MUNICIPAL INCOME SHARES | abfunds.com | |
MANAGEMENT OF THE FUND (continued)
NAME, ADDRESS*, AGE AND (YEAR FIRST ELECTED**) | PRINCIPAL OCCUPATION(S), DURING PAST FIVE YEARS AND OTHER INFORMATION*** | PORTFOLIOS IN AB FUND COMPLEX OVERSEEN BY TRUSTEE | OTHER TRUSTEE | |||||
INDEPENDENT TRUSTEES (continued) | ||||||||
Carol C. McMullen,## 64 | Managing Director of Slalom Consulting (consulting) since 2014, private investor and member of the Advisory Board of Butcher Box (since 2018). Formerly, member, Partners Healthcare Investment Committee (2010-2019); Director of Norfolk & Dedham Group (mutual property and casualty insurance) from 2011 until November 2016; Director of Partners Community Physicians Organization (healthcare) from 2014 until December 2016; and Managing Director of The Crossland Group (consulting) from 2012 until 2013. She has held a number of senior positions in the asset and wealth management industries, including at Eastern Bank (where her roles included President of Eastern Wealth Management), Thomson Financial (Global Head of Sales for Investment Management), and Putnam Investments (where her roles included Chief Investment Officer, Core and Growth and Head of Global Investment Research). She has served on a number of private company and non-profit boards, and as a director or trustee of the AB Funds since June 2016. | 90 | None | |||||
| abfunds.com | AB IMPACT MUNICIPAL INCOME SHARES | 49 | |
MANAGEMENT OF THE FUND (continued)
NAME, ADDRESS*, AGE AND (YEAR FIRST ELECTED**) | PRINCIPAL OCCUPATION(S), DURING PAST FIVE YEARS AND OTHER INFORMATION*** | PORTFOLIOS IN AB FUND COMPLEX OVERSEEN BY TRUSTEE | OTHER TRUSTEE | |||||
INDEPENDENT TRUSTEES (continued) | ||||||||
Garry L. Moody,## (2008) | Private Investor since prior to 2015. Formerly, Partner, Deloitte & Touche LLP (1995-2008) where he held a number of senior positions, including Vice Chairman, and U.S. and Global Investment Management Practice Managing Partner; President, Fidelity Accounting and Custody Services Company (1993-1995), where he was responsible for accounting, pricing, custody and reporting for the Fidelity mutual funds; and Partner, Ernst & Young LLP (1975-1993), where he served as the National Director of Mutual Fund Tax Services and Managing Partner of its Chicago Office Tax department. He is a member of the Trustee Advisory Board of BoardIQ, a biweekly publication focused on issues and news affecting directors of mutual funds. He is also a member of the Investment Company Institute’s Board of Governors and the Independent Directors Council Governing Council. He has served as a director or trustee, and as Chairman of the Audit Committees, of the AB Funds since 2008. | 90 | None | |||||
| 50 | AB IMPACT MUNICIPAL INCOME SHARES | abfunds.com | |
MANAGEMENT OF THE FUND (continued)
NAME, ADDRESS*, AGE AND (YEAR FIRST ELECTED**) | PRINCIPAL OCCUPATION(S), DURING PAST FIVE YEARS AND OTHER INFORMATION*** | PORTFOLIOS IN AB FUND COMPLEX OVERSEEN BY TRUSTEE | OTHER TRUSTEE | |||||
INDEPENDENT TRUSTEES (continued) | ||||||||
| Earl D. Weiner,## 80 (2007) | Senior Counsel since 2017, Of Counsel from 2007 to 2016, and Partner prior to then, of the law firm Sullivan & Cromwell LLP. He is a former member of the ABA Federal Regulation of Securities Committee Task Force to draft editions of the Fund Director’s Guidebook. He also serves as a director or trustee of various non-profit organizations and has served as Chairman or Vice Chairman of a number of them. He has served as a director or trustee of the AB Funds since 2007 and served as Chairman of the Governance and Nominating Committees of the AB Funds from 2007 until August 2014. | 90 | None | |||||
| * | The address for each of the Company’s independent Trustees is c/o AllianceBernstein L.P., Attention: Legal and Compliance Department – Mutual Fund Legal, 1345 Avenue of the Americas, New York, NY 10105. |
| ** | There is no stated term of office for the Trustees. |
| *** | The information above includes each Trustee’s principal occupation during the last five years and other information relating to the experience, attributes, and skills relevant to each Trustee’s qualifications to serve as a Trustee, which led to the conclusion that each Trustee should serve as a Trustee for the Trust. |
| # | Mr. Keith is an “interested person” of the Trust, as defined in the 1940 Act, due to his position as a Senior Vice President of the Adviser. |
| ## | Member of the Audit Committee, the Governance and Nominating Committee, and the Independent Directors Committee. |
| abfunds.com | AB IMPACT MUNICIPAL INCOME SHARES | 51 | |
MANAGEMENT OF THE FUND (continued)
Officer Information
Certain information concerning the Fund’s Officers is listed below.
| NAME, ADDRESS* AND AGE | POSITION(S) HELD WITH FUND | PRINCIPAL OCCUPATION DURING PAST 5 YEARS | ||
Robert M. Keith 60 | President and Chief Executive Officer | See biography above. | ||
R.B. “Guy” Davidson III^ 59 | Vice President | Senior Vice President of the Adviser**, with which he has been associated since prior to 2015. He is also Chief Investment Officer - Municipal Business. | ||
Eric A. Glass 49 | Vice President | Senior Vice President of the Adviser**, with which he has been associated since prior to 2015. | ||
Matthew J. Norton 37 | Vice President | Senior Vice President of the Adviser**, with which he has been associated since prior to 2015. He is also Co-Head — Municipal Portfolio Management. | ||
Emilie D. Wrapp 64 | Secretary | Senior Vice President, Assistant General Counsel and Assistant Secretary of ABI**, with which she has been associated since prior to 2015. | ||
Michael B. Reyes 43 | Senior Analyst | Vice President of the Adviser**, with which he has been associated since prior to 2015. | ||
Joseph J. Mantineo 61 | Treasurer and Chief Financial Officer | Senior Vice President of AllianceBernstein Investor Services, Inc. (“ABIS”)**, with which he has been associated since prior to 2015. | ||
Phyllis J. Clarke 59 | Controller | Vice President of ABIS**, with which she has been associated since prior to 2015. | ||
Vincent S. Noto 55 | Chief Compliance Officer | Senior Vice President since 2015 and Mutual Fund Chief Compliance Officer of the Adviser** since prior to 2015. |
| * | The address for each of the Portfolio’s Officers is 1345 Avenue of the Americas, New York, NY 10105. |
| ** | The Adviser, ABI and ABIS are affiliates of the Trust. |
| ^ | Mr. Davidson is expected to retire from the Adviser effective December 30, 2020. |
The Trust’s Statement of Additional Information (“SAI”) has additional information about the Trust’s Trustees and Officers and is available without charge upon request. Contact your financial representative or ABI at (800) 227-4618, or visit, www.abfunds.com. for a free prospectus or SAI.
| 52 | AB IMPACT MUNICIPAL INCOME SHARES | abfunds.com | |
Operation and Effectiveness of the Fund’s Liquidity Risk Management Program:
In October 2016, the Securities and Exchange Commission (“SEC”) adopted the open-end fund liquidity rule (the “Liquidity Rule”). In June 2018 the SEC adopted a requirement that funds disclose information about the operation and effectiveness of their Liquidity Risk Management Program (“LRMP”) in their reports to shareholders.
One of the requirements of the Liquidity Rule is for the Fund to designate an Administrator of the Fund’s Liquidity Risk Management Program. The Administrator of the Fund’s LRMP is AllianceBernstein L.P., the Fund’s investment adviser (the “Adviser”). The Adviser has delegated the responsibility to its Liquidity Risk Management Committee (the “Committee”). Another requirement of the Liquidity Rule is for the Fund’s Board of Directors (the “Fund Board”) to receive an annual written report from the Administrator of the LRMP, which addresses the operation of the Fund’s LRMP and assesses its adequacy and effectiveness. The Adviser provided the Fund’s Board with such annual report during the first quarter of 2020, which covered the period December 1, 2018 through December 31, 2019 (the “Program Reporting Period”).
The LRMP’s principal objectives include supporting the Fund’s compliance with limits on investments in illiquid assets and mitigating the risk that the Fund will be unable to meet its redemption obligations in a timely manner. Pursuant to the LRMP, the Fund classifies the liquidity of its portfolio investments into one of the four categories defined by the SEC: Highly Liquid, Moderately Liquid, Less Liquid, and Illiquid. These classifications are reported to the SEC on Form N-PORT.
During the Program Reporting Period, the Committee reviewed whether the Fund’s strategy is appropriate for an open-end structure, taking into account any holdings of less liquid and illiquid assets. The Committee also performed an analysis to determine whether the Fund is required to maintain a Highly Liquid Investment Minimum (“HLIM”). If the Fund participated in derivative transactions, the exposure from such transactions were considered in the LRMP. The Committee also incorporated the following information when determining the Fund’s reasonably anticipated trading size for purposes of liquidity monitoring: historical net redemption activity, a Fund’s concentration in an issuer, shareholder concentration, investment performance, total net assets, and distribution channels.
The Adviser informed the Fund Board that the Committee believes the Fund’s LRMP is adequately designed, has been implemented as intended, and has operated effectively since its inception. No material exceptions have been noted since the implementation of the LRMP, and there were no liquidity events that impacted the Fund or its ability to timely meet redemptions during the Program Reporting Period.
| abfunds.com | AB IMPACT MUNICIPAL INCOME SHARES | 53 | |
Information Regarding the Review and Approval of the Fund’s Advisory Agreement
The disinterested trustees (the “directors”) of AB Corporate Shares (the “Company”) unanimously approved the continuance of the Company’s Advisory Agreement with the Adviser in respect of AB Impact Municipal Income Shares (the “Fund”) at a meeting held on November 4-6, 2019 (the “Meeting”).*
Prior to approval of the continuance of the Advisory Agreement, the directors had requested from the Adviser, and received and evaluated, extensive materials. They reviewed the proposed continuance of the Advisory Agreement with the Adviser and with experienced counsel who are independent of the Adviser, who advised on the relevant legal standards. The directors also reviewed additional materials, including comparative analytical data prepared by the Senior Analyst for the Fund. The directors also discussed the proposed continuance in private sessions with counsel.
The directors noted that the Fund is designed as a vehicle for the wrap fee account market (where investors pay fees to a wrap fee sponsor which pays investment fees and expenses from such fee). The directors also noted that no advisory fee is payable by the Fund, that the Advisory Agreement does not include the reimbursement provision for certain administrative expenses included in the advisory agreements of most of the open-end AB Funds, and that the Adviser is responsible for payment of the Fund’s ordinary expenses. The directors noted that the Company acknowledges in the Advisory Agreement that the Adviser and its affiliates expect to receive compensation from third parties in connection with services provided under the Advisory Agreement. The directors further noted that the Adviser receives payments from the wrap fee program sponsors (the “Sponsors”) that use the Fund as an investment vehicle for their clients.
The directors considered their knowledge of the nature and quality of the services provided by the Adviser to the Fund gained from their experience as directors or trustees of most of the registered investment companies advised by the Adviser, their overall confidence in the Adviser’s integrity and competence they have gained from that experience, the Adviser’s initiative in identifying and raising potential issues with the directors and its responsiveness, frankness and attention to concerns raised by the directors in the past, including the Adviser’s willingness to consider and implement organizational and operational changes designed to improve investment results and the services provided to the AB Funds. The directors noted that they have four regular meetings each year, at each of which they review extensive materials and information from the Adviser, including information on the investment performance of the Fund and the underlying fund advised by the Adviser in which the Fund invests.
| * | Following transactions completed on November 13, 2019 that may have been deemed to have been an “assignment” causing termination of the Fund’s investment advisory agreement, a new investment advisory agreement, having the same terms as the prior one, was entered into by the Fund and the Adviser. |
| 54 | AB IMPACT MUNICIPAL INCOME SHARES | abfunds.com | |
The directors also considered all factors they believed relevant, including the specific matters discussed below. During the course of their deliberations, the directors evaluated, among other things, the reasonableness of the advisory fee. The directors did not identify any particular information that was all-important or controlling, and different directors may have attributed different weights to the various factors. The directors determined that the selection of the Adviser to manage the Fund and the overall arrangements between the Fund and the Adviser, as provided in the Advisory Agreement, including the advisory fee, were fair and reasonable in light of the services performed, expenses incurred and such other matters as the directors considered relevant in the exercise of their business judgment. The material factors and conclusions that formed the basis for the directors’ determinations included the following:
Nature, Extent and Quality of Services Provided
The directors considered the scope and quality of services provided by the Adviser under the Advisory Agreement, including the quality of the investment research capabilities of the Adviser and the other resources it has dedicated to performing services for the Fund. The directors noted that the Adviser from time to time reviews the Fund’s investment strategies and from time to time proposes changes intended to improve the Fund’s relative or absolute performance for the directors’ consideration. They also noted the professional experience and qualifications of the Fund’s portfolio management team and other senior personnel of the Adviser. The quality of administrative and other services, including the Adviser’s role in coordinating the activities of the Fund’s other service providers, also was considered. The directors concluded that, overall, they were satisfied with the nature, extent and quality of services provided to the Fund under the Advisory Agreement.
Costs of Services Provided and Profitability
The directors reviewed a schedule of the revenues and expenses and related notes indicating the profitability of the Fund to the Adviser for the period ended December 31, 2017 and calendar year 2018 that had been prepared with an expense allocation methodology arrived at in consultation with an independent consultant retained by the Fund’s former Senior Officer/Independent Compliance Officer. The directors noted the assumptions and methods of allocation used by the Adviser in preparing fund-specific profitability data and understood that there are a number of potentially acceptable allocation methodologies for information of this type. The directors noted that the profitability information reflected all revenues and expenses of the Adviser’s relationship with the Fund. The directors recognized that it is difficult to make comparisons of the profitability of the Advisory Agreement with the profitability of fund advisory contracts for unaffiliated funds because comparative information is not generally publicly available and is affected by numerous factors. The directors focused on the profitability of the Adviser’s relationship with the Fund before taxes and
| abfunds.com | AB IMPACT MUNICIPAL INCOME SHARES | 55 | |
distribution expenses. The directors noted that the Fund was not profitable to the Adviser in the periods reviewed.
Fall-Out Benefits
The directors considered the other benefits to the Adviser and its affiliates from their relationships with the Fund and the underlying fund advised by the Adviser in which the Fund invests. The directors noted that the Adviser is compensated by the Sponsors. The directors understood that the Adviser also might derive reputational and other benefits from its association with the Fund.
Investment Results
In addition to the information reviewed by the directors in connection with the Meeting, the directors receive detailed performance information for the Fund at each regular Board meeting during the year.
At the Meeting, the directors reviewed performance information prepared by an independent service provider (the “15(c) service provider”), showing the performance of the Fund against a group of similar funds (“peer group”) and a larger group of similar funds (“peer universe”), each selected by the 15(c) service provider, and information prepared by the Adviser showing the Fund’s performance against a broad-based securities market index, in each case for the 1-year period ended July 31, 2019 and (in the case of comparisons with the broad-based securities market index) for the period from inception. The directors were cognizant that the Fund was neither designed nor offered as a standalone investment and was intended to serve solely as a component of certain separately managed accounts (“SMAs”). The Adviser had explained that this attribute made it difficult to select an appropriate benchmark for the Fund. At the directors’ request, the Adviser provided information showing the weighting of the Fund in a current SMA and the overall performance of the SMA versus its stated benchmark. Based on their review, the directors concluded that the Fund’s investment performance was acceptable.
Advisory Fees
The directors considered the advisory fee rate payable by the Fund to the Adviser (zero) and information provided by the 15(c) service provider showing the fees payable by other fund families used in wrap fee programs similar to that of the Fund. The directors recognized that it is difficult to make comparisons of advisory fees because there are variations in the services that are included in the fees payable by other funds.
The directors noted the unusual arrangements in the Advisory Agreement providing for no advisory fee but were cognizant that the Adviser is indirectly compensated by the Sponsors for its services to the Fund. The directors reviewed the fee arrangements between the Adviser and each of the current Sponsors and noted that such fees were negotiated on an
| 56 | AB IMPACT MUNICIPAL INCOME SHARES | abfunds.com | |
arm’s length basis and were within the range of fees paid by wrap fee sponsors to other advisers of similar funds. While the Adviser’s fee arrangements with the Sponsors vary, the directors acknowledged the Adviser’s view that a portion of such fees (less the expenses of the Fund paid by the Adviser) may reasonably be viewed as compensating the Adviser for advisory services it provides to the Fund (the “implied fee”) and that the Adviser believes that while the Sponsors pay the Adviser different fee rates, the rate of fee attributable to Fund management at the Fund level is the same for all Sponsors. The directors also considered the fee rate schedules used by other registered investment companies that invest in fixed income securities that are advised by the Adviser.
The Adviser informed the directors that there were no institutional products managed by the Adviser that utilize investment strategies similar to those of the Fund.
The directors noted that the Fund may invest in shares of exchange-traded funds (“ETFs”), subject to the restrictions and limitations of the Investment Company Act of 1940 as these may be varied as a result of exemptive orders issued by the SEC. The directors also noted that ETFs pay advisory fees pursuant to their advisory contracts. The directors concluded, based on the Adviser’s explanation of how it uses ETFs when they are the most cost-effective way to obtain desired exposures, in some cases pending purchases of underlying securities, that the advisory fee for the Fund would be for services in addition to, rather than duplicative of, the services provided under the advisory contracts of the ETFs.
The directors did not consider comparative expense information for the Fund because the Fund does not bear ordinary expenses.
Economies of Scale
The directors did not consider the extent to which fee levels in the Advisory Agreement for the Fund reflect economies of scale because the Advisory Agreement does not provide for any compensation to be paid to the Adviser by the Fund and the Fund’s expense ratio is zero. They did note, however, that the fee payable to the Adviser by the current Sponsors declines at a breakpoint based on either individual account sizes or on total assets managed by the Adviser for the Sponsor.
| abfunds.com | AB IMPACT MUNICIPAL INCOME SHARES | 57 | |
This page is not part of the Shareholder Report or the Financial Statements.
AB FAMILY OF FUNDS
US EQUITY
CORE
Core Opportunities Fund
FlexFee™ US Thematic Portfolio
Select US Equity Portfolio
GROWTH
Concentrated Growth Fund
Discovery Growth Fund
FlexFee™ Large Cap Growth Portfolio
Growth Fund
Large Cap Growth Fund
Small Cap Growth Portfolio
VALUE
Discovery Value Fund
Equity Income Fund
Relative Value Fund
Small Cap Value Portfolio
Value Fund
INTERNATIONAL/ GLOBAL EQUITY
CORE
FlexFee™ International Strategic Core Portfolio
Global Core Equity Portfolio
International Portfolio
International Strategic Core Portfolio
Sustainable Global Thematic Fund
Tax-Managed International Portfolio
Tax-Managed Wealth Appreciation Strategy
Wealth Appreciation Strategy
INTERNATIONAL/ GLOBAL EQUITY (continued)
GROWTH
Concentrated International Growth Portfolio
FlexFee™ Emerging Markets Growth Portfolio
Sustainable International Thematic Fund
VALUE
All China Equity Portfolio
International Value Fund
FIXED INCOME
MUNICIPAL
High Income Municipal Portfolio
Intermediate California Municipal Portfolio
Intermediate Diversified Municipal Portfolio
Intermediate New York Municipal Portfolio
Municipal Bond Inflation Strategy
Tax-Aware Fixed Income Opportunities Portfolio1
National Portfolio
Arizona Portfolio
California Portfolio
Massachusetts Portfolio
Minnesota Portfolio
New Jersey Portfolio
New York Portfolio
Ohio Portfolio
Pennsylvania Portfolio
Virginia Portfolio
FIXED INCOME (continued)
TAXABLE
Bond Inflation Strategy
FlexFee™ High Yield Portfolio
FlexFee™ International Bond Portfolio
Global Bond Fund
High Income Fund
Income Fund
Intermediate Duration Portfolio
Limited Duration High Income Portfolio
Short Duration Income Portfolio
Short Duration Portfolio
Total Return Bond Portfolio1
ALTERNATIVES
All Market Real Return Portfolio
Global Real Estate Investment Fund
Select US Long/Short Portfolio
Unconstrained Bond Fund
MULTI-ASSET
All Market Income Portfolio
All Market Total Return Portfolio
Conservative Wealth Strategy
Emerging Markets Multi-Asset Portfolio
Global Risk Allocation Fund
Tax-Managed All Market Income Portfolio
CLOSED-END FUNDS
AllianceBernstein Global High Income Fund
AllianceBernstein National Municipal Income Fund
We also offer Government Money Market Portfolio, which serves as the money market fund exchange vehicle for the AB mutual funds. You could lose money by investing in the Fund. Although the Fund seeks to preserve the value of your investment at $1.00 per share, it cannot guarantee it will do so. The Fund may impose a fee upon sale of your shares or may temporarily suspend your ability to sell shares if the Fund’s liquidity falls below required minimums because of market conditions or other factors. An investment in the Fund is not insured or guaranteed by the Federal Deposit Insurance Corporation or any other government agency. The Fund’s sponsor has no legal obligation to provide financial support to the Fund, and you should not expect that the sponsor will provide financial support to the Fund at any time.
Investors should consider the investment objectives, risks, charges and expenses of the Fund carefully before investing. For copies of our prospectus or summary prospectus, which contain this and other information, visit us online at www.abfunds.com or contact your AB representative. Please read the prospectus and/or summary prospectus carefully before investing.
| 1 | Prior to July 12, 2019, Total Return Bond Portfolio was named Intermediate Bond Portfolio; prior to February 5, 2020, Tax-Aware Fixed Income Opportunities Portfolio was named Tax-Aware Fixed Income Portfolio. |
| 58 | AB IMPACT MUNICIPAL INCOME SHARES | abfunds.com | |
NOTES
| abfunds.com | AB IMPACT MUNICIPAL INCOME SHARES | 59 | |
NOTES
| 60 | AB IMPACT MUNICIPAL INCOME SHARES | abfunds.com | |
AB IMPACT MUNICIPAL INCOME SHARES
1345 Avenue of the Americas
New York, NY 10105
800 221 5672
IMISH-0151-0420 
APR 04.30.20

ANNUAL REPORT
AB MUNICIPAL INCOME SHARES

Beginning January 1, 2021, as permitted by new regulations adopted by the Securities and Exchange Commission, the Fund’s annual and semi-annual shareholder reports will no longer be sent by mail, unless you specifically request paper copies of the reports. Instead, the reports will be made available on a website, and you will be notified by mail each time a report is posted and provided with a website address to access the report.
If you already elected to receive shareholder reports electronically, you will not be affected by this change and you need not take any action. You may elect to receive shareholder reports and other communications from the Fund electronically at any time by contacting your financial intermediary (such as a broker-dealer or bank) or, if you are a direct investor, by calling the Fund at (800) 221 5672.
You may elect to receive all future reports in paper form free of charge. If you invest through a financial intermediary, you can contact your financial intermediary to request that you continue to receive paper copies of your shareholder reports; if you invest directly with the Fund, you can call the Fund at (800) 221 5672. Your election to receive reports in paper form will apply to all funds held in your account with your financial intermediary or, if you invest directly, to all AB Mutual Funds you hold.
| Investment Products Offered | • Are Not FDIC Insured • May Lose Value • Are Not Bank Guaranteed | |
Investors should consider the investment objectives, risks, charges and expenses of the Fund carefully before investing. For copies of our prospectus or summary prospectus, which contain this and other information, visit us online at www.abfunds.com or contact your AB representative. Please read the prospectus and/or summary prospectus carefully before investing.
This shareholder report must be preceded or accompanied by the Fund’s prospectus for individuals who are not current shareholders of the Fund.
You may obtain a description of the Fund’s proxy voting policies and procedures, and information regarding how the Fund voted proxies relating to portfolio securities during the most recent 12-month period ended June 30, without charge. Simply visit AB’s website at www.abfunds.com, or go to the Securities and Exchange Commission’s (the “Commission”) website at www.sec.gov, or call AB at (800) 227 4618.
The Fund files its complete schedule of portfolio holdings with the Commission for the first and third quarters of each fiscal year as an exhibit to its reports on Form N-PORT. The Fund’s Form N-PORT reports are available on the Commission’s website at www.sec.gov. The Fund’s Forms N-PORT may also be reviewed and copied at the Commission’s Public Reference Room in Washington, DC; information on the operation of the Public Reference Room may be obtained by calling (800) SEC 0330. AB publishes full portfolio holdings for the Fund monthly at www.abfunds.com.
AllianceBernstein Investments, Inc. (ABI) is the distributor of the AB family of mutual funds. ABI is a member of FINRA and is an affiliate of AllianceBernstein L.P., the Adviser of the funds.
The [A/B] logo is a registered service mark of AllianceBernstein and AllianceBernstein® is a registered service mark used by permission of the owner, AllianceBernstein L.P.
| FROM THE PRESIDENT |  |
Dear Shareholder,
We are pleased to provide this report for AB Municipal Income Shares (the “Fund”). Please review the discussion of Fund performance, the market conditions during the reporting period and the Fund’s investment strategy.
As always, AB strives to keep clients ahead of what’s next by:
| + | Transforming uncommon insights into uncommon knowledge with a global research scope |
| + | Navigating markets with seasoned investment experience and sophisticated solutions |
| + | Providing thoughtful investment insights and actionable ideas |
Whether you’re an individual investor or a multi-billion-dollar institution, we put knowledge and experience to work for you.
AB’s global research organization connects and collaborates across platforms and teams to deliver impactful insights and innovative products. Better insights lead to better opportunities—anywhere in the world.
For additional information about AB’s range of products and shareholder resources, please log on to www.abfunds.com.
Thank you for your investment in the AB Mutual Funds.
Sincerely,

Robert M. Keith
President and Chief Executive Officer, AB Mutual Funds
| abfunds.com | AB MUNICIPAL INCOME SHARES | 1 | |
ANNUAL REPORT
June 11, 2020
This report provides management’s discussion of fund performance for AB Municipal Income Shares for the annual reporting period ended April 30, 2020. Please note, shares of this Fund are available only to separately managed accounts or participants in “wrap fee” programs or other investment programs approved by the Adviser.
The investment objective of the Fund is to earn the highest level of current income, exempt from federal taxation, that is available consistent with what the Adviser considers to be an appropriate level of risk.
NAV RETURNS AS OF APRIL 30, 2020 (unaudited)
| 6 Months | 12 Months | |||||||
| AB MUNICIPAL INCOME SHARES | -8.87% | -4.23% | ||||||
| Bloomberg Barclays Municipal Bond Index | -1.33% | 2.16% | ||||||
INVESTMENT RESULTS
The table above shows the Fund’s performance compared to its benchmark, the Bloomberg Barclays Municipal Bond Index, for the six- and 12-month periods ended April 30, 2020.
The Fund underperformed the benchmark for both periods. The Fund is generally used to provide exposure to lower-rated municipal bonds and longer-duration bonds within separately managed account strategies. The Fund is overweight lower-rated (non-investment grade) bonds relative to the benchmark, which is fully composed of investment-grade bonds. This overweight was detrimental over both periods. The Fund is overweight long-duration bonds relative to the benchmark. This overweight detracted over both periods as yields for shorter-duration bonds declined relative to long-duration bonds.
For both periods, an overweight to the senior living sector and security selection within the state general obligation bond sector detracted, relative to the benchmark. Underweights to the airport and state lease-backed sectors contributed. During the 12-month period, security selection in utilities contributed. For the six-month period, the Fund’s overweight to four- to five-year duration municipals, relative to slightly longer- or shorter-duration bonds, contributed.
The Fund utilized derivatives for hedging purposes in the form of consumer price index swaps, which detracted from absolute performance for both periods, and interest rate swaps, which added for both periods.
| 2 | AB MUNICIPAL INCOME SHARES | abfunds.com | |
MARKET REVIEW AND INVESTMENT STRATEGY
Themes of strong demand, light supply and supportive credit fundamentals were prominent until the last couple months of the 12-month period ended April 30, 2020. In March, these themes sharply reversed and volatility spiked dramatically. The novel coronavirus pandemic quickly led to the increase in market volatility and to a sharp economic contraction. In this environment, investors fled to cash from nearly every other type of investment, and stocks and bonds fell dramatically. The municipal bond market was not spared; after 60 consecutive weeks of inflows, municipal bond funds had record outflows. Municipals had shown strong absolute and relative performance prior to March, with yields declining 0.8% to over 1% depending on the maturity since April of 2019. In March, open-end funds had to sell vast quantities of bonds to meet shareholder redemptions, and this selling contributed to yields rising over 2% in less than two weeks. The municipal market did recover toward the end of March and into April as investor demand returned following the actions taken by the US Federal Reserve to address market liquidity and the passing of the Coronavirus Aid, Relief, and Economic Security Act, which included direct aid to municipalities. As a result, after the large moves during both periods, yields for high-grade municipal bonds ended lower for the 12-month period by 0.3% to 0.7%, with yields for shorter-maturity bonds declining more; for the six-month period, longer-maturity municipal yields were higher by about 0.15% and shorter-maturity bonds declined by about 0.3%. Over both the six- and 12-month periods, the additional yield provided by more credit-sensitive bonds increased.
The Fund’s Senior Investment Management Team relies on an investment process that combines quantitative and fundamental research to build effective municipal bond portfolios.
The Fund may purchase municipal securities that are insured under policies issued by certain insurance companies. Historically, insured municipal securities typically received a higher credit rating, which meant that the issuer of the securities paid a lower interest rate. As a result of declines in the credit quality and associated downgrades of most bond insurers, insurance has less value than it did in the past. The market now values insured municipal securities primarily based on the credit quality of the issuer of the security with little value given to the insurance feature. In purchasing such insured securities, the Adviser evaluates the risk and return of municipal securities through its own research. If an insurance company’s rating is downgraded or the company becomes insolvent, the prices of municipal securities insured by the insurance company may decline. As of April 30, 2020, the Fund’s percentages of investments in municipal bonds that are insured and in insured municipal bonds that have been pre-refunded or escrowed to maturity were 2.90% and 0.05%, respectively.
| abfunds.com | AB MUNICIPAL INCOME SHARES | 3 | |
INVESTMENT POLICIES
The Fund pursues its objective by investing principally in high-yielding municipal securities that may be non-investment grade or investment-grade. As a matter of fundamental policy, the Fund invests, under normal circumstances, at least 80% of its net assets in municipal securities that pay interest that is exempt from federal income tax. These securities may pay interest that is subject to the federal alternative minimum tax for certain taxpayers.
The Adviser selects securities for purchase or sale based on its assessment of the securities’ risk and return characteristics as well as the securities’ impact on the overall risk and return characteristics of the Fund. In making this assessment, the Adviser takes into account various factors, including the credit quality and sensitivity to interest rates of the securities under consideration and of the Fund’s other holdings.
The Fund may invest without limit in lower-rated securities (“junk bonds”), which may include securities having the lowest rating, and in unrated securities that, in the Adviser’s judgment, would be lower-rated securities if rated. The Fund may invest in fixed-income securities with any maturity or duration. The Fund will seek to increase income for shareholders by investing in longer maturity bonds. Consistent with its objective of seeking a higher level of income, the Fund may experience greater volatility and a higher risk of loss of principal than other municipal funds.
The Fund may also invest in tender option bond transactions (“TOBs”); forward commitments; zero-coupon municipal securities and variable, floating and inverse floating-rate municipal securities; certain types of mortgage-related securities; and derivatives, such as options, futures contracts, forwards and swaps.
The Fund may make short sales of securities or maintain a short position, and may use other investment techniques. The Fund may use leverage for investment purposes to increase income through the use of TOBs and derivative instruments, such as interest rate swaps.
| 4 | AB MUNICIPAL INCOME SHARES | abfunds.com | |
DISCLOSURES AND RISKS
Benchmark Disclosure
The Bloomberg Barclays Municipal Bond Index is unmanaged and does not reflect fees and expenses associated with the active management of a fund. The Bloomberg Barclays Municipal Bond Index represents the performance of the long-term tax-exempt bond market consisting of investment-grade bonds. An investor cannot invest directly in an index, and its results are not indicative of the performance for any specific investment, including the Fund.
A Word About Risk
Market Risk: The market value of a security may move up or down, sometimes rapidly and unpredictably. These fluctuations may cause a security to be worth less than the price originally paid for it, or less than it was worth at an earlier time. Market risk may affect a single issuer, industry, sector of the economy or the market as a whole. Global economies and financial markets are increasingly interconnected, which increases the probabilities that conditions in one country or region might adversely impact issuers in a different country or region. Conditions affecting the general economy, including political, social, or economic instability at the local, regional, or global level may also affect the market value of a security. Health crises, such as pandemic and epidemic diseases, as well as other incidents that interrupt the expected course of events, such as natural disasters, war or civil disturbance, acts of terrorism, power outages and other unforeseeable and external events, and the public response to or fear of such diseases or events, have and may in the future have an adverse effect on the Fund’s investments and net asset value and can lead to increased market volatility. For example, any preventative or protective actions that governments may take in respect of such diseases or events may result in periods of business disruption, inability to obtain raw materials, supplies and component parts, and reduced or disrupted operations for the Fund’s portfolio companies. The occurrence and pendency of such diseases or events could adversely affect the economies and financial markets either in specific countries or worldwide.
Credit Risk: An issuer or guarantor of a fixed-income security, or the counterparty to a derivatives or other contract, may be unable or unwilling to make timely payments of interest or principal, or to otherwise honor its obligations. The issuer or guarantor may default, causing a loss of the full principal amount of a security and any accrued interest. The degree of risk for a particular security may be reflected in its credit rating. There is the possibility that the credit rating of a fixed-income security may be downgraded after purchase, which may adversely affect the value of the security. Investments in fixed-income securities with lower ratings tend to have a higher probability that an issuer will default or fail to meet its payment obligations.
| abfunds.com | AB MUNICIPAL INCOME SHARES | 5 | |
DISCLOSURES AND RISKS (continued)
Municipal Market Risk: This is the risk that special factors may adversely affect the value of municipal securities and have a significant effect on the yield or value of the Fund’s investments in municipal securities. These factors include economic conditions, political or legislative changes, uncertainties related to the tax status of municipal securities, or the rights of investors in these securities. To the extent that the Fund invests more of its assets in a particular state’s municipal securities, the Fund may be vulnerable to events adversely affecting that state, including economic, political and regulatory occurrences, court decisions, terrorism and catastrophic natural disasters, such as hurricanes or earthquakes. The Fund’s investments in certain municipal securities with principal and interest payments that are made from the revenues of a specific project or facility, and not general tax revenues, may have increased risks. Factors affecting the project or facility, such as local business or economic conditions, could have a significant effect on the project’s ability to make payments of principal and interest on these securities.
Congress has previously considered making changes to the municipal securities provisions of the Internal Revenue Code that could change the US federal income tax treatment of certain types of municipal securities.
Tax Risk: There is no guarantee that all of the Fund’s income will remain exempt from federal or state income taxes. From time to time, the US government and the US Congress consider changes in federal tax law that could limit or eliminate the federal tax exemption for municipal bond income, which would in effect reduce the income received by shareholders from the Fund by increasing taxes on that income. In such event, the Fund’s net asset value (“NAV”) could also decline as yields on municipal bonds, which are typically lower than those on taxable bonds, would be expected to increase to approximately the yield of comparable taxable bonds. Actions or anticipated actions affecting the tax-exempt status of municipal bonds could also result in significant shareholder redemptions of Fund shares as investors anticipate adverse effects on the Fund or seek higher yields to offset the potential loss of the tax deduction. As a result, the Fund would be required to maintain higher levels of cash to meet the redemptions, which would negatively affect the Fund’s yield. The federal income tax treatment of payments in respect of certain derivative contracts is unclear.
Below Investment-Grade Securities Risk: Investments in fixed-income securities with lower ratings (commonly known as “junk bonds”) tend to have a higher probability that an issuer will default or fail to meet its payment obligations. These securities may be subject to greater price volatility due to such factors as specific corporate developments, interest-rate sensitivity and negative perceptions of the junk bond market generally and may be more difficult to trade than other types of securities.
| 6 | AB MUNICIPAL INCOME SHARES | abfunds.com | |
DISCLOSURES AND RISKS (continued)
Interest-Rate Risk: Changes in interest rates will affect the value of investments in fixed-income securities. When interest rates rise, the value of existing investments in fixed-income securities tends to fall and this decrease in value may not be offset by higher income from new investments. Interest-rate risk is generally greater for fixed-income securities with longer maturities or durations.
Inflation Risk: This is the risk that the value of assets or income from investments will be less in the future as inflation decreases the value of money. As inflation increases, the value of the Fund’s assets can decline as can the value of the Fund’s distributions. This risk is significantly greater for fixed-income securities with longer maturities.
Leverage Risk: To the extent the Fund uses leveraging techniques, its NAV may be more volatile because leverage tends to exaggerate the effect of changes in interest rates and any increase or decrease in the value of the Fund’s investments.
Illiquid Investments Risk: Illiquid investments risk exists when particular investments, such as lower-rated securities, are or become difficult to purchase or sell, possibly preventing the Fund from selling such investments at an advantageous price. The Fund is subject to illiquid investments risk because the market for municipal securities is generally smaller than many other markets. Derivatives and securities involving substantial market and credit risk tend to involve greater illiquid investments risk than most other types of investments.
Derivatives Risk: Derivatives may be difficult to price or unwind and leveraged so that small changes may produce disproportionate losses for the Fund. Derivatives, especially over-the-counter derivatives, are also subject to counterparty risk.
Management Risk: The Fund is subject to management risk because it is an actively managed investment fund. The Adviser will apply its investment techniques and risk analyses in making investment decisions, but there is no guarantee that its techniques will produce the intended results.
These risks are fully discussed in the Fund’s prospectus. As with all investments, you may lose money by investing in the Fund.
An Important Note About Historical Performance
The performance shown in this report represents past performance and does not guarantee future results. Current performance may be lower or higher than the performance information shown. You may obtain performance information current to the most recent month-end by calling (800) 227 4618. The investment return and
| abfunds.com | AB MUNICIPAL INCOME SHARES | 7 | |
DISCLOSURES AND RISKS (continued)
principal value of an investment in the Fund will fluctuate, so that your shares, when redeemed, may be worth more or less than their original cost. Performance assumes reinvestment of distributions and does not account for taxes.
Investors should consider the investment objectives, risks, charges and expenses of the Fund carefully before investing. For copies of our prospectus and/or summary prospectus, which contain this and other information, visit us online at www.abfunds.com or contact your AllianceBernstein Investments representative. Please read the prospectus and/or summary prospectus carefully before investing.
| 8 | AB MUNICIPAL INCOME SHARES | abfunds.com | |
HISTORICAL PERFORMANCE
GROWTH OF A $10,000 INVESTMENT IN THE FUND (unaudited)
9/1/20101 TO 4/30/2020
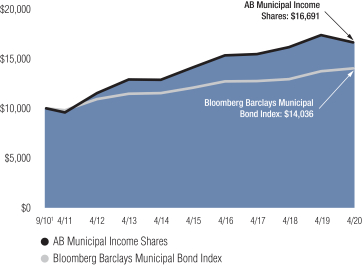
This chart illustrates the total value of an assumed $10,000 investment in AB Municipal Income Shares (from 9/1/20101 to 4/30/2020) as compared to the performance of its benchmark. The chart assumes the reinvestment of dividends and capital gains distributions.
| 1 | Inception date: 9/1/2010. |
| abfunds.com | AB MUNICIPAL INCOME SHARES | 9 | |
HISTORICAL PERFORMANCE (continued)
AVERAGE ANNUAL RETURNS AS OF APRIL 30, 2020 (unaudited)
| NAV Returns | ||||
| 1 Year | -4.23% | |||
| 5 Years | 3.37% | |||
| Since Inception1 | 5.45% | |||
AVERAGE ANNUAL RETURNS
AS OF THE MOST RECENT CALENDAR QUARTER-END
MARCH 31, 2020 (unaudited)
| NAV Returns | ||||
| 1 Year | -1.15% | |||
| 5 Years | 3.82% | |||
| Since Inception1 | 5.78% | |||
The prospectus fee table shows the fees and the total operating expenses of the Fund as 0.01% because the Adviser does not charge any fees or expenses and reimburses Fund operating expenses except certain extraordinary expenses, taxes, brokerage costs and the interest on borrowings or certain leveraged transactions. Participants in a wrap fee program or other investment program eligible to invest in the Fund pay fees to the program sponsor and should review the program brochure or other literature provided by the sponsor for a discussion of fees and expenses charged.
| 1 | Inception date: 9/1/2010. |
| 10 | AB MUNICIPAL INCOME SHARES | abfunds.com | |
EXPENSE EXAMPLE
(unaudited)
As a shareholder of the Fund, you may incur various ongoing non-operating and extraordinary costs. This example is intended to help you understand your ongoing costs (in dollars) of investing in the Fund and to compare these costs with the ongoing costs of investing in other mutual funds.
The Example is based on an investment of $1,000 invested at the beginning of the period and held for the entire period as indicated below.
Actual Expenses
The table below provides information about actual account values and actual expenses. You may use the information in this line, together with the amount you invested, to estimate the expenses that you paid over the period. Simply divide your account value by $1,000 (for example, an $8,600 account value divided by $1,000 = 8.6), then multiply the result by the number in the first line under the heading entitled “Expenses Paid During Period” to estimate the expenses you paid on your account during this period.
Hypothetical Example for Comparison Purposes
The table below provides information about hypothetical account values and hypothetical expenses based on the Fund’s actual expense ratio and an assumed annual rate of return of 5% before expenses, which is not the Fund’s actual return. The hypothetical account values and expenses may not be used to estimate the actual ending account balance or expenses you paid for the period. You may use this information to compare the ongoing costs of investing in the Fund and other funds by comparing this 5% hypothetical example with the 5% hypothetical examples that appear in the shareholder reports of other funds.
Please note that the expenses shown in the table are meant to highlight your ongoing costs only and do not reflect any transactional costs, such as sales charges (loads), or contingent deferred sales charges on redemptions. Therefore, the hypothetical example is useful in comparing ongoing costs only, and will not help you determine the relative total costs of owning different funds. In addition, if these transactional costs were included, your costs would have been higher.
| Beginning Account Value November 1, 2019 | Ending Account Value April 30, 2020 | Expenses Paid During Period* | Annualized Expense Ratio* | |||||||||||||
Actual | $ | 1,000 | $ | 911.30 | $ | 0.05 | 0.01 | % | ||||||||
Hypothetical** | $ | 1,000 | $ | 1,024.81 | $ | 0.05 | 0.01 | % | ||||||||
| * | Expenses are equal to the Fund’s annualized expense ratio (interest expense incurred) multiplied by the average account value over the period, multiplied by 182/366 (to reflect the one-half year period). The Fund’s operating expenses are borne by the Adviser or its affiliates. |
| ** | Assumes 5% annual return before expenses. |
| abfunds.com | AB MUNICIPAL INCOME SHARES | 11 | |
PORTFOLIO SUMMARY
April 30, 2020 (unaudited)
PORTFOLIO STATISTICS
Net Assets ($mil): $4,685.9
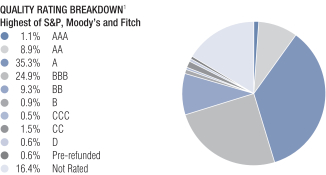
| 1 | All data are as of April 30, 2020. The Fund’s quality rating breakdown is expressed as a percentage of the Fund’s total investments in municipal securities and may vary over time. The Fund also enters into derivative transactions, which may be used for hedging or investment purposes (see “Portfolio of Investments” section of the report for additional details). The quality ratings are determined by using the S&P Global Ratings (“S&P”), Moody’s Investors Services, Inc. (“Moody’s”) and Fitch Ratings, Ltd. (“Fitch”). The Fund considers the credit ratings issued by S&P, Moody’s and Fitch and uses the highest rating issued by the agencies. These ratings are a measure of the quality and safety of a bond or portfolio, based on the issuer’s financial condition. AAA is the highest (best) and D is the lowest (worst). If applicable, the pre-refunded category includes bonds which are secured by U.S. Government securities and therefore are deemed high-quality investment-grade by the Adviser. If applicable, Not Applicable (N/A) includes non-creditworthy investments, such as equities, currency contracts, futures and options. If applicable, the Not Rated category includes bonds that are not rated by a nationally recognized statistical rating organization. The Adviser evaluates the creditworthiness of non-rated securities based on a number of factors including, but not limited to, cash flows, enterprise value and economic environment. |
| 12 | AB MUNICIPAL INCOME SHARES | abfunds.com | |
PORTFOLIO OF INVESTMENTS
April 30, 2020
| Principal Amount (000) | U.S. $ Value | |||||||
| ||||||||
MUNICIPAL OBLIGATIONS – 97.2% | ||||||||
Long-Term Municipal Bonds – 97.2% | ||||||||
Alabama – 3.1% | ||||||||
County of Jefferson AL | $ | 5,125 | $ | 5,751,805 | ||||
County of Jefferson AL Sewer Revenue | 11,645 | 13,276,232 | ||||||
Elmore County Board of Education | 2,130 | 2,160,331 | ||||||
Infirmary Health System Special Care Facilities Financing Authority of Mobile | 10,000 | 10,727,250 | ||||||
Jefferson County Board of Education/AL | 28,280 | 32,893,964 | ||||||
Lower Alabama Gas District (The) | 10,000 | 12,443,300 | ||||||
Southeast Alabama Gas Supply District (The) | 13,350 | 13,988,263 | ||||||
Special Care Facilities Financing Authority of the City of Pell City Alabama | 3,000 | 3,117,390 | ||||||
Special Care Facilities Financing Authority of the City of Pell City Alabama | 10,000 | 10,391,300 | ||||||
Tuscaloosa County Industrial Development Authority | 38,735 | 38,317,824 | ||||||
|
| |||||||
| 143,067,659 | ||||||||
|
| |||||||
| abfunds.com | AB MUNICIPAL INCOME SHARES | 13 | |
PORTFOLIO OF INVESTMENTS (continued)
| Principal Amount (000) | U.S. $ Value | |||||||
| ||||||||
Alaska – 0.2% |
| |||||||
State of Alaska International Airports System | $ | 9,000 | $ | 10,144,710 | ||||
|
| |||||||
American Samoa – 0.3% | ||||||||
American Samoa Economic Development Authority | 8,315 | 9,542,959 | ||||||
Series 2015A | 3,235 | 3,548,633 | ||||||
|
| |||||||
| 13,091,592 | ||||||||
|
| |||||||
Arizona – 1.1% |
| |||||||
Arizona Industrial Development Authority | 7,864 | 7,441,146 | ||||||
Arizona Industrial Development Authority | 4,285 | 4,751,341 | ||||||
Arizona Industrial Development Authority | 1,250 | 1,191,387 | ||||||
Arizona Industrial Development Authority | 1,100 | 976,800 | ||||||
Arizona Sports & Tourism Authority | 3,670 | 3,905,981 | ||||||
City of Phoenix Civic Improvement Corp. | 2,850 | 2,864,392 | ||||||
Glendale Industrial Development Authority | 1,000 | 829,860 | ||||||
Glendale Industrial Development Authority | 2,700 | 2,731,401 | ||||||
Industrial Development Authority of the City of Phoenix (The) | 3,875 | 3,962,149 | ||||||
| 14 | AB MUNICIPAL INCOME SHARES | abfunds.com | |
PORTFOLIO OF INVESTMENTS (continued)
| Principal Amount (000) | U.S. $ Value | |||||||
| ||||||||
Maricopa County Industrial Development Authority | $ | 18,500 | $ | 18,904,780 | ||||
Quechan Indian Tribe of Fort Yuma | 60 | 63,222 | ||||||
Salt Verde Financial Corp. | 150 | 182,652 | ||||||
Tempe Industrial Development Authority | 1,185 | 926,777 | ||||||
Tempe Industrial Development Authority | 1,065 | 1,002,485 | ||||||
|
| |||||||
| 49,734,373 | ||||||||
|
| |||||||
Arkansas – 0.2% |
| |||||||
Arkansas Development Finance Authority | 10,000 | 8,721,700 | ||||||
|
| |||||||
California – 5.4% | ||||||||
Abag Finance Authority for Nonprofit Corps. | 100 | 101,576 | ||||||
Alameda Corridor Transportation Authority | 26,130 | 27,890,633 | ||||||
Anaheim Public Financing Authority | 1,460 | 1,571,325 | ||||||
Bay Area Toll Authority | 1,000 | 1,121,720 | ||||||
California Educational Facilities Authority | 8,210 | 8,892,611 | ||||||
California Educational Facilities Authority | 100 | 102,093 | ||||||
| abfunds.com | AB MUNICIPAL INCOME SHARES | 15 | |
PORTFOLIO OF INVESTMENTS (continued)
| Principal Amount (000) | U.S. $ Value | |||||||
| ||||||||
California Health Facilities Financing Authority (Children’s Hospital Los Angeles) | $ | 1,700 | $ | 1,858,525 | ||||
California Health Facilities Financing Authority | 3,425 | 3,680,745 | ||||||
California Health Facilities Financing Authority | 6,150 | 7,017,941 | ||||||
California Housing Finance | 4,418 | 4,247,967 | ||||||
California Municipal Finance Authority | 3,030 | 3,187,730 | ||||||
California Municipal Finance Authority | 1,000 | 1,006,960 | ||||||
Series 2014 | 1,085 | 894,919 | ||||||
California Municipal Finance Authority | 3,625 | 3,776,380 | ||||||
California Municipal Finance Authority | 1,025 | 979,439 | ||||||
California Municipal Finance Authority | 1,200 | 1,282,356 | ||||||
7.25%, 06/01/2043 | 2,075 | 2,220,292 | ||||||
California Municipal Finance Authority | 725 | 741,755 | ||||||
California Pollution Control Financing Authority | 4,675 | 4,749,192 | ||||||
| 16 | AB MUNICIPAL INCOME SHARES | abfunds.com | |
PORTFOLIO OF INVESTMENTS (continued)
| Principal Amount (000) | U.S. $ Value | |||||||
| ||||||||
California Pollution Control Financing Authority | $ | 785 | $ | 698,148 | ||||
California School Finance Authority | 8,850 | 8,263,422 | ||||||
California School Finance Authority | 3,000 | 3,151,860 | ||||||
California Statewide Communities Development Authority | 530 | 541,941 | ||||||
California Statewide Communities Development Authority | 6,440 | 6,400,587 | ||||||
Series 2016A 5.00%, 12/01/2041(a) | 6,160 | 6,127,475 | ||||||
Series 2018A 5.50%, 12/01/2058(a) | 3,775 | 3,823,660 | ||||||
California Statewide Communities Development Authority | 1,200 | 1,174,104 | ||||||
California Statewide Communities Development Authority | 100 | 106,073 | ||||||
California Statewide Communities Development Authority | 140 | 145,922 | ||||||
California Statewide Communities Development Authority | 250 | 257,478 | ||||||
City of Roseville CA | 1,000 | 1,078,880 | ||||||
| abfunds.com | AB MUNICIPAL INCOME SHARES | 17 | |
PORTFOLIO OF INVESTMENTS (continued)
| Principal Amount (000) | U.S. $ Value | |||||||
| ||||||||
City of San Buenaventura CA | $ | 100 | $ | 106,645 | ||||
Golden State Tobacco Securitization Corp. | 82,290 | 79,980,120 | ||||||
5.25%, 06/01/2047 | 2,400 | 2,348,136 | ||||||
M-S-R Energy Authority | 17,685 | 25,301,929 | ||||||
Municipal Improvement Corp. of Los Angeles | 2,705 | 2,951,885 | ||||||
Oakland Unified School District/Alameda County | 6,215 | 7,017,130 | ||||||
Palomar Health | 3,990 | 4,306,686 | ||||||
Series 2017 | 3,375 | 3,610,406 | ||||||
San Francisco City & County Redevelopment Agency Successor Agency | 1,000 | 1,043,750 | ||||||
San Joaquin Hills Transportation Corridor Agency | 1,450 | 1,532,433 | ||||||
Series 2014B | 1,000 | 1,052,110 | ||||||
Southern California Logistics Airport Authority | 1,685 | 1,684,187 | ||||||
State of California | 7,900 | 8,943,713 | ||||||
Tobacco Securitization Authority of Southern California | 10,480 | 1,593,170 | ||||||
5.00%, 06/01/2039 | 1,555 | 1,754,133 | ||||||
| 18 | AB MUNICIPAL INCOME SHARES | abfunds.com | |
PORTFOLIO OF INVESTMENTS (continued)
| Principal Amount (000) | U.S. $ Value | |||||||
| ||||||||
University of California CA Revenues | $ | 465 | $ | 521,160 | ||||
University of California CA Revenues | 536 | 590,201 | ||||||
|
| |||||||
| 251,431,503 | ||||||||
|
| |||||||
Colorado – 2.1% |
| |||||||
Centerra Metropolitan District No. 1 | 5,000 | 4,562,450 | ||||||
City & County of Denver CO | 645 | 635,080 | ||||||
Colorado Health Facilities Authority | 3,960 | 3,962,719 | ||||||
5.00%, 08/01/2044(b) | 63,235 | 67,458,466 | ||||||
Colorado Health Facilities Authority | 1,150 | 1,279,812 | ||||||
Colorado Health Facilities Authority | 7,050 | 7,694,934 | ||||||
Colorado Health Facilities Authority | 1,000 | 975,990 | ||||||
Copper Ridge Metropolitan District | 3,660 | 3,171,909 | ||||||
Copperleaf Metropolitan District No. 2 | 1,000 | 981,560 | ||||||
E-470 Public Highway Authority | 1,000 | 1,007,460 | ||||||
Plaza Metropolitan District No. 1 | 1,500 | 1,431,495 | ||||||
STC Metropolitan District No. 2 | 1,940 | 1,751,467 | ||||||
| abfunds.com | AB MUNICIPAL INCOME SHARES | 19 | |
PORTFOLIO OF INVESTMENTS (continued)
| Principal Amount (000) | U.S. $ Value | |||||||
| ||||||||
Sterling Ranch Community Authority Board | $ | 1,000 | $ | 1,011,520 | ||||
Sterling Ranch Community Authority Board | 2,000 | 1,796,500 | ||||||
Vauxmont Metropolitan District AGM | 805 | 818,580 | ||||||
5.00%, 12/01/2033-12/01/2050(c) | 805 | 931,650 | ||||||
|
| |||||||
| 99,471,592 | ||||||||
|
| |||||||
Connecticut – 3.0% |
| |||||||
City of New Haven CT | 1,650 | 1,809,638 | ||||||
Connecticut State Health & Educational Facilities Authority | 3,850 | 3,961,607 | ||||||
Connecticut State Health & Educational Facilities Authority | 5,750 | 6,099,715 | ||||||
Connecticut State Health & Educational Facilities Authority | 2,095 | 2,296,494 | ||||||
Connecticut State Health & Educational Facilities Authority | 2,475 | 2,162,476 | ||||||
Connecticut State Health & Educational Facilities Authority | 1,000 | 1,015,090 | ||||||
Series 2018K-1 | 7,090 | 7,169,462 | ||||||
State of Connecticut | 5,000 | 5,510,750 | ||||||
Series 2013E | 1,000 | 1,083,470 | ||||||
| 20 | AB MUNICIPAL INCOME SHARES | abfunds.com | |
PORTFOLIO OF INVESTMENTS (continued)
| Principal Amount (000) | U.S. $ Value | |||||||
| ||||||||
Series 2015F | $ | 7,070 | $ | 8,017,528 | ||||
Series 2016A | 8,165 | 9,190,442 | ||||||
Series 2016E | 12,845 | 14,704,327 | ||||||
Series 2016F | 10,205 | 11,631,863 | ||||||
Series 2017A | 26,125 | 29,882,296 | ||||||
Series 2018A | 7,930 | 9,077,337 | ||||||
Series 2018C | 7,490 | 8,643,464 | ||||||
Series 2018E | 1,035 | 1,180,593 | ||||||
Series 2020A | 8,300 | 9,534,874 | ||||||
State of Connecticut Special Tax Revenue | 5,000 | 5,368,050 | ||||||
|
| |||||||
| 138,339,476 | ||||||||
|
| |||||||
Delaware – 0.1% |
| |||||||
Delaware State Economic Development Authority | 2,440 | 2,457,363 | ||||||
Delaware State Economic Development Authority | 1,310 | 1,323,061 | ||||||
|
| |||||||
| 3,780,424 | ||||||||
|
| |||||||
District of Columbia – 0.6% |
| |||||||
District of Columbia | 14,075 | 14,075,000 | ||||||
2.28%, 08/01/2038(d) | 625 | 625,000 | ||||||
NATL Series 2002B | 250 | 250,000 | ||||||
District of Columbia | 1,420 | 1,445,503 | ||||||
Series 2016A | 1,900 | 1,964,705 | ||||||
| abfunds.com | AB MUNICIPAL INCOME SHARES | 21 | |
PORTFOLIO OF INVESTMENTS (continued)
| Principal Amount (000) | U.S. $ Value | |||||||
| ||||||||
District of Columbia | $ | 8,580 | $ | 8,860,928 | ||||
Series 2017B | 1,465 | 1,537,078 | ||||||
Metropolitan Washington Airports Authority | 500 | 551,115 | ||||||
|
| |||||||
| 29,309,329 | ||||||||
|
| |||||||
Florida – 3.9% |
| |||||||
Alachua County Health Facilities Authority | 435 | 464,376 | ||||||
Alachua County Health Facilities Authority | 1,000 | 1,061,970 | ||||||
Bexley Community Development District | 1,000 | 960,130 | ||||||
Cape Coral Health Facilities Authority | 1,400 | 1,103,284 | ||||||
6.00%, 07/01/2045-07/01/2050(a) | 4,015 | 3,071,026 | ||||||
Capital Trust Agency, Inc. | 1,300 | 1,102,179 | ||||||
Capital Trust Agency, Inc. | 5,225 | 4,511,233 | ||||||
Capital Trust Agency, Inc. | 3,820 | 3,881,769 | ||||||
City of Lakeland FL | 2,350 | 2,416,215 | ||||||
| 22 | AB MUNICIPAL INCOME SHARES | abfunds.com | |
PORTFOLIO OF INVESTMENTS (continued)
| Principal Amount (000) | U.S. $ Value | |||||||
| ||||||||
City of Lakeland FL | $ | 5,610 | $ | 5,913,220 | ||||
City Of South Miami Health Facilities Authority, Inc. | 14,530 | 15,980,344 | ||||||
County of Miami-Dade FL Aviation Revenue | 10,000 | 10,953,800 | ||||||
Series 2015A | 1,100 | 1,222,892 | ||||||
County of Osceola FL Transportation Revenue | 6,045 | 3,373,254 | ||||||
County of Palm Beach FL | 4,030 | 3,583,066 | ||||||
Florida Higher Educational Facilities Financial Authority | 1,000 | 898,550 | ||||||
Florida Higher Educational Facilities Financial Authority | 3,380 | 3,307,012 | ||||||
Greater Orlando Aviation Authority | 9,650 | 10,746,986 | ||||||
Highlands County Health Facilities Authority | 1,530 | 892,143 | ||||||
6.25%, 04/01/2049 | 1,820 | 1,014,959 | ||||||
Lakewood Ranch Stewardship District | 1,000 | 1,016,440 | ||||||
5.45%, 05/01/2048 | 1,525 | 1,563,659 | ||||||
Manatee County School District | 2,700 | 3,279,393 | ||||||
| abfunds.com | AB MUNICIPAL INCOME SHARES | 23 | |
PORTFOLIO OF INVESTMENTS (continued)
| Principal Amount (000) | U.S. $ Value | |||||||
| ||||||||
Marshall Creek Community Development District | $ | 1,655 | $ | 1,630,076 | ||||
Martin County Health Facilities Authority | 1,350 | 1,447,619 | ||||||
Martin County Industrial Development Authority | 13,155 | 13,154,474 | ||||||
Miami Beach Health Facilities Authority | 2,885 | 3,049,993 | ||||||
Series 2014 | 2,000 | 2,110,220 | ||||||
Miami-Dade County Expressway Authority | 4,000 | 4,355,240 | ||||||
Mid-Bay Bridge Authority | 3,600 | 3,786,524 | ||||||
Series 2015C | 2,750 | 2,858,082 | ||||||
North Broward Hospital District | 21,590 | 23,106,190 | ||||||
Pinellas County Industrial Development Authority | 1,955 | 1,820,261 | ||||||
Town of Davie FL | 3,765 | 3,948,318 | ||||||
Series 2018 | 24,650 | 25,814,466 | ||||||
Village Community Development District No. 13 | 1,000 | 950,160 | ||||||
3.375%, 05/01/2034 | 1,500 | 1,397,280 | ||||||
3.55%, 05/01/2039 | 2,615 | 2,397,301 | ||||||
3.70%, 05/01/2050 | 10,000 | 8,916,800 | ||||||
| 24 | AB MUNICIPAL INCOME SHARES | abfunds.com | |
PORTFOLIO OF INVESTMENTS (continued)
| Principal Amount (000) | U.S. $ Value | |||||||
| ||||||||
Volusia County School Board | $ | 1,625 | $ | 1,825,038 | ||||
|
| |||||||
| 184,885,942 | ||||||||
|
| |||||||
Georgia – 2.1% |
| |||||||
Cedartown Polk County Hospital Authority | 4,000 | 4,304,680 | ||||||
City of Atlanta GA Department of Aviation | 1,390 | 1,462,975 | ||||||
Series 2014A | 1,820 | 1,994,411 | ||||||
Clarke County Hospital Authority | 2,500 | 2,842,725 | ||||||
Development Authority for Fulton County | 2,000 | 2,261,880 | ||||||
Development Authority of Gwinnett County | 10,855 | 12,474,562 | ||||||
Fayette County Hospital Authority/GA | 10,710 | 11,988,036 | ||||||
Glynn-Brunswick Memorial Hospital Authority | 12,680 | 13,479,836 | ||||||
Main Street Natural Gas, Inc. | 16,200 | 17,112,870 | ||||||
Series 2018C | 12,245 | 12,966,230 | ||||||
Municipal Electric Authority of Georgia | 16,960 | 17,649,876 | ||||||
|
| |||||||
| 98,538,081 | ||||||||
|
| |||||||
| abfunds.com | AB MUNICIPAL INCOME SHARES | 25 | |
PORTFOLIO OF INVESTMENTS (continued)
| Principal Amount (000) | U.S. $ Value | |||||||
| ||||||||
Guam – 0.9% |
| |||||||
Territory of Guam | $ | 2,310 | $ | 2,147,561 | ||||
Territory of Guam | 9,015 | 9,089,675 | ||||||
Territory of Guam | 6,420 | 6,177,709 | ||||||
Series 2015D | 25,505 | 25,318,690 | ||||||
|
| |||||||
| 42,733,635 | ||||||||
|
| |||||||
Idaho – 0.0% |
| |||||||
Idaho Housing & Finance Association | 200 | 204,220 | ||||||
|
| |||||||
Illinois – 10.7% |
| |||||||
Chicago Board of Education | 5,630 | 5,252,114 | ||||||
Series 2015C | 10,315 | 9,973,838 | ||||||
Series 2015E | 1,000 | 983,520 | ||||||
Series 2016A | 1,400 | 1,506,246 | ||||||
Series 2016B | 1,900 | 2,010,713 | ||||||
Series 2017G | 4,150 | 4,055,629 | ||||||
Series 2017H | 5,795 | 5,351,695 | ||||||
Series 2018A | 17,705 | 17,930,173 | ||||||
Series 2019A | 6,070 | 6,089,154 | ||||||
Series 2019B | 3,100 | 3,078,203 | ||||||
Chicago O’Hare International Airport | 1,665 | 1,784,347 | ||||||
Series 2016B | 5,000 | 5,508,700 | ||||||
| 26 | AB MUNICIPAL INCOME SHARES | abfunds.com | |
PORTFOLIO OF INVESTMENTS (continued)
| Principal Amount (000) | U.S. $ Value | |||||||
| ||||||||
Series 2016C | $ | 9,250 | $ | 10,098,222 | ||||
Series 2017B | 33,445 | 37,119,907 | ||||||
Chicago O’Hare International Airport | 7,145 | 7,523,052 | ||||||
Chicago Transit Authority | 4,285 | 4,563,611 | ||||||
City of Chicago IL | 1,050 | 702,587 | ||||||
Illinois Finance Authority | 2,835 | 3,196,377 | ||||||
Illinois Finance Authority | 4,280 | 3,816,402 | ||||||
5.00%, 09/01/2036-09/01/2040 | 3,495 | 3,597,167 | ||||||
Illinois Finance Authority | 400 | 408,604 | ||||||
Illinois Finance Authority | 1,000 | 1,078,160 | ||||||
Illinois Finance Authority | 4,295 | 4,422,733 | ||||||
Illinois Finance Authority | 1,079 | 816,916 | ||||||
6.33%, 05/15/2048 | 829 | 564,801 | ||||||
6.44%, 05/15/2055 | 1,998 | 1,351,668 | ||||||
Series 2016C | 609 | 6,090 | ||||||
| abfunds.com | AB MUNICIPAL INCOME SHARES | 27 | |
PORTFOLIO OF INVESTMENTS (continued)
| Principal Amount (000) | U.S. $ Value | |||||||
| ||||||||
Illinois Finance Authority | $ | 3,500 | $ | 3,582,390 | ||||
Series 2015 | 2,000 | 1,732,780 | ||||||
Illinois Finance Authority | 3,000 | 2,996,040 | ||||||
Series 2017C | 1,000 | 997,730 | ||||||
Illinois Finance Authority | 4,750 | 5,106,345 | ||||||
Illinois Municipal Electric Agency | 6,700 | 7,143,406 | ||||||
Illinois State Toll Highway Authority | 3,125 | 3,562,956 | ||||||
Series 2015B | 2,850 | 3,204,882 | ||||||
Series 2016A | 7,000 | 7,978,250 | ||||||
Series 2016B | 3,450 | 3,873,004 | ||||||
Metropolitan Pier & Exposition Authority | 47,375 | 43,047,294 | ||||||
Series 2012 | 20,785 | 4,558,231 | ||||||
Series 2015B | 13,300 | 12,270,979 | ||||||
Series 2017B | 9,850 | 1,273,901 | ||||||
State of Illinois | 1,300 | 1,279,330 | ||||||
Series 2014 | 14,800 | 14,446,000 | ||||||
Series 2016 | 35,155 | 34,036,170 | ||||||
Series 2017A | 14,795 | 14,338,308 | ||||||
| 28 | AB MUNICIPAL INCOME SHARES | abfunds.com | |
PORTFOLIO OF INVESTMENTS (continued)
| Principal Amount (000) | U.S. $ Value | |||||||
| ||||||||
Series 2017C | $ | 25,000 | $ | 24,049,250 | ||||
Series 2017D | 76,815 | 75,094,577 | ||||||
Series 2018A | 24,410 | 23,598,113 | ||||||
Series 2018B | 5,000 | 4,876,900 | ||||||
Series 2019B | 33,295 | 29,096,388 | ||||||
5.00%, 11/01/2031 | 28,975 | 27,705,315 | ||||||
Village of Antioch IL Special Service Areas No. 1 & 2 | 3,767 | 3,269,229 | ||||||
Series 2016B | 1,700 | 1,504,075 | ||||||
Village of Pingree Grove IL Special Service Area No. 7 | 748 | 741,567 | ||||||
5.00%, 03/01/2036(e) | 2,963 | 2,768,924 | ||||||
Series 2015B | 918 | 905,928 | ||||||
|
| |||||||
| 501,828,891 | ||||||||
|
| |||||||
Indiana – 0.8% | ||||||||
Indiana Finance Authority | 3,905 | 4,080,569 | ||||||
Indiana Finance Authority | 1,000 | 1,007,590 | ||||||
5.50%, 08/15/2045 | 2,225 | 2,233,989 | ||||||
Indiana Finance Authority | 1,000 | 1,011,460 | ||||||
Indiana Finance Authority | 10,970 | 11,248,078 | ||||||
| abfunds.com | AB MUNICIPAL INCOME SHARES | 29 | |
PORTFOLIO OF INVESTMENTS (continued)
| Principal Amount (000) | U.S. $ Value | |||||||
| ||||||||
Indiana Finance Authority | $ | 22,795 | $ | 18,325,356 | ||||
|
| |||||||
| 37,907,042 | ||||||||
|
| |||||||
Iowa – 0.3% | ||||||||
Iowa Finance Authority | 6,405 | 6,246,861 | ||||||
Iowa Finance Authority | 11,000 | 10,166,710 | ||||||
|
| |||||||
| 16,413,571 | ||||||||
|
| |||||||
Kansas – 0.1% | ||||||||
Overland Park Development Corp. | 3,140 | 2,774,028 | ||||||
Wyandotte County-Kansas City Unified Government | 1,765 | 1,532,638 | ||||||
|
| |||||||
| 4,306,666 | ||||||||
|
| |||||||
Kentucky – 1.5% | ||||||||
City of Ashland KY | 930 | 952,580 | ||||||
Kentucky Economic Development Finance Authority | 15,780 | 16,872,266 | ||||||
Kentucky Economic Development Finance Authority | 2,135 | 2,125,283 | ||||||
5.00%, 08/01/2044-08/01/2049(b) | 13,615 | 14,478,234 | ||||||
| 30 | AB MUNICIPAL INCOME SHARES | abfunds.com | |
PORTFOLIO OF INVESTMENTS (continued)
| Principal Amount (000) | U.S. $ Value | |||||||
| ||||||||
Kentucky Economic Development Finance Authority | $ | 1,685 | $ | 1,515,523 | ||||
5.50%, 11/15/2045 | 1,000 | 901,390 | ||||||
Series 2016A | 3,100 | 2,431,642 | ||||||
Kentucky Economic Development Finance Authority | 9,625 | 10,224,922 | ||||||
5.25%, 06/01/2041 | 1,250 | 1,339,438 | ||||||
Kentucky Economic Development Finance Authority | 1,750 | 1,471,610 | ||||||
5.75%, 11/15/2045 | 3,350 | 2,697,152 | ||||||
Louisville/Jefferson County Metropolitan Government | 1,965 | 2,333,595 | ||||||
Series 2016 | 8,205 | 9,145,539 | ||||||
Series 2020A | 5,120 | 5,851,603 | ||||||
|
| |||||||
| 72,340,777 | ||||||||
|
| |||||||
Louisiana – 1.8% |
| |||||||
Jefferson Parish Hospital Service District No. 2 | 2,130 | 2,157,456 | ||||||
Jefferson Sales Tax District | 3,400 | 4,073,400 | ||||||
Louisiana Local Government Environmental Facilities & Community Development Auth | 2,100 | 2,085,300 | ||||||
Louisiana Local Government Environmental Facilities & Community Development Auth | 27,600 | 30,820,284 | ||||||
| abfunds.com | AB MUNICIPAL INCOME SHARES | 31 | |
PORTFOLIO OF INVESTMENTS (continued)
| Principal Amount (000) | U.S. $ Value | |||||||
| ||||||||
Louisiana Public Facilities Authority | $ | 10 | $ | 12,198 | ||||
Louisiana Public Facilities Authority | 2,750 | 27 | ||||||
Series 2014A | 1,250 | 13 | ||||||
Louisiana Public Facilities Authority | 10,270 | 10,832,077 | ||||||
Louisiana Public Facilities Authority | 17,565 | 19,888,617 | ||||||
Louisiana Public Facilities Authority | 1,110 | 1,186,290 | ||||||
New Orleans Aviation Board | 1,000 | 1,096,370 | ||||||
Parish of St. John the Baptist LA | 4,855 | 4,349,594 | ||||||
2.10%, 06/01/2037 | 2,465 | 2,165,552 | ||||||
2.20%, 06/01/2037 | 3,700 | 3,072,739 | ||||||
Port New Orleans Board of Commissioners | 1,540 | 1,667,953 | ||||||
|
| |||||||
| 83,407,870 | ||||||||
|
| |||||||
Maine – 0.4% |
| |||||||
Finance Authority of Maine | 4,630 | 4,811,635 | ||||||
Series 2018R-2 | 1,700 | 1,705,032 | ||||||
Maine Health & Higher Educational Facilities Authority | 9,620 | 10,680,021 | ||||||
| 32 | AB MUNICIPAL INCOME SHARES | abfunds.com | |
PORTFOLIO OF INVESTMENTS (continued)
| Principal Amount (000) | U.S. $ Value | |||||||
| ||||||||
Maine Health & Higher Educational Facilities Authority | $ | 1,000 | $ | 1,045,080 | ||||
|
| |||||||
| 18,241,768 | ||||||||
|
| |||||||
Maryland – 1.3% | ||||||||
City of Baltimore MD | 1,000 | 862,300 | ||||||
Series 2017 | 3,250 | 2,803,895 | ||||||
City of Baltimore MD | 1,000 | 961,340 | ||||||
City of Baltimore MD | 1,750 | 1,333,185 | ||||||
Series 2019B | 300 | 232,029 | ||||||
Maryland Health & Higher Educational Facilities Authority | 3,245 | 3,554,897 | ||||||
Maryland Health & Higher Educational Facilities Authority | 9,880 | 9,989,020 | ||||||
5.00%, 07/01/2046(c) | 22,040 | 23,960,125 | ||||||
Maryland Health & Higher Educational Facilities Authority | 16,530 | 17,259,991 | ||||||
|
| |||||||
| 60,956,782 | ||||||||
|
| |||||||
Massachusetts – 0.8% | ||||||||
Massachusetts Development Finance Agency | 2,220 | 2,315,638 | ||||||
Series 2017A | 670 | 711,902 | ||||||
| abfunds.com | AB MUNICIPAL INCOME SHARES | 33 | |
PORTFOLIO OF INVESTMENTS (continued)
| Principal Amount (000) | U.S. $ Value | |||||||
| ||||||||
Massachusetts Development Finance Agency | $ | 1,760 | $ | 1,832,741 | ||||
Massachusetts Development Finance Agency | 5,000 | 5,036,400 | ||||||
Massachusetts Development Finance Agency | 2,360 | 2,560,142 | ||||||
Massachusetts Development Finance Agency | 3,850 | 4,175,202 | ||||||
Massachusetts Development Finance Agency | 3,980 | 4,086,431 | ||||||
Massachusetts Development Finance Agency | 2,550 | 2,660,976 | ||||||
AGM Series 2019A | 1,000 | 1,112,420 | ||||||
Massachusetts Development Finance Agency | 10,525 | 8,693,018 | ||||||
Series 2017A | 4,525 | 3,315,829 | ||||||
|
| |||||||
| 36,500,699 | ||||||||
|
| |||||||
Michigan – 2.8% | ||||||||
City of Detroit MI | 4,385 | 4,291,056 | ||||||
City of Detroit MI Sewage Disposal System Revenue | 4,400 | 4,681,028 | ||||||
5.25%, 07/01/2039 | 4,825 | 5,121,641 | ||||||
| 34 | AB MUNICIPAL INCOME SHARES | abfunds.com | |
PORTFOLIO OF INVESTMENTS (continued)
| Principal Amount (000) | U.S. $ Value | |||||||
| ||||||||
City of Detroit MI Water Supply System Revenue | $ | 1,060 | $ | 1,097,535 | ||||
Detroit City School District | 120 | 127,534 | ||||||
Grand Rapids Economic Development Corp. | 1,655 | 1,498,295 | ||||||
Great Lakes Water Authority Water Supply System Revenue | 1,025 | 1,188,990 | ||||||
Series 2016D | 25,210 | 29,227,465 | ||||||
Kalamazoo Hospital Finance Authority | 20,100 | 21,080,262 | ||||||
Michigan Finance Authority | 2,100 | 2,303,405 | ||||||
Series 2015D-1 | 2,000 | 2,215,420 | ||||||
Series 2015D-2 | 3,400 | 3,898,270 | ||||||
Michigan Finance Authority | 4,000 | 4,118,480 | ||||||
5.00%, 11/15/2032 | 3,850 | 4,279,044 | ||||||
Series 2019A | 6,635 | 7,258,756 | ||||||
Michigan Finance Authority | 2,000 | 2,168,420 | ||||||
| abfunds.com | AB MUNICIPAL INCOME SHARES | 35 | |
PORTFOLIO OF INVESTMENTS (continued)
| Principal Amount (000) | U.S. $ Value | |||||||
| ||||||||
Michigan Finance Authority | $ | 7,950 | $ | 8,485,053 | ||||
Michigan Strategic Fund | 2,000 | 2,084,860 | ||||||
Series 2016 | 8,970 | 9,434,736 | ||||||
Michigan Strategic Fund | 8,600 | 8,667,768 | ||||||
Michigan Tobacco Settlement Finance Authority | 5,775 | 5,627,680 | ||||||
Wayne State University | 4,000 | 4,536,920 | ||||||
|
| |||||||
| 133,392,618 | ||||||||
|
| |||||||
Minnesota – 0.1% |
| |||||||
City of Wayzata MN | 1,000 | 963,450 | ||||||
Duluth Economic Development Authority | 2,925 | 3,156,980 | ||||||
Minnesota Higher Education Facilities Authority | 1,900 | 1,996,159 | ||||||
|
| |||||||
| 6,116,589 | ||||||||
|
| |||||||
Mississippi – 0.4% |
| |||||||
Mississippi Hospital Equipment & Facilities Authority | 15,900 | 16,261,784 | ||||||
| 36 | AB MUNICIPAL INCOME SHARES | abfunds.com | |
PORTFOLIO OF INVESTMENTS (continued)
| Principal Amount (000) | U.S. $ Value | |||||||
| ||||||||
Mississippi Hospital Equipment & Facilities Authority | $ | 2,005 | $ | 2,134,798 | ||||
5.00%, 01/01/2035 | 1,230 | 1,425,386 | ||||||
|
| |||||||
| 19,821,968 | ||||||||
|
| |||||||
Missouri – 1.3% |
| |||||||
Cape Girardeau County Industrial Development Authority | 2,925 | 3,048,991 | ||||||
Health & Educational Facilities Authority of the State of Missouri | 1,000 | 926,320 | ||||||
Series 2019I | 37,870 | 29,625,136 | ||||||
5.00%, 02/01/2042-02/01/2048 | 3,220 | 2,981,261 | ||||||
Kansas City Industrial Development Authority | 3,175 | 2,603,754 | ||||||
Kansas City Industrial Development Authority | 2,915 | 1,835,634 | ||||||
Lee’s Summit Industrial Development Authority | 620 | 546,598 | ||||||
Series 2016A | 3,060 | 2,553,201 | ||||||
Series 2018 | 6,940 | 5,708,774 | ||||||
Missouri Joint Municipal Electric Utility Commission | 3,240 | 3,709,897 | ||||||
St. Louis County Industrial Development Authority | 2,000 | 1,780,720 | ||||||
5.125%, 12/01/2045 | 4,500 | 3,782,250 | ||||||
|
| |||||||
| 59,102,536 | ||||||||
|
| |||||||
| abfunds.com | AB MUNICIPAL INCOME SHARES | 37 | |
PORTFOLIO OF INVESTMENTS (continued)
| Principal Amount (000) | U.S. $ Value | |||||||
| ||||||||
Montana – 0.0% |
| |||||||
Montana Facility Finance Authority | $ | 1,085 | $ | 1,232,549 | ||||
|
| |||||||
Nebraska – 0.6% |
| |||||||
Central Plains Energy Project | 2,975 | 3,155,047 | ||||||
Series 2017A | 19,955 | 24,382,716 | ||||||
|
| |||||||
| 27,537,763 | ||||||||
|
| |||||||
Nevada – 1.1% |
| |||||||
City of Carson City NV | 3,935 | 4,107,087 | ||||||
City of Reno NV | 17,000 | 1,806,760 | ||||||
City of Sparks NV | 3,540 | 3,226,639 | ||||||
Clark County School District | 17,110 | 19,334,872 | ||||||
AGM Series 2019B | 5,185 | 5,239,339 | ||||||
Las Vegas Redevelopment Agency | 1,800 | 1,973,808 | ||||||
Las Vegas Valley Water District | 14,000 | 15,754,340 | ||||||
State of Nevada Department of Business & Industry | 1,890 | 1,822,603 | ||||||
|
| |||||||
| 53,265,448 | ||||||||
|
| |||||||
| 38 | AB MUNICIPAL INCOME SHARES | abfunds.com | |
PORTFOLIO OF INVESTMENTS (continued)
| Principal Amount (000) | U.S. $ Value | |||||||
| ||||||||
New Hampshire – 0.6% |
| |||||||
New Hampshire Business Finance Authority | $ | 17,433 | $ | 16,714,639 | ||||
New Hampshire Health and Education Facilities Authority Act | 5,380 | 6,537,668 | ||||||
New Hampshire Health and Education Facilities Authority Act | 2,940 | 3,098,319 | ||||||
|
| |||||||
| 26,350,626 | ||||||||
|
| |||||||
New Jersey – 8.3% |
| |||||||
City of Bayonne NJ | 1,075 | 1,236,293 | ||||||
New Jersey Economic Development Authority | 3,455 | 3,484,955 | ||||||
Series 2014P | 5,000 | 5,074,450 | ||||||
Series 2014U | 3,500 | 3,553,655 | ||||||
Series 2015X | 15,920 | 16,164,054 | ||||||
Series 2017A | 1,640 | 1,652,808 | ||||||
Series 2017B | 7,505 | 7,566,691 | ||||||
Series 2017D | 5,370 | 5,377,244 | ||||||
Series 2018A | 5,885 | 5,821,538 | ||||||
Series 2019M | 2,800 | 2,831,612 | ||||||
New Jersey Economic Development Authority | 3,770 | 3,803,402 | ||||||
New Jersey Economic Development Authority | 6,035 | 6,283,453 | ||||||
| abfunds.com | AB MUNICIPAL INCOME SHARES | 39 | |
PORTFOLIO OF INVESTMENTS (continued)
| Principal Amount (000) | U.S. $ Value | |||||||
| ||||||||
New Jersey Economic Development Authority | $ | 7,085 | $ | 7,041,356 | ||||
New Jersey Economic Development Authority | 735 | 767,737 | ||||||
New Jersey Economic Development Authority | 8,270 | 8,185,150 | ||||||
Series 2000B | 1,475 | 1,477,036 | ||||||
New Jersey Educational Facilities Authority | 1,805 | 1,658,813 | ||||||
5.00%, 07/01/2045 | 1,400 | 1,485,428 | ||||||
New Jersey Health Care Facilities Financing Authority | 1,300 | 1,505,673 | ||||||
New Jersey Health Care Facilities Financing Authority | 8,645 | 9,508,053 | ||||||
New Jersey Health Care Facilities Financing Authority | 1,070 | 1,051,778 | ||||||
New Jersey Health Care Facilities Financing Authority | 2,040 | 2,172,763 | ||||||
New Jersey Transportation Trust Fund Authority | 45,225 | 48,605,384 | ||||||
| 40 | AB MUNICIPAL INCOME SHARES | abfunds.com | |
PORTFOLIO OF INVESTMENTS (continued)
| Principal Amount (000) | U.S. $ Value | |||||||
| ||||||||
Series 2018A | $ | 38,885 | $ | 41,352,243 | ||||
New Jersey Transportation Trust Fund Authority | 4,825 | 4,783,457 | ||||||
Series 2014A | 1,000 | 1,002,880 | ||||||
Series 2015A | 8,450 | 8,292,323 | ||||||
Series 2018A | 36,990 | 37,300,959 | ||||||
Series 2019B | 2,715 | 2,521,713 | ||||||
5.00%, 06/15/2032 | 3,480 | 3,519,846 | ||||||
New Jersey Turnpike Authority | 2,500 | 2,730,233 | ||||||
Series 2015E | 15,400 | 16,853,298 | ||||||
Series 2016A | 6,500 | 7,309,380 | ||||||
Series 2017A | 15,000 | 17,144,550 | ||||||
Series 2017B | 13,540 | 15,789,198 | ||||||
Series 2019A | 11,320 | 12,878,877 | ||||||
Tobacco Settlement Financing Corp. | 68,740 | 69,106,384 | ||||||
|
| |||||||
| 386,894,667 | ||||||||
|
| |||||||
New Mexico – 0.2% |
| |||||||
City of Santa Fe NM | 2,180 | 1,902,564 | ||||||
New Mexico Hospital Equipment Loan Council | 1,060 | 1,110,467 | ||||||
New Mexico Hospital Equipment Loan Council | 6,615 | 5,993,035 | ||||||
|
| |||||||
| 9,006,066 | ||||||||
|
| |||||||
| abfunds.com | AB MUNICIPAL INCOME SHARES | 41 | |
PORTFOLIO OF INVESTMENTS (continued)
| Principal Amount (000) | U.S. $ Value | |||||||
| ||||||||
New York – 5.6% |
| |||||||
Build NYC Resource Corp. | $ | 35,350 | $ | 36,767,535 | ||||
Build NYC Resource Corp. | 2,000 | 2,047,320 | ||||||
City of New York NY | 17,500 | 20,380,900 | ||||||
Dutchess County Local Development Corp. | 13,520 | 14,596,868 | ||||||
Metropolitan Transportation Authority | 4,425 | 4,431,991 | ||||||
Series 2015B | 3,715 | 3,723,136 | ||||||
Series 2015D | 5,135 | 5,147,221 | ||||||
Series 2016A | 3,440 | 3,448,806 | ||||||
Series 2017C | 18,850 | 18,948,774 | ||||||
Series 2020A | 855 | 856,992 | ||||||
Monroe County Industrial Development Corp./NY | 3,155 | 2,560,472 | ||||||
Nassau County Industrial Development Agency | 75 | 63,780 | ||||||
6.70%, 01/01/2049 | 444 | 338,933 | ||||||
Series 2014B | 77 | 76,561 | ||||||
Series 2014C | 514 | 77,066 | ||||||
New York City Housing Development Corp. | 3,645 | 3,554,167 | ||||||
| 42 | AB MUNICIPAL INCOME SHARES | abfunds.com | |
PORTFOLIO OF INVESTMENTS (continued)
| Principal Amount (000) | U.S. $ Value | |||||||
| ||||||||
New York City Municipal Water Finance Authority | $ | 8,000 | $ | 9,300,560 | ||||
New York Liberty Development Corp. | 100 | 105,615 | ||||||
New York Liberty Development Corp. | 1,325 | 1,651,295 | ||||||
New York Liberty Development Corp. | 2,620 | 2,432,591 | ||||||
New York NY GO | 500 | 542,550 | ||||||
New York State Dormitory Authority | 4,200 | 4,652,840 | ||||||
New York State Dormitory Authority | 9,865 | 15,890,049 | ||||||
New York State Thruway Authority | 2,000 | 2,142,900 | ||||||
New York State Thruway Authority | 3,800 | 4,184,674 | ||||||
New York Transportation Development Corp. (Delta Air Lines, Inc.) | 51,325 | 51,460,714 | ||||||
New York Transportation Development Corp. (Laguardia Gateway Partners LLC) | 28,055 | 28,499,982 | ||||||
Orange County Funding Corp. | 1,070 | 971,228 | ||||||
| abfunds.com | AB MUNICIPAL INCOME SHARES | 43 | |
PORTFOLIO OF INVESTMENTS (continued)
| Principal Amount (000) | U.S. $ Value | |||||||
| ||||||||
Port Authority of New York & New Jersey | $ | 3,900 | $ | 4,110,327 | ||||
Series 2013178 | 5,000 | 5,444,450 | ||||||
Triborough Bridge & Tunnel Authority | 1,950 | 2,111,395 | ||||||
TSASC, Inc./NY | 1,560 | 1,619,873 | ||||||
Ulster County Capital Resource Corp. | 860 | 726,829 | ||||||
5.25%, 09/15/2042-09/15/2053 | 2,330 | 1,882,846 | ||||||
Westchester County Local Development Corp. | 3,840 | 3,703,450 | ||||||
Westchester County Local Development Corp. | 4,230 | 4,412,228 | ||||||
|
| |||||||
| 262,866,918 | ||||||||
|
| |||||||
North Carolina – 0.5% |
| |||||||
County of New Hanover NC | 5,830 | 6,503,106 | ||||||
North Carolina Medical Care Commission | 5,000 | 4,162,600 | ||||||
5.00%, 07/01/2045 | 1,000 | 816,370 | ||||||
North Carolina Medical Care Commission | 2,250 | 2,115,720 | ||||||
North Carolina Medical Care Commission | 1,735 | 1,622,190 | ||||||
| 44 | AB MUNICIPAL INCOME SHARES | abfunds.com | |
PORTFOLIO OF INVESTMENTS (continued)
| Principal Amount (000) | U.S. $ Value | |||||||
| ||||||||
Series 2017 | $ | 1,000 | $ | 884,020 | ||||
North Carolina Turnpike Authority | 5,000 | 5,259,700 | ||||||
|
| |||||||
| 21,363,706 | ||||||||
|
| |||||||
North Dakota – 0.4% |
| |||||||
County of Grand Forks ND | 7,725 | 6,586,181 | ||||||
6.375%, 12/15/2043 | 4,750 | 3,592,900 | ||||||
County of Ward ND | 10,230 | 10,092,269 | ||||||
|
| |||||||
| 20,271,350 | ||||||||
|
| |||||||
Ohio – 6.4% |
| |||||||
American Municipal Power, Inc. | 10,000 | 11,330,800 | ||||||
Buckeye Tobacco Settlement Financing Authority | 2,000 | 2,003,240 | ||||||
Series 2020B | 174,725 | 155,506,997 | ||||||
Butler County Port Authority | 675 | 597,362 | ||||||
City of Chillicothe/OH | 7,500 | 8,258,443 | ||||||
County of Allen OH Hospital Facilities Revenue | 10,390 | 10,850,277 | ||||||
County of Cuyahoga/OH | 5,680 | 5,768,040 | ||||||
Series 2017 | 6,490 | 6,621,682 | ||||||
5.25%, 02/15/2047 | 12,860 | 13,400,377 | ||||||
County of Franklin OH | 3,940 | 3,483,748 | ||||||
Series 2013 | 2,300 | 2,245,099 | ||||||
| abfunds.com | AB MUNICIPAL INCOME SHARES | 45 | |
PORTFOLIO OF INVESTMENTS (continued)
| Principal Amount (000) | U.S. $ Value | |||||||
| ||||||||
County of Hamilton OH | $ | 1,030 | $ | 957,818 | ||||
County of Hamilton OH | 18,425 | 20,189,562 | ||||||
County of Marion OH | 2,210 | 1,745,502 | ||||||
County of Montgomery OH | 6,000 | 3,346,020 | ||||||
County of Ross OH | 6,000 | 6,567,840 | ||||||
Dayton-Montgomery County Port Authority | 2,500 | 2,065,850 | ||||||
Ohio Air Quality Development Authority | 5,305 | 5,318,263 | ||||||
Ohio Air Quality Development Authority | 7,480 | 7,536,100 | ||||||
Ohio Air Quality Development Authority | 1,780 | 1,631,441 | ||||||
Ohio Higher Educational Facility Commission | 9,690 | 10,752,364 | ||||||
Ohio Water Development Authority Water Pollution Control Loan Fund | 13,200 | 16,542,670 | ||||||
Ohio Water Development Authority Water Pollution Control Loan Fund | 3,110 | 3,133,325 | ||||||
| 46 | AB MUNICIPAL INCOME SHARES | abfunds.com | |
PORTFOLIO OF INVESTMENTS (continued)
| Principal Amount (000) | U.S. $ Value | |||||||
| ||||||||
Toledo-Lucas County Port Authority | $ | 1,000 | $ | 861,280 | ||||
|
| |||||||
| 300,714,100 | ||||||||
|
| |||||||
Oklahoma – 0.7% |
| |||||||
Comanche County Memorial Hospital | 780 | 819,827 | ||||||
Oklahoma Development Finance Authority | 15,630 | 16,004,057 | ||||||
Oklahoma Development Finance Authority | 14,170 | 14,721,355 | ||||||
Tulsa Airports Improvement Trust | 1,125 | 1,103,501 | ||||||
|
| |||||||
| 32,648,740 | ||||||||
|
| |||||||
Pennsylvania – 7.1% |
| |||||||
Allegheny County Hospital Development Authority | 33,535 | 37,967,817 | ||||||
Allentown Neighborhood Improvement Zone Development Authority | 2,270 | 2,182,174 | ||||||
Altoona Area School District | 1,600 | 1,819,232 | ||||||
Beaver County Industrial Development Authority | 10,000 | 9,975,000 | ||||||
Beaver County Industrial Development Authority | 1,430 | 1,440,725 | ||||||
Bensalem Township School District | 8,570 | 9,836,046 | ||||||
| abfunds.com | AB MUNICIPAL INCOME SHARES | 47 | |
PORTFOLIO OF INVESTMENTS (continued)
| Principal Amount (000) | U.S. $ Value | |||||||
| ||||||||
Berks County Industrial Development Authority | $ | 1,000 | $ | 950,850 | ||||
Chambersburg Area Municipal Authority | 1,350 | 1,281,771 | ||||||
6.00%, 10/01/2048 | 9,000 | 8,987,220 | ||||||
Chester County Health & Education Facilities Authority | 1,250 | 1,357,438 | ||||||
Chester County Industrial Development Authority | 1,050 | 864,087 | ||||||
City of Philadelphia PA | 1,200 | 1,254,612 | ||||||
Series 2017 | 12,110 | 14,703,590 | ||||||
Series 2019B | 11,300 | 13,760,082 | ||||||
AGM Series 2017A | 13,000 | 15,493,050 | ||||||
City of Philadelphia PA Water & Wastewater Revenue | 5,105 | 6,002,707 | ||||||
Commonwealth of Pennsylvania | 1,120 | 1,319,136 | ||||||
County of Lehigh PA | 10,000 | 10,463,000 | ||||||
Crawford County Hospital Authority | 3,375 | 3,727,621 | ||||||
| 48 | AB MUNICIPAL INCOME SHARES | abfunds.com | |
PORTFOLIO OF INVESTMENTS (continued)
| Principal Amount (000) | U.S. $ Value | |||||||
| ||||||||
Cumberland County Municipal Authority | $ | 1,815 | $ | 1,523,457 | ||||
Series 2012 | 1,000 | 892,230 | ||||||
Delaware River Joint Toll Bridge Commission | 4,000 | 4,791,800 | ||||||
Lancaster County Hospital Authority/PA | 900 | 815,315 | ||||||
Montgomery County Higher Education & Health Authority | 1,500 | 1,435,095 | ||||||
Montgomery County Higher Education & Health Authority | 8,900 | 8,891,434 | ||||||
5.00%, 09/01/2051 | 2,300 | 2,478,480 | ||||||
Series 2018 | 3,600 | 3,990,708 | ||||||
Montgomery County Industrial Development Authority/PA | 200 | 217,606 | ||||||
Montgomery County Industrial Development Authority/PA | 1,040 | 986,419 | ||||||
5.25%, 01/01/2040 | 4,740 | 4,251,827 | ||||||
Moon Industrial Development Authority | 5,135 | 4,823,151 | ||||||
Northeastern Pennsylvania Hospital & Education Authority | 265 | 251,535 | ||||||
| abfunds.com | AB MUNICIPAL INCOME SHARES | 49 | |
PORTFOLIO OF INVESTMENTS (continued)
| Principal Amount (000) | U.S. $ Value | |||||||
| ||||||||
Series 2016A | $ | 2,925 | $ | 2,742,656 | ||||
Series 2016B | 2,310 | 2,293,472 | ||||||
Pennsylvania Economic Development Financing Authority | 2,330 | 1,703,277 | ||||||
Pennsylvania Economic Development Financing Authority | 1,620 | 1,728,945 | ||||||
Pennsylvania Economic Development Financing Authority | 2,830 | 2,913,117 | ||||||
Pennsylvania Economic Development Financing Authority | 24,530 | 25,367,465 | ||||||
Pennsylvania Higher Educational Facilities Authority | 1,000 | 1,101,200 | ||||||
Series 2017 | 1,000 | 1,082,840 | ||||||
Pennsylvania Turnpike Commission | 4,000 | 4,409,520 | ||||||
Series 2017B | 12,850 | 14,473,543 | ||||||
Series 2018A | 10,000 | 11,395,300 | ||||||
Series 2019A | 5,435 | 6,261,283 | ||||||
Philadelphia Authority for Industrial Development | 1,000 | 1,078,040 | ||||||
| 50 | AB MUNICIPAL INCOME SHARES | abfunds.com | |
PORTFOLIO OF INVESTMENTS (continued)
| Principal Amount (000) | U.S. $ Value | |||||||
| ||||||||
School District of Philadelphia (The) | $ | 2,615 | $ | 2,999,710 | ||||
Series 2016F | 4,000 | 4,681,060 | ||||||
Series 2018A | 4,000 | 4,729,830 | ||||||
Series 2018B | 3,000 | 3,496,020 | ||||||
Series 2019A | 5,530 | 6,035,622 | ||||||
5.00%, 09/01/2044 | 17,900 | 21,120,031 | ||||||
Scranton-Lackawanna Health & Welfare Authority | 12,110 | 9,394,942 | ||||||
Series 2016B | 825 | 797,874 | ||||||
Series 2016C | 2,945 | 935,420 | ||||||
Series 2016D | 58,055 | 3,007,830 | ||||||
State Public School Building Authority | 9,880 | 11,766,169 | ||||||
Union County Hospital Authority | 8,435 | 9,284,816 | ||||||
|
| |||||||
| 333,535,197 | ||||||||
|
| |||||||
Puerto Rico – 5.0% |
| |||||||
Children’s Trust Fund | 8,370 | 1,142,840 | ||||||
Commonwealth of Puerto Rico | 2,510 | 1,653,462 | ||||||
Series 2011A | 2,810 | 1,812,450 | ||||||
Series 2012A | 3,490 | 2,207,425 | ||||||
5.75%, 07/01/2028(f)(g) | 1,350 | 857,250 | ||||||
| abfunds.com | AB MUNICIPAL INCOME SHARES | 51 | |
PORTFOLIO OF INVESTMENTS (continued)
| Principal Amount (000) | U.S. $ Value | |||||||
| ||||||||
Series 2014A | $ | 10,325 | $ | 5,988,500 | ||||
AGC Series 2001A | 670 | 734,092 | ||||||
GDB Debt Recovery Authority of Puerto Rico | 8,840 | 5,392,582 | ||||||
Puerto Rico Commonwealth Aqueduct & Sewer Authority | 7,990 | 7,930,075 | ||||||
6.125%, 07/01/2024 | 8,240 | 8,425,400 | ||||||
Series 2012A | 8,140 | 7,651,600 | ||||||
5.00%, 07/01/2022-07/01/2033 | 9,700 | 9,414,800 | ||||||
5.125%, 07/01/2037 | 1,155 | 1,091,475 | ||||||
5.25%, 07/01/2029-07/01/2042 | 12,060 | 11,556,375 | ||||||
5.50%, 07/01/2028 | 4,090 | 4,090,000 | ||||||
5.75%, 07/01/2037 | 2,985 | 2,940,225 | ||||||
6.00%, 07/01/2047 | 2,845 | 2,809,437 | ||||||
Puerto Rico Electric Power Authority | 7,315 | 4,343,281 | ||||||
5.00%, 07/01/2037(f)(g) | 14,970 | 8,888,437 | ||||||
Series 2010A | 1,040 | 617,500 | ||||||
Series 2010C | 1,735 | 1,030,156 | ||||||
Series 2010D | 1,050 | 623,438 | ||||||
5.00%, 07/01/2022 | 950 | 564,063 | ||||||
Series 2010X | 9,480 | 5,628,750 | ||||||
Series 2010Z | 2,565 | 1,522,969 | ||||||
Series 2012A | 2,510 | 1,490,313 | ||||||
5.00%, 07/01/2042(f)(g) | 1,740 | 1,033,125 | ||||||
AGM Series 2007U | 1,050 | 1,057,277 | ||||||
AGM Series 2007V | 25,380 | 27,326,138 | ||||||
NATL Series 2007V | 6,350 | 6,489,172 | ||||||
Puerto Rico Highway & Transportation Authority | 8,600 | 9,021,400 | ||||||
| 52 | AB MUNICIPAL INCOME SHARES | abfunds.com | |
PORTFOLIO OF INVESTMENTS (continued)
| Principal Amount (000) | U.S. $ Value | |||||||
| ||||||||
AGC Series 2007C | $ | 1,735 | $ | 1,906,071 | ||||
AGC Series 2007N | 825 | 876,480 | ||||||
AGM Series 2007C | 1,800 | 1,912,446 | ||||||
NATL Series 2005L | 7,565 | 7,602,598 | ||||||
NATL Series 2007 | 1,000 | 1,044,230 | ||||||
NATL Series 2007N | 480 | 483,130 | ||||||
Puerto Rico Industrial Tourist Educational Medical & Environmental Control Facilities Financing Auth | 23,735 | 24,506,387 | ||||||
Puerto Rico Industrial Tourist Educational Medical & Environmental Control Facilities Financing Auth | 335 | 316,595 | ||||||
Puerto Rico Sales Tax Financing Corp. Sales Tax Revenue | 16,565 | 4,558,574 | ||||||
Series 2019A | 12,525 | 11,185,076 | ||||||
4.55%, 07/01/2040 | 1,198 | 1,102,783 | ||||||
5.00%, 07/01/2058 | 33,956 | 31,819,149 | ||||||
|
| |||||||
| 232,647,526 | ||||||||
|
| |||||||
Rhode Island – 0.1% |
| |||||||
Rhode Island Health & Educational Building Corp. | 3,150 | 3,305,642 | ||||||
Rhode Island Health & Educational Building Corp. | 2,000 | 2,409,510 | ||||||
|
| |||||||
| 5,715,152 | ||||||||
|
| |||||||
| abfunds.com | AB MUNICIPAL INCOME SHARES | 53 | |
PORTFOLIO OF INVESTMENTS (continued)
| Principal Amount (000) | U.S. $ Value | |||||||
| ||||||||
South Carolina – 1.8% |
| |||||||
South Carolina Jobs-Economic Development Authority | $ | 9,595 | $ | 10,836,209 | ||||
South Carolina Jobs-Economic Development Authority | 1,000 | 799,050 | ||||||
5.125%, 05/01/2048 | 1,000 | 793,650 | ||||||
South Carolina Public Service Authority | 575 | 599,248 | ||||||
Series 2013B | 810 | 844,158 | ||||||
Series 2014A | 11,820 | 12,264,195 | ||||||
Series 2014B | 1,160 | 1,215,262 | ||||||
Series 2014C | 3,495 | 3,652,677 | ||||||
Series 2015A | 5,000 | 5,228,200 | ||||||
Series 2016A | 4,815 | 5,192,470 | ||||||
Series 2016B | 38,780 | 41,198,173 | ||||||
|
| |||||||
| 82,623,292 | ||||||||
|
| |||||||
South Dakota – 0.4% |
| |||||||
South Dakota Health & Educational Facilities Authority | 18,295 | 20,597,663 | ||||||
|
| |||||||
Tennessee – 1.1% |
| |||||||
Bristol Industrial Development Board | 9,080 | 7,837,765 | ||||||
5.125%, 12/01/2042(a) | 19,270 | 15,839,554 | ||||||
| 54 | AB MUNICIPAL INCOME SHARES | abfunds.com | |
PORTFOLIO OF INVESTMENTS (continued)
| Principal Amount (000) | U.S. $ Value | |||||||
| ||||||||
Chattanooga Health Educational & Housing Facility Board | $ | 1,000 | $ | 997,990 | ||||
5.00%, 08/01/2044-08/01/2049 | 11,555 | 12,293,511 | ||||||
Johnson City Health & Educational Facilities Board | 5,250 | 5,426,662 | ||||||
Metropolitan Government Nashville & Davidson County Health & Educational Facilities Board | 5,040 | 2,810,657 | ||||||
Metropolitan Government Nashville & Davidson County Health & Educational Facilities Board | 2,435 | 2,647,308 | ||||||
Series 2017A | 2,335 | 2,522,337 | ||||||
Shelby County Health Educational & Housing Facilities Board | 1,000 | 932,400 | ||||||
5.375%, 12/01/2047 | 800 | 749,288 | ||||||
|
| |||||||
| 52,057,472 | ||||||||
|
| |||||||
Texas – 7.2% |
| |||||||
Central Texas Regional Mobility Authority Series 2013 | 3,500 | 3,621,520 | ||||||
Series 2015A | 4,905 | 5,182,819 | ||||||
Series 2016 | 12,965 | 13,798,093 | ||||||
Series 2020A | 6,170 | 6,664,983 | ||||||
Central Texas Turnpike System | 6,800 | 7,048,404 | ||||||
| abfunds.com | AB MUNICIPAL INCOME SHARES | 55 | |
PORTFOLIO OF INVESTMENTS (continued)
| Principal Amount (000) | U.S. $ Value | |||||||
| ||||||||
Series 2020A | $ | 5,300 | $ | 6,339,436 | ||||
City of Houston TX | 1,965 | 1,920,198 | ||||||
City of Houston TX Airport System Revenue | 16,960 | 16,799,389 | ||||||
Series 2015B | 2,960 | 2,920,102 | ||||||
Series 2018 | 22,875 | 22,730,201 | ||||||
Clifton Higher Education Finance Corp. | 530 | 547,951 | ||||||
Series 2013 | 1,000 | 1,087,100 | ||||||
Series 2016A | 2,180 | 2,570,787 | ||||||
Dallas County Flood Control District No. 1 | 1,650 | 1,715,604 | ||||||
Dallas/Fort Worth International Airport | 1,500 | 1,530,780 | ||||||
Decatur Hospital Authority | 3,150 | 3,276,252 | ||||||
Grand Parkway Transportation Corp. | 5,340 | 5,692,440 | ||||||
Series 2020C | 40,000 | 42,406,400 | ||||||
Irving Hospital Authority | 7,305 | 7,795,092 | ||||||
Mission Economic Development Corp. | 25,175 | 24,964,789 | ||||||
| 56 | AB MUNICIPAL INCOME SHARES | abfunds.com | |
PORTFOLIO OF INVESTMENTS (continued)
| Principal Amount (000) | U.S. $ Value | |||||||
| ||||||||
New Hope Cultural Education Facilities Finance Corp. | $ | 8,315 | $ | 7,206,694 | ||||
New Hope Cultural Education Facilities Finance Corp. | 1,380 | 1,204,022 | ||||||
New Hope Cultural Education Facilities Finance Corp. | 4,500 | 3,467,610 | ||||||
New Hope Cultural Education Facilities Finance Corp. | 3,800 | 3,282,281 | ||||||
North East Texas Regional Mobility Authority | 4,940 | 4,990,783 | ||||||
North Texas Education Finance Corp. | 280 | 303,117 | ||||||
North Texas Tollway Authority | 8,975 | 9,841,626 | ||||||
Series 2015A | 7,000 | 7,737,170 | ||||||
Series 2017B | 7,400 | 8,211,210 | ||||||
Port Beaumont Navigation District | 3,315 | 2,452,338 | ||||||
Red River Health Facilities Development Corp. | 1,790 | 1,983,320 | ||||||
Red River Health Facilities Development Corp. | 1,315 | 1,374,399 | ||||||
Red River Health Facilities Development Corp. | 1,740 | 1,748,874 | ||||||
| abfunds.com | AB MUNICIPAL INCOME SHARES | 57 | |
PORTFOLIO OF INVESTMENTS (continued)
| Principal Amount (000) | U.S. $ Value | |||||||
| ||||||||
Sanger Industrial Development Corp. | $ | 2,180 | $ | 545,000 | ||||
Tarrant County Cultural Education Facilities Finance Corp. | 200 | 140,000 | ||||||
Tarrant County Cultural Education Facilities Finance Corp. | 8,465 | 7,624,170 | ||||||
Tarrant County Cultural Education Facilities Finance Corp. | 1,115 | 730,894 | ||||||
Series 2015A | 3,540 | 2,258,874 | ||||||
Series 2015B | 4,000 | 3,242,760 | ||||||
Tarrant County Cultural Education Facilities Finance Corp. | 6,475 | 5,049,960 | ||||||
Tarrant County Cultural Education Facilities Finance Corp. | 5,350 | 5,183,437 | ||||||
Texas Municipal Gas Acquisition & Supply Corp. I | 9,775 | 10,992,378 | ||||||
Texas Private Activity Bond Surface Transportation Corp. | 1,255 | 1,240,580 | ||||||
Texas Private Activity Bond Surface Transportation Corp. | 660 | 662,739 | ||||||
| 58 | AB MUNICIPAL INCOME SHARES | abfunds.com | |
PORTFOLIO OF INVESTMENTS (continued)
| Principal Amount (000) | U.S. $ Value | |||||||
| ||||||||
Texas Private Activity Bond Surface Transportation Corp. | $ | 9,100 | $ | 8,876,721 | ||||
Texas Private Activity Bond Surface Transportation Corp. | 39,270 | 40,967,642 | ||||||
Series 2013 | 3,600 | 3,962,808 | ||||||
Texas State University System | 2,300 | 2,338,180 | ||||||
Texas Transportation Commission | 7,500 | 7,626,975 | ||||||
Travis County Health Facilities Development Corp. | 1,200 | 1,248,324 | ||||||
Uptown Development Authority | 1,015 | 1,117,840 | ||||||
|
| |||||||
| 336,225,066 | ||||||||
|
| |||||||
Utah – 0.0% |
| |||||||
Timber Lakes Water Special Service District | 10 | 10,280 | ||||||
Utah Charter School Finance Authority | 100 | 100,435 | ||||||
|
| |||||||
| 110,715 | ||||||||
|
| |||||||
Vermont – 0.1% |
| |||||||
Vermont Economic Development Authority | 1,100 | 1,091,695 | ||||||
Vermont Economic Development Authority | 200 | 189,968 | ||||||
Vermont Educational & Health Buildings Financing Agency | 1,500 | 1,658,445 | ||||||
|
| |||||||
| 2,940,108 | ||||||||
|
| |||||||
| abfunds.com | AB MUNICIPAL INCOME SHARES | 59 | |
PORTFOLIO OF INVESTMENTS (continued)
| Principal Amount (000) | U.S. $ Value | |||||||
| ||||||||
Virginia – 0.8% |
| |||||||
Cherry Hill Community Development Authority | $ | 1,000 | $ | 941,550 | ||||
Chesapeake Bay Bridge & Tunnel District | 1,000 | 1,054,730 | ||||||
Chesterfield County Economic Development Authority | 1,030 | 928,473 | ||||||
Fairfax County Economic Development Authority | 1,955 | 1,878,618 | ||||||
Tobacco Settlement Financing Corp./VA | 7,490 | 7,064,643 | ||||||
Virginia College Building Authority | ||||||||
Series 2015A | 1,110 | 948,828 | ||||||
Series 2015B | 1,000 | 941,110 | ||||||
Virginia College Building Authority | 550 | 612,513 | ||||||
Virginia Small Business Financing Authority | 16,405 | 16,347,254 | ||||||
5.50%, 01/01/2042 | 3,580 | 3,536,825 | ||||||
Virginia Small Business Financing Authority | 2,250 | 2,259,248 | ||||||
|
| |||||||
| 36,513,792 | ||||||||
|
| |||||||
Washington – 2.0% |
| |||||||
Kalispel Tribe of Indians | 750 | 768,465 | ||||||
| 60 | AB MUNICIPAL INCOME SHARES | abfunds.com | |
PORTFOLIO OF INVESTMENTS (continued)
| Principal Amount (000) | U.S. $ Value | |||||||
| ||||||||
King County Public Hospital District No. 4 | $ | 2,235 | $ | 2,295,256 | ||||
Pend Oreille County Public Utility District No. 1 Box Canyon | 9,000 | 10,073,880 | ||||||
Port of Seattle WA | 5,035 | 5,454,214 | ||||||
State of Washington | 12,015 | 14,574,581 | ||||||
Washington Health Care Facilities Authority | 6,970 | 7,501,321 | ||||||
5.00%, 08/01/2044(j) | 11,835 | 12,625,460 | ||||||
Washington Health Care Facilities Authority | 2,350 | 2,615,620 | ||||||
Series 2017B | 1,855 | 2,079,641 | ||||||
Washington Health Care Facilities Authority | 18,005 | 18,655,277 | ||||||
Washington State Housing Finance Commission | 3,550 | 3,576,270 | ||||||
Washington State Housing Finance Commission | 2,790 | 2,558,354 | ||||||
Series 2019A | 9,220 | 7,655,110 | ||||||
Washington State Housing Finance Commission | 3,215 | 3,355,785 | ||||||
|
| |||||||
| 93,789,234 | ||||||||
|
| |||||||
| abfunds.com | AB MUNICIPAL INCOME SHARES | 61 | |
PORTFOLIO OF INVESTMENTS (continued)
| Principal Amount (000) | U.S. $ Value | |||||||
| ||||||||
West Virginia – 0.0% |
| |||||||
West Virginia Hospital Finance Authority | $ | 2,100 | $ | 2,220,834 | ||||
|
| |||||||
Wisconsin – 1.9% |
| |||||||
UMA Education, Inc. | 21,005 | 21,240,814 | ||||||
Wisconsin Health & Educational Facilities Authority | 20,345 | 22,381,128 | ||||||
Wisconsin Health & Educational Facilities Authority | 1,000 | 1,081,790 | ||||||
Wisconsin Health & Educational Facilities Authority | 3,690 | 3,130,704 | ||||||
Wisconsin Health & Educational Facilities Authority | 7,405 | 7,992,856 | ||||||
Wisconsin Public Finance Authority | 1,340 | 1,093,748 | ||||||
Wisconsin Public Finance Authority | 3,335 | 2,994,997 | ||||||
Wisconsin Public Finance Authority | 2,060 | 1,877,196 | ||||||
Series 2016D | 720 | 641,851 | ||||||
Wisconsin Public Finance Authority | 2,650 | 2,711,355 | ||||||
| 62 | AB MUNICIPAL INCOME SHARES | abfunds.com | |
PORTFOLIO OF INVESTMENTS (continued)
| Principal Amount (000) | U.S. $ Value | |||||||
| ||||||||
Wisconsin Public Finance Authority | $ | 3,225 | $ | 3,224,422 | ||||
Wisconsin Public Finance Authority | 2,685 | 2,635,811 | ||||||
6.375%, 01/01/2048(a) | 11,270 | 10,792,603 | ||||||
Wisconsin Public Finance Authority | 1,550 | 1,495,719 | ||||||
Wisconsin Public Finance Authority | 1,000 | 953,300 | ||||||
Wisconsin Public Finance Authority | 4,650 | 4,166,342 | ||||||
Wisconsin Public Finance Authority | 545 | 539,768 | ||||||
|
| |||||||
| 88,954,404 | ||||||||
|
| |||||||
Total Municipal Obligations | 4,553,874,401 | |||||||
|
| |||||||
GOVERNMENTS – TREASURIES – 1.0% | ||||||||
United States – 1.0% | ||||||||
U.S. Treasury Bonds 2.00%, 02/15/2050 | 40,000 | 47,212,500 | ||||||
|
| |||||||
| Shares | ||||||||
SHORT-TERM INVESTMENTS – 1.5% | ||||||||
Investment Companies – 1.5% | ||||||||
AB Fixed Income Shares, Inc. – Government Money Market Portfolio – Class AB, | 69,467,829 | 69,467,829 | ||||||
|
| |||||||
Total Investments – 99.7% | 4,670,554,730 | |||||||
Other assets less liabilities – 0.3% | 15,356,041 | |||||||
|
| |||||||
Net Assets – 100.0% | $ | 4,685,910,771 | ||||||
|
| |||||||
| abfunds.com | AB MUNICIPAL INCOME SHARES | 63 | |
PORTFOLIO OF INVESTMENTS (continued)
CENTRALLY CLEARED INFLATION (CPI) SWAPS (see Note C)
| Rate Type | ||||||||||||||||||||||||||
Notional | Termination Date | Payments made by the Fund | Payments received by the Fund | Payment Frequency Paid/ Received | Market Value | Upfront Premiums Paid (Received) | Unrealized Appreciation/ (Depreciation) | |||||||||||||||||||
USD | 437,230 | 06/17/2024 | CPI# | 1.760% | Maturity | $ | 18,715,236 | $ | (17,421,411 | ) | $ | 1,293,825 | ||||||||||||||
USD | 437,230 | 06/17/2024 | 1.760% | CPI# | Maturity | (18,715,232 | ) | — | (18,715,232 | ) | ||||||||||||||||
USD | 256,170 | 01/15/2025 | 1.671% | CPI# | Maturity | (10,344,078 | ) | — | (10,344,078 | ) | ||||||||||||||||
USD | 123,108 | 01/15/2025 | 1.637% | CPI# | Maturity | (4,950,792 | ) | — | (4,950,792 | ) | ||||||||||||||||
USD | 275,432 | 01/15/2025 | 1.637% | CPI# | Maturity | (11,602,724 | ) | — | (11,602,724 | ) | ||||||||||||||||
USD | 371,020 | 01/15/2028 | 0.735% | CPI# | Maturity | 13,979,284 | — | 13,979,284 | ||||||||||||||||||
USD | 219,860 | 01/15/2028 | 1.230% | CPI# | Maturity | (829,321 | ) | — | (829,321 | ) | ||||||||||||||||
|
|
|
|
|
| |||||||||||||||||||||
| $ | (13,747,627 | ) | $ | (17,421,411 | ) | $ | (31,169,038 | ) | ||||||||||||||||||
|
|
|
|
|
| |||||||||||||||||||||
| # | Variable interest rate based on the rate of inflation as determined by the Consumer Price Index (CPI). |
CENTRALLY CLEARED INTEREST RATE SWAPS (see Note C)
| Rate Type | ||||||||||||||||||||||||||||||||
Notional | Termination Date | Payments made by the Fund | Payments received by the Fund | Payment Frequency Paid/ Received | Market Value | Upfront Premiums Paid (Received) | Unrealized Appreciation/ (Depreciation) | |||||||||||||||||||||||||
USD | 514,490 | 06/17/2021 | | 3 Month LIBOR | | 1.907% | | Quarterly/ Semi-Annual | | $ | 12,050,470 | $ | — | $ | 12,050,470 | |||||||||||||||||
USD | 250,000 | 10/15/2024 | | 3 Month LIBOR | | 1.582% | | Quarterly/ Semi-Annual | | 13,166,875 | — | 13,166,875 | ||||||||||||||||||||
USD | 80,600 | 01/15/2025 | | 3 Month LIBOR | | 1.566% | | Quarterly/ Semi-Annual | | 4,695,045 | — | 4,695,045 | ||||||||||||||||||||
USD | 146,650 | 01/16/2025 | | 3 Month LIBOR | | 1.623% | | Quarterly/ Semi-Annual | | 8,974,386 | — | 8,974,386 | ||||||||||||||||||||
USD | 115,000 | 03/18/2029 | | 3 Month LIBOR | | 2.661% | | Quarterly/ Semi-Annual | | 21,093,356 | — | 21,093,356 | ||||||||||||||||||||
USD | 47,210 | 04/15/2044 | 1.463% | | 3 Month LIBOR | | | Semi-Annual/ Quarterly | | (6,959,487 | ) | — | (6,959,487 | ) | ||||||||||||||||||
USD | 40,000 | 04/15/2044 | 0.738% | | 3 Month LIBOR | | | Semi-Annual/ Quarterly | | 359,994 | — | 359,994 | ||||||||||||||||||||
USD | 40,000 | 04/15/2044 | 1.281% | | 3 Month LIBOR | | | Semi-Annual/ Quarterly | | (4,244,904 | ) | — | (4,244,904 | ) | ||||||||||||||||||
USD | 25,000 | 04/15/2044 | 0.931% | | 3 Month LIBOR | | | Semi-Annual/ Quarterly | | (672,727 | ) | — | (672,727 | ) | ||||||||||||||||||
USD | 25,000 | 04/15/2044 | 0.755% | | 3 Month LIBOR | | | Semi-Annual/ Quarterly | | 324,703 | — | 324,703 | ||||||||||||||||||||
USD | 37,250 | 04/16/2049 | | 3 Month LIBOR | | 2.746% | | Quarterly/ Semi-Annual | 19,344,235 | — | 19,344,235 | |||||||||||||||||||||
|
|
|
|
|
| |||||||||||||||||||||||||||
| $ | 68,131,946 | $ | — | $ | 68,131,946 | |||||||||||||||||||||||||||
|
|
|
|
|
| |||||||||||||||||||||||||||
| 64 | AB MUNICIPAL INCOME SHARES | abfunds.com | |
PORTFOLIO OF INVESTMENTS (continued)
INFLATION (CPI) SWAPS (see Note C)
| Rate Type | ||||||||||||||||||||||||||||||||||||
| Swap Counterparty | Notional Amount (000) | Termination Date | Payments made by the Fund | Payments received by the Fund | Payment Frequency Paid Received | Market Value | Upfront Premiums Paid (Received) | Unrealized Appreciation/ (Depreciation) | ||||||||||||||||||||||||||||
Barclays Bank PLC | USD | 50,003 | 09/20/2020 | 2.263 | % | CPI | # | Maturity | $ | (1,057,878 | ) | $ | — | $ | (1,057,878 | ) | ||||||||||||||||||||
Barclays Bank PLC | USD | 42,028 | 10/15/2020 | 2.208 | % | CPI | # | Maturity | (889,942 | ) | — | (889,942 | ) | |||||||||||||||||||||||
Barclays Bank PLC | USD | 25,607 | 10/15/2020 | 2.210 | % | CPI | # | Maturity | (543,536 | ) | — | (543,536 | ) | |||||||||||||||||||||||
Citibank, NA | USD | 30,570 | 10/17/2020 | 2.220 | % | CPI | # | Maturity | (659,912 | ) | — | (659,912 | ) | |||||||||||||||||||||||
JPMorgan Chase Bank, NA | USD | 50,936 | 08/30/2020 | 2.210 | % | CPI | # | Maturity | (967,586 | ) | — | (967,586 | ) | |||||||||||||||||||||||
|
|
|
|
|
| |||||||||||||||||||||||||||||||
| $ | (4,118,854 | ) | $ | — | $ | (4,118,854 | ) | |||||||||||||||||||||||||||||
|
|
|
|
|
| |||||||||||||||||||||||||||||||
| # | Variable interest rate based on the rate of inflation as determined by the Consumer Price Index (CPI). |
INTEREST RATE SWAPS (see Note C)
| Rate Type | ||||||||||||||||||||||||||||||||||||
| Swap Counterparty | Notional Amount (000) | Termination Date | Payments made by the Fund | Payments received by the Fund | Payment Frequency Paid Received | Market Value | Upfront Premiums Paid (Received) | Unrealized Appreciation/ (Depreciation) | ||||||||||||||||||||||||||||
Citibank, NA | USD | 100 | 01/09/2051 | | 30 Year Muni Rate Lock | | 2.250 | % | Maturity | $ | (451 | ) | $ | — | $ | (451 | ) | |||||||||||||||||||
Citibank, NA | USD | 52,610 | 10/09/2029 | 1.120 | % | SIFMA | * | | Quarterly/ Quarterly | | (2,587,653 | ) | — | (2,587,653 | ) | |||||||||||||||||||||
Citibank, NA | USD | 52,610 | 10/09/2029 | 1.125 | % | SIFMA | * | | Quarterly/ Quarterly | | (2,614,849 | ) | — | (2,614,849 | ) | |||||||||||||||||||||
|
|
|
|
|
| |||||||||||||||||||||||||||||||
| $ | (5,202,953 | ) | $ | — | $ | (5,202,953 | ) | |||||||||||||||||||||||||||||
|
|
|
|
|
| |||||||||||||||||||||||||||||||
| * | Variable interest rate based on the Securities Industry & Financial Markets Association (SIFMA) Municipal |
| (a) | Security is exempt from registration under Rule 144A of the Securities Act of 1933. These securities are considered restricted, but liquid and may be resold in transactions exempt from registration, normally to qualified institutional buyers. At April 30, 2020, the aggregate market value of these securities amounted to $388,700,783 or 8.3% of net assets. |
| (b) | Security represents the underlying municipal obligation of an inverse floating rate obligation held by the Fund (see Note H). |
| (c) | When-Issued or delayed delivery security. |
| (d) | An auction rate security whose interest rate resets at each auction date. Auctions are typically held every week or month. The rate shown is as of April 30, 2020 and the aggregate market value of these securities amounted to $14,950,000 or 0.32% of net assets. |
| (e) | Illiquid security. |
| (f) | Defaulted. |
| (g) | Non-income producing security. |
| (h) | Restricted and illiquid security. |
| abfunds.com | AB MUNICIPAL INCOME SHARES | 65 | |
PORTFOLIO OF INVESTMENTS (continued)
| Restricted & Illiquid Securities | Acquisition Date | Cost | Market Value | Percentage of Net Assets | ||||||||||||
Jefferson Parish Hospital Service District No. 2 | 09/04/2014 | $ | 2,175,906 | $ | 2,157,456 | 0.05 | % | |||||||||
Louisiana Public Facilities Authority | 11/22/2013 | 1,973,785 | 27 | 0.00 | % | |||||||||||
Louisiana Public Facilities Authority | 07/31/2014 | 868,862 | 13 | 0.00 | % | |||||||||||
Sanger Industrial Development Corp. (Texas Pellets, Inc.) | 08/31/2012 | 2,213,171 | 545,000 | 0.01 | % | |||||||||||
| (i) | Security is exempt from registration under Rule 144A of the Securities Act of 1933. These securities, which represent 0.36% of net assets as of April 30, 2020, are considered illiquid and restricted. Additional information regarding such securities follows: |
| 144A/Restricted & Illiquid Securities | Acquisition Date | Cost | Market Value | Percentage of Net Assets | ||||||||||||
Kansas City Industrial Development Authority | ||||||||||||||||
Series 2016 6.00%, 11/15/2046 | 12/18/2015 | $ | 2,931,841 | $ | 1,835,634 | 0.04 | % | |||||||||
Massachusetts Development Finance Agency | ||||||||||||||||
Series 2017 8.00%, 12/01/2022 | 12/07/2017 | 9,452,901 | 8,693,018 | 0.19 | % | |||||||||||
Massachusetts Development Finance Agency | ||||||||||||||||
Series 2017A 7.75%, 12/01/2044 | 12/07/2017 | 4,525,000 | 3,315,829 | 0.07 | % | |||||||||||
Nassau County Industrial Development Agency | ||||||||||||||||
Series 2014C 2.00%, 01/01/2049 | 03/21/2014 | 5,138 | 77,066 | 0.00 | % | |||||||||||
Scranton-Lackawanna Health & Welfare Authority | ||||||||||||||||
Series 2016D 0.0%, 01/01/2057 | 11/29/2017 | 5,563,943 | 3,007,830 | 0.06 | % | |||||||||||
| 66 | AB MUNICIPAL INCOME SHARES | abfunds.com | |
PORTFOLIO OF INVESTMENTS (continued)
| (j) | Position, or a portion thereof, has been segregated to collateralize OTC derivatives outstanding. |
| (k) | Affiliated investments. |
| (l) | The rate shown represents the 7-day yield as of period end. |
| (m) | To obtain a copy of the fund’s shareholder report, please go to the Securities and Exchange Commission’s website at www.sec.gov, or call AB at (800) 227-4618. |
As of April 30, 2020, the Fund’s percentages of investments in municipal bonds that are insured and in insured municipal bonds that have been pre-refunded or escrowed to maturity are 2.9% and 0.1%, respectively.
Glossary:
AGC – Assured Guaranty Corporation
AGM – Assured Guaranty Municipal
BAM – Build American Mutual
COP – Certificate of Participation
ETM – Escrowed to Maturity
GO – General Obligation
LIBOR – London Interbank Offered Rates
NATL – National Interstate Corporation
OSF – Order of St. Francis
SD – School District
UPMC – University of Pittsburgh Medical Center
XLCA – XL Capital Assurance Inc.
See notes to financial statements.
| abfunds.com | AB MUNICIPAL INCOME SHARES | 67 | |
STATEMENT OF ASSETS & LIABILITIES
April 30, 2020
| Assets | ||||
Investments in securities, at value | ||||
Unaffiliated issuers (cost $4,855,139,029) | $ | 4,601,086,901 | ||
Affiliated issuers (cost $69,467,829) | 69,467,829 | |||
Cash | 683,633 | |||
Cash collateral due from broker | 91,933,504 | |||
Interest receivable | 64,312,509 | |||
Receivable for shares of beneficial interest sold | 22,609,843 | |||
Receivable for investment securities sold | 99,721 | |||
Affiliated dividends receivable | 34,576 | |||
Receivable due from Adviser | 7,918 | |||
|
| |||
Total assets | 4,850,236,434 | |||
|
| |||
| Liabilities |
| |||
Payable for investment securities purchased | 72,907,408 | |||
Payable for floating rate notes issued* | 62,450,000 | |||
Dividends payable | 15,023,402 | |||
Unrealized depreciation on interest rate swaps | 5,202,953 | |||
Unrealized depreciation on inflation swaps | 4,118,854 | |||
Payable for shares of beneficial interest redeemed | 3,835,644 | |||
Payable for variation margin on centrally cleared swaps | 448,096 | |||
Other liabilities | 339,306 | |||
|
| |||
Total liabilities | 164,325,663 | |||
|
| |||
Net Assets | $ | 4,685,910,771 | ||
|
| |||
| Composition of Net Assets |
| |||
Shares of beneficial interest, at par | $ | 4,338 | ||
Additional paid-in capital | 4,973,163,671 | |||
Accumulated loss | (287,257,238 | ) | ||
|
| |||
| $ | 4,685,910,771 | |||
|
| |||
Net Asset Value Per Share—unlimited shares of beneficial interest authorized, $.00001 par value (based on 433,789,357 common shares outstanding) | $ | 10.80 | ||
|
| |||
| * | Represents short-term floating rate certificates issued by tender option bond trusts (see Note H). |
See notes to financial statements.
| 68 | AB MUNICIPAL INCOME SHARES | abfunds.com | |
STATEMENT OF OPERATIONS
Year Ended April 30, 2020
| Investment Income | ||||||||
Interest | $ | 152,782,380 | ||||||
Dividends—Affiliated issuers | 1,720,592 | |||||||
Other income(a) | 97,612 | $ | 154,600,584 | |||||
|
| |||||||
| Expenses | ||||||||
Interest expense | 229,846 | |||||||
|
| |||||||
Total expenses | 229,846 | |||||||
|
| |||||||
Net investment income | 154,370,738 | |||||||
|
| |||||||
| Realized and Unrealized Gain (Loss) on Investment Transactions | ||||||||
Net realized loss on: | ||||||||
Investment transactions | 7,087,565 | |||||||
Swaps | (63,776,051 | ) | ||||||
Net change in unrealized appreciation/depreciation of: | ||||||||
Investments | (371,668,001 | ) | ||||||
Swaps | 29,083,372 | |||||||
|
| |||||||
Net loss on investment transactions | (399,273,115 | ) | ||||||
|
| |||||||
Net Decrease in Net Assets from Operations | $ | (244,902,377 | ) | |||||
|
|
| (a) | Other income includes a reimbursement for investment in affiliated issuer (see Note B). |
See notes to financial statements.
| abfunds.com | AB MUNICIPAL INCOME SHARES | 69 | |
STATEMENT OF CHANGES IN NET ASSETS
| Year Ended April 30, 2020 | Year Ended April 30, 2019 | |||||||
| Increase (Decrease) in Net Assets from Operations | ||||||||
Net investment income | $ | 154,370,738 | $ | 119,281,882 | ||||
Net realized loss on investment transactions | (56,688,486 | ) | (2,269,690 | ) | ||||
Net change in unrealized appreciation/depreciation of investments | (342,584,629 | ) | 110,839,076 | |||||
|
|
|
| |||||
Net increase (decrease) in net assets from operations | (244,902,377 | ) | 227,851,268 | |||||
Distribution to Shareholders | (154,514,928 | ) | (121,039,748 | ) | ||||
| Transactions in Shares of Beneficial Interest | ||||||||
Net increase | 1,575,752,846 | 641,871,214 | ||||||
|
|
|
| |||||
Total increase | 1,176,335,541 | 748,682,734 | ||||||
| Net Assets | ||||||||
Beginning of period | 3,509,575,230 | 2,760,892,496 | ||||||
|
|
|
| |||||
End of period | $ | 4,685,910,771 | $ | 3,509,575,230 | ||||
|
|
|
| |||||
See notes to financial statements.
| 70 | AB MUNICIPAL INCOME SHARES | abfunds.com | |
NOTES TO FINANCIAL STATEMENTS
April 30, 2020
NOTE A
Significant Accounting Policies
AB Corporate Shares (the “Trust”) was organized as a Massachusetts business trust under the laws of The Commonwealth of Massachusetts by an Agreement and Declaration of Trust dated January 26, 2004. The Trust is registered under the Investment Company Act of 1940, as an open-end, diversified management investment company. The Trust operates as a “series” company currently offering five separate portfolios: AB Corporate Income Shares, AB Municipal Income Shares, AB Taxable Multi-Sector Income Shares, AB Impact Municipal Income Shares and AB Tax-Aware Real Return Income Shares. Each portfolio is considered to be a separate entity for financial reporting and tax purposes. This report relates only to AB Municipal Income Shares (the “Fund”).
Shares of the Fund are offered exclusively to holders of accounts established under wrap-fee programs sponsored and maintained by certain registered investment advisers approved by AllianceBernstein L.P. (the “Adviser”). The Fund’s shares may be purchased at the relevant net asset value without a sales charge or other fee. The financial statements have been prepared in conformity with U.S. generally accepted accounting principles (“U.S. GAAP”) which require management to make certain estimates and assumptions that affect the reported amounts of assets and liabilities in the financial statements and amounts of income and expenses during the reporting period. Actual results could differ from those estimates. The Fund is an investment company under U.S. GAAP and follows the accounting and reporting guidance applicable to investment companies. The following is a summary of significant accounting policies followed by the Fund.
1. Security Valuation
Portfolio securities are valued at their current market value determined on the basis of market quotations or, if market quotations are not readily available or are deemed unreliable, at “fair value” as determined in accordance with procedures established by and under the general supervision of the Trust’s Board of Trustees (the “Board”).
In general, the market values of securities which are readily available and deemed reliable are determined as follows: securities listed on a national securities exchange (other than securities listed on the NASDAQ Stock Market, Inc. (“NASDAQ”)) or on a foreign securities exchange are valued at the last sale price at the close of the exchange or foreign securities exchange. If there has been no sale on such day, the securities are valued at the last traded price from the previous day. Securities listed on more than one exchange are valued by reference to the principal exchange on
| abfunds.com | AB MUNICIPAL INCOME SHARES | 71 | |
NOTES TO FINANCIAL STATEMENTS (continued)
which the securities are traded; securities listed only on NASDAQ are valued in accordance with the NASDAQ Official Closing Price; listed or over the counter (“OTC”) market put or call options are valued at the mid level between the current bid and ask prices. If either a current bid or current ask price is unavailable, the Adviser will have discretion to determine the best valuation (e.g., last trade price in the case of listed options); open futures are valued using the closing settlement price or, in the absence of such a price, the most recent quoted bid price. If there are no quotations available for the day of valuation, the last available closing settlement price is used; U.S. Government securities and any other debt instruments having 60 days or less remaining until maturity are generally valued at market by an independent pricing vendor, if a market price is available. If a market price is not available, the securities are valued at amortized cost. This methodology is commonly used for short term securities that have an original maturity of 60 days or less, as well as short term securities that had an original term to maturity that exceeded 60 days. In instances when amortized cost is utilized, the Valuation Committee (the “Committee”) must reasonably conclude that the utilization of amortized cost is approximately the same as the fair value of the security. Such factors the Committee will consider include, but are not limited to, an impairment of the creditworthiness of the issuer or material changes in interest rates. Fixed-income securities, including mortgage-backed and asset-backed securities, may be valued on the basis of prices provided by a pricing service or at a price obtained from one or more of the major broker-dealers. In cases where broker-dealer quotes are obtained, the Adviser may establish procedures whereby changes in market yields or spreads are used to adjust, on a daily basis, a recently obtained quoted price on a security. Swaps and other derivatives are valued daily, primarily using independent pricing services, independent pricing models using market inputs, as well as third party broker-dealers or counterparties. Open end mutual funds are valued at the closing net asset value per share, while exchange traded funds are valued at the closing market price per share.
Securities for which market quotations are not readily available (including restricted securities) or are deemed unreliable are valued at fair value as deemed appropriate by the Adviser. Factors considered in making this determination may include, but are not limited to, information obtained by contacting the issuer, analysts, analysis of the issuer’s financial statements or other available documents. In addition, the Fund may use fair value pricing for securities primarily traded in non-U.S. markets because most foreign markets close well before the Fund values its securities at 4:00 p.m., Eastern Time. The earlier close of these foreign markets gives rise to the possibility that significant events, including broad market moves, may have occurred in the interim and may materially affect the value of those securities. To account for this, the Fund generally values many of its foreign
| 72 | AB MUNICIPAL INCOME SHARES | abfunds.com | |
NOTES TO FINANCIAL STATEMENTS (continued)
equity securities using fair value prices based on third party vendor modeling tools to the extent available.
2. Fair Value Measurements
In accordance with U.S. GAAP regarding fair value measurements, fair value is defined as the price that the Fund would receive to sell an asset or pay to transfer a liability in an orderly transaction between market participants at the measurement date. U.S. GAAP establishes a framework for measuring fair value, and a three-level hierarchy for fair value measurements based upon the transparency of inputs to the valuation of an asset or liability (including those valued based on their market values as described in Note A.1 above). Inputs may be observable or unobservable and refer broadly to the assumptions that market participants would use in pricing the asset or liability. Observable inputs reflect the assumptions market participants would use in pricing the asset or liability based on market data obtained from sources independent of the Fund. Unobservable inputs reflect the Fund’s own assumptions about the assumptions that market participants would use in pricing the asset or liability based on the best information available in the circumstances. Each investment is assigned a level based upon the observability of the inputs which are significant to the overall valuation. The three-tier hierarchy of inputs is summarized below.
| • | Level 1—quoted prices in active markets for identical investments |
| • | Level 2—other significant observable inputs (including quoted prices for similar investments, interest rates, prepayment speeds, credit risk, etc.) |
| • | Level 3—significant unobservable inputs (including the Fund’s own assumptions in determining the fair value of investments) |
The fair value of debt instruments, such as bonds, and over-the-counter derivatives is generally based on market price quotations, recently executed market transactions (where observable) or industry recognized modeling techniques and are generally classified as Level 2. Pricing vendor inputs to Level 2 valuations may include quoted prices for similar investments in active markets, interest rate curves, coupon rates, currency rates, yield curves, option adjusted spreads, default rates, credit spreads and other unique security features in order to estimate the relevant cash flows which are then discounted to calculate fair values. If these inputs are unobservable and significant to the fair value, these investments will be classified as Level 3.
Other fixed income investments, including non-U.S. government and corporate debt, are generally valued using quoted market prices, if available, which are typically impacted by current interest rates, maturity dates and any perceived credit risk of the issuer. Additionally, in the absence of
| abfunds.com | AB MUNICIPAL INCOME SHARES | 73 | |
NOTES TO FINANCIAL STATEMENTS (continued)
quoted market prices, these inputs are used by pricing vendors to derive a valuation based upon industry or proprietary models which incorporate issuer specific data with relevant yield/spread comparisons with more widely quoted bonds with similar key characteristics. Those investments for which there are observable inputs are classified as Level 2. Where the inputs are not observable, the investments are classified as Level 3.
The following table summarizes the valuation of the Fund’s investments by the above fair value hierarchy levels as of April 30, 2020:
Investments in | Level 1 | Level 2 | Level 3 | Total | ||||||||||||
Assets: | ||||||||||||||||
Long-Term Municipal Bonds | $ | – 0 | – | $ | 4,553,874,401 | $ | – 0 | – | $ | 4,553,874,401 | ||||||
Governments—Treasuries | – 0 | – | 47,212,500 | – 0 | – | 47,212,500 | ||||||||||
Short-Term Investments | 69,467,829 | – 0 | – | – 0 | – | 69,467,829 | ||||||||||
Liabilities: | ||||||||||||||||
Floating Rate Notes(a) | (62,450,000 | ) | – 0 | – | – 0 | – | (62,450,000 | ) | ||||||||
|
|
|
|
|
|
|
| |||||||||
Total Investments in Securities | 7,017,829 | 4,601,086,901 | – 0 | – | 4,608,104,730 | |||||||||||
Other Financial Instruments(b): | ||||||||||||||||
Assets: | ||||||||||||||||
Centrally Cleared Inflation (CPI) Swaps | – 0 | – | 32,694,520 | – 0 | – | 32,694,520 | (c) | |||||||||
Centrally Cleared Interest Rate Swaps | – 0 | – | 80,009,064 | – 0 | – | 80,009,064 | (c) | |||||||||
Liabilities: | ||||||||||||||||
Centrally Cleared Inflation (CPI) Swaps | – 0 | – | (46,442,147 | ) | – 0 | – | (46,442,147 | )(c) | ||||||||
Centrally Cleared Interest Rate Swaps | – 0 | – | (11,877,118 | ) | – 0 | – | (11,877,118 | )(c) | ||||||||
Inflation (CPI) Swaps | – 0 | – | (4,118,854 | ) | – 0 | – | (4,118,854 | ) | ||||||||
Interest Rate Swaps | – 0 | – | (5,202,953 | ) | – 0 | – | (5,202,953 | ) | ||||||||
|
|
|
|
|
|
|
| |||||||||
Total | $ | 7,017,829 | $ | 4,646,149,413 | $ | – 0 | – | $ | 4,653,167,242 | (d) | ||||||
|
|
|
|
|
|
|
| |||||||||
| (a) | The Fund may hold liabilities in which the fair value approximates the carrying amount for financial statement purposes. |
| (b) | Other financial instruments are derivative instruments, such as futures, forwards and swaps, which are valued at the unrealized appreciation/(depreciation) on the instrument. Other financial instruments may also include swaps with upfront premiums, options written and swaptions written which are valued at market value. |
| (c) | Only variation margin receivable/(payable) at period end is reported within the statement of assets and liabilities. This amount reflects cumulative unrealized appreciation/(depreciation) on futures and centrally cleared swaps as reported in the portfolio of investments. Where applicable, centrally cleared swaps with upfront premiums are presented here at market value. |
| (d) | The amount of $422,761,234 for Long-Term Municipal Bonds was transferred out of Level 3 into Level 2 as improved transparency of price inputs received from pricing vendors has increased the observability during the reporting period. |
| 74 | AB MUNICIPAL INCOME SHARES | abfunds.com | |
NOTES TO FINANCIAL STATEMENTS (continued)
3. Taxes
It is the Fund’s policy to meet the requirements of the Internal Revenue Code applicable to regulated investment companies and to distribute all of its investment company taxable income and net realized gains, if any, to shareholders. Therefore, no provisions for federal income or excise taxes are required.
In accordance with U.S. GAAP requirements regarding accounting for uncertainties in income taxes, management has analyzed the Fund’s tax positions taken or expected to be taken on federal and state income tax returns for all open tax years (the current and the prior three tax years) and has concluded that no provision for income tax is required in the Fund’s financial statements.
4. Investment Income and Investment Transactions
Dividend income is recorded on the ex-dividend date or as soon as the Fund is informed of the dividend. Interest income is accrued daily. Investment transactions are accounted for on the date the securities are purchased or sold. Investment gains or losses are determined on the identified cost basis. The Fund amortizes premiums and accretes discounts as adjustments to interest income.
5. Dividends and Distributions
Dividends and distributions to shareholders, if any, are recorded on the ex-dividend date. Income dividends and capital gains distributions are determined in accordance with federal tax regulations and may differ from those determined in accordance with U.S. GAAP. To the extent these differences are permanent, such amounts are reclassified within the capital accounts based on their federal tax basis treatment; temporary differences do not require such reclassification.
NOTE B
Advisory Fee and Other Transactions with Affiliates
Under the terms of the advisory agreement, the Fund pays no advisory fee to the Adviser and the Adviser reimburses or pays for the Fund’s operating expenses. The Fund is an integral part of separately managed accounts in wrap-fee programs and other investment programs. Typically, participants in these programs pay a fee to their investment adviser for all costs and expenses of the separately managed account, including costs and expenses associated with the Fund, and a fee is paid by their investment adviser to the Adviser. In certain cases, participants may have a direct relationship with the Adviser without the involvement of a third party investment adviser, in which case the participant would pay a fee directly to the Adviser. The Adviser serves as investment manager and adviser of the Fund and continuously furnishes an investment program for the Fund
| abfunds.com | AB MUNICIPAL INCOME SHARES | 75 | |
NOTES TO FINANCIAL STATEMENTS (continued)
and manages, supervises and conducts the affairs of the Fund, subject to the supervisions of the Fund’s Board. The advisory agreement provides that the Adviser or an affiliate will furnish, or pay the expenses of the Fund for, office space, facilities and equipment, services of executive and other personnel of the Fund and certain administrative services.
The Fund has entered into a distribution agreement with AllianceBernstein Investments, Inc., the Fund’s principal underwriter (the “Underwriter”), to permit the Underwriter to distribute the Fund’s shares, which are sold at their net asset value without any sales charge. The Fund does not pay a fee for this service. The Underwriter is a wholly owned subsidiary of the Adviser.
AllianceBernstein Investor Services, Inc. (“ABIS”), a wholly-owned subsidiary of the Adviser, acts as the Fund’s registrar, transfer agent and dividend-disbursing agent. ABIS registers the transfer, issuance and redemption of Fund shares and disburses dividends and other distributions to Fund shareholders. The Fund does not pay a fee for this service.
The Fund may invest in AB Government Money Market Portfolio (the “Government Money Market Portfolio”) which has a contractual annual advisory fee rate of ..20% of the portfolio’s average daily net assets and bears its own expenses. The Adviser has contractually agreed to waive .10% of the advisory fee of Government Money Market Portfolio (resulting in a net advisory fee of .10%) until August 31, 2020. In connection with the investment by the Fund in Government Money Market Portfolio, the Adviser has contractually agreed to reimburse the Fund in an amount equal to the Fund’s pro rata share of the effective advisory fee of Government Money Market Portfolio, as borne indirectly by the Fund as an acquired fund fee and expense. For the year ended April 30, 2020, such reimbursement amounted to $97,612.
A summary of the Fund’s transactions in AB mutual funds for the year ended April 30, 2020 is as follows:
Fund | Market Value 4/30/19 (000) | Purchases at Cost (000) | Sales Proceeds (000) | Market Value 4/30/20 (000) | Dividend Income (000) | |||||||||||||||
Government Money Market Portfolio | $ | 75,312 | $ | 1,387,874 | $ | 1,393,718 | $ | 69,468 | $ | 1,721 | ||||||||||
During the second quarter of 2018, AXA S.A. (“AXA”), a French holding company for the AXA Group, completed the sale of a minority stake in its subsidiary, AXA Equitable Holdings, Inc. (now named Equitable Holdings,
| 76 | AB MUNICIPAL INCOME SHARES | abfunds.com | |
NOTES TO FINANCIAL STATEMENTS (continued)
Inc.)(“Equitable”), through an initial public offering. Equitable is the holding company for a diverse group of financial services companies, including an approximately 64.9% economic interest in the Adviser and a 100% interest in AllianceBernstein Corporation, the general partner of the Adviser. Since the initial sale, AXA has completed additional offerings, most recently during the fourth quarter of 2019. As a result, AXA currently owns less than 10% of the outstanding shares of common stock of Equitable, and no longer owns a controlling interest in Equitable. AXA previously announced its intention to sell its entire interest in Equitable over time, subject to market conditions and other factors (the “Plan”). Most of AXA’s remaining Equitable shares are to be delivered on redemption of AXA bonds mandatorily exchangeable into Equitable shares and maturing in May 2021. AXA retains sole discretion to determine the timing of any future sales of its remaining shares of Equitable common stock.
Sales under the Plan that were completed on November 13, 2019 resulted in the indirect transfer of a “controlling block” of voting securities of the Adviser (a “Change of Control Event”) and may have been deemed to have been an “assignment” causing a termination of the Fund’s investment advisory and administration agreements. In order to ensure that investment advisory and administration services could continue uninterrupted in the event of a Change of Control Event, the Board previously approved new investment advisory and administration agreements with the Adviser, and shareholders of the Fund subsequently approved the new investment advisory agreement. These agreements became effective on November 13, 2019.
NOTE C
Investment Transactions
Purchases and sales of investment securities (excluding short-term investments) for the year ended April 30, 2020 were as follows:
| Purchases | Sales | |||||||
Investment securities (excluding U.S. government securities) | $ | 2,160,089,705 | $ | 502,292,093 | ||||
U.S. government securities | 47,110,156 | – 0 | – | |||||
The cost of investments for federal income tax purposes, gross unrealized appreciation and unrealized depreciation are as follows:
Cost | $ | 4,863,093,120 | ||
|
| |||
Gross unrealized appreciation | $ | 146,151,581 | ||
Gross unrealized depreciation | (378,181,906 | ) | ||
|
| |||
Net unrealized depreciation | $ | (232,030,325 | ) | |
|
|
| abfunds.com | AB MUNICIPAL INCOME SHARES | 77 | |
NOTES TO FINANCIAL STATEMENTS (continued)
1. Derivative Financial Instruments
The Fund may use derivatives in an effort to earn income and enhance returns, to replace more traditional direct investments, to obtain exposure to otherwise inaccessible markets (collectively, “investment purposes”), or to hedge or adjust the risk profile of its portfolio.
The principal types of derivatives utilized by the Fund, as well as the methods in which they may be used are:
| • | Swaps |
The Fund may enter into swaps to hedge its exposure to interest rates or credit risk. A swap is an agreement that obligates two parties to exchange a series of cash flows at specified intervals based upon or calculated by reference to changes in specified prices or rates for a specified amount of an underlying asset. The payment flows are usually netted against each other, with the difference being paid by one party to the other. In addition, collateral may be pledged or received by the Fund in accordance with the terms of the respective swaps to provide value and recourse to the Fund or its counterparties in the event of default, bankruptcy or insolvency by one of the parties to the swap.
Risks may arise as a result of the failure of the counterparty to the swap to comply with the terms of the swap. The loss incurred by the failure of a counterparty is generally limited to the net interim payment to be received by the Fund, and/or the termination value at the end of the contract. Therefore, the Fund considers the creditworthiness of each counterparty to a swap in evaluating potential counterparty risk. This risk is mitigated by having a netting arrangement between the Fund and the counterparty and by the posting of collateral by the counterparty to the Fund to cover the Fund’s exposure to the counterparty. Additionally, risks may arise from unanticipated movements in interest rates or in the value of the underlying securities. The Fund accrues for the interim payments on swaps on a daily basis, with the net amount recorded within unrealized appreciation/depreciation of swaps on the statement of assets and liabilities, where applicable. Once the interim payments are settled in cash, the net amount is recorded as realized gain/(loss) on swaps on the statement of operations, in addition to any realized gain/(loss) recorded upon the termination of swaps. Upfront premiums paid or received for OTC swaps are recognized as cost or proceeds on the statement of assets and liabilities and are amortized on a straight line basis over the life of the contract. Amortized upfront premiums are included in net realized gain/(loss) from swaps on the statement of operations. Fluctuations in the value of swaps are recorded as a component of net change in unrealized appreciation/depreciation of swaps on the statement of operations.
| 78 | AB MUNICIPAL INCOME SHARES | abfunds.com | |
NOTES TO FINANCIAL STATEMENTS (continued)
Certain standardized swaps, including certain interest rate swaps and credit default swaps, are (or soon will be) subject to mandatory central clearing. Cleared swaps are transacted through futures commission merchants (“FCMs”) that are members of central clearinghouses, with the clearinghouse serving as central counterparty, similar to transactions in futures contracts. Centralized clearing will be required for additional categories of swaps on a phased-in basis based on requirements published by the Securities and Exchange Commission and Commodity Futures Trading Commission.
At the time the Fund enters into a centrally cleared swap, the Fund deposits and maintains as collateral an initial margin with the broker, as required by the clearinghouse on which the transaction is effected. Such amount is shown as cash collateral due from broker on the statement of assets and liabilities. Pursuant to the contract, the Fund agrees to receive from or pay to the broker an amount of cash equal to the daily fluctuation in the value of the contract. Such receipts or payments are known as variation margin and are recorded by the Fund as unrealized gains or losses. Risks may arise from the potential inability of a counterparty to meet the terms of the contract. The credit/counterparty risk for centrally cleared swaps is generally less than non-centrally cleared swaps, since the clearinghouse, which is the issuer or counterparty to each centrally cleared swap, has robust risk mitigation standards, including the requirement to provide initial and variation margin. When the contract is closed, the Fund records a realized gain or loss equal to the difference between the value of the contract at the time it was opened and the time it was closed.
Interest Rate Swaps:
The Fund is subject to interest rate risk exposure in the normal course of pursuing its investment objectives. Because the Fund holds fixed rate bonds, the value of these bonds may decrease if interest rates rise. To help hedge against this risk and to maintain its ability to generate income at prevailing market rates, the Fund may enter into interest rate swaps. Interest rate swaps are agreements between two parties to exchange cash flows based on a notional amount. The Fund may elect to pay a fixed rate and receive a floating rate, or, receive a fixed rate and pay a floating rate on a notional amount.
In addition, the Fund may also enter into interest rate swap transactions to preserve a return or spread on a particular investment or portion of its portfolio, or protecting against an increase in the price of securities the Fund anticipates purchasing at a later date. Interest rate swaps involve the exchange by a Fund with another party of their respective commitments to pay or receive interest (e.g., an exchange of floating rate payments for fixed rate payments) computed based on
| abfunds.com | AB MUNICIPAL INCOME SHARES | 79 | |
NOTES TO FINANCIAL STATEMENTS (continued)
a contractually-based principal (or “notional”) amount. Interest rate swaps are entered into on a net basis (i.e., the two payment streams are netted out, with the Fund receiving or paying, as the case may be, only the net amount of the two payments).
During the year ended April 30, 2020, the Fund held interest rate swaps for hedging purposes.
Inflation (CPI) Swaps:
Inflation swap agreements are contracts in which one party agrees to pay the cumulative percentage increase in a price index (the Consumer Price Index with respect to CPI swaps) over the term of the swap (with some lag on the inflation index), and the other pays a compounded fixed rate. Inflation swaps may be used to protect the net asset value, or NAV, of a Fund against an unexpected change in the rate of inflation measured by an inflation index since the value of these agreements is expected to increase if there are unexpected inflation increases.
During the year ended April 30, 2020, the Fund held inflation (CPI) swaps for hedging purposes.
The Fund typically enters into International Swaps and Derivatives Association, Inc. Master Agreements (“ISDA Master Agreement”) with its OTC derivative contract counterparties in order to, among other things, reduce its credit risk to OTC counterparties. ISDA Master Agreements include provisions for general obligations, representations, collateral and events of default or termination. Under an ISDA Master Agreement, the Fund typically may offset with the OTC counterparty certain derivative financial instruments’ payables and/or receivables with collateral held and/or posted and create one single net payment (close-out netting) in the event of default or termination. In the event of a default by an OTC counterparty, the return of collateral with market value in excess of the Fund’s net liability, held by the defaulting party, may be delayed or denied.
The Fund’s ISDA Master Agreements may contain provisions for early termination of OTC derivative transactions in the event the net assets of the Fund decline below specific levels (“net asset contingent features”). If these levels are triggered, the Fund’s OTC counterparty has the right to terminate such transaction and require the Fund to pay or receive a settlement amount in connection with the terminated transaction. If OTC derivatives were held at period end, please refer to netting arrangements by the OTC counterparty table below for additional details.
| 80 | AB MUNICIPAL INCOME SHARES | abfunds.com | |
NOTES TO FINANCIAL STATEMENTS (continued)
During the year ended April 30, 2020, the Fund had entered into the following derivatives:
Asset Derivatives | Liability Derivatives | |||||||||||
Derivative | Statement of | Fair Value | Statement of | Fair Value | ||||||||
Interest rate contracts | Receivable/Payable for variation margin on centrally cleared swaps | $ | 95,282,173 | * | Receivable/Payable for variation margin on centrally cleared swaps | $ | 58,319,265 | * | ||||
Interest rate contracts | Unrealized depreciation on interest rate swaps |
| 5,202,953 |
| ||||||||
Interest rate contracts | Unrealized depreciation on inflation swaps |
| 4,118,854 |
| ||||||||
|
|
|
| |||||||||
Total | $ | 95,282,173 | $ | 67,641,072 | ||||||||
|
|
|
| |||||||||
| * | Only variation margin receivable/payable at period end is reported within the statement of assets and liabilities. |
This amount reflects cumulative unrealized appreciation/(depreciation) on futures and centrally cleared swaps as reported in the portfolio of investments.
Derivative Type | Location of Gain or (Loss) on | Realized Gain or (Loss) on Derivatives | Change in Unrealized Appreciation or (Depreciation) | |||||||
Interest rate contracts | Net realized gain (loss) on swaps; Net change in unrealized appreciation/depreciation of swaps | $ | (63,776,051 | ) | $ | 29,083,372 | ||||
|
|
|
| |||||||
Total | $ | (63,776,051 | ) | $ | 29,083,372 | |||||
|
|
|
| |||||||
| abfunds.com | AB MUNICIPAL INCOME SHARES | 81 | |
NOTES TO FINANCIAL STATEMENTS (continued)
The following table represents the average monthly volume of the Fund’s derivative transactions during the year ended April 30, 2020:
Interest Rate Swaps: | ||||
Average notional amount | $ | 105,291,429 | (a) | |
Inflation Swaps: | ||||
Average notional amount | $ | 778,726,923 | ||
Centrally Cleared Interest Rate Swaps: | ||||
Average notional amount | $ | 889,813,077 | ||
Centrally Cleared Inflation Swaps: | ||||
Average notional amount | $ | 836,133,636 | (b) |
| (a) | Positions were open for seven months during the year. |
| (b) | Positions were open for eleven months during the year. |
For financial reporting purposes, the Fund does not offset derivative assets and derivative liabilities that are subject to netting arrangements in the statement of assets and liabilities.
All OTC derivatives held at period end were subject to netting arrangements. The following table presents the Fund’s derivative assets and liabilities by OTC counterparty net of amounts available for offset under ISDA Master Agreements (“MA”) and net of the related collateral received/pledged by the Fund as of April 30, 2020. Exchange-traded derivatives and centrally cleared swaps are not subject to netting arrangements and as such are excluded from the table.
Counterparty | Derivative Liabilities Subject to a MA | Derivatives Available for Offset | Cash Collateral Pledged* | Security Collateral Pledged* | Net Amount of Derivative Liabilities | |||||||||||||||
Barclays Bank PLC | $ | 2,491,356 | $ | – 0 | – | $ | (2,470,000 | ) | $ | – 0 | – | $ | 21,356 | |||||||
Citibank, NA | 5,862,865 | – 0 | – | (5,862,865 | ) | – 0 | – | – 0 | – | |||||||||||
JPMorgan Chase Bank, NA | 967,586 | – 0 | – | – 0 | – | (967,586 | ) | – 0 | – | |||||||||||
|
|
|
|
|
|
|
|
|
| |||||||||||
Total | $ | 9,321,807 | $ | – 0 | – | $ | (8,332,865 | ) | $ | (967,586 | ) | $ | 21,356 | ^ | ||||||
|
|
|
|
|
|
|
|
|
| |||||||||||
| * | The actual collateral received/pledged may be more than the amount reported due to over-collateralization. |
| ^ | Net amount represents the net receivable/payable that would be due from/to the counterparty in the event of default or termination. The net amount from OTC financial derivative instruments can only be netted across transactions governed under the same master agreement with the same counterparty. |
| 82 | AB MUNICIPAL INCOME SHARES | abfunds.com | |
NOTES TO FINANCIAL STATEMENTS (continued)
NOTE D
Shares of Beneficial Interest
Transactions in shares of beneficial interest were as follows:
| Shares | Amount | |||||||||||||||||||||||
| Year Ended April 30, 2020 | Year Ended April 30, 2019 | Year Ended April 30, | Year Ended April 30, | |||||||||||||||||||||
|
| |||||||||||||||||||||||
Shares sold | 190,409,250 | 117,096,573 | $ | 2,239,043,371 | $ | 1,333,456,463 | ||||||||||||||||||
| ||||||||||||||||||||||||
Shares issued in reinvestment of dividends | 37 | – 0 | – | 448 | – 0 | – | ||||||||||||||||||
| ||||||||||||||||||||||||
Shares redeemed | (56,641,214 | ) | (60,999,172 | ) | (663,290,973 | ) | (691,585,249 | ) | ||||||||||||||||
| ||||||||||||||||||||||||
Net increase | 133,768,073 | 56,097,401 | $ | 1,575,752,846 | $ | 641,871,214 | ||||||||||||||||||
| ||||||||||||||||||||||||
NOTE E
Risks Involved in Investing in the Fund
Market Risk—The market value of a security may move up or down, sometimes rapidly and unpredictably. These fluctuations may cause a security to be worth less than the price originally paid for it, or less than it was worth at an earlier time. Market risk may affect a single issuer, industry, sector of the economy or the market as a whole. Global economies and financial markets are increasingly interconnected, which increases the probabilities that conditions in one country or region might adversely impact issuers in a different country or region. Conditions affecting the general economy, including political, social, or economic instability at the local, regional, or global level may also affect the market value of a security. Health crises, such as pandemic and epidemic diseases, as well as other incidents that interrupt the expected course of events, such as natural disasters, war or civil disturbance, acts of terrorism, power outages and other unforeseeable and external events, and the public response to or fear of such diseases or events, have and may in the future have an adverse effect on the Fund’s investments and net asset value and can lead to increased market volatility. For example, any preventative or protective actions that governments may take in respect of such diseases or events may result in periods of business disruption, inability to obtain raw materials, supplies and component parts, and reduced or disrupted operations for the Fund’s portfolio companies. The occurrence and pendency of such diseases or events could adversely affect the economies and financial markets either in specific countries or worldwide.
Credit Risk—An issuer or guarantor of a fixed-income security, or the counterparty to a derivatives or other contract, may be unable or unwilling to make timely payments of interest or principal, or to otherwise honor its obligations. The issuer or guarantor may default, causing a loss of the full
| abfunds.com | AB MUNICIPAL INCOME SHARES | 83 | |
NOTES TO FINANCIAL STATEMENTS (continued)
principal amount of a security and any accrued interest. The degree of risk for a particular security may be reflected in its credit rating. There is the possibility that the credit rating of a fixed-income security may be downgraded after purchase, which may adversely affect the value of the security. Investments in fixed-income securities with lower ratings tend to have a higher probability that an issuer will default or fail to meet its payment obligations.
Municipal Market Risk—This is the risk that special factors may adversely affect the value of municipal securities and have a significant effect on the yield or value of the Fund’s investments in municipal securities. These factors include economic conditions, political or legislative changes, uncertainties related to the tax status of municipal securities, or the rights of investors in these securities. To the extent that the Fund invests more of its assets in a particular state’s municipal securities, the Fund may be vulnerable to events adversely affecting that state, including economic, political and regulatory occurrences, court decisions, terrorism and catastrophic natural disasters, such as hurricanes or earthquakes. The Fund’s investments in certain municipal securities with principal and interest payments that are made from the revenues of a specific project or facility, and not general tax revenues, may have increased risks. Factors affecting the project or facility, such as local business or economic conditions, could have a significant effect on the project’s ability to make payments of principal and interest on these securities.
The Fund may invest in the municipal securities of Puerto Rico or other US territories and their governmental agencies and municipalities, which are exempt from federal, state, and, where applicable, local income taxes. These municipal securities may have more risks than those of other US issuers of municipal securities. Puerto Rico experienced a significant downturn during the recession. Puerto Rico’s downturn was particularly severe, and Puerto Rico continues to face a very challenging economic and fiscal environment. Municipal securities issued by Puerto Rico issuers have extremely low ratings by the credit rating organizations. More recently Puerto Rico has defaulted on its debt payments, and if the general economic situation in Puerto Rico persists, the volatility and credit quality of Puerto Rican municipal securities will continue to be adversely affected, and the market for such securities may experience continued volatility. In addition, Puerto Rico’s difficulties have resulted in increased volatility in portions of the broader municipal securities market from time to time, and this may recur in the future.
Congress has previously considered making changes to the municipal securities provisions of the Internal Revenue Code that could change the U.S. federal income tax treatment of certain types of municipal securities.
| 84 | AB MUNICIPAL INCOME SHARES | abfunds.com | |
NOTES TO FINANCIAL STATEMENTS (continued)
Tax Risk—There is no guarantee that all of the Fund’s income will remain exempt from federal or state income taxes. From time to time, the U.S. Government and the U.S. Congress consider changes in federal tax law that could limit or eliminate the federal tax exemption for municipal bond income, which would in effect reduce the income received by shareholders from the Fund by increasing taxes on that income. In such event, the Fund’s net asset value, or NAV, could also decline as yields on municipal bonds, which are typically lower than those on taxable bonds, would be expected to increase to approximately the yield of comparable taxable bonds. Actions or anticipated actions affecting the tax exempt status of municipal bonds could also result in significant shareholder redemptions of Fund shares as investors anticipate adverse effects on the Fund or seek higher yields to offset the potential loss of the tax deduction. As a result, the Fund would be required to maintain higher levels of cash to meet the redemptions, which would negatively affect the Fund’s yield. The federal income tax treatment of payments in respect of certain derivative contracts is unclear.
Below Investment Grade Securities Risk—Investments in fixed-income securities with lower ratings (“junk bonds”) tend to have a higher probability that an issuer will default or fail to meet its payment obligations. These securities may be subject to greater price volatility due to such factors as specific corporate developments, interest rate sensitivity and negative perceptions of the junk bond market generally and may be more difficult to trade than other types of securities.
Interest Rate Risk—Changes in interest rates will affect the value of investments in fixed-income securities. When interest rates rise, the value of existing investments in fixed-income securities tends to fall and this decrease in value may not be offset by higher income from new investments. Interest rate risk is generally greater for fixed-income securities with longer maturities or durations.
Inflation Risk—This is the risk that the value of assets or income from investments will be less in the future as inflation decreases the value of money. As inflation increases, the value of the Fund’s assets can decline as can the value of the Fund’s distributions. This risk is significantly greater for fixed-income securities with longer maturities.
Leverage Risk—When the Fund borrows money or otherwise leverages its investments, its performance may be volatile because leverage tends to exaggerate the effect of any increase or decrease in the value of the Fund’s investments. The Fund may create leverage through the use of reverse repurchase arrangements, forward currency exchange contracts, forward commitments, dollar rolls or futures or by borrowing money. The
| abfunds.com | AB MUNICIPAL INCOME SHARES | 85 | |
NOTES TO FINANCIAL STATEMENTS (continued)
use of other types of derivative instruments by the Fund, such as options and swaps, may also result in a form of leverage. Leverage may result in higher returns to the Fund than if the Fund were not leveraged, but may also adversely affect returns, particularly if the market is declining.
Illiquid Investments Risk—Illiquid investments risk exists when particular investments, such as lower-rated securities, are or become difficult to purchase or sell, possibly preventing the Fund from selling such investments at an advantageous price. The Fund is subject to illiquid investments risk because the market for municipal securities is generally smaller than many other markets. Derivatives and securities involving substantial market and credit risk tend to involve greater illiquid investments risk than most other types of investments.
Derivatives Risk—The Fund may enter into derivative transactions such as forwards, options, futures and swaps. Derivatives may be illiquid, difficult to price, and leveraged so that small changes may produce disproportionate losses for the Fund, and subject to counterparty risk to a greater degree than more traditional investments. Derivatives may result in significant losses, including losses that are far greater than the value of the derivatives reflected on the statement of assets and liabilities.
LIBOR Risk—The Fund may invest in certain debt securities, derivatives or other financial instruments that utilize the London Interbank Offered Rate, or “LIBOR,” as a “benchmark” or “reference rate” for various interest rate calculations. In July 2017, the United Kingdom Financial Conduct Authority, which regulates LIBOR, announced a desire to phase out the use of LIBOR by the end of 2021. Although financial regulators and industry working groups have suggested alternative reference rates, such as European Interbank Offer Rate (“EURIBOR”), Sterling Overnight Interbank Average Rate (“SONIA”) and Secured Overnight Financing Rate (“SOFR”), global consensus on alternative rates is lacking and the process for amending existing contracts or instruments to transition away from LIBOR remains unclear. The elimination of LIBOR or changes to other reference rates or any other changes or reforms to the determination or supervision of reference rates could have an adverse impact on the market for, or value of, any securities or payments linked to those reference rates, which may adversely affect the Fund’s performance and/or net asset value. Uncertainty and risk also remain regarding the willingness and ability of issuers and lenders to include revised provisions in new and existing contracts or instruments. Consequently, the transition away from LIBOR to other reference rates may lead to increased volatility and illiquidity in markets that are tied to LIBOR, fluctuations in values of LIBOR-related investments or investments in issuers that utilize LIBOR, increased difficulty in borrowing or refinancing and diminished effectiveness of hedging strat-
| 86 | AB MUNICIPAL INCOME SHARES | abfunds.com | |
NOTES TO FINANCIAL STATEMENTS (continued)
egies, adversely affecting the Fund’s performance. Furthermore, the risks associated with the expected discontinuation of LIBOR and transition may be exacerbated if the work necessary to effect an orderly transition to an alternative reference rate is not completed in a timely manner. Because the usefulness of LIBOR as a benchmark could deteriorate during the transition period, these effects could occur prior to the end of 2021.
Indemnification Risk—In the ordinary course of business, the Fund enters into contracts that contain a variety of indemnifications. The Fund’s maximum exposure under these arrangements is unknown. However, the Fund has not had prior claims or losses pursuant to these indemnification provisions and expects the risk of loss thereunder to be remote. Therefore, the Fund has not accrued any liability in connection with these indemnification provisions.
Management Risk—The Fund is subject to management risk because it is an actively-managed investment fund. The Adviser will apply its investment techniques and risk analyses in making investment decisions, but there is no guarantee that its techniques will produce the intended results.
NOTE F
Joint Credit Facility
A number of open-end mutual funds managed by the Adviser, including the Fund, participate in a $325 million revolving credit facility (the “Facility”) intended to provide short-term financing, if necessary, subject to certain restrictions in connection with abnormal redemption activity. Commitment fees related to the Facility are paid by the Adviser. The Fund did not utilize the Facility during the year ended April 30, 2020.
NOTE G
Distributions to Shareholders
The tax character of distributions paid during the fiscal years ended April 30, 2020 and April 30, 2019 were as follows:
| 2020 | 2019 | |||||||
Distributions paid from: | ||||||||
Ordinary income | $ | 3,709,081 | $ | 2,482,625 | ||||
|
|
|
| |||||
Total taxable distributions | 3,709,081 | 2,482,625 | ||||||
Tax-exempt distributions | 150,805,847 | 118,557,123 | ||||||
|
|
|
| |||||
Total distributions paid | $ | 154,514,928 | $ | 121,039,748 | ||||
|
|
|
| |||||
| abfunds.com | AB MUNICIPAL INCOME SHARES | 87 | |
NOTES TO FINANCIAL STATEMENTS (continued)
As of April 30, 2020, the components of accumulated earnings/(deficit) on a tax basis were as follows:
Undistributed tax-exempt income | $ | 14,476,209 | ||
Accumulated capital and other losses | (53,855,071 | )(a) | ||
Unrealized appreciation/(depreciation) | (232,296,868 | )(b) | ||
|
| |||
Total accumulated earnings/(deficit) | $ | (271,675,730 | )(c) | |
|
|
| (a) | As of April 30, 2020, the Fund had a net capital loss carryforward of $53,855,071. |
| (b) | The differences between book-basis and tax-basis unrealized appreciation/(depreciation) are attributable primarily to the tax treatment of swaps, the tax deferral of losses on wash sales, and the tax treatment of tender option bonds. |
| (c) | The differences between book-basis and tax-basis components of accumulated earnings/(deficit) are attributable primarily to the tax treatment of defaulted securities and dividends payable. |
For tax purposes, net realized capital losses may be carried over to offset future capital gains, if any. Funds are permitted to carry forward capital losses for an indefinite period, and such losses will retain their character as either short-term or long-term capital losses. As of April 30, 2020, the Fund had a net short-term capital loss carryforward of $53,855,071, which may be carried forward for an indefinite period.
During the current fiscal year, there were no permanent differences that resulted in adjustments to accumulated loss or additional paid-in capital.
NOTE H
Floating Rate Notes Issued in Connection with Securities Held
The Fund may engage in tender option bond (“TOB”) transactions in which the Fund transfers a fixed rate bond (“Fixed Rate Bond”) into a Special Purpose Vehicle (the “SPV”, which is generally organized as a trust). The Fund buys a residual interest in the assets and cash flows of the SPV, often referred to as an inverse floating rate obligation (“Inverse Floater”). The SPV also issues floating rate notes (“Floating Rate Notes”) which are sold to third parties. The Floating Rate Notes pay interest at rates that generally reset weekly and their holders have the option to tender their notes to a liquidity provider for redemption at par. The Inverse Floater held by the Fund gives the Fund the right (1) to cause the holders of the Floating Rate Notes to tender their notes at par, and (2) to have the trustee transfer the Fixed Rate Bond held by the SPV to the Fund, thereby collapsing the SPV. The SPV may also be collapsed in certain other circumstances. In accordance with U.S. GAAP requirements regarding accounting for transfers and servicing of financial assets and extinguishments of liabilities, the Fund accounts for the transaction described above as a secured borrowing by including the Fixed Rate Bond in its portfolio of investments and the Floating Rate Notes as a liability under the caption “Payable for floating rate notes issued” in its statement of assets and liabilities. Interest expense related to the Fund’s liability with respect to
| 88 | AB MUNICIPAL INCOME SHARES | abfunds.com | |
NOTES TO FINANCIAL STATEMENTS (continued)
Floating Rate Notes is recorded as incurred. The interest expense is also included in the Fund’s expense ratio. At April 30, 2020, the amount of the Fund’s Floating Rate Notes outstanding was $62,450,000 and the related interest rate was 0.24% to 0.37%. For the year ended April 30, 2020, the average amount of Floating Rate Notes outstanding and the daily weighted average interest rate were $5,666,230 and 1.74%, respectively.
The Fund may also purchase Inverse Floaters in the secondary market without first owning the underlying bond. Such an Inverse Floater is included in the Fund’s portfolio of investments but is not required to be treated as a secured borrowing and reflected in the Fund’s financial statements as a secured borrowing.
NOTE I
Recent Accounting Pronouncements
In March 2017, the Financial Accounting Standards Board issued an Accounting Standards Update, ASU 2017-08, Receivables—Nonrefundable Fees and Other Costs (Subtopic 310-20), Premium Amortization on Purchased Callable Debt Securities which amends the amortization period for certain purchased callable debt securities held at a premium, shortening such period to the earliest call date. ASU 2017-08 does not require any accounting change for debt securities held at a discount; the discount continues to be amortized to maturity. ASU 2017-08 is effective for fiscal years, and interim periods within those fiscal years, beginning after December 15, 2018. The Fund has adopted ASU 2017-08, which did not have a material impact on the Fund’s financial position or the results of its operations, and had no impact on the Fund’s net assets.
NOTE J
Subsequent Events
Management has evaluated subsequent events for possible recognition or disclosure in the financial statements through the date the financial statements are issued. Management has determined that there are no material events that would require disclosure in the Fund’s financial statements through this date.
| abfunds.com | AB MUNICIPAL INCOME SHARES | 89 | |
FINANCIAL HIGHLIGHTS
Selected Data For A Share Of Beneficial Interest Outstanding Throughout Each Period
| Year Ended April 30, | ||||||||||||||||||||
| 2020 | 2019 | 2018 | 2017 | 2016 | ||||||||||||||||
|
|
|
|
|
|
|
|
|
| |||||||||||
Net asset value, beginning of period | $ 11.70 | $ 11.32 | $ 11.25 | $ 11.59 | $ 11.14 | |||||||||||||||
|
|
|
|
|
|
|
|
|
| |||||||||||
Income From Investment Operations | ||||||||||||||||||||
Net investment income(a) | .44 | .45 | .44 | .44 | .48 | |||||||||||||||
Net realized and unrealized gain (loss) on investment transactions | (.90 | ) | .38 | .07 | (.34 | ) | .46 | |||||||||||||
|
|
|
|
|
|
|
|
|
| |||||||||||
Net increase (decrease) in net asset value from operations | (.46 | ) | .83 | .51 | .10 | .94 | ||||||||||||||
|
|
|
|
|
|
|
|
|
| |||||||||||
Less: Dividends | ||||||||||||||||||||
Dividends from net investment income | (.44 | ) | (.45 | ) | (.44 | ) | (.44 | ) | (.49 | ) | ||||||||||
|
|
|
|
|
|
|
|
|
| |||||||||||
Net asset value, end of period | $ 10.80 | $ 11.70 | $ 11.32 | $ 11.25 | $ 11.59 | |||||||||||||||
|
| |||||||||||||||||||
Total Return | ||||||||||||||||||||
Total investment return based on net asset value(b) | (4.23 | )% | 7.53 | % | 4.55 | % | .87 | % | 8.69 | % | ||||||||||
Ratios/Supplemental Data | ||||||||||||||||||||
Net assets, end of period | $4,685,911 | $3,509,575 | $2,760,892 | $1,667,126 | $1,112,540 | |||||||||||||||
Ratio to average net assets of: | ||||||||||||||||||||
Expenses(c) | .01 | % | .01 | % | .01 | % | .00 | %(d) | .01 | % | ||||||||||
Net investment income | 3.67 | % | 3.91 | % | 3.82 | % | 3.85 | % | 4.25 | % | ||||||||||
Portfolio turnover rate | 12 | % | 14 | % | 19 | % | 23 | % | 8 | % | ||||||||||
| (a) | Based on average shares outstanding. |
| (b) | Total investment return is calculated assuming an initial investment made at the net asset value at the beginning of the period, reinvestment of all dividends and distributions at net asset value during the period, and redemption on the last day of the period. Total return does not reflect the deduction of taxes that a shareholder would pay on fund distributions or the redemption of fund shares. Total investment return calculated for a period of less than one year is not annualized. |
| (c) | The expense ratios, excluding interest expense are .00%, .00%, .00%, .00% and .00%, respectively. |
| (d) | Amount is less than .005%. |
See notes to financial statements.
| 90 | AB MUNICIPAL INCOME SHARES | abfunds.com | |
REPORT OF INDEPENDENT REGISTERED
PUBLIC ACCOUNTING FIRM
To the Board of Trustees of AB Corporate Shares and Shareholders of AB Municipal Income Shares:
Opinion on the Financial Statements
We have audited the accompanying statement of assets and liabilities of AB Municipal Income Shares (the “Fund”) (one of the series constituting AB Corporate Shares (the “Trust”)), including the portfolio of investments, as of April 30, 2020, and the related statement of operations for the year then ended, the statements of changes in net assets for each of the two years in the period then ended, the financial highlights for each of the five years in the period then ended and the related notes (collectively referred to as the “financial statements”). In our opinion, the financial statements present fairly, in all material respects, the financial position of the Fund (one of the series constituting AB Corporate Shares) at April 30, 2020, the results of its operations for the year then ended, the changes in its net assets for each of the two years in the period then ended and its financial highlights for each of the five years in the period then ended, in conformity with U.S. generally accepted accounting principles.
Basis for Opinion
These financial statements are the responsibility of the Trust’s management. Our responsibility is to express an opinion on the Fund’s financial statements based on our audits. We are a public accounting firm registered with the Public Company Accounting Oversight Board (United States) (“PCAOB”) and are required to be independent with respect to the Fund in accordance with the U.S. federal securities laws and the applicable rules and regulations of the Securities and Exchange Commission and the PCAOB.
We conducted our audits in accordance with the standards of the PCAOB. Those standards require that we plan and perform the audit to obtain reasonable assurance about whether the financial statements are free of material misstatement, whether due to error or fraud. The Trust is not required to have, nor were we engaged to perform, an audit of the Trust’s internal control over financial reporting. As part of our audits, we are required to obtain an understanding of internal control over financial reporting, but not for the purpose of expressing an opinion on the effectiveness of the Trust’s internal control over financial reporting. Accordingly, we express no such opinion.
Our audits included performing procedures to assess the risks of material misstatement of the financial statements, whether due to error or fraud, and performing procedures that respond to those risks. Such procedures included examining, on a test basis, evidence regarding the amounts and
| abfunds.com | AB MUNICIPAL INCOME SHARES | 91 | |
REPORT OF INDEPENDENT REGISTERED
PUBLIC ACCOUNTING FIRM (continued)
disclosures in the financial statements. Our procedures included confirmation of securities owned as of April 30, 2020, by correspondence with the custodian and others or by other appropriate auditing procedures where replies from others were not received. Our audits also included evaluating the accounting principles used and significant estimates made by management, as well as evaluating the overall presentation of the financial statements. We believe that our audits provide a reasonable basis for our opinion.

We have served as the auditor of one or more of the AB investment companies since 1968.
New York, New York
June 26, 2020
| 92 | AB MUNICIPAL INCOME SHARES | abfunds.com | |
BOARD OF TRUSTEES
Marshall C. Turner, Jr.(1), Chairman Jorge A. Bermudez(1) Michael J. Downey(1) Nancy P. Jacklin(1) | Robert M. Keith, President and Chief Executive Officer Jeanette Loeb(1) Carol C. McMullen(1) Garry L. Moody(1) Earl D. Weiner(1) | |
OFFICERS
R.B. “Guy” Davidson III(2),^ , Vice President Terrance T. Hults(2), Vice President Matthew J. Norton(2), Vice President Emilie D. Wrapp, Secretary | Michael B. Reyes, Senior Analyst Joseph J. Mantineo, Treasurer and Chief Financial Officer Phyllis J. Clarke, Controller Vincent S. Noto, Chief Compliance Officer |
Custodian and Accounting Agent State Street Bank and Trust Company
Principal Underwriter AllianceBernstein Investments, Inc.
Transfer Agent AllianceBernstein Investor Services, | Legal Counsel Seward & Kissel LLP One Battery Park Plaza New York, NY 10004
Independent Registered Public Accounting Firm Ernst & Young LLP 5 Times Square New York, NY 10036 |
| 1 | Member of the Audit Committee, the Governance and Nominating Committee, and the Independent Directors Committee. |
| 2 | The day-to-day management of, and investment decisions for, the Fund’s Portfolio are made by the Adviser’s Municipal Bond Investment Team. Messrs. Davidson, Hults and Norton are the investment professionals primarily responsible for the day-to-day management of the Fund’s Portfolio. |
| ^ | Mr. Davidson is expected to retire from the Adviser effective December 30, 2020. |
| abfunds.com | AB MUNICIPAL INCOME SHARES | 93 | |
MANAGEMENT OF THE FUND
Board of Trustees Information
The business and affairs of the Trust are managed under the direction of the Board of Trustees. Certain information concerning the Trust’s Trustee is set forth below.
| NAME, ADDRESS*, AGE AND (YEAR FIRST ELECTED**) | PRINCIPAL OCCUPATION(S), DURING PAST FIVE YEARS AND OTHER INFORMATION*** | PORTFOLIOS IN AB FUND COMPLEX OVERSEEN BY TRUSTEE | OTHER PUBLIC COMPANY DIRECTORSHIPS CURRENTLY HELD BY TRUSTEE | |||||
| INTERESTED TRUSTEE | ||||||||
Robert M. Keith,# 1345 Avenue of the Americas New York, NY 10105 (2010) | Senior Vice President of AllianceBernstein L.P. (the “Adviser”) and the head of AllianceBernstein Investments, Inc. (“ABI”) since July 2008; Director of ABI and President of the AB Mutual Funds. Previously, he served as Executive Managing Director of ABI from December 2006 to June 2008. Prior to joining ABI in 2006, Executive Managing Director of Bernstein Global Wealth Management, and prior thereto, Senior Managing Director and Global Head of Client Service and Sales of the Adviser’s institutional investment management business since 2004. Prior thereto, he was Managing Director and Head of North American Client Service and Sales in the Adviser’s institutional investment management business with which he had been associated since prior to 2004. | 90 | None | |||||
| 94 | AB MUNICIPAL INCOME SHARES | abfunds.com | |
MANAGEMENT OF THE FUND (continued)
| NAME, ADDRESS*, AGE AND (YEAR FIRST ELECTED**) | PRINCIPAL OCCUPATION(S), DURING PAST FIVE YEARS AND OTHER INFORMATION*** | PORTFOLIOS IN AB FUND COMPLEX OVERSEEN BY TRUSTEE | OTHER PUBLIC COMPANY DIRECTORSHIPS CURRENTLY HELD BY TRUSTEE | |||||
| INDEPENDENT TRUSTEES | ||||||||
| Marshall C. Turner, Jr.,## Chairman of the Board 78 (2005) | Private Investor since prior to 2015. Former Chairman and CEO of Dupont Photomasks, Inc. (components of semi-conductor manufacturing). He has extensive operating leadership, and venture capital investing experience, including five interim or full-time CEO roles, and prior service as general partner of institutional venture capital partnerships. He also has extensive non-profit board leadership experience, and currently serves on the boards of two education and science-related non-profit organizations. He has served as a director of one AB Fund since 1992, and director or trustee of all AB Funds since 2005. He has been Chairman of the AB Funds since January 2014, and the Chairman of the Independent Directors Committees of such AB Funds since February 2014. | 90 | Xilinx, Inc. (programmable logic semi-conductors) since 2007 | |||||
| abfunds.com | AB MUNICIPAL INCOME SHARES | 95 | |
MANAGEMENT OF THE FUND (continued)
| NAME, ADDRESS*, AGE AND (YEAR FIRST ELECTED**) | PRINCIPAL OCCUPATION(S), DURING PAST FIVE YEARS AND OTHER INFORMATION*** | PORTFOLIOS IN AB FUND COMPLEX OVERSEEN BY TRUSTEE | OTHER PUBLIC COMPANY DIRECTORSHIPS CURRENTLY HELD BY TRUSTEE | |||||
INDEPENDENT TRUSTEES (continued) | ||||||||
Jorge A. Bermudez,## 69 (2020) | Private investor since prior to 2015. Former Chief Risk Officer of Citigroup, Inc., a global financial services company, from November 2007 to March 2008, Chief Executive Officer of Citigroup’s Commercial Business Group in North America and Citibank Texas from 2005 to 2007, and a variety of other executive and leadership roles at various businesses within Citigroup prior to then; Chairman (2018) of the Texas A&M Foundation Board of Trustees (Trustee since 2013) and Chairman of the Smart Grid Center Board at Texas A&M University since 2012; director of, among others, Citibank N.A. from 2005 to 2008, the Federal Reserve Bank of Dallas, Houston Branch from 2009 to 2011, the Federal Reserve Bank of Dallas from 2011 to 2017, and the Electric Reliability Council of Texas from 2010 to 2016. He has served as director or trustee of the AB Funds since January 2020. | 90 | Moody’s Corporation since April 2011 | |||||
Michael J. Downey,## (2005) | Private Investor since prior to 2015. Formerly, Chairman of The Asia Pacific Fund, Inc. (registered investment company) since prior to 2015 until January 2019. From 1987 until 1993, Chairman and CEO of Prudential Mutual Fund Management, director of the Prudential mutual funds, and member of the Executive Committee of Prudential Securities, Inc. He has served as a director or trustee of the AB Funds since 2005. | 90 | None | |||||
| 96 | AB MUNICIPAL INCOME SHARES | abfunds.com | |
MANAGEMENT OF THE FUND (continued)
| NAME, ADDRESS*, AGE AND (YEAR FIRST ELECTED**) | PRINCIPAL OCCUPATION(S), DURING PAST FIVE YEARS AND OTHER INFORMATION*** | PORTFOLIOS IN AB FUND COMPLEX OVERSEEN BY TRUSTEE | OTHER PUBLIC COMPANY DIRECTORSHIPS CURRENTLY HELD BY TRUSTEE | |||||
INDEPENDENT TRUSTEES (continued) | ||||||||
| Nancy P. Jacklin,## 72 (2006) | Private Investor since prior to 2015. Professorial Lecturer at the Johns Hopkins School of Advanced International Studies (2008-2015). U.S. Executive Director of the International Monetary Fund (which is responsible for ensuring the stability of the international monetary system), (December 2002-May 2006); Partner, Clifford Chance (1992-2002); Sector Counsel, International Banking and Finance, and Associate General Counsel, Citicorp (1985-1992); Assistant General Counsel (International), Federal Reserve Board of Governors (1982-1985); and Attorney Advisor, U.S. Department of the Treasury (1973-1982). Member of the Bar of the District of Columbia and of New York; and member of the Council on Foreign Relations. She has served as a director or trustee of the AB Funds since 2006 and has been Chair of the Governance and Nominating Committees of the AB Funds since August 2014. | 90 | None | |||||
Jeanette Loeb,## (2020) | Chief Executive Officer of PetCareRx (e-commerce pet pharmacy) from 2002 to 2011 and 2015 to present. Director of New York City Center since 2005. She was a director of AB Multi-Manager Alternative Fund, Inc. (fund of hedge funds) from 2012 to 2018. Formerly, affiliated with Goldman Sachs Group, Inc. (financial services) from 1977 to 1994, including as a partner thereof from 1986 to 1994. She has served as a Director of the AB Funds since April 2020. | 90 | Apollo Investment Corp. (business development company) since August 2011 | |||||
| abfunds.com | AB MUNICIPAL INCOME SHARES | 97 | |
MANAGEMENT OF THE FUND (continued)
| NAME, ADDRESS*, AGE AND (YEAR FIRST ELECTED**) | PRINCIPAL OCCUPATION(S), DURING PAST FIVE YEARS AND OTHER INFORMATION*** | PORTFOLIOS IN AB FUND COMPLEX OVERSEEN BY TRUSTEE | OTHER PUBLIC COMPANY DIRECTORSHIPS CURRENTLY HELD BY TRUSTEE | |||||
INDEPENDENT TRUSTEES (continued) | ||||||||
Carol C. McMullen,## 64 | Managing Director of Slalom Consulting (consulting) since 2014, private investor and member of the Advisory Board of Butcher Box (since 2018). Formerly, member, Partners Healthcare Investment Committee (2010-2019); Director of Norfolk & Dedham Group (mutual property and casualty insurance) from 2011 until November 2016; Director of Partners Community Physicians Organization (healthcare) from 2014 until December 2016; and Managing Director of The Crossland Group (consulting) from 2012 until 2013. She has held a number of senior positions in the asset and wealth management industries, including at Eastern Bank (where her roles included President of Eastern Wealth Management), Thomson Financial (Global Head of Sales for Investment Management), and Putnam Investments (where her roles included Chief Investment Officer, Core and Growth and Head of Global Investment Research). She has served on a number of private company and non-profit boards, and as a director or trustee of the AB Funds since June 2016. | 90 | None | |||||
| 98 | AB MUNICIPAL INCOME SHARES | abfunds.com | |
MANAGEMENT OF THE FUND (continued)
| NAME, ADDRESS*, AGE AND (YEAR FIRST ELECTED**) | PRINCIPAL OCCUPATION(S), DURING PAST FIVE YEARS AND OTHER INFORMATION*** | PORTFOLIOS IN AB FUND COMPLEX OVERSEEN BY TRUSTEE | OTHER PUBLIC COMPANY DIRECTORSHIPS CURRENTLY HELD BY TRUSTEE | |||||
INDEPENDENT TRUSTEES (continued) | ||||||||
Garry L. Moody,## (2008) | Private Investor since prior to 2015. Formerly, Partner, Deloitte & Touche LLP (1995-2008) where he held a number of senior positions, including Vice Chairman, and U.S. and Global Investment Management Practice Managing Partner; President, Fidelity Accounting and Custody Services Company (1993-1995), where he was responsible for accounting, pricing, custody and reporting for the Fidelity mutual funds; and Partner, Ernst & Young LLP (1975-1993), where he served as the National Director of Mutual Fund Tax Services and Managing Partner of its Chicago Office Tax department. He is a member of the Trustee Advisory Board of BoardIQ, a biweekly publication focused on issues and news affecting directors of mutual funds. He is also a member of the Investment Company Institute’s Board of Governors and the Independent Directors Council Governing Council. He has served as a director or trustee, and as Chairman of the Audit Committees, of the AB Funds since 2008. | 90 | None | |||||
| abfunds.com | AB MUNICIPAL INCOME SHARES | 99 | |
MANAGEMENT OF THE FUND (continued)
| NAME, ADDRESS*, AGE AND (YEAR FIRST ELECTED**) | PRINCIPAL OCCUPATION(S), DURING PAST FIVE YEARS AND OTHER INFORMATION*** | PORTFOLIOS IN AB FUND COMPLEX OVERSEEN BY TRUSTEE | OTHER PUBLIC COMPANY DIRECTORSHIPS CURRENTLY HELD BY TRUSTEE | |||||
INDEPENDENT TRUSTEES (continued) | ||||||||
| Earl D. Weiner,## 80 (2007) | Senior Counsel since 2017, Of Counsel from 2007 to 2016, and Partner prior to then, of the law firm Sullivan & Cromwell LLP. He is a former member of the ABA Federal Regulation of Securities Committee Task Force to draft editions of the Fund Director’s Guidebook. He also serves as a director or trustee of various non-profit organizations and has served as Chairman or Vice Chairman of a number of them. He has served as a director or trustee of the AB Funds since 2007 and served as Chairman of the Governance and Nominating Committees of the AB Funds from 2007 until August 2014. | 90 | None | |||||
| * | The address for each of the Trust’s disinterested Trustees is c/o AllianceBernstein L.P., Attention: Legal and Compliance Department—Mutual Fund Legal, 1345 Avenue of the Americas, New York, NY 10105. |
| ** | There is no stated term of office for the Trust’s Trustees. |
| *** | The information above includes each Trustee’s principal occupation during the last five years and other information relating to the experience, attributes, and skills relevant to each Trustee’s qualifications to serve as a Trustee, which led to the conclusion that each Trustee should serve as a Trustee for the Trust. |
| # | Mr. Keith is an “interested person” of the Trust, as defined in the 1940 Act, due to his position as a Senior Vice President of the Adviser. |
| ## | Member of the Audit Committee, the Governance and Nominating Committee and the Independent Directors Committee. |
| 100 | AB MUNICIPAL INCOME SHARES | abfunds.com | |
MANAGEMENT OF THE FUND (continued)
Officers
| NAME, ADDRESS* AND AGE | POSITION(S) HELD WITH FUND | PRINCIPAL OCCUPATION DURING PAST FIVE YEARS | ||
Robert M. Keith 60 | President and Chief Executive Officer | See biography above. | ||
R. B. “Guy” Davidson, III^ 59 | Vice President | Senior Vice President of the Adviser**, with which he has been associated since prior to 2015. He is also Chief Investment Officer – Municipal Business. | ||
Terrance T. Hults 54 | Vice President | Senior Vice President of the Adviser**, with which he has been associated since prior to 2015. He is also Co-Head – Municipal Portfolio Management. | ||
Matthew J. Norton 37 | Vice President | Senior Vice President of the Adviser**, with which he has been associated since prior to 2015. He is also Co-Head – Municipal Portfolio Management. | ||
Emilie D. Wrapp 64 | Secretary | Senior Vice President, Assistant General Counsel and Assistant Secretary of ABI**, with which she has been associated since prior to 2015. | ||
Michael B. Reyes 43 | Senior Analyst | Vice President of the Adviser**, with which he has been associated since prior to 2015. | ||
Joseph J. Mantineo 61 | Treasurer and Chief Financial Officer | Senior Vice President of AllianceBernstein Investor Services, Inc. (“ABIS”)**, with which he has been associated since prior to 2015. | ||
Phyllis J. Clarke 59 | Controller | Vice President of ABIS**, with which she has been associated since prior to 2015. | ||
Vincent S. Noto 55 | Chief Compliance Officer | Senior Vice President since 2015 and Mutual Fund Chief Compliance Officer of the Adviser** since prior to 2015. |
| * | The address for each of the Portfolio’s Officers is 1345 Avenue of the Americas, New York, NY 10105. |
| ** | The Adviser, ABI and ABIS are affiliates of the Trust. |
| ^ | Mr. Davidson is expected to retire from the Adviser effective December 30, 2020. |
The Trust’s Statement of Additional Information (“SAI”) has additional information about the Trust’s Trustees and Officers and is available without charge upon request. Contact your financial representative or ABI at (800)-227-4618, or visit www.abfunds.com, for a free prospectus or SAI.
| abfunds.com | AB MUNICIPAL INCOME SHARES | 101 | |
Operation and Effectiveness of the Fund’s Liquidity Risk Management Program:
In October 2016, the Securities and Exchange Commission (“SEC”) adopted the open-end fund liquidity rule (the “Liquidity Rule”). In June 2018 the SEC adopted a requirement that funds disclose information about the operation and effectiveness of their Liquidity Risk Management Program (“LRMP”) in their reports to shareholders.
One of the requirements of the Liquidity Rule is for the Fund to designate an Administrator of the Fund’s Liquidity Risk Management Program. The Administrator of the Fund’s LRMP is AllianceBernstein L.P., the Fund’s investment adviser (the “Adviser”). The Adviser has delegated the responsibility to its Liquidity Risk Management Committee (the “Committee”). Another requirement of the Liquidity Rule is for the Fund’s Board of Directors (the “Fund Board”) to receive an annual written report from the Administrator of the LRMP, which addresses the operation of the Fund’s LRMP and assesses its adequacy and effectiveness. The Adviser provided the Fund’s Board with such annual report during the first quarter of 2020, which covered the period December 1, 2018 through December 31, 2019 (the “Program Reporting Period”).
The LRMP’s principal objectives include supporting the Fund’s compliance with limits on investments in illiquid assets and mitigating the risk that the Fund will be unable to meet its redemption obligations in a timely manner. Pursuant to the LRMP, the Fund classifies the liquidity of its portfolio investments into one of the four categories defined by the SEC: Highly Liquid, Moderately Liquid, Less Liquid, and Illiquid. These classifications are reported to the SEC on Form N-PORT.
During the Program Reporting Period, the Committee reviewed whether the Fund’s strategy is appropriate for an open-end structure, taking into account any holdings of less liquid and illiquid assets. The Committee also performed an analysis to determine whether the Fund is required to maintain a Highly Liquid Investment Minimum (“HLIM”). If the Fund participated in derivative transactions, the exposure from such transactions were considered in the LRMP. The Committee also incorporated the following information when determining the Fund’s reasonably anticipated trading size for purposes of liquidity monitoring: historical net redemption activity, a Fund’s concentration in an issuer, shareholder concentration, investment performance, total net assets, and distribution channels.
The Adviser informed the Fund Board that the Committee believes the Fund’s LRMP is adequately designed, has been implemented as intended, and has operated effectively since its inception. No material exceptions have been noted since the implementation of the LRMP, and there were no liquidity events that impacted the Fund or its ability to timely meet redemptions during the Program Reporting Period.
| 102 | AB MUNICIPAL INCOME SHARES | abfunds.com | |
Information Regarding the Review and Approval of the Fund’s Advisory Agreement
The disinterested trustees (the “directors”) of AB Corporate Shares (the “Company”) unanimously approved the continuance of the Company’s Advisory Agreement with the Adviser in respect of AB Municipal Income Shares (the “Fund”) at a meeting held on November 4-6, 2019 (the “Meeting”.)*
Prior to approval of the continuance of the Advisory Agreement, the directors had requested from the Adviser, and received and evaluated, extensive materials. They reviewed the proposed continuance of the Advisory Agreement with the Adviser and with experienced counsel who are independent of the Adviser, who advised on the relevant legal standards. The directors also reviewed additional materials, including comparative analytical data prepared by the Senior Analyst for the Fund. The directors also discussed the proposed continuance in private sessions with counsel.
The directors noted that the Fund is designed as a vehicle for the wrap fee account market (where investors pay fees to a wrap fee sponsor which pays investment fees and expenses from such fee). The directors also noted that no advisory fee is payable by the Fund, that the Advisory Agreement does not include the reimbursement provision for certain administrative expenses included in the advisory agreements of most of the open-end AB Funds, and that the Adviser is responsible for payment of the Fund’s ordinary expenses. The directors noted that the Company acknowledges in the Advisory Agreement that the Adviser and its affiliates expect to receive compensation from third parties in connection with services provided under the Advisory Agreement. The directors further noted that the Adviser receives payments from the wrap fee program sponsors (the “Sponsors”) that use the Fund as an investment vehicle for their clients.
The directors considered their knowledge of the nature and quality of the services provided by the Adviser to the Fund gained from their experience as directors or trustees of most of the registered investment companies advised by the Adviser, their overall confidence in the Adviser’s integrity and competence they have gained from that experience, the Adviser’s initiative in identifying and raising potential issues with the directors and its responsiveness, frankness and attention to concerns raised by the directors in the past, including the Adviser’s willingness to consider and implement organizational and operational changes designed to improve investment results and the services provided to the AB Funds. The directors noted that they have four regular meetings each year, at each of which they review extensive materials and information from the Adviser, including information on the investment performance of the Fund and the underlying fund advised by the Adviser in which the Fund invests.
| * | Following transactions completed on November 13, 2019 that may have been deemed to have been an “assignment” causing termination of the Fund’s investment advisory agreement, a new investment advisory agreement, having the same terms as the prior one, was entered into by the Fund and the Adviser. |
| abfunds.com | AB MUNICIPAL INCOME SHARES | 103 | |
The directors also considered all factors they believed relevant, including the specific matters discussed below. During the course of their deliberations, the directors evaluated, among other things, the reasonableness of the advisory fee. The directors did not identify any particular information that was all-important or controlling, and different directors may have attributed different weights to the various factors. The directors determined that the selection of the Adviser to manage the Fund and the overall arrangements between the Fund and the Adviser, as provided in the Advisory Agreement, including the advisory fee, were fair and reasonable in light of the services performed, expenses incurred and such other matters as the directors considered relevant in the exercise of their business judgment. The material factors and conclusions that formed the basis for the directors’ determinations included the following:
Nature, Extent and Quality of Services Provided
The directors considered the scope and quality of services provided by the Adviser under the Advisory Agreement, including the quality of the investment research capabilities of the Adviser and the other resources it has dedicated to performing services for the Fund. The directors noted that the Adviser from time to time reviews the Fund’s investment strategies and from time to time proposes changes intended to improve the Fund’s relative or absolute performance for the directors’ consideration. They also noted the professional experience and qualifications of the Fund’s portfolio management team and other senior personnel of the Adviser. The quality of administrative and other services, including the Adviser’s role in coordinating the activities of the Fund’s other service providers, also was considered. The directors concluded that, overall, they were satisfied with the nature, extent and quality of services provided to the Fund under the Advisory Agreement.
Costs of Services Provided and Profitability
The directors reviewed a schedule of the revenues and expenses and related notes indicating the profitability of the Fund to the Adviser for calendar years 2017 and 2018 that had been prepared with an expense allocation methodology arrived at in consultation with an independent consultant retained by the Fund’s former Senior Officer/Independent Compliance Officer. The directors noted the assumptions and methods of allocation used by the Adviser in preparing fund-specific profitability data and understood that there are a number of potentially acceptable allocation methodologies for information of this type. The directors noted that the profitability information reflected all revenues and expenses of the Adviser’s relationship with the Fund. The directors recognized that it is difficult to make comparisons of the profitability of the Advisory Agreement with the profitability of fund advisory contracts for unaffiliated funds because comparative information is not generally publicly available and is affected by numerous factors. The directors focused on the profitability of the Adviser’s relationship with the Fund before taxes and distribution
| 104 | AB MUNICIPAL INCOME SHARES | abfunds.com | |
expenses. The directors concluded that the Adviser’s level of profitability from its relationship with the Fund in the periods reviewed was not unreasonable.
Fall-Out Benefits
The directors considered the other benefits to the Adviser and its affiliates from their relationships with the Fund and the underlying fund advised by the Adviser in which the Fund invests. The directors noted that the Adviser is compensated by the Sponsors. The directors understood that the Adviser also might derive reputational and other benefits from its association with the Fund.
Investment Results
In addition to the information reviewed by the directors in connection with the Meeting, the directors receive detailed performance information for the Fund at each regular Board meeting during the year.
At the Meeting, the directors reviewed performance information prepared by an independent service provider (the “15(c) service provider”), showing the performance of the Fund against a group of similar funds (“peer group”) and a larger group of similar funds (“peer universe”), each selected by the 15(c) service provider, and information prepared by the Adviser showing the Fund’s performance against a broad-based securities market index, in each case for the 1-, 3- and 5-year periods ended July 31, 2019 and (in the case of comparisons with the broad-based securities market index) for the period from inception. The directors were cognizant that the Fund was neither designed nor offered as a standalone investment and was intended to serve solely as a component of certain separately managed accounts (“SMAs”). The Adviser had explained that this attribute made it difficult to select an appropriate benchmark for the Fund. At the directors’ request, the Adviser provided information showing the weighting of the Fund in a current SMA and the overall performance of the SMA versus its stated benchmark. Based on their review, the directors concluded that the Fund’s investment performance was acceptable.
Advisory Fees
The directors considered the advisory fee rate payable by the Fund to the Adviser (zero) and information provided by the 15(c) service provider showing the fees payable by other fund families used in wrap fee programs similar to that of the Fund. The directors recognized that it is difficult to make comparisons of advisory fees because there are variations in the services that are included in the fees payable by other funds.
The directors noted the unusual arrangements in the Advisory Agreement providing for no advisory fee but were cognizant that the Adviser is indirectly compensated by the Sponsors for its services to the Fund. The directors reviewed the fee arrangements between the Adviser and each of
| abfunds.com | AB MUNICIPAL INCOME SHARES | 105 | |
the current Sponsors and noted that such fees were negotiated on an arm’s length basis and were within the range of fees paid by wrap fee sponsors to other advisers of similar funds. While the Adviser’s fee arrangements with the Sponsors vary, the directors acknowledged the Adviser’s view that a portion of such fees (less the expenses of the Fund paid by the Adviser) may reasonably be viewed as compensating the Adviser for advisory services it provides to the Fund (the “implied fee”) and that the Adviser believes that while the Sponsors pay the Adviser different fee rates, the rate of fee attributable to Fund management at the Fund level is the same for all Sponsors. The directors also considered the fee rate schedules used by other registered investment companies that invest in fixed income securities that are advised by the Adviser.
The Adviser informed the directors that there were no institutional products managed by the Adviser that utilize investment strategies similar to those of the Fund.
The directors did not consider comparative expense information for the Fund because the Fund does not bear ordinary expenses.
Economies of Scale
The directors did not consider the extent to which fee levels in the Advisory Agreement for the Fund reflect economies of scale because the Advisory Agreement does not provide for any compensation to be paid to the Adviser by the Fund and the Fund’s expense ratio is zero. They did note, however, that the fee payable to the Adviser by the current Sponsors declines at a breakpoint based on either individual account sizes or on total assets managed by the Adviser for the Sponsor.
| 106 | AB MUNICIPAL INCOME SHARES | abfunds.com | |
This page is not part of the Shareholder Report or the Financial Statements.
AB FAMILY OF FUNDS
US EQUITY
CORE
Core Opportunities Fund
FlexFee™ US Thematic Portfolio
Select US Equity Portfolio
GROWTH
Concentrated Growth Fund
Discovery Growth Fund
FlexFee™ Large Cap Growth Portfolio
Growth Fund
Large Cap Growth Fund
Small Cap Growth Portfolio
VALUE
Discovery Value Fund
Equity Income Fund
Relative Value Fund
Small Cap Value Portfolio
Value Fund
INTERNATIONAL/ GLOBAL EQUITY
CORE
FlexFee™ International Strategic Core Portfolio
Global Core Equity Portfolio
International Portfolio
International Strategic Core Portfolio
Sustainable Global Thematic Fund
Tax-Managed International Portfolio
Tax-Managed Wealth Appreciation Strategy
Wealth Appreciation Strategy
INTERNATIONAL/ GLOBAL EQUITY (continued)
GROWTH
Concentrated International Growth Portfolio
FlexFee™ Emerging Markets Growth Portfolio
Sustainable International Thematic Fund
VALUE
All China Equity Portfolio
International Value Fund
FIXED INCOME
MUNICIPAL
High Income Municipal Portfolio
Intermediate California Municipal Portfolio
Intermediate Diversified Municipal Portfolio
Intermediate New York Municipal Portfolio
Municipal Bond Inflation Strategy
Tax-Aware Fixed Income Opportunities Portfolio1
National Portfolio
Arizona Portfolio
California Portfolio
Massachusetts Portfolio
Minnesota Portfolio
New Jersey Portfolio
New York Portfolio
Ohio Portfolio
Pennsylvania Portfolio
Virginia Portfolio
FIXED INCOME (continued)
TAXABLE
Bond Inflation Strategy
FlexFee™ High Yield Portfolio
FlexFee™ International Bond Portfolio
Global Bond Fund
High Income Fund
Income Fund
Intermediate Duration Portfolio
Limited Duration High Income Portfolio
Short Duration Income Portfolio
Short Duration Portfolio
Total Return Bond Portfolio1
ALTERNATIVES
All Market Real Return Portfolio
Global Real Estate Investment Fund
Select US Long/Short Portfolio
Unconstrained Bond Fund
MULTI-ASSET
All Market Income Portfolio
All Market Total Return Portfolio
Conservative Wealth Strategy
Emerging Markets Multi-Asset Portfolio
Global Risk Allocation Fund
Tax-Managed All Market Income Portfolio
CLOSED-END FUNDS
AllianceBernstein Global High Income Fund
AllianceBernstein National Municipal Income Fund
We also offer Government Money Market Portfolio, which serves as the money market fund exchange vehicle for the AB mutual funds. You could lose money by investing in the Fund. Although the Fund seeks to preserve the value of your investment at $1.00 per share, it cannot guarantee it will do so. The Fund may impose a fee upon sale of your shares or may temporarily suspend your ability to sell shares if the Fund’s liquidity falls below required minimums because of market conditions or other factors. An investment in the Fund is not insured or guaranteed by the Federal Deposit Insurance Corporation or any other government agency. The Fund’s sponsor has no legal obligation to provide financial support to the Fund, and you should not expect that the sponsor will provide financial support to the Fund at any time.
Investors should consider the investment objectives, risks, charges and expenses of the Fund carefully before investing. For copies of our prospectus or summary prospectus, which contain this and other information, visit us online at www.abfunds.com or contact your AB representative. Please read the prospectus and/or summary prospectus carefully before investing.
| 1 | Prior to July 12, 2019, Total Return Bond Portfolio was named Intermediate Bond Portfolio; prior to February 5, 2020, Tax-Aware Fixed Income Opportunities Portfolio was named Tax-Aware Fixed Income Portfolio. |
| abfunds.com | AB MUNICIPAL INCOME SHARES | 107 | |
NOTES
| 108 | AB MUNICIPAL INCOME SHARES | abfunds.com | |
AB MUNICIPAL INCOME SHARES
1345 Avenue of the Americas
New York, NY 10105
800 221 5672
MIS-0151-0420 
APR 04.30.20

ANNUAL REPORT
AB TAXABLE MULTI-SECTOR INCOME SHARES

Beginning January 1, 2021, as permitted by new regulations adopted by the Securities and Exchange Commission, the Fund’s annual and semi-annual shareholder reports will no longer be sent by mail, unless you specifically request paper copies of the reports. Instead, the reports will be made available on a website, and you will be notified by mail each time a report is posted and provided with a website address to access the report.
If you already elected to receive shareholder reports electronically, you will not be affected by this change and you need not take any action. You may elect to receive shareholder reports and other communications from the Fund electronically at any time by contacting your financial intermediary (such as a broker-dealer or bank) or, if you are a direct investor, by calling the Fund at (800) 221 5672.
You may elect to receive all future reports in paper form free of charge. If you invest through a financial intermediary, you can contact your financial intermediary to request that you continue to receive paper copies of your shareholder reports; if you invest directly with the Fund, you can call the Fund at (800) 221 5672. Your election to receive reports in paper form will apply to all funds held in your account with your financial intermediary or, if you Invest directly, to all AB Mutual Funds you hold.
| Investment Products Offered | • Are Not FDIC Insured • May Lose Value • Are Not Bank Guaranteed | |
Investors should consider the investment objectives, risks, charges and expenses of the Fund carefully before investing. For copies of our prospectus or summary prospectus, which contain this and other information, visit us online at www.abfunds.com or contact your AB representative. Please read the prospectus and/or summary prospectus carefully before investing.
This shareholder report must be preceded or accompanied by the Fund’s prospectus for individuals who are not current shareholders of the Fund.
You may obtain a description of the Fund’s proxy voting policies and procedures, and information regarding how the Fund voted proxies relating to portfolio securities during the most recent 12-month period ended June 30, without charge. Simply visit AB’s website at www.abfunds.com, or go to the Securities and Exchange Commission’s (the “Commission”) website at www.sec.gov, or call AB at (800) 227 4618.
The Fund files its complete schedule of portfolio holdings with the Commission for the first and third quarters of each fiscal year as an exhibit to its reports on Form N-PORT. The Fund’s Form N-PORT reports are available on the Commission’s website at www.sec.gov. The Fund’s Forms N-PORT may also be reviewed and copied at the Commission’s Public Reference Room in Washington, DC; information on the operation of the Public Reference Room may be obtained by calling (800) SEC 0330. AB publishes full portfolio holdings for the Fund monthly at www.abfunds.com.
AllianceBernstein Investments, Inc. (ABI) is the distributor of the AB family of mutual funds. ABI is a member of FINRA and is an affiliate of AllianceBernstein L.P., the Adviser of the funds.
The [A/B] logo is a registered service mark of AllianceBernstein and AllianceBernstein® is a registered service mark used by permission of the owner, AllianceBernstein L.P.
| FROM THE PRESIDENT |  |
Dear Shareholder,
We are pleased to provide this report for AB Taxable Multi-Sector Income Shares (the “Fund”). Please review the discussion of Fund performance, the market conditions during the reporting period and the Fund’s investment strategy.
As always, AB strives to keep clients ahead of what’s next by:
| + | Transforming uncommon insights into uncommon knowledge with a global research scope |
| + | Navigating markets with seasoned investment experience and sophisticated solutions |
| + | Providing thoughtful investment insights and actionable ideas |
Whether you’re an individual investor or a multi-billion-dollar institution, we put knowledge and experience to work for you.
AB’s global research organization connects and collaborates across platforms and teams to deliver impactful insights and innovative products. Better insights lead to better opportunities—anywhere in the world.
For additional information about AB’s range of products and shareholder resources, please log on to www.abfunds.com.
Thank you for your investment in the AB Mutual Funds.
Sincerely,

Robert M. Keith
President and Chief Executive Officer, AB Mutual Funds
| abfunds.com | AB TAXABLE MULTI-SECTOR INCOME SHARES | 1 | |
ANNUAL REPORT
June 9, 2020
This report provides management’s discussion of fund performance for AB Taxable Multi-Sector Income Shares for the annual reporting period ended April 30, 2020. Please note, shares of this Fund are available only to separately managed accounts or participants in “wrap fee” programs or other investment programs approved by the Adviser.
The Fund’s investment objective is to generate income and price appreciation.
NAV RETURNS AS OF APRIL 30, 2020 (unaudited)
| 6 Months | 12 Months | |||||||
| AB TAXABLE MULTI-SECTOR INCOME SHARES | 0.69% | 3.43% | ||||||
| Bloomberg Barclays US Aggregate ex Government Bond Index | 2.72% | 8.52% | ||||||
INVESTMENT RESULTS
The table above shows the Fund’s performance compared to its benchmark, the Bloomberg Barclays US Aggregate ex Government Bond Index, for the six- and 12-month periods ended April 30, 2020.
During both periods, the Fund underperformed the benchmark. The Fund’s shorter-than-benchmark duration detracted, relative to the benchmark, as yields fell across the curve during both periods. Yield-curve positioning detracted as well, as gains from an overweight to the short end of the curve were more than offset by negative returns from underweight positioning along the intermediate and long portions of the curve. Industry allocation detracted, from a lack of exposure to agency mortgage-backed securities and overweights to US municipal bonds and real estate investment trusts. Security selection contributed to returns, mostly within the energy, electric, consumer noncyclical and US municipal bonds sectors. The Fund’s turnover rate was 124% due to client redemptions in April, and an allocation switch from multi-sector income shares to municipals.
The Fund utilized derivatives in the form of interest rate swaps for hedging purposes and credit default swaps for investment purposes, which had an immaterial impact on absolute returns during both periods.
MARKET REVIEW AND INVESTMENT STRATEGY
Global fixed-income market returns were mixed over the 12-month period ended April 30, 2020. In July, the US Federal Reserve (the “Fed”) began a series of three 25-basis-point (b.p.) interest-rate cuts due to slowing global growth concerns. Numerous other central banks followed suit by lowering interest rates. The UK’s exit from the European Union and a
| 2 | AB TAXABLE MULTI-SECTOR INCOME SHARES | abfunds.com | |
US-China trade truce in January led markets higher until investor sentiment turned decidedly negative in March due to the spread of COVID-19. Investor uncertainty led to an unprecedented flight to quality as credit spreads on risk assets quickly widened to levels not seen since the 2008–2009 global financial crisis. The market rout was met by swift monetary and fiscal policy action. The Fed lowered interest rates 150 b.p. to zero, and most other major central banks followed suit with substantial rate cuts.
Markets began to recover in April as governments and central banks initiated over $9 trillion of monetary and fiscal stimulus measures to combat the economic fallout from the virus and governments began to relax social distancing and stay-at-home guidelines. Higher quality and longer maturity developed-market treasury returns were strong, along with US corporate bonds that rallied in April on the back of record new issuance. High-yield bonds had negative returns for the period, primarily from the March sell-off. Emerging-market returns fell as lower oil prices impacted emerging-market commodity exporters. The US dollar advanced against most developed- and emerging-market currencies. The Swiss franc and the yen, which are also considered safe haven currencies, advanced against the US dollar.
The Fund’s Senior Investment Management Team (the “Team”) continues to seek attractively priced securities through top-down and bottom-up research, while mitigating overall risk. The Team invests primarily in single-sector, investment-grade issues of global corporates but has leeway to invest in below investment-grade bonds as well.
INVESTMENT POLICIES
The Fund invests, under normal circumstances, at least 80% of its net assets in fixed-income securities. The Fund may invest in a broad range of securities in both developed and emerging markets. The Fund may invest across all fixed-income sectors, including corporate and US and non-US government securities. The Fund may invest up to 50% of its assets in below investment-grade bonds (“junk bonds”). The Fund expects to invest in readily marketable fixed-income securities with a range of maturities from short- to long-term.
The Fund may invest without limit in US dollar-denominated foreign fixed-income securities and may invest up to 50% of its assets in non-US dollar-denominated foreign fixed-income securities. These investments may include, in each case, developed- and emerging-market debt securities.
The Adviser selects securities for purchase or sale based on its assessment of the securities’ risk and return characteristics as well as the securities’ impact on the overall risk and return characteristics of
(continued on next page)
| abfunds.com | AB TAXABLE MULTI-SECTOR INCOME SHARES | 3 | |
the Fund. In making this assessment, the Adviser takes into account various factors, including the credit quality and sensitivity to interest rates of the securities under consideration and of the Fund’s other holdings.
The Fund may also invest in mortgage-related and other asset-backed securities, loan participations, inflation-indexed securities, structured securities, variable, floating, and inverse floating-rate instruments and preferred stock, and may use other investment techniques. The Fund may use leverage for investment purposes. The Fund intends, among other things, to enter into transactions such as reverse repurchase agreements, forward contracts and dollar rolls. The Fund may invest, without limit, in derivatives, such as options, futures contracts, forwards or swap agreements.
Currencies can have a dramatic effect on returns of non-US dollar-denominated fixed-income securities, significantly adding to returns in some years and greatly diminishing them in others. The Adviser evaluates currency and fixed-income positions separately and may seek to hedge the currency exposure resulting from the Fund’s fixed-income securities positions when it finds the currency exposure unattractive. To hedge a portion of its currency risk, the Fund may from time to time invest in currency-related derivatives, including forward currency exchange contracts, futures contracts, options on futures contracts, swaps and options. The Adviser may also seek investment opportunities by taking long or short positions in currencies through the use of currency-related derivatives.
| 4 | AB TAXABLE MULTI-SECTOR INCOME SHARES | abfunds.com | |
DISCLOSURES AND RISKS
Benchmark Disclosure
The Bloomberg Barclays US Aggregate ex Government Bond Index is unmanaged and does not reflect fees and expenses associated with the active management of a fund. The Bloomberg Barclays US Aggregate ex Government Bond Index represents the performance of securities within the US investment-grade fixed-rate bond market, with index components for corporate securities, mortgage pass-through securities, asset-backed securities and commercial mortgage-backed securities. An investor cannot invest directly in an index, and its results are not indicative of the performance for any specific investment, including the Fund.
A Word About Risk
Market Risk: The market value of a security may move up or down, sometimes rapidly and unpredictably. These fluctuations may cause a security to be worth less than the price originally paid for it, or less than it was worth at an earlier time. Market risk may affect a single issuer, industry, sector of the economy or the market as a whole. Global economies and financial markets are increasingly interconnected, which increases the probabilities that conditions in one country or region might adversely impact issuers in a different country or region. Conditions affecting the general economy, including political, social, or economic instability at the local, regional, or global level may also affect the market value of a security. Health crises, such as pandemic and epidemic diseases, as well as other incidents that interrupt the expected course of events, such as natural disasters, war or civil disturbance, acts of terrorism, power outages and other unforeseeable and external events, and the public response to or fear of such diseases or events, have and may in the future have an adverse effect on the Fund’s investments and net asset value and can lead to increased market volatility. For example, any preventative or protective actions that governments may take in respect of such diseases or events may result in periods of business disruption, inability to obtain raw materials, supplies and component parts, and reduced or disrupted operations for the Fund’s portfolio companies. The occurrence and pendency of such diseases or events could adversely affect the economies and financial markets either in specific countries or worldwide.
Credit Risk: An issuer or guarantor of a fixed-income security, or the counterparty to a derivatives or other contract, may be unable or unwilling to make timely payments of interest or principal, or to otherwise honor its obligations. The issuer or guarantor may default, causing a loss of the full principal amount of a security and any accrued interest. The degree of risk for a particular security may be reflected in its credit rating. There is the possibility that the credit rating of a fixed-income security may be downgraded after purchase, which may adversely affect the value of the security.
| abfunds.com | AB TAXABLE MULTI-SECTOR INCOME SHARES | 5 | |
DISCLOSURES AND RISKS (continued)
Interest-Rate Risk: Changes in interest rates will affect the value of investments in fixed-income securities. When interest rates rise, the value of existing investments in fixed-income securities tends to fall and this decrease in value may not be offset by higher income from new investments. Interest-rate risk is generally greater for fixed-income securities with longer maturities or durations.
Below Investment-Grade Securities Risk: Investments in fixed-income securities with lower ratings (commonly known as “junk bonds”) tend to have a higher probability that an issuer will default or fail to meet its payment obligations. These securities may be subject to greater price volatility due to such factors as specific corporate developments, interest-rate sensitivity, negative perceptions of the junk bond market generally and may be more difficult to trade than other types of securities.
Inflation Risk: This is the risk that the value of assets or income from investments will be less in the future as inflation decreases the value of money. As inflation increases, the value of the Fund’s assets can decline as can the value of the Fund’s distributions. This risk is significantly greater for fixed-income securities with longer maturities.
Foreign (Non-US) Risk: Investments in securities of non-US issuers may involve more risk than those of US issuers. These securities may fluctuate more widely in price and may be more difficult to trade due to adverse market, economic, political, regulatory or other factors.
Emerging-Market Risk: Investments in emerging-market countries may have more risk because the markets are less developed and less liquid as well as being subject to increased economic, political, regulatory or other uncertainties.
Currency Risk: Fluctuations in currency exchange risk may negatively affect the value of the Fund’s investments or reduce its returns.
Mortgage-Related and/or Other Asset-Backed Securities Risk: Investments in mortgage-related and other asset-backed securities are subject to certain additional risks. The value of these securities may be particularly sensitive to changes in interest rates. These risks include “extension risk”, which is the risk that, in periods of rising interest rates, issuers may delay the payment of principal, and “prepayment risk”, which is the risk that in periods of falling interest rates, issuers may pay principal sooner than expected, exposing the Fund to a lower rate of return upon reinvestment of principal. Mortgage-backed securities offered by nongovernmental issuers and other asset-backed securities may be subject to other risks, such as higher rates of default in the mortgages or assets backing the securities or risks associated with the nature and servicing of mortgages or assets backing the securities.
| 6 | AB TAXABLE MULTI-SECTOR INCOME SHARES | abfunds.com | |
DISCLOSURES AND RISKS (continued)
Derivatives Risk: Derivatives may be difficult to price or unwind and leveraged so that small changes may produce disproportionate losses for the Fund. Derivatives, especially over-the-counter derivatives, are also subject to counterparty risk.
Leverage Risk: To the extent the Fund uses leveraging techniques, its net asset value (“NAV”) may be more volatile because leverage tends to exaggerate the effect of changes in interest rates and any increase or decrease in the value of the Fund’s investments.
Management Risk: The Fund is subject to management risk because it is an actively managed investment fund. The Adviser will apply its investment techniques and risk analyses in making investment decisions, but there is no guarantee that its techniques will produce the intended results.
These risks are fully discussed in the Fund’s prospectus. As with all investments, you may lose money by investing in the Fund.
An Important Note About Historical Performance
The performance shown in this report represents past performance and does not guarantee future results. Current performance may be lower or higher than the performance information shown. You may obtain performance information current to the most recent month-end by calling (800) 227 4618. The investment return and principal value of an investment in the Fund will fluctuate, so that your shares, when redeemed, may be worth more or less than their original cost. Performance assumes reinvestment of distributions and does not account for taxes.
Investors should consider the investment objectives, risks, charges and expenses of the Fund carefully before investing. For copies of our prospectus and/or summary prospectus, which contain this and other information, visit us online at www.abfunds.com or contact your AllianceBernstein Investments representative. Please read the prospectus and/or summary prospectus carefully before investing.
| abfunds.com | AB TAXABLE MULTI-SECTOR INCOME SHARES | 7 | |
HISTORICAL PERFORMANCE
GROWTH OF A $10,000 INVESTMENT IN THE FUND (unaudited)
9/15/20101 TO 4/30/2020
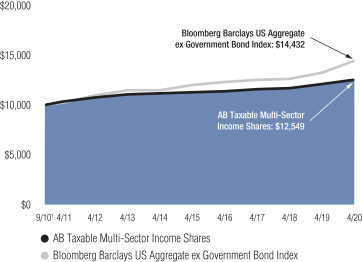
This chart illustrates the total value of an assumed $10,000 investment in AB Taxable Multi-Sector Income Shares (from 9/15/20101 to 4/30/2020) as compared to the performance of the Fund’s benchmark.
| 1 | Inception date: 9/15/2010. |
| 8 | AB TAXABLE MULTI-SECTOR INCOME SHARES | abfunds.com | |
HISTORICAL PERFORMANCE (continued)
AVERAGE ANNUAL RETURNS AS OF APRIL 30, 2020 (unaudited)
| NAV Returns | ||||
| 1 Year | 3.43% | |||
| 5 Years | 2.16% | |||
| Since Inception1 | 2.39% | |||
AVERAGE ANNUAL RETURNS
AS OF THE MOST RECENT CALENDAR QUARTER-END
MARCH 31, 2020 (unaudited)
| NAV Returns | ||||
| 1 Year | 1.89% | |||
| 5 Years | 1.81% | |||
| Since Inception1 | 2.21% | |||
The prospectus fee table shows the fees and the total operating expenses of the Fund as 0.00% because the Adviser does not charge any fees or expenses and reimburses Fund operating expenses, except certain extraordinary expenses, taxes, brokerage costs and the interest on borrowings or certain leveraged transactions. Participants in a wrap fee program or other investment program eligible to invest in the Fund pay fees to the program sponsor and should review the program brochure or other literature provided by the sponsor for a discussion of fees and expenses charged.
| 1 | Inception date: 9/15/2010. |
| abfunds.com | AB TAXABLE MULTI-SECTOR INCOME SHARES | 9 | |
EXPENSE EXAMPLE
(unaudited)
As a shareholder of the Fund, you may incur various ongoing non-operating and extraordinary costs. This example is intended to help you understand your ongoing costs (in dollars) of investing in the Fund and to compare these costs with the ongoing costs of investing in other mutual funds.
The Example is based on an investment of $1,000 invested at the beginning of the period and held for the entire period as indicated below.
Actual Expenses
The table below provides information about actual account values and actual expenses. You may use the information in this line, together with the amount you invested, to estimate the expenses that you paid over the period. Simply divide your account value by $1,000 (for example, an $8,600 account value divided by $1,000 = 8.6), then multiply the result by the number in the first line under the heading entitled “Expenses Paid During Period” to estimate the expenses you paid on your account during this period.
Hypothetical Example for Comparison Purposes
The table below provides information about hypothetical account values and hypothetical expenses based on the Fund’s actual expense ratio and an assumed annual rate of return of 5% before expenses, which is not the Fund’s actual return. The hypothetical account values and expenses may not be used to estimate the actual ending account balance or expenses you paid for the period. You may use this information to compare the ongoing costs of investing in the Fund and other funds by comparing this 5% hypothetical example with the 5% hypothetical examples that appear in the shareholder reports of other funds.
Please note that the expenses shown in the table are meant to highlight your ongoing costs only and do not reflect any transactional costs, such as sales charges (loads), or contingent deferred sales charges on redemptions. Therefore, the hypothetical example is useful in comparing ongoing costs only, and will not help you determine the relative total costs of owning different funds. In addition, if these transactional costs were included, your costs would have been higher.
| Beginning Account Value November 1, 2019 | Ending Account Value April 30, 2020 | Expenses Paid During Period* | Annualized Expense Ratio* | |||||||||||||
Actual | $ | 1,000 | $ | 1,006.90 | $ | 0.05 | 0.01 | % | ||||||||
Hypothetical** | $ | 1,000 | $ | 1,024.81 | $ | 0.05 | 0.01 | % | ||||||||
| * | Expenses are equal to the Fund’s annualized expense ratio, multiplied by the average account value over the period, multiplied by 182/366 (to reflect the one-half year period). The Fund’s operating expenses are borne by the Adviser or its affiliates. |
| ** | Assumes 5% annual return before expenses. |
| 10 | AB TAXABLE MULTI-SECTOR INCOME SHARES | abfunds.com | |
PORTFOLIO SUMMARY
April 30, 2020 (unaudited)
PORTFOLIO STATISTICS
Net Assets ($mil): $178.5
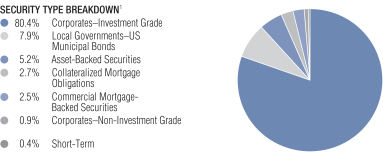
| 1 | All data are as of April 30, 2020. The Fund’s security type breakdown is expressed as a percentage of total investments and may vary over time. The Fund also enters into derivative transactions, which may be used for hedging or investment purposes (see “Portfolio of Investments” section of the report for additional details). |
| abfunds.com | AB TAXABLE MULTI-SECTOR INCOME SHARES | 11 | |
PORTFOLIO OF INVESTMENTS
April 30, 2020
| Principal Amount (000) | U.S. $ Value | |||||||
|
|
| ||||||
CORPORATES – INVESTMENT | ||||||||
Industrial – 49.5% | ||||||||
Basic – 2.3% | ||||||||
DuPont de Nemours, Inc. | $ | 1,550 | $ | 1,564,524 | ||||
Glencore Finance Canada Ltd. | 505 | 517,968 | ||||||
Glencore Funding LLC | 225 | 224,431 | ||||||
PPG Industries, Inc. | 1,750 | 1,766,642 | ||||||
|
| |||||||
| 4,073,565 | ||||||||
|
| |||||||
Capital Goods – 5.7% | ||||||||
3M Co. | 850 | 881,391 | ||||||
Caterpillar Financial Services Corp. | 700 | 713,041 | ||||||
2.95%, 02/26/2022 | 915 | 945,387 | ||||||
CNH Industrial Capital LLC | 950 | 954,750 | ||||||
Eaton Corp. | 1,265 | 1,308,023 | ||||||
General Dynamics Corp. | 1,000 | 1,020,170 | ||||||
John Deere Capital Corp. | 636 | 646,761 | ||||||
2.30%, 06/07/2021 | 1,100 | 1,115,477 | ||||||
Northrop Grumman Corp. | 1,000 | 1,004,930 | ||||||
Rockwell Collins, Inc. | 1,650 | 1,690,210 | ||||||
|
| |||||||
| 10,280,140 | ||||||||
|
| |||||||
Communications - Media – 5.3% | ||||||||
Charter Communications Operating LLC/Charter Communications Operating Capital | 1,750 | 1,843,782 | ||||||
Comcast Corp. | 700 | 736,666 | ||||||
3.375%, 02/15/2025 | 675 | 736,270 | ||||||
Fox Corp. | 1,350 | 1,401,583 | ||||||
4.03%, 01/25/2024 | 435 | 469,809 | ||||||
Omnicom Group, Inc./Omnicom Capital, Inc. | 450 | 472,055 | ||||||
3.65%, 11/01/2024 | 800 | 853,936 | ||||||
| 12 | AB TAXABLE MULTI-SECTOR INCOME SHARES | abfunds.com | |
PORTFOLIO OF INVESTMENTS (continued)
| Principal Amount (000) | U.S. $ Value | |||||||
|
|
| ||||||
Time Warner Cable LLC | $ | 5 | $ | 5,095 | ||||
ViacomCBS, Inc. | 1,000 | 1,050,360 | ||||||
Walt Disney Co. (The) 1.83% (LIBOR 3 Month + 0.25%), 09/01/2021(b) | 725 | 720,396 | ||||||
3.00%, 09/15/2022 | 1,100 | 1,150,380 | ||||||
|
| |||||||
| 9,440,332 | ||||||||
|
| |||||||
Communications - | ||||||||
AT&T, Inc. 1.964% (LIBOR 3 Month + 1.18%), 06/12/2024(b) | 610 | 596,775 | ||||||
2.625%, 12/01/2022 | 355 | 363,385 | ||||||
3.00%, 06/30/2022 | 375 | 386,052 | ||||||
3.80%, 03/15/2022 | 515 | 537,665 | ||||||
Crown Castle International Corp. | 1,760 | 1,777,160 | ||||||
Verizon Communications, Inc. | 200 | 204,244 | ||||||
|
| |||||||
| 3,865,281 | ||||||||
|
| |||||||
Consumer Cyclical - Automotive – 2.6% | ||||||||
BMW Finance NV | 675 | 673,771 | ||||||
BMW US Capital LLC | 1,065 | 1,080,783 | ||||||
Daimler Finance North America LLC | 1,000 | 999,420 | ||||||
General Motors Co. | 125 | 124,245 | ||||||
General Motors Financial Co., Inc. | 220 | 217,664 | ||||||
Harley-Davidson Financial Services, Inc. | 1,025 | 1,030,443 | ||||||
Nissan Motor Acceptance Corp. | 455 | 446,815 | ||||||
|
| |||||||
| 4,573,141 | ||||||||
|
| |||||||
Consumer Cyclical - Other – 1.3% | ||||||||
DR Horton, Inc. | 1,000 | 1,000,520 | ||||||
Marriott International, Inc./MD | 560 | 541,173 | ||||||
Series Y 2.18% (LIBOR 3 Month + 0.60%), 12/01/2020(b) | 800 | 786,368 | ||||||
|
| |||||||
| 2,328,061 | ||||||||
|
| |||||||
| abfunds.com | AB TAXABLE MULTI-SECTOR INCOME SHARES | 13 | |
PORTFOLIO OF INVESTMENTS (continued)
| Principal Amount (000) | U.S. $ Value | |||||||
|
|
| ||||||
Consumer Cyclical - Restaurants – 0.3% | ||||||||
Starbucks Corp. | $ | 100 | $ | 100,652 | ||||
2.20%, 11/22/2020 | 477 | 479,690 | ||||||
|
| |||||||
| 580,342 | ||||||||
|
| |||||||
Consumer Non-Cyclical – 14.0% | ||||||||
AbbVie, Inc. | 650 | 656,032 | ||||||
2.50%, 05/14/2020 | 17 | 17,005 | ||||||
3.375%, 11/14/2021 | 615 | 634,717 | ||||||
AmerisourceBergen Corp. | 945 | 968,039 | ||||||
Amgen, Inc. | 1,275 | 1,310,573 | ||||||
Archer-Daniels-Midland Co. | 1,110 | 1,155,621 | ||||||
Baxalta, Inc. | 23 | 23,593 | ||||||
Biogen, Inc. | 54 | 57,041 | ||||||
Bristol-Myers Squibb Co. | 600 | 619,512 | ||||||
2.75%, 02/15/2023(a) | 225 | 235,033 | ||||||
3.25%, 02/20/2023(a) | 815 | 863,378 | ||||||
Bunge Ltd. Finance Corp. | 1,375 | 1,381,834 | ||||||
Cigna Corp. | 1,825 | 1,877,432 | ||||||
CommonSpirit Health | 1,000 | 981,990 | ||||||
Conagra Brands, Inc. | 1,000 | 995,880 | ||||||
Covidien International Finance SA | 1,925 | 2,028,199 | ||||||
CVS Health Corp. | 400 | 403,240 | ||||||
DH Europe Finance II Sarl | 1,850 | 1,879,304 | ||||||
Eli Lilly & Co. | 1,275 | 1,315,265 | ||||||
Gilead Sciences, Inc. | 565 | 574,729 | ||||||
2.55%, 09/01/2020 | 1,000 | 1,005,460 | ||||||
Kraft Heinz Foods Co. | 13 | 13,010 | ||||||
McCormick & Co., Inc./MD | 830 | 882,572 | ||||||
| 14 | AB TAXABLE MULTI-SECTOR INCOME SHARES | abfunds.com | |
PORTFOLIO OF INVESTMENTS (continued)
| Principal Amount (000) | U.S. $ Value | |||||||
|
|
| ||||||
Medtronic, Inc. | $ | 40 | $ | 41,789 | ||||
Merck & Co., Inc. | 1,130 | 1,223,587 | ||||||
PepsiCo, Inc. | 1,110 | 1,239,326 | ||||||
Philip Morris International, Inc. | 1,000 | 1,080,470 | ||||||
Tyson Foods, Inc. | 475 | 475,584 | ||||||
Zimmer Biomet Holdings, Inc. | 1,055 | 1,028,498 | ||||||
|
| |||||||
| 24,968,713 | ||||||||
|
| |||||||
Energy – 3.5% | ||||||||
BP Capital Markets America, Inc. | 775 | 798,025 | ||||||
Energy Transfer Operating LP | 1,000 | 991,170 | ||||||
4.65%, 06/01/2021 | 10 | 9,990 | ||||||
Enterprise Products Operating LLC | 55 | 55,544 | ||||||
Kinder Morgan Energy Partners LP | 5 | 5,045 | ||||||
MPLX LP | 1,250 | 1,103,150 | ||||||
ONEOK, Inc. | 1,000 | 997,400 | ||||||
Phillips 66 | 1,285 | 1,339,330 | ||||||
Schlumberger Finance Canada Ltd. | 1,000 | 995,100 | ||||||
|
| |||||||
| 6,294,754 | ||||||||
|
| |||||||
Services – 3.5% | ||||||||
Booking Holdings, Inc. | 1,685 | 1,716,341 | ||||||
eBay, Inc. | 830 | 830,216 | ||||||
2.60%, 07/15/2022 | 485 | 497,198 | ||||||
Mastercard, Inc. | 1,590 | 1,619,574 | ||||||
Moody’s Corp. | 200 | 203,926 | ||||||
4.50%, 09/01/2022 | 1,300 | 1,382,251 | ||||||
|
| |||||||
| 6,249,506 | ||||||||
|
| |||||||
| abfunds.com | AB TAXABLE MULTI-SECTOR INCOME SHARES | 15 | |
PORTFOLIO OF INVESTMENTS (continued)
| Principal Amount (000) | U.S. $ Value | |||||||
|
|
| ||||||
Technology – 8.8% | ||||||||
Apple, Inc. | $ | 800 | $ | 858,832 | ||||
Baidu, Inc. | 375 | 377,220 | ||||||
Broadcom, Inc. | 860 | 891,364 | ||||||
Fidelity National Information Services, Inc. | 850 | 900,618 | ||||||
Hewlett Packard Enterprise Co. | 75 | 75,473 | ||||||
Honeywell International, Inc. | 1,300 | 1,337,778 | ||||||
IBM Credit LLC | 255 | 266,740 | ||||||
Intel Corp. | 1,025 | 1,150,839 | ||||||
International Business Machines Corp. | 500 | 519,875 | ||||||
3.625%, 02/12/2024 | 1,000 | 1,088,480 | ||||||
KLA Corp. | 1,250 | 1,390,912 | ||||||
Lam Research Corp. | 1,583 | 1,613,140 | ||||||
Oracle Corp. | 1,175 | 1,190,463 | ||||||
3.625%, 07/15/2023 | 500 | 541,490 | ||||||
QUALCOMM, Inc. | 475 | 495,249 | ||||||
3.00%, 05/20/2022 | 805 | 838,601 | ||||||
Texas Instruments, Inc. | 1,325 | 1,401,426 | ||||||
VMware, Inc. | 800 | 805,104 | ||||||
|
| |||||||
| 15,743,604 | ||||||||
|
| |||||||
| 88,397,439 | ||||||||
|
| |||||||
Financial Institutions – 20.2% | ||||||||
Banking – 11.3% | ||||||||
American Express Co. | 200 | 200,692 | ||||||
Bank of America Corp. 1.866% (LIBOR 3 Month + 0.65%), 06/25/2022(b) | 535 | 529,217 | ||||||
2.881%, 04/24/2023 | 1,175 | 1,203,682 | ||||||
5.00%, 05/13/2021 | 30 | 31,183 | ||||||
Capital One NA 2.15%, 09/06/2022 | 750 | 747,915 | ||||||
2.95%, 07/23/2021 | 1,100 | 1,109,966 | ||||||
| 16 | AB TAXABLE MULTI-SECTOR INCOME SHARES | abfunds.com | |
PORTFOLIO OF INVESTMENTS (continued)
| Principal Amount (000) | U.S. $ Value | |||||||
|
|
| ||||||
Citigroup, Inc. | $ | 1,300 | $ | 1,332,123 | ||||
Discover Bank | 255 | 254,974 | ||||||
Fifth Third Bancorp | 53 | 54,858 | ||||||
Fifth Third Bank/Cincinnati OH | 1,750 | 1,756,930 | ||||||
Goldman Sachs Group, Inc. (The) | 48 | 48,240 | ||||||
2.908%, 06/05/2023 | 300 | 306,642 | ||||||
Series D | 40 | 40,222 | ||||||
HSBC Bank USA NA | 1,000 | 1,011,700 | ||||||
JPMorgan Chase & Co. | 225 | 227,628 | ||||||
2.776%, 04/25/2023 | 1,320 | 1,351,429 | ||||||
4.50%, 01/24/2022 | 95 | 100,285 | ||||||
Manufacturers & Traders Trust Co. | 355 | 355,216 | ||||||
Mitsubishi UFJ Financial Group, Inc. | 215 | 218,322 | ||||||
Mizuho Financial Group, Inc. | 220 | 223,095 | ||||||
Morgan Stanley | 1,435 | 1,458,362 | ||||||
Nationwide Building Society | 200 | 211,728 | ||||||
Regions Bank/Birmingham AL | 1,165 | 1,166,340 | ||||||
Royal Bank of Canada | 1,500 | 1,521,135 | ||||||
Synchrony Bank | 775 | 774,008 | ||||||
Truist Bank | 1,125 | 1,136,835 | ||||||
Truist Financial Corp. | 200 | 201,486 | ||||||
Wells Fargo Bank NA | 1,050 | 1,057,707 | ||||||
Zions Bancorp NA | 1,555 | 1,566,678 | ||||||
|
| |||||||
| 20,198,598 | ||||||||
|
| |||||||
| abfunds.com | AB TAXABLE MULTI-SECTOR INCOME SHARES | 17 | |
PORTFOLIO OF INVESTMENTS (continued)
| Principal Amount (000) | U.S. $ Value | |||||||
|
|
| ||||||
Finance – 1.2% | ||||||||
AIG Global Funding | $ | 500 | $ | 508,490 | ||||
3.35%, 06/25/2021(a) | 600 | 612,246 | ||||||
Air Lease Corp. | 1,015 | 983,931 | ||||||
|
| |||||||
| 2,104,667 | ||||||||
|
| |||||||
Other Finance – 0.7% | ||||||||
Enterprise Community Loan Fund, Inc. | 1,180 | 1,222,433 | ||||||
|
| |||||||
REITS – 7.0% |
| |||||||
American Tower Corp. | 675 | 684,355 | ||||||
3.00%, 06/15/2023 | 575 | 601,111 | ||||||
3.50%, 01/31/2023 | 600 | 634,002 | ||||||
Equinix, Inc. | 1,790 | 1,872,215 | ||||||
Essex Portfolio LP | 1,230 | 1,275,018 | ||||||
Healthpeak Properties, Inc. | 1,000 | 1,027,740 | ||||||
Kimco Realty Corp. | 1,370 | 1,374,192 | ||||||
Realty Income Corp. | 850 | 873,460 | ||||||
Simon Property Group LP | 1,500 | 1,515,285 | ||||||
Ventas Realty LP | 119 | 118,317 | ||||||
Welltower, Inc. | 1,000 | 1,028,820 | ||||||
Weyerhaeuser Co. | 1,400 | 1,424,850 | ||||||
|
| |||||||
| 12,429,365 | ||||||||
|
| |||||||
| 35,955,063 | ||||||||
|
| |||||||
Utility – 9.3% | ||||||||
Electric – 8.6% | ||||||||
American Electric Power Co., Inc. | 1,050 | 1,055,534 | ||||||
Berkshire Hathaway Energy Co. | 650 | 655,844 | ||||||
CMS Energy Corp. | 850 | 899,980 | ||||||
Dominion Energy, Inc. | 1,500 | 1,522,005 | ||||||
| 18 | AB TAXABLE MULTI-SECTOR INCOME SHARES | abfunds.com | |
PORTFOLIO OF INVESTMENTS (continued)
| Principal Amount (000) | U.S. $ Value | |||||||
|
|
| ||||||
DTE Energy Co. | ||||||||
Series B | $ | 565 | $ | 582,227 | ||||
Series D | 325 | 346,037 | ||||||
Eversource Energy | 1,920 | 1,935,629 | ||||||
Exelon Corp. | 548 | 551,715 | ||||||
2.85%, 06/15/2020 | 145 | 145,070 | ||||||
Florida Power & Light Co. | 400 | 397,384 | ||||||
National Rural Utilities Cooperative Finance Corp. | 995 | 1,012,044 | ||||||
3.05%, 02/15/2022 | 300 | 310,167 | ||||||
NextEra Energy Capital Holdings, Inc. | 693 | 704,414 | ||||||
2.80%, 01/15/2023 | 600 | 623,100 | ||||||
Pinnacle West Capital Corp. | 1,000 | 1,004,240 | ||||||
Public Service Enterprise Group, Inc. | 845 | 868,761 | ||||||
Southern California Edison Co. | 1,775 | 1,879,352 | ||||||
Southern Co. (The) | 875 | 884,721 | ||||||
|
| |||||||
| 15,378,224 | ||||||||
|
| |||||||
Other Utility – 0.7% | ||||||||
American Water Capital Corp. | 1,135 | 1,235,368 | ||||||
|
| |||||||
| 16,613,592 | ||||||||
|
| |||||||
Total Corporates – Investment Grade | 140,966,094 | |||||||
|
| |||||||
LOCAL GOVERNMENTS – US MUNICIPAL BONDS – 7.7% | ||||||||
United States – 7.7% | ||||||||
Buckeye Tobacco Settlement Financing Authority | 2,500 | 2,497,450 | ||||||
1.95%, 06/01/2026 | 400 | 375,108 | ||||||
Central Texas Turnpike System | ||||||||
Series 2020B | 1,000 | 989,250 | ||||||
| abfunds.com | AB TAXABLE MULTI-SECTOR INCOME SHARES | 19 | |
PORTFOLIO OF INVESTMENTS (continued)
| Principal Amount (000) | U.S. $ Value | |||||||
|
|
| ||||||
Chicago Housing Authority | ||||||||
Series 2018B | $ | 1,000 | $ | 1,031,570 | ||||
City of San Francisco CA Public Utilities Commission Water Revenue | ||||||||
Series 2020A | 500 | 505,355 | ||||||
Colorado Health Facilities Authority | ||||||||
Series 2019B | 800 | 800,896 | ||||||
2.237%, 11/01/2022 | 100 | 100,139 | ||||||
2.396%, 11/01/2023 | 1,050 | 1,054,966 | ||||||
County of Riverside CA | 200 | 201,216 | ||||||
Massachusetts Development Finance Agency | 385 | 383,907 | ||||||
New York State Dormitory Authority | ||||||||
Series 2020F | 350 | 350,070 | ||||||
2.027%, 02/15/2023 | 250 | 251,153 | ||||||
Ohio Turnpike & Infrastructure Commission | 700 | 704,557 | ||||||
Pennsylvania Turnpike Commission | 760 | 779,904 | ||||||
Reedy Creek Improvement District | 700 | 687,918 | ||||||
Regional Transportation Authority | 1,000 | 1,001,340 | ||||||
State of Connecticut | 1,100 | 1,109,889 | ||||||
State of Wisconsin | 1,000 | 1,002,880 | ||||||
|
| |||||||
Total Local Governments – US Municipal Bonds | 13,827,568 | |||||||
|
| |||||||
ASSET-BACKED SECURITIES – 5.1% | ||||||||
Autos - Fixed Rate – 2.2% | ||||||||
CarMax Auto Owner Trust | 836 | 838,631 | ||||||
Ford Credit Floorplan Master Owner Trust | ||||||||
Series 2017-1, Class A1 | 175 | 174,907 | ||||||
Series 2017-2, Class A1 | 1,000 | 992,802 | ||||||
| 20 | AB TAXABLE MULTI-SECTOR INCOME SHARES | abfunds.com | |
PORTFOLIO OF INVESTMENTS (continued)
| Principal Amount (000) | U.S. $ Value | |||||||
|
|
| ||||||
GM Financial Consumer Automobile Receivables Trust | $ | 603 | $ | 605,781 | ||||
Honda Auto Receivables Owner Trust | 400 | 403,273 | ||||||
USAA Auto Owner Trust | 901 | 903,345 | ||||||
|
| |||||||
| 3,918,739 | ||||||||
|
| |||||||
Credit Cards - Fixed Rate – 1.7% | ||||||||
Cabela’s Credit Card Master Note Trust | 120 | 121,020 | ||||||
Chase Issuance Trust | 105 | 106,940 | ||||||
World Financial Network Credit Card Master Trust | ||||||||
Series 2017-C, Class A | 1,400 | 1,402,831 | ||||||
Series 2018-B, Class A | 1,350 | 1,353,064 | ||||||
|
| |||||||
| 2,983,855 | ||||||||
|
| |||||||
Other ABS - Fixed Rate – 1.2% | ||||||||
SBA Tower Trust | 67 | 67,071 | ||||||
SoFi Consumer Loan Program LLC | ||||||||
Series 2016-3, Class A | 11 | 11,005 | ||||||
Series 2017-2, Class A | 106 | 105,742 | ||||||
Series 2017-5, Class A2 | 555 | 535,969 | ||||||
SoFi Consumer Loan Program Trust | 912 | 899,155 | ||||||
Verizon Owner Trust | 539 | 540,305 | ||||||
|
| |||||||
| 2,159,247 | ||||||||
|
| |||||||
Total Asset-Backed Securities | 9,061,841 | |||||||
|
| |||||||
| abfunds.com | AB TAXABLE MULTI-SECTOR INCOME SHARES | 21 | |
PORTFOLIO OF INVESTMENTS (continued)
| Principal Amount (000) | U.S. $ Value | |||||||
|
|
| ||||||
COLLATERALIZED MORTGAGE | ||||||||
Risk Share Floating Rate – 2.5% | ||||||||
Bellemeade Re Ltd. | $ | 598 | $ | 572,593 | ||||
Series 2019-3A, Class M1B | 383 | 332,967 | ||||||
Federal Home Loan Mortgage Corp. | ||||||||
Series 2013-DN1, Class M2 | 196 | 146,738 | ||||||
Series 2014-DN3, Class M3 | 148 | 117,298 | ||||||
Series 2019-DNA3, Class M2 | 75 | 64,087 | ||||||
Federal Home Loan Mortgage Corp. Structured Agency Credit Risk Debt Notes | 258 | 255,409 | ||||||
Federal National Mortgage Association Connecticut Avenue Securities | ||||||||
Series 2014-C01, Class M2 | 676 | 532,060 | ||||||
Series 2014-C03, Class 2M2 | 250 | 192,439 | ||||||
Series 2016-C01, Class 1M2 | 402 | 411,751 | ||||||
Series 2016-C02, Class 1M2 | 645 | 656,583 | ||||||
Series 2016-C03, Class 1M2 | 284 | 288,067 | ||||||
Series 2016-C06, Class 1M2 | 212 | 206,996 | ||||||
Series 2016-C07, Class 2M2 | 186 | 182,775 | ||||||
| 22 | AB TAXABLE MULTI-SECTOR INCOME SHARES | abfunds.com | |
PORTFOLIO OF INVESTMENTS (continued)
| Principal Amount (000) | U.S. $ Value | |||||||
|
|
| ||||||
Series 2017-C02, Class 2M2 | $ | 397 | $ | 375,021 | ||||
Series 2017-C06, Class 2M2 | 207 | 182,556 | ||||||
|
| |||||||
| 4,517,340 | ||||||||
|
| |||||||
Agency Fixed Rate – 0.2% |
| |||||||
Federal Home Loan Mortgage Corp. REMICs | ||||||||
Series 4029, Class LD | 234 | 237,337 | ||||||
Series 4459, Class CA | 51 | 55,876 | ||||||
|
| |||||||
| 293,213 | ||||||||
|
| |||||||
Total Collateralized Mortgage Obligations | 4,810,553 | |||||||
|
| |||||||
COMMERCIAL MORTGAGE-BACKED SECURITIES – 2.5% | ||||||||
Non-Agency Floating Rate CMBS – 1.7% | ||||||||
BAMLL Commercial Mortgage Securities Trust | 1,000 | 965,059 | ||||||
DBWF Mortgage Trust | 1,000 | 926,029 | ||||||
Invitation Homes Trust | 333 | 324,284 | ||||||
Starwood Retail Property Trust | 975 | 910,776 | ||||||
|
| |||||||
| 3,126,148 | ||||||||
|
| |||||||
Non-Agency Fixed Rate CMBS – 0.7% | ||||||||
Citigroup Commercial Mortgage Trust | 17 | 16,596 | ||||||
GS Mortgage Securities Trust | 340 | 339,326 | ||||||
| abfunds.com | AB TAXABLE MULTI-SECTOR INCOME SHARES | 23 | |
PORTFOLIO OF INVESTMENTS (continued)
| Principal Amount (000) | U.S. $ Value | |||||||
|
|
| ||||||
JP Morgan Chase Commercial Mortgage Securities Trust | $ | 750 | $ | 754,645 | ||||
LSTAR Commercial Mortgage Trust | 100 | 100,820 | ||||||
|
| |||||||
| 1,211,387 | ||||||||
|
| |||||||
Agency CMBS – 0.1% | ||||||||
Federal Home Loan Mortgage Corp. Multifamily Structured Pass Through Certificates | ||||||||
Series K021, Class A1 | 49 | 49,780 | ||||||
Series K025, Class A1 | 61 | 60,923 | ||||||
|
| |||||||
| 110,703 | ||||||||
|
| |||||||
Total Commercial Mortgage-Backed Securities | 4,448,238 | |||||||
|
| |||||||
CORPORATES – NON-INVESTMENT GRADE – 0.9% | ||||||||
Industrial – 0.9% |
| |||||||
Consumer Cyclical - Automotive – 0.4% |
| |||||||
Ford Motor Credit Co. LLC | 400 | 398,160 | ||||||
3.336%, 03/18/2021 | 325 | 313,274 | ||||||
|
| |||||||
| 711,434 | ||||||||
|
| |||||||
Energy – 0.5% | ||||||||
Western Midstream Operating LP | 945 | 921,196 | ||||||
|
| |||||||
Total Corporates – Non-Investment Grade | 1,632,630 | |||||||
|
| |||||||
| Shares | ||||||||
SHORT-TERM INVESTMENTS – 0.4% | ||||||||
Investment Companies – 0.4% | ||||||||
AB Fixed Income Shares, Inc. – Government Money Market Portfolio - Class AB, 0.35%(e)(f)(g) | 656,427 | 656,427 | ||||||
|
| |||||||
Total Investments – 98.3% | 175,403,351 | |||||||
Other assets less liabilities – 1.7% | 3,104,588 | |||||||
|
| |||||||
Net Assets – 100.0% | $ | 178,507,939 | ||||||
|
| |||||||
| 24 | AB TAXABLE MULTI-SECTOR INCOME SHARES | abfunds.com | |
PORTFOLIO OF INVESTMENTS (continued)
CENTRALLY CLEARED CREDIT DEFAULT SWAPS (see Note C)
Description | Fixed Rate (Pay)/ Receive | Payment Frequency | Implied Credit Spread at April 30, 2020 | Notional | Market Value | Upfront Premiums Paid/ (Received) | Unrealized Appreciation/ (Depreciation) | |||||||||||||||||||||||||
Buy Contracts | ||||||||||||||||||||||||||||||||
CDX-NAIG Series 34, 5 Year Index, 06/20/2025* | (1.00 | )% | Quarterly | 0.88 | % | USD | 30,000 | $ | (214,069 | ) | $ | (132,105 | ) | $ | (81,964 | ) | ||||||||||||||||
| * | Termination date |
CENTRALLY CLEARED INTEREST RATE SWAPS (see Note C)
| Rate Type | ||||||||||||||||||||||||||
Notional | Termination Date | Payments made by the Fund | Payments received by the Fund | Payment Frequency Paid/ Received | Market Value | Upfront Premiums Paid/ (Received) | Unrealized Appreciation/ (Depreciation) | |||||||||||||||||||
| USD | 15,000 | 04/18/2021 | 3 Month LIBOR | 2.511% | Quarterly/Semi-Annual | $ | 304,008 | $ | — | $ | 304,008 | |||||||||||||||
| USD | 12,380 | 04/08/2022 | 0.489% | 3 Month LIBOR | Semi-Annual/Quarterly | (19,776 | ) | — | (19,776 | ) | ||||||||||||||||
| USD | 5,730 | 02/28/2025 | 1.174% | 3 Month LIBOR | Semi-Annual/Quarterly | (206,158 | ) | — | (206,158 | ) | ||||||||||||||||
| USD | 6,420 | 03/06/2025 | 0.790% | 3 Month LIBOR | Semi-Annual/Quarterly | (117,555 | ) | — | (117,555 | ) | ||||||||||||||||
|
|
|
|
|
| |||||||||||||||||||||
| $ | (39,481 | ) | $ | — | $ | (39,481 | ) | |||||||||||||||||||
|
|
|
|
|
| |||||||||||||||||||||
CREDIT DEFAULT SWAPS (see Note C)
| Swap Counterparty & Referenced Obligation | Fixed Rate (Pay)/ Receive | Payment Frequency | Implied Credit Spread at April 30, 2020 | Notional | Market Value | Upfront Premiums Paid/ (Received) | Unrealized Appreciation/ (Depreciation) | |||||||||||||||||||||||||
Buy Contracts | ||||||||||||||||||||||||||||||||
Citigroup Global Markets, Inc. |
| |||||||||||||||||||||||||||||||
CDX-CMBX.NA.BBB-. Series 9, 09/17/2058* | (3.00 | )% | Monthly | 8.90 | % | USD | 105 | $ | 28,759 | $ | 3,575 | $ | 25,184 | |||||||||||||||||||
JPMorgan Securities LLC | ||||||||||||||||||||||||||||||||
CDX-CMBX.NA.BBB-. Series 9, 09/17/2058* | (3.00 | ) | Monthly | 8.90 | USD | 1,560 | 427,414 | 138,455 | 288,959 | |||||||||||||||||||||||
Sale Contracts | ||||||||||||||||||||||||||||||||
Citigroup Global Markets, Inc. |
| |||||||||||||||||||||||||||||||
CDX-CMBX.NA.A Series 6, 05/11/63* | 2.00 | Monthly | 6.85 | USD | 2,500 | (352,917 | ) | 23,592 | (376,509 | ) | ||||||||||||||||||||||
CDX-CMBX.NA.BBB- Series 6, 05/11/2063* | 3.00 | Monthly | 13.94 | USD | 180 | (58,500 | ) | (17,549 | ) | (40,951 | ) | |||||||||||||||||||||
CDX-CMBX.NA.BBB- Series 6, 05/11/2063* | 3.00 | Monthly | 13.94 | USD | 59 | (19,180 | ) | (8,021 | ) | (11,159 | ) | |||||||||||||||||||||
CDX-CMBX.NA.BBB- Series 6, 05/11/2063* | 3.00 | Monthly | 13.94 | USD | 32 | (10,402 | ) | (3,168 | ) | (7,234 | ) | |||||||||||||||||||||
Credit Suisse International | ||||||||||||||||||||||||||||||||
CDX-CMBX.NA.BBB- Series 6, 05/11/2063* | 3.00 | Monthly | 13.94 | USD | 224 | (72,800 | ) | (22,410 | ) | (50,390 | ) | |||||||||||||||||||||
| abfunds.com | AB TAXABLE MULTI-SECTOR INCOME SHARES | 25 | |
PORTFOLIO OF INVESTMENTS (continued)
| Swap Counterparty & Referenced Obligation | Fixed Rate (Pay)/ Receive | Payment Frequency | Implied Credit Spread at April 30, 2020 | Notional | Market Value | Upfront Premiums Paid/ (Received) | Unrealized Appreciation/ (Depreciation) | |||||||||||||||||||||||||
CDX-CMBX.NA.BBB- Series 6, 05/11/2063* | 3.00 | % | Monthly | 13.94 | % | USD | 18 | $ | (5,852 | ) | $ | (1,799 | ) | $ | (4,053 | ) | ||||||||||||||||
CDX-CMBX.NA.BBB- Series 6, 05/11/2063* | 3.00 | Monthly | 13.94 | USD | 335 | (108,903 | ) | (32,654 | ) | (76,249 | ) | |||||||||||||||||||||
Goldman Sachs International | ||||||||||||||||||||||||||||||||
CDX-CMBX.NA.BBB- Series 6, 05/11/2063* | 3.00 | Monthly | 13.94 | USD | 291 | (94,600 | ) | (27,532 | ) | (67,068 | ) | |||||||||||||||||||||
JPMorgan Securities LLC | ||||||||||||||||||||||||||||||||
CDX-CMBX.NA.BBB- Series 6, 05/11/2063* | 3.00 | % | Monthly | 13.94 | % | USD | 1,066 | (346,539 | ) | (160,916 | ) | (185,623 | ) | |||||||||||||||||||
|
|
|
|
|
| |||||||||||||||||||||||||||
| $ | (613,520 | ) | $ | (108,427 | ) | $ | (505,093 | ) | ||||||||||||||||||||||||
|
|
|
|
|
| |||||||||||||||||||||||||||
| * | Termination date |
| (a) | Security is exempt from registration under Rule 144A of the Securities Act of 1933. These securities are considered restricted, but liquid and may be resold in transactions exempt from registration, normally to qualified institutional buyers. At April 30, 2020, the aggregate market value of these securities amounted to $17,278,081 or 9.7% of net assets. |
| (b) | Floating Rate Security. Stated interest/floor/ceiling rate was in effect at April 30, 2020. |
| (c) | When-Issued or delayed delivery security. |
| (d) | Security is exempt from registration under Rule 144A of the Securities Act of 1933. These securities, which represent 0.58% of net assets as of April 30, 2020, are considered illiquid and restricted. Additional information regarding such securities follows: |
| 144A/Restricted & Illiquid Securities | Acquisition Date | Cost | Market Value | Percentage of Net Assets | ||||||||||||
BAMLL Commercial Mortgage Securities Trust | ||||||||||||||||
Series 2017-SCH, Class AF | 12/14/2017 | $ | 1,000,000 | $ | 965,059 | 0.54 | % | |||||||||
SBA Tower Trust | ||||||||||||||||
Series 2015-1A, Class C | 09/27/2017 | 67,000 | 67,071 | 0.04 | % | |||||||||||
| (e) | Affiliated investments. |
| (f) | To obtain a copy of the fund’s shareholder report, please go to the Securities and Exchange Commission’s website at www.sec.gov, or call AB at (800) 227-4618. |
| (g) | The rate shown represents the 7-day yield as of period end. |
Glossary:
ABS – Asset-Backed Securities
CDX-CMBX.NA – North American Commercial Mortgage-Backed Index
CDX-NAIG – North American Investment Grade Credit Default Swap Index
CMBS – Commercial Mortgage-Backed Securities
LIBOR – London Interbank Offered Rates
REIT – Real Estate Investment Trust
REMICs – Real Estate Mortgage Investment Conduits
See notes to financial statements.
| 26 | AB TAXABLE MULTI-SECTOR INCOME SHARES | abfunds.com | |
STATEMENT OF ASSETS & LIABILITIES
April 30, 2020
| Assets |
| |||
Investments in securities, at value | ||||
Unaffiliated issuers (cost $174,440,907) | $ | 174,746,924 | ||
Affiliated issuers (cost $656,427) | 656,427 | |||
Cash collateral due from broker | 1,196,649 | |||
Receivable for shares of beneficial interest sold | 2,346,345 | |||
Interest receivable | 1,241,923 | |||
Market value on credit default swaps (net premiums paid $142,030) | 456,173 | |||
Receivable for newly entered centrally cleared credit default swaps | 107,035 | |||
Receivable for variation margin on centrally cleared swaps | 6,292 | |||
Affiliated dividends receivable | 92 | |||
Receivable due from Adviser | 22 | |||
|
| |||
Total assets | 180,757,882 | |||
|
| |||
| Liabilities |
| |||
Due to custodian | 84,240 | |||
Market value on credit default swaps (net premiums received $250,457) | 1,069,693 | |||
Payable for investment securities purchased | 488,721 | |||
Dividends payable | 427,128 | |||
Payable for shares of beneficial interest redeemed | 156,988 | |||
Payable for terminated centrally cleared credit default swaps | 23,173 | |||
|
| |||
Total liabilities | 2,249,943 | |||
|
| |||
Net Assets | $ | 178,507,939 | ||
|
| |||
| Composition of Net Assets |
| |||
Shares of beneficial interest, at par | $ | 180 | ||
Additional paid-in capital | 179,143,129 | |||
Accumulated loss | (635,370 | ) | ||
|
| |||
| $ | 178,507,939 | |||
|
| |||
Net Asset Value Per Share—unlimited shares of beneficial interest authorized, $.00001 par value (based on 18,043,602 common shares outstanding) | $ | 9.89 | ||
|
| |||
See notes to financial statements.
| abfunds.com | AB TAXABLE MULTI-SECTOR INCOME SHARES | 27 | |
STATEMENT OF OPERATIONS
Year Ended April 30, 2020
| Investment Income |
| |||||||
Interest | $ | 5,198,689 | ||||||
Dividends—Affiliated issuers | 78,664 | |||||||
Other income(a) | 5,592 | $ | 5,282,945 | |||||
|
|
|
| |||||
| Expenses |
| |||||||
Bank overdraft expense | 13,383 | |||||||
|
| |||||||
Total expenses | 13,383 | |||||||
|
| |||||||
Net investment income | 5,269,562 | |||||||
|
| |||||||
| Realized and Unrealized Gain (Loss) on Investment Transactions | ||||||||
Net realized gain on: | ||||||||
Investment transactions | 1,180,655 | |||||||
Swaps | 181,429 | |||||||
Net change in unrealized appreciation/depreciation of: | ||||||||
Investments | (12,830 | ) | ||||||
Swaps | (899,408 | ) | ||||||
|
| |||||||
Net gain on investment transactions | 449,846 | |||||||
|
| |||||||
Net Increase in Net Assets from Operations | $ | 5,719,408 | ||||||
|
| |||||||
| (a) | Other income includes a reimbursement for investment in affiliated issuer (see Note B). |
See notes to financial statements.
| 28 | AB TAXABLE MULTI-SECTOR INCOME SHARES | abfunds.com | |
STATEMENT OF CHANGES IN NET ASSETS
| Year Ended April 30, 2020 | Year Ended April 30, 2019 | |||||||
| Increase (Decrease) in Net Assets from Operations | ||||||||
Net investment income | $ | 5,269,562 | $ | 3,852,818 | ||||
Net realized gain (loss) on investment transactions | 1,362,084 | (71,236 | ) | |||||
Net change in unrealized appreciation/depreciation of investments | (912,238 | ) | 2,150,372 | |||||
|
|
|
| |||||
Net increase in net assets from operations | 5,719,408 | 5,931,954 | ||||||
Distribution to Shareholders | (5,605,173 | ) | (3,965,321 | ) | ||||
| Transactions in Shares of Beneficial Interest | ||||||||
Net increase | 24,093,885 | 22,704,832 | ||||||
|
|
|
| |||||
Total increase | 24,208,120 | 24,671,465 | ||||||
| Net Assets | ||||||||
Beginning of period | 154,299,819 | 129,628,354 | ||||||
|
|
|
| |||||
End of period | $ | 178,507,939 | $ | 154,299,819 | ||||
|
|
|
| |||||
See notes to financial statements.
| abfunds.com | AB TAXABLE MULTI-SECTOR INCOME SHARES | 29 | |
NOTES TO FINANCIAL STATEMENTS
April 30, 2020
NOTE A
Significant Accounting Policies
AB Corporate Shares (the “Trust”) was organized as a Massachusetts business trust under the laws of The Commonwealth of Massachusetts by an Agreement and Declaration of Trust dated January 26, 2004. The Trust is registered under the Investment Company Act of 1940, as an open-end, diversified management investment company. The Trust operates as a “series” company currently offering five separate portfolios: AB Corporate Income Shares, AB Municipal Income Shares, AB Taxable Multi-Sector Income Shares, AB Impact Municipal Income Shares and AB Tax-Aware Real Return Income Shares. Each portfolio is considered to be a separate entity for financial reporting and tax purposes. This report relates only to AB Taxable Multi-Sector Income Shares (the “Fund”).
Shares of the Fund are offered exclusively to holders of accounts established under wrap-fee programs sponsored and maintained by certain registered investment advisers approved by AllianceBernstein L.P. (the “Adviser”). The Fund’s shares may be purchased at the relevant net asset value without a sales charge or other fee. The financial statements have been prepared in conformity with U.S. generally accepted accounting principles (“U.S. GAAP”) which require management to make certain estimates and assumptions that affect the reported amounts of assets and liabilities in the financial statements and amounts of income and expenses during the reporting period. Actual results could differ from those estimates. The Fund is an investment company under U.S. GAAP and follows the accounting and reporting guidance applicable to investment companies. The following is a summary of significant accounting policies followed by the Fund.
1. Security Valuation
Portfolio securities are valued at their current market value determined on the basis of market quotations or, if market quotations are not readily available or are deemed unreliable, at “fair value” as determined in accordance with procedures established by and under the general supervision of the Trust’s Board of Trustees (the “Board”).
In general, the market values of securities which are readily available and deemed reliable are determined as follows: securities listed on a national securities exchange (other than securities listed on the NASDAQ Stock Market, Inc. (“NASDAQ”)) or on a foreign securities exchange are valued at the last sale price at the close of the exchange or foreign securities exchange. If there has been no sale on such day, the securities are valued at the last traded price from the previous day. Securities listed on more than one exchange are valued by reference to the principal exchange on which the securities are traded; securities listed only on NASDAQ are val-
| 30 | AB TAXABLE MULTI-SECTOR INCOME SHARES | abfunds.com | |
NOTES TO FINANCIAL STATEMENTS (continued)
ued in accordance with the NASDAQ Official Closing Price; listed or over the counter (“OTC”) market put or call options are valued at the mid level between the current bid and ask prices. If either a current bid or current ask price is unavailable, the Adviser will have discretion to determine the best valuation (e.g., last trade price in the case of listed options); open futures are valued using the closing settlement price or, in the absence of such a price, the most recent quoted bid price. If there are no quotations available for the day of valuation, the last available closing settlement price is used; U.S. Government securities and any other debt instruments having 60 days or less remaining until maturity are generally valued at market by an independent pricing vendor, if a market price is available. If a market price is not available, the securities are valued at amortized cost. This methodology is commonly used for short term securities that have an original maturity of 60 days or less, as well as short term securities that had an original term to maturity that exceeded 60 days. In instances when amortized cost is utilized, the Valuation Committee (the “Committee”) must reasonably conclude that the utilization of amortized cost is approximately the same as the fair value of the security. Such factors the Committee will consider include, but are not limited to, an impairment of the creditworthiness of the issuer or material changes in interest rates. Fixed-income securities, including mortgage-backed and asset-backed securities, may be valued on the basis of prices provided by a pricing service or at a price obtained from one or more of the major broker-dealers. In cases where broker-dealer quotes are obtained, the Adviser may establish procedures whereby changes in market yields or spreads are used to adjust, on a daily basis, a recently obtained quoted price on a security. Swaps and other derivatives are valued daily, primarily using independent pricing services, independent pricing models using market inputs, as well as third party broker-dealers or counterparties. Open end mutual funds are valued at the closing net asset value per share, while exchange traded funds are valued at the closing market price per share.
Securities for which market quotations are not readily available (including restricted securities) or are deemed unreliable are valued at fair value as deemed appropriate by the Adviser. Factors considered in making this determination may include, but are not limited to, information obtained by contacting the issuer, analysts, analysis of the issuer’s financial statements or other available documents. In addition, the Fund may use fair value pricing for securities primarily traded in non-U.S. markets because most foreign markets close well before the Fund values its securities at 4:00 p.m., Eastern Time. The earlier close of these foreign markets gives rise to the possibility that significant events, including broad market moves, may have occurred in the interim and may materially affect the value of those securities. To account for this, the Fund generally values many of its foreign equity securities using fair value prices based on third party vendor modeling tools to the extent available.
| abfunds.com | AB TAXABLE MULTI-SECTOR INCOME SHARES | 31 | |
NOTES TO FINANCIAL STATEMENTS (continued)
2. Fair Value Measurements
In accordance with U.S. GAAP regarding fair value measurements, fair value is defined as the price that the Fund would receive to sell an asset or pay to transfer a liability in an orderly transaction between market participants at the measurement date. U.S. GAAP establishes a framework for measuring fair value, and a three-level hierarchy for fair value measurements based upon the transparency of inputs to the valuation of an asset or liability (including those valued based on their market values as described in Note A.1 above). Inputs may be observable or unobservable and refer broadly to the assumptions that market participants would use in pricing the asset or liability. Observable inputs reflect the assumptions market participants would use in pricing the asset or liability based on market data obtained from sources independent of the Fund. Unobservable inputs reflect the Fund’s own assumptions about the assumptions that market participants would use in pricing the asset or liability based on the best information available in the circumstances. Each investment is assigned a level based upon the observability of the inputs which are significant to the overall valuation. The three-tier hierarchy of inputs is summarized below.
| • | Level 1—quoted prices in active markets for identical investments |
| • | Level 2—other significant observable inputs (including quoted prices for similar investments, interest rates, prepayment speeds, credit risk, etc.) |
| • | Level 3—significant unobservable inputs (including the Fund’s own assumptions in determining the fair value of investments) |
The fair value of debt instruments, such as bonds, and over-the-counter derivatives is generally based on market price quotations, recently executed market transactions (where observable) or industry recognized modeling techniques and are generally classified as Level 2. Pricing vendor inputs to Level 2 valuations may include quoted prices for similar investments in active markets, interest rate curves, coupon rates, currency rates, yield curves, option adjusted spreads, default rates, credit spreads and other unique security features in order to estimate the relevant cash flows which are then discounted to calculate fair values. If these inputs are unobservable and significant to the fair value, these investments will be classified as Level 3.
Valuations of mortgage-backed or other asset-backed securities, by pricing vendors, are based on both proprietary and industry recognized models and discounted cash flow techniques. Significant inputs to the valuation of these instruments are value of the collateral, the rates and timing of delinquencies, the rates and timing of prepayments, and default and loss expectations, which are driven in part by housing prices for residential mortgages. Significant inputs are determined based on relative value
| 32 | AB TAXABLE MULTI-SECTOR INCOME SHARES | abfunds.com | |
NOTES TO FINANCIAL STATEMENTS (continued)
analyses, which incorporate comparisons to instruments with similar collateral and risk profiles, including relevant indices. Mortgage and asset-backed securities for which management has collected current observable data through pricing services are generally categorized within Level 2. Those investments for which current observable data has not been provided are classified as Level 3.
Other fixed income investments, including non-U.S. government and corporate debt, are generally valued using quoted market prices, if available, which are typically impacted by current interest rates, maturity dates and any perceived credit risk of the issuer. Additionally, in the absence of quoted market prices, these inputs are used by pricing vendors to derive a valuation based upon industry or proprietary models which incorporate issuer specific data with relevant yield/spread comparisons with more widely quoted bonds with similar key characteristics. Those investments for which there are observable inputs are classified as Level 2. Where the inputs are not observable, the investments are classified as Level 3.
The following table summarizes the valuation of the Fund’s investments by the above fair value hierarchy levels as of April 30, 2020:
Investments in Securities: | Level 1 | Level 2 | Level 3 | Total | ||||||||||||
Assets: | ||||||||||||||||
Corporates – Investment Grade | $ | – 0 | – | $ | 140,966,094 | $ | –0 | – | $ | 140,966,094 | ||||||
Local Governments – US Municipal Bonds | – 0 | – | 13,827,568 | – 0 | – | 13,827,568 | ||||||||||
Asset-Backed Securities | – 0 | – | 9,061,841 | – 0 | – | 9,061,841 | ||||||||||
Collateralized Mortgage Obligations | – 0 | – | 4,810,553 | – 0 | – | 4,810,553 | ||||||||||
Commercial Mortgage-Backed Securities | – 0 | – | 4,448,238 | – 0 | – | 4,448,238 | ||||||||||
Corporates – Non-Investment Grade | – 0 | – | 1,632,630 | – 0 | – | 1,632,630 | ||||||||||
Short-Term Investments | 656,427 | – 0 – | – 0 | – | 656,427 | |||||||||||
|
|
|
|
|
|
|
| |||||||||
Total Investments in Securities | 656,427 | 174,746,924 | – 0 | – | 175,403,351 | |||||||||||
Other Financial Instruments(a): | ||||||||||||||||
Assets: | ||||||||||||||||
Centrally Cleared Interest Rate Swaps | – 0 | – | 304,008 | – 0 | – | 304,008 | (b) | |||||||||
Credit Default Swaps | – 0 | – | 456,173 | – 0 | – | 456,173 | ||||||||||
Liabilities: | ||||||||||||||||
Centrally Cleared Credit Default Swaps | – 0 | – | (214,069 | ) | – 0 | – | (214,069 | )(b) | ||||||||
Centrally Cleared Interest Rate Swaps | – 0 | – | (343,489 | ) | – 0 | – | (343,489 | )(b) | ||||||||
Credit Default Swaps | – 0 | – | (1,069,693 | ) | – 0 | – | (1,069,693 | ) | ||||||||
|
|
|
|
|
|
|
| |||||||||
Total | $ | 656,427 | $ | 173,879,854 | $ | –0 | – | $ | 174,536,281 | (c) | ||||||
|
|
|
|
|
|
|
| |||||||||
| abfunds.com | AB TAXABLE MULTI-SECTOR INCOME SHARES | 33 | |
NOTES TO FINANCIAL STATEMENTS (continued)
| (a) | Other financial instruments are derivative instruments, such as futures, forwards and swaps, which are valued at the unrealized appreciation/(depreciation) on the instrument. Other financial instruments may also include swaps with upfront premiums, options written and swaptions written which are valued at market value. |
| (b) | Only variation margin receivable/(payable) at period end is reported within the statement of assets and liabilities. This amount reflects cumulative unrealized appreciation/(depreciation) on futures and centrally cleared swaps as reported in the portfolio of investments. Where applicable, centrally cleared swaps with upfront premiums are presented here at market value. |
| (c) | Amounts of $3,694,807 and $1,000,090 for Asset-Backed Securities and Commercial Mortgage-Backed Securities, respectively, were transferred out of Level 3 into Level 2 as improved transparency of price inputs received from pricing vendors has increased the observability during the reporting period. |
3. Taxes
It is the Fund’s policy to meet the requirements of the Internal Revenue Code applicable to regulated investment companies and to distribute all of its investment company taxable income and net realized gains, if any, to shareholders. Therefore, no provisions for federal income or excise taxes are required.
In accordance with U.S. GAAP requirements regarding accounting for uncertainties in income taxes, management has analyzed the Fund’s tax positions taken or expected to be taken on federal and state income tax returns for all open tax years (the current and the prior three tax years) and has concluded that no provision for income tax is required in the Fund’s financial statements.
4. Investment Income and Investment Transactions
Dividend income is recorded on the ex-dividend date or as soon as the Fund is informed of the dividend. Interest income is accrued daily. Investment transactions are accounted for on the date the securities are purchased or sold. Investment gains or losses are determined on the identified cost basis. The Fund amortizes premiums and accretes discounts as adjustments to interest income.
5. Dividends and Distributions
Dividends and distributions to shareholders, if any, are recorded on the ex-dividend date. Income dividends and capital gains distributions are determined in accordance with federal tax regulations and may differ from those determined in accordance with U.S. GAAP. To the extent these differences are permanent, such amounts are reclassified within the capital accounts based on their federal tax basis treatment; temporary differences do not require such reclassification.
NOTE B
Advisory Fee and Other Transactions with Affiliates
Under the terms of the Advisory Agreement, the Fund pays no advisory fee to the Adviser and the Adviser reimburses or pays for the Fund’s operating expenses. The Fund is an integral part of separately managed accounts in
| 34 | AB TAXABLE MULTI-SECTOR INCOME SHARES | abfunds.com | |
NOTES TO FINANCIAL STATEMENTS (continued)
wrap-fee programs and other investment programs. Typically, participants in these programs pay a fee to their investment adviser for all costs and expenses of the separately managed account, including costs and expenses associated with the Fund, and a fee is paid by their investment adviser to the Adviser. In certain cases, participants may have a direct relationship with the Adviser without the involvement of a third party investment adviser, in which case the participant would pay a fee directly to the Adviser. The Adviser serves as investment manager and adviser of the Fund and continuously furnishes an investment program for the Fund and manages, supervises and conducts the affairs of the Fund, subject to the supervisions of the Fund’s Board. The Advisory Agreement provides that the Adviser or an affiliate will furnish, or pay the expenses of the Fund for, office space, facilities and equipment, services of executive and other personnel of the Fund and certain administrative services.
The Fund has entered into a distribution agreement with AllianceBernstein Investments, Inc., the Fund’s principal underwriter (the “Underwriter”), to permit the Underwriter to distribute the Fund’s shares, which are sold at their net asset value without any sales charge. The Fund does not pay a fee for this service. The Underwriter is a wholly owned subsidiary of the Adviser.
AllianceBernstein Investor Services, Inc. (“ABIS”), a wholly-owned subsidiary of the Adviser, acts as the Fund’s registrar, transfer agent and dividend-disbursing agent. ABIS registers the transfer, issuance and redemption of Fund shares and disburses dividends and other distributions to Fund shareholders. The Fund does not pay a fee for this service.
The Fund may invest in AB Government Money Market Portfolio (the “Government Money Market Portfolio”) which has a contractual annual advisory fee rate of ..20% of the portfolio’s average daily net assets and bears its own expenses. The Adviser has contractually agreed to waive .10% of the advisory fee of Government Money Market Portfolio (resulting in a net advisory fee of .10%) until August 31, 2020. In connection with the investment by the Fund in Government Money Market Portfolio, the Adviser has contractually agreed to reimburse its advisory fee from the Fund in an amount equal to the Fund’s pro rata share of the effective advisory fee of Government Money Market Portfolio, as borne indirectly by the Fund as an acquired fund fee and expense. For the year ended April 30, 2020, such reimbursement amounted to $4,355.
| abfunds.com | AB TAXABLE MULTI-SECTOR INCOME SHARES | 35 | |
NOTES TO FINANCIAL STATEMENTS (continued)
A summary of the Fund’s transactions in AB mutual funds for the year ended April 30, 2020 is as follows:
Fund | Market Value 4/30/19 (000) | Purchases at Cost (000) | Sales Proceeds (000) | Market Value 4/30/20 (000) | Dividend Income (000) | |||||||||||||||
Government Money Market Portfolio | $ | 2,711 | $ | 189,984 | $ | 192,039 | $ | 656 | $ | 79 | ||||||||||
During the second quarter of 2018, AXA S.A. (“AXA”), a French holding company for the AXA Group, completed the sale of a minority stake in its subsidiary, AXA Equitable Holdings, Inc. (now named Equitable Holdings, Inc.)(“Equitable”), through an initial public offering. Equitable is the holding company for a diverse group of financial services companies, including an approximately 64.9% economic interest in the Adviser and a 100% interest in AllianceBernstein Corporation, the general partner of the Adviser. Since the initial sale, AXA has completed additional offerings, most recently during the fourth quarter of 2019. As a result, AXA currently owns less than 10% of the outstanding shares of common stock of Equitable, and no longer owns a controlling interest in Equitable. AXA previously announced its intention to sell its entire interest in Equitable over time, subject to market conditions and other factors (the “Plan”). Most of AXA’s remaining Equitable shares are to be delivered on redemption of AXA bonds mandatorily exchangeable into Equitable shares and maturing in May 2021. AXA retains sole discretion to determine the timing of any future sales of its remaining shares of Equitable common stock.
Sales under the Plan that were completed on November 13, 2019 resulted in the indirect transfer of a “controlling block” of voting securities of the Adviser (a “Change of Control Event”) and may have been deemed to have been an “assignment” causing a termination of the Fund’s investment advisory and administration agreements. In order to ensure that investment advisory and administration services could continue uninterrupted in the event of a Change of Control Event, the Board previously approved new investment advisory and administration agreements with the Adviser, and shareholders of the Fund subsequently approved the new investment advisory agreement. These agreements became effective on November 13, 2019.
NOTE C
Investment Transactions
Purchases and sales of investment securities (excluding short-term investments) for the year ended April 30, 2020 were as follows:
| Purchases | Sales | |||||||
Investment securities (excluding U.S. government securities) | $ | 215,495,063 | $ | 175,980,808 | ||||
U.S. government securities | 65,182,884 | 74,713,661 | ||||||
| 36 | AB TAXABLE MULTI-SECTOR INCOME SHARES | abfunds.com | |
NOTES TO FINANCIAL STATEMENTS (continued)
The cost of investments for federal income tax purposes, gross unrealized appreciation and unrealized depreciation are as follows:
Cost | $ | 175,098,002 | ||
|
| |||
Gross unrealized appreciation | $ | 2,921,138 | ||
Gross unrealized depreciation | (2,669,439 | ) | ||
|
| |||
Net unrealized appreciation | $ | 251,699 | ||
|
|
1. Derivative Financial Instruments
The Fund may use derivatives in an effort to earn income and enhance returns, to replace more traditional direct investments, to obtain exposure to otherwise inaccessible markets (collectively, “investment purposes”), or to hedge or adjust the risk profile of its portfolio.
The principal types of derivatives utilized by the Fund, as well as the methods in which they may be used are:
| • | Swaps |
The Fund may enter into swaps to hedge its exposure to interest rates, credit risk or currencies. The Fund may also enter into swaps for non-hedging purposes as a means of gaining market exposures, making direct investments in foreign currencies, as described below under “Currency Transactions.” A swap is an agreement that obligates two parties to exchange a series of cash flows at specified intervals based upon or calculated by reference to changes in specified prices or rates for a specified amount of an underlying asset. The payment flows are usually netted against each other, with the difference being paid by one party to the other. In addition, collateral may be pledged or received by the Fund in accordance with the terms of the respective swaps to provide value and recourse to the Fund or its counterparties in the event of default, bankruptcy or insolvency by one of the parties to the swap.
Risks may arise as a result of the failure of the counterparty to the swap to comply with the terms of the swap. The loss incurred by the failure of a counterparty is generally limited to the net interim payment to be received by the Fund, and/or the termination value at the end of the contract. Therefore, the Fund considers the creditworthiness of each counterparty to a swap in evaluating potential counterparty risk. This risk is mitigated by having a netting arrangement between the Fund and the counterparty and by the posting of collateral by the counterparty to the Fund to cover the Fund’s exposure to the counterparty. Additionally, risks may arise from unanticipated movements in interest rates or in the value of the underlying securities. The Fund accrues for the interim payments on swaps on a daily basis, with the net amount recorded within unrealized appreciation/depreciation of swaps on the
| abfunds.com | AB TAXABLE MULTI-SECTOR INCOME SHARES | 37 | |
NOTES TO FINANCIAL STATEMENTS (continued)
statement of assets and liabilities, where applicable. Once the interim payments are settled in cash, the net amount is recorded as realized gain/(loss) on swaps on the statement of operations, in addition to any realized gain/(loss) recorded upon the termination of swaps. Upfront premiums paid or received for OTC swaps are recognized as cost or proceeds on the statement of assets and liabilities and are amortized on a straight line basis over the life of the contract. Amortized upfront premiums are included in net realized gain/(loss) from swaps on the statement of operations. Fluctuations in the value of swaps are recorded as a component of net change in unrealized appreciation/depreciation of swaps on the statement of operations.
Certain standardized swaps, including certain interest rate swaps and credit default swaps, are (or soon will be) subject to mandatory central clearing. Cleared swaps are transacted through futures commission merchants (“FCMs”) that are members of central clearinghouses, with the clearinghouse serving as central counterparty, similar to transactions in futures contracts. Centralized clearing will be required for additional categories of swaps on a phased-in basis based on requirements published by the Securities and Exchange Commission and Commodity Futures Trading Commission.
At the time the Fund enters into a centrally cleared swap, the Fund deposits and maintains as collateral an initial margin with the broker, as required by the clearinghouse on which the transaction is effected. Such amount is shown as cash collateral due from broker on the statement of assets and liabilities. Pursuant to the contract, the Fund agrees to receive from or pay to the broker an amount of cash equal to the daily fluctuation in the value of the contract. Such receipts or payments are known as variation margin and are recorded by the Fund as unrealized gains or losses. Risks may arise from the potential inability of a counterparty to meet the terms of the contract. The credit/counterparty risk for centrally cleared swaps is generally less than non-centrally cleared swaps, since the clearinghouse, which is the issuer or counterparty to each centrally cleared swap, has robust risk mitigation standards, including the requirement to provide initial and variation margin. When the contract is closed, the Fund records a realized gain or loss equal to the difference between the value of the contract at the time it was opened and the time it was closed.
Interest Rate Swaps:
The Fund is subject to interest rate risk exposure in the normal course of pursuing its investment objectives. Because the Fund holds fixed rate bonds, the value of these bonds may decrease if interest rates rise. To help hedge against this risk and to maintain its ability to generate income at prevailing market rates, the Fund may enter into
| 38 | AB TAXABLE MULTI-SECTOR INCOME SHARES | abfunds.com | |
NOTES TO FINANCIAL STATEMENTS (continued)
interest rate swaps. Interest rate swaps are agreements between two parties to exchange cash flows based on a notional amount. The Fund may elect to pay a fixed rate and receive a floating rate, or, receive a fixed rate and pay a floating rate on a notional amount.
In addition, the Fund may also enter into interest rate swap transactions to preserve a return or spread on a particular investment or portion of its portfolio, or protecting against an increase in the price of securities the Fund anticipates purchasing at a later date. Interest rate swaps involve the exchange by a Fund with another party of their respective commitments to pay or receive interest (e.g., an exchange of floating rate payments for fixed rate payments) computed based on a contractually-based principal (or “notional”) amount. Interest rate swaps are entered into on a net basis (i.e., the two payment streams are netted out, with the Fund receiving or paying, as the case may be, only the net amount of the two payments).
During the year ended April 30, 2020, the Fund held interest rate swaps for hedging purposes.
Credit Default Swaps:
The Fund may enter into credit default swaps, including to manage its exposure to the market or certain sectors of the market, to reduce its risk exposure to defaults by corporate and sovereign issuers held by the Fund, or to create exposure to corporate or sovereign issuers to which it is not otherwise exposed. The Fund may purchase credit protection (“Buy Contract”) or provide credit protection (“Sale Contract”) on the referenced obligation of the credit default swap. During the term of the swap, the Fund receives/(pays) fixed payments from/(to) the respective counterparty, calculated at the agreed upon rate applied to the notional amount. If the Fund is a buyer/(seller) of protection and a credit event occurs, as defined under the terms of the swap, the Fund will either (i) receive from the seller/(pay to the buyer) of protection an amount equal to the notional amount of the swap (the “Maximum Payout Amount”) and deliver/(take delivery of) the referenced obligation or (ii) receive/(pay) a net settlement amount in the form of cash or securities equal to the notional amount of the swap less the recovery value of the referenced obligation. In certain circumstances Maximum Payout Amounts may be partially offset by recovery values of the respective referenced obligations, upfront premium received upon entering into the agreement, or net amounts received from settlement of buy protection credit default swaps entered into by the Fund for the same referenced obligations with the same counterparty.
Credit default swaps may involve greater risks than if a Fund had invested in the referenced obligation directly. Credit default swaps are
| abfunds.com | AB TAXABLE MULTI-SECTOR INCOME SHARES | 39 | |
NOTES TO FINANCIAL STATEMENTS (continued)
subject to general market risk, liquidity risk, counterparty risk and credit risk. If the Fund is a buyer of protection and no credit event occurs, it will lose the payments it made to its counterparty. If the Fund is a seller of protection and a credit event occurs, the value of the referenced obligation received by the Fund coupled with the periodic payments previously received, may be less than the Maximum Payout Amount it pays to the buyer, resulting in a net loss to the Fund.
Implied credit spreads over U.S. Treasuries of comparable maturity utilized in determining the market value of credit default swaps on issuers as of period end are disclosed in the portfolio of investments. The implied spreads serve as an indicator of the current status of the payment/performance risk and typically reflect the likelihood of default by the issuer of the referenced obligation. The implied credit spread of a particular reference obligation also reflects the cost of buying/selling protection and may reflect upfront payments required to be made to enter into the agreement. Widening credit spreads typically represent a deterioration of the referenced obligation’s credit soundness and greater likelihood of default or other credit event occurring as defined under the terms of the agreement. A credit spread identified as “Defaulted” indicates a credit event has occurred for the referenced obligation.
During the year ended April 30, 2020, the Fund held credit default swaps for non-hedging purposes.
The Fund typically enters into International Swaps and Derivatives Association, Inc. Master Agreements (“ISDA Master Agreement”) with its OTC derivative contract counterparties in order to, among other things, reduce its credit risk to OTC counterparties. ISDA Master Agreements include provisions for general obligations, representations, collateral and events of default or termination. Under an ISDA Master Agreement, the Fund typically may offset with the OTC counterparty certain derivative financial instruments’ payables and/or receivables with collateral held and/or posted and create one single net payment (close-out netting) in the event of default or termination. In the event of a default by an OTC counterparty, the return of collateral with market value in excess of the Fund’s net liability, held by the defaulting party, may be delayed or denied.
The Fund’s ISDA Master Agreements may contain provisions for early termination of OTC derivative transactions in the event the net assets of the Fund decline below specific levels (“net asset contingent features”). If these levels are triggered, the Fund’s OTC counterparty has the right to terminate such transaction and require the Fund to pay or receive a settlement amount in connection with the terminated transaction. If OTC derivatives were held at period end, please refer to netting arrangements by the OTC counterparty table below for additional details.
| 40 | AB TAXABLE MULTI-SECTOR INCOME SHARES | abfunds.com | |
NOTES TO FINANCIAL STATEMENTS (continued)
During the year ended April 30, 2020, the Fund had entered into the following derivatives:
Asset Derivatives | Liability Derivatives | |||||||||||
Derivative Type | Statement of | Fair Value | Statement of | Fair Value | ||||||||
Credit contracts | Receivable/Payable for variation margin on centrally cleared swaps | $ | 81,964 | * | ||||||||
Interest rate contracts | Receivable/Payable for variation margin on centrally cleared swaps | $ | 304,008 | * | Receivable/Payable for variation margin on centrally cleared swaps | | 343,489 | * | ||||
Credit contracts | Market value on credit default swaps | 456,173 | Market value on credit default swaps | 1,069,693 | ||||||||
|
|
|
| |||||||||
Total | $ | 760,181 | $ | 1,495,146 | ||||||||
|
|
|
| |||||||||
| * | Only variation margin receivable/payable at period end is reported within the statement of assets and liabilities. This amount reflects cumulative unrealized appreciation/(depreciation) on futures and centrally cleared swaps as reported in the portfolio of investments. |
Derivative Type | Location of Gain | Realized Gain or (Loss) on Derivatives | Change in Unrealized Appreciation or (Depreciation) | |||||||
Interest rate contracts | Net realized gain (loss) on swaps; Net change in unrealized appreciation/depreciation of swaps | $ | 222,278 | $ | (329,016 | ) | ||||
Credit contracts | Net realized gain (loss) on swaps; Net change in unrealized appreciation/depreciation of swaps | (40,849 | ) | (570,392 | ) | |||||
|
|
|
| |||||||
Total | $ | 181,429 | $ | (899,408 | ) | |||||
|
|
|
| |||||||
The following table represents the average monthly volume of the Fund’s derivative transactions during the year ended April 30, 2020:
Centrally Cleared Interest Rate Swaps: | ||||
Average notional amount | $ | 34,893,846 | ||
Credit Default Swaps: | ||||
Average notional amount of buy contracts | $ | 1,640,769 | ||
Average notional amount of sale contracts | $ | 3,340,385 | ||
Centrally Cleared Credit Default Swaps: | ||||
Average notional amount of buy contracts | $ | 45,000,000 | (a) |
| (a) | Positions were open for one month during the year. |
| abfunds.com | AB TAXABLE MULTI-SECTOR INCOME SHARES | 41 | |
NOTES TO FINANCIAL STATEMENTS (continued)
For financial reporting purposes, the Fund does not offset derivative assets and derivative liabilities that are subject to netting arrangements in the statement of assets and liabilities.
All OTC derivatives held at period end were subject to netting arrangements. The following table presents the Fund’s derivative assets and liabilities by OTC counterparty net of amounts available for offset under ISDA Master Agreements (“MA”) and net of the related collateral received/pledged by the Fund as of April 30, 2020. Exchange-traded derivatives and centrally cleared swaps are not subject to netting arrangements and as such are excluded from the table.
Counterparty | Derivative Assets Subject to a MA | Derivatives Available for Offset | Cash Collateral Received* | Security Collateral Received* | Net Amount of Derivative Assets | |||||||||||||||
Citigroup Global Markets, Inc. | $ | 28,759 | $ | (28,759 | ) | $ | – 0 | – | $ | – 0 | – | $ | – 0 | – | ||||||
JPMorgan Securities LLC | 427,414 | (346,539 | ) | – 0 | – | – 0 | – | 80,875 | ||||||||||||
|
|
|
|
|
|
|
|
|
| |||||||||||
Total | $ | 456,173 | $ | (375,298 | ) | $ | – 0 | – | $ | – 0 | – | $ | 80,875 | ^ | ||||||
|
|
|
|
|
|
|
|
|
| |||||||||||
Counterparty | Derivative Liabilities Subject to a MA | Derivatives Available for Offset | Cash Collateral Pledged* | Security Collateral Pledged* | Net Amount of Derivative Liabilities | |||||||||||||||
Citigroup Global Markets, Inc. | $ | 440,999 | $ | (28,759 | ) | $ | (412,240 | ) | $ | – 0 | – | $ | – 0 | – | ||||||
Credit Suisse International | 187,555 | – 0 | – | – 0 | – | – 0 | – | 187,555 | ||||||||||||
Goldman Sachs International | 94,600 | – 0 | – | – 0 | – | – 0 | – | 94,600 | ||||||||||||
JPMorgan Securities LLC | 346,539 | (346,539 | ) | – 0 | – | – 0 | – | – 0 | – | |||||||||||
|
|
|
|
|
|
|
|
|
| |||||||||||
Total | $ | 1,069,693 | $ | (375,298 | ) | $ | (412,240 | ) | $ | – 0 | – | $ | 282,155 | ^ | ||||||
|
|
|
|
|
|
|
|
|
| |||||||||||
| * | The actual collateral received/pledged may be more than the amount reported due to over-collateralization. |
| ^ | Net amount represents the net receivable/payable that would be due from/to the counterparty in the event of default or termination. The net amount from OTC financial derivative instruments can only be netted across transactions governed under the same master agreement with the same counterparty. |
2. Currency Transactions
The Fund may invest in non-U.S. Dollar-denominated securities on a currency hedged or unhedged basis. The Fund may seek investment opportunities by taking long or short positions in currencies through the use of currency-related derivatives, including forward currency exchange contracts, futures and options on futures, swaps, and other options. The Fund may enter into transactions for investment opportunities when it anticipates that a foreign currency will appreciate or depreciate in value but securities denominated in that currency are not held by the Fund and do not present attractive investment opportunities. Such transactions may also be used when the Adviser believes that it may be more efficient than a direct investment in a foreign currency-denominated security. The Fund may also
| 42 | AB TAXABLE MULTI-SECTOR INCOME SHARES | abfunds.com | |
NOTES TO FINANCIAL STATEMENTS (continued)
conduct currency exchange contracts on a spot basis (i.e., for cash at the spot rate prevailing in the currency exchange market for buying or selling currencies).
NOTE D
Shares of Beneficial Interest
Transactions in shares of beneficial interest were as follows:
| Shares | Amount | |||||||||||||||||||||||
| Year Ended April 30, 2020 | Year Ended April 30, 2019 | Year Ended April 30, 2020 | Year Ended April 30, 2019 | |||||||||||||||||||||
|
| |||||||||||||||||||||||
Shares sold | 27,279,165 | 8,683,152 | $ | 270,823,547 | $ | 84,359,626 | ||||||||||||||||||
| ||||||||||||||||||||||||
Shares redeemed | (24,944,045 | ) | (6,340,194 | ) | (246,729,662 | ) | (61,654,794 | ) | ||||||||||||||||
| ||||||||||||||||||||||||
Net increase | 2,335,120 | 2,342,958 | $ | 24,093,885 | $ | 22,704,832 | ||||||||||||||||||
| ||||||||||||||||||||||||
NOTE E
Risks Involved in Investing in the Fund
Market Risk—The market value of a security may move up or down, sometimes rapidly and unpredictably. These fluctuations may cause a security to be worth less than the price originally paid for it, or less than it was worth at an earlier time. Market risk may affect a single issuer, industry, sector of the economy or the market as a whole. Global economies and financial markets are increasingly interconnected, which increases the probabilities that conditions in one country or region might adversely impact issuers in a different country or region. Conditions affecting the general economy, including political, social, or economic instability at the local, regional, or global level may also affect the market value of a security. Health crises, such as pandemic and epidemic diseases, as well as other incidents that interrupt the expected course of events, such as natural disasters, war or civil disturbance, acts of terrorism, power outages and other unforeseeable and external events, and the public response to or fear of such diseases or events, have and may in the future have an adverse effect on the Fund’s investments and net asset value and can lead to increased market volatility. For example, any preventative or protective actions that governments may take in respect of such diseases or events may result in periods of business disruption, inability to obtain raw materials, supplies and component parts, and reduced or disrupted operations for the Fund’s portfolio companies. The occurrence and pendency of such diseases or events could adversely affect the economies and financial markets either in specific countries or worldwide.
Credit Risk—An issuer or guarantor of a fixed-income security, or the counterparty to a derivatives or other contract, may be unable or unwilling to make timely payments of interest or principal, or to otherwise honor its
| abfunds.com | AB TAXABLE MULTI-SECTOR INCOME SHARES | 43 | |
NOTES TO FINANCIAL STATEMENTS (continued)
obligations. The issuer or guarantor may default, causing a loss of the full principal amount of a security and any accrued interest. The degree of risk for a particular security may be reflected in its credit rating. Investments in fixed-income securities with lower ratings tend to have a higher probability that an issuer will default or fail to meet its payment obligations.
Interest Rate Risk—Changes in interest rates will affect the value of investments in fixed-income securities. When interest rates rise, the value of existing investments in fixed-income securities tends to fall and this decrease in value may not be offset by higher income from new investments. Interest rate risk is generally greater for fixed-income securities with longer maturities or durations.
Below Investment Grade Securities Risk—Investments in fixed-income securities with lower ratings (“junk bonds”) tend to have a higher probability that an issuer will default or fail to meet its payment obligations. These securities may be subject to greater price volatility due to such factors as specific corporate developments, interest rate sensitivity, negative perceptions of the junk bond market generally and may be more difficult to trade than other types of securities.
Inflation Risk—This is the risk that the value of assets or income from investments will be less in the future as inflation decreases the value of money. As inflation increases, the value of the Fund’s assets can decline as can the value of the Fund’s distributions. This risk is significantly greater for fixed-income securities with longer maturities.
Foreign (Non-U.S.) Risk—Investments in securities of non-U.S. issuers may involve more risk than those of U.S. issuers. These securities may fluctuate more widely in price and may be more difficult to trade due to adverse market, economic, political, regulatory or other factors.
Emerging Market Risk—Investments in emerging market countries may have more risk because the markets are less developed and less liquid as well as being subject to increased economic, political, regulatory or other uncertainties.
Currency Risk—Fluctuations in currency exchange rates may negatively affect the value of the Fund’s investments or reduce its returns.
Mortgage-Related and/or Other Asset-Backed Securities Risk—Investments in mortgage-related and other asset-backed securities are subject to certain additional risks. The value of these securities may be particularly sensitive to changes in interest rates. These risks include “extension risk”, which is the risk that, in periods of rising interest rates, issuers may delay the payment of principal, and “prepayment risk”, which
| 44 | AB TAXABLE MULTI-SECTOR INCOME SHARES | abfunds.com | |
NOTES TO FINANCIAL STATEMENTS (continued)
is the risk that in periods of falling interest rates, issuers may pay principal sooner than expected, exposing the Fund to a lower rate of return upon reinvestment of principal. Mortgage-backed securities offered by non-governmental issuers and other asset-backed securities may be subject to other risks, such as higher rates of default in the mortgages or assets backing the securities or risks associated with the nature and servicing of mortgages or assets backing the securities.
Derivatives Risk—The Fund may enter into derivative transactions such as forwards, options, futures and swaps. Derivatives may be illiquid, difficult to price, and leveraged so that small changes may produce disproportionate losses for the Fund, and subject to counterparty risk to a greater degree than more traditional investments. Derivatives may result in significant losses, including losses that are far greater than the value of the derivatives reflected on the statement of assets and liabilities.
Leverage Risk—When the Fund borrows money or otherwise leverages its investments, its performance may be volatile because leverage tends to exaggerate the effect of any increase or decrease in the value of the Fund’s investments. The Fund may create leverage through the use of reverse repurchase arrangements, forward currency exchange contracts, forward commitments, dollar rolls or futures or by borrowing money. The use of other types of derivative instruments by the Fund, such as options and swaps, may also result in a form of leverage. Leverage may result in higher returns to the Fund than if the Fund were not leveraged, but may also adversely affect returns, particularly if the market is declining.
LIBOR Risk—The Fund may invest in certain debt securities, derivatives or other financial instruments that utilize the London Interbank Offered Rate, or “LIBOR,” as a “benchmark” or “reference rate” for various interest rate calculations. In July 2017, the United Kingdom Financial Conduct Authority, which regulates LIBOR, announced a desire to phase out the use of LIBOR by the end of 2021. Although financial regulators and industry working groups have suggested alternative reference rates, such as European Interbank Offer Rate (“EURIBOR”), Sterling Overnight Interbank Average Rate (“SONIA”) and Secured Overnight Financing Rate (“SOFR”), global consensus on alternative rates is lacking and the process for amending existing contracts or instruments to transition away from LIBOR remains unclear. The elimination of LIBOR or changes to other reference rates or any other changes or reforms to the determination or supervision of reference rates could have an adverse impact on the market for, or value of, any securities or payments linked to those reference rates, which may adversely affect the Fund’s performance and/or net asset value. Uncertainty and risk also remain regarding the willingness and ability of issuers and lenders to include revised provisions in new and existing
| abfunds.com | AB TAXABLE MULTI-SECTOR INCOME SHARES | 45 | |
NOTES TO FINANCIAL STATEMENTS (continued)
contracts or instruments. Consequently, the transition away from LIBOR to other reference rates may lead to increased volatility and illiquidity in markets that are tied to LIBOR, fluctuations in values of LIBOR-related investments or investments in issuers that utilize LIBOR, increased difficulty in borrowing or refinancing and diminished effectiveness of hedging strategies, adversely affecting the Fund’s performance. Furthermore, the risks associated with the expected discontinuation of LIBOR and transition may be exacerbated if the work necessary to effect an orderly transition to an alternative reference rate is not completed in a timely manner. Because the usefulness of LIBOR as a benchmark could deteriorate during the transition period, these effects could occur prior to the end of 2021.
Indemnification Risk—In the ordinary course of business, the Fund enters into contracts that contain a variety of indemnifications. The Fund’s maximum exposure under these arrangements is unknown. However, the Fund has not had prior claims or losses pursuant to these indemnification provisions and expects the risk of loss thereunder to be remote. Therefore, the Fund has not accrued any liability in connection with these indemnification provisions.
Management Risk—The Fund is subject to management risk because it is an actively-managed investment fund. The Adviser will apply its investment techniques and risk analyses in making investment decisions, but there is no guarantee that its techniques will produce the intended results.
NOTE F
Joint Credit Facility
A number of open-end mutual funds managed by the Adviser, including the Fund, participate in a $325 million revolving credit facility (the “Facility”) intended to provide short-term financing, if necessary, subject to certain restrictions in connection with abnormal redemption activity. Commitment fees related to the Facility are paid by the Adviser. The Fund did not utilize the Facility during the year ended April 30, 2020.
NOTE G
Distributions to Shareholders
The tax character of distributions paid during the fiscal years ended April 30, 2020 and April 30, 2019 were as follows:
| 2020 | 2019 | |||||||
Distributions paid from: | ||||||||
Ordinary income | $ | 5,605,173 | $ | 3,965,321 | ||||
|
|
|
| |||||
Total distributions paid | $ | 5,605,173 | $ | 3,965,321 | ||||
|
|
|
| |||||
| 46 | AB TAXABLE MULTI-SECTOR INCOME SHARES | abfunds.com | |
NOTES TO FINANCIAL STATEMENTS (continued)
As of April 30, 2020, the components of accumulated earnings/(deficit) on a tax basis were as follows:
Accumulated capital losses | $ | (231,628 | )(a) | |
Other losses | (225,401 | )(b) | ||
Unrealized appreciation/(depreciation) | 248,787 | (c) | ||
|
| |||
Total accumulated earnings/(deficit) | $ | (208,242 | )(d) | |
|
|
| (a) | As of April 30, 2020, the Fund had a net capital loss carryforward of $231,628. During the fiscal year, the Fund utilized $920,684 of capital loss carryforwards to offset current year net realized gains. |
| (b) | As of April 30, 2020 the Fund had a qualified late-year ordinary loss deferral of $225,401. |
| (c) | The differences between book-basis and tax-basis unrealized appreciation/(depreciation) are attributable primarily to the tax deferral of losses on wash sales and the tax treatment of swaps. |
| (d) | The differences between book-basis and tax-basis components of accumulated earnings/(deficit) are attributable primarily to dividends payable. |
For tax purposes, net capital losses may be carried over to offset future capital gains, if any. Funds are permitted to carry forward realized capital losses for an indefinite period, and such losses will retain their character as either short-term or long-term capital losses. As of April 30, 2020, the Fund had a net short-term capital loss carryforward of $231,628, which may be carried forward for an indefinite period.
During the current fiscal year, there were no permanent differences that resulted in adjustments to accumulated loss or additional paid-in capital.
NOTE H
Recent Accounting Pronouncements
In March 2017, the Financial Accounting Standards Board issued an Accounting Standards Update, ASU 2017-08, Receivables—Nonrefundable Fees and Other Costs (Subtopic 310-20), Premium Amortization on Purchased Callable Debt Securities which amends the amortization period for certain purchased callable debt securities held at a premium, shortening such period to the earliest call date. ASU 2017-08 does not require any accounting change for debt securities held at a discount; the discount continues to be amortized to maturity. ASU 2017-08 is effective for fiscal years, and interim periods within those fiscal years, beginning after December 15, 2018. The Fund has adopted ASU 2017-08, which did not have a material impact on the Fund’s financial position or the results of its operations, and had no impact on the Fund’s net assets.
| abfunds.com | AB TAXABLE MULTI-SECTOR INCOME SHARES | 47 | |
NOTES TO FINANCIAL STATEMENTS (continued)
NOTE I
Subsequent Events
Management has evaluated subsequent events for possible recognition or disclosure in the financial statements through the date the financial statements are issued. Management has determined that there are no material events that would require disclosure in the Fund’s financial statements through this date.
| 48 | AB TAXABLE MULTI-SECTOR INCOME SHARES | abfunds.com | |
FINANCIAL HIGHLIGHTS
Selected Data For A Share Of Beneficial Interest Outstanding Throughout Each Period
| Year Ended April 30, | ||||||||||||||||||||
| 2020 | 2019 | 2018 | 2017 | 2016 | ||||||||||||||||
|
|
|
|
|
|
|
|
|
| |||||||||||
Net asset value, beginning of period | $9.82 | $9.70 | $9.84 | $9.91 | $9.97 | |||||||||||||||
|
|
|
|
|
|
|
|
|
| |||||||||||
Income From Investment Operations | ||||||||||||||||||||
Net investment income(a) | .24 | .25 | .20 | .17 | .14 | |||||||||||||||
Net realized and unrealized gain (loss) on investment transactions | .09 | .13 | (.14 | ) | (.01 | ) | (.02 | )† | ||||||||||||
|
|
|
|
|
|
|
|
|
| |||||||||||
Net increase in net asset value from operations | .33 | .38 | .06 | .16 | .12 | |||||||||||||||
|
|
|
|
|
|
|
|
|
| |||||||||||
Less: Dividends | ||||||||||||||||||||
Dividends from net investment income | (.26 | ) | (.26 | ) | (.20 | ) | (.23 | ) | (.18 | ) | ||||||||||
|
|
|
|
|
|
|
|
|
| |||||||||||
Net asset value, end of period | $9.89 | $9.82 | $9.70 | $9.84 | $9.91 | |||||||||||||||
|
| |||||||||||||||||||
Total Return | ||||||||||||||||||||
Total investment return based on net asset value(b) | 3.43 | % | 4.00 | % | .65 | % | 1.48 | % | 1.26 | % | ||||||||||
Ratios/Supplemental Data | ||||||||||||||||||||
Net assets, end of period (000’s omitted) | $178,508 | $154,300 | $129,628 | $74,327 | $307,233 | |||||||||||||||
Ratio to average net assets of: | ||||||||||||||||||||
Expenses | .01 | %(c) | 0 | % | 0 | % | 0 | % | 0 | % | ||||||||||
Net investment income | 2.47 | % | 2.62 | % | 2.05 | % | 1.67 | % | 1.44 | % | ||||||||||
Portfolio turnover rate | 124 | % | 45 | % | 81 | % | 85 | % | 109 | % | ||||||||||
| (a) | Based on average shares outstanding. |
| (b) | Total investment return is calculated assuming an initial investment made at the net asset value at the beginning of the period, reinvestment of all dividends and distributions at net asset value during the period, and redemption on the last day of the period. Total return does not reflect the deduction of taxes that a shareholder would pay on fund distributions or the redemption of fund shares. Total investment return calculated for a period of less than one year is not annualized. |
| (c) | The expense ratio, excluding bank overdraft expense is .00%. |
| † | Due to timing of sales and repurchase of capital shares, the net realized and unrealized gain (loss) per share is not in accordance with the Fund’s change in net realized and unrealized gain (loss) on investment transactions for the period. |
See notes to financial statements.
| abfunds.com | AB TAXABLE MULTI-SECTOR INCOME SHARES | 49 | |
REPORT OF INDEPENDENT REGISTERED
PUBLIC ACCOUNTING FIRM
To the Board of Trustees of AB Corporate Shares and Shareholders of AB Taxable Multi-Sector Income Shares:
Opinion on the Financial Statements
We have audited the accompanying statement of assets and liabilities of AB Taxable Multi-Sector Income Shares (the “Fund”) (one of the series constituting AB Corporate Shares (the “Trust”)), including the portfolio of investments, as of April 30, 2020, and the related statement of operations for the year then ended, the statements of changes in net assets for each of the two years in the period then ended, the financial highlights for each of the five years in the period then ended and the related notes (collectively referred to as the “financial statements”). In our opinion, the financial statements present fairly, in all material respects, the financial position of the Fund (one of the series constituting AB Corporate Shares) at April 30, 2020, the results of its operations for the year then ended, the changes in its net assets for each of the two years in the period then ended and its financial highlights for each of the five years in the period then ended, in conformity with U.S. generally accepted accounting principles.
Basis for Opinion
These financial statements are the responsibility of the Trust’s management. Our responsibility is to express an opinion on the Fund’s financial statements based on our audits. We are a public accounting firm registered with the Public Company Accounting Oversight Board (United States) (“PCAOB”) and are required to be independent with respect to the Fund in accordance with the U.S. federal securities laws and the applicable rules and regulations of the Securities and Exchange Commission and the PCAOB.
We conducted our audits in accordance with the standards of the PCAOB. Those standards require that we plan and perform the audit to obtain reasonable assurance about whether the financial statements are free of material misstatement, whether due to error or fraud. The Trust is not required to have, nor were we engaged to perform, an audit of the Trust’s internal control over financial reporting. As part of our audits, we are required to obtain an understanding of internal control over financial reporting, but not for the purpose of expressing an opinion on the effectiveness of the Trust’s internal control over financial reporting. Accordingly, we express no such opinion.
Our audits included performing procedures to assess the risks of material misstatement of the financial statements, whether due to error or fraud, and performing procedures that respond to those risks. Such procedures included examining, on a test basis, evidence regarding the amounts and
| 50 | AB TAXABLE MULTI-SECTOR INCOME SHARES | abfunds.com | |
REPORT OF INDEPENDENT REGISTERED
PUBLIC ACCOUNTING FIRM (continued)
disclosures in the financial statements. Our procedures included confirmation of securities owned as of April 30, 2020, by correspondence with the custodian and others or by other appropriate auditing procedures where replies from others were not received. Our audits also included evaluating the accounting principles used and significant estimates made by management, as well as evaluating the overall presentation of the financial statements. We believe that our audits provide a reasonable basis for our opinion.

We have served as the auditor of one or more of the AB investment companies since 1968.
New York, New York
June 26, 2020
| abfunds.com | AB TAXABLE MULTI-SECTOR INCOME SHARES | 51 | |
2020 FEDERAL TAX INFORMATION
(unaudited)
For Federal income tax purposes, the following information is furnished with respect to the distributions paid by the Fund during the taxable year ended April 30, 2020.
For foreign shareholders, 94.76% of ordinary dividends paid may be considered to be qualifying to be taxed as interest-related dividends.
Shareholders should not use the above information to prepare their income tax returns. The information necessary to complete your income tax returns will be included with your Form 1099-DIV which will be sent to you separately in January 2021.
| 52 | AB TAXABLE MULTI-SECTOR INCOME SHARES | abfunds.com | |
BOARD OF TRUSTEES
Marshall C. Turner, Jr.(1), Chairman Jorge A. Bermudez(1) Michael J. Downey(1) Nancy P. Jacklin(1) Robert M. Keith, President and Chief Executive Officer | Jeanette Loeb(1) Carol C. McMullen(1) Garry L. Moody(1) Earl D. Weiner(1) |
OFFICERS
Scott A. DiMaggio(2), Vice President Shawn E. Keegan(2), Vice President Douglas J. Peebles(2),* Senior Vice President Emilie D. Wrapp, Secretary | Michael B. Reyes, Senior Analyst Joseph J. Mantineo, Treasurer and Chief Financial Officer Phyllis J. Clarke, Controller Vincent S. Noto, Chief Compliance Officer |
Custodian and Accounting Agent State Street Bank and Trust Company
Principal Underwriter AllianceBernstein Investments, Inc.
Transfer Agent AllianceBernstein Investor Services, Inc. | Legal Counsel Seward & Kissel LLP One Battery Park Plaza New York, NY 10004
Independent Registered Public Accounting Firm Ernst & Young LLP 5 Times Square New York, NY 10036 |
| 1 | Member of the Audit Committee, the Governance and Nominating Committee and the Independent Directors Committee. |
| 2 | The day-to-day management of, and investment decisions for, the Fund’s portfolio are made by the Adviser’s Core Fixed-Income Team. Messrs. DiMaggio, Keegan and Peebles are the investment professionals primarily responsible for the day-to-day management of the Fund’s portfolio. |
| * | Mr. Peebles is expected to retire from the Adviser effective December 30, 2020. |
| abfunds.com | AB TAXABLE MULTI-SECTOR INCOME SHARES | 53 | |
TRUSTEES AND OFFICERS INFORMATION
Board of Trustees Information
The business and affairs of the Fund are managed under the direction of the Board of Trustees. Certain information concerning the Fund’s Trustees is set forth below.
| NAME, ADDRESS*, AGE, (YEAR FIRST ELECTED**) | PRINCIPAL OCCUPATION(S) DURING PAST FIVE YEARS AND OTHER INFORMATION*** | PORTFOLIOS IN AB FUND COMPLEX OVERSEEN BY TRUSTEE | OTHER PUBLIC COMPANY DIRECTORSHIP CURRENTLY HELD BY TRUSTEE | |||||
| INTERESTED TRUSTEE | ||||||||
Robert M. Keith,# 1345 Avenue of the Americas New York, NY 10105 60 (2010) | Senior Vice President of AllianceBernstein L.P. (the “Adviser”) and the head of AllianceBernstein Investments, Inc. (“ABI”) since July 2008; Director of ABI and President of the AB Mutual Funds. Previously, he served as Executive Managing Director of ABI from December 2006 to June 2008. Prior to joining ABI in 2006, Executive Managing Director of Bernstein Global Wealth Management, and prior thereto, Senior Managing Director and Global Head of Client Service and Sales of the Adviser’s institutional investment management business since 2004. Prior thereto, he was Managing Director and Head of North American Client Service and Sales in the Adviser’s institutional investment management business with which he had been associated since prior to 2004. | 90 | None | |||||
| 54 | AB TAXABLE MULTI-SECTOR INCOME SHARES | abfunds.com | |
TRUSTEES AND OFFICERS INFORMATION (continued)
| NAME, ADDRESS*, AGE, (YEAR FIRST ELECTED**) | PRINCIPAL OCCUPATION(S) DURING PAST FIVE YEARS AND OTHER INFORMATION*** | PORTFOLIOS IN AB FUND COMPLEX OVERSEEN BY TRUSTEE | OTHER PUBLIC COMPANY DIRECTORSHIP CURRENTLY HELD BY TRUSTEE | |||||
| INDEPENDENT TRUSTEES | ||||||||
Marshall C. Turner, Jr.,## Chairman of the Board 78 (2005) | Private Investor since prior to 2015. Former Chairman and CEO of Dupont Photomasks, Inc. (components of semi-conductor manufacturing). He has extensive operating leadership, and venture capital investing experience, including five interim or full-time CEO roles, and prior service as general partner of institutional venture capital partnerships. He also has extensive non-profit board leadership experience, and currently serves on the boards of two education and science-related non-profit organizations. He has served as a director of one AB Fund since 1992, and director or trustee of all AB Funds since 2005. He has been Chairman of the AB Funds since January 2014, and the Chairman of the Independent Directors Committees of such AB Funds since February 2014. | 90 | Xilinx, Inc. (programmable logic semi-conductors) since 2007 | |||||
| abfunds.com | AB TAXABLE MULTI-SECTOR INCOME SHARES | 55 | |
TRUSTEES AND OFFICERS INFORMATION (continued)
| NAME, ADDRESS*, AGE, (YEAR FIRST ELECTED**) | PRINCIPAL OCCUPATION(S) DURING PAST FIVE YEARS AND OTHER INFORMATION*** | PORTFOLIOS IN AB FUND COMPLEX OVERSEEN BY TRUSTEE | OTHER PUBLIC COMPANY DIRECTORSHIP CURRENTLY HELD BY TRUSTEE | |||||
| INDEPENDENT TRUSTEES (continued) | ||||||||
Jorge A. Bermudez,## 69 (2020) | Private investor since prior to 2015. Former Chief Risk Officer of Citigroup, Inc., a global financial services company, from November 2007 to March 2008, Chief Executive Officer of Citigroup’s Commercial Business Group in North America and Citibank Texas from 2005 to 2007, and a variety of other executive and leadership roles at various businesses within Citigroup prior to then; Chairman (2018) of the Texas A&M Foundation Board of Trustees (Trustee since 2013) and Chairman of the Smart Grid Center Board at Texas A&M University since 2012; director of, among others, Citibank N.A. from 2005 to 2008, the Federal Reserve Bank of Dallas, Houston Branch from 2009 to 2011, the Federal Reserve Bank of Dallas from 2011 to 2017, and the Electric Reliability Council of Texas from 2010 to 2016. He has served as director or trustee of the AB Funds since January 2020. | 90 | Moody’s Corporation since April 2011 | |||||
Michael J. Downey,## 76 (2005) | Private Investor since prior to 2015. Formerly, Chairman of The Asia Pacific Fund, Inc. (registered investment company) since prior to 2015 until January 2019. From 1987 until 1993, Chairman and CEO of Prudential Mutual Fund Management, director of the Prudential mutual funds, and member of the Executive Committee of Prudential Securities, Inc. He has served as a director or trustee of the AB Funds since 2005. | 90 | None | |||||
| 56 | AB TAXABLE MULTI-SECTOR INCOME SHARES | abfunds.com | |
TRUSTEES AND OFFICERS INFORMATION (continued)
| NAME, ADDRESS*, AGE, (YEAR FIRST ELECTED**) | PRINCIPAL OCCUPATION(S) DURING PAST FIVE YEARS AND OTHER INFORMATION*** | PORTFOLIOS IN AB FUND COMPLEX OVERSEEN BY TRUSTEE | OTHER PUBLIC COMPANY DIRECTORSHIP CURRENTLY HELD BY TRUSTEE | |||||
| INDEPENDENT TRUSTEES (continued) | ||||||||
Nancy P. Jacklin,## 72 (2006) | Private Investor since prior to 2015. Professorial Lecturer at the Johns Hopkins School of Advanced International Studies (2008-2015). U.S. Executive Director of the International Monetary Fund (which is responsible for ensuring the stability of the international monetary system), (December 2002-May 2006); Partner, Clifford Chance (1992-2002); Sector Counsel, International Banking and Finance, and Associate General Counsel, Citicorp (1985-1992); Assistant General Counsel (International), Federal Reserve Board of Governors (1982-1985); and Attorney Advisor, U.S. Department of the Treasury (1973-1982). Member of the Bar of the District of Columbia and of New York; and member of the Council on Foreign Relations. She has served as a director or trustee of the AB Funds since 2006 and has been Chair of the Governance and Nominating Committees of the AB Funds since August 2014. | 90 | None | |||||
Jeanette Loeb,## 68 (2020) | Chief Executive Officer of PetCareRx (e-commerce pet pharmacy) from 2002 to 2011 and 2015 to present. Director of New York City Center since 2005. She was a director of AB Multi-Manager Alternative Fund, Inc. (fund of hedge funds) from 2012 to 2018. Formerly, affiliated with Goldman Sachs Group, Inc. (financial services) from 1977 to 1994, including as a partner thereof from 1986 to 1994. She has served as a Director of the AB Funds since April 2020. | 90 | Apollo Investment Corp. (business development company) since August 2011 | |||||
| abfunds.com | AB TAXABLE MULTI-SECTOR INCOME SHARES | 57 | |
TRUSTEES AND OFFICERS INFORMATION (continued)
| NAME, ADDRESS*, AGE, (YEAR FIRST ELECTED**) | PRINCIPAL OCCUPATION(S) DURING PAST FIVE YEARS AND OTHER INFORMATION*** | PORTFOLIOS IN AB FUND COMPLEX OVERSEEN BY TRUSTEE | OTHER PUBLIC COMPANY DIRECTORSHIP CURRENTLY HELD BY TRUSTEE | |||||
| INDEPENDENT TRUSTEES (continued) | ||||||||
Carol C. McMullen,## 64 (2016) | Managing Director of Slalom Consulting (consulting) since 2014, private investor and member of the Advisory Board of Butcher Box (since 2018). Formerly, member, Partners Healthcare Investment Committee (2010-2019); Director of Norfolk & Dedham Group (mutual property and casualty insurance) from 2011 until November 2016; Director of Partners Community Physicians Organization (healthcare) from 2014 until December 2016; and Managing Director of The Crossland Group (consulting) from 2012 until 2013. She has held a number of senior positions in the asset and wealth management industries, including at Eastern Bank (where her roles included President of Eastern Wealth Management), Thomson Financial (Global Head of Sales for Investment Management), and Putnam Investments (where her roles included Chief Investment Officer, Core and Growth and Head of Global Investment Research). She has served on a number of private company and non-profit boards, and as a director or trustee of the AB Funds since June 2016. | 90 | None | |||||
| 58 | AB TAXABLE MULTI-SECTOR INCOME SHARES | abfunds.com | |
TRUSTEES AND OFFICERS INFORMATION (continued)
| NAME, ADDRESS*, AGE, (YEAR FIRST ELECTED**) | PRINCIPAL OCCUPATION(S) DURING PAST FIVE YEARS AND OTHER INFORMATION*** | PORTFOLIOS IN AB FUND COMPLEX OVERSEEN BY TRUSTEE | OTHER PUBLIC COMPANY DIRECTORSHIP CURRENTLY HELD BY TRUSTEE | |||||
| INDEPENDENT TRUSTEES (continued) | ||||||||
Garry L. Moody,## 68 (2008) | Private Investor since prior to 2015. Formerly, Partner, Deloitte & Touche LLP (1995-2008) where he held a number of senior positions, including Vice Chairman, and U.S. and Global Investment Management Practice Managing Partner; President, Fidelity Accounting and Custody Services Company (1993-1995), where he was responsible for accounting, pricing, custody and reporting for the Fidelity mutual funds; and Partner, Ernst & Young LLP (1975-1993), where he served as the National Director of Mutual Fund Tax Services and Managing Partner of its Chicago Office Tax department. He is a member of the Trustee Advisory Board of BoardIQ, a biweekly publication focused on issues and news affecting directors of mutual funds. He is also a member of the Investment Company Institute’s Board of Governors and the Independent Directors Council Governing Council. He has served as a director or trustee, and as Chairman of the Audit Committees, of the AB Funds since 2008. | 90 | None | |||||
| abfunds.com | AB TAXABLE MULTI-SECTOR INCOME SHARES | 59 | |
TRUSTEES AND OFFICERS INFORMATION (continued)
| NAME, ADDRESS*, AGE, (YEAR FIRST ELECTED**) | PRINCIPAL OCCUPATION(S) DURING PAST FIVE YEARS AND OTHER INFORMATION*** | PORTFOLIOS IN AB FUND COMPLEX OVERSEEN BY TRUSTEE | OTHER PUBLIC COMPANY DIRECTORSHIP CURRENTLY HELD BY TRUSTEE | |||||
| INDEPENDENT TRUSTEES (continued) | ||||||||
Earl D. Weiner,## 80 (2007) | Senior Counsel since 2017, Of Counsel from 2007 to 2016, and Partner prior to then, of the law firm Sullivan & Cromwell LLP. He is a former member of the ABA Federal Regulation of Securities Committee Task Force to draft editions of the Fund Director’s Guidebook. He also serves as a director or trustee of various non-profit organizations and has served as Chairman or Vice Chairman of a number of them. He has served as a director or trustee of the AB Funds since 2007 and served as Chairman of the Governance and Nominating Committees of the AB Funds from 2007 until August 2014. | 90 | None | |||||
| * | The address for each of the Trust’s disinterested Trustees is c/o AllianceBernstein L.P., Attention: Legal and Compliance Department – Mutual Fund Legal, 1345 Avenue of the Americas, New York, NY 10105. |
| ** | There is no stated term of office for the Trust’s Trustees. |
| *** | The information above includes each Trustee’s principal occupation during the last five years and other information relating to the experience, attributes, and skills relevant to each Trustee’s qualifications to serve as a Trustee, which led to the conclusion that each Trustee should serve as a Trustee for the Trust. |
| # | Mr. Keith is an “interested person” of the Trust as defined in the 1940 Act, due to his position as a Senior Vice President of the Adviser. |
| ## | Member of the Audit Committee, the Governance and Nominating Committee and the Independent Directors Committee. |
| 60 | AB TAXABLE MULTI-SECTOR INCOME SHARES | abfunds.com | |
TRUSTEES AND OFFICERS INFORMATION (continued)
Officer Information
Certain information concerning the Trust’s officers is set forth below.
NAME, ADDRESS,* AND AGE | POSITION(S) HELD WITH FUND | PRINCIPAL OCCUPATION DURING PAST FIVE YEARS | ||
| OFFICERS | ||||
| Robert M. Keith 60 | President and Chief Executive Officer | See biography above. | ||
Douglas J. Peebles^ 54 | Senior Vice President | Senior Vice President of the Adviser**, with which he has been associated since prior to 2015. He is also Chief Investment Officer of Fixed Income. | ||
Scott A. DiMaggio 48 | Vice President | Senior Vice President of the Adviser**, with which he had been associated since prior to 2015. He is also Co-Head of Fixed Income. | ||
| Shawn E. Keegan 48 | Vice President | Senior Vice President of the Adviser**, with which he has been associated since prior to 2015. | ||
Emilie D. Wrapp 64 | Secretary | Senior Vice President, Assistant General Counsel and Assistant Secretary of ABI**, with which she has been associated since prior to 2015. | ||
Michael B. Reyes 43 | Senior Analyst | Vice President of the Adviser**, with which he has been associated since prior to 2015. | ||
Joseph J. Mantineo 61 | Treasurer and Chief Financial Officer | Senior Vice President of AllianceBernstein Investor Services, Inc. (“ABIS”)**, with which he has been associated since prior to 2015. | ||
Phyllis J. Clarke 59 | Controller | Vice President of ABIS**, with which she has been associated since prior to 2015. | ||
Vincent S. Noto 55 | Chief Compliance Officer | Senior Vice President since 2015 and Mutual Fund Chief Compliance Officer of the Adviser** since prior to 2015. |
| * | The address for each of the Portfolio’s Officers is 1345 Avenue of the Americas, New York, NY 10105. |
| ** | The Adviser, ABI and ABIS are affiliates of the Trust. |
| ^ | Mr. Peebles is expected to retire from the Adviser effective December 30, 2020. |
The Fund’s Statement of Additional Information (“SAI”) has additional information about the Trust’s Trustees and Officers and is available without charge upon request. Contact your financial representative or ABI at (800) 227-4618, or visit www.abfunds.com, for a free prospectus or SAI.
| abfunds.com | AB TAXABLE MULTI-SECTOR INCOME SHARES | 61 | |
Operation and Effectiveness of the Fund’s Liquidity Risk Management Program:
In October 2016, the Securities and Exchange Commission (“SEC”) adopted the open-end fund liquidity rule (the “Liquidity Rule”). In June 2018 the SEC adopted a requirement that funds disclose information about the operation and effectiveness of their Liquidity Risk Management Program (“LRMP”) in their reports to shareholders.
One of the requirements of the Liquidity Rule is for the Fund to designate an Administrator of the Fund’s Liquidity Risk Management Program. The Administrator of the Fund’s LRMP is AllianceBernstein L.P., the Fund’s investment adviser (the “Adviser”). The Adviser has delegated the responsibility to its Liquidity Risk Management Committee (the “Committee”). Another requirement of the Liquidity Rule is for the Fund’s Board of Directors (the “Fund Board”) to receive an annual written report from the Administrator of the LRMP, which addresses the operation of the Fund’s LRMP and assesses its adequacy and effectiveness. The Adviser provided the Fund’s Board with such annual report during the first quarter of 2020, which covered the period December 1, 2018 through December 31, 2019 (the “Program Reporting Period”).
The LRMP’s principal objectives include supporting the Fund’s compliance with limits on investments in illiquid assets and mitigating the risk that the Fund will be unable to meet its redemption obligations in a timely manner. Pursuant to the LRMP, the Fund classifies the liquidity of its portfolio investments into one of the four categories defined by the SEC: Highly Liquid, Moderately Liquid, Less Liquid, and Illiquid. These classifications are reported to the SEC on Form N-PORT.
During the Program Reporting Period, the Committee reviewed whether the Fund’s strategy is appropriate for an open-end structure, taking into account any holdings of less liquid and illiquid assets. The Committee also performed an analysis to determine whether the Fund is required to maintain a Highly Liquid Investment Minimum (“HLIM”). If the Fund participated in derivative transactions, the exposure from such transactions were considered in the LRMP. The Committee also incorporated the following information when determining the Fund’s reasonably anticipated trading size for purposes of liquidity monitoring: historical net redemption activity, a Fund’s concentration in an issuer, shareholder concentration, investment performance, total net assets, and distribution channels.
The Adviser informed the Fund Board that the Committee believes the Fund’s LRMP is adequately designed, has been implemented as intended, and has operated effectively since its inception. No material exceptions have been noted since the implementation of the LRMP, and there were no liquidity events that impacted the Fund or its ability to timely meet redemptions during the Program Reporting Period.
| 62 | AB TAXABLE MULTI-SECTOR INCOME SHARES | abfunds.com | |
Information Regarding the Review and Approval of the Fund’s Advisory Agreement
The disinterested trustees (the “directors”) of AB Corporate Shares (the “Company”) unanimously approved the continuance of the Company’s Advisory Agreement with the Adviser in respect of AB Taxable Multi-Sector Income Shares (the “Fund”) at a meeting held on November 4-6, 2019 (the “Meeting”.)*
Prior to approval of the continuance of the Advisory Agreement, the directors had requested from the Adviser, and received and evaluated, extensive materials. They reviewed the proposed continuance of the Advisory Agreement with the Adviser and with experienced counsel who are independent of the Adviser, who advised on the relevant legal standards. The directors also reviewed additional materials, including comparative analytical data prepared by the Senior Analyst for the Fund. The directors also discussed the proposed continuance in private sessions with counsel.
The directors noted that the Fund is designed as a vehicle for the wrap fee account market (where investors pay fees to a wrap fee sponsor which pays investment fees and expenses from such fee). The directors also noted that no advisory fee is payable by the Fund, that the Advisory Agreement does not include the reimbursement provision for certain administrative expenses included in the advisory agreements of most of the open-end AB Funds, and that the Adviser is responsible for payment of the Fund’s ordinary expenses. The directors noted that the Company acknowledges in the Advisory Agreement that the Adviser and its affiliates expect to receive compensation from third parties in connection with services provided under the Advisory Agreement. The directors further noted that the Adviser receives payments from the wrap fee program sponsors (the “Sponsors”) that use the Fund as an investment vehicle for their clients.
The directors considered their knowledge of the nature and quality of the services provided by the Adviser to the Fund gained from their experience as directors or trustees of most of the registered investment companies advised by the Adviser, their overall confidence in the Adviser’s integrity and competence they have gained from that experience, the Adviser’s initiative in identifying and raising potential issues with the directors and its responsiveness, frankness and attention to concerns raised by the directors in the past, including the Adviser’s willingness to consider and implement organizational and operational changes designed to improve investment results and the services provided to the AB Funds. The directors noted that they have four regular meetings each year, at each of which they review extensive materials and information from the Adviser, including information on the investment performance of the Fund and the underlying fund advised by the Adviser in which the Fund invests.
| * | Following transactions completed on November 13, 2019 that may have been deemed to have been an “assignment” causing termination of the Fund’s investment advisory agreement, a new investment advisory agreement, having the same terms as the prior one, was entered into by the Fund and the Adviser. |
| abfunds.com | AB TAXABLE MULTI-SECTOR INCOME SHARES | 63 | |
The directors also considered all factors they believed relevant, including the specific matters discussed below. During the course of their deliberations, the directors evaluated, among other things, the reasonableness of the advisory fee. The directors did not identify any particular information that was all-important or controlling, and different directors may have attributed different weights to the various factors. The directors determined that the selection of the Adviser to manage the Fund and the overall arrangements between the Fund and the Adviser, as provided in the Advisory Agreement, including the advisory fee, were fair and reasonable in light of the services performed, expenses incurred and such other matters as the directors considered relevant in the exercise of their business judgment. The material factors and conclusions that formed the basis for the directors’ determinations included the following:
Nature, Extent and Quality of Services Provided
The directors considered the scope and quality of services provided by the Adviser under the Advisory Agreement, including the quality of the investment research capabilities of the Adviser and the other resources it has dedicated to performing services for the Fund. The directors noted that the Adviser from time to time reviews the Fund’s investment strategies and from time to time proposes changes intended to improve the Fund’s relative or absolute performance for the directors’ consideration. They also noted the professional experience and qualifications of the Fund’s portfolio management team and other senior personnel of the Adviser. The quality of administrative and other services, including the Adviser’s role in coordinating the activities of the Fund’s other service providers, also was considered. The directors concluded that, overall, they were satisfied with the nature, extent and quality of services provided to the Fund under the Advisory Agreement.
Costs of Services Provided and Profitability
The directors reviewed a schedule of the revenues and expenses and related notes indicating the profitability of the Fund to the Adviser for calendar years 2017 and 2018 that had been prepared with an expense allocation methodology arrived at in consultation with an independent consultant retained by the Fund’s former Senior Officer/Independent Compliance Officer. The directors noted the assumptions and methods of allocation used by the Adviser in preparing fund-specific profitability data and understood that there are a number of potentially acceptable allocation methodologies for information of this type. The directors noted that the profitability information reflected all revenues and expenses of the Adviser’s relationship with the Fund. The directors recognized that it is difficult to make comparisons of the profitability of the Advisory Agreement with the profitability of fund advisory contracts for unaffiliated funds because comparative information is not generally publicly available and is affected by numerous factors. The directors focused on the profitability of the Adviser’s relationship with the Fund before taxes and distribution
| 64 | AB TAXABLE MULTI-SECTOR INCOME SHARES | abfunds.com | |
expenses. The directors noted that the Fund was not profitable to the Adviser in the periods reviewed.
Fall-Out Benefits
The directors considered the other benefits to the Adviser and its affiliates from their relationships with the Fund and the underlying fund advised by the Adviser in which the Fund invests. The directors noted that the Adviser is compensated by the Sponsors. The directors understood that the Adviser also might derive reputational and other benefits from its association with the Fund.
Investment Results
In addition to the information reviewed by the directors in connection with the Meeting, the directors receive detailed performance information for the Fund at each regular Board meeting during the year.
At the Meeting, the directors reviewed performance information prepared by an independent service provider (the “15(c) service provider”), showing the performance of the Fund against a group of similar funds (“peer group”) and a larger group of similar funds (“peer universe”), each selected by the 15(c) service provider, and information prepared by the Adviser showing the Fund’s performance against a broad-based securities market index, in each case for the 1-, 3- and 5-year periods ended July 31, 2019 and (in the case of comparisons with the broad-based securities market index) for the period from inception. The directors were cognizant that the Fund was neither designed nor offered as a standalone investment and was intended to serve solely as a component of certain separately managed accounts (“SMAs”). The Adviser had explained that this attribute made it difficult to select an appropriate benchmark for the Fund. At the directors’ request, the Adviser provided information showing the weighting of the Fund in a current SMA and the overall performance of the SMA versus its stated benchmark. Based on their review, and their discussion with the Adviser of the reasons for the Fund’s underperformance in certain periods, the directors concluded that the Fund’s investment performance was acceptable.
Advisory Fees
The directors considered the advisory fee rate payable by the Fund to the Adviser (zero) and information provided by the 15(c) service provider showing the fees payable by other fund families used in wrap fee programs similar to that of the Fund. The directors recognized that it is difficult to make comparisons of advisory fees because there are variations in the services that are included in the fees payable by other funds.
The directors noted the unusual arrangements in the Advisory Agreement providing for no advisory fee but were cognizant that the Adviser is indirectly compensated by the Sponsors for its services to the Fund. The directors reviewed the fee arrangements between the Adviser and each of
| abfunds.com | AB TAXABLE MULTI-SECTOR INCOME SHARES | 65 | |
the current Sponsors and noted that such fees were negotiated on an arm’s length basis and were within the range of fees paid by wrap fee sponsors to other advisers of similar funds. While the Adviser’s fee arrangements with the Sponsors vary, the directors acknowledged the Adviser’s view that a portion of such fees (less the expenses of the Fund paid by the Adviser) may reasonably be viewed as compensating the Adviser for advisory services it provides to the Fund (the “implied fee”) and that the Adviser believes that while the Sponsors pay the Adviser different fee rates, the rate of fee attributable to Fund management at the Fund level is the same for all Sponsors. The directors also considered the fee rate schedules used by other registered investment companies that invest in fixed income securities that are advised by the Adviser.
The directors also considered the Adviser’s fee schedule for other clients utilizing investment strategies similar to those of the Fund. For this purpose, they reviewed the relevant advisory fee information from the Adviser’s Form ADV and in a report from the Fund’s Senior Analyst and noted the differences between the Fund’s fee schedule, on the one hand, and the Adviser’s institutional fee schedule and the schedule of fees charged by the Adviser to any offshore funds and for services to any sub-advised funds utilizing investment strategies similar to those of the Fund, on the other. The directors recognized that such information was of limited utility in light of the Fund’s unusual fee arrangement. The directors noted that the Adviser may, in some cases, agree to fee rates with large institutional clients that are lower than those reviewed by the directors and that they had previously discussed with the Adviser its policies in respect of such arrangements. The directors previously discussed these matters with an independent fee consultant. The directors also compared the advisory fee rate for the Fund with that for another fund advised by the Adviser utilizing similar investment strategies.
The Adviser reviewed with the directors the significantly greater scope of the services it provides to the Fund relative to institutional, offshore fund and sub-advised fund clients. In this regard, the Adviser noted, among other things, that, compared to institutional and offshore or sub-advisory accounts, the Fund (i) demands considerably more portfolio management, research and trading resources due to significantly higher daily cash flows; (ii) has more tax and regulatory restrictions and compliance obligations; (iii) must prepare and file or distribute regulatory and other communications about fund operations; and (iv) must provide shareholder servicing to retail investors. The Adviser also reviewed the greater legal risks presented by the large and changing population of Fund shareholders who may assert claims against the Adviser in individual or class actions, and the greater entrepreneurial risk in offering new fund products, which require substantial investment to launch, may not succeed, and generally must be priced to compete with larger, more established funds resulting in lack of profitability to the Adviser until a new fund achieves scale. In light of the
| 66 | AB TAXABLE MULTI-SECTOR INCOME SHARES | abfunds.com | |
substantial differences in services rendered by the Adviser to institutional, offshore fund and sub-advised fund clients as compared to the Fund, and the different risk profile, the directors considered these fee comparisons inapt and did not place significant weight on them in their deliberations.
The directors did not consider comparative expense information for the Fund because the Fund does not bear ordinary expenses.
Economies of Scale
The directors did not consider the extent to which fee levels in the Advisory Agreement for the Fund reflect economies of scale because the Advisory Agreement does not provide for any compensation to be paid to the Adviser by the Fund and the Fund’s expense ratio is zero. They did note, however, that the fee payable to the Adviser by the current Sponsors declines at a breakpoint based on either individual account sizes or on total assets managed by the Adviser for the Sponsor.
| abfunds.com | AB TAXABLE MULTI-SECTOR INCOME SHARES | 67 | |
This page is not part of the Shareholder Report or the Financial Statements.
AB FAMILY OF FUNDS
US EQUITY
CORE
Core Opportunities Fund
FlexFee™ US Thematic Portfolio
Select US Equity Portfolio
GROWTH
Concentrated Growth Fund
Discovery Growth Fund
FlexFee™ Large Cap Growth Portfolio
Growth Fund
Large Cap Growth Fund
Small Cap Growth Portfolio
VALUE
Discovery Value Fund
Equity Income Fund
Relative Value Fund
Small Cap Value Portfolio
Value Fund
INTERNATIONAL/ GLOBAL EQUITY
CORE
FlexFee™ International Strategic Core Portfolio
Global Core Equity Portfolio
International Portfolio
International Strategic Core Portfolio
Sustainable Global Thematic Fund
Tax-Managed International Portfolio
Tax-Managed Wealth Appreciation Strategy
Wealth Appreciation Strategy
INTERNATIONAL/ GLOBAL EQUITY (continued)
GROWTH
Concentrated International Growth Portfolio
FlexFee™ Emerging Markets Growth Portfolio
Sustainable International Thematic Fund
VALUE
All China Equity Portfolio
International Value Fund
FIXED INCOME
MUNICIPAL
High Income Municipal Portfolio
Intermediate California Municipal Portfolio
Intermediate Diversified Municipal Portfolio
Intermediate New York Municipal Portfolio
Municipal Bond Inflation Strategy
Tax-Aware Fixed Income Opportunities Portfolio1
National Portfolio
Arizona Portfolio
California Portfolio
Massachusetts Portfolio
Minnesota Portfolio
New Jersey Portfolio
New York Portfolio
Ohio Portfolio
Pennsylvania Portfolio
Virginia Portfolio
FIXED INCOME (continued)
TAXABLE
Bond Inflation Strategy
FlexFee™ High Yield Portfolio
FlexFee™ International Bond Portfolio
Global Bond Fund
High Income Fund
Income Fund
Intermediate Duration Portfolio
Limited Duration High Income Portfolio
Short Duration Income Portfolio
Short Duration Portfolio
Total Return Bond Portfolio1
ALTERNATIVES
All Market Real Return Portfolio
Global Real Estate Investment Fund
Select US Long/Short Portfolio
Unconstrained Bond Fund
MULTI-ASSET
All Market Income Portfolio
All Market Total Return Portfolio
Conservative Wealth Strategy
Emerging Markets Multi-Asset Portfolio
Global Risk Allocation Fund
Tax-Managed All Market Income Portfolio
CLOSED-END FUNDS
AllianceBernstein Global High Income Fund
AllianceBernstein National Municipal Income Fund
We also offer Government Money Market Portfolio, which serves as the money market fund exchange vehicle for the AB mutual funds. You could lose money by investing in the Fund. Although the Fund seeks to preserve the value of your investment at $1.00 per share, it cannot guarantee it will do so. The Fund may impose a fee upon sale of your shares or may temporarily suspend your ability to sell shares if the Fund’s liquidity falls below required minimums because of market conditions or other factors. An investment in the Fund is not insured or guaranteed by the Federal Deposit Insurance Corporation or any other government agency. The Fund’s sponsor has no legal obligation to provide financial support to the Fund, and you should not expect that the sponsor will provide financial support to the Fund at any time.
Investors should consider the investment objectives, risks, charges and expenses of the Fund carefully before investing. For copies of our prospectus or summary prospectus, which contain this and other information, visit us online at www.abfunds.com or contact your AB representative. Please read the prospectus and/or summary prospectus carefully before investing.
| 1 | Prior to July 12, 2019, Total Return Bond Portfolio was named Intermediate Bond Portfolio; prior to February 5, 2020, Tax-Aware Fixed Income Opportunities Portfolio was named Tax-Aware Fixed Income Portfolio. |
| 68 | AB TAXABLE MULTI-SECTOR INCOME SHARES | abfunds.com | |
AB TAXABLE MULTI-SECTOR INCOME SHARES
1345 Avenue of the Americas
New York, NY 10105
800 221 5672
TMSIS-0151-0420 
APR 04.30.20

ANNUAL REPORT
AB TAX-AWARE REAL RETURN INCOME SHARES

Beginning January 1, 2021, as permitted by new regulations adopted by the Securities and Exchange Commission, the Fund’s annual and semi-annual shareholder reports will no longer be sent by mail, unless you specifically request paper copies of the reports. Instead, the reports will be made available on a website, and you will be notified by mail each time a report is posted and provided with a website address to access the report.
If you already elected to receive shareholder reports electronically, you will not be affected by this change and you need not take any action. You may elect to receive shareholder reports and other communications from the Fund electronically at any time by contacting your financial intermediary (such as a broker-dealer or bank) or, if you are a direct investor, by calling the Fund at (800) 221 5672.
You may elect to receive all future reports in paper form free of charge. If you invest through a financial intermediary, you can contact your financial intermediary to request that you continue to receive paper copies of your shareholder reports; if you invest directly with the Fund, you can call the Fund at (800) 221 5672. Your election to receive reports in paper form will apply to all funds held in your account with your financial intermediary or, if you invest directly, to all AB Mutual Funds you hold.
| Investment Products Offered | • Are Not FDIC Insured • May Lose Value • Are Not Bank Guaranteed | |
Investors should consider the investment objectives, risks, charges and expenses of the Fund carefully before investing. For copies of our prospectus or summary prospectus, which contain this and other information, visit us online at www.abfunds.com or contact your AB representative. Please read the prospectus and/or summary prospectus carefully before investing.
This shareholder report must be preceded or accompanied by the Fund’s prospectus for individuals who are not current shareholders of the Fund.
You may obtain a description of the Fund’s proxy voting policies and procedures, and information regarding how the Fund voted proxies relating to portfolio securities during the most recent 12-month period ended June 30, without charge. Simply visit AB’s website at www.abfunds.com, or go to the Securities and Exchange Commission’s (the “Commission”) website at www.sec.gov, or call AB at (800) 227 4618.
The Fund files its complete schedule of portfolio holdings with the Commission for the first and third quarters of each fiscal year as an exhibit to its reports on Form N-PORT. The Fund’s Form N-PORT reports are available on the Commission’s website at www.sec.gov. The Fund’s Forms N-PORT may also be reviewed and copied at the Commission’s Public Reference Room in Washington, DC; information on the operation of the Public Reference Room may be obtained by calling (800) SEC 0330. AB publishes full portfolio holdings for the Fund monthly at www.abfunds.com.
AllianceBernstein Investments, Inc. (ABI) is the distributor of the AB family of mutual funds. ABI is a member of FINRA and is an affiliate of AllianceBernstein L.P., the Adviser of the funds.
The [A/B] logo is a registered service mark of AllianceBernstein and AllianceBernstein® is a registered service mark used by permission of the owner, AllianceBernstein L.P.
| FROM THE PRESIDENT |  |
Dear Shareholder,
We are pleased to provide this report for AB Tax-Aware Real Return Income Shares (the “Fund”). Please review the discussion of Fund performance, the market conditions during the reporting period and the Fund’s investment strategy.
As always, AB strives to keep clients ahead of what’s next by:
| + | Transforming uncommon insights into uncommon knowledge with a global research scope |
| + | Navigating markets with seasoned investment experience and sophisticated solutions |
| + | Providing thoughtful investment insights and actionable ideas |
Whether you’re an individual investor or a multi-billion-dollar institution, we put knowledge and experience to work for you.
AB’s global research organization connects and collaborates across platforms and teams to deliver impactful insights and innovative products. Better insights lead to better opportunities—anywhere in the world.
For additional information about AB’s range of products and shareholder resources, please log on to www.abfunds.com.
Thank you for your investment in the AB Mutual Funds.
Sincerely,

Robert M. Keith
President and Chief Executive Officer, AB Mutual Funds
| abfunds.com | AB TAX-AWARE REAL RETURN INCOME SHARES | 1 | |
ANNUAL REPORT
June 16, 2020
This report provides management’s discussion of fund performance for AB Tax-Aware Real Return Income Shares for the annual reporting period ended April 30, 2020. Please note, shares of this Fund are available only to separately managed accounts or participants in “wrap fee” programs or other investment programs approved by the Adviser.
The Fund commenced investment operations on May 2, 2011 and continued operations through March 20, 2014, the date on which all shares of the Fund were redeemed. Between March 20, 2014 and November 12, 2019, the Fund did not conduct investment operations. The Fund resumed investment operations on November 13, 2019. The performance information shown is only for the current activation period. Because the Fund has had periods in which it was not conducting investment operations, its performance is not comparable to the performance of other mutual funds.
The investment objective of the Fund is to maximize real after-tax return for investors subject to federal income taxation.
NAV RETURNS AS OF APRIL 30, 2020 (unaudited)
| Since Inception1 | 12 Months | |||||||
| AB TAX-AWARE REAL RETURN INCOME SHARES | -10.43% | — | ||||||
| Bloomberg Barclays 1-10 Year TIPS Index | 3.28% | — | ||||||
| 1 | Current activation date: 11/12/2019. |
INVESTMENT RESULTS
The table above shows the Fund’s performance compared to its benchmark, the Bloomberg Barclays 1-10 Year Treasury Inflation Protected Securities (“TIPS”) Index, for the period since the Fund’s inception on November 12, 2019, through April 30, 2020. Due to limited performance history, there is no discussion of performance versus the benchmark for the 12-month period.
The Fund underperformed the benchmark for the period since inception. The Fund invests primarily in municipal bonds and uses tax-efficient hedges for inflation protection. The Fund’s lower-than-benchmark interest-rate risk detracted, relative to the benchmark, as rates fell. Furthermore, owning municipal bonds and an overweight to credit detracted as the highest-quality assets, treasuries, outperformed. An overweight to consumer price index (“CPI”) hedges also detracted. Yield-curve positioning in seven- to 10-year duration municipals contributed, as did security selection within the toll roads/transit sector.
| 2 | AB TAX-AWARE REAL RETURN INCOME SHARES | abfunds.com | |
The Fund utilized derivatives in the form of interest rate swaps for hedging purposes, which added to absolute performance, while total return swaps and CPI swaps for hedging purposes detracted.
MARKET REVIEW AND INVESTMENT STRATEGY
Themes of strong demand, light supply and supportive credit fundamentals were prominent until the last couple months of the 12-month period ended April 30, 2020. In March, these themes sharply reversed and volatility spiked dramatically. The novel coronavirus pandemic quickly led to the increase in market volatility and to a sharp economic contraction. In this environment, investors fled to cash from nearly every other type of investment, and stocks and bonds fell dramatically. The municipal bond market was not spared; after 60 consecutive weeks of inflows, municipal bond funds had record outflows. Municipals had shown strong absolute and relative performance prior to March, with yields declining 0.8% to over 1%, depending on the maturity since April of 2019. In March, open-end funds had to sell vast quantities of bonds to meet shareholder redemptions, and this selling contributed to yields rising over 2% in less than two weeks. The municipal market did recover toward the end of March and into April as investor demand returned following the actions taken by the US Federal Reserve to address market liquidity and the passing of the Coronavirus Aid, Relief, and Economic Security Act, which included direct aid to municipalities. As a result, after the large moves during both periods, yields for high-grade municipal bonds ended lower for the 12-month period by 0.3% to 0.7%, with yields for shorter-maturity bonds declining more; for the six-month period, longer-maturity municipal yields were higher by about 0.15% and shorter-maturity bonds declined by about 0.3%. Over both the six- and 12-month periods, the additional yield provided by more credit-sensitive bonds increased.
The Fund’s Senior Investment Management Team (the “Team”) continues to focus on real after-tax return by investing in municipal bonds that generate income exempt from federal income taxes. In seeking to manage volatility and interest-rate risk, the Team focuses on intermediate-term bonds and seeks to provide inflation protection by entering inflation swap agreements or investing in other inflation-protected instruments.
INVESTMENT POLICIES
The Fund seeks real after-tax return for investors who are subject to federal income taxes. Real return is the rate of return after adjusting for inflation. The Fund pursues its objective by investing primarily in municipal securities that pay interest exempt from federal taxation and by using inflation protection derivatives instruments. Municipal securities may pay interest that is subject to the federal alternative minimum tax for certain taxpayers.
(continued on next page)
| abfunds.com | AB TAX-AWARE REAL RETURN INCOME SHARES | 3 | |
The Fund may invest in fixed-income securities with any maturity or duration. The Fund may also invest without limit in fixed-income securities that are rated below investment grade (commonly known as “junk bonds”).
The Adviser selects securities for purchase or sale based on its assessment of the securities’ risk and return characteristics as well as the securities’ impact on the overall risk and return characteristics of the Fund. In making this assessment, the Adviser takes into account various factors, including the credit quality and sensitivity to interest rates of the securities under consideration and of the Fund’s other holdings.
The Fund may make significant use of derivatives, including swaps, futures, options and forwards. To provide inflation protection, the Fund will enter into various kinds of inflation swap agreements. The Fund may use other inflation-protected instruments. Payments to the Fund pursuant to swaps will result in taxable income, either ordinary income or capital gains, rather than income exempt from federal taxation. The Fund may at times seek a substantial amount of inflation protection and, consequently, may generate substantial taxable income. It is expected that the Fund’s primary use of derivatives will be for the purposes of inflation protection.
The Fund may utilize leverage for investment purposes through the use of tender option bond transactions (“TOBs”). The Adviser will consider the impact of TOBs, swaps and other derivatives in making its assessments of the Fund’s risks. The resulting exposures to markets, sectors, issuers or specific securities will be continuously monitored by the Adviser.
| 4 | AB TAX-AWARE REAL RETURN INCOME SHARES | abfunds.com | |
DISCLOSURES AND RISKS
Benchmark Disclosure
The Bloomberg Barclays 1-10 Year TIPS Index is unmanaged and does not reflect fees and expenses associated with the active management of a fund. The Bloomberg Barclays 1-10 Year TIPS Index represents the performance of US Treasury inflation-indexed securities with maturities between one and ten years. An investor cannot invest directly in an index, and its results are not indicative of the performance for any specific investment, including the Fund.
A Word About Risk
Market Risk: The market value of a security may move up or down, sometimes rapidly and unpredictably. These fluctuations may cause a security to be worth less than the price originally paid for it, or less than it was worth at an earlier time. Market risk may affect a single issuer, industry, sector of the economy or the market as a whole. Global economies and financial markets are increasingly interconnected, which increases the probabilities that conditions in one country or region might adversely impact issuers in a different country or region. Conditions affecting the general economy, including political, social, or economic instability at the local, regional, or global level may also affect the market value of a security. Health crises, such as pandemic and epidemic diseases, as well as other incidents that interrupt the expected course of events, such as natural disasters, war or civil disturbance, acts of terrorism, power outages and other unforeseeable and external events, and the public response to or fear of such diseases or events, have and may in the future have an adverse effect on the Fund’s investments and net asset value and can lead to increased market volatility. For example, any preventative or protective actions that governments may take in respect of such diseases or events may result in periods of business disruption, inability to obtain raw materials, supplies and component parts, and reduced or disrupted operations for the Fund’s portfolio companies. The occurrence and pendency of such diseases or events could adversely affect the economies and financial markets either in specific countries or worldwide.
Credit Risk: An issuer or guarantor of a fixed-income security, or the counterparty to a derivatives or other contract, may be unable or unwilling to make timely payments of interest or principal, or to otherwise honor its obligations. The issuer or guarantor may default, causing a loss of the full principal amount of a security and any accrued interest. The degree of risk for a particular security may be reflected in its credit rating. There is the possibility that the credit rating of a fixed-income security may be downgraded after purchase, which may adversely affect the value of the security. Investments in fixed-income securities with lower ratings tend to have a higher probability that an issuer will default or fail to meet its payment obligations.
| abfunds.com | AB TAX-AWARE REAL RETURN INCOME SHARES | 5 | |
DISCLOSURES AND RISKS (continued)
Interest-Rate Risk: Changes in interest rates will affect the value of investments in fixed-income securities. When interest rates rise, the value of existing investments in fixed-income securities tends to fall and this decrease in value may not be offset by higher income from new investments. Interest-rate risk is generally greater for fixed-income securities with longer maturities or durations.
Below Investment-Grade Securities Risk: Investments in fixed-income securities with lower ratings (commonly known as “junk bonds”) tend to have a higher probability that an issuer will default or fail to meet its payment obligations. These securities may be subject to greater price volatility due to such factors as specific corporate developments and negative perceptions of the junk bond market generally and may be more difficult to trade than other types of securities.
Duration Risk: Duration is a measure that relates the expected price volatility of a fixed-income security to changes in interest rates. The duration of a fixed-income security may be shorter than or equal to full maturity of a fixed-income security. Fixed-income securities with longer durations have more risk and will decrease in price as interest rates rise.
Municipal Market Risk: This is the risk that special factors may adversely affect the value of municipal securities and have a significant effect on the yield or value of the Fund’s investments in municipal securities. These factors include economic conditions, political or legislative changes, uncertainties related to the tax status of municipal securities, or the rights of investors in these securities. To the extent that the Fund invests more of its assets in a particular state’s municipal securities, the Fund may be vulnerable to events adversely affecting that state, including economic, political and regulatory occurrences, court decisions, terrorism and catastrophic natural disasters, such as hurricanes or earthquakes. The Fund’s investments in certain municipal securities with principal and interest payments that are made from the revenues of a specific project or facility, and not general tax revenues, may have increased risks. Factors affecting the project or facility, such as local business or economic conditions, could have a significant effect on the project’s ability to make payments of principal and interest on these securities.
Congress has previously considered making changes to the municipal securities provisions of the Internal Revenue Code that could change the US federal income tax treatment of certain types of municipal securities.
Inflation Risk: This is the risk that the value of assets or income from investments will be less in the future as inflation decreases the value of money. As inflation increases, the value of the Fund’s assets can decline
| 6 | AB TAX-AWARE REAL RETURN INCOME SHARES | abfunds.com | |
DISCLOSURES AND RISKS (continued)
as can the value of the Fund’s distributions. This risk is significantly greater for fixed-income securities with longer maturities.
Derivatives Risk: Derivatives may be difficult to price or unwind and leveraged so that small changes may produce disproportionate losses for the Fund. Derivatives, especially over-the-counter derivatives, are also subject to counterparty risk.
Leverage Risk: To the extent the Fund uses leveraging techniques, such as TOBs, its net asset value (“NAV”) may be more volatile because leverage tends to exaggerate the effect of changes in interest rates and any increase or decrease in the value of the Fund’s investments.
Illiquid Investments Risk: Illiquid investments risk exists when particular investments, such as lower-rated securities, are or become difficult to purchase or sell, possibly preventing the Fund from selling such investments at an advantageous price. The Fund is subject to illiquid investments risk because the market for municipal securities is generally smaller than many other markets. Derivatives and securities involving substantial market and credit risk tend to involve greater illiquid investments risk than most other types of investments.
Management Risk: The Fund is subject to management risk because it is an actively managed investment fund. The Adviser will apply its investment techniques and risk analyses in making investment decisions, but there is no guarantee that its techniques will produce the intended results.
These risks are fully discussed in the Fund’s prospectus. As with all investments, you may lose money by investing in the Fund.
An Important Note About Historical Performance
The performance shown in this report represents past performance and does not guarantee future results. Current performance may be lower or higher than the performance information shown. You may obtain performance information current to the most recent month-end by calling (800) 227 4618. The investment return and principal value of an investment in the Fund will fluctuate, so that your shares, when redeemed, may be worth more or less than their original cost. Performance assumes reinvestment of distributions and does not account for taxes. The Fund has been in operation only for a short period of time, and therefore has a very limited historical performance period. This limited performance period is unlikely to be representative of the performance the Portfolio will achieve over a longer period.
| abfunds.com | AB TAX-AWARE REAL RETURN INCOME SHARES | 7 | |
DISCLOSURES AND RISKS (continued)
Investors should consider the investment objectives, risks, charges and expenses of the Fund carefully before investing. For copies of our prospectus and/or summary prospectus, which contain this and other information, visit us online at www.abfunds.com or contact your AllianceBernstein Investments representative. Please read the prospectus and/or summary prospectus carefully before investing.
| 8 | AB TAX-AWARE REAL RETURN INCOME SHARES | abfunds.com | |
HISTORICAL PERFORMANCE
GROWTH OF A $10,000 INVESTMENT IN THE FUND (unaudited)
11/12/20191 TO 4/30/2020
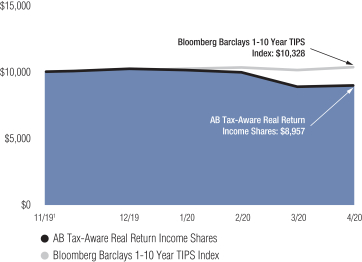
This chart illustrates the total value of an assumed $10,000 investment in AB Tax-Aware Real Return Income Shares (from 11/12/20191 to 4/30/2020) as compared to the performance of its benchmark. The chart assumes the reinvestment of dividends and capital gains distributions.
| 1 | Current activation date: 11/12/2019. |
| abfunds.com | AB TAX-AWARE REAL RETURN INCOME SHARES | 9 | |
HISTORICAL PERFORMANCE (continued)
AVERAGE ANNUAL RETURNS AS OF APRIL 30, 2020 (unaudited)
| NAV Returns | ||||
| Since Inception1 | -10.43% | |||
AVERAGE ANNUAL RETURNS
AS OF THE MOST RECENT CALENDAR QUARTER-END
MARCH 31, 2020 (unaudited)
| NAV Returns | ||||
| Since Inception1 | -11.43% | |||
The prospectus fee table shows the fees and the total operating expenses of the Fund as 0.00% because the Adviser does not charge any fees or expenses and reimburses Fund operating expenses except certain extraordinary expenses, taxes, brokerage costs and the interest on borrowings or certain leveraged transactions. Participants in a wrap fee program or other investment program eligible to invest in the Fund pay fees to the program sponsor and should review the program brochure or other literature provided by the sponsor for a discussion of fees and expenses charged.
| 1 | Current activation date: 11/12/2019. |
| 10 | AB TAX-AWARE REAL RETURN INCOME SHARES | abfunds.com | |
EXPENSE EXAMPLE
(unaudited)
As a shareholder of the Fund, you may incur various ongoing non-operating and extraordinary costs. This example is intended to help you understand your ongoing costs (in dollars) of investing in the Fund and to compare these costs with the ongoing costs of investing in other mutual funds.
The Example is based on an investment of $1,000 invested at the beginning of the period and held for the entire period as indicated below.
Actual Expenses
The table below provides information about actual account values and actual expenses. You may use the information, together with the amount you invested, to estimate the expenses that you paid over the period. Simply divide your account value by $1,000 (for example, an $8,600 account value divided by $1,000 = 8.6), then multiply the result by the number under the heading entitled “Expenses Paid During Period” to estimate the expenses you paid on your account during this period.
Hypothetical Example for Comparison Purposes
The table below also provides information about hypothetical account values and hypothetical expenses based on the Fund’s actual expense ratio and an assumed annual rate of return of 5% before expenses, which is not the Fund’s actual return. The hypothetical account values and expenses may not be used to estimate the actual ending account balance or expenses you paid for the period. You may use this information to compare the ongoing costs of investing in the Fund and other funds by comparing this 5% hypothetical example with the 5% hypothetical examples that appear in the shareholder reports of other funds.
Please note that the expenses shown in the table are meant to highlight your ongoing costs only and do not reflect any transactional costs, such as sales charges (loads), or contingent deferred sales charges on redemptions. Therefore, the hypothetical example is useful in comparing ongoing costs only, and will not help you determine the relative total costs of owning different funds. In addition, if these transactional costs were included, your costs would have been higher.
| Beginning Account Value November 12, 2019+ | Ending Account Value April 30, 2020 | Expenses Paid During Period* | Annualized Expense Ratio* | |||||||||||||
Actual | $ | 1,000 | $ | 895.70 | $ | 0.04 | 0.01 | % | ||||||||
Hypothetical** | $ | 1,000 | $ | 1,023.31 | $ | 0.05 | 0.01 | % | ||||||||
| + | Commencement of operations. |
| * | Expenses are equal to the Fund’s annualized expense ratio, multiplied by the average account value over the period, multiplied by 171/366 (to reflect the since inception period). The Fund’s operating expenses are borne by the Adviser or its affiliates. |
| ** | Assumes 5% annual return before expenses. |
| abfunds.com | AB TAX-AWARE REAL RETURN INCOME SHARES | 11 | |
PORTFOLIO SUMMARY
April 30, 2020 (unaudited)
PORTFOLIO STATISTICS
Net Assets ($mil): $18.8
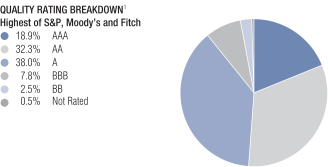
| 1 | All data are as of April 30, 2020. The Fund’s quality rating breakdown is expressed as a percentage of the Fund’s total investments in municipal securities and may vary over time. The quality ratings are determined by using the S&P Global Ratings (“S&P”), Moody’s Investors Services, Inc.(“Moody’s”) and Fitch Ratings, Ltd.(“Fitch”). The Fund considers the credit ratings issued by S&P, Moody’s and Fitch and uses the highest rating issued by the agencies. These ratings are a measure of the quality and safety of a bond or portfolio, based on the issuer’s financial condition. AAA is the highest (best) and D is the lowest (worst). If applicable, the pre-refunded category includes bonds which are secured by U.S. Government securities and therefore are deemed high-quality investment-grade by the Adviser. If applicable, Not Applicable (N/A) includes non-creditworthy investments, such as equities, currency contracts, futures and options. If applicable, the Not Rated category includes bonds that are not rated by a nationally recognized statistical rating organization. The Adviser evaluates the creditworthiness of non-rated securities based on a number of factors including, but not limited to, cash flows, enterprise value and economic environment. |
| 12 | AB TAX-AWARE REAL RETURN INCOME SHARES | abfunds.com | |
PORTFOLIO OF INVESTMENTS
April 30, 2020
| Principal Amount (000) | U.S. $ Value | |||||||
| ||||||||
MUNICIPAL OBLIGATIONS – 84.2% |
| |||||||
Long-Term Municipal Bonds – 82.1% |
| |||||||
Alabama – 3.3% |
| |||||||
Lower Alabama Gas District (The) | $ | 580 | $ | 617,015 | ||||
|
| |||||||
Alaska – 2.6% |
| |||||||
Alaska Industrial Development & Export Authority | 445 | 477,957 | ||||||
|
| |||||||
Arizona – 4.0% |
| |||||||
City of Phoenix Civic Improvement Corp. | 390 | 435,369 | ||||||
Series 2019B | 275 | 315,939 | ||||||
|
| |||||||
| 751,308 | ||||||||
|
| |||||||
Colorado – 3.5% |
| |||||||
Weld County School District No. RE-2 Eaton | 530 | 661,605 | ||||||
|
| |||||||
Connecticut – 10.6% |
| |||||||
City of New Haven CT | 70 | 78,011 | ||||||
Connecticut State Health & Educational Facilities Authority | 1,055 | 1,070,952 | ||||||
Series 2020A | 515 | 588,094 | ||||||
State of Connecticut | 215 | 258,202 | ||||||
|
| |||||||
| 1,995,259 | ||||||||
|
| |||||||
Delaware – 4.7% |
| |||||||
State of Delaware | 850 | 884,119 | ||||||
|
| |||||||
District of Columbia – 3.3% |
| |||||||
District of Columbia | 490 | 616,489 | ||||||
|
| |||||||
| abfunds.com | AB TAX-AWARE REAL RETURN INCOME SHARES | 13 | |
PORTFOLIO OF INVESTMENTS (continued)
| Principal Amount (000) | U.S. $ Value | |||||||
| ||||||||
Florida – 0.6% |
| |||||||
Greater Orlando Aviation Authority | $ | 95 | $ | 111,176 | ||||
|
| |||||||
Illinois – 6.1% |
| |||||||
Illinois Finance Authority | 100 | 105,535 | ||||||
Sales Tax Securitization Corp. | 270 | 299,125 | ||||||
State of Illinois | 175 | 169,545 | ||||||
Series 2018A | 295 | 290,047 | ||||||
Series 2019A | 290 | 285,003 | ||||||
|
| |||||||
| 1,149,255 | ||||||||
|
| |||||||
Kentucky – 7.0% |
| |||||||
City of Ashland KY | 100 | 112,802 | ||||||
Kentucky Public Energy Authority | 570 | 613,964 | ||||||
Louisville/Jefferson County Metropolitan Government | 575 | 580,480 | ||||||
|
| |||||||
| 1,307,246 | ||||||||
|
| |||||||
Michigan – 1.6% |
| |||||||
Michigan Finance Authority | 100 | 102,260 | ||||||
Michigan State University | 160 | 199,554 | ||||||
|
| |||||||
| 301,814 | ||||||||
|
| |||||||
Missouri – 1.3% |
| |||||||
Missouri Highway & Transportation Commission | 225 | 238,846 | ||||||
|
| |||||||
| 14 | AB TAX-AWARE REAL RETURN INCOME SHARES | abfunds.com | |
PORTFOLIO OF INVESTMENTS (continued)
| Principal Amount (000) | U.S. $ Value | |||||||
| ||||||||
New Jersey – 1.8% |
| |||||||
New Jersey Transportation Trust Fund Authority | $ | 330 | $ | 334,125 | ||||
|
| |||||||
New York – 5.7% |
| |||||||
Metropolitan Transportation Authority | 260 | 260,424 | ||||||
New York City Transitional Finance Authority Future Tax Secured Revenue | 200 | 242,088 | ||||||
New York Liberty Development Corp. | 210 | 194,979 | ||||||
New York State Urban Development Corp. | 355 | 367,336 | ||||||
|
| |||||||
| 1,064,827 | ||||||||
|
| |||||||
North Carolina – 2.1% |
| |||||||
Raleigh Durham Airport Authority | 340 | 398,317 | ||||||
|
| |||||||
Ohio – 6.5% |
| |||||||
Buckeye Tobacco Settlement Financing Authority | 495 | 582,166 | ||||||
State of Ohio | 545 | 636,010 | ||||||
|
| |||||||
| 1,218,176 | ||||||||
|
| |||||||
Pennsylvania – 9.2% |
| |||||||
City of Philadelphia PA | 155 | 197,076 | ||||||
Commonwealth Financing Authority | 120 | 134,578 | ||||||
Lower Merion School District | 710 | 790,173 | ||||||
Pennsylvania Turnpike Commission | 575 | 609,448 | ||||||
|
| |||||||
| 1,731,275 | ||||||||
|
| |||||||
| abfunds.com | AB TAX-AWARE REAL RETURN INCOME SHARES | 15 | |
PORTFOLIO OF INVESTMENTS (continued)
| Principal Amount (000) | U.S. $ Value | |||||||
| ||||||||
Texas – 1.0% |
| |||||||
City of Houston TX Airport System Revenue | $ | 100 | $ | 99,053 | ||||
Port Beaumont Navigation District | 100 | 81,734 | ||||||
|
| |||||||
| 180,787 | ||||||||
|
| |||||||
Virginia – 1.8% |
| |||||||
Federal Home Loan Mortgage Corp. | 100 | 103,690 | ||||||
Virginia College Building Authority | 190 | 227,806 | ||||||
|
| |||||||
| 331,496 | ||||||||
|
| |||||||
Washington – 1.0% |
| |||||||
City of Seattle WA Municipal Light & Power Revenue | 165 | 186,036 | ||||||
|
| |||||||
West Virginia – 3.4% |
| |||||||
State of West Virginia | 515 | 645,290 | ||||||
|
| |||||||
Wisconsin – 1.0% |
| |||||||
UMA Education, Inc. | 50 | 51,169 | ||||||
Wisconsin Public Finance Authority | 140 | 140,102 | ||||||
|
| |||||||
| 191,271 | ||||||||
|
| |||||||
Total Long-Term Municipal Bonds | 15,393,689 | |||||||
|
| |||||||
Short-Term Municipal Notes – 2.1% |
| |||||||
Missouri – 2.1% |
| |||||||
Missouri Highway & Transportation Commission | 395 | 403,461 | ||||||
|
| |||||||
Total Municipal Obligations | 15,797,150 | |||||||
|
| |||||||
| 16 | AB TAX-AWARE REAL RETURN INCOME SHARES | abfunds.com | |
PORTFOLIO OF INVESTMENTS (continued)
| Shares | U.S. $ Value | |||||||
| ||||||||
SHORT-TERM INVESTMENTS – 4.2% |
| |||||||
Investment Companies – 4.2% |
| |||||||
AB Fixed Income Shares, Inc. – Government Money Market Portfolio – Class AB, | 788,799 | $ | 788,799 | |||||
|
| |||||||
Total Investments – 88.4% | 16,585,949 | |||||||
Other assets less liabilities – 11.6% | 2,174,237 | |||||||
|
| |||||||
Net Assets – 100.0% | $ | 18,760,186 | ||||||
|
| |||||||
CENTRALLY CLEARED INFLATION (CPI) SWAPS (see Note C)
| Rate Type | ||||||||||||||||||||||||||||||
Notional | Termination Date | Payments made by the Fund | Payments received by the Fund | Payment Frequency Paid/ Received | Market Value | Upfront Premiums Paid/ (Received) | Unrealized Appreciation/ (Depreciation) | |||||||||||||||||||||||
| USD | 4,000 | 12/24/2021 | 1.753% | CPI# | Maturity | $ | (120,489 | ) | $ | — | $ | (120,489 | ) | |||||||||||||||||
| USD | 3,000 | 02/10/2023 | 1.558% | CPI# | Maturity | (97,287 | ) | — | (97,287 | ) | ||||||||||||||||||||
| USD | 2,500 | 12/24/2024 | 1.846% | CPI# | Maturity | (125,298 | ) | — | (125,298 | ) | ||||||||||||||||||||
| USD | 2,000 | 02/10/2027 | 1.755% | CPI# | Maturity | (99,448 | ) | — | (99,448 | ) | ||||||||||||||||||||
| USD | 2,600 | 12/24/2029 | 1.978% | CPI# | Maturity | (185,278 | ) | — | (185,278 | ) | ||||||||||||||||||||
| USD | 1,000 | 02/10/2035 | 1.914% | CPI# | Maturity | (73,301 | ) | — | (73,301 | ) | ||||||||||||||||||||
|
|
|
|
|
| |||||||||||||||||||||||||
| $ | (701,101 | ) | $ | — | $ | (701,101 | ) | |||||||||||||||||||||||
|
|
|
|
|
| |||||||||||||||||||||||||
| # | Variable interest rate based on the rate of inflation as determined by the Consumer Price Index (CPI). |
CENTRALLY CLEARED INTEREST RATE SWAPS (see Note C)
| Rate Type | ||||||||||||||||||||||||||||||
Notional | Termination Date | Payments made by the Fund | Payments received by the Fund | Payment Frequency Paid/ Received | Market Value | Upfront Premiums Paid/ (Received) | Unrealized Appreciation/ (Depreciation) | |||||||||||||||||||||||
| USD | 5,800 | 11/25/2021 | 1.585% | | 3 Month LIBOR | | Semi-Annual/ Quarterly | $ | (133,235 | ) | $ | — | $ | (133,235 | ) | |||||||||||||||
| USD | 5,300 | 01/23/2023 | 1.672% | | 3 Month LIBOR | | Semi-Annual/ Quarterly | (213,901 | ) | — | (213,901 | ) | ||||||||||||||||||
| USD | 14,400 | 11/29/2024 | 1.538% | | 3 Month LIBOR | | Semi-Annual/ Quarterly | (795,335 | ) | — | (795,335 | ) | ||||||||||||||||||
| USD | 4,700 | 11/25/2026 | 1.581% | | 3 Month LIBOR | | Semi-Annual/ Quarterly | (349,312 | ) | — | (349,312 | ) | ||||||||||||||||||
| USD | 3,500 | 01/23/2031 | 1.890% | | 3 Month LIBOR | | Semi-Annual/ Quarterly | (470,571 | ) | — | (470,571 | ) | ||||||||||||||||||
|
|
|
|
|
| |||||||||||||||||||||||||
| $ | (1,962,354 | ) | $ | — | $ | (1,962,354 | ) | |||||||||||||||||||||||
|
|
|
|
|
| |||||||||||||||||||||||||
| abfunds.com | AB TAX-AWARE REAL RETURN INCOME SHARES | 17 | |
PORTFOLIO OF INVESTMENTS (continued)
TOTAL RETURN SWAPS (see Note C)
| Counterparty & Referenced Obligation | Rate Paid/ Received | Payment Frequency | Current Notional (000) | Maturity Date | Unrealized Appreciation/ (Depreciation) | |||||||||||||||||
Receive Total Return on Reference Obligation |
| |||||||||||||||||||||
Barclays Bank PLC |
| |||||||||||||||||||||
Barclays Capital US Inflation Linked Bonds 1 to 10 Year | 3 Month LIBOR Plus 0.25% | Maturity | USD | 8,572 | 12/23/2020 | $ | 203,338 | |||||||||||||||
Barclays Capital US Inflation Linked Bonds 1 to 10 Year | 3 Month LIBOR Plus 0.25% | Maturity | USD | 14,032 | 12/29/2020 | 327,419 | ||||||||||||||||
Barclays Capital US Inflation Linked Bonds 1 to 10 Year | 3 Month LIBOR Plus 0.25% | Maturity | USD | 8,635 | 01/23/2021 | 181,214 | ||||||||||||||||
|
| |||||||||||||||||||||
| $ | 711,971 | |||||||||||||||||||||
|
| |||||||||||||||||||||
| (a) | Security is exempt from registration under Rule 144A of the Securities Act of 1933. These securities are considered restricted, but liquid and may be resold in transactions exempt from registration, normally to qualified institutional buyers. At April 30, 2020, the aggregate market value of these securities amounted to $376,695 or 2.0% of net assets. |
| (b) | Affiliated investments. |
| (c) | The rate shown represents the 7-day yield as of period end. |
| (d) | To obtain a copy of the fund’s shareholder report, please go to the Securities and Exchange Commission’s website at www.sec.gov, or call AB at (800) 227-4618. |
As of April 30, 2020, the Fund’s percentages of investments in municipal bonds that are insured and in insured municipal bonds that have been pre-refunded or escrowed to maturity are 0.0% and 0.0%, respectively.
Glossary:
LIBOR – London Interbank Offered Rates
See notes to financial statements.
| 18 | AB TAX-AWARE REAL RETURN INCOME SHARES | abfunds.com | |
STATEMENT OF ASSETS & LIABILITIES
April 30, 2020
| Assets |
| |||
Investments in securities, at value | ||||
Unaffiliated issuers (cost $16,574,604) | $ | 15,797,150 | ||
Affiliated issuers (cost $788,799) | 788,799 | |||
Cash | 2,635 | |||
Cash collateral due from broker | 1,291,722 | |||
Unrealized appreciation on total return swaps | 711,971 | |||
Interest receivable | 173,530 | |||
Affiliated dividends receivable | 171 | |||
Receivable due from Adviser | 40 | |||
|
| |||
Total assets | 18,766,018 | |||
|
| |||
| Liabilities |
| |||
Payable for variation margin on centrally cleared swaps | 5,587 | |||
Dividends payable | 245 | |||
|
| |||
Total liabilities | 5,832 | |||
|
| |||
Net Assets | $ | 18,760,186 | ||
|
| |||
| Composition of Net Assets |
| |||
Shares of beneficial interest, at par | $ | 21 | ||
Additional paid-in capital | 21,248,183 | |||
Accumulated loss | (2,488,018 | ) | ||
|
| |||
| $ | 18,760,186 | |||
|
| |||
Net Asset Value Per Share—unlimited shares of beneficial interest authorized, $.00001 par value (based on 2,095,229 common shares outstanding) | $ | 8.95 | ||
|
| |||
See notes to financial statements.
| abfunds.com | AB TAX-AWARE REAL RETURN INCOME SHARES | 19 | |
STATEMENT OF OPERATIONS
For the Period of November 12, 2019(a) to April 30, 2020
| Investment Income | ||||||||
Interest | $ | 94,499 | ||||||
Dividends—Affiliated issuers | 40,577 | |||||||
Other income(b) | 2,526 | $ | 137,602 | |||||
|
| |||||||
| Expenses | ||||||||
Bank overdraft expense | 1,254 | |||||||
|
| |||||||
Total expenses | 1,254 | |||||||
|
| |||||||
Net investment income | 136,348 | |||||||
|
| |||||||
| Realized and Unrealized Gain (Loss) on Investment Transactions | ||||||||
Net realized gain (loss) on: | ||||||||
Investment transactions | (53,409 | ) | ||||||
Swaps | 164,732 | |||||||
Net change in unrealized appreciation/depreciation of: | ||||||||
Investments | (777,454 | ) | ||||||
Swaps | (1,951,484 | ) | ||||||
|
| |||||||
Net loss on investment transactions | (2,617,615 | ) | ||||||
|
| |||||||
Net Decrease in Net Assets from Operations | $ | (2,481,267 | ) | |||||
|
|
| (a) | Commencement of operations. |
| (b) | Other income includes a reimbursement for investment in affiliated issuer (see Note B). |
See notes to financial statements.
| 20 | AB TAX-AWARE REAL RETURN INCOME SHARES | abfunds.com | |
STATEMENT OF CHANGES IN NET ASSETS
| November 12, 2019(a) to April 30, 2020 | ||||
| Increase (Decrease) in Net Assets from Operations |
| |||
Net investment income | $ | 136,348 | ||
Net realized gain on investment transactions | 111,323 | |||
Net change in unrealized appreciation/depreciation of investments | (2,728,938 | ) | ||
|
| |||
Net decrease in net assets from operations | (2,481,267 | ) | ||
Distribution to Shareholders | (7,743 | ) | ||
| Transactions in Shares of Beneficial Interest |
| |||
Net increase | 21,249,196 | |||
|
| |||
Total increase | 18,760,186 | |||
| Net Assets |
| |||
Beginning of period | – 0 | – | ||
|
| |||
End of period | $ | 18,760,186 | ||
|
| |||
| (a) | Commencement of operations. |
See notes to financial statements.
| abfunds.com | AB TAX-AWARE REAL RETURN INCOME SHARES | 21 | |
NOTES TO FINANCIAL STATEMENTS
April 30, 2020
NOTE A
Significant Accounting Policies
AB Corporate Shares (the “Trust”) was organized as a Massachusetts business trust under the laws of The Commonwealth of Massachusetts by an Agreement and Declaration of Trust dated January 26, 2004. The Trust is registered under the Investment Company Act of 1940, as an open-end, diversified management investment company. The Trust operates as a “series” company currently offering five separate portfolios: AB Corporate Income Shares, AB Municipal Income Shares, AB Taxable Multi-Sector Income Shares, AB Impact Municipal Income Shares and AB Tax-Aware Real Return Income Shares. Each portfolio is considered to be a separate entity for financial reporting and tax purposes. This report relates only to AB Tax-Aware Real Return Income Shares (the “Fund”). The Fund commenced investment operations on May 2, 2011 and continued operations through March 20, 2014, the date on which all shares of the Fund were redeemed. Between March 20, 2014 and November 12, 2019, the Fund did not conduct investment operations. The Fund resumed investment operations on November 12, 2019.
Shares of the Fund are offered exclusively to holders of accounts established under wrap-fee programs sponsored and maintained by certain registered investment advisers approved by AllianceBernstein L.P. (the “Adviser”). The Fund’s shares may be purchased at the relevant net asset value without a sales charge or other fee. The financial statements have been prepared in conformity with U.S. generally accepted accounting principles (“U.S. GAAP”) which require management to make certain estimates and assumptions that affect the reported amounts of assets and liabilities in the financial statements and amounts of income and expenses during the reporting period. Actual results could differ from those estimates. The Fund is an investment company under U.S. GAAP and follows the accounting and reporting guidance applicable to investment companies. The following is a summary of significant accounting policies followed by the Fund.
1. Security Valuation
Portfolio securities are valued at their current market value determined on the basis of market quotations or, if market quotations are not readily available or are deemed unreliable, at “fair value” as determined in accordance with procedures established by and under the general supervision of the Trust’s Board of Trustees (the “Board”).
In general, the market values of securities which are readily available and deemed reliable are determined as follows: securities listed on a national securities exchange (other than securities listed on the NASDAQ Stock Market, Inc. (“NASDAQ”)) or on a foreign securities exchange are valued at
| 22 | AB TAX-AWARE REAL RETURN INCOME SHARES | abfunds.com | |
NOTES TO FINANCIAL STATEMENTS (continued)
the last sale price at the close of the exchange or foreign securities exchange. If there has been no sale on such day, the securities are valued at the last traded price from the previous day. Securities listed on more than one exchange are valued by reference to the principal exchange on which the securities are traded; securities listed only on NASDAQ are valued in accordance with the NASDAQ Official Closing Price; listed or over the counter (“OTC”) market put or call options are valued at the mid level between the current bid and ask prices. If either a current bid or current ask price is unavailable, the Adviser will have discretion to determine the best valuation (e.g., last trade price in the case of listed options); open futures are valued using the closing settlement price or, in the absence of such a price, the most recent quoted bid price. If there are no quotations available for the day of valuation, the last available closing settlement price is used; U.S. Government securities and any other debt instruments having 60 days or less remaining until maturity are generally valued at market by an independent pricing vendor, if a market price is available. If a market price is not available, the securities are valued at amortized cost. This methodology is commonly used for short term securities that have an original maturity of 60 days or less, as well as short term securities that had an original term to maturity that exceeded 60 days. In instances when amortized cost is utilized, the Valuation Committee (the “Committee”) must reasonably conclude that the utilization of amortized cost is approximately the same as the fair value of the security. Such factors the Committee will consider include, but are not limited to, an impairment of the creditworthiness of the issuer or material changes in interest rates. Fixed-income securities, including mortgage-backed and asset-backed securities, may be valued on the basis of prices provided by a pricing service or at a price obtained from one or more of the major broker-dealers. In cases where broker-dealer quotes are obtained, the Adviser may establish procedures whereby changes in market yields or spreads are used to adjust, on a daily basis, a recently obtained quoted price on a security. Swaps and other derivatives are valued daily, primarily using independent pricing services, independent pricing models using market inputs, as well as third party broker-dealers or counterparties. Open end mutual funds are valued at the closing net asset value per share, while exchange traded funds are valued at the closing market price per share.
Securities for which market quotations are not readily available (including restricted securities) or are deemed unreliable are valued at fair value as deemed appropriate by the Adviser. Factors considered in making this determination may include, but are not limited to, information obtained by contacting the issuer, analysts, analysis of the issuer’s financial statements or other available documents. In addition, the Fund may use fair value pricing for securities primarily traded in non-U.S. markets because most foreign markets close well before the Fund values its securities at 4:00 p.m.,
| abfunds.com | AB TAX-AWARE REAL RETURN INCOME SHARES | 23 | |
NOTES TO FINANCIAL STATEMENTS (continued)
Eastern Time. The earlier close of these foreign markets gives rise to the possibility that significant events, including broad market moves, may have occurred in the interim and may materially affect the value of those securities. To account for this, the Fund generally values many of its foreign equity securities using fair value prices based on third party vendor modeling tools to the extent available.
2. Fair Value Measurements
In accordance with U.S. GAAP regarding fair value measurements, fair value is defined as the price that the Fund would receive to sell an asset or pay to transfer a liability in an orderly transaction between market participants at the measurement date. U.S. GAAP establishes a framework for measuring fair value, and a three-level hierarchy for fair value measurements based upon the transparency of inputs to the valuation of an asset or liability (including those valued based on their market values as described in Note A.1 above). Inputs may be observable or unobservable and refer broadly to the assumptions that market participants would use in pricing the asset or liability. Observable inputs reflect the assumptions market participants would use in pricing the asset or liability based on market data obtained from sources independent of the Fund. Unobservable inputs reflect the Fund’s own assumptions about the assumptions that market participants would use in pricing the asset or liability based on the best information available in the circumstances. Each investment is assigned a level based upon the observability of the inputs which are significant to the overall valuation. The three-tier hierarchy of inputs is summarized below.
| • | Level 1—quoted prices in active markets for identical investments |
| • | Level 2—other significant observable inputs (including quoted prices for similar investments, interest rates, prepayment speeds, credit risk, etc.) |
| • | Level 3—significant unobservable inputs (including the Fund’s own assumptions in determining the fair value of investments) |
The fair value of debt instruments, such as bonds, and over-the-counter derivatives is generally based on market price quotations, recently executed market transactions (where observable) or industry recognized modeling techniques and are generally classified as Level 2. Pricing vendor inputs to Level 2 valuations may include quoted prices for similar investments in active markets, interest rate curves, coupon rates, currency rates, yield curves, option adjusted spreads, default rates, credit spreads and other unique security features in order to estimate the relevant cash flows which are then discounted to calculate fair values. If these inputs are unobservable and significant to the fair value, these investments will be classified as Level 3.
| 24 | AB TAX-AWARE REAL RETURN INCOME SHARES | abfunds.com | |
NOTES TO FINANCIAL STATEMENTS (continued)
Other fixed income investments, including non-U.S. government and corporate debt, are generally valued using quoted market prices, if available, which are typically impacted by current interest rates, maturity dates and any perceived credit risk of the issuer. Additionally, in the absence of quoted market prices, these inputs are used by pricing vendors to derive a valuation based upon industry or proprietary models which incorporate issuer specific data with relevant yield/spread comparisons with more widely quoted bonds with similar key characteristics. Those investments for which there are observable inputs are classified as Level 2. Where the inputs are not observable, the investments are classified as Level 3.
The following table summarizes the valuation of the Fund’s investments by the above fair value hierarchy levels as of April 30, 2020:
Investments in Securities: | Level 1 | Level 2 | Level 3 | Total | ||||||||||||
Assets: |
| |||||||||||||||
Long-Term Municipal Bonds | $ | — | $ | 15,393,689 | $ | — | $ | 15,393,689 | ||||||||
Short-Term Municipal Notes | — | 403,461 | — | 403,461 | ||||||||||||
Short-Term Investments | 788,799 | — | — | 788,799 | ||||||||||||
|
|
|
|
|
|
|
| |||||||||
Total Investments in Securities | 788,799 | 15,797,150 | — | 16,585,949 | ||||||||||||
Other Financial Instruments(a): | ||||||||||||||||
Assets: |
| |||||||||||||||
Total Return Swaps | — | 711,971 | — | 711,971 | ||||||||||||
Liabilities: |
| |||||||||||||||
Centrally Cleared Inflation (CPI) Swaps | — | (701,101 | ) | — | (701,101 | )(b) | ||||||||||
Centrally Cleared Interest Rate Swaps | — | (1,962,354 | ) | — | (1,962,354 | )(b) | ||||||||||
|
|
|
|
|
|
|
| |||||||||
Total | $ | 788,799 | $ | 13,845,666 | $ | — | $ | 14,634,465 | ||||||||
|
|
|
|
|
|
|
| |||||||||
| (a) | Other financial instruments are derivative instruments, such as futures, forwards and swaps, which are valued at the unrealized appreciation/(depreciation) on the instrument. Other financial instruments may also include swaps with upfront premiums, options written and swaptions written which are valued at market value. |
| (b) | Only variation margin receivable/(payable) at period end is reported within the statement of assets and liabilities. This amount reflects cumulative unrealized appreciation/(depreciation) on futures and centrally cleared swaps as reported in the portfolio of investments. Where applicable, centrally cleared swaps with upfront premiums are presented here at market value. |
3. Taxes
It is the Fund’s policy to meet the requirements of the Internal Revenue Code applicable to regulated investment companies and to distribute all of its investment company taxable income and net realized gains, if any, to shareholders. Therefore, no provisions for federal income or excise taxes are required.
In accordance with U.S. GAAP requirements regarding accounting for uncertainties in income taxes, management has analyzed the Fund’s tax
| abfunds.com | AB TAX-AWARE REAL RETURN INCOME SHARES | 25 | |
NOTES TO FINANCIAL STATEMENTS (continued)
positions taken or expected to be taken on federal and state income tax returns for all open tax years (the current tax year) and has concluded that no provision for income tax is required in the Fund’s financial statements.
4. Investment Income and Investment Transactions
Dividend income is recorded on the ex-dividend date or as soon as the Fund is informed of the dividend. Interest income is accrued daily. Investment transactions are accounted for on the date the securities are purchased or sold. Investment gains or losses are determined on the identified cost basis. The Fund amortizes premiums and accretes discounts as adjustments to interest income.
5. Dividends and Distributions
Dividends and distributions to shareholders, if any, are recorded on the ex-dividend date. Income dividends and capital gains distributions are determined in accordance with federal tax regulations and may differ from those determined in accordance with U.S. GAAP. To the extent these differences are permanent, such amounts are reclassified within the capital accounts based on their federal tax basis treatment; temporary differences do not require such reclassification.
NOTE B
Advisory Fee and Other Transactions with Affiliates
Under the terms of the Advisory Agreement, the Fund pays no advisory fee to the Adviser and the Adviser reimburses or pays for the Fund’s operating expenses. The Fund is an integral part of separately managed accounts in wrap-fee programs and other investment programs. Typically, participants in these programs pay a fee to their investment adviser for all costs and expenses of the separately managed account, including costs and expenses associated with the Fund, and a fee is paid by their investment adviser to the Adviser. In certain cases, participants may have a direct relationship with the Adviser without the involvement of a third party investment adviser, in which case the participant would pay a fee directly to the Adviser. The Adviser serves as investment manager and adviser of the Fund and continuously furnishes an investment program for the Fund and manages, supervises and conducts the affairs of the Fund, subject to the supervisions of the Fund’s Board. The Advisory Agreement provides that the Adviser or an affiliate will furnish, or pay the expenses of the Fund for, office space, facilities and equipment, services of executive and other personnel of the Fund and certain administrative services.
The Fund has entered into a distribution agreement with AllianceBernstein Investments, Inc., the Fund’s principal underwriter (the “Underwriter”), to permit the Underwriter to distribute the Fund’s shares, which are sold at
| 26 | AB TAX-AWARE REAL RETURN INCOME SHARES | abfunds.com | |
NOTES TO FINANCIAL STATEMENTS (continued)
their net asset value without any sales charge. The Fund does not pay a fee for this service. The Underwriter is a wholly owned subsidiary of the Adviser.
AllianceBernstein Investor Services, Inc. (“ABIS”), a wholly-owned subsidiary of the Adviser, acts as the Fund’s registrar, transfer agent and dividend-disbursing agent. ABIS registers the transfer, issuance and redemption of Fund shares and disburses dividends and other distributions to Fund shareholders. The Fund does not pay a fee for this service.
The Fund may invest in AB Government Money Market Portfolio (the “Government Money Market Portfolio”) which has a contractual annual advisory fee rate of ..20% of the portfolio’s average daily net assets and bears its own expenses. The Adviser has contractually agreed to waive .10% of the advisory fee of Government Money Market Portfolio (resulting in a net advisory fee of .10%) until August 31, 2020. In connection with the investment by the Fund in Government Money Market Portfolio, the Adviser has contractually agreed to reimburse its advisory fee from the Fund in an amount equal to the Fund’s pro rata share of the effective advisory fee of Government Money Market Portfolio, as borne indirectly by the Fund as an acquired fund fee and expense. For the period ended April 30, 2020, such reimbursement amounted to $2,526.
A summary of the Fund’s transactions in AB mutual funds for the period ended April 30, 2020 is as follows:
Fund | Market Value 11/12/19(a) (000) | Purchases at Cost (000) | Sales Proceeds (000) | Market Value 4/30/20 (000) | Dividend Income (000) | |||||||||||||||
Government Money Market Portfolio | $ | 0 | $ | 22,782 | $ | 21,993 | $ | 789 | $ | 41 | ||||||||||
| (a) | Commencement of operations. |
During the second quarter of 2018, AXA S.A. (“AXA”), a French holding company for the AXA Group, completed the sale of a minority stake in its subsidiary, AXA Equitable Holdings, Inc. (now named Equitable Holdings, Inc.) (“Equitable”), through an initial public offering. Equitable is the holding company for a diverse group of financial services companies, including an approximately 64.9% economic interest in the Adviser and a 100% interest in AllianceBernstein Corporation, the general partner of the Adviser. Since the initial sale, AXA has completed additional offerings, most recently during the fourth quarter of 2019. As a result, AXA currently owns less than 10% of the outstanding shares of common stock of Equitable, and no longer owns a controlling interest in Equitable. AXA previously announced its intention to sell its entire interest in Equitable over time, subject to
| abfunds.com | AB TAX-AWARE REAL RETURN INCOME SHARES | 27 | |
NOTES TO FINANCIAL STATEMENTS (continued)
market conditions and other factors (the “Plan”). Most of AXA’s remaining Equitable shares are to be delivered on redemption of AXA bonds mandatorily exchangeable into Equitable shares and maturing in May 2021. AXA retains sole discretion to determine the timing of any future sales of its remaining shares of Equitable common stock.
Sales under the Plan that were completed on November 13, 2019 resulted in the indirect transfer of a “controlling block” of voting securities of the Adviser (a “Change of Control Event”) and may have been deemed to have been an “assignment” causing a termination of the Fund’s investment advisory and administration agreements. In order to ensure that investment advisory and administration services could continue uninterrupted in the event of a Change of Control Event, the Board previously approved new investment advisory and administration agreements with the Adviser, and shareholders of the Fund subsequently approved the new investment advisory agreement. These agreements became effective on November 13, 2019.
NOTE C
Investment Transactions
Purchases and sales of investment securities (excluding short-term investments) for the period ended April 30, 2020 were as follows:
| Purchases | Sales | |||||||
Investment securities (excluding U.S. government securities) | $ | 17,545,228 | $ | 1,310,756 | ||||
U.S. government securities | 102,552 | – 0 | – | |||||
The cost of investments for federal income tax purposes, gross unrealized appreciation and unrealized depreciation are as follows:
Cost | $ | 17,363,403 | ||
|
| |||
Gross unrealized appreciation | $ | 858,570 | ||
Gross unrealized depreciation | (3,462,304 | ) | ||
|
| |||
Net unrealized depreciation | $ | (2,603,734 | ) | |
|
|
1. Derivative Financial Instruments
The Fund may use derivatives in an effort to earn income and enhance returns, to replace more traditional direct investments, to obtain exposure to otherwise inaccessible markets (collectively, “investment purposes”), or to hedge or adjust the risk profile of its portfolio.
The principal types of derivatives utilized by the Fund, as well as the methods in which they may be used are:
| • | Swaps |
The Fund may enter into swaps to hedge its exposure to interest rates, credit risk, equity markets or currencies. A swap is an
| 28 | AB TAX-AWARE REAL RETURN INCOME SHARES | abfunds.com | |
NOTES TO FINANCIAL STATEMENTS (continued)
agreement that obligates two parties to exchange a series of cash flows at specified intervals based upon or calculated by reference to changes in specified prices or rates for a specified amount of an underlying asset. The payment flows are usually netted against each other, with the difference being paid by one party to the other. In addition, collateral may be pledged or received by the Fund in accordance with the terms of the respective swaps to provide value and recourse to the Fund or its counterparties in the event of default, bankruptcy or insolvency by one of the parties to the swap.
Risks may arise as a result of the failure of the counterparty to the swap to comply with the terms of the swap. The loss incurred by the failure of a counterparty is generally limited to the net interim payment to be received by the Fund, and/or the termination value at the end of the contract. Therefore, the Fund considers the creditworthiness of each counterparty to a swap in evaluating potential counterparty risk. This risk is mitigated by having a netting arrangement between the Fund and the counterparty and by the posting of collateral by the counterparty to the Fund to cover the Fund’s exposure to the counterparty. Additionally, risks may arise from unanticipated movements in interest rates or in the value of the underlying securities. The Fund accrues for the interim payments on swaps on a daily basis, with the net amount recorded within unrealized appreciation/depreciation of swaps on the statement of assets and liabilities, where applicable. Once the interim payments are settled in cash, the net amount is recorded as realized gain/(loss) on swaps on the statement of operations, in addition to any realized gain/(loss) recorded upon the termination of swaps. Upfront premiums paid or received for OTC swaps are recognized as cost or proceeds on the statement of assets and liabilities and are amortized on a straight line basis over the life of the contract. Amortized upfront premiums are included in net realized gain/(loss) from swaps on the statement of operations. Fluctuations in the value of swaps are recorded as a component of net change in unrealized appreciation/depreciation of swaps on the statement of operations.
Certain standardized swaps, including certain interest rate swaps and credit default swaps, are (or soon will be) subject to mandatory central clearing. Cleared swaps are transacted through futures commission merchants (“FCMs”) that are members of central clearinghouses, with the clearinghouse serving as central counterparty, similar to transactions in futures contracts. Centralized clearing will be required for additional categories of swaps on a phased-in basis based on requirements published by the Securities and Exchange Commission and Commodity Futures Trading Commission.
| abfunds.com | AB TAX-AWARE REAL RETURN INCOME SHARES | 29 | |
NOTES TO FINANCIAL STATEMENTS (continued)
At the time the Fund enters into a centrally cleared swap, the Fund deposits and maintains as collateral an initial margin with the broker, as required by the clearinghouse on which the transaction is effected. Such amount is shown as cash collateral due from broker on the statement of assets and liabilities. Pursuant to the contract, the Fund agrees to receive from or pay to the broker an amount of cash equal to the daily fluctuation in the value of the contract. Such receipts or payments are known as variation margin and are recorded by the Fund as unrealized gains or losses. Risks may arise from the potential inability of a counterparty to meet the terms of the contract. The credit/counterparty risk for centrally cleared swaps is generally less than non-centrally cleared swaps, since the clearinghouse, which is the issuer or counterparty to each centrally cleared swap, has robust risk mitigation standards, including the requirement to provide initial and variation margin. When the contract is closed, the Fund records a realized gain or loss equal to the difference between the value of the contract at the time it was opened and the time it was closed.
Interest Rate Swaps:
The Fund is subject to interest rate risk exposure in the normal course of pursuing its investment objectives. Because the Fund holds fixed rate bonds, the value of these bonds may decrease if interest rates rise. To help hedge against this risk and to maintain its ability to generate income at prevailing market rates, the Fund may enter into interest rate swaps. Interest rate swaps are agreements between two parties to exchange cash flows based on a notional amount. The Fund may elect to pay a fixed rate and receive a floating rate, or, receive a fixed rate and pay a floating rate on a notional amount.
In addition, the Fund may also enter into interest rate swap transactions to preserve a return or spread on a particular investment or portion of its portfolio, or protecting against an increase in the price of securities the Fund anticipates purchasing at a later date. Interest rate swaps involve the exchange by a Fund with another party of their respective commitments to pay or receive interest (e.g., an exchange of floating rate payments for fixed rate payments) computed based on a contractually-based principal (or “notional”) amount. Interest rate swaps are entered into on a net basis (i.e., the two payment streams are netted out, with the Fund receiving or paying, as the case may be, only the net amount of the two payments).
During the period ended April 30, 2020, the Fund held interest rate swaps for hedging purposes.
Inflation (CPI) Swaps:
Inflation swap agreements are contracts in which one party agrees to pay the cumulative percentage increase in a price index (the
| 30 | AB TAX-AWARE REAL RETURN INCOME SHARES | abfunds.com | |
NOTES TO FINANCIAL STATEMENTS (continued)
Consumer Price Index with respect to CPI swaps) over the term of the swap (with some lag on the inflation index), and the other pays a compounded fixed rate. Inflation swaps may be used to protect the net asset value, or NAV, of a Fund against an unexpected change in the rate of inflation measured by an inflation index since the value of these agreements is expected to increase if there are unexpected inflation increases.
During the period ended April 30, 2020, the Fund held inflation (CPI) swaps for hedging purposes.
Total Return Swaps:
The Fund may enter into total return swaps in order to take a “long” or “short” position with respect to an underlying referenced asset. The Fund is subject to market price volatility of the underlying referenced asset. A total return swap involves commitments to pay interest in exchange for a market linked return based on a notional amount. To the extent that the total return of the security, group of securities or index underlying the transaction exceeds or falls short of the offsetting interest obligation, the Fund will receive a payment from or make a payment to the counterparty.
During the period ended April 30, 2020, the Fund held total return swaps for hedging purposes.
The Fund typically enters into International Swaps and Derivatives Association, Inc. Master Agreements (“ISDA Master Agreement”) with its OTC derivative contract counterparties in order to, among other things, reduce its credit risk to OTC counterparties. ISDA Master Agreements include provisions for general obligations, representations, collateral and events of default or termination. Under an ISDA Master Agreement, the Fund typically may offset with the OTC counterparty certain derivative financial instruments’ payables and/or receivables with collateral held and/or posted and create one single net payment (close-out netting) in the event of default or termination. In the event of a default by an OTC counterparty, the return of collateral with market value in excess of the Fund’s net liability, held by the defaulting party, may be delayed or denied.
The Fund’s ISDA Master Agreements may contain provisions for early termination of OTC derivative transactions in the event the net assets of the Fund decline below specific levels (“net asset contingent features”). If these levels are triggered, the Fund’s OTC counterparty has the right to terminate such transaction and require the Fund to pay or receive a settlement amount in connection with the terminated transaction. If OTC derivatives were held at period end, please refer to netting arrangements by the OTC counterparty table below for additional details.
| abfunds.com | AB TAX-AWARE REAL RETURN INCOME SHARES | 31 | |
NOTES TO FINANCIAL STATEMENTS (continued)
During the period ended April 30, 2020, the Fund had entered into the following derivatives:
Asset Derivatives | Liability Derivatives | |||||||||||
Derivative Type | Statement of Location | Fair Value | Statement of Location | Fair Value | ||||||||
Interest rate contracts | Receivable/Payable for variation margin on centrally cleared swaps | $ | 2,663,455 | * | ||||||||
Equity contracts | Unrealized appreciation on total return swaps | $ | 711,971 | |||||||||
|
|
|
| |||||||||
Total | $ | 711,971 | $ | 2,663,455 | ||||||||
|
|
|
| |||||||||
| * | Only variation margin receivable/payable at period end is reported within the statement of assets and liabilities. This amount reflects cumulative unrealized appreciation/(depreciation) on futures and centrally cleared swaps as reported in the portfolio of investments. |
Derivative Type | Location of Gain | Realized Gain or (Loss) on Derivatives | Change in Unrealized Appreciation or (Depreciation) | |||||||
Interest rate contracts | Net realized gain (loss) on swaps; Net change in unrealized appreciation/depreciation of swaps | $ | 164,732 | $ | (2,663,455 | ) | ||||
Equity contracts | Net realized gain (loss) on swaps; Net change in unrealized appreciation/depreciation of swaps | 0 | 711,971 | |||||||
|
|
|
| |||||||
Total | $ | 164,732 | $ | (1,951,484 | ) | |||||
|
|
|
| |||||||
The following table represents the average monthly volume of the Fund’s derivative transactions during the period ended April 30, 2020:
Centrally Cleared Interest Rate Swaps: | ||||
Average notional amount | $ | 32,233,333 | (a) | |
Centrally Cleared Inflation Swaps: | ||||
Average notional amount | $ | 12,700,000 | (b) | |
Total Return Swaps: | ||||
Average notional amount | $ | 26,633,333 | (a) |
| (a) | Positions were open for six months during the year. |
| (b) | Positions were open for five months during the year. |
| 32 | AB TAX-AWARE REAL RETURN INCOME SHARES | abfunds.com | |
NOTES TO FINANCIAL STATEMENTS (continued)
For financial reporting purposes, the Fund does not offset derivative assets and derivative liabilities that are subject to netting arrangements in the statement of assets and liabilities.
All OTC derivatives held at period end were subject to netting arrangements. The following table presents the Fund’s derivative assets and liabilities by OTC counterparty net of amounts available for offset under ISDA Master Agreements (“MA”) and net of the related collateral received/pledged by the Fund as of April 30, 2020. Exchange-traded derivatives and centrally cleared swaps are not subject to netting arrangements and as such are excluded from the table.
Counterparty | Derivative Assets Subject to a MA | Derivatives Available for Offset | Cash Collateral Received* | Security Collateral Received* | Net Amount of Derivative Assets | |||||||||||||||
Barclays Bank PLC | $ | 711,971 | $ | – 0 | – | $ | – 0 | – | $ | 628,663 | $ | 83,308 | ||||||||
|
|
|
|
|
|
|
|
|
| |||||||||||
Total | $ | 711,971 | $ | – 0 | – | $ | – 0 | – | $ | 628,663 | $ | 83,308 | ^ | |||||||
|
|
|
|
|
|
|
|
|
| |||||||||||
| * | The actual collateral received/pledged may be more than the amount reported due to over-collateralization. |
| ^ | Net amount represents the net receivable/payable that would be due from/to the counterparty in the event of default or termination. The net amount from OTC financial derivative instruments can only be netted across transactions governed under the same master agreement with the same counterparty. |
NOTE D
Shares of Beneficial Interest
Transactions in shares of beneficial interest were as follows:
| Shares | Amount | |||||||||||
| November 12, 2019(a) to April 30, 2020 | November 12, 2019(a) to April 30, 2020 | |||||||||||
|
| |||||||||||
Shares sold | 2,550,264 | $ | 25,272,794 | |||||||||
| ||||||||||||
Shares redeemed | (455,035 | ) | (4,023,598 | ) | ||||||||
| ||||||||||||
Net increase | 2,095,229 | $ | 21,249,196 | |||||||||
| ||||||||||||
| (a) | Commencement of operations. |
NOTE E
Risks Involved in Investing in the Fund
Market Risk—The market value of a security may move up or down, sometimes rapidly and unpredictably. These fluctuations may cause a security to be worth less than the price originally paid for it, or less than it was worth at an earlier time. Market risk may affect a single issuer, industry, sector of the economy or the market as a whole. Global economies and financial markets are increasingly interconnected, which
| abfunds.com | AB TAX-AWARE REAL RETURN INCOME SHARES | 33 | |
NOTES TO FINANCIAL STATEMENTS (continued)
increases the probabilities that conditions in one country or region might adversely impact issuers in a different country or region. Conditions affecting the general economy, including political, social, or economic instability at the local, regional, or global level may also affect the market value of a security. Health crises, such as pandemic and epidemic diseases, as well as other incidents that interrupt the expected course of events, such as natural disasters, war or civil disturbance, acts of terrorism, power outages and other unforeseeable and external events, and the public response to or fear of such diseases or events, have and may in the future have an adverse effect on the Fund’s investments and net asset value and can lead to increased market volatility. For example, any preventative or protective actions that governments may take in respect of such diseases or events may result in periods of business disruption, inability to obtain raw materials, supplies and component parts, and reduced or disrupted operations for the Fund’s portfolio companies. The occurrence and pendency of such diseases or events could adversely affect the economies and financial markets either in specific countries or worldwide.
Credit Risk—An issuer or guarantor of a fixed-income security, or the counterparty to a derivatives or other contract, may be unable or unwilling to make timely payments of interest or principal, or to otherwise honor its obligations. The issuer or guarantor may default, causing a loss of the full principal amount of a security and any accrued interest. The degree of risk for a particular security may be reflected in its credit rating. There is the possibility that the credit rating of a fixed-income security may be downgraded after purchase, which may adversely affect the value of the security. Investments in fixed-income securities with lower ratings tend to have a higher probability that an issuer will default or fail to meet its payment obligations.
Interest Rate Risk—Changes in interest rates will affect the value of investments in fixed-income securities. When interest rates rise, the value of existing investments in fixed-income securities tends to fall and this decrease in value may not be offset by higher income from new investments. Interest rate risk is generally greater for fixed-income securities with longer maturities or durations.
Below Investment Grade Securities Risk—Investments in fixed-income securities with lower ratings (commonly known as “junk bonds”) are subject to a higher probability that an issuer will default or fail to meet its payment obligations. These securities may be subject to greater price volatility due to such factors as specific corporate developments and negative perceptions of the junk bond market generally and may be more difficult to trade than other types of securities.
| 34 | AB TAX-AWARE REAL RETURN INCOME SHARES | abfunds.com | |
NOTES TO FINANCIAL STATEMENTS (continued)
Duration Risk—Duration is a measure that relates the expected price volatility of a fixed-income security to changes in interest rates. The duration of a fixed-income security may be shorter than or equal to full maturity of a fixed-income security. Fixed-income securities with longer durations have more risk and will decrease in price as interest rates rise.
Municipal Market Risk—This is the risk that special factors may adversely affect the value of municipal securities and have a significant effect on the yield or value of the Fund’s investments in municipal securities. These factors include economic conditions, political or legislative changes, uncertainties related to the tax status of municipal securities, or the rights of investors in these securities. To the extent that the Fund invests more of its assets in a particular state’s municipal securities, the Fund may be vulnerable to events adversely affecting that state, including economic, political and regulatory occurrences, court decisions, terrorism and catastrophic natural disasters, such as hurricanes or earthquakes. The Fund’s investments in certain municipal securities with principal and interest payments that are made from the revenues of a specific project or facility, and not general tax revenues, may have increased risks. Factors affecting the project or facility, such as local business or economic conditions, could have a significant effect on the project’s ability to make payments of principal and interest on these securities.
Congress has previously considered making changes to the municipal securities provisions of the Internal Revenue Code that could change the U.S. federal income tax treatment of certain types of municipal securities
Inflation Risk—This is the risk that the value of assets or income from investments will be less in the future as inflation decreases the value of money. As inflation increases, the value of the Fund’s assets can decline as can the value of the Fund’s distributions. This risk is significantly greater for fixed-income securities with longer maturities.
Derivatives Risk—The Fund may enter into derivative transactions such as forwards, options, futures and swaps. Derivatives may be illiquid, difficult to price, and leveraged so that small changes may produce disproportionate losses for the Fund, and subject to counterparty risk to a greater degree than more traditional investments. Derivatives may result in significant losses, including losses that are far greater than the value of the derivatives reflected on the statement of assets and liabilities.
Leverage Risk—When the Fund borrows money or otherwise leverages its investments, its performance may be volatile because leverage tends to exaggerate the effect of any increase or decrease in the value of the Fund’s investments. The Fund may create leverage through the use of
| abfunds.com | AB TAX-AWARE REAL RETURN INCOME SHARES | 35 | |
NOTES TO FINANCIAL STATEMENTS (continued)
reverse repurchase arrangements, forward currency exchange contracts, forward commitments, dollar rolls or futures or by borrowing money. The use of other types of derivative instruments by the Fund, such as options and swaps, may also result in a form of leverage. Leverage may result in higher returns to the Fund than if the Fund were not leveraged, but may also adversely affect returns, particularly if the market is declining.
Illiquid Investments Risk—Illiquid investments risk exists when particular investments, such as lower-rated securities, are or become difficult to purchase or sell, possibly preventing the Fund from selling such investments at an advantageous price. The Fund is subject to illiquid investments risk because the market for municipal securities is generally smaller than many other markets. Derivatives and securities involving substantial market and credit risk tend to involve greater illiquid investments risk than most other types of investments.
LIBOR Risk—The Fund may invest in certain debt securities, derivatives or other financial instruments that utilize the London Interbank Offered Rate, or “LIBOR,” as a “benchmark” or “reference rate” for various interest rate calculations. In July 2017, the United Kingdom Financial Conduct Authority, which regulates LIBOR, announced a desire to phase out the use of LIBOR by the end of 2021. Although financial regulators and industry working groups have suggested alternative reference rates, such as European Interbank Offer Rate (“EURIBOR”), Sterling Overnight Interbank Average Rate (“SONIA”) and Secured Overnight Financing Rate (“SOFR”), global consensus on alternative rates is lacking and the process for amending existing contracts or instruments to transition away from LIBOR remains unclear. The elimination of LIBOR or changes to other reference rates or any other changes or reforms to the determination or supervision of reference rates could have an adverse impact on the market for, or value of, any securities or payments linked to those reference rates, which may adversely affect the Fund’s performance and/or net asset value. Uncertainty and risk also remain regarding the willingness and ability of issuers and lenders to include revised provisions in new and existing contracts or instruments. Consequently, the transition away from LIBOR to other reference rates may lead to increased volatility and illiquidity in markets that are tied to LIBOR, fluctuations in values of LIBOR-related investments or investments in issuers that utilize LIBOR, increased difficulty in borrowing or refinancing and diminished effectiveness of hedging strategies, adversely affecting the Fund’s performance. Furthermore, the risks associated with the expected discontinuation of LIBOR and transition may be exacerbated if the work necessary to effect an orderly transition to an alternative reference rate is not completed in a timely manner. Because the usefulness of LIBOR as a benchmark could deteriorate during the transition period, these effects could occur prior to the end of 2021.
| 36 | AB TAX-AWARE REAL RETURN INCOME SHARES | abfunds.com | |
NOTES TO FINANCIAL STATEMENTS (continued)
Indemnification Risk—In the ordinary course of business, the Fund enters into contracts that contain a variety of indemnifications. The Fund’s maximum exposure under these arrangements is unknown. However, the Fund has not had prior claims or losses pursuant to these indemnification provisions and expects the risk of loss thereunder to be remote. Therefore, the Fund has not accrued any liability in connection with these indemnification provisions.
Management Risk—The Fund is subject to management risk because it is an actively-managed investment fund. The Adviser will apply its investment techniques and risk analyses in making investment decisions, but there is no guarantee that its techniques will produce the intended results.
NOTE F
Joint Credit Facility
A number of open-end mutual funds managed by the Adviser, including the Fund, participate in a $325 million revolving credit facility (the “Facility”) intended to provide short-term financing, if necessary, subject to certain restrictions in connection with abnormal redemption activity. Commitment fees related to the Facility are paid by the participating funds and are included in miscellaneous expenses in the statement of operations. The Fund did not utilize the Facility during the six months ended April 30, 2020.
NOTE G
Distributions to Shareholders
The tax character of distributions paid during the period ended April 30, 2020 was as follows:
| 2020 | ||||
Distributions paid from: | ||||
Ordinary income | $ | – 0 | – | |
|
| |||
Total taxable distributions paid | – 0 | – | ||
Tax-exempt distributions | 7,743 | |||
|
| |||
Total distributions paid | $ | 7,743 | ||
|
| |||
As of April 30, 2020, the components of accumulated earnings/(deficit) on a tax basis were as follows:
Undistributed ordinary income | $ | 81,682 | ||
Undistributed tax-exempt income | 84,477 | |||
Accumulated capital and other losses | (50,198 | )(a) | ||
Unrealized appreciation/(depreciation) | (2,603,734 | )(b) | ||
|
| |||
Total accumulated earnings/(deficit) | $ | (2,487,773 | )(c) | |
|
|
| (a) | As of April 30, 2020, the Fund had a net capital loss carryforward of $50,198. |
| abfunds.com | AB TAX-AWARE REAL RETURN INCOME SHARES | 37 | |
NOTES TO FINANCIAL STATEMENTS (continued)
| (b) | The difference between book-basis and tax-basis unrealized appreciation/(depreciation) is attributable primarily to the tax treatment of swaps. |
| (c) | The difference between book-basis and tax-basis components of accumulated earnings/(deficit) is attributable primarily to dividends payable. |
For tax purposes, net realized capital losses may be carried over to offset future capital gains, if any. Funds are permitted to carry forward capital losses for an indefinite period, and such losses will retain their character as either short-term or long-term capital losses. As of April 30, 2020, the Fund had a net short-term capital loss carryforward of $50,198, which may be carried forward for an indefinite period.
During the current fiscal period, permanent differences primarily due to non-deductible excise tax paid resulted in a net decrease in accumulated loss and a net decrease in additional paid-in capital. These reclassifications had no effect on net assets.
NOTE H
Recent Accounting Pronouncements
In March 2017, the Financial Accounting Standards Board issued an Accounting Standards Update, ASU 2017-08, Receivables – Nonrefundable Fees and Other Costs (Subtopic 310-20), Premium Amortization on Purchased Callable Debt Securities which amends the amortization period for certain purchased callable debt securities held at a premium, shortening such period to the earliest call date. ASU 2017-08 does not require any accounting change for debt securities held at a discount; the discount continues to be amortized to maturity. ASU 2017-08 is effective for fiscal years, and interim periods within those fiscal years, beginning after December 15, 2018. The Fund has adopted ASU 2017-08, which did not have a material impact on the Fund’s financial position or the results of its operations, and had no impact on the Fund’s net assets.
NOTE I
Subsequent Events
Management has evaluated subsequent events for possible recognition or disclosure in the financial statements through the date the financial statements are issued. Management has determined that there are no material events that would require disclosure in the Fund’s financial statements through this date.
| 38 | AB TAX-AWARE REAL RETURN INCOME SHARES | abfunds.com | |
FINANCIAL HIGHLIGHTS
Selected Data For A Share Of Beneficial Interest Outstanding Throughout Each Period
| November 12, 2019(a) to April 30, 2020 | ||||
|
| |||
Net asset value, beginning of period | $10.00 | |||
|
| |||
Income From Investment Operations |
| |||
Net investment income(b) | .07 | |||
Net realized and unrealized loss on investment transactions | (1.11 | ) | ||
|
| |||
Net decrease in net asset value from operations | (1.04 | ) | ||
|
| |||
Less: Dividends |
| |||
Dividends from net investment income | (.01 | ) | ||
|
| |||
Net asset value, end of period | $8.95 | |||
|
| |||
Total Return |
| |||
Total investment return based on net asset value(c) | (10.43 | )% | ||
Ratios/Supplemental Data |
| |||
Net assets, end of period (000’s omitted) | $18,760 | |||
Ratio to average net assets of: |
| |||
Expenses(d) | .01 | %^ | ||
Net investment income | 1.55 | %^ | ||
Portfolio turnover rate | 10 | % | ||
| (a) | Commencement of operations. |
| (b) | Based on average shares outstanding. |
| (c) | Total investment return is calculated assuming an initial investment made at the net asset value at the beginning of the period, reinvestment of all dividends and distributions at net asset value during the period, and redemption on the last day of the period. Total return does not reflect the deduction of taxes that a shareholder would pay on fund distributions or the redemption of fund shares. Total investment return calculated for a period of less than one year is not annualized. |
| (d) | The expense ratio, excluding bank overdraft expense, is .00%. |
| ^ | Annualized. |
See notes to financial statements.
| abfunds.com | AB TAX-AWARE REAL RETURN INCOME SHARES | 39 | |
REPORT OF INDEPENDENT REGISTERED
PUBLIC ACCOUNTING FIRM
To the Board of Trustees of AB Corporate Shares and Shareholders of
AB Tax-Aware Real Return Income Shares:
Opinion on the Financial Statements
We have audited the accompanying statement of assets and liabilities of AB Tax-Aware Real Return Income Shares (the “Fund”) (one of the series constituting AB Corporate Shares (the “Trust”)), including the portfolio of investments, as of April 30, 2020, and the related statements of operations and changes in net assets and financial highlights for the period from November 12, 2019 (commencement of operations) to April 30, 2020 and the related notes (collectively referred to as the “financial statements”). In our opinion, the financial statements present fairly, in all material respects, the financial position of the Fund (one of the series constituting AB Corporate Shares) at April 30, 2020, the results of its operations, the changes in its net assets and its financial highlights for the period from November 12, 2019 (commencement of operations) to April 30, 2020, in conformity with U.S. generally accepted accounting principles.
Basis for Opinion
These financial statements are the responsibility of the Trust’s management. Our responsibility is to express an opinion on the Fund’s financial statements based on our audits. We are a public accounting firm registered with the Public Company Accounting Oversight Board (United States) (“PCAOB”) and are required to be independent with respect to the Fund in accordance with the U.S. federal securities laws and the applicable rules and regulations of the Securities and Exchange Commission and the PCAOB.
We conducted our audits in accordance with the standards of the PCAOB. Those standards require that we plan and perform the audit to obtain reasonable assurance about whether the financial statements are free of material misstatement, whether due to error or fraud. The Trust is not required to have, nor were we engaged to perform, an audit of the Trust’s internal control over financial reporting. As part of our audits, we are required to obtain an understanding of internal control over financial reporting, but not for the purpose of expressing an opinion on the effectiveness of the Trust’s internal control over financial reporting. Accordingly, we express no such opinion.
Our audits included performing procedures to assess the risks of material misstatement of the financial statements, whether due to error or fraud, and performing procedures that respond to those risks. Such procedures included examining, on a test basis, evidence regarding the amounts and disclosures in the financial statements. Our procedures included confirmation
| 40 | AB TAX-AWARE REAL RETURN INCOME SHARES | abfunds.com | |
REPORT OF INDEPENDENT REGISTERED
PUBLIC ACCOUNTING FIRM (continued)
of securities owned as of April 30, 2020, by correspondence with the custodian and others or by other appropriate auditing procedures where replies from others were not received. Our audits also included evaluating the accounting principles used and significant estimates made by management, as well as evaluating the overall presentation of the financial statements. We believe that our audits provide a reasonable basis for our opinion.

We have served as the auditor of one or more of the AB investment companies since 1968.
New York, New York
June 26, 2020
| abfunds.com | AB TAX-AWARE REAL RETURN INCOME SHARES | 41 | |
BOARD OF TRUSTEES
Marshall C. Turner, Jr.(1), Chairman Jorge A. Bermudez(1) Michael J. Downey(1) Nancy P. Jacklin(1) | Robert M. Keith, President and Chief Executive Officer Jeanette Loeb(1) Carol C. McMullen(1) Garry L. Moody(1) Earl D. Weiner(1) | |
OFFICERS
R.B. “Guy” Davidson III(2)^, Vice President Terrance T. Hults(2), Vice President Matthew J. Norton(2), Vice President Andrew D. Potter(2), Vice President | Emilie D. Wrapp, Secretary Michael B. Reyes, Senior Analyst Joseph J. Mantineo, Treasurer and Chief Financial Officer Phyllis J. Clarke, Controller Vincent S. Noto, Chief Compliance Officer |
Custodian and Accounting Agent State Street Bank and Trust Company
Principal Underwriter AllianceBernstein Investments, Inc.
Transfer Agent AllianceBernstein Investor Services, | Legal Counsel Seward & Kissel LLP One Battery Park Plaza New York, NY 10004
Independent Registered Public Accounting Firm Ernst & Young LLP 5 Times Square New York, NY 10036 |
| 1 | Member of the Audit Committee, the Governance and Nominating Committee, and the Independent Directors Committee. |
| 2 | The day-to-day management of, and investment decisions for, the Fund’s portfolio are made by the Adviser’s Municipal Bond Investment Team. Messrs. Davidson, Hults, Norton and Potter are the investment professionals primarily responsible for the day-to-day management of the Fund’s portfolio. |
| ^ | Mr. Davidson is expected to retire from the Adviser effective December 30, 2020. |
| 42 | AB TAX-AWARE REAL RETURN INCOME SHARES | abfunds.com | |
MANAGEMENT OF THE FUND
Board of Trustees Information
The business and affairs of the Trust are managed under the direction of the Board of Trustees. Certain information concerning the Trust’s Trustee is set forth below.
| NAME, ADDRESS*, AGE AND (YEAR FIRST ELECTED**) | PRINCIPAL OCCUPATION(S), DURING PAST FIVE YEARS AND OTHER INFORMATION*** | PORTFOLIOS IN AB FUND COMPLEX OVERSEEN BY TRUSTEE | OTHER PUBLIC COMPANY DIRECTORSHIPS CURRENTLY HELD BY TRUSTEE | |||||
| INTERESTED TRUSTEE | ||||||||
Robert M. Keith,# 1345 Avenue of the Americas New York, NY 10105 (2010) | Senior Vice President of AllianceBernstein L.P. (the “Adviser”) and the head of AllianceBernstein Investments, Inc. (“ABI”) since July 2008; Director of ABI and President of the AB Mutual Funds. Previously, he served as Executive Managing Director of ABI from December 2006 to June 2008. Prior to joining ABI in 2006, Executive Managing Director of Bernstein Global Wealth Management, and prior thereto, Senior Managing Director and Global Head of Client Service and Sales of the Adviser’s institutional investment management business since 2004. Prior thereto, he was Managing Director and Head of North American Client Service and Sales in the Adviser’s institutional investment management business with which he had been associated since prior to 2004. | 90 | None | |||||
| abfunds.com | AB TAX-AWARE REAL RETURN INCOME SHARES | 43 | |
MANAGEMENT OF THE FUND (continued)
| NAME, ADDRESS*, AGE AND (YEAR FIRST ELECTED**) | PRINCIPAL OCCUPATION(S), DURING PAST FIVE YEARS AND OTHER INFORMATION*** | PORTFOLIOS IN AB FUND COMPLEX OVERSEEN BY TRUSTEE | OTHER PUBLIC COMPANY DIRECTORSHIPS CURRENTLY HELD BY TRUSTEE | |||||
| INDEPENDENT TRUSTEES | ||||||||
| Marshall C. Turner, Jr.,## Chairman of the Board 78 (2005) | Private Investor since prior to 2015. Former Chairman and CEO of Dupont Photomasks, Inc. (components of semi-conductor manufacturing). He has extensive operating leadership, and venture capital investing experience, including five interim or full-time CEO roles, and prior service as general partner of institutional venture capital partnerships. He also has extensive non-profit board leadership experience, and currently serves on the boards of two education and science-related non-profit organizations. He has served as a director of one AB Fund since 1992, and director or trustee of all AB Funds since 2005. He has been Chairman of the AB Funds since January 2014, and the Chairman of the Independent Directors Committees of such AB Funds since February 2014. | 90 | Xilinx, Inc. (programmable logic semi-conductors) since 2007 | |||||
| 44 | AB TAX-AWARE REAL RETURN INCOME SHARES | abfunds.com | |
MANAGEMENT OF THE FUND (continued)
| NAME, ADDRESS*, AGE AND (YEAR FIRST ELECTED**) | PRINCIPAL OCCUPATION(S), DURING PAST FIVE YEARS AND OTHER INFORMATION*** | PORTFOLIOS IN AB FUND COMPLEX OVERSEEN BY TRUSTEE | OTHER PUBLIC COMPANY DIRECTORSHIPS CURRENTLY HELD BY TRUSTEE | |||||
INDEPENDENT TRUSTEES (continued) | ||||||||
Jorge A. Bermudez,## 69 (2020) | Private investor since prior to 2015. Former Chief Risk Officer of Citigroup, Inc., a global financial services company, from November 2007 to March 2008, Chief Executive Officer of Citigroup’s Commercial Business Group in North America and Citibank Texas from 2005 to 2007, and a variety of other executive and leadership roles at various businesses within Citigroup prior to then; Chairman (2018) of the Texas A&M Foundation Board of Trustees (Trustee since 2013) and Chairman of the Smart Grid Center Board at Texas A&M University since 2012; director of, among others, Citibank N.A. from 2005 to 2008, the Federal Reserve Bank of Dallas, Houston Branch from 2009 to 2011, the Federal Reserve Bank of Dallas from 2011 to 2017, and the Electric Reliability Council of Texas from 2010 to 2016. He has served as director or trustee of the AB Funds since January 2020. | 90 | Moody’s Corporation since April 2011 | |||||
Michael J. Downey,## (2005) | Private Investor since prior to 2015. Formerly, Chairman of The Asia Pacific Fund, Inc. (registered investment company) since prior to 2015 until January 2019. From 1987 until 1993, Chairman and CEO of Prudential Mutual Fund Management, director of the Prudential mutual funds, and member of the Executive Committee of Prudential Securities, Inc. He has served as a director or trustee of the AB Funds since 2005. | 90 | None | |||||
| abfunds.com | AB TAX-AWARE REAL RETURN INCOME SHARES | 45 | |
MANAGEMENT OF THE FUND (continued)
| NAME, ADDRESS*, AGE AND (YEAR FIRST ELECTED**) | PRINCIPAL OCCUPATION(S), DURING PAST FIVE YEARS AND OTHER INFORMATION*** | PORTFOLIOS IN AB FUND COMPLEX OVERSEEN BY TRUSTEE | OTHER PUBLIC COMPANY DIRECTORSHIPS CURRENTLY HELD BY TRUSTEE | |||||
INDEPENDENT TRUSTEES (continued) | ||||||||
| Nancy P. Jacklin,## 72 (2006) | Private Investor since prior to 2015. Professorial Lecturer at the Johns Hopkins School of Advanced International Studies (2008-2015). U.S. Executive Director of the International Monetary Fund (which is responsible for ensuring the stability of the international monetary system), (December 2002-May 2006); Partner, Clifford Chance (1992-2002); Sector Counsel, International Banking and Finance, and Associate General Counsel, Citicorp (1985-1992); Assistant General Counsel (International), Federal Reserve Board of Governors (1982-1985); and Attorney Advisor, U.S. Department of the Treasury (1973-1982). Member of the Bar of the District of Columbia and of New York; and member of the Council on Foreign Relations. She has served as a director or trustee of the AB Funds since 2006 and has been Chair of the Governance and Nominating Committees of the AB Funds since August 2014. | 90 | None | |||||
| Jeanette Loeb,## 68 (2020) | Chief Executive Officer of PetCareRx (e-commerce pet pharmacy) from 2002 to 2011 and 2015 to present. Director of New York City Center since 2005. She was a director of AB Multi-Manager Alternative Fund, Inc. (fund of hedge funds) from 2012 to 2018. Formerly, affiliated with Goldman Sachs Group, Inc. (financial services) from 1977 to 1994, including as a partner thereof from 1986 to 1994. She has served as a Director of the AB Funds since April 2020. | 90 | Apollo Investment Corp. (business development company) since August 2011 | |||||
| 46 | AB TAX-AWARE REAL RETURN INCOME SHARES | abfunds.com | |
MANAGEMENT OF THE FUND (continued)
| NAME, ADDRESS*, AGE AND (YEAR FIRST ELECTED**) | PRINCIPAL OCCUPATION(S), DURING PAST FIVE YEARS AND OTHER INFORMATION*** | PORTFOLIOS IN AB FUND COMPLEX OVERSEEN BY TRUSTEE | OTHER PUBLIC COMPANY DIRECTORSHIPS CURRENTLY HELD BY TRUSTEE | |||||
INDEPENDENT TRUSTEES (continued) | ||||||||
Carol C. McMullen,## 64 | Managing Director of Slalom Consulting (consulting) since 2014, private investor and member of the Advisory Board of Butcher Box (since 2018). Formerly, member, the Partners Healthcare Investment Committee (2010-2019); Director of Norfolk & Dedham Group (mutual property and casualty insurance) from 2011 until November 2016; Director of Partners Community Physicians Organization (healthcare) from 2014 until December 2016; and Managing Director of The Crossland Group (consulting) from 2012 until 2013. She has held a number of senior positions in the asset and wealth management industries, including at Eastern Bank (where her roles included President of Eastern Wealth Management), Thomson Financial (Global Head of Sales for Investment Management), and Putnam Investments (where her roles included Chief Investment Officer, Core and Growth and Head of Global Investment Research). She has served on a number of private company and non-profit boards, and as a director or trustee of the AB Funds since June 2016. | 90 | None | |||||
| abfunds.com | AB TAX-AWARE REAL RETURN INCOME SHARES | 47 | |
MANAGEMENT OF THE FUND (continued)
| NAME, ADDRESS*, AGE AND (YEAR FIRST ELECTED**) | PRINCIPAL OCCUPATION(S), DURING PAST FIVE YEARS AND OTHER INFORMATION*** | PORTFOLIOS IN AB FUND COMPLEX OVERSEEN BY TRUSTEE | OTHER PUBLIC COMPANY DIRECTORSHIPS CURRENTLY HELD BY TRUSTEE | |||||
INDEPENDENT TRUSTEES (continued) | ||||||||
Garry L. Moody,## (2008) | Private Investor since prior to 2015. Formerly, Partner, Deloitte & Touche LLP (1995-2008) where he held a number of senior positions, including Vice Chairman, and U.S. and Global Investment Management Practice Managing Partner; President, Fidelity Accounting and Custody Services Company (1993-1995), where he was responsible for accounting, pricing, custody and reporting for the Fidelity mutual funds; and Partner, Ernst & Young LLP (1975-1993), where he served as the National Director of Mutual Fund Tax Services and Managing Partner of its Chicago Office Tax department. He is a member of the Trustee Advisory Board of BoardIQ, a biweekly publication focused on issues and news affecting directors of mutual funds. He is also a member of the Investment Company Institute’s Board of Governors and the Independent Directors Council Governing Council. He has served as a director or trustee, and as Chairman of the Audit Committees, of the AB Funds since 2008. | 90 | None | |||||
| 48 | AB TAX-AWARE REAL RETURN INCOME SHARES | abfunds.com | |
MANAGEMENT OF THE FUND (continued)
| NAME, ADDRESS*, AGE AND (YEAR FIRST ELECTED**) | PRINCIPAL OCCUPATION(S), DURING PAST FIVE YEARS AND OTHER INFORMATION*** | PORTFOLIOS IN AB FUND COMPLEX OVERSEEN BY TRUSTEE | OTHER PUBLIC COMPANY DIRECTORSHIPS CURRENTLY HELD BY TRUSTEE | |||||
INDEPENDENT TRUSTEES (continued) | ||||||||
| Earl D. Weiner,## 80 (2007) | Senior Counsel since 2017, Of Counsel from 2007 to 2016, and Partner prior to then, of the law firm Sullivan & Cromwell LLP. He is a former member of the ABA Federal Regulation of Securities Committee Task Force to draft editions of the Fund Director’s Guidebook. He also serves as a director or trustee of various non-profit organizations and has served as Chairman or Vice Chairman of a number of them. He has served as a director or trustee of the AB Funds since 2007 and served as Chairman of the Governance and Nominating Committees of the AB Funds from 2007 until August 2014. | 90 | None | |||||
| * | The address for each of the Trust’s disinterested Trustees is c/o AllianceBernstein L.P., Attention: Legal and Compliance Department—Mutual Fund Legal, 1345 Avenue of the Americas, New York, NY 10105. |
| ** | There is no stated term of office for the Trust’s Trustees. |
| *** | The information above includes each Trustee’s principal occupation during the last five years and other information relating to the experience, attributes, and skills relevant to each Trustee’s qualifications to serve as a Trustee, which led to the conclusion that each Trustee should serve as a Trustee for the Trust. |
| # | Mr. Keith is an “interested person” of the Trust, as defined in the 1940 Act, due to his position as a Senior Vice President of the Adviser. |
| ## | Member of the Audit Committee, the Governance and Nominating Committee and the Independent Directors Committee. |
| abfunds.com | AB TAX-AWARE REAL RETURN INCOME SHARES | 49 | |
MANAGEMENT OF THE FUND (continued)
Officers
| NAME, ADDRESS* AND AGE | POSITION(S) HELD WITH FUND | PRINCIPAL OCCUPATION DURING PAST FIVE YEARS | ||
Robert M. Keith 60 | President and Chief Executive Officer | See biography above. | ||
R.B. “Guy” Davidson, III^ 59 | Vice President | Senior Vice President of the Adviser**, with which he has been associated since prior to 2015. He is also Chief Investment Officer – Municipal Business. | ||
Terrance T. Hults 54 | Vice President | Senior Vice President of the Adviser**, with which he has been associated since prior to 2015. He is also Co-Head – Municipal Portfolio Management. | ||
Matthew J. Norton 37 | Vice President | Senior Vice President of the Adviser**, with which he has been associated since prior to 2015. He is also Co-Head – Municipal Portfolio Management. | ||
Andrew D. Potter 35 | Vice President | Vice President of the Adviser**, with which he has been associated since prior to 2015. | ||
Emilie D. Wrapp 64 | Secretary | Senior Vice President, Assistant General Counsel and Assistant Secretary of ABI**, with which she has been associated since prior to 2015. | ||
Michael B. Reyes 43 | Senior Analyst | Vice President of the Adviser**, with which he has been associated since prior to 2015. | ||
Joseph J. Mantineo 61 | Treasurer and Chief Financial Officer | Senior Vice President of AllianceBernstein Investor Services, Inc. (“ABIS”)**, with which he has been associated since prior to 2015. | ||
Phyllis J. Clarke 59 | Controller | Vice President of ABIS**, with which she has been associated since prior to 2015. | ||
Vincent S. Noto 55 | Chief Compliance Officer | Senior Vice President since 2015 and Mutual Fund Chief Compliance Officer of the since prior to 2015. |
| * | The address for each of the Portfolio’s Officers is 1345 Avenue of the Americas, New York, NY 10105. |
| ** | The Adviser, ABI and ABIS are affiliates of the Trust. |
| ^ | Mr. Davidson is expected to retire from the Adviser effective December 30, 2020. |
The Trust’s Statement of Additional Information (“SAI”) has additional information about the Trust’s Trustees and Officers and is available without charge upon request. Contact your financial representative or ABI at (800)-227-4618, or visit www.abfunds.com, for a free prospectus or SAI.
| 50 | AB TAX-AWARE REAL RETURN INCOME SHARES | abfunds.com | |
Operation and Effectiveness of the Fund’s Liquidity Risk Management Program:
In October 2016, the Securities and Exchange Commission (“SEC”) adopted the open-end fund liquidity rule (the “Liquidity Rule”). In June 2018 the SEC adopted a requirement that funds disclose information about the operation and effectiveness of their Liquidity Risk Management Program (“LRMP”) in their reports to shareholders.
One of the requirements of the Liquidity Rule is for the Fund to designate an Administrator of the Fund’s Liquidity Risk Management Program. The Administrator of the Fund’s LRMP is AllianceBernstein L.P., the Fund’s investment adviser (the “Adviser”). The Adviser has delegated the responsibility to its Liquidity Risk Management Committee (the “Committee”). Another requirement of the Liquidity Rule is for the Fund’s Board of Directors (the “Fund Board”) to receive an annual written report from the Administrator of the LRMP, which addresses the operation of the Fund’s LRMP and assesses its adequacy and effectiveness. The Adviser provided the Fund’s Board with such annual report during the first quarter of 2020, which covered the period December 1, 2018 through December 31, 2019 (the “Program Reporting Period”).
The LRMP’s principal objectives include supporting the Fund’s compliance with limits on investments in illiquid assets and mitigating the risk that the Fund will be unable to meet its redemption obligations in a timely manner. Pursuant to the LRMP, the Fund classifies the liquidity of its portfolio investments into one of the four categories defined by the SEC: Highly Liquid, Moderately Liquid, Less Liquid, and Illiquid. These classifications are reported to the SEC on Form N-PORT.
During the Program Reporting Period, the Committee reviewed whether the Fund’s strategy is appropriate for an open-end structure, taking into account any holdings of less liquid and illiquid assets. The Committee also performed an analysis to determine whether the Fund is required to maintain a Highly Liquid Investment Minimum (“HLIM”). If the Fund participated in derivative transactions, the exposure from such transactions were considered in the LRMP. The Committee also incorporated the following information when determining the Fund’s reasonably anticipated trading size for purposes of liquidity monitoring: historical net redemption activity, a Fund’s concentration in an issuer, shareholder concentration, investment performance, total net assets, and distribution channels.
The Adviser informed the Fund Board that the Committee believes the Fund’s LRMP is adequately designed, has been implemented as intended, and has operated effectively since its inception. No material exceptions have been noted since the implementation of the LRMP, and there were no liquidity events that impacted the Fund or its ability to timely meet redemptions during the Program Reporting Period.
| abfunds.com | AB TAX-AWARE REAL RETURN INCOME SHARES | 51 | |
Information Regarding the Review and Approval of the Fund’s Advisory Agreement
The disinterested trustees (the “directors”) of AB Corporate Shares (the “Company”) unanimously approved the continuance of the Company’s Advisory Agreement with the Adviser in respect of AB Tax-Aware Real Return Income Shares (the “Fund”) at a meeting held on November 4-6, 2019 (the “Meeting”.)*
Prior to approval of the Advisory Agreement, the directors had requested from the Adviser, and received and evaluated, extensive materials. They reviewed the proposed continuance of the Advisory Agreement with the Adviser and with experienced counsel who are independent of the Adviser, who advised on the relevant legal standards. The directors also reviewed additional materials, including comparative analytical data prepared by the Senior Analyst for the Fund. The directors also discussed the proposed continuance in private sessions with counsel.
The directors noted that the Fund is designed as a vehicle for the wrap fee account market (where investors pay fees to a wrap fee sponsor which pays investment fees and expenses from such fee). The directors also noted that no advisory fee is payable by the Fund to the Adviser, that the Advisory Agreement does not include the reimbursement provision for certain administrative expenses included in the advisory agreements of most of the open-end AB Funds, and that the Adviser is responsible for payment of the Fund’s ordinary expenses. The directors noted that the Company acknowledges in the Advisory Agreement that the Adviser and its affiliates expect to receive compensation from third parties in connection with services provided to the Fund under the Advisory Agreement. The directors further noted that the Adviser would receive payments from the wrap fee program sponsors (the “Sponsors”) that use the Fund as an investment vehicle for their clients.
The directors considered their knowledge of the nature and quality of the services to be provided by the Adviser to the Fund gained from their experience as directors or trustees of most of the registered investment companies advised by the Adviser, their overall confidence in the Adviser’s integrity and competence they have gained from that experience, the Adviser’s initiative in identifying and raising potential issues with the directors and its responsiveness, frankness and attention to concerns raised by the directors in the past, including the Adviser’s willingness to consider and implement organizational and operational changes designed to improve investment results and the services provided to the AB Funds. The directors noted that they have four regular meetings each year, at each of which they review extensive materials and information from the Adviser, including information on the investment performance of the AB Funds.
| * | Following transactions completed on November 13, 2019 that may have been deemed to have been an “assignment” causing termination of the Fund’s investment advisory agreement, a new investment advisory agreement, having the same terms as the prior one, was entered into by the Fund and the Adviser. |
| 52 | AB TAX-AWARE REAL RETURN INCOME SHARES | abfunds.com | |
The directors also considered all factors they believed relevant, including the specific matters discussed below. During the course of their deliberations, the directors evaluated, among other things, the reasonableness of the advisory fee. The directors did not identify any particular information that was all-important or controlling, and different directors may have attributed different weights to the various factors. The directors determined that the selection of the Adviser to manage the Fund and the overall arrangements between the Fund and the Adviser, as provided in the Advisory Agreement, including the advisory fee, were fair and reasonable in light of the services to be performed, expenses to be incurred and such other matters as the directors considered relevant in the exercise of their business judgment. The material factors and conclusions that formed the basis for the directors’ determinations included the following:
Nature, Extent and Quality of Services To Be Provided
The directors considered the scope and quality of services to be provided by the Adviser under the Advisory Agreement, including the quality of the investment research capabilities of the Adviser and the other resources it has dedicated to performing services for the AB Funds. They also noted the professional experience and qualifications of the Fund’s portfolio management team and other senior personnel of the Adviser. The quality of administrative and other services, including the Adviser’s role in coordinating the activities of the Fund’s other service providers, also was considered. The directors concluded that, overall, they were satisfied with the nature, extent and quality of services to be provided to the Fund under the Advisory Agreement.
Costs of Services To Be Provided and Profitability
Because the Fund had not yet commenced operations, the directors were unable to consider historical information about the profitability of the Fund. However, the Adviser agreed to provide the directors with profitability information in connection with future proposed continuances of the Advisory Agreement. They also considered the costs to be borne by the Adviser in providing services to the Fund and that the Fund was unlikely to be profitable to the Adviser unless it achieves a material level of net assets.
Fall-Out Benefits
The directors considered the other benefits to the Adviser and its affiliates from their relationships with the Fund. The directors noted that the Adviser would be compensated by the Sponsors. The directors understood that the Adviser also might derive reputational and other benefits from its association with the Fund.
Investment Results
Since the Fund had not yet commenced operations, no performance or other historical information for the Fund was available. The Adviser
| abfunds.com | AB TAX-AWARE REAL RETURN INCOME SHARES | 53 | |
manages another fund with an investment strategy similar to that proposed for the Fund, and, at the Meeting, the directors reviewed performance information for that fund.
Advisory Fees
The directors considered the advisory fee rate payable by the Fund to the Adviser (zero) and reviewed information prepared by an analytical service that is not affiliated with the Adviser showing the advisory fees payable by other funds in the same category as the Fund. The directors recognized that it is difficult to make comparisons of advisory fees because there are variations in the services that are included in the fees paid by other funds.
The directors noted the unusual arrangements in the Advisory Agreement providing for no advisory fee but were cognizant that the Adviser would be indirectly compensated by the Sponsors for its services to the Fund. While the Adviser’s fee arrangements with the Sponsors would vary, the directors acknowledged the Adviser’s view that a portion of such fees (less the expenses of the Fund to be paid by the Adviser) may reasonably be viewed as compensating the Adviser for advisory services it would provide to the Fund (the “implied fee”) and that the Adviser believes that while the Sponsors would pay the Adviser different fee rates, the rate of fee attributable to Fund management at the Fund level would be the same for all Sponsors. The directors also considered the fee rate schedules used by other registered investment companies that invest in fixed income securities that are advised by the Adviser.
The Adviser informed the directors that there were no institutional products managed by it that utilize investment strategies similar to those proposed for the Fund.
Since the Fund would not bear ordinary expenses, the directors did not consider comparative expense information.
Economies of Scale
Since the Advisory Agreement does not provide for any compensation to be paid to the Adviser by the Fund and the Fund’s expense ratio would be zero, the directors did not consider the extent to which fee levels in the Advisory Agreement reflect economies of scale.
| 54 | AB TAX-AWARE REAL RETURN INCOME SHARES | abfunds.com | |
This page is not part of the Shareholder Report or the Financial Statements.
AB FAMILY OF FUNDS
US EQUITY
CORE
Core Opportunities Fund
FlexFee™ US Thematic Portfolio
Select US Equity Portfolio
GROWTH
Concentrated Growth Fund
Discovery Growth Fund
FlexFee™ Large Cap Growth Portfolio
Growth Fund
Large Cap Growth Fund
Small Cap Growth Portfolio
VALUE
Discovery Value Fund
Equity Income Fund
Relative Value Fund
Small Cap Value Portfolio
Value Fund
INTERNATIONAL/ GLOBAL EQUITY
CORE
FlexFee™ International Strategic Core Portfolio
Global Core Equity Portfolio
International Portfolio
International Strategic Core Portfolio
Sustainable Global Thematic Fund
Tax-Managed International Portfolio
Tax-Managed Wealth Appreciation Strategy
Wealth Appreciation Strategy
INTERNATIONAL/ GLOBAL EQUITY (continued)
GROWTH
Concentrated International Growth Portfolio
FlexFee™ Emerging Markets Growth Portfolio
Sustainable International Thematic Fund
VALUE
All China Equity Portfolio
International Value Fund
FIXED INCOME
MUNICIPAL
High Income Municipal Portfolio
Intermediate California Municipal Portfolio
Intermediate Diversified Municipal Portfolio
Intermediate New York Municipal Portfolio
Municipal Bond Inflation Strategy
Tax-Aware Fixed Income Opportunities Portfolio1
National Portfolio
Arizona Portfolio
California Portfolio
Massachusetts Portfolio
Minnesota Portfolio
New Jersey Portfolio
New York Portfolio
Ohio Portfolio
Pennsylvania Portfolio
Virginia Portfolio
FIXED INCOME (continued)
TAXABLE
Bond Inflation Strategy
FlexFee™ High Yield Portfolio
FlexFee™ International Bond Portfolio
Global Bond Fund
High Income Fund
Income Fund
Intermediate Duration Portfolio
Limited Duration High Income Portfolio
Short Duration Income Portfolio
Short Duration Portfolio
Total Return Bond Portfolio1
ALTERNATIVES
All Market Real Return Portfolio
Global Real Estate Investment Fund
Select US Long/Short Portfolio
Unconstrained Bond Fund
MULTI-ASSET
All Market Income Portfolio
All Market Total Return Portfolio
Conservative Wealth Strategy
Emerging Markets Multi-Asset Portfolio
Global Risk Allocation Fund
Tax-Managed All Market Income Portfolio
CLOSED-END FUNDS
AllianceBernstein Global High Income Fund
AllianceBernstein National Municipal Income Fund
We also offer Government Money Market Portfolio, which serves as the money market fund exchange vehicle for the AB mutual funds. You could lose money by investing in the Fund. Although the Fund seeks to preserve the value of your investment at $1.00 per share, it cannot guarantee it will do so. The Fund may impose a fee upon sale of your shares or may temporarily suspend your ability to sell shares if the Fund’s liquidity falls below required minimums because of market conditions or other factors. An investment in the Fund is not insured or guaranteed by the Federal Deposit Insurance Corporation or any other government agency. The Fund’s sponsor has no legal obligation to provide financial support to the Fund, and you should not expect that the sponsor will provide financial support to the Fund at any time.
Investors should consider the investment objectives, risks, charges and expenses of the Fund carefully before investing. For copies of our prospectus or summary prospectus, which contain this and other information, visit us online at www.abfunds.com or contact your AB representative. Please read the prospectus and/or summary prospectus carefully before investing.
| 1 | Prior to July 12, 2019, Total Return Bond Portfolio was named Intermediate Bond Portfolio; prior to February 5, 2020, Tax-Aware Fixed Income Opportunities Portfolio was named Tax-Aware Fixed Income Portfolio. |
| abfunds.com | AB TAX-AWARE REAL RETURN INCOME SHARES | 55 | |
NOTES
| 56 | AB TAX-AWARE REAL RETURN INCOME SHARES | abfunds.com | |
NOTES
| abfunds.com | AB TAX-AWARE REAL RETURN INCOME SHARES | 57 | |
NOTES
| 58 | AB TAX-AWARE REAL RETURN INCOME SHARES | abfunds.com | |
NOTES
| abfunds.com | AB TAX-AWARE REAL RETURN INCOME SHARES | 59 | |
NOTES
| 60 | AB TAX-AWARE REAL RETURN INCOME SHARES | abfunds.com | |
AB TAX-AWARE REAL RETURN INCOME SHARES
1345 Avenue of the Americas
New York, NY 10105
800 221 5672
TARRIS-0151-0420 
| ITEM 2. | CODE OF ETHICS. |
(a) The registrant has adopted a code of ethics that applies to its principal executive officer, principal financial officer and principal accounting officer. A copy of the registrant’s code of ethics is filed herewith as Exhibit 12(a)(1).
(b) During the period covered by this report, no material amendments were made to the provisions of the code of ethics adopted in 2(a) above.
(c) During the period covered by this report, no implicit or explicit waivers to the provisions of the code of ethics adopted in 2(a) above were granted.
ITEM 3. AUDIT COMMITTEE FINANCIAL EXPERT.
The registrant’s Board of Directors has determined that independent directors Garry L. Moody and Marshall C. Turner, Jr. qualify as audit committee financial experts.
ITEM 4. PRINCIPAL ACCOUNTANT FEES AND SERVICES.
(a) - (c) The following table sets forth the aggregate fees billed* by the independent registered public accounting firm Ernst & Young LLP, for the Fund’s last two fiscal years, for professional services rendered for: (i) the audit of the Fund’s annual financial statements included in the Fund’s annual report to stockholders; (ii) assurance and related services that are reasonably related to the performance of the audit of the Fund’s financial statements and are not reported under (i), which include advice and education related to accounting and auditing issues, quarterly press release review (for those Funds that issue quarterly press releases), and preferred stock maintenance testing (for those Funds that issue preferred stock); and (iii) tax compliance, tax advice and tax return preparation.
| Audit Fees | Audit-Related Fees | Tax Fees | ||||||||||||||
AB Corp Income Shares | 2019 | $ | 32,537 | $ | — | $ | 24,243 | |||||||||
| 2020 | $ | 32,537 | $ | — | $ | 21,140 | ||||||||||
AB Taxable Multi-Sector Income Shares | 2019 | $ | 36,041 | $ | — | $ | 23,758 | |||||||||
| 2020 | $ | 36,041 | $ | — | $ | 20,463 | ||||||||||
AB Municipal Income Shares | 2019 | $ | 45,353 | $ | — | $ | 26,166 | |||||||||
| 2020 | $ | 45,353 | $ | — | $ | 21,061 | ||||||||||
AB Impact Municipal Income Shares | 2019 | $ | 29,731 | $ | — | $ | 22,320 | |||||||||
| 2020 | $ | 29,731 | $ | — | $ | 21,518 | ||||||||||
AB Tax-Aware Real Return Income Shares | 2019 | N/A | N/A | N/A | ||||||||||||
| 2020 | $ | 22,500 | $ | — | $ | 12,272 | ||||||||||
| * | The Fund’s Adviser absorbs all ordinary Fund expenses, including the Fund’s audit fees, audit-related fees and tax fees. |
(d) Not applicable.
(e) (1) Beginning with audit and non-audit service contracts entered into on or after May 6, 2003, the Fund’s Audit Committee policies and procedures require the pre-approval of all audit and non-audit services provided to the Fund by the Fund’s independent registered public accounting firm. The Fund’s Audit Committee policies and procedures also require pre-approval of all audit and non-audit services provided to the Adviser and Service Affiliates to the extent that these services are directly related to the operations or financial reporting of the Fund.
(e) (2) All of the amounts for Audit Fees, Audit-Related Fees and Tax Fees in the table under Item 4 (a) – (c) are for services pre-approved by the Fund’s Audit Committee.
(f) Not applicable.
(g) The following table sets forth the aggregate non-audit services provided to the Fund, the Fund’s Adviser and entities that control, are controlled by or under common control with the Adviser that provide ongoing services to the Fund (“Service Affiliates”):
Total Amount of Pre-approved by the | ||||||||||||
| All Fees for Non- Audit Services Provided to the Portfolio, the Adviser and Service Affiliates | Audit Committee (Portion Comprised of Audit Related Fees) (Portion Comprised of Tax Fees) | |||||||||||
AB Corp Income Shares | 2019 | $ | 415,236 | $ | 24,243 | |||||||
| $ | — | |||||||||||
| $ | (24,243 | ) | ||||||||||
| 2020 | $ | 975,431 | $ | 21,140 | ||||||||
| $ | — | |||||||||||
| $ | (21,140 | ) | ||||||||||
AB Taxable Multi-Sector Income Shares | 2019 | $ | 414,751 | $ | 23,758 | |||||||
| $ | — | |||||||||||
| $ | (23,758 | ) | ||||||||||
| 2020 | $ | 974,754 | $ | 20,463 | ||||||||
| $ | — | |||||||||||
| $ | (20,463 | ) | ||||||||||
AB Municipal Income Shares | 2019 | $ | 417,159 | $ | 26,166 | |||||||
| $ | — | |||||||||||
| $ | (26,166 | ) | ||||||||||
| 2020 | $ | 975,352 | $ | 21,061 | ||||||||
| $ | — | |||||||||||
| $ | (21,061 | ) | ||||||||||
AB Impact Municipal Income Shares | 2019 | $ | 413,313 | $ | 22,320 | |||||||
| $ | — | |||||||||||
| $ | (22,320 | ) | ||||||||||
| 2020 | $ | 975,809 | $ | 21,518 | ||||||||
| $ | — | |||||||||||
| $ | (21,518 | ) | ||||||||||
AB Tax-Aware Real Return Income Shares | 2019 | N/A | N/A | |||||||||
| $ | — | |||||||||||
| N/A | ||||||||||||
| 2020 | $ | 966,563 | $ | 12,272 | ||||||||
| $ | — | |||||||||||
| $ | (12,272 | ) | ||||||||||
(h) The Audit Committee of the Fund has considered whether the provision of any non-audit services not pre-approved by the Audit Committee provided by the Fund’s independent registered public accounting firm to the Adviser and Service Affiliates is compatible with maintaining the auditor’s independence.
ITEM 5. AUDIT COMMITTEE OF LISTED REGISTRANTS.
Not applicable to the registrant.
ITEM 6. INVESTMENTS.
Please see Schedule of Investments contained in the Report to Shareholders included under Item 1 of this Form N-CSR.
ITEM 7. DISCLOSURE OF PROXY VOTING POLICIES AND PROCEDURES FOR CLOSED-END MANAGEMENT INVESTMENT COMPANIES.
Not applicable to the registrant.
ITEM 8. PORTFOLIO MANAGERS OF CLOSED-END MANAGEMENT INVESTMENT COMPANIES.
Not applicable to the registrant.
ITEM 9. PURCHASES OF EQUITY SECURITIES BY CLOSED-END MANAGEMENT INVESTMENT COMPANY AND AFFILIATED PURCHASERS.
Not applicable to the registrant.
ITEM 10. SUBMISSION OF MATTERS TO A VOTE OF SECURITY HOLDERS.
There have been no material changes to the procedures by which shareholders may recommend nominees to the Fund’s Board of Directors since the Fund last provided disclosure in response to this item.
ITEM 11. CONTROLS AND PROCEDURES.
(a) The registrant’s principal executive officer and principal financial officer have concluded that the registrant’s disclosure controls and procedures (as defined in Rule 30a-3 (c) under the Investment Company Act of 1940, as amended) are effective at the reasonable assurance level based on their evaluation of these controls and procedures as of a date within 90 days of the filing date of this document.
(b) There were no significant changes in the registrant’s internal controls over financial reporting during the second fiscal quarter of the period that could significantly affect these controls subsequent to the date of their evaluation, including any corrective actions with regard to significant deficiencies and material weaknesses.
ITEM 12. DISCLOSURE OF SECURITIES LENDING ACTIVITIES FOR CLOSED-END MANAGEMENT INVESTMENT COMPANIES.
Not applicable to the registrant.
| ITEM 13. | EXHIBITS |
The following exhibits are attached to this Form N-CSR:
SIGNATURES
Pursuant to the requirements of the Securities Exchange Act of 1934 and the Investment Company Act of 1940, the registrant has duly caused this report to be signed on its behalf by the undersigned, thereunto duly authorized.
| (Registrant): AB Corporate Shares | ||
| By: | /s/ Robert M. Keith | |
| Robert M. Keith | ||
| President | ||
| Date: June 29, 2020 | ||
Pursuant to the requirements of the Securities Exchange Act of 1934 and the Investment Company Act of 1940, this report has been signed below by the following persons on behalf of the registrant and in the capacities and on the dates indicated.
| By: | /s/ Robert M. Keith | |
| Robert M. Keith | ||
| President | ||
| Date: June 29, 2020 | ||
| By: | /s/ Joseph J. Mantineo | |
| Joseph J. Mantineo | ||
| Treasurer and Chief Financial Officer | ||
| Date: June 29, 2020 | ||