UNITED STATES
SECURITIES AND EXCHANGE COMMISSION
Washington, D.C. 20549
FORM N-CSR
CERTIFIED SHAREHOLDER REPORT OF REGISTERED
MANAGEMENT INVESTMENT COMPANIES
Investment Company Act file number 811-21482
SunAmerica Specialty Series
(Exact name of registrant as specified in charter)
Harborside 5, 185 Hudson Street, Jersey City, NJ 07311
(Address of principal executive offices) (Zip code)
John T. Genoy
Senior Vice President
SunAmerica Asset Management, LLC
Harborside 5,
185 Hudson Street,
Jersey City, NJ 07311
(Name and address of agent for service)
Registrant’s telephone number, including area code: (201) 324-6414
Date of fiscal year end: October 31
Date of reporting period: October 31, 2020
| Item 1. | Reports to Stockholders |
2020 ANNUAL REPORT
SunAmerica Specialty Series

Beginning on January 1, 2021, as permitted by regulations adopted by the Securities and Exchange Commission, paper copies of each Fund’s shareholder reports will no longer be sent by mail, unless you specifically request paper copies of the reports from the Fund or your financial intermediary. Instead, the reports will be made available on a website, and you will be notified by mail each time a report is posted and provided with a website link to access the report.
If you already elected to receive shareholder reports electronically, you will not be affected by this change and you need not take any action. At any time, you may elect to receive reports and other communications from a Fund electronically by calling 800-858-8850 or contacting your financial intermediary directly.
You may elect to receive all future reports in paper free of charge. If your account is held directly at the Fund, you can inform the Fund that you wish to receive paper copies of reports by calling 800-858-8850. If your account is held through a financial intermediary, please contact the financial intermediary to make this election. Your election to receive paper will apply to all AIG Funds in which you are invested and may apply to all funds held with your financial intermediary.

Table of Contents
A Message from the President — (unaudited)
Dear Shareholders:
All of us at AIG and SunAmerica Asset Management, along with our Fund subadvisers hope this annual report finds you and yours safe and well during these challenging times.
As the COVID-19 pandemic continues to evolve, know that we remain focused on serving our Fund shareholders. As such, we are pleased to present this annual update for SunAmerica Specialty Series (the “Specialty Series”), including AIG Commodity Strategy Fund, AIG ESG Dividend Fund, AIG Focused Alpha Large-Cap Fund, AIG Focused Growth Fund, AIG Income Explorer Fund and AIG Small-Cap Fund (the “Funds”), covering the 12-month period ended October 31, 2020.
Overall, global bonds and global equities advanced, while commodities generated negative returns. Virtually all asset classes saw volatility surge during the annual period.
Global equities rose as the annual period began in November 2019. In our view, waning recession fears and forecasts for improving global economic growth in 2020 helped bolster investor sentiment, while geopolitics and trade disputes, especially between the U.S. and China, persisted as major drivers of market volatility. In December 2019, the U.S. Administration announced that a “Phase One” trade deal with China had been agreed to in principle, providing significant relief to global markets. U.S. equities were further supported by accommodative U.S. Federal Reserve (“Fed”) policy. The Fed had lowered interest rates by 25 basis points† in October 2019, its third interest rate cut of the calendar year, but then left rates unchanged for the remainder of the fourth quarter.
Most global equity markets continued to advance as 2020 began, with U.S. equities achieving record highs in February. However, as COVID-19 spread rapidly across the globe, it caused unprecedented disruption to financial markets and economies and soured trade deal optimism between the U.S. and China. Thus, global equities ended the first quarter of 2020 significantly lower. Exacerbating matters was the plunging of the price of oil to its lowest level since 2002, as the world’s largest oil producers failed to agree on reducing output as demand collapsed. Most central banks and governments took extraordinary measures in an effort to limit financial market stress, mitigate the economic fallout and cushion household and business income. The U.S. Fed cut the targeted federal funds rate to near zero and increased the scope of its asset purchase program. Many other developed market central banks also added accommodation, while several emerging market central banks embarked on quantitative easing for the first time. On the fiscal front, the U.S. government enacted a $2 trillion relief bill, unleashing a massive stimulus plan to stem economic damage. For the quarter, U.S. equities, as represented by the S&P 500 Index*, suffered its fastest-ever decline into a bear market but surged to its best weekly gain in 11 years at the end of the March 2020 on Fed and U.S. government emergency stimulus action. Still, the late surge was not enough to pull the U.S. equity market out of significant losses for the quarter.
Then, in yet another sharp reversal, global equities saw their best quarterly return since December 1999 in the second quarter of 2020 and continued to rise during the third quarter of 2020. Markets were fueled by optimism around successful early-stage trials for a potential COVID-19 vaccine, ongoing fiscal and monetary stimulus and signs global economic activity was improving. As new COVID-19 cases declined in most countries, governments shifted their focus toward gradually lifting lockdown restrictions, even as new cases rose significantly in some areas of the U.S. and as India and much of Latin America struggled to bring the coronavirus under control. Also, oil prices rebounded as the global economy appeared to begin to recover. In the second calendar quarter, U.S. equities rallied to their largest quarterly gain since the fourth quarter of 1998, even as the National Bureau of Economic Research declared in June that a U.S. economic recession had officially begun in February 2020. U.S. equities extended their strong rally in the third calendar quarter, buoyed by better than consensus expected corporate earnings. Still, volatility remained high, as the U.S. grappled with political uncertainty ahead of the November presidential election and the lack of additional fiscal stimulus.
The roller coaster continued, as global equity markets, including the U.S. equity market, then fell in October 2020. Corporate earnings results for many companies that reported in October came in above consensus expectations. However, expectations had been
A Message from the President — (unaudited) (continued)
heightened by reports the U.S. economy had grown robustly in the third calendar quarter as businesses resumed activity postponed or restricted by COVID-19. Also, political uncertainty surrounding U.S. elections and spikes in COVID-19 positivity, hospitalization and mortality rates in the U.S. and around the world proved sources of volatility.
The broad global fixed income market posted a positive return for the annual period overall. Despite accommodative central bank policies, government bond yields increased across most markets in the last months of 2019, as global activity indicators stabilized and trade negotiations seemed to progress. Government bond yields in several developed markets, including the U.S., then fell to record lows in the first quarter of 2020, as the COVID-19 pandemic sparked fears of a global economic recession and major central banks engaged in an aggressive easing cycle. Most global government bond yields remained largely range-bound near record lows across most developed markets in the second quarter of 2020, supported by extremely accommodative central bank purchase programs. In the last four months of the annual period, yield curves steepened, led by increases in yields on longer-term maturities in several developed markets, while most other government bond yields generally drifted lower. The Fed extended its emergency liquidity provisions through the end of 2020 and unveiled a new inflation policy framework that will allow inflation to modestly exceed 2% without a hawkish†† policy response. This low-for-longer and inflation tolerance policy stance by the Fed prompted the sell-off in longer-dated securities, while strong demand for government bonds as a perceived “safe haven” kept short-to-intermediate-term yields low. In October, the 10-year U.S. Treasury yield rose, which seemed to reflect rising hopes of economic stimulus, and credit sectors and securitized sectors outperformed duration-equivalent government bonds. Most non-government bond sectors underperformed the broad fixed income market for the annual period overall, but still posted positive absolute returns. The primary exceptions were investment grade corporate bonds and Treasury inflation protected securities, which performed especially strongly during the annual period.
Commodities were challenged during the annual period overall. At the end of 2019, commodities gained across all four sectors. However, in the first quarter of 2020, commodities faced severe headwinds, led down by the energy sector, as oil prices fell sharply after an OPEC+††† agreement to curtail production disintegrated. Only precious metals gained, supported by an increase in gold prices, as investors flocked to what were perceived as “safe haven” assets. In the second and third quarters of 2020, commodities broadly advanced. Energy prices rose, supported by an improving global demand outlook as economies gradually began to reopen. Industrial metals rose as mine closures caused supply disruptions. Precious metals lifted despite the gradual reopening of economies, with gold prices closing above $1,800 per ounce for the first time in more than eight years, as low interest rates and a resurgence of COVID-19 cases increased demand. Commodities ended the month of October lower, with energy once again the weakest performing sector, as it was for the annual period overall. Agriculture and livestock also declined for the annual period as whole, while precious metals and industrial metals rose.
During the annual period overall, developed market equities, as measured by the 4.36% return of the MSCI World Index*, underperformed emerging market equities, as measured by the 8.25% return of the MSCI Emerging Markets Index*. Among the developed markets, U.S. equities, as measured by the 9.71% return of the S&P 500 Index*, significantly outperformed non-U.S. equities, as measured by the -6.86% return of the MSCI EAFE Index*. Within the U.S. equity market, large-cap stocks performed best, followed at some distance by mid-cap stocks. Small-cap stocks posted a modest negative return during the annual period. Growth stocks significantly outpaced valued stocks across the capitalization spectrum. U.S. bonds, as presented by the Bloomberg Barclays U.S. Aggregate Bond Index*, and global bonds, as represented by the Bloomberg Barclays Global Aggregate Bond Index*, posted returns of 6.19% and 5.63%, respectively, for the annual period overall. The Bloomberg Barclays U.S. Treasury Index*, returned 6.95%, while international government bonds, as represented by the FTSE Non-U.S. WGBI (USD, hedged)*, returned 3.06%. Commodities, as represented by the Bloomberg Commodity Index*, returned -8.75% for the same annual period.
On the following pages, you will find the financial statements and portfolio information for each of the Specialty Series Funds for the annual period ended October 31, 2020. You will also find a comprehensive review of the portfolios’ performance and management strategies over the same annual period.
Thank you for being a part of the Specialty Series Funds. We value your ongoing confidence in us and look forward to serving your investment needs in the future. As always, if you have any questions regarding your investments, please contact your financial professional or get in touch with us directly at 800-858-8850 or via our website at www.aig.com/funds.
A Message from the President — (unaudited) (continued)
Sincerely,

Sharon French
President & CEO
SunAmerica Asset Management, LLC
Past performance is no guarantee of future results. Diversification and asset allocation do not guarantee a profit nor protect against a loss.
| * | | The MSCI World Index is a free float-adjusted market capitalization-weighted index that is designed to measure the equity market performance of 23 developed markets. The MSCI Emerging Markets Index is a free float-adjusted market capitalization index that is designed to measure equity market performance of 26 emerging markets. The S&P 500 Index is an unmanaged, weighted index of 500 large company stocks that is widely recognized as representative of the performance of the U.S. stock market. The MSCI EAFE (Europe, Australasia, Far East) Index is a free float-adjusted market capitalization index that is designed to measure the equity market performance of 21 developed markets, excluding the U.S. and Canada. The Bloomberg Barclays U.S. Aggregate Bond Index represented securities that are U.S. domestic, taxable and dollar denominated. The index covers components for government and corporate securities, mortgage pass-through securities and asset-backed securities. The Bloomberg Barclays Global Aggregate Bond Index provides a broad-based measure of the global investment-grade fixed income markets. The Bloomberg Barclays U.S. Treasury Index measures U.S. dollar-denominated, fixed-rate, nominal debt issued by the U.S. Treasury. The FTSE WGBI (World Government Bond Index) (USD, hedged) is a market capitalization-weighted bond index consisting of the government bond markets of more than 20 countries, including all fixed-rate bonds with a remaining maturity of one year or longer and with amounts outstanding of at least the equivalent of US$50 billion. The Bloomberg Commodity Index is a broadly diversified index made up of 23 exchange-traded futures on physical commodities weighted to account for economic significance and market liquidity. Indices are not managed and an investor cannot invest directly into an index. |
| † | | A basis point is 1/100th of a percentage point. |
| †† | | Hawkish language tends to suggest higher interest rates; opposite of dovish. |
| ††† | | OPEC+ is composed of the Organization of the Petroleum Exporting Countries (OPEC) and non-OPEC oil-producing countries, most notably Russia. |
The AIG Commodity Strategy Fund is not a complete investment program and should not be an investor’s sole investment because its performance is linked to the performance of highly volatile commodities. Investors should consider buying shares of the AIG Commodity Strategy Fund only as part of an overall portfolio strategy that includes other asset classes, such as fixed income and equity investments. Investors in the AIG Commodity Strategy Fund should be willing to assume greater risks of potentially significant short-term share price fluctuation because of the AIG Commodity Strategy Fund’s investments in commodity-linked derivative instruments.
The risks associated with the use of futures contracts by the AIG Commodity Strategy Fund include the risk that: (i) changes in the price of a futures contract may not always track the changes in market value of the underlying reference assets; (ii) trading restrictions or limitations may be imposed by an exchange, and government regulations may restrict trading in futures contracts; and (iii) if the Fund has insufficient cash to meet margin requirements, the Fund may need to sell other investments, including at disadvantageous times. Forwards are not exchange-traded and therefore no clearing house or exchange stands ready to meet the obligations of the contracts. Thus, the Fund faces the risk that its counterparties may not perform their obligations. Investments that provide exposure to foreign markets involve special risks, such as currency fluctuations, differing financial reporting and regulatory standards, and economic and political instability. These risks are highlighted when the issuer is in an emerging market. Fixed income securities and currency and fixed income futures are subject to changes in their value when prevailing interest rates change. Adverse changes in currency exchange rates (relative to the U.S. dollar) may erode or reverse any potential gains from futures instruments that are tied to foreign instruments or currencies. The Fund also has exposure to the commodities markets, which may subject it to greater volatility than investments in traditional securities. The AIG Commodity Strategy Fund expects to invest a significant portion of its assets in repurchase agreements collateralized by the U.S. government and its agencies and may also invest in other high quality, short-term securities (“money market instruments”). The primary purpose of the repurchase agreements and other money market instruments held by the Fund will be to serve as collateral for the futures instruments. The Fund’s investments in repurchase agreements involve certain risks involving the default or insolvency of the seller and counterparty risk (i.e., the risk that the counterparty will not perform its obligations). The Fund’s returns are expected to be derived principally from changes in the value of the assets underlying the futures instruments held by the Fund. Active trading of the Fund’s portfolio may result in high portfolio turnover and correspondingly greater brokerage commissions and other transaction costs, which will be borne directly by the Fund and which will affect the Fund’s performance. Active trading may also result in increased tax liability for Fund shareholders. Investors should note that the ability of the subadviser to successfully implement the Fund’s strategies, including the proprietary investment processes used by the subadviser, will influence the performance of the Fund significantly.
Focused funds are less diversified than typical mutual funds; therefore, the performance of each holding in a focused fund has a greater impact upon the overall portfolio, which increases risk. Stocks of small-cap and mid-cap companies are generally more volatile than and not as readily marketable as those of larger companies and may have fewer resources and a greater risk of business failure than do large companies.
SunAmerica Specialty Series
EXPENSE EXAMPLE — October 31, 2020 — (unaudited)
Disclosure of Fund Expenses in Shareholder Reports
As a shareholder of a Fund (each a “Fund” and collectively, the “Funds”) in the SunAmerica Specialty Series (the “Trust”), you may incur two types of costs: (1) transaction costs, including applicable sales charges (loads) on purchase payments and contingent deferred sales charges and (2) ongoing costs, including management fees; distribution and account maintenance fees; and other Fund expenses. This Example is intended to help you understand your ongoing costs (in dollars) of investing in the Funds and to compare these costs with the ongoing costs of investing in other mutual funds. The Example is based on an investment of $1,000 invested at May 1, 2020 and held until October 31, 2020.
Actual Expenses
The “Actual” section of the table provides information about your actual account values and actual expenses. You may use the information in these columns, together with the amount you invested, to estimate the expenses that you paid over the period. Simply divide your account value by $1,000 (for example, an $8,600 account value divided by $1,000 = 8.6), then multiply the result by the number in the column under the heading entitled “Expenses Paid During the Six Months Ended October 31, 2020” to estimate the expenses you paid on your account during this period. For shareholder accounts in classes other than Class W, the “Expenses Paid During the Six Months Ended October 31, 2020” column and the “Annualized Expense Ratio” column do not include small account fees that may be charged if your account balance is below $500 ($250 for retirement plan accounts). In addition, the “Expenses Paid During the Six Months Ended October 31, 2020” column and the “Annualized Expense Ratio” column do not include administrative or other fees that may apply to qualified retirement plan accounts and accounts held through financial institutions. See the Funds’ prospectuses, your retirement plan document and/or materials from your financial advisers for a full description of these fees. Had these fees been included, the “Expenses Paid During the Six Months Ended October 31, 2020” column would have been higher and the “Ending Account Value” column would have been lower.
Hypothetical Example for Comparison Purposes
The “Hypothetical” section of the table provides information about hypothetical account values and hypothetical expenses based on each Fund's actual expense ratio and an annual rate of return of 5% before expenses, which is not the Fund's actual return. The hypothetical account values and expenses may not be used to estimate the actual ending account balance or expenses you paid for the period. You may use this information to compare the ongoing costs of investing in the Funds and other funds. To do so, compare this 5% hypothetical example with the 5% hypothetical examples that appear in the shareholder reports of other funds. For shareholder accounts in classes other than Class W, the “Expenses Paid During the Six Months Ended October 31, 2020” column and the “Annualized Expense Ratio” column do not include small account fees that may be charged if your account balance is below $500 ($250 for retirement plan accounts). In addition, the “Expenses Paid During the Six Months Ended October 31, 2020” column and the “Annualized Expense Ratio” column do not include administrative or other fees that may apply to qualified retirement plan accounts and accounts held through financial institutions. See the Funds’ prospectuses, your retirement plan document and/or materials from your financial advisers for a full description of these fees. Had these fees been included, the “Expenses Paid During the Six Months Ended October 31, 2020” column would have been higher and the “Ending Account Value” column would have been lower.
Please note that the expenses shown in the table are meant to highlight your ongoing costs only and do not reflect any transaction costs, including sales charges on purchase payments, contingent deferred sales charges; small account fees and administrative fees, if applicable, to your account. Please refer to the Funds’ prospectus, your retirement plan document and/or materials from your financial adviser, for more information. Therefore, the “Hypothetical” example is useful in comparing ongoing costs only, and will not help you determine the relative total costs of owning different funds. In addition, if these transactional costs and other fees were included, your costs would have been higher.
SunAmerica Specialty Series
EXPENSE EXAMPLE — October 31, 2020 — (unaudited) (continued)
| | | | | | | | | | | | | | | | | | | | | | | | | | | | |
| | | Actual
| | | Hypothetical
| |
| | | Beginning
Account Value
at May 1,
2020
| | | Ending Account
Value Using
Actual Return at
October 31,
2020
| | | Expenses Paid
During the
Six Months Ended
October 31,
2020*
| | | Beginning
Account Value
at May 1,
2020
| | | Ending Account
Value Using a
Hypothetical 5%
Annual Return
at October 31,
2020
| | | Expenses Paid
During the
Six Months Ended
October 31,
2020*
| | | Annualized
Expense
Ratio*
| |
AIG Commodity Strategy Fund@ | | | | | | | | | | | | | | | | | | | | | | | | | | | | |
Class A# | | $ | 1,000.00 | | | $ | 1,161.74 | | | $ | 9.35 | | | $ | 1,000.00 | | | $ | 1,016.49 | | | $ | 8.72 | | | | 1.72 | % |
Class C# | | $ | 1,000.00 | | | $ | 1,157.02 | | | $ | 12.85 | | | $ | 1,000.00 | | | $ | 1,013.22 | | | $ | 11.99 | | | | 2.37 | % |
Class W# | | $ | 1,000.00 | | | $ | 1,161.48 | | | $ | 8.26 | | | $ | 1,000.00 | | | $ | 1,017.50 | | | $ | 7.71 | | | | 1.52 | % |
AIG ESG Dividend Fund | | | | | | | | | | | | | | | | | | | | | | | | | | | | |
Class A# | | $ | 1,000.00 | | | $ | 1,121.35 | | | $ | 6.03 | | | $ | 1,000.00 | | | $ | 1,019.46 | | | $ | 5.74 | | | | 1.13 | % |
Class C# | | $ | 1,000.00 | | | $ | 1,116.94 | | | $ | 9.47 | | | $ | 1,000.00 | | | $ | 1,016.19 | | | $ | 9.02 | | | | 1.78 | % |
Class W# | | $ | 1,000.00 | | | $ | 1,122.43 | | | $ | 4.96 | | | $ | 1,000.00 | | | $ | 1,020.46 | | | $ | 4.72 | | | | 0.93 | % |
AIG Focused Alpha
Large-Cap Fund | | | | | | | | | | | | | | | | | | | | | | | | | | | | |
Class A | | $ | 1,000.00 | | | $ | 1,125.05 | | | $ | 8.76 | | | $ | 1,000.00 | | | $ | 1,016.89 | | | $ | 8.31 | | | | 1.64 | % |
Class C | | $ | 1,000.00 | | | $ | 1,121.21 | | | $ | 12.37 | | | $ | 1,000.00 | | | $ | 1,013.47 | | | $ | 11.74 | | | | 2.32 | % |
Class W# | | $ | 1,000.00 | | | $ | 1,126.06 | | | $ | 8.02 | | | $ | 1,000.00 | | | $ | 1,017.60 | | | $ | 7.61 | | | | 1.50 | % |
AIG Focused Growth Fund | | | | | | | | | | | | | | | | | | | | | | | | | | | | |
Class A# | | $ | 1,000.00 | | | $ | 1,297.91 | | | $ | 6.53 | | | $ | 1,000.00 | | | $ | 1,019.46 | | | $ | 5.74 | | | | 1.13 | % |
Class C# | | $ | 1,000.00 | | | $ | 1,294.20 | | | $ | 10.26 | | | $ | 1,000.00 | | | $ | 1,016.19 | | | $ | 9.02 | | | | 1.78 | % |
Class W# | | $ | 1,000.00 | | | $ | 1,299.71 | | | $ | 5.38 | | | $ | 1,000.00 | | | $ | 1,020.46 | | | $ | 4.72 | | | | 0.93 | % |
AIG Income Explorer Fund | | | | | | | | | | | | | | | | | | | | | | | | | | | | |
Class A# | | $ | 1,000.00 | | | $ | 1,022.73 | | | $ | 5.03 | | | $ | 1,000.00 | | | $ | 1,020.16 | | | $ | 5.03 | | | | 0.99 | % |
Class C# | | $ | 1,000.00 | | | $ | 1,020.28 | | | $ | 8.33 | | | $ | 1,000.00 | | | $ | 1,016.89 | | | $ | 8.31 | | | | 1.64 | % |
Class W# | | $ | 1,000.00 | | | $ | 1,023.73 | | | $ | 4.02 | | | $ | 1,000.00 | | | $ | 1,021.17 | | | $ | 4.01 | | | | 0.79 | % |
AIG Small-Cap Fund | | | | | | | | | | | | | | | | | | | | | | | | | | | | |
Class A# | | $ | 1,000.00 | | | $ | 1,136.64 | | | $ | 6.71 | | | $ | 1,000.00 | | | $ | 1,018.85 | | | $ | 6.34 | | | | 1.25 | % |
Class C# | | $ | 1,000.00 | | | $ | 1,133.60 | | | $ | 10.19 | | | $ | 1,000.00 | | | $ | 1,015.58 | | | $ | 9.63 | | | | 1.90 | % |
Class W# | | $ | 1,000.00 | | | $ | 1,138.42 | | | $ | 5.64 | | | $ | 1,000.00 | | | $ | 1,019.86 | | | $ | 5.33 | | | | 1.05 | % |
| * | Expenses are equal to each Fund’s annualized expense ratio multiplied by the average account value over the period, multiplied by 184 days then divided by 366 days (to reflect the one-half year period). |
| | These ratios do not reflect transaction costs, including sales charges on purchase payments, contingent deferred sales charges, small account fees and administrative fees, if applicable to your account. Please refer to your Prospectus, your retirement plan document and/or materials from your financial adviser, for more information. |
| # | During the stated period, the investment adviser either waived a portion of or all of the fees and assumed a portion of or all expenses for the Funds or through recoupment provisions, recovered a portion of or all fees and expenses waived or reimbursed in the previous two fiscal years. As a result, if these fees and expenses had not been waived or assumed, the “Actual/Hypothetical Ending Account Value” would have been lower and the “Actual/Hypothetical Expenses Paid During the Six Months Ended October 31, 2020” and the “Annualized Expense Ratio” would have been higher. If these fees and expenses had not been recouped, the “Actual/Hypothetical Ending Account Value” would have been higher and the “Actual/Hypothetical Expenses Paid During the Six Months Ended October 31, 2020” and the “Annualized Expense Ratio” would have been lower. |
| @ | Consolidated (see Note 2 to Notes to Financial Statements) |
SunAmerica Specialty Series
STATEMENT OF ASSETS AND LIABILITIES — October 31, 2020
| | | | | | | | | | | | | | | | | | | | | | | | |
| | | AIG
Commodity
Strategy
Fund#
| | | AIG
ESG
Dividend
Fund
| | | AIG
Focused
Alpha
Large-Cap
Fund
| | | AIG
Focused
Growth
Fund
| | | AIG
Income
Explorer
Fund
| | | AIG
Small-Cap
Fund
| |
ASSETS: | | | | | | | | | | | | | | | | | | | | | | | | |
Investments at value (unaffiliated)* | | $ | 17,361,360 | | | $ | 35,887,746 | | | $ | 626,753,992 | | | $ | 585,337,059 | | | $ | 34,703,081 | | | $ | 34,324,913 | |
Repurchase agreements (cost approximates value) | | | 6,045,000 | | | | 505,000 | | | | — | | | | — | | | | 164,000 | | | | 750,000 | |
Cash | | | 3,643 | | | | 857 | | | | 7,075,480 | | | | 44,134,398 | | | | — | | | | 116,167 | |
Foreign cash* | | | — | | | | — | | | | — | | | | — | | | | 12,791 | | | | — | |
Receivable for: | | | | | | | | | | | | | | | | | | | | | | | | |
Shares of beneficial interest sold | | | 221 | | | | 57,961 | | | | 251,224 | | | | 269,087 | | | | 6,175 | | | | 8,283 | |
Dividends and interest | | | 906 | | | | 68,217 | | | | 1,084,925 | | | | — | | | | 112,730 | | | | 4,574 | |
Investments sold | | | — | | | | — | | | | — | | | | — | | | | 561,672 | | | | 884 | |
Investments sold on an extended settlement basis | | | — | | | | — | | | | — | | | | — | | | | 12,649 | | | | 18,453 | |
Receipts on swap contracts | | | 117,984 | | | | — | | | | — | | | | — | | | | — | | | | — | |
Prepaid expenses and other assets | | | 6,065 | | | | 1,959 | | | | 28,853 | | | | 48,094 | | | | 6,053 | | | | 6,347 | |
Cash collateral for futures contracts | | | 1,793,344 | | | | — | | | | — | | | | — | | | | — | | | | 20 | |
Due from investment adviser for expense reimbursements/fee waivers | | | 45,693 | | | | 34,402 | | | | 9,032 | | | | 215,706 | | | | 44,939 | | | | 69,792 | |
Variation margin on futures contracts | | | 97,406 | | | | — | | | | — | | | | — | | | | — | | | | — | |
| | |
|
|
| |
|
|
| |
|
|
| |
|
|
| |
|
|
| |
|
|
|
Total assets | | | 25,471,622 | | | | 36,556,142 | | | | 635,203,506 | | | | 630,004,344 | | | | 35,624,090 | | | | 35,299,433 | |
| | |
|
|
| |
|
|
| |
|
|
| |
|
|
| |
|
|
| |
|
|
|
LIABILITIES: | | | | | | | | | | | | | | | | | | | | | | | | |
Payable for: | | | | | | | | | | | | | | | | | | | | | | | | |
Shares of beneficial interest redeemed | | | 5,172 | | | | 32,979 | | | | 293,911 | | | | 376,303 | | | | 81,937 | | | | 13,880 | |
Investments purchased | | | — | | | | — | | | | — | | | | — | | | | — | | | | 1,722 | |
Investment advisory and management fees | | | 21,539 | | | | 23,894 | | | | 566,968 | | | | 562,762 | | | | 31,305 | | | | 31,314 | |
Distribution and account maintenance fees | | | 7,690 | | | | 10,724 | | | | 207,427 | | | | 219,175 | | | | 11,975 | | | | 11,537 | |
Transfer agent fees and expenses | | | 7,842 | | | | 8,488 | | | | 170,614 | | | | 178,647 | | | | 8,794 | | | | 10,725 | |
Trustees’ fees and expenses | | | — | | | | 31 | | | | 630 | | | | 567 | | | | 41 | | | | 39 | |
Other accrued expenses | | | 151,929 | | | | 84,929 | | | | 162,464 | | | | 151,906 | | | | 82,579 | | | | 141,379 | |
Call and put options written, at value@ | | | 17,160 | | | | — | | | | — | | | | — | | | | — | | | | — | |
Variation margin on futures contracts | | | 63,654 | | | | — | | | | — | | | | — | | | | — | | | | 11,880 | |
Due to custodian | | | — | | | | — | | | | — | | | | — | | | | 39,825 | | | | — | |
| | |
|
|
| |
|
|
| |
|
|
| |
|
|
| |
|
|
| |
|
|
|
Total liabilities | | | 274,986 | | | | 161,045 | | | | 1,402,014 | | | | 1,489,360 | | | | 256,456 | | | | 222,476 | |
| | |
|
|
| |
|
|
| |
|
|
| |
|
|
| |
|
|
| |
|
|
|
NET ASSETS | | $ | 25,196,636 | | | $ | 36,395,097 | | | $ | 633,801,492 | | | $ | 628,514,984 | | | $ | 35,367,634 | | | $ | 35,076,957 | |
| | |
|
|
| |
|
|
| |
|
|
| |
|
|
| |
|
|
| |
|
|
|
| # | Consolidated (see Note 2) |
See Notes to Financial Statements
SunAmerica Specialty Series
STATEMENT OF ASSETS AND LIABILITIES — October 31, 2020 — (continued)
| | | | | | | | | | | | | | | | | | | | | | | | |
| | | AIG
Commodity
Strategy
Fund#
| | | AIG
ESG
Dividend
Fund
| | | AIG
Focused
Alpha
Large-Cap
Fund
| | | AIG
Focused
Growth
Fund
| | | AIG
Income
Explorer
Fund
| | | AIG
Small-Cap
Fund
| |
NET ASSETS REPRESENTED BY: | | | | | | | | | | | | | | | | | | | | | | | | |
Paid-in capital | | $ | 120,606,570 | | | $ | 36,286,966 | | | $ | 459,818,070 | | | $ | 353,905,434 | | | $ | 41,205,318 | | | $ | 34,980,738 | |
Total accumulated earnings (loss) | | | (95,409,934 | ) | | | 108,131 | | | | 173,983,422 | | | | 274,609,550 | | | | (5,837,684 | ) | | | 96,219 | |
| | |
|
|
| |
|
|
| |
|
|
| |
|
|
| |
|
|
| |
|
|
|
Net assets | | $ | 25,196,636 | | | $ | 36,395,097 | | | $ | 633,801,492 | | | $ | 628,514,984 | | | $ | 35,367,634 | | | $ | 35,076,957 | |
| | |
|
|
| |
|
|
| |
|
|
| |
|
|
| |
|
|
| |
|
|
|
*Cost | | | | | | | | | | | | | | | | | | | | | | | | |
Investments (unaffiliated) | | $ | 17,461,515 | | | $ | 34,942,283 | | | $ | 512,105,527 | | | $ | 373,048,883 | | | $ | 38,434,977 | | | $ | 32,987,246 | |
| | |
|
|
| |
|
|
| |
|
|
| |
|
|
| |
|
|
| |
|
|
|
Foreign cash | | $ | — | | | $ | — | | | $ | — | | | $ | — | | | $ | 12,744 | | | $ | — | |
| | |
|
|
| |
|
|
| |
|
|
| |
|
|
| |
|
|
| |
|
|
|
@Premiums received on options written | | $ | 14,988 | | | $ | — | | | $ | — | | | $ | — | | | $ | — | | | $ | — | |
| | |
|
|
| |
|
|
| |
|
|
| |
|
|
| |
|
|
| |
|
|
|
| | | | | | |
Class A (unlimited shares authorized): | | | | | | | | | | | | | | | | | | | | | | | | |
Net assets | | $ | 24,308,673 | | | $ | 27,061,296 | | | $ | 574,027,999 | | | $ | 539,061,163 | | | $ | 30,766,411 | | | $ | 31,578,633 | |
Shares of beneficial interest issued and outstanding | | | 4,130,505 | | | | 1,915,229 | | | | 20,066,865 | | | | 17,378,074 | | | | 2,276,900 | | | | 2,085,899 | |
Net asset value and redemption price per share (excluding any applicable contingent deferred sales charge) | | $ | 5.89 | | | $ | 14.13 | | | $ | 28.61 | | | $ | 31.02 | | | $ | 13.51 | | | $ | 15.14 | |
Maximum sales charge (5.75% of offering price) | | | 0.36 | | | | 0.86 | | | | 1.75 | | | | 1.89 | | | | 0.82 | | | | 0.92 | |
| | |
|
|
| |
|
|
| |
|
|
| |
|
|
| |
|
|
| |
|
|
|
Maximum offering price to public | | $ | 6.25 | | | $ | 14.99 | | | $ | 30.36 | | | $ | 32.91 | | | $ | 14.33 | | | $ | 16.06 | |
| | |
|
|
| |
|
|
| |
|
|
| |
|
|
| |
|
|
| |
|
|
|
Class C (unlimited shares authorized): | | | | | | | | | | | | | | | | | | | | | | | | |
Net assets | | $ | 248,911 | | | $ | 1,529,639 | | | $ | 21,652,719 | | | $ | 48,422,626 | | | $ | 2,402,342 | | | $ | 1,571,447 | |
Shares of beneficial interest issued and outstanding | | | 44,486 | | | | 108,087 | | | | 824,157 | | | | 1,709,455 | | | | 178,015 | | | | 109,601 | |
Net asset value, offering and redemption price per share (excluding any applicable contingent deferred sales charge) | | $ | 5.60 | | | $ | 14.15 | | | $ | 26.27 | | | $ | 28.33 | | | $ | 13.50 | | | $ | 14.34 | |
| | |
|
|
| |
|
|
| |
|
|
| |
|
|
| |
|
|
| |
|
|
|
Class W (unlimited shares authorized): | | | | | | | | | | | | | | | | | | | | | | | | |
Net assets | | $ | 639,052 | | | $ | 7,804,162 | | | $ | 38,120,774 | | | $ | 41,031,195 | | | $ | 2,198,881 | | | $ | 1,926,877 | |
Shares of beneficial interest issued and outstanding | | | 107,034 | | | | 552,384 | | | | 1,305,267 | | | | 1,289,224 | | | | 162,899 | | | | 125,295 | |
Net asset value, offering and redemption price per share | | $ | 5.97 | | | $ | 14.13 | | | $ | 29.21 | | | $ | 31.83 | | | $ | 13.50 | | | $ | 15.38 | |
| | |
|
|
| |
|
|
| |
|
|
| |
|
|
| |
|
|
| |
|
|
|
| # | Consolidated (see Note 2) |
See Notes to Financial Statements
SunAmerica Specialty Series
STATEMENT OF OPERATIONS — For the year ended October 31, 2020
| | | | | | | | | | | | | | | | | | | | | | | | |
| | | AIG
Commodity
Strategy
Fund#
| | | AIG
ESG
Dividend
Fund
| | | AIG
Focused
Alpha
Large-Cap
Fund
| | | AIG
Focused
Growth
Fund
| | | AIG
Income
Explorer
Fund
| | | AIG
Small-Cap
Fund
| |
INVESTMENT INCOME: | | | | | | | | | | | | | | | | | | | | | | | | |
Dividends (unaffiliated) | | $ | — | | | $ | 1,020,901 | | | $ | 9,992,057 | | | $ | 3,243,695 | | | $ | 1,776,579 | | | $ | 327,597 | |
Interest (unaffiliated) | | | 204,459 | | | | 389 | | | | — | | | | — | | | | 62,520 | | | | 550 | |
| | |
|
|
| |
|
|
| |
|
|
| |
|
|
| |
|
|
| |
|
|
|
Total investment income* | | | 204,459 | | | | 1,021,290 | | | | 9,992,057 | | | | 3,243,695 | | | | 1,839,099 | | | | 328,147 | |
| | |
|
|
| |
|
|
| |
|
|
| |
|
|
| |
|
|
| |
|
|
|
EXPENSES: | | | | | | | | | | | | | | | | | | | | | | | | |
Investment advisory and management fees | | | 309,943 | | | | 231,635 | | | | 6,236,245 | | | | 5,676,772 | | | | 396,953 | | | | 381,010 | |
Distribution and account maintenance fees: | | | | | | | | | | | | | | | | | | | | | | | | |
Class A | | | 83,314 | | | | 79,804 | | | | 1,893,264 | | | | 1,630,975 | | | | 114,529 | | | | 114,070 | |
Class C | | | 6,480 | | | | 8,834 | | | | 302,079 | | | | 497,117 | | | | 29,512 | | | | 18,762 | |
Service fees: | | | | | | | | | | | | | | | | | | | | | | | | |
Class W | | | 1,480 | | | | 9,688 | | | | 41,496 | | | | 61,495 | | | | 5,340 | | | | 4,529 | |
Transfer agent fees and expenses: | | | | | | | | | | | | | | | | | | | | | | | | |
Class A | | | 59,995 | | | | 52,738 | | | | 1,362,636 | | | | 1,198,168 | | | | 76,670 | | | | 81,369 | |
Class C | | | 2,860 | | | | 3,751 | | | | 81,297 | | | | 119,943 | | | | 7,965 | | | | 6,647 | |
Class W | | | 3,205 | | | | 15,579 | | | | 63,789 | | | | 92,292 | | | | 9,037 | | | | 7,845 | |
Registration fees: | | | | | | | | | | | | | | | | | | | | | | | | |
Class A | | | 23,170 | | | | 20,674 | | | | 37,347 | | | | 34,700 | | | | 24,331 | | | | 22,367 | |
Class C | | | 13,177 | | | | 12,815 | | | | 14,606 | | | | 15,527 | | | | 14,662 | | | | 12,970 | |
Class W | | | 13,248 | | | | 16,204 | | | | 15,835 | | | | 16,665 | | | | 16,742 | | | | 13,517 | |
Custodian and accounting fees | | | 117,334 | | | | 15,042 | | | | 47,467 | | | | 40,163 | | | | 9,789 | | | | 67,680 | |
Reports to shareholders | | | 17,734 | | | | 13,703 | | | | 127,729 | | | | 106,697 | | | | 37,449 | | | | 19,119 | |
Audit and tax fees | | | 79,981 | | | | 56,157 | | | | 48,797 | | | | 48,761 | | | | 65,454 | | | | 44,371 | |
Legal fees | | | 36,192 | | | | 28,056 | | | | 94,610 | | | | 86,031 | | | | 92,286 | | | | 31,306 | |
Trustees’ fees and expenses | | | 2,109 | | | | 2,310 | | | | 48,777 | | | | 43,468 | | | | 3,229 | | | | 21,508 | |
Interest expense | | | — | | | | — | | | | 889 | | | | 8,055 | | | | 141 | | | | 905 | |
Other expenses | | | 68,740 | | | | 50,111 | | | | 3,644 | | | | (21,543 | ) | | | 57,516 | | | | 84,019 | |
| | |
|
|
| |
|
|
| |
|
|
| |
|
|
| |
|
|
| |
|
|
|
Total expenses before fee waivers, expense reimbursements, expense recoupments and fees paid indirectly | | | 838,962 | | | | 617,101 | | | | 10,420,507 | | | | 9,655,286 | | | | 961,605 | | | | 931,994 | |
Fees waived and expenses (reimbursed)/recouped by investment advisor (see Note 4) | | | (392,753 | ) | | | (272,947 | ) | | | 3,047 | | | | (2,998,175 | ) | | | (448,610 | ) | | | (448,573 | ) |
Fees paid indirectly (see Note 9) | | | — | | | | — | | | | (7,583 | ) | | | (18,617 | ) | | | — | | | | — | |
| | |
|
|
| |
|
|
| |
|
|
| |
|
|
| |
|
|
| |
|
|
|
Net expenses | | | 446,209 | | | | 344,154 | | | | 10,415,971 | | | | 6,638,494 | | | | 512,995 | | | | 483,421 | |
| | |
|
|
| |
|
|
| |
|
|
| |
|
|
| |
|
|
| |
|
|
|
Net investment income (loss) | | $ | (241,750 | ) | | $ | 677,136 | | | $ | (423,914 | ) | | $ | (3,394,799 | ) | | $ | 1,326,104 | | | $ | (155,274 | ) |
| | |
|
|
| |
|
|
| |
|
|
| |
|
|
| |
|
|
| |
|
|
|
| # | Consolidated (see Note 2) |
See Notes to Financial Statements
SunAmerica Specialty Series
STATEMENT OF OPERATIONS — For the year ended October 31, 2020 — (continued)
| | | | | | | | | | | | | | | | | | | | | | | | |
| | | AIG
Commodity
Strategy
Fund#
| | | AIG
ESG
Dividend
Fund
| | | AIG
Focused
Alpha
Large-Cap
Fund
| | | AIG
Focused
Growth
Fund
| | | AIG
Income
Explorer
Fund
| | | AIG
Small-Cap
Fund
| |
NET REALIZED AND UNREALIZED GAIN (LOSS) ON INVESTMENTS AND FOREIGN CURRENCIES: | | | | | | | | | | | | | | | | | | | | | | | | |
Net realized gain (loss) on: | | | | | | | | | | | | | | | | | | | | | | | | |
Investments (unaffiliated) | | $ | 1,052 | | | $ | (695,146 | ) | | $ | 60,065,832 | | | $ | 66,022,233 | | | $ | (1,470,059 | ) | | $ | (1,015,640 | ) |
Futures contracts | | | (1,813,153 | ) | | | — | | | | — | | | | — | | | | — | | | | 258,039 | |
Forward contracts | | | — | | | | — | | | | — | | | | — | | | | (8,469 | ) | | | — | |
Swap contracts | | | (958,890 | ) | | | — | | | | — | | | | — | | | | — | | | | — | |
Written options contracts | | | 16,348 | | | | — | | | | — | | | | — | | | | — | | | | — | |
Net realized foreign exchange gain (loss) on other assets and liabilities | | | 7 | | | | — | | | | — | | | | — | | | | 1,772 | | | | — | |
| | |
|
|
| |
|
|
| |
|
|
| |
|
|
| |
|
|
| |
|
|
|
Net realized gain (loss) on investments and foreign currencies | | | (2,754,636 | ) | | | (695,146 | ) | | | 60,065,832 | | | | 66,022,233 | | | | (1,476,756 | ) | | | (757,601 | ) |
| | |
|
|
| |
|
|
| |
|
|
| |
|
|
| |
|
|
| |
|
|
|
Change in unrealized appreciation (depreciation) on: | | | | | | | | | | | | | | | | | | | | | | | | |
Investments (unaffiliated) | | | 41,902 | | | | 335,008 | | | | 7,503,289 | | | | 107,196,355 | | | | (4,286,058 | ) | | | (1,166,635 | ) |
Futures contracts | | | 418,398 | | | | — | | | | — | | | | — | | | | — | | | | (17,836 | ) |
Forward contracts | | | — | | | | — | | | | — | | | | — | | | | 10,197 | | | | — | |
Swap contracts | | | (48,409 | ) | | | — | | | | — | | | | — | | | | — | | | | — | |
Written options contracts | | | 2,419 | | | | — | | | | — | | | | — | | | | — | | | | — | |
Change in net unrealized foreign exchange gain (loss) on other assets and liabilities | | | — | | | | — | | | | — | | | | — | | | | (2,711 | ) | | | — | |
| | |
|
|
| |
|
|
| |
|
|
| |
|
|
| |
|
|
| |
|
|
|
Net unrealized gain (loss) on investments and foreign currencies | | | 414,310 | | | | 335,008 | | | | 7,503,289 | | |
| 107,196,355
|
| | | (4,278,572 | ) | | | (1,184,471 | ) |
| | |
|
|
| |
|
|
| |
|
|
| |
|
|
| |
|
|
| |
|
|
|
Net realized and unrealized gain (loss) on investments and foreign currencies | | | (2,340,326 | ) | | | (360,138 | ) | | | 67,569,121 | | | | 173,218,588 | | | | (5,755,328 | ) | | | (1,942,072 | ) |
| | |
|
|
| |
|
|
| |
|
|
| |
|
|
| |
|
|
| |
|
|
|
NET INCREASE (DECREASE) IN NET ASSETS RESULTING FROM OPERATIONS | | | (2,582,076 | ) | | $ | 316,998 | | | $ | 67,145,207 | | | $ | 169,823,789 | | | $ | (4,429,224 | ) | | $ | (2,097,346 | ) |
| | |
|
|
| |
|
|
| |
|
|
| |
|
|
| |
|
|
| |
|
|
|
* Net of foreign withholding taxes on interest and dividends of | | $ | — | | | $ | — | | | $ | 305,164 | | | $ | — | | | $ | 38,385 | | | $ | 247 | |
| | |
|
|
| |
|
|
| |
|
|
| |
|
|
| |
|
|
| |
|
|
|
| # | Consolidated (see Note 2) |
See Notes to Financial Statements
SunAmerica Specialty Series
STATEMENT OF CHANGES IN NET ASSETS
| | | | | | | | | | | | | | | | | | | | | | | | |
| | | AIG Commodity
Strategy Fund#
| | | AIG ESG Dividend Fund
| | | AIG Focused Alpha
Large-Cap Fund
| |
| | | For the
year ended
October 31,
2020
| | | For the
year ended
October 31,
2019
| | | For the
year ended
October 31,
2020
| | | For the
year ended
October 31,
2019
| | | For the
year ended
October 31,
2020
| | | For the
year ended
October 31,
2019
| |
INCREASE (DECREASE) IN NET ASSETS | | | | | | | | | | | | | | | | | | | | | | | | |
Operations: | | | | | | | | | | | | | | | | | | | | | | | | |
Net investment income (loss) | | $ | (241,750 | ) | | $ | 174,932 | | | $ | 677,136 | | | $ | 651,401 | | | $ | (423,914 | ) | | $ | (237,713 | ) |
Net realized gain (loss) on investments and foreign currencies | | | (2,754,636 | ) | | | (3,598,811 | ) | | | (695,146 | ) | | | (127,868 | ) | | | 60,065,832 | | | | 66,021,600 | |
Net unrealized gain (loss) on investments and foreign currencies | | | 414,310 | | | | 1,674,627 | | | | 335,008 | | | | 943,313 | | | | 7,503,289 | | | | (6,772,830 | ) |
| | |
|
|
| |
|
|
| |
|
|
| |
|
|
| |
|
|
| |
|
|
|
Net increase (decrease) in net assets resulting from operations | | | (2,582,076 | ) | | | (1,749,252 | ) | | | 316,998 | | | | 1,466,846 | | | | 67,145,207 | | | | 59,011,057 | |
| | |
|
|
| |
|
|
| |
|
|
| |
|
|
| |
|
|
| |
|
|
|
| | | | | | |
Distributions to shareholders from: | | | | | | | | | | | | | | | | | | | | | | | | |
Distributable earnings (Class A) | | | (200,116 | ) | | | (22,154 | ) | | | (531,166 | ) | | | (2,167,817 | ) | | | (58,678,098 | ) | | | (95,234,176 | ) |
Distributable earnings (Class C) | | | — | | | | — | | | | (20,732 | ) | | | (41,456 | ) | | | (3,831,158 | ) | | | (6,231,964 | ) |
Distributable earnings (Class W) | | | (15,522 | ) | | | (3,578 | ) | | | (165,823 | ) | | | (366,322 | ) | | | (2,242,153 | ) | | | (3,202,795 | ) |
Return of Capital (Class A) | | | — | | | | — | | | | — | | | | — | | | | — | | | | — | |
Return of Capital (Class C) | | | — | | | | — | | | | — | | | | — | | | | — | | | | — | |
Return of Capital (Class W) | | | — | | | | — | | | | — | | | | — | | | | — | | | | — | |
| | |
|
|
| |
|
|
| |
|
|
| |
|
|
| |
|
|
| |
|
|
|
Total distributions to shareholders | | | (215,638 | ) | | | (25,732 | ) | | | (717,721 | ) | | | (2,575,595 | ) | | | (64,751,409 | ) | | | (104,668,935 | ) |
| | |
|
|
| |
|
|
| |
|
|
| |
|
|
| |
|
|
| |
|
|
|
Net increase (decrease) in net assets resulting from capital share transactions (see Note 7) | | | (4,613,564 | ) | | | (1,999,689 | ) | | | 5,822,274 | | | | 6,227,356 | | | | 3,641,371 | | | | 45,531,906 | |
| | |
|
|
| |
|
|
| |
|
|
| |
|
|
| |
|
|
| |
|
|
|
Total increase (decrease) in net assets | | | (7,411,278 | ) | | | (3,774,673 | ) | | | 5,421,551 | | | | 5,118,607 | | | | 6,035,169 | | | | (125,972 | ) |
| | | | | | |
NET ASSETS: | | | | | | | | | | | | | | | | | | | | | | | | |
Beginning of period | | | 32,607,914 | | | | 36,382,587 | | | | 30,973,546 | | | | 25,854,939 | | | | 627,766,323 | | | | 627,892,295 | |
| | |
|
|
| |
|
|
| |
|
|
| |
|
|
| |
|
|
| |
|
|
|
End of period | | $ | 25,196,636 | | | $ | 32,607,914 | | | $ | 36,395,097 | | | $ | 30,973,546 | | | $ | 633,801,492 | | | $ | 627,766,323 | |
| | |
|
|
| |
|
|
| |
|
|
| |
|
|
| |
|
|
| |
|
|
|
| # | Consolidated (see Note 2) |
See Notes to Financial Statements
SunAmerica Specialty Series
STATEMENT OF CHANGES IN NET ASSETS — (continued)
| | | | | | | | | | | | | | | | | | | | | | | | |
| | | AIG Focused Growth Fund
| | | AIG Income Explorer Fund
| | | AIG Small-Cap Fund
| |
| | | For the
year ended
October 31,
2020
| | | For the
year ended
October 31,
2019
| | | For the
year ended
October 31,
2020
| | | For the
year ended
October 31,
2019
| | | For the
year ended
October 31,
2020
| | | For the
year ended
October 31,
2019
| |
INCREASE (DECREASE) IN NET ASSETS | | | | | | | | | | | | | | | | | | | | | | | | |
Operations: | | | | | | | | | | | | | | | | | | | | | | | | |
Net investment income (loss) | | $ | (3,394,799 | ) | | $ | (3,182,880 | ) | | $ | 1,326,104 | | | $ | 2,105,919 | | | $ | (155,274 | ) | | $ | (243,327 | ) |
Net realized gain (loss) on investments and foreign currencies | | | 66,022,233 | | | | 54,586,958 | | | | (1,476,756 | ) | | | (478,481 | ) | | | (757,601 | ) | | | 306,855 | |
Net unrealized gain (loss) on investments and foreign currencies | | | 107,196,355 | | | | (29,287,154 | ) | | | (4,278,572 | ) | | | 4,026,041 | | | | (1,184,471 | ) | | | (3,267,805 | ) |
| | |
|
|
| |
|
|
| |
|
|
| |
|
|
| |
|
|
| |
|
|
|
Net increase (decrease) in net assets resulting from operations | | | 169,823,789 | | | | 22,116,924 | | | | (4,429,224 | ) | | | 5,653,479 | | | | (2,097,346 | ) | | | (3,204,277 | ) |
| | |
|
|
| |
|
|
| |
|
|
| |
|
|
| |
|
|
| |
|
|
|
Distributions to shareholders from: | | | | | | | | | | | | | | | | | | | | | | | | |
Distributable earnings (Class A) | | | (44,655,419 | ) | | | (94,208,878 | ) | | | (1,114,943 | ) | | | (2,180,601 | ) | | | (850,619 | ) | | | (4,719,487 | ) |
Distributable earnings (Class C) | | | (5,435,185 | ) | | | (13,637,145 | ) | | | (80,194 | ) | | | (197,819 | ) | | | (60,201 | ) | | | (299,248 | ) |
Distributable earnings (Class W) | | | (4,641,014 | ) | | | (14,308,470 | ) | | | (120,883 | ) | | | (336,621 | ) | | | (131,949 | ) | | | (1,238,362 | ) |
Return of Capital (Class A) | | | — | | | | — | | | | (67,487 | ) | | | — | | | | — | | | | — | |
Return of Capital (Class C) | | | — | | | | — | | | | (4,854 | ) | | | — | | | | — | | | | — | |
Return of Capital (Class W) | | | — | | | | — | | | | (7,317 | ) | | | — | | | | — | | | | — | |
| | |
|
|
| |
|
|
| |
|
|
| |
|
|
| |
|
|
| |
|
|
|
Total distributions to shareholders | | | (54,731,618 | ) | | | (122,154,493 | ) | | | (1,395,678 | ) | | | (2,715,041 | ) | | | (1,042,769 | ) | | | (6,257,097 | ) |
| | |
|
|
| |
|
|
| |
|
|
| |
|
|
| |
|
|
| |
|
|
|
Net increase (decrease) in net assets resulting from capital share transactions (see Note 7) | | | (31,987,680 | ) | | | 7,266,843 | | | | (2,280,078 | ) | | | (14,458,759 | ) | | | (7,320,675 | ) | | | (15,377,156 | ) |
| | |
|
|
| |
|
|
| |
|
|
| |
|
|
| |
|
|
| |
|
|
|
Total increase (decrease) in net assets | | | 83,104,491 | | | | (92,770,726 | ) | | | (8,104,980 | ) | | | (11,520,321 | ) | | | (10,460,790 | ) | | | (24,838,530 | ) |
| | | | | | |
NET ASSETS: | | | | | | | | | | | | | | | | | | | | | | | | |
Beginning of period | | | 545,410,493 | | | | 638,181,219 | | | | 43,472,614 | | | | 54,992,935 | | | | 45,537,747 | | | | 70,376,277 | |
| | |
|
|
| |
|
|
| |
|
|
| |
|
|
| |
|
|
| |
|
|
|
End of period | | $ | 628,514,984 | | | $ | 545,410,493 | | | $ | 35,367,634 | | | $ | 43,472,614 | | | $ | 35,076,957 | | | $ | 45,537,747 | |
| | |
|
|
| |
|
|
| |
|
|
| |
|
|
| |
|
|
| |
|
|
|
See Notes to Financial Statements
SunAmerica Specialty Series
FINANCIAL HIGHLIGHTS
| | | | | | | | | | | | | | | | | | | | | | | | | | | | | | | | | | | | | | | | | | | | | | | | | | | | |
Period Ended
| | Net
Asset
Value
beginning
of period
| | | Net
investment
income(1)
| | | Net gain
(loss) on
investments
(both
realized
and
unrealized)
| | | Total from
investment
operations
| | | Dividends
from net
investment
income
| | | Distributions
from
net realized
gains
| | | Total
Distri-
butions
| | | Net
Asset
Value
end of
period
| | | Total
Return(2)
| | | Net
Assets
end of
period
(000’s)
| | | Ratio of
expenses
to average
net assets(3)
| | | Ratio
of net
investment
income to
average
net assets(3)
| | | Portfolio
Turnover
| |
| | | | | | | | | | | | | | | | | | | | | | | | | | | | | | | | | | | | | | | | | | | | | | | | | | | | | |
AIG COMMODITY STRATEGY FUND#
| |
|
Class A
|
|
| 10/31/16 | | $ | 7.40 | | | $ | (0.10 | ) | | $ | (0.22 | ) | | $ | (0.32 | ) | | $ | — | | | $ | — | | | $ | — | | | $ | 7.08 | | | | (4.32 | )% | | $ | 35,228 | | | | 1.72 | % | | | (1.40 | )% | | | 50 | % |
| 10/31/17 | | | 7.08 | | | | (0.07 | ) | | | 0.12 | | | | 0.05 | | | | — | | | | — | | | | — | | | | 7.13 | | | | 0.71 | | | | 35,015 | | | | 1.73 | | | | (0.98 | ) | | | 49 | |
| 10/31/18 | | | 7.13 | | | | (0.01 | ) | | | (0.26 | ) | | | (0.27 | ) | | | (0.01 | ) | | | — | | | | (0.01 | ) | | | 6.85 | | | | (3.75 | ) | | | 32,602 | | | | 1.72 | | | | (0.14 | ) | | | 1 | |
| 10/31/19 | | | 6.85 | | | | 0.04 | | | | (0.37 | ) | | | (0.33 | ) | | | (0.00 | ) | | | — | | | | (0.00 | ) | | | 6.52 | | | | (4.75 | ) | | | 29,938 | | | | 1.72 | | | | 0.54 | | | | 62 | |
| 10/31/20 | | | 6.52 | | | | (0.06 | ) | | | (0.52 | ) | | | (0.58 | ) | | | (0.05 | ) | | | — | | | | (0.05 | ) | | | 5.89 | | | | (8.98 | ) | | | 24,309 | | | | 1.72 | | | | (0.94 | ) | | | 1 | |
|
Class C
|
|
| 10/31/16 | | $ | 7.20 | | | $ | (0.14 | ) | | $ | (0.22 | ) | | $ | (0.36 | ) | | $ | — | | | $ | — | | | $ | — | | | $ | 6.84 | | | | (5.00 | )% | | $ | 3,478 | | | | 2.37 | % | | | (2.06 | )% | | | 50 | % |
| 10/31/17 | | | 6.84 | | | | (0.11 | ) | | | 0.12 | | | | 0.01 | | | | — | | | | — | | | | — | | | | 6.85 | | | | 0.15 | | | | 2,755 | | | | 2.38 | | | | (1.65 | ) | | | 49 | |
| 10/31/18 | | | 6.85 | | | | (0.06 | ) | | | (0.25 | ) | | | (0.31 | ) | | | — | | | | — | | | | — | | | | 6.54 | | | | (4.53 | ) | | | 1,908 | | | | 2.37 | | | | (0.83 | ) | | | 1 | |
| 10/31/19 | | | 6.54 | | | | (0.01 | ) | | | (0.34 | ) | | | (0.35 | ) | | | — | | | | — | | | | — | | | | 6.19 | | | | (5.35 | ) | | | 1,051 | | | | 2.37 | | | | (0.09 | ) | | | 62 | |
| 10/31/20 | | | 6.19 | | | | (0.09 | ) | | | (0.50 | ) | | | (0.59 | ) | | | — | | | | — | | | | — | | | | 5.60 | | | | (9.53 | ) | | | 249 | | | | 2.37 | | | | (1.45 | ) | | | 1 | |
|
Class W
|
|
| 10/31/16 | | $ | 7.47 | | | $ | (0.09 | ) | | $ | (0.21 | ) | | $ | (0.30 | ) | | $ | — | | | $ | — | | | $ | — | | | $ | 7.17 | | | | (4.02 | )% | | $ | 1,958 | | | | 1.52 | % | | | (1.21 | )% | | | 50 | % |
| 10/31/17 | | | 7.17 | | | | (0.06 | ) | | | 0.12 | | | | 0.06 | | | | — | | | | — | | | | — | | | | 7.23 | | | | 0.84 | | | | 1,651 | | | | 1.53 | | | | (0.79 | ) | | | 49 | |
| 10/31/18 | | | 7.23 | | | | 0.01 | | | | (0.27 | ) | | | (0.26 | ) | | | (0.03 | ) | | | — | | | | (0.03 | ) | | | 6.94 | | | | (3.64 | ) | | | 1,873 | | | | 1.52 | | | | 0.08 | | | | 1 | |
| 10/31/19 | | | 6.94 | | | | 0.05 | | | | (0.36 | ) | | | (0.31 | ) | | | (0.02 | ) | | | — | | | | (0.02 | ) | | | 6.61 | | | | (4.52 | ) | | | 1,618 | | | | 1.52 | | | | 0.73 | | | | 62 | |
| 10/31/20 | | | 6.61 | | | | (0.03 | ) | | | (0.55 | ) | | | (0.58 | ) | | | (0.06 | ) | | | — | | | | (0.06 | ) | | | 5.97 | | | | (8.79 | ) | | | 639 | | | | 1.52 | | | | (0.52 | ) | | | 1 | |
| # | Consolidated (see Note 2) |
| (1) | Calculated based upon average shares outstanding. |
| (2) | Total return does not reflect sales load, but does include expense reimbursements and expense reductions. |
| (3) | Net of following expense reimbursements, waivers and (recoupments), if applicable (based on average net assets): |
| | | | | | | | | | | | | | | | | | | | |
| | | 10/31/16
| | | 10/31/17
| | | 10/31/18
| | | 10/31/19
| | | 10/31/20
| |
Commodity Strategy Fund Class A | | | 0.85 | % | | | 0.92 | % | | | 0.83 | % | | | 1.08 | % | | | 1.42 | % |
Commodity Strategy Fund Class C | | | 1.21 | | | | 1.25 | | | | 1.45 | | | | 1.96 | | | | 3.51 | |
Commodity Strategy Fund Class W | | | 1.48 | | | | 1.52 | | | | 1.49 | | | | 1.93 | | | | 2.69 | |
See Notes to Financial Statements
SunAmerica Specialty Series
FINANCIAL HIGHLIGHTS — (continued)
| | | | | | | | | | | | | | | | | | | | | | | | | | | | | | | | | | | | | | | | | | | | | | | | | | | | |
Period Ended
| | Net
Asset
Value
beginning
of period
| | | Net
investment
income(1)
| | | Net gain
(loss) on
investments
(both
realized
and
unrealized)
| | | Total from
investment
operations
| | | Dividends
from net
investment
income
| | | Distributions
from
net realized
gains
| | | Total
Distri-
butions
| | | Net
Asset
Value
end of
period
| | | Total
Return(2)
| | | Net
Assets
end of
period
(000’s)
| | | Ratio of
expenses
to average
net assets(3)
| | | Ratio
of net
investment
income to
average
net assets(3)
| | | Portfolio
Turnover
| |
| | | | | | | | | | | | | | | | | | | | | | | | | | | | | | | | | | | | | | | | | | | | | | | | | | | | | |
AIG ESG DIVIDEND FUND
| |
|
Class A
|
|
| 12/16/16@- | | | | | | | | | | | | | | | | | | | | | | | | | | | | | | | | | | | | | | | | | | | | | | | | | | | | |
| 10/31/17 | | $ | 15.00 | | | $ | 0.25 | | | $ | 0.56 | | | $ | 0.81 | | | $ | — | | | $ | — | | | $ | — | | | $ | 15.81 | | | | 5.40 | % | | $ | 24,913 | | | | 1.25 | %(4) | | | 1.92 | %(4) | | | 18 | % |
| 10/31/18 | | | 15.81 | | | | 0.30 | | | | 0.37 | | | | 0.67 | | | | (0.51 | ) | | | (0.09 | ) | | | (0.60 | ) | | | 15.88 | | | | 4.26 | (5) | | | 22,973 | | | | 1.25 | | | | 1.84 | | | | 57 | |
| 10/31/19 | | | 15.88 | | | | 0.33 | | | | 0.28 | | | | 0.61 | | | | (0.29 | ) | | | (1.24 | ) | | | (1.53 | ) | | | 14.96 | | | | 4.35 | | | | 20,874 | | | | 1.14 | | | | 2.22 | | | | 51 | |
| 10/31/20 | | | 14.96 | | | | 0.30 | | | | (0.81 | ) | | | (0.51 | ) | | | (0.32 | ) | | | — | | | | (0.32 | ) | | | 14.13 | | | | (3.23 | ) | | | 27,061 | | | | 1.13 | | | | 2.19 | | | | 70 | |
|
Class C
|
|
| 12/16/16@- | | | | | | | | | | | | | | | | | | | | | | | | | | | | | | | | | | | | | | | | | | | | | | | | | | | | |
| 10/31/17 | | $ | 15.00 | | | $ | 0.16 | | | $ | 0.56 | | | $ | 0.72 | | | $ | — | | | $ | — | | | $ | — | | | $ | 15.72 | | | | 4.80 | % | | $ | 365 | | | | 1.90 | %(4) | | | 1.22 | %(4) | | | 18 | % |
| 10/31/18 | | | 15.72 | | | | 0.19 | | | | 0.38 | | | | 0.57 | | | | (0.34 | ) | | | (0.09 | ) | | | (0.43 | ) | | | 15.86 | | | | 3.59 | (5) | | | 384 | | | | 1.90 | | | | 1.18 | | | | 57 | |
| 10/31/19 | | | 15.86 | | | | 0.21 | | | | 0.31 | | | | 0.52 | | | | (0.20 | ) | | | (1.24 | ) | | | (1.44 | ) | | | 14.94 | | | | 3.71 | | | | 1,019 | | | | 1.78 | | | | 1.51 | | | | 51 | |
| 10/31/20 | | | 14.94 | | | | 0.21 | | | | (0.76 | ) | | | (0.55 | ) | | | (0.24 | ) | | | — | | | | (0.24 | ) | | | 14.15 | | | | (3.58 | ) | | | 1,530 | | | | 1.78 | | | | 1.53 | | | | 70 | |
|
Class W
|
|
| 12/16/16@- | | | | | | | | | | | | | | | | | | | | | | | | | | | | | | | | | | | | | | | | | | | | | | | | | | | | |
| 10/31/17 | | $ | 15.00 | | | $ | 0.28 | | | $ | 0.56 | | | $ | 0.84 | | | $ | — | | | $ | — | | | $ | — | | | $ | 15.84 | | | | 5.60 | % | | $ | 352 | | | | 1.05 | %(4) | | | 2.06 | %(4) | | | 18 | % |
| 10/31/18 | | | 15.84 | | | | 0.31 | | | | 0.40 | | | | 0.71 | | | | (0.57 | ) | | | (0.09 | ) | | | (0.66 | ) | | | 15.89 | | | | 4.48 | (5) | | | 2,498 | | | | 1.05 | | | | 1.99 | | | | 57 | |
| 10/31/19 | | | 15.89 | | | | 0.34 | | | | 0.30 | | | | 0.64 | | | | (0.32 | ) | | | (1.24 | ) | | | (1.56 | ) | | | 14.97 | | | | 4.57 | | | | 9,080 | | | | 0.93 | | | | 2.46 | | | | 51 | |
| 10/31/20 | | | 14.97 | | | | 0.33 | | | | (0.82 | ) | | | (0.49 | ) | | | (0.35 | ) | | | — | | | | (0.35 | ) | | | 14.13 | | | | (3.11 | ) | | | 7,804 | | | | 0.93 | | | | 2.34 | | | | 70 | |
| @ | Commencement of operations. |
| (1) | Calculated based upon average shares outstanding. |
| (2) | Total return is not annualized and does not reflect sales load, but does include expense reimbursements and expense reductions. |
| (3) | Net of following expense reimbursements, waivers and (recoupments), if applicable (based on average net assets): |
| | | | | | | | | | | | | | | | |
| | | 10/31/17(4)
| | | 10/31/18
| | | 10/31/19
| | | 10/31/20
| |
ESG Dividend Fund Class A | | | 1.25 | % | | | 0.75 | % | | | 0.81 | % | | | 0.82 | % |
ESG Dividend Fund Class C | | | 4.56 | | | | 2.88 | | | | 1.87 | | | | 1.56 | |
ESG Dividend Fund Class W | | | 5.15 | | | | 1.41 | | | | 0.93 | | | | 0.99 | |
| (5) | The Fund’s performance figure was increased by 0.66% from a reimbursement of losses resulting from an investment restriction violation. |
See Notes to Financial Statements
SunAmerica Specialty Series
FINANCIAL HIGHLIGHTS — (continued)
| | | | | | | | | | | | | | | | | | | | | | | | | | | | | | | | | | | | | | | | | | | | | | | | | | | | |
Period
Ended
| | Net
Asset
Value
beginning
of period
| | | Net
investment
income
(loss)(1)
| | |
Net gain
(loss) on
investments
(both
realized
and
unrealized)
| | | Total from
investment
operations
| | | Dividends
from net
investment
income
| | | Distributions
from net
realized
gains
| | | Total
Distri-
butions
| | | Net
Asset
Value
end of
period
| | | Total
Return(2)
| | | Net
Assets
end of
period
(000's)
| | | Ratio of
expenses
to average
net assets(3)
| | | Ratio
of net
investment
income
(loss) to
average
net assets(3)
| | | Portfolio
Turnover
| |
|
AIG FOCUSED
ALPHA LARGE-CAP FUND
| |
|
Class A
|
|
| 10/31/16 | | $ | 26.56 | | | $ | (0.11 | ) | | $ | (0.14 | ) | | $ | (0.25 | ) | | $ | — | | | $ | (2.61 | ) | | $ | (2.61 | ) | | $ | 23.70 | | | | (0.91 | )% | | $ | 413,090 | | | | 1.67 | % | | | (0.47 | )% | | | 38 | % |
| 10/31/17 | | | 23.70 | | | | (0.07 | ) | | | 8.28 | | | | 8.21 | | | | — | | | | — | | | | — | | | | 31.91 | | | | 34.64 | | | | 505,796 | | | | 1.65 | | | | (0.26 | ) | | | 68 | |
| 10/31/18 | | | 31.91 | | | | (0.06 | ) | | | 2.30 | | | | 2.24 | | | | — | | | | (2.73 | ) | | | (2.73 | ) | | | 31.42 | | | | 7.46 | | | | 572,092 | | | | 1.64 | | | | (0.20 | ) | | | 65 | |
| 10/31/19 | | | 31.42 | | | | (0.00 | ) | | | 2.42 | | | | 2.42 | | | | — | | | | (5.28 | ) | | | (5.28 | ) | | | 28.56 | | | | 9.96 | | | | 570,081 | | | | 1.64 | | | | (0.01 | ) | | | 94 | |
| 10/31/20 | | | 28.56 | | | | (0.01 | ) | | | 3.03 | | | | 3.02 | | | | — | | | | (2.97 | ) | | | (2.97 | ) | | | 28.61 | | | | 11.67 | | | | 574,028 | | | | 1.64 | | | | (0.04 | ) | | | 75 | |
|
Class C
|
|
| 10/31/16 | | $ | 25.89 | | | $ | (0.26 | ) | | $ | (0.14 | ) | | $ | (0.40 | ) | | $ | — | | | $ | (2.61 | ) | | $ | (2.61 | ) | | $ | 22.88 | | | | (1.58 | )% | | $ | 106,319 | | | | 2.32 | % | | | (1.12 | )% | | | 38 | % |
| 10/31/17 | | | 22.88 | | | | (0.24 | ) | | | 7.97 | | | | 7.73 | | | | — | | | | — | | | | — | | | | 30.61 | | | | 33.78 | | | | 118,151 | | | | 2.30 | | | | (0.91 | ) | | | 68 | |
| 10/31/18 | | | 30.61 | | | | (0.26 | ) | | | 2.21 | | | | 1.95 | | | | — | | | | (2.73 | ) | | | (2.73 | ) | | | 29.83 | | | | 6.78 | | | | 35,561 | | | | 2.30 | | | | (0.81 | ) | | | 65 | |
| 10/31/19 | | | 29.83 | | | | (0.17 | ) | | | 2.25 | | | | 2.08 | | | | — | | | | (5.28 | ) | | | (5.28 | ) | | | 26.63 | | | | 9.24 | | | | 34,632 | | | | 2.30 | | | | (0.67 | ) | | | 94 | |
| 10/31/20 | | | 26.63 | | | | (0.19 | ) | | | 2.80 | | | | 2.61 | | | | — | | | | (2.97 | ) | | | (2.97 | ) | | | 26.27 | | | | 10.90 | | | | 21,653 | | | | 2.31 | | | | (0.72 | ) | | | 75 | |
|
Class W
|
|
| 10/31/16 | | $ | 26.77 | | | $ | (0.08 | ) | | $ | (0.15 | ) | | $ | (0.23 | ) | | $ | — | | | $ | (2.61 | ) | | $ | (2.61 | ) | | $ | 23.93 | | | | (0.82 | )% | | $ | 8,368 | | | | 1.52%(4) | | | | (0.31 | )%(4) | | | 38 | % |
| 10/31/17 | | | 23.93 | | | | (0.05 | ) | | | 8.39 | | | | 8.34 | | | | — | | | | — | | | | — | | | | 32.27 | | | | 34.85 | | | | 15,342 | | | | 1.52(4) | | | | (0.18 | )(4) | | | 68 | |
| 10/31/18 | | | 32.27 | | | | (0.03 | ) | | | 2.34 | | | | 2.31 | | | | — | | | | (2.73 | ) | | | (2.73 | ) | | | 31.85 | | | | 7.60 | | | | 20,240 | | | | 1.52(4) | | | | (0.09 | )(4) | | | 65 | |
| 10/31/19 | | | 31.85 | | | | 0.03 | | | | 2.46 | | | | 2.49 | | | | — | | | | (5.28 | ) | | | (5.28 | ) | | | 29.06 | | | | 10.07 | | | | 23,054 | | | | 1.52(4) | | | | 0.11 | (4) | | | 94 | |
| 10/31/20 | | | 29.06 | | | | 0.02 | | | | 3.10 | | | | 3.12 | | | | — | | | | (2.97 | ) | | | (2.97 | ) | | | 29.21 | | | | 11.82 | | | | 38,121 | | | | 1.51 | (4) | | | 0.06 | (4) | | | 75 | |
| (1) | Calculated based upon average shares outstanding. |
| (2) | Total return does not reflect sales load, but does include expense reimbursements and expense reductions. |
| (3) | Excludes expense reductions. If expense reductions had been applied, the ratio of expenses to average net assets would have been lower and the ratio of net investment income (loss) to average net assets would have been higher by the following: |
| | | | | | | | | | | | | | | | | | | | |
| | | 10/31/16
| | | 10/31/17
| | | 10/31/18
| | | 10/31/19
| | | 10/31/20
| |
Focused Alpha Large-Cap Fund Class A | | | 0.00 | % | | | 0.00 | % | | | 0.00 | % | | | 0.00 | % | | | 0.00 | % |
Focused Alpha Large-Cap Fund Class C | | | 0.00 | | | | 0.00 | | | | 0.00 | | | | 0.00 | | | | 0.00 | |
Focused Alpha Large-Cap Fund Class W | | | 0.00 | | | | 0.00 | | | | 0.00 | | | | 0.00 | | | | 0.00 | |
| (4) | Net of following expense reimbursements, waivers and (recoupments), if applicable (based on average net assets): |
| | | | | | | | | | | | | | | | | | | | |
| | | 10/31/16
| | | 10/31/17
| | | 10/31/18
| | | 10/31/19
| | | 10/31/20
| |
Focused Alpha Large-Cap Fund Class A | | | — | % | | | — | % | | | — | % | | | — | % | | | — | % |
Focused Alpha Large-Cap Fund Class C | | | — | | | | — | | | | — | | | | — | | | | — | |
Focused Alpha Large-Cap Fund Class W | | | 0.08 | | | | 0.01 | | | | (0.00 | ) | | | (0.01 | ) | | | (0.01 | ) |
See Notes to Financial Statements
SunAmerica Specialty Series
FINANCIAL HIGHLIGHTS — (continued)
| | | | | | | | | | | | | | | | | | | | | | | | | | | | | | | | | | | | | | | | | | | | | | | | | | | | |
Period Ended
| | Net
Asset
Value
beginning
of period
| | | Net
investment
income
(loss)(1)
| | | Net gain
(loss) on
investments
(both
realized
and
unrealized)
| | | Total from
investment
operations
| | | Dividends
from net
investment
income
| | | Distributions
from net
realized
gains
| | | Total
Distri-
butions
| | | Net
Asset
Value
end of
period
| | | Total
Return(2)
| | | Net
Assets
end of
period
(000's)
| | | Ratio of
expenses
to average
net assets(3)
| | | Ratio
of net
investment
income
(loss) to
average
net assets(3)
| | | Portfolio
Turnover
| |
| | | | | | | | | | | | | | | | | | | | | | | | | | | | | | | | | | | | | | | | | | | | | | | | | | | | | |
AIG FOCUSED GROWTH FUND
| |
|
Class A
|
|
| 10/31/16 | | $ | 26.85 | | | $ | (0.25 | ) | | $ | 0.43 | | | $ | 0.18 | | | $ | — | | | $ | (3.27 | ) | | $ | (3.27 | ) | | $ | 23.76 | | | | 0.75 | % | | $ | 369,683 | | | | 1.68 | % | | | (1.07 | )% | | | 29 | % |
| 10/31/17 | | | 23.76 | | | | (0.25 | ) | | | 8.52 | | | | 8.27 | | | | — | | | | (0.39 | ) | | | (0.39 | ) | | | 31.64 | | | | 35.38 | | | | 456,940 | | | | 1.66 | | | | (0.93 | ) | | | 66 | |
| 10/31/18 | | | 31.64 | | | | (0.33 | ) | | | 1.93 | | | | 1.60 | | | | — | | | | (2.61 | ) | | | (2.61 | ) | | | 30.63 | | | | 5.41 | | | | 493,051 | | | | 1.65 | | | | (1.03 | ) | | | 94 | |
| 10/31/19 | | | 30.63 | | | | (0.13 | ) | | | 0.94 | | | | 0.81 | | | | — | | | | (5.96 | ) | | | (5.96 | ) | | | 25.48 | | | | 3.95 | | | | 445,683 | | | | 1.16 | (4) | | | (0.50 | )(4) | | | 92 | |
| 10/31/20 | | | 25.48 | | | | (0.15 | ) | | | 8.28 | | | | 8.13 | | | | — | | | | (2.59 | ) | | | (2.59 | ) | | | 31.02 | | | | 35.20 | | | | 539,061 | | | | 1.13 | (4) | | | (0.56 | )(4) | | | 53 | |
|
Class C
|
|
| 10/31/16 | | $ | 26.15 | | | $ | (0.39 | ) | | $ | 0.41 | | | $ | 0.02 | | | $ | — | | | $ | (3.27 | ) | | $ | (3.27 | ) | | $ | 22.90 | | | | 0.09 | % | | $ | 81,943 | | | | 2.33 | % | | | (1.72 | )% | | | 29 | % |
| 10/31/17 | | | 22.90 | | | | (0.41 | ) | | | 8.17 | | | | 7.76 | | | | — | | | | (0.39 | ) | | | (0.39 | ) | | | 30.27 | | | | 34.47 | | | | 90,491 | | | | 2.32 | | | | (1.59 | ) | | | 66 | |
| 10/31/18 | | | 30.27 | | | | (0.52 | ) | | | 1.86 | | | | 1.34 | | | | — | | | | (2.61 | ) | | | (2.61 | ) | | | 29.00 | | | | 4.74 | | | | 68,173 | | | | 2.31 | | | | (1.70 | ) | | | 94 | |
| 10/31/19 | | | 29.00 | | | | (0.28 | ) | | | 0.86 | | | | 0.58 | | | | — | | | | (5.96 | ) | | | (5.96 | ) | | | 23.62 | | | | 3.25 | | | | 52,219 | | | | 1.81 | (4) | | | (1.15 | )(4) | | | 92 | |
| 10/31/20 | | | 23.62 | | | | (0.30 | ) | | | 7.60 | | | | 7.30 | | | | — | | | | (2.59 | ) | | | (2.59 | ) | | | 28.33 | | | | 34.37 | | | | 48,423 | | | | 1.78 | (4) | | | (1.20 | )(4) | | | 53 | |
|
Class W
|
|
| 10/31/16 | | $ | 27.05 | | | $ | (0.21 | ) | | $ | 0.43 | | | $ | 0.22 | | | $ | — | | | $ | (3.27 | ) | | $ | (3.27 | ) | | $ | 24.00 | | | | 0.91 | % | | $ | 30,065 | | | | 1.51 | % | | | (0.86 | )% | | | 29 | % |
| 10/31/17 | | | 24.00 | | | | (0.20 | ) | | | 8.62 | | | | 8.42 | | | | — | | | | (0.39 | ) | | | (0.39 | ) | | | 32.03 | | | | 35.65 | | | | 45,470 | | | | 1.48 | | | | (0.75 | ) | | | 66 | |
| 10/31/18 | | | 32.03 | | | | (0.27 | ) | | | 1.96 | | | | 1.69 | | | | — | | | | (2.61 | ) | | | (2.61 | ) | | | 31.11 | | | | 5.64 | | | | 76,957 | | | | 1.45 | | | | (0.83 | ) | | | 94 | |
| 10/31/19 | | | 31.11 | | | | (0.08 | ) | | | 0.96 | | | | 0.88 | | | | — | | | | (5.96 | ) | | | (5.96 | ) | | | 26.03 | | | | 4.14 | | | | 47,508 | | | | 0.97 | (4) | | | (0.30 | )(4) | | | 92 | |
| 10/31/20 | | | 26.03 | | | | (0.09 | ) | | | 8.48 | | | | 8.39 | | | | — | | | | (2.59 | ) | | | (2.59 | ) | | | 31.83 | | | | 35.48 | | | | 41,031 | | | | 0.93 | (4) | | | (0.33 | )(4) | | | 53 | |
| (1) | Calculated based upon average shares outstanding. |
| (2) | Total return does not reflect sales load, but does include expense reimbursements and expense reductions. |
| (3) | Excludes expense reductions. If expense reductions had been applied, the ratio of expenses to average net assets would have been lower and the ratio of net investment income (loss) to average net assets would have been higher by the following: |
| | | | | | | | | | | | | | | | | | | | |
| | | 10/31/16
| | | 10/31/17
| | | 10/31/18
| | | 10/31/19
| | | 10/31/20
| |
Focused Growth Fund Class A | | | 0.00 | % | | | 0.00 | % | | | 0.00 | % | | | 0.00 | % | | | 0.00 | % |
Focused Growth Fund Class C | | | 0.00 | | | | 0.00 | | | | 0.00 | | | | 0.00 | | | | 0.00 | |
Focused Growth Fund Class W | | | 0.00 | | | | 0.00 | | | | 0.00 | | | | 0.00 | | | | 0.00 | |
| (4) | Net of following expense reimbursements, waivers and (recoupments), if applicable (based on average net assets): |
| | | | | | | | |
| | | 10/31/19
| | | 10/31/20
| |
Focused Growth Fund Class A | | | 0.51 | % | | | 0.53 | % |
Focused Growth Fund Class C | | | 0.52 | | | | 0.54 | |
Focused Growth Fund Class W | | | 0.51 | | | | 0.54 | |
See Notes to Financial Statements
SunAmerica Specialty Series
FINANCIAL HIGHLIGHTS — (continued)
| | | | | | | | | | | | | | | | | | | | | | | | | | | | | | | | | | | | | | | | | | | | | | | | | | | | | | | | |
Period Ended
| | Net
Asset
Value
beginning
of period
| | | Net
investment
income(1)
| | | Net gain
(loss) on
investments
(both
realized
and
unrealized)
| | | Total from
investment
operations
| | | Dividends
from net
investment
income
| | | Return
of
Capital
| | | Distributions
from
net realized
gains
| | | Total
Distri-
butions
| | | Net
Asset
Value
end of
period
| | | Total
Return(2)
| | | Net
Assets
end of
period
(000’s)
| | | Ratio of
expenses
to average
net assets(3)
| | | Ratio
of net
investment
income to
average
net assets(3)
| | | Portfolio
Turnover
| |
| | | | | | | | | | | | | | | | | | | | | | | | | | | | | | | | | | | | | | | | | | | | | | | | | | | | | | | | | |
AIG INCOME EXPLORER FUND
| |
|
Class A
|
|
| 10/31/16 | | $ | 13.92 | | | $ | 0.62 | | | $ | 0.60 | | | $ | 1.22 | | | $ | (0.64 | ) | | $ | — | | | $ | — | | | $ | (0.64 | ) | | $ | 14.50 | | | | 9.10 | % | | $ | 22,195 | | | | 1.72 | % | | | 4.42 | % | | | 54 | % |
| 10/31/17 | | | 14.50 | | | | 0.65 | | | | 1.23 | | | | 1.88 | | | | (0.57 | ) | | | — | | | | — | | | | (0.57 | ) | | | 15.81 | | | | 13.21 | (4) | | | 31,625 | | | | 1.72 | | | | 4.30 | | | | 49 | |
| 10/31/18 | | | 15.81 | | | | 0.57 | | | | (1.08 | ) | | | (0.51 | ) | | | (0.68 | ) | | | — | | | | (0.01 | ) | | | (0.69 | ) | | | 14.61 | | | | (3.42 | ) | | | 44,413 | | | | 1.72 | | | | 3.77 | | | | 51 | |
| 10/31/19 | | | 14.61 | | | | 0.67 | | | | 1.16 | | | | 1.83 | | | | (0.70 | ) | | | — | | | | (0.15 | ) | | | (0.85 | ) | | | 15.59 | | | | 13.02 | | | | 35,512 | | | | 1.72 | | | | 4.45 | | | | 31 | |
| 10/31/20 | | | 15.59 | | | | 0.49 | | | | (2.06 | ) | | | (1.57 | ) | | | (0.48 | ) | | | (0.03 | ) | | | — | | | | (0.51 | ) | | | 13.51 | | | | (10.14 | ) | | | 30,766 | | | | 1.25 | | | | 3.39 | | | | 138 | |
|
Class C
|
|
| 10/31/16 | | $ | 13.90 | | | $ | 0.52 | | | $ | 0.61 | | | $ | 1.13 | | | $ | (0.55 | ) | | $ | — | | | $ | — | | | $ | (0.55 | ) | | $ | 14.48 | | | | 8.42 | % | | $ | 3,307 | | | | 2.37 | % | | | 3.75 | % | | | 54 | % |
| 10/31/17 | | | 14.48 | | | | 0.55 | | | | 1.22 | | | | 1.77 | | | | (0.47 | ) | | | — | | | | — | | | | (0.47 | ) | | | 15.78 | | | | 12.43 | (4) | | | 4,954 | | | | 2.37 | | | | 3.65 | | | | 49 | |
| 10/31/18 | | | 15.78 | | | | 0.50 | | | | (1.11 | ) | | | (0.61 | ) | | | (0.58 | ) | | | — | | | | (0.01 | ) | | | (0.59 | ) | | | 14.58 | | | | (4.07 | ) | | | 4,360 | | | | 2.37 | | | | 3.17 | | | | 51 | |
| 10/31/19 | | | 14.58 | | | | 0.57 | | | | 1.17 | | | | 1.74 | | | | (0.61 | ) | | | — | | | | (0.15 | ) | | | (0.76 | ) | | | 15.56 | | | | 12.31 | | | | 3,595 | | | | 2.37 | | | | 3.82 | | | | 31 | |
| 10/31/20 | | | 15.56 | | | | 0.39 | | | | (2.03 | ) | | | (1.64 | ) | | | (0.40 | ) | | | (0.02 | ) | | | — | | | | (0.42 | ) | | | 13.50 | | | | (10.59 | ) | | | 2,402 | | | | 1.93 | | | | 2.68 | | | | 138 | |
|
Class W
|
|
| 10/31/16 | | $ | 13.91 | | | $ | 0.63 | | | $ | 0.63 | | | $ | 1.26 | | | $ | (0.67 | ) | | $ | — | | | $ | — | | | $ | (0.67 | ) | | $ | 14.50 | | | | 9.38 | % | | $ | 505 | | | | 1.52 | % | | | 4.65 | % | | | 54 | % |
| 10/31/17 | | | 14.50 | | | | 0.54 | | | | 1.37 | | | | 1.91 | | | | (0.60 | ) | | | — | | | | — | | | | (0.60 | ) | | | 15.81 | | | | 13.44 | (4) | | | 7,927 | | | | 1.52 | | | | 3.95 | | | | 49 | |
| 10/31/18 | | | 15.81 | | | | 0.61 | | | | (1.09 | ) | | | (0.48 | ) | | | (0.71 | ) | | | — | | | | (0.01 | ) | | | (0.72 | ) | | | 14.61 | | | | (3.24 | ) | | | 6,220 | | | | 1.52 | | | | 3.94 | | | | 51 | |
| 10/31/19 | | | 14.61 | | | | 0.72 | | | | 1.14 | | | | 1.86 | | | | (0.73 | ) | | | — | | | | (0.15 | ) | | | (0.88 | ) | | | 15.59 | | | | 13.24 | | | | 4,366 | | | | 1.52 | | | | 4.73 | | | | 31 | |
| 10/31/20 | | | 15.59 | | | | 0.51 | | | | (2.06 | ) | | | (1.55 | ) | | | (0.51 | ) | | | (0.03 | ) | | | — | | | | (0.54 | ) | | | 13.50 | | | | (10.03 | ) | | | 2,199 | | | | 1.12 | | | | 3.43 | | | | 138 | |
| (1) | Calculated based upon average shares outstanding. |
| (2) | Total return does not reflect sales load, but does include expense reimbursements and expense reductions. |
| (3) | Net of following expense reimbursements, waivers and (recoupments), if applicable (based on average net assets): |
| | | | | | | | | | | | | | | | | | | | |
| | | 10/31/16
| | | 10/31/17
| | | 10/31/18
| | | 10/31/19
| | | 10/31/20
| |
Income Explorer Fund Class A | | | 0.52 | % | | | 0.40 | % | | | 0.26 | % | | | 0.41 | % | | | 1.07 | % |
Income Explorer Fund Class C | | | 0.97 | | | | 0.56 | | | | 0.52 | | | | 0.73 | | | | 1.49 | |
Income Explorer Fund Class W | | | 4.00 | | | | 0.71 | | | | 0.46 | | | | 0.59 | | | | 1.42 | |
| (4) | The Fund’s performance figure was increased by less than 0.01% from gains on the disposal of investments in violation of investment restrictions. |
See Notes to Financial Statements
SunAmerica Specialty Series
FINANCIAL HIGHLIGHTS — (continued)
| | | | | | | | | | | | | | | | | | | | | | | | | | | | | | | | | | | | | | | | | | | | | | | | | | | | |
Period Ended
| | Net
Asset
Value
beginning
of period
| | | Net
investment
income(1)
| | | Net gain
(loss) on
investments
(both
realized
and
unrealized)
| | | Total from
investment
operations
| | | Dividends
from net
investment
income
| | | Distributions
from
net realized
gains
| | | Total
Distri-
butions
| | | Net
Asset
Value
end of
period
| | | Total
Return(2)
| | | Net
Assets
end of
period
(000’s)
| | | Ratio of
expenses
to average
net assets(3)
| | | Ratio
of net
investment
income to
average
net assets(3)
| | | Portfolio
Turnover
| |
| | | | | | | | | | | | | | | | | | | | | | | | | | | | | | | | | | | | | | | | | | | | | | | | | | | | | |
AIG SMALL-CAP FUND
| |
|
Class A
|
|
| 10/31/16 | | $ | 16.42 | | | $ | (0.10 | ) | | $ | 0.75 | | | $ | 0.65 | | | $ | — | | | $ | (1.32 | ) | | $ | (1.32 | ) | | $ | 15.75 | | | | 4.61 | % | | $ | 42,739 | | | | 1.72 | % | | | (0.66 | )% | | | 67 | % |
| 10/31/17 | | | 15.75 | | | | (0.14 | ) | | | 5.22 | | | | 5.08 | | | | — | | | | (0.52 | ) | | | (0.52 | ) | | | 20.31 | | | | 32.76 | | | | 48,384 | | | | 1.72 | | | | (0.79 | ) | | | 65 | |
| 10/31/18 | | | 20.31 | | | | (0.19 | ) | | | 0.92 | | | | 0.73 | | | | — | | | | (2.00 | ) | | | (2.00 | ) | | | 19.04 | | | | 4.05 | | | | 50,471 | | | | 1.73 | | | | (0.97 | ) | | | 63 | |
| 10/31/19 | | | 19.04 | | | | (0.07 | ) | | | (0.75 | ) | | | (0.82 | ) | | | — | | | | (1.80 | ) | | | (1.80 | ) | | | 16.42 | | | | (4.07 | ) | | | 37,069 | | | | 1.28 | | | | (0.43 | ) | | | 63 | |
| 10/31/20 | | | 16.42 | | | | (0.06 | ) | | | (0.84 | ) | | | (0.90 | ) | | | — | | | | (0.38 | ) | | | (0.38 | ) | | | 15.14 | | | | (5.68 | ) | | | 31,579 | | | | 1.25 | | | | (0.40 | ) | | | 68 | |
|
Class C
|
|
| 10/31/16 | | $ | 16.24 | | | $ | (0.19 | ) | | $ | 0.72 | | | $ | 0.53 | | | $ | — | | | $ | (1.32 | ) | | $ | (1.32 | ) | | $ | 15.45 | | | | 3.87 | % | | $ | 811 | | | | 2.37 | % | | | (1.33 | )% | | | 67 | % |
| 10/31/17 | | | 15.45 | | | | (0.26 | ) | | | 5.11 | | | | 4.85 | | | | — | | | | (0.52 | ) | | | (0.52 | ) | | | 19.78 | | | | 31.89 | | | | 1,944 | | | | 2.37 | | | | (1.48 | ) | | | 65 | |
| 10/31/18 | | | 19.78 | | | | (0.31 | ) | | | 0.89 | | | | 0.58 | | | | — | | | | (2.00 | ) | | | (2.00 | ) | | | 18.36 | | | | 3.34 | | | | 3,099 | | | | 2.38 | | | | (1.64 | ) | | | 63 | |
| 10/31/19 | | | 18.36 | | | | (0.17 | ) | | | (0.72 | ) | | | (0.89 | ) | | | — | | | | (1.80 | ) | | | (1.80 | ) | | | 15.67 | | | | (4.66 | ) | | | 2,551 | | | | 1.92 | | | | (1.08 | ) | | | 63 | |
| 10/31/20 | | | 15.67 | | | | (0.15 | ) | | | (0.80 | ) | | | (0.95 | ) | | | — | | | | (0.38 | ) | | | (0.38 | ) | | | 14.34 | | | | (6.29 | ) | | | 1,571 | | | | 1.90 | | | | (1.02 | ) | | | 68 | |
|
Class W
|
|
| 10/31/16 | | $ | 16.48 | | | $ | (0.07 | ) | | $ | 0.75 | | | $ | 0.68 | | | $ | — | | | $ | (1.32 | ) | | $ | (1.32 | ) | | $ | 15.84 | | | | 4.79 | % | | $ | 341 | | | | 1.52 | % | | | (0.47 | )% | | | 67 | % |
| 10/31/17 | | | 15.84 | | | | (0.12 | ) | | | 5.26 | | | | 5.14 | | | | — | | | | (0.52 | ) | | | (0.52 | ) | | | 20.46 | | | | 32.96 | | | | 8,230 | | | | 1.52 | | | | (0.70 | ) | | | 65 | |
| 10/31/18 | | | 20.46 | | | | (0.16 | ) | | | 0.94 | | | | 0.78 | | | | — | | | | (2.00 | ) | | | (2.00 | ) | | | 19.24 | | | | 4.29 | | | | 16,806 | | | | 1.53 | | | | (0.81 | ) | | | 63 | |
| 10/31/19 | | | 19.24 | | | | (0.04 | ) | | | (0.76 | ) | | | (0.80 | ) | | | — | | | | (1.80 | ) | | | (1.80 | ) | | | 16.64 | | | | (3.90 | ) | | | 5,918 | | | | 1.11 | | | | (0.23 | ) | | | 63 | |
| 10/31/20 | | | 16.64 | | | | (0.01 | ) | | | (0.87 | ) | | | (0.88 | ) | | | — | | | | (0.38 | ) | | | (0.38 | ) | | | 15.38 | | | | (5.48 | ) | | | 1,927 | | | | 1.05 | | | | (0.05 | ) | | | 68 | |
| (1) | Calculated based upon average shares outstanding. |
| (2) | Total return does not reflect sales load, but does include expense reimbursements and expense reductions. |
| (3) | Net of following expense reimbursements, waivers and (recoupments), if applicable (based on average net assets): |
| | | | | | | | | | | | | | | | | | | | |
| | | 10/31/16
| | | 10/31/17
| | | 10/31/18
| | | 10/31/19
| | | 10/31/20
| |
Small Cap Fund Class A | | | 0.26 | % | | | 0.29 | % | | | 0.22 | % | | | 0.82 | % | | | 1.12 | % |
Small Cap Fund Class C | | | 2.27 | | | | 0.96 | | | | 0.75 | | | | 1.16 | | | | 1.67 | |
Small Cap Fund Class W | | | 5.01 | | | | 0.50 | | | | 0.36 | | | | 1.01 | | | | 1.45 | |
See Notes to Financial Statements
SunAmerica Specialty Series — AIG Commodity Strategy Fund
PORTFOLIO PROFILE — October 31, 2020@ — (unaudited)
Industry Allocation*
| | | | |
U.S. Government Treasuries | | | 50.8 | % |
Repurchase Agreements | | | 24.0 | |
Federal Home Loan Bank | | | 9.8 | |
United States Treasury Notes | | | 3.4 | |
Federal Farm Credit Bank | | | 3.2 | |
Investment Companies | | | 1.6 | |
Options Purchased | | | 0.1 | |
| | |
|
|
|
| | | | 92.9 | % |
| | |
|
|
|
| * | | Calculated as a percentage of net assets |
Credit Quality†**
| @ | Consolidated (See Note 2) |
| ** | Calculated as a percentage of total debt issues, excluding short-term securities. |
SunAmerica Specialty Series — AIG Commodity Strategy Fund
PORTFOLIO OF INVESTMENTS — October 31, 2020@
| | | | | | | | |
| Security Description | | Shares/
Principal
Amount | | | Value
(Note 3) | |
|
|
U.S. GOVERNMENT AGENCIES — 6.5% | |
Federal Farm Credit Bank FRS — 3.2% | |
0.16% (1 ML + 0.01%)
due 12/11/2020 | | $ | 250,000 | | | $ | 250,003 | |
0.18% (SOFR + 0.10%)
due 05/07/2021 | | | 50,000 | | | | 50,017 | |
0.19% (1 ML + 0.05%)
due 03/01/2021 | | | 200,000 | | | | 200,038 | |
0.22% (1 ML + 0.08%)
due 02/01/2021 | | | 300,000 | | | | 300,067 | |
| | | | | | |
|
|
|
| | | | | | | | 800,125 | |
| | | | | | |
|
|
|
Federal Home Loan Bank FRS — 3.3% | |
0.10% (3 ML - 0.14%)
due 12/18/2020 | | | 125,000 | | | | 125,006 | |
0.10% (3 ML - 0.14%)
due 01/04/2021 | | | 125,000 | | | | 124,998 | |
0.11% (SOFR + 0.03%)
due 11/06/2020 | | | 180,000 | | | | 180,000 | |
0.13% (SOFR + 0.05%)
due 01/22/2021 | | | 175,000 | | | | 175,012 | |
0.13% (SOFR + 0.05%)
due 01/28/2021 | | | 190,000 | | | | 190,013 | |
0.13% (3 ML - 0.12%)
due 11/03/2020 | | | 50,000 | | | | 50,000 | |
| | | | | | |
|
|
|
| | | | | | | | 845,029 | |
| | | | | | |
|
|
|
Total U.S. Government Agencies | | | | | | | | |
(cost $1,645,019) | | | | | | | 1,645,154 | |
| | | |
|
|
|
U.S. GOVERNMENT TREASURIES — 3.4% | |
United States Treasury Notes FRS — 3.4% | |
0.22% (3 UTBMM + 0.12%)
due 01/31/2021 | | | 600,000 | | | | 600,137 | |
0.24% (3 UTBMM + 0.14%)
due 04/30/2021 | | | 250,000 | | | | 250,168 | |
| | | | | | |
|
|
|
Total U.S. Government Treasuries | | | | | | | | |
(cost $849,951) | | | | | | | 850,305 | |
| | | |
|
|
|
COMMON STOCKS — 1.6% | |
Investment Companies — 1.6% | |
Uranium Participation Corp.†(1)
(cost $473,576) | | | 130,425 | | | | 391,579 | |
| | | | | | |
|
|
|
OPTIONS-PURCHASED†(1)(3) — 0.1% | |
Exchange Traded Call Options | | | 11 | | | | 29,415 | |
Exchange Traded Put Options | | | 2 | | | | 3,750 | |
| | | | | | |
|
|
|
Total Options-Purchased | | | | | | | | |
(cost $52,334) | | | | | | | 33,165 | |
| | | |
|
|
|
Total Long-Term Investment Securities | | | | | | | | |
(cost $3,020,880) | | | | | | | 2,920,203 | |
| | | |
|
|
|
SHORT-TERM INVESTMENT SECURITIES — 57.3% | |
Federal Home Loan Bank FRS — 6.5% | |
0.06% (3 ML - 0.17%)
due 01/08/2021 | | | 350,000 | | | | 349,984 | |
0.09% (3 ML - 0.20%)
due 11/16/2020 | | | 600,000 | | | | 599,995 | |
0.11% (1 ML - 0.04%)
due 12/17/2020 | | | 700,000 | | | | 700,025 | |
| | | | | | |
|
|
|
| | | | | | | | 1,650,004 | |
| | | | | | |
|
|
|
|
|
U.S. Government Treasuries — 50.8% | |
United States Cash Management Bills | |
0.09% due 01/12/2021 | | $ | 398,000 | | | $ | 397,933 | |
0.10% due 03/02/2021 | | | 400,000 | | | | 399,867 | |
0.11% due 01/05/2021 | | | 38,800 | | | | 38,794 | |
0.12%-0.14% due 12/29/2020 | | | 400,000 | | | | 399,943 | |
0.12% due 01/19/2021 | | | 600,000 | | | | 599,890 | |
0.12% due 03/23/2021 | | | 400,000 | | | | 399,851 | |
United States Treasury Bills | | | | | | | | |
0.08% due 12/10/2020 | | | 400,000 | | | | 399,962 | |
0.09% due 11/24/2020 | | | 400,000 | | | | 399,980 | |
0.09%-0.17% due 12/01/2020 | | | 600,000 | | | | 599,960 | |
0.09%-0.17% due 01/28/2021 | | | 575,000 | | | | 574,868 | |
0.10%-0.11% due 11/27/2020 | | | 518,400 | | | | 518,370 | |
0.10%-0.18% due 12/24/2020 | | | 500,000 | | | | 499,937 | |
0.10%-0.13% due 01/21/2021 | | | 652,000 | | | | 651,875 | |
0.10% due 02/25/2021 | | | 400,000 | | | | 399,871 | |
0.11% due 11/17/2020 | | | 219,500 | | | | 219,493 | |
0.11%-0.16% due 12/08/2020 | | | 800,000 | | | | 799,930 | |
0.11%-0.15% due 12/15/2020 | | | 480,000 | | | | 479,951 | |
0.11% due 12/17/2020 | | | 400,000 | | | | 399,956 | |
0.11% due 01/07/2021 | | | 361,200 | | | | 361,144 | |
0.11% due 01/14/2021 | | | 500,000 | | | | 499,915 | |
0.11%-0.12% due 02/18/2021 | | | 700,000 | | | | 699,797 | |
0.11% due 03/25/2021 | | | 400,000 | | | | 399,849 | |
0.11% due 04/29/2021 | | | 599,700 | | | | 599,381 | |
0.12%-0.15% due 11/19/2020 | | | 575,000 | | | | 574,978 | |
0.12% due 03/18/2021 | | | 400,000 | | | | 399,856 | |
0.12% due 04/15/2021 | | | 200,000 | | | | 199,911 | |
0.13% due 11/05/2020 | | | 177,600 | | | | 177,599 | |
0.15% due 11/12/2020 | | | 375,000 | | | | 374,993 | |
0.17% due 11/03/2020 | | | 323,300 | | | | 323,299 | |
| | | | | | |
|
|
|
| | | | | | | | 12,791,153 | |
| | | | | | |
|
|
|
Total Short-Term Investment Securities | | | | | | | | |
(cost $14,440,635) | | | | | | | 14,441,157 | |
| | | |
|
|
|
REPURCHASE AGREEMENTS — 24.0% | |
Bank of America Securities LLC Joint Repurchase Agreement(2) | | | 690,000 | | | | 690,000 | |
Bank of America Securities LLC Joint Repurchase Agreement(1)(2) | | | 500,000 | | | | 500,000 | |
Barclays Capital, Inc. Joint Repurchase Agreement(2) | | | 600,000 | | | | 600,000 | |
Barclays Capital, Inc. Joint Repurchase Agreement(1)(2) | | | 435,000 | | | | 435,000 | |
BNP Paribas SA Joint Repurchase Agreement(2) | | | 600,000 | | | | 600,000 | |
BNP Paribas SA Joint Repurchase Agreement(1)(2) | | | 435,000 | | | | 435,000 | |
Deutsche Bank AG Joint Repurchase Agreement(2) | | | 785,000 | | | | 785,000 | |
Deutsche Bank AG Joint Repurchase Agreement(1)(2) | | | 570,000 | | | | 570,000 | |
RBS Securities, Inc. Joint Repurchase Agreement(2) | | | 825,000 | | | | 825,000 | |
SunAmerica Specialty Series — AIG Commodity Strategy Fund
PORTFOLIO OF INVESTMENTS — October 31, 2020@ — (continued)
| | | | | | | | |
| Security Description | |
Principal
Amount | | | Value
(Note 3) | |
|
|
REPURCHASE AGREEMENTS (continued) | |
RBS Securities, Inc. Joint Repurchase Agreement(1)(2) | | $ | 605,000 | | | $ | 605,000 | |
| | | | | | |
|
|
|
Total Repurchase Agreements | | | | | | | | |
(cost $6,045,000) | | | | | | | 6,045,000 | |
| | | |
|
|
|
TOTAL INVESTMENTS | | | | | | | | |
(cost $23,506,515)(4) | | | 92.9 | % | | | 23,406,360 | |
Other assets less liabilities | | | 7.1 | | | | 1,790,276 | |
| | |
|
|
| |
|
|
|
NET ASSETS | | | 100.0 | % | | $ | 25,196,636 | |
| | |
|
|
| |
|
|
|
| @ | Consolidated (see Note 2) |
| † | Non-income producing security |
| (1) | The security is owned by the AIG Commodity Strategy Cayman Fund, Ltd., which is a wholly-owned subsidiary of the AIG Commodity Strategy Fund. |
| (2) | See Note 3 for details of Joint Repurchase Agreements. |
| | | | | | | | | | | | | | | | | | | | | | | | | | | | |
Exchange Traded Call Options(a)
| |
Issue
| | Expiration
Month
| | | Strike
Price
| | | Number of
Contracts
| | | Notional
Amount*
| | | Premiums
Paid
| | | Value at
October 31,
2020
| | | Unrealized
Appreciation
(Depreciation)
| |
| Coffee | | | December 2020 | | | $ | 120 | | | | 5 | | | $ | 3 | | | $ | 12,206 | | | $ | 225 | | | $ | (11,981 | ) |
| Natural Gas | | | March 2021 | | | | 3 | | | | 6 | | | | 281 | | | | 25,140 | | | | 29,190 | | | | 4,050 | |
| | | | | | | | | | | | | | | | | | |
|
|
| |
|
|
| |
|
|
|
| | | | | | | | | | | | | | | | | | | $ | 37,346 | | | $ | 29,415 | | | $ | (7,931 | ) |
| | | | | | | | | | | | | | | | | | |
|
|
| |
|
|
| |
|
|
|
| * | Notional amount is calculated by multiplying the number of contracts by the multiplier by the market value of the underlying security or index. |
| | | | | | | | | | | | | | | | | | | | | | | | | | |
Exchange Traded Put Options(a)
| |
Issue
| | Expiration
Month
| | Strike
Price
| | | Number of
Contracts
| | | Notional
Amount*
| | | Premiums
Paid
| | | Value at
October 31,
2020
| | | Unrealized
Appreciation
(Depreciation)
| |
| Copper | | December 2020 | | $ | 6,375 | | | | 2 | | | $ | 38 | | | $ | 14,988 | | | $ | 3,750 | | | $ | (11,238 | ) |
| | | | | | | | | | | | | | | | |
|
|
| |
|
|
| |
|
|
|
| * | Notional amount is calculated by multiplying the number of contracts by the multiplier by the market value of the underlying security or index. |
| (4) | See Note 6 for cost of investments on a tax basis. |
FRS — Floating Rate Security
The rates on FRS are the current interest rates as of October 31, 2020 and unless otherwise, the dates shown are the original maturity dates.
Index Legend
1 ML — 1 Month USD LIBOR
3ML — 3 Month USD LIBOR
SOFR — Secured Overnight Financing Rate
3 UTBMM — US Treasury 3 Month Bill Money Market Yield
| | | | | | | | | | | | | | | | | | | | | | | | | | | | |
Exchange Traded Written Call Options(a)
| |
Issue
| | Expiration
Month
| | | Strike
Price
| | | Number of
Contracts
| | | Notional
Amount*
| | | Premiums
Paid
| | | Value at
October 31,
2020
| | | Unrealized
Appreciation
(Depreciation)
| |
| Natural Gas | | | March 2021 | | | $ | 4 | | | | 6 | | | $ | 166 | | | $ | 16,050 | | | $ | 17,160 | | | $ | (1,110 | ) |
| | | | | | | | | | | | | | | | | | |
|
|
| |
|
|
| |
|
|
|
| * | Notional amount is calculated by multiplying the number of contracts by the multiplier by the market value of the underlying security or index. |
SunAmerica Specialty Series — AIG Commodity Strategy Fund
PORTFOLIO OF INVESTMENTS — October 31, 2020@ — (continued)
| | | | | | | | | | | | | | | | | | | | |
Futures Contracts(a)
| |
Number of
Contracts
| | Type
| | Description
| | Expiration Month
| | | Notional
Basis**
| | | Notional
Value**
| | | Unrealized
Appreciation
| |
| 11 | | Long | | Aluminum Futures | | | December 2020 | | | $ | 423,815 | | | $ | 509,575 | | | $ | 85,760 | |
| 6 | | Short | | Brent Crude Futures | | | December 2022 | | | | 273,280 | | | | 261,600 | | | | 11,680 | |
| 7 | | Short | | Brent Crude Futures | | | December 2023 | | | | 341,750 | | | | 316,260 | | | | 25,490 | |
| 16 | | Long | | Brent Crude Futures | | | April 2021 | | | | 621,710 | | | | 628,480 | | | | 6,770 | |
| 11 | | Long | | Copper Futures | | | December 2020 | | | | 1,466,867 | | | | 1,846,556 | | | | 379,689 | |
| 15 | | Long | | Corn Futures | | | December 2020 | | | | 275,212 | | | | 298,875 | | | | 23,663 | |
| 4 | | Long | | Cotton Futures | | | December 2020 | | | | 118,800 | | | | 137,840 | | | | 19,040 | |
| 15 | | Long | | Gold Futures | | | December 2020 | | | | 2,770,930 | | | | 2,819,850 | | | | 48,920 | |
| 9 | | Long | | Lean Hogs Futures | | | December 2020 | | | | 227,810 | | | | 236,070 | | | | 8,260 | |
| 4 | | Short | | Lean Hogs Futures | | | June 2021 | | | | 130,760 | | | | 125,040 | | | | 5,720 | |
| 48 | | Long | | Natural Gas Futures | | | January 2021 | | | | 1,609,110 | | | | 1,665,120 | | | | 56,010 | |
| 5 | | Long | | Natural Gas Futures | | | December 2020 | | | | 153,670 | | | | 167,700 | | | | 14,030 | |
| 9 | | Long | | Nickel Futures | | | December 2020 | | | | 685,263 | | | | 817,614 | | | | 132,351 | |
| 23 | | Long | | Soybean Futures | | | January 2021 | | �� | | 1,206,338 | | | | 1,214,688 | | | | 8,350 | |
| 12 | | Long | | Soybean Meal Futures | | | December 2020 | | | | 355,220 | | | | 454,320 | | | | 99,100 | |
| 30 | | Long | | Soybean Oil Futures | | | December 2020 | | | | 517,266 | | | | 604,980 | | | | 87,714 | |
| 35 | | Long | | Sugar Futures | | | March 2021 | | | | 508,693 | | | | 562,912 | | | | 54,219 | |
| 6 | | Long | | Wheat Futures | | | December 2020 | | | | 165,212 | | | | 179,550 | | | | 14,338 | |
| 16 | | Long | | Wheat Futures | | | December 2020 | | | | 360,112 | | | | 433,000 | | | | 72,888 | |
| 7 | | Long | | WTI Crude Futures | | | March 2021 | | | | 257,320 | | | | 259,000 | | | | 1,680 | |
| 9 | | Long | | Zinc Futures | | | December 2020 | | | | 451,273 | | | | 566,438 | | | | 115,165 | |
| | | | | | | | | | | | | | | | | | |
|
|
|
| | | | | | | | | | | | | | | | | | | $ | 1,270,837 | |
| | | | | | | | | | | | | | | | | | |
|
|
|
| | | | | | |
| | | | | | | | | | | | | | | | Unrealized
(Depreciation)
| |
| 10 | | Short | | Aluminum Futures | | | December 2020 | | | $ | 442,617 | | | $ | 463,250 | | | $ | (20,633 | ) |
| 17 | | Long | | Brent Crude Oil Futures | | | January 2021 | | | | 727,570 | | | | 644,980 | | | | (82,590 | ) |
| 10 | | Long | | Coffee Futures | | | March 2021 | | | | 413,063 | | | | 400,688 | | | | (12,375 | ) |
| 2 | | Long | | Copper Futures | | | March 2021 | | | | 338,000 | | | | 336,200 | | | | (1,800 | ) |
| 4 | | Short | | Copper Futures | | | December 2020 | | | | 636,352 | | | | 671,475 | | | | (35,123 | ) |
| 4 | | Long | | Corn Futures | | | July 2021 | | | | 82,213 | | | | 81,450 | | | | (763 | ) |
| 8 | | Long | | Gasoline Futures | | | December 2020 | | | | 366,589 | | | | 346,819 | | | | (19,770 | ) |
| 12 | | Long | | Live Cattle Futures | | | December 2020 | | | | 528,260 | | | | 519,840 | | | | (8,420 | ) |
| 8 | | Long | | Low Sulfur Gasoline Futures | | | January 2021 | | | | 263,475 | | | | 248,600 | | | | (14,875 | ) |
| 4 | | Long | | NY Harbor ULSD Futures | | | December 2020 | | | | 188,622 | | | | 182,431 | | | | (6,191 | ) |
| 5 | | Long | | Platinum Futures | | | January 2021 | | | | 228,485 | | | | 212,100 | | | | (16,385 | ) |
| 9 | | Long | | Silver Futures | | | December 2020 | | | | 1,231,005 | | | | 1,064,070 | | | | (166,935 | ) |
| 12 | | Long | | Soybean Meal Futures | | | March 2021 | | | | 435,701 | | | | 432,240 | | | | (3,461 | ) |
| 9 | | Long | | WTI Crude Futures | | | December 2020 | | | | 342,650 | | | | 322,110 | | | | (20,540 | ) |
| 1 | | Long | | Wheat Futures | | | July 2021 | | | | 30,375 | | | | 29,625 | | | | (750 | ) |
| 5 | | Short | | Zinc Futures | | | December 2020 | | | | 287,343 | | | | 314,687 | | | | (27,344 | ) |
| | | | | | | | | | | | | | | | | | |
|
|
|
| | | | | | | | | | | | | | | | | | | $ | (437,955 | ) |
| | | | | | | | | | | | | | | | | | |
|
|
|
| Net Unrealized Appreciation (Depreciation) | | | $ | 832,882 | |
| | | | | | | | | | | | | | | | | | |
|
|
|
| ** | Notional basis refers to the contractual amount agreed upon at inception of the open contract; notional value represents the current value of the open contract. |
ULSD — Ultra Low Sulfur Diesel Futures
| | | | | | | | | | | | | | | | | | | | |
Over the Counter Total Return Swap Contracts(a)
| |
Swap Counterparty
| | Notional
Amount
(000’s)
| | | Maturity
Date
| | | Payments Received (Paid)
by the Portfolio/Frequency
| | Total Return Received or Paid
by Portfolio/Frequency
| | Upfront Premiums
Paid (Received)
| | | Unrealized
Appreciation
(Depreciation)
| |
| JPMorgan | | | 261 | | | | 11/30/2020 | | | (0.090)%/Monthly | | Bloomberg Commodity Index/Monthly | | $ | — | | | $ | — | |
| JPMorgan | | | 55 | | | | 02/26/2021 | | | (0.090)%/Monthly | | Bloomberg Commodity Index/Monthly | | | — | | | | — | |
| JPMorgan | | | 8,022 | | | | 03/31/2021 | | | (0.090)%/Monthly | | Bloomberg Commodity Index/Monthly | | | — | | | | — | |
| JPMorgan | | | 109 | | | | 04/30/2021 | | | (0.090)%/Monthly | | Bloomberg Commodity Index/Monthly | | | — | | | | — | |
| | | | | | | | | | | | | | |
|
|
| |
|
|
|
| | | | | | | | | | | | | | | $ | — | | | $ | — | |
| | | | | | | | | | | | | | |
|
|
| |
|
|
|
| (a) | The security is owned by the AIG Commodity Strategy Cayman Fund, Ltd. which is a wholly-owned subsidiary of the AIG Commodity Strategy Fund. |
SunAmerica Specialty Series — AIG Commodity Strategy Fund
PORTFOLIO OF INVESTMENTS — October 31, 2020@ — (continued)
The following is a summary of the inputs used to value the Fund’s net assets as of October 31, 2020 (see Note 3):
| | | | | | | | | | | | | | | | |
| | | Level 1 — Unadjusted
Quoted Prices
| | | Level 2 — Other
Observable Inputs
| | | Level 3 — Significant
Unobservable Inputs
| | | Total
| |
ASSETS: | | | | | | | | | | | | | | | | |
Investments at Value:* | | | | | | | | | | | | | | | | |
| | | | |
U.S. Government Agencies | | $ | — | | | $ | 1,645,154 | | | $ | — | | | $ | 1,645,154 | |
U.S. Government Treasuries | | | — | | | | 850,305 | | | | — | | | | 850,305 | |
Common Stocks | | | 391,579 | | | | — | | | | — | | | | 391,579 | |
Options — Purchased | | | 33,165 | | | | — | | | | — | | | | 33,165 | |
Short-Term Investment Securities | | | — | | | | 14,441,157 | | | | — | | | | 14,441,157 | |
Repurchase Agreements | | | — | | | | 6,045,000 | | | | — | | | | 6,045,000 | |
| | |
|
|
| |
|
|
| |
|
|
| |
|
|
|
Total Investments at Value | | $ | 424,744 | | | $ | 22,981,616 | | | $ | — | | | $ | 23,406,360 | |
| | |
|
|
| |
|
|
| |
|
|
| |
|
|
|
Other Financial Instruments:† | | | | | | | | | | | | | | | | |
| | | | |
Futures Contracts | | $ | 1,270,837 | | | $ | — | | | $ | — | | | $ | 1,270,837 | |
| | |
|
|
| |
|
|
| |
|
|
| |
|
|
|
| | | | |
LIABILITIES: | | | | | | | | | | | | | | | | |
Other Financial Instruments:† | | | | | | | | | | | | | | | | |
| | | | |
Exchange Traded Written Call Options | | $ | 1,110 | | | $ | — | | | $ | — | | | $ | 1,110 | |
Futures Contracts | | | 437,955 | | | | — | | | | — | | | | 437,955 | |
| | |
|
|
| |
|
|
| |
|
|
| |
|
|
|
| | | $ | 439,065 | | | $ | — | | | $ | — | | | $ | 439,065 | |
| | |
|
|
| |
|
|
| |
|
|
| |
|
|
|
| * | For a detailed presentation of investments, please refer to the Portfolio of Investments. |
| † | Amounts represent unrealized appreciation/depreciation as of the end of the reporting period. |
| @ | Consolidated (see Note 2) |
See Notes to Financial Statements
SunAmerica Specialty Series — AIG ESG Dividend Fund
PORTFOLIO PROFILE — October 31, 2020 — (unaudited)
Industry Allocation*
| | | | |
Food-Misc./Diversified | | | 7.7 | % |
Investment Management/Advisor Services | | | 6.5 | |
Cosmetics & Toiletries | | | 5.5 | |
Human Resources | | | 5.1 | |
Medical-Biomedical/Gene | | | 4.8 | |
Beverages-Non-alcoholic | | | 4.5 | |
Retail-Restaurants | | | 3.7 | |
Computers | | | 3.7 | |
Auto-Heavy Duty Trucks | | | 3.5 | |
Retail-Consumer Electronics | | | 3.3 | |
Transport-Services | | | 3.1 | |
Distribution/Wholesale | | | 3.1 | |
Machinery-Construction & Mining | | | 3.1 | |
Electronic Components-Semiconductors | | | 3.0 | |
Apparel Manufacturers | | | 3.0 | |
Retail-Building Products | | | 2.9 | |
Home Decoration Products | | | 2.9 | |
Commercial Services-Finance | | | 2.9 | |
Diversified Manufacturing Operations | | | 2.8 | |
Data Processing/Management | | | 2.8 | |
Containers-Paper/Plastic | | | 2.4 | |
Consumer Products-Misc. | | | 2.4 | |
Insurance-Property/Casualty | | | 2.2 | |
Real Estate Investment Trusts | | | 2.1 | |
Toys | | | 2.1 | |
Networking Products | | | 2.0 | |
Finance-Credit Card | | | 1.8 | |
Oil-Field Services | | | 1.7 | |
Advertising Agencies | | | 1.6 | |
Repurchase Agreements | | | 1.4 | |
Oil Companies-Exploration & Production | | | 1.2 | |
Office Automation & Equipment | | | 1.2 | |
| | |
|
|
|
| | | | 100.0 | % |
| | |
|
|
|
| * | | Calculated as a percentage of net assets |
SunAmerica Specialty Series — AIG ESG Dividend Fund
PORTFOLIO OF INVESTMENTS — October 31, 2020
| | | | | | | | |
| Security Description | | Shares | | |
Value
(Note 3) | |
|
|
COMMON STOCKS — 98.6% | |
Advertising Agencies — 1.6% | |
Omnicom Group, Inc. | | | 12,302 | | | $ | 580,654 | |
| | | | | | |
|
|
|
Apparel Manufacturers — 3.0% | |
Hanesbrands, Inc. | | | 68,076 | | | | 1,093,981 | |
| | | | | | |
|
|
|
Auto-Heavy Duty Trucks — 3.5% | |
Cummins, Inc. | | | 5,738 | | | | 1,261,729 | |
| | | | | | |
|
|
|
Beverages-Non-alcoholic — 4.5% | |
Coca-Cola Co. | | | 15,830 | | | | 760,790 | |
PepsiCo, Inc. | | | 6,552 | | | | 873,316 | |
| | | | | | |
|
|
|
| | | | | | | | 1,634,106 | |
| | | | | | |
|
|
|
Commercial Services-Finance — 2.9% | |
Automatic Data Processing, Inc. | | | 6,727 | | | | 1,062,597 | |
| | | | | | |
|
|
|
Computers — 3.7% | |
Hewlett Packard Enterprise Co. | | | 65,236 | | | | 563,639 | |
HP, Inc. | | | 43,084 | | | | 773,789 | |
| | | | | | |
|
|
|
| | | | | | | | 1,337,428 | |
| | | | | | |
|
|
|
Consumer Products-Misc. — 2.4% | |
Kimberly-Clark Corp. | | | 6,488 | | | | 860,244 | |
| | | | | | |
|
|
|
Containers-Paper/Plastic — 2.4% | |
Amcor PLC | | | 84,757 | | | | 884,016 | |
| | | | | | |
|
|
|
Cosmetics & Toiletries — 5.5% | |
Colgate-Palmolive Co. | | | 12,386 | | | | 977,132 | |
Procter & Gamble Co. | | | 7,462 | | | | 1,023,040 | |
| | | | | | |
|
|
|
| | | | | | | | 2,000,172 | |
| | | | | | |
|
|
|
Data Processing/Management — 2.8% | |
Paychex, Inc. | | | 12,199 | | | | 1,003,368 | |
| | | | | | |
|
|
|
Distribution/Wholesale — 3.1% | |
Fastenal Co. | | | 26,027 | | | | 1,125,147 | |
| | | | | | |
|
|
|
Diversified Manufacturing Operations — 2.8% | |
Illinois Tool Works, Inc. | | | 5,198 | | | | 1,018,184 | |
| | | | | | |
|
|
|
Electronic Components-Semiconductors — 3.0% | |
Texas Instruments, Inc. | | | 7,589 | | | | 1,097,293 | |
| | | | | | |
|
|
|
Finance-Credit Card — 1.8% | |
Western Union Co. | | | 34,333 | | | | 667,434 | |
| | | | | | |
|
|
|
Food-Misc./Diversified — 7.7% | |
Campbell Soup Co. | | | 19,106 | | | | 891,677 | |
General Mills, Inc. | | | 17,725 | | | | 1,047,902 | |
Kellogg Co. | | | 13,499 | | | | 848,952 | |
| | | | | | |
|
|
|
| | | | | | | | 2,788,531 | |
| | | | | | |
|
|
|
Home Decoration Products — 2.9% | |
Newell Brands, Inc. | | | 60,291 | | | | 1,064,739 | |
| | | | | | |
|
|
|
Human Resources — 5.1% | |
ManpowerGroup, Inc. | | | 12,354 | | | | 838,466 | |
Robert Half International, Inc. | | | 19,962 | | | | 1,011,874 | |
| | | | | | |
|
|
|
| | | | | | | | 1,850,340 | |
| | | | | | |
|
|
|
Insurance-Property/Casualty — 2.2% | |
First American Financial Corp. | | | 18,051 | | | | 804,894 | |
| | | | | | |
|
|
|
Investment Management/Advisor Services — 6.5% | |
Franklin Resources, Inc. | | | 36,545 | | | | 685,219 | |
Invesco, Ltd. | | | 53,089 | | | | 695,997 | |
T. Rowe Price Group, Inc. | | | 7,744 | | | | 980,855 | |
| | | | | | |
|
|
|
| | | | | | | | 2,362,071 | |
| | | | | | |
|
|
|
| Security Description | | Shares/
Principal
Amount | | | Value
(Note 3) | |
|
|
Machinery-Construction & Mining — 3.1% | |
Caterpillar, Inc. | | | 7,129 | | | $ | 1,119,609 | |
| | | | | | |
|
|
|
Medical-Biomedical/Gene — 4.8% | |
Amgen, Inc. | | | 4,294 | | | | 931,540 | |
Gilead Sciences, Inc. | | | 14,007 | | | | 814,507 | |
| | | | | | |
|
|
|
| | | | | | | | 1,746,047 | |
| | | | | | |
|
|
|
Networking Products — 2.0% | |
Cisco Systems, Inc. | | | 20,009 | | | | 718,323 | |
| | | | | | |
|
|
|
Office Automation & Equipment — 1.2% | |
Xerox Holdings Corp. | | | 25,510 | | | | 443,364 | |
| | | | | | |
|
|
|
Oil Companies-Exploration & Production — 1.2% | |
ConocoPhillips | | | 15,635 | | | | 447,474 | |
| | | | | | |
|
|
|
Oil-Field Services — 1.7% | |
Baker Hughes Co. | | | 42,886 | | | | 633,426 | |
| | | | | | |
|
|
|
Real Estate Investment Trusts — 2.1% | |
Iron Mountain, Inc. | | | 29,286 | | | | 763,193 | |
| | | | | | |
|
|
|
Retail-Building Products — 2.9% | |
Home Depot, Inc. | | | 4,011 | | | | 1,069,774 | |
| | | | | | |
|
|
|
Retail-Consumer Electronics — 3.3% | |
Best Buy Co., Inc. | | | 10,847 | | | | 1,209,983 | |
| | | | | | |
|
|
|
Retail-Restaurants — 3.7% | |
Dunkin’ Brands Group, Inc. | | | 13,464 | | | | 1,342,495 | |
| | | | | | |
|
|
|
Toys — 2.1% | |
Hasbro, Inc. | | | 9,099 | | | | 752,669 | |
| | | | | | |
|
|
|
Transport-Services — 3.1% | |
C.H. Robinson Worldwide, Inc. | | | 12,942 | | | | 1,144,461 | |
| | | | | | |
|
|
|
Total Long-Term Investment Securities | | | | | | | | |
(cost $34,942,283) | | | | | | | 35,887,746 | |
| | | |
|
|
|
REPURCHASE AGREEMENTS — 1.4% | |
Agreement with Fixed Income Clearing Corp., bearing interest at 0.00% dated 10/30/2020, to be repurchased 11/02/2020 in the amount of $505,000 and collateralized by $516,900 of United States Treasury Notes, bearing interest at 0.25% due 06/30/2025 and having an approximate value of $515,148
(cost $505,000) | | $ | 505,000 | | | | 505,000 | |
| | | | | | |
|
|
|
TOTAL INVESTMENTS | | | | | | | | |
(cost $35,447,283)(1) | | | 100.0 | % | | | 36,392,746 | |
Other assets less liabilities | | | 0.0 | | | | 2,351 | |
| | |
|
|
| |
|
|
|
NET ASSETS | | | 100.0 | % | | $ | 36,395,097 | |
| | |
|
|
| |
|
|
|
| (1) | See Note 6 for cost of investments on a tax basis. |
SunAmerica Specialty Series — AIG ESG Dividend Fund
PORTFOLIO OF INVESTMENTS — October 31, 2020 — (continued)
The following is a summary of the inputs used to value the Fund’s net assets as of October 31, 2020 (see Note 3):
| | | | | | | | | | | | | | | | |
| | | Level 1 — Unadjusted
Quoted Prices
| | | Level 2 — Other
Observable Inputs
| | | Level 3 — Significant
Unobservable Inputs
| | | Total
| |
ASSETS: | | | | | | | | | | | | | | | | |
Investments at Value:* | | | | | | | | | | | | | | | | |
| | | | |
Common Stocks | | $ | 35,887,746 | | | $ | — | | | $ | — | | | $ | 35,887,746 | |
Repurchase Agreements | | | — | | | | 505,000 | | | | — | | | | 505,000 | |
| | |
|
|
| |
|
|
| |
|
|
| |
|
|
|
Total Investments at Value | | $ | 35,887,746 | | | $ | 505,000 | | | $ | — | | | $ | 36,392,746 | |
| | |
|
|
| |
|
|
| |
|
|
| |
|
|
|
| * | For a detailed presentation of investments, please refer to the Portfolio of Investments. |
See Notes to Financial Statements
SunAmerica Specialty Series — AIG Focused Alpha Large-Cap Fund
PORTFOLIO PROFILE — October 31, 2020 — (unaudited)
Industry Allocation*
| | | | |
Applications Software | | | 11.7 | % |
Commercial Services-Finance | | | 11.5 | |
Internet Content-Entertainment | | | 6.5 | |
E-Commerce/Products | | | 5.8 | |
Electronic Forms | | | 5.7 | |
Auto-Cars/Light Trucks | | | 5.5 | |
Retail-Discount | | | 5.5 | |
Cosmetics & Toiletries | | | 5.3 | |
Medical-HMO | | | 4.8 | |
Diagnostic Equipment | | | 4.8 | |
Insurance-Property/Casualty | | | 4.7 | |
Finance-Credit Card | | | 4.6 | |
Beverages-Non-alcoholic | | | 4.5 | |
Medical-Drugs | | | 4.5 | |
Aerospace/Defense | | | 4.4 | |
Real Estate Investment Trusts | | | 4.3 | |
Oil Refining & Marketing | | | 2.4 | |
Banks-Super Regional | | | 2.0 | |
Registered Investment Companies | | | 0.4 | |
| | |
|
|
|
| | | | 98.9 | % |
| | |
|
|
|
| * | | Calculated as a percentage of net assets |
SunAmerica Specialty Series — AIG Focused Alpha Large-Cap Fund
PORTFOLIO OF INVESTMENTS — October 31, 2020
| | | | | | | | |
| Security Description | |
Shares | | | Value
(Note 3) | |
|
|
COMMON STOCKS — 98.5% | |
Aerospace/Defense — 4.4% | |
BAE Systems PLC ADR | | | 1,344,451 | | | $ | 28,072,137 | |
| | | | | | |
|
|
|
Applications Software — 11.7% | |
Microsoft Corp. | | | 163,189 | | | | 33,040,877 | |
ServiceNow, Inc.† | | | 82,713 | | | | 41,155,507 | |
| | | | | | |
|
|
|
| | | | | | | | 74,196,384 | |
| | | | | | |
|
|
|
Auto-Cars/Light Trucks — 5.5% | |
General Motors Co. | | | 1,011,819 | | | | 34,938,110 | |
| | | | | | |
|
|
|
Banks-Super Regional — 2.0% | |
Wells Fargo & Co. | | | 597,518 | | | | 12,816,761 | |
| | | | | | |
|
|
|
Beverages-Non-alcoholic — 4.5% | |
Coca-Cola Co. | | | 600,548 | | | | 28,862,337 | |
| | | | | | |
|
|
|
Commercial Services-Finance — 11.5% | |
PayPal Holdings, Inc.† | | | 224,638 | | | | 41,811,871 | |
S&P Global, Inc. | | | 96,743 | | | | 31,221,868 | |
| | | | | | |
|
|
|
| | | | | | | | 73,033,739 | |
| | | | | | |
|
|
|
Cosmetics & Toiletries — 5.3% | |
Unilever NV | | | 589,366 | | | | 33,334,541 | |
| | | | | | |
|
|
|
Diagnostic Equipment — 4.8% | |
Danaher Corp. | | | 133,369 | | | | 30,613,520 | |
| | | | | | |
|
|
|
E-Commerce/Products — 5.8% | |
Amazon.com, Inc.† | | | 12,013 | | | | 36,473,270 | |
| | | | | | |
|
|
|
Electronic Forms — 5.7% | |
Adobe, Inc.† | | | 80,589 | | | | 36,031,342 | |
| | | | | | |
|
|
|
Finance-Credit Card — 4.6% | |
Visa, Inc., Class A | | | 159,293 | | | | 28,945,131 | |
| | | | | | |
|
|
|
Insurance-Property/Casualty — 4.7% | |
Berkshire Hathaway, Inc., Class B† | | | 147,078 | | | | 29,695,048 | |
| | | | | | |
|
|
|
|
|
Internet Content-Entertainment — 6.5% | |
Facebook, Inc., Class A† | | | 156,307 | | | $ | 41,125,935 | |
| | | | | | |
|
|
|
Medical-Drugs — 4.5% | |
Sanofi ADR | | | 633,978 | | | | 28,719,204 | |
| | | | | | |
|
|
|
Medical-HMO — 4.8% | |
Anthem, Inc. | | | 112,556 | | | | 30,705,277 | |
| | | | | | |
|
|
|
Oil Refining & Marketing — 2.4% | |
Marathon Petroleum Corp. | | | 508,222 | | | | 14,992,549 | |
| | | | | | |
|
|
|
Real Estate Investment Trusts — 4.3% | |
Crown Castle International Corp. | | | 173,495 | | | | 27,099,919 | |
| | | | | | |
|
|
|
Retail-Discount — 5.5% | |
Dollar Tree, Inc.† | | | 384,372 | | | | 34,716,479 | |
| | | | | | |
|
|
|
Total Long-Term Investment Securities | | | | | | | | |
(cost $509,722,989) | | | | | | | 624,371,683 | |
| | | |
|
|
|
SHORT-TERM INVESTMENT SECURITIES — 0.4% | |
Registered Investment Companies — 0.4% | |
State Street Institutional Liquid Reserves Fund, Premier Class
0.09%(1)
(cost $2,382,538) | | | 2,381,833 | | | | 2,382,309 | |
| | | | | | |
|
|
|
TOTAL INVESTMENTS | | | | | | | | |
(cost $512,105,527)(2) | | | 98.9 | % | | | 626,753,992 | |
Other assets less liabilities | | | 1.1 | | | | 7,047,500 | |
| | |
|
|
| |
|
|
|
NET ASSETS | | | 100.0 | % | | $ | 633,801,492 | |
| | |
|
|
| |
|
|
|
| † | Non-income producing security |
| (1) | The rate shown is the 7-day yield as of October 31, 2020. |
| (2) | See Note 6 for cost of investments on a tax basis. |
ADR — American Depositary Receipt
The following is a summary of the inputs used to value the Fund’s net assets as of October 31, 2020 (see Note 3):
| | | | | | | | | | | | | | | | |
| | | Level 1 — Unadjusted
Quoted Prices
| | | Level 2 — Other
Observable Inputs
| | | Level 3 — Significant
Unobservable Inputs
| | | Total
| |
ASSETS: | | | | | | | | | | | | | | | | |
Investments at Value:* | | | | | | | | | | | | | | | | |
| | | | |
Common Stocks | | $ | 624,371,683 | | | $ | — | | | $ | — | | | $ | 624,371,683 | |
Short-Term Investment Securities | | | 2,382,309 | | | | — | | | | — | | | | 2,382,309 | |
| | |
|
|
| |
|
|
| |
|
|
| |
|
|
|
Total Investments at Value | | $ | 626,753,992 | | | $ | — | | | $ | — | | | $ | 626,753,992 | |
| | |
|
|
| |
|
|
| |
|
|
| |
|
|
|
| * | For a detailed presentation of investments, please refer to the Portfolio of Investments. |
See Notes to Financial Statements
SunAmerica Specialty Series — AIG Focused Growth Fund
PORTFOLIO PROFILE — October 31, 2020 — (unaudited)
Industry Allocation*
| | | | |
Applications Software | | | 12.8 | % |
Commercial Services-Finance | | | 12.2 | |
Auto-Cars/Light Trucks | | | 9.4 | |
Internet Content-Entertainment | | | 7.2 | |
E-Commerce/Products | | | 6.7 | |
Electronic Forms | | | 6.1 | |
Real Estate Investment Trusts | | | 5.9 | |
Finance-Credit Card | | | 5.9 | |
Diagnostic Equipment | | | 5.9 | |
Resorts/Theme Parks | | | 3.5 | |
Hotels/Motels | | | 2.7 | |
Diagnostic Kits | | | 2.3 | |
Multimedia | | | 1.9 | |
Commercial Services | | | 1.6 | |
Racetracks | | | 1.5 | |
Insurance-Property/Casualty | | | 1.5 | |
E-Commerce/Services | | | 1.3 | |
Finance-Investment Banker/Broker | | | 1.3 | |
Enterprise Software/Service | | | 1.1 | |
Satellite Telecom | | | 0.7 | |
Professional Sports | | | 0.6 | |
Veterinary Diagnostics | | | 0.4 | |
Medical-Outpatient/Home Medical | | | 0.3 | |
Consulting Services | | | 0.3 | |
| | |
|
|
|
| | | | 93.1 | % |
| | |
|
|
|
| * | | Calculated as a percentage of net assets |
SunAmerica Specialty Series — AIG Focused Growth Fund
PORTFOLIO OF INVESTMENTS — October 31, 2020
| | | | | | | | |
| Security Description | | Shares | | | Value
(Note 3) | |
|
|
COMMON STOCKS — 93.1% | |
Applications Software — 12.8% | |
Microsoft Corp. | | | 200,198 | | | $ | 40,534,089 | |
ServiceNow, Inc.† | | | 80,493 | | | | 40,050,902 | |
| | | | | | |
|
|
|
| | | | | | | | 80,584,991 | |
| | | | | | |
|
|
|
Auto-Cars/Light Trucks — 9.4% | |
Tesla, Inc.† | | | 152,500 | | | | 59,176,100 | |
| | | | | | |
|
|
|
Commercial Services — 1.6% | |
CoStar Group, Inc.† | | | 12,000 | | | | 9,883,320 | |
| | | | | | |
|
|
|
Commercial Services-Finance — 12.2% | |
PayPal Holdings, Inc.† | | | 216,488 | | | | 40,294,911 | |
S&P Global, Inc. | | | 112,185 | | | | 36,205,465 | |
| | | | | | |
|
|
|
| | | | | | | | 76,500,376 | |
| | | | | | |
|
|
|
Consulting Services — 0.3% | |
Gartner, Inc.† | | | 18,000 | | | | 2,161,800 | |
| | | | | | |
|
|
|
Diagnostic Equipment — 5.9% | |
Danaher Corp. | | | 160,514 | | | | 36,844,384 | |
| | | | | | |
|
|
|
Diagnostic Kits — 2.3% | |
IDEXX Laboratories, Inc.† | | | 33,500 | | | | 14,231,470 | |
| | | | | | |
|
|
|
E-Commerce/Products — 6.7% | |
Amazon.com, Inc.† | | | 13,935 | | | | 42,308,750 | |
| | | | | | |
|
|
|
E-Commerce/Services — 1.3% | |
Zillow Group, Inc., Class A† | | | 92,825 | | | | 8,292,057 | |
| | | | | | |
|
|
|
Electronic Forms — 6.1% | |
Adobe, Inc.† | | | 85,766 | | | | 38,345,979 | |
| | | | | | |
|
|
|
Enterprise Software/Service — 1.1% | |
Guidewire Software, Inc.† | | | 70,000 | | | | 6,727,700 | |
| | | | | | |
|
|
|
Finance-Credit Card — 5.9% | |
Visa, Inc., Class A | | | 202,938 | | | | 36,875,864 | |
| | | | | | |
|
|
|
Finance-Investment Banker/Broker — 1.3% | |
Charles Schwab Corp. | | | 201,000 | | | | 8,263,110 | |
| | | | | | |
|
|
|
Hotels/Motels — 2.7% | |
Hyatt Hotels Corp., Class A | | | 309,000 | | | | 17,038,260 | |
| | | | | | |
|
|
|
|
|
Insurance-Property/Casualty — 1.5% | |
Arch Capital Group, Ltd.† | | | 217,000 | | | $ | 6,555,570 | |
Kinsale Capital Group, Inc. | | | 15,000 | | | | 2,812,050 | |
| | | | | | |
|
|
|
| | | | | | | | 9,367,620 | |
| | | | | | |
|
|
|
Internet Content-Entertainment — 7.2% | |
Facebook, Inc., Class A† | | | 173,162 | | | | 45,560,654 | |
| | | | | | |
|
|
|
Medical-Outpatient/Home Medical — 0.3% | |
American Well Corp† | | | 87,364 | | | | 2,254,865 | |
| | | | | | |
|
|
|
Multimedia — 1.9% | |
FactSet Research Systems, Inc. | | | 40,000 | | | | 12,260,000 | |
| | | | | | |
|
|
|
Professional Sports — 0.6% | |
Manchester United PLC, Class A | | | 260,000 | | | | 3,551,600 | |
| | | | | | |
|
|
|
Racetracks — 1.5% | |
Penn National Gaming, Inc.† | | | 175,000 | | | | 9,446,500 | |
| | | | | | |
|
|
|
Real Estate Investment Trusts — 5.9% | |
American Homes 4 Rent, Class A | | | 100,000 | | | | 2,827,000 | |
Crown Castle International Corp. | | | 202,609 | | | | 31,647,526 | |
Gaming and Leisure Properties, Inc. | | | 67,625 | | | | 2,458,168 | |
| | | | | | |
|
|
|
| | | | | �� | | | 36,932,694 | |
| | | | | | |
|
|
|
Resorts/Theme Parks — 3.5% | |
Marriott Vacations Worldwide Corp. | | | 33,850 | | | | 3,269,910 | |
Vail Resorts, Inc. | | | 81,000 | | | | 18,795,240 | |
| | | | | | |
|
|
|
| | | | | | | | 22,065,150 | |
| | | | | | |
|
|
|
Satellite Telecom — 0.7% | |
Iridium Communications, Inc.† | | | 166,500 | | | | 4,397,265 | |
| | | | | | |
|
|
|
Veterinary Diagnostics — 0.4% | |
Neogen Corp.† | | | 32,500 | | | | 2,266,550 | |
| | | | | | |
|
|
|
TOTAL INVESTMENTS | | | | | | | | |
(cost $373,048,883)(1) | | | 93.1 | % | | | 585,337,059 | |
Other assets less liabilities | | | 6.9 | | | | 43,177,925 | |
| | |
|
|
| |
|
|
|
NET ASSETS | | | 100.0 | % | | $ | 628,514,984 | |
| | |
|
|
| |
|
|
|
| † | Non-income producing security |
| (1) | See Note 6 for cost of investments on a tax basis. |
The following is a summary of the inputs used to value the Fund’s net assets as of October 31, 2020 (see Note 3):
| | | | | | | | | | | | | | | | |
| | | Level 1 — Unadjusted
Quoted Prices
| | | Level 2 — Other
Observable Inputs
| | | Level 3 — Significant
Unobservable Inputs
| | | Total
| |
ASSETS: | | | | | | | | | | | | | | | | |
Investments at Value:* | | | | | | | | | | | | | | | | |
| | | | |
Common Stocks | | $ | 585,337,059 | | | $ | — | | | $ | — | | | $ | 585,337,059 | |
| | |
|
|
| |
|
|
| |
|
|
| |
|
|
|
| * | For a detailed presentation of investments, please refer to the Portfolio of Investments. |
See Notes to Financial Statements
SunAmerica Specialty Series — AIG Income Explorer Fund
PORTFOLIO PROFILE — October 31, 2020 — (unaudited)
Industry Allocation*
| | | | |
Real Estate Investment Trusts | | | 21.1 | % |
Insurance-Multi-line | | | 5.0 | |
Banks-Commercial | | | 4.5 | |
Banks-Super Regional | | | 4.4 | |
Diversified Banking Institutions | | | 4.2 | |
Tobacco | | | 3.8 | |
Medical-Drugs | | | 3.6 | |
Insurance-Reinsurance | | | 3.2 | |
Telephone-Integrated | | | 2.9 | |
Banks-Fiduciary | | | 2.4 | |
Investment Management/Advisor Services | | | 2.3 | |
Insurance-Life/Health | | | 2.2 | |
Oil Companies-Integrated | | | 2.2 | |
Food-Misc./Diversified | | | 2.2 | |
Pipelines | | | 1.9 | |
Closed-End Funds | | | 1.6 | |
Insurance-Property/Casualty | | | 1.6 | |
Metal-Diversified | | | 1.5 | |
Computers | | | 1.5 | |
Chemicals-Diversified | | | 1.5 | |
Private Equity | | | 1.4 | |
Advertising Agencies | | | 1.4 | |
Semiconductor Equipment | | | 1.2 | |
Apparel Manufacturers | | | 1.1 | |
Home Decoration Products | | | 1.0 | |
Oil-Field Services | | | 1.0 | |
Capacitors | | | 0.9 | |
Cosmetics & Toiletries | | | 0.9 | |
Building Products-Cement | | | 0.9 | |
Containers-Paper/Plastic | | | 0.9 | |
Medical-Wholesale Drug Distribution | | | 0.9 | |
Diversified Manufacturing Operations | | | 0.9 | |
Computer Services | | | 0.8 | |
Electric-Integrated | | | 0.8 | |
Electric-Generation | | | 0.8 | |
Diversified Minerals | | | 0.8 | |
Computers-Memory Devices | | | 0.8 | |
Real Estate Operations & Development | | | 0.8 | |
Finance-Investment Banker/Broker | | | 0.8 | |
Networking Products | | | 0.8 | |
Metal-Iron | | | 0.8 | |
Human Resources | | | 0.8 | |
Investment Companies | | | 0.7 | |
Gas-Distribution | | | 0.7 | |
Oil Companies-Exploration & Production | | | 0.6 | |
Electric-Transmission | | | 0.6 | |
Cellular Telecom | | | 0.6 | |
Repurchase Agreements | | | 0.5 | |
Savings & Loans/Thrifts | | | 0.4 | |
Aerospace/Defense | | | 0.4 | |
| | |
|
|
|
| | | | 98.6 | % |
| | |
|
|
|
| * | | Calculated as a percentage of net assets |
SunAmerica Specialty Series — AIG Income Explorer Fund
PORTFOLIO OF INVESTMENTS — October 31, 2020
| | | | | | | | |
| Security Description | | Shares | | |
Value
(Note 3) | |
|
|
COMMON STOCKS — 58.5% | |
Advertising Agencies — 1.4% | |
Interpublic Group of Cos., Inc. | | | 15,655 | | | $ | 283,199 | |
Omnicom Group, Inc. | | | 4,383 | | | | 206,877 | |
| | | | | | |
|
|
|
| | | | | | | | 490,076 | |
| | | | | | |
|
|
|
Aerospace/Defense — 0.4% | |
Raytheon Technologies Corp. | | | 2,469 | | | | 134,116 | |
| | | | | | |
|
|
|
Apparel Manufacturers — 1.1% | |
Hanesbrands, Inc. | | | 24,115 | | | | 387,528 | |
| | | | | | |
|
|
|
Building Products-Cement — 0.9% | |
Anhui Conch Cement Co., Ltd. | | | 53,000 | | | | 331,702 | |
| | | | | | |
|
|
|
Capacitors — 0.9% | |
Walsin Technology Corp.† | | | 59,000 | | | | 338,052 | |
| | | | | | |
|
|
|
Cellular Telecom — 0.6% | |
SoftBank Corp. | | | 17,400 | | | | 202,009 | |
| | | | | | |
|
|
|
Chemicals-Diversified — 1.5% | |
LyondellBasell Industries NV, Class A | | | 3,825 | | | | 261,821 | |
Mitsubishi Chemical Holdings Corp. | | | 47,600 | | | | 268,187 | |
| | | | | | |
|
|
|
| | | | | | | | 530,008 | |
| | | | | | |
|
|
|
Computer Services — 0.8% | |
International Business Machines Corp. | | | 2,671 | | | | 298,244 | |
| | | | | | |
|
|
|
Computers — 1.5% | |
Hewlett Packard Enterprise Co. | | | 25,106 | | | | 216,916 | |
HP, Inc. | | | 17,465 | | | | 313,671 | |
| | | | | | |
|
|
|
| | | | | | | | 530,587 | |
| | | | | | |
|
|
|
Computers-Memory Devices — 0.8% | |
Seagate Technology PLC | | | 6,068 | | | | 290,172 | |
| | | | | | |
|
|
|
Containers-Paper/Plastic — 0.9% | |
WestRock Co. | | | 8,762 | | | | 329,013 | |
| | | | | | |
|
|
|
Cosmetics & Toiletries — 0.9% | |
Unilever NV | | | 5,905 | | | | 333,537 | |
| | | | | | |
|
|
|
Diversified Manufacturing Operations — 0.9% | |
3M Co. | | | 1,901 | | | | 304,084 | |
| | | | | | |
|
|
|
Diversified Minerals — 0.8% | |
BHP Group PLC | | | 15,111 | | | | 293,273 | |
| | | | | | |
|
|
|
Food-Misc./Diversified — 2.2% | |
General Mills, Inc. | | | 7,242 | | | | 428,147 | |
Kraft Heinz Co. | | | 11,290 | | | | 345,361 | |
| | | | | | |
|
|
|
| | | | | | | | 773,508 | |
| | | | | | |
|
|
|
Home Decoration Products — 1.0% | |
Newell Brands, Inc. | | | 19,466 | | | | 343,770 | |
| | | | | | |
|
|
|
Human Resources — 0.8% | |
Adecco Group AG | | | 5,645 | | | | 276,627 | |
| | | | | | |
|
|
|
Investment Management/Advisor Services — 1.5% | |
Franklin Resources, Inc. | | | 13,693 | | | | 256,744 | |
Invesco, Ltd. | | | 20,019 | | | | 262,449 | |
| | | | | | |
|
|
|
| | | | | | | | 519,193 | |
| | | | | | |
|
|
|
Medical-Drugs — 3.6% | |
AbbVie, Inc. | | | 4,007 | | | | 340,996 | |
Bayer AG | | | 3,234 | | | | 151,988 | |
GlaxoSmithKline PLC | | | 12,301 | | | | 205,232 | |
|
|
Medical-Drugs (continued) | |
Pfizer, Inc. | | | 9,155 | | | $ | 324,819 | |
Takeda Pharmaceutical Co., Ltd. | | | 8,600 | | | | 266,146 | |
| | | | | | |
|
|
|
| | | | | | | | 1,289,181 | |
| | | | | | |
|
|
|
Medical-Wholesale Drug Distribution — 0.9% | |
Cardinal Health, Inc. | | | 6,673 | | | | 305,557 | |
| | | | | | |
|
|
|
Metal-Diversified — 1.5% | |
MMC Norilsk Nickel PJSC ADR | | | 11,380 | | | | 271,413 | |
Rio Tinto, Ltd. | | | 4,103 | | | | 267,563 | |
| | | | | | |
|
|
|
| | | | | | | | 538,976 | |
| | | | | | |
|
|
|
Metal-Iron — 0.8% | |
Fortescue Metals Group, Ltd. | | | 22,768 | | | | 279,160 | |
| | | | | | |
|
|
|
Networking Products — 0.8% | |
Cisco Systems, Inc. | | | 7,794 | | | | 279,805 | |
| | | | | | |
|
|
|
Oil Companies-Exploration & Production — 0.6% | |
CNOOC, Ltd. | | | 237,000 | | | | 216,515 | |
| | | | | | |
|
|
|
Oil Companies-Integrated — 2.2% | |
China Petroleum & Chemical Corp. | | | 622,000 | | | | 243,247 | |
Eni SpA | | | 23,616 | | | | 166,200 | |
Lukoil PJSC ADR | | | 3,615 | | | | 184,783 | |
TOTAL SE | | | 5,932 | | | | 179,638 | |
| | | | | | |
|
|
|
| | | | | | | | 773,868 | |
| | | | | | |
|
|
|
Oil-Field Services — 1.0% | |
Baker Hughes Co. | | | 22,911 | | | | 338,395 | |
| | | | | | |
|
|
|
Real Estate Investment Trusts — 19.5% | |
Agree Realty Corp. | | | 2,022 | | | | 125,506 | |
Alexandria Real Estate Equities, Inc. | | | 883 | | | | 133,792 | |
American Campus Communities, Inc. | | | 3,014 | | | | 112,904 | |
American Homes 4 Rent, Class A | | | 5,401 | | | | 152,686 | |
American Tower Corp. | | | 646 | | | | 148,354 | |
Apartment Investment & Management Co., Class A | | | 2,718 | | | | 86,704 | |
Apple Hospitality REIT, Inc. | | | 8,691 | | | | 86,041 | |
Armada Hoffler Properties, Inc. | | | 7,420 | | | | 66,854 | |
Camden Property Trust | | | 1,314 | | | | 121,203 | |
CareTrust REIT, Inc. | | | 6,790 | | | | 116,109 | |
Clipper Realty, Inc. | | | 13,784 | | | | 77,466 | |
Columbia Property Trust, Inc. | | | 6,857 | | | | 72,547 | |
CoreSite Realty Corp. | | | 1,236 | | | | 147,529 | |
Crown Castle International Corp. | | | 1,038 | | | | 162,136 | |
CubeSmart | | | 4,590 | | | | 155,739 | |
CyrusOne, Inc. | | | 2,259 | | | | 160,502 | |
DiamondRock Hospitality Co. | | | 12,739 | | | | 62,931 | |
Digital Realty Trust, Inc. | | | 1,211 | | | | 174,747 | |
Douglas Emmett, Inc. | | | 3,248 | | | | 76,653 | |
Duke Realty Corp. | | | 4,053 | | | | 153,974 | |
Easterly Government Properties, Inc. | | | 6,094 | | | | 127,365 | |
Empire State Realty Trust, Inc., Class A | | | 10,090 | | | | 54,284 | |
EPR Properties | | | 2,028 | | | | 48,348 | |
Equinix, Inc. | | | 251 | | | | 183,541 | |
Equity LifeStyle Properties, Inc. | | | 1,980 | | | | 117,196 | |
Equity Residential | | | 1,709 | | | | 80,289 | |
Extra Space Storage, Inc. | | | 1,354 | | | | 156,996 | |
First Industrial Realty Trust, Inc. | | | 3,387 | | | | 134,836 | |
Four Corners Property Trust, Inc. | | | 5,074 | | | | 128,575 | |
SunAmerica Specialty Series — AIG Income Explorer Fund
PORTFOLIO OF INVESTMENTS — October 31, 2020 — (continued)
| | | | | | | | |
| Security Description | | Shares | | |
Value
(Note 3) | |
|
|
COMMON STOCKS (continued) | |
Real Estate Investment Trusts (continued) | |
Gaming and Leisure Properties, Inc. | | | 3,434 | | | $ | 124,826 | |
GEO Group, Inc. | | | 8,974 | | | | 79,510 | |
Healthcare Trust of America, Inc., Class A | | | 4,781 | | | | 116,178 | |
Host Hotels & Resorts, Inc. | | | 7,686 | | | | 80,549 | |
Hudson Pacific Properties, Inc. | | | 3,891 | | | | 74,941 | |
Invitation Homes, Inc. | | | 4,771 | | | | 130,057 | |
Iron Mountain, Inc. | | | 4,343 | | | | 113,179 | |
Kimco Realty Corp. | | | 6,823 | | | | 70,004 | |
Lamar Advertising Co., Class A | | | 1,609 | | | | 99,694 | |
Mid-America Apartment Communities, Inc. | | | 1,065 | | | | 124,211 | |
Monmouth Real Estate Investment Corp. | | | 9,355 | | | | 129,567 | |
National Health Investors, Inc. | | | 1,766 | | | | 98,984 | |
National Retail Properties, Inc. | | | 2,684 | | | | 85,915 | |
Omega Healthcare Investors, Inc. | | | 3,382 | | | | 97,435 | |
Outfront Media, Inc. | | | 5,403 | | | | 70,833 | |
Physicians Realty Trust | | | 7,557 | | | | 127,411 | |
Prologis, Inc. | | | 1,574 | | | | 156,141 | |
QTS Realty Trust, Inc., Class A | | | 2,684 | | | | 165,093 | |
Realty Income Corp. | | | 1,905 | | | | 110,223 | |
Rexford Industrial Realty, Inc. | | | 3,049 | | | | 141,657 | |
SBA Communications Corp. | | | 586 | | | | 170,157 | |
Simon Property Group, Inc. | | | 961 | | | | 60,360 | |
STAG Industrial, Inc. | | | 4,523 | | | | 140,756 | |
STORE Capital Corp. | | | 3,731 | | | | 95,887 | |
Sun Communities, Inc. | | | 906 | | | | 124,693 | |
Sunstone Hotel Investors, Inc. | | | 9,776 | | | | 72,538 | |
Terreno Realty Corp. | | | 2,568 | | | | 144,527 | |
UDR, Inc. | | | 3,010 | | | | 94,032 | |
Uniti Group, Inc. | | | 18,553 | | | | 163,637 | |
Ventas, Inc. | | | 2,502 | | | | 98,754 | |
Welltower, Inc. | | | 1,769 | | | | 95,119 | |
| | | | | | |
|
|
|
| | | | | | | | 6,882,675 | |
| | | | | | |
|
|
|
Real Estate Operations & Development — 0.8% | |
Country Garden Holdings Co., Ltd. | | | 234,000 | | | | 288,756 | |
| | | | | | |
|
|
|
Semiconductor Equipment — 1.2% | |
Globalwafers Co., Ltd. | | | 30,000 | | | | 436,401 | |
| | | | | | |
|
|
|
Telephone-Integrated — 2.9% | |
AT&T, Inc. | | | 9,287 | | | | 250,935 | |
CenturyLink, Inc. | | | 26,389 | | | | 227,473 | |
Telefonica SA | | | 54,988 | | | | 179,784 | |
Verizon Communications, Inc. | | | 6,214 | | | | 354,136 | |
| | | | | | |
|
|
|
| | | | | | | | 1,012,328 | |
| | | | | | |
|
|
|
Tobacco — 3.8% | |
Altria Group, Inc. | | | 7,082 | | | | 255,519 | |
British American Tobacco PLC | | | 8,472 | | | | 269,171 | |
Imperial Brands PLC | | | 14,890 | | | | 236,206 | |
Japan Tobacco, Inc. | | | 15,500 | | | | 293,118 | |
Philip Morris International, Inc. | | | 4,155 | | | | 295,088 | |
| | | | | | |
|
|
|
| | | | | | | | 1,349,102 | |
| | | | | | |
|
|
|
Total Common Stocks | | | | | | | | |
(cost $24,305,590) | | | | | | | 20,696,218 | |
| | | |
|
|
|
|
|
PREFERRED SECURITIES — 39.6% | |
Banks-Commercial — 4.5% | |
First Citizens BancShares, Inc.
Series A
5.38% | | | 11,105 | | | $ | 297,947 | |
First Republic Bank
Series J
4.70% | | | 11,260 | | | | 293,211 | |
First Republic Bank
Series I
5.50% | | | 9,500 | | | | 257,925 | |
Merchants Bancorp
Series B
6.00% | | | 8,000 | | | | 202,160 | |
Synovus Financial Corp.
Series E
5.88% | | | 10,600 | | | | 273,162 | |
Truist Financial Corp.
Series O
5.25% | | | 9,800 | | | | 264,110 | |
| | | | | | |
|
|
|
| | | | | | | | 1,588,515 | |
| | | | | | |
|
|
|
Banks-Fiduciary — 2.4% | |
Northern Trust Corp.
Series E
4.70% | | | 11,000 | | | | 291,280 | |
State Street Corp.
Series D
5.90% | | | 10,000 | | | | 275,000 | |
State Street Corp.
Series G
5.35% | | | 10,000 | | | | 283,600 | |
| | | | | | |
|
|
|
| | | | | | | | 849,880 | |
| | | | | | |
|
|
|
Banks-Super Regional — 4.4% | |
PNC Financial Services Group, Inc.
Series P
6.13% | | | 7,500 | | | | 200,325 | |
US Bancorp FRS
(3ML+0.60%)
Series B
3.50% | | | 12,000 | | | | 272,880 | |
US Bancorp
Series K
5.50% | | | 10,300 | | | | 278,203 | |
US Bancorp
Series F
6.50% | | | 6,000 | | | | 160,020 | |
Wells Fargo & Co.
Series Z
4.75% | | | 9,000 | | | | 224,820 | |
Wells Fargo & Co.
Series R
6.63% | | | 10,414 | | | | 291,488 | |
Wells Fargo & Co.
Series Q
5.85% | | | 5,500 | | | | 142,395 | |
| | | | | | |
|
|
|
| | | | | | | | 1,570,131 | |
| | | | | | |
|
|
|
SunAmerica Specialty Series — AIG Income Explorer Fund
PORTFOLIO OF INVESTMENTS — October 31, 2020 — (continued)
| | | | | | | | |
| Security Description | | Shares | | |
Value
(Note 3) | |
|
|
PREFERRED SECURITIES (continued) | |
Closed-End Funds — 1.6% | |
Gabelli Equity Trust, Inc.
Series K
5.00% | | | 10,949 | | | $ | 292,458 | |
Highland Income Fund
Series A
5.38% | | | 11,200 | | | | 283,136 | |
| | | | | | |
|
|
|
| | | | | | | | 575,594 | |
| | | | | | |
|
|
|
Diversified Banking Institutions — 4.2% | |
Bank of America Corp. FRS
(3 ML+0.50%)
Series 5
4.00% | | | 7,700 | | | | 189,497 | |
Bank of America Corp.
Series KK
5.38% | | | 9,000 | | | | 238,230 | |
HSBC Holdings PLC
Series A
6.20% | | | 7,000 | | | | 180,530 | |
JPMorgan Chase & Co.
Series DD
5.75% | | | 7,500 | | | | 203,175 | |
JPMorgan Chase & Co.
Series EE
6.00% | | | 7,497 | | | | 205,043 | |
JPMorgan Chase & Co.
Series GG
4.75% | | | 7,000 | | | | 185,780 | |
Morgan Stanley
Series K
5.85% | | | 10,000 | | | | 281,800 | |
| | | | | | |
|
|
|
| | | | | | | | 1,484,055 | |
| | | | | | |
|
|
|
Electric-Generation — 0.8% | |
Brookfield Renewable Partners LP
Series 17
5.25% | | | 11,375 | | | | 295,295 | |
| | | | | | |
|
|
|
Electric-Integrated — 0.8% | |
Duke Energy Corp.
Series A
5.75% | | | 10,472 | | | | 295,310 | |
| | | | | | |
|
|
|
Electric-Transmission — 0.6% | |
Brookfield Infrastructure Partners LP
Series 13
5.13% | | | 8,100 | | | | 208,413 | |
| | | | | | |
|
|
|
Finance-Investment Banker/Broker — 0.8% | |
Charles Schwab Corp.
Series D
5.95% | | | 11,000 | | | | 284,900 | |
| | | | | | |
|
|
|
Gas-Distribution — 0.7% | |
Spire, Inc.
Series A
5.90% | | | 8,500 | | | | 232,560 | |
| | | | | | |
|
|
|
|
|
Insurance-Life/Health — 2.2% | |
American Equity Investment Life Holding Co.
Series A
5.95% | | | 6,000 | | | $ | 149,400 | |
Athene Holding, Ltd.
Series A
6.35% | | | 10,000 | | | | 267,800 | |
Athene Holding, Ltd.
Series C
6.38% | | | 6,000 | | | | 161,400 | |
Brighthouse Financial, Inc.
Series B
6.75% | | | 7,500 | | | | 204,900 | |
| | | | | | |
|
|
|
| | | | | | | | 783,500 | |
| | | | | | |
|
|
|
Insurance-Multi-line — 5.0% | |
Aegon NV FRS
(3 ML+0.86%)
Series 1
4.00% | | | 9,800 | | | | 243,628 | |
Allstate Corp.
5.10% | | | 11,000 | | | | 286,000 | |
Allstate Corp.
Series I
4.75% | | | 10,300 | | | | 273,053 | |
Hartford Financial Services Group, Inc.
7.88% | | | 6,000 | | | | 164,760 | |
Hartford Financial Services Group, Inc.
Series G
6.00% | | | 10,300 | | | | 282,941 | |
MetLife, Inc.
Series E
5.63% | | | 6,000 | | | | 161,880 | |
MetLife, Inc.
Series F
4.75% | | | 7,000 | | | | 183,820 | |
Voya Financial, Inc.
Series B
5.35% | | | 5,500 | | | | 156,145 | |
| | | | | | |
|
|
|
| | | | | | | | 1,752,227 | |
| | | | | | |
|
|
|
Insurance-Property/Casualty — 1.6% | |
Arch Capital Group, Ltd.
Series E
5.25% | | | 11,000 | | | | 280,390 | |
Arch Capital Group, Ltd.
Series F
5.45% | | | 11,000 | | | | 287,100 | |
| | | | | | |
|
|
|
| | | | | | | | 567,490 | |
| | | | | | |
|
|
|
Insurance-Reinsurance — 3.2% | |
Axis Capital Holdings, Ltd.
Series E
5.50% | | | 11,200 | | | | 285,376 | |
PartnerRe, Ltd.
Series I
5.88% | | | 10,800 | | | | 277,884 | |
Reinsurance Group of America, Inc.
6.20% | | | 10,903 | | | | 287,621 | |
SunAmerica Specialty Series — AIG Income Explorer Fund
PORTFOLIO OF INVESTMENTS — October 31, 2020 — (continued)
| | | | | | | | |
| Security Description | | Shares | | |
Value
(Note 3) | |
|
|
PREFERRED SECURITIES (continued) | |
Insurance-Reinsurance (continued) | |
RenaissanceRe Holdings, Ltd.
Series F
5.75% | | | 10,000 | | | $ | 269,500 | |
| | | | | | |
|
|
|
| | | | | | | | 1,120,381 | |
| | | | | | |
|
|
|
Investment Companies — 0.7% | |
Oaktree Capital Group LLC
Series B
6.55% | | | 8,800 | | | | 235,752 | |
| | | | | | |
|
|
|
Investment Management/Advisor Services — 0.8% | |
Ares Management Corp.
Series A
7.00% | | | 11,000 | | | | 286,220 | |
| | | | | | |
|
|
|
Pipelines — 1.9% | |
Energy Transfer Operating LP
Series D
7.63% | | | 6,940 | | | | 130,056 | |
Energy Transfer Operating LP
Series E
7.60% | | | 8,130 | | | | 158,128 | |
Energy Transfer Partners LP
Series C
7.38% | | | 9,000 | | | | 164,610 | |
NGL Energy Partners LP
Series B
9.00% | | | 20,000 | | | | 210,000 | |
| | | | | | |
|
|
|
| | | | | | | | 662,794 | |
| | | | | | |
|
|
|
Private Equity — 1.4% | |
Apollo Global Management, Inc.
Series B
6.38% | | | 8,500 | | | | 225,165 | |
KKR & Co, Inc.
Series A
6.75% | | | 10,400 | | | | 271,232 | |
| | | | | | |
|
|
|
| | | | | | | | 496,397 | |
| | | | | | |
|
|
|
Real Estate Investment Trusts — 1.6% | |
Public Storage
Series L
4.63% | | | 10,972 | | | | 289,770 | |
Two Harbors Investment Corp.
Series C
7.25% | | | 14,246 | | | | 272,099 | |
| | | | | | |
|
|
|
| | | | | | | | 561,869 | |
| | | | | | |
|
|
|
| Security Description | | Shares/
Principal
Amount | | |
Value
(Note 3) | |
|
|
Savings & Loans/Thrifts — 0.4% | |
New York Community Bancorp, Inc.
Series A
6.38% | | | 6,000 | | | $ | 155,580 | |
| | | | | | |
|
|
|
Total Preferred Securities | | | | | | | | |
(cost $14,129,387) | | | | | | | 14,006,863 | |
| | | |
|
|
|
Total Long-Term Investment Securities | | | | | | | | |
(cost $38,434,977) | | | | | | | 34,703,081 | |
| | | |
|
|
|
REPURCHASE AGREEMENTS — 0.5% | |
Agreement with Fixed Income Clearing Corp., bearing interest at 0.00% dated 10/30/2020, to be repurchased 11/02/2020 in the amount of $164,000 and collateralized by $167,900 of United States Treasury Notes, bearing interest at 0.25% due 06/30/2025 and having an approximate value of $167,331
(cost $164,000) | | $ | 164,000 | | | | 164,000 | |
| | | | | | |
|
|
|
TOTAL INVESTMENTS | | | | | | | | |
(cost $38,598,977)(1) | | | 98.6 | % | | | 34,867,081 | |
Other assets less liabilities | | | 1.4 | | | | 500,553 | |
| | |
|
|
| |
|
|
|
NET ASSETS | | | 100.0 | % | | $ | 35,367,634 | |
| | |
|
|
| |
|
|
|
| † | Non-income producing security |
| (1) | See Note 6 for cost of investments on a tax basis. |
ADR — American Depositary Receipt
FRS — Floating Rate Security
The rates shown on FRS are the current interest rates at October 31, 2020 and unless noted otherwise, the dates shown are the original maturity dates.
Index Legend
3 ML — 3 Month USD LIBOR
SunAmerica Specialty Series — AIG Income Explorer Fund
PORTFOLIO OF INVESTMENTS — October 31, 2020 — (continued)
The following is a summary of the inputs used to value the Fund’s net assets as of October 31, 2020 (see Note 3):
| | | | | | | | | | | | | | | | |
| | | Level 1 — Unadjusted
Quoted Prices
| | | Level 2 — Other
Observable Inputs
| | | Level 3 — Significant
Unobservable Inputs
| | | Total
| |
ASSETS: | | | | | | | | | | | | | | | | |
Investments at Value:* | | | | | | | | | | | | | | | | |
| | | | |
Common Stocks | | $ | 14,517,510 | | | $ | 6,178,708 | ** | | $ | — | | | $ | 20,696,218 | |
Preferred Securities | | | 14,006,863 | | | | — | | | | — | | | | 14,006,863 | |
Repurchase Agreements | | | — | | | | 164,000 | | | | — | | | | 164,000 | |
| | |
|
|
| |
|
|
| |
|
|
| |
|
|
|
Total Investments at Value | | $ | 28,524,373 | | | $ | 6,342,708 | | | $ | — | | | $ | 34,867,081 | |
| | |
|
|
| |
|
|
| |
|
|
| |
|
|
|
| * | For a detailed presentation of investments, please refer to the Portfolio of Investments. |
| ** | Represents foreign equity securities that have been fair valued in accordance with pricing procedures approved by the Board (see Note 3). |
See Notes to Financial Statements
SunAmerica Specialty Series — AIG Small-Cap Fund
PORTFOLIO PROFILE — October 31, 2020 — (unaudited)
Industry Allocation*
| | | | |
Medical-Biomedical/Gene | | | 6.7 | % |
Banks-Commercial | | | 5.0 | |
Real Estate Investment Trusts | | | 3.8 | |
Medical Products | | | 2.8 | |
Medical-Outpatient/Home Medical | | | 2.2 | |
Medical-Drugs | | | 2.2 | |
Repurchase Agreements | | | 2.1 | |
Computer Software | | | 2.0 | |
Enterprise Software/Service | | | 1.8 | |
Auto/Truck Parts & Equipment-Original | | | 1.6 | |
E-Commerce/Services | | | 1.6 | |
Electronic Measurement Instruments | | | 1.6 | |
Electronic Components-Misc. | | | 1.5 | |
Building & Construction Products-Misc. | | | 1.5 | |
Finance-Investment Banker/Broker | | | 1.5 | |
Medical Labs & Testing Services | | | 1.5 | |
Insurance-Property/Casualty | | | 1.4 | |
Food-Misc./Diversified | | | 1.3 | |
Retail-Restaurants | | | 1.3 | |
Diagnostic Kits | | | 1.3 | |
Recreational Vehicles | | | 1.1 | |
Finance-Consumer Loans | | | 1.1 | |
Tobacco | | | 1.1 | |
Human Resources | | | 1.1 | |
Building-Residential/Commercial | | | 1.1 | |
Investment Management/Advisor Services | | | 1.0 | |
Transport-Air Freight | | | 1.0 | |
Diagnostic Equipment | | | 1.0 | |
Energy-Alternate Sources | | | 1.0 | |
Building-Heavy Construction | | | 0.9 | |
Food-Wholesale/Distribution | | | 0.8 | |
Semiconductor Equipment | | | 0.8 | |
Water | | | 0.8 | |
E-Services/Consulting | | | 0.8 | |
Medical-Wholesale Drug Distribution | | | 0.8 | |
Medical Laser Systems | | | 0.8 | |
Telecom Services | | | 0.8 | |
Medical Information Systems | | | 0.7 | |
Transport-Marine | | | 0.7 | |
Auto/Truck Parts & Equipment-Replacement | | | 0.7 | |
Commercial Services | | | 0.7 | |
Disposable Medical Products | | | 0.7 | |
Retail-Building Products | | | 0.7 | |
Gambling (Non-Hotel) | | | 0.7 | |
Retail-Pet Food & Supplies | | | 0.7 | |
Transport-Services | | | 0.7 | |
Electronic Components-Semiconductors | | | 0.7 | |
Transport-Truck | | | 0.7 | |
Firearms & Ammunition | | | 0.7 | |
E-Commerce/Products | | | 0.7 | |
Computer Services | | | 0.6 | |
Entertainment Software | | | 0.6 | |
Water Treatment Systems | | | 0.6 | |
Leisure Products | | | 0.6 | |
E-Marketing/Info | | | 0.6 | |
Electric-Integrated | | | 0.6 | |
Industrial Automated/Robotic | | | 0.6 | |
Retail-Sporting Goods | | | 0.6 | |
Industrial Audio & Video Products | | | 0.6 | |
Protection/Safety | | | 0.6 | |
Networking Products | | | 0.6 | |
| | | | |
Telecommunication Equipment | | | 0.5 | % |
Drug Delivery Systems | | | 0.5 | |
Physical Therapy/Rehabilitation Centers | | | 0.5 | |
MRI/Medical Diagnostic Imaging | | | 0.5 | |
Therapeutics | | | 0.5 | |
Distribution/Wholesale | | | 0.5 | |
Audio/Video Products | | | 0.5 | |
Chemicals-Specialty | | | 0.5 | |
Savings & Loans/Thrifts | | | 0.5 | |
U.S. Government Treasuries | | | 0.4 | |
Gas-Distribution | | | 0.4 | |
Hazardous Waste Disposal | | | 0.4 | |
Cosmetics & Toiletries | | | 0.4 | |
Lighting Products & Systems | | | 0.4 | |
Building & Construction-Misc. | | | 0.4 | |
Exchange-Traded Funds | | | 0.4 | |
Internet Content-Entertainment | | | 0.3 | |
Computer Data Security | | | 0.3 | |
Racetracks | | | 0.3 | |
Machinery-General Industrial | | | 0.3 | |
Retail-Automobile | | | 0.3 | |
Metal Processors & Fabrication | | | 0.3 | |
Computers-Periphery Equipment | | | 0.3 | |
Apparel Manufacturers | | | 0.3 | |
Applications Software | | | 0.3 | |
Oil Companies-Exploration & Production | | | 0.3 | |
Consumer Products-Misc. | | | 0.2 | |
Commercial Services-Finance | | | 0.2 | |
Casino Services | | | 0.2 | |
Real Estate Management/Services | | | 0.2 | |
Chemicals-Diversified | | | 0.2 | |
Engineering/R&D Services | | | 0.2 | |
Aerospace/Defense-Equipment | | | 0.2 | |
Insurance-Life/Health | | | 0.2 | |
Footwear & Related Apparel | | | 0.2 | |
Retail-Apparel/Shoe | | | 0.2 | |
Electric-Generation | | | 0.2 | |
Retail-Home Furnishings | | | 0.2 | |
Retail-Discount | | | 0.2 | |
Medical Instruments | | | 0.2 | |
Building-Mobile Home/Manufactured Housing | | | 0.2 | |
Schools | | | 0.2 | |
Pastoral & Agricultural | | | 0.2 | |
Diversified Manufacturing Operations | | | 0.2 | |
Machinery-Pumps | | | 0.2 | |
Consulting Services | | | 0.2 | |
Oil-Field Services | | | 0.2 | |
Building Products-Doors & Windows | | | 0.2 | |
Web Hosting/Design | | | 0.2 | |
Insurance-Reinsurance | | | 0.2 | |
Athletic Equipment | | | 0.1 | |
Steel-Producers | | | 0.1 | |
Metal-Aluminum | | | 0.1 | |
Medical-Hospitals | | | 0.1 | |
Computers-Integrated Systems | | | 0.1 | |
Environmental Consulting & Engineering | | | 0.1 | |
Rental Auto/Equipment | | | 0.1 | |
Rubber/Plastic Products | | | 0.1 | |
Financial Guarantee Insurance | | | 0.1 | |
Airlines | | | 0.1 | |
Office Furnishings-Original | | | 0.1 | |
SunAmerica Specialty Series — AIG Small-Cap Fund
PORTFOLIO PROFILE — October 31, 2020 — (unaudited) (continued)
Industry Allocation* (continued)
| | | | |
Semiconductor Components-Integrated Circuits | | | 0.1 | % |
Oil Refining & Marketing | | | 0.1 | |
Electronic Security Devices | | | 0.1 | |
Resorts/Theme Parks | | | 0.1 | |
Insurance Brokers | | | 0.1 | |
Beverages-Non-alcoholic | | | 0.1 | |
Miscellaneous Manufacturing | | | 0.1 | |
Real Estate Operations & Development | | | 0.1 | |
Health Care Cost Containment | | | 0.1 | |
Lasers-System/Components | | | 0.1 | |
Electric Products-Misc. | | | 0.1 | |
Data Processing/Management | | | 0.1 | |
Finance-Mortgage Loan/Banker | | | 0.1 | |
Wireless Equipment | | | 0.1 | |
Aerospace/Defense | | | 0.1 | |
Veterinary Diagnostics | | | 0.1 | |
Building Products-Wood | | | 0.1 | |
Machinery-Electrical | | | 0.1 | |
Paper & Related Products | | | 0.1 | |
Steel Pipe & Tube | | | 0.1 | |
Building Products-Air & Heating | | | 0.1 | |
Precious Metals | | | 0.1 | |
Auto-Heavy Duty Trucks | | | 0.1 | |
Satellite Telecom | | | 0.1 | |
Medical-Nursing Homes | | | 0.1 | |
Retail-Misc./Diversified | | | 0.1 | |
Rubber-Tires | | | 0.1 | |
Non-Hazardous Waste Disposal | | | 0.1 | |
Finance-Leasing Companies | | | 0.1 | |
Machinery-Construction & Mining | | | 0.1 | |
Transport-Equipment & Leasing | | | 0.1 | |
Communications Software | | | 0.1 | |
Optical Supplies | | | 0.1 | |
Instruments-Controls | | | 0.1 | |
Metal-Iron | | | 0.1 | |
Retail-Vision Service Center | | | 0.1 | |
Finance-Commercial | | | 0.1 | |
Independent Power Producers | | | 0.1 | |
Home Furnishings | | | 0.1 | |
Machine Tools & Related Products | | | 0.1 | |
Telephone-Integrated | | | 0.1 | |
Internet Content-Information/News | | | 0.1 | |
Batteries/Battery Systems | | | 0.1 | |
Building-Maintenance & Services | | | 0.1 | |
Publishing-Newspapers | | | 0.1 | |
Banks-Super Regional | | | 0.1 | |
Containers-Metal/Glass | | | 0.1 | |
Internet Connectivity Services | | | 0.1 | |
Television | | | 0.1 | |
Medical-HMO | | | 0.1 | |
Wire & Cable Products | | | 0.1 | |
Casino Hotels | | | 0.1 | |
Printing-Commercial | | | 0.1 | |
Gold Mining | | | 0.1 | |
Golf | | | 0.1 | |
Poultry | | | 0.1 | |
Agricultural Operations | | | 0.1 | |
Internet Security | | | 0.1 | |
Retail-Bedding | | | 0.1 | |
Linen Supply & Related Items | | | 0.1 | |
Software Tools | | | 0.1 | |
| | | | |
Appliances | | | 0.1 | % |
Patient Monitoring Equipment | | | 0.1 | |
Machinery-Farming | | | 0.1 | |
Insurance-Multi-line | | | 0.1 | |
Retail-Regional Department Stores | | | 0.1 | |
Cable/Satellite TV | | | 0.1 | |
Identification Systems | | | 0.1 | |
Security Services | | | 0.1 | |
Filtration/Separation Products | | | 0.1 | |
Retail-Pawn Shops | | | 0.1 | |
Dental Supplies & Equipment | | | 0.1 | |
Hotels/Motels | | | 0.1 | |
Quarrying | | | 0.1 | |
| | |
|
|
|
| | | | 100.0% | |
| | |
|
|
|
| * | | Calculated as a percentage of net assets |
SunAmerica Specialty Series — AIG Small-Cap Fund
PORTFOLIO OF INVESTMENTS — October 31, 2020
| | | | | | | | |
| Security Description | | Shares | | |
Value
(Note 3) | |
|
|
COMMON STOCKS — 97.1% | |
Advanced Materials — 0.0% | |
Haynes International, Inc. | | | 103 | | | $ | 1,670 | |
Lydall, Inc.† | | | 141 | | | | 2,790 | |
Materion Corp. | | | 167 | | | | 8,549 | |
| | | | | | |
|
|
|
| | | | | | | | 13,009 | |
| | | | | | |
|
|
|
Advertising Sales — 0.0% | |
Boston Omaha Corp., Class A† | | | 108 | | | | 1,726 | |
| | | | | | |
|
|
|
Advertising Services — 0.0% | |
Fluent, Inc.† | | | 345 | | | | 880 | |
National CineMedia, Inc. | | | 513 | | | | 1,018 | |
| | | | | | |
|
|
|
| | | | | | | | 1,898 | |
| | | | | | |
|
|
|
Aerospace/Defense — 0.1% | |
AeroVironment, Inc.† | | | 179 | | | | 13,668 | |
Kratos Defense & Security Solutions, Inc.† | | | 1,001 | | | | 18,909 | |
National Presto Industries, Inc. | | | 42 | | | | 3,490 | |
Park Aerospace Corp. | | | 162 | | | | 1,716 | |
| | | | | | |
|
|
|
| | | | | | | | 37,783 | |
| | | | | | |
|
|
|
Aerospace/Defense-Equipment — 0.2% | |
AAR Corp. | | | 276 | | | | 5,371 | |
Aerojet Rocketdyne Holdings, Inc.† | | | 605 | | | | 19,614 | |
Astronics Corp.† | | | 193 | | | | 1,235 | |
Barnes Group, Inc. | | | 387 | | | | 14,203 | |
Ducommun, Inc.† | | | 89 | | | | 2,928 | |
Kaman Corp. | | | 228 | | | | 9,042 | |
Moog, Inc., Class A | | | 245 | | | | 15,286 | |
Triumph Group, Inc. | | | 425 | | | | 2,805 | |
| | | | | | |
|
|
|
| | | | | | | | 70,484 | |
| | | | | | |
|
|
|
Agricultural Chemicals — 0.0% | |
Intrepid Potash, Inc.† | | | 79 | | | | 788 | |
Marrone Bio Innovations, Inc.† | | | 555 | | | | 611 | |
| | | | | | |
|
|
|
| | | | | | | | 1,399 | |
| | | | | | |
|
|
|
Agricultural Operations — 0.1% | |
Alico, Inc. | | | 43 | | | | 1,242 | |
Andersons, Inc. | | | 257 | | | | 5,574 | |
Cadiz, Inc.† | | | 164 | | | | 1,566 | |
Fresh Del Monte Produce, Inc. | | | 256 | | | | 5,512 | |
Limoneira Co. | | | 134 | | | | 1,853 | |
Tejon Ranch Co.† | | | 173 | | | | 2,372 | |
Vital Farms, Inc.† | | | 85 | | | | 2,938 | |
| | | | | | |
|
|
|
| | | | | | | | 21,057 | |
| | | | | | |
|
|
|
Airlines — 0.1% | |
Allegiant Travel Co. | | | 108 | | | | 14,554 | |
Hawaiian Holdings, Inc. | | | 375 | | | | 5,194 | |
Mesa Air Group, Inc.† | | | 243 | | | | 768 | |
SkyWest, Inc. | | | 407 | | | | 11,815 | |
Spirit Airlines, Inc.† | | | 735 | | | | 12,914 | |
| | | | | | |
|
|
|
| | | | | | | | 45,245 | |
| | | | | | |
|
|
|
Apparel Manufacturers — 0.3% | |
Deckers Outdoor Corp.† | | | 231 | | | | 58,528 | |
Kontoor Brands, Inc. | | | 425 | | | | 13,983 | |
Lakeland Industries, Inc.† | | | 63 | | | | 1,359 | |
Oxford Industries, Inc. | | | 135 | | | | 5,558 | |
Superior Group of Cos., Inc. | | | 89 | | | | 1,924 | |
|
|
Apparel Manufacturers (continued) | |
Urban Outfitters, Inc.† | | | 569 | | | $ | 12,711 | |
| | | | | | |
|
|
|
| | | | | | | | 94,063 | |
| | | | | | |
|
|
|
Appliances — 0.1% | |
Hamilton Beach Brands Holding Co., Class A | | | 56 | | | | 1,235 | |
iRobot Corp.† | | | 228 | | | | 18,144 | |
| | | | | | |
|
|
|
| | | | | | | | 19,379 | |
| | | | | | |
|
|
|
Applications Software — 0.3% | |
Agilysys, Inc.† | | | 150 | | | | 4,062 | |
Appfolio, Inc., Class A† | | | 135 | | | | 19,287 | |
Brightcove, Inc.† | | | 325 | | | | 4,111 | |
Cerence, Inc.† | | | 303 | | | | 16,538 | |
Digi International, Inc.† | | | 236 | | | | 3,476 | |
Ebix, Inc. | | | 217 | | | | 3,919 | |
GTY Technology Holdings, Inc.† | | | 365 | | | | 1,062 | |
IBEX, Ltd.† | | | 40 | | | | 604 | |
Immersion Corp.† | | | 141 | | | | 869 | |
Model N, Inc.† | | | 281 | | | | 9,900 | |
Park City Group, Inc.† | | | 102 | | | | 443 | |
PDF Solutions, Inc.† | | | 238 | | | | 4,460 | |
Phreesia, Inc.† | | | 236 | | | | 8,725 | |
Sprout Social, Inc., Class A† | | | 225 | | | | 9,833 | |
| | | | | | |
|
|
|
| | | | | | | | 87,289 | |
| | | | | | |
|
|
|
Athletic Equipment — 0.1% | |
Clarus Corp. | | | 193 | | | | 2,994 | |
Nautilus, Inc.† | | | 244 | | | | 5,292 | |
Vista Outdoor, Inc.† | | | 481 | | | | 9,509 | |
YETI Holdings, Inc.† | | | 660 | | | | 32,657 | |
| | | | | | |
|
|
|
| | | | | | | | 50,452 | |
| | | | | | |
|
|
|
Audio/Video Products — 0.5% | |
Daktronics, Inc. | | | 301 | | | | 1,174 | |
Sonos, Inc.† | | | 665 | | | | 9,709 | |
Universal Electronics, Inc.† | | | 4,116 | | | | 152,539 | |
VOXX International Corp.† | | | 163 | | | | 1,847 | |
| | | | | | |
|
|
|
| | | | | | | | 165,269 | |
| | | | | | |
|
|
|
Auto Repair Centers — 0.0% | |
Monro, Inc. | | | 272 | | | | 11,440 | |
| | | | | | |
|
|
|
Auto-Heavy Duty Trucks — 0.1% | |
Blue Bird Corp.† | | | 127 | | | | 1,466 | |
Navistar International Corp.† | | | 412 | | | | 17,761 | |
REV Group, Inc. | | | 226 | | | | 1,774 | |
Workhorse Group, Inc.† | | | 777 | | | | 11,950 | |
| | | | | | |
|
|
|
| | | | | | | | 32,951 | |
| | | | | | |
|
|
|
Auto-Truck Trailers — 0.0% | |
Wabash National Corp. | | | 436 | | | | 6,217 | |
| | | | | | |
|
|
|
Auto/Truck Parts & Equipment-Original — 1.6% | |
Adient PLC† | | | 725 | | | | 15,385 | |
American Axle & Manufacturing Holdings, Inc.† | | | 927 | | | | 6,229 | |
Cooper-Standard Holdings, Inc.† | | | 138 | | | | 2,165 | |
Dana, Inc. | | | 1,193 | | | | 16,690 | |
Dorman Products, Inc.† | | | 220 | | | | 19,639 | |
Fox Factory Holding Corp.† | | | 341 | | | | 28,671 | |
Gentherm, Inc.† | | | 4,768 | | | | 220,711 | |
Meritor, Inc.† | | | 572 | | | | 13,923 | |
SunAmerica Specialty Series — AIG Small-Cap Fund
PORTFOLIO OF INVESTMENTS — October 31, 2020 — (continued)
| | | | | | | | |
| Security Description | | Shares | | |
Value
(Note 3) | |
|
|
COMMON STOCKS (continued) | |
Auto/Truck Parts & Equipment-Original (continued) | |
Methode Electronics, Inc. | | | 303 | | | $ | 9,323 | |
Miller Industries, Inc. | | | 92 | | | | 2,755 | |
Modine Manufacturing Co.† | | | 408 | | | | 2,611 | |
Shyft Group, Inc. | | | 10,478 | | | | 202,330 | |
Telenav, Inc.† | | | 273 | | | | 1,111 | |
Tenneco, Inc., Class A† | | | 421 | | | | 3,629 | |
Visteon Corp.† | | | 229 | | | | 20,530 | |
| | | | | | |
|
|
|
| | | | | | | | 565,702 | |
| | | | | | |
|
|
|
Auto/Truck Parts & Equipment-Replacement — 0.7% | |
Douglas Dynamics, Inc. | | | 186 | | | | 6,344 | |
Motorcar Parts of America, Inc.† | | | 155 | | | | 2,283 | |
Standard Motor Products, Inc. | | | 5,397 | | | | 247,183 | |
XPEL, Inc.† | | | 138 | | | | 3,420 | |
| | | | | | |
|
|
|
| | | | | | | | 259,230 | |
| | | | | | |
|
|
|
B2B/E-Commerce — 0.0% | |
ePlus, Inc.† | | | 110 | | | | 7,426 | |
| | | | | | |
|
|
|
Banks-Commercial — 5.0% | |
1st Constitution Bancorp | | | 75 | | | | 978 | |
1st Source Corp. | | | 135 | | | | 4,521 | |
ACNB Corp. | | | 70 | | | | 1,461 | |
Alerus Financial Corp. | | | 122 | | | | 2,624 | |
Allegiance Bancshares, Inc. | | | 156 | | | | 4,415 | |
Altabancorp | | | 131 | | | | 2,852 | |
Amalgamated Bank, Class A | | | 112 | | | | 1,243 | |
American National Bankshares, Inc. | | | 88 | | | | 2,006 | |
Ameris Bancorp | | | 547 | | | | 16,027 | |
Ames National Corp. | | | 72 | | | | 1,390 | |
Arrow Financial Corp. | | | 109 | | | | 2,983 | |
Atlantic Capital Bancshares, Inc.† | | | 172 | | | | 2,387 | |
Atlantic Union Bankshares Corp. | | | 643 | | | | 16,261 | |
Auburn National Bancorporation, Inc. | | | 19 | | | | 706 | |
BancFirst Corp. | | | 155 | | | | 6,890 | |
Bancorp, Inc.† | | | 425 | | | | 4,080 | |
BancorpSouth Bank | | | 817 | | | | 19,126 | |
Bank First Corp. | | | 52 | | | | 3,329 | |
Bank of Commerce Holdings | | | 131 | | | | 1,049 | |
Bank of Marin Bancorp | | | 109 | | | | 3,285 | |
Bank of N.T. Butterfield & Son, Ltd. | | | 419 | | | | 11,087 | |
Bank of Princeton | | | 47 | | | | 924 | |
Bank7 Corp. | | | 23 | | | | 209 | |
BankUnited, Inc. | | | 757 | | | | 19,114 | |
Bankwell Financial Group, Inc. | | | 55 | | | | 907 | |
Banner Corp. | | | 287 | | | | 10,582 | |
Bar Harbor Bankshares | | | 123 | | | | 2,512 | |
Baycom Corp.† | | | 94 | | | | 1,043 | |
BCB Bancorp, Inc. | | | 119 | | | | 1,082 | |
Bogota Financial Corp.† | | | 48 | | | | 379 | |
Bridge Bancorp, Inc. | | | 138 | | | | 2,697 | |
Bridgewater Bancshares, Inc.† | | | 182 | | | | 2,022 | |
Bryn Mawr Bank Corp. | | | 162 | | | | 4,351 | |
Business First Bancshares, Inc. | | | 159 | | | | 2,641 | |
Byline Bancorp, Inc. | | | 200 | | | | 2,628 | |
C&F Financial Corp. | | | 29 | | | | 903 | |
Cadence BanCorp | | | 1,017 | | | | 11,411 | |
California Bancorp, Inc.† | | | 62 | | | | 846 | |
Cambridge Bancorp | | | 52 | | | | 3,229 | |
|
|
Banks-Commercial (continued) | | | | | |
Camden National Corp. | | | 122 | | | $ | 3,900 | | | | | |
Capital Bancorp, Inc.† | | | 66 | | | | 694 | | | | | |
Capital City Bank Group, Inc. | | | 111 | | | | 2,365 | | | | | |
Capstar Financial Holdings, Inc. | | | 132 | | | | 1,371 | | | | | |
Carter Bank & Trust | | | 187 | | | | 1,300 | | | | | |
Cathay General Bancorp | | | 626 | | | | 14,730 | | | | | |
CB Financial Services, Inc. | | | 41 | | | | 804 | | | | | |
CBTX, Inc. | | | 146 | | | | 2,759 | | | | | |
Central Pacific Financial Corp. | | | 226 | | | | 3,112 | | | | | |
Central Valley Community Bancorp | | | 87 | | | | 1,122 | | | | | |
Century Bancorp, Inc., Class A | | | 23 | | | | 1,646 | | | | | |
Chemung Financial Corp. | | | 30 | | | | 1,022 | | | | | |
ChoiceOne Financial Services, Inc. | | | 60 | | | | 1,726 | | | | | |
CIT Group, Inc. | | | 814 | | | | 23,972 | | | | | |
Citizens & Northern Corp. | | | 110 | | | | 1,863 | | | | | |
Citizens Holding Co. | | | 39 | | | | 846 | | | | | |
City Holding Co. | | | 130 | | | | 7,856 | | | | | |
Civista Bancshares, Inc. | | | 130 | | | | 1,854 | | | | | |
CNB Financial Corp. | | | 122 | | | | 2,213 | | | | | |
Coastal Financial Corp.† | | | 75 | | | | 1,114 | | | | | |
Codorus Valley Bancorp, Inc. | | | 77 | | | | 1,036 | | | | | |
Colony Bankcorp, Inc. | | | 64 | | | | 802 | | | | | |
Columbia Banking System, Inc. | | | 592 | | | | 16,819 | | | | | |
Community Bank System, Inc. | | | 436 | | | | 25,284 | | | | | |
Community Financial Corp. | | | 43 | | | | 940 | | | | | |
Community Trust Bancorp, Inc. | | | 128 | | | | 4,073 | | | | | |
ConnectOne Bancorp, Inc. | | | 306 | | | | 4,722 | | | | | |
County Bancorp, Inc. | | | 40 | | | | 740 | | | | | |
CrossFirst Bankshares, Inc.† | | | 395 | | | | 3,298 | | | | | |
Customers Bancorp, Inc.† | | | 237 | | | | 3,275 | | | | | |
CVB Financial Corp. | | | 1,066 | | | | 18,655 | | | | | |
Eagle Bancorp, Inc. | | | 264 | | | | 7,899 | | | | | |
Enterprise Bancorp, Inc. | | | 74 | | | | 1,673 | | | | | |
Enterprise Financial Services Corp. | | | 198 | | | | 5,764 | | | | | |
Equity Bancshares, Inc., Class A† | | | 120 | | | | 2,206 | | | | | |
Esquire Financial Holdings, Inc.† | | | 56 | | | | 873 | | | | | |
Evans Bancorp, Inc. | | | 39 | | | | 890 | | | | | |
Farmers & Merchants Bancorp, Inc. | | | 83 | | | | 1,665 | | | | | |
Farmers National Banc Corp. | | | 214 | | | | 2,493 | | | | | |
FB Financial Corp. | | | 256 | | | | 7,552 | | | | | |
Fidelity D&D Bancorp, Inc. | | | 32 | | | | 1,525 | | | | | |
Financial Institutions, Inc. | | | 131 | | | | 2,323 | | | | | |
First BanCorp | | | 1,775 | | | | 11,520 | | | | | |
First Bancorp | | | 237 | | | | 5,709 | | | | | |
First Bancorp, Inc. | | | 83 | | | | 1,920 | | | | | |
First Bancshares, Inc. | | | 170 | | | | 4,053 | | | | | |
First Bank | | | 132 | | | | 989 | | | | | |
First Busey Corp. | | | 416 | | | | 7,484 | | | | | |
First Business Financial Services, Inc. | | | 67 | | | | 1,149 | | | | | |
First Choice Bancorp | | | 85 | | | | 1,197 | | | | | |
First Commonwealth Financial Corp. | | | 804 | | | | 6,930 | | | | | |
First Community Bankshares, Inc. | | | 143 | | | | 2,714 | | | | | |
First Community Corp. | | | 59 | | | | 838 | | | | | |
First Financial Bancorp | | | 800 | | | | 11,440 | | | | | |
First Financial Bankshares, Inc. | | | 1,064 | | | | 31,718 | | | | | |
First Financial Corp. | | | 111 | | | | 3,854 | | | | | |
First Foundation, Inc. | | | 325 | | | | 4,833 | | | | | |
First Guaranty Bancshares, Inc. | | | 30 | | | | 436 | | | | | |
First Internet Bancorp | | | 78 | | | | 1,679 | | | | | |
SunAmerica Specialty Series — AIG Small-Cap Fund
PORTFOLIO OF INVESTMENTS — October 31, 2020 — (continued)
| | | | | | | | |
| Security Description | | Shares | | |
Value
(Note 3) | |
|
|
COMMON STOCKS (continued) | |
Banks-Commercial (continued) | |
First Interstate BancSystem, Inc., Class A | | | 346 | | | $ | 12,214 | |
First Merchants Corp. | | | 445 | | | | 11,619 | |
First Mid Bancshares, Inc. | | | 120 | | | | 3,331 | |
First Midwest Bancorp, Inc. | | | 940 | | | | 11,797 | |
First Northwest Bancorp | | | 72 | | | | 846 | |
First of Long Island Corp. | | | 188 | | | | 2,901 | |
First United Corp. | | | 55 | | | | 656 | |
Flagstar Bancorp, Inc. | | | 352 | | | | 10,331 | |
FNCB Bancorp, Inc. | | | 141 | | | | 775 | |
Franklin Financial Services Corp. | | | 34 | | | | 748 | |
Fulton Financial Corp. | | | 1,309 | | | | 14,386 | |
FVCBankcorp, Inc.† | | | 97 | | | | 1,197 | |
German American Bancorp, Inc. | | | 203 | | | | 6,124 | |
Glacier Bancorp, Inc. | | | 790 | | | | 28,282 | |
Great Southern Bancorp, Inc. | | | 91 | | | | 3,726 | |
Great Western Bancorp, Inc. | | | 456 | | | | 5,923 | |
Guaranty Bancshares, Inc. | | | 58 | | | | 1,676 | |
Hancock Whitney Corp. | | | 711 | | | | 16,261 | |
Hanmi Financial Corp. | | | 252 | | | | 2,265 | |
HarborOne Bancorp, Inc. | | | 436 | | | | 4,098 | |
Hawthorn Bancshares, Inc. | | | 48 | | | | 910 | |
HBT Financial, Inc. | | | 81 | | | | 1,000 | |
Heartland Financial USA, Inc. | | | 286 | | | | 9,421 | |
Heritage Commerce Corp. | | | 479 | | | | 3,473 | |
Heritage Financial Corp. | | | 297 | | | | 6,225 | |
Hilltop Holdings, Inc. | | | 594 | | | | 13,549 | |
Home BancShares, Inc. | | | 1,261 | | | | 20,933 | |
HomeStreet, Inc. | | | 183 | | | | 5,686 | |
Hope Bancorp, Inc. | | | 968 | | | | 7,812 | |
Horizon Bancorp, Inc. | | | 353 | | | | 4,377 | |
Howard Bancorp, Inc.† | | | 109 | | | | 1,104 | |
Independent Bank Corp. | | | 174 | | | | 2,605 | |
Independent Bank Corp. | | | 271 | | | | 15,526 | |
International Bancshares Corp. | | | 440 | | | | 12,179 | |
Investar Holding Corp. | | | 84 | | | | 1,171 | |
Kearny Financial Corp. | | | 660 | | | | 5,544 | |
Lakeland Bancorp, Inc. | | | 402 | | | | 4,474 | |
Lakeland Financial Corp. | | | 204 | | | | 10,431 | |
Landmark Bancorp, Inc. | | | 32 | | | | 750 | |
LCNB Corp. | | | 100 | | | | 1,376 | |
Level One Bancorp, Inc. | | | 42 | | | | 661 | |
Limestone Bancorp, Inc.† | | | 43 | | | | 456 | |
Live Oak Bancshares, Inc. | | | 231 | | | | 8,612 | |
Luther Burbank Corp. | | | 151 | | | | 1,424 | |
Macatawa Bank Corp. | | | 216 | | | | 1,553 | |
Mackinac Financial Corp. | | | 74 | | | | 735 | |
MainStreet Bancshares, Inc.† | | | 58 | | | | 865 | |
Mercantile Bank Corp. | | | 130 | | | | 2,842 | |
Merchants Bancorp | | | 72 | | | | 1,554 | |
Meridian Corp. | | | 44 | | | | 774 | |
Meta Financial Group, Inc. | | | 9,559 | | | | 280,461 | |
Metrocity Bankshares, Inc. | | | 143 | | | | 1,998 | |
Metropolitan Bank Holding Corp.† | | | 58 | | | | 1,737 | |
Mid Penn Bancorp, Inc. | | | 57 | | | | 1,114 | |
Middlefield Banc Corp. | | | 49 | | | | 935 | |
Midland States Bancorp, Inc. | | | 177 | | | | 2,637 | |
MidWestOne Financial Group, Inc. | | | 121 | | | | 2,438 | |
MVB Financial Corp. | | | 81 | | | | 1,292 | |
|
|
Banks-Commercial (continued) | |
National Bankshares, Inc. | | | 53 | | | $ | 1,441 | |
NBT Bancorp, Inc. | | | 351 | | | | 9,610 | |
Nicolet Bankshares, Inc.† | | | 77 | | | | 4,751 | |
Northeast Bank | | | 63 | | | | 1,209 | |
Northrim BanCorp, Inc. | | | 52 | | | | 1,485 | |
Norwood Financial Corp. | | | 48 | | | | 1,098 | |
Oak Valley Bancorp | | | 56 | | | | 777 | |
OFG Bancorp | | | 417 | | | | 6,001 | |
Ohio Valley Banc Corp. | | | 35 | | | | 749 | |
Old National Bancorp | | | 1,352 | | | | 18,901 | |
Old Second Bancorp, Inc. | | | 237 | | | | 2,026 | |
OP Bancorp | | | 101 | | | | 649 | |
Origin Bancorp, Inc. | | | 181 | | | | 4,049 | |
Orrstown Financial Services, Inc. | | | 90 | | | | 1,258 | |
Park National Corp. | | | 118 | | | | 10,815 | |
Partners Bancorp | | | 81 | | | | 407 | |
PCB Bancorp | | | 103 | | | | 968 | |
PCSB Financial Corp. | | | 122 | | | | 1,643 | |
Peapack-Gladstone Financial Corp. | | | 151 | | | | 2,549 | |
Penns Woods Bancorp, Inc. | | | 56 | | | | 1,157 | |
Peoples Bancorp of North Carolina, Inc. | | | 37 | | | | 640 | |
Peoples Bancorp, Inc. | | | 152 | | | | 3,435 | |
Peoples Financial Services Corp. | | | 58 | | | | 2,079 | |
Pioneer Bancorp, Inc.† | | | 96 | | | | 908 | |
Plumas Bancorp | | | 38 | | | | 765 | |
Preferred Bank | | | 114 | | | | 3,857 | |
Premier Financial Bancorp, Inc. | | | 108 | | | | 1,350 | |
Premier Financial Corp. | | | 305 | | | | 5,487 | |
Provident Bancorp, Inc. | | | 71 | | | | 612 | |
QCR Holdings, Inc. | | | 122 | | | | 3,786 | |
RBB Bancorp | | | 137 | | | | 1,749 | |
Red River Bancshares, Inc. | | | 41 | | | | 1,862 | |
Reliant Bancorp, Inc. | | | 124 | | | | 2,089 | |
Renasant Corp. | | | 449 | | | | 12,801 | |
Republic Bancorp, Inc., Class A | | | 80 | | | | 2,666 | |
Republic First Bancorp, Inc.† | | | 375 | | | | 836 | |
Richmond Mutual BanCorp, Inc. | | | 101 | | | | 1,106 | |
S&T Bancorp, Inc. | | | 319 | | | | 6,313 | |
Salisbury Bancorp, Inc. | | | 21 | | | | 711 | |
Sandy Spring Bancorp, Inc. | | | 380 | | | | 9,633 | |
SB Financial Group, Inc. | | | 59 | | | | 905 | |
Seacoast Banking Corp. of Florida† | | | 426 | | | | 9,150 | |
Select Bancorp, Inc.† | | | 129 | | | | 961 | |
ServisFirst Bancshares, Inc. | | | 402 | | | | 14,834 | |
Shore Bancshares, Inc. | | | 102 | | | | 1,104 | |
Sierra Bancorp | | | 115 | | | | 2,282 | |
Silvergate Capital Corp., Class A† | | | 12,732 | | | | 284,688 | |
Simmons First National Corp., Class A | | | 893 | | | | 15,172 | |
SmartFinancial, Inc. | | | 116 | | | | 1,733 | |
South Plains Financial, Inc. | | | 87 | | | | 1,275 | |
South State Corp. | | | 577 | | | | 35,428 | |
Southern First Bancshares, Inc.† | | | 60 | | | | 1,610 | |
Southern National Bancorp of Virginia, Inc. | | | 163 | | | | 1,575 | |
Southside Bancshares, Inc. | | | 261 | | | | 7,037 | |
Spirit of Texas Bancshares, Inc. | | | 108 | | | | 1,373 | |
Standard AVB Financial Corp. | | | 32 | | | | 1,050 | |
Sterling Bancorp, Inc. | | | 135 | | | | 477 | |
Stock Yards Bancorp, Inc. | | | 169 | | | | 6,459 | |
SunAmerica Specialty Series — AIG Small-Cap Fund
PORTFOLIO OF INVESTMENTS — October 31, 2020 — (continued)
| | | | | | | | |
| Security Description | | Shares | | |
Value
(Note 3) | |
|
|
COMMON STOCKS (continued) | |
Banks-Commercial (continued) | |
Summit Financial Group, Inc. | | | 94 | | | $ | 1,693 | |
Texas Capital Bancshares, Inc.† | | | 417 | | | | 18,765 | |
Tompkins Financial Corp. | | | 118 | | | | 6,607 | |
Towne Bank | | | 552 | | | | 10,035 | |
TriCo Bancshares | | | 218 | | | | 6,307 | |
TriState Capital Holdings, Inc.† | | | 227 | | | | 2,858 | |
Triumph Bancorp, Inc.† | | | 187 | | | | 7,878 | |
TrustCo Bank Corp. | | | 781 | | | | 4,292 | |
Trustmark Corp. | | | 520 | | | | 12,163 | |
UMB Financial Corp. | | | 360 | | | | 21,913 | |
United Bankshares, Inc. | | | 1,021 | | | | 26,781 | |
United Community Banks, Inc. | | | 644 | | | | 13,485 | |
United Security Bancshares | | | 111 | | | | 690 | |
Unity Bancorp, Inc. | | | 64 | | | | 897 | |
Univest Financial Corp. | | | 237 | | | | 3,759 | |
Valley National Bancorp | | | 3,286 | | | | 25,105 | |
Veritex Holdings, Inc. | | | 391 | | | | 7,714 | |
Washington Trust Bancorp, Inc. | | | 141 | | | | 4,762 | |
WesBanco, Inc. | | | 538 | | | | 13,068 | |
West BanCorp, Inc. | | | 132 | | | | 2,190 | |
Westamerica BanCorp | | | 215 | | | | 11,260 | |
Western New England Bancorp, Inc. | | | 188 | | | | 1,083 | |
| | | | | | |
|
|
|
| | | | | | | | 1,769,855 | |
| | | | | | |
|
|
|
Banks-Fiduciary — 0.0% | |
Parke Bancorp, Inc. | | | 87 | | | | 1,047 | |
| | | | | | |
|
|
|
Banks-Mortgage — 0.0% | |
Walker & Dunlop, Inc. | | | 233 | | | | 14,651 | |
| | | | | | |
|
|
|
Banks-Super Regional — 0.1% | |
Independent Bank Group, Inc. | | | 305 | | | | 15,732 | |
National Bank Holdings Corp., Class A | | | 243 | | | | 7,326 | |
| | | | | | |
|
|
|
| | | | | | | | 23,058 | |
| | | | | | |
|
|
|
Batteries/Battery Systems — 0.1% | |
EnerSys | | | 351 | | | | 25,132 | |
| | | | | | |
|
|
|
Beverages-Non-alcoholic — 0.1% | |
Celsius Holdings, Inc.† | | | 283 | | | | 5,691 | |
Coca-Cola Consolidated, Inc. | | | 39 | | | | 8,929 | |
National Beverage Corp.† | | | 97 | | | | 7,594 | |
NewAge, Inc.† | | | 781 | | | | 1,827 | |
Primo Water Corp. | | | 1,288 | | | | 16,139 | |
| | | | | | |
|
|
|
| | | | | | | | 40,180 | |
| | | | | | |
|
|
|
Beverages-Wine/Spirits — 0.0% | |
MGP Ingredients, Inc. | | | 106 | | | | 4,454 | |
| | | | | | |
|
|
|
Broadcast Services/Program — 0.0% | |
Hemisphere Media Group, Inc.† | | | 135 | | | | 1,056 | |
MSG Networks, Inc., Class A† | | | 328 | | | | 2,932 | |
| | | | | | |
|
|
|
| | | | | | | | 3,988 | |
| | | | | | |
|
|
|
Building & Construction Products-Misc. — 1.5% | |
American Woodmark Corp.† | | | 140 | | | | 11,565 | |
Builders FirstSource, Inc.† | | | 954 | | | | 28,906 | |
Caesarstone, Ltd. | | | 183 | | | | 1,766 | |
Forterra, Inc.† | | | 16,667 | | | | 217,504 | |
Gibraltar Industries, Inc.† | | | 269 | | | | 15,454 | |
Louisiana-Pacific Corp. | | | 930 | | | | 26,580 | |
|
|
Building & Construction Products-Misc. (continued) | |
Patrick Industries, Inc. | | | 3,289 | | | $ | 183,362 | |
Simpson Manufacturing Co., Inc. | | | 359 | | | | 31,851 | |
Summit Materials, Inc., Class A† | | | 945 | | | | 16,717 | |
| | | | | | |
|
|
|
| | | | | | | | 533,705 | |
| | | | | | |
|
|
|
Building & Construction-Misc. — 0.4% | |
Comfort Systems USA, Inc. | | | 296 | | | | 13,557 | |
EMCOR Group, Inc. | | | 448 | | | | 30,549 | |
IES Holdings, Inc.† | | | 67 | | | | 2,139 | |
MYR Group, Inc.† | | | 134 | | | | 5,728 | |
NV5 Global, Inc.† | | | 90 | | | | 5,047 | |
TopBuild Corp.† | | | 273 | | | | 41,826 | |
WillScot Mobile Mini Holdings Corp.† | | | 1,322 | | | | 24,563 | |
| | | | | | |
|
|
|
| | | | | | | | 123,409 | |
| | | | | | |
|
|
|
Building Products-Air & Heating — 0.1% | |
AAON, Inc. | | | 339 | | | | 19,801 | |
SPX Corp.† | | | 355 | | | | 15,048 | |
| | | | | | |
|
|
|
| | | | | | | | 34,849 | |
| | | | | | |
|
|
|
Building Products-Cement — 0.0% | |
Concrete Pumping Holdings, Inc.† | | | 221 | | | | 714 | |
US Concrete, Inc.† | | | 132 | | | | 4,483 | |
| | | | | | |
|
|
|
| | | | | | | | 5,197 | |
| | | | | | |
|
|
|
Building Products-Doors & Windows — 0.2% | |
Apogee Enterprises, Inc. | | | 212 | | | | 5,065 | |
Cornerstone Building Brands, Inc.† | | | 361 | | | | 2,769 | |
Griffon Corp. | | | 355 | | | | 7,611 | |
JELD-WEN Holding, Inc.† | | | 560 | | | | 11,777 | |
Masonite International Corp.† | | | 201 | | | | 17,688 | |
PGT Innovations, Inc.† | | | 470 | | | | 7,792 | |
| | | | | | |
|
|
|
| | | | | | | | 52,702 | |
| | | | | | |
|
|
|
Building Products-Light Fixtures — 0.0% | |
LSI Industries, Inc. | | | 211 | | | | 1,443 | |
Research Frontiers, Inc.† | | | 219 | | | | 567 | |
| | | | | | |
|
|
|
| | | | | | | | 2,010 | |
| | | | | | |
|
|
|
Building Products-Wood — 0.1% | |
Boise Cascade Co. | | | 322 | | | | 12,358 | |
UFP Industries, Inc. | | | 493 | | | | 24,606 | |
| | | | | | |
|
|
|
| | | | | | | | 36,964 | |
| | | | | | |
|
|
|
Building-Heavy Construction — 0.9% | |
Aegion Corp.† | | | 250 | | | | 3,527 | |
Arcosa, Inc. | | | 400 | | | | 18,468 | |
Construction Partners, Inc., Class A† | | | 217 | | | | 4,422 | |
Dycom Industries, Inc.† | | | 253 | | | | 16,430 | |
Granite Construction, Inc. | | | 386 | | | | 7,454 | |
Great Lakes Dredge & Dock Corp.† | | | 20,596 | | | | 212,757 | |
MasTec, Inc.† | | | 467 | | | | 23,182 | |
Primoris Services Corp. | | | 396 | | | | 7,472 | |
Sterling Construction Co., Inc.† | | | 228 | | | | 3,352 | |
Tutor Perini Corp.† | | | 336 | | | | 4,539 | |
| | | | | | |
|
|
|
| | | | | | | | 301,603 | |
| | | | | | |
|
|
|
Building-Maintenance & Services — 0.1% | |
ABM Industries, Inc. | | | 553 | | | | 19,200 | |
BrightView Holdings, Inc.† | | | 337 | | | | 4,122 | |
| | | | | | |
|
|
|
| | | | | | | | 23,322 | |
| | | | | | |
|
|
|
SunAmerica Specialty Series — AIG Small-Cap Fund
PORTFOLIO OF INVESTMENTS — October 31, 2020 — (continued)
| | | | | | | | |
| Security Description | | Shares | | |
Value
(Note 3) | |
|
|
COMMON STOCKS (continued) | |
Building-Mobile Home/Manufactured Housing — 0.2% | | | | | |
Cavco Industries, Inc.† | | | 76 | | | $ | 13,083 | |
LCI Industries | | | 203 | | | | 22,261 | |
Skyline Champion Corp.† | | | 434 | | | | 11,132 | |
Winnebago Industries, Inc. | | | 257 | | | | 12,066 | |
| | | | | | |
|
|
|
| | | | | | | | 58,542 | |
| | | | | | |
|
|
|
Building-Residential/Commercial — 1.1% | |
Beazer Homes USA, Inc.† | | | 235 | | | | 2,862 | |
Century Communities, Inc.† | | | 5,283 | | | | 205,192 | |
Forestar Group, Inc.† | | | 137 | | | | 2,280 | |
Green Brick Partners, Inc.† | | | 196 | | | | 3,506 | |
Installed Building Products, Inc.† | | | 188 | | | | 17,021 | |
KB Home | | | 727 | | | | 23,446 | |
LGI Homes, Inc.† | | | 184 | | | | 19,666 | |
M/I Homes, Inc.† | | | 230 | | | | 9,412 | |
MDC Holdings, Inc. | | | 419 | | | | 18,235 | |
Meritage Homes Corp.† | | | 307 | | | | 26,737 | |
Taylor Morrison Home Corp.† | | | 1,041 | | | | 22,485 | |
TRI Pointe Group, Inc.† | | | 1,069 | | | | 17,564 | |
| | | | | | |
|
|
|
| | | | | | | | 368,406 | |
| | | | | | |
|
|
|
Cable/Satellite TV — 0.1% | |
Liberty Latin America, Ltd., Class A† | | | 381 | | | | 3,734 | |
Liberty Latin America, Ltd., Class C† | | | 1,279 | | | | 12,432 | |
WideOpenWest, Inc.† | | | 431 | | | | 2,150 | |
| | | | | | |
|
|
|
| | | | | | | | 18,316 | |
| | | | | | |
|
|
|
Casino Hotels — 0.1% | |
Boyd Gaming Corp. | | | 670 | | | | 21,253 | |
Century Casinos, Inc.† | | | 223 | | | | 1,050 | |
| | | | | | |
|
|
|
| | | | | | | | 22,303 | |
| | | | | | |
|
|
|
Casino Services — 0.2% | |
Accel Entertainment, Inc.† | | | 366 | | | | 3,514 | |
Caesars Entertainment, Inc.† | | | 1,368 | | | | 61,314 | |
Everi Holdings, Inc.† | | | 677 | | | | 5,829 | |
Scientific Games Corp.† | | | 471 | | | | 15,015 | |
| | | | | | |
|
|
|
| | | | | | | | 85,672 | |
| | | | | | |
|
|
|
Cellular Telecom — 0.0% | |
Cambium Networks Corp.† | | | 46 | | | | 1,060 | |
| | | | | | |
|
|
|
Chemicals-Diversified — 0.2% | |
Aceto Chemicals, Inc.†(1) | | | 1 | | | | 0 | |
AdvanSix, Inc.† | | | 226 | | | | 3,440 | |
Codexis, Inc.† | | | 442 | | | | 5,883 | |
Innospec, Inc. | | | 202 | | | | 13,360 | |
Koppers Holdings, Inc.† | | | 170 | | | | 3,813 | |
Orion Engineered Carbons SA | | | 497 | | | | 7,291 | |
Quaker Chemical Corp. | | | 110 | | | | 20,987 | |
Stepan Co. | | | 178 | | | | 20,726 | |
| | | | | | |
|
|
|
| | | | | | | | 75,500 | |
| | | | | | |
|
|
|
Chemicals-Fibers — 0.0% | |
Rayonier Advanced Materials, Inc.† | | | 511 | | | | 1,753 | |
| | | | | | |
|
|
|
Chemicals-Other — 0.0% | |
American Vanguard Corp. | | | 238 | | | | 3,075 | |
| | | | | | |
|
|
|
Chemicals-Specialty — 0.5% | |
AgroFresh Solutions, Inc.† | | | 253 | | | | 521 | |
|
|
Chemicals-Specialty (continued) | |
Amyris, Inc.† | | | 879 | | | | 2,198 | |
Balchem Corp. | | | 265 | | | | 26,487 | |
Ferro Corp.† | | | 675 | | | | 8,680 | |
GCP Applied Technologies, Inc.† | | | 403 | | | | 8,789 | |
H.B. Fuller Co. | | | 424 | | | | 19,186 | |
Hawkins, Inc. | | | 80 | | | | 3,737 | |
Ingevity Corp.† | | | 342 | | | | 18,769 | |
Kraton Corp.† | | | 257 | | | | 7,273 | |
Minerals Technologies, Inc. | | | 281 | | | | 15,368 | |
Oil-Dri Corp. of America | | | 42 | | | | 1,435 | |
PQ Group Holdings, Inc.† | | | 316 | | | | 3,653 | |
Rogers Corp.† | | | 154 | | | | 18,668 | |
Sensient Technologies Corp. | | | 350 | | | | 22,900 | |
Tronox Holdings PLC, Class A | | | 738 | | | | 7,210 | |
| | | | | | |
|
|
|
| | | | | | | | 164,874 | |
| | | | | | |
|
|
|
Circuit Boards — 0.0% | |
TTM Technologies, Inc.† | | | 824 | | | | 9,781 | |
| | | | | | |
|
|
|
Coal — 0.0% | |
Arch Resources, Inc., Class A | | | 125 | | | | 3,819 | |
CONSOL Energy, Inc.† | | | 214 | | | | 811 | |
NACCO Industries, Inc., Class A | | | 31 | | | | 604 | |
Peabody Energy Corp. | | | 517 | | | | 667 | |
SunCoke Energy, Inc. | | | 685 | | | | 2,391 | |
Warrior Met Coal, Inc. | | | 424 | | | | 6,360 | |
| | | | | | |
|
|
|
| | | | | | | | 14,652 | |
| | | | | | |
|
|
|
Coatings/Paint — 0.0% | |
Kronos Worldwide, Inc. | | | 184 | | | | 2,451 | |
| | | | | | |
|
|
|
Coffee — 0.0% | |
Farmer Brothers Co.† | | | 132 | | | | 458 | |
| | | | | | |
|
|
|
Commercial Services — 0.7% | |
Collectors Universe, Inc. | | | 75 | | | | 4,120 | |
Emerald Holding, Inc. | | | 202 | | | | 529 | |
HMS Holdings Corp.† | | | 726 | | | | 19,326 | |
LiveRamp Holdings, Inc.† | | | 529 | | | | 34,962 | |
Medifast, Inc. | | | 93 | | | | 13,065 | |
National Research Corp. | | | 111 | | | | 5,750 | |
PFSweb, Inc.† | | | 25,788 | | | | 159,886 | |
Progyny, Inc.† | | | 220 | | | | 5,361 | |
ServiceSource International, Inc.† | | | 716 | | | | 995 | |
SP Plus Corp.† | | | 190 | | | | 3,502 | |
Team, Inc.† | | | 247 | | | | 1,324 | |
WW International, Inc.† | | | 389 | | | | 8,231 | |
| | | | | | |
|
|
|
| | | | | | | | 257,051 | |
| | | | | | |
|
|
|
Commercial Services-Finance — 0.2% | |
Cardtronics PLC, Class A† | | | 297 | | | | 5,290 | |
Cass Information Systems, Inc. | | | 117 | | | | 4,589 | |
CBIZ, Inc.† | | | 420 | | | | 9,521 | |
EVERTEC, Inc. | | | 496 | | | | 16,507 | |
Evo Payments, Inc., Class A† | | | 336 | | | | 7,079 | |
Franchise Group, Inc. | | | 180 | | | | 4,126 | |
Green Dot Corp., Class A† | | | 420 | | | | 22,394 | |
GreenSky, Inc., Class A† | | | 512 | | | | 2,422 | |
MoneyGram International, Inc.† | | | 511 | | | | 2,632 | |
Priority Technology Holdings, Inc.† | | | 63 | | | | 182 | |
Repay Holdings Corp.† | | | 491 | | | | 11,062 | |
| | | | | | |
|
|
|
| | | | | | | | 85,804 | |
| | | | | | |
|
|
|
SunAmerica Specialty Series — AIG Small-Cap Fund
PORTFOLIO OF INVESTMENTS — October 31, 2020 — (continued)
| | | | | | | | |
| Security Description | | Shares | | |
Value
(Note 3) | |
|
|
COMMON STOCKS (continued) | |
Communications Software — 0.1% | | | | | |
8x8, Inc.† | | | 852 | | | $ | 14,723 | |
Avaya Holdings Corp.† | | | 682 | | | | 11,730 | |
SeaChange International, Inc.† | | | 249 | | | | 187 | |
Smith Micro Software, Inc.† | | | 282 | | | | 1,162 | |
| | | | | | |
|
|
|
| | | | | | | | 27,802 | |
| | | | | | |
|
|
|
Computer Aided Design — 0.0% | |
Altair Engineering, Inc., Class A† | | | 350 | | | | 15,060 | |
| | | | | | |
|
|
|
Computer Data Security — 0.3% | |
OneSpan, Inc.† | | | 275 | | | | 6,031 | |
Ping Identity Holding Corp.† | | | 302 | | | | 8,362 | |
Qualys, Inc.† | | | 281 | | | | 24,686 | |
Rapid7, Inc.† | | | 415 | | | | 25,701 | |
SecureWorks Corp., Class A† | | | 74 | | | | 770 | |
Tenable Holdings, Inc.† | | | 575 | | | | 19,613 | |
Varonis Systems, Inc.† | | | 257 | | | | 29,701 | |
| | | | | | |
|
|
|
| | | | | | | | 114,864 | |
| | | | | | |
|
|
|
Computer Services — 0.6% | |
Conduent, Inc.† | | | 1,360 | | | | 4,740 | |
ExlService Holdings, Inc.† | | | 277 | | | | 20,980 | |
Insight Enterprises, Inc.† | | | 286 | | | | 15,258 | |
Mastech Digital, Inc.† | | | 4,916 | | | | 77,083 | |
MAXIMUS, Inc. | | | 504 | | | | 34,060 | |
PAE, Inc.† | | | 487 | | | | 3,857 | |
Parsons Corp.† | | | 186 | | | | 5,863 | |
Perspecta, Inc. | | | 1,148 | | | | 20,584 | |
Rimini Street, Inc.† | | | 185 | | | | 586 | |
StarTek, Inc.† | | | 144 | | | | 756 | |
Sykes Enterprises, Inc.† | | | 319 | | | | 10,923 | |
TTEC Holdings, Inc. | | | 150 | | | | 8,217 | |
Unisys Corp.† | | | 510 | | | | 6,701 | |
Virtusa Corp.† | | | 240 | | | | 12,072 | |
| | | | | | |
|
|
|
| | | | | | | | 221,680 | |
| | | | | | |
|
|
|
Computer Software — 2.0% | |
Avid Technology, Inc.† | | | 30,664 | | | | 285,789 | |
Bandwidth, Inc., Class A† | | | 158 | | | | 25,336 | |
Box, Inc., Class A† | | | 1,144 | | | | 17,732 | |
Cloudera, Inc.† | | | 1,689 | | | | 16,417 | |
Cornerstone OnDemand, Inc.† | | | 500 | | | | 18,995 | |
Envestnet, Inc.† | | | 438 | | | | 33,612 | |
J2 Global, Inc.† | | | 373 | | | | 25,319 | |
Red Violet, Inc.† | | | 56 | | | | 1,165 | |
Simulations Plus, Inc. | | | 116 | | | | 7,519 | |
Upland Software, Inc.† | | | 5,303 | | | | 221,241 | |
Veritone, Inc.† | | | 193 | | | | 1,810 | |
Verra Mobility Corp.† | | | 1,103 | | | | 10,600 | |
Xperi Holding Corp. | | | 885 | | | | 10,974 | |
Yext, Inc.† | | | 834 | | | | 13,828 | |
Zuora, Inc., Class A† | | | 828 | | | | 7,965 | |
| | | | | | |
|
|
|
| | | | | | | | 698,302 | |
| | | | | | |
|
|
|
Computers-Integrated Systems — 0.1% | |
Cubic Corp. | | | 259 | | | | 15,310 | |
Diebold Nixdorf, Inc.† | | | 579 | | | | 3,607 | |
MTS Systems Corp. | | | 159 | | | | 3,861 | |
NetScout Systems, Inc.† | | | 573 | | | | 11,758 | |
|
|
Computers-Integrated Systems (continued) | |
PAR Technology Corp.† | | | 133 | | | | 4,917 | |
Super Micro Computer, Inc.† | | | 370 | | | | 8,406 | |
| | | | | | |
|
|
|
| | | | | | | | 47,859 | |
| | | | | | |
|
|
|
Computers-Memory Devices — 0.0% | |
Quantum Corp.† | | | 241 | | | | 1,007 | |
| | | | | | |
|
|
|
Computers-Other — 0.0% | |
3D Systems Corp.† | | | 973 | | | | 5,536 | |
ExOne Co.† | | | 95 | | | | 955 | |
PlayAGS, Inc.† | | | 219 | | | | 591 | |
| | | | | | |
|
|
|
| | | | | | | | 7,082 | |
| | | | | | |
|
|
|
Computers-Periphery Equipment — 0.3% | |
iCAD, Inc.† | | | 9,552 | | | | 93,228 | |
Mitek Systems, Inc.† | | | 330 | | | | 4,108 | |
| | | | | | |
|
|
|
| | | | | | | | 97,336 | |
| | | | | | |
|
|
|
Computers-Voice Recognition — 0.0% | |
Vocera Communications, Inc.† | | | 265 | | | | 8,687 | |
| | | | | | |
|
|
|
Consulting Services — 0.2% | |
Acacia Research Corp.† | | | 392 | | | | 1,235 | |
CRA International, Inc. | | | 62 | | | | 2,539 | |
Forrester Research, Inc.† | | | 90 | | | | 3,325 | |
Franklin Covey Co.† | | | 103 | | | | 1,743 | |
GP Strategies Corp.† | | | 108 | | | | 1,042 | |
Hackett Group, Inc. | | | 206 | | | | 2,662 | |
Huron Consulting Group, Inc.† | | | 187 | | | | 7,080 | |
ICF International, Inc. | | | 150 | | | | 9,808 | |
Information Services Group, Inc.† | | | 296 | | | | 607 | |
Kelly Services, Inc., Class A | | | 277 | | | | 4,814 | |
R1 RCM, Inc.† | | | 881 | | | | 15,787 | |
Vectrus, Inc.† | | | 94 | | | | 3,715 | |
| | | | | | |
|
|
|
| | | | | | | | 54,357 | |
| | | | | | |
|
|
|
Consumer Products-Misc. — 0.2% | |
Central Garden & Pet Co.† | | | 80 | | | | 3,117 | |
Central Garden & Pet Co., Class A† | | | 326 | | | | 11,537 | |
Helen of Troy, Ltd.† | | | 209 | | | | 39,626 | |
Quanex Building Products Corp. | | | 271 | | | | 4,932 | |
WD-40 Co. | | | 112 | | | | 27,259 | |
| | | | | | |
|
|
|
| | | | | | | | 86,471 | |
| | | | | | |
|
|
|
Containers-Metal/Glass — 0.1% | |
Greif, Inc., Class A | | | 212 | | | | 8,605 | |
Greif, Inc., Class B | | | 49 | | | | 2,119 | |
O-I Glass, Inc. | | | 1,292 | | | | 12,184 | |
| | | | | | |
|
|
|
| | | | | | | | 22,908 | |
| | | | | | |
|
|
|
Containers-Paper/Plastic — 0.0% | |
Matthews International Corp., Class A | | | 251 | | | | 5,479 | |
TriMas Corp.† | | | 357 | | | | 8,686 | |
UFP Technologies, Inc.† | | | 57 | | | | 2,113 | |
| | | | | | |
|
|
|
| | | | | | | | 16,278 | |
| | | | | | |
|
|
|
Cosmetics & Toiletries — 0.4% | |
e.l.f. Beauty, Inc.† | | | 5,403 | | | | 109,519 | |
Edgewell Personal Care Co.† | | | 449 | | | | 11,773 | |
Inter Parfums, Inc. | | | 147 | | | | 6,036 | |
SunAmerica Specialty Series — AIG Small-Cap Fund
PORTFOLIO OF INVESTMENTS — October 31, 2020 — (continued)
| | | | | | | | |
| Security Description | | Shares | | |
Value
(Note 3) | |
|
|
COMMON STOCKS (continued) | |
Cosmetics & Toiletries (continued) | |
Revlon, Inc., Class A† | | | 57 | | | $ | 233 | |
| | | | | | |
|
|
|
| | | | | | | | 127,561 | |
| | | | | | |
|
|
|
Cruise Lines — 0.0% | |
Lindblad Expeditions Holdings, Inc.† | | | 212 | | | | 1,764 | |
| | | | | | |
|
|
|
Data Processing/Management — 0.1% | |
Bottomline Technologies DE, Inc.† | | | 357 | | | | 14,180 | |
CommVault Systems, Inc.† | | | 345 | | | | 13,658 | |
CSG Systems International, Inc. | | | 270 | | | | 10,228 | |
| | | | | | |
|
|
|
| | | | | | | | 38,066 | |
| | | | | | |
|
|
|
Dental Supplies & Equipment — 0.1% | |
Patterson Cos., Inc. | | | 699 | | | | 17,388 | |
| | | | | | |
|
|
|
Diagnostic Equipment — 1.0% | |
Accelerate Diagnostics, Inc.† | | | 256 | | | | 2,412 | |
BioTelemetry, Inc.† | | | 3,944 | | | | 167,936 | |
GenMark Diagnostics, Inc.† | | | 574 | | | | 7,014 | |
Nymox Pharmaceutical Corp.† | | | 345 | | | | 662 | |
Quanterix Corp.† | | | 4,769 | | | | 174,593 | |
Quotient, Ltd.† | | | 475 | | | | 2,242 | |
| | | | | | |
|
|
|
| | | | | | | | 354,859 | |
| | | | | | |
|
|
|
Diagnostic Kits — 1.3% | |
Aspira Women’s Health, Inc.† | | | 654 | | | | 2,465 | |
Chembio Diagnostics, Inc.† | | | 21,166 | | | | 100,327 | |
Co-Diagnostics, Inc.† | | | 219 | | | | 2,937 | |
Meridian Bioscience, Inc.† | | | 17,109 | | | | 293,419 | |
Natera, Inc.† | | | 584 | | | | 39,280 | |
OraSure Technologies, Inc.† | | | 586 | | | | 8,755 | |
| | | | | | |
|
|
|
| | | | | | | | 447,183 | |
| | | | | | |
|
|
|
Dialysis Centers — 0.0% | |
American Renal Associates Holdings, Inc.† | | | 118 | | | | 1,356 | |
| | | | | | |
|
|
|
Direct Marketing — 0.0% | |
Quotient Technology, Inc.† | | | 708 | | | | 6,301 | |
| | | | | | |
|
|
|
Disposable Medical Products — 0.7% | |
BioLife Solutions, Inc.† | | | 7,328 | | | | 210,387 | |
CONMED Corp. | | | 224 | | | | 17,465 | |
Merit Medical Systems, Inc.† | | | 447 | | | | 22,372 | |
Utah Medical Products, Inc. | | | 28 | | | | 2,324 | |
| | | | | | |
|
|
|
| | | | | | | | 252,548 | |
| | | | | | |
|
|
|
Distribution/Wholesale — 0.5% | |
A-Mark Precious Metals, Inc. | | | 40 | | | | 1,243 | |
Avient Corp. | | | 754 | | | | 23,427 | |
Core-Mark Holding Co., Inc. | | | 368 | | | | 10,065 | |
EVI Industries, Inc.† | | | 40 | | | | 1,168 | |
Fossil Group, Inc.† | | | 387 | | | | 2,210 | |
G-III Apparel Group, Ltd.† | | | 363 | | | | 4,893 | |
H&E Equipment Services, Inc. | | | 264 | | | | 5,555 | |
KAR Auction Services, Inc. | | | 1,065 | | | | 15,506 | |
Resideo Technologies, Inc.† | | | 1,022 | | | | 10,302 | |
ScanSource, Inc.† | | | 209 | | | | 4,201 | |
SiteOne Landscape Supply, Inc.† | | | 362 | | | | 43,255 | |
Systemax, Inc. | | | 102 | | | | 2,900 | |
Titan Machinery, Inc.† | | | 157 | | | | 2,354 | |
Triton International, Ltd. | | | 499 | | | | 18,403 | |
|
|
Distribution/Wholesale (continued) | |
Veritiv Corp.† | | | 106 | | | | 1,526 | |
VSE Corp. | | | 73 | | | | 2,114 | |
WESCO International, Inc.† | | | 405 | | | | 16,702 | |
| | | | | | |
|
|
|
| | | | | | | | 165,824 | |
| | | | | | |
|
|
|
Diversified Manufacturing Operations — 0.2% | |
Chase Corp. | | | 61 | | | | 5,805 | |
Enerpac Tool Group Corp. | | | 447 | | | | 7,970 | |
EnPro Industries, Inc. | | | 171 | | | | 10,092 | |
Fabrinet† | | | 303 | | | | 18,186 | |
Federal Signal Corp. | | | 493 | | | | 14,139 | |
NL Industries, Inc. | | | 69 | | | | 286 | |
| | | | | | |
|
|
|
| | | | | | | | 56,478 | |
| | | | | | |
|
|
|
Diversified Minerals — 0.0% | |
Caledonia Mining Corp. PLC | | | 92 | | | | 1,502 | |
Livent Corp.† | | | 1,210 | | | | 13,008 | |
United States Lime & Minerals, Inc. | | | 17 | | | | 1,576 | |
| | | | | | |
|
|
|
| | | | | | | | 16,086 | |
| | | | | | |
|
|
|
Diversified Operations — 0.0% | |
Professional Holding Corp., Class A† | | | 94 | | | | 1,281 | |
| | | | | | |
|
|
|
Diversified Operations/Commercial Services — 0.0% | |
Viad Corp. | | | 166 | | | | 3,320 | |
| | | | | | |
|
|
|
Drug Delivery Systems — 0.5% | |
Antares Pharma, Inc.† | | | 1,355 | | | | 3,699 | |
BioDelivery Sciences International, Inc.† | | | 49,621 | | | | 156,802 | |
Heron Therapeutics, Inc.† | | | 723 | | | | 11,792 | |
Revance Therapeutics, Inc.† | | | 519 | | | | 13,432 | |
| | | | | | |
|
|
|
| | | | | | | | 185,725 | |
| | | | | | |
|
|
|
E-Commerce/Products — 0.7% | |
1-800-Flowers.com, Inc., Class A† | | | 205 | | | | 4,065 | |
CarParts.com, Inc.† | | | 174 | | | | 2,208 | |
Lands’ End, Inc.† | | | 96 | | | | 1,541 | |
Liquidity Services, Inc.† | | | 229 | | | | 1,953 | |
Overstock.com, Inc.† | | | 3,622 | | | | 203,194 | |
RealReal, Inc.† | | | 514 | | | | 6,471 | |
Stitch Fix, Inc., Class A† | | | 464 | | | | 15,976 | |
| | | | | | |
|
|
|
| | | | | | | | 235,408 | |
| | | | | | |
|
|
|
E-Commerce/Services — 1.6% | |
Cargurus, Inc.† | | | 712 | | | | 14,190 | |
Cars.com, Inc.† | | | 556 | | | | 4,109 | |
ChannelAdvisor Corp.† | | | 17,767 | | | | 287,825 | |
Eventbrite, Inc., Class A† | | | 524 | | | | 4,836 | |
EverQuote, Inc., Class A† | | | 116 | | | | 3,885 | |
Groupon, Inc.† | | | 192 | | | | 3,723 | |
Shutterstock, Inc. | | | 180 | | | | 11,781 | |
Stamps.com, Inc.† | | | 140 | | | | 31,254 | |
TrueCar, Inc.† | | | 874 | | | | 3,811 | |
Upwork, Inc.† | | | 10,589 | | | | 195,367 | |
| | | | | | |
|
|
|
| | | | | | | | 560,781 | |
| | | | | | |
|
|
|
E-Marketing/Info — 0.6% | |
comScore, Inc.† | | | 489 | | | | 976 | |
Magnite, Inc.† | | | 873 | | | | 7,883 | |
QuinStreet, Inc.† | | | 13,020 | | | | 208,385 | |
| | | | | | |
|
|
|
| | | | | | | | 217,244 | |
| | | | | | |
|
|
|
SunAmerica Specialty Series — AIG Small-Cap Fund
PORTFOLIO OF INVESTMENTS — October 31, 2020 — (continued)
| | | | | | | | |
| Security Description | | Shares | | |
Value
(Note 3) | |
|
|
COMMON STOCKS (continued) | |
E-Services/Consulting — 0.8% | | | | | |
Perficient, Inc.† | | | 6,990 | | | $ | 273,728 | |
| | | | | | |
|
|
|
Electric Products-Misc. — 0.1% | |
Graham Corp. | | | 80 | | | | 1,056 | |
nLight, Inc.† | | | 287 | | | | 6,096 | |
Novanta, Inc.† | | | 282 | | | | 30,659 | |
Ultralife Corp.† | | | 75 | | | | 387 | |
| | | | | | |
|
|
|
| | | | | | | | 38,198 | |
| | | | | | |
|
|
|
Electric-Distribution — 0.0% | |
Genie Energy, Ltd., Class B | | | 109 | | | | 904 | |
Spark Energy, Inc., Class A | | | 99 | | | | 903 | |
Unitil Corp. | | | 122 | | | | 4,215 | |
| | | | | | |
|
|
|
| | | | | | | | 6,022 | |
| | | | | | |
|
|
|
Electric-Generation — 0.2% | |
Atlantic Power Corp.† | | | 717 | | | | 1,427 | |
Brookfield Renewable Corp., Class A | | | 564 | | | | 37,658 | |
Ormat Technologies, Inc. | | | 330 | | | | 23,387 | |
| | | | | | |
|
|
|
| | | | | | | | 62,472 | |
| | | | | | |
|
|
|
Electric-Integrated — 0.6% | |
ALLETE, Inc. | | | 430 | | | | 22,179 | |
Ameresco, Inc., Class A† | | | 201 | | | | 7,716 | |
Avista Corp. | | | 555 | | | | 18,437 | |
Black Hills Corp. | | | 519 | | | | 29,407 | |
Evoqua Water Technologies Corp.† | | | 753 | | | | 17,266 | |
MGE Energy, Inc. | | | 301 | | | | 19,571 | |
NorthWestern Corp. | | | 419 | | | | 21,843 | |
Otter Tail Corp. | | | 334 | | | | 12,809 | |
PNM Resources, Inc. | | | 655 | | | | 32,750 | |
Portland General Electric Co. | | | 742 | | | | 29,161 | |
| | | | | | |
|
|
|
| | | | | | | | 211,139 | |
| | | | | | |
|
|
|
Electronic Components-Misc. — 1.5% | |
Advanced Energy Industries, Inc.† | | | 313 | | | | 21,118 | |
Applied Optoelectronics, Inc.† | | | 178 | | | | 1,563 | |
Atkore International Group, Inc.† | | | 390 | | | | 8,069 | |
Bel Fuse, Inc., Class B | | | 83 | | | | 972 | |
Benchmark Electronics, Inc. | | | 301 | | | | 6,270 | |
Comtech Telecommunications Corp. | | | 200 | | | | 2,880 | |
IntriCon Corp.† | | | 70 | | | | 875 | |
Kimball Electronics, Inc.† | | | 198 | | | | 2,400 | |
Knowles Corp.† | | | 19,163 | | | | 273,073 | |
NVE Corp. | | | 39 | | | | 1,799 | |
OSI Systems, Inc.† | | | 140 | | | | 10,802 | |
Plexus Corp.† | | | 237 | | | | 16,481 | |
Sanmina Corp.† | | | 554 | | | | 13,540 | |
SMART Global Holdings, Inc.† | | | 117 | | | | 3,087 | |
SMTC Corp.† | | | 44,299 | | | | 154,603 | |
Transcat, Inc.† | | | 57 | | | | 1,762 | |
Vishay Intertechnology, Inc. | | | 1,096 | | | | 17,777 | |
Vishay Precision Group, Inc.† | | | 102 | | | | 2,437 | |
| | | | | | |
|
|
|
| | | | | | | | 539,508 | |
| | | | | | |
|
|
|
Electronic Components-Semiconductors — 0.7% | |
Alpha & Omega Semiconductor, Ltd.† | | | 169 | | | | 2,680 | |
Ambarella, Inc.† | | | 273 | | | | 14,925 | |
Amkor Technology, Inc.† | | | 823 | | | | 9,753 | |
|
|
Electronic Components-Semiconductors (continued) | | | | | |
Atomera, Inc.† | | | 132 | | | | 1,076 | |
AXT, Inc.† | | | 322 | | | | 1,916 | |
CEVA, Inc.† | | | 179 | | | | 7,217 | |
CTS Corp. | | | 263 | | | | 7,269 | |
Diodes, Inc.† | | | 349 | | | | 20,183 | |
DSP Group, Inc.† | | | 183 | | | | 2,410 | |
GSI Technology, Inc.† | | | 136 | | | | 831 | |
Impinj, Inc.† | | | 139 | | | | 3,546 | |
Intellicheck, Inc.† | | | 148 | | | | 1,071 | |
Lattice Semiconductor Corp.† | | | 1,109 | | | | 38,704 | |
MACOM Technology Solutions Holdings, Inc.† | | | 388 | | | | 14,162 | |
Photronics, Inc.† | | | 521 | | | | 5,080 | |
Pixelworks, Inc.† | | | 322 | | | | 715 | |
Rambus, Inc.† | | | 935 | | | | 12,894 | |
Semtech Corp.† | | | 532 | | | | 29,201 | |
Silicon Laboratories, Inc.† | | | 357 | | | | 36,578 | |
SiTime Corp.† | | | 75 | | | | 6,262 | |
Synaptics, Inc.† | | | 281 | | | | 21,544 | |
| | | | | | |
|
|
|
| | | | | | | | 238,017 | |
| | | | | | |
|
|
|
Electronic Measurement Instruments — 1.6% | |
Badger Meter, Inc. | | | 240 | | | | 17,602 | |
CyberOptics Corp.† | | | 59 | | | | 1,359 | |
FARO Technologies, Inc.† | | | 146 | | | | 8,795 | |
Fitbit, Inc., Class A† | | | 2,006 | | | | 14,122 | |
Itron, Inc.† | | | 331 | | | | 22,492 | |
Luna Innovations, Inc.† | | | 36,969 | | | | 233,274 | |
Mesa Laboratories, Inc. | | | 968 | | | | 253,045 | |
Stoneridge, Inc.† | | | 214 | | | | 4,886 | |
| | | | | | |
|
|
|
| | | | | | | | 555,575 | |
| | | | | | |
|
|
|
Electronic Security Devices — 0.1% | |
Alarm.com Holdings, Inc.† | | | 392 | | | | 22,865 | |
API Group Corp.†* | | | 1,155 | | | | 16,620 | |
Napco Security Technologies, Inc.† | | | 96 | | | | 2,316 | |
Wrap Technologies, Inc.† | | | 94 | | | | 486 | |
| | | | | | |
|
|
|
| | | | | | | | 42,287 | |
| | | | | | |
|
|
|
Energy-Alternate Sources — 1.0% | |
Clean Energy Fuels Corp.† | | | 1,072 | | | | 2,658 | |
FuelCell Energy, Inc.† | | | 1,755 | | | | 3,510 | |
FutureFuel Corp. | | | 213 | | | | 2,533 | |
Green Plains, Inc.† | | | 282 | | | | 4,258 | |
Maxeon Solar Technologies, Ltd.† | | | 79 | | | | 1,280 | |
Plug Power, Inc.† | | | 2,811 | | | | 39,354 | |
Renewable Energy Group, Inc.† | | | 315 | | | | 17,766 | |
REX American Resources Corp.† | | | 46 | | | | 3,344 | |
Sunnova Energy International, Inc.† | | | 438 | | | | 10,538 | |
SunPower Corp.† | | | 631 | | | | 10,090 | |
Sunrun, Inc.† | | | 1,203 | | | | 62,580 | |
TPI Composites, Inc.† | | | 5,939 | | | | 196,700 | |
| | | | | | |
|
|
|
| | | | | | | | 354,611 | |
| | | | | | |
|
|
|
Engineering/R&D Services — 0.2% | |
Exponent, Inc. | | | 423 | | | | 29,437 | |
Fluor Corp. | | | 1,162 | | | | 13,189 | |
Iteris, Inc.† | | | 332 | | | | 1,252 | |
KBR, Inc. | | | 1,174 | | | | 26,168 | |
Mistras Group, Inc.† | | | 149 | | | | 554 | |
| | | | | | |
|
|
|
| | | | | | | | 70,600 | |
| | | | | | |
|
|
|
SunAmerica Specialty Series — AIG Small-Cap Fund
PORTFOLIO OF INVESTMENTS — October 31, 2020 — (continued)
| | | | | | | | |
| Security Description | | Shares | | |
Value
(Note 3) | |
|
|
COMMON STOCKS (continued) | |
Enterprise Software/Service — 1.8% | |
ACI Worldwide, Inc.† | | | 944 | | | $ | 27,536 | |
Akerna Corp.† | | | 74 | | | | 176 | |
American Software, Inc., Class A | | | 16,800 | | | | 246,624 | |
Appian Corp.† | | | 293 | | | | 18,547 | |
Asure Software, Inc.† | | | 111 | | | | 785 | |
Benefitfocus, Inc.† | | | 239 | | | | 2,455 | |
Blackbaud, Inc. | | | 408 | | | | 20,131 | |
Blackline, Inc.† | | | 414 | | | | 40,440 | |
Cardlytics, Inc.† | | | 216 | | | | 15,945 | |
Daily Journal Corp.† | | | 9 | | | | 2,441 | |
Domo, Inc., Class B† | | | 210 | | | | 6,672 | |
Donnelley Financial Solutions, Inc.† | | | 248 | | | | 3,132 | |
eGain Corp.† | | | 172 | | | | 2,726 | |
Evolent Health, Inc., Class A† | | | 623 | | | | 6,193 | |
Intelligent Systems Corp.† | | | 62 | | | | 2,351 | |
LivePerson, Inc.† | | | 509 | | | | 27,211 | |
ManTech International Corp., Class A | | | 224 | | | | 14,533 | |
MicroStrategy, Inc., Class A† | | | 64 | | | | 10,692 | |
MobileIron, Inc.† | | | 804 | | | | 5,660 | |
Omnicell, Inc.† | | | 350 | | | | 30,292 | |
Progress Software Corp. | | | 370 | | | | 13,457 | |
PROS Holdings, Inc.† | | | 324 | | | | 9,127 | |
QAD, Inc., Class A | | | 95 | | | | 3,975 | |
SailPoint Technologies Holding, Inc.† | | | 726 | | | | 30,136 | |
Sapiens International Corp. NV | | | 211 | | | | 5,724 | |
SPS Commerce, Inc.† | | | 290 | | | | 24,821 | |
SVMK, Inc.† | | | 999 | | | | 20,909 | |
Verint Systems, Inc.† | | | 528 | | | | 25,619 | |
Workiva, Inc.† | | | 322 | | | | 17,810 | |
| | | | | | |
|
|
|
| | | | | | | | 636,120 | |
| | | | | | |
|
|
|
Entertainment Software — 0.6% | |
Glu Mobile, Inc.† | | | 30,792 | | | | 220,471 | |
| | | | | | |
|
|
|
Environmental Consulting & Engineering — 0.1% | |
Montrose Environmental Group Inc† | | | 90 | | | | 2,433 | |
Tetra Tech, Inc. | | | 444 | | | | 44,804 | |
| | | | | | |
|
|
|
| | | | | | | | 47,237 | |
| | | | | | |
|
|
|
Filtration/Separation Products — 0.1% | |
ESCO Technologies, Inc. | | | 211 | | | | 17,659 | |
| | | | | | |
|
|
|
Finance-Commercial — 0.1% | |
Hannon Armstrong Sustainable Infrastructure Capital, Inc. | | | 598 | | | | 25,026 | |
Marlin Business Services Corp. | | | 69 | | | | 504 | |
MMA Capital Holdings, Inc.† | | | 39 | | | | 978 | |
NewStar Financial, Inc. CVR†(1) | | | 360 | | | | 194 | |
| | | | | | |
|
|
|
| | | | | | | | 26,702 | |
| | | | | | |
|
|
|
Finance-Consumer Loans — 1.1% | |
Curo Group Holdings Corp. | | | 151 | | | | 1,131 | |
Encore Capital Group, Inc.† | | | 5,696 | | | | 181,873 | |
Enova International, Inc.† | | | 285 | | | | 4,375 | |
EZCORP, Inc., Class A† | | | 395 | | | | 1,762 | |
International Money Express, Inc.† | | | 11,286 | | | | 156,988 | |
LendingClub Corp.† | | | 582 | | | | 2,718 | |
Navient Corp. | | | 1,578 | | | | 12,640 | |
Nelnet, Inc., Class A | | | 142 | | | | 8,668 | |
|
|
Finance-Consumer Loans (continued) | |
Paysign, Inc.† | | | 254 | | | | 1,209 | |
PRA Group, Inc.† | | | 372 | | | | 12,696 | |
Regional Management Corp.† | | | 71 | | | | 1,443 | |
World Acceptance Corp.† | | | 39 | | | | 3,275 | |
| | | | | | |
|
|
|
| | | | | | | | 388,778 | |
| | | | | | |
|
|
|
Finance-Credit Card — 0.0% | |
Atlanticus Holdings Corp.† | | | 42 | | | | 481 | |
I3 Verticals, Inc., Class A† | | | 122 | | | | 2,517 | |
| | | | | | |
|
|
|
| | | | | | | | 2,998 | |
| | | | | | |
|
|
|
Finance-Investment Banker/Broker — 1.5% | |
Amerant Bancorp, Inc.† | | | 187 | | | | 1,883 | |
Arlington Asset Investment Corp., Class A | | | 286 | | | | 704 | |
Cowen, Inc., Class A | | | 10,340 | | | | 221,896 | |
Diamond Hill Investment Group, Inc. | | | 26 | | | | 3,560 | |
Greenhill & Co., Inc. | | | 117 | | | | 1,513 | |
Houlihan Lokey, Inc. | | | 422 | | | | 26,459 | |
Moelis & Co., Class A | | | 436 | | | | 16,219 | |
Oppenheimer Holdings, Inc., Class A | | | 77 | | | | 1,930 | |
Piper Sandler Cos. | | | 144 | | | | 12,017 | |
PJT Partners, Inc., Class A | | | 3,542 | | | | 239,652 | |
Siebert Financial Corp.† | | | 94 | | | | 338 | |
StoneX Group, Inc.† | | | 135 | | | | 7,152 | |
| | | | | | |
|
|
|
| | | | | | | | 533,323 | |
| | | | | | |
|
|
|
Finance-Leasing Companies — 0.1% | |
Aaron’s Holdings Co., Inc. | | | 556 | | | | 29,057 | |
| | | | | | |
|
|
|
Finance-Mortgage Loan/Banker — 0.1% | |
Federal Agricultural Mtg. Corp., Class C | | | 75 | | | | 4,844 | |
Mr. Cooper Group, Inc.† | | | 631 | | | | 13,302 | |
Oportun Financial Corp.† | | | 160 | | | | 2,128 | |
PennyMac Financial Services, Inc. | | | 350 | | | | 17,787 | |
| | | | | | |
|
|
|
| | | | | | | | 38,061 | |
| | | | | | |
|
|
|
Finance-Other Services — 0.0% | |
BGC Partners, Inc., Class A | | | 2,513 | | | | 7,413 | |
SWK Holdings Corp.† | | | 29 | | | | 419 | |
| | | | | | |
|
|
|
| | | | | | | | 7,832 | |
| | | | | | |
|
|
|
Financial Guarantee Insurance — 0.1% | |
MBIA, Inc.† | | | 438 | | | | 2,501 | |
NMI Holdings, Inc., Class A† | | | 678 | | | | 14,570 | |
Radian Group, Inc. | | | 1,579 | | | | 28,343 | |
| | | | | | |
|
|
|
| | | | | | | | 45,414 | |
| | | | | | |
|
|
|
Firearms & Ammunition — 0.7% | |
American Outdoor Brands, Inc.† | | | 112 | | | | 1,695 | |
Smith & Wesson Brands, Inc. | | | 450 | | | | 7,465 | |
Sturm Ruger & Co., Inc. | | | 3,393 | | | | 226,856 | |
| | | | | | |
|
|
|
| | | | | | | | 236,016 | |
| | | | | | |
|
|
|
Food-Baking — 0.0% | |
Hostess Brands, Inc.† | | | 1,009 | | | | 12,754 | |
| | | | | | |
|
|
|
Food-Canned — 0.0% | |
Landec Corp.† | | | 214 | | | | 2,056 | |
Seneca Foods Corp., Class A† | | | 54 | | | | 1,990 | |
| | | | | | |
|
|
|
| | | | | | | | 4,046 | |
| | | | | | |
|
|
|
SunAmerica Specialty Series — AIG Small-Cap Fund
PORTFOLIO OF INVESTMENTS — October 31, 2020 — (continued)
| | | | | | | | |
| Security Description | | Shares | | |
Value
(Note 3) | |
|
|
COMMON STOCKS (continued) | |
Food-Catering — 0.0% | | | | | |
Healthcare Services Group, Inc. | | | 616 | | | $ | 14,094 | |
| | | | | | |
|
|
|
Food-Confectionery — 0.0% | |
Tootsie Roll Industries, Inc. | | | 133 | | | | 3,974 | |
| | | | | | |
|
|
|
Food-Meat Products — 0.0% | |
Nathan’s Famous, Inc. | | | 23 | | | | 1,167 | |
| | | | | | |
|
|
|
Food-Misc./Diversified — 1.3% | |
B&G Foods, Inc. | | | 526 | | | | 13,971 | |
BellRing Brands, Inc., Class A† | | | 10,155 | | | | 185,735 | |
Bridgford Foods Corp.† | | | 14 | | | | 255 | |
Cal-Maine Foods, Inc.† | | | 258 | | | | 9,894 | |
J&J Snack Foods Corp. | | | 123 | | | | 16,675 | |
John B. Sanfilippo & Son, Inc. | | | 2,677 | | | | 194,778 | |
Lancaster Colony Corp. | | | 156 | | | | 25,918 | |
Simply Good Foods Co.† | | | 702 | | | | 13,198 | |
| | | | | | |
|
|
|
| | | | | | | | 460,424 | |
| | | | | | |
|
|
|
Food-Retail — 0.0% | |
Ingles Markets, Inc., Class A | | | 118 | | | | 4,232 | |
Natural Grocers by Vitamin Cottage, Inc. | | | 75 | | | | 798 | |
Village Super Market, Inc., Class A | | | 71 | | | | 1,608 | |
Weis Markets, Inc. | | | 79 | | | | 3,587 | |
| | | | | | |
|
|
|
| | | | | | | | 10,225 | |
| | | | | | |
|
|
|
Food-Wholesale/Distribution — 0.8% | |
Calavo Growers, Inc. | | | 3,489 | | | | 234,217 | |
Chefs’ Warehouse, Inc.† | | | 249 | | | | 3,366 | |
HF Foods Group, Inc.† | | | 293 | | | | 1,931 | |
Performance Food Group Co.† | | | 1,080 | | | | 36,299 | |
SpartanNash Co. | | | 293 | | | | 5,394 | |
United Natural Foods, Inc.† | | | 450 | | | | 6,556 | |
| | | | | | |
|
|
|
| | | | | | | | 287,763 | |
| | | | | | |
|
|
|
Footwear & Related Apparel — 0.2% | |
Crocs, Inc.† | | | 551 | | | | 28,834 | |
Rocky Brands, Inc. | | | 57 | | | | 1,533 | |
Steven Madden, Ltd. | | | 679 | | | | 16,303 | |
Weyco Group, Inc. | | | 50 | | | | 792 | |
Wolverine World Wide, Inc. | | | 658 | | | | 17,549 | |
| | | | | | |
|
|
|
| | | | | | | | 65,011 | |
| | | | | | |
|
|
|
Funeral Services & Related Items — 0.0% | |
Carriage Services, Inc. | | | 136 | | | | 3,510 | |
| | | | | | |
|
|
|
Gambling (Non-Hotel) — 0.7% | |
Golden Entertainment, Inc.† | | | 138 | | | | 1,775 | |
International Game Technology PLC | | | 820 | | | | 6,732 | |
Monarch Casino & Resort, Inc.† | | | 5,186 | | | | 225,021 | |
Red Rock Resorts, Inc., Class A | | | 543 | | | | 10,382 | |
Twin River Worldwide Holdings, Inc. | | | 148 | | | | 3,592 | |
| | | | | | |
|
|
|
| | | | | | | | 247,502 | |
| | | | | | |
|
|
|
Gas-Distribution — 0.4% | |
Chesapeake Utilities Corp. | | | 133 | | | | 12,929 | |
New Jersey Resources Corp. | | | 786 | | | | 22,935 | |
Northwest Natural Holding Co. | | | 251 | | | | 11,154 | |
ONE Gas, Inc. | | | 432 | | | | 29,825 | |
RGC Resources, Inc. | | | 63 | | | | 1,499 | |
South Jersey Industries, Inc. | | | 832 | | | | 16,033 | |
|
|
Gas-Distribution (continued) | |
Southwest Gas Holdings, Inc. | | | 462 | | | | 30,363 | |
Spire, Inc. | | | 414 | | | | 23,201 | |
| | | | | | |
|
|
|
| | | | | | | | 147,939 | |
| | | | | | |
|
|
|
Gas-Transportation — 0.0% | |
Brookfield Infrastructure Corp., Class A | | | 268 | | | | 14,598 | |
| | | | | | |
|
|
|
Gold Mining — 0.1% | |
Gold Resource Corp. | | | 539 | | | | 1,477 | |
Novagold Resources, Inc.† | | | 1,960 | | | | 20,305 | |
| | | | | | |
|
|
|
| | | | | | | | 21,782 | |
| | | | | | |
|
|
|
Golf — 0.1% | |
Acushnet Holdings Corp. | | | 282 | | | | 9,625 | |
Callaway Golf Co. | | | 770 | | | | 11,927 | |
| | | | | | |
|
|
|
| | | | | | | | 21,552 | |
| | | | | | |
|
|
|
Hazardous Waste Disposal — 0.4% | |
Heritage-Crystal Clean, Inc.† | | | 125 | | | | 2,060 | |
Sharps Compliance Corp.† | | | 20,565 | | | | 122,568 | |
US Ecology, Inc. | | | 260 | | | | 7,935 | |
| | | | | | |
|
|
|
| | | | | | | | 132,563 | |
| | | | | | |
|
|
|
Health Care Cost Containment — 0.1% | |
CorVel Corp.† | | | 73 | | | | 6,659 | |
HealthEquity, Inc.† | | | 621 | | | | 31,975 | |
| | | | | | |
|
|
|
| | | | | | | | 38,634 | |
| | | | | | |
|
|
|
Healthcare Safety Devices — 0.0% | |
Alpha Pro Tech, Ltd.† | | | 101 | | | | 1,433 | |
Retractable Technologies, Inc.† | | | 109 | | | | 800 | |
| | | | | | |
|
|
|
| | | | | | | | 2,233 | |
| | | | | | |
|
|
|
Home Furnishings — 0.1% | |
Casper Sleep, Inc.† | | | 209 | | | | 1,386 | |
Ethan Allen Interiors, Inc. | | | 187 | | | | 3,001 | |
Hooker Furniture Corp. | | | 96 | | | | 2,640 | |
Purple Innovation, Inc.† | | | 183 | | | | 5,192 | |
Sleep Number Corp.† | | | 223 | | | | 14,129 | |
| | | | | | |
|
|
|
| | | | | | | | 26,348 | |
| | | | | | |
|
|
|
Hotels/Motels — 0.1% | |
Bluegreen Vacations Corp. | | | 43 | | | | 209 | |
Bluegreen Vacations Holding Corp. | | | 103 | | | | 840 | |
Hilton Grand Vacations, Inc.† | | | 702 | | | | 14,461 | |
Marcus Corp. | | | 185 | | | | 1,356 | |
Target Hospitality Corp.† | | | 244 | | | | 212 | |
| | | | | | |
|
|
|
| | | | | | | | 17,078 | |
| | | | | | |
|
|
|
Housewares — 0.0% | |
Lifetime Brands, Inc. | | | 100 | | | | 1,005 | |
Tupperware Brands Corp.† | | | 404 | | | | 12,815 | |
| | | | | | |
|
|
|
| | | | | | | | 13,820 | |
| | | | | | |
|
|
|
Human Resources — 1.1% | |
AMN Healthcare Services, Inc.† | | | 385 | | | | 25,133 | |
ASGN, Inc.† | | | 420 | | | | 28,006 | |
Barrett Business Services, Inc. | | | 63 | | | | 3,733 | |
BG Staffing, Inc. | | | 76 | | | | 606 | |
Cross Country Healthcare, Inc.† | | | 295 | | | | 2,316 | |
Heidrick & Struggles International, Inc. | | | 158 | | | | 3,610 | |
SunAmerica Specialty Series — AIG Small-Cap Fund
PORTFOLIO OF INVESTMENTS — October 31, 2020 — (continued)
| | | | | | | | |
| Security Description | | Shares | | |
Value
(Note 3) | |
|
|
COMMON STOCKS (continued) | |
Human Resources (continued) | |
Insperity, Inc. | | | 299 | | | $ | 22,897 | |
Kforce, Inc. | | | 6,802 | | | | 236,029 | |
Korn Ferry | | | 462 | | | | 13,948 | |
Resources Connection, Inc. | | | 252 | | | | 2,707 | |
TriNet Group, Inc.† | | | 340 | | | | 23,433 | |
TrueBlue, Inc.† | | | 295 | | | | 4,578 | |
Willdan Group, Inc.† | | | 85 | | | | 2,224 | |
| | | | | | |
|
|
|
| | | | | | | | 369,220 | |
| | | | | | |
|
|
|
Identification Systems — 0.1% | |
Brady Corp., Class A | | | 389 | | | | 14,673 | |
Digimarc Corp.† | | | 99 | | | | 3,137 | |
| | | | | | |
|
|
|
| | | | | | | | 17,810 | |
| | | | | | |
|
|
|
Independent Power Producers — 0.1% | |
Clearway Energy, Inc., Class A | | | 288 | | | | 7,548 | |
Clearway Energy, Inc., Class C | | | 668 | | | | 18,811 | |
| | | | | | |
|
|
|
| | | | | | | | 26,359 | |
| | | | | | |
|
|
|
Industrial Audio & Video Products — 0.6% | |
Akoustis Technologies, Inc.† | | | 256 | | | | 2,122 | |
GoPro, Inc., Class A† | | | 1,066 | | | | 6,332 | |
Turtle Beach Corp.† | | | 10,532 | | | | 189,787 | |
| | | | | | |
|
|
|
| | | | | | | | 198,241 | |
| | | | | | |
|
|
|
Industrial Automated/Robotic — 0.6% | |
Ichor Holdings, Ltd.† | | | 8,850 | | | | 205,851 | |
| | | | | | |
|
|
|
Instruments-Controls — 0.1% | |
Allied Motion Technologies, Inc. | | | 60 | | | | 2,267 | |
Watts Water Technologies, Inc., Class A | | | 226 | | | | 25,034 | |
| | | | | | |
|
|
|
| | | | | | | | 27,301 | |
| | | | | | |
|
|
|
Instruments-Scientific — 0.0% | |
Fluidigm Corp.† | | | 582 | | | | 3,341 | |
| | | | | | |
|
|
|
Insurance Brokers — 0.1% | |
BRP Group, Inc., Class A† | | | 278 | | | | 7,089 | |
Crawford & Co., Class A | | | 134 | | | | 858 | |
eHealth, Inc.† | | | 210 | | | | 14,093 | |
Goosehead Insurance, Inc., Class A | | | 106 | | | | 12,989 | |
Selectquote, Inc.† | | | 262 | | | | 4,512 | |
Trean Insurance Group, Inc.† | | | 99 | | | | 1,074 | |
| | | | | | |
|
|
|
| | | | | | | | 40,615 | |
| | | | | | |
|
|
|
Insurance-Life/Health — 0.2% | |
American Equity Investment Life Holding Co. | | | 748 | | | | 18,565 | |
CNO Financial Group, Inc. | | | 1,166 | | | | 20,697 | |
FBL Financial Group, Inc., Class A | | | 79 | | | | 3,926 | |
GWG Holdings, Inc.† | | | 26 | | | | 195 | |
Independence Holding Co. | | | 38 | | | | 1,437 | |
National Western Life Group, Inc., Class A | | | 21 | | | | 3,562 | |
Security National Financial Corp., Class A† | | | 79 | | | | 521 | |
Trupanion, Inc.† | | | 245 | | | | 17,527 | |
| | | | | | |
|
|
|
| | | | | | | | 66,430 | |
| | | | | | |
|
|
|
Insurance-Multi-line — 0.1% | | | | | |
Citizens, Inc.† | | | 409 | | | | 2,360 | |
Genworth Financial, Inc., Class A† | | | 4,160 | | | | 16,349 | |
Vericity, Inc. | | | 15 | | | | 158 | |
| | | | | | |
|
|
|
| | | | | | | | 18,867 | |
| | | | | | |
|
|
|
|
|
Insurance-Property/Casualty — 1.4% | | | | | |
Ambac Financial Group, Inc.† | | | 374 | | | $ | 4,593 | |
AMERISAFE, Inc. | | | 158 | | | | 9,319 | |
Donegal Group, Inc., Class A | | | 90 | | | | 1,306 | |
Employers Holdings, Inc. | | | 237 | | | | 7,586 | |
Enstar Group, Ltd.† | | | 99 | | | | 17,015 | |
FedNat Holding Co. | | | 102 | | | | 523 | |
HCI Group, Inc. | | | 50 | | | | 2,349 | |
Heritage Insurance Holdings, Inc. | | | 207 | | | | 1,954 | |
Horace Mann Educators Corp. | | | 342 | | | | 11,597 | |
Investors Title Co. | | | 11 | | | | 1,469 | |
James River Group Holdings, Ltd. | | | 5,915 | | | | 276,408 | |
Kinsale Capital Group, Inc. | | | 174 | | | | 32,620 | |
National General Holdings Corp. | | | 562 | | | | 19,091 | |
NI Holdings, Inc.† | | | 75 | | | | 1,253 | |
Palomar Holdings, Inc.† | | | 167 | | | | 14,891 | |
ProAssurance Corp. | | | 442 | | | | 6,820 | |
ProSight Global, Inc.† | | | 77 | | | | 911 | |
Protective Insurance Corp., Class B | | | 74 | | | | 973 | |
RLI Corp. | | | 326 | | | | 28,264 | |
Safety Insurance Group, Inc. | | | 119 | | | | 8,330 | |
Selective Insurance Group, Inc. | | | 488 | | | | 25,405 | |
State Auto Financial Corp. | | | 145 | | | | 1,789 | |
Stewart Information Services Corp. | | | 217 | | | | 9,199 | |
Tiptree, Inc. | | | 202 | | | | 984 | |
United Fire Group, Inc. | | | 173 | | | | 3,554 | |
United Insurance Holdings Corp. | | | 168 | | | | 738 | |
Universal Insurance Holdings, Inc. | | | 228 | | | | 2,843 | |
Watford Holdings, Ltd.† | | | 141 | | | | 5,076 | |
| | | | | | |
|
|
|
| | | | | | | | 496,860 | |
| | | | | | |
|
|
|
Insurance-Reinsurance — 0.2% | |
Argo Group International Holdings, Ltd. | | | 268 | | | | 9,562 | |
Essent Group, Ltd. | | | 909 | | | | 36,224 | |
Greenlight Capital Re, Ltd., Class A† | | | 229 | | | | 1,546 | |
Third Point Reinsurance, Ltd.† | | | 664 | | | | 5,166 | |
| | | | | | |
|
|
|
| | | | | | | | 52,498 | |
| | | | | | |
|
|
|
Internet Application Software — 0.0% | |
Tucows, Inc., Class A† | | | 77 | | | | 5,682 | |
VirnetX Holding Corp. | | | 522 | | | | 2,892 | |
| | | | | | |
|
|
|
| | | | | | | | 8,574 | |
| | | | | | |
|
|
|
Internet Connectivity Services — 0.1% | |
Boingo Wireless, Inc.† | | | 361 | | | | 3,372 | |
Cogent Communications Holdings, Inc. | | | 350 | | | | 19,530 | |
| | | | | | |
|
|
|
| | | | | | | | 22,902 | |
| | | | | | |
|
|
|
Internet Content-Entertainment — 0.3% | |
Limelight Networks, Inc.† | | | 34,143 | | | | 120,525 | |
| | | | | | |
|
|
|
Internet Content-Information/News — 0.1% | |
DHI Group, Inc.† | | | 401 | | | | 678 | |
HealthStream, Inc.† | | | 213 | | | | 3,898 | |
LiveXLive Media, Inc.† | | | 379 | | | | 762 | |
TechTarget, Inc.† | | | 192 | | | | 8,409 | |
Yelp, Inc.† | | | 587 | | | | 11,546 | |
| | | | | | |
|
|
|
| | | | | | | | 25,293 | |
| | | | | | |
|
|
|
Internet Gambling — 0.0% | |
GAN, Ltd.† | | | 61 | | | | 867 | |
| | | | | | |
|
|
|
SunAmerica Specialty Series — AIG Small-Cap Fund
PORTFOLIO OF INVESTMENTS — October 31, 2020 — (continued)
| | | | | | | | |
| Security Description | | Shares | | |
Value
(Note 3) | |
|
|
COMMON STOCKS (continued) | |
Internet Security — 0.1% | | | | | |
Mimecast, Ltd.† | | | 471 | | | $ | 17,997 | |
Zix Corp.† | | | 451 | | | | 2,765 | |
| | | | | | |
|
|
|
| | | | | | | | 20,762 | |
| | | | | | |
|
|
|
Investment Companies — 0.0% | |
BBX Capital, Inc.† | | | 103 | | | | 355 | |
Grid Dynamics Holdings, Inc.† | | | 179 | | | | 1,396 | |
PDL Community Bancorp† | | | 62 | | | | 564 | |
Rafael Holdings, Inc., Class B† | | | 76 | | | | 1,247 | |
| | | | | | |
|
|
|
| | | | | | | | 3,562 | |
| | | | | | |
|
|
|
Investment Management/Advisor Services — 1.0% | |
Altisource Portfolio Solutions SA† | | | 38 | | | | 423 | |
Artisan Partners Asset Management, Inc., Class A | | | 453 | | | | 18,147 | |
AssetMark Financial Holdings, Inc.† | | | 135 | | | | 2,855 | |
Associated Capital Group, Inc., Class A | | | 15 | | | | 481 | |
B. Riley Financial, Inc. | | | 156 | | | | 4,093 | |
Blucora, Inc.† | | | 397 | | | | 3,950 | |
Boston Private Financial Holdings, Inc. | | | 676 | | | | 4,178 | |
BrightSphere Investment Group, Inc. | | | 506 | | | | 6,983 | |
Cohen & Steers, Inc. | | | 202 | | | | 11,375 | |
Columbia Financial, Inc.† | | | 406 | | | | 4,949 | |
Federated Hermes, Inc. | | | 796 | | | | 19,024 | |
First Western Financial, Inc.† | | | 52 | | | | 738 | |
Focus Financial Partners, Inc., Class A† | | | 259 | | | | 9,456 | |
GAMCO Investors, Inc., Class A | | | 45 | | | | 553 | |
Hamilton Lane, Inc., Class A | | | 248 | | | | 17,286 | |
Pzena Investment Management, Inc., Class A | | | 140 | | | | 727 | |
Sculptor Capital Management, Inc. | | | 152 | | | | 1,648 | |
Silvercrest Asset Management Group, Inc., Class A | | | 17,226 | | | | 194,482 | |
Stifel Financial Corp. | | | 550 | | | | 32,153 | |
Virtus Investment Partners, Inc. | | | 61 | | | | 9,733 | |
Waddell & Reed Financial, Inc., Class A | | | 531 | | | | 8,151 | |
Westwood Holdings Group, Inc. | | | 64 | | | | 618 | |
WisdomTree Investments, Inc. | | | 1,148 | | | | 4,179 | |
| | | | | | |
|
|
|
| | | | | | | | 356,182 | |
| | | | | | |
|
|
|
Lasers-System/Components — 0.1% | |
II-VI, Inc.† | | | 831 | | | | 37,786 | |
LENSAR, Inc.† | | | 69 | | | | 673 | |
| | | | | | |
|
|
|
| | | | | | | | 38,459 | |
| | | | | | |
|
|
|
Leisure Products — 0.6% | |
Escalade, Inc. | | | 85 | | | | 1,582 | |
Johnson Outdoors, Inc., Class A | | | 2,472 | | | | 215,880 | |
| | | | | | |
|
|
|
| | | | | | | | 217,462 | |
| | | | | | |
|
|
|
Lighting Products & Systems — 0.4% | |
Orion Energy Systems ,Inc.† | | | 19,540 | | | | 125,447 | |
| | | | | | |
|
|
|
Linen Supply & Related Items — 0.1% | |
UniFirst Corp. | | | 124 | | | | 20,312 | |
| | | | | | |
|
|
|
Machine Tools & Related Products — 0.1% | | | | | |
Hurco Cos., Inc. | | | 51 | | | | 1,522 | |
Kennametal, Inc. | | | 685 | | | | 21,235 | |
Luxfer Holdings PLC | | | 238 | | | | 2,956 | |
| | | | | | |
|
|
|
| | | | | | | | 25,713 | |
| | | | | | |
|
|
|
|
|
Machinery-Construction & Mining — 0.1% | | | | | |
Astec Industries, Inc. | | | 185 | | | $ | 9,398 | |
Hyster-Yale Materials Handling, Inc. | | | 82 | | | | 3,477 | |
Manitowoc Co, Inc.† | | | 280 | | | | 2,108 | |
Terex Corp. | | | 555 | | | | 13,703 | |
| | | | | | |
|
|
|
| | | | | | | | 28,686 | |
| | | | | | |
|
|
|
Machinery-Electrical — 0.1% | |
Argan, Inc. | | | 122 | | | | 5,025 | |
Bloom Energy Corp., Class A† | | | 731 | | | | 9,240 | |
Franklin Electric Co., Inc. | | | 380 | | | | 22,697 | |
| | | | | | |
|
|
|
| | | | | | | | 36,962 | |
| | | | | | |
|
|
|
Machinery-Farming — 0.1% | |
Alamo Group, Inc. | | | 82 | | | | 9,867 | |
Lindsay Corp. | | | 89 | | | | 9,372 | |
| | | | | | |
|
|
|
| | | | | | | | 19,239 | |
| | | | | | |
|
|
|
Machinery-General Industrial — 0.3% | |
Albany International Corp., Class A | | | 254 | | | | 12,939 | |
Altra Industrial Motion Corp. | | | 532 | | | | 22,748 | |
Applied Industrial Technologies, Inc. | | | 319 | | | | 19,475 | |
Chart Industries, Inc.† | | | 298 | | | | 25,166 | |
DXP Enterprises, Inc.† | | | 135 | | | | 2,111 | |
Gencor Industries, Inc.† | | | 75 | | | | 867 | |
Intevac, Inc.† | | | 191 | | | | 1,009 | |
Kadant, Inc. | | | 94 | | | | 10,821 | |
Ranpak Holdings Corp.† | | | 239 | | | | 2,039 | |
Tennant Co. | | | 151 | | | | 9,003 | |
Welbilt, Inc.† | | | 1,075 | | | | 6,536 | |
| | | | | | |
|
|
|
| | | | | | | | 112,714 | |
| | | | | | |
|
|
|
Machinery-Material Handling — 0.0% | |
Columbus McKinnon Corp. | | | 191 | | | | 6,473 | |
| | | | | | |
|
|
|
Machinery-Print Trade — 0.0% | |
Eastman Kodak Co.† | | | 127 | | | | 879 | |
| | | | | | |
|
|
|
Machinery-Pumps — 0.2% | |
Cactus, Inc., Class A | | | 392 | | | | 6,664 | |
CIRCOR International, Inc.† | | | 165 | | | | 4,604 | |
CSW Industrials, Inc. | | | 113 | | | | 9,665 | |
Gorman-Rupp Co. | | | 145 | | | | 4,502 | |
Mueller Water Products, Inc., Class A | | | 1,293 | | | | 13,395 | |
NN, Inc.† | | | 346 | | | | 1,855 | |
SPX FLOW, Inc.† | | | 351 | | | | 14,865 | |
| | | | | | |
|
|
|
| | | | | | | | 55,550 | |
| | | | | | |
|
|
|
Medical Imaging Systems — 0.0% | |
Lantheus Holdings, Inc.† | | | 547 | | | | 5,940 | |
| | | | | | |
|
|
|
Medical Information Systems — 0.7% | |
1Life Healthcare, Inc.† | | | 648 | | | | 18,280 | |
Allscripts Healthcare Solutions, Inc.† | | | 1,334 | | | | 13,447 | |
Computer Programs & Systems, Inc. | | | 106 | | | | 2,956 | |
Health Catalyst, Inc.† | | | 277 | | | | 9,551 | |
Inovalon Holdings, Inc., Class A† | | | 608 | | | | 11,546 | |
MTBC, Inc.† | | | 23,174 | | | | 177,745 | |
NantHealth, Inc.† | | | 222 | | | | 446 | |
NextGen Healthcare, Inc.† | | | 460 | | | | 6,256 | |
Ontrak, Inc.† | | | 66 | | | | 4,042 | |
Schrodinger, Inc.† | | | 241 | | | | 11,756 | |
SunAmerica Specialty Series — AIG Small-Cap Fund
PORTFOLIO OF INVESTMENTS — October 31, 2020 — (continued)
| | | | | | | | |
| Security Description | | Shares | | |
Value
(Note 3) | |
|
|
COMMON STOCKS (continued) | |
Medical Information Systems (continued) | |
Tabula Rasa HealthCare, Inc.† | | | 169 | | | $ | 5,837 | |
| | | | | | |
|
|
|
| | | | | | | | 261,862 | |
| | | | | | |
|
|
|
Medical Instruments — 0.2% | |
AngioDynamics, Inc.† | | | 302 | | | | 3,123 | |
Apyx Medical Corp.† | | | 276 | | | | 1,662 | |
Cantel Medical Corp. | | | 313 | | | | 14,974 | |
Milestone Scientific, Inc.† | | | 348 | | | | 536 | |
Misonix Opco, Inc.† | | | 99 | | | | 1,125 | |
Natus Medical, Inc.† | | | 277 | | | | 5,044 | |
NuVasive, Inc.† | | | 424 | | | | 18,838 | |
Silk Road Medical, Inc.† | | | 222 | | | | 13,453 | |
Stereotaxis, Inc.† | | | 364 | | | | 1,150 | |
| | | | | | |
|
|
|
| | | | | | | | 59,905 | |
| | | | | | |
|
|
|
Medical Labs & Testing Services — 1.5% | |
Avalon GloboCare Corp.† | | | 163 | | | | 183 | |
Cellular Biomedicine Group, Inc.† | | | 102 | | | | 1,837 | |
Dyadic International, Inc.† | | | 159 | | | | 1,135 | |
Fulgent Genetics, Inc.† | | | 3,829 | | | | 124,557 | |
Invitae Corp.† | | | 952 | | | | 37,328 | |
Liquidia Technologies, Inc.† | | | 223 | | | | 1,030 | |
MEDNAX, Inc.† | | | 615 | | | | 7,841 | |
Medpace Holdings, Inc.† | | | 225 | | | | 24,961 | |
OPKO Health, Inc.† | | | 3,280 | | | | 11,546 | |
Personalis, Inc.† | | | 6,571 | | | | 162,501 | |
Progenity, Inc.† | | | 29 | | | | 145 | |
SI-BONE, Inc.† | | �� | 209 | | | | 4,383 | |
Vapotherm, Inc.† | | | 162 | | | | 4,852 | |
Viemed Healthcare, Inc.† | | | 17,969 | | | | 143,932 | |
| | | | | | |
|
|
|
| | | | | | | | 526,231 | |
| | | | | | |
|
|
|
Medical Laser Systems — 0.8% | |
Cutera, Inc.† | | | 14,071 | | | | 266,364 | |
| | | | | | |
|
|
|
Medical Products — 2.8% | |
Accuray, Inc.† | | | 738 | | | | 2,148 | |
Acutus Medical, Inc.† | | | 81 | | | | 1,852 | |
Alphatec Holdings, Inc.† | | | 372 | | | | 3,177 | |
AtriCure, Inc.† | | | 361 | | | | 12,476 | |
Atrion Corp. | | | 12 | | | | 7,214 | |
Avanos Medical, Inc.† | | | 393 | | | | 13,892 | |
AxoGen, Inc.† | | | 300 | | | | 3,783 | |
Axonics Modulation Technologies, Inc.† | | | 249 | | | | 11,676 | |
Bellerophon Therapeutics, Inc.† | | | 37 | | | | 312 | |
BioSig Technologies, Inc.† | | | 198 | | | | 626 | |
Cardiovascular Systems, Inc.† | | | 319 | | | | 11,372 | |
Castle Biosciences, Inc.† | | | 4,007 | | | | 186,045 | |
Cerus Corp.† | | | 1,354 | | | | 7,108 | |
CryoLife, Inc.† | | | 304 | | | | 5,095 | |
CytoSorbents Corp.† | | | 339 | | | | 2,593 | |
Electromed, Inc.† | | | 11,177 | | | | 92,881 | |
FONAR Corp.† | | | 52 | | | | 1,021 | |
Glaukos Corp.† | | | 352 | | | | 19,684 | |
Hanger, Inc.† | | | 305 | | | | 5,328 | |
Inari Medical, Inc.† | | | 63 | | | | 4,171 | |
InfuSystem Holdings, Inc.† | | | 119 | | | | 1,466 | |
Inogen, Inc.† | | | 152 | | | | 4,440 | |
Inspire Medical Systems, Inc.† | | | 216 | | | | 25,797 | |
|
|
Medical Products (continued) | |
Integer Holdings Corp.† | | | 270 | | | | 15,781 | |
Intersect ENT, Inc.† | | | 268 | | | | 4,154 | |
Invacare Corp. | | | 278 | | | | 2,255 | |
iRadimed Corp.† | | | 49 | | | | 1,110 | |
iRhythm Technologies, Inc.† | | | 226 | | | | 47,788 | |
LeMaitre Vascular, Inc. | | | 137 | | | | 4,450 | |
LivaNova PLC† | | | 403 | | | | 20,287 | |
Luminex Corp. | | | 5,791 | | | | 127,634 | |
NanoString Technologies, Inc.† | | | 312 | | | | 11,435 | |
Nemaura Medical, Inc.† | | | 61 | | | | 217 | |
Nevro Corp.† | | | 277 | | | | 41,331 | |
Orthofix Medical, Inc.† | | | 154 | | | | 4,814 | |
OrthoPediatrics Corp.† | | | 108 | | | | 4,817 | |
PAVmed, Inc.† | | | 301 | | | | 539 | |
Pulse Biosciences, Inc.† | | | 113 | | | | 1,368 | |
Repro-Med Systems, Inc.† | | | 222 | | | | 1,225 | |
SeaSpine Holdings Corp.† | | | 218 | | | | 2,782 | |
Shockwave Medical, Inc.† | | | 235 | | | | 16,055 | |
Sientra, Inc.† | | | 383 | | | | 1,616 | |
Soleno Therapeutics, Inc.† | | | 491 | | | | 854 | |
Soliton, Inc.† | | | 57 | | | | 408 | |
Surgalign Holdings, Inc.† | | | 482 | | | | 839 | |
Surmodics, Inc.† | | | 109 | | | | 4,006 | |
Tactile Systems Technology, Inc.† | | | 151 | | | | 5,524 | |
Venus Concept, Inc.† | | | 158 | | | | 333 | |
Wright Medical Group NV† | | | 1,061 | | | | 32,456 | |
Zynex, Inc.† | | | 15,245 | | | | 195,288 | |
| | | | | | |
|
|
|
| | | | | | | | 973,523 | |
| | | | | | |
|
|
|
Medical-Biomedical/Gene — 6.7% | |
Abeona Therapeutics, Inc.† | | | 498 | | | | 533 | |
ADMA Biologics, Inc.† | | | 496 | | | | 987 | |
Adverum Biotechnologies, Inc.† | | | 716 | | | | 7,812 | |
Affimed NV† | | | 671 | | | | 2,120 | |
Agenus, Inc.† | | | 28,365 | | | | 104,667 | |
Akero Therapeutics, Inc.† | | | 112 | | | | 2,974 | |
Akouos, Inc.† | | | 120 | | | | 2,329 | |
Albireo Pharma, Inc.† | | | 110 | | | | 3,472 | |
Alder Biopharmaceuticals, Inc. CVR†(1) | | | 708 | | | | 623 | |
Allakos, Inc.† | | | 201 | | | | 19,121 | |
Allogene Therapeutics, Inc.† | | | 445 | | | | 15,094 | |
ALX Oncology Holdings, Inc.† | | | 79 | | | | 3,121 | |
AMAG Pharmaceuticals, Inc.† | | | 254 | | | | 3,485 | |
Amicus Therapeutics, Inc.† | | | 2,096 | | | | 37,372 | |
AnaptysBio, Inc.† | | | 177 | | | | 5,214 | |
Anavex Life Sciences Corp.† | | | 433 | | | | 2,555 | |
ANI Pharmaceuticals, Inc.† | | | 78 | | | | 1,988 | |
Annexon, Inc.† | | | 122 | | | | 2,539 | |
Apellis Pharmaceuticals, Inc.† | | | 495 | | | | 15,790 | |
Applied Genetic Technologies Corp.† | | | 201 | | | | 1,037 | |
Applied Molecular Transport, Inc.† | | | 102 | | | | 2,998 | |
Applied Therapeutics, Inc.† | | | 112 | | | | 1,822 | |
Aprea Therapeutics, Inc.† | | | 59 | | | | 1,287 | |
Aptinyx, Inc.† | | | 209 | | | | 612 | |
Aravive, Inc.† | | | 100 | | | | 463 | |
Arbutus Biopharma Corp.† | | | 25,796 | | | | 72,745 | |
Arcturus Therapeutics Holdings, Inc.† | | | 132 | | | | 7,139 | |
Arcus Biosciences, Inc.† | | | 348 | | | | 7,586 | |
Arcutis Biotherapeutics, Inc.† | | | 149 | | | | 2,655 | |
SunAmerica Specialty Series — AIG Small-Cap Fund
PORTFOLIO OF INVESTMENTS — October 31, 2020 — (continued)
| | | | | | | | |
| Security Description | | Shares | | |
Value
(Note 3) | |
|
|
COMMON STOCKS (continued) | |
Medical-Biomedical/Gene (continued) | |
Ardelyx, Inc.† | | | 602 | | | $ | 3,076 | |
Arena Pharmaceuticals, Inc.† | | | 479 | | | | 41,060 | |
Arrowhead Pharmaceuticals, Inc.† | | | 828 | | | | 47,444 | |
Assembly Biosciences, Inc.† | | | 253 | | | | 3,729 | |
Atara Biotherapeutics, Inc.† | | | 597 | | | | 7,707 | |
Athersys, Inc.† | | | 1,430 | | | | 2,502 | |
Atreca, Inc., Class A† | | | 232 | | | | 3,100 | |
AVEO Pharmaceuticals, Inc.† | | | 180 | | | | 977 | |
Avid Bioservices, Inc.† | | | 465 | | | | 3,371 | |
Avidity Biosciences, Inc.† | | | 138 | | | | 3,413 | |
Avrobio, Inc.† | | | 258 | | | | 3,684 | |
Beam Therapeutics, Inc.† | | | 291 | | | | 9,943 | |
BioCryst Pharmaceuticals, Inc.† | | | 1,456 | | | | 5,562 | |
Biohaven Pharmaceutical Holding Co., Ltd.† | | | 397 | | | | 30,752 | |
Black Diamond Therapeutics, Inc.† | | | 149 | | | | 4,695 | |
Blueprint Medicines Corp.† | | | 456 | | | | 46,640 | |
BrainStorm Cell Therapeutics, Inc.† | | | 235 | | | | 2,357 | |
Bridgebio Pharma, Inc.† | | | 600 | | | | 23,028 | |
Cabaletta Bio, Inc.† | | | 106 | | | | 1,226 | |
Calithera Biosciences, Inc.† | | | 542 | | | | 1,919 | |
Cara Therapeutics, Inc.† | | | 339 | | | | 4,495 | |
CASI Pharmaceuticals, Inc.† | | | 545 | | | | 1,281 | |
Catabasis Pharmaceuticals, Inc.† | | | 159 | | | | 213 | |
CEL-SCI Corp.† | | | 278 | | | | 3,344 | |
Centogene NV† | | | 70 | | | | 852 | |
Cerecor, Inc.† | | | 299 | | | | 616 | |
Champions Oncology, Inc.† | | | 20,599 | | | | 180,859 | |
Checkmate Pharmaceuticals, Inc.† | | | 42 | | | | 483 | |
ChemoCentryx, Inc.† | | | 409 | | | | 19,632 | |
Chinook Therapeutics, Inc.† | | | 109 | | | | 1,346 | |
ChromaDex Corp.† | | | 336 | | | | 1,515 | |
Cohbar, Inc.† | | | 214 | | | | 196 | |
Constellation Pharmaceuticals, Inc.† | | | 253 | | | | 4,964 | |
ContraFect Corp.† | | | 202 | | | | 1,141 | |
Cortexyme, Inc.† | | | 130 | | | | 6,223 | |
Crinetics Pharmaceuticals, Inc.† | | | 223 | | | | 2,694 | |
Cue Biopharma, Inc.† | | | 237 | | | | 2,640 | |
Cymabay Therapeutics, Inc.† | | | 571 | | | | 4,751 | |
CytomX Therapeutics, Inc.† | | | 372 | | | | 2,463 | |
Deciphera Pharmaceuticals, Inc.† | | | 308 | | | | 17,886 | |
Denali Therapeutics, Inc.† | | | 518 | | | | 22,160 | |
DermTech, Inc.† | | | 67 | | | | 855 | |
Dicerna Pharmaceuticals, Inc.† | | | 536 | | | | 11,251 | |
Dynavax Technologies Corp.† | | | 876 | | | | 3,267 | |
Editas Medicine, Inc.† | | | 518 | | | | 16,027 | |
Eiger BioPharmaceuticals, Inc.† | | | 227 | | | | 2,016 | |
Emergent BioSolutions, Inc.† | | | 368 | | | | 33,109 | |
Enochian Biosciences, Inc.† | | | 114 | | | | 348 | |
Enzo Biochem, Inc.† | | | 366 | | | | 666 | |
Epizyme, Inc.† | | | 735 | | | | 9,085 | |
Esperion Therapeutics, Inc.† | | | 213 | | | | 6,384 | |
Evelo Biosciences, Inc.† | | | 165 | | | | 655 | |
Evolus, Inc.† | | | 180 | | | | 545 | |
Exagen, Inc.† | | | 39 | | | | 556 | |
Exicure, Inc.† | | | 489 | | | | 733 | |
Fate Therapeutics, Inc.† | | | 591 | | | | 26,240 | |
FibroGen, Inc.† | | | 695 | | | | 26,674 | |
Five Prime Therapeutics, Inc.† | | | 221 | | | | 1,008 | |
|
|
Medical-Biomedical/Gene (continued) | | | | | |
Forma Therapeutics Holdings, Inc.† | | | 133 | | | | 5,735 | | | | | |
Frequency Therapeutics, Inc.† | | | 207 | | | | 4,529 | | | | | |
Galera Therapeutics, Inc.† | | | 72 | | | | 590 | | | | | |
Generation Bio Co.† | | | 101 | | | | 2,610 | | | | | |
Genprex, Inc.† | | | 235 | | | | 764 | | | | | |
Geron Corp.† | | | 2,369 | | | | 4,122 | | | | | |
GlycoMimetics, Inc.† | | | 306 | | | | 857 | | | | | |
Gossamer Bio, Inc.† | | | 467 | | | | 3,876 | | | | | |
Halozyme Therapeutics, Inc.† | | | 1,120 | | | | 31,360 | | | | | |
Harvard Bioscience, Inc.† | | | 316 | | | | 1,068 | | | | | |
Homology Medicines, Inc.† | | | 280 | | | | 2,960 | | | | | |
iBio, Inc.† | | | 476 | | | | 828 | | | | | |
IGM Biosciences, Inc.† | | | 59 | | | | 3,115 | | | | | |
ImmunoGen, Inc.† | | | 1,417 | | | | 7,992 | | | | | |
Immunovant, Inc.† | | | 288 | | | | 12,563 | | | | | |
Innoviva, Inc.† | | | 523 | | | | 5,654 | | | | | |
Inovio Pharmaceuticals, Inc.† | | | 1,293 | | | | 12,736 | | | | | |
Inozyme Pharma Inc† | | | 67 | | | | 1,539 | | | | | |
Insmed, Inc.† | | | 835 | | | | 27,505 | | | | | |
Intercept Pharmaceuticals, Inc.† | | | 214 | | | | 5,947 | | | | | |
iTeos Therapeutics, Inc.† | | | 88 | | | | 2,004 | | | | | |
IVERIC bio, Inc.† | | | 662 | | | | 3,919 | | | | | |
Kaleido Biosciences, Inc.† | | | 96 | | | | 587 | | | | | |
Karuna Therapeutics, Inc.† | | | 130 | | | | 10,555 | | | | | |
Karyopharm Therapeutics, Inc.† | | | 578 | | | | 8,566 | | | | | |
Keros Therapeutics, Inc.† | | | 57 | | | | 3,169 | | | | | |
Kezar Life Sciences, Inc.† | | | 258 | | | | 1,321 | | | | | |
Kindred Biosciences, Inc.† | | | 307 | | | | 1,071 | | | | | |
Kiniksa Pharmaceuticals, Ltd., Class A† | | | 220 | | | | 3,445 | | | | | |
Kodiak Sciences, Inc.† | | | 238 | | | | 21,613 | | | | | |
Krystal Biotech, Inc.† | | | 111 | | | | 4,772 | | | | | |
Lexicon Pharmaceuticals, Inc.† | | | 340 | | | | 377 | | | | | |
Ligand Pharmaceuticals, Inc.† | | | 119 | | | | 9,812 | | | | | |
LogicBio Therapeutics, Inc.† | | | 101 | | | | 558 | | | | | |
Lyra Therapeutics, Inc.† | | | 34 | | | | 364 | | | | | |
MacroGenics, Inc.† | | | 435 | | | | 8,443 | | | | | |
Magenta Therapeutics, Inc.† | | | 171 | | | | 1,079 | | | | | |
Marker Therapeutics, Inc.† | | | 243 | | | | 330 | | | | | |
MEI Pharma, Inc.† | | | 852 | | | | 2,215 | | | | | |
MeiraGTx Holdings PLC† | | | 169 | | | | 2,160 | | | | | |
Mersana Therapeutics, Inc.† | | | 439 | | | | 7,911 | | | | | |
Mirati Therapeutics, Inc.† | | | 309 | | | | 67,096 | | | | | |
Molecular Templates, Inc.† | | | 218 | | | | 1,927 | | | | | |
Mustang Bio, Inc.† | | | 236 | | | | 629 | | | | | |
Myriad Genetics, Inc.† | | | 587 | | | | 7,296 | | | | | |
NantKwest, Inc.† | | | 260 | | | | 1,953 | | | | | |
NeoGenomics, Inc.† | | | 854 | | | | 33,502 | | | | | |
NextCure, Inc.† | | | 136 | | | | 1,314 | | | | | |
NGM Biopharmaceuticals, Inc.† | | | 197 | | | | 3,416 | | | | | |
Nkarta, Inc.† | | | 134 | | | | 3,847 | | | | | |
Novavax, Inc.† | | | 508 | | | | 41,001 | | | | | |
Nurix Therapeutics, Inc.† | | | 92 | | | | 2,327 | | | | | |
Omeros Corp.† | | | 487 | | | | 4,938 | | | | | |
Oncocyte Corp.† | | | 519 | | | | 768 | | | | | |
Oncternal Therapeutics, Inc. CVR†(1) | | | 7 | | | | 14 | | | | | |
Organogenesis Holdings, Inc.† | | | 167 | | | | 610 | | | | | |
Orgenesis, Inc.† | | | 149 | | | | 675 | | | | | |
Osmotica Pharmaceuticals PLC† | | | 107 | | | | 549 | | | | | |
Ovid therapeutics, Inc.† | | | 353 | | | | 1,804 | | | | | |
SunAmerica Specialty Series — AIG Small-Cap Fund
PORTFOLIO OF INVESTMENTS — October 31, 2020 — (continued)
| | | | | | | | |
| Security Description | | Shares | | |
Value
(Note 3) | |
|
|
COMMON STOCKS (continued) | |
Medical-Biomedical/Gene (continued) | |
Oyster Point Pharma, Inc.† | | | 50 | | | $ | 991 | |
Pacific Biosciences of California, Inc.† | | | 1,376 | | | | 18,039 | |
Pandion Therapeutics, Inc.† | | | 62 | | | | 732 | |
PDL BioPharma, Inc.† | | | 918 | | | | 1,974 | |
Phathom Pharmaceuticals, Inc.† | | | 89 | | | | 3,503 | |
Pieris Pharmaceuticals, Inc.† | | | 409 | | | | 1,027 | |
Pliant Therapeutics, Inc.† | | | 86 | | | | 1,859 | |
Poseida Therapeutics, Inc.† | | | 111 | | | | 1,278 | |
Precigen, Inc.† | | | 546 | | | | 2,342 | |
Precision BioSciences, Inc.† | | | 383 | | | | 2,417 | |
Prevail Therapeutics, Inc.† | | | 118 | | | | 1,155 | |
Protara Therapeutics, Inc.† | | | 17 | | | | 305 | |
Prothena Corp. PLC† | | | 254 | | | | 2,771 | |
Provention Bio, Inc.† | | | 392 | | | | 4,649 | |
PTC Therapeutics, Inc.† | | | 510 | | | | 26,617 | |
Puma Biotechnology, Inc.† | | | 8,869 | | | | 74,234 | |
Radius Health, Inc.† | | | 375 | | | | 5,029 | |
RAPT Therapeutics, Inc.† | | | 90 | | | | 2,587 | |
REGENXBIO, Inc.† | | | 281 | | | | 8,082 | |
Relay Therapeutics, Inc.† | | | 265 | | | | 9,789 | |
Replimune Group, Inc.† | | | 172 | | | | 7,191 | |
Retrophin, Inc.† | | | 403 | | | | 8,157 | |
REVOLUTION Medicines, Inc.† | | | 318 | | | | 9,600 | |
Rigel Pharmaceuticals, Inc.† | | | 1,401 | | | | 3,474 | |
Rocket Pharmaceuticals, Inc.† | | | 281 | | | | 7,851 | |
Rubius Therapeutics, Inc.† | | | 296 | | | | 1,252 | |
Sangamo Therapeutics, Inc.† | | | 949 | | | | 9,813 | |
Satsuma Pharmaceuticals, Inc.† | | | 76 | | | | 271 | |
Savara, Inc.† | | | 397 | | | | 413 | |
Scholar Rock Holding Corp.† | | | 187 | | | | 7,274 | |
Selecta Biosciences, Inc.† | | | 559 | | | | 1,655 | |
Solid Biosciences, Inc.† | | | 204 | | | | 667 | |
Sorrento Therapeutics, Inc.† | | | 17,135 | | | | 118,917 | |
SpringWorks Therapeutics, Inc.† | | | 175 | | | | 10,148 | |
Stoke Therapeutics, Inc.† | | | 101 | | | | 3,877 | |
Strongbridge Biopharma PLC† | | | 293 | | | | 571 | |
Sutro Biopharma, Inc.† | | | 214 | | | | 2,752 | |
Syndax Pharmaceuticals, Inc.† | | | 222 | | | | 3,865 | |
TCR2 Therapeutics, Inc.† | | | 209 | | | | 4,111 | |
Tela Bio, Inc.† | | | 57 | | | | 864 | |
Theravance Biopharma, Inc.† | | | 379 | | | | 7,167 | |
Tobira Therapeutics, Inc. CVR†(1) | | | 104 | | | | 0 | |
Translate Bio, Inc.† | | | 562 | | | | 7,210 | |
TransMedics Group, Inc.† | | | 8,361 | | | | 100,165 | |
Turning Point Therapeutics, Inc.† | | | 299 | | | | 27,565 | |
Twist Bioscience Corp.† | | | 270 | | | | 20,693 | |
Tyme Technologies, Inc.† | | | 558 | | | | 484 | |
Ultragenyx Pharmaceutical, Inc.† | | | 474 | | | | 47,637 | |
UNITY Biotechnology, Inc.† | | | 287 | | | | 1,111 | |
Vaxart, Inc.† | | | 432 | | | | 2,125 | |
VBI Vaccines, Inc.† | | | 1,416 | | | | 3,328 | |
Veracyte, Inc.† | | | 472 | | | | 16,360 | |
Verastem, Inc.† | | | 1,407 | | | | 1,688 | |
Vericel Corp.† | | | 15,196 | | | | 281,582 | |
Veru, Inc.† | | | 438 | | | | 1,104 | |
Viela Bio, Inc.† | | | 178 | | | | 5,680 | |
Viking Therapeutics, Inc.† | | | 541 | | | | 3,046 | |
Vir Biotechnology, Inc.† | | | 442 | | | | 13,896 | |
|
|
Medical-Biomedical/Gene (continued) | |
VolitionRX, Ltd.† | | | 225 | | | | 668 | |
VYNE Therapeutics, Inc.† | | | 1,197 | | | | 1,915 | |
WaVe Life Sciences, Ltd.† | | | 202 | | | | 1,428 | |
X4 Pharmaceuticals, Inc.† | | | 133 | | | | 763 | |
XBiotech, Inc.† | | | 118 | | | | 2,019 | |
Xencor, Inc.† | | | 457 | | | | 17,540 | |
XOMA Corp.† | | | 50 | | | | 1,240 | |
Y-mAbs Therapeutics, Inc.† | | | 247 | | | | 10,557 | |
Zentalis Pharmaceuticals, Inc.† | | | 95 | | | | 3,761 | |
ZIOPHARM Oncology, Inc.† | | | 1,758 | | | | 3,674 | |
| | | | | | |
|
|
|
| | | | | | | | 2,356,294 | |
| | | | | | |
|
|
|
Medical-Drugs — 2.2% | |
89bio, Inc.† | | | 54 | | | | 1,251 | |
AcelRx Pharmaceuticals, Inc.† | | | 660 | | | | 1,129 | |
Aduro Biotech Holding, Inc. CVR†(1) | | | 109 | | | | 0 | |
Aeglea BioTherapeutics, Inc.† | | | 346 | | | | 2,657 | |
Aerie Pharmaceuticals, Inc.† | | | 302 | | | | 3,204 | |
Agile Therapeutics, Inc.† | | | 560 | | | | 1,523 | |
Alector, Inc.† | | | 382 | | | | 3,595 | |
Allovir, Inc.† | | | 148 | | | | 3,912 | |
Amphastar Pharmaceuticals, Inc.† | | | 300 | | | | 5,877 | |
Aquestive Therapeutics, Inc.† | | | 164 | | | | 794 | |
Athenex, Inc.† | | | 511 | | | | 5,825 | |
Avenue Therapeutics, Inc.† | | | 55 | | | | 173 | |
Axcella Health, Inc.† | | | 124 | | | | 526 | |
Aytu BioScience, Inc.† | | | 189 | | | | 180 | |
Beyond Air, Inc.† | | | 115 | | | | 603 | |
Beyondspring, Inc.† | | | 121 | | | | 1,784 | |
BioSpecifics Technologies Corp.† | | | 51 | | | | 4,493 | |
Bioxcel Therapeutics, Inc.† | | | 97 | | | | 4,432 | |
Cassava Sciences, Inc.† | | | 191 | | | | 1,568 | |
Catalyst Biosciences, Inc.† | | | 182 | | | | 997 | |
Catalyst Pharmaceuticals, Inc.† | | | 800 | | | | 2,376 | |
Checkpoint Therapeutics, Inc.† | | | 372 | | | | 815 | |
Chiasma, Inc.† | | | 413 | | | | 1,549 | |
Chimerix, Inc.† | | | 399 | | | | 1,065 | |
Cidara Therapeutics, Inc.† | | | 290 | | | | 757 | |
Clovis Oncology, Inc.† | | | 684 | | | | 3,372 | |
Coherus Biosciences, Inc.† | | | 14,167 | | | | 236,164 | |
Collegium Pharmaceutical, Inc.† | | | 283 | | | | 5,046 | |
Concert Pharmaceuticals, Inc.† | | | 236 | | | | 2,435 | |
Corbus Pharmaceuticals Holdings, Inc.† | | | 616 | | | | 579 | |
Corcept Therapeutics, Inc.† | | | 792 | | | | 13,290 | |
Cyclerion Therapeutics, Inc.† | | | 183 | | | | 428 | |
Cytokinetics, Inc.† | | | 547 | | | | 8,407 | |
Durect Corp.† | | | 1,670 | | | | 3,014 | |
Eagle Pharmaceuticals, Inc.† | | | 90 | | | | 4,187 | |
Eloxx Pharmaceuticals, Inc.† | | | 220 | | | | 557 | |
Enanta Pharmaceuticals, Inc.† | | | 157 | | | | 6,850 | |
Eton Pharmaceuticals, Inc.† | | | 122 | | | | 889 | |
Fortress Biotech, Inc.† | | | 518 | | | | 1,140 | |
Fulcrum Therapeutics, Inc.† | | | 118 | | | | 1,163 | |
Galectin Therapeutics, Inc.† | | | 307 | | | | 780 | |
Gritstone Oncology, Inc.† | | | 248 | | | | 677 | |
Harpoon Therapeutics, Inc.† | | | 87 | | | | 1,259 | |
Harrow Health, Inc.† | | | 185 | | | | 881 | |
Hookipa Pharma, Inc.† | | | 102 | | | | 959 | |
Ideaya Biosciences, Inc.† | | | 131 | | | | 1,594 | |
SunAmerica Specialty Series — AIG Small-Cap Fund
PORTFOLIO OF INVESTMENTS — October 31, 2020 — (continued)
| | | | | | | | |
| Security Description | | Shares | | |
Value
(Note 3) | |
|
|
COMMON STOCKS (continued) | |
Medical-Drugs — (continued) | |
IMARA, Inc.† | | | 41 | | | $ | 648 | |
Immunic, Inc.† | | | 46 | | | | 729 | |
Intellia Therapeutics, Inc.† | | | 4,234 | | | | 101,362 | |
Intra-Cellular Therapies, Inc.† | | | 539 | | | | 13,297 | |
Ironwood Pharmaceuticals, Inc.† | | | 1,316 | | | | 13,002 | |
Jounce Therapeutics, Inc.† | | | 142 | | | | 1,181 | |
Kadmon Holdings, Inc.† | | | 1,422 | | | | 4,835 | |
Kala Pharmaceuticals, Inc.† | | | 326 | | | | 2,152 | |
KalVista Pharmaceuticals, Inc.† | | | 112 | | | | 1,927 | |
Kura Oncology, Inc.† | | | 437 | | | | 13,656 | |
Lannett Co., Inc.† | | | 262 | | | | 1,685 | |
Madrigal Pharmaceuticals, Inc.† | | | 72 | | | | 9,162 | |
Marinus Pharmaceuticals, Inc.† | | | 206 | | | | 2,686 | |
MediciNova, Inc.† | | | 347 | | | | 1,940 | |
Minerva Neurosciences, Inc.† | | | 282 | | | | 905 | |
Mirum Pharmaceuticals, Inc.† | | | 43 | | | | 677 | |
Morphic Holding, Inc.† | | | 113 | | | | 3,041 | |
MyoKardia, Inc.† | | | 418 | | | | 93,435 | |
Neoleukin Therapeutics, Inc.† | | | 266 | | | | 2,790 | |
Neubase Therapeutics, Inc.† | | | 138 | | | | 1,081 | |
NeuroBo Pharmaceuticals, Inc.† | | | 35 | | | | 176 | |
Ocular Therapeutix, Inc.† | | | 499 | | | | 4,740 | |
Odonate Therapeutics, Inc.† | | | 108 | | | | 1,556 | |
Optinose, Inc.† | | | 288 | | | | 922 | |
ORIC Pharmaceuticals, Inc.† | | | 72 | | | | 1,548 | |
Pacira BioSciences, Inc.† | | | 346 | | | | 18,096 | |
Paratek Pharmaceuticals, Inc.† | | | 360 | | | | 1,717 | |
Passage Bio, Inc.† | | | 112 | | | | 1,883 | |
PhaseBio Pharmaceuticals, Inc.† | | | 126 | | | | 344 | |
Phibro Animal Health Corp., Class A | | | 168 | | | | 2,762 | |
Prestige Consumer Healthcare, Inc.† | | | 415 | | | | 13,707 | |
Progenics Pharmaceuticals, Inc. CVR†(1) | | | 722 | | | | 0 | |
Protagonist Therapeutics, Inc.† | | | 250 | | | | 4,737 | |
Relmada Therapeutics, Inc.† | | | 119 | | | | 3,681 | |
Rhythm Pharmaceuticals, Inc.† | | | 277 | | | | 5,864 | |
Rockwell Medical, Inc.† | | | 575 | | | | 490 | |
scPharmaceuticals, Inc.† | | | 58 | | | | 500 | |
Seres Therapeutics, Inc.† | | | 438 | | | | 12,216 | |
SIGA Technologies, Inc.† | | | 430 | | | | 2,748 | |
Spectrum Pharmaceuticals, Inc.† | | | 1,189 | | | | 4,078 | |
Spero Therapeutics, Inc.† | | | 122 | | | | 1,599 | |
Supernus Pharmaceuticals, Inc.† | | | 402 | | | | 7,381 | |
Syros Pharmaceuticals, Inc.† | | | 342 | | | | 2,281 | |
TG Therapeutics, Inc.† | | | 916 | | | | 23,147 | |
TherapeuticsMD, Inc.† | | | 1,948 | | | | 2,377 | |
Tricida, Inc.† | | | 233 | | | | 1,312 | |
UroGen Pharma, Ltd.† | | | 160 | | | | 3,603 | |
Vanda Pharmaceuticals, Inc.† | | | 443 | | | | 4,736 | |
Vaxcyte, Inc.† | | | 150 | | | | 5,605 | |
Verrica Pharmaceuticals, Inc.† | | | 103 | | | | 763 | |
Voyager Therapeutics, Inc.† | | | 213 | | | | 2,264 | |
vTv Therapeutics, Inc., Class A† | | | 86 | | | | 146 | |
Xeris Pharmaceuticals, Inc.† | | | 379 | | | | 1,793 | |
Zogenix, Inc.† | | | 458 | | | | 9,765 | |
| | | | | | |
|
|
|
| | | | | | | | 763,484 | |
| | | | | | |
|
|
|
Medical-Generic Drugs — 0.0% | |
Amneal Pharmaceuticals, Inc.† | | | 818 | | | | 3,403 | |
|
|
Medical-Generic Drugs (continued) | |
Arvinas, Inc.† | | | 241 | | | | 5,039 | |
Endo International PLC† | | | 1,868 | | | | 8,537 | |
| | | | | | |
|
|
|
| | | | | | | | 16,979 | |
| | | | | | |
|
|
|
Medical-HMO — 0.1% | |
Magellan Health, Inc.† | | | 196 | | | | 14,165 | |
Tivity Health, Inc.† | | | 357 | | | | 4,909 | |
Triple-S Management Corp., Class B† | | | 187 | | | | 3,463 | |
| | | | | | |
|
|
|
| | | | | | | | 22,537 | |
| | | | | | |
|
|
|
Medical-Hospitals — 0.1% | |
Community Health Systems, Inc.† | | | 703 | | | | 4,387 | |
Select Medical Holdings Corp.† | | | 896 | | | | 18,798 | |
Surgery Partners, Inc.† | | | 186 | | | | 4,059 | |
Tenet Healthcare Corp.† | | | 862 | | | | 21,153 | |
| | | | | | |
|
|
|
| | | | | | | | 48,397 | |
| | | | | | |
|
|
|
Medical-Nursing Homes — 0.1% | |
Ensign Group, Inc. | | | 422 | | | | 24,830 | |
National HealthCare Corp. | | | 103 | | | | 6,520 | |
| | | | | | |
|
|
|
| | | | | | | | 31,350 | |
| | | | | | |
|
|
|
Medical-Outpatient/Home Medical — 2.2% | |
Addus HomeCare Corp.† | | | 2,968 | | | | 289,588 | |
Joint Corp.† | | | 10,913 | | | | 204,510 | |
LHC Group, Inc.† | | | 250 | | | | 54,137 | |
Pennant Group, Inc.† | | | 5,153 | | | | 214,674 | |
Providence Service Corp.† | | | 100 | | | | 11,755 | |
| | | | | | |
|
|
|
| | | | | | | | 774,664 | |
| | | | | | |
|
|
|
Medical-Wholesale Drug Distribution — 0.8% | |
AdaptHealth Corp.† | | | 206 | | | | 5,624 | |
Covetrus, Inc.† | | | 809 | | | | 19,974 | |
Eidos Therapeutics, Inc.† | | | 90 | | | | 6,383 | |
Evofem Biosciences, Inc.† | | | 632 | | | | 1,498 | |
Owens & Minor, Inc. | | | 520 | | | | 13,062 | |
PetIQ, Inc.† | | | 7,788 | | | | 222,425 | |
| | | | | | |
|
|
|
| | | | | | | | 268,966 | |
| | | | | | |
|
|
|
Metal Processors & Fabrication — 0.3% | |
AZZ, Inc. | | | 215 | | | | 7,222 | |
Helios Technologies, Inc. | | | 256 | | | | 10,711 | |
Lawson Products, Inc.† | | | 36 | | | | 1,484 | |
LB Foster Co., Class A† | | | 83 | | | | 1,125 | |
Mayville Engineering Co., Inc.† | | | 61 | | | | 544 | |
Mueller Industries, Inc. | | | 461 | | | | 13,337 | |
Park-Ohio Holdings Corp. | | | 72 | | | | 1,421 | |
RBC Bearings, Inc.† | | | 203 | | | | 24,167 | |
Rexnord Corp. | | | 1,006 | | | | 32,272 | |
Standex International Corp. | | | 101 | | | | 6,271 | |
Tredegar Corp. | | | 216 | | | | 3,149 | |
| | | | | | |
|
|
|
| | | | | | | | 101,703 | |
| | | | | | |
|
|
|
Metal Products-Distribution — 0.0% | |
Olympic Steel, Inc. | | | 75 | | | | 856 | |
Ryerson Holding Corp.† | | | 132 | | | | 1,039 | |
Worthington Industries, Inc. | | | 301 | | | | 14,812 | |
| | | | | | |
|
|
|
| | | | | | | | 16,707 | |
| | | | | | |
|
|
|
Metal Products-Fasteners — 0.0% | |
Eastern Co. | | | 44 | | | | 901 | |
| | | | | | |
|
|
|
SunAmerica Specialty Series — AIG Small-Cap Fund
PORTFOLIO OF INVESTMENTS — October 31, 2020 — (continued)
| | | | | | | | |
| Security Description | | Shares | | |
Value
(Note 3) | |
|
|
COMMON STOCKS (continued) | |
Metal-Aluminum — 0.1% | | | | | |
Alcoa Corp.† | | | 1,545 | | | $ | 19,961 | |
Arconic Corp.† | | | 821 | | | | 17,849 | |
Century Aluminum Co.† | | | 416 | | | | 2,737 | |
Kaiser Aluminum Corp. | | | 130 | | | | 8,181 | |
| | | | | | |
|
|
|
| | | | | | | | 48,728 | |
| | | | | | |
|
|
|
Metal-Diversified — 0.0% | |
Ferroglobe Representation & Warranty Trust†(1) | | | 777 | | | | 0 | |
| | | | | | |
|
|
|
Metal-Iron — 0.1% | |
Cleveland-Cliffs, Inc. | | | 3,257 | | | | 26,968 | |
| | | | | | |
|
|
|
Miscellaneous Manufacturing — 0.1% | |
Hillenbrand, Inc. | | | 611 | | | | 17,872 | |
John Bean Technologies Corp. | | | 258 | | | | 21,664 | |
| | | | | | |
|
|
|
| | | | | | | | 39,536 | |
| | | | | | |
|
|
|
Motion Pictures & Services — 0.0% | |
Eros STX Global Corp.† | | | 1,246 | | | | 2,393 | |
IMAX Corp.† | | | 408 | | | | 4,704 | |
| | | | | | |
|
|
|
| | | | | | | | 7,097 | |
| | | | | | |
|
|
|
MRI/Medical Diagnostic Imaging — 0.5% | |
RadNet, Inc.† | | | 12,318 | | | | 178,734 | |
| | | | | | |
|
|
|
Multimedia — 0.0% | |
E.W. Scripps Co., Class A | | | 462 | | | | 4,195 | |
Entravision Communications Corp., Class A | | | 485 | | | | 887 | |
Media General, Inc. CVR†(1) | | | 1,299 | | | | 0 | |
| | | | | | |
|
|
|
| | | | | | | | 5,082 | |
| | | | | | |
|
|
|
Networking Products — 0.6% | |
A10 Networks, Inc.† | | | 502 | | | | 3,384 | |
Calix, Inc.† | | | 434 | | | | 10,160 | |
Extreme Networks, Inc.† | | | 977 | | | | 3,967 | |
Infinera Corp.† | | | 1,313 | | | | 8,219 | |
Inseego Corp.† | | | 562 | | | | 4,889 | |
NeoPhotonics Corp.† | | | 23,284 | | | | 158,564 | |
NETGEAR, Inc.† | | | 244 | | | | 7,520 | |
| | | | | | |
|
|
|
| | | | | | | | 196,703 | |
| | | | | | |
|
|
|
Night Clubs — 0.0% | |
RCI Hospitality Holdings, Inc. | | | 70 | | | | 1,498 | |
| | | | | | |
|
|
|
Non-Ferrous Metals — 0.0% | |
Energy Fuels, Inc.† | | | 1,027 | | | | 1,551 | |
Uranium Energy Corp.† | | | 1,498 | | | | 1,292 | |
| | | | | | |
|
|
|
| | | | | | | | 2,843 | |
| | | | | | |
|
|
|
Non-Hazardous Waste Disposal — 0.1% | |
Casella Waste Systems, Inc., Class A† | | | 380 | | | | 20,516 | |
Covanta Holding Corp. | | | 978 | | | | 8,880 | |
| | | | | | |
|
|
|
| | | | | | | | 29,396 | |
| | | | | | |
|
|
|
Office Automation & Equipment — 0.0% | |
Pitney Bowes, Inc. | | | 1,429 | | | | 7,588 | |
| | | | | | |
|
|
|
Office Furnishings-Original — 0.1% | |
CompX International, Inc. | | | 14 | | | | 177 | |
Herman Miller, Inc. | | | 486 | | | | 14,808 | |
HNI Corp. | | | 352 | | | | 11,458 | |
Interface, Inc. | | | 481 | | | | 2,948 | |
|
|
Office Furnishings-Original (continued) | |
Kimball International, Inc., Class B | | | 297 | | | | 3,059 | |
Knoll, Inc. | | | 413 | | | | 4,733 | |
Steelcase, Inc., Class A | | | 711 | | | | 7,423 | |
| | | | | | |
|
|
|
| | | | | | | | 44,606 | |
| | | | | | |
|
|
|
Office Supplies & Forms — 0.0% | |
ACCO Brands Corp. | | | 762 | | | | 4,016 | |
| | | | | | |
|
|
|
Oil & Gas Drilling — 0.0% | |
Nabors Industries, Ltd. | | | 58 | | | | 1,648 | |
Patterson-UTI Energy, Inc. | | | 1,510 | | | | 3,866 | |
ProPetro Holding Corp.† | | | 661 | | | | 2,611 | |
Transocean, Ltd.† | | | 4,822 | | | | 3,233 | |
| | | | | | |
|
|
|
| | | | | | | | 11,358 | |
| | | | | | |
|
|
|
Oil Companies-Exploration & Production — 0.3% | |
Antero Resources Corp.† | | | 2,002 | | | | 6,807 | |
Berry Corp. | | | 558 | | | | 1,462 | |
Bonanza Creek Energy, Inc.† | | | 155 | | | | 2,745 | |
Brigham Minerals, Inc., Class A | | | 304 | | | | 2,681 | |
CNX Resources Corp.† | | | 1,834 | | | | 17,790 | |
Comstock Resources, Inc.† | | | 201 | | | | 1,067 | |
Contango Oil & Gas Co.† | | | 755 | | | | 944 | |
Earthstone Energy, Inc., Class A† | | | 192 | | | | 516 | |
Evolution Petroleum Corp. | | | 233 | | | | 515 | |
Falcon Minerals Corp. | | | 315 | | | | 580 | |
Goodrich Petroleum Corp.† | | | 76 | | | | 728 | |
Gulfport Energy Corp.† | | | 1,326 | | | | 339 | |
Kosmos Energy, Ltd. | | | 3,324 | | | | 3,305 | |
Magnolia Oil & Gas Corp., Class A† | | | 1,022 | | | | 4,436 | |
Matador Resources Co.† | | | 910 | | | | 6,434 | |
Montage Resources Corp.† | | | 177 | | | | 876 | |
Ovintiv, Inc. | | | 2,159 | | | | 19,863 | |
PDC Energy, Inc.† | | | 823 | | | | 9,810 | |
Penn Virginia Corp.† | | | 112 | | | | 860 | |
PrimeEnergy Resources Corp.† | | | 4 | | | | 206 | |
Range Resources Corp. | | | 1,766 | | | | 11,620 | |
SM Energy Co. | | | 941 | | | | 1,515 | |
Southwestern Energy Co.† | | | 4,942 | | | | 13,195 | |
Talos Energy, Inc.† | | | 102 | | | | 671 | |
Tellurian, Inc.† | | | 1,353 | | | | 1,299 | |
W&T Offshore, Inc.† | | | 777 | | | | 1,088 | |
Whiting Petroleum Corp.† | | | 10 | | | | 146 | |
| | | | | | |
|
|
|
| | | | | | | | 111,498 | |
| | | | | | |
|
|
|
Oil Field Machinery & Equipment — 0.0% | |
Dril-Quip, Inc.† | | | 288 | | | | 7,459 | |
Exterran Corp.† | | | 215 | | | | 910 | |
Thermon Group Holdings, Inc.† | | | 270 | | | | 2,724 | |
US Silica Holdings, Inc. | | | 608 | | | | 1,654 | |
| | | | | | |
|
|
|
| | | | | | | | 12,747 | |
| | | | | | |
|
|
|
Oil Refining & Marketing — 0.1% | |
Adams Resources & Energy, Inc. | | | 18 | | | | 343 | |
CVR Energy, Inc. | | | 244 | | | | 2,687 | |
Delek US Holdings, Inc. | | | 515 | | | | 5,181 | |
Murphy USA, Inc.† | | | 227 | | | | 27,760 | |
Par Pacific Holdings, Inc.† | | | 330 | | | | 2,125 | |
PBF Energy, Inc., Class A | | | 796 | | | | 3,717 | |
SunAmerica Specialty Series — AIG Small-Cap Fund
PORTFOLIO OF INVESTMENTS — October 31, 2020 — (continued)
| | | | | | | | |
| Security Description | | Shares | | |
Value
(Note 3) | |
|
|
COMMON STOCKS (continued) | |
Oil Refining & Marketing (continued) | |
Trecora Resources† | | | 199 | | | $ | 1,178 | |
| | | | | | |
|
|
|
| | | | | | | | 42,991 | |
| | | | | | |
|
|
|
Oil-Field Services — 0.2% | |
Archrock, Inc. | | | 1,070 | | | | 6,345 | |
ChampionX Corp.† | | | 1,532 | | | | 13,374 | |
DMC Global, Inc. | | | 120 | | | | 4,268 | |
Frank’s International NV† | | | 1,278 | | | | 2,237 | |
Helix Energy Solutions Group, Inc.† | | | 1,176 | | | | 2,917 | |
Liberty Oilfield Services, Inc., Class A | | | 535 | | | | 3,574 | |
Matrix Service Co.† | | | 214 | | | | 1,626 | |
MRC Global, Inc.† | | | 648 | | | | 2,761 | |
National Energy Services Reunited Corp.† | | | 170 | | | | 1,258 | |
Newpark Resources, Inc.† | | | 733 | | | | 524 | |
NexTier Oilfield Solutions, Inc.† | | | 1,334 | | | | 2,521 | |
NOW, Inc.† | | | 903 | | | | 3,675 | |
Oceaneering International, Inc.† | | | 818 | | | | 3,338 | |
Oil States International, Inc.† | | | 496 | | | | 1,235 | |
RPC, Inc.† | | | 474 | | | | 1,128 | |
Select Energy Services, Inc., Class A† | | | 486 | | | | 1,468 | |
Solaris Oilfield Infrastructure, Inc., Class A | | | 238 | | | | 1,411 | |
| | | | | | |
|
|
|
| | | | | | | | 53,660 | |
| | | | | | |
|
|
|
Optical Supplies — 0.1% | |
STAAR Surgical Co.† | | | 378 | | | | 27,405 | |
| | | | | | |
|
|
|
Paper & Related Products — 0.1% | |
Clearwater Paper Corp.† | | | 133 | | | | 4,941 | |
Domtar Corp. | | | 453 | | | | 10,818 | |
Neenah, Inc. | | | 138 | | | | 5,193 | |
P.H. Glatfelter Co. | | | 361 | | | | 5,151 | |
Schweitzer-Mauduit International, Inc. | | | 256 | | | | 8,499 | |
Verso Corp., Class A | | | 258 | | | | 2,007 | |
| | | | | | |
|
|
|
| | | | | | | | 36,609 | |
| | | | | | |
|
|
|
Pastoral & Agricultural — 0.2% | |
Darling Ingredients, Inc.† | | | 1,327 | | | | 57,061 | |
| | | | | | |
|
|
|
Patient Monitoring Equipment — 0.1% | |
CareDx, Inc.† | | | 395 | | | | 19,375 | |
| | | | | | |
|
|
|
Pharmacy Services — 0.0% | |
Option Care Health, Inc.† | | | 362 | | | | 4,825 | |
| | | | | | |
|
|
|
Physical Therapy/Rehabilitation Centers — 0.5% | |
U.S. Physical Therapy, Inc. | | | 2,262 | | | | 179,444 | |
| | | | | | |
|
|
|
Physicians Practice Management — 0.0% | |
Accolade, Inc.† | | | 96 | | | | 3,362 | |
Apollo Medical Holdings, Inc.† | | | 163 | | | | 2,813 | |
| | | | | | |
|
|
|
| | | | | | | | 6,175 | |
| | | | | | |
|
|
|
Pipelines — 0.0% | |
NextDecade Corp.† | | | 173 | | | | 419 | |
| | | | | | |
|
|
|
Pollution Control — 0.0% | |
Advanced Emissions Solutions, Inc. | | | 131 | | | | 583 | |
CECO Environmental Corp.† | | | 255 | | | | 1,805 | |
| | | | | | |
|
|
|
| | | | | | | | 2,388 | |
| | | | | | |
|
|
|
Poultry — 0.1% | |
Sanderson Farms, Inc. | | | 166 | | | | 21,243 | |
| | | | | | |
|
|
|
|
|
Power Converter/Supply Equipment — 0.0% | | | | | |
Powell Industries, Inc. | | | 74 | | | $ | 1,749 | |
Vicor Corp.† | | | 159 | | | | 12,402 | |
| | | | | | |
|
|
|
| | | | | | | | 14,151 | |
| | | | | | |
|
|
|
Precious Metals — 0.1% | |
Coeur Mining, Inc.† | | | 1,997 | | | | 14,119 | |
Hecla Mining Co. | | | 4,303 | | | | 19,708 | |
| | | | | | |
|
|
|
| | | | | | | | 33,827 | |
| | | | | | |
|
|
|
Printing-Commercial — 0.1% | |
Cimpress PLC† | | | 147 | | | | 10,790 | |
Deluxe Corp. | | | 344 | | | | 7,375 | |
Ennis, Inc. | | | 211 | | | | 3,216 | |
Quad/Graphics, Inc. | | | 274 | | | | 622 | |
| | | | | | |
|
|
|
| | | | | | | | 22,003 | |
| | | | | | |
|
|
|
Professional Sports — 0.0% | |
Liberty Media Corp.-Liberty Braves, Series A† | | | 83 | | | | 1,718 | |
Liberty Media Corp.-Liberty Braves, Series C† | | | 299 | | | | 6,121 | |
| | | | | | |
|
|
|
| | | | | | | | 7,839 | |
| | | | | | |
|
|
|
Protection/Safety — 0.6% | |
Genasys, Inc.† | | | 31,035 | | | | 186,831 | |
ShotSpotter, Inc.† | | | 66 | | | | 1,934 | |
Vivint Smart Home, Inc.† | | | 601 | | | | 9,346 | |
| | | | | | |
|
|
|
| | | | | | | | 198,111 | |
| | | | | | |
|
|
|
Publishing-Books — 0.0% | |
Gannett Co, Inc. | | | 1,084 | | | | 1,247 | |
Houghton Mifflin Harcourt Co.† | | | 870 | | | | 2,271 | |
Scholastic Corp. | | | 240 | | | | 4,742 | |
| | | | | | |
|
|
|
| | | | | | | | 8,260 | |
| | | | | | |
|
|
|
Publishing-Newspapers — 0.1% | |
TEGNA, Inc. | | | 1,809 | | | | 21,762 | |
Tribune Publishing Co. | | | 129 | | | | 1,479 | |
| | | | | | |
|
|
|
| | | | | | | | 23,241 | |
| | | | | | |
|
|
|
Publishing-Periodicals — 0.0% | |
Meredith Corp. | | | 327 | | | | 3,597 | |
Value Line, Inc. | | | 8 | | | | 218 | |
| | | | | | |
|
|
|
| | | | | | | | 3,815 | |
| | | | | | |
|
|
|
Quarrying — 0.1% | |
Compass Minerals International, Inc. | | | 282 | | | | 17,027 | |
| | | | | | |
|
|
|
Racetracks — 0.3% | |
Churchill Downs, Inc. | | | 313 | | | | 46,684 | |
Penn National Gaming, Inc.† | | | 1,254 | | | | 67,691 | |
| | | | | | |
|
|
|
| | | | | | | | 114,375 | |
| | | | | | |
|
|
|
Radio — 0.0% | |
Entercom Communications Corp., Class A | | | 967 | | | | 1,450 | |
iHeartMedia, Inc., Class A† Class A | | | 494 | | | | 4,061 | |
Saga Communications, Inc., Class A | | | 31 | | | | 528 | |
| | | | | | |
|
|
|
| | | | | | | | 6,039 | |
| | | | | | |
|
|
|
Real Estate Investment Trusts — 3.8% | |
Acadia Realty Trust | | | 699 | | | | 6,522 | |
Agree Realty Corp. | | | 439 | | | | 27,249 | |
Alexander & Baldwin, Inc. | | | 594 | | | | 7,633 | |
SunAmerica Specialty Series — AIG Small-Cap Fund
PORTFOLIO OF INVESTMENTS — October 31, 2020 — (continued)
| | | | | | | | |
| Security Description | | Shares | | |
Value
(Note 3) | |
|
|
COMMON STOCKS (continued) | |
Real Estate Investment Trusts (continued) | |
Alexander’s, Inc. | | | 18 | | | $ | 4,377 | |
Alpine Income Property Trust, Inc. | | | 55 | | | | 767 | |
American Assets Trust, Inc. | | | 415 | | | | 8,686 | |
American Finance Trust, Inc. | | | 900 | | | | 5,188 | |
Anworth Mtg. Asset Corp. | | | 808 | | | | 1,325 | |
Apollo Commercial Real Estate Finance, Inc. | | | 1,223 | | | | 10,640 | |
Arbor Realty Trust, Inc. | | | 869 | | | | 10,272 | |
Ares Commercial Real Estate Corp. | | | 254 | | | | 2,365 | |
Armada Hoffler Properties, Inc. | | | 474 | | | | 4,271 | |
ARMOUR Residential REIT, Inc. | | | 528 | | | | 5,037 | |
Blackstone Mtg. Trust, Inc., Class A | | | 1,136 | | | | 24,651 | |
Bluerock Residential Growth REIT, Inc. | | | 203 | | | | 1,758 | |
Broadmark Realty Capital, Inc. | | | 1,061 | | | | 10,578 | |
BRT Apartments Corp. | | | 87 | | | | 1,083 | |
Capstead Mtg. Corp. | | | 786 | | | | 4,016 | |
CareTrust REIT, Inc. | | | 788 | | | | 13,475 | |
CatchMark Timber Trust, Inc., Class A | | | 402 | | | | 3,493 | |
Chatham Lodging Trust | | | 382 | | | | 2,808 | |
Cherry Hill Mtg. Investment Corp. | | | 125 | | | | 1,145 | |
Chimera Investment Corp. | | | 1,583 | | | | 13,218 | |
CIM Commercial Trust Corp. | | | 93 | | | | 744 | |
City Office REIT, Inc. | | | 353 | | | | 2,231 | |
Clipper Realty, Inc. | | | 123 | | | | 691 | |
Colony Capital, Inc. | | | 3,960 | | | | 14,098 | |
Colony Credit Real Estate, Inc. | | | 693 | | | | 3,631 | |
Columbia Property Trust, Inc. | | | 944 | | | | 9,988 | |
Community Healthcare Trust, Inc. | | | 178 | | | | 8,241 | |
CoreCivic, Inc. | | | 986 | | | | 6,320 | |
CorEnergy Infrastructure Trust, Inc. | | | 113 | | | | 529 | |
CorePoint Lodging, Inc. | | | 324 | | | | 1,549 | |
DiamondRock Hospitality Co. | | | 1,647 | | | | 8,136 | |
Diversified Healthcare Trust | | | 1,956 | | | | 5,663 | |
Dynex Capital, Inc. | | | 183 | | | | 2,998 | |
Easterly Government Properties, Inc. | | | 660 | | | | 13,794 | |
EastGroup Properties, Inc. | | | 319 | | | | 42,452 | |
Ellington Financial, Inc. | | | 340 | | | | 4,162 | |
Ellington Residential Mortgage REIT | | | 74 | | | | 787 | |
Essential Properties Realty Trust, Inc. | | | 762 | | | | 12,588 | |
Farmland Partners, Inc. | | | 215 | | | | 1,385 | |
Four Corners Property Trust, Inc. | | | 580 | | | | 14,697 | |
Franklin Street Properties Corp. | | | 857 | | | | 3,599 | |
Front Yard Residential Corp. | | | 413 | | | | 5,530 | |
GEO Group, Inc. | | | 971 | | | | 8,603 | |
Getty Realty Corp. | | | 282 | | | | 7,411 | |
Gladstone Commercial Corp. | | | 277 | | | | 4,501 | |
Gladstone Land Corp. | | | 161 | | | | 2,233 | |
Global Medical REIT, Inc. | | | 348 | | | | 4,326 | |
Global Net Lease, Inc. | | | 743 | | | | 10,573 | |
Granite Point Mtg. Trust, Inc. | | | 450 | | | | 3,033 | |
Great Ajax Corp. | | | 171 | | | | 1,313 | |
Healthcare Realty Trust, Inc. | | | 1,114 | | | | 30,969 | |
Hersha Hospitality Trust | | | 281 | | | | 1,377 | |
Independence Realty Trust, Inc. | | | 782 | | | | 9,501 | |
Industrial Logistics Properties Trust | | | 535 | | | | 10,261 | |
Innovative Industrial Properties, Inc. | | | 175 | | | | 20,410 | |
Invesco Mtg. Capital, Inc. | | | 1,506 | | | | 4,066 | |
Investors Real Estate Trust | | | 106 | | | | 7,145 | |
iStar, Inc. | | | 601 | | | | 7,092 | |
|
|
Real Estate Investment Trusts (continued) | |
Jernigan Capital, Inc. | | | 184 | | | | 3,181 | |
Kite Realty Group Trust | | | 685 | | | | 7,097 | |
KKR Real Estate Finance Trust, Inc. | | | 236 | | | | 3,944 | |
Ladder Capital Corp. | | | 872 | | | | 6,540 | |
Lexington Realty Trust | | | 2,256 | | | | 22,402 | |
LTC Properties, Inc. | | | 321 | | | | 10,596 | |
Macerich Co. | | | 1,236 | | | | 8,603 | |
Mack-Cali Realty Corp. | | | 716 | | | | 7,869 | |
MFA Financial, Inc. | | | 3,742 | | | | 10,552 | |
Monmouth Real Estate Investment Corp. | | | 783 | | | | 10,845 | |
National Health Investors, Inc. | | | 355 | | | | 19,898 | |
National Storage Affiliates Trust | | | 516 | | | | 17,487 | |
NETSTREIT Corp.† | | | 99 | | | | 1,736 | |
New Senior Investment Group, Inc. | | | 676 | | | | 2,643 | |
New York Mtg. Trust, Inc. | | | 3,124 | | | | 7,935 | |
NexPoint Residential Trust, Inc. | | | 6,247 | | | | 276,867 | |
Office Properties Income Trust | | | 394 | | | | 7,254 | |
One Liberty Properties, Inc. | | | 132 | | | | 2,037 | |
Orchid Island Capital, Inc. | | | 549 | | | | 2,849 | |
Pebblebrook Hotel Trust | | | 1,073 | | | | 12,855 | |
PennyMac Mtg. Investment Trust | | | 818 | | | | 12,245 | |
Physicians Realty Trust | | | 1,721 | | | | 29,016 | |
Piedmont Office Realty Trust, Inc., Class A | | | 1,041 | | | | 11,888 | |
Plymouth Industrial REIT, Inc. | | | 131 | | | | 1,665 | |
PotlatchDeltic Corp. | | | 540 | | | | 22,437 | |
Preferred Apartment Communities, Inc., Class A | | | 392 | | | | 2,117 | |
PS Business Parks, Inc. | | | 166 | | | | 18,929 | |
QTS Realty Trust, Inc., Class A | | | 505 | | | | 31,063 | |
Ready Capital Corp. | | | 345 | | | | 3,878 | |
Redwood Trust, Inc. | | | 948 | | | | 8,058 | |
Retail Opportunity Investments Corp. | | | 954 | | | | 9,282 | |
Retail Properties of America, Inc., Class A | | | 1,769 | | | | 9,270 | |
Retail Value, Inc. | | | 135 | | | | 1,687 | |
RLJ Lodging Trust | | | 1,354 | | | | 11,076 | |
RPT Realty | | | 665 | | | | 3,252 | |
Ryman Hospitality Properties, Inc. | | | 416 | | | | 16,578 | |
Sabra Health Care REIT, Inc. | | | 1,694 | | | | 22,293 | |
Safehold, Inc. | | | 143 | | | | 9,841 | |
Saul Centers, Inc. | | | 98 | | | | 2,425 | |
Seritage Growth Properties, Class A† | | | 281 | | | | 3,577 | |
Service Properties Trust | | | 1,352 | | | | 9,748 | |
SITE Centers Corp. | | | 1,263 | | | | 8,601 | |
STAG Industrial, Inc. | | | 1,236 | | | | 38,464 | |
Summit Hotel Properties, Inc. | | | 853 | | | | 4,504 | |
Sunstone Hotel Investors, Inc. | | | 1,773 | | | | 13,156 | |
Tanger Factory Outlet Centers, Inc. | | | 747 | | | | 4,624 | |
Terreno Realty Corp. | | | 550 | | | | 30,954 | |
TPG RE Finance Trust, Inc. | | | 495 | | | | 3,871 | |
Two Harbors Investment Corp. | | | 2,259 | | | | 11,431 | |
UMH Properties, Inc. | | | 302 | | | | 4,116 | |
Uniti Group, Inc. | | | 1,594 | | | | 14,059 | |
Universal Health Realty Income Trust | | | 106 | | | | 5,668 | |
Urban Edge Properties | | | 957 | | | | 8,996 | |
Urstadt Biddle Properties, Inc., Class A | | | 245 | | | | 2,330 | |
Washington Real Estate Investment Trust | | | 680 | | | | 11,886 | |
Western Asset Mtg. Capital Corp. | | | 491 | | | | 953 | |
Whitestone REIT | | | 329 | | | | 1,961 | |
Xenia Hotels & Resorts, Inc. | | | 934 | | | | 7,696 | |
| | | | | | |
|
|
|
| | | | | | | | 1,323,969 | |
| | | | | | |
|
|
|
SunAmerica Specialty Series — AIG Small-Cap Fund
PORTFOLIO OF INVESTMENTS — October 31, 2020 — (continued)
| | | | | | | | |
| Security Description | | Shares | | |
Value
(Note 3) | |
|
|
COMMON STOCKS (continued) | |
Real Estate Management/Services — 0.2% | | | | | |
Cushman & Wakefield PLC† | | | 911 | | | $ | 10,677 | |
eXp World Holdings, Inc.† | | | 201 | | | | 8,520 | |
Fathom Holdings, Inc.† | | | 39 | | | | 732 | |
Marcus & Millichap, Inc.† | | | 192 | | | | 5,996 | |
Maui Land & Pineapple Co., Inc.† | | | 56 | | | | 565 | |
Newmark Group, Inc., Class A | | | 1,178 | | | | 5,578 | |
RE/MAX Holdings, Inc., Class A | | | 147 | | | | 4,754 | |
Realogy Holdings Corp.† | | | 945 | | | | 10,546 | |
Redfin Corp.† | | | 799 | | | | 33,374 | |
RMR Group, Inc., Class A | | | 125 | | | | 3,333 | |
| | | | | | |
|
|
|
| | | | | | | | 84,075 | |
| | | | | | |
|
|
|
Real Estate Operations & Development — 0.1% | |
American Realty Investors, Inc.† | | | 9 | | | | 73 | |
CTO Realty Growth, Inc. | | | 38 | | | | 1,677 | |
FRP Holdings, Inc.† | | | 54 | | | | 2,185 | |
Griffin Industrial Realty, Inc. | | | 21 | | | | 1,114 | |
Kennedy-Wilson Holdings, Inc. | | | 1,008 | | | | 13,285 | |
Legacy Housing Corp.† | | | 68 | | | | 926 | |
McGrath RentCorp | | | 199 | | | | 11,359 | |
St. Joe Co.† | | | 271 | | | | 7,328 | |
Stratus Properties, Inc.† | | | 49 | | | | 1,047 | |
Transcontinental Realty Investors, Inc.† | | | 11 | | | | 242 | |
| | | | | | |
|
|
|
| | | | | | | | 39,236 | |
| | | | | | |
|
|
|
Recreational Centers — 0.0% | |
OneSpaWorld Holdings, Ltd. | | | 373 | | | | 2,316 | |
| | | | | | |
|
|
|
Recreational Vehicles — 1.1% | |
Camping World Holdings, Inc., Class A | | | 271 | | | | 7,165 | |
Malibu Boats, Inc., Class A† | | | 3,899 | | | | 198,186 | |
Marine Products Corp. | | | 59 | | | | 936 | |
MasterCraft Boat Holdings, Inc.† | | | 153 | | | | 3,155 | |
OneWater Marine, Inc., Class A† | | | 10,083 | | | | 187,846 | |
| | | | | | |
|
|
|
| | | | | | | | 397,288 | |
| | | | | | |
|
|
|
Recycling — 0.0% | |
Harsco Corp.† | | | 645 | | | | 8,320 | |
| | | | | | |
|
|
|
Rental Auto/Equipment — 0.1% | |
Alta Equipment Group, Inc.† | | | 140 | | | | 1,067 | |
Avis Budget Group, Inc.† | | | 434 | | | | 14,613 | |
CAI International, Inc. | | | 135 | | | | 3,557 | |
Herc Holdings, Inc.† | | | 201 | | | | 8,916 | |
Nesco Holdings, Inc.† | | | 109 | | | | 452 | |
Rent-A-Center, Inc. | | | 400 | | | | 12,360 | |
Textainer Group Holdings, Ltd.† | | | 426 | | | | 6,160 | |
| | | | | | |
|
|
|
| | | | | | | | 47,125 | |
| | | | | | |
|
|
|
Resorts/Theme Parks — 0.1% | |
Marriott Vacations Worldwide Corp. | | | 334 | | | | 32,265 | |
SeaWorld Entertainment, Inc.† | | | 419 | | | | 9,226 | |
| | | | | | |
|
|
|
| | | | | | | | 41,491 | |
| | | | | | |
|
|
|
Retail-Apparel/Shoe — 0.2% | |
Abercrombie & Fitch Co., Class A | | | 514 | | | | 7,309 | |
American Eagle Outfitters, Inc. | | | 1,244 | | | | 17,055 | |
Boot Barn Holdings, Inc.† | | | 235 | | | | 7,525 | |
Buckle, Inc. | | | 239 | | | | 5,726 | |
Caleres, Inc. | | | 305 | | | | 2,342 | |
|
|
Retail-Apparel/Shoe (continued) | |
Cato Corp., Class A | | | 175 | | | | 1,071 | |
Chico’s FAS, Inc. | | | 980 | | | | 1,049 | |
Children’s Place, Inc. | | | 117 | | | | 2,957 | |
Designer Brands, Inc., Class A | | | 508 | | | | 2,200 | |
Duluth Holdings, Inc., Class B† | | | 91 | | | | 1,396 | |
Express, Inc.† | | | 524 | | | | 320 | |
Genesco, Inc.† | | | 117 | | | | 2,073 | |
Guess?, Inc. | | | 348 | | | | 4,099 | |
Shoe Carnival, Inc. | | | 77 | | | | 2,386 | |
Tilly’s, Inc., Class A | | | 183 | | | | 1,124 | |
Vera Bradley, Inc.† | | | 169 | | | | 1,071 | |
Winmark Corp. | | | 25 | | | | 4,235 | |
| | | | | | |
|
|
|
| | | | | | | | 63,938 | |
| | | | | | |
|
|
|
Retail-Appliances — 0.0% | |
Conn’s, Inc.† | | | 144 | | | | 1,349 | |
| | | | | | |
|
|
|
Retail-Arts & Crafts — 0.0% | |
Michaels Cos., Inc.† | | | 614 | | | | 4,980 | |
| | | | | | |
|
|
|
Retail-Automobile — 0.3% | |
America’s Car-Mart, Inc.† | | | 52 | | | | 4,499 | |
Asbury Automotive Group, Inc.† | | | 159 | | | | 16,374 | |
Group 1 Automotive, Inc. | | | 144 | | | | 15,275 | |
Lithia Motors, Inc., Class A | | | 210 | | | | 48,210 | |
Rush Enterprises, Inc., Class A | | | 337 | | | | 12,078 | |
Rush Enterprises, Inc., Class B | | | 55 | | | | 1,730 | |
Sonic Automotive, Inc., Class A | | | 197 | | | | 7,104 | |
| | | | | | |
|
|
|
| | | | | | | | 105,270 | |
| | | | | | |
|
|
|
Retail-Bedding — 0.1% | |
Bed Bath & Beyond, Inc. | | | 1,046 | | | | 20,711 | |
| | | | | | |
|
|
|
Retail-Building Products — 0.7% | |
Aspen Aerogels, Inc.† | | | 169 | | | | 1,910 | |
At Home Group, Inc.† | | | 442 | | | | 7,200 | |
Beacon Roofing Supply, Inc.† | | | 450 | | | | 13,815 | |
BMC Stock Holdings, Inc.† | | | 554 | | | | 21,933 | |
Foundation Building Materials, Inc.† | | | 13,570 | | | | 197,579 | |
GMS, Inc.† | | | 343 | | | | 7,752 | |
| | | | | | |
|
|
|
| | | | | | | | 250,189 | |
| | | | | | |
|
|
|
Retail-Computer Equipment — 0.0% | |
PC Connection, Inc. | | | 91 | | | | 4,145 | |
| | | | | | |
|
|
|
Retail-Discount — 0.2% | |
Big Lots, Inc. | | | 324 | | | | 15,422 | |
BJ’s Wholesale Club Holdings, Inc.† | | | 1,129 | | | | 43,230 | |
Citi Trends, Inc. | | | 82 | | | | 2,141 | |
| | | | | | |
|
|
|
| | | | | | | | 60,793 | |
| | | | | | |
|
|
|
Retail-Drug Store — 0.0% | |
OptimizeRx Corp.† | | | 120 | | | | 2,376 | |
Rite Aid Corp.† | | | 451 | | | | 4,122 | |
| | | | | | |
|
|
|
| | | | | | | | 6,498 | |
| | | | | | |
|
|
|
Retail-Floor Coverings — 0.0% | |
Lumber Liquidators Holdings, Inc.† | | | 235 | | | | 5,198 | |
| | | | | | |
|
|
|
Retail-Gardening Products — 0.0% | |
GrowGeneration Corp.† | | | 295 | | | | 4,926 | |
| | | | | | |
|
|
|
SunAmerica Specialty Series — AIG Small-Cap Fund
PORTFOLIO OF INVESTMENTS — October 31, 2020 — (continued)
| | | | | | | | |
| Security Description | | Shares | | |
Value
(Note 3) | |
|
|
COMMON STOCKS (continued) | |
Retail-Hair Salons — 0.0% | | | | | |
Regis Corp.† | | | 194 | | | $ | 1,075 | |
| | | | | | |
|
|
|
Retail-Home Furnishings — 0.2% | |
Haverty Furniture Cos., Inc. | | | 139 | | | | 3,478 | |
La-Z-Boy, Inc. | | | 367 | | | | 12,562 | |
Lovesac Co.† | | | 81 | | | | 2,085 | |
RH† | | | 128 | | | | 42,910 | |
| | | | | | |
|
|
|
| | | | | | | | 61,035 | |
| | | | | | |
|
|
|
Retail-Jewelry — 0.0% | |
Envela Corp.† | | | 64 | | | | 259 | |
Movado Group, Inc. | | | 130 | | | | 1,418 | |
Signet Jewelers, Ltd. | | | 430 | | | | 9,580 | |
| | | | | | |
|
|
|
| | | | | | | | 11,257 | |
| | | | | | |
|
|
|
Retail-Leisure Products — 0.0% | |
MarineMax, Inc.† | | | 170 | | | | 5,097 | |
| | | | | | |
|
|
|
Retail-Misc./Diversified — 0.1% | |
Container Store Group, Inc.† | | | 161 | | | | 1,533 | |
Gaia, Inc.† | | | 100 | | | | 1,014 | |
GameStop Corp., Class A† | | | 472 | | | | 4,942 | |
Hudson, Ltd., Class A† | | | 327 | | | | 2,498 | |
PriceSmart, Inc. | | | 188 | | | | 12,972 | |
Sally Beauty Holdings, Inc.† | | | 930 | | | | 7,784 | |
| | | | | | |
|
|
|
| | | | | | | | 30,743 | |
| | | | | | |
|
|
|
Retail-Office Supplies — 0.0% | |
ODP Corp. | | | 431 | | | | 8,404 | |
| | | | | | |
|
|
|
Retail-Pawn Shops — 0.1% | |
FirstCash, Inc. | | | 335 | | | | 17,433 | |
| | | | | | |
|
|
|
Retail-Pet Food & Supplies — 0.7% | |
Freshpet, Inc.† | | | 319 | | | | 36,526 | |
PetMed Express, Inc. | | | 7,087 | | | | 209,633 | |
| | | | | | |
|
|
|
| | | | | | | | 246,159 | |
| | | | | | |
|
|
|
Retail-Petroleum Products — 0.0% | |
World Fuel Services Corp. | | | 515 | | | | 10,841 | |
| | | | | | |
|
|
|
Retail-Regional Department Stores — 0.1% | |
Dillard’s, Inc., Class A | | | 62 | | | | 2,773 | |
Macy’s, Inc. | | | 2,575 | | | | 15,991 | |
| | | | | | |
|
|
|
| | | | | | | | 18,764 | |
| | | | | | |
|
|
|
Retail-Restaurants — 1.3% | |
Biglari Holdings, Inc., Class A† | | | 1 | | | | 437 | |
Biglari Holdings, Inc., Class B† | | | 8 | | | | 670 | |
BJ’s Restaurants, Inc. | | | 182 | | | | 5,134 | |
Bloomin’ Brands, Inc. | | | 722 | | | | 10,094 | |
Brinker International, Inc. | | | 370 | | | | 16,110 | |
Cannae Holdings, Inc.† | | | 711 | | | | 26,293 | |
Carrols Restaurant Group, Inc.† | | | 291 | | | | 1,702 | |
Cheesecake Factory, Inc. | | | 350 | | | | 10,402 | |
Chuy’s Holdings, Inc.† | | | 162 | | | | 3,400 | |
Cracker Barrel Old Country Store, Inc. | | | 196 | | | | 22,309 | |
Dave & Buster’s Entertainment, Inc. | | | 364 | | | | 6,246 | |
Del Taco Restaurants, Inc.† | | | 27,697 | | | | 205,373 | |
Denny’s Corp.† | | | 512 | | | | 4,588 | |
Dine Brands Global, Inc. | | | 128 | | | | 6,586 | |
El Pollo Loco Holdings, Inc.† | | | 151 | | | | 2,132 | |
|
|
Retail-Restaurants (continued) | |
Fiesta Restaurant Group, Inc.† | | | 148 | | | | 1,279 | |
Jack in the Box, Inc. | | | 187 | | | | 14,971 | |
Kura Sushi USA, Inc., Class A† | | | 28 | | | | 360 | |
Noodles & Co.† | | | 258 | | | | 1,667 | |
Papa John’s International, Inc. | | | 270 | | | | 20,682 | |
Red Robin Gourmet Burgers, Inc.† | | | 128 | | | | 1,541 | |
Ruth’s Hospitality Group, Inc. | | | 267 | | | | 2,985 | |
Shake Shack, Inc., Class A† | | | 289 | | | | 19,513 | |
Texas Roadhouse, Inc. | | | 542 | | | | 37,956 | |
Waitr Holdings, Inc.† | | | 690 | | | | 1,759 | |
Wingstop, Inc. | | | 244 | | | | 28,385 | |
| | | | | | |
|
|
|
| | | | | | | | 452,574 | |
| | | | | | |
|
|
|
Retail-Sporting Goods — 0.6% | |
Hibbett Sports, Inc.† | | | 136 | | | | 5,142 | |
Sportsman’s Warehouse Holdings, Inc.† | | | 14,985 | | | | 195,105 | |
Zumiez, Inc.† | | | 173 | | | | 4,844 | |
| | | | | | |
|
|
|
| | | | | | | | 205,091 | |
| | | | | | |
|
|
|
Retail-Vision Service Center — 0.1% | |
National Vision Holdings, Inc.† | | | 663 | | | | 26,739 | |
| | | | | | |
|
|
|
Retirement/Aged Care — 0.0% | |
Brookdale Senior Living, Inc.† | | | 1,514 | | | | 4,451 | |
Five Star Senior Living, Inc.† | | | 156 | | | | 713 | |
| | | | | | |
|
|
|
| | | | | | | | 5,164 | |
| | | | | | |
|
|
|
Rubber-Tires — 0.1% | |
Cooper Tire & Rubber Co. | | | 416 | | | | 14,306 | |
Goodyear Tire & Rubber Co. | | | 1,906 | | | | 15,782 | |
| | | | | | |
|
|
|
| | | | | | | | 30,088 | |
| | | | | | |
|
|
|
Rubber/Plastic Products — 0.1% | |
Myers Industries, Inc. | | | 296 | | | | 4,245 | |
Proto Labs, Inc.† | | | 220 | | | | 25,978 | |
Raven Industries, Inc. | | | 294 | | | | 6,444 | |
Trinseo SA | | | 316 | | | | 10,055 | |
| | | | | | |
|
|
|
| | | | | | | | 46,722 | |
| | | | | | |
|
|
|
Satellite Telecom — 0.1% | |
Gogo, Inc.† | | | 455 | | | | 3,658 | |
Iridium Communications, Inc.† | | | 970 | | | | 25,618 | |
KVH Industries, Inc.† | | | 138 | | | | 1,199 | |
Loral Space & Communications, Inc. | | | 106 | | | | 1,846 | |
| | | | | | |
|
|
|
| | | | | | | | 32,321 | |
| | | | | | |
|
|
|
Savings & Loans/Thrifts — 0.5% | |
Axos Financial, Inc.† | | | 477 | | | | 13,003 | |
Banc of California, Inc. | | | 368 | | | | 4,416 | |
BankFinancial Corp. | | | 109 | | | | 801 | |
Berkshire Hills Bancorp, Inc. | | | 369 | | | | 4,808 | |
Brookline Bancorp, Inc. | | | 639 | | | | 6,122 | |
Capitol Federal Financial, Inc. | | | 1,094 | | | | 12,559 | |
Community Bankers Trust Corp. | | | 180 | | | | 983 | |
Dime Community Bancshares, Inc. | | | 236 | | | | 2,985 | |
Eagle Bancorp Montana, Inc. | | | 52 | | | | 1,001 | |
ESSA Bancorp, Inc. | | | 75 | | | | 953 | |
First Capital, Inc. | | | 27 | | | | 1,628 | |
First Savings Financial Group, Inc. | | | 15 | | | | 811 | |
Flushing Financial Corp. | | | 222 | | | | 2,839 | |
FS Bancorp, Inc. | | | 31 | | | | 1,436 | |
SunAmerica Specialty Series — AIG Small-Cap Fund
PORTFOLIO OF INVESTMENTS — October 31, 2020 — (continued)
| | | | | | | | |
| Security Description | | Shares | | |
Value
(Note 3) | |
|
|
COMMON STOCKS (continued) | �� |
Savings & Loans/Thrifts (continued) | |
Greene County Bancorp, Inc. | | | 25 | | | $ | 564 | |
Hingham Institution for Savings | | | 12 | | | | 2,424 | |
Home Bancorp, Inc. | | | 63 | | | | 1,590 | |
HomeTrust Bancshares, Inc. | | | 129 | | | | 2,060 | |
Investors Bancorp, Inc. | | | 1,902 | | | | 16,091 | |
Meridian Bancorp, Inc. | | | 386 | | | | 4,806 | |
Northfield Bancorp, Inc. | | | 393 | | | | 3,993 | |
Northwest Bancshares, Inc. | | | 967 | | | | 10,318 | |
OceanFirst Financial Corp. | | | 489 | | | | 7,320 | |
Oconee Federal Financial Corp. | | | 9 | | | | 203 | |
Pacific Premier Bancorp, Inc. | | | 659 | | | | 16,804 | |
Provident Financial Holdings, Inc. | | | 49 | | | | 620 | |
Provident Financial Services, Inc. | | | 592 | | | | 8,033 | |
Prudential Bancorp, Inc. | | | 66 | | | | 765 | |
Riverview Bancorp, Inc. | | | 174 | | | | 816 | |
Southern Missouri Bancorp, Inc. | | | 63 | | | | 1,605 | |
Territorial Bancorp, Inc. | | | 65 | | | | 1,379 | |
Timberland Bancorp, Inc. | | | 61 | | | | 1,162 | |
Washington Federal, Inc. | | | 623 | | | | 13,264 | |
Waterstone Financial, Inc. | | | 185 | | | | 3,123 | |
WSFS Financial Corp. | | | 414 | | | | 13,120 | |
| | | | | | |
|
|
|
| | | | | | | | 164,405 | |
| | | | | | |
|
|
|
Schools — 0.2% | |
Adtalem Global Education, Inc.† | | | 429 | | | | 10,056 | |
American Public Education, Inc.† | | | 119 | | | | 3,364 | |
Aspen Group, Inc.† | | | 156 | | | | 1,463 | |
K12, Inc.† | | | 329 | | | | 7,853 | |
Laureate Education, Inc., Class A† | | | 887 | | | | 11,531 | |
Perdoceo Education Corp.† | | | 571 | | | | 6,447 | |
Strategic Education, Inc. | | | 199 | | | | 16,529 | |
Universal Technical Institute, Inc.† | | | 238 | | | | 1,092 | |
| | | | | | |
|
|
|
| | | | | | | | 58,335 | |
| | | | | | |
|
|
|
Security Services — 0.1% | |
Brink’s Co. | | | 414 | | | | 17,732 | |
| | | | | | |
|
|
|
Semiconductor Components-Integrated Circuits — 0.1% | |
MaxLinear, Inc.† | | | 557 | | | | 14,727 | |
Power Integrations, Inc. | | | 486 | | | | 29,262 | |
| | | | | | |
|
|
|
| | | | | | | | 43,989 | |
| | | | | | |
|
|
|
Semiconductor Equipment — 0.8% | |
Axcelis Technologies, Inc.† | | | 274 | | | | 6,047 | |
Brooks Automation, Inc. | | | 599 | | | | 27,973 | |
CMC Materials, Inc. | | | 239 | | | | 33,984 | |
Cohu, Inc. | | | 339 | | | | 7,367 | |
FormFactor, Inc.† | | | 637 | | | | 18,059 | |
Onto Innovation, Inc.† | | | 391 | | | | 12,539 | |
Ultra Clean Holdings, Inc.† | | | 8,108 | | | | 172,619 | |
Veeco Instruments, Inc.† | | | 401 | | | | 5,105 | |
| | | | | | |
|
|
|
| | | | | | | | 283,693 | |
| | | | | | |
|
|
|
Software Tools — 0.1% | |
Digital Turbine, Inc.† | | | 679 | | | | 19,460 | |
| | | | | | |
|
|
|
Steel Pipe & Tube — 0.1% | | | | | |
Advanced Drainage Systems, Inc. | | | 458 | | | | 29,051 | |
Northwest Pipe Co.† | | | 79 | | | | 2,117 | |
|
|
Steel Pipe & Tube (continued) | | | | | |
Omega Flex, Inc. | | | 24 | | | $ | 3,593 | |
TimkenSteel Corp.† | | | 371 | | | | 1,436 | |
| | | | | | |
|
|
|
| | | | | | | | 36,197 | |
| | | | | | |
|
|
|
Steel-Producers — 0.1% | |
Carpenter Technology Corp. | | | 392 | | | | 6,852 | |
Commercial Metals Co. | | | 981 | | | | 20,258 | |
Schnitzer Steel Industries, Inc., Class A | | | 213 | | | | 4,473 | |
United States Steel Corp. | | | 1,807 | | | | 17,455 | |
| | | | | | |
|
|
|
| | | | | | | | 49,038 | |
| | | | | | |
|
|
|
Steel-Specialty — 0.0% | |
Allegheny Technologies, Inc.† | | | 1,046 | | | | 9,634 | |
| | | | | | |
|
|
|
Superconductor Product & Systems — 0.0% | |
American Superconductor Corp.† | | | 185 | | | | 2,573 | |
| | | | | | |
|
|
|
SupraNational Banks — 0.0% | |
Banco Latinoamericano de Comercio Exterior SA, Class E | | | 255 | | | | 3,261 | |
| | | | | | |
|
|
|
Telecom Equipment-Fiber Optics — 0.0% | |
Clearfield, Inc.† | | | 92 | | | | 1,926 | |
| | | | | | |
|
|
|
Telecom Services — 0.8% | |
ATN International, Inc. | | | 92 | | | | 4,112 | |
Consolidated Communications Holdings, Inc.† | | | 600 | | | | 2,802 | |
GTT Communications, Inc.† | | | 263 | | | | 970 | |
HC2 Holdings, Inc.† | | | 312 | | | | 671 | |
Ooma, Inc.† | | | 16,037 | | | | 226,282 | |
ORBCOMM, Inc.† | | | 610 | | | | 2,623 | |
Rackspace Technology, Inc.† | | | 279 | | | | 4,394 | |
Spok Holdings, Inc. | | | 146 | | | | 1,326 | |
Vonage Holdings Corp.† | | | 1,910 | | | | 20,208 | |
| | | | | | |
|
|
|
| | | | | | | | 263,388 | |
| | | | | | |
|
|
|
Telecommunication Equipment — 0.5% | |
Acacia Communications, Inc.† | | | 321 | | | | 21,744 | |
ADTRAN, Inc. | | | 394 | | | | 4,212 | |
DZS, Inc.† | | | 99 | | | | 1,128 | |
Harmonic, Inc.† | | | 783 | | | | 4,651 | |
PC-Tel, Inc. | | | 25,429 | | | | 129,688 | |
Plantronics, Inc. | | | 282 | | | | 5,505 | |
Preformed Line Products Co. | | | 25 | | | | 1,376 | |
Viavi Solutions, Inc.† | | | 1,884 | | | | 23,267 | |
| | | | | | |
|
|
|
| | | | | | | | 191,571 | |
| | | | | | |
|
|
|
Telephone-Integrated — 0.1% | |
Alaska Communications Systems Group, Inc. | | | 428 | | | | 818 | |
Cincinnati Bell, Inc.† | | | 413 | | | | 6,216 | |
IDT Corp., Class B† | | | 125 | | | | 1,191 | |
Shenandoah Telecommunications Co. | | | 397 | | | | 17,317 | |
| | | | | | |
|
|
|
| | | | | | | | 25,542 | |
| | | | | | |
|
|
|
Television — 0.1% | |
AMC Networks, Inc., Class A† | | | 319 | | | | 6,779 | |
Gray Television, Inc.† | | | 716 | | | | 9,079 | |
Sinclair Broadcast Group, Inc., Class A | | | 364 | | | | 6,763 | |
| | | | | | |
|
|
|
| | | | | | | | 22,621 | |
| | | | | | |
|
|
|
SunAmerica Specialty Series — AIG Small-Cap Fund
PORTFOLIO OF INVESTMENTS — October 31, 2020 — (continued)
| | | | | | | | |
| Security Description | | Shares | | |
Value
(Note 3) | |
|
|
COMMON STOCKS (continued) | |
Textile-Apparel — 0.0% | | | | | |
Unifi, Inc.† | | | 113 | | | $ | 1,694 | |
| | | | | | |
|
|
|
Theaters — 0.0% | |
AMC Entertainment Holdings, Inc., Class A | | | 429 | | | | 1,013 | |
Cinemark Holdings, Inc. | | | 881 | | | | 7,215 | |
| | | | | | |
|
|
|
| | | | | | | | 8,228 | |
| | | | | | |
|
|
|
Therapeutics — 0.5% | |
Akebia Therapeutics, Inc.† | | | 1,181 | | | | 2,622 | |
Anika Therapeutics, Inc.† | | | 115 | | | | 3,751 | |
Axsome Therapeutics, Inc.† | | | 228 | | | | 15,119 | |
CorMedix, Inc.† | | | 254 | | | | 1,283 | |
Fennec Pharmaceuticals, Inc.† | | | 18,288 | | | | 138,257 | |
Flexion Therapeutics, Inc.† | | | 361 | | | | 4,328 | |
G1 Therapeutics, Inc.† | | | 281 | | | | 3,088 | |
La Jolla Pharmaceutical Co.† | | | 149 | | | | 507 | |
MannKind Corp.† | | | 1,816 | | | | 3,650 | |
Recro Pharma, Inc.† | | | 160 | | | | 254 | |
| | | | | | |
|
|
|
| | | | | | | | 172,859 | |
| | | | | | |
|
|
|
Tobacco — 1.1% | |
Greenlane Holdings, Inc., Class A† | | | 85 | | | | 207 | |
Turning Point Brands, Inc. | | | 9,426 | | | | 353,192 | |
Universal Corp. | | | 200 | | | | 7,970 | |
Vector Group, Ltd. | | | 1,152 | | | | 10,587 | |
| | | | | | |
|
|
|
| | | | | | | | 371,956 | |
| | | | | | |
|
|
|
Toys — 0.0% | |
Funko, Inc., Class A† | | | 201 | | | | 1,274 | |
| | | | | | |
|
|
|
Traffic Management Sys — 0.0% | |
Arlo Technologies, Inc.† | | | 646 | | | | 2,881 | |
| | | | | | |
|
|
|
Transactional Software — 0.0% | |
Synchronoss Technologies, Inc.† | | | 338 | | | | 936 | |
| | | | | | |
|
|
|
Transport-Air Freight — 1.0% | |
Air Transport Services Group, Inc.† | | | 12,216 | | | | 342,537 | |
Atlas Air Worldwide Holdings, Inc.† | | | 212 | | | | 12,542 | |
| | | | | | |
|
|
|
| | | | | | | | 355,079 | |
| | | | | | |
|
|
|
Transport-Equipment & Leasing — 0.1% | |
GATX Corp. | | | 287 | | | | 19,596 | |
General Finance Corp.† | | | 87 | | | | 570 | |
Greenbrier Cos., Inc. | | | 266 | | | | 7,177 | |
Willis Lease Finance Corp.† | | | 24 | | | | 509 | |
| | | | | | |
|
|
|
| | | | | | | | 27,852 | |
| | | | | | |
|
|
|
Transport-Marine — 0.7% | |
Ardmore Shipping Corp. | | | 277 | | | | 776 | |
Costamare, Inc. | | | 409 | | | | 2,327 | |
DHT Holdings, Inc. | | | 919 | | | | 4,420 | |
Diamond S Shipping, Inc.† | | | 226 | | | | 1,279 | |
Dorian LPG, Ltd.† | | | 26,190 | | | | 214,758 | |
Eagle Bulk Shipping, Inc.† | | | 52 | | | | 716 | |
Frontline, Ltd. | | | 973 | | | | 5,264 | |
Genco Shipping & Trading, Ltd. | | | 141 | | | | 911 | |
Golar LNG, Ltd.† | | | 751 | | | | 5,670 | |
International Seaways, Inc. | | | 198 | | | | 2,681 | |
Nordic American Tankers, Ltd. | | | 1,189 | | | | 3,460 | |
Overseas Shipholding Group, Inc., Class A† | | | 544 | | | | 1,039 | |
|
|
Transport-Marine (continued) | |
Pangaea Logistics Solutions, Ltd. | | | 87 | | | | 232 | |
Safe Bulkers, Inc.† | | | 428 | | | | 379 | |
Scorpio Bulkers, Inc. | | | 74 | | | | 813 | |
Scorpio Tankers, Inc. | | | 422 | | | | 3,722 | |
SEACOR Holdings, Inc.† | | | 158 | | | | 4,840 | |
SFL Corp., Ltd. | | | 796 | | | | 5,182 | |
Tidewater, Inc.† | | | 333 | | | | 1,951 | |
| | | | | | |
|
|
|
| | | | | | | | 260,420 | |
| | | | | | |
|
|
|
Transport-Services — 0.7% | |
Bristow Group, Inc.† | | | 54 | | | | 1,122 | |
CryoPort, Inc.† | | | 281 | | | | 11,279 | |
Daseke, Inc.† | | | 376 | | | | 2,470 | |
Echo Global Logistics, Inc.† | | | 216 | | | | 5,826 | |
Forward Air Corp. | | | 229 | | | | 14,420 | |
Hub Group, Inc., Class A† | | | 270 | | | | 13,535 | |
Matson, Inc. | | | 353 | | | | 18,339 | |
Radiant Logistics, Inc.† | | | 323 | | | | 1,660 | |
Universal Logistics Holdings, Inc. | | | 8,692 | | | | 171,493 | |
| | | | | | |
|
|
|
| | | | | | | | 240,144 | |
| | | | | | |
|
|
|
Transport-Truck — 0.7% | |
ArcBest Corp. | | | 208 | | | | 6,348 | |
Covenant Logistics Group, Inc.† | | | 96 | | | | 1,322 | |
Heartland Express, Inc. | | | 402 | | | | 7,361 | |
Marten Transport, Ltd. | | | 488 | | | | 7,488 | |
P.A.M. Transportation Services, Inc.† | | | 15 | | | | 594 | |
Saia, Inc.† | | | 217 | | | | 32,042 | |
US Xpress Enterprises, Inc., Class A† | | | 183 | | | | 1,320 | |
USA Truck, Inc.† | | | 18,855 | | | | 161,587 | |
Werner Enterprises, Inc. | | | 502 | | | | 19,086 | |
| | | | | | |
|
|
|
| | | | | | | | 237,148 | |
| | | | | | |
|
|
|
Travel Services — 0.0% | |
Liberty TripAdvisor Holdings, Inc., Class A† | | | 599 | | | | 1,066 | |
| | | | | | |
|
|
|
Venture Capital — 0.0% | |
Safeguard Scientifics, Inc. | | | 161 | | | | 937 | |
| | | | | | |
|
|
|
Veterinary Diagnostics — 0.1% | |
Heska Corp.† | | | 57 | | | | 6,688 | |
Neogen Corp.† | | | 435 | | | | 30,337 | |
| | | | | | |
|
|
|
| | | | | | | | 37,025 | |
| | | | | | |
|
|
|
Vitamins & Nutrition Products — 0.0% | |
Calyxt, Inc.† | | | 85 | | | | 273 | |
LifeVantage Corp.† | | | 113 | | | | 1,248 | |
Nature’s Sunshine Products, Inc.† | | | 73 | | | | 761 | |
USANA Health Sciences, Inc.† | | | 95 | | | | 7,187 | |
| | | | | | |
|
|
|
| | | | | | | | 9,469 | |
| | | | | | |
|
|
|
Water — 0.8% | |
American States Water Co. | | | 304 | | | | 22,706 | |
Artesian Resources Corp., Class A | | | 66 | | | | 2,325 | |
California Water Service Group | | | 408 | | | | 18,185 | |
Consolidated Water Co., Ltd. | | | 119 | | | | 1,197 | |
Global Water Resources, Inc. | | | 105 | | | | 1,113 | |
Middlesex Water Co. | | | 141 | | | | 9,044 | |
PICO Holdings, Inc.† | | | 139 | | | | 1,150 | |
SJW Group | | | 218 | | | | 13,230 | |
SunAmerica Specialty Series — AIG Small-Cap Fund
PORTFOLIO OF INVESTMENTS — October 31, 2020 — (continued)
| | | | | | | | |
| Security Description | | Shares | | |
Value
(Note 3) | |
|
|
COMMON STOCKS (continued) | |
Water (continued) | |
York Water Co. | | | 4,977 | | | $ | 210,278 | |
| | | | | | |
|
|
|
| | | | | | | | 279,228 | |
| | | | | | |
|
|
|
Water Treatment Systems — 0.6% | |
Energy Recovery, Inc.† | | | 331 | | | | 3,207 | |
Pure Cycle Corp.† | | | 24,645 | | | | 216,876 | |
| | | | | | |
|
|
|
| | | | | | | | 220,083 | |
| | | | | | |
|
|
|
Web Hosting/Design — 0.2% | |
Endurance International Group Holdings, Inc.† | | | 545 | | | | 3,167 | |
NIC, Inc. | | | 543 | | | | 12,174 | |
Q2 Holdings, Inc.† | | | 409 | | | | 37,317 | |
| | | | | | |
|
|
|
| | | | | | | | 52,658 | |
| | | | | | |
|
|
|
Wire & Cable Products — 0.1% | |
Belden, Inc. | | | 364 | | | | 11,241 | |
Encore Wire Corp. | | | 168 | | | | 7,763 | |
Insteel Industries, Inc. | | | 153 | | | | 3,329 | |
| | | | | | |
|
|
|
| | | | | | | | 22,333 | |
| | | | | | |
|
|
|
Wireless Equipment — 0.1% | |
Anterix, Inc.† | | | 90 | | | | 2,873 | |
CalAmp Corp.† | | | 276 | | | | 1,954 | |
Casa Systems, Inc.† | | | 261 | | | | 1,088 | |
InterDigital, Inc. | | | 254 | | | | 14,219 | |
Maxar Technologies, Inc. | | | 504 | | | | 12,988 | |
Powerfleet, Inc.† | | | 235 | | | | 1,422 | |
Resonant, Inc.† | | | 413 | | | | 946 | |
Ribbon Communications, Inc.† | | | 562 | | | | 2,422 | |
| | | | | | |
|
|
|
| | | | | | | | 37,912 | |
| | | | | | |
|
|
|
X-Ray Equipment — 0.0% | |
Varex Imaging Corp.† | | | 315 | | | | 4,221 | |
ViewRay, Inc.† | | | 919 | | | | 2,729 | |
| | | | | | |
|
|
|
| | | | | | | | 6,950 | |
| | | | | | |
|
|
|
Total Common Stocks | | | | | | | | |
(cost $32,738,223) | | | | | | | 34,052,816 | |
| | | |
|
|
|
EXCHANGE-TRADED FUNDS — 0.4% | |
iShares Russell 2000 ETF
(cost $98,038) | | | 780 | | | | 119,410 | |
| | | | | | |
|
|
|
RIGHTS† — 0.0% | |
Silver Mining — 0.0% | |
Pan American Silver Corp. CVR†
Expires 02/22/2029 | | | 3,628 | | | | 2,612 | |
| | | | | | |
|
|
|
Telecom Services — 0.0% | | | | | |
HC2 Holdings, Inc.
Expires 11/20/2020
(Strike price $2.27) | | | 312 | | | | 0 | |
| | | | | | |
|
|
|
(cost $1,129) | | | | | | | 2,612 | |
| | | | | | |
|
|
|
|
|
WARRANTS† — 0.0% | | | | | |
Oil Companies-Exploration & Production — 0.0% | |
Whiting Petroleum Corp.,
Series A | | | 39 | | | $ | 111 | |
Whiting Petroleum Corp.,
Series B | | | 19 | | | | 57 | |
| | | | | | |
|
|
|
(cost $0) | | | | | | | 168 | |
| | | |
|
|
|
Total Long-Term Investment Securities | | | | | | | | |
(cost $32,837,390) | | | | | | | 34,175,006 | |
| | | |
|
|
|
SHORT-TERM INVESTMENT SECURITIES — 0.4% | | | | | |
U.S. Government Treasuries — 0.4% | |
United States Treasury Bills
0.15% due 06/17/2021(2) | | $ | 100,000 | | | | 99,935 | |
0.17% due 05/20/2021(2) | | | 50,000 | | | | 49,972 | |
| | | | | | |
|
|
|
Total Short-Term Investment Securities | | | | | | | | |
(cost $149,856) | | | | | | | 149,907 | |
| | | |
|
|
|
REPURCHASE AGREEMENTS — 2.1% | |
Agreement with Fixed Income Clearing Corp., bearing interest at 0.00% dated 10/30/2020, to be repurchased 11/02/2020 in the amount of $750,000 and collateralized by $767,700 of United States Treasury Notes, bearing interest at 0.25% due 06/30/2025 and having an approximate value of $765,097
(cost $750,000) | | | 750,000 | | | | 750,000 | |
| | | | | | |
|
|
|
TOTAL INVESTMENTS | | | | | | | | |
(cost $33,737,246)(3) | | | 100.0 | % | | | 35,074,913 | |
Other assets less liabilities | | | 0.0 | | | | 2,044 | |
| | |
|
|
| |
|
|
|
NET ASSETS | | | 100.0 | % | | $ | 35,076,957 | |
| | |
|
|
| |
|
|
|
| † | Non-income producing security |
| * | Securities exempt from registration under Rule 144A of the Securities Act of 1933. These securities may be sold in transactions exempt from registration, normally to qualified institutional buyers. The Fund has no right to demand registration of these securities. At October 31, 2020, the aggregate value of these securities was $16,620 representing 0.0% of net assets. |
| (1) | Securities classified as Level 3 (see Note 3). |
| (2) | The security or a portion thereof was pledged as collateral to cover margin requirements for open futures contracts. |
| (3) | See Note 6 for cost of investments on a tax basis. |
CVR — Contingent Value Rights
ETF — Exchange Traded Fund
| | | | | | | | | | | | | | | | | | | | |
Futures Contracts
| |
Number of
Contracts
| | Type
| | Description
| | Expiration Month
| | | Notional
Basis*
| | | Notional
Value*
| | | Unrealized
Appreciation
(Depreciation)
| |
| 11 | | Long | | E-Mini Russell 2000 Index | | | December 2020 | | | $ | 842,618 | | | $ | 845,240 | | | $ | 2,622 | |
| | | | | | | | | | | | | | | | | | |
|
|
|
| * | Notional basis refers to the contractual amount agreed upon at inception of the open contract; notional value represents the current value of the open contract. |
SunAmerica Specialty Series — AIG Small-Cap Fund
PORTFOLIO OF INVESTMENTS — October 31, 2020 — (continued)
The following is a summary of the inputs used to value the Fund’s net assets as of October 31, 2020 (see Note 3):
| | | | | | | | | | | | | | | | |
| | | Level 1 — Unadjusted
Quoted Prices
| | | Level 2 — Other
Observable Inputs
| | | Level 3 — Significant
Unobservable Inputs
| | | Total
| |
ASSETS: | | | | | | | | | | | | | | | | |
Investments at Value:* | | | | | | | | | | | | | | | | |
| | | | |
Common Stocks: | | | | | | | | | | | | | | | | |
Chemicals-Diversified | | $ | 75,500 | | | $ | — | | | $ | 0 | | | $ | 75,500 | |
Finance-Commercial | | | 26,508 | | | | — | | | | 194 | | | | 26,702 | |
Medical-Biomedical/Gene | | | 2,355,657 | | | | — | | | | 637 | | | | 2,356,294 | |
Medical-Drugs | | | 763,484 | | | | — | | | | 0 | | | | 763,484 | |
Metal-Diversified | | | — | | | | — | | | | 0 | | | | 0 | |
Multimedia | | | 5,082 | | | | — | | | | 0 | | | | 5,082 | |
Other Industries | | | 30,825,754 | | | | — | | | | — | | | | 30,825,754 | |
Exchange-Traded Funds | | | 119,410 | | | | — | | | | — | | | | 119,410 | |
Rights | | | 2,612 | | | | 0 | | | | — | | | | 2,612 | |
Warrants | | | 168 | | | | — | | | | — | | | | 168 | |
Short-Term Investments Securities | | | — | | | | 149,907 | | | | — | | | | 149,907 | |
Repurchase Agreements | | | — | | | | 750,000 | | | | — | | | | 750,000 | |
| | |
|
|
| |
|
|
| |
|
|
| |
|
|
|
Total Investments at Value | | $ | 34,174,175 | | | $ | 899,907 | | | $ | 831 | | | $ | 35,074,913 | |
| | |
|
|
| |
|
|
| |
|
|
| |
|
|
|
Other Financial Instruments:† | | | | | | | | | | | | | | | | |
Futures Contracts | | $ | 2,622 | | | $ | — | | | $ | — | | | $ | 2,622 | |
| | |
|
|
| |
|
|
| |
|
|
| |
|
|
|
| * | | For a detailed presentation of investments, please refer to the Portfolio of Investments. |
| † | | Amounts represent unrealized appreciation/depreciation as of the end of the reporting period. |
At the beginning and end of the reporting period, Level 3 investments in securities were not considered a material portion of the Fund. There were no material Level 3 transfers during the reporting period.
See Notes to Financial Statements
SunAmerica Specialty Series
NOTES TO FINANCIAL STATEMENTS — October 31, 2020
Note 1. Organization
SunAmerica Specialty Series (the “Trust”) is registered under the Investment Company Act of 1940, as amended (the “1940 Act”), as an open-end management investment company and is organized as a Delaware Statutory Trust. The Trust consists of six different investment funds (each a “Fund” and collectively, the “Funds”) as of October 31, 2020. Each Fund is managed by SunAmerica Asset Management, LLC (the “Adviser” or “SunAmerica”). An investor may invest in one or more of the following Funds: AIG Commodity Strategy Fund (the “Commodity Strategy Fund”), AIG ESG Dividend Fund (the “ESG Dividend Fund”), AIG Focused Alpha Large-Cap Fund (the “Focused Alpha Large-Cap Fund”), AIG Focused Growth Fund (the “Focused Growth Fund”), AIG Income Explorer Fund (the “Income Explorer Fund”) and AIG Small-Cap Fund (“the Small-Cap Fund”).
The Funds are considered to be separate entities for financial and tax reporting purposes. The investment objective and principal investment techniques for each Fund are as follows:
The Commodity Strategy Fund seeks to provide long-term total return through a strategy that is designed to provide diversified exposure to the commodities markets. The Fund seeks to achieve its investment goal by investing its assets in a combination of commodity-linked derivative instruments and fixed income securities.
The ESG Dividend Fund seeks to provide total return including capital appreciation and current income, employing a “buy and hold” strategy with up to forty dividend yielding equity securities selected annually from the Russell 1000® Index that meet the Fund’s ESG standards.
The Focused Alpha Large-Cap Fund seeks to provide growth of capital through active trading of equity securities to achieve a blend of growth companies, value companies and companies that have elements of growth and value, issued by large-cap companies. Under normal market conditions, the Fund will invest at least 80% of its net assets, plus any borrowing for investment purposes, in large-cap companies.
The Focused Growth Fund seeks to provide growth of capital through active trading of equity securities of large, small and mid-cap companies.
The Income Explorer Fund seeks to provide high current income with a secondary objective of capital appreciation primarily by strategically allocating its assets among a preferred securities enhanced index strategy, real estate investment trust (“REIT”) strategy and global dividend equity strategy. Through this combination of investments, the Fund expects to gain exposure to a broad range of income-producing investments, including both fixed income and equity securities.
The Small-Cap Fund seeks to provide long-term growth of capital by strategically allocating its assets between a small-cap index strategy and a micro-cap growth strategy.
Each Fund, except for the Focused Alpha Large-Cap Fund and Focused Growth Fund, is a “diversified” Fund within the meaning of the 1940 Act.
Each Fund offers multiple classes of shares of beneficial interest. The classes within each Fund are presented in the Statement of Assets and Liabilities. The cost structure for each class is as follows:
Class A shares are offered at net asset value per share plus an initial sales charge. Additionally, any purchases of Class A shares in excess of $1,000,000 will be purchased at net asset value but will be subject to a contingent deferred sales charge on redemptions made within one year of purchase.
Class C shares are offered at net asset value and may be subject to a contingent deferred sales charge on redemptions made within 12 months of purchase. Effective September 30, 2020, Class C shares convert automatically to Class A shares approximately eight years after purchase and at such time will be subject to the lower distribution fee applicable to Class A shares.
Class W shares are offered at net asset value per share. The class is offered exclusively through advisory fee-based programs sponsored by certain financial intermediaries and other programs.
SunAmerica Specialty Series
NOTES TO FINANCIAL STATEMENTS — October 31, 2020 — (continued)
Each class of shares bears the same voting, dividend, liquidation and other rights and conditions, except as may otherwise be provided in the Funds’ registration statement. Class A and Class C shares make distribution and account maintenance fee payments under a distribution plan pursuant to Rule 12b-1 under the 1940 Act, with Class C shares being subject to higher distribution fee rates. Class W shares have not adopted 12b-1 Plans and make no payments thereunder, however, Class W shares pay a service fee to the Funds’ distributor for administrative and shareholder services.
Indemnifications: The Trust’s organizational documents provide current and former officers and trustees with a limited indemnification against liabilities arising out of the performance of their duties to the Trust. In addition, pursuant to Indemnification Agreements between the Trust and each of the current trustees who is not an “interested person,” as defined in Section 2(a)(19) of the 1940 Act, of the Trust (collectively, the “Disinterested Trustees”), the Trust provides the Disinterested Trustees with a limited indemnification against liabilities arising out of the performance of their duties to the Trust, whether such liabilities are asserted during or after their service as trustees. In addition, in the normal course of business the Trust enters into contracts that contain the obligation to indemnify others. The Trust’s maximum exposure under these arrangements is unknown. Currently, however, the Trust expects the risk of loss to be remote.
Note 2. Basis for consolidation for the SunAmerica Commodity Strategy Cayman Fund Ltd.
The AIG Commodity Strategy Cayman Fund Ltd. (the “Commodity Strategy Subsidiary”), a Cayman Islands exempted company, was incorporated on October 20, 2008, and is a wholly-owned subsidiary of the Commodity Strategy Fund. The Commodity Strategy Subsidiary commenced operations on May 22, 2009 and was organized as a wholly-owned subsidiary of the Commodity Strategy Fund in order to effect certain investments on behalf of the Commodity Strategy Fund consistent with the investment objectives and policies in the Commodity Strategy Fund’s prospectus and statement of additional information. With respect to its investments, the Commodity Strategy Subsidiary will generally be subject to the same fundamental, non-fundamental and certain other investment restrictions as the Commodity Strategy Fund; however, the Commodity Strategy Subsidiary (unlike the Commodity Strategy Fund) may invest without limitation in commodity-linked swap agreements and other commodity-linked derivative instruments that may otherwise be limited if purchased by the Commodity Strategy Fund due to federal tax requirements relating to qualifying income. The Commodity Strategy Fund and Commodity Strategy Subsidiary may test for compliance with certain investment restrictions on a consolidated basis, except that with respect to its investment in certain securities that may involve leverage, the Commodity Strategy Subsidiary will comply with asset segregation or “earmarking” requirements to the same extent as the Commodity Strategy Fund. The Commodity Strategy Fund may invest up to 25% of its assets in the Commodity Strategy Subsidiary. As of October 31, 2020, net assets of the Commodity Strategy Fund were $25,196,636, of which approximately $4,844,082, or approximately 19.2%, represented the Commodity Strategy Fund’s ownership of all issued shares and voting rights of the Commodity Strategy Subsidiary.
Note 3. Significant Accounting Policies
The preparation of financial statements in accordance with U.S. generally accepted accounting principles (“GAAP”) requires management to make estimates and assumptions that affect the reported amounts and disclosures in the financial statements. Actual results could differ from those estimates and those differences could be significant. The Funds are considered investment companies under GAAP and follow the accounting and reporting guidance applicable to investment companies. The following is a summary of significant accounting policies consistently followed by the Trust in the preparation of its financial statements:
Security Valuation: In accordance with the authoritative guidance on fair value measurements and disclosures under GAAP, the Funds disclose the fair value of their investments in a hierarchy that prioritizes the inputs to valuation techniques used to measure the fair value. In accordance with GAAP, fair value is defined as the price that the Funds would receive upon selling an asset or transferring a liability in a timely transaction to an independent third party in the principal or most advantageous market. GAAP establishes a three-tier hierarchy to provide more transparency around the inputs used to measure fair value and to establish classification of fair value measurements for disclosure purposes. Inputs refer broadly to the assumptions that market participants would use in pricing the asset or liability, including assumptions about risk. Inputs may be observable or unobservable. Observable inputs are inputs that reflect the assumptions market participants would use in pricing the asset or liability developed based on market data obtained from sources independent of the reporting entity. Unobservable inputs are inputs that reflect the
SunAmerica Specialty Series
NOTES TO FINANCIAL STATEMENTS — October 31, 2020 — (continued)
reporting entity’s own assumptions about the assumptions market participants would use in pricing the asset or liability developed based on the best information available in the circumstances. The three-tiers are as follows:
Level 1 — Unadjusted quoted prices in active markets for identical securities
Level 2 — Other significant observable inputs (including quoted prices for similar securities, interest rates, prepayment speeds, credit risk, referenced indices, quoted prices in inactive markets, adjusted quoted prices in active markets, adjusted quoted prices
on foreign equity securities that were adjusted in accordance with pricing procedures approved by the Board of Trustees (the “Board”) , etc.)
Level 3 — Significant unobservable inputs (includes inputs that reflect the Funds’ own assumptions about the assumptions market participants would use in pricing the security, developed based on the best information available under the circumstances)
Changes in valuation techniques may result in transfers in or out of an investment’s assigned Level within the hierarchy. The methodology used for valuing investments is not necessarily an indication of the risk associated with investing in those investments and the determination of the significance of a particular input to the fair value measurement in its entirety requires judgment and consideration of factors specific to each security.
The availability of observable inputs can vary from security to security and is affected by a wide variety of factors, including, for example, the type of security, whether the security is recently issued and not yet established in the marketplace, the liquidity of markets, and other characteristics particular to the security. To the extent that valuation is based on models or inputs that are less observable or unobservable in the market, the determination of fair value requires more judgment. Accordingly, the degree of judgment exercised in determining fair value is greatest for instruments categorized in Level 3.
The summary of the Funds’ assets and liabilities classified in the fair value hierarchy as of October 31, 2020 is reported on a schedule at the end of each Fund’s Portfolio of Investments.
Stocks are generally valued based upon closing sales prices reported on recognized securities exchanges on which the securities are principally traded and are generally categorized as Level 1. Stocks listed on the NASDAQ are valued using the NASDAQ Official Closing Price (“NOCP”). Generally, the NOCP will be the last sale price unless the reported trade for the stock is outside the range of the bid/ask price. In such cases, the NOCP will be normalized to the nearer of the bid or ask price. For listed securities having no sales reported and for unlisted securities, such securities will be valued based upon the last reported bid price.
As of the close of regular trading on the New York Stock Exchange (“NYSE”), securities traded primarily on security exchanges outside the United States are valued at the last sale price on such exchanges on the day of valuation, or if there is no sale on the day of valuation, at the last-reported bid price. If a security’s price is available from more than one exchange, the Funds use the exchange that is the primary market for the security. Such securities are generally categorized as Level 1. However, depending on the foreign market, closing prices may be up to 15 hours old when they are used to price a Fund’s shares, and a Fund may determine that certain closing prices do not reflect the fair value of the security. This determination will be based on the review of a number of factors, including developments in foreign markets, the performance of U.S. securities markets, and the performance of instruments trading in U.S. markets that represent foreign securities and baskets of foreign securities. If a Fund determines that closing prices do not reflect the fair value of the securities, the Fund will adjust the previous closing prices in accordance with pricing procedures approved by the Board to reflect what it believes to be the fair value of the securities as of the close of regular trading on the NYSE. The Funds may also fair value securities in other situations, for example, when a particular foreign market is closed but a Fund is open. For foreign equity securities and foreign equity futures contracts, the Funds use an outside pricing service to provide it with closing market prices and information used for adjusting those prices, and when so adjusted, such securities and futures are generally categorized as Level 2.
Bonds, debentures and other debt securities are valued at evaluated bid prices obtained for the day of valuation from a Board-approved pricing service and are generally categorized as Level 2. The pricing services may use valuation models or matrix pricing which considers information with respect to comparable bond and note transactions, quotations from bond dealers, or by reference to other securities that are considered comparable in such characteristics as rating, interest rate, maturity date, option
SunAmerica Specialty Series
NOTES TO FINANCIAL STATEMENTS — October 31, 2020 — (continued)
adjusted spread models, prepayments projections, interest rate spreads, and yield curves to determine current value. If a price is unavailable from a Board-approved pricing service, the securities may be priced at the mean of two independent quotes obtained from brokers.
Investments in registered investment companies that do not trade on an exchange are valued at the end of day net asset value per share. Investments in registered investment companies that trade on an exchange are valued at the last sales price or official closing price as of the close of the customary trading session on the exchange where the security is principally traded. Investments in registered investment companies are generally categorized as Level 1.
Futures contracts traded on national securities exchanges are valued at the quoted daily settlement price established by the exchange on which they trade reported by a Board-approved pricing service, and are generally categorized as Level 1. Option contracts traded on national securities exchanges are valued at the mean of the last bid and ask price reported by a Board-approved pricing service as of the close of the exchange on which they are traded, and are generally categorized as Level 1.
Option contracts traded in the over-the-counter (“OTC”) market are valued at the mid valuation provided by a Board-approved pricing service, and are generally categorized as Level 2. Swap contracts traded on national securities exchanges are valued at the closing price of the exchange on which they are traded or if a closing price of the exchange is not available, the swap will be valued using a mid valuation provided by a Board-approved pricing service, and are generally categorized as Level 2. Swap contracts traded over the counter are valued at a mid valuation provided by a Board-approved pricing service, and are generally categorized as Level 2. Forward foreign currency contracts (“forward contracts”) are valued at the 4:00 p.m. Eastern Time forward rate and are generally categorized as Level 2.
Other securities are valued on the basis of last sale or bid price (if a last sale price is not available) which is, in the opinion of the Adviser, the broadest and most representative market, that may be either a securities exchange or OTC market, and are generally categorized as Level 1 or Level 2.
The Board is responsible for the share valuation process and has adopted policies and procedures (the “PRC Procedures”) for valuing the securities and other assets held by the Funds, including procedures for the fair valuation of securities and other assets for which market quotations are not readily available or are unreliable. The PRC Procedures provide for the establishment of a pricing review committee, which is responsible for, among other things, making certain determinations in connection with the Trust’s fair valuation procedures. Securities for which market quotations are not readily available or the values of which may be significantly impacted by the occurrence of developments or significant events are generally categorized as Level 3. There is no single standard for making fair value determinations, which may result in prices that vary from those of other funds.
Derivative Instruments:
Futures: During the period, the Commodity Strategy Fund entered into futures transactions for investment purposes in order to provide exposure to commodities. The Small-Cap Fund entered into futures transactions for investment purposes in order to provide exposure to U.S and non-U.S. equity markets.
A futures contract is an agreement between two parties to buy and sell a financial instrument at a set price on a future date. Upon entering into a futures transaction, a Fund will be required to segregate an initial margin payment of cash or other liquid securities with the futures commission merchant (the “broker”). Subsequent payments are made or received by a Fund as a result of changes in the value of the contract and/or changes in the value of the initial margin requirement. Such receipts or payments are recorded in the Statements of Assets and Liabilities as variation margin for changes in the value of the contracts and as cash collateral for futures contracts for the changes in the value of the initial margin requirement. When a contract is closed, a Fund records a realized gain or loss equal to the difference between the value of the contract at the time it was opened and the value at the time it was closed.
The primary risk to a Fund of entering into futures contracts is market risk. Market risk is the risk that there will be an unfavorable change in the interest rate, value or currency rate of the underlying security or securities. Futures contracts involve, to varying degrees, risk of loss in excess of the variation margin. There may also be trading restrictions or limitations imposed by
SunAmerica Specialty Series
NOTES TO FINANCIAL STATEMENTS — October 31, 2020 — (continued)
an exchange, and government regulations may restrict trading in futures contracts. While a Fund will generally only purchase exchange-traded futures, due to market conditions, there may not always be a liquid secondary market for a futures contract and, as a result, the Fund may be unable to close out its futures contracts at a time which is advantageous. In addition, if a Fund has insufficient cash to meet margin requirements, the Fund may need to sell other investments, including at disadvantageous times. There is generally minimal counterparty credit risk to a Fund since exchange-traded futures contracts are centrally cleared.
Futures contracts outstanding at the end of the period, if any, are reported on a schedule at the end of each Fund’s Portfolio of Investments.
Forward Foreign Currency Contracts: During the period, the Income Explorer Fund used forward contracts to attempt to protect securities against changes in future foreign exchange rates.
A forward contract is an agreement between two parties to buy or sell currency at a set price on a future date. The market value of the contract will fluctuate with changes in currency exchange rates. The contract is marked-to-market daily using the forward rate and the cumulative change in market value is recorded by a Fund as unrealized appreciation or depreciation. On the settlement date, a Fund records either realized gains or losses equal to the difference between the value of the contract at the time it was opened and the value at the time it was closed.
For federal income tax purposes, the Income Explorer Fund has made an election to treat gains and losses from forward foreign currency contracts as capital gains and losses.
Risks to a Fund of entering into forward contracts include counterparty risk, market risk and illiquidity risk. Counterparty risk arises upon entering into these contracts from the potential inability of counterparties to meet the terms of their contracts. If the counterparty defaults, a Fund’s loss will generally consist of the net amount of contractual payments that the Fund has not yet received though the Fund’s maximum exposure due to counterparty risk could extend to the notional amount of the contract. Market risk is the risk that the value of the forward contract will depreciate due to unfavorable changes in the exchange rates. These contracts may involve market risk in excess of the unrealized appreciation or depreciation reported on the Statement of Assets and Liabilities. Illiquidity risk arises because the secondary market for forwards may have less liquidity relative to markets for other securities. Currency transactions are also subject to risks different from those of other portfolio transactions. Because currency control is of great importance to the issuing governments and influences economic planning and policy, purchases and sales of currency and related instruments can be adversely affected by government exchange controls, limitations or restrictions on repatriation of currency, and manipulations or exchange restrictions imposed by governments.
Forward foreign currency contracts outstanding at the end of the period, if any, are reported on a schedule at the end of each Fund’s Portfolio of Investments.
Options: During the period, the Commodity Strategy Fund used options contracts to provide exposure to commodities.
An option is a contract conveying a right to buy or sell a financial instrument at a specified price during a stipulated period. When a Fund writes a call or a put option, it receives a premium which is equal to the current market value of the option written. The premiums on written options are recorded as a liability on the Statement of Assets and Liabilities. If a Fund purchases a call or a put option, it pays a premium which reflects the current market value of the option and which is included on the Fund’s Statement of Assets and Liabilities as an investment. The option position is marked to market daily and its value fluctuates based upon the value of the underlying financial instrument, time to expiration, cost of borrowing funds, and volatility of the value of the underlying financial instrument. If an option which a Fund has written either expires on its stipulated expiration date, or if the Fund enters into a closing purchase transaction, the Fund realizes a gain (or loss if the cost of a closing purchase transaction exceeds the premium received when the option was written) without regard to any unrealized gain or loss on the underlying security, and the liability related to such options is extinguished. If a call option which a Fund has written is exercised, the Fund realizes a gain or loss from the sale of the underlying security and the proceeds from such sale are increased by the premium originally received. If a put option which a Fund has written is exercised, the amount of the premium originally received reduces the cost of the security which the Fund purchased upon exercise of the option. Options may be traded on a national securities exchange or in the OTC market.
SunAmerica Specialty Series
NOTES TO FINANCIAL STATEMENTS — October 31, 2020 — (continued)
Risks to the Funds of entering into option contracts include counterparty risk, market risk and, with respect to OTC options, illiquidity risk. Counterparty risk arises from the potential inability of counterparties to meet the terms of their contracts. If the counterparty defaults, the Fund’s loss will consist of the net amount of contractual payments that the Fund has not yet received. Market risk is the risk that there will be an unfavorable change in the value of the underlying securities, and for written options, may result in losses in excess of the amounts shown on the statement and assets and liabilities. There is also the risk a Fund may not be able to enter into a closing transaction because of an illiquid market. In addition, unlisted options are not traded on an exchange and may not be as actively traded as listed options, making the valuation of such securities more difficult. An unlisted option also entails a greater risk that the party on the other side of the option transaction may default, which would make it impossible to close out an unlisted option position in some cases, and profits related to the transaction lost thereby.
Option contracts outstanding at the end of the period, if any, are reported on a schedule at the end of each Fund’s Portfolio of Investments.
Swap Contracts: Certain Funds may enter into credit default, interest rate and/or total return swap contracts. Swap contracts are privately negotiated in the OTC market and may be entered into as a bilateral contract or a centrally cleared contract (“centrally cleared swaps”). In a centrally cleared swap, immediately following execution of the swap contract, the swap contract is novated to a central counterparty (the “CCP”) and a Fund faces the CCP through a broker. Upon entering into a centrally cleared swap, a Fund is required to deposit initial margin with the broker in the form of cash or securities in an amount that varies depending on the size and risk profile of the particular swap. Securities deposited as initial margin are designated on the Portfolio of Investments and cash deposited is recorded on the Statement of Assets and Liabilities as cash collateral for centrally cleared swap contracts. Unlike a bilateral swap contract, for centrally cleared swaps, a Fund has no credit exposure to the counterparty as the CCP stands between the Fund and the counterparty. Swaps are marked-to-market daily and the changes in value are recorded as an unrealized gain (loss). The daily change in valuation of swap contracts, if any, is recorded as unrealized appreciation (depreciation) on swap contracts. When the swap is terminated, a Fund will record a realized gain or loss equal to the difference between the proceeds from (or cost of) the closing transaction and the Fund’s basis in the contract, if any. Generally, the basis of the contracts is the premium received or paid. Upfront payments and receipts on swap contracts are amortized on a daily basis. Net periodic payments made or received by a Fund are included as part of realized gain (loss).
Total Return Swaps: During the period, the Commodity Strategy Fund used total return swaps for investment purposes in order to provide exposure to commodities.
Total return swaps give a Fund the right to receive the appreciation in the value of a specified security, index or other instrument in return for a fee paid to the counterparty, which will typically be an agreed upon interest rate. If the underlying asset in a total return swap declines in value over the term of the swap, a Fund may also be required to pay the dollar value of that decline to the counterparty.
The Fund will generally enter into total return swaps only on a net basis, which means that the two payment streams are netted against each other, with the Fund receiving or paying, as the case may be, only the net amount of the two payments. Payments may be made at the conclusion of a total return swap contract or periodically during its term. Total return swaps normally do not involve the delivery of securities or other underlying assets. Accordingly, the risk of loss with respect to total return swaps is normally limited to the net amount of payments that the Fund is contractually obligated to make. If the counterparty to a total return swap defaults, the Fund’s risk of loss consists of the net discounted amount of payments that the Fund is contractually entitled to receive, if any.
Total return swap contracts outstanding at the end of the period, if any, are reported on a schedule at the end of the Fund’s Portfolio of Investments.
Risks of Entering into Swap Agreements: Risks to a Fund of entering into credit default swaps, total return swaps and interest rate swaps, include credit risk, market risk, counterparty risk, liquidity risk and documentation risk. By entering into swap agreements, a Fund may be exposed to risk of potential loss due to unfavorable changes in interest rates, the price of the underlying security or index, or the underlying referenced asset’s perceived or actual credit, that the counterparty may default on its obligation to perform or the possibility that there is no liquid market for these agreements. There is also the risk that the parties may disagree as to the
SunAmerica Specialty Series
NOTES TO FINANCIAL STATEMENTS — October 31, 2020 — (continued)
meaning of contractual terms in the swap agreement. In addition, to the extent that a subadviser does not accurately analyze and predict the underlying economic factors influencing the value of the swap, a Fund may suffer a loss, which may be in excess of the amount reflected on the statement of assets and liabilities.
Risks of Commodity-Linked Derivatives: Commodity-linked derivatives are derivative instruments, the value of which is primarily linked to the price movement of a commodity, commodity index or commodity futures or option contract. The commodity-linked derivative instruments in which certain of the Funds invest have substantial risks, including risk of loss of a significant portion of their principal value. Commodity-linked derivative instruments may be more volatile and less liquid than the underlying instruments and their value will be affected by the performance of the commodity markets, as well as economic and other regulatory or political developments, overall market movements and other factors. Typically, the return of the commodity-linked swaps will be based on some multiple of the performance of an index. The multiple (or leverage) will magnify the positive and negative return the Fund earns from these swaps as compared to the index.
Master Agreements: Certain Funds that hold derivative instruments and other financial instruments may be a party to ISDA (International Swap and Derivatives Association, Inc.) Master Agreements or similar agreements (“Master Agreements”) with certain counterparties that govern such instruments. Master Agreements may contain provisions regarding, among other things, the parties’ general obligations, representations, agreements, collateral requirements, events of default and early termination. Collateral can be in the form of cash or securities as agreed to by a Fund and applicable counterparty. Collateral requirements are generally determined based on a Fund’s net position with each counterparty. Master Agreements may also include certain provisions that require a Fund to post additional collateral upon the occurrence of certain events, such as when a Fund’s net assets fall below a specified level. In addition, Master Agreements typically specify certain standard termination events, such as failure of a party to pay or deliver, credit support defaults and other events of default. Termination events applicable to a Fund may also occur upon a decline in a Fund’s net assets below a specified level over a certain period of time. Additional termination events applicable to counterparties may occur upon a decline in a counterparty’s long-term and short-term credit ratings below a specified level, or upon a decline in the ratings of a counterparty’s credit support provider. Upon the occurrence of a termination event, the other party may elect to terminate early and cause settlement of all instruments outstanding pursuant to a particular Master Agreement, including the payment of any losses and costs resulting from such early termination, as reasonably determined by the terminating party. Any decision by one or more of a Fund’s counterparties to elect early termination could cause a Fund to accelerate the payment of liabilities, which settlement amounts could be in excess of the amount of assets that are already posted as collateral. Typically, the Master Agreement will permit a single net payment in the event of default. Note, however, that bankruptcy or insolvency laws of a particular jurisdiction may impose restrictions on or prohibitions against the right of offset in bankruptcy, insolvency or other events. As a result, the early termination with respect to derivative instruments subject to Master Agreements that are in a net liability position could be material to a Fund’s financial statements. The Funds do not offset derivative assets and derivative liabilities that are subject to netting arrangements in the Statement of Assets and Liabilities.
The following tables represent the value of derivatives held as of October 31, 2020, by their primary underlying risk exposure and the respective location on the Statement of Assets and Liabilities and the effect of derivatives on the Statement of Operations for the year ended October 31, 2020. The derivative contracts held during the period are not accounted for as hedging instruments under GAAP. For a detailed presentation of derivatives held as of October 31, 2020, please refer to a schedule at the end of each Fund’s Portfolio of Investments.
SunAmerica Specialty Series
NOTES TO FINANCIAL STATEMENTS — October 31, 2020 — (continued)
| | | | | | | | | | | | | | | | | | | | | | | | | | | | | | | | |
| | | Futures
Contracts(1)(8)
| | | Swap
Contracts(2)
| | | Options
Purchased(3)
| | | Foreign
Forward
Exchange
Contracts(4)
| | | Futures
Contracts(1)(8)
| | | Swap
Contracts(5)
| | | Options
Written(6)
| | | Foreign
Forward
Exchange
Contracts(7)
| |
| |
| | | Equity Contracts
| |
Fund
| | Asset Derivatives
| | | Liability Derivatives
| |
Small-Cap | | $ | — | | | $ | — | | | $ | — | | | $ | — | | | $ | 11,880 | | | $ | — | | | $ | — | | | $ | — | |
| |
| | | Commodity Contracts
| |
| | | Asset Derivatives
| | | Liability Derivatives
| |
Commodity Strategy# | | $ | 97,406 | | | $ | — | | | $ | 33,165 | | | $ | — | | | $ | 63,654 | | | $ | — | | | $ | 17,160 | | | $ | — | |
| |
| | | Foreign Exchange Contracts
| |
| | | Asset Derivatives
| | | Liability Derivatives
| |
Income Explorer | | $ | — | | | $ | — | | | $ | — | | | $ | — | | | $ | — | | | $ | — | | | $ | — | | | $ | — | |
Statement of Assets and Liabilities Location:
| (1) | Variation margin on futures contracts |
| (2) | Unrealized appreciation on swap contracts |
| (3) | Investments at value (unaffiliated) |
| (4) | Unrealized appreciation on forward foreign currency contracts |
| (5) | Unrealized depreciation on swap contracts |
| (6) | Call and put options written, at value |
| (7) | Unrealized depreciation on forward foreign currency contracts |
| (8) | The variation margin on futures contracts is included in the cumulative appreciation (depreciation) as reported on each Fund's Portfolio of Investments in the following amounts: |
| | | | |
Fund
| | Cumulative
Appreciation
(Depreciation)
| |
Commodity Strategy# | | | $832,882 | |
Small-Cap | | | 2,622 | |
| # | Consolidated (see Note 2) |
SunAmerica Specialty Series
NOTES TO FINANCIAL STATEMENTS — October 31, 2020 — (continued)
| | | | | | | | | | | | | | | | | | | | |
| | | Realized Gain (Loss) on Derivatives Recognized in Statement of Operations
| |
| | | Futures
Contracts(1)
| | | Swap
Contracts(2)
| | | Written
Options(3)
| | | Purchased
Options(4)
| | | Foreign Forward
Exchange
Contracts(5)
| |
| |
Fund
| | Equity Contracts
| |
Small-Cap | | $ | 258,039 | | | $ | — | | | $ | — | | | $ | — | | | $ | — | |
| |
| | | Commodity Contracts
| |
Commodity Strategy# | | $ | (1,813,153 | ) | | $ | (958,890 | ) | | $ | 16,348 | | | $ | 17,873 | | | $ | — | |
| |
| | | Foreign Exchange Contracts
| |
Income Explorer . | | $ | — | | | $ | — | | | $ | — | | | $ | — | | | $ | (8,469 | ) |
| |
| | | Change in Unrealized Appreciation (Depreciation) on Derivatives Recognized
in Statement of Operations
| |
| | | Futures
Contracts(6)
| | | Swap
Contracts(7)
| | | Written
Options(8)
| | | Purchased
Options(9)
| | | Foreign Forward
Exchange
Contracts(10)
| |
| |
Fund
| | Equity Contracts
| |
Small-Cap | | $ | (17,836 | ) | | $ | — | | | $ | — | | | $ | — | | | $ | — | |
| |
| | | Commodity Contracts
| |
Commodity Strategy# | | $ | 418,398 | | | $ | (48,409 | ) | | $ | 2,419 | | | $ | (5,059 | ) | | $ | — | |
| |
| | | Foreign Exchange Contracts
| |
Income Explorer . | | $ | — | | | $ | — | | | $ | — | | | $ | — | | | $ | 10,197 | |
Statement of Operations Location:
| (1) | Net realized gain (loss) on futures contracts |
| (2) | Net realized gain (loss) on swap contracts |
| (3) | Net realized gain (loss) on written options contracts |
| (4) | Net realized gain (loss) on investments |
| (5) | Net realized gain (loss) on forward contracts |
| (6) | Change in unrealized appreciation (depreciation) on futures contracts |
| (7) | Change in unrealized appreciation (depreciation) on swap contracts |
| (8) | Change in unrealized appreciation (depreciation) on written options contracts |
| (9) | Change in unrealized appreciation (depreciation) on investments |
| (10) | Change in unrealized appreciation (depreciation) on forward contracts |
| # | Consolidated (see Note 2) |
SunAmerica Specialty Series
NOTES TO FINANCIAL STATEMENTS — October 31, 2020 — (continued)
The following table represents the average monthly balances of derivatives held during the year ended October 31, 2020.
| | | | | | | | | | | | | | | | | | | | | | | | | | | | |
| | | Average Amount Outstanding During the Period
| |
Fund
| | Futures
Contracts(2)
| | | Foreign
Exchange
Contracts(2)
| | | Purchased Call
Options
Contracts(1)
| | | Purchased
Put Options
Contracts(1)
| | | Total Return
Swap Contracts(1)
| | | Written Call
Options
Contracts(1)
| | | Written Put
Options
Contracts(1)
| |
Commodity Strategy# | | $ | 20,519,336 | | | $ | — | | | $ | 9,036 | | | $ | 4,229 | | | $ | 8,885,518 | | | $ | 4,408 | | | $ | 975 | |
Income Explorer | | | — | | | | 109,596 | | | | — | | | | — | | | | — | | | | — | | | | — | |
Small-Cap | | | 715,957 | | | | — | | | | — | | | | — | | | | — | | | | — | | | | — | |
| (1) | Amounts represent values in US dollars. |
| (2) | Amounts represent notional amounts in US dollars. |
| # | Consolidated (see Note 2) |
The following tables set forth the Funds’ derivative assets and liabilities by counterparty, net of amount available for offset under Master Agreements and net of related collateral pledged/(received) as of October 31, 2020. The repurchase agreements held by the Funds as of October 31, 2020 are subject to Master Agreements but are not included in the following tables. See the Portfolio of Investments and Notes to the Financial Statements for more information about the Funds’ holdings in repurchase agreements.
| | | | | | | | | | | | | | | | | | | | | | | | | | | | | | | | | | | | | | | | | | | | |
| | | AIG Commodity Strategy Fund#
| | | | | | | | | | |
| | | Derivative Assets(1)
| | | Derivative Liabilities(1)
| | | | | | | | | | |
Counterparty
| | Forward
Foreign
Currency
Contracts
| | | OTC Swaps
| | | Options
Purchased
| | | Total
| | | Forward
Foreign
Currency
Contracts
| | | OTC Swaps
| | | Options
Written
| | | Total
| | | Net
Derivative
Assets
(Liabilities)
| | | Collateral
Pledged/
(Received)(2)
| | | Net
Amount(3)
| |
JPMorgan | | $ | — | | | $ | — | | | $ | — | | | $ | — | | | $ | — | | | $ | — | | | $ | — | | | $ | — | | | $ | — | | | $ | — | | | $ | — | |
| (1) | Gross amounts of recognized assets and liabilities not offset in the Statement of Assets and Liabilities. |
| (2) | For each respective counterparty, collateral pledged or (received) is limited to an amount not to exceed 100% of the derivative asset/liability in the table above. |
| (3) | Net amount represents the net amount due (to)/from counterparty in the event of a default based on the contractual set-off rights under the agreement. |
| # | Consolidated (see Note 2) |
Repurchase Agreements: The Funds, along with other affiliated registered investment companies, pursuant to procedures adopted by the Board and applicable guidance from the Securities and Exchange Commission (“SEC”), may transfer uninvested cash balances into a single joint account, the daily aggregate balance of which is invested in one or more repurchase agreements collateralized by U.S. Treasury or federal agency obligations. In a repurchase agreement, the seller of a security agrees to repurchase the security at a mutually agreed-upon time and price, which reflects the effective rate of return for the term of the agreement. For repurchase agreements and joint repurchase agreements, the Funds’ custodian takes possession of the collateral pledged for investments in such repurchase agreements (“repo” or collectively “repos”). The underlying collateral is valued daily on a mark to market basis, plus accrued interest to ensure that the value, at the time the agreement is entered into, is equal to at least 102% of the repurchase price, including accrued interest. In the event of default of the obligation to repurchase, a Fund has the right to liquidate the collateral and apply the proceeds in satisfaction of the obligation. If the seller defaults and the value of the collateral declines or if bankruptcy proceedings are commenced with respect to the seller of the security, realization of the collateral by a Fund may be delayed or limited.
As of October 31, 2020, the following Fund held an undivided interest in the joint repurchase agreement with Bank of America Securities LLC:
| | | | | | | | |
Fund
| | Percentage
Ownership
| | | Principal
Amount
| |
Commodity Strategy | | | 0.92 | % | | $ | 690,000 | |
Commodity Strategy Subsidiary | | | 0.67 | | | | 500,000 | |
SunAmerica Specialty Series
NOTES TO FINANCIAL STATEMENTS — October 31, 2020 — (continued)
As of such date, the repurchase agreement in that joint account and the collateral thereof were as follows:
Bank of America Securities LLC, dated October 30, 2020, bearing interest at a rate of 0.06% per annum, with a principal amount of $75,000,000, a repurchase price of $75,000,375, and a maturity date of November 2, 2020. The repurchase agreement is collateralized by the following:
| | | | | | | | | | | | | | | | |
Type of Collateral
| | Interest
Rate
| | | Maturity
Date
| | | Principal
Amount
| | | Value
| |
U.S. Treasury Notes | | | 0.25 | % | | | 06/15/2023 | | | $ | 76,310,000 | | | $ | 76,519,051 | |
As of October 31, 2020, the following Funds held an undivided interest in the joint repurchase agreement with Barclays Capital, Inc.:
| | | | | | | | |
Fund
| | Percentage
Ownership
| | | Principal
Amount
| |
Commodity Strategy | | | 0.92 | % | | $ | 600,000 | |
Commodity Strategy Subsidiary | | | 0.67 | | | | 435,000 | |
As of such date, the repurchase agreement in that joint account and the collateral thereof were as follows:
Barclays Capital, Inc., dated October 30, 2020, bearing interest at a rate of 0.07% per annum, with a principal amount of $65,000,000, a repurchase price of $65,000,379, and a maturity date of November 2, 2020. The repurchase agreement is collateralized by the following:
| | | | | | | | | | | | | | | | |
Type of Collateral
| | Interest
Rate
| | | Maturity
Date
| | | Principal
Amount
| | | Value
| |
U.S. Treasury Bonds | | | 1.13 | % | | | 05/15/2040 | | | $ | 68,705,000 | | | $ | 66,150,733 | |
As of October 31, 2020, the following Funds held an undivided interest in the joint repurchase agreement with BNP Paribas SA:
| | | | | | | | |
Fund
| | Percentage
Ownership
| | | Principal
Amount
| |
Commodity Strategy | | | 0.92 | % | | $ | 600,000 | |
Commodity Strategy Subsidiary | | | 0.67 | | | | 435,000 | |
As of such date, the repurchase agreement in that joint account and the collateral thereof were as follows:
BNP Paribas SA, dated October 30, 2020, bearing interest at a rate of 0.06% per annum, with a principal amount of $65,000,000, a repurchase price of $65,000,325, and a maturity date of November 2, 2020. The repurchase agreement is collateralized by the following:
| | | | | | | | | | | | | | | | |
Type of Collateral
| | Interest
Rate
| | | Maturity
Date
| | | Principal
Amount
| | | Value
| |
U.S. Treasury Bonds | | | 2.38 | % | | | 11/15/2049 | | | $ | 55,398,700 | | | $ | 66,017,976 | |
As of October 31, 2020, the following Funds held an undivided interest in the joint repurchase agreement with Deutsche Bank AG:
| | | | | | | | |
Fund
| | Percentage
Ownership
| | | Principal
Amount
| |
Commodity Strategy | | | 0.92 | % | | $ | 785,000 | |
Commodity Strategy Subsidiary | | | 0.67 | | | | 570,000 | |
SunAmerica Specialty Series
NOTES TO FINANCIAL STATEMENTS — October 31, 2020 — (continued)
As of such date, the repurchase agreement in that joint account and the collateral thereof were as follows:
Deutsche Bank AG, dated October 30, 2020, bearing interest at a rate of 0.06% per annum, with a principal amount of $85,000,000, a repurchase price of $85,000,425 and a maturity date of November 2, 2020. The repurchase agreement is collateralized by the following:
| | | | | | | | | | | | | | | | |
Type of Collateral
| | Interest
Rate
| | | Maturity
Date
| | | Principal
Amount
| | | Value
| |
U.S. Treasury Notes | | | 2.00 | % | | | 10/31/2022 | | | $ | 82,866,000 | | | $ | 86,756,817 | |
As of October 31, 2020, the following Funds held an undivided interest in the joint repurchase agreement with RBS Securities, Inc.:
| | | | | | | | |
Fund
| | Percentage
Ownership
| | | Principal
Amount
| |
Commodity Strategy | | | 0.93 | % | | $ | 825,000 | |
Commodity Strategy Subsidiary | | | 0.68 | | | | 605,000 | |
As of such date, the repurchase agreement in that joint account and the collateral thereof were as follows:
RBS Securities, Inc., dated October 30, 2020, bearing interest at a rate of 0.06% per annum, with a principal amount of $88,500,000, a repurchase price of $88,500,443, and a maturity date of November 2, 2020. The repurchase agreement is collateralized by the following:
| | | | | | | | | | | | | | | | |
Type of Collateral
| | Interest
Rate
| | | Maturity
Date
| | | Principal
Amount
| | | Value
| |
U.S. Treasury Notes | | | 0.50 | % | | | 08/31/2027 | | | $ | 90,760,000 | | | $ | 90,255,038 | |
Securities Transactions, Investment Income, Expenses, Dividends and Distributions to Shareholders: Securities transactions are recorded on a trade date basis. Realized gains and losses on sales of investments are calculated on the identified cost basis.
Interest income is accrued daily from settlement date except when collection is not expected. For financial statement purposes, the Funds amortize all premiums and accrete all discounts on fixed income securities. Dividend income is recorded on the ex-dividend date except for certain dividends from foreign securities, which are recorded as soon as the Trust is informed after the ex-dividend date.
Securities purchased or sold on a when-issued or forward commitment basis outstanding at the end of the period, if any, are included in investments purchased/sold on an extended settlement basis in the Statement of Assets and Liabilities.
Distributions received from Real Estate Investment Trusts (“REIT”) investments are recharacterized based on information provided by the REIT into the following categories: ordinary income, long-term and short-term capital gains and return of capital. If information is not available on a timely basis from the REIT, the recharacterization will be based on available information which may include the previous year’s allocation. If new or additional information becomes available from the REIT at a later date, a recharacterization will be made in the following year. The amount recharacterized as ordinary income is recorded as dividend income and the amount recharacterized as capital gain is recorded as realized gain in the Statement of Operations. The amount recharacterized as return of capital is recorded as a reduction to the cost of investments in the Statement of Assets and Liabilities. These recharacterizations are reflected in the accompanying financial statements.
Expenses common to all Funds are allocated among the Funds based on relative net assets or other appropriate methods. In all other respects, expenses are charged to each Fund as incurred on a specific identification basis.
Income, expenses other than class specific expenses, and realized and unrealized gains and losses are allocated daily to each class of shares based upon the relative value of outstanding shares of each class of shares at the beginning of the day (after adjusting for the current capital share activity of the respective class).
SunAmerica Specialty Series
NOTES TO FINANCIAL STATEMENTS — October 31, 2020 — (continued)
Dividends from net investment income, if any, are normally paid monthly for the Income Explorer Fund and quarterly for the ESG Dividend Fund. All other Funds pay annually. Each of the Funds reserves the right to declare and pay dividends less frequently than disclosed above, provided that the net realized capital gains and the net investment income, if any, are paid at least annually. The Funds record dividends and distributions to their shareholders on the ex-dividend date.
The amount of dividends and distributions from net investment income and net realized capital gains are determined in accordance with federal income tax regulations, which may differ from GAAP. These “book/tax” differences are either considered temporary or permanent in nature. To the extent these differences are permanent in nature, such amounts are reclassified within the capital accounts at fiscal year end based on their federal tax-basis treatment; temporary differences do not require reclassification. Net assets are not affected by these reclassifications.
Each Fund is considered a separate entity for tax purposes and intends to comply with the requirements of the Internal Revenue Code, as amended, applicable to regulated investment companies and distribute all of its taxable income, including any net capital gains on investments, to its shareholders. Each Fund also intends to distribute sufficient net investment income and net capital gains, if any, so that each Fund will not be subject to excise tax on undistributed income and gains. Therefore, no federal income tax or excise tax provision is required.
Each Fund recognizes the tax benefits of uncertain tax positions only when the position is more likely than not to be sustained, assuming examination by tax authorities. Management has analyzed each Fund’s tax positions and concluded that no liability for unrecognized tax benefits should be recorded related to uncertain tax positions. The Funds are not aware of any tax provisions for which it is reasonably possible that the total amounts of unrecognized tax benefits will change materially in the next twelve months. The Funds file U.S. federal and certain state income tax returns. The Funds’ federal tax returns for the prior three fiscal years remain subject to examination by the Internal Revenue Service.
Foreign Currency Translation: The books and records of the Funds are maintained in U.S. dollars. Assets and liabilities denominated in foreign currencies and commitments under forward foreign currency contracts are translated into U.S. dollars based on the exchange rate of such currencies against U.S. dollars on the date of valuation.
The Funds do not isolate that portion of the results of operations arising as a result of changes in the foreign exchange rates from the changes in the market prices of securities held at the end of the period. Similarly, the Funds do not isolate the effect of changes in foreign exchange rates from the changes in the market prices of portfolio securities sold during the period.
Realized foreign exchange gains and losses on other assets and liabilities and change in unrealized foreign exchange gains and losses on other assets and liabilities located in the Statements of Operations include realized foreign exchange gains and losses from currency gains or losses between the trade and the settlement dates of securities transactions, the difference between the amounts of interest, dividends and foreign withholding taxes recorded on the Funds’ books and the U.S. dollar equivalent amounts actually received or paid and changes in the unrealized foreign exchange gains and losses relating to the other assets and liabilities arising as a result of changes in the exchange rates.
LIBOR Risk: A Fund’s investments, payment obligations and financing terms may be based on floating rates, such as London Interbank Offer Rate (“LIBOR”), Euro Interbank Offered Rate and other similar types of reference rates (each, a “Reference Rate”). On July 27, 2017, the Chief Executive of the UK Financial Conduct Authority (“FCA”), which regulates LIBOR, announced that the FCA will no longer persuade nor require banks to submit rates for the calculation of LIBOR and certain other Reference Rates after 2021. Such announcement indicates that the continuation of LIBOR and other Reference Rates on the current basis cannot and will not be guaranteed after 2021. This announcement and any additional regulatory or market changes may have an adverse impact on a Fund or its investments.
In advance of 2021, regulators and market participants are expected to work together to identify or develop successor Reference Rates. Additionally, prior to 2021, it is expected that market participants will focus on the transition mechanisms by which the Reference Rates in existing contracts or instruments may be amended, whether through market wide protocols, fallback contractual provisions, bespoke negotiations or amendments or otherwise. Nonetheless, the termination of certain Reference
SunAmerica Specialty Series
NOTES TO FINANCIAL STATEMENTS — October 31, 2020 — (continued)
Rates presents risks to a Fund. At this time, it is not possible to completely identify or predict the effect of any such changes, any establishment of alternative Reference Rates or any other reforms to Reference Rates that may be enacted in the UK or elsewhere. The elimination of a Reference Rate or any other changes or reforms to the determination or supervision of Reference Rates could have an adverse impact on the market for or value of any securities or payments linked to those Reference Rates and other financial obligations held by a Fund or on its overall financial condition or results of operations. In addition, any substitute Reference Rate and any pricing adjustments imposed by a regulator or by counterparties or otherwise may adversely affect a Fund’s performance and/or NAV.
New Accounting Pronouncements: In August 2018, the FASB issued Accounting Standards Update (“ASU”) No. 2018-13 “Disclosure Framework – Changes to the Disclosure Requirements for Fair Value Measurement”. The ASU eliminates, modifies, and adds disclosure requirements for fair value measurements and is for fiscal years, and interim periods within those fiscal years, beginning after December 15, 2019. The ASU allows for early adoption of either the entire standard or only the provisions that eliminate or modify the requirements. Management has elected to early adopt the provisions that eliminate disclosure requirements and is still evaluating the impact of applying the rest of the ASU.
Effective November 1, 2019, the Funds are subject to ASU 2017-08, “Premium Amortization on Purchased Callable Debt Securities”, which requires the premiums on certain purchased debt securities with non-contingent call features to be amortized to the earliest call date. The amortization period for callable debt securities purchased at a discount is not impacted. Adoption of the ASU had no material impact on the Funds.
Note 4. Investment Advisory and Management Agreements, Distribution and Service Agreements
The Trust, on behalf of each Fund, has entered into Investment Advisory and Management Agreements (the “Agreements”) with SunAmerica. Under the Agreements, SunAmerica provides continuous supervision of each Fund’s portfolio and administrative affairs, subject to general review by the Board. In connection therewith, SunAmerica furnishes the Funds with office facilities, maintains certain of the Funds’ books and records, pays the salaries and expenses of all personnel, including officers of the Funds who are employees of SunAmerica and its affiliates and oversees the performance of services provided to the Funds by third parties. Pursuant to the Agreements, the Funds pay SunAmerica a management fee at an annual rate based on average daily net assets, which is computed daily and payable monthly, as follows:
| | | | |
Fund
| | Percentage
| |
Commodity Strategy | | | 1.00 | % |
ESG Dividend | | | 0.75 | |
Focused Alpha Large-Cap | | | 1.00 | |
Focused Growth | | | 1.00 | |
Income Explorer | | | 1.00 | |
Small-Cap | | | 1.00 | |
The Commodity Strategy Subsidiary has entered into a separate contract with SunAmerica whereby SunAmerica provides investment advisory and other services to the Commodity Strategy Subsidiary. In consideration of these services, the Commodity Strategy Subsidiary pays SunAmerica a management fee at the annual rate of 1.00% of average daily net assets of the Commodity Strategy Subsidiary. SunAmerica has contractually agreed to waive the management fee it receives from the Commodity Strategy Fund in an amount equal to the management fee paid by the Commodity Strategy Subsidiary to SunAmerica (the “Commodity Strategy Subsidiary management fee waiver”). This waiver may not be terminated by SunAmerica, and will remain in effect for as long as SunAmerica’s contract with the Commodity Strategy Subsidiary is in place. For the year ended October 31, 2020, the amount of advisory fees waived was $52,075.
Pursuant to the Subadvisory Agreement between SunAmerica and Wellington Management Company LLP (“Wellington”) (the “Commodity Strategy Subadvisory Agreement”), SunAmerica has delegated portfolio management responsibilities of the Commodity Strategy Fund to Wellington. Pursuant to a Subadvisory Agreement between SunAmerica and Wellington with respect to the Commodity Strategy Subsidiary, SunAmerica has delegated portfolio management responsibilities of the Commodity Strategy Subsidiary to Wellington. Payments to Wellington for its services are made by SunAmerica, not by the Fund.
Pursuant to the Subadvisory Agreement between SunAmerica and Marsico Capital Management, LLC (“Marsico”) and the Subadvisory Agreement between SunAmerica and Blackrock Investment Management, LLC (“Blackrock”), SunAmerica has
SunAmerica Specialty Series
NOTES TO FINANCIAL STATEMENTS — October 31, 2020 — (continued)
delegated portfolio management responsibilities of the Focused Alpha Large-Cap Fund to Marsico and Blackrock. Each Subadviser is paid by SunAmerica and not the Fund.
Pursuant to the Subadvisory Agreement between SunAmerica and Marsico, and the Subadvisory Agreement between SunAmerica and BAMCO, Inc. (“BAMCO”), SunAmerica has delegated portfolio management responsibilities of the Focused Growth Fund to Marsico and BAMCO. Each subadviser is paid by SunAmerica and not the Fund.
Prior to December 17, 2019 (the “Effective Date”), SunAmerica delegated a portion of portfolio management responsibilities of the Income Explorer Fund to Cohen & Steers Capital Management, Inc. (“Cohen & Steers”). Cohen and Steers was paid by SunAmerica and not by the Fund. As of the Effective Date, Cohen & Steers no longer serves as subadviser to the Fund, and SunAmerica assumed day-to-day management responsibilities.
Pursuant to the Subadvisory Agreement between SunAmerica and Cadence Capital Management, LLC (“Cadence”), SunAmerica has delegated a portion of portfolio management responsibilities of the Small-Cap Fund to Cadence. Cadence is paid by SunAmerica and not by the Fund.
Pursuant to an Advisory Fee Wavier Agreement with the Focused Growth Fund and the Small-Cap Fund, SunAmerica is contractually obligated to waive its advisory fee so that the advisory fee equals 0.90% and 0.85%, respectively, of average daily net assets of each of the Funds. For the year ended October 31, 2020, the amount of advisory fees waived for the Focused Growth Fund and Small-Cap Fund was $567,677 and $57,152, respectively. Effective March 31, 2020, pursuant to an Advisory Fee Wavier Agreement with the Income Explorer Fund, SunAmerica is contractually obligated to waive its advisory fee so that the advisory fee equals 0.75% of average daily net assets of the Fund. For the year ended October 31, 2020, the amount of advisory fees waived for the Income Explorer Fund was $55,225.
SunAmerica has contractually agreed to waive fees and/or reimburse expenses to the extent necessary to cap the Funds’ annual Fund operating expense at the following percentages of each Class’s average daily net assets. For the purposes of waived fee and/or reimbursed expense calculations, annual Fund operating expenses shall not include extraordinary expenses (i.e., expenses that are unusual in nature and infrequent in occurrence, such as litigation), or acquired fund fees and expenses, brokerage commissions and other transactional expenses relating to the purchase and sale of portfolio securities, interest, taxes and governmental fees, and other expenses not incurred in the ordinary course of a Fund’s business. The contractual expense fee waivers and expense reimbursements will continue in effect indefinitely, unless terminated by the Trustees, including a majority of the Disinterested Trustees.
| | | | |
Fund
| | Percentage
| |
Commodity Strategy Class A# | | | 1.72 | % |
Commodity Strategy Class C# | | | 2.37 | |
Commodity Strategy Class W# | | | 1.52 | |
ESG Dividend Class A | | | 1.13 | |
ESG Dividend Class C | | | 1.78 | |
ESG Dividend Class W | | | 0.93 | |
Focused Alpha Large-Cap Class A | | | 1.72 | |
Focused Alpha Large-Cap Class C | | | 2.37 | |
Focused Alpha Large-Cap Class W | | | 1.52 | |
Focused Growth Class A | | | 1.13 | |
Focused Growth Class C | | | 1.78 | |
Focused Growth Class W | | | 0.93 | |
Income Explorer Class A(1) | | | 0.99 | |
Income Explorer Class C(1) | | | 1.64 | |
Income Explorer Class W(1) | | | 0.79 | |
Small-Cap Class A | | | 1.25 | |
Small-Cap Class C | | | 1.90 | |
Small-Cap Class W | | | 1.05 | |
| # | Consolidated (see Note 2) |
| (1) | Effective March 31, 2020, the expense limitation for Class A, C and W changed from 1.55%, 2.20%, and 1.35% to 0.99%, 1.64% and 0.79%, respectively. Prior to December 17, 2019, the expense limitation for Class A, C and W was 1.72%, 2.37% and 1.52%, respectively. |
SunAmerica Specialty Series
NOTES TO FINANCIAL STATEMENTS — October 31, 2020 — (continued)
Any contractual waivers and/or reimbursements made by SunAmerica with respect to a Fund, with the exception of the Advisory Fee and Subsidiary management fee waivers, are subject to recoupment from the Funds within two years after the occurrence of any such waivers and/or reimbursements, provided that the Funds are able to effect such payment to SunAmerica and remain in compliance with the expense limitations in effect at the time the waivers and/or reimbursements were made.
For the year ended October 31, 2020, pursuant to the contractual expense limitations referred above, SunAmerica has waived or reimbursed expenses as follows:
| | | | |
Fund
| | Other
Expenses
Reimbursed
| |
Commodity Strategy | | $ | 228,791 | |
ESG Dividend | | | 156,255 | |
Focused Alpha Large-Cap | | | — | |
Focused Growth | | | 989,710 | |
Income Explorer | | | 246,672 | |
Small-Cap | | | 250,729 | |
| | | | |
Fund
| | Class Specific
Expenses
Reimbursed
| |
Commodity Strategy Class A | | $ | 80,132 | |
Commodity Strategy Class C | | | 15,762 | |
Commodity Strategy Class W | | | 15,993 | |
ESG Dividend Class A | | | 61,639 | |
ESG Dividend Class C | | | 13,099 | |
ESG Dividend Class W | | | 31,427 | |
Focused Alpha Large-Cap Class A | | | — | |
Focused Alpha Large-Cap Class C | | | — | |
Focused Alpha Large-Cap Class W | | | 1,936 | |
Focused Growth Class A | | | 1,198,786 | |
Focused Growth Class C | | | 133,639 | |
Focused Growth Class W | | | 108,363 | |
Income Explorer Class A | | | 99,442 | |
Income Explorer Class C | | | 22,456 | |
Income Explorer Class W | | | 24,815 | |
Small-Cap Class A | | | 102,456 | |
Small-Cap Class C | | | 17,787 | |
Small-Cap Class W | | | 20,449 | |
For the year ended October 31, 2020, the amounts recouped by SunAmerica are as follows:
| | | | |
Fund
| | Class Specific
Expenses
Recouped
| |
Commodity Strategy Class A | | $ | — | |
Commodity Strategy Class C | | | — | |
Commodity Strategy Class W | | | — | |
ESG Dividend Class A | | | — | |
ESG Dividend Class C | | | — | |
ESG Dividend Class W | | | — | |
Focused Alpha Large-Cap Class A | | | — | |
Focused Alpha Large-Cap Class C | | | — | |
Focused Alpha Large-Cap Class W | | | 4,983 | |
Focused Growth Class A | | | — | |
Focused Growth Class C | | | — | |
Focused Growth Class W | | | — | |
Income Explorer Class A | | | — | |
SunAmerica Specialty Series
NOTES TO FINANCIAL STATEMENTS — October 31, 2020 — (continued)
| | | | |
Fund
| | Class Specific
Expenses
Recouped
| |
Income Explorer Class C | | $ | — | |
Income Explorer Class W | | | — | |
Small-Cap Class A | | | — | |
Small-Cap Class C | | | — | |
Small-Cap Class W | | | — | |
At October 31, 2020, expenses previously waived and/or reimbursed by SunAmerica that are subject to recoupment and expire during the time periods indicated are as follows:
| | | | | | | | |
| | | Other Expenses Reimbursed
| |
Fund
| | October 31, 2021
| | | October 31, 2022
| |
Commodity Strategy | | $ | 194,012 | | | $ | 228,791 | |
ESG Dividend | | | 144,525 | | | | 156,255 | |
Focused Alpha Large-Cap | | | — | | | | — | |
Focused Growth | | | 1,010,634 | | | | 989,710 | |
Income Explorer | | | 67,581 | | | | 246,672 | |
Small-Cap | | | 213,197 | | | | 250,729 | |
| | | | | | | | |
| | | Class Specific Expenses Reimbursed
| |
Fund
| | October 31, 2021
| | | October 31, 2022
| |
Commodity Strategy Class A | | $ | 91,964 | | | $ | 80,132 | |
Commodity Strategy Class C | | | 17,581 | | | | 15,762 | |
Commodity Strategy Class W | | | 17,219 | | | | 15,993 | |
ESG Dividend Class A | | | 66,884 | | | | 61,639 | |
ESG Dividend Class C | | | 12,051 | | | | 13,099 | |
ESG Dividend Class W | | | 28,425 | | | | 31,427 | |
Focused Alpha Large-Cap Class A | | | — | | | | — | |
Focused Alpha Large-Cap Class C | | | — | | | | — | |
Focused Alpha Large-Cap Class W | | | — | | | | 1,218 | |
Focused Growth Class A | | | 1,143,417 | | | | 1,198,786 | |
Focused Growth Class C | | | 152,360 | | | | 133,639 | |
Focused Growth Class W | | | 151,927 | | | | 108,363 | |
Income Explorer Class A | | | 98,793 | | | | 99,442 | |
Income Explorer Class C | | | 22,451 | | | | 22,456 | |
Income Explorer Class W | | | 26,877 | | | | 24,815 | |
Small-Cap Class A | | | 124,303 | | | | 102,456 | |
Small-Cap Class C | | | 20,445 | | | | 17,787 | |
Small-Cap Class W | | | 35,892 | | | | 20,449 | |
The Trust, on behalf of each Fund, has a Distribution Agreement with AIG Capital Services, Inc. (“ACS” or the “Distributor”), an affiliate of the Adviser. Each Fund has adopted a Distribution Plan on behalf of its Class A shares and Class C shares (each a “Plan” and collectively, the “Plans”) in accordance with the provisions of Rule 12b-1 under the 1940 Act, hereinafter referred to as the “Class A Plan” and the “Class C Plan.” In adopting the Plans, the Trustees determined that there was a reasonable likelihood that each such Plan would benefit the Fund and the shareholders of the respective class. The sales charge and distribution fees of a particular class will not be used to subsidize the sale of shares of any other class.
Under the Class A Plan and Class C Plan, the Distributor receives payments from a Fund at an annual rate of 0.10% and 0.75%, respectively, of average daily net assets of such Fund’s Class to compensate the Distributor and certain securities firms for providing sales and promotional activities for distributing that class of shares. The distribution costs for which the Distributor may be compensated include fees paid to broker-dealers that have sold Fund shares, commissions and other expenses such as those incurred for sales literature, prospectus printing and distribution and compensation to wholesalers. It is possible that in any given year, the amount paid to the Distributor under each Plan may exceed the Distributor’s distribution costs as described above. During the year ended October 31, 2020, ACS waived fees in the amount of $10,527 for the Class A shares of AIG ESG
SunAmerica Specialty Series
NOTES TO FINANCIAL STATEMENTS — October 31, 2020 — (continued)
Fund. The Plans further provide that the Class A and Class C shares of each Fund shall pay the Distributor an account maintenance fee up to an annual rate of 0.25% of the average daily net assets of such class of shares for payments to broker-dealers for providing account maintenance activities. The Distributor does not receive or retain any distribution and/or a account maintenance fees for any shares when the shareholder does not have a broker of record. For the year ended October 31, 2020, ACS received fees based upon the aforementioned rates (see Statement of Operations).
The Trust, on behalf of each fund, has entered into an Administrative and Shareholder Services Agreement with ACS, pursuant to which ACS is paid an annual fee of 0.15% of average daily net assets of Class W shares as compensation for providing administrative and shareholder services to Class W shareholders. For year ended October 31, 2020, ACS earned fees based upon the aforementioned rates (see Statement of Operations).
ACS receives sales charges on each Fund’s Class A shares, portions of which are reallocated to affiliated broker-dealers and nonaffiliated broker-dealers. ACS also receives the proceeds of contingent deferred sales charges paid by investors in connection with certain redemptions of each Fund’s Class A and Class C shares. ACS has advised the Funds that for the year ended October 31, 2020, the proceeds received from sales (and paid out to affiliated and non-affiliated broker-dealers) and redemptions are as follows:
| | | | | | | | | | | | | | | | | | | | |
| | | Class A
| | | Class C
| |
Fund
| | Sales
Charges
| | | Affiliated
Broker-dealers
| | | Non-affiliated
Broker-dealers
| | | Contingent
Deferred
Sales Charges
| | | Contingent
Deferred
Sales Charges
| |
Commodity Strategy | | $ | 1,996 | | | $ | 740 | | | $ | 965 | | | $ | — | | | $ | 51 | |
ESG Dividend | | | 29,667 | | | | 16,376 | | | | 9,202 | | | | — | | | | — | |
Focused Alpha Large-Cap | | | 285,129 | | | | 74,355 | | | | 168,512 | | | | — | | | | 1,441 | |
Focused Growth | | | 432,252 | | | | 132,578 | | | | 235,424 | | | | 6,227 | | | | 2,330 | |
Income Explorer | | | 34,992 | | | | 10,890 | | | | 18,247 | | | | — | | | | 772 | |
Small-Cap | | | 38,504 | | | | 22,723 | | | | 9,823 | | | | — | | | | 41 | |
The Trust has entered into a Service Agreement with AIG Fund Services, Inc. (“AFS”), an affiliate of the Adviser. Under the Service Agreement, AFS performs certain shareholder account functions by assisting the Funds’ transfer agent, DST Asset Manager Solutions, Inc. (“DST”), in connection with the services that it offers to the shareholders of the Funds. Pursuant to the Service Agreement, the Funds pay a fee to AFS for services rendered based upon an annual rate of 0.22% of daily net assets. For the year ended October 31, 2020, the Funds incurred the following expenses which are included in transfer agent fees payable in the Statement of Assets and Liabilities and in transfer agent fees and expenses in the Statement of Operations, to compensate AFS pursuant to the terms of the Service Agreement.
| | | | | | | | |
Fund
| | Expenses
| | | Payable at
October 31, 2020
| |
Commodity Strategy Class A | | $ | 53,135 | | | $ | 4,558 | |
Commodity Strategy Class C | | | 1,426 | | | | 78 | |
Commodity Strategy Class W | | | 2,171 | | | | 123 | |
ESG Dividend Class A | | | 51,006 | | | | 5,263 | |
ESG Dividend Class C | | | 2,731 | | | | 300 | |
ESG Dividend Class W | | | 14,210 | | | | 1,446 | |
Focused Alpha Large-Cap Class A | | | 1,240,731 | | | | 112,064 | |
Focused Alpha Large-Cap Class C | | | 70,382 | | | | 5,307 | |
Focused Alpha Large-Cap Class W | | | 60,861 | | | | 7,362 | |
Focused Growth Class A | | | 1,048,917 | | | | 105,602 | |
Focused Growth Class C | | | 109,780 | | | | 10,032 | |
Focused Growth Class W | | | 90,192 | | | | 8,174 | |
Income Explorer Class A | | | 73,005 | | | | 5,980 | |
Income Explorer Class C | | | 6,493 | | | | 477 | |
Income Explorer Class W | | | 7,832 | | | | 430 | |
Small-Cap Class A | | | 72,715 | | | | 6,199 | |
Small-Cap Class C | | | 4,465 | | | | 312 | |
Small-Cap Class W | | | 6,643 | | | | 379 | |
SunAmerica Specialty Series
NOTES TO FINANCIAL STATEMENTS — October 31, 2020 — (continued)
At October 31, 2020, SunAmerica Series, Inc. AIG Active Allocation Fund and AIG Multi-Asset Allocation Fund (“Strategy Funds”), affiliates of the Adviser owned 5% or more of the outstanding shares of the following Funds:
| | | | | | | | |
| | | Holder
| |
Fund
| | Active
Allocation Fund
| | | Multi-Asset
Allocation Fund
| |
Commodity Strategy | | | 3.40 | % | | | 76.82 | % |
ESG Dividend | | | 13.67 | | | | 52.75 | |
Income Explorer | | | 11.82 | | | | 53.00 | |
Small-Cap | | | 9.31 | | | | 55.20 | |
The Strategy Portfolios do not invest in the underlying funds for the purpose of exercising management or control; however, investments by these Portfolios within the set limits across their asset allocations may represent a significant portion of net assets of the underlying funds.
Note 5. Purchases and Sales of Investment Securities
The cost of purchases and proceeds from sales and maturities of long-term investments during the year ended October 31, 2020 were as follows:
| | | | | | | | | | | | | | | | |
Fund
| | Purchases
of portfolio
securities
(excluding U.S.
government
securities)
| | | Sales
of portfolio
securities
(excluding U.S.
government
securities)
| | | Purchases
of U.S.
government
securities
| | | Sales
of U.S.
government
securities
| |
Commodity Strategy | | $ | 16,393 | | | $ | 132,265 | | | $ | — | | | $ | 1,000,009 | |
ESG Dividend | | | 27,939,686 | | | | 21,245,639 | | | | — | | | | — | |
Focused Alpha Large-Cap | | | 462,258,356 | | | | 525,882,230 | | | | — | | | | — | |
Focused Growth | | | 294,542,297 | | | | 423,873,979 | | | | — | | | | — | |
Income Explorer | | | 53,591,302 | | | | 55,486,960 | | | | — | | | | — | |
Small-Cap | | | 25,288,880 | | | | 33,285,718 | | | | — | | | | — | |
Note 6. Federal Income Taxes
The following details the tax basis distributions as well as the components of distributable earnings. The tax basis components of distributable earnings differ from the amounts reflected in the Statement of Assets and Liabilities by temporary book/tax differences primarily due to taxable income from wholly owned foreign subsidiary, amortization of organizational costs, investments in passive foreign investment companies, investments in real estate investment trusts, investments in partnerships, wash sales and derivative transactions.
| | | | | | | | | | | | | | | | | | | | | | | | |
| | | Distributable Earnings
| | | Tax Distributions
| |
| | | For the year ended October 31, 2020
| |
Fund
| | Ordinary
Income
| | | Long-term
Gains/ Capital
Loss Carryover
| | | Unrealized
Appreciation
(Depreciation)*
| | | Ordinary
Income
| | | Long-Term
Capital Gains
| | | Return
of Capital
| |
AIG Commodity Strategy# | | $ | — | | | $ | (83,764,755 | ) | | $ | (16,687,895 | ) | | $ | 215,638 | | | $ | — | | | $ | — | |
AIG ESG Dividend | | | 35,350 | | | | (694,349 | ) | | | 768,621 | | | | 717,721 | | | | — | | | | — | |
AIG Focused Alpha Large-Cap | | | — | | | | 59,430,931 | | | | 114,614,617 | | | | 89,198 | | | | 64,662,211 | | | | — | |
AIG Focused Growth | | | — | | | | 65,948,971 | | | | 212,023,703 | | | | — | | | | 54,731,618 | | | | — | |
AIG Income Explorer | | | — | | | | (2,054,470 | ) | | | (3,703,550 | ) | | | 1,316,020 | | | | — | | | | 79,658 | |
AIG Small-Cap | | | — | | | | (865,558 | ) | | | 1,039,878 | | | | 26 | | | | 1,042,743 | | | | — | |
| * | Unrealized appreciation (depreciation) includes amounts for derivatives and other assets and liabilities denominated in foreign currency. |
| # | Consolidated (see Note 2) |
| | | | | | | | |
| | | Tax Distributions
| |
| | | For the year ended
October 31, 2019
| |
Fund
| | Ordinary
Income
| | | Long-Term
Capital Gains
| |
AIG Commodity Strategy | | $ | 25,732 | | | $ | — | |
AIG ESG Dividend | | | 924,735 | | | | 1,650,859 | |
AIG Focused Alpha Large-Cap | | | — | | | | 104,688,935 | |
AIG Focused Growth | | | — | | | | 122,154,493 | |
AIG Income Explorer | | | 2,279,752 | | | | 435,289 | |
AIG Small-Cap | | | 260,473 | | | | 5,996,624 | |
SunAmerica Specialty Series
NOTES TO FINANCIAL STATEMENTS — October 31, 2020 — (continued)
As of October 31, 2020, for Federal income tax purposes, the Funds indicated below have capital loss carryforwards, which are available to offset future capital gains, if any:
| | | | | | | | |
| | | Unlimited
| |
Fund
| | ST
| | | LT
| |
Commodity Strategy# | | $ | 51,864,246 | | | $ | 31,900,509 | |
ESG Dividend | | | — | | | | 694,349 | |
Focused Alpha Large-Cap | | | — | | | | — | |
Focused Growth | | | — | | | | — | |
Income Explorer | | | 1,697,959 | | | | 356,511 | |
Small-Cap | | | 865,558 | | | | — | |
The Funds indicated below utilized capital loss carryforwards which offset net realized taxable gains, in the period ended October 31, 2020.
| | | | |
Fund
| | Capital Loss
Carryforward Utilized
| |
AIG Commodity Strategy | | $ | 4,704 | |
AIG ESG Dividend | | | — | |
AIG Focused Alpha Large-Cap | | | — | |
AIG Focused Growth | | | — | |
AIG Income Explorer | | | — | |
AIG Small-Cap | | | — | |
Under the current tax law, late year ordinary losses may be deferred and treated as occurring on the first day of the following year. For the fiscal year ended October 31, 2020 the Funds elected to defer late year ordinary losses as follows:
| | | | | | | | | | | | |
Fund
| | Deferred Late Year
Ordinary Loss
| | | Deferred Post-
October Short-Term
Capital Loss
| | | Deferred Post-
October Long-Term
Capital Loss
| |
AIG Commodity Strategy | | $ | 122,487 | | | $ | — | | | $ | — | |
AIG ESG Dividend | | | — | | | | — | | | | — | |
AIG Focused Alpha Large-Cap | | | 62,129 | | | | — | | | | — | |
AIG Focused Growth | | | 3,363,125 | | | | — | | | | — | |
AIG Income Explorer | | | — | | | | — | | | | — | |
AIG Small-Cap | | | 78,098 | | | | — | | | | — | |
For the period ended October 31, 2020, the reclassifications arising from book/tax differences resulted in increases (decreases) that were due to deconsolidation adjustments of the wholly owned foreign subsidiaries, derivative transactions, net investment losses, treatment of foreign currency, capital loss carryforwards acquired as a result of mergers, and equalization debits to the components of net assets as follows:
| | | | | | | | | | | | |
Fund
| | Accumulated
Undistributed
Net Investment
Income (Loss)
| | | Accumulated
Undistributed Net
Realized Gain
(Loss)
| | | Capital Paid-in
| |
AIG Commodity Strategy | | $ | 119,304 | | | $ | 2,759,340 | | | $ | (2,878,644 | ) |
AIG ESG Dividend | | | — | | | | — | | | | — | |
AIG Focused Alpha Large-Cap | | | 361,785 | | | | 10,980 | | | | (372,765 | ) |
AIG Focused Growth | | | 3,014,823 | | | | (7,504 | ) | | | (3,007,319 | ) |
AIG Income Explorer | | | 30,179 | | | | 17,715 | | | | (47,894 | ) |
AIG Small-Cap | | | 51,180 | | | | (21,272 | ) | | | (29,908 | ) |
At October 31, 2020 the amounts of aggregate unrealized gain (loss) and the cost of investment securities for federal tax purposes, including short-term securities and repurchase agreements, were as follows:
| | | | | | | | | | | | | | | | |
Fund
| | Aggregate
Unrealized
Gain@
| | | Aggregate
Unrealized
Loss@
| | | Net
Unrealized
Gain/
(Loss)@
| | | Cost of
Investments
| |
Commodity Strategy# | | $ | 2,318,500 | | | $ | (19,738,012 | ) | | $ | (17,419,512 | ) | | $ | 42,700,210 | |
ESG Dividend | | | 3,966,595 | | | | (3,197,974 | ) | | | 768,621 | | | | 35,624,125 | |
Focused Alpha Large-Cap | | | 134,873,318 | | | | (20,258,701 | ) | | | 114,614,617 | | | | 512,139,375 | |
Focused Growth | | | 213,593,411 | | | | (1,569,708 | ) | | | 212,023,703 | | | | 373,313,356 | |
Income Explorer | | | 227,849 | | | | (3,932,343 | ) | | | (3,704,494 | ) | | | 38,571,542 | |
Small-Cap | | | 5,904,403 | | | | (4,864,525 | ) | | | 1,039,878 | | | | 34,035,035 | |
| # | Consolidated (see Note 2) |
| @ | Unrealized appreciation (depreciation) includes amounts for derivatives. |
SunAmerica Specialty Series
NOTES TO FINANCIAL STATEMENTS — October 31, 2020 — (continued)
Note 7. Capital Share Transactions
Transactions in capital shares of each class of each Fund were as follows:
| | | | | | | | | | | | | | | | | | | | | | | | | | | | | | | | |
| | | Commodity Strategy Fund#
| |
| | | Class A
| | | Class A
| | | Class C
| | | Class C
| |
| | | For the
year ended
October 31, 2020
| | | For the
year ended
October 31, 2019
| | | For the
year ended
October 31, 2020
| | | For the
year ended
October 31, 2019
| |
| | | Shares
| | | Amount
| | | Shares
| | | Amount
| | | Shares
| | | Amount
| | | Shares
| | | Amount
| |
Shares sold | | | 782,846 | | | $ | 4,419,016 | | | | 744,193 | | | $ | 4,923,330 | | | | 5,337 | | | $ | 28,819 | | | | 11,429 | | | $ | 72,103 | |
Reinvested shares | | | 30,664 | | | | 197,170 | | | | 3,240 | | | | 21,807 | | | | — | | | | — | | | | — | | | | — | |
Shares redeemed | | | (1,311,078 | ) | | | (7,909,509 | ) | | | (925,463 | ) | | | (6,056,798 | ) | | | (93,211 | ) | | | (536,279 | ) | | | (125,105 | ) | | | (783,222 | ) |
| | |
|
|
| |
|
|
| |
|
|
| |
|
|
| |
|
|
| |
|
|
| |
|
|
| |
|
|
|
Net increase (decrease) in shares outstanding before automatic conversion | | | (497,568 | ) | | | (3,293,323 | ) | | | (178,030 | ) | | | (1,111,661 | ) | | | (87,874 | ) | | | (507,460 | ) | | | (113,676 | ) | | | (711,119 | ) |
Shares issued/(reacquired) upon automatic conversion | | | 35,587 | | | | 213,610 | | | | 7,901 | | | | 51,136 | | | | (37,363 | ) | | | (213,610 | ) | | | (8,303 | ) | | | (51,136 | ) |
| | |
|
|
| |
|
|
| |
|
|
| |
|
|
| |
|
|
| |
|
|
| |
|
|
| |
|
|
|
Net increase (decrease) | | | (461,981 | ) | | $ | (3,079,713 | ) | | | (170,129 | ) | | $ | (1,059,525 | ) | | | (125,237 | ) | | $ | (721,070 | ) | | | (121,979 | ) | | $ | (763,255 | ) |
| | |
|
|
| |
|
|
| |
|
|
| |
|
|
| |
|
|
| |
|
|
| |
|
|
| |
|
|
|
| | | | | |
| | | Commodity Strategy Fund#
| | | | | | | | | | | | | |
| | | Class W
| | | Class W
| | | | | | | | | | | | | |
| | | For the
year ended
October 31, 2020
| | | For the
year ended
October 31, 2019
| | | | | | | | | | | | | |
| | | Shares
| | | Amount
| | | Shares
| | | Amount
| | | | | | | | | | | | | |
Shares sold | | | 53,202 | | | $ | 342,792 | | | | 127,061 | | | $ | 850,819 | | | | | | | | | | | | | | | | �� | |
Reinvested shares | | | 2,254 | | | | 14,673 | | | | 478 | | | | 3,253 | | | | | | | | | | | | | | | | | |
Shares redeemed | | | (193,132 | ) | | | (1,170,246 | ) | | | (152,650 | ) | | | (1,030,981 | ) | | | | | | | | | | | | | | | | |
| | |
|
|
| |
|
|
| |
|
|
| |
|
|
| | | | | | | | | | | | | | | | |
Net increase (decrease) | | | (137,676 | ) | | $ | (812,781 | ) | | | (25,111 | ) | | $ | (176,909 | ) | | | | | | | | | | | | | | | | |
| | |
|
|
| |
|
|
| |
|
|
| |
|
|
| | | | | | | | | | | | | | | | |
| # | Consolidated (see Note 2) |
| | | | | | | | | | | | | | | | | | | | | | | | | | | | | | | | |
| | | ESG Dividend Fund
| |
| | | Class A
| | | Class A
| | | Class C
| | | Class C
| |
| | | For the
year ended
October 31, 2020
| | | For the
year ended
October 31, 2019
| | | For the
year ended
October 31, 2020
| | | For the
year ended
October 31, 2019
| |
| | | Shares
| | | Amount
| | | Shares
| | | Amount
| | | Shares
| | | Amount
| | | Shares
| | | Amount
| |
Shares sold | | | 715,337 | | | $ | 9,304,685 | | | | 212,418 | | | $ | 2,936,076 | | | | 73,004 | | | $ | 966,574 | | | | 44,290 | | | $ | 601,260 | |
Reinvested shares | | | 39,147 | | | | 522,423 | | | | 149,957 | | | | 2,162,528 | | | | 1,539 | | | | 20,527 | | | | 2,866 | | | | 41,372 | |
Shares redeemed | | | (234,240 | ) | | | (3,333,920 | ) | | | (413,727 | ) | | | (6,051,867 | ) | | | (34,685 | ) | | | (466,124 | ) | | | (3,122 | ) | | | (45,215 | ) |
| | |
|
|
| |
|
|
| |
|
|
| |
|
|
| |
|
|
| |
|
|
| |
|
|
| |
|
|
|
Net increase (decrease) | | | 520,244 | | | $ | 6,493,188 | | | | (51,352 | ) | | $ | (953,263 | ) | | | 39,858 | | | $ | 520,977 | | | | 44,034 | | | $ | 597,417 | |
| | |
|
|
| |
|
|
| |
|
|
| |
|
|
| |
|
|
| |
|
|
| |
|
|
| |
|
|
|
| | | | | |
| | | ESG Dividend Fund
| | | | | | | | | | | | | |
| | | Class W
| | | Class W
| | | | | | | | | | | | | |
| | | For the
year ended
October 31, 2020
| | | For the
year ended
October 31, 2019
| | | | | | | | | | | | | |
| | | Shares
| | | Amount
| | | Shares
| | | Amount
| | | | | | | | | | | | | |
Shares sold | | | 295,030 | | | $ | 4,127,530 | | | | 516,899 | | | $ | 7,556,893 | | | | | | | | | | | | | | | | | |
Reinvested shares | | | 11,967 | | | | 162,440 | | | | 25,200 | | | | 365,215 | | | | | | | | | | | | | | | | | |
Shares redeemed | | | (361,109 | ) | | | (5,481,861 | ) | | | (92,826 | ) | | | (1,338,906 | ) | | | | | | | | | | | | | | | | |
| | |
|
|
| |
|
|
| |
|
|
| |
|
|
| | | | | | | | | | | | | | | | |
Net increase (decrease) | | | (54,112 | ) | | $ | (1,191,891 | ) | | | 449,273 | | | $ | 6,583,202 | | | | | | | | | | | | | | | | | |
| | |
|
|
| |
|
|
| |
|
|
| |
|
|
| | | | | | | | | | | | | | | | |
SunAmerica Specialty Series
NOTES TO FINANCIAL STATEMENTS — October 31, 2020 — (continued)
| | | | | | | | | | | | | | | | | | | | | | | | | | | | | | | | |
| |
| | | Focused Alpha Large-Cap Fund
| |
| | | Class A
| | | Class A
| | | Class C
| | | Class C
| |
| | | For the
year ended
October 31, 2020
| | | For the
year ended
October 31, 2019
| | | For the
year ended
October 31, 2020
| | | For the
year ended
October 31, 2019
| |
| | | Shares
| | | Amount
| | | Shares
| | | Amount
| | | Shares
| | | Amount
| | | Shares
| | | Amount
| |
Shares sold | | | 767,566 | | | $ | 20,909,471 | | | | 788,384 | | | $ | 21,185,928 | | | | 439,000 | | | $ | 11,493,874 | | | | 298,457 | | | $ | 7,277,088 | |
Reinvested shares | | | 2,166,932 | | | | 56,145,211 | | | | 3,597,827 | | | | 90,593,272 | | | | 152,188 | | | | 3,643,371 | | | | 243,728 | | | | 5,754,416 | |
Shares redeemed | | | (3,083,382 | ) | | | (83,270,436 | ) | | | (2,673,521 | ) | | | (73,772,251 | ) | | | (788,429 | ) | | | (20,482,952 | ) | | | (391,153 | ) | | | (9,890,641 | ) |
| | |
|
|
| |
|
|
| |
|
|
| |
|
|
| |
|
|
| |
|
|
| |
|
|
| |
|
|
|
Net increase (decrease) in shares outstanding before automatic conversion | | | (148,884 | ) | | | (6,215,754 | ) | | | 1,712,690 | | | | 38,006,949 | | | | (197,241 | ) | | | (5,345,707 | ) | | | 151,032 | | | | 3,140,863 | |
Shares issued/(reacquired) upon automatic conversion | | | 256,484 | | | | 7,625,274 | | | | 39,916 | | | | 1,127,361 | | | | (279,082 | ) | | | (7,625,274 | ) | | | (42,633 | ) | | | (1,127,361 | ) |
| | |
|
|
| |
|
|
| |
|
|
| |
|
|
| |
|
|
| |
|
|
| |
|
|
| |
|
|
|
Net increase (decrease) | | | 107,600 | | | $ | 1,409,520 | | | | 1,752,606 | | | $ | 39,134,310 | | | | (476,323 | ) | | $ | (12,970,981 | ) | | | 108,399 | | | $ | 2,013,502 | |
| | |
|
|
| |
|
|
| |
|
|
| |
|
|
| |
|
|
| |
|
|
| |
|
|
| |
|
|
|
| | | | | |
| | | Focused Alpha Large-Cap Fund
| | | | | | | | | | | | | |
| | | Class W
| | | Class W
| | | | | | | | | | | | | |
| | | For the
year ended
October 31, 2020
| | | For the
year ended
October 31, 2019
| | | | | | | | | | | | | |
| | | Shares
| | | Amount
| | | Shares
| | | Amount
| | | | | | | | | | | | | |
Shares sold | | | 910,896 | | | $ | 25,666,076 | | | | 318,807 | | | $ | 9,137,453 | | | | | | | | | | | | | | | | | |
Reinvested shares | | | 78,680 | | | | 2,078,729 | | | | 117,540 | | | | 3,007,853 | | | | | | | | | | | | | | | | | |
Shares redeemed | | | (477,490 | ) | | | (12,541,973 | ) | | | (278,699 | ) | | | (7,761,212 | ) | | | | | | | | | | | | | | | | |
| | |
|
|
| |
|
|
| |
|
|
| |
|
|
| | | | | | | | | | | | | | | | |
Net increase (decrease) | | | 512,086 | | | $ | 15,202,832 | | | | 157,648 | | | $ | 4,384,094 | | | | | | | | | | | | | | | | | |
| | |
|
|
| |
|
|
| |
|
|
| |
|
|
| | | | | | | | | | | | | | | | |
| |
| | | Focused Growth Fund
| |
| | | Class A
| | | Class A
| | | Class C
| | | Class C
| |
| | | For the
year ended
October 31, 2020
| | | For the
year ended
October 31, 2019
| | | For the
year ended
October 31, 2020
| | | For the
year ended
October 31, 2019
| |
| | | Shares
| | | Amount
| | | Shares
| | | Amount
| | | Shares
| | | Amount
| | | Shares
| | | Amount
| |
Shares sold | | | 1,264,914 | | | $ | 34,384,961 | | | | 1,222,201 | | | $ | 30,798,053 | | | | 311,696 | | | $ | 7,566,217 | | | | 318,215 | | | $ | 7,362,172 | |
Reinvested shares | | | 1,797,829 | | | | 42,177,071 | | | | 3,675,722 | | | | 87,813,005 | | | | 237,846 | | | | 5,125,588 | | | | 572,895 | | | | 12,764,097 | |
Shares redeemed | | | (3,266,776 | ) | | | (84,914,895 | ) | | | (3,546,402 | ) | | | (90,930,305 | ) | | | (953,603 | ) | | | (23,161,363 | ) | | | (981,090 | ) | | | (22,907,904 | ) |
| | |
|
|
| |
|
|
| |
|
|
| |
|
|
| |
|
|
| |
|
|
| |
|
|
| |
|
|
|
Net increase (decrease) in shares outstanding before automatic conversion | | | (204,033 | ) | | | (8,352,863 | ) | | | 1,351,521 | | | | 27,680,753 | | | | (404,061 | ) | | | (10,469,558 | ) | | | (89,980 | ) | | | (2,781,635 | ) |
Shares issued/(reacquired) upon automatic conversion | | | 88,651 | | | | 2,751,928 | | | | 46,641 | | | | 1,276,839 | | | | (96,970 | ) | | | (2,751,928 | ) | | | (50,118 | ) | | | (1,276,839 | ) |
| | |
|
|
| |
|
|
| |
|
|
| |
|
|
| |
|
|
| |
|
|
| |
|
|
| |
|
|
|
Net increase (decrease) | | | (115,382 | ) | | $ | (5,600,935 | ) | | | 1,398,162 | | | $ | 28,957,592 | | | | (501,031 | ) | | $ | (13,221,486 | ) | | | (140,098 | ) | | $ | (4,058,474 | ) |
| | |
|
|
| |
|
|
| |
|
|
| |
|
|
| |
|
|
| |
|
|
| |
|
|
| |
|
|
|
SunAmerica Specialty Series
NOTES TO FINANCIAL STATEMENTS — October 31, 2020 — (continued)
| | | | | | | | | | | | | | | | | | | | | | | | | | | | | | | | |
| | | Focused Growth Fund
| | | | | | | | | | | | | |
| | | Class W
| | | Class W
| | | | | | | | | | | | | |
| | | For the
year ended
October 31, 2020
| | | For the
year ended
October 31, 2019
| | | | | | | | | | | | | |
| | | Shares
| | | Amount
| | | Shares
| | | Amount
| | | | | | | | | | | | | |
Shares sold | | | 584,747 | | | $ | 16,286,467 | | | | 997,214 | | | $ | 25,912,229 | | | | | | | | | | | | | | | | | |
Reinvested shares | | | 176,418 | | | | 4,239,325 | | | | 558,388 | | | | 13,607,909 | | | | | | | | | | | | | | | | | |
Shares redeemed | | | (1,297,263 | ) | | | (33,691,051 | ) | | | (2,203,896 | ) | | | (57,152,413 | ) | | | | | | | | | | | | | | | | |
| | |
|
|
| |
|
|
| |
|
|
| |
|
|
| | | | | | | | | | | | | | | | |
Net increase (decrease) | | | (536,098 | ) | | $ | (13,165,259 | ) | | | (648,294 | ) | | $ | (17,632,275 | ) | | | | | | | | | | | | | | | | |
| | |
|
|
| |
|
|
| |
|
|
| |
|
|
| | | | | | | | | | | | | | | | |
| |
| | | Income Explorer Fund
| |
| | | Class A
| | | Class A
| | | Class C
| | | Class C
| |
| | | For the
year ended
October 31, 2020
| | | For the
year ended
October 31, 2019
| | | For the
year ended
October 31, 2020
| | | For the
year ended
October 31, 2019
| |
| | | Shares
| | | Amount
| | | Shares
| | | Amount
| | | Shares
| | | Amount
| | | Shares
| | | Amount
| |
Shares sold | | | 377,709 | | | $ | 5,445,670 | | | | 135,064 | | | $ | 2,031,486 | | | | 12,486 | | | $ | 186,001 | | | | 12,751 | | | $ | 191,162 | |
Reinvested shares | | | 83,108 | | | | 1,165,778 | | | | 147,350 | | | | 2,168,866 | | | | 5,628 | | | | 79,049 | | | | 12,393 | | | | 181,811 | |
Shares redeemed | | | (466,089 | ) | | | (6,832,247 | ) | | | (1,045,118 | ) | | | (15,474,668 | ) | | | (66,469 | ) | | | (974,327 | ) | | | (92,783 | ) | | | (1,356,710 | ) |
| | |
|
|
| |
|
|
| |
|
|
| |
|
|
| |
|
|
| |
|
|
| |
|
|
| |
|
|
|
Net increase (decrease) in shares outstanding before automatic conversion | | | (5,272 | ) | | | (220,799 | ) | | | (762,704 | ) | | | (11,274,316 | ) | | | (48,355 | ) | | | (709,277 | ) | | | (67,639 | ) | | | (983,737 | ) |
Shares issued/(reacquired) upon automatic conversion | | | 4,624 | | | | 70,964 | | | | 313 | | | | 4,655 | | | | (4,634 | ) | | | (70,964 | ) | | | (314 | ) | | | (4,655 | ) |
| | |
|
|
| |
|
|
| |
|
|
| |
|
|
| |
|
|
| |
|
|
| |
|
|
| |
|
|
|
Net increase (decrease) | | | (648 | ) | | $ | (149,835 | ) | | | (762,391 | ) | | $ | (11,269,661 | ) | | | (52,989 | ) | | $ | (780,241 | ) | | | (67,953 | ) | | $ | (988,392 | ) |
| | |
|
|
| |
|
|
| |
|
|
| |
|
|
| |
|
|
| |
|
|
| |
|
|
| |
|
|
|
| | | | | |
| | | Income Explorer Fund
| | | | | | | | | | | | | |
| | | Class W
| | | Class W
| | | | | | | | | | | | | |
| | | For the
year ended
October 31, 2020
| | | For the
year ended
October 31, 2019
| | | | | | | | | | | | | |
| | | Shares
| | | Amount
| | | Shares
| | | Amount
| | | | | | | | | | | | | |
Shares sold | | | 215,949 | | | $ | 3,322,256 | | | | 190,641 | | | $ | 2,861,249 | | | | | | | | | | | | | | | | | |
Reinvested shares | | | 8,268 | | | | 117,041 | | | | 22,280 | | | | 327,940 | | | | | | | | | | | | | | | | | |
Shares redeemed | | | (341,294 | ) | | | (4,789,299 | ) | | | (358,698 | ) | | | (5,389,895 | ) | | | | | | | | | | | | | | | | |
| | |
|
|
| |
|
|
| |
|
|
| |
|
|
| | | | | | | | | | | | | | | | |
Net increase (decrease) | | | (117,077 | ) | | $ | (1,350,002 | ) | | | (145,777 | ) | | $ | (2,200,706 | ) | | | | | | | | | | | | | | | | |
| | |
|
|
| |
|
|
| |
|
|
| |
|
|
| | | | | | | | | | | | | | | | |
| |
| | | Small-Cap Fund
| |
| | | Class A
| | | Class A
| | | Class C
| | | Class C
| |
| | | For the
year ended
October 31, 2020
| | | For the
year ended
October 31, 2019
| | | For the
year ended
October 31, 2020
| | | For the
year ended
October 31, 2019
| |
| | | Shares
| | | Amount
| | | Shares
| | | Amount
| | | Shares
| | | Amount
| | | Shares
| | | Amount
| |
Shares sold | | | 293,038 | | | $ | 3,889,280 | | | | 240,834 | | | $ | 3,983,989 | | | | 14,113 | | | $ | 206,692 | | | | 113,637 | | | $ | 1,668,816 | |
Reinvested shares | | | 50,781 | | | | 848,038 | | | | 293,816 | | | | 4,703,992 | | | | 3,755 | | | | 59,748 | | | | 19,319 | | | | 296,934 | |
Shares redeemed | | | (516,505 | ) | | | (7,819,021 | ) | | | (928,129 | ) | | | (15,253,977 | ) | | | (70,157 | ) | | | (980,838 | ) | | | (138,723 | ) | | | (2,191,269 | ) |
| | |
|
|
| |
|
|
| |
|
|
| |
|
|
| |
|
|
| |
|
|
| |
|
|
| |
|
|
|
Net increase (decrease) in shares outstanding before automatic conversion | | | (172,686 | ) | | | (3,081,703 | ) | | | (393,479 | ) | | | (6,565,996 | ) | | | (52,289 | ) | | | (714,398 | ) | | | (5,767 | ) | | | (225,519 | ) |
Shares issued/(reacquired) upon automatic conversion | | | 860 | | | | 13,909 | | | | 203 | | | | 3,424 | | | | (906 | ) | | | (13,909 | ) | | | (211 | ) | | | (3,424 | ) |
| | |
|
|
| |
|
|
| |
|
|
| |
|
|
| |
|
|
| |
|
|
| |
|
|
| |
|
|
|
Net increase (decrease) | | | (171,826 | ) | | $ | (3,067,794 | ) | | | (393,276 | ) | | $ | (6,562,572 | ) | | | (53,195 | ) | | $ | (728,307 | ) | | | (5,978 | ) | | $ | (228,943 | ) |
| | |
|
|
| |
|
|
| |
|
|
| |
|
|
| |
|
|
| |
|
|
| |
|
|
| |
|
|
|
SunAmerica Specialty Series
NOTES TO FINANCIAL STATEMENTS — October 31, 2020 — (continued)
| | | | | | | | | | | | | | | | | | | | | | | | | | | | | | | | |
| | | | | |
| | | Small-Cap Fund
| | | | | | | | | | | | | |
| | | Class W
| | | Class W
| | | | | | | | | | | | | |
| | | For the
year ended
October 31, 2020
| | | For the
year ended
October 31, 2019
| | | | | | | | | | | | | |
| | | Shares
| | | Amount
| | | Shares
| | | Amount
| | | | | | | | | | | | | |
Shares sold | | | 27,171 | | | $ | 394,662 | | | | 243,488 | | | $ | 4,044,751 | | | | | | | | | | | | | | | | | |
Reinvested shares | | | 7,682 | | | | 130,124 | | | | 73,950 | | | | 1,198,001 | | | | | | | | | | | | | | | | | |
Shares redeemed | | | (265,169 | ) | | | (4,049,360 | ) | | | (835,445 | ) | | | (13,828,393 | ) | | | | | | | | | | | | | | | | |
| | |
|
|
| |
|
|
| |
|
|
| |
|
|
| | | | | | | | | | | | | | | | |
Net increase (decrease) | | | (230,316 | ) | | $ | (3,524,574 | ) | | | (518,007 | ) | | $ | (8,585,641 | ) | | | | | | | | | | | | | | | | |
| | |
|
|
| |
|
|
| |
|
|
| |
|
|
| | | | | | | | | | | | | | | | |
Note 8. Line of Credit
The Trust, along with certain other funds managed by the Adviser and exclusive of the Commodity Strategy Fund, has access to a $75 million committed unsecured line of credit and a $50 million uncommitted unsecured line of credit. The Commodity Strategy Fund has access to a $10 million committed secured line of credit. The committed and uncommitted lines of credit are renewable on an annual basis with State Street Bank and Trust Company (“State Street”), the Trust’s custodian. Prior to September 4, 2020, interest was payable on the committed line of credit at the higher of the Federal Funds Rate (but not less than zero) plus 125 basis points or the One-Month London Interbank Offered Rate (but not less than zero) plus 125 basis points and State Street’s discretionary bid rate on the uncommitted line of credit. The Trust, on behalf of each of the Funds, has paid State Street for its own account, such Fund’s ratable portion of an upfront fee in an amount equal to $25,000 in the aggregate for the uncommitted line of credit made available by State Street to certain other funds managed by the Adviser, which are also party to the uncommitted line of credit. There was also a commitment fee of 25 basis points per annum on the daily unused portion of the committed line of credit. Effective September 4, 2020, interest on each of the committed and uncommitted lines of credit is payable at a variable rate per annum equal to the Applicable Rate plus one and one quarter of one percent (1.25%). The Applicable Rate per annum shall be equal to the higher of (a) the Federal Funds Effective Rate on such date and (b) the Overnight Bank Funding Rate on such date, plus, in each case, 10 basis points. Notwithstanding anything to the contrary, if the Federal Funds Effective Rate or the Overnight Bank Funding Rate shall be less than zero, then the Federal Funds Effective Rate or the Overnight Bank Funding Rate, shall be deemed to be zero for the purposes of determining the rate. The Trust, on behalf of each of the Funds, has paid State Street for its own account, such Fund’s ratable portion of an upfront fee in an amount equal to $40,000 in the aggregate for the uncommitted line of credit made available by State Street to certain other funds managed by the Adviser, which are also party to the uncommitted line of credit. There is also a commitment fee of 30 basis points per annum on the daily unused portion of the committed line of credit.
Borrowings under the line of credit will commence when the respective Fund’s cash shortfall exceeds $100,000. For the year ended October 31, 2020, the following Funds had borrowings:
| | | | | | | | | | | | | | | | |
Fund
| | Days
Outstanding
| | | Interest
Charges
| | | Average
Debt
Utilized
| | | Weighted
Average
Interest
| |
Focused Alpha Large-Cap | | | 28 | | | $ | 889 | | | $ | 428,571 | | | | 2.38 | % |
Focused Growth | | | 156 | | | | 8,055 | | | | 736,859 | | | | 3.02 | |
Income Explorer | | | 20 | | | | 141 | | | | 178,750 | | | | 1.42 | |
Small Cap | | | 48 | | | | 905 | | | | 246,875 | | | | 2.65 | |
At October 31, 2020, none of the Funds had outstanding borrowings.
Note 9. Expense Reductions
Through expense offset arrangements resulting from broker commission recapture, a portion of the expenses of certain Funds have been reduced. For the year ended October 31, 2020, the amount of expense reductions received by each Fund used to offset non-affiliated expenses are reflected as Fees paid indirectly in the Statement of Operations.
SunAmerica Specialty Series
NOTES TO FINANCIAL STATEMENTS — October 31, 2020 — (continued)
Note 10. Interfund Lending Agreement
Pursuant to the exemptive relief granted by the SEC, the Funds are permitted to participate in an interfund lending program among investment companies advised by SunAmerica or an affiliate. The interfund lending program allows the participating Funds to borrow money from and lend money to each other for temporary or emergency purposes. An interfund loan will be made under this facility only if the participating Funds receive a more favorable interest rate than would otherwise be available from a typical bank for a comparable transaction.
For the year ended October 31, 2020, none of the Funds participated in this program.
Note 11. Investment Concentration
Each Fund may invest in obligations issued by agencies and instrumentalities of the U.S. Government that may vary in the level of support they receive from the government. The government may choose not to provide financial support to government sponsored agencies or instrumentalities if it is not legally obligated to do so, and if the issuer defaults, a fund holding securities of such issuer might not be able to recover its investment from the U.S. Government. As a result of the Commodity Strategy Funds’ concentration in such investments, these funds may be subject to risks associated with U.S. Government agencies or instrumentalities.
The Commodity Strategy Fund’s exposure to the commodities markets may subject the Fund to greater volatility than investments in traditional securities. The value of commodity-linked derivative instruments may be affected by changes in overall market movements, commodity index volatility, changes in interest rates, or sectors affecting a particular industry or commodity, such as drought, floods, weather, livestock disease, embargoes, tariffs and international economic, political and regulatory developments.
Note 12. Security Transactions with Affiliated Portfolios
The Funds are permitted to transfer securities by purchasing from and/or selling to other affiliated funds under certain conditions approved by the Board of Trustees. The affiliated funds involved in such transactions must have a common investment adviser or investment advisers which are affiliated persons of each other, common Trustees, and/or common officers in compliance with Rule 17a-7 of the 1940 Act. Pursuant to the Act, such a transaction must be either a purchase or a sale, for no consideration other than cash payment against prompt delivery of the security at the current market price. No brokerage commission or fee (except for customary transfer fees), or other remuneration is paid in connection with such transactions. For the year ended October 31, 2020, none of the Funds engaged in security transactions with affiliated Funds.
Note 13. Other Matters
An outbreak of respiratory disease caused by a novel coronavirus was first detected in China and subsequently spread internationally. This coronavirus has resulted in closing borders, enhanced health screenings, healthcare service preparation and delivery, quarantines, cancellations, disruptions to supply chains and customer activity, as well as general concern and uncertainty. The impact of this coronavirus may last for an extended period of time including through the issue date of these financial statements and has resulted in substantial market volatility and may result in a significant economic downturn.
Note 14. Subsequent Event
At a meeting held on October 15, 2020, the Board approved certain changes to the Small Cap Fund’s name and investment strategies and techniques. These changes became effective on December 15, 2020, (the “Effective Date”). As of the Effective Date, the Fund’s name changed to “AIG Small-Cap Quality Fund.” Also as of the Effective Date, the Fund seeks to achieve its investment objective by following a “buy and hold” strategy that seeks to identify and invest in approximately 75-100 small-cap equity securities on the basis of a number of quality-related measures or factors. Additionally, SunAmerica assumed the day-to-day management of the Fund and Cadence no longer serves as subadviser to the Fund.
SunAmerica Specialty Series
REPORT OF INDEPENDENT REGISTERED PUBLIC ACCOUNTING FIRM
To the Board of Trustees of SunAmerica Specialty Series and Shareholders of each of the six funds listed in the table below
Opinions on the Financial Statements
We have audited the accompanying statements of assets and liabilities, including the portfolios of investments, of each of the funds listed in the table below (constituting SunAmerica Specialty Series, hereafter collectively referred to as the “Funds”) as of the date listed in the table below and for the periods listed in the table below (collectively referred to as the “financial statements”). In our opinion, the financial statements present fairly, in all material respects, the financial position of each of the Funds as of the date listed in the table below, the results of each of their operations, the changes in each of their net assets and each of the financial highlights for each of the periods listed in the table below in conformity with accounting principles generally accepted in the United States of America.
|
| SunAmerica Specialty Series |
AIG Commodity Strategy Fund(1) |
AIG ESG Dividend Fund(2) |
AIG Focused Alpha Large-Cap Fund(3) |
AIG Focused Growth Fund(3) |
AIG Income Explorer Fund(3) |
AIG Small-Cap Fund(3) |
| (1) | The consolidated statement of assets and liabilities, including the consolidated portfolio of investments, as of October 31, 2020, the related consolidated statement of operations for the year then ended, the consolidated statement of changes in net assets for each of the two years in the period ended October 31, 2020, including the related notes, and the financial highlights for each of the five years in the period ended October 31, 2020 |
| (2) | The statement of assets and liabilities, including the portfolio of investments, as of October 31, 2020, the related statement of operations for the year then ended and the statement of changes in net assets, including the related notes, for each of the two years in the period ended October 31, 2020 and the financial highlights for each of the periods indicated therein |
| (3) | The statements of assets and liabilities, including the portfolios of investments, as of October 31, 2020, the related statements of operations for the year then ended, the statements of changes in net assets for each of the two years in the period ended October 31, 2020, including the related notes, and the financial highlights for each of the five years in the period ended October 31, 2020 |
Basis for Opinions
These financial statements are the responsibility of the Funds’ management. Our responsibility is to express an opinion on the Funds’ financial statements based on our audits. We are a public accounting firm registered with the Public Company Accounting Oversight Board (United States) (“PCAOB”) and are required to be independent with respect to the Funds in accordance with the U.S. federal securities laws and the applicable rules and regulations of the Securities and Exchange Commission and the PCAOB.
We conducted our audits of these financial statements in accordance with the standards of the PCAOB. Those standards require that we plan and perform the audit to obtain reasonable assurance about whether the financial statements are free of material misstatement, whether due to error or fraud.
Our audits included performing procedures to assess the risks of material misstatement of the financial statements, whether due to error or fraud, and performing procedures that respond to those risks. Such procedures included examining, on a test basis, evidence regarding the amounts and disclosures in the financial statements. Our audits also included evaluating the accounting principles used and significant estimates made by management, as well as evaluating the overall presentation of the financial statements. Our procedures included confirmation of securities owned as of October 31, 2020 by correspondence with the custodian, transfer agents and brokers; when replies were not received from brokers, we performed other auditing procedures. We believe that our audits provide a reasonable basis for our opinions.
/s/ PricewaterhouseCoopers LLP
Houston, Texas
December 23, 2020
We have served as the auditor of one or more investment companies in the AIG Funds family of funds since 1984.
SunAmerica Specialty Series
STATEMENT REGARDING LIQUIDITY RISK MANAGEMENT PROGRAM — (unaudited)
Pursuant to Rule 22e-4 under the 1940 Act, the Funds have adopted a liquidity risk management program. SunAmerica Asset Management, LLC (the “Adviser” or “SunAmerica”), the investment adviser to the Trust, has been designated by the Board to administer the Funds’ liquidity risk management program (the “Program”). The Adviser has appointed a Liquidity Risk Management Committee (the “Committee”) comprised of certain officers as well as certain personnel of the Adviser. The Committee is subject to the oversight of the Adviser. The Adviser and the Committee are referred to collectively herein as the “Program Administrator.” The Program is designed to assess, manage and periodically review each Fund’s liquidity risk, based on factors specific to the circumstances of each Fund. “Liquidity risk” means the risk that a Fund could not meet requests to redeem shares issued by the Fund without significant dilution of remaining investors’ interests in the Fund. During the period, the Program Administrator provided the Board with a report addressing the operations of the program and assessing its adequacy and effectiveness of implementation.
During the period covered by the liquidity Program report to the Board, the Program supported each Fund’s ability to honor redemption requests timely and the Adviser’s management of each Fund’s liquidity profile, including during periods of market volatility and net redemptions. The Program Administrator reported that it has reviewed the Program and believes that the Program is reasonably designed to assess and manage the liquidity risk of each Fund, that the Program has been effectively implemented to monitor and respond to liquidity developments (where necessary) and is operating effectively, and that the Program addresses potential liquidity risks in connection with the management of the Funds. Furthermore, the Program Administrator reported that each Fund operated as a “Primarily Highly Liquid Fund” during the review period, and therefore, did not have to comply with the Highly Liquid Investment Minimum requirements. Finally, the Program Administrator reported that each Fund had no breaches of the limit on illiquid investments, and therefore, no Board notification or regulatory filings were required.
There can be no assurance that the Program will achieve its objectives in the future. Please refer to your Fund’s prospectus for more information regarding the Fund’s exposure to liquidity risk and other principal risks to which an investment in the Fund may be subject.
SunAmerica Specialty Series
APPROVAL OF THE INVESTMENT ADVISORY AND MANAGEMENT AGREEMENTS AND SUBADVISORY AGREEMENTS — October 31, 2020 — (unaudited)
The Board of Trustees (the “Board,” the members of which are referred to as “Trustees”) of SunAmerica Specialty Series (the “Trust”), including the Trustees who are not “interested persons,” as defined in Section 2(a)(19) of the Investment Company Act of 1940, as amended (the “1940 Act”) (the “Independent Trustees”), of the Trust or its separate series (each, a “Fund,” and collectively, the “Funds”), SunAmerica Asset Management, LLC (“SunAmerica”), Wellington Management Company LLP (“Wellington”), BAMCO, Inc. (“BAMCO”), Marsico Capital Management LLC (“Marsico”), BlackRock Investment Management LLC (“BlackRock”), Cadence Capital Management, LLC (“Cadence” and together with Wellington, BAMCO, Marsico, BlackRock and Cohen and Steers, the “Subadvisers”), approved the continuation of the Investment Advisory and Management Agreements between the Trust, on behalf of each of the Funds and SunAmerica (the “Advisory Agreements”), each for a one-year period ending June 30, 2021 at a meeting held on June 2-3, 2020 (the “Meeting”).1 The Trust currently consists of the following six separate Funds: AIG Commodity Strategy Fund (the “Commodity Strategy Fund”), the AIG Focused Growth Fund (the “Focused Growth Fund”), the AIG Focused Alpha Large-Cap Fund (the “Alpha Large-Cap Fund”), the AIG Income Explorer Fund (the “Income Explorer Fund”), the AIG Small-Cap Fund (the “Small-Cap Fund”), and the AIG ESG Dividend Fund (the “ESG Dividend Fund”).
At the Meeting, the Board, including the Independent Trustees, also approved the continuation of the Subadvisory Agreement between SunAmerica and Wellington with respect to the Commodity Strategy Fund, the Subadvisory Agreement between SunAmerica and Marsico with respect to each of the Focused Growth Fund and Alpha Large-Cap Fund, the Subadvisory Agreement between SunAmerica and BAMCO with respect to the Focused Growth Fund, the Subadvisory Agreement between SunAmerica and BlackRock with respect to the Alpha Large-Cap Fund, and the Subadvisory Agreement between SunAmerica and Cadence with respect to the Small-Cap Fund each for a one-year period ending June 30, 2021 (the “Subadvisory Agreements,” and together with the Advisory Agreements, the “Agreements”).
In accordance with Section 15(c) of the 1940 Act, the Board requested, and SunAmerica and the Subadvisers provided, materials relating to the Board’s consideration of whether to approve the continuation of the Advisory Agreements and Subadvisory Agreements. These materials included, among other things: (a) a summary of the services provided to the Funds by SunAmerica and its affiliates, and by the Subadvisers; (b) information independently compiled and prepared by Broadridge Financial Solutions, Inc. (“Broadridge”), an independent third-party provider of mutual fund data, on fees and expenses of the Funds, and the investment performance of the Funds as compared with a peer group of funds, along with fee and performance data with respect to the Funds and any other mutual funds or other accounts advised or subadvised by SunAmerica or the Subadvisers with similar investment objectives and/or strategies, as applicable; (c) information on the profitability of SunAmerica and its affiliates, and a discussion relating to indirect benefits; (d) information relating to economies of scale; (e) information about SunAmerica’s general compliance policies and procedures and the services it provides in connection with its oversight of subadvisers; (f) information on SunAmerica’s and the Subadvisers’ risk management processes; (g) information regarding brokerage and soft dollar practices; and (h) information about the key personnel of SunAmerica and its affiliates, and the Subadvisers, who are involved in the investment management, administration, compliance and risk management activities with respect to the Funds, as well as current and projected staffing levels and compensation practices.
In determining whether to approve the continuation of the Advisory Agreements and Subadvisory Agreements, the Board, including the Independent Trustees, considered at the Meeting, and from time to time, as appropriate, factors that it deemed relevant, including the following information:
Nature, Extent and Quality of Services Provided by SunAmerica and the Subadvisers. The Board, including the Independent Trustees, considered the nature, extent and quality of services provided by SunAmerica. The Board noted that the services include acting as investment manager and adviser to the Funds, managing the daily business affairs of the Funds, and obtaining and evaluating economic, statistical and financial information to formulate and implement investment policies. Additionally, the Board observed that SunAmerica provides office space, bookkeeping, accounting, legal, and compliance, clerical and administrative services and has authorized its officers and employees, if elected, to serve as officers or trustees of the Trust without compensation. The Board also noted that SunAmerica is responsible for monitoring and reviewing the activities of affiliated and unaffiliated third-party service providers, including the Subadvisers. In addition to the quality of the advisory services provided by SunAmerica, the Board
| 1 | | On March 25, 2020, as a result of health and safety measures put in place to combat the global COVID-19 pandemic, the Securities and Exchange Commission issued an exemptive order (the “Order”) pursuant to Sections 6(c) and 38(a) of the 1940 Act, that temporarily exempts registered investment management companies from the in-person voting requirements under the 1940 Act, subject to certain requirements, including that votes taken pursuant to the Order are ratified at the next in-person meeting. The Board determined that reliance on the Order was necessary or appropriate due to the circumstances related to current or potential effects of COVID-19 and therefore, the June meeting was held telephonically in reliance on the Order. |
SunAmerica Specialty Series
APPROVAL OF THE INVESTMENT ADVISORY AND MANAGEMENT AGREEMENTS AND SUBADVISORY AGREEMENTS — October 31, 2020 — (unaudited) (continued)
considered the quality of the administrative and other services provided by SunAmerica to the Funds pursuant to the Advisory Agreements. The Board further considered the significant risks assumed by SunAmerica in connection with the services provided to the Funds including entrepreneurial risk in sponsoring new funds and ongoing risks such as operational, reputational, liquidity, litigation, regulatory and compliance risks with respect to all Funds.
In connection with the services provided by SunAmerica, the Board analyzed the structure and duties of SunAmerica’s fund administration, accounting, operations, legal and compliance departments and concluded that they were adequate to meet the needs of the Funds. The Board also reviewed the personnel responsible for providing advisory services to the Funds and other key personnel of SunAmerica, in addition to current and projected staffing levels and compensation practices. The Board concluded, based on its experience and interaction with SunAmerica, that: (i) SunAmerica would continue to be able to retain quality investment and other personnel; (ii) SunAmerica has exhibited a high level of diligence and attention to detail in carrying out its advisory and other responsibilities under the Advisory Agreements; (iii) SunAmerica has been responsive to requests of the Board; and (iv) SunAmerica has kept the Board apprised of developments relating to the Funds and the industry in general. The Board concluded that the nature and extent of services provided under the Advisory Agreements were reasonable and appropriate in relation to the management fee and that the quality of services continues to be high.
The Board also considered SunAmerica’s reputation and relationship with the Funds and considered the benefit to shareholders of investing in funds that are part of a family of funds offering a variety of types of mutual funds and shareholder services. The Board considered SunAmerica’s experience in providing management and investment advisory and administrative services to advisory clients and noted that as of March 31, 2020, SunAmerica managed, advised and/or administered approximately $71.8 billion in assets. In addition, the Board considered SunAmerica’s code of ethics and its commitment to compliance generally and with respect to its management and administration of the Funds. The Board also considered SunAmerica’s risk management processes. The Board also considered the performance of certain portions of the business continuity plan which have been invoked in response to the COVID-19 pandemic. The Board further observed that SunAmerica has developed internal procedures for monitoring compliance with the investment objectives, policies and restrictions of the Funds as set forth in the Funds’ prospectuses. The Board also reviewed SunAmerica’s compliance and regulatory history and noted that there were no material legal, regulatory or compliance issues that would potentially impact SunAmerica in effectively serving as the investment adviser to the Funds.
The Board also considered the nature, extent and quality of services provided by each Subadviser to the applicable Funds. The Board observed that the Subadvisers are responsible for providing day-to-day investment management services, including investment research, advice and supervision, and determining which securities will be purchased or sold by the Fund that each Subadviser manages, subject to the oversight and review of SunAmerica. The Board reviewed each Subadviser’s history, structure, size, visibility and resources, which are needed to attract and retain highly qualified investment professionals. The Board reviewed the personnel who are responsible for providing subadvisory services to the Funds and other key personnel of the Subadvisers, in addition to current and projected staffing levels and compensation practices, and concluded, based on its experience with each Subadviser, that each Subadviser: (i) has been able to retain high quality portfolio managers and other investment personnel; (ii) has exhibited a high level of diligence and attention to detail in carrying out its responsibilities under the applicable Subadvisory Agreement; and (iii) has been responsive to requests of the Board and of SunAmerica. In addition, the Board considered each Subadviser’s code of ethics and risk management processes. The Board further observed that each Subadviser has developed internal policies and procedures for monitoring compliance with the investment objectives, policies and restrictions of the Funds as set forth in the Funds’ prospectuses. The Board also reviewed each Subadviser’s compliance and regulatory history and noted that there were no material legal, regulatory or compliance issues that would potentially impact the Subadvisers in effectively serving as subadvisers to the Funds. The Board concluded that the nature and extent of services provided by the Subadvisers under the Subadvisory Agreements were reasonable and appropriate in relation to the subadvisory fees and that the quality of services continues to be high.
Investment Performance. The Board, including the Independent Trustees, also considered the investment performance of SunAmerica and the Subadvisers with respect to the Funds. In connection with its review, the Board received and reviewed information regarding the investment performance of the Funds as compared to each Fund’s peer universe (“Peer Universe”) and/or peer group (“Peer Group”) as independently determined by Broadridge and to an appropriate index or combination of indices. The Board was provided with a description of the methodology used by Broadridge to select the funds in the Peer Groups and Peer Universes.
SunAmerica Specialty Series
APPROVAL OF THE INVESTMENT ADVISORY AND MANAGEMENT AGREEMENTS AND SUBADVISORY AGREEMENTS — October 31, 2020 — (unaudited) (continued)
The Board noted that performance information was for the periods ended March 31, 2020. The Board also noted that it regularly reviews the performance of the Funds throughout the year. The Board further noted that, while it monitors performance of the Funds closely, it generally attaches more importance to performance over relatively long periods of time, typically three to five years. The Board noted that while it found the data provided by Broadridge generally useful, it recognized its limitations, including in particular that the data may vary depending on the end date selected and that the results of performance comparisons may vary depending on the selection of the peer group.
Commodity Strategy Fund. The Board considered that the Fund’s performance was above the medians of its Peer Group and Peer Universe for the one-year period and below the medians of its Peer Group and Peer Universe for the three-year period. The Board also considered that the Fund outperformed its Broadridge Index for the one-year period and underperformed its Broadridge Index for the three-year period. The Board noted management’s discussion of the Fund’s performance and the fact that Wellington had begun managing the Fund as of September 2015 under the Fund’s new name and investment strategies. The Board concluded that the Fund’s performance was being appropriately monitored.
ESG Dividend Fund. The Board considered that the Fund’s performance was equal to the median of its Peer Group for the one-year period and below the median of its Peer Group for the three-year period. The Board also noted that the Fund’s performance was above the median of its Peer Universe for the one-year period and below the median of its Peer Universe for the three-year period. The Board further noted that the Fund outperformed its Broadridge Index for the one- and three-year periods. The Board noted management’s discussion of the Fund’s performance and concluded that the Fund’s performance was satisfactory.
Focused Growth Fund. The Board considered that the Fund’s performance was below the medians of its Peer Group and Peer Universe for the one-, three- and five-year periods. The Board also noted that the Fund underperformed its Broadridge Index for the one-, three- and five-year periods. The Board took into account management’s discussion of the reasons for the Fund’s recent underperformance and concluded that the Fund’s performance was being appropriately monitored.
Alpha Large-Cap Fund. The Board considered that the Fund’s performance was below the medians of its Peer Group and Peer Universe for the one-year period and above the medians of its Peer Group and Peer Universe for the three- and five-year periods. The Board further noted that the Fund underperformed its Broadridge Index for the one-year period and outperformed its Broadridge Index for the three- and five-year periods. The Board noted management’s discussion of the Fund’s performance, including the impact of market conditions on the Fund’s performance, and concluded that the Fund’s performance was being appropriately monitored.
Income Explorer Fund. The Board noted that the Fund’s performance was below the medians of its Peer Group and Peer Universe for the one-, three- and five-year periods. The Board further noted that the Fund underperformed its Broadridge Index for the one-, three- and five-year periods. The Board noted management’s discussion of the Fund’s performance, including the Fund’s recent subadviser and investment strategy changes, and concluded that the Fund’s performance was being appropriately monitored.
Small-Cap Fund. The Board noted that the Fund’s performance was below the medians of its Peer Group and Peer Universe for the one-year period and was above the medians of its Peer Group and Peer Universe for the three- and five-year periods. The Board further noted that the Fund underperformed its Broadridge Index for the one- and three-year periods and outperformed its Broadridge Index for the five-year period. The Board noted management’s discussion of the Fund’s performance, including the impact of market conditions on the Fund’s performance, and concluded that the Fund’s performance was being appropriately monitored.
Consideration of the Management Fees and Subadvisory Fees and the Cost of the Services and Profits to be Realized by SunAmerica and the Subadvisers and their Affiliates from the Relationship with the Funds. The Board, including the Independent Trustees, received and reviewed information regarding the fees paid by the Funds to SunAmerica pursuant to the Advisory Agreements and the fees paid by SunAmerica to the Subadvisers pursuant to the Subadvisory Agreements. The Board examined this information in order to determine the reasonableness of the fees in light of the nature and quality of services to be provided and any potential additional benefits to be received by SunAmerica, the Subadvisers or their affiliates in connection with providing such services to the Funds.
To assist in analyzing the reasonableness of the management fee for each of the Funds, the Board received reports independently prepared by Broadridge. The reports showed comparative fee information for each Fund’s Peer Group and/or Peer Universe as determined by Broadridge, including rankings within each category. In considering the reasonableness of the management fee to be
SunAmerica Specialty Series
APPROVAL OF THE INVESTMENT ADVISORY AND MANAGEMENT AGREEMENTS AND SUBADVISORY AGREEMENTS — October 31, 2020 — (unaudited) (continued)
paid by each Fund to SunAmerica, the Board reviewed a number of expense comparisons, including: (i) contractual and actual management fees; and (ii) actual total operating expenses. In considering each Fund’s total operating expenses, the Board analyzed the level of fee waivers and expense reimbursements and the net expense caps contractually agreed upon by SunAmerica with respect to the Funds, as applicable. The Board further considered that, unlike the funds in the Peer Group and Peer Universe, the fee waivers and/or reimbursements being made by SunAmerica with respect to the Funds are only reflected in the total expenses category of the Broadridge reports, rather than also being reflected as specific management fee waivers in the actual management fees category of the Broadridge reports. As a result, the Board took into account that the actual management fees presented by Broadridge for the funds in the applicable Peer Groups and Peer Universes may appear lower on a relative basis. The Board also considered the various expense components of the Funds and compared each Fund’s net expense ratio (taking into account the contractual fee caps) to those of other funds within its Peer Group and/or Peer Universe as a guide to help assess the reasonableness of the management fee for the Funds. The Board acknowledged that it was difficult to make precise comparisons with other funds in the Peer Groups and Peer Universes since the exact nature of services provided under the various fund agreements is often not apparent. The Board noted, however, that the comparative fee information provided by Broadridge as a whole was useful in assessing whether SunAmerica was providing services at a cost that was competitive with other, similar funds.
The Board also considered the management fees received by SunAmerica with respect to other mutual funds and accounts with similar investment strategies to the Funds, to the extent applicable. The Board noted, however, that the mutual funds identified as similar to the Funds are sold only in the variable annuity market and, accordingly, are in different Broadridge classifications, with a peer groups consisting of funds underlying variable insurance products.
The Board also received and reviewed information regarding the fees paid by SunAmerica to the Subadvisers pursuant to the Subadvisory Agreements. To assist in analyzing the reasonableness of the subadvisory fees, the Board received a report prepared independently by Broadridge. The report showed comparative fee information of each Fund’s Peer Group and/or Peer Universe that the Trustees used as a guide to help assess the reasonableness of the subadvisory fees. The Trustees noted that Peer Group and/or Peer Universe information as a whole was useful in assessing whether the Subadvisers were providing services at a cost that was competitive with other similar funds. The Trustees also considered that the subadvisory fees are paid by SunAmerica out of its management fees and not by the Funds, and that subadvisory fees may vary widely within a Peer Group for various reasons, including market pricing demands, existing relationships, experience and success, and individual client needs. The Board further considered the amount of subadvisory fees paid by SunAmerica and the amount of the management fees which it retained and determined that these amounts were reasonable in light of the services performed by SunAmerica and the Subadvisers, respectively.
The Board also considered fees received by the Subadvisers with respect to other mutual funds and accounts with similar investment strategies to the Funds for which they serve as adviser or subadviser, as applicable. The Board noted in particular that Wellington provided its standard institutional fee schedules used for accounts with similar strategies, and Wellington highlighted certain differences between institutional accounts and the Commodity Strategy Fund, including that these accounts are subject to different investment limitations and restrictions and do not experience daily cash flows in a manner similar to the Fund. The Board then noted that the subadvisory fees paid by SunAmerica to the Subadvisers were reasonable as compared to fees the applicable Subadvisers receive for other comparable accounts for which they serve as adviser or subadviser.
Commodity Strategy Fund. The Board considered that the Fund’s actual management fees were above the medians of its Peer Group and Peer Universe. The Board also considered that the Fund’s total expenses were above the medians of its Peer Group and Peer Universe. The Board noted management’s discussion regarding the Fund’s expenses.
ESG Dividend Fund. The Board considered that the Fund’s actual management fees were above the medians of its Peer Group and Peer Universe. The Board also considered that the Fund’s total expenses were below the median of its Peer Group and above the median of its Peer Universe. The Board noted management’s discussion regarding the Fund’s expenses.
Focused Growth Fund. The Board considered that the Fund’s actual management fees were below the median of its Peer Group and above the median of its Peer Universe. The Board also considered that the Fund’s total expenses were below the medians of its Peer Group and Peer Universe. The Board noted management’s discussion regarding the Fund’s expenses. The Board also took into account previous actions to reduce Fund expenses through fee waivers.
SunAmerica Specialty Series
APPROVAL OF THE INVESTMENT ADVISORY AND MANAGEMENT AGREEMENTS AND SUBADVISORY AGREEMENTS — October 31, 2020 — (unaudited) (continued)
Alpha Large-Cap Fund. The Board considered that the Fund’s actual management fees were above the medians of its Peer Group and Peer Universe. The Board also considered that the Fund’s total expenses were above the medians of its Peer Group and Peer Universe. The Board noted management’s discussion regarding the Fund’s expenses.
Income Explorer Fund. The Board considered that the Fund’s actual management fees were above the median of its Peer Group and below the median of its Peer Universe. The Board also considered that the Fund’s total expenses were below the medians of its Peer Group and Peer Universe. The Board noted management’s discussion regarding the Fund’s expenses. The Board also took into account recent actions to reduce Fund expenses through fee waivers.
Small-Cap Fund. The Board considered that the Fund’s actual management fees were above the medians of its Peer Group and Peer Universe. The Board also considered that the Fund’s total expenses were below the medians of its Peer Group and Peer Universe. The Board noted management’s discussion regarding the Fund’s expenses. The Board also took into account previous actions to reduce Fund expenses through fee waivers.
Profitability. The Board also considered SunAmerica’s profitability and the benefits SunAmerica and its affiliates received from their relationship with the Funds. The Board received and reviewed financial statements relating to SunAmerica’s financial condition and profitability with respect to the services it provided the Funds and considered how profit margins could affect SunAmerica’s ability to attract and retain high quality investment professionals and other key personnel. The Board was also provided with a profitability analysis that detailed the revenues earned and the expenses incurred by SunAmerica and its affiliates that provide services to the Funds on a Fund by Fund basis, as well as an Investment Management Profitability Analysis prepared by an independent information service, Broadridge. In particular, the Board considered the contractual fee waivers and/or expense reimbursements agreed to by SunAmerica.
The Board considered the profitability of SunAmerica under the Advisory Agreements, including the amount of management fees it retained after payment to the Subadvisers, and considered the profitability of SunAmerica’s affiliates under the Rule 12b-1 Plans, Service Agreements and Administrative and Shareholder Services Agreement. Additionally, the Board considered whether SunAmerica, the Subadvisers and their affiliates received any indirect benefits from the relationship with the Funds. Specifically, the Board observed that AIG Federal Savings Bank, an affiliate of SunAmerica serves as custodian with respect to certain shareholder retirement accounts that are administered by SunAmerica and receives a fee payable by the qualifying shareholders. The Board further considered whether there were any collateral or “fall-out” benefits that SunAmerica and its affiliates may derive as a result of their relationship with the Funds. The Board noted that SunAmerica believes that any such benefits are de minimis and do not impact the reasonableness of the management fees.
The Board also reviewed financial statements and/or other information from the Subadvisers and their affiliates and considered whether the Subadvisers had the financial resources necessary to attract and retain high quality investment management personnel and to provide a high quality of services.
The Board concluded that SunAmerica and the Subadvisers had the financial resources necessary to perform their obligations under the Agreements and to continue to provide the Funds with the high quality services that they had provided in the past. The Board also concluded that the management fee and subadvisory fees were reasonable in light of the factors discussed above.
Economies of Scale. The Board, including the Independent Trustees, considered whether the shareholders would benefit from economies of scale and whether there was potential for future realization of economies with respect to the Funds. The Board considered that as a result of being part of the AIG fund complex, the Funds share common resources and may share certain expenses, and if the size of the complex increases, each Fund could incur lower expenses than they otherwise would achieve as stand-alone entities. The Board further noted that SunAmerica has agreed to contractually cap the total annual operating expenses of each class of the Funds, at certain levels. The Board observed that those expense caps benefited shareholders by limiting total fees even in the absence of breakpoints. The Board concluded that the Funds’ management fee structure was reasonable and that it would continue to review fees in connection with the renewal of the Advisory Agreements, including whether the implementation of breakpoints would be appropriate in the future due to an increase in asset size or otherwise.
SunAmerica Specialty Series
APPROVAL OF THE INVESTMENT ADVISORY AND MANAGEMENT AGREEMENTS AND SUBADVISORY AGREEMENTS — October 31, 2020 — (unaudited) (continued)
The Board noted that the Subadvisory Agreements with respect to certain of the Funds included breakpoints, but did not review specific information regarding whether there have been economies of scale with respect to the Subadvisers’ management of the Funds because it regards that information as less relevant at the subadviser level since SunAmerica, and not the Funds, is responsible for paying the subadvisory fees. Rather, the Board considered information regarding economies of scale in the context of the renewal of the Advisory Agreements and concluded that the management fee structure, including the amount of management fees retained by SunAmerica, was reasonable in light of the factors discussed above.
Other Factors. In consideration of the Agreements, the Board also received information regarding SunAmerica’s and the Subadvisers’ brokerage and soft dollar practices. The Board considered that SunAmerica and the Subadvisers are responsible for decisions to buy and sell securities for the applicable Funds, selection of broker-dealers and negotiation of commission rates. The Board noted that it receives reports from SunAmerica and from an independent third party that include information on brokerage commissions and execution throughout the year. The Board also considered the benefits SunAmerica and the Subadvisers derive from their soft dollar arrangements, including arrangements under which brokers provide brokerage and/or research services to SunAmerica and/or the Subadvisers in return for allocating brokerage.
Conclusion. After a full and complete discussion, the Board approved the Agreements, each for a one-year period ending June 30, 2021. Based upon their evaluation of all these factors in their totality, the Board, including the Independent Trustees, was satisfied that the terms of the Agreements, were fair and reasonable and in the best interests of the Funds and the Funds’ shareholders. In arriving at a decision to approve the Agreements, the Board did not identify any single factor or group of factors as all-important or controlling, but considered all factors together, and each Independent Trustee may have attributed different weights to different factors. The Independent Trustees were also assisted by the advice of independent legal counsel in making this determination.
SunAmerica Specialty Series
TRUSTEE AND OFFICER INFORMATION — October 31, 2020 — (unaudited)
The following table contains basic information regarding the Trustees and Officers that oversee operations of the Funds and other investment companies within the Fund complex.
| | | | | | | | | | |
Name,
and Age
| | Position(s) Held With Trust
| | Length of
Time Served(1)
| | Principal Occupation(s)
During Past 5 Years
| | Number of
Funds in
Fund Complex
Overseen by
Trustee(2)
| | Other Director(s)
Held by Trustee
During Past 5 Years(3)
|
| | | | | |
| Disinterested Trustees | | | | | | | | | | |
| | | | | |
Dr. Judith L. Craven Age: 75 | | Trustee | | 2004 to present | | Retired. | | 82 | | Director A.G. Belo Corp. (media company) (1992 to 2014); Director, Sysco Corp. (food marketing and distribution company) (1996 to 2017); Director, Luby’s, Inc. (1998 to 2019). |
| | | | | |
Richard W. Grant Age: 75 | | Trustee Chairman of the Board | | 2011 to present | | Retired. | | 23 | | None |
| | | | | |
Stephen J. Gutman Age: 77 | | Trustee | | 2001 to present | | Vice President and Associate Broker, Corcoran Group (real estate) (2002 to present); President, SJG Marketing Inc. (2009 to present). | | 23 | | None |
| | | | | |
Eileen A. Kamerick Age: 62 | | Director | | 2018 to present | | National Association of Corporate Directors Board Leadership Fellow and financial expert; Adjunct Professor of Law, University of Chicago, Washington University in St. Louis and University of Iowa law schools (2007 to Present); formerly, Senior Advisor to the Chief Executive Officer and Executive Vice President and Chief Financial Officer of ConnectWise, Inc. (software and services company) (2015 to 2016); Chief Financial Officer, Press Ganey Associates (healthcare informatics company) (2012 to 2014). | | 23 | | Hochschild Mining plc (precious metals company) (2016 to Present); Associated Banc-Corp (financial services company) (2007 to Present); Legg Mason Closed End Funds (registered investment companies) (2013 to Present); Westell Technologies, Inc. (technology company) (2003 to 2016). |
| INTERESTED TRUSTEE | | | | | | | | | | |
| | | | | |
Peter A. Harbeck(4) Age: 66 | | Trustee | | 2001 to present | | Retired June 2019, formerly President (1995-2019), CEO (1997-2019) and Director (1992-2019), SunAmerica; Director, AIG Capital Services, Inc. (“ACS”) (1993-2019); Chairman, President and CEO, Advisor Group, Inc. (2004-2016). | | 72 | | None |
| (1) | | Trustees serve until their successors are duly elected and qualified. |
| (2) | | The “Fund Complex” means two or more registered investment companies that hold themselves out to investors as related companies for purposes of investment services or have a common investment adviser or an investment adviser that is an affiliated person of the Adviser. The “Fund Complex” includes the Trust (6 funds), SunAmerica Money Market Funds Inc. (1 fund), SunAmerica Equity Funds (2 funds), SunAmerica Income Funds (3 funds), SunAmerica Series, Inc. (6 portfolios), Anchor Series Trust (4 portfolios), SunAmerica Senior Floating Rate Fund, Inc. (1 fund), SunAmerica Series Trust (60 portfolios), VALIC Company I (44 portfolios), VALIC Company II (15 funds), Seasons Series Trust (19 portfolios). |
| (3) | | Directorships of companies required to report to the SEC under the Securities Exchange Act of 1934 (i.e., “public companies”) or other investment companies registered under the 1940 Act. |
| (4) | | Mr. Harbeck is considered to be an Interested Trustee because he owns shares of American International Group, Inc., the ultimate parent of the Adviser. |
Additional information concerning the Trustees is contained in the Statement of Additional Information which is available, without charge, by calling (800) 858-8850.
SunAmerica Specialty Series
TRUSTEE AND OFFICER INFORMATION — October 31, 2020 — (unaudited) (continued)
| | | | | | |
Name,
and Age
| | Position(s) Held With
Trust
| | Length of
Time Served(4)
| | Principal Occupation(s)
During Past 5 Years
|
| | | |
| OFFICERS | | | | | | |
| | | |
John T. Genoy Age: 52 | | President | | 2007-present | | Chief Financial Officer, SunAmerica (2002 to present); Senior Vice President, SunAmerica (2003 to present); Chief Operating Officer, SunAmerica (2006 to present). |
| | | |
Sharon French Age: 55 | | Executive Vice President | | 2019-present | | President and CEO of SunAmerica (since 2019); Vice President of AIG (since 2019); Executive Vice President and Head of Beta Solutions, Oppenheimer Funds (2016-2019); President, F-Squared Capital, LLC (financial services) (2013-2015). |
| | | |
Gregory N. Bressler Age: 54 | | Secretary | | 2005-present | | Senior Vice President and General Counsel, SunAmerica (2005 to present). |
| | | |
Kathleen Fuentes Age: 51 | | Chief Legal Officer and Assistant Secretary | | 2013-present | | Vice President and Deputy General Counsel, SunAmerica (2006 to present) |
| | | |
James Nichols Age: 54 | | Vice President | | 2006-present | | Director, President and CEO, ACS (2006 to present); Senior Vice President, SunAmerica (2002 to present). |
| | | |
Gregory R. Kingston Age: 54 | | Treasurer | | 2014-present | | Vice President, SunAmerica (2001 to present); Head of Mutual Fund Administration, SunAmerica (2014 to present). |
| | | |
Shawn Parry Age: 48 | | Vice President and Assistant Treasurer | | 2014-present | | Vice President (2014 to present); Assistant Vice President, SunAmerica (2005 to 2014) |
| | | |
Donna McManus Age: 59 | | Vice President and Assistant Treasurer | | 2014-present | | Vice President, SunAmerica, (2014 to present), Managing Director, BNY Mellon (2009-2014). |
| | | |
Timothy Pettee Age: 62 | | Vice President | | 2018-present | | Chief Investment Officer, SunAmerica (2018 to Present); Lead Portfolio Manager-Rules Based Funds (2013 to Present); Chief Investment Officer (2003 to 2013). |
| | | |
Christopher C. Joe Age: 51 | | Chief Compliance Officer | | 2017 to Present | | Chief Compliance Officer, AIG Funds, Anchor Series Trust, Seasons Series Trust, SunAmerica Series Trust, VALIC Company I and VALIC Company II (2017-Present); Chief Compliance Officer, VALIC Retirement Services Company (2017-Present); Chief Compliance Officer, Invesco PowerShares (2012-2017); Chief Compliance Officer, Invesco Investment Advisers, LLC (2010-2013); U.S. Compliance Director, Invesco Ltd. (2006-2014); Deputy Chief Compliance Officer, Invesco Advisers, LLC (2014-2015). |
| | | |
Matthew J. Hackethal Age: 48 | | Anti-Money Laundering (“AML”) Compliance Officer | | 2006-present | | Acting Chief Compliance Officer, AIG Funds, Anchor Series Trust, Seasons Series Trust, SunAmerica Series Trust, VALIC Company I and VALIC Company II (2016 to 2017); Chief Compliance Officer, SunAmerica (2006 to Present); Chief Compliance Officer, The Variable Annuity Life Insurance Company (2016 to 2017); AML Compliance Officer, AIG Funds, Anchor Series Trust, Seasons Series Trust, SunAmerica Series Trust, VALIC Company I and VALIC Company II (2006 to Present); and Vice President, SunAmerica (2011 to Present). |
SunAmerica Specialty Series
SHAREHOLDER TAX INFORMATION — October 31, 2020 — (unaudited)
Certain tax information regarding SunAmerica Specialty Series is required to be provided to shareholders based upon each Fund’s income and distributions for the taxable period ended October 31, 2020. The information and distributions reported herein may differ from the information and distributions taxable to the shareholders for the calendar year end December 31, 2020. The information necessary to complete your income tax returns will be included with your Form 1099-DIV to be received under separate cover in early 2021.
During the year ended October 31, 2020, the Funds paid the following long-term capital gains along with the percentage of ordinary
income dividends that qualified for the dividends received deductions for corporations.
| | | | | | | | |
Fund
| | Net Long-
Term
Capital Gains
| | | Qualifying % for the
Dividends
Received Deduction
| |
AIG Commodity Strategy | | $ | — | | | | — | % |
AIG ESG Dividend | | | — | | | | 100.00 | |
AIG Focused Alpha Large-Cap | | | 64,662,211 | | | | 100.00 | |
AIG Focused Growth | | | 54,731,618 | | | | — | |
AIG Income Explorer | | | — | | | | 59.15 | |
AIG Small-Cap | | | 1,042,743 | | | | — | |
For the year ended October 31, 2020, certain dividends paid by the following Funds may be subject to a maximum tax rate of 15%, as provided for by the Jobs and Growth Tax Relief Reconciliation Act of 2003. Of the distributions paid during the fiscal year, the following represents the maximum amount that may be considered qualified dividend income:
| | | | |
Fund
| | Amount
| |
AIG Commodity Strategy | | $ | 215,638 | |
AIG ESG Dividend | | | 717,721 | |
AIG Focused Alpha Large-Cap | | | 89,198 | |
AIG Focused Growth | | | — | |
AIG Income Explorer | | | 1,316,020 | |
AIG Small-Cap | | | 26 | |
SunAmerica Specialty Series
COMPARISONS: FUNDS vs. INDICES — (unaudited)
As required by the Securities and Exchange Commission, the graphs on the following pages compare the performance of a $10,000 investment in the SunAmerica Specialty Series’ Funds to a similar investment in an index or indices. Please note that “inception,” as used herein, reflects the date on which a specific class of shares commenced operations. It is important to note that the SunAmerica Specialty Series’ Funds are professionally managed mutual funds, while the indices are not available for investment and are unmanaged. The comparison is shown for illustrative purposes only. The graphs present the performance of the largest class of that particular Fund. The performance of the other classes will vary based upon the difference in sales charges and fees assessed to shareholders of that class.
SunAmerica Specialty Series
COMPARISONS: FUNDS vs. INDICES — (unaudited) (continued)
AIG Commodity Strategy Fund
For the annual period ended October 31, 2020, Class A shares of the AIG Commodity Strategy Fund returned -8.98% (before maximum sales charge), modestly underperforming the Fund’s benchmark, the Bloomberg Commodity Index*, which returned -8.75% for the same period. To compare, the S&P 500 Index, a broad-based equity market index, returned 9.71% for the same period.*
The Fund seeks to provide long-term total return through a strategy designed to provide diversified exposure to the commodities markets by investing its assets in a combination of commodity-linked derivative instruments and fixed income securities. A portion of the Fund’s assets are managed pursuant to an index strategy designed to track, before fees and expenses, the performance of the Bloomberg Commodity Index (the “Index”), and a portion of the Fund’s assets are managed pursuant to an active strategy designed to outperform the Index. The Fund does not invest directly in commodities.
Three key factors affected the commodities market during the annual period – oil market fundamentals, COVID-19’s effect on the precious metals sector, and recovering industrial and agricultural demand from China. First, the oil market suffered the worst surplus in its history in April 2020 as global demand collapsed due to the immobilization of many around the world, while two of the world’s largest producers – Saudi Arabia and Russia – engaged in a price war to boost supply. Satisfied with the intended consequences of a price war, Saudi Arabia, Russia and a group of 22 oil producing countries coordinated the largest supply reduction on record. Natural gas production also came under pressure as associated gas production declines, on the back of slowing oil output, tightened U.S. natural gas markets heading into 2021. Second, precious metals was the best performing sector in the Bloomberg Commodity Index during the annual period, benefiting from accommodative central bank policy and ongoing concerns around COVID-19 case surges. Concerns around the development and distribution of an effective vaccine also provided a tailwind for precious metals, as investors searched for what were perceived as “safe haven” assets. Third, as the first area hit by COVID-19, China has been one of the first economies to show signs of recovery. Indicators of economic activity in China pointed to higher infrastructure and property-related construction, lending broad support to the industrial metals sector. Auto demand and production also rebounded. Additionally, we saw indication of meaningful boosts to Chinese demand for U.S. beans, a key part of the “Phase One” trade deal between the U.S. and China.
Amid this backdrop, commodity contract selection detracted from the Fund’s relative results during the annual period. Contract selection in Brent crude oil was the largest detractor, driven by positioning along the futures curves. This was partially offset by curve positioning in natural gas, live cattle and lean hogs, which contributed positively.
Sector selection and security selection overall contributed positively to the Fund’s relative results. More specifically, having a modest underweight to the energy sector benefited the Fund’s performance, as it was the worst performing sector in the Bloomberg Commodity Index during the annual period. Within the energy sector, underweights to natural gas and crude oil and an overweight to gasoline helped most. An overweight to precious metals also buoyed the Fund’s relative results. The Fund maintained a sizable allocation to gold but was largely neutral relative to the Bloomberg Commodity Index given our view on valuations. In contrast, the Fund prudently held an overweight to silver on the back of recovering industrial demand from China. We also held a long Fund position in platinum, as the metal benefited from temporary mining shutdowns across South Africa and remained one of the most undervalued commodities, in our view. A Fund overweight to industrial metals added value as well, especially our emphasis on copper and nickel. Both metals benefited from longer-term tailwinds, such as demand for electric vehicles, but also saw a near-term boost to prices amid ongoing supply disruptions. In particular, Indonesia’s ban on nickel exports threatened to take supply off the market amid recovering Chinese demand for stainless steel. An underweight to agriculture and livestock as a whole detracted. An overweight to lean hogs and an underweight to wheat hampered results within the sector most, but an overweight to soybean meal contributed positively.
SunAmerica Specialty Series
COMPARISONS: FUNDS vs. INDICES — (unaudited) (continued)
Past performance is no guarantee of future results. Diversification does not guarantee a profit or protect against a loss.
* The Bloomberg Commodity Index is a broadly diversified commodity price index made up of 23 exchange-traded futures on physical commodities weighted to account for economic significance and market liquidity. The S&P 500 Index is an unmanaged, weighted index of 500 large company stocks that is widely recognized as representative of the performance of the U.S. stock market. Indices are not managed and an investor cannot invest directly in an index.
The Fund is actively managed and its holdings are subject to change. Accordingly, securities listed may or may not be a part of current portfolio construction.
SunAmerica Specialty Series
COMPARISONS: FUNDS vs. INDICES — (unaudited) (continued)
Since inception, $10,000 invested in AIG Commodity Strategy Fund Class A shares would be valued at $5,747. The same amount invested in securities mirroring the performance of the Bloomberg Commodity Index and the S&P 500 Index would be valued at $5,184 and $33,988, respectively.
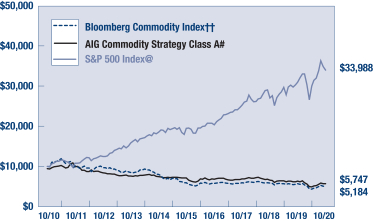
| | | | | | | | | | | | | | | | | | | | | | | | |
AIG
Commodity
Strategy Fund#
| | Class A
| | | Class C
| | | Class W
| |
| | Average
Annual
Return
| | | Cumulative
Return†
| | | Average
Annual
Return
| | | Cumulative
Return†
| | | Average
Annual
Return
| | | Cumulative
Return†
| |
1 Year Return | | | -14.25% | | | | -8.98% | | | | -10.44% | | | | -9.53% | | | | -8.79% | | | | -8.79% | |
5 Year Return | | | -5.39% | | | | -19.60% | | | | -4.90% | | | | -22.22% | | | | -4.08% | | | | -18.78% | |
10 Year Return | | | -5.39% | | | | -39.03% | | | | -5.43% | | | | -42.77% | | | | -4.62% | | | | -37.67% | |
Since Inception* | | | -4.09% | | | | -35.69% | | | | -4.23% | | | | -40.42% | | | | -3.41% | | | | -34.00% | |
| † | | Cumulative returns do not include sales load. If sales load had been included, the return would be lower. |
| * | | Inception Date - Class A: 11/04/08; Class C: 11/04/08; Class W: 11/04/08 |
| # | | For the purposes of the graph, it has been assumed that the maximum sales charge of 5.75% of offering price was deducted from the initial $10,000 investment in the Fund. For purposes of the table, it has been assumed that the maximum sales charge with respect to the Class A shares was deducted from the initial investment in the Fund and that the CDSC with respect to the Class C shares has been deducted as applicable. |
For the 12 month period ended October 31, 2020, the AIG Commodity Strategy Fund Class A returned -14.25%, compared to -8.75% for the Bloomberg Commodity Index and 9.71% for the S&P 500 Index. (The performance data and graph do not reflect the deduction of taxes that a shareholder would pay on Fund distributions or the redemption of Fund shares.)
Performance data quoted represents past performance and is no guarantee of future results. Maximum Sales Charge: Class A: 5.75%, Class C: 1.00% CDSC. The Fund’s daily net asset values are not guaranteed and shares are not insured by the FDIC, the Federal Reserve Board or any other agency. The investment return and principal value of an investment will fluctuate so that an investor’s shares, when redeemed, may be higher or lower than the original cost. Current performance may be higher or lower than that shown. Performance as of the most recent month end is available at www.aig.com/funds.
| †† | | The Bloomberg Commodity Index is a broadly diversified commodity price index made up of 23 exchange-traded futures on physical commodities weighted to account for economic significance and market liquidity. |
| @ | | The S&P 500 Index is an unmanaged, weighted index of 500 large company stocks that is widely recognized as representative of the performance of the U.S. stock market. |
| | | Indices are not managed and an investor cannot invest directly into an index. |
SunAmerica Specialty Series
COMPARISONS: FUNDS vs. INDICES — (unaudited) (continued)
AIG ESG Dividend Fund
For the annual period ended October 31, 2020, Class A shares of the AIG ESG Dividend Fund returned -3.23% (before maximum sales charge). While posting disappointing absolute returns, the Fund outperformed the Fund’s benchmark, the Russell 1000® Value Index* (the “Index”), which returned -7.57% for the same period.
The Fund’s principal investment strategies are value and Environmental, Social and Governance (“ESG”) investing, wherein the Fund employs a “buy and hold” strategy with up to 40 dividend-yielding equity securities selected annually from the Russell 1000® Index* that meet the Fund’s ESG standards. At least 80% of the Fund’s net assets, plus any borrowings for investment purposes, will be invested in dividend-yielding equity securities of companies that meet the Fund’s ESG standards. The value-oriented philosophy to which the Fund subscribes is that of investing in securities believed to be undervalued in the market. The selection criteria are usually calculated to identify stocks of companies with solid financial strength that have attractive valuations and that may have generally been overlooked by the market. ESG investing involves investing in companies that satisfy certain ESG standards. For example, companies must not generate significant revenues from certain types of business that include weapons, alcohol, tobacco, gambling and nuclear energy. Companies must not have a poor track record in how it interacts with its employees, its customers, the environment and the society in which it does business. The Fund expects to invest primarily in large-cap common stocks, although the Fund may invest in companies of any size.
During the annual period, the Fund outperformed the Index on a relative basis primarily because of effective stock selection in the Industrials, Consumer Staples, Energy and Real Estate sectors. Having overweight allocations to Industrials and Consumer Staples, which each outperformed the Index during the annual period, and having underweight exposure to Financials, Energy and Real Estate, each of which underperformed the Index during the annual period, further bolstered the Fund’s relative results. These positive contributors were only partially offset by the detracting effects of weak security selection in the Communication Services, Financials, Materials and Health Care sectors. While having an overweight exposure to Information Technology proved beneficial, as it outpaced the Index during the annual period, it was more than offset by stock selection in the sector, which detracted. Having underweight exposure to Materials and Health Care also hurt, as each of these sectors significantly outperformed the Index during the annual period.
The primary individual positive contributors to the Fund’s relative results during the annual period included consumer electronics and appliances retailer Best Buy Co., Inc., consumer products manufacturer The Clorox Company, quick service restaurant franchiser Dunkin’ Brands Group, Inc., engine and electric power generation systems manufacturer Cummins Inc. and multi-modal transportations services and logistics solutions provider C.H. Robinson Worldwide, Inc. Conversely, individual stocks that detracted most from the Fund’s relative results during the annual period included department store retailer Macy’s Inc., technology hardware and services company Xerox Holdings Corp., information technology solutions provider Hewlett Packard Enterprise Co., apparel and accessories retailer The Gap, Inc. and fashion retailer Nordstrom, Inc.
Past performance is no guarantee of future results.
* The Russell 1000 Value Index is a market-capitalization weighted index of those firms in the Russell 1000 Index with lower price-to-book ratios and lower forecasted growth values. The Russell 1000 Index is a comprehensive large-cap index measuring the performance of the largest 1,000 U.S. incorporated companies. Indices are not managed and an investor cannot invest directly into an index. Indices are not managed and an investor cannot invest directly into an index.
The Fund employs a Disciplined Strategy and will not deviate from its strategy (except to the extent necessary to comply with federal tax laws or other applicable laws). If the Fund is committed to a strategy that is unsuccessful, the Fund will not meet its investment goal. Because the Fund will not use certain techniques available to other mutual funds to reduce stock market exposure, the Fund may be more susceptible to general market declines than other mutual funds. ESG screening limits the availability of investment opportunities for the Fund. If the Fund changes its ESG standards or a company stops meeting the Fund’s ESG standards, the Fund may sell the affected investments even if this means the Fund loses money. The performance of the Fund may be subject to greater fluctuation since its strategy involves holding a limited number of securities. This type of strategy may increase the Fund’s risk since the performance of a particular stock may have a larger impact, positively or negatively, on the Fund’s performance.
The Fund’s holdings are subject to change. Accordingly, securities listed may or may not be a part of current portfolio construction.
SunAmerica Specialty Series
COMPARISONS: FUNDS vs. INDICES — (unaudited) (continued)
Since inception, $10,000 invested in AIG ESG Dividend Fund Class A shares would be valued at $10,455. The same amount invested in securities mirroring the performance of the Russell 1000® Value Index would be valued at $11,425.
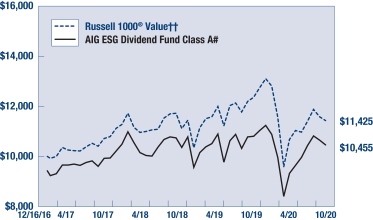
| | | | | | | | | | | | | | | | | | | | | | | | |
AIG ESG
Dividend Fund#
| | Class A
| | | Class C
| | | Class W
| |
| | Average
Annual
Return
| | | Cumulative
Return†
| | | Average
Annual
Return
| | | Cumulative
Return†
| | | Average
Annual
Return
| | | Cumulative
Return†
| |
1 Year Return | | | -8.78% | | | | -3.23% | | | | -4.53% | | | | -3.58% | | | | -3.11% | | | | -3.11% | |
5 Year Return | | | N/A | | | | N/A | | | | N/A | | | | N/A | | | | N/A | | | | N/A | |
10 Year Return | | | N/A | | | | N/A | | | | N/A | | | | N/A | | | | N/A | | | | N/A | |
Since Inception* | | | 1.15% | | | | 10.96% | | | | 2.14% | | | | 8.56% | | | | 2.92% | | | | 11.79% | |
| † | | Cumulative returns do not include sales load. If sales load had been included, the return would be lower. |
| * | | Inception Date - Class A: 12/16/16; Class C: 12/16/16; Class W: 12/16/16 |
| # | | For the purposes of the graph, it has been assumed that the maximum sales charge of 5.75% of offering price was deducted from the initial $10,000 investment in the Fund. For purposes of the table, it has been assumed that the maximum sales charge with respect to the Class A shares was deducted from the initial investment in the Fund and that the CDSC with respect to the Class C shares has been deducted as applicable. |
For the 12 month period ended October 31, 2020, the AIG ESG Dividend Fund Class A returned -8.78%, compared to -7.57% for the Russell 1000 Value Index. (The performance data and graph do not reflect the deduction of taxes that a shareholder would pay on Fund distributions or the redemption of Fund shares.)
Performance data quoted represents past performance and is no guarantee of future results. Maximum Sales Charge: Class A: 5.75%, Class C: 1.00% CDSC. The Fund’s daily net asset values are not guaranteed and shares are not insured by the FDIC, the Federal Reserve Board or any other agency. The investment return and principal value of an investment will fluctuate so that an investor’s shares, when redeemed, may be higher or lower than the original cost. Current performance may be higher or lower than that shown. Performance as of the most recent month end is available at www.aig.com/funds.
| †† | | The Russell 1000 Value Index is a market-capitalization weighted index of those firms in the Russell 1000 Index with lower price-to-book ratios and lower forecasted growth values. |
| | | Indices are not managed and an investor cannot invest directly into an index. |
SunAmerica Specialty Series
COMPARISONS: FUNDS vs. INDICES — (unaudited) (continued)
AIG Focused Alpha Large-Cap Fund
For the annual period ended October 31, 2020, Class A shares of the AIG Focused Alpha Large-Cap Fund returned 11.67% (before maximum sales charge). The Fund outperformed its benchmark, the Russell 1000® Index*, which returned 10.87% for the same period.
The AIG Focused Alpha Large-Cap Fund brings together Marsico Capital Management LLC (“Marsico”) and BlackRock Investment Management (“BlackRock”), well-known equity managers who each contribute stock picks to the Fund’s portfolio. Marsico emphasizes large-cap growth investing, while BlackRock favors a large-cap value investment style. The Fund managers’ combined stock picks, blending different investment styles, are designed to offer the potential for attractive returns over the long term.
Below, Marisco discusses its portion of the Fund’s performance during the annual period. Marsico manages the large-cap growth portion of the Fund’s portfolio.
Our portion of the Fund outperformed the Russell 1000® Index during the annual period due primarily to an emphasis on investments in U.S. large-capitalization growth equities, which significantly outperformed U.S. large-capitalization value equities during the annual period. Individual stock selection was also a major contributor to relative results. Our portion of the Fund was helped most by stock selection in the Financials, Consumer Discretionary and Real Estate sectors.
Among the top individual contributors to our portion of the fund’s results was a position in Amazon.com, Inc., boosted by two of its highest margin businesses, Amazon Web Services and advertising, which continued to outpace its legacy businesses, which are primarily in the retail space. Shares of Danaher Corp. also rose robustly during the annual period due to the resumption of business operations in the research markets, as laboratory personnel returned to work in the third quarter of 2020. In addition, Danaher Corp.’s diagnostic business segment benefited as a result of increased testing for COVID-19. Further, the company expanded its bioprocessing platform, which was critical for the ongoing research and development of therapeutics and vaccines for COVID-19. PayPal Holdings, Inc., a constituent of the Information Technology sector, was also a top positive contributor to our portion of the Fund’s relative results during the annual period. Even as the pandemic took its toll on economic activity in general, e-commerce spending surged ahead of its pre-COVID levels with both existing e-commerce shoppers and new customers using e-commerce transaction platforms amid the stay-at-home conditions that dominated. PayPal Holdings, Inc., which provides a dominant checkout feature for e-commerce transactions was a beneficiary of this trend, and its shares, in turn, surged. We maintained the Fund’s positions in each of these holdings at the end of the annual period.
Such positive contributors were partially offset by weak stock selection in the Industrials sector. Within the sector, a major detractor from our portion of the Fund’s results was Uber Technologies, Inc. Its shares slid significantly during the annual period, as the spread of COVID-19 led to the global population reducing activities outside of their homes. Because the company is highly reliant on consumer demand for transportation to work, the airport or other commerce activities to drive revenue, its business was understandably under pressure, especially given the ongoing uncertainty as to when the world might return to normal activities. Also within the Industrials sector, The Boeing Company detracted, with its shares declining as the COVID-19 pandemic led to a dramatic decrease in commercial airline travel demand. While airlines were generally in good financial health prior to the pandemic outbreak, the unprecedented drop in travel demand resulted in corresponding declines in airline revenues. In the absence of revenue, many believed airlines would delay or cancel the delivery of new aircraft, which, in turn, hurt The Boeing Company’s revenues. At the same time, aircraft production has consumed The Boeing Company’s cash, thereby threatening both its financial balance sheet and its liquidity. We sold our portion of the Fund’s positions in both Uber Technologies, Inc. and The Boeing Company by the end of the annual period.
Sector allocation overall is not a consideration in our portfolio construction but rather a residual of our stock selection process. Nevertheless, sector allocation contributed positively to our portion of the Fund’s relative results during the annual period. Our
SunAmerica Specialty Series
COMPARISONS: FUNDS vs. INDICES — (unaudited) (continued)
portion of the Fund’s overweight to Information Technology, which was the strongest sector in the Russell 1000® Index during the annual period, contributed positively. Having no exposure to Energy, which was the worst performing sector in the Russell 1000® Index during the annual period, added value as well. These positive contributors were partially offset by the detracting effect of having an overweight allocation to Real Estate, which underperformed the Russell 1000® Index during the annual period, and of having an underweight exposure to Health Care, which outperformed the Russell 1000® Index during the annual period.
Below, BlackRock discusses its portion of the Fund’s performance during the annual period. BlackRock manages the large-cap value portion of the Fund’s portfolio.
Our portion of the Fund underperformed the Russell 1000® Index during the annual period, but outperformed the Russell 1000® Value Index*, the benchmark used for the large-cap value portion of the Fund’s portfolio, due primarily to sector allocation. Relative to the Russell 1000® Value Index, having overweight exposure to Consumer Discretionary, Materials and Health Care, which each outperformed the Russell 1000® Value Index during the annual period, contributed positively. Having an underweight to Financials and no exposure to Real Estate, which each underperformed the Russell 1000® Value Index during the annual period, also proved beneficial. Conversely, having an underweight allocation to Consumer Staples and no exposure to Utilities, which each outpaced the Russell 1000® Value Index during the annual period, detracted from our portion of the Fund’s relative results.
Stock selection overall detracted from our portion of the Fund’s results relative to the Russell 1000® Value Index. Stock selection in Industrials, Financials and Health Care detracted most from our portion of the Fund’s results. A position in British multinational defense and aerospace company BAE Systems PLC ADR, which is not a component of the Russell 1000® Value Index but which underperformed the Russell 1000® Value Index during the annual period, accounted for the majority of relative underperformance in Industrials. Exposure to money center banks Wells Fargo & Co., JPMorgan Chase & Co., and Citigroup Inc. detracted most from relative results in Financials. In Health Care, a lack of exposure to medical products manufacturer Danaher Corp. and pharmaceuticals and health care products manufacturer Abbott Laboratories hampered relative performance. Security selection in Materials also detracted from relative returns during the annual period, albeit more modestly. Partially offsetting these detractors was effective stock selection in Energy, Communication Services and Consumer Discretionary, which contributed positively. In Energy, an overweight position in ConocoPhillips and avoidance of Exxon Mobil Corp. and Chevron Corp., each an U.S. integrated oil and gas operator, boosted relative results most. In Communication Services, a position in Facebook Inc., Class A within the interactive media & services industry, proved most advantageous. A position in auto manufacturer General Motors Co. helped most in the Consumer Discretionary sector. Stock selection in Consumer Staples added value as well during the annual period.
SunAmerica Specialty Series
COMPARISONS: FUNDS vs. INDICES — (unaudited) (continued)
Past performance is no guarantee of future results.
* The Russell 1000® Index offers investors access to the extensive large-cap segment of the U.S. equity universe representing approximately 92% of the U.S. market. The Russell 1000® is constructed to provide a comprehensive and unbiased barometer for the large-cap segment and is completely reconstituted annually to ensure new and growing equities are reflected. The Russell 1000® includes the largest 1,000 securities in the Russell 3000®. Indices are not managed and an investor cannot invest directly into an index. The Russell 1000® Value Index is a market-capitalization weighted index of those firms in the Russell 1000 Index with lower price-to-book ratios and lower forecasted growth values.
Because focused mutual funds are less diversified than typical mutual funds, the performance of each holding in a focused fund has a greater impact upon the overall portfolio, which increases risk.
The Fund is actively managed and its holdings are subject to change. Accordingly, securities listed may or may not be part of current portfolio construction.
SunAmerica Specialty Series
COMPARISONS: FUNDS vs. INDICES — (unaudited) (continued)
Over the past ten years, $10,000 invested in the AIG Focused Alpha Large-Cap Fund Class A shares would be valued at $32,827. The same amount invested in securities mirroring the performance of the Russell 1000® Index would be valued at $34,084.
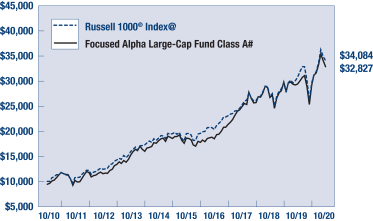
| | | | | | | | | | | | | | | | | | | | | | | | |
AIG
Focused Alpha
Large-Cap Fund#
| | Class A
| | | Class C
| | | Class W
| |
| | Average
Annual
Return
| | | Cumulative
Return†
| | | Average
Annual
Return
| | | Cumulative
Return†
| | | Average
Annual
Return
| | | Cumulative
Return†
| |
1 Year Return | | | 5.25% | | | | 11.67% | | | | 9.91% | | | | 10.90% | | | | 11.82% | | | | 11.82% | |
5 Year Return | | | 10.65% | | | | 75.98% | | | | 11.24% | | | | 70.33% | | | | 12.11% | | | | 77.07% | |
10 Year Return | | | 12.62% | | | | 248.37% | | | | N/A | | | | N/A | | | | N/A | | | | N/A | |
Since Inception* | | | 9.39% | | | | 302.20% | | | | 13.11% | | | | 194.78% | | | | 14.01% | | | | 215.98% | |
| † | | Cumulative returns do not include sales load. If sales load had been included, the return would be lower. |
| * | | Inception Date - Class A: 12/27/05; Class C: 01/24/12; Class W: 01/24/12 |
| # | | For the purpose of the graph, it has been assumed that the maximum sales charge of 5.75% of offering price was deducted from the initial $10,000 investment in the Fund. For purposes of the table, it has been assumed that the maximum sales charge with respect to the Class A shares was deducted from the initial investment in the Fund and the CDSC with respect to the Class C shares has been deducted as applicable. |
For the 12 month period ended October 31, 2020, the AIG Focused Alpha Large-Cap Class A returned 5.25%, compared to 10.87% for the Russell 1000® Index. (The performance data and graph do not reflect the deduction of taxes that a shareholder would pay on Fund distributions or the redemption of the Fund Shares.)
The Fund acquired the assets and assumed the liabilities of the SunAmerica Focused Alpha Large-Cap Fund, Inc. (the “Predecessor Fund”), a closed-end investment company also advised by SunAmerica, in a reorganization that occurred on January 23, 2012 (the “Reorganization”). Prior to the Reorganization, the Fund had no operating history and the performance information in the graph and the table reflects the performance of the Predecessor Fund through the Reorganization. The Predecessor Fund may have performed differently if it were an open-end fund since closed-end funds are generally not subject to the cash flow fluctuations of an open-end fund. The performance figures above for the period prior to the Reorganization were calculated using the actual operating expenses of the Predecessor Fund, which were lower than those of the Fund. If the Fund’s higher operating expenses were applied to the performance for the period prior to the Reorganization, the performance would have been lower.
Performance data quoted represents past performance and is no guarantee of future results. Maximum sales charge: Class A: 5.75%, Class C: 1.00% CDSC. The Fund’s daily net asset values are not guaranteed and shares are not insured by the FDIC, the Federal Reserve Board or any other agency. The investment return and principal value of an investment will fluctuate so that an investor’s shares, when redeemed, may be higher or lower than the original cost. Current performance may be higher or lower than that shown. Performance as of the most recent month end is available at www.aig.com/funds.
| @ | | The Russell 1000® Index offers investors access to the extensive large-cap segment of the U.S. equity universe representing approximately 92% of the U.S. market. The Russell 1000® is constructed to provide a comprehensive and unbiased barometer for the large-cap segment and is completely reconstructed annually to ensure new and growing equities are reflected. The Russell 1000® includes the largest 1,000 securities in the Russell 3000® Index. Indices are not managed and an investor cannot invest directly into an index. |
SunAmerica Specialty Series
COMPARISONS: FUNDS vs. INDICES — (unaudited) (continued)
AIG Focused Growth Fund
For the annual period ended October 31, 2020, Class A shares of the AIG Focused Growth Fund returned 35.20% (before maximum sales charge). The Fund outperformed its benchmark, the Russell 3000® Growth Index*, which returned 28.20% for the same period.
The AIG Focused Growth Fund brings together Marsico Capital Management LLC (“Marsico”) and BAMCO Inc. (“BAMCO”), well-known equity managers who each contribute stock picks to the Fund’s portfolio. Marsico emphasizes large-cap growth investing, while BAMCO focuses on small/mid-cap growth opportunities. The Fund managers’ combined stock picks, blending different investment styles, are designed to offer the potential for attractive returns over the long term.
Below, Marisco discusses its portion of the Fund’s performance during the annual period. Marsico manages the large-cap growth portion of the Fund’s portfolio.
Our portion of the Fund outperformed the Russell 3000® Growth Index during the annual period due primarily to stock selection. Our portion of the Fund was helped most by stock selection in the Consumer Discretionary and Health Care sectors. Within Consumer Discretionary, the Fund’s position in Amazon.com, Inc. contributed most positively, boosted by two of its highest margin businesses, Amazon Web Services and advertising, which continued to outpace its legacy businesses, which are primarily in the retail space. In Health Care, shares of Danaher Corp. rose robustly during the annual period due to the resumption of business operations in the research markets, as laboratory personnel returned to work in the third quarter of 2020. In addition, Danaher Corp.’s diagnostic business segment benefited as a result of increased testing for COVID-19. Further, the company expanded its bioprocessing platform, which was critical for the ongoing research and development of therapeutics and vaccines for COVID-19. At the end of the annual period, we maintained our conviction in both of these holdings.
PayPal Holdings, Inc., a constituent of the Information Technology sector, was also a top positive contributor to our portion of the Fund’s relative results during the annual period. Even as the pandemic took its toll on economic activity in general, e-commerce spending surged ahead of its pre-COVID levels with both existing e-commerce shoppers and new customers using e-commerce transaction platforms amid the stay-at-home conditions that dominated. PayPal Holdings, Inc., which provides a dominant checkout feature for e-commerce transactions, was a beneficiary of this trend, and its shares, in turn, surged. We maintained the Fund’s position in PayPal Holdings, Inc. at the end of the annual period.
Such positive contributors were partially offset by weak stock selection in the Industrials sector. Within the sector, a major detractor from our portion of the Fund’s results was Uber Technologies, Inc. Its shares slid significantly during the annual period, as the spread of COVID-19 led to the global population reducing activities outside of their homes. Because the company is highly reliant on consumer demand for transportation to work, the airport or other commerce activities to drive revenue, its business was understandably under pressure, especially given the ongoing uncertainty as to when the world might return to normal activities. Also within the Industrials sector, The Boeing Company detracted, with its shares declining as the COVID-19 pandemic led to a dramatic decrease in commercial airline travel demand. While airlines were generally in good financial health prior to the pandemic outbreak, the unprecedented drop in travel demand resulted in corresponding declines in airline revenues. In the absence of revenue, many believed airlines would delay or cancel the delivery of new aircraft, which, in turn, hurt The Boeing Company’s revenues. At the same time, aircraft production has consumed The Boeing Company’s cash, thereby threatening both its financial balance sheet and its liquidity. We sold our portion of the Fund’s positions in both Uber Technologies, Inc. and The Boeing Company by the end of the annual period.
Sector allocation overall is not a consideration in our portfolio construction but rather a residual of our stock selection process. Nevertheless, sector allocation contributed positively, albeit modestly, to our portion of the Fund’s relative results during the annual period. Our portion of the Fund’s overweight to Information Technology, which was the second-strongest sector in the Russell 3000®
SunAmerica Specialty Series
COMPARISONS: FUNDS vs. INDICES — (unaudited) (continued)
Growth Index during the annual period, and its underweight allocations to Industrials and Health Care, which each underperformed the Russell 3000® Growth Index during the annual period, contributed positively. Having no exposure to the weakly performing Consumer Staples sector added value as well. These positive contributors were partially offset by the detracting effect of having overweight allocations to Real Estate and Financials, which each underperformed the Russell 3000® Growth Index during the annual period. Having a position in cash, though modest, during an annual period when the Russell 3000® Growth Index rallied, also dampened relative results.
Below, BAMCO discusses its portion of the Fund’s performance during the annual period. BAMCO manages the small/mid-cap portion of the Fund’s portfolio.
Our portion of the Fund significantly outperformed the Russell 3000® Growth Index due primarily to effective stock selection and, to a lesser extent, to sector allocation. Stock selection helped most in the Consumer Discretionary, Industrials, Health Care and Communication Services sectors. Favorable stock selection in Consumer Discretionary was led by triple-digit share price gains from electric vehicle manufacturer Tesla, Inc. and regional casino operator Penn National Gaming, Inc. Shares of Tesla, Inc. appreciated after the company consistently reported strong quarterly results, including profitability that beat analysts’ forecasts and solid growth in existing and new programs across different geographies and vehicles. Also, the company presented a grand vision around its battery activity aimed at expanding its competitive advantage and market opportunity. Investors also appeared to be impressed by significant growth in production from Tesla Inc.’s new factory in Shanghai. Penn National Gaming, Inc.’s stock price gained after the company completed an equity and convertible offering deal to enhance its liquidity profile. The company saw a quick rebound in revenues at re-opened properties, and its margins improved as revenue continued to build while keeping costs low by delaying its ramp-up of labor and marketing to pre-COVID-19 levels. The early September 2020 launch of its Barstool Sportsbook app also lifted its stock price. Our portion of the Fund’s only holding in the Industrials sector, real estate information and marketing services company CoStar Group, Inc., added value. Its shares rose, as net new sales re-accelerated more quickly than investors forecasted. Demand for the company’s digital marketplace business grew as traditionally offline activities increasingly shifted online during the pandemic. Strength in Health Care came from veterinary diagnostics leader IDEXX Laboratories, Inc. and telehealth company American Well Corp, while share price gains from real estate and rental marketplace Zillow Group, Inc., Class A bolstered performance in Communication Services.
These positive contributors were partially offset by challenging stock selection in Information Technology and Financials. Weakness in Information Technology was due to share price losses from personal and casualty insurance software vendor Guidewire Software, Inc. and syndicated research provider Gartner, Inc. Guidewire Software, Inc.’s shares declined as the company’s shift to the cloud caused short-term financial headwinds and slowed the cadence of new license sales. Additionally, a sudden Chief Financial Officer transition pressured the stock. Gartner Inc.’s share price fell due to concerns about how the pandemic would reduce growth in the company’s research business and meaningfully impact its destination events business. Adverse stock selection in Financials was driven by specialty insurer Arch Capital Group, Ltd. and brokerage firm The Charles Schwab Corp. The former’s shares declined due to economic-related headwinds in the mortgage business, while the latter’s stock price fell due to investor concerns around uncertain near-term earnings.
Sector allocation contributed positively, driven primarily by a meaningful overweight exposure to the strongly performing Consumer Discretionary sector via sizable positions in Tesla, Inc., Hyatt Hotels Corp., Class A and Vail Resorts, Inc. Underweight exposure to the Industrials and Health Care sectors and lack of exposure to Consumer Staples, each of which underperformed the Russell 3000® Growth Index during the annual period, also added value. Only partially offsetting these positive contributors was the detracting effect of having an underweight exposure to Information Technology, which outperformed the Russell 3000® Growth Index during the annual period, driven higher by sharp gains from sector heavyweights Apple, Inc. and Microsoft Corp. Having an overweight allocation to the poorly performing Financials sector also hampered relative results. All that said, at BAMCO, we construct our portion of the Fund from the bottom up, one stock at a time. Each stock is included in the portfolio if it meets our rigorous investment
SunAmerica Specialty Series
COMPARISONS: FUNDS vs. INDICES — (unaudited) (continued)
criteria. To help manage risk, we are aware of our sector and security weights, but we do not include a holding to achieve a target sector allocation or to approximate an index. Exposure to any given sector is purely a result of our stock selection process.
Finally, style biases within our portion of the Fund added value during the annual period. In particular, an emphasis on the strongly performing residual volatility, liquidity and beta factors contributed positively to relative results.
Past performance is no guarantee of future results.
* The Russell 3000® Growth Index measures the performance of those Russell 3000® Index companies with higher price-to-book ratios and higher forecasted growth values. The Russell 3000® Index consists of the 3,000 largest U.S. companies based on total market capitalization. Indices are not managed and an investor cannot invest directly into an index.
Because focused mutual funds are less diversified than typical mutual funds, the performance of each holding in a focused fund has a greater impact upon the overall portfolio, which increases risk. Stocks of small-cap and mid-cap companies are generally more volatile than and not as readily marketable as those of larger companies and may have less resources and a greater risk of business failure than do large companies.
The Fund is actively managed and its holdings are subject to change. Accordingly, securities listed may or may not be part of current portfolio construction.
SunAmerica Specialty Series
COMPARISONS: FUNDS vs. INDICES — (unaudited) (continued)
Over the past ten years, $10,000 invested in the AIG Focused Growth Fund Class A shares would be valued at $36,361. The same amount invested in securities mirroring the performance of the Russell 3000® Growth Index would be valued at $44,110.
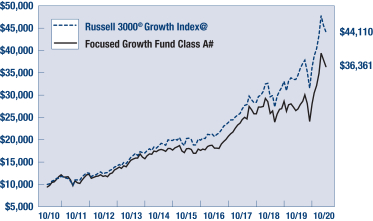
| | | | | | | | | | | | | | | | | | | | | | | | |
AIG
Focused Growth#
| | Class A
| | | Class C
| | | Class W
| |
| | Average
Annual
Return
| | | Cumulative
Return†
| | | Average
Annual
Return
| | | Cumulative
Return†
| | | Average
Annual
Return
| | | Cumulative
Return†
| |
1 Year Return | | | 27.45% | | | | 35.20% | | | | 33.37% | | | | 34.37% | | | | 35.48% | | | | 35.48% | |
5 Year Return | | | 13.75% | | | | 102.06% | | | | 14.36% | | | | 95.57% | | | | 15.33% | | | | 104.03% | |
10 Year Return | | | 13.78% | | | | 285.84% | | | | N/A | | | | N/A | | | | N/A | | | | N/A | |
Since Inception* | | | 10.80% | | | | 407.35% | | | | 14.09% | | | | 217.91% | | | | 15.05% | | | | 242.21% | |
| † | | Cumulative returns do not include sales load. If sales load had been included, the return would be lower. |
| * | | Inception Date - Class A: 07/28/05; Class C: 01/24/12; Class W: 01/24/12 |
| # | | For the purpose of the graph, it has been assumed that the maximum sales charge of 5.75% of offering price was deducted from the initial $10,000 investment in the Fund. For purposes of the table, it has been assumed that the maximum sales charge with respect to the Class A shares was deducted from the initial investment in the Fund and the CDSC with respect to the Class C shares has been deducted as applicable. |
For the 12 month period ended October 31, 2020, the AIG Focused Growth Class A returned 27.45%, compared to 28.20% for the Russell 3000® Growth Index. (The performance data and graph do not reflect the deduction of taxes that a shareholder would pay on Fund distributions or the redemption of the Fund Shares.)
The Fund acquired the assets and assumed the liabilities of the SunAmerica Focused Alpha Growth Fund, Inc. (the “Predecessor Fund”), a closed-end investment company also advised by SunAmerica, in a reorganization that occurred on January 23, 2012 (the “Reorganization”). Prior to the Reorganization, the Fund had no operating history and the performance information in the graph and the table reflects the performance of the Predecessor Fund through the Reorganization. The Predecessor Fund may have performed differently if it were an open-end fund since closed-end funds are generally not subject to the cash flow fluctuations of an open-end fund. The performance figures above for the period prior to the Reorganization were calculated using the actual operating expenses of the Predecessor Fund, which were lower than those of the Fund. If the Fund’s higher operating expenses were applied to the performance for the period prior to the Reorganization, the performance would have been lower.
Performance data quoted represents past performance and is no guarantee of future results. Maximum sales charge: Class A: 5.75%, Class C: 1.00% CDSC. The Fund’s daily net asset values are not guaranteed and shares are not insured by the FDIC, the Federal Reserve Board or any other agency. The investment return and principal value of an investment will fluctuate so that an investor’s shares, when redeemed, may be higher or lower than the original cost. Current performance may be higher or lower than that shown. Performance as of the most recent month end is available at www.aig.com/funds.
| @ | | The Russell 3000® Growth Index measures the performance of those Russell 3000® Index companies with higher price-to-book ratios and higher forecasted growth values. The Russell 3000® Index consists of the 3,000 largest U.S. companies based on total market capitalization. Indices are not managed and an investor cannot invest directly into an index. |
SunAmerica Specialty Series
COMPARISONS: FUNDS vs. INDICES — (unaudited) (continued)
AIG Income Explorer Fund
Effective December 17, 2019, certain changes were made to the AIG Income Explorer Fund’s investment strategy and techniques, as well as to the portfolio management. Prior to this date, the Fund was invested in closed end funds, global equity securities and preferred securities. Effective the same date, Cohen & Steers Capital Management, Inc. (“Cohen & Steers”) no longer managed the closed-end funds and preferred securities sleeves of the Fund, and these two sleeves were replaced by real estate investment trust (REIT) and preferred securities sleeves managed by SunAmerica Asset Management Corp. (“SunAmerica”). SunAmerica, the Fund’s investment adviser, is also responsible for determining the allocation among the different sleeves of the Fund and for managing the global dividend equity strategy. The Fund’s investment objective did not change, but its benchmark index did change. For a detailed description of the Fund’s strategy, techniques and management, as well as expenses, please see the Fund’s Prospectus.
For the annual period ended October 31, 2020, Class A shares of the AIG Income Explorer Fund returned -10.14% (before maximum sales charge). The Fund underperformed its new benchmark, a blended benchmark comprised 45% of the MSCI ACWI Value Index*, 35% of the S&P Preferred Stock Index and 20% of the FTSE NAREIT All Equity REITs Index*. The new blended benchmark returned -7.82% for the same period. The components of the new blended benchmark, the MSCI ACWI Value Index*, the S&P Preferred Stock Index and the FTSE NAREIT All Equity REITs Index, returned -12.21%, 3.02% and -16.01%, respectively, for the same annual period. The Fund’s former blended benchmark, comprised 60% of the MSCI World Index (Net)** and 40% of the Bloomberg Barclays U.S. Aggregate Bond Index,** returned 5.72% for the same period. The components of the former blended benchmark, the Bloomberg Barclays U.S. Aggregate Bond Index, a broad-based fixed income market index, returned 6.19%, and the MSCI World Index (Net), a broad-based global equity market index, returned 4.36%, for the same annual period.
The Fund seeks to achieve its investment objective of high current income and, secondarily, capital appreciation by combining three distinct income producing investment strategies – global dividend equities, preferred securities and real estate investment trusts (REITs) – into a single fund that seeks a high level of monthly income. By exploring asset classes that are less correlated with traditional bond markets, the Fund may provide more diversified income opportunities than fixed income investments alone. This multi-asset class approach is designed to help deliver attractive yield and risk-adjusted returns, conveniently in one portfolio.
Below, SunAmerica discusses its portion of the Fund’s performance during the annual period. SunAmerica manages the global dividend equity strategy sleeve of the Fund.
During the period from November 1, 2019 through December 16, 2019, our portion of the Fund outperformed the MSCI World Index, the benchmark then utilized for the global dividend equity strategy sleeve. Individual stock selection overall contributed most positively, while country allocation also boosted results, albeit more modestly. Sector allocation as a whole detracted.
From a sector perspective, effective stock selection in the Consumer Staples, Consumer Discretionary and Real Estate sectors contributed most positively. Positioning in the Materials sector and having no exposure to Utilities, which was the second-weakest sector in the MSCI World Index during the period from November 1, 2019 through December 16, 2019, also proved beneficial. Only partially offsetting these positive contributors was both weak stock selection and allocation positioning in the Energy, Information Technology and Health Care sectors, which detracted. Having no exposure to the Financials sector, which outperformed the MSCI World Index during this same time period, also dampened relative results.
Regionally, our portion of the Fund benefited most from positioning and stock selection in the U.K. Having exposure to Taiwan and Russia, which are not constituents of the MSCI World Index but which outperformed the MSCI World Index from November 1, 2019 through December 16, 2019, also added value. Effective stock selection in Switzerland further boosted our portion of the Fund’s relative results. Conversely, positioning decisions in France and Italy hindered results as did having an underweight exposure to and weak stock selection in the U.S. Having an overweight allocation to Hong Kong, which lagged the MSCI World Index during the same time period, also detracted from relative results.
SunAmerica Specialty Series
COMPARISONS: FUNDS vs. INDICES — (unaudited) (continued)
Among individual holdings, positions in U.K. residential housing developers and builders Persimmon PLC and Barratt Developments PLC, Taiwanese semiconductor company Yageo Corp., U.K. tobacco company British American Tobacco PLC and Russian metals and mining company MMC Norilsk Nickel PJSC ADR were among the top positive contributors to our portion of the Fund’s relative performance during the period from November 1, 2019 through December 16, 2019. Notable laggards during this same time frame included Taiwanese industrial products manufacturer Catcher Technology Co., Ltd., French telecommunications services provider Orange SA, French automobile manufacturers Renault SA and Peugeot SA and Italian automobile manufacturer Fiat Chrysler Automobiles N.V.
During the period from December 17, 2019 through October 31, 2020, our portion of the Fund underperformed the MSCI ACWI Value, the benchmark utilized for the global dividend equity strategy sleeve beginning December 17, 2019. Individual stock selection overall detracted most, while country allocation as a whole also detracted, albeit only modestly. Sector allocation overall contributed positively.
From a sector perspective, stock selection proved most challenging in the Industrials, Communication Services and Consumer Staples sectors. Allocation positioning in the Consumer Discretionary, Industrials and Health Care sectors also dampened relative results. Only partially offsetting these detractors was effective stock selection in the Energy, Financials and Real Estate sectors, which contributed positively. Having an underweight to Financials, which underperformed the MSCI ACWI Value during the period from December 17, 2019 through October 31, 2020, and having an overweight to Materials, which outperformed the MSCI ACWI Value during this same time period, also proved beneficial.
Regionally, our portion of the Fund was hurt most by positioning and stock selection in the U.S., France, Germany and Italy. Conversely, positioning and stock selection in Australia, Taiwan and the Netherlands boosted relative results most.
Among individual holdings, positions in U.S. department store operator Kohl’s Corp., U.S. cruise ships owner and operator Carnival Corp., U.S. apparel and accessories retailer The Gap, Inc., French automobile manufacturer Renault SA and Italian automobile manufacturer Fiat Chrysler Automobiles N.V. were among the top detractors from our portion of the Fund’s relative performance during the period from December 17, 2019 through October 31, 2020. Notable positive contributors during this same time frame included Australian iron ore producer Fortescue Metals Group Ltd., U.S. energy and engineering and construction services provider Halliburton Co., U.S. oilfield products and services provider Baker Hughes Co., U.S. chemical company DuPont de Nemours, Inc. and U.S. consumer foods manufacturer General Mills, Inc.
Below, Cohen & Steers discusses its portions of the Fund’s performance during the period from November 1, 2019 through December 16, 2019. Cohen & Steers managed the closed-end fund and preferred securities sleeves of the Fund, respectively, during this time period.
Closed-End Fund Sleeve: During the period from November 1, 2019 through December 16, 2019, our portion of the Fund outperformed the Morningstar All Taxable Fixed Income Index,† the benchmark then utilized for the Closed-End Fund sleeve. This allocation to fixed income strategy closed-end funds helped relative performance. Conversely, an out-of-benchmark position in utilities closed-end funds and an overweight in preferred securities closed-end funds detracted from relative performance.
Security selection contributed most positively to our portion of the Fund’s relative return in the U.S. multi-sector bond closed-end funds category. On the other hand, security selection in the preferred securities closed-end funds category hindered relative performance.
SunAmerica Specialty Series
COMPARISONS: FUNDS vs. INDICES — (unaudited) (continued)
Preferred Securities Sleeve: Relative to a blended index – 50% BofA Merrill Lynch Capital Securities Index and 50% BofA Merrill Lynch Fixed Rate Preferred Securities Index†† – which tracks various aspects of the preferred securities market, our portion of the Fund’s overweight to the utilities segment of the market and its underweight to the banking segment of the market slightly detracted. Security selection in the pipelines segment of the market also hampered relative results. Partially offsetting these detractors was effective security selection in the banking segment of the market, which contributed positively.
Below, SunAmerica discusses the performance of the REIT and preferred securities sleeves of the Fund, respectively, during the period from December 17, 2019 through October 31, 2020. SunAmerica managed the REIT and preferred securities sleeves of the Fund, respectively, during this time period.
REIT Sleeve: The REIT portion of the Fund underperformed the FTSE NAREIT All Equity REITs Index* during the December 17, 2019 through October 31, 2020 time period. The principal investment technique of the REIT sleeve is to employ a “buy and hold” strategy with approximately 60 equity REITs selected annually from the FTSE NAREIT All Equity REITs Index*. We select securities from the FTSE NAREIT All Equity REITs Index* on the basis of a number of factors, including profitability, volatility and size. While the security selection process will take place on an annual basis, we may, from time to time, substitute certain securities for those selected for the REIT sleeve or reduce the position size of a portfolio security in between the annual rebalancings under certain limited circumstances. These circumstances will generally include where the value of a security held by the REIT sleeve becomes a disproportionately large percentage of the REIT sleeve’s holdings in the discretion of the portfolio managers. The REIT sleeve will be evaluated and adjusted at the discretion of the portfolio managers on an annual period.
Relative results were hurt most by having an underweight to infrastructure REITs, which outperformed the FTSE NAREIT All Equity REITs Index* during the period we established and managed the REIT sleeve. Having overweights to the specialty REITs and lodging/resorts REITs sub-sectors, which each underperformed the FTSE NAREIT All Equity REITs Index* during this same time frame, also detracted. Stock selection within the specialty REITs sub-sector dampened relative results as well. Partially offsetting these detractors was effective stock selection within the retail, health care and residential REITs sub-sectors, which contributed positively.
Among individual holdings, notable laggards included Empire State Realty Trust, Inc. Class A, which primarily focuses on office and retail properties in Manhattan and the greater New York metropolitan area; Clipper Realty, Inc., which primarily acquires and manages multi-family residential and commercial properties in the New York metropolitan area; EPR Properties, which acquires and develops properties leased to movie theatre and entertainment-related business operators, generally under long-term triple-net leases; Simon Property Group, Inc., which owns, develops and manages retail real estate properties, including regional malls and outlet centers; and Armada Hoffler Properties, Inc., which develops, builds, owns and manages office, retail and residential properties in the mid-Atlantic region of the U.S. Positions in several data center REITs were among the top positive contributors to our portion of the Fund’s relative performance during the period from December 17, 2019 through October 31, 2020. These data center REITs included Equinix, Inc., QTS Realty Trust, Inc. Class A, and CyrusOne, Inc. Positions in Prologis, Inc., which is an owner, operator and developer of industrial real estate and distribution facilities, and Uniti Group Inc., which provides wireless infrastructure solutions for the communications industry, were also top positive contributors to the REIT sleeve’s performance during this time period.
Preferred Securities Sleeve: The Preferred Securities portion of the Fund outperformed the S&P Preferred Stock Index* during the December 17, 2019 through October 31, 2020 time period. The principal investment technique of the preferred securities sleeve is to employ an enhanced index management strategy, which seeks to modestly outperform the S&P Preferred Stock Index* over time, while maintaining similar risk characteristics to the S&P Preferred Stock Index*. The preferred securities sleeve invests in a diversified portfolio of preferred securities issued by U.S. and foreign companies, which may include traditional preferred securities, hybrid preferred securities and floating rate preferred securities. The preferred securities sleeve may invest in both investment grade
SunAmerica Specialty Series
COMPARISONS: FUNDS vs. INDICES — (unaudited) (continued)
and below investment grade securities but anticipates investing predominantly in investment grade securities. We expect the preferred securities sleeve to invest a substantial portion of its assets in the Financials sector, which is comprised of the banking, brokerage and insurance industries. We select securities from the S&P Preferred Stock Index* by applying certain constraints, such as credit quality and position size limits, and by employing a statistical technique known as optimization. Because the preferred securities sleeve uses an enhanced index strategy, not all of the securities in the S&P Preferred Stock Index* are included in the preferred securities sleeve, and the preferred securities sleeve’s holdings may be underweight or overweight particular securities, sectors or industries within the S&P Preferred Stock Index*. The preferred securities sleeve may engage in active trading of its portfolio securities.
During the December 17, 2019 through October 31, 2020 time period, the weighting of the preferred securities sleeve roughly mirrored that of the S&P Preferred Stock Index*, with the highest percentage of holdings in the Financials sector. The preferred securities sleeve was overweight relative to the S&P Preferred Stock Index* in the Financials, Consumer Discretionary, Energy, Industrials and Utilities sectors. The Industrials and Utilities sectors outperformed the S&P Preferred Stock Index* most during this time frame and had the second and third highest contribution to return in the preferred securities sleeve. Financials had the most significant contribution to return in the preferred securities sleeve and also outperformed the S&P Preferred Stock Index* during the same time period. Conversely, positioning in the Consumer Discretionary, Consumer Staples and Information Technology sectors detracted from relative results during this time frame. This was due mainly to the preferred securities sleeve not owning select holdings in each sector that performed strongly and aided S&P Preferred Stock Index* performance.
On a macro level, the preferred securities sleeve was buoyed by the volatility surrounding the COVID-19 pandemic and its effect on the stock and bond markets. The erosion of the economy due to COVID-19 whipsawed U.S. Treasury bond levels to multi-years lows, and the U.S. Federal Reserve stepped in to lower interest rates to near zero in an effort to mitigate the adverse effects of the pandemic on the economy. While performance fluctuated throughout the time period, the low interest rate and low bond rate environment helped support the performance of preferred securities overall, as preferred securities tend to perform better when rates are low.
SunAmerica Specialty Series
COMPARISONS: FUNDS vs. INDICES — (unaudited) (continued)
Past performance is no guarantee of future results. Diversification does not guarantee a profit or protect against a loss.
Preferred securities are subject to bond market volatility risk, credit risk and interest rate fluctuation risk. In addition, preferred securities are subordinated to other securities in the issuer’s capital structure and are subject to the risk that the issuer will fail to make dividends or other distributions because other claims on the issuer’s assets take priority. Preferred securities may be less liquid than many other types of securities and may be subject to the risk of being redeemed prior to their scheduled date. Real estate securities are subject to the risk that property values may fall due to increasing vacancies or declining rents. The price of real estate securities also may decline because of the failure of borrowers to pay their loans and poor management. Many real estate companies utilize leverage, which increases investment risk and could adversely affect a company’s operations and market value in periods of rising interest rates, as well as risks normally associated with debt financing. Income and real estate values also may be adversely affected by such factors as applicable laws, interest rate levels and the availability of financing. The Global Dividend Stocks and REIT sleeves each employ a disciplined strategy and will not deviate from their strategy (except to the extent necessary to comply with federal tax laws or other applicable laws). If either sleeve is committed to a strategy that is unsuccessful, the Fund may not meet its overall investment goal. Because the Global Dividend Stocks sleeve generally will not use certain hedging techniques available to the Preferred and REIT sleeves to reduce stock market exposure, this portion of the Fund may be more susceptible to general market declines than the other sleeves. International investing involves special risks, such as currency fluctuations and economic and political instability, greater market volatility and limited liquidity. Stocks of small-cap and mid-cap companies are generally more volatile than and not as readily marketable as those of larger companies, and may have fewer resources and a greater risk of business failure than do large companies.
* The MSCI ACWI Value Index captures large- and mid-cap securities exhibiting overall value style characteristics across 23 Developed Markets countries and 26 Emerging Markets countries. The value investment style characteristics for index construction are defined using three variables: book value to price, 12-month forward earnings to price and dividend yield. The S&P Preferred Stock Index is comprised of U.S. exchange-traded preferred stocks that meet minimum price, liquidity, trading volume, maturity and other requirements determined by S&P Dow Jones Indices LLC, a subsidiary of S&P Global, Inc. The FTSE NAREIT All Equity REITs Index is a free-float adjusted, market capitalization-weighted index of all tax-qualified U.S. equity REITs with more than 50% of total assets in qualifying real estate assets other than mortgages secured by real property. Please note that an investor cannot invest directly in an index.
** The MSCI World Index is a free float-adjusted market capitalization weighted index that is designed to measure the equity market performance of developed markets. It consists of the following 23 developed market country indices: Australia, Austria, Belgium, Canada, Denmark, Finland, France, Germany, Hong Kong, Ireland, Israel, Italy, Japan, Netherlands, New Zealand, Norway, Portugal, Singapore, Spain, Sweden, Switzerland, the United Kingdom and the United States. Net total return indices reinvest dividends after the deduction of withholding taxes, using (for international indices) a tax rate applicable to non-resident institutional investors who do not benefit from double taxation treaties. The Bloomberg Barclays U.S. Aggregate Bond Index represents securities that are U.S. domestic, taxable and dollar denominated. The index covers components for government and corporate securities, mortgage pass-through securities and asset-backed securities.
† The Morningstar All Taxable Fixed Income Index was the benchmark used for the Closed-End Fund sleeve of the Fund prior to December 17, 2019. It is an index that tracks the weighted average of the market price of closed-end funds that invest in taxable fixed-income securities.
†† The BofA Merrill Lynch Capital Securities Index is a sub-set of the BofA Merrill Lynch U.S. Corporate Index including all fixed-to-floating rate, perpetual callable and callable securities. The BofA Merrill Lynch U.S. Corporate Index tracks the performance of U.S. dollar-denominated investment-grade corporate debt publicly issued in the U.S. domestic market. Qualifying securities must be rated investment-grade (based on an average of Moody’s, S&P and Fitch) and must have an investment-grade-rated country of risk (based on an average of Moody’s, S&P and Fitch foreign-currency long-term sovereign debt ratings). The BofA Merrill Lynch Fixed Rate Preferred Securities Index tracks the performance of fixed-rate U.S. dollar-denominated preferred securities issued in the U.S. domestic market. Qualifying securities must be rated investment-grade (based on an average of Moody’s, S&P and Fitch) and must have an investment-grade-rated country of risk (based on an average of Moody’s, S&P and Fitch foreign-currency long-term sovereign debt ratings).
Indices are not managed and an investor cannot invest directly in an index.
The Fund is actively managed and its holdings are subject to change. Accordingly, securities listed may or may not be a part of current portfolio construction.
SunAmerica Specialty Series
COMPARISONS: FUNDS vs. INDICES — (unaudited) (continued)
Since inception, $10,000 invested in AIG Income Explorer Fund Class A shares would be valued at $12,298. The same amount invested in securities mirroring the performance of the Blended Benchmark (New) (MSCI ACWI Value Index (Net) (45%), S&P U.S. Preferred Stock Index (35%) and FTSE NAREIT All Equity REITs Index (20%)), MSCI ACWI Index (Net), Blended Benchmark (Old) (MSCI World Index (Net) (60%), and Bloomberg Barclays U.S. Aggregate Bond Index (40%)), and the MSCI World Index (Net) would be valued at $14,518, $17,738 $16,263, and $18,237, respectively.
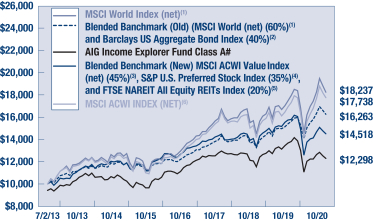
| | | | | | | | | | | | | | | | | | | | | | | | |
AIG
Income Explorer Fund#
| | Class A
| | | Class C
| | | Class W
| |
| | Average
Annual
Return
| | | Cumulative
Return†
| | | Average
Annual
Return
| | | Cumulative
Return†
| | | Average
Annual
Return
| | | Cumulative
Return†
| |
1 Year Return | | | -15.30% | | | | -10.14% | | | | -11.45% | | | | -10.59% | | | | -10.03% | | | | -10.03% | |
5 Year Return | | | 2.69% | | | | 21.15% | | | | 3.27% | | | | 17.44% | | | | 4.11% | | | | 22.34% | |
10 Year Return | | | N/A | | | | N/A | | | | N/A | | | | N/A | | | | N/A | | | | N/A | |
Since Inception* | | | 2.86% | | | | 30.53% | | | | 3.05% | | | | 24.62% | | | | 3.89% | | | | 32.33% | |
| † | | Cumulative returns do not include sales load. If sales load had been included, the return would be lower. |
| * | | Inception Date - Class A: 07/02/13; Class C: 07/02/13; Class I: 07/02/13 |
| # | | For the purposes of the graph, it has been assumed that the maximum sales charge of 5.75% of offering price was deducted from the initial $10,000 investment in the Fund. For purposes of the table, it has been assumed that the maximum sales charge with respect to the Class A shares was deducted from the initial investment in the Fund and that the CDSC with respect to the Class C shares has been deducted as applicable. |
For the 12 month period ended October 31, 2020, the AIG Income Explorer Fund Class A returned -15.30%, compared to -7.82% for the Blended Benchmark (MSCI ACWI Value Index (Net) (45%), S&P U.S. Preferred Stock Index (35%) and FTSE NAREIT All Equity REITs Index (20%)), 4.89% for the MSCI ACWI Index (Net). (The performance data and graph do not reflect the deduction of taxes that a shareholder would pay on Fund distributions or the redemption of Fund shares.)
Performance data quoted represents past performance and is no guarantee of future results. Maximum Sales Charge: Class A: 5.75%, Class C: 1.00% CDSC. The Fund’s daily net asset values are not guaranteed and shares are not insured by the FDIC, the Federal Reserve Board or any other agency. The investment return and principal value of an investment will fluctuate so that an investor’s shares, when redeemed, may be higher or lower than the original cost. Current performance may be higher or lower than that shown. Performance as of the most recent month end is available at www.aig.com/funds.
| (1) | | The MSCI World Index (Net) is a free float-adjusted market capitalization-weighted index that is designed to measure the equity market performance of developed markets consisting of 23 developed market country indexes: Australia, Austria, Belgium, Canada, Denmark, Finland, France, Germany, Hong Kong, Ireland, Italy, Israel, Japan, Netherlands, New Zealand, Norway, Portugal, Singapore, Spain, Sweden, Switzerland, the United Kingdom and the United States. Net total return indices reinvest dividends after the deduction of withholding taxes, using (for international indices) a tax rate applicable to non-resident institutional investors who do not benefit from double taxation treaties. |
| (2) | | The Bloomberg Barclays U.S. Aggregate Bond Index represents securities that are U.S. domestic, taxable and dollar denominated. The index covers components for government and corporate securities, mortgage pass-through securities and asset-backed securities. |
| (3) | | The MSCI ACWI Value captures large- and mid-cap securities exhibiting overall value style characteristics across 23 Developed Markets countries and 26 Emerging Markets countries. The value investment style characteristics for index construction are defined using three variables: book value to price, 12-month forward earnings to price and dividend yield. |
| (4) | | The S&P Preferred Stock Index is comprised of U.S. exchange-traded preferred stocks that meet minimum price, liquidity, trading volume, maturity and other requirements determined by S&P Dow Jones Indices LLC, a subsidiary of S&P Global, Inc. |
| (5) | | The FTSE NAREIT All Equity REITs Index is a free-float adjusted, market capitalization-weighted index of all tax-qualified U.S. equity REITs with more than 50% of total assets in qualifying real estate assets other than mortgages secured by real property. |
| (6) | | The MSCI ACWI Index (net) is a free float-adjusted market capitalization weighted index that is designed to measure the equity market performance of developed and emerging markets. The Index is comprised of 23 developed and 26 emerging market country indices. The developed market country indices included are Australia, Austria, Belgium, Canada, Denmark, Finland, France, Germany, Hong Kong, Ireland, Israel, Italy, Japan, Netherlands, New Zealand, Norway, Portugal, Singapore, Spain, |
SunAmerica Specialty Series
COMPARISONS: FUNDS vs. INDICES — (unaudited) (continued)
| | Sweden, Switzerland, the United Kingdom and the United States. The emerging market country indices included are: Argentina, Brazil, Chile, China, Colombia, Czech Republic, Egypt, Greece, Hungary, India, Indonesia, Korea, Malaysia, Mexico, Pakistan, Peru, Philippines, Poland, Qatar, Russia, Saudi Arabia, South Africa, Taiwan, Thailand, Turkey and United Arab Emirates. The net index approximates the minimum possible dividend reinvestment and assumes that the dividend is reinvested after the deduction of withholding tax, applying the rate to nonresident individuals who do not benefit from double taxation treaties. |
| | | Indices are not managed and an investor cannot invest directly into an index. |
SunAmerica Specialty Series
COMPARISONS: FUNDS vs. INDICES — (unaudited) (continued)
AIG Small-Cap Fund
For the annual period ended October 31, 2020, Class A shares of the AIG Small-Cap Fund returned -5.68% (before maximum sales charge). The Fund underperformed its benchmark, the Russell 2000® Index*, which returned -0.14% for the same period.
The Fund seeks to achieve its investment objective of long-term growth of capital primarily by strategically allocating its assets between a small-cap index strategy and an actively-managed micro-cap growth strategy. The small-cap index strategy provides broad exposure to small-cap stocks by tracking the Russell 2000® Index, and the micro-cap strategy is actively managed to enhance alpha potential relative to the Russell Microcap® Index**.
SunAmerica Asset Management, LLC (“SunAmerica”) is the Fund’s investment adviser, managing the overall asset allocations and the index strategy. Cadence Capital Management, LLC (“Cadence”) is the portfolio manager of the micro-cap growth strategy. The Fund will generally allocate approximately 40-60% of its assets to each strategy.
Below, SunAmerica discusses its portion of the Fund’s performance during the annual period. SunAmerica manages the small-cap index sleeve of the Fund.
Our portion of the Fund lagged the return of the Russell 2000® Index during the annual period. U.S. small-cap stocks underperformed the mid-cap and large-cap segments of the U.S. equity market during the annual period, as measured by the Russell indices. Within the small-cap universe, as within all market capitalization segments, growth stocks significantly outperformed value stocks during the annual period, and there was great dispersion among the performance of the sectors of the Russell 2000® Index. Health Care and Consumer Staples were the best relative performers in terms of total return, each sector posting a robust double-digit gain. Consumer Discretionary and Information Technology also were strong performers. Conversely, Energy was by far the weakest sector in the Russell 2000® Index during the annual period, followed by Real Estate, Utilities and Financials, each posting a double-digit negative return during the annual period.
Among individual holdings, notable laggards included Invesco Mortgage Capital, Inc. and Blackstone Mortgage Trust, Inc., Class A, each of the Real Estate industry of the Financials sector; Brink’s Co. of the Commercial Services & Supplies industry of the Industrials sector; Radian Group, Inc. of the Insurance industry of the Financials sector; and ALLETE, Inc. of the Utilities industry of the Utilities sector. The top positive contributors to the Russell 2000® Index and to our portion of the Fund’s relative performance during the annual period included Teladoc Health, Inc. and Quidel Corp., each of the Health Care Equipment & Services industry of the Health Care sector; MyoKardia, Inc. and Immunomedics, Inc., each of the Pharmaceuticals and Biotechnology industry of the Health Care sector; and Chegg, Inc. of the Commercial Services & Supplies industry of the Industrials sector.
Each sector and stock in the Russell 2000® Index was represented in our portion of the Fund with approximately the same weighting as in the Index and therefore had a similar effect.
Below, Cadence discusses its portion of the Fund’s performance during the annual period. Cadence manages the micro-cap sleeve of the Fund.
Our portion of the Fund underperformed the return of the Russell 2000® Index during the annual period, driven by the poor performance of valuation, one of the underpinnings of our strategy’s conservative growth investment approach. Our portion of the Fund also underperformed the Russell Microcap® Index, which returned 3.15% during the annual period. Growth stocks outperformed value stocks by a historic margin across the capitalization spectrum during the annual period. Also, weak stock selection in Health Care, Industrials, Information Technology and Consumer Discretionary detracted significantly from relative results, more than offsetting the positive contribution made by underweighting several poorly performing sectors, including Financials, Real Estate and Energy.
SunAmerica Specialty Series
COMPARISONS: FUNDS vs. INDICES — (unaudited) (continued)
More specifically, relative to the Russell 2000® Index, stock selection in Health Care was the largest detractor from our portion of the Fund’s results during the annual period. The Health Care Equipment and Services industry, long an area of attractive returns for the portfolio, experienced significantly diverse stock-by-stock performance. An orthopedic operator with a strong market position saw its shares fall due to a decline in patient visits amidst the COVID-19 pandemic. A radiology outpatient services business suffered similarly. These detractors were only partially offset by several holdings that experienced double-digit and triple-digit gains during the annual period. Winners ranged from a testing company benefiting from COVID-19 protocols to a health care information technology company executing a merger and acquisition strategy successfully. Stock selection within the Pharmaceuticals and Biotechnology industry also disappointed. A pain drug stock was hurt by a decline in elective procedures, despite being a beneficiary of the shift away from more addictive opioids. Also, not owning several biotechnology stocks that enjoyed significant gains during the annual period, many due to speculation over a role in the cure of COVID-19, hurt. However, our portion of the Fund did not invest in these stocks because many were larger than our sleeve’s micro-cap size target, and most did not have earnings.
On the positive side, our portion of the Fund was underweight Financials, one of the worst performing sectors in the Russell 2000® Index during the annual period. Within the sector, our portion of the Fund also benefited from strong stock selection in the Banks and Thrifts industry. The decline in interest rates during the annual period weighed on banks’ net interest margins, and credit concerns also loomed over bank stock performance due to the consequences of the pandemic. However, several of the bank stocks held by our portion of the Fund experienced robust share price gains.
An underweight to Real Estate also buoyed our portion of the Fund’s relative results. Real estate was one of the weakest sectors in the Russell 2000® Index during the annual period, as investors feared rising vacancies and rent defaults would depress future earnings. Stock selection within the sector also proved effective. For example, the portfolio held an apartment real estate investment trust (REIT) with properties in the Sun Belt markets, which experienced above-average occupancy and rent collection rates. While the REIT’s shares declined, they still substantially outperformed the Real Estate sector within the Russell 2000® Index and were cushioned by an attractive dividend yield.
In short, the underperformance of valuation and the strong performance of loss-making companies, or those businesses yet to make a profit, were headwinds to our portion of the Fund’s investment approach. Further, small-cap stocks have significantly trailed large-cap stocks in recent years, but we believe a re-opening of global economies with progress in combatting COVID-19 should broaden economic activity and lead inflows into the undervalued small-cap segment of the equity markets. The realization of such a scenario would benefit the micro-cap segment of the equity markets as well, in our view.
SunAmerica Specialty Series
COMPARISONS: FUNDS vs. INDICES — (unaudited) (continued)
Past performance is no guarantee of future results. Diversification does not guarantee a profit or protect against a loss.
* The Russell 2000® Index measures the performance of approximately 2,000 small-cap companies in the Russell 3000® Index, which is made up of 3,000 of the biggest U.S. stocks. The Russell 2000® Index serves as a benchmark for small-cap stocks in the United States. The weighted average market capitalization for companies in the Russell 2000® Index is about US$1.3 billion.
** The Russell Microcap® Index is a capitalization weighted index of 2,000 small-cap and micro-cap stocks that captures the smallest 1,000 companies in the Russell 2000® Index, plus 1,000 smaller U.S.-based listed stocks. The Russell Microcap® Index is recalculated annually to prevent growing stocks from distorting index performance, and to include new entrants. The Russell Microcap® Index represents just 3% of the overall U.S. equity market by capitalization.
Indices are not managed and an investor cannot invest directly in an index.
A portion of the Fund is actively managed and its holdings are subject to change. Accordingly, securities listed may or may not be a part of current portfolio construction.
SunAmerica Specialty Series
COMPARISONS: FUNDS vs. INDICES — (unaudited) (continued)
Since inception, $10,000 invested in AIG Small-Cap Fund Class A shares would be valued at $13,487. The same amount invested in securities mirroring the performance of the Russell® 2000 Index would be valued at $15,442.
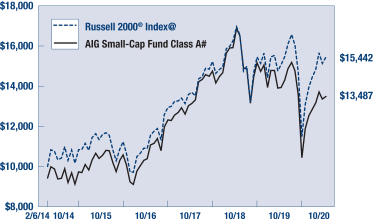
| | | | | | | | | | | | | | | | | | | | | | | | |
AIG Small-Cap Fund#
| | Class A
| | | Class C
| | | Class W
| |
| | Average
Annual
Return
| | | Cumulative
Return†
| | | Average
Annual
Return
| | | Cumulative
Return†
| | | Average
Annual
Return
| | | Cumulative
Return†
| |
1 Year Return | | | -11.10% | | | | -5.68% | | | | -7.20% | | | | -6.29% | | | | -5.48% | | | | -5.48% | |
5 Year Return | | | 4.27% | | | | 30.76% | | | | 4.81% | | | | 26.49% | | | | 5.71% | | | | 31.98% | |
10 Year Return | | | N/A | | | | N/A | | | | N/A | | | | N/A | | | | N/A | | | | N/A | |
Since Inception* | | | 4.54% | | | | 43.14% | | | | 4.78% | | | | 36.95% | | | | 5.67% | | | | 45.00% | |
| † | | Cumulative returns do not include sales load. If sales load had been included, the return would be lower. |
| * | | Inception Date - Class A: 02/06/14; Class C: 02/06/14; Class W: 02/06/14 |
| # | | For the purposes of the graph, it has been assumed that the maximum sales charge of 5.75% of offering price was deducted from the initial $10,000 investment in the Fund. For purposes of the table, it has been assumed that the maximum sales charge with respect to the Class A shares was deducted from the initial investment in the Fund and that the CDSC with respect to the Class C shares has been deducted as applicable. |
For the 12 month period ended October 31, 2020, the AIG Small-Cap Fund Class A returned -11.10%, compared to -0.14% for the Russell® 2000 Index. (The performance data and graph do not reflect the deduction of taxes that a shareholder would pay on Fund distributions or the redemption of Fund shares.)
Performance data quoted represents past performance and is no guarantee of future results. Maximum Sales Charge: Class A: 5.75%, Class C: 1.00% CDSC. The Fund’s daily net asset values are not guaranteed and shares are not insured by the FDIC, the Federal Reserve Board or any other agency. The investment return and principal value of an investment will fluctuate so that an investor’s shares, when redeemed, may be higher or lower than the original cost. Current performance may be higher or lower than that shown. Performance as of the most recent month end is available at www.aig.com/funds.
| @ | | The Russell 2000® Index measures the performance of approximately 2,000 small-cap companies in the Russell 3000® Index, which is made up of 3,000 of the biggest U.S. stocks. The Russell 2000® Index serves as a benchmark for small-cap stocks in the United States. The weighted average market capitalization for companies in the Russell 2000® Index is about US$1.3 billion. Indices are not managed and an investor cannot invest directly into an index. |

Harborside 5
185 Hudson Street, Suite 3300
Jersey City, NJ 07311
| | | | |
Directors/Trustees Richard W. Grant Peter A. Harbeck Dr. Judith L. Craven Stephen J. Gutman Eileen A. Kamerick Officers John T. Genoy, President and Chief Executive Officer Sharon French, Executive Vice President Timothy Pettee, Vice President James Nichols, Vice President Gregory N. Bressler, Secretary Gregory R. Kingston, Treasurer Shawn Parry, Vice President and Assistant Treasurer Donna McManus, Vice President and Assistant Treasurer Kathleen Fuentes, Chief Legal Officer and Assistant Secretary Christopher C. Joe, Chief Compliance Officer Matthew J. Hackethal, Anti-Money Laundering Compliance Officer Investment Adviser SunAmerica Asset Management, LLC Harborside 5 185 Hudson Street, Suite 3300 Jersey City, NJ 07311 Distributor AIG Capital Services, Inc. Harborside 5 185 Hudson Street, Suite 3300 Jersey City, NJ 07311 Shareholder Servicing Agent AIG Fund Services, Inc. Harborside 5 185 Hudson Street, Suite 3300 Jersey City, NJ 07311 Custodian State Street Bank and Trust Company One Lincoln Street Boston, MA 02111 Transfer Agent DST Asset Manager Solutions, Inc. 303 W 11th Street Kansas City, MO 64105 | | VOTING PROXIES ON FUND PORTFOLIO SECURITIES A description of the policies and procedures that the Trust uses to determine how to vote proxies related to securities held in a Fund’s portfolio, which is available in the Trust’s Statement of Additional Information, may be obtained without charge upon request, by calling (800) 858-8850. The information is also available from the EDGAR database on the U.S. Securities and Exchange Commission’s website at http://www.sec.gov. PROXY VOTING RECORD ON FUND PORTFOLIO SECURITIES Information regarding how the Trust voted proxies related to securities held in the Funds during the most recent twelve month period ended June 30 is available, once filed with the U.S. Securities and Exchange Commission, without charge, upon request, by calling (800) 858-8850 or on the U.S. Securities and Exchange Commission website at http://www.sec.gov. DISCLOSURE OF QUARTERLY PORTFOLIO HOLDINGS The Trust is required to file its complete schedule of portfolio holdings with the U.S. Securities and Exchange Commission for the first and third quarters of each fiscal year on Form N-PORT. The Trust’s Forms N-PORT are available on the U.S. Securities and Exchange Commission website at http://www.sec.gov. | | DELIVERY OF SHAREHOLDER DOCUMENTS The Funds have adopted a policy that allows them to send only one copy of a Fund’s prospectus, proxy material, annual report and semi-annual report (the “shareholder documents”) to shareholders with multiple accounts residing at the same “household.” This practice is called householding and reduces Fund expenses, which benefits you and other shareholders. Unless the Funds receive instructions to the contrary, you will only receive one copy of the shareholder documents. The Funds will continue to household the shareholder documents indefinitely, until we are instructed otherwise. If you do not wish to participate in householding please contact Shareholder Services at (800) 858-8850 ext. 6010 or send a written request with your name, the name of your fund(s) and your account number(s) to AIG Funds, P.O. Box 219186, Kansas City MO, 64121-9186. We will resume individual mailings for your account within thirty (30) days of receipt of your request. This report is submitted solely for the general information of shareholders of the Funds. Distribution of this report to persons other than shareholders of the Funds is authorized only in connection with a currently effective prospectus, setting forth details of the Funds, which must precede or accompany this report. |

Go Paperless!!
Did you know that you have the option to
receive your shareholder reports online?
By choosing this convenient service, you will no longer receive paper copies of Fund documents such as annual reports, semi-annual reports, prospectuses and proxy statements in the mail. Instead, you are provided with quick and easy access to this information via the Internet.
Why Choose Electronic Delivery?
It’s Quick — Fund documents will be received faster than via traditional mail.
It’s Convenient — Elimination of bulky documents from personal files.
It’s Cost Effective — Reduction of your Fund’s printing and mailing costs.
To sign up for electronic delivery, follow
these simple steps:
| | |
| 1 | | Go to www.aig.com/funds |
| |
| 2 | | Click on the link to “Go Paperless!!” |
The email address you provide will be kept strictly confidential. Once your enrollment has been processed, you will begin receiving email notifications when anything you receive electronically is available online.
You can return to www.aig.com/funds at any time to change your email address, edit your preferences or to cancel this service if you choose to resume physical delivery of your Fund documents.
Please note - this option is only available to accounts opened through the Funds.

For information on receiving this report online, see inside back cover.
AIG Funds are advised by SunAmerica Asset Management, LLC (SAAMCo) and distributed by AIG Capital Services, Inc. (ACS), Member FINRA. Harborside 5, 185 Hudson Street, Suite 3300, Jersey City, NJ 07311, 800-858-8850. SAAMCo and ACS are members of American International Group, Inc. (AIG).
Investors should carefully consider a Fund’s investment objectives, risks, charges and expenses before investing. The prospectus, containing this and other important information, can be obtained from your financial adviser, the AIG Funds Sales Desk at 800-858-8850, ext. 6003, or at aig.com/funds. Read the prospectus carefully before investing.
HWANN - 10/20
SunAmerica Specialty Series (“the registrant”) has adopted a Code of Ethics applicable to its Principal Executive and Principal Accounting Officers pursuant to Section 406 of the Sarbanes-Oxley Act of 2002 (the “Code”). During the fiscal year ended October 31, 2020, there were no reportable waivers or implicit waivers to a provision of the Code that applies to the registrant’s Principal Executive and Principal Accounting Officers (the “Covered Officers”).
| Item 3. | Audit Committee Financial Expert. |
The registrant’s Board of Trustees has determined that Eileen A. Kamerick, a Trustee of the registrant, qualifies as an audit committee financial expert, as defined in Item 3 (b) of Form N-CSR. Ms. Kamerick is considered to be “independent” for purposes of Item 3(a)(2) of Form N-CSR.
| Item 4. | Principal Accountant Fees and Services. |
(a)—(d) Aggregate fees billed to the registrant for the last two fiscal years for professional services rendered by the registrant’s principal accountants were as follows:
| | | | | | | | |
| | | 2019 | | | 2020 | |
(a) Audit Fees | | $ | 257,467 | | | $ | 260,042 | |
(b) Audit-Related Fees | | $ | 0 | | | $ | 0 | |
(c) Tax Fees | | $ | 0 | | | $ | 0 | |
(d) All Other Fees | | $ | 0 | | | $ | 0 | |
Audit Fees include amounts related to the audit of the registrant’s annual financial statements and services normally provided by the principal accountant in connection with statutory and regulatory filings.
Aggregate fees billed to the investment adviser and Adviser Affiliates (as defined below in Item 4(e)) that are required to be pre-approved pursuant to paragraph (c)(7)(ii) of Rule 2-01 of Regulation S-X for the last two fiscal years for services rendered by the registrant’s principal accountant were as follows:
| | | | | | | | |
| | | 2019 | | | 2020 | |
(b) Audit-Related Fees | | $ | 0 | | | $ | 0 | |
(c) Tax Fees | | $ | 0 | | | $ | 0 | |
(d) All Other Fees | | $ | 0 | | | $ | 0 | |
| | (e) | (1) The registrant’s audit committee pre-approves all audit services provided by the registrant’s principal accountant for the registrant and all non-audit services provided by the registrant’s principal accountant for the registrant, its investment adviser and any entity controlling, controlled by, or under common control with the investment adviser (“Adviser Affiliates”) that provides ongoing services to the registrant, if the engagement by the investment adviser or Adviser Affiliate relates directly to the operations and financial reporting of the registrant. The audit committee has not presently established any pre-approval policies and procedures that permit the pre-approval of the above services other than by the full audit committee. Certain de minimis exceptions are allowed for non-audit services in accordance with Rule 2-01(c)(7)(i)(C) of Regulation S-X as set forth in the registrant’s audit committee charter. |
| | | (2) No services included in (b)-(d) above in connection with fees billed to the registrant or the investment adviser or Adviser Affiliates were approved pursuant to paragraph (c)(7)(i)(C) of Rule 2-01 of Regulation S-X. |
| | (g) | The aggregate fees billed for the most recent fiscal year and the preceding fiscal year by the registrant’s principal accountant for non-audit services rendered to the registrant, its investment adviser, and Adviser Affiliates that provide ongoing services to the registrant for 2019 and 2020 were $0 and $0, respectively. |
| Item 5. | Audit Committee of Listed Registrants. |
Not applicable.
Included in Item 1 to the Form.
| Item 7. | Disclosure of Proxy Voting Policies and Procedures for Closed-End Management Investment Companies. |
Not applicable.
| Item 8. | Portfolio Managers of Closed-End Management Investment Companies. |
Not applicable.
| Item 9. | Purchases of Equity Securities by Closed-End Management Investment Company and Affiliated Purchasers. |
Not applicable.
| Item 10. | Submission of Matters to a Vote of Security Holders. |
There were no material changes to the procedures by which shareholders may recommend nominees to the registrant’s Board of Trustees that were implemented after the registrant last provided disclosure in response to the requirements of Item 407(c)(2)(iv) of Regulation S-K (17 CFR 229.407) (as required by Item 22(b)(15)) of Schedule 14A (17 CFR 240.14a - 101), or this Item 10.
| Item 11. | Controls and Procedures. |
| | (a) | An evaluation was performed within 90 days of the filing of this report, under the supervision and with the participation of the registrant’s management, including the President and Treasurer, of the effectiveness of the design and operation of the registrant’s disclosure controls and procedures (as defined under Rule 30a-3(c) under the Investment Company Act of 1940 (17 CFR 270.30a-3(c))). Based on that evaluation, the registrant’s management, including the President and Treasurer, concluded that the registrant’s disclosure controls and procedures are effective. |
| | (b) | There was no change in the registrant’s internal control over financial reporting (as defined in Rule 30a-3(d) under the Investment Company Act of 1940 (17 CFR 270.30a-3(d))) that occurred during the most recent fiscal half year that has materially affected, or is reasonably likely to materially affect, the registrant’s internal control over financial reporting. |
| Item 12. | Disclosure of Securities Lending Activities for Closed-End Management Investment Companies. |
Not applicable.
SIGNATURES
Pursuant to the requirements of the Securities Exchange Act of 1934 and the Investment Company Act of 1940, the registrant has duly caused this report to be signed on its behalf by the undersigned, thereunto duly authorized.
| | |
| SunAmerica Specialty Series |
| |
| By: | | /s/ John T. Genoy |
| | John T. Genoy President |
Date: January 7, 2021
Pursuant to the requirements of the Securities Exchange Act of 1934 and the Investment Company Act of 1940, this report has been signed below by the following persons on behalf of the registrant and in the capacities and on the dates indicated.
| | |
| |
| By: | | /s/ John T. Genoy |
| | John T. Genoy President |
Date: January 7, 2021
| | |
| |
| By: | | /s/ Gregory R. Kingston |
| | Gregory R. Kingston Treasurer |
Date: January 7, 2021