Exhibit 99.1

Lender Presentation September 5, 2018
Disclaimer This presentation may contain forward - looking statements and management may make additional forward - looking statements in respon se to your questions. These statements are made under the “safe harbor” provisions of the U.S. Private Securities Litigation Reform Act of 1995. These fo rwa rd - looking statements can be identified by terminology such as “will,” “expects,” “anticipates,” “future,” “intends,” “plans,” “believes,” “estimates” and si milar statements. Statements that are not historical facts, including statements concerning our beliefs, forecasts, estimates and expectations, and those regarding our ex pected financial results are forward - looking statements. Forward - looking statements involve inherent risks and uncertainties that could cause actual results to diffe r materially from those projected or anticipated, including risks related to: the cyclical and highly volatile nature of the industries we serve, our reliance on a s mall number of customers for a significant portion of our revenue, the industries in which we participate are highly competitive and rapidly evolving, the market for ou r s tock is subject to significant fluctuation, our ability to consummate the transactions described herein (the “Transactions”), our ability to successfully integrate QGT’s op erations and employees, unexpected costs, charges or expenses resulting from the Transactions, our ability to successfully grow our or QGT's business, potential adverse reactions or changes to business relationships resulting from the completion of the Transactions, the retention of key employees, customers or suppli ers , legislative, regulatory and economic developments, including changing business conditions in the semiconductor industry markets overall and the economy i n g eneral and other risks outlined in our public filings with the Securities and Exchange Commission, including as set forth under “Risk Factors”, “Management’s Di scussion and Analysis of Financial Condition and Results of Operations” and elsewhere in our most recent Quarterly Report on Form 10 - Q and Annual Report on Form 10 - K filed with the Securities and Exchange Commission. The forward - looking statements made in this presentation relate only to events or information as of the date on which the statements are made in this presentation. Except as required by law, we undertake no obligation to update or revise publicly any forward - lo oking statements, whether as a result of new information, future events or otherwise, after the date on which the statements are made or to reflect the occu rre nce of unanticipated events. Non - GAAP Measurement In addition to U.S. GAAP financials, this presentation includes certain non - GAAP financial measures. These non - GAAP financial me asures are in addition to, and not a substitute for or superior to, measures of financial performance prepared in accordance with U.S. GAAP. Our determinati on of our non - GAAP measures might not be the same as similarly titled measures used by other companies, and it should not be construed as a substitute for amou nts determined in accordance with GAAP. There are limitations associated with using non - GAAP measures, including that they exclude financial information that some may consider important in evaluating our performance. Management compensates for this by presenting information on both a GAAP and non - GAAP basis and prov iding reconciliations of the GAAP and non - GAAP results. Tables presenting reconciliations of non - GAAP results to U.S. GAAP results are included in the Append ix. The Company neither updates nor confirms any guidance regarding the future operating results of the Company which have been g ive n prior to this presentation. 1

Presenters Jim Scholhamer Chief Executive Officer and Director Ultra Clean Technology Sheri Savage Senior Vice President of Finance and Chief Financial Officer Ultra Clean Technology Jim Pursiano Head of Corporate Development Ultra Clean Technology 2

TRANSACTION OVERVIEW
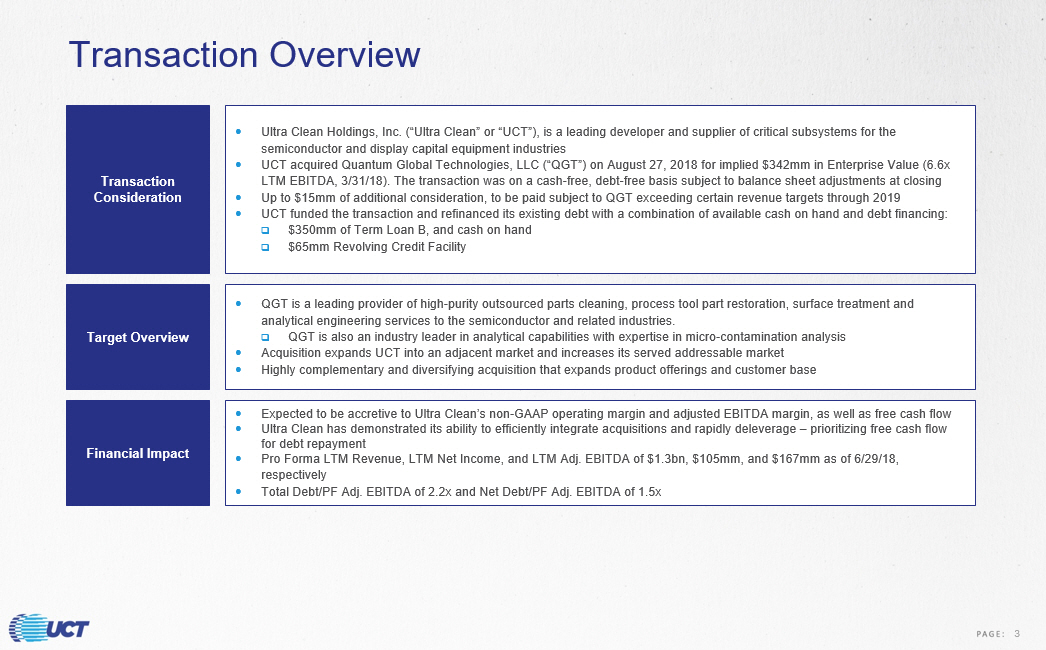
Transaction Overview Ultra Clean Holdings, Inc. (“Ultra Clean” or “UCT”), is a leading developer and supplier of critical subsystems for the semiconductor and display capital equipment industries UCT acquired Quantum Global Technologies, LLC (“QGT”) on August 27, 2018 for implied $342mm in Enterprise Value (6.6x LTM EBITDA, 3/31/18). The transaction was on a cash - free, debt - free basis subject to balance sheet adjustments at closing Up to $15mm of additional consideration, to be paid subject to QGT exceeding certain revenue targets through 2019 UCT funded the transaction and refinanced its existing debt with a combination of available cash on hand and debt financing: □ $350mm of Term Loan B, and cash on hand □ $65mm Revolving Credit Facility Transaction Consideration Expected to be accretive to Ultra Clean’s non - GAAP operating margin and adjusted EBITDA margin, as well as free cash flow Ultra Clean has demonstrated its ability to efficiently integrate acquisitions and rapidly deleverage – prioritizing free cash flow for debt repayment Pro Forma LTM Revenue, LTM Net Income, and LTM Adj. EBITDA of $1.3bn, $105mm, and $167mm as of 6/29/18, respectively Total Debt/PF Adj. EBITDA of 2.2x and Net Debt/PF Adj. EBITDA of 1.5x Financial Impact Target Overview QGT is a leading provider of high - purity outsourced parts cleaning, process tool part restoration, surface treatment and analytical engineering services to the semiconductor and related industries. □ QGT is also an industry leader in analytical capabilities with expertise in micro - contamination analysis Acquisition expands UCT into an adjacent market and increases its served addressable market Highly complementary and diversifying acquisition that expands product offerings and customer base 3
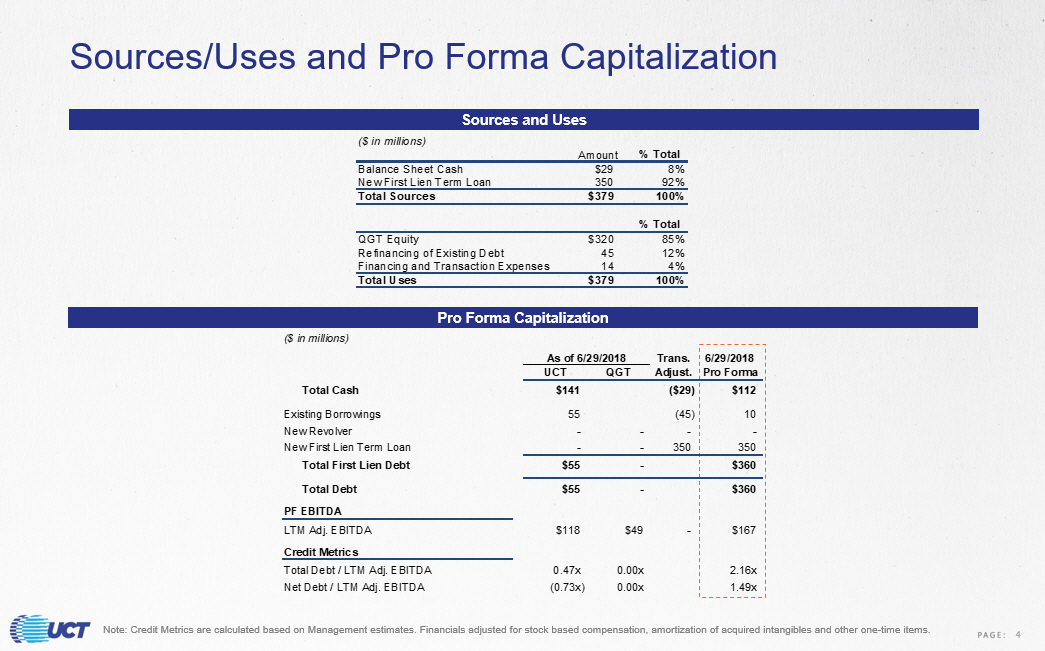
Sources/Uses and Pro Forma Capitalization Pro Forma Capitalization Sources and Uses ($ in millions) Amount % Total Balance Sheet Cash $29 8% New First Lien Term Loan 350 92% Total Sources $379 100% % Total QGT Equity $320 85% Refinancing of Existing Debt 45 12% Financing and Transaction Expenses 14 4% Total Uses $379 100% Note: Credit Metrics are calculated based on Management estimates. Financials adjusted for stock based compensation, amortiza tio n of acquired intangibles and other one - time items. ($ in millions) Trans. 6/29/2018 UCT QGT Adjust. Pro Forma Total Cash $141 ($29) $112 Existing Borrowings 55 (45) 10 New Revolver - - - - New First Lien Term Loan - - 350 350 Total First Lien Debt $55 - $360 Total Debt $55 - $360 PF EBITDA LTM Adj. EBITDA $118 $49 - $167 Credit Metrics Total Debt / LTM Adj. EBITDA 0.47x 0.00x 2.16x Net Debt / LTM Adj. EBITDA (0.73x) 0.00x 1.49x As of 6/29/2018 4

Summary Term Sheet: Senior Secured Credit Facilities Borrower: Ultra Clean Holdings, Inc. (the “Borrower”) Security: Secured by a first - priority lien on substantially all existing and future assets of the Borrower and the subsidiary Guarantors and 100% of the equity in the Borrower and each Guarantor (limited to 65% of the capital stock of first tier foreign subsidiaries) Guarantees: Unconditionally guaranteed by the Borrower and the Borrower’s existing and subsequently acquired direct or indirect wholly - owned domestic restricted subsidiaries Issue: Revolving Credit Facility First Lien Term Loan Size: $65mm $350 million Maturity: 5 years 7 years Amortization: None 1.00% per annum Call Protection: None 101 soft call for 6 months Mandatory Prepayments: (i) 50% Excess Cash Flow Sweep with step downs to 25% and 0% based on the First Lien Net Leverage Ratio; (ii) 100% of Asset Sales with step downs to 50% and 0% based on the First Lien Net Leverage Ratio (with reinvestment rights); (iii) 100% of certain debt issuance or refinancing proceeds Covenants: Customary and appropriate affirmative and negative covenants, including: financial reporting; limitations on indebtedness; limitations on liens; restrictions on mergers and acquisitions and disposition of assets; limitations on restricted payments; and restrictions on the transactions with affiliates Financial Covenants: (i) Leverage - based and (ii) fixed charge coverage maintenance covenant (RCF Only) None Summary Terms and Conditions 5

Expected Transaction Timeline Timetable Details Date Event September 5 th Bank Meeting September 19 th Commitments Due by 12pm September 20 th Price and Allocate S M T W T F S 1 2 3 4 5 6 7 8 9 10 11 12 13 14 15 16 17 18 19 20 21 22 23 24 25 26 27 28 29 30 Market Holiday Key Date September 2018 6

UCT OVERVIEW
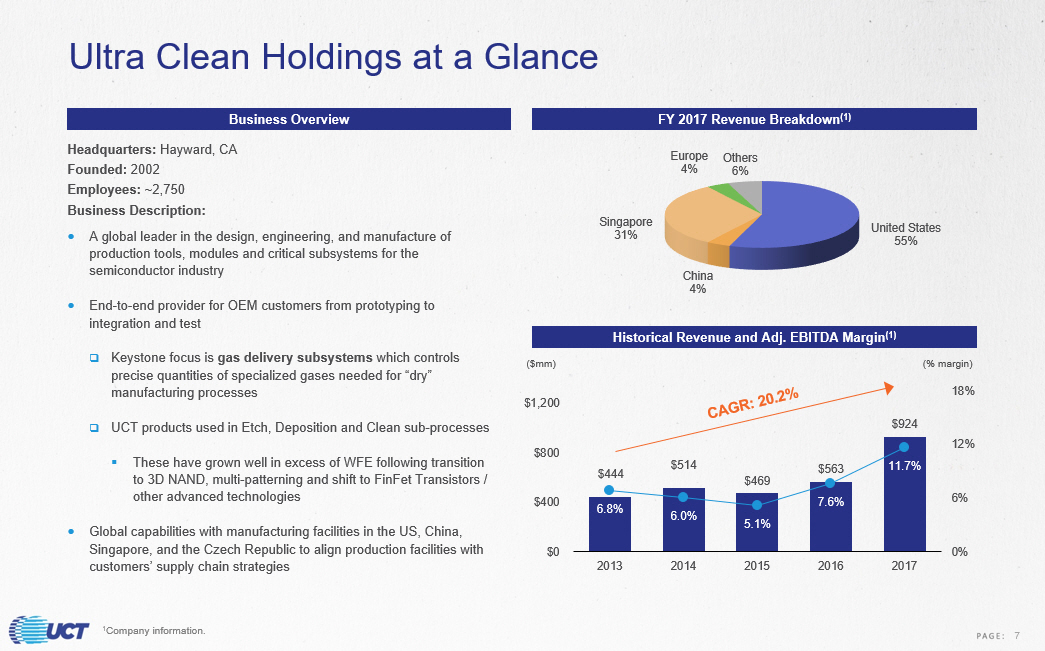
$444 $514 $469 $563 $924 6.8% 6.0% 5.1% 7.6% 11.7% 0% 6% 12% 18% $0 $400 $800 $1,200 2013 2014 2015 2016 2017 (% margin ) ($mm) Ultra Clean Holdings at a Glance Headquarters: Hayward, CA Founded: 2002 Employees: ~ 2,750 Business Description: A global leader in the design, engineering, and manufacture of production tools, modules and critical subsystems for the semiconductor industry End - to - end provider for OEM customers from prototyping to integration and test □ Keystone focus is gas delivery subsystems which controls precise quantities of specialized gases needed for “dry” manufacturing processes □ UCT products used in Etch, Deposition and Clean sub - processes ▪ These have grown well in excess of WFE following transition to 3D NAND, multi - patterning and shift to FinFet Transistors / other advanced technologies Global capabilities with manufacturing facilities in the US, China, Singapore, and the Czech Republic to align production facilities with customers’ supply chain strategies Business Overview FY 2017 Revenue Breakdown (1) Historical Revenue and Adj. EBITDA Margin (1) United States 55% China 4% Singapore 31% Europe 4% Others 6% 1 Company information. 7

Customers Choose UCT Through All Steps of the Value Chain Design for manufacturability (DFM) New product design and manufacture Global network of strategic suppliers Comprehensive new product introduction process Subsystem through full tool integration Prototyping / Development Manufacturing / Engineering Supply Chain Management Manufacturing Integration and Test Highly integrated, one - stop full spectrum solution for semi equipment customers 8

PROCESS CHAMBER GAS PANEL TRANSFER CHAMBER FACTORY INTERFACE Semi Manufacturing Process UCT’s solutions address key semiconductor manufacturing processes, which provides avenues for organic market expansion going forward Source: Company Information. UCT’s Solutions Form the Backbone for the Complex Semiconductor Manufacturing Process 9
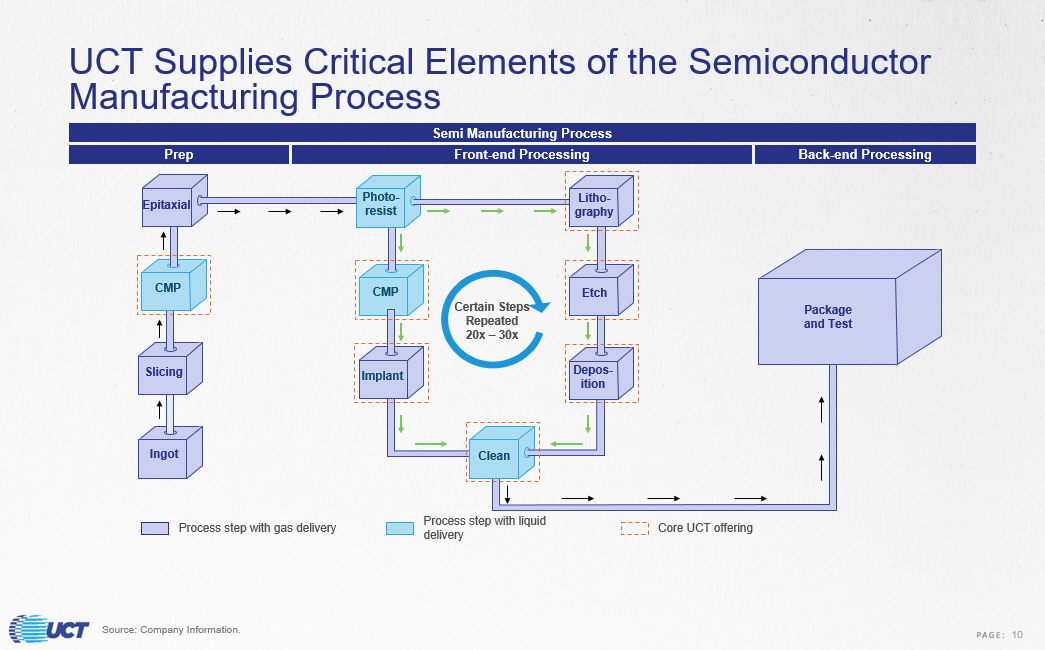
UCT Supplies Critical Elements of the Semiconductor Manufacturing Process Prep Front - end Processing Back - end Processing Semi Manufacturing Process Process step with gas delivery Process step with liquid delivery Epitaxial Photo - resist Litho - graphy CMP Slicing Ingot CMP Implant Clean Depos - ition Etch Certain Steps Repeated 20x – 30x Package and Test Core UCT offering Source: Company Information. 10

Strong Market Share with Meaningful Opportunity to Drive Further Penetration OEM Outsourced Manufacturing Market Share x Need for uniform delivery solutions favors UCT as OEMs continue to outsource gas subsystems to reduce fixed costs and better focus on their value - added processes x 50% of gas delivery is currently done in - house and there is potential to gain share from insourcers x Chemical subsystems market is highly fragmented and UCT has opportunity to grow and consolidate market share going forward UCT 5% Other Subsystems Providers: Flex , Celestica, Benchmark, etc. 10% Specialty Contract Manufacturers 7% OEM Component Suppliers 34% OEM In - Sourcing 44% Source: Company Information. 11
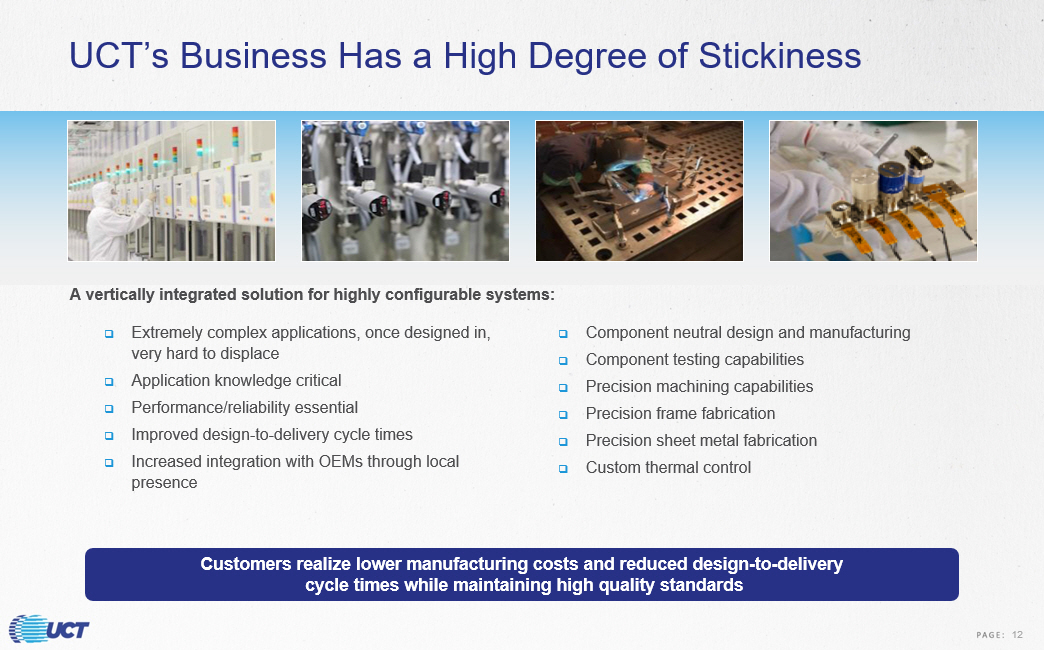
UCT’s Business Has a High Degree of Stickiness □ Extremely complex applications, once designed in, very hard to displace □ Application knowledge critical □ Performance/reliability essential □ Improved design - to - delivery cycle times □ Increased integration with OEMs through local presence □ Component neutral design and manufacturing □ Component testing capabilities □ Precision machining capabilities □ Precision frame fabrication □ Precision sheet metal fabrication □ Custom thermal control Customers realize lower manufacturing costs and reduced design - to - delivery cycle times while maintaining high quality standards A vertically integrated solution for highly configurable systems: 12

A CM- UCT CM-A B CM-B C D E F CM-C G H CM-D I J K L M N O P Q R S T U V W Specialty Manufacturer Contract Manfacturer Thousands of additional suppliers Leading Manufacturer in a Highly Fragmented Supply Chain Semi Equipment Revenue Manufacturers Meaningful scale positions UCT to provide differentiated, comprehensive global solutions. Fragmented sub - scale market provides opportunities to optimize utilization, cost base and customer reach. Source: VLSI 2016 Critical Subsystems Market Share (excludes pump and optic suppliers), UCT internal estimates. Scale is Difficult to Achieve 13
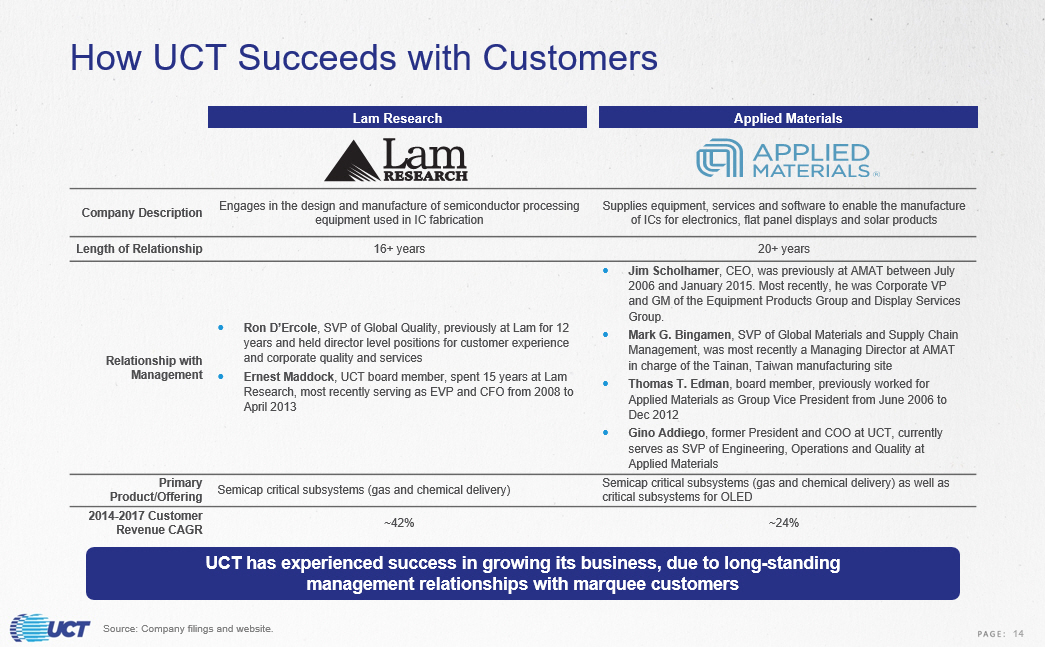
How UCT Succeeds with Customers Company Description Engages in the design and manufacture of semiconductor processing equipment used in IC fabrication Supplies equipment, services and software to enable the manufacture of ICs for electronics, flat panel displays and solar products Length of Relationship 16+ years 20+ years Relationship with Management Ron D’Ercole , SVP of Global Quality, previously at Lam for 12 years and held director level positions for customer experience and corporate quality and services Ernest Maddock , UCT board member, spent 15 years at Lam Research, most recently serving as EVP and CFO from 2008 to April 2013 Jim Scholhamer , CEO, was previously at AMAT between July 2006 and January 2015. Most recently, he was Corporate VP and GM of the Equipment Products Group and Display Services Group. Mark G. Bingamen , SVP of Global Materials and Supply Chain Management, was most recently a Managing Director at AMAT in charge of the Tainan, Taiwan manufacturing site Thomas T. Edman , board member, previously worked for Applied Materials as Group Vice President from June 2006 to Dec 2012 Gino Addiego , former President and COO at UCT, currently serves as SVP of Engineering, Operations and Quality at Applied Materials Primary Product/Offering Semicap critical subsystems (gas and chemical delivery) Semicap critical subsystems (gas and chemical delivery) as well as critical subsystems for OLED 2014 - 2017 Customer Revenue CAGR ~42% ~24% Applied Materials Lam Research Source: Company filings and website. UCT has experienced success in growing its business, due to long - standing management relationships with marquee customers 14

Disciplined Track Record in Executing Acquisitions Feb 2015 Aug 2015 Sep 2018 Jul 2012 American Integration Technologies (AIT) Miconex acquisition bolstered UCT’s position in the chemical delivery market and augmented UCT’s manufacturing capabilities for wet clean and CMP subsystems Acquisition of Marchi facilitated the Company’s vertical integration in chemical and gas delivery UCT’s acquisition of AIT added to its existing customer base in the semiconductor and medical spaces and expanded manufacturing capabilities QGT acquisition positions UCT to capitalize on the fastest growing segments of WFE market and become the leading outsourcing manufacturer for the semiconductor capital equipment industry Highly strategic M&A focused on targets that are accretive to earnings with recurring cash flows Purchase Price: $100.3mm EV / EBITDA: ~ 5.0x PF Debt / EBITDA: ~1.5X Purchase Price: $43.6mm EV / EBITDA: ~11.8x PF Debt / EBITDA: ~2.2x Purchase Price: $22.8mm EV / EBITDA: ~6.2x PF Debt / EBITDA: ~3.7x Purchase Price: $342mm EV / EBITDA: ~ 6.6x PF Debt / EBITDA: ~2.2x Source: Company materials, Company filings and website. 15

“We are very pleased to add Marchi’s unique products and expertise to UCT and expect the transaction to be immediately accretive to earnings following the close of the transaction. Like UCT, Marchi products are well entrenched in leading semiconductor capital equipment providers, enabling advanced processes through precise and stable temperature control of gas and liquid delivery” - Jim Scholhamer UCT Commentary at Time of Transaction Case Studies: UCT’s Acquisitions of Marchi and Miconex On February 5, 2015, UCT signed and closed on its acquisition of Marchi Thermal Systems, Inc. (Marchi), which included substantially all of Marchi’s assets and certain of its liabilities. UCT paid a purchase price of ~$ 43.6 million. Marchi had ~$17 million in revenue in its last fiscal year ended December 31, 2014 versus $40 million in 2017. The acquisition of Marchi: □ Deepened the Company’s offerings to its existing customer base by facilitating vertical integration in chemical and gas delivery □ Integrated a key component of UCT’s gas panels, bringing the Company even closer to the customer in the product design stage □ Expanded UCT’s capabilities and its footprint with existing customers Transaction Description February 2015 has agreed to acquire $43.6 million Source: Press release, Company filings, Company information. 1 Consideration included $15mm in cash, 500,000 UCT shares (valued at $7.58 as of July 31, 2015 close) and a $4mm potential cas h e arn out payable over a two - year period. On August 3, 2015, UCT signed and closed an agreement to acquire Miconex s.r.o. (Miconex), a provider of advanced precision fabrication of plastics, primarily for the semiconductor industry. Located in the Czech Republic, Miconex had revenue of ~$40.5 million in the twelve months ending June 30, 2015 versus ~$72 million in 2017. The acquisition of Miconex : □ Extended the Company’s capabilities in specialty manufacturing processes for wet clean and CMP subsystems □ Expanded UCT’s addressable market in semiconductor equipment and adjacent segments □ Strengthened the Company’s position in chemical delivery Transaction Description “With Miconex, our offerings now include a new and advanced set of competencies in the manufacture of highly complex fluid systems used for wet processing steps like cleaning, chemical mechanical polishing and electrochemical deposition. Miconex employees bring excellence in engineering, precision machining, welding, assembly and integration of high performance plastics” - Jim Scholhamer UCT Commentary at Time of Transaction August 2015 has agreed to acquire $22.8 million (1) UCT’s past acquisition expertise will ensure QGT acquisition is seamlessly integrated 16
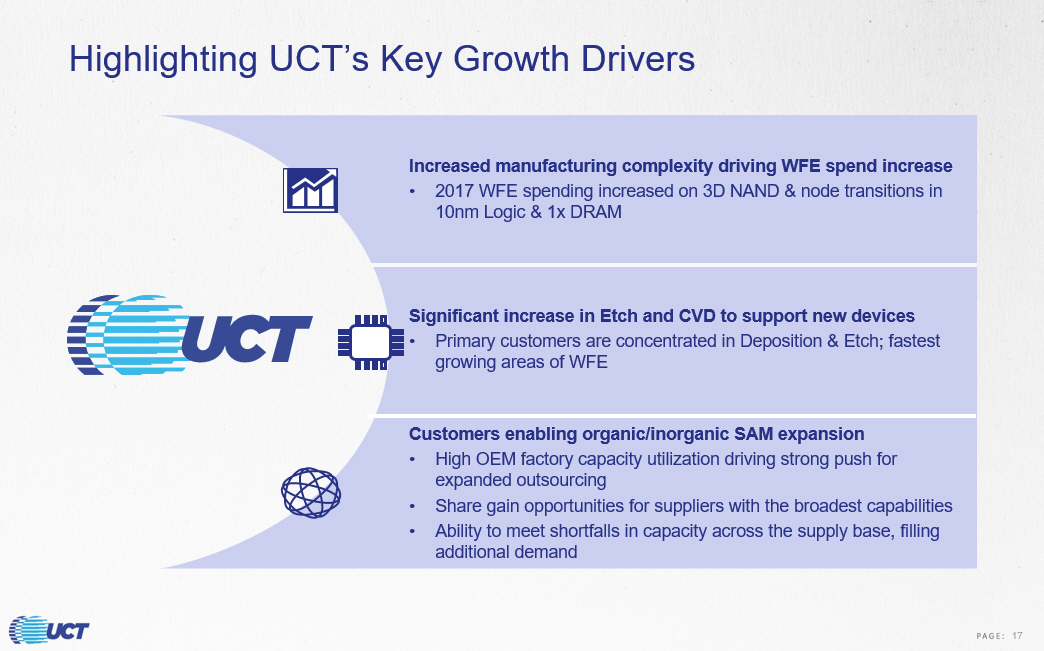
Significant increase in Etch and CVD to support new devices • Primary customers are concentrated in Deposition & Etch; fastest growing areas of WFE Customers enabling organic/inorganic SAM expansion • High OEM factory capacity utilization driving strong push for expanded outsourcing • Share gain opportunities for suppliers with the broadest capabilities • Ability to meet shortfalls in capacity across the supply base, filling additional demand Increased manufacturing complexity driving WFE spend increase • 2017 WFE spending increased on 3D NAND & node transitions in 10nm Logic & 1x DRAM Highlighting UCT’s Key Growth Drivers 17

UCT Core Management Team Leadership Team with strong industry expertise and proven track record Jim Scholhamer Chief Executive Officer CEO since 2015 Previously Corporate Vice President and General Manager at Applied Materials, Inc. Headed display and manufacturing operations of Applied Materials when the group delivered on $1B in revenue Mark Bingaman Senior Vice President of Global Materials and Supply Chain Management SVP of Global Materials and Supply Chain Management since 2010 30+ years of experience with McDonnell Douglas, Applied Materials and UCT Previously Managing Director at Applied Materials, in charge of site at Tainan, Taiwan which manufactured Solar, glass and di spl ay capital equipment Jim Pursiano Head of Corporate Development Previously Principal at Venturi & Company LLC Former Managing Director of Corporate Development at Applied Materials, joined Applied Materials’ Corporate Business Developm ent Group to help build the firm’s Corporate Development and M&A capabilities Ron D’Ercole Senior Vice President of Global Quality SVP of Global Quality since 2016 Joined UCT in 2014 as Vice President of Quality Previously held director positions at Lam Research and Novellus Systems David Speirs Senior Vice President of Machining SVP of Machining since 2010, joined UCT in 2006 to manage the manufacturing operations of Sieger Engineering following its acquisition Worked in the semiconductor capital equipment industry for the more than 20 years Previously VP of Operations for Metara Inc. and held several director level management positions at Novellus Systems Sheri Savage Chief Financial Officer CFO since 2016 Served as Senior Director of Finance starting in 2009 Previously Corporate Controller, Vice President of Finance and Director of Internal Audit at various semiconductor capital eq uip ment companies 18
ACQUISITION RATIONALE AND QGT OVERVIEW
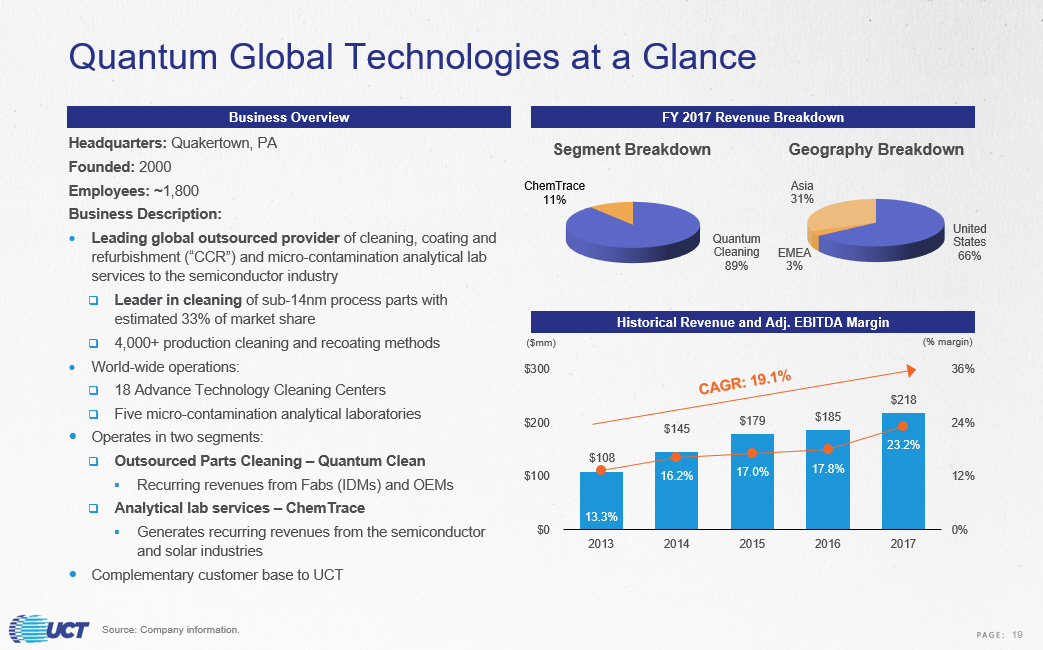
$108 $145 $179 $185 $218 13.3% 16.2% 17.0% 17.8% 23.2% 0% 12% 24% 36% $0 $100 $200 $300 2013 2014 2015 2016 2017 (% margin ) ($mm) Quantum Global Technologies at a Glance Headquarters: Quakertown, PA Founded: 2000 Employees: ~ 1,800 Business Description: Leading global outsourced provider of cleaning , coating and refurbishment (“CCR”) and micro - contamination analytical lab services to the semiconductor industry □ Leader in cleaning of sub - 14nm process parts with estimated 33% of market share □ 4,000+ production cleaning and recoating methods World - wide operations: □ 18 Advance Technology Cleaning Centers □ Five micro - contamination analytical laboratories Operates in two segments: □ Outsourced Parts Cleaning – Quantum Clean ▪ Recurring revenues from Fabs (IDMs) and OEMs □ Analytical lab services – ChemTrace ▪ Generates recurring revenues from the semiconductor and solar industries Complementary customer base to UCT Business Overview FY 2017 Revenue Breakdown Historical Revenue and Adj. EBITDA Margin Quantum Cleaning 89% ChemTrace 11% Segment Breakdown United States 66% EMEA 3% Asia 31% Geography Breakdown Source: Company information. 19
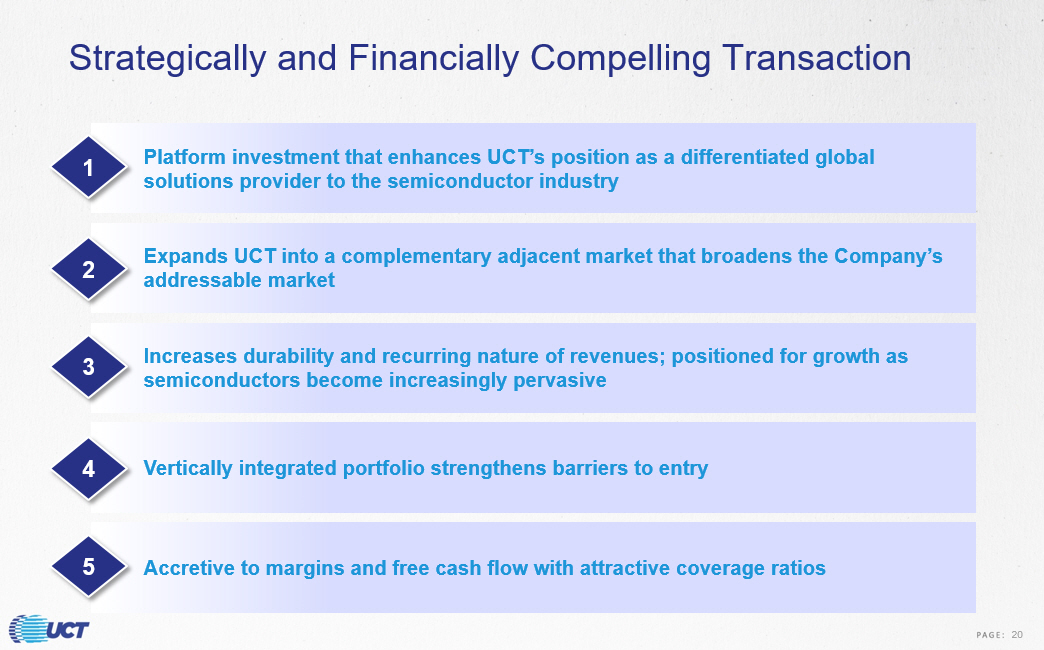
Strategically and Financially Compelling Transaction Platform investment that enhances UCT’s position as a differentiated global solutions provider to the semiconductor industry Expands UCT into a complementary adjacent market that broadens the Company’s addressable market Increases durability and recurring nature of revenues; positioned for growth as semiconductors become increasingly pervasive Vertically integrated portfolio strengthens barriers to entry Accretive to margins and free cash flow with attractive coverage ratios 1 2 3 4 5 20
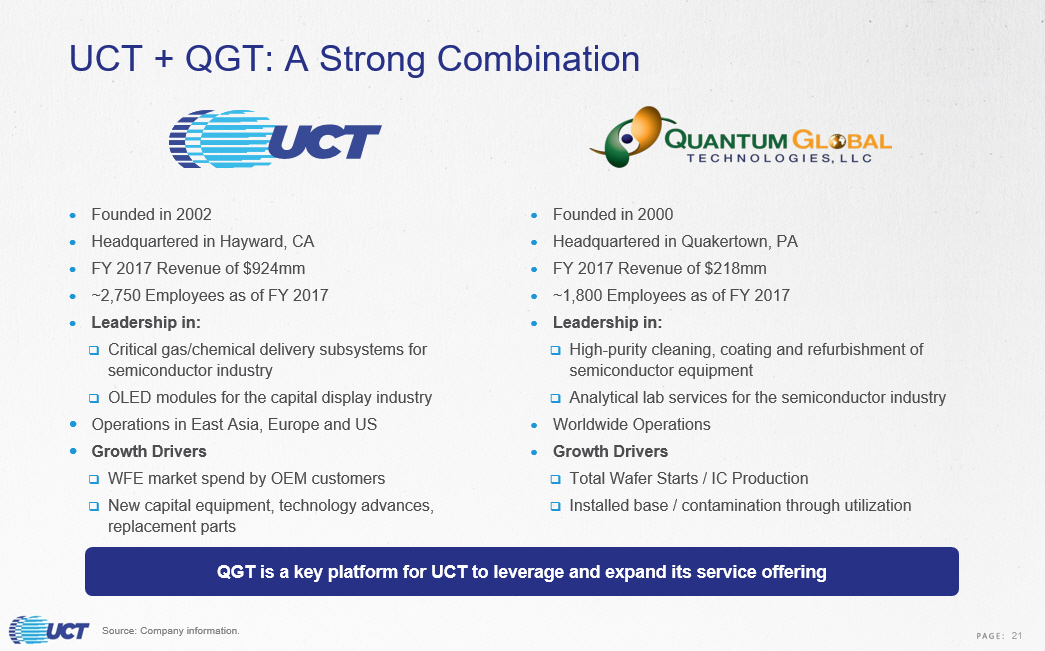
Founded in 2002 Headquartered in Hayward, CA FY 2017 Revenue of $924mm ~2,750 Employees as of FY 2017 Leadership in: □ Critical gas/chemical delivery subsystems for semiconductor industry □ OLED modules for the capital display industry Operations in East Asia, Europe and US Growth Drivers □ WFE market spend by OEM customers □ New capital equipment, technology advances, replacement parts Founded in 2000 Headquartered in Quakertown, PA FY 2017 Revenue of $218mm ~ 1,800 Employees as of FY 2017 Leadership in: □ High - purity cleaning, coating and refurbishment of semiconductor equipment □ Analytical lab services for the semiconductor industry Worldwide Operations Growth Drivers □ Total Wafer Starts / IC Production □ Installed base / contamination through utilization Source: Company information. QGT is a key platform for UCT to leverage and expand its service offering UCT + QGT: A Strong Combination 21

Historical Financial Summary Historical Revenue Adj. EBITDA (1) / Adj. EBITDA Margin (FYE) (FYE) $444 $514 $469 $563 $924 $108 $145 $179 $185 $218 $0 $500 $1,000 $1,500 2013 2014 2015 2016 2017 ($mm) $30 $31 $24 $42 $108 $14 $24 $30 $33 $50 6.8% 6.0% 5.1% 7.5% 11.7% 13.3% 16.2% 17.0% 17.8% 23.2% (80%) (40%) 0% 40% $0 $80 $160 $240 2013 2014 2015 2016 2017 ($mm) UCT QGT Source: Company Filings. 1 Financials are non - GAAP and adjusted for stock - based compensation, amortization of intangibles and non - recurring items. • UCT and QGT experienced strong 2017 revenue growth of 64.3% and 17.5%, respectively • QGT revenue streams would have helped the PF company partially offset revenue declines in FY2015 • Weighted avg. CAGR of 19.9% Commentary • UCT and QGT both reached their highest EBITDA margins of the past 4 years in 2017 at 11.7% and 23.2%, respectively • UCT’s margin improved 4.9% over the 4 year period, while QGT’s margin grew 9.9%, almost doubling Commentary 22
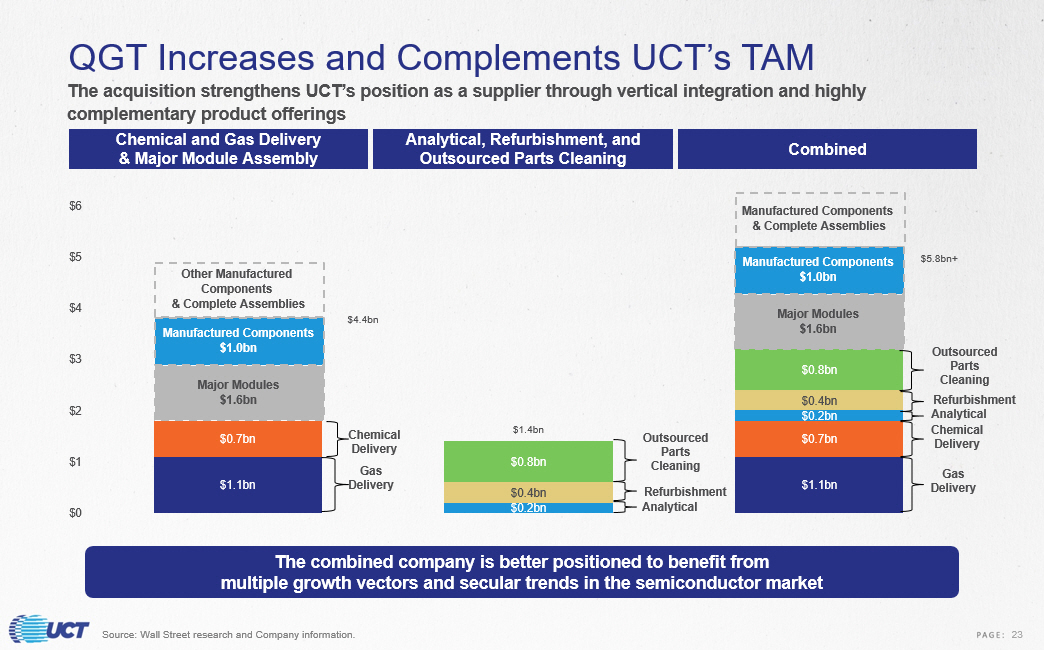
The acquisition strengthens UCT’s position as a supplier through vertical integration and highly complementary product offerings Source: Wall Street research and Company information. QGT Increases and Complements UCT’s TAM $1.1bn $1.1bn $0.7bn $0.7bn $0.2bn $0.2bn $0.4bn $0.4bn $0.8bn $0.8bn $4.4bn $1.4bn $5.8bn+ $0 $1 $2 $3 $4 $5 $6 Chemical and Gas Delivery & Major Module Assembly Analytical, Refurbishment, and Outsourced Parts Cleaning Combined Gas Delivery Chemical Delivery Analytical Refurbishment Outsourced Parts Cleaning Gas Delivery Chemical Delivery Analytical Refurbishment Outsourced Parts Cleaning The combined company is better positioned to benefit from multiple growth vectors and secular trends in the semiconductor market Manufactured Components & Complete Assemblies Major Modules $1.6bn Other Manufactured Components & Complete Assemblies Manufactured Components $1.0bn Major Modules $1.6bn Manufactured Components $1.0bn 23
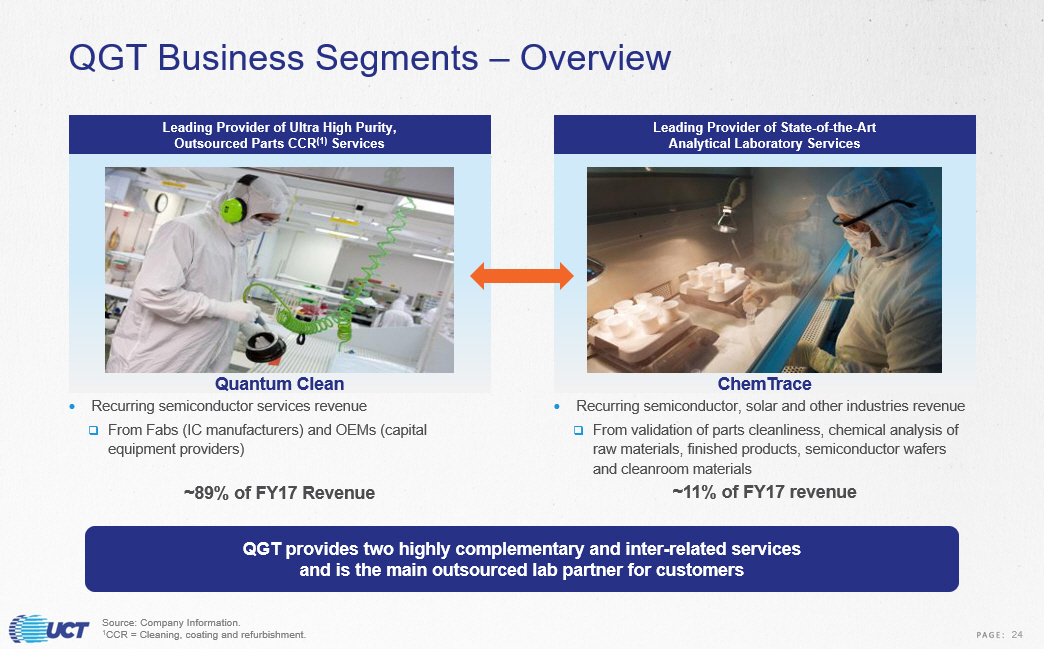
Leading Provider of Ultra High Purity, Outsourced Parts CCR (1) Services Leading Provider of State - of - the - Art Analytical Laboratory Services Quantum Clean ChemTrace Recurring semiconductor services revenue □ From Fabs ( IC manufacturers) and OEMs (capital equipment providers) Recurring semiconductor, solar and other industries revenue □ From validation of parts cleanliness, chemical analysis of raw materials, finished products, semiconductor wafers and cleanroom materials ~89% of FY17 Revenue ~11% of FY17 revenue QGT provides two highly complementary and inter - related services and is the main outsourced lab partner for customers Source: Company Information. 1 CCR = Cleaning, coating and refurbishment. QGT Business Segments – Overview 24
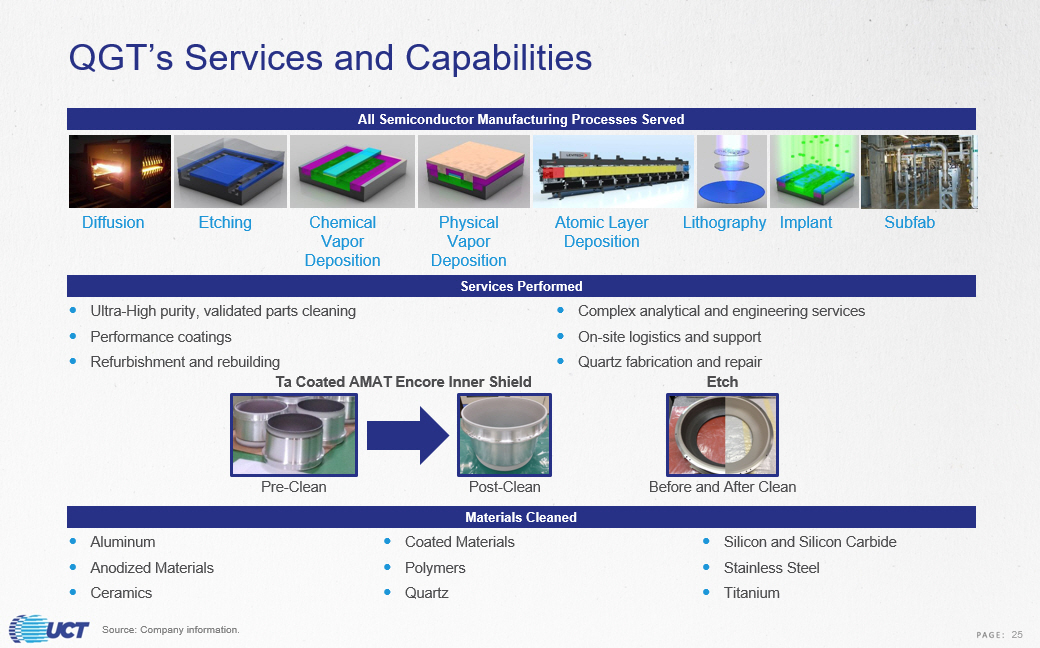
QGT’s Services and Capabilities Aluminum Anodized Materials Ceramics All Semiconductor Manufacturing Processes Served Materials Cleaned Diffusion Etching Chemical Vapor Deposition Physical Vapor Deposition Atomic Layer Deposition Lithography Implant Subfab Coated Materials Polymers Quartz Silicon and Silicon Carbide Stainless Steel Titanium Ultra - High purity, validated parts cleaning Performance coatings Refurbishment and rebuilding Services Performed Complex analytical and engineering services On - site logistics and support Quartz fabrication and repair Source: Company information. Ta Coated AMAT Encore Inner Shield Pre - Clean Post - Clean Etch Before and After Clean 25

Outsized Growth in Sub - 14nm Manufacturing 0 2,000 4,000 6,000 8,000 10,000 12,000 2000 2001 2002 2003 2004 2005 2006 2007 2008 2009 2010 2011 2012 2013 2014 2015 2016 2017 2018 2019 0.010 Micron 0.014 Micron 0.015 Micron 0.019 Micron 0.020 Micron 0.022 Micron 0.028 Micron 0.032 Micron 0.040 Micron 0.045 Micron 0.065 Micron 0.08 Micron 0.09 Micron 0.11 Micron 0.13 Micron 0.15 Micron 0.18 Micron 0.25 Micron 0.0.35 Micron >=0.50 Micron Wafer Square Inch by Geometry Millions of Square Inches (MSI) ~250% growth projected in sub - 14nm silicon square inches (wafers) from 2016 to 2019. Quantum positioned to take full advantage of sub - 14nm growth QGT’s services become extremely critical and differentiated to ensure high wafer yields and throughput, as chip geometries shrink and density increases Source: Company information. 26

FY 2016 Sales ($mm) FY 2017 Sales ($mm) % of FY 2017 Total Sales Customer Relationship Global leader in IDM space $56 $62 28.4% 10+ years Leading manufacturer of chips and advanced display 36 45 20.6% 10+ years Global leader in consumer electronics 40 44 20.2% 10+ years World - class provider of WFE 13 20 9.2% 10+ years World’s largest semiconductor foundry 5 7 3.2% 10+ years Global semiconductor company in analog/digital embedded processing 4 5 2.3% 10+ years Key player in semiconductor memory and storage 3 4 1.8% 10+ years Global pure foundry player/leader in specialty RF 2 3 1.4% 10+ years Key developer of advanced semiconductor equipment 3 2 0.9% 10+ years Others 23 26 11.9% Total $185 $218 100% IDM OEM Foundry With key relationships across multiple levels of the semiconductor value chain, QGT’s revenue is more resilient against customer specific weakness QGT has a Diverse Customer Base QGT’s Key Growth Drivers include: • Wafer starts per year and global IC production, which grew to 280bn IC Units in 2017 • Semiconductor demand, which has grown at a 7.2% CAGR from 2012 - 2017, and is projected to reach $503bn by 2020E • Progression of node geometries, with 2016 - 2019 projected growth of ~250% for sub - 14nm silicon wafers (will reach 3,000+ MSI by 2 020) Key QGT Growth Drivers Source: Company information. 27

QGT Operates from an Advantaged Position • Industry remains fragmented • Large customers are more likely to engage with large, global suppliers who can meet their requirements • Large number of small regional players serve ~72% of market □ Most serve local fabs or a specific small group of IC manufacturers □ Typically serve the trailing edge of technology nodes • Industry drivers favor consolidation: □ Smaller players unable to invest & meet technical requirements (for advanced technology nodes) □ Regional players cannot meet the copy - exact needs of global fabs or OEMs □ Consolidation should improve customer reach, capacity utilization and profitability Competitor A Competitor B Competitor C Others (~90) 14% 72% 6% 5% 3% CCR + Analytical Lab Services Market* Source: QGT Management estimates. Industry Highlights 28

QGT’s Addressable Market Opportunity 1 2016 Data. 2 Expected to grow at 15.4% CAGR 2016 – 2020 (Future Market Insights) to $3.0 trillion by 2020. Electronic End Market Products > $1.7T (2) Semiconductors $339bn Materials $44bn Process Tools $37bn Services $35bn $0.8bn $0.4bn $0.2bn Current market size for QGT’s services estimated between $1.2bn - $1.6bn Analytical Testing Refurbishment Outsourced Parts Cleaning 29

QGT Can Leverage UCT’s Global Footprint FY2017 Employees UCT QGT Total United States 1,347 941 2,288 Asia 1,051 684 1,735 EMEA 349 86 435 UCT Location QGT Location FY2017 Employees UCT QGT Total Engineering / Development 39 160 199 SG&A 268 452 720 Manufacturing 2,440 1,099 3,539 South San Francisco – Precision Machining Hayward – Weldments, Gas Panels, Integration Fremont – Prototyping Machine Czech Republic – Plastic Machining and fabrication, Integration Hayward – Thermal Systems Chandler – Sheet Metal, Frames, Integration Austin – Weldments, Gas Panel, Integration Philippines – Weldments, Modules Shanghai – Gas Panels, Weldments, Integration Global footprint provides co - location close to customers’ supply chain while allowing the Company to maintain a capital efficient business model Source: Company Information. Korea – QGT Israel – QGT Singapore – Gas Panel, Integration, Additive Manufacturing UK – QGT 30
CREDIT HIGHLIGHTS
Credit Highlights Capitalizing on Fastest Growing Semiconductor Market Segments 1 Critical Subsystems Provider Throughout Manufacturing Process 2 Increased Recurring Revenue and Business Resiliency 4 Proven Growth Strategy Driving Exceptional Results 6 Complementary Revenue Profile and Customer Base 3 Accretive to Margins and Free Cash Flow 5 31
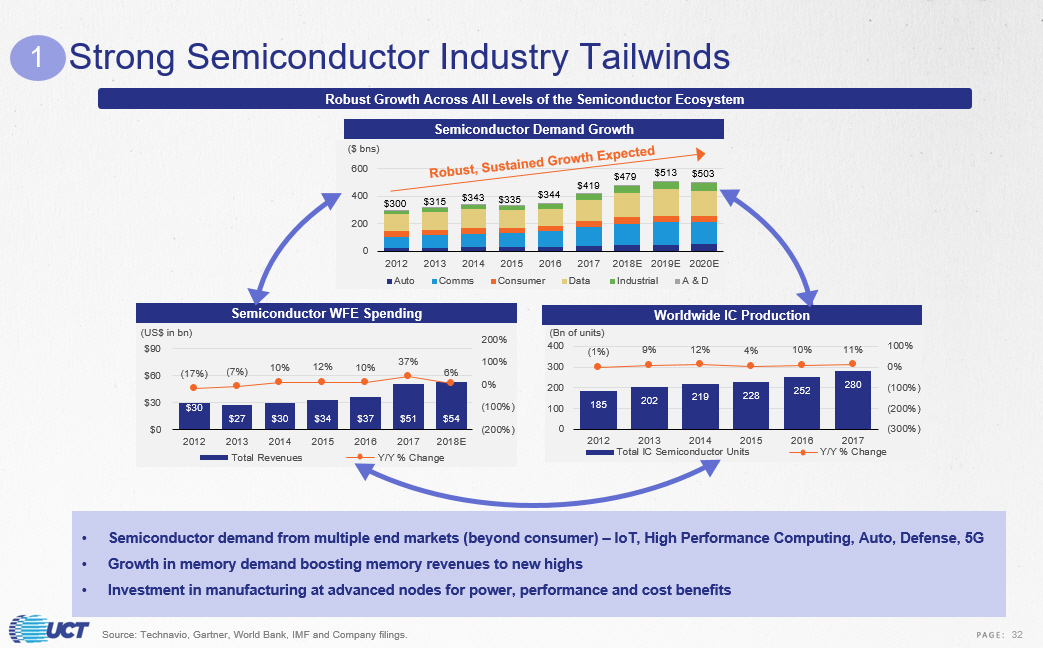
Strong Semiconductor Industry Tailwinds 1 0 200 400 600 2012 2013 2014 2015 2016 2017 2018E 2019E 2020E ($ bns) Auto Comms Consumer Data Industrial A & D $419 $479 $300 $343 $513 $315 $335 $344 $503 $30 $27 $30 $34 $37 $51 $54 (17%) (7%) 10% 12% 10% 37% 6% (200%) (100%) 0% 100% 200% $0 $30 $60 $90 2012 2013 2014 2015 2016 2017 2018E (US$ in bn) Total Revenues Y/Y % Change 185 202 219 228 252 280 (1%) 9% 12% 4% 10% 11% (300%) (200%) (100%) 0% 100% 0 100 200 300 400 2012 2013 2014 2015 2016 2017 (Bn of units) Total IC Semiconductor Units Y/Y % Change Robust Growth Across All Levels of the Semiconductor Ecosystem Source: Technavio, Gartner, World Bank, IMF and Company filings. Semiconductor Demand Growth Semiconductor WFE Spending Worldwide IC Production • Semiconductor demand from multiple end markets (beyond consumer) – IoT, High Performance Computing, Auto, Defense, 5G • Growth in memory demand boosting memory revenues to new highs • Investment in manufacturing at advanced nodes for power, performance and cost benefits 32

Applied Materials 18% Lam Research 15% ASML 13% Tokyo Electron 11% KLA - Tenor 5% Others 38% Strong Semiconductor Industry Tailwinds (cont’d) Semiconductor WFE market accounts for 50% – 55% of capital spending by semiconductor manufacturers □ WFE market dominated by five major players, accounting for 62% of total market share □ In 2017, WFE market exceeded approximately $ 51bn Smaller nodes (<7nm) require extremely advanced equipment and related services Advancements in manufacturing processes have led to growing importance of etch, deposition and clean steps Equipment spend for these processes has grown in excess of the rest of the WFE market , with deposition and etch growing at ~16% from 2015 - 2018, outpacing the broader market by ~4% Since downstream demand is ultimately determined by semiconductor demand, contract manufacturing services are poised to benefit All IDMs and OEMs outsource cleaning Semiconductor Industry Backdrop WFE Market Top 2 Customers of UCT 1 Source: Company information, Gartner. 33
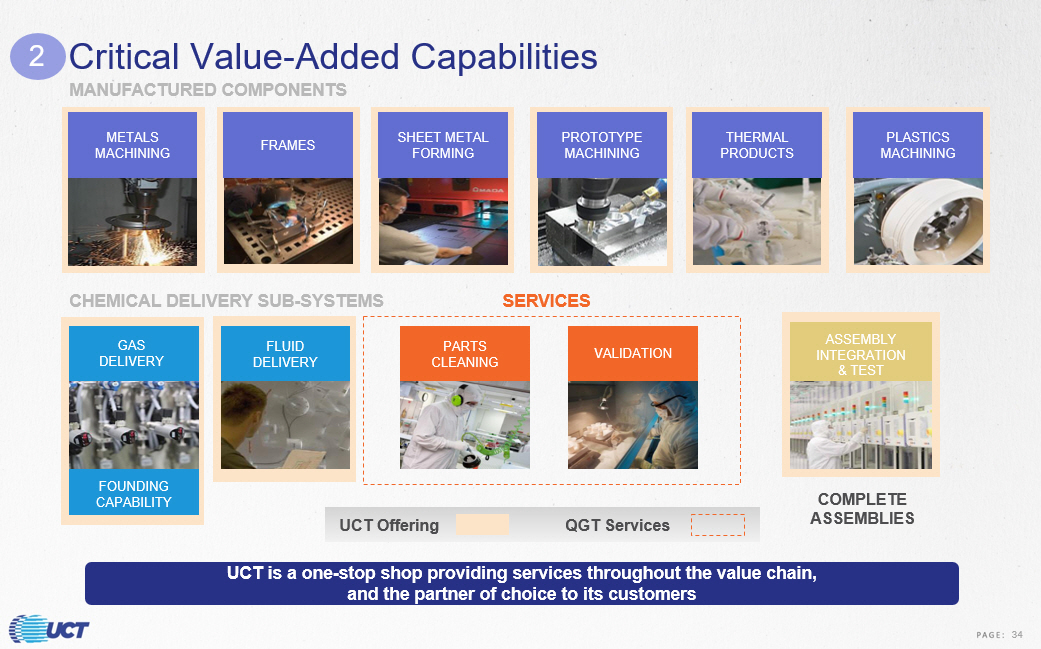
FOUNDING CAPABILITY MANUFACTURED COMPONENTS CHEMICAL DELIVERY SUB - SYSTEMS COMPLETE ASSEMBLIES GAS DELIVERY METALS MACHINING FRAMES SHEET METAL FORMING PROTOTYPE MACHINING THERMAL PRODUCTS PLASTICS MACHINING ASSEMBLY INTEGRATION & TEST FLUID DELIVERY PARTS CLEANING VALIDATION 2 UCT is a one - stop shop providing services throughout the value chain, and the partner of choice to its customers Critical Value - Added Capabilities UCT Offering QGT Services SERVICES 34
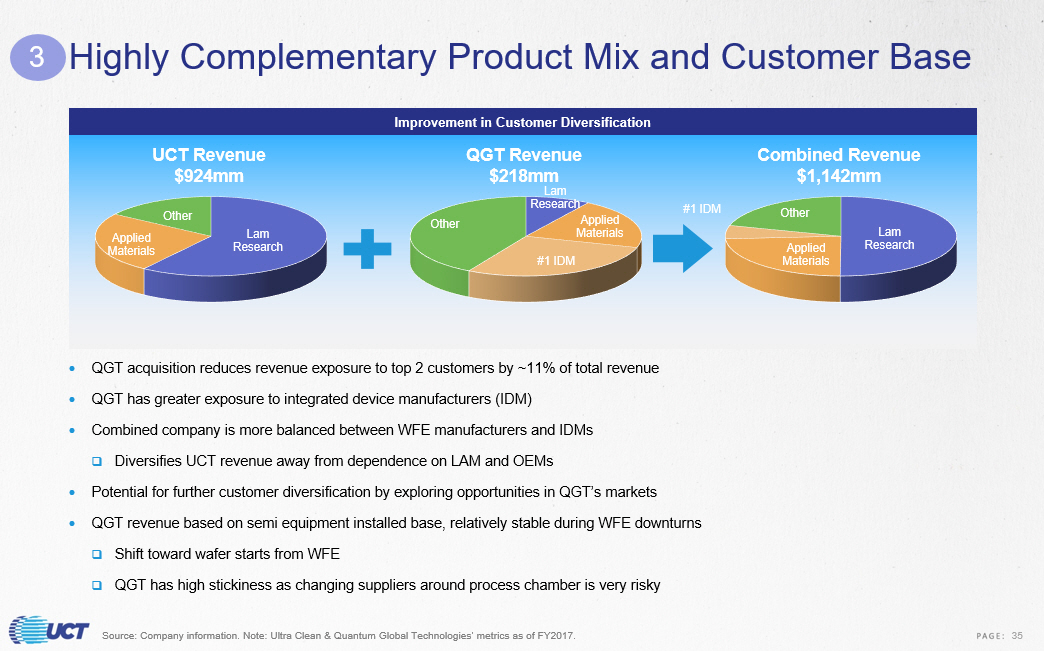
Lam Research Applied Materials Other Lam Research Applied Materials #1 IDM Other Lam Research Applied Materials #1 IDM Other UCT Revenue $924mm QGT Revenue $218mm Combined Revenue $1,142mm Highly Complementary Product Mix and Customer Base Source: Company information. Note: Ultra Clean & Quantum Global Technologies’ metrics as of FY2017. Improvement in Customer Diversification 3 QGT acquisition reduces revenue exposure to top 2 customers by ~11% of total revenue QGT has greater exposure to integrated device manufacturers (IDM) Combined company is more balanced between WFE manufacturers and IDMs □ Diversifies UCT revenue away from dependence on LAM and OEMs Potential for further customer diversification by exploring opportunities in QGT’s markets QGT revenue based on semi equipment installed base, relatively stable during WFE downturns □ Shift toward wafer starts from WFE □ QGT has high stickiness as changing suppliers around process chamber is very risky 35
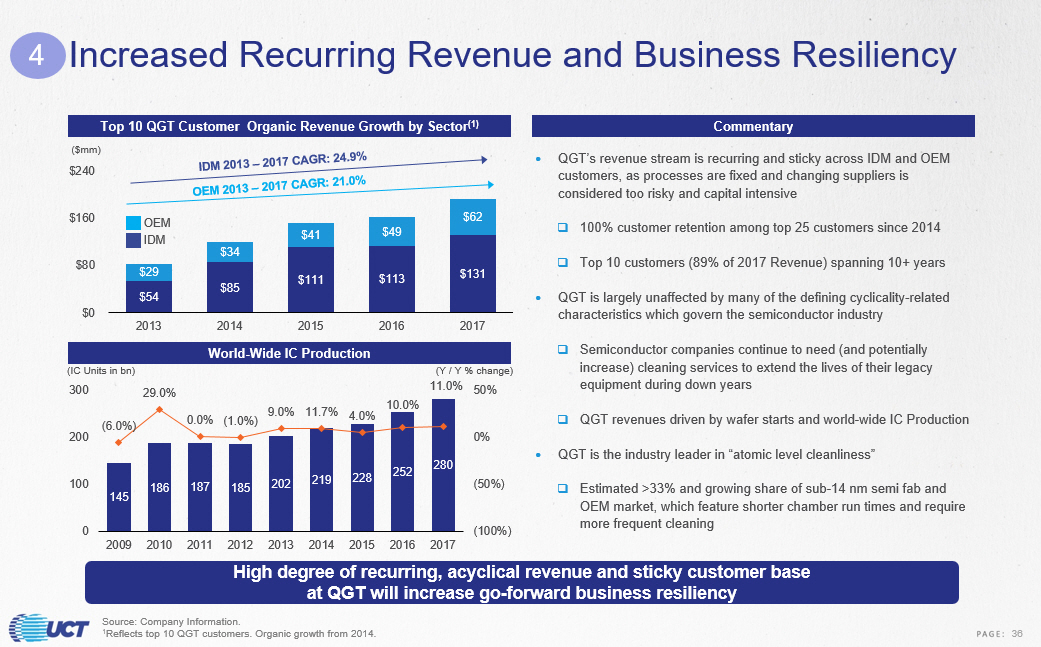
Increased Recurring Revenue and Business Resiliency High degree of recurring, acyclical revenue and sticky customer base at QGT will increase go - forward business resiliency QGT’s revenue stream is recurring and sticky across IDM and OEM customers, as processes are fixed and changing suppliers is considered too risky and capital intensive □ 100% customer retention among top 25 customers since 2014 □ Top 10 customers (89% of 2017 Revenue) spanning 10+ years QGT is largely unaffected by many of the defining cyclicality - related characteristics which govern the semiconductor industry □ Semiconductor companies continue to need (and potentially increase) cleaning services to extend the lives of their legacy equipment during down years □ QGT revenues driven by wafer starts and world - wide IC Production QGT is the industry leader in “atomic level cleanliness” □ Estimated >33% and growing share of sub - 14 nm semi fab and OEM market, which feature shorter chamber run times and require more frequent cleaning Commentary Top 10 QGT Customer Organic Revenue Growth by Sector (1) World - Wide IC Production Source: Company Information. 1 Reflects top 10 QGT customers. Organic growth from 2014. $54 $85 $111 $113 $131 $29 $34 $41 $49 $62 $0 $80 $160 $240 2013 2014 2015 2016 2017 ($mm) IDM OEM 145 186 187 185 202 219 228 252 280 (6.0%) 29.0% 0.0% (1.0%) 9.0% 11.7% 4.0% 10.0% 11.0% (100%) (50%) 0% 50% 0 100 200 300 2009 2010 2011 2012 2013 2014 2015 2016 2017 (IC Units in bn ) (Y / Y % change) 4 36
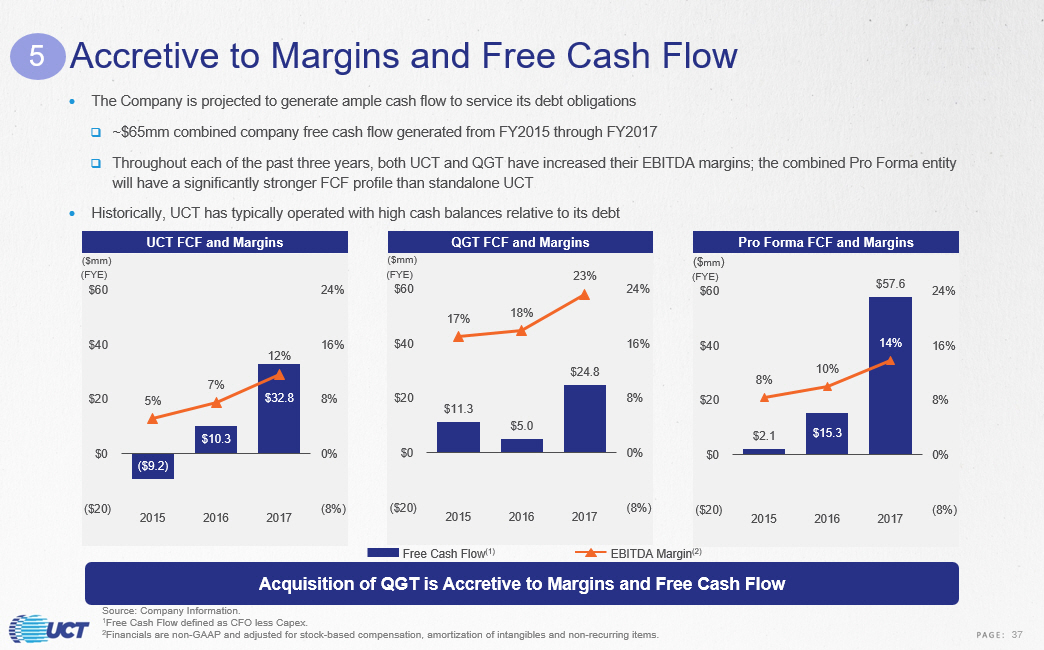
$11.3 $5.0 $24.8 17% 18% 23% (8%) 0% 8% 16% 24% ($20) $0 $20 $40 $60 2015 2016 2017 ($mm) $2.1 $15.3 $57.6 8% 10% 14% (8%) 0% 8% 16% 24% ($20) $0 $20 $40 $60 2015 2016 2017 ($ mm ) ($9.2) $10.3 $32.8 5% 7% 12% (8%) 0% 8% 16% 24% ($20) $0 $20 $40 $60 2015 2016 2017 ($mm) Accretive to Margins and Free Cash Flow The Company is projected to generate ample cash flow to service its debt obligations □ ~$65mm combined company free cash flow generated from FY2015 through FY2017 □ Throughout each of the past three years, both UCT and QGT have increased their EBITDA margins; the combined Pro Forma entity will have a significantly stronger FCF profile than standalone UCT Historically, UCT has typically operated with high cash balances relative to its debt UCT FCF and Margins (FYE) (FYE) (FYE) Free Cash Flow (1) EBITDA Margin (2) Source: Company Information. 1 Free Cash Flow defined as CFO less Capex. 2 Financials are non - GAAP and adjusted for stock - based compensation, amortization of intangibles and non - recurring items. Acquisition of QGT is Accretive to Margins and Free Cash Flow QGT FCF and Margins Pro Forma FCF and Margins 5 37

$403 $444 $514 $469 $563 $924 5.1% 6.8% 6.0% 5.1% 7.6% 11.7% $0 $100 $200 $300 $400 $500 $600 $700 $800 $900 $1,000 0% 2% 4% 6% 8% 10% 12% 14% ($mm) UCT Revenue UCT EBITDA Margin Growth Strategy Driving Exceptional Results July 2012 American Integration Technologies (AIT) 2012 2013 2014 2015 2016 2017 February / August 2015 / 2018 January 2015 Focus on Semiconductor End Market September 2018 (FYE) 2016 & 2017 Faster Growth than WFE Market and Customers Source: Company Filings. The Company’s strategy has driven organic growth historically, strategically supplemented by accretive acquisitions 6 38

UCT’s Financial Policy
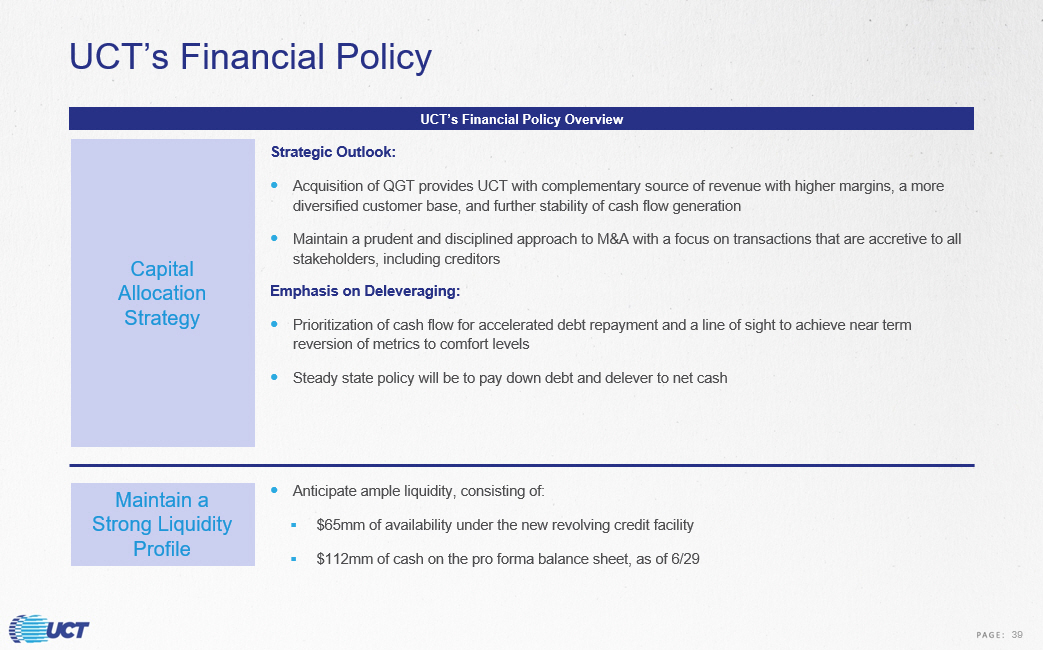
UCT’s Financial Policy UCT’s Financial Policy Overview Strategic Outlook: Acquisition of QGT provides UCT with complementary source of revenue with higher margins, a more diversified customer base, and further stability of cash flow generation Maintain a prudent and disciplined approach to M&A with a focus on transactions that are accretive to all stakeholders, including creditors Emphasis on Deleveraging: Prioritization of cash flow for accelerated debt repayment and a line of sight to achieve near term reversion of metrics to comfort levels Steady state policy will be to pay down debt and delever to net cash Anticipate ample liquidity, consisting of: ▪ $65mm of availability under the new revolving credit facility ▪ $112mm of cash on the pro forma balance sheet, as of 6/29 Capital Allocation Strategy Maintain a Strong Liquidity Profile 39

APPENDIX

Ultra Clean Holdings, Inc. Pro Forma Structure Ultra Clean Holdings, Inc. (DE) $65mm RCF due 2023 $350mm Term Loan B due 2025 Quantum Global Technologies, LLC (DE) Ultra Clean Technology Systems and Service, Inc. (CA) UCT Thermal Solutions, Inc. (DE) Ultra Clean International Holding Company (Caymans) Asian Non - Guarantor Restricted Subsidiaries Asian Non - Guarantor Restricted Subsidiaries Quantum Global Technologies Holding Company, LLC (US) Borrower Guarantor Non - Guarantor American Integration Technologies, LLC. (DE) Asian Non - Guarantor Restricted Subsidiaries 40

EBITDA Bridge $105 $10 $2 $118 $43 $5 $49 $0 $167 $0 $50 $100 $150 $200 UCT 6/29 EBITDA Stock Based Comp One-Time Charges UCT 6/29 Adj. EBITDA QGT 6/29 EBITDA Stock Based Comp + Precious Metal Recovery Acquisition and Other Adjustments QGT 6/29 Adj. EBITDA Synergies New Co. Adj. EBITDA ($mm) (1) (2) EBITDA Bridge (As of 6/29) $1 Note: Adj. EBITDA takes into account stock based compensation and related one - time charges. 1 UCT one - time charges include income - tax effect of non - GAAP adjustments, restructuring fees reserved for severance and other cost s related to the closure of the Company’s operations in China, and one time consulting fees related to the expansion of the Company’s operations in Singapore. 2 QGT adjustments include one time legal charges, HR expenses, bonus normalization, site relocation costs and other non - recurring items. 41

1 UCT and one - time charges include income - tax effect of non - GAAP adjustments, restructuring fees reserved for severance and other costs related to the closure of the Company’s operations in China, and one time consulting fees related to the expansion of the Company’s operations in Singapore. 2 QGT adjustments include one time acquisition related items, precious metals recovery, and other non - recurring expenses. GAAP to Non - GAAP Reconciliation EBITDA Unaudited Reconciliation of Pro Forma Combined GAAP Net Income to Pro Forma Combined Adjusted EBITDA LTM ended 6/29/2018 ($ in millions) UCT QGT Pro Forma Combined GAAP Net Income 84$ 20$ 105$ Provision for Taxes 10 2 11 Interest and Other Expense, net 1 8 9 Depreciation 5 13 18 Amortization 5 2 8 Stock-Based Compensation 10 1 12 Other Non-recurring Items 2 2 5 Adjusted EBITDA 118$ 49$ 167$ Unaudited Combined Pro Forma Revenue LTM ended 6/29/2018 ($ in millions) UCT QGT Pro Forma Combined Revenue 1,097$ 231$ 1,327$ 42
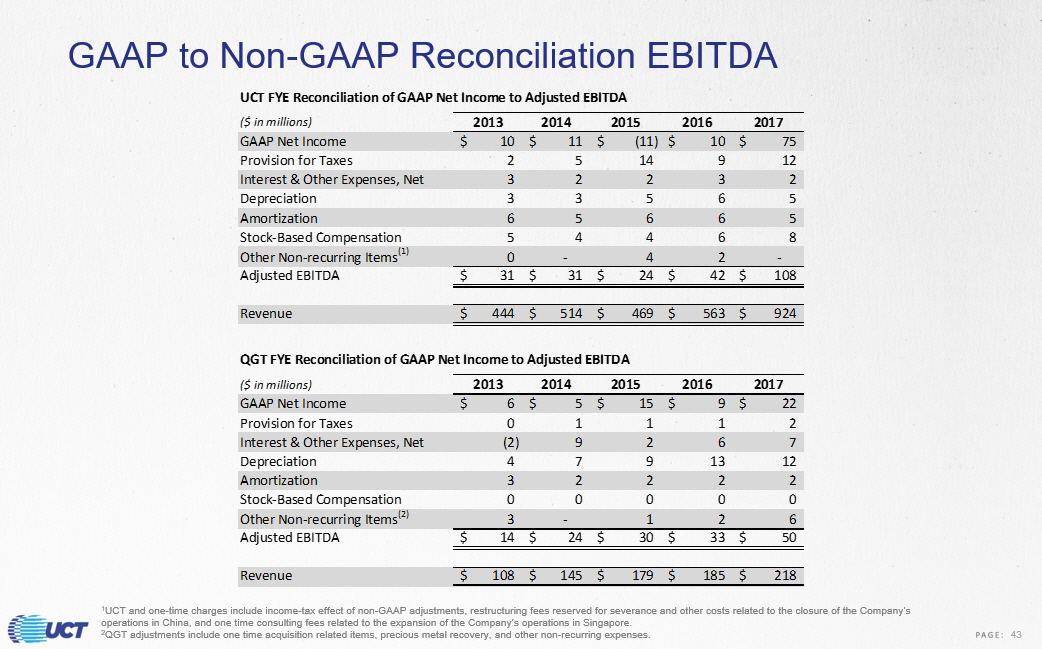
1 UCT and one - time charges include income - tax effect of non - GAAP adjustments, restructuring fees reserved for severance and other costs related to the closure of the Company’s operations in China, and one time consulting fees related to the expansion of the Company’s operations in Singapore. 2 QGT adjustments include one time acquisition related items, precious metal recovery, and other non - recurring expenses. GAAP to Non - GAAP Reconciliation EBITDA UCT FYE Reconciliation of GAAP Net Income to Adjusted EBITDA ($ in millions) 2013 2014 2015 2016 2017 GAAP Net Income 10$ 11$ (11)$ 10$ 75$ Provision for Taxes 2 5 14 9 12 Interest & Other Expenses, Net 3 2 2 3 2 Depreciation 3 3 5 6 5 Amortization 6 5 6 6 5 Stock-Based Compensation 5 4 4 6 8 Other Non-recurring Items (1) 0 - 4 2 - Adjusted EBITDA 31$ 31$ 24$ 42$ 108$ Revenue 444$ 514$ 469$ 563$ 924$ QGT FYE Reconciliation of GAAP Net Income to Adjusted EBITDA ($ in millions) 2013 2014 2015 2016 2017 GAAP Net Income 6$ 5$ 15$ 9$ 22$ Provision for Taxes 0 1 1 1 2 Interest & Other Expenses, Net (2) 9 2 6 7 Depreciation 4 7 9 13 12 Amortization 3 2 2 2 2 Stock-Based Compensation 0 0 0 0 0 Other Non-recurring Items (2) 3 - 1 2 6 Adjusted EBITDA 14$ 24$ 30$ 33$ 50$ Revenue 108$ 145$ 179$ 185$ 218$ 43

$108.2 $145.1 $178.7 $185.4 $217.9 $0 $50 $100 $150 $200 $250 2013 2014 2015 2016 2017 $ mm Sales $14.4 $23.5 $30.4 $33.1 $50.5 $0 $10 $20 $30 $40 $50 $60 2013 2014 2015 2016 2017 $ mm Adj. EBITDA $61.3 $83.8 $103.6 $107.5 $128.9 0 20 40 60 80 100 120 140 2013 2014 2015 2016 2017 $ mm GAAP Gross Profit ($3.0) $9.4 $11.3 $5.0 $24.8 -$10 $0 $10 $20 $30 2013 2014 2015 2016 2017 $ mm Free Cash Flow (1) QGT Historical Financial Summary Source: Company information. 1 Free Cash Flow defined as Cash Flow from Operations less Capital Expenditures 44

Source: Company information. QGT Historical Income Statement Fiscal Year Ended LTM Dec. 2015 Dec. 2016 Dec. 2017 Jun. 2018 (1) $178.7 $185.4 $217.9 $222.9 75.1 77.9 88.9 91.3 $103.6 $107.5 $128.9 $131.7 44.5 49.6 49.2 52.5 28.4 29.1 33.6 33.3 6.3 6.5 8.3 8.2 6.2 6.7 7.6 7.5 Total Operating Expenses 85.5 92.0 98.7 101.5 18.1 15.5 30.3 30.2 Interest and Other Income (expense), net (4.3) (4.1) (8.0) (7.7) Income Before Provision for Income Taxes $13.8 $11.4 $22.3 $22.5 Income Taxes, Warranty Liability and Other 1.2 (2.8) (0.3) (0.8) Net Income (loss) $15.0 $8.5 $22.0 $21.7 Indirect Expenses Sales & Marketing Expenses Engineering Expenses Income from Operations G&A Expenses Operating Expenses Sales Cost of Goods Sold Gross Income 45

Source: Company information. QGT Historical Balance Sheet Assets Dec. 31, 2015 Dec. 31, 2016 Dec. 31, 2017 Current Assets Cash 15.7 11.9 30.3 Accounts receivable, net 16.5 17.1 18.8 Prepaid expense and other 3.5 3.7 4.8 Total Current Assets $35.8 $32.7 $54.0 Property and Equipment $65.9 $76.1 $88.5 Other assets $19.3 $19.3 $17.9 Total Assets $121.1 $128.0 $160.3 Liabilities and Stockholders' Equity Current Liabilities Line of Credit $0.0 $0.0 $0.0 Notes & capital leases payable $14.2 $94.9 $94.3 Accounts payable $6.1 $3.2 $7.3 Accrued expenses and other $11.1 $12.5 $20.3 Total Current Liabilities $31.4 $110.6 $121.9 Debt, net of current portion $43.5 $22.8 $30.4 Series B Preferred Unit Liability $12.7 $0.0 $0.0 Warrant Liability $10.7 $0.0 $0.0 Other $3.8 $3.6 $3.5 Total Liabilities $102.2 $137.0 $155.8 Stockholders' Equity Equity $24.6 ($5.3) $15.6 Distributions ($5.8) ($3.7) ($11.1) Total Stockholders' Equity $18.9 (9.0) 4.6 Total Liabilities and Stockholders' Equity $121.1 $128.0 $160.3 46
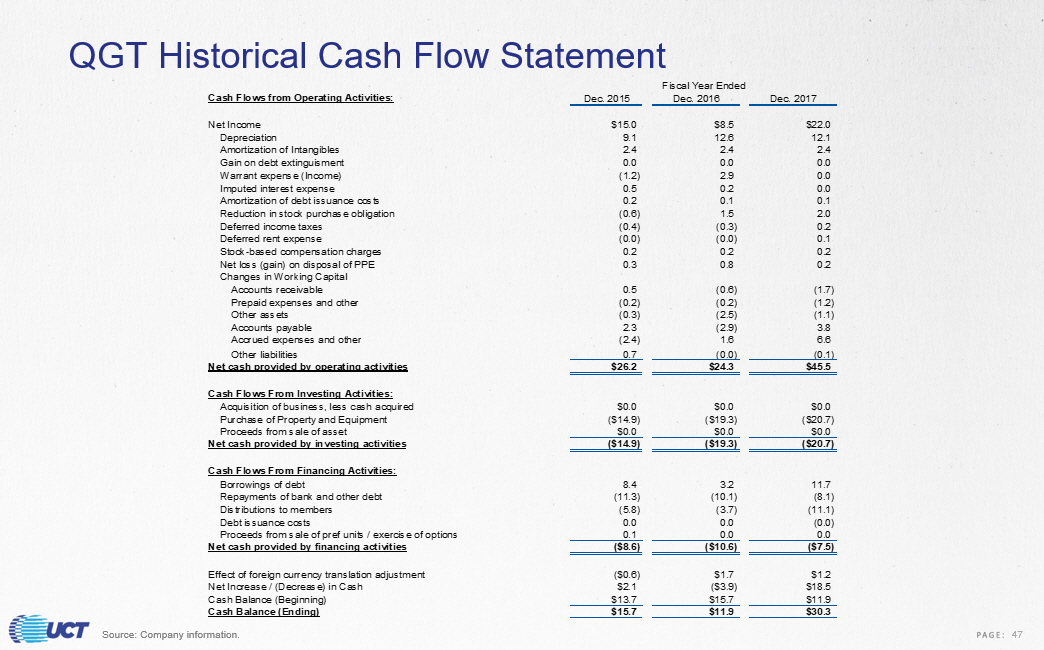
Source: Company information. QGT Historical Cash Flow Statement Fiscal Year Ended Cash Flows from Operating Activities: Dec. 2015 Dec. 2016 Dec. 2017 Net Income $15.0 $8.5 $22.0 9.1 12.6 12.1 2.4 2.4 2.4 0.0 0.0 0.0 (1.2) 2.9 0.0 0.5 0.2 0.0 0.2 0.1 0.1 (0.6) 1.5 2.0 (0.4) (0.3) 0.2 (0.0) (0.0) 0.1 0.2 0.2 0.2 0.3 0.8 0.2 Accounts receivable 0.5 (0.6) (1.7) Prepaid expenses and other (0.2) (0.2) (1.2) Other assets (0.3) (2.5) (1.1) Accounts payable 2.3 (2.9) 3.8 Accrued expenses and other (2.4) 1.6 6.6 Other liabilities 0.7 (0.0) (0.1) Net cash provided by operating activities $26.2 $24.3 $45.5 Cash Flows From Investing Activities: Acquisition of business, less cash acquired $0.0 $0.0 $0.0 Purchase of Property and Equipment ($14.9) ($19.3) ($20.7) Proceeds from sale of asset $0.0 $0.0 $0.0 Net cash provided by investing activities ($14.9) ($19.3) ($20.7) Cash Flows From Financing Activities: Borrowings of debt 8.4 3.2 11.7 Repayments of bank and other debt (11.3) (10.1) (8.1) Distributions to members (5.8) (3.7) (11.1) Debt issuance costs 0.0 0.0 (0.0) Proceeds from sale of pref units / exercise of options 0.1 0.0 0.0 Net cash provided by financing activities ($8.6) ($10.6) ($7.5) Effect of foreign currency translation adjustment ($0.6) $1.7 $1.2 Net Increase / (Decrease) in Cash $2.1 ($3.9) $18.5 Cash Balance (Beginning) $13.7 $15.7 $11.9 Cash Balance (Ending) $15.7 $11.9 $30.3 Warrant expense (Income) Net loss (gain) on disposal of PPE Changes in Working Capital Imputed interest expense Amortization of debt issuance costs Reduction in stock purchase obligation Deferred income taxes Deferred rent expense Stock-based compensation charges Depreciation Amortization of Intangibles Gain on debt extinguisment 47

THANK YOU 48