Exhibit 99.1
Lender Presentation February 2021

D i sclaimer Page 1 This presentation may contain forward - looking statements and management may make additional forward - looking statements in response to your questions. These statements are made under the “safe harbor” provisions of the U.S. Private Securities Litigation Reform Act of 1995. These forward - looking statements can be identified by terminology such as “will,” “expects,” “anticipates,” “future,” “intends,” “plans,” “believes,” “estimates” and similar statements. Statements that are n ot historical facts, including statements concerning our beliefs, forecasts, estimates and expectations, and those regarding our expected financial results for the fourth quarter of 2020 are forward - looking statements. Forward - looking statements involve inherent risks and uncertainties that could cause actual results to differ materially from those projected or anticipated, including risks related to: the cyclical and highly volatile nature of the industries we serve, our reliance on a small number of customers for a significant portion of our revenue, the industries in which we participate are highly competitive and rapidly evolving, the market for our stock is subject to significant fluctuation, our ability to consummate the transactions described herein (the “Transactions”), our ability to successfully integrate Ham - Let’s operations and employees, unexpected costs, charges or expenses resulting from the Transactions, our ability to successfully grow our or Ham - Let's business, potential adver se reactions or changes to business relationships resulting from the completion of the Transactions, the retention of key employees, customers or suppliers, legislative, regulatory and economic developments, including changing business conditions in the semiconductor industry markets overall and the economy in general and other risks outlined in our public filings with the Securities and Exchange Commission, including as set forth under “Risk Factors”, “Management’s Discussion and Analysis of Financial Condition and Results of Operations” and elsewhere in our most recent Quarterly Report on Form 10 - Q and Annual Report on Form 10 - K filed with the Securities and Exchange Commission. The forward - looking statements made in this presentation relate only to events or information as of the date on which the statements are made in this presentation. Except as required by law, we undertake no obligation to update or revise publicly any forward - looking statements, whether as a result of new information, future events or otherwise, after the date on which the statements are made or to reflect the occurrence of unanticipated events. Non - GAAP Measurement In addition to U.S. GAAP financials, this presentation includes certain non - GAAP financial measures. These non - GAAP financial measures are in addition to, and not a substitute for or superior to, measures of financial performance prepared in accordance with U.S. GAAP. Our determination of our non - GAAP measures might not be the same as similarly titled measures used by other companies, and it should not be construed as a substitute for amounts determined in accordance with GAAP. There are limitations associated with using non - GAAP measures, including that they exclude financial information that some may consider important in evaluating our performance. Management compensates for this by presenting information on both a GAAP and non - GAAP basis and providing reconciliations of the GAAP and non - GAAP results. Tables presenting reconciliations of non - GAAP results to U.S. GAAP results are included in the Appendix. The Company neither updates nor confirms any guidance regarding the future operating results of the Company which have been given prior to this presentation.

Presenters Jim Scholhamer Chief Executive Officer and Director Ultra Clean Technology Sheri Savage Senior Vice President of Finance and Chief Financial Officer Ultra Clean Technology Jim Pursiano Head of Corporate Development Ultra Clean Technology Page 2

Transaction Overview
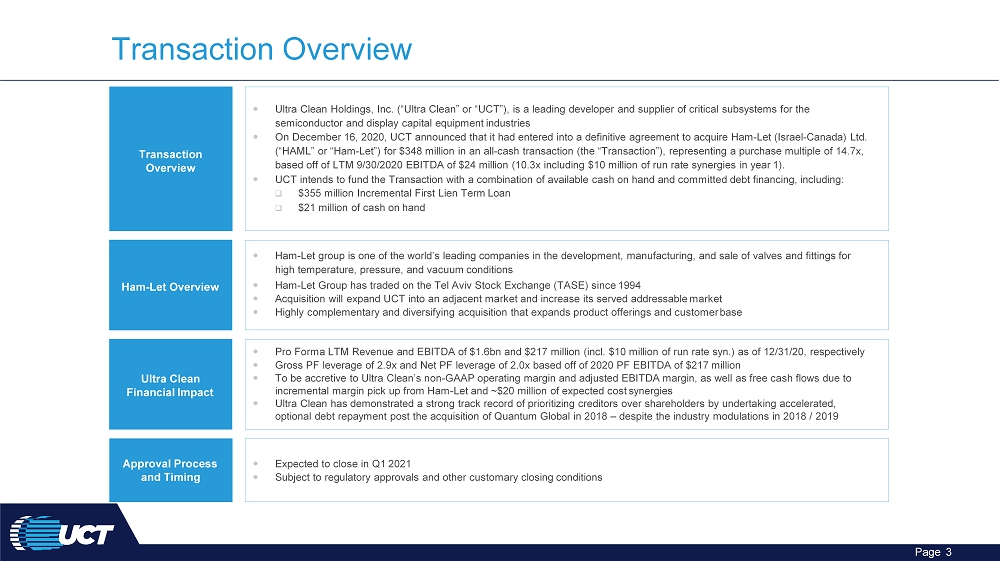
Transaction Overview Page 3 Ultra Clean Holdings, Inc. (“Ultra Clean” or “UCT”), is a leading developer and supplier of critical subsystems for the semiconductor and display capital equipment industries On December 16, 2020, UCT announced that it had entered into a definitive agreement to acquire Ham - Let (Israel - Canada) Ltd. (“HAML” or “Ham - Let”) for $348 million in an all - cash transaction (the “Transaction”), representing a purchase multiple of 14.7x, based off of LTM 9/30/2020 EBITDA of $24 million (10.3x including $10 million of run rate synergies in year 1). UCT intends to fund the Transaction with a combination of available cash on hand and committed debt financing, including: □ $355 million Incremental First Lien Term Loan □ $21 million of cash on hand T ransaction Overview Expected to close in Q1 2021 Subject to regulatory approvals and other customary closing conditions Approval Process and Timing Pro Forma LTM Revenue and EBITDA of $1.6bn and $217 million (incl. $10 million of run rate syn.) as of 12/31/20, respectively Gross PF leverage of 2.9x and Net PF leverage of 2.0x based off of 2020 PF EBITDA of $217 million To be accretive to Ultra Clean’s non - GAAP operating margin and adjusted EBITDA margin, as well as free cash flows due to incremental margin pick up from Ham - Let and ~$20 million of expected cost synergies Ultra Clean has demonstrated a strong track record of prioritizing creditors over shareholders by undertaking accelerated, optional debt repayment post the acquisition of Quantum Global in 2018 – despite the industry modulations in 2018 / 2019 Ultra Clean Financial Impact Ham - Let Overview Ham - Let group is one of the world’s leading companies in the development, manufacturing, and sale of valves and fittings for high temperature, pressure, and vacuum conditions Ham - Let Group has traded on the Tel Aviv Stock Exchange (TASE) since 1994 Acquisition will expand UCT into an adjacent market and increase its served addressable market Highly complementary and diversifying acquisition that expands product offerings and customer base
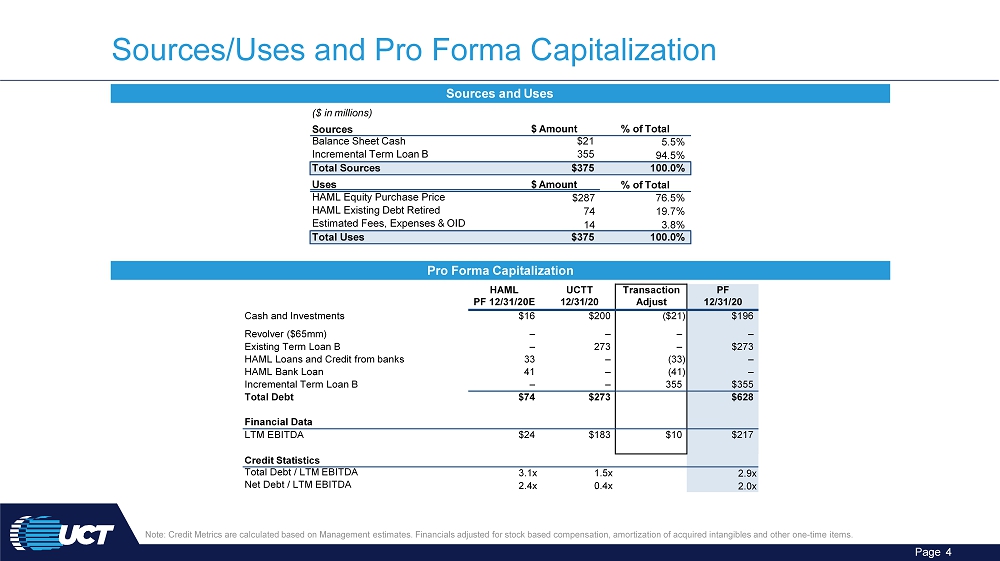
Sources/Uses and Pro Forma Capitalization Pro Forma Capitalization Sources and Uses Note: Credit Metrics are calculated based on Management estimates. Financials adjusted for stock based compensation, amortization of acquired intangibles and other one - time items. ($ in millions) Sources $ Amount % of Total Balance Sheet Cash Incremental Term Loan B $21 355 5.5% 94.5% 100.0% Total Sources $375 Uses $ Amount % of Total HAML Equity Purchase Price HAML Existing Debt Retired Estimated Fees, Expenses & OID $287 74 14 76.5% 19.7% 3.8% T otal Uses $37 5 100.0% Credit Statistics Total Debt / LTM EBITDA Net Debt / LTM EBITDA 3.1x 2.4x 1.5x 0.4x 2.9x 2.0x HAML UCTT PF 12/31/20E 12/31/20 Transaction Adjust PF 12/31/20 Cash and Investments $16 $200 ($ 2 1) $196 Revolver ($65mm) – – – – Existing Term Loan B – 273 – $273 HAML Loans and Credit from banks 33 – (3 3 ) – HAML Bank Loan 41 – (4 1 ) – Incremental Term Loan B – – 355 $355 Total Debt $74 $273 $628 Financial Data LTM EBITDA $24 $183 $10 $217 Page 4
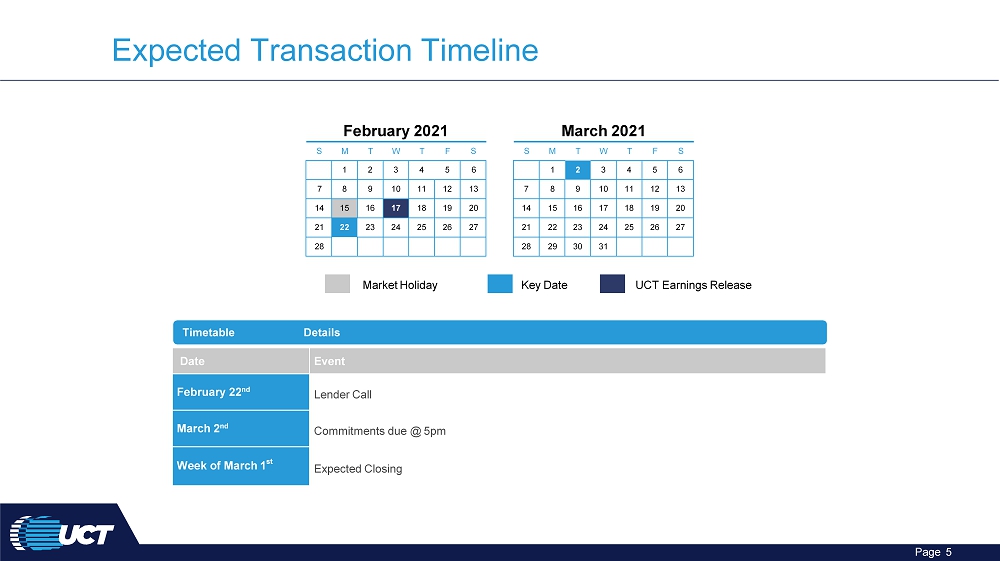
Expected Transaction Timeline Timetable Details Date Event February 22 nd Lender Call March 2 nd Commitments due @ 5pm Week of March 1 st Expected Closing 1 2 3 4 5 6 7 8 9 10 11 12 13 14 15 16 17 18 19 20 21 22 23 24 25 26 27 28 S February 2021 M T W T F S 1 2 3 4 5 6 7 8 9 10 11 12 13 14 15 16 17 18 19 20 21 22 23 24 25 26 27 28 29 30 31 S M March 2021 T W T F S Market Holiday Key Date UCT Earnings Release Page 5
Ultra Clean Technology Update
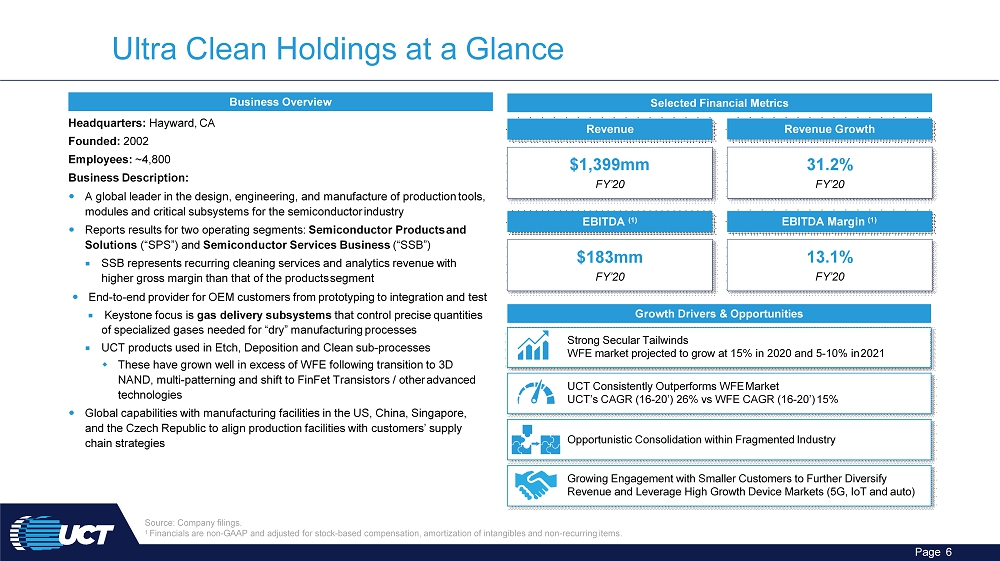
Ultra Clean Holdings at a Glance Headquarters: Hayward, CA Founded: 2002 Employees: ~4,800 Business Description: A global leader in the design, engineering, and manufacture of production tools, modules and critical subsystems for the semiconductor industry Reports results for two operating segments: Semiconductor Products and Solutions (“SPS”) and Semiconductor Services Business (“SSB”) SSB represents recurring cleaning services and analytics revenue with higher gross margin than that of the products segment End - to - end provider for OEM customers from prototyping to integration and test Keystone focus is gas delivery subsystems that control precise quantities of specialized gases needed for “dry” manufacturing processes UCT products used in Etch, Deposition and Clean sub - processes These have grown well in excess of WFE following transition to 3D NAND, multi - patterning and shift to FinFet Transistors / other advanced technologies Global capabilities with manufacturing facilities in the US, China, Singapore, and the Czech Republic to align production facilities with customers’ supply chain strategies Business Overview Source: Company filings. 1 Financials are non - GAAP and adjusted for stock - based compensation, amortization of intangibles and non - recurring items. Selected Financial Metrics Strong Secular Tailwinds WFE market projected to grow at 15% in 2020 and 5 - 10% in 2021 UCT Consistently Outperforms WFE Market UCT’s CAGR (16 - 20’) 26% vs WFE CAGR (16 - 20’) 15% Growth Drivers & Opportunities Revenue Revenue Growth $1,399mm FY’20 31.2% FY’20 EBITDA (1) EBITDA Margin (1) Opportunistic Consolidation within Fragmented Industry Growing Engagement with Smaller Customers to Further Diversify Revenue and Leverage High Growth Device Markets (5G, IoT and auto) $183mm FY’20 13.1% FY’20 Page 6
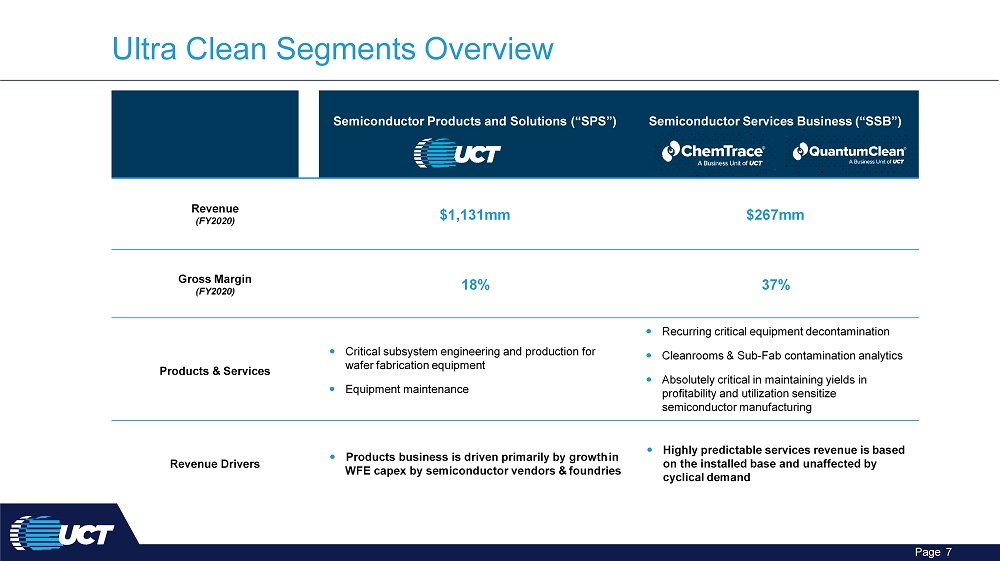
Ultra Clean Segments Overview Semiconductor Products and Solutions (“SPS”) Semiconductor Services Business (“SSB”) Revenue (FY2020) $1,131mm $267mm Gross Margin (FY2020) 18% 37% Products & Services Critical subsystem engineering and production for wafer fabrication equipment Equipment maintenance Recurring critical equipment decontamination Cleanrooms & Sub - Fab contamination analytics Absolutely critical in maintaining yields in profitability and utilization sensitize semiconductor manufacturing Revenue Drivers Products business is driven primarily by growth in WFE capex by semiconductor vendors & foundries Highly predictable services revenue is based on the installed base and unaffected by cyclical demand Page 7
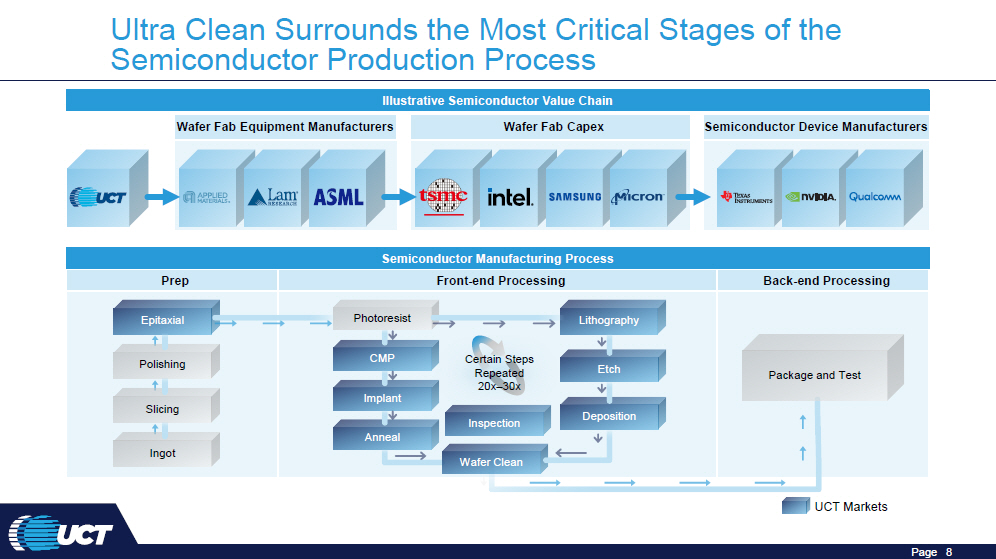
Ultra Clean Surrounds the Most Critical Stages of the Semiconductor Production Process Prep Front - end Processing Back - end Processing Semiconductor Manufacturing Process UCT Markets Deposition E tch L i th o g ra p hy Implant C M P P h o tores i st Ingot S li c i ng Polishing E p i ta x i al A n n e a l Inspection Wafer Clean Certain Steps Repeated 20x – 30x Package and Test Illustrative Semiconductor Value Chain Wafer Fab Equipment Manufacturers Wafer Fab Capex Semiconductor Device Manufacturers Page 8
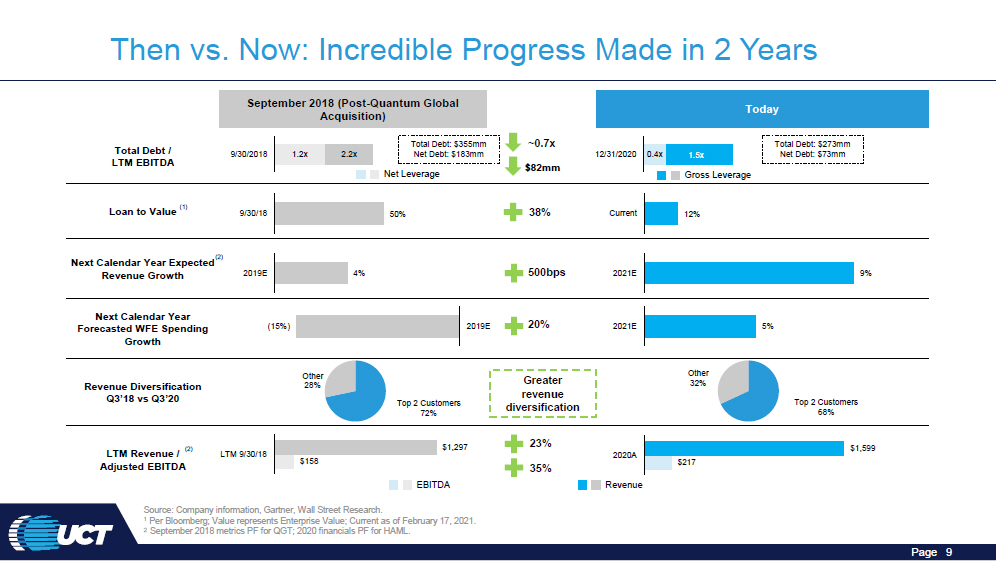
Source: Company information, Gartner, Wall Street Research. 1 Per Bloomberg; Value represents Enterprise Value; Current as of February 17, 2021. 2 September 2018 metrics PF for QGT; 2020 financials PF for HAML. Then vs. Now: Incredible Progress Made in 2 Years 59 9 EBI T DA Revenue September 2018 (Post - Quantum Global Acquisition) Today ~0.7x Total Debt / Total Debt: $ 9/30/2018 1.2x 2.2x Net Debt: $1 LTM EBITDA 355 m m 83mm $82mm 12 / 31 / 2 02 0 0 .4 x 1.5x Total Debt: $273mm Net Debt: $73mm Net Leverage Gross Leve rage 38% Current Loan to Value (1) 9/30/18 50% 12% (2) Next Calendar Year Expected Revenue Growth 2019E 4% 500bps 2021E 9% Next Calendar Year Forecasted WFE Spending (15%) Growth 2019E 20% 2021E 5% Other Revenue Diversification 28% Q3’18 vs Q3’20 Top 2 Customers 72% Greater revenue di v ers i f i ca t i on Other 32% Top 2 Customers 68% L T M Re v enue / (2) L TM 9 / 30 / 1 8 $1 ,2 Adjusted EBITDA $158 97 23% 35% 2020A $217 $1 , Page 9
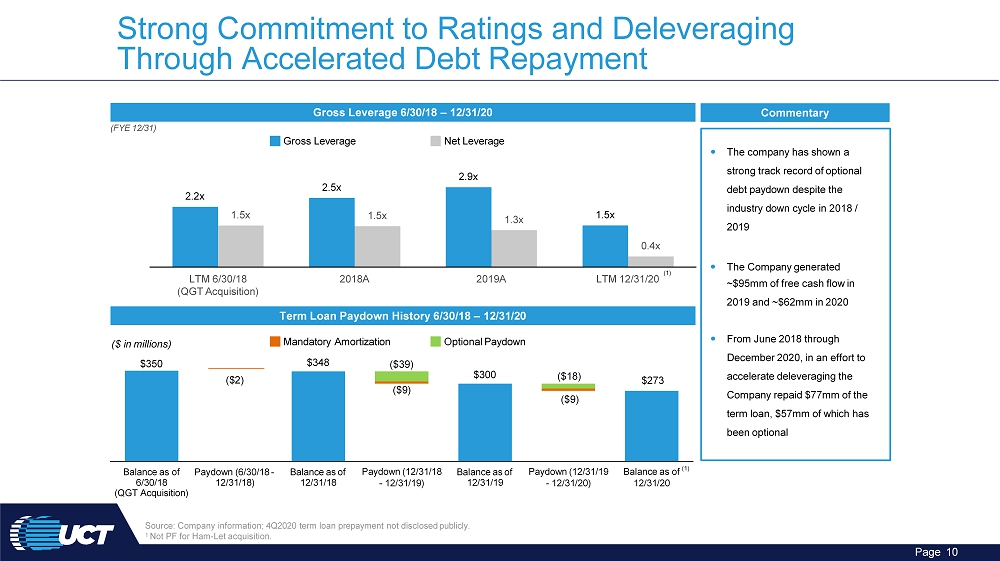
Strong Commitment to Ratings and Deleveraging Through Accelerated Debt Repayment Gross Leverage 6/30/18 – 12/31/20 (FYE 12/31) The company has shown a strong track record of optional debt paydown despite the industry down cycle in 2018 / 2019 The Company generated ~$95mm of free cash flow in 2019 and ~$62mm in 2020 From June 2018 through December 2020, in an effort to accelerate deleveraging the Company repaid $77mm of the term loan, $57mm of which has been optional Commentary Term Loan Paydown History 6/30/18 – 12/31/20 2.2x 2.5x 2.9x 1.5x 1 . 5 x 1.5x 1.3x 0.4x LTM 6/30/18 (QGT Acquisition) 2 0 1 8 A 2 0 1 9 A LTM 12/31/20 Source: Company information; 4Q2020 term loan prepayment not disclosed publicly. 1 Not PF for Ham - Let acquisition. Gross Leverage Net Leverage ( $ 2) $348 ($ 3 9) $300 Balance as of Paydown (6/30/18 - 6/30/18 12/31/18) (QGT Acquisition) Balance as of 12/31/18 Paydown (12/31/18 - 12/31/19) Balance as of 12/31/19 Paydown (12/31/19 - 12/31/20) ($ in millions) $350 ($ 9 ) Mandatory Amortization Optional Paydown Page 10 $273 ($ 1 8) ($ 9 ) ( 1 ) Balance as of (1) 12/31/20

Q4’2020 Operational Update $370 4Q'19 4Q'20 Revenue grew 29% YoY from $286mm in 4Q’2019 to $370mm in 4Q’2020 Adj. EBITDA grew >50% YoY from $33mm in 4Q’2019 to $51mm in 4Q’2020, EBITDA margin increased to 13.8% during the period The Company hasn’t experienced any major COVID - related disruptions in 4Q’2020 and 2020, all sites have been running smoothly during the year UCT’s performance these past few quarters underscores the strength, flexibility and resiliency of the Company’s business model allowing it to consistently gain share and deliver growth UCT continued to gain share across the customer base Particularly with AMAT as UCT works with them to meet their outsourcing needs ($ in millions) $286 $33 Source: Company Filings. Page 11 $51 ($ in millions) Quarterly Revenue (YoY) Quarterly Adj. EBITDA (YoY) 4Q'19 4Q'20 UCT continues to exceed customer expectations for quality and on - time delivery Continued to win manufacturing awards i.e. with a major lithography company for its next - gen tools Accelerating technology inflections due to the pandemic, robust mobile demand driven by 5G, new CPU architectures which are enabling higher performance servers, cloud, AI and machine learning are all driving semiconductor content enrichment The Company is very optimistic about 2021 due to the strength of its business model and secular tailwinds In December, the Company announced acquisition of Ham - Let
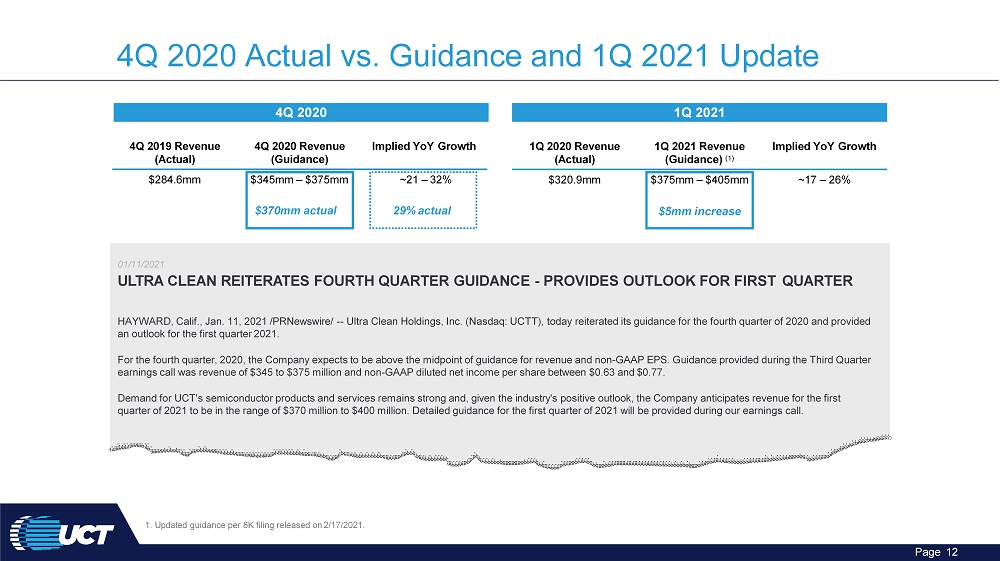
4Q 2020 Actual vs. Guidance and 1Q 2021 Update 4Q 2020 1Q 2021 01/11/2021 ULTRA CLEAN REITERATES FOURTH QUARTER GUIDANCE - PROVIDES OUTLOOK FOR FIRST QUARTER HAYWARD, Calif., Jan. 11, 2021 /PRNewswire/ -- Ultra Clean Holdings, Inc. (Nasdaq: UCTT), today reiterated its guidance for the fourth quarter of 2020 and provided an outlook for the first quarter 2021. For the fourth quarter, 2020, the Company expects to be above the midpoint of guidance for revenue and non - GAAP EPS. Guidance provided during the Third Quarter earnings call was revenue of $345 to $375 million and non - GAAP diluted net income per share between $0.63 and $0.77. Demand for UCT's semiconductor products and services remains strong and, given the industry's positive outlook, the Company anticipates revenue for the first quarter of 2021 to be in the range of $370 million to $400 million. Detailed guidance for the first quarter of 2021 will be provided during our earnings call. 4Q 2019 Revenue (Actual) 4Q 2020 Revenue (Guidance) Implied YoY Growth $284.6mm $345mm – $375mm $370mm actual ~21 – 32% 29% actual 1. Updated guidance per 8K filing released on 2/17/2021. Page 12 1Q 2020 Revenue (Actual) 1Q 2021 Revenue (Guidance) (1) Implied YoY Growth $320.9mm $375mm – $405mm $5mm increase ~17 – 26%
Ham - Let Overview
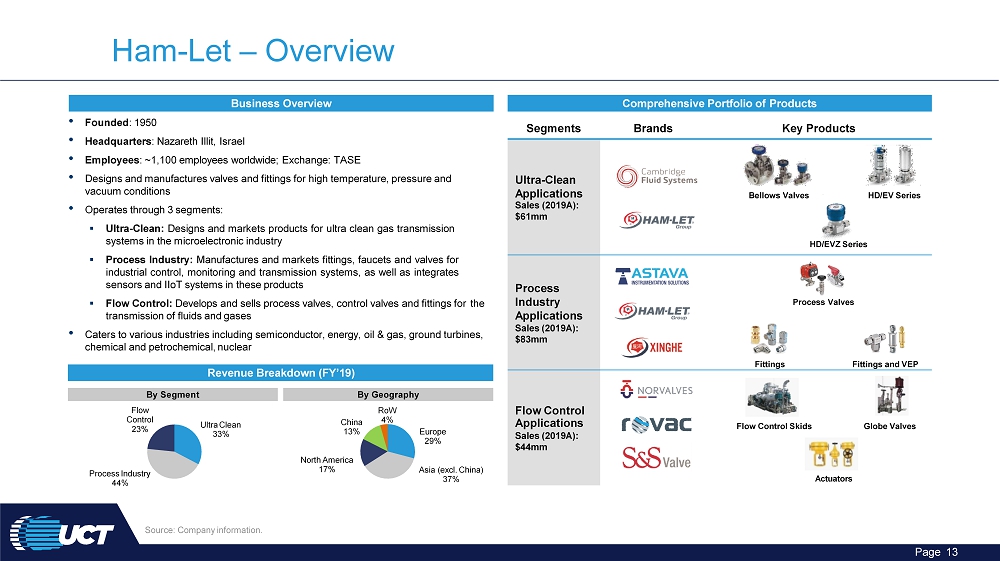
• Founded : 1950 • Headquarters : Nazareth Illit, Israel • Employees : ~1,100 employees worldwide; Exchange: TASE • Designs and manufactures valves and fittings for high temperature, pressure and vacuum conditions • Operates through 3 segments: ▪ Ultra - Clean : Designs and markets products for ultra clean gas transmission systems in the microelectronic industry ▪ Process Industry : Manufactures and markets fittings, faucets and valves for industrial control, monitoring and transmission systems, as well as integrates sensors and IIoT systems in these products ▪ Flow Control: Develops and sells process valves, control valves and fittings for the transmission of fluids and gases • Caters to various industries including semiconductor, energy, oil & gas, ground turbines, chemical and petrochemical, nuclear E urop e 29% Asia (excl. China) 37% North America 17% Ch ina 13% Ro W 4% Business Overview Comprehensive Portfolio of Products Revenue Breakdown (FY’19) By Segment By Geography Ultra Clean 33% Process Industry 44% Flow Con t ro l 23% Source: Company information. Ham - Let – Overview Segments Brands Key Products Ultra - Clean A p p lic a tio n s Bellows Valves HD/EV Series Sales (2019A): $61mm HD/EVZ Series Process Industry A p p lic a tio n s Sales (2019A): $83mm Process Valves Fittings Fittings and VEP Flow Control Flow Control Skids Globe Valves Actuators Applications Sales (2019A): $44mm Page 13
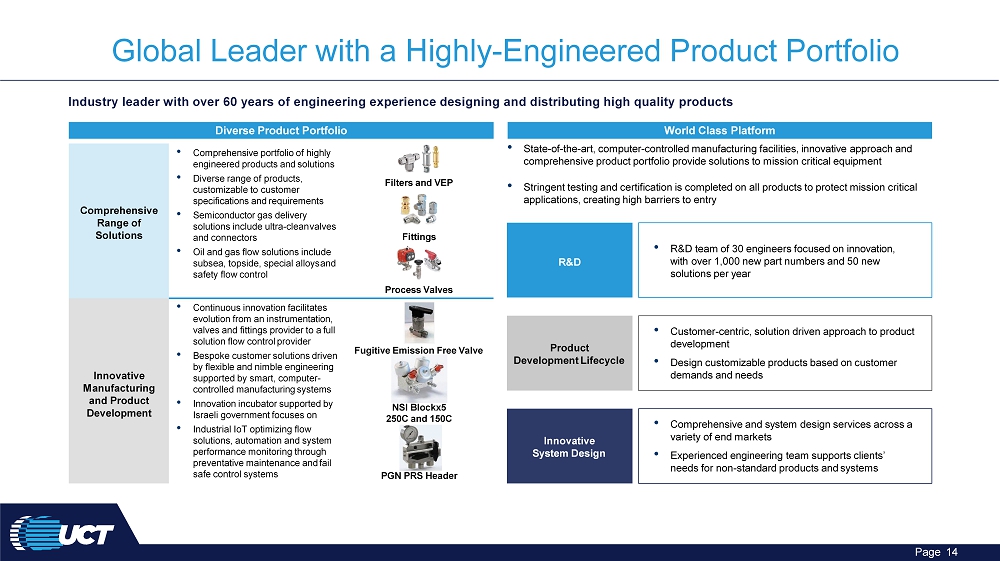
Diverse Product Portfolio World Class Platform Industry leader with over 60 years of engineering experience designing and distributing high quality products • State - of - the - art, computer - controlled manufacturing facilities, innovative approach and comprehensive product portfolio provide solutions to mission critical equipment • Stringent testing and certification is completed on all products to protect mission critical applications, creating high barriers to entry Com p r ehensi v e Range of Solutions • Comprehensive portfolio of highly engineered products and solutions • Diverse range of products, Filters and VEP customizable to customer specifications and requirements • Semiconductor gas delivery solutions include ultra - clean valves and connectors Fittings • Oil and gas flow solutions include subsea, topside, special alloys and safety flow control Process Valves Innovative M anufa c tu r ing and Product Development • Continuous innovation facilitates evolution from an instrumentation, valves and fittings provider to a full solution flow control provider • Bespoke customer solutions driven Fugitive Emission Free Valve by flexible and nimble engineering supported by smart, computer - controlled manufacturing systems • Innovation incubator supported by NSI Blockx5 Israeli government focuses on 250C and 150C • Industrial IoT optimizing flow solutions, automation and system performance monitoring through preventative maintenance and fail safe control systems PGN PRS Header R&D Page 14 Product Development Lifecycle Innovative System Design • R&D team of 30 engineers focused on innovation, with over 1,000 new part numbers and 50 new solutions per year • Customer - centric, solution driven approach to product development • Design customizable products based on customer demands and needs • Comprehensive and system design services across a variety of end markets • Experienced engineering team supports clients’ needs for non - standard products and systems Global Leader with a Highly - Engineered Product Portfolio
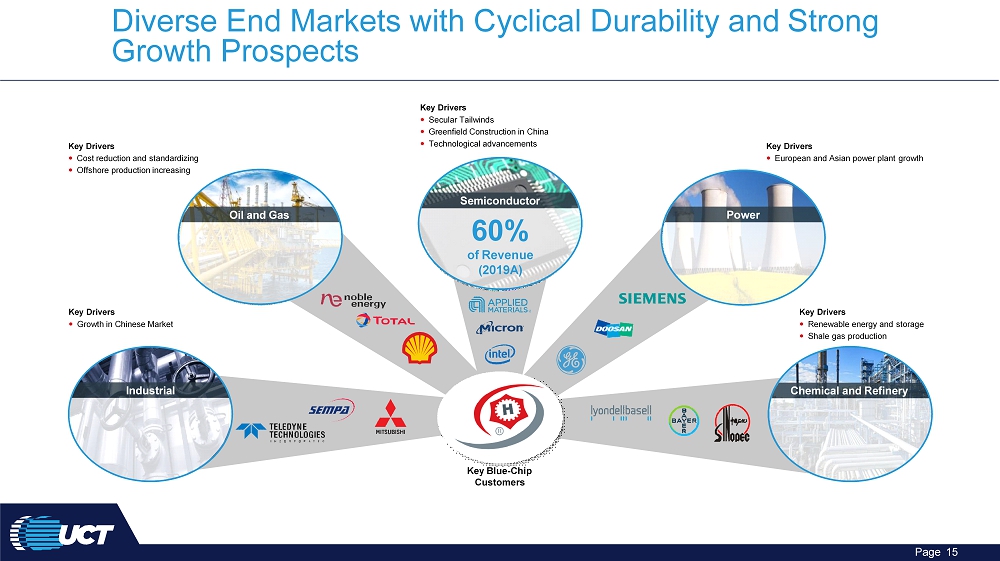
I ndus t r i al Oil and Gas Key Drivers Secular Tailwinds Greenfield Construction in China Technological advancements Key Drivers Growth in Chinese Market Key Drivers European and Asian power plant growth Key Drivers Renewable energy and storage Shale gas production Key Drivers Cost reduction and standardizing Offshore production increasing Key Blue - Chip Customers Semiconductor 60% of Revenue (2019A) Chemical and Refinery Po w er Diverse End Markets with Cyclical Durability and Strong Growth Prospects Page 15
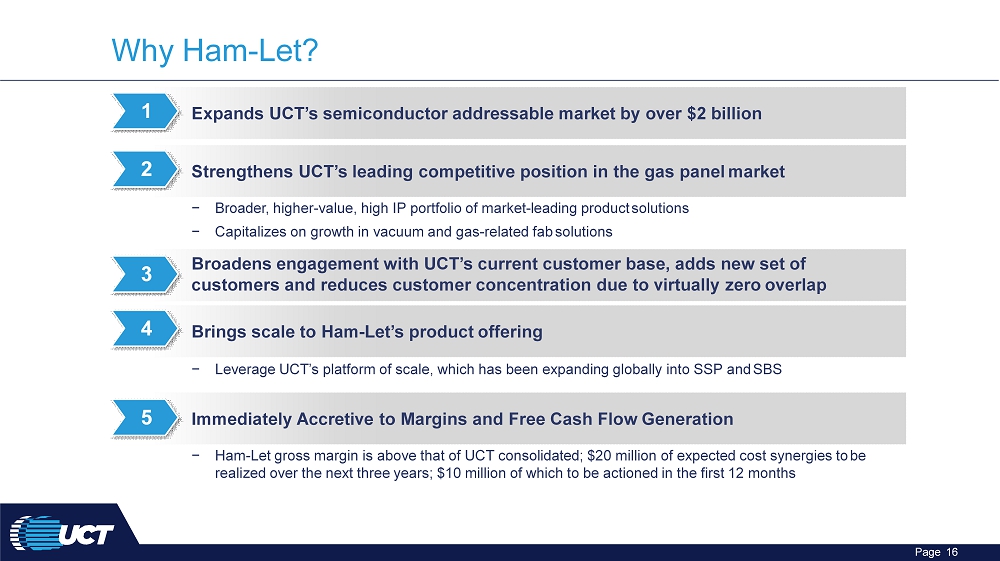
Why Ham - Let? Expands UCT’s semiconductor addressable market by over $2 billion 1 Broadens engagement with UCT’s current customer base, adds new set of customers and reduces customer concentration due to virtually zero overlap 3 4 Strengthens UCT’s leading competitive position in the gas panel market 2 − Broader, higher - value, high IP portfolio of market - leading product solutions − Capitalizes on growth in vacuum and gas - related fab solutions Brings scale to Ham - Let’s product offering − Leverage UCT’s platform of scale, which has been expanding globally into SSP and SBS 5 Page 16 Immediately Accretive to Margins and Free Cash Flow Generation − Ham - Let gross margin is above that of UCT consolidated; $20 million of expected cost synergies to be realized over the next three years; $10 million of which to be actioned in the first 12 months
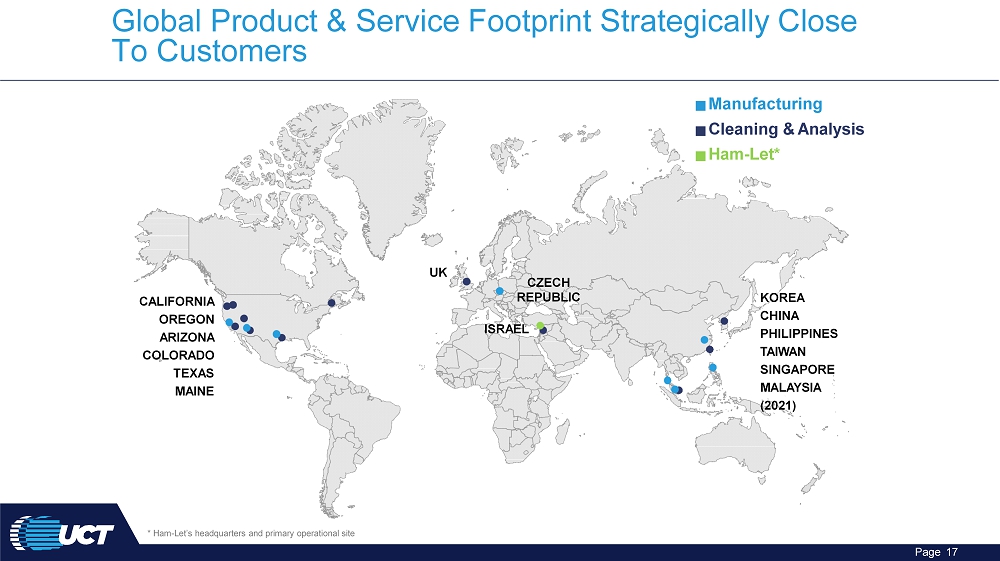
Global Product & Service Footprint Strategically Close To Customers * Ham - Let’s headquarters and primary operational site Manufacturing Cleaning & Analysis Ham - Let* C A LIFORN I A OREGON A RIZO N A C OLO R A D O TEX A S M A INE Page 17 UK KOREA CHINA PHILIPPI N ES TAIWAN SINGAPORE MALAYSIA (2021) CZECH REPUBLIC IS R A EL
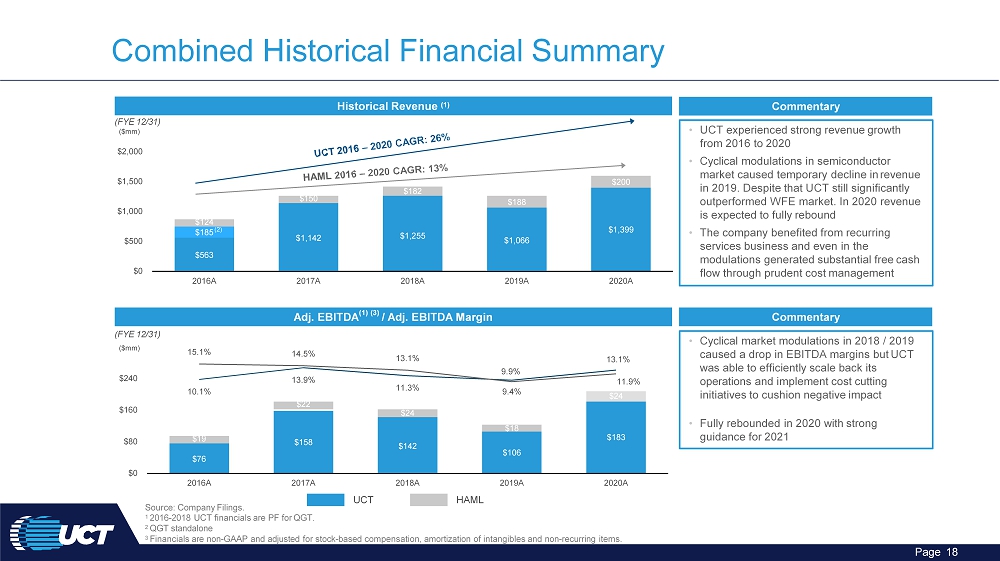
Source: Company Filings. 1 2016 - 2018 UCT financials are PF for QGT. 2 QGT standalone Combined Historical Financial Summary Historical Revenue (1) Adj. EBITDA (1) (3) / Adj. EBITDA Margin $563 $1,142 $1,255 $1,066 $1 , 39 9 $124 $150 $182 $188 $200 $0 $500 $1 , 00 0 $1 , 50 0 $2 , 00 0 2016A 2017A 2018A 2019A 2020A (FYE 12/31) ($mm) $76 $158 $142 $106 $183 $19 $22 $24 $18 $24 10 . 1 % 13 . 9 % 11 . 3 % 9 . 9 % 13 . 1 % 15 . 1 % 14 . 5 % 13 . 1 % 9 . 4 % 11 . 9 % $0 $80 $160 $240 2016A 2017A 2018A 2019A 2020A (FYE 12/31) ($mm) UCT HAML 3 Financials are non - GAAP and adjusted for stock - based compensation, amortization of intangibles and non - recurring items. Page 18 • UCT experienced strong revenue growth from 2016 to 2020 • Cyclical modulations in semiconductor market caused temporary decline in revenue in 2019. Despite that UCT still significantly outperformed WFE market. In 2020 revenue is expected to fully rebound • The company benefited from recurring services business and even in the modulations generated substantial free cash flow through prudent cost management Commentary • Cyclical market modulations in 2018 / 2019 caused a drop in EBITDA margins but UCT was able to efficiently scale back its operations and implement cost cutting initiatives to cushion negative impact • Fully rebounded in 2020 with strong guidance for 2021 Commentary $185 (2)

Credit Highlights
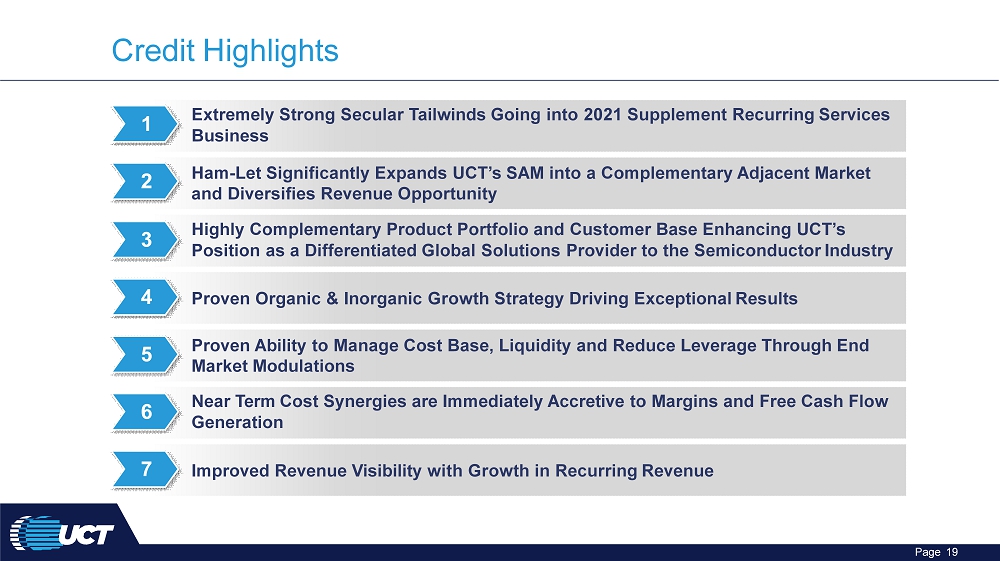
Credit Highlights 1 Highly Complementary Product Portfolio and Customer Base Enhancing UCT’s Position as a Differentiated Global Solutions Provider to the Semiconductor Industry 3 Proven Organic & Inorganic Growth Strategy Driving Exceptional Results 4 5 Proven Ability to Manage Cost Base, Liquidity and Reduce Leverage Through End Market Modulations Near Term Cost Synergies are Immediately Accretive to Margins and Free Cash Flow Generation 6 Extremely Strong Secular Tailwinds Going into 2021 Supplement Recurring Services Business Ham - Let Significantly Expands UCT’s SAM into a Complementary Adjacent Market and Diversifies Revenue Opportunity 2 Improved Revenue Visibility with Growth in Recurring Revenue 7 Page 19

Extremely Strong Secular Tailwinds Going into 2021 Supplement Recurring Services Business Source: Company Estimates. 1 $34 $37 $51 $60 $57 1 1% 37% 16% (17 % ) $50 1 5 % 17% 58% 2 2 % (5 % ) 3 1 % - 1 50 % - 1 00 % - 5 0 % 0% 5 0 % 1 0 0 % 2 0 15 2 0 19 2 0 20 2 0 16 2 0 17 Total WFE Spending ($, bn) 2018 WFE Spending Growth (%) UCT Growth (%) Guidance from downstream customers indicates extremely strong secular tailwinds going into 2021 and UCT has consistently outperformed WFE market. UCT’s operational excellence and cost discipline allowed the Company to gain market share through periods of end market modulation TSMC and other downstream customers guided much higher than expected capex spend for 2021 driving strong demand for AMAT, LRCX, ASML and, as a result, UCTT as they remain a key supplier to semicap manufacturers and one of the best positioned for the upside in semis Analysts have estimated growth of ~15% for AMAT over CY2021 LRCX is projected to grow ~20% in CY20 and ~17% in CY2021 ASML is projected by Analysts to grow ~14% in CY2021 while the company itself also guided double - digits growth for the same period resulting from continued secular tailwinds Page 20 Guidance from Customers ($bn )
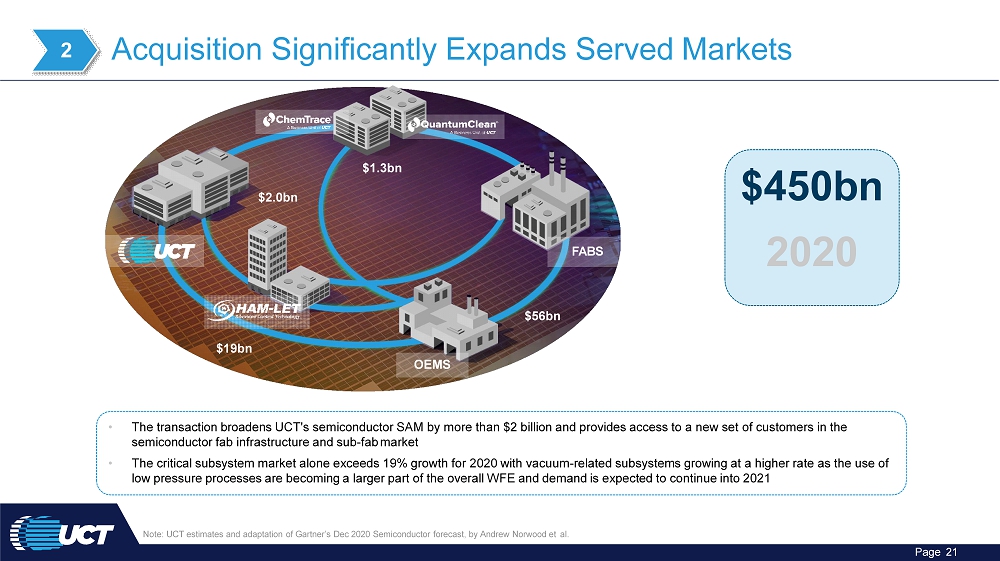
Acquisition Significantly Expands Served Markets $450 b n 2020 2 • The transaction broadens UCT's semiconductor SAM by more than $2 billion and provides access to a new set of customers in the semiconductor fab infrastructure and sub - fab market • The critical subsystem market alone exceeds 19% growth for 2020 with vacuum - related subsystems growing at a higher rate as the use of low pressure processes are becoming a larger part of the overall WFE and demand is expected to continue into 2021 FABS Note: UCT estimates and adaptation of Gartner’s Dec 2020 Semiconductor forecast, by Andrew Norwood et al. Page 21 OEMS $1. 3bn $2. 0bn $19bn $56bn
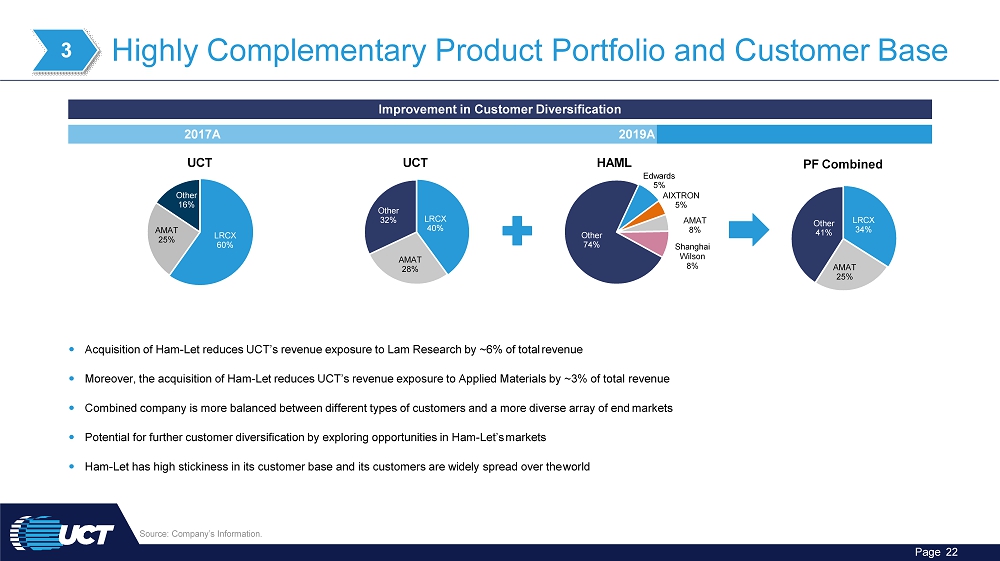
Improvement in Customer Diversification LRC X 40% A M AT 28% Ot he r 32% E d w ard s 5% AI X T R ON 5% A M AT 8% Sh a ngha i Wilson 8% Ot he r 74% LRC X 34% A M AT 25% Ot he r 41% PF Combined Acquisition of Ham - Let reduces UCT’s revenue exposure to Lam Research by ~6% of total revenue Moreover, the acquisition of Ham - Let reduces UCT’s revenue exposure to Applied Materials by ~3% of total revenue Combined company is more balanced between different types of customers and a more diverse array of end markets Potential for further customer diversification by exploring opportunities in Ham - Let’s markets Ham - Let has high stickiness in its customer base and its customers are widely spread over the world 3 Highly Complementary Product Portfolio and Customer Base 2017A 2019A LRC X 60% Source: Company’s Information. Page 22 A M AT 25% Ot he r 16% UC T UC T H A M L
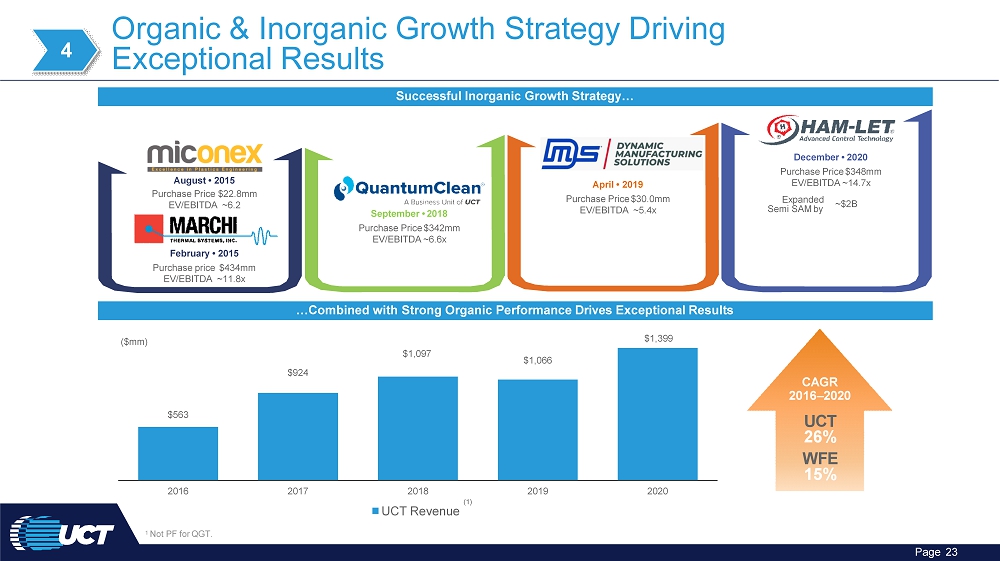
Organic & Inorganic Growth Strategy Driving Exceptional Results 1 Not PF for QGT. $563 $924 $1,097 $1,066 $1,399 2 0 16 2 0 17 2 0 19 2 0 20 ($ mm ) CAGR 2016 – 20 20 UCT 26% W F E 15% 4 August • 2015 Purchase Price $22.8mm EV/EBITDA ~6.2 February • 2015 Purchase price $434mm EV/EBITDA ~11.8x December • 2020 Purchase Price $348mm EV/EBITDA ~14.7x ~ $ 2 B September • 2018 Purchase Price $342mm EV/EBITDA ~6.6x April • 2019 Purchase Price $30.0mm EV/EBITDA ~5.4x E x panded Semi SAM by Successful Inorganic Growth Strategy… …Combined with Strong Organic Performance Drives Exceptional Results 2018 (1) UCT Revenue Page 23
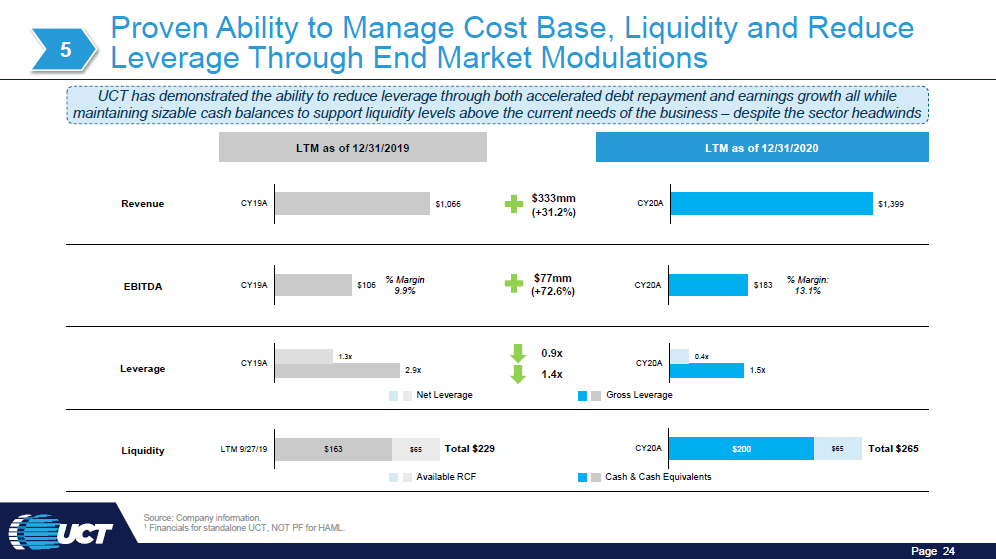
. Source: Company information. 1 Financials for standalone UCT, NOT PF for HAML. Proven Ability to Manage Cost Base, Liquidity and Reduce Leverage Through End Market Modulations $1 , 39 9 $65 LTM as of 12/31/2019 LTM as of 12/31/2020 $333mm CY20A Revenue CY19A $ 1,066 (+31.2%) % Marg in $77mm % Margin: E BI T DA C Y 19 A $10 6 9.9% (+72.6%) CY20A $183 13.1% 1 . 3 x 0.9x 0.4x Le v e r age C Y 19 A 2 9x C Y 20 A 1.4x 1.5x Net L everage Gross Leverag e Liquidity LTM 9/27/19 $163 $65 Total $229 CY20A $200 Av ail able RCF Cash & Cash Eq uiv alents 5 Total $265 UCT has demonstrated the ability to reduce leverage through both accelerated debt repayment and earnings growth all while maintaining sizable cash balances to support liquidity levels above the current needs of the business – despite the sector headwinds Page 24
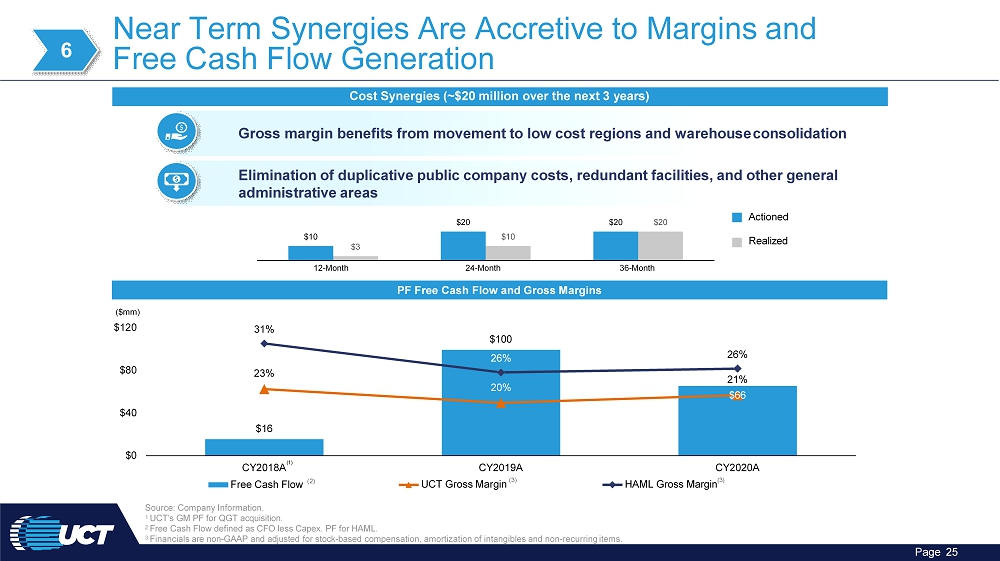
$16 $100 $66 23% 21% 31% 26% 20% 26% $0 $ 4 0 $ 8 0 C Y 2 0 1 8A ($ mm ) $120 (1) Near Term Synergies Are Accretive to Margins and Free Cash Flow Generation PF Free Cash Flow and Gross Margins CY2019A UCT Gross Margin (3) Source: Company Information. 1 UCT’s GM PF for QGT acquisition. 2 Free Cash Flow defined as CFO less Capex. PF for HAML. 3 Financials are non - GAAP and adjusted for stock - based compensation, amortization of intangibles and non - recurring items. 6 Cost Synergies (~$20 million over the next 3 years) Gross margin benefits from movement to low cost regions and warehouse consolidation Elimination of duplicative public company costs, redundant facilities, and other general administrative areas $10 $20 $20 $10 $20 $3 12 - Month 24 - Month 36 - Month A c t i o n ed R ea li z e d Page 25 Free Cash Flow (2) CY2020A HAML Gross Margin (3)
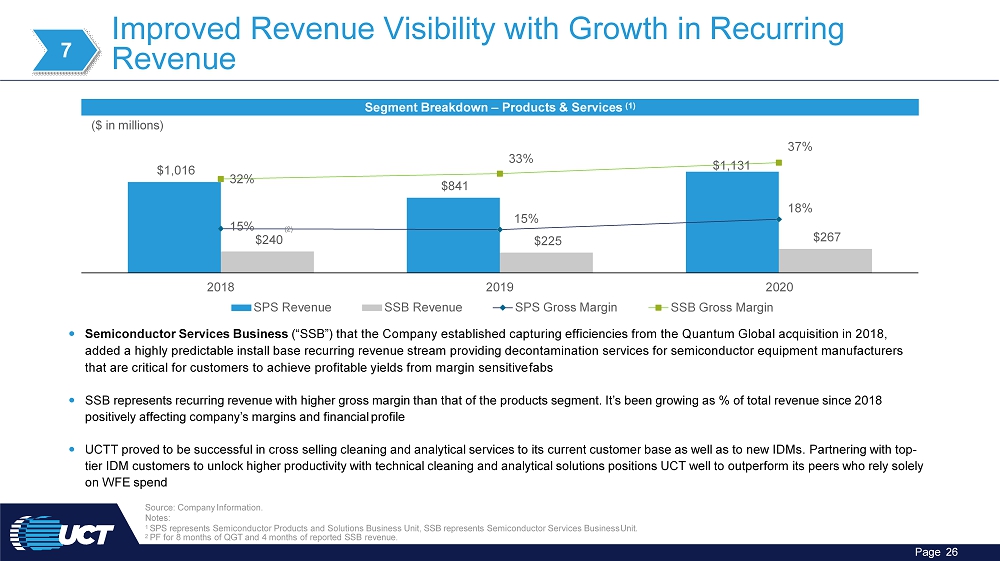
$1 , 0 16 $841 $1 , 1 31 $267 15% $225 18% 32% 33% 37% 2 0 18 2 0 19 ($ in millions) SPS Revenue SSB Revenue SPS Gross Margin 2 0 20 SSB Gross Margin Segment Breakdown – Products & Services (1) Improved Revenue Visibility with Growth in Recurring Revenue 15% (2) $240 7 2 PF for 8 months of QGT and 4 months of reported SSB revenue. Page 26 Semiconductor Services Business (“SSB”) that the Company established capturing efficiencies from the Quantum Global acquisition in 2018, added a highly predictable install base recurring revenue stream providing decontamination services for semiconductor equipment manufacturers that are critical for customers to achieve profitable yields from margin sensitive fabs SSB represents recurring revenue with higher gross margin than that of the products segment. It’s been growing as % of total revenue since 2018 positively affecting company’s margins and financial profile UCTT proved to be successful in cross selling cleaning and analytical services to its current customer base as well as to new IDMs. Partnering with top - tier IDM customers to unlock higher productivity with technical cleaning and analytical solutions positions UCT well to outperform its peers who rely solely on WFE spend Source: Company Information. Notes: 1 SPS represents Semiconductor Products and Solutions Business Unit, SSB represents Semiconductor Services Business Unit.
UCT’s Financial Policy
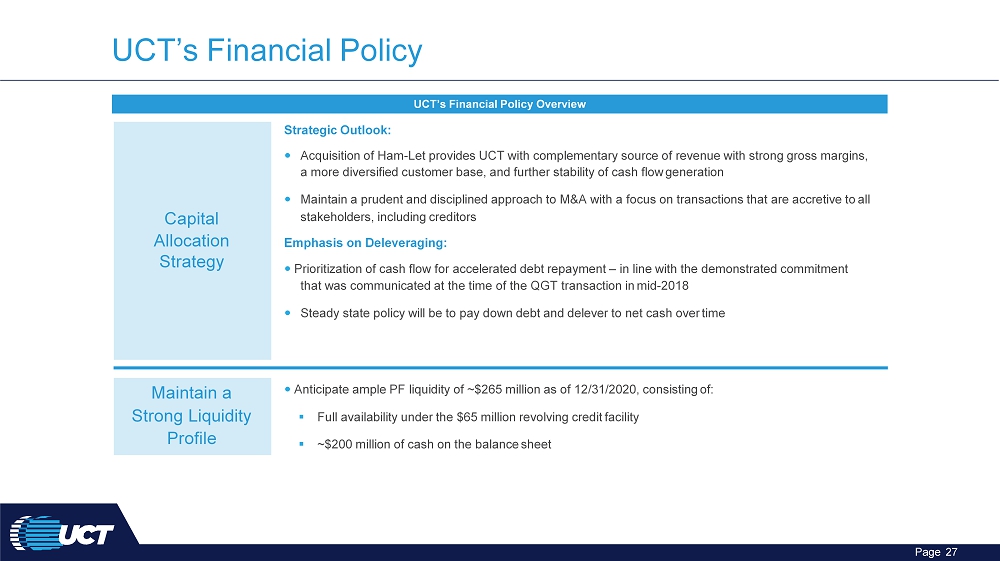
UCT’s Financial Policy UCT’s Financial Policy Overview Strategic Outlook: Acquisition of Ham - Let provides UCT with complementary source of revenue with strong gross margins, a more diversified customer base, and further stability of cash flow generation Maintain a prudent and disciplined approach to M&A with a focus on transactions that are accretive to all Capital stakeholders, including creditors Allocation Emphasis on Deleveraging: Strategy Prioritization of cash flow for accelerated debt repayment – in line with the demonstrated commitment that was communicated at the time of the QGT transaction in mid - 2018 Steady state policy will be to pay down debt and delever to net cash over time Maintain a Anticipate ample PF liquidity of ~$265 million as of 12/31/2020, consisting of: Strong Liquidity ▪ Full availability under the $65 million revolving credit facility Profile ▪ ~$200 million of cash on the balance sheet Page 27
Ap p en d ix
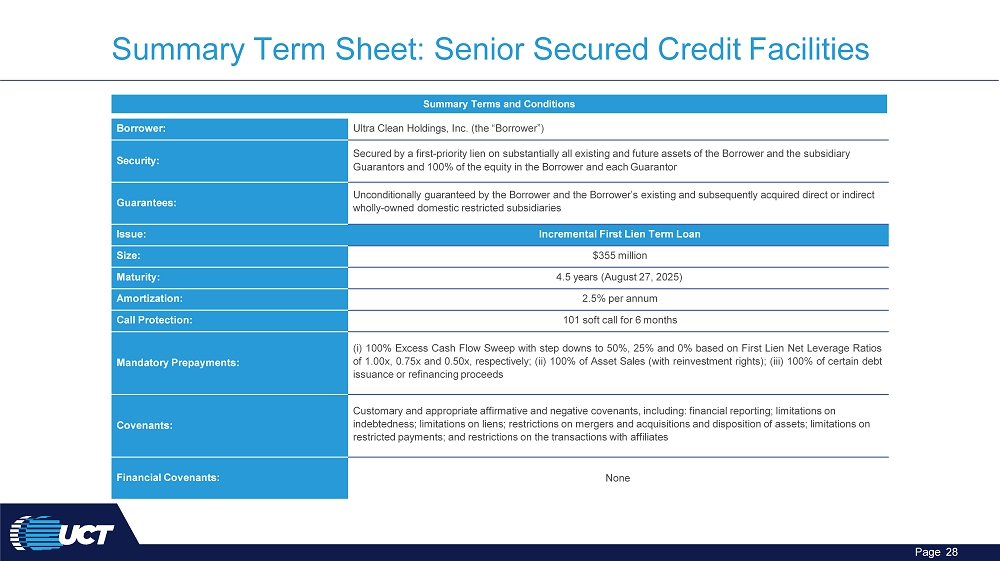
Summary Term Sheet: Senior Secured Credit Facilities Page 28 Borrower: Ultra Clean Holdings, Inc. (the “Borrower”) Security: Secured by a first - priority lien on substantially all existing and future assets of the Borrower and the subsidiary Guarantors and 100% of the equity in the Borrower and each Guarantor Guarantees: Unconditionally guaranteed by the Borrower and the Borrower’s existing and subsequently acquired direct or indirect wholly - owned domestic restricted subsidiaries Issue: Incremental First Lien Term Loan Size: $355 million Maturity: 4.5 years (August 27, 2025) Amortization: 2.5% per annum Call Protection: 101 soft call for 6 months Mandatory Prepayments: (i) 100 % Excess Cash Flow Sweep with step downs to 50 % , 25 % and 0 % based on First Lien Net Leverage Ratios of 1 . 00 x, 0 . 75 x and 0 . 50 x, respectively ; (ii) 100 % of Asset Sales (with reinvestment rights) ; (iii) 100 % of certain debt issuance or refinancing proceeds Covenants: Customary and appropriate affirmative and negative covenants, including: financial reporting; limitations on indebtedness; limitations on liens; restrictions on mergers and acquisitions and disposition of assets; limitations on restricted payments; and restrictions on the transactions with affiliates Financial Covenants: None Summary Terms and Conditions
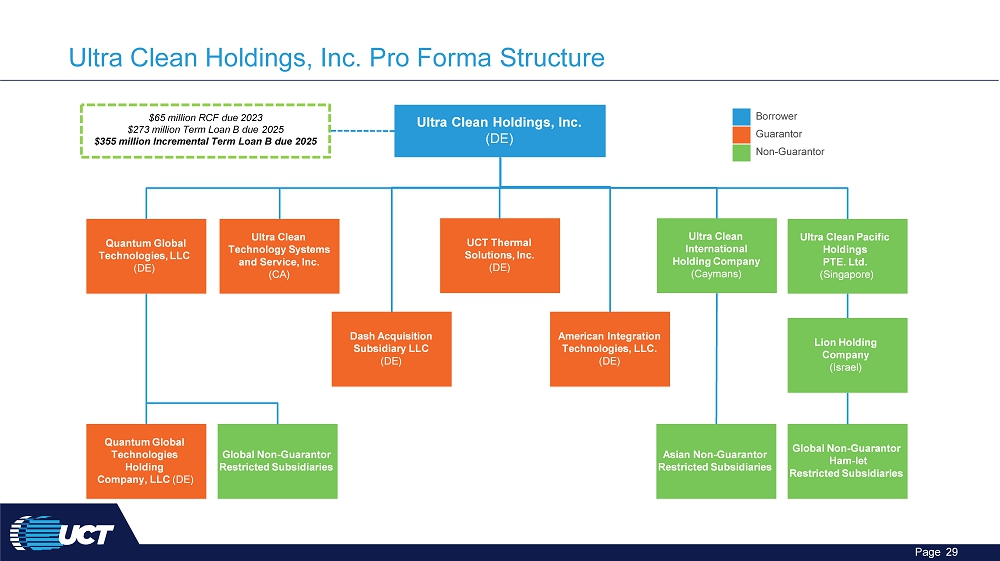
Ultra Clean Holdings, Inc. Pro Forma Structure Ultra Clean Holdings, Inc. (DE) $65 million RCF due 2023 $273 million Term Loan B due 2025 $355 million Incremental Term Loan B due 2025 Quantum Global Technologies, LLC (DE) Ultra Clean Technology Systems and Service, Inc. (CA) UCT Thermal Solutions, Inc. (DE) Ultra Clean International Holding Company (Caymans) Asian Non - Guarantor Restricted Subsidiaries Global Non - Guarantor Restricted Subsidiaries Quantum Global Technologies Holding Company, LLC (DE) B or r o w er Gu a ra n tor Non - Guarantor American Integration Technologies, LLC. (DE) Ultra Clean Pacific Holdings PTE. Ltd. (Singapore) Lion Holding Company (Israel) Global Non - Guarantor Ham - let Restricted Subsidiaries Dash Acquisition Subsidiary LLC (DE) Page 29
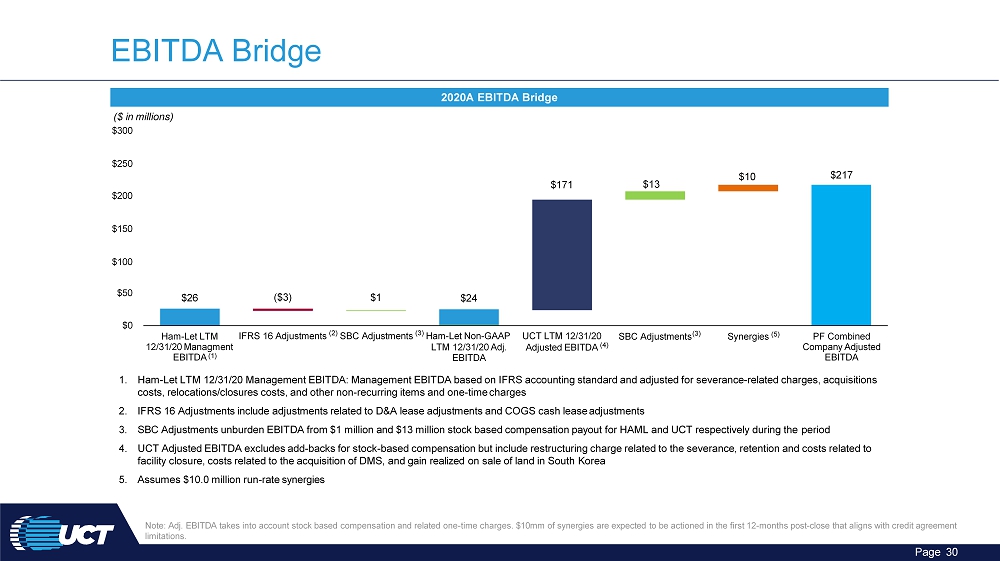
EBITDA Bridge 2020A EBITDA Bridge Note: Adj. EBITDA takes into account stock based compensation and related one - time charges. $10mm of synergies are expected to be actioned in the first 12 - months post - close that aligns with credit agreement limitations. $26 Page 30 ( $3 ) $1 $24 $171 $0 $ 5 0 $ 2 00 $ 1 50 $ 1 00 PF Combined Company Adjusted EBITDA ($ in millions) $300 $250 $10 1. Ham - Let LTM 12/31/20 Management EBITDA: Management EBITDA based on IFRS accounting standard and adjusted for severance - related charges, acquisitions costs, relocations/closures costs, and other non - recurring items and one - time charges 2. IFRS 16 Adjustments include adjustments related to D&A lease adjustments and COGS cash lease adjustments 3. SBC Adjustments unburden EBITDA from $1 million and $13 million stock based compensation payout for HAML and UCT respectively during the period 4. UCT Adjusted EBITDA excludes add - backs for stock - based compensation but include restructuring charge related to the severance, retention and costs related to facility closure, costs related to the acquisition of DMS, and gain realized on sale of land in South Korea 5. Assumes $10.0 million run - rate synergies Ham - Let LTM 12/31/20 Managment EBITDA (1) IFRS 16 Adjustments (2) SBC Adjustments (3) Ham - Let Non - GAAP LTM 12/31/20 Adj. EBITDA UCT LTM 12/31/20 Adjusted EBITDA (4) Synergies (5) $13 SBC Adjustments (3) $217
THANK YOU Page 31