SIGNATURE
Pursuant to the requirements of the Securities Exchange Act of 1934, the registrant has duly caused this report to be signed on its behalf by the undersigned, thereunto duly authorized.
| | SILVERCREST MINES INC. |
| | |
| | /s/ J. Scott Drever |
| Date: March 28, 2013 | J. Scott Drever |
| | Chairman and President |
UPDATED RESOURCE ESTIMATE FOR THE LA JOYA
PROPERTY
DURANGO, MEXICO
NI 43-101 TECHNICAL REPORT
PREPARED FOR SILVERCREST MINES INC.
RELEASED: MARCH 27, 2013
EFFECTIVE DATE: DECEMBER 16, 2012
| | LA JOYA, NI 43-101 TECHNICAL REPORT |
| | RELEASED: MARCH 27, 2013 |
| TABLE OF CONTENTS | |
| |
| 1.0 | EXECUTIVE SUMMARY | 1 |
| | 1.1 | Property Description and Ownership | 3 |
| | 1.2 | Geology and Mineralization | 3 |
| | 1.3 | Drilling and Exploration | 5 |
| | 1.4 | Mineral Processing and Metallurgical Testing | 5 |
| | 1.5 | Mineral Resource Estimation | 7 |
| | 1.6 | Recommendations | 8 |
| | | | |
| 2.0 | INTRODUCTION AND TERMS OF REFERENCE | 10 |
| | 2.1 | Report Authors and EBA Quality Control | 10 |
| | 2.2 | Site visits | 10 |
| | | | |
| 3.0 | RELIANCE ON OTHER EXPERTS | 10 |
| | | |
| 4.0 | PROPERTY DESCRIPTION AND LOCATION | 11 |
| | 4.1 | Location | 11 |
| | 4.2 | Concessions | 11 |
| | 4.3 | Property Agreements | 12 |
| | 4.4 | Mexican Mine Permitting and Regulations | 16 |
| 5.0 | ACCESSIBILITY, CLIMATE, LOCAL RESOURCES, INFRASTRUCTURE AND ACCESSIBILITY, CLIMATE, LOCAL RESOURCES, INFRASTRUCTURE AND |
| | PHYSIOGRAPHY | 17 |
| | 5.1 | Accessibility | 17 |
| | 5.2 | Climate | | 17 |
| | 5.3 | Local Resources | 17 |
| | 5.4 | Infrastructure | 19 |
| | 5.5 | Physiography | 19 |
| 6.0 | HISTORY | | 20 |
| | 6.1 | Discovery | 20 |
| | 6.2 | Pre-1977 | 20 |
| | 6.3 | 1977 to 2006, Luismin | 21 |
| | | 6.3.1 1997 to 2001, Luismin-Boliden Joint Venture | 21 |
| | 6.4 | 2001 to 2010 | 22 |
| | 6.5 | Historical Resource Estimations | 23 |
| 7.0 | GEOLOGICAL SETTING AND MINERALIZATION | 25 |
| | 7.1 | Regional Geology | 25 |
| | 7.2 | Local Geology | 25 |
| | | 7.2.1 | Sedimentary Units | 28 |
| | | 7.2.2 | Igneous Units | 28 |
| | | 7.2.3 | Structural Events | 29 |
i
| | LA JOYA, NI 43-101 TECHNICAL REPORT |
| | RELEASED: MARCH 27, 2013 |
| |
| | 7.3 | Mineralization | | 30 |
| | | 7.3.1 | La Joya and Santo Nino | 30 |
| | | 7.3.2 | Coloradito | | 32 |
| 8.0 | DEPOSIT TYPE | | 32 |
| | | | |
| 9.0 | EXPLORATION | | 34 |
| | | | |
| | 9.1 | Surface Sampling and Mapping | 34 |
| | 9.2 | Exploration History Compilation and Database Development | 34 |
| | | 9.2.1 | Rock Coding in Database | 35 |
| | | | | |
| 10.0 | DRILLING | | | 36 |
| | 10.1 | Phase 1 Drilling, Oct 2010 to July 2011 | 36 |
| | 10.2 | Phase II Drilling, Nov 2011 to Dec 2012 | 36 |
| | | | |
| 11.0 | SAMPLE PREPARATION, ANALYSES AND SECURITY | 45 |
| | | |
| | 11.1 | Historic Sample Preparation | 45 |
| | 11.2 | SilverCrest Sample Preparation and Analysis, 2010-2013 | 45 |
| | | 11.2.1 | Laboratory Selection | 47 |
| | | 11.2.2 | Methods | | 47 |
| | | 11.2.3 | Sample Storage and Security | 47 |
| | 11.3 | QP Statement | | 48 |
| | | | | |
| 12.0 | DATA VERIFICATION | 48 |
| | | |
| | 12.1 | Site Visit IV: October 2012 | 48 |
| | 12.2 | Phase II Sampling QA/QC | 51 |
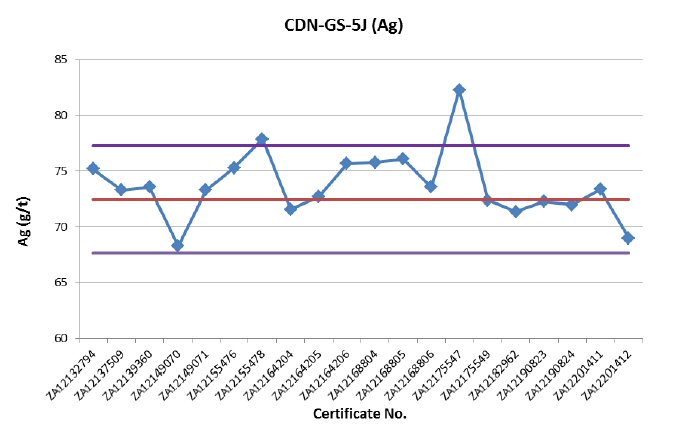
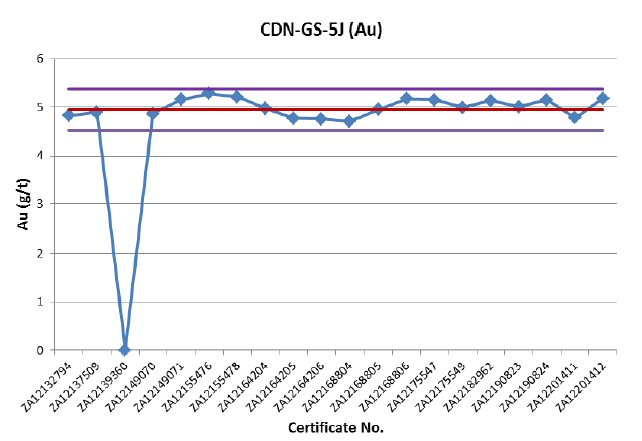
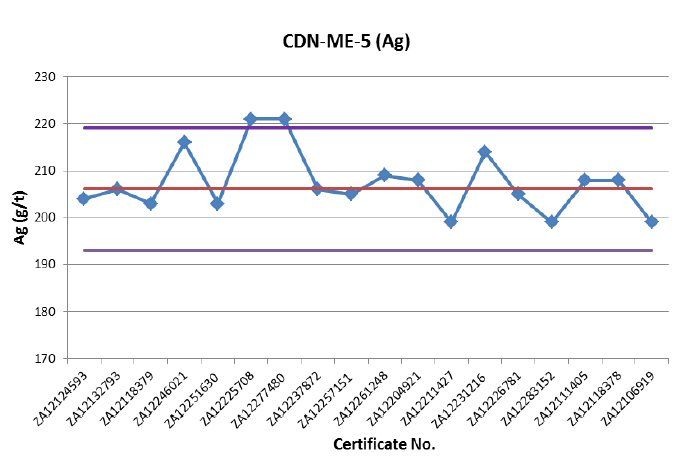
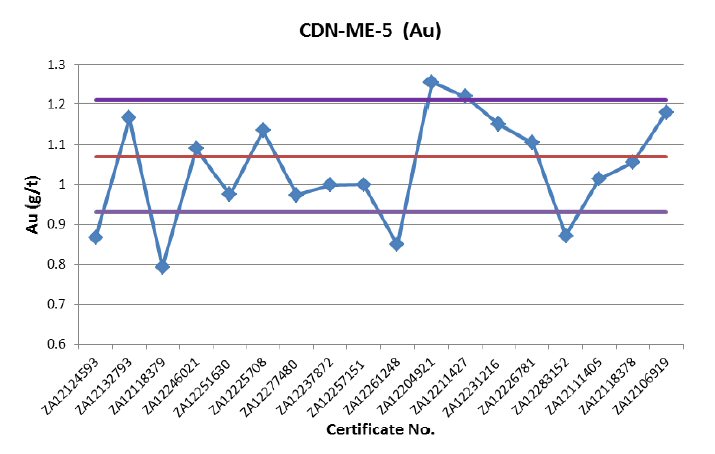
| | | 12.2.1 | SilverCrest Certified Reference Material Insertions | 51 |
| | | 12.2.2 | SilverCrest Blank Material Insertions | 55 |
| | 12.3 | QP Statement | | 57 |
| | | | | |
| 13.0 | MINERAL PROCESSING AND METALLURGICAL TESTING | 58 |
| | | |
| | 13.1 | Initial Test Work at Instituto Tecnológico de Saltillo - 2011 | 58 |
| | 13.2 | Test Work at ALS - 2012 to 2013 | 61 |
| | | 13.2.1 | Sample Selection | 61 |
| | | 13.2.2 | Test Program Scope | 61 |
| | | 13.2.3 | Sample Preparation | 62 |
| | | 13.2.4 | Sample Characterization | 62 |
| | | | 13.2.4.1 | Head Assay and Specific Gravity | 62 |
| | | | 13.2.4.2 | JKTech SMC Tests | 63 |
| | | | 13.2.4.3 | Bond Ball Mill Grindability Tests | 63 |
| | | | 13.2.4.4 | Abrasion Tests | 64 |
| | | 13.2.5 | Mineralogy Analysis | 64 |
| | | 13.2.6 | Gravity Concentration | 65 |
| | | 13.2.7 | Batch Rougher Flotation Tests | 66 |
| | | 13.2.8 | Batch Cleaner Flotation Tests | 68 |
ii
| | LA JOYA, NI 43-101 TECHNICAL REPORT |
| | RELEASED: MARCH 27, 2013 |
| | | 13.2.9 Optimization Tests to Control Penalty Elements | 69 |
| | | | 13.2.9.1 | Arsenic Control Test Work | 70 |
| | | | 13.2.9.2 | Antimony and Bismuth Control Test Work | 71 |
| | 13.3 | Recommendations | | 71 |
| | | | | |
| 14.0 | MINERAL RESOURCE ESTIMATE | 72 |
| | | |
| | 14.1 Previous NI 43-101 Resource Estimate (Phase 1, Jan 5, 2012) | 72 |
| | 14.2 Current NI 43-101 Resource Estimation (Phase II) | 73 |
| | | 14.2.1 | Basis of Current Estimate | 73 |
| | | 14.2.2 Metal Price Analysis and Silver Equivalent Calculation | 74 |
| | | 14.2.3 Specific Gravity Used in Resource Estimation | 77 |
| | 14.3 Geological Model Used in the Interpretation | 80 |
| | | 14.3.1 Lithocoding used in the GEMS block model | 86 |
| | | 14.3.2 Main Mineralized Trend (MMT) Geostatistics | 87 |
| | | | 14.3.2.1 | MMT High Grade Capping | 97 |
| | | 14.3.3 | Santo Nino Geostatistics | 101 |
| | | | 14.3.3.1 | Santo Nino High Grade Capping | 112 |
| | | 14.3.4 | Coloradito Geostatistics | 115 |
| | | | 14.3.4.1 | Coloradito High Grade Capping | 122 |
| | | 14.3.5 | Interpolation and Modelling Parameters | 125 |
| | | | 14.3.5.1 | Main Mineralized Trend | 125 |
| | | | 14.3.5.2 | Santo Nino | 127 |
| | | | 14.3.5.3 | Coloradito | 128 |
| | 14.4 | Resource Estimate | 128 |
| | | 14.4.1 | Mineral Resource Classification | 131 |
| | 14.5 | Resource Validation | 131 |
| | | | |
| 15.0 | MINERAL RESERVE ESTIMATES | 133 |
| | | |
| 16.0 | MINING METHODS | | 133 |
| | | | |
| 17.0 | RECOVERY METHODS | 133 |
| | | |
| 18.0 | PROJECT INFRASTRUCTURE | 133 |
| | | |
| 19.0 | MARKET STUDIES AND CONTRACTS | 133 |
| | | |
| 20.0 | ENVIRONMENTAL STUDIES, PERMITTING AND SOCIAL OR COMMUNITY IMPACT133 |
| | |
| 21.0 | CAPITAL AND OPERATING COSTS | 134 |
| | | |
| 22.0 | ECONOMIC ANALYSIS | 134 |
| | | |
| 23.0 | ADJACENT PROPERTIES | 134 |
| | | |
| 24.0 | OTHER RELEVANT DATA AND INFORMATION | 134 |
iii
| | LA JOYA, NI 43-101 TECHNICAL REPORT |
| | RELEASED: MARCH 27, 2013 |
| 25.0 | INTERPRETATION AND CONCLUSIONS | 134 |
| | | |
| 26.0 | RECOMMENDATIONS | 135 |
| | | |
| REFERENCES | 138 |
Table 1: Inferred Ag-Cu-Au-W-Mo Resource Estimation for the MMT and Santo Nino Deposits, Effective Date December 16, 2012 | 2 |
Table 2: Inferred W-Mo Resource Estimation for the MMT, Santo Nino and Coloradito Deposits, Effective Date December 16, 2012 | 2 |
| Table 3: Batch Cleaner Flotation Test Results- Baseline | 6 |
| Table 4: Batch Cleaner Flotation Test Results- with Cyanide | 6 |
| Table 5: 5-Year Metal Price Trends and AgEQ Calculation for Silver, Copper and Gold | 8 |
| Table 6: Recommended Phase III Work and Estimated Costs for the La Joya Property | 9 |
| Table 7: SilverCrest Mineral Concessions for the La Joya Property | 14 |
| Table 8: Summary of Historical Drilling on the La Joya Property | 23 |
| Table 9: Historical Luismin Estimates (non-NI 43-101 Compliant) | 24 |
| Table 10: Major Deformation Events (Patterson, 2001) | 30 |
| Table 11: Rockcoding Used in Phase I and II SilverCrest Drill Logs and in GEMS Drill Hole Database | 35 |
| Table 12: Summary of SilverCrest Drilling on the La Joya Property | 40 |
| Table 13: Significant Drill Hole Intercepts > 5 M Length from Phase II Drilling | 40 |
| Table 14: Recent Significant Tungsten Drill Intersections | 44 |
| Table 15: Drill Core Samples and Duplicates Collected by EBA, October 2012 | 49 |
| Table 16: Certified Reference Material CDN-ME-16 Comparison - October 2012 | 50 |
| Table 17: Certified Reference Material CDN-W-4 Comparison - October 2012 | 50 |
| Table 18: Certified Reference Material Reporting Values Used in Phase II by SilverCrest | 51 |
| Table 19: Element Analysis - Samples CZ, ST and MA | 59 |
| Table 20: Mineral Species - Sample CZ. Samples | 59 |
| Table 21: Mineral Species - Sample ST | 60 |
| Table 22: Mineral Species - Sample MA | 60 |
| Table 23: Composite Samples of Manto, Structure and Contact, 2012 Memo of La Joya Metallurgical Sample Selection | 61 |
| Table 24: Sample Composites Summary | 62 |
| Table 25: Chemical Element Analysis | 63 |
| Table 26: JK Tech SMC Data | 63 |
| Table 27: Bond Ball Grindability Test and Abrasion Test Results | 64 |
| Table 28: Abrasion Test Results | 64 |
| Table 29: Mineral Compositions | 64 |
| Table 30: Copper Minerals Deportment | 65 |
| Table 31: Gravity Test Results On Contact Composite Samples | 66 |
| Table 32: Summary of Batch Cleaner Test Results -Baseline | 69 |
| Table 33: Penalty Element Concentration in 3rd Cleaner Concentrate | 69 |
| Table 34: As Concentration in 3rd Cleaner Concentrate after Treatment | 70 |
| Table 35: Summary of Batch Cleaner Test Results - with Cyanide | 70 |
| Table 36: Depressant Screening Tests Summary | 71 |
| Table 37: Phase I Inferred Ag-Cu-Au Resource Estimation for the La Joya Deposit, Effective Date January. 5, 2012 | 72 |
| Table 38: Phase I Inferred Zn-Pb Resource Estimation for the La Joya Deposit, Effective Date January 5, 2012 | 73 |
| Table 39: Phase I Inferred W Resource Estimation for the La Joya Deposit, Effective Date January 5, 2012 | 73 |
iv
| | LA JOYA, NI 43-101 TECHNICAL REPORT |
| | RELEASED: MARCH 27, 2013 |
| Table 40: GEMS Block Model Bounds, Dimensions and Rotation Used for the LJ_2012, LJ2012COL and LJ_2012_SN Database | 74 |
| Table 41: 5-Year Metal Price Trends and AgEQ Calculation for Silver, Copper and Gold | 77 |
| Table 42 : GEMS Solid SG Distribution Summary | 80 |
| Table 43: Rockcodes Applied to MMT and Santo Nino Block Model | 86 |
| Table 44: Rockcodes Applied to Coloradito Block Model | 86 |
| Table 45: Main Mineralized Trend - Manto Raw Non-Composited Descriptive Metal Data | 87 |
| Table 46: Main Mineralized Trend - Manto 2 metre Composited Descriptive Metal Data | 88 |
| Table 47: Main Mineralized Trend - Manto 2 metre Composited >15 AgEQ Descriptive Metal Data | 88 |
| Table 48: Main Mineralized Trend - Manto 2 metre Composited >30 AgEQ Descriptive Metal Data | 89 |
| Table 49: Main Mineralized Trend - Manto 2 metre Composited >60 AgEQ Descriptive Metal Data | 89 |
| Table 50: Main Mineralized Trend - Raw Non-Composited Structure Descriptive Metal Data | 90 |
| Table 51: Main Mineralized Trend -Structure Descriptive Statistics for 2 metre Composited, Metal Data | 90 |
| Table 52: Main Mineralized Trend -2 metre Composited Structure>15 AgEQ Descriptive Metal Data | 91 |
| Table 53: Main Mineralized Trend Structure Descriptive Statistics for 2 metre Composited >30 AgEQ Metal Data | 91 |
| Table 54: Main Mineralized Trend Structure Descriptive Statistics for 2 metre Composited >60 AgEQ Metal Data | 92 |
| Table 55: Main Mineralized Trend Contact Skarn Descriptive Statistics for Raw, Non-Composited Descriptive Metal Data | 92 |
| Table 56: Main Mineralized Trend Contact Skarn Descriptive Statistics for 2 metre-Composited Descriptive Metal Data | 93 |
| Table 57: Main Mineralized Trend Contact Skarn Descriptive Statistics for 2 metre Composited >15 AgEQ Metal Data | 93 |
| Table 58: Main Mineralized Trend Contact Skarn Descriptive Statistics for 2 metre Composited >30 AgEQ Metal Data | 94 |
| Table 59: Main Mineralized Trend Contact Skarn Descriptive Statistics for 2 metre Composited >60 AgEQ Metal Data | 94 |
| Table 60: Santo Nino - Manto Descriptive Statistics for Raw, Non-Composited, Metal Data | 101 |
| Table 61: Santo Nino - Manto 2 metre Composited Descriptive Metal Data | 102 |
| Table 62: Santo Nino - Manto 2 metre Composited >15 AgEQ Descriptive Metal Data | 102 |
| Table 63: Santo Nino - Manto 2 metre Composited >30 AgEQ Descriptive Metal Data | 103 |
| Table 64: Santo Nino - Manto 2 metre Composited >60 AgEQ Descriptive Metal Data | 103 |
| Table 65: Santo Nino Structure Descriptive Statistics for Raw, Non-Composited, Metal Data | 104 |
| Table 66: Santo Nino Structure Descriptive Statistics for 2 metre Composited, Metal Data | 104 |
| Table 67: Santo Nino Structure Descriptive Statistics for 2 metre Composited >15 AgEQ Descriptive Metal Data | 105 |
| Table 68: Santo Nino Structure Descriptive Statistics for 2 metre Composited >30 AgEQ Descriptive Metal Data | 105 |
| Table 69: Santo Nino Structure Descriptive Statistics for 2 metre Composited >60 AgEQ Descriptive Metal Data | 106 |
| Table 70: Santo Nino Contact Skarn Descriptive Statistics for Raw, Non-Composited Descriptive Metal Data | 106 |
| Table 71: Santo Nino Contact Skarn Descriptive Statistics for 2 metre Composited Descriptive Metal Data | 107 |
| Table 72: Santo Nino Contact Skarn Descriptive Statistics for 2 metre Composited >15 AgEQ Metal Data | 107 |
| Table 73: Santo Nino Contact Skarn Descriptive Statistics for 2 metre Composited >30 AgEQ Metal Data | 108 |
| Table 74: Santo Nino Contact Skarn Descriptive Statistics for 2 metre Composited >60 AgEQ Metal Data | 108 |
| Table 75: Coloradito Contact Skarn - Descriptive Statistics for Raw, Non-Composited, Metal Data | 116 |
| Table 76: Coloradito Contact Skarn - 2 metre Composited Descriptive Metal Data | 116 |
| Table 77: Coloradito Contact Skarn - Composited >15 AgEQ Descriptive Metal Data | 117 |
| Table 78: Coloradito Contact Skarn - >30 AgEQ Descriptive Metal Data | 117 |
| Table 79: Coloradito Contact Skarn - >60 AgEQ Descriptive Metal Data | 118 |
| Table 80: Coloradito Contact Skarn - >200 ppm W Descriptive Metal Data | 118 |
| Table 81: Coloradito Contact Skarn - >200 ppm W Descriptive Metal Data | 119 |
| Table 82: Model Search Parametres | 126 |
| Table 83: Average Reporting Composite Data for Block Model by Mineralized Solid Type for the MMT | 127 |
| Table 84: Main Mineralized Trend - Manto 2 metre Composited >30 AgEQ Descriptive Metal Data | 128 |
| Table 85: Average Reporting Composite Data for Block Model by Mineralized Solid Type for Coloradito | 128 |
| Table 86: Inferred Ag-Cu-Au- Resource Estimation for MMT and, Santo Nino Deposits, Effective Date Dec. 16, 2012 | 129 |
v
| | LA JOYA, NI 43-101 TECHNICAL REPORT |
| | RELEASED: MARCH 27, 2013 |
Table 87: Inferred W-Mo- Resource Estimation for MMT, Santo Nino and Coloradito Deposits, Effective Date Dec. 16, 2012 | 129 |
| Table 88: Recommended Phase III Work and Estimated Costs for the La Joya Property | 137 |
| |
| |
| FIGURES | |
| Figure 1: Property scale location map | 13 |
| Figure 2: Mineral concession map | 15 |
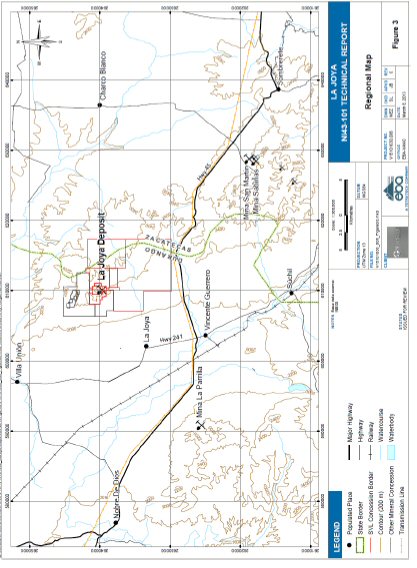
| Figure 3: Regional map showing mineral concession, local infrastructure, and proximal mines | 18 |
| Figure 4: Historical non-NI 43-101 compliant resource of Luismin and Boliden | 24 |
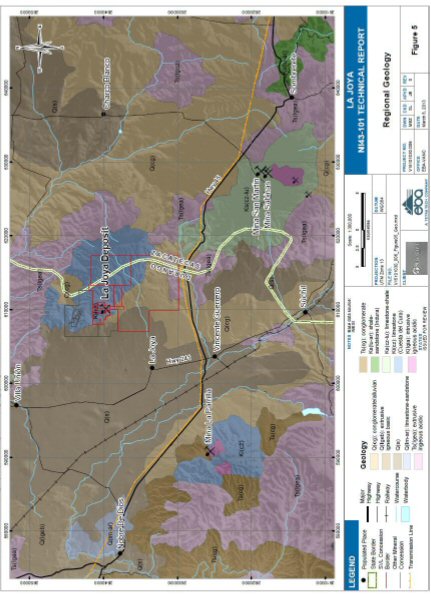
| Figure 5: Regional geology map | 26 |
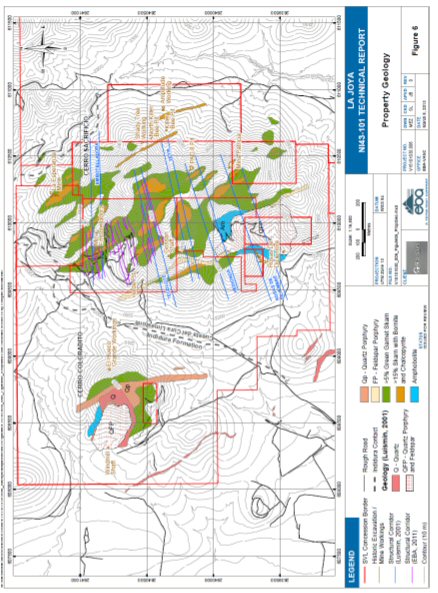
| Figure 6: Local property geology | 27 |
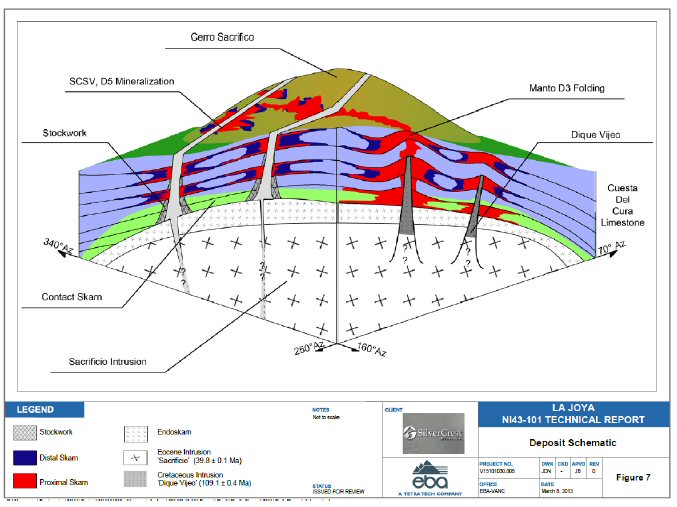
| Figure 7: La Joya deposit model schematic | 33 |
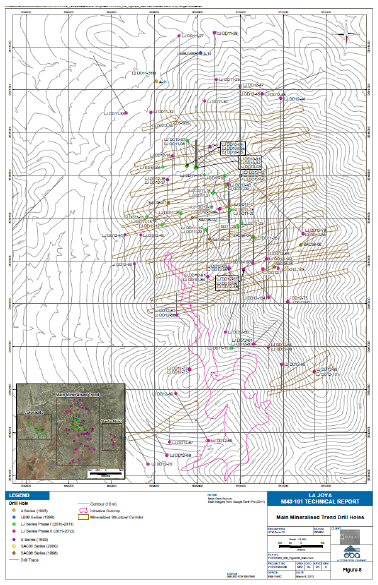
| Figure 8: Phase I and II drill hole location map of the MMT | 37 |
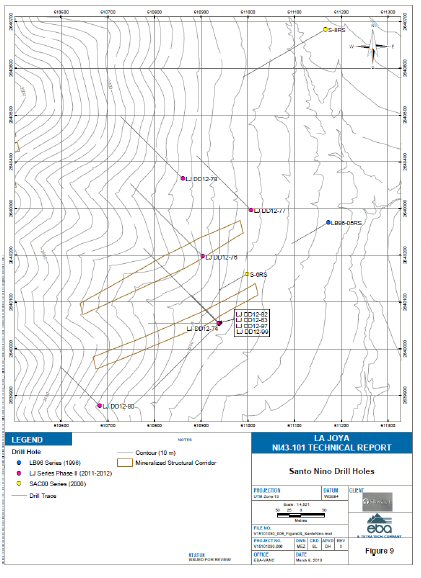
| Figure 9: Phase II drill hole map of Santo Nino | 38 |
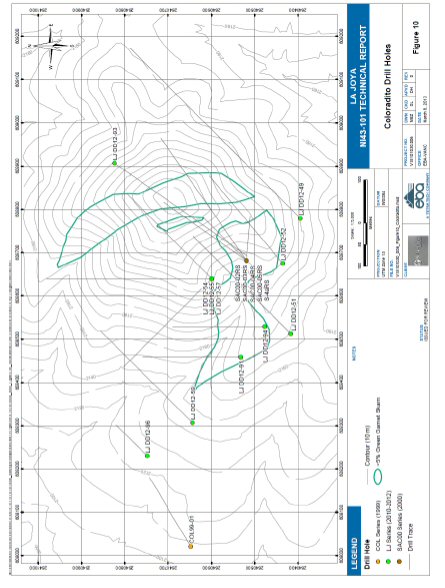
| Figure 10: Phase II drill hole map of Coloradito | 39 |
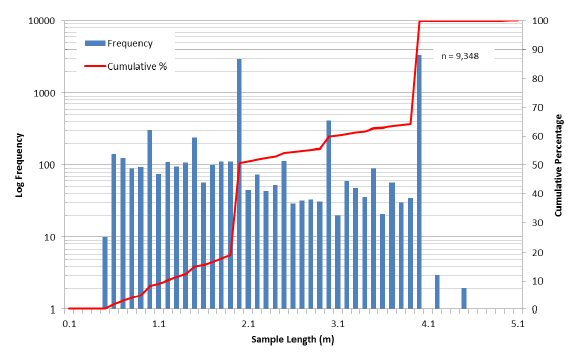
| Figure 11: Log histogram distribution of sample lengths from Phase II | 46 |
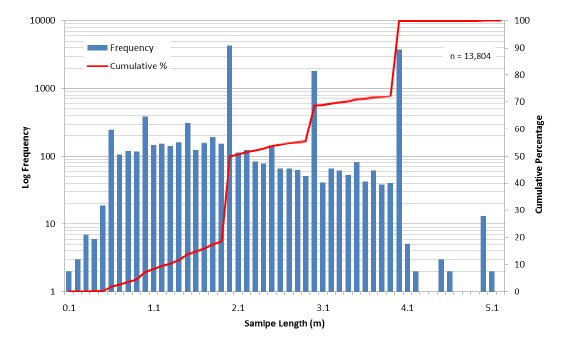
| Figure 12: Log histogram distribution of sample lengths from Historic, Phase I and II drilling | 46 |
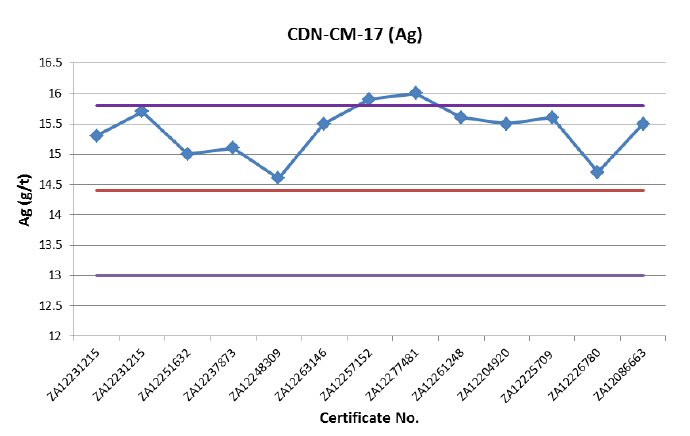
| Figure 13: CRM CDN-CM-17 (Ag) | 51 |
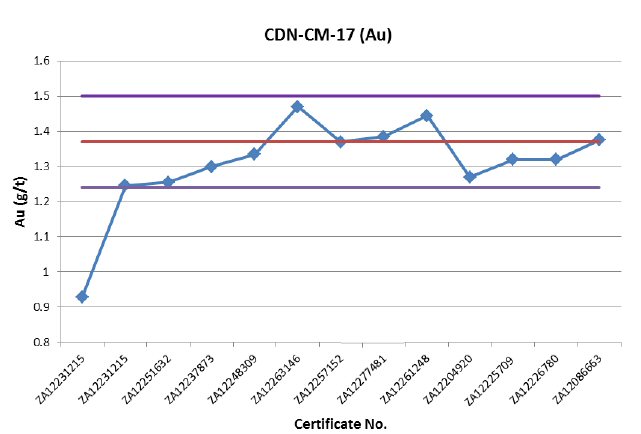
| Figure 14: CRM CDN-CM-17 (Au) | 52 |
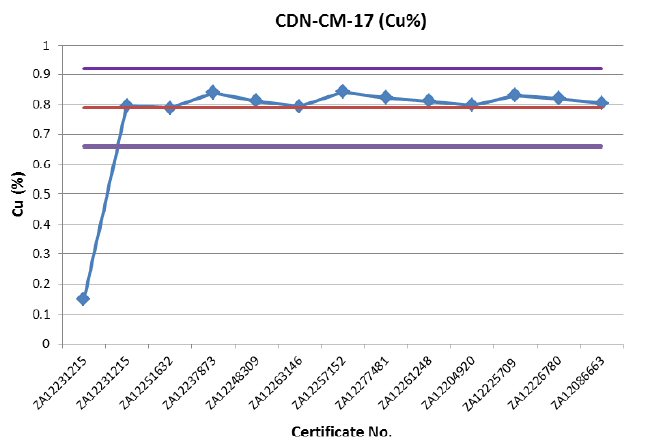
| Figure 15: CRM CDN-CM-17 (Cu%) | 52 |
| Figure 16: CRM CDN-GS-5J (Ag) | 53 |
| Figure 17: CRM CDN-GS-5J (Au) | 53 |
| Figure 18: CRM CDN-ME-5 (Ag) | 54 |
| Figure 19: CRM CDN-ME-5 (Au) | 54 |
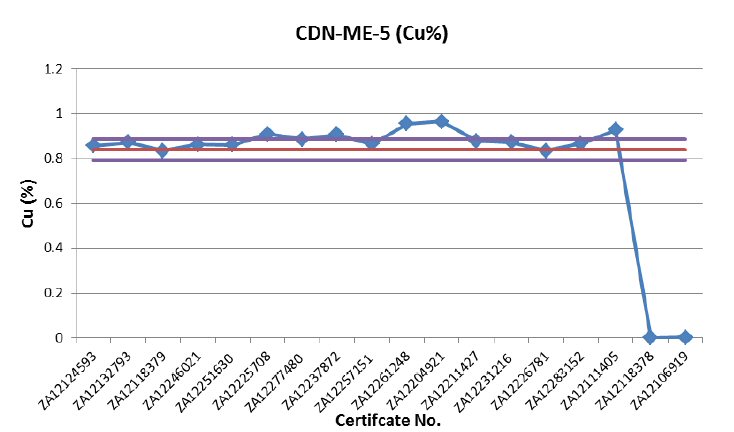
| Figure 20: CRM CDN-ME-5 (Cu) | 55 |
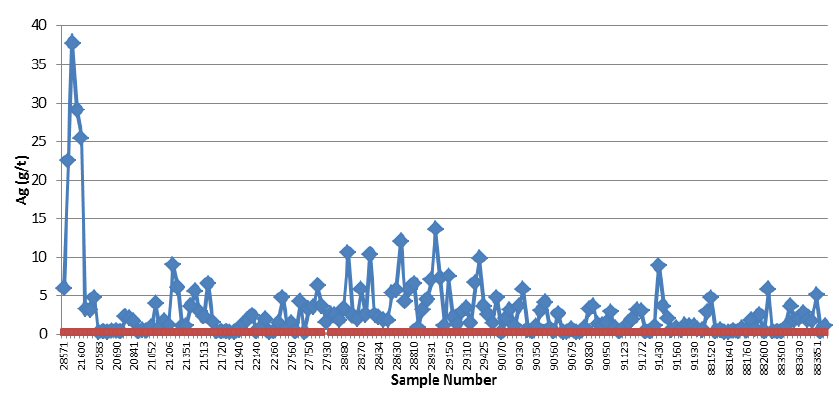
| Figure 21: SilverCrest Phase II mineralized blank material Ag (gpt) | 56 |
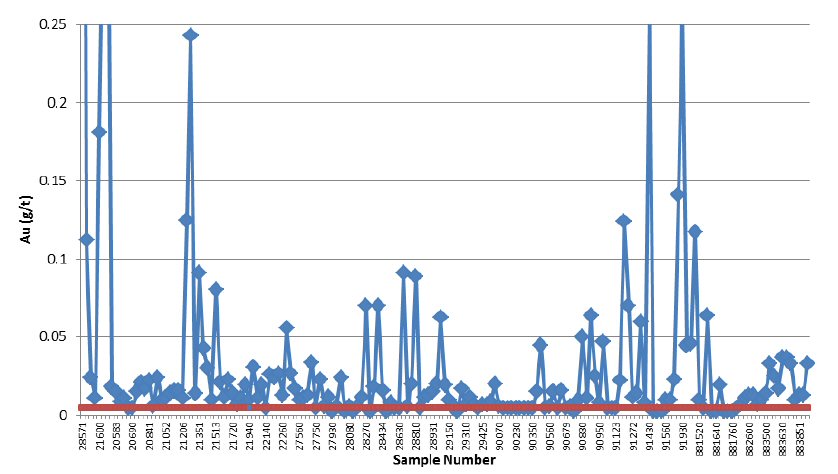
| Figure 22: SilverCrest Phase II mineralized blank material Au (gpt) | 56 |
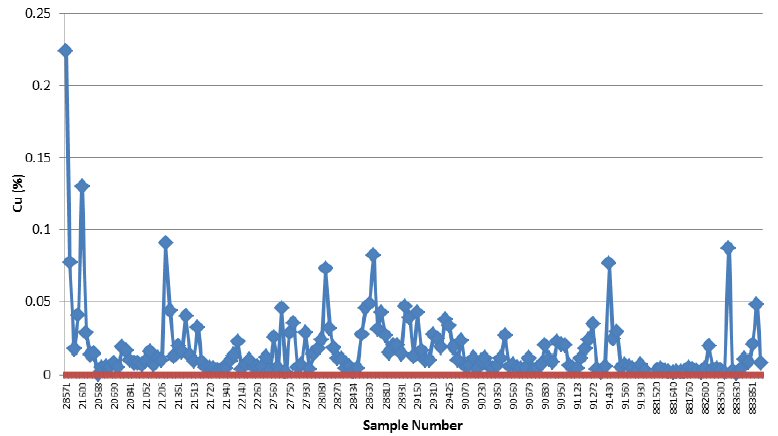
| Figure 23: SilverCrest Phase II mineralized blank material Cu (%) | 57 |
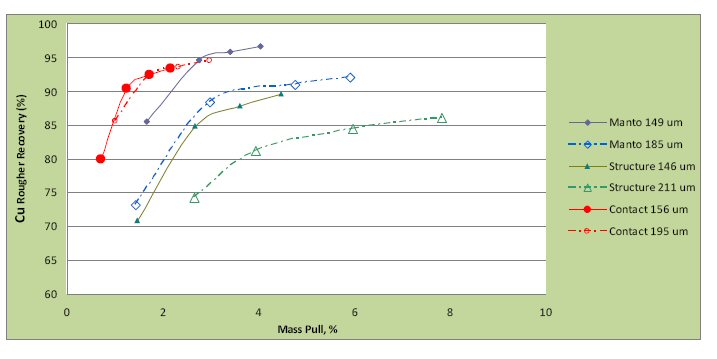
| Figure 24: Copper Recovery vs. Rougher Concentrate Mass Pull | 66 |
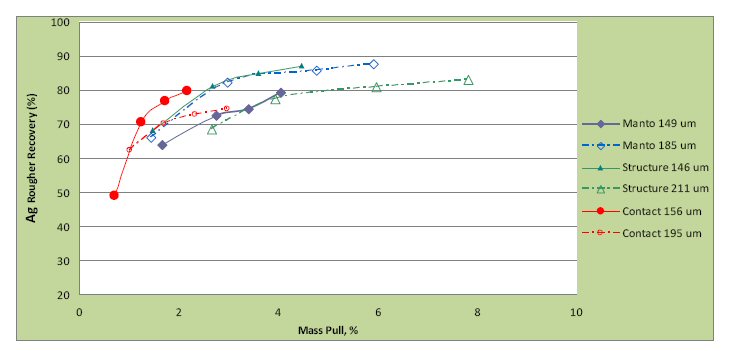
| Figure 25: Silver Recovery vs. Rougher Concentrate Mass Pull | 67 |
| Figure 26: Gold Recovery vs. Rougher Concentrate Mass Pull | 67 |
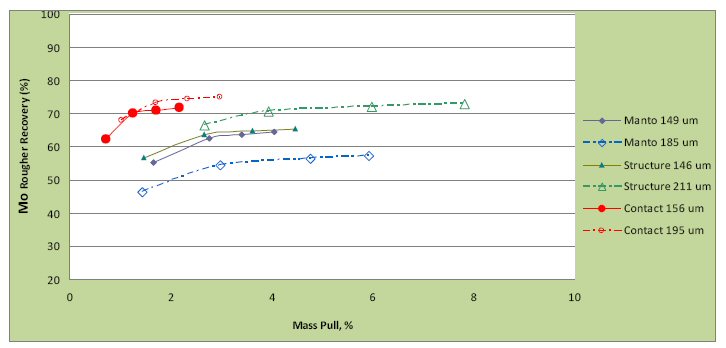
| Figure 27: Molybdenum Recovery vs. Rougher Concentrate Mass Pull | 67 |
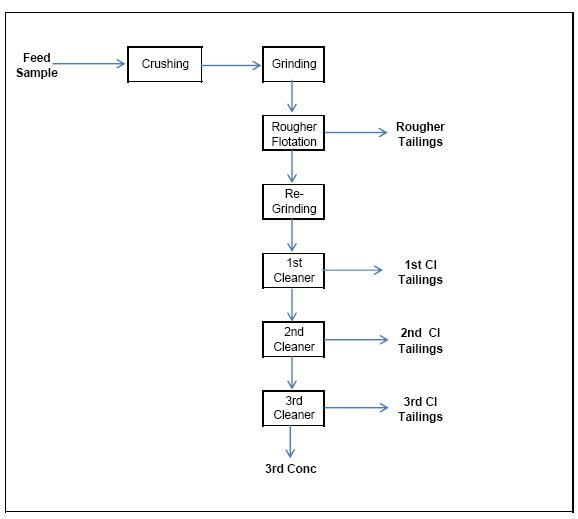
| Figure 28: La Joya Batch Cleaner Flotation Test Diagram | 68 |
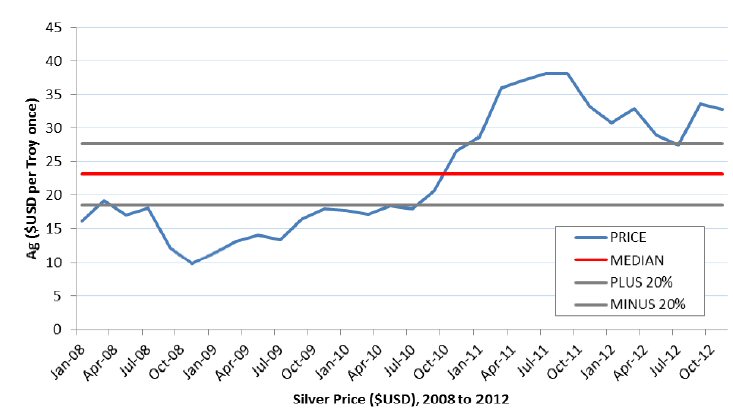
| Figure 29: 5-year silver metal price trend | 76 |
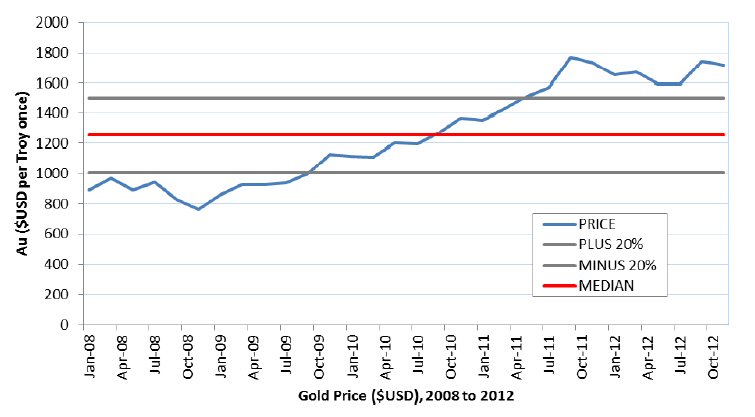
| Figure 30: 5-year gold price trend | 76 |
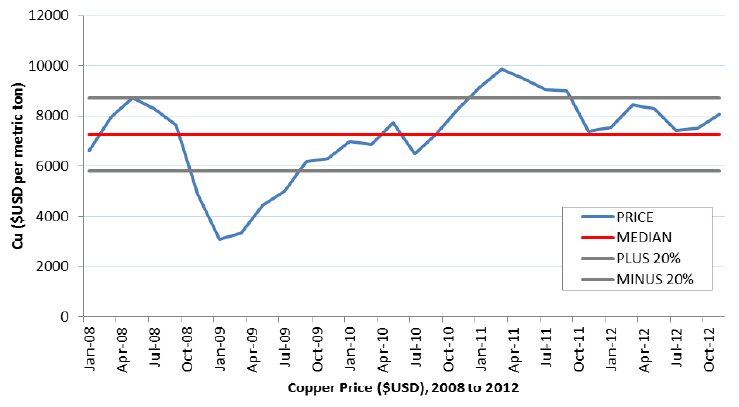
| Figure 31: 5 year copper price trend | 77 |
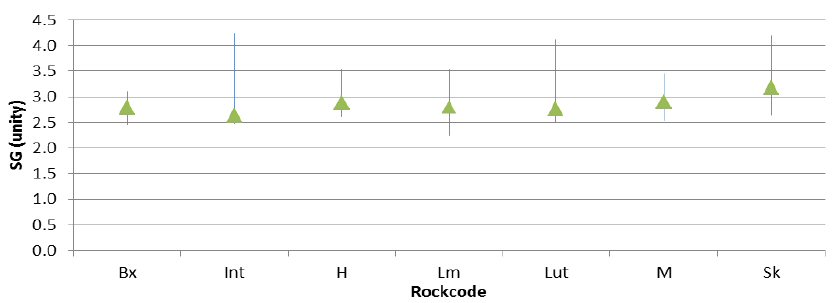
| Figure 32: Distribution of specific gravity by rockcode. (n=1279) | 78 |
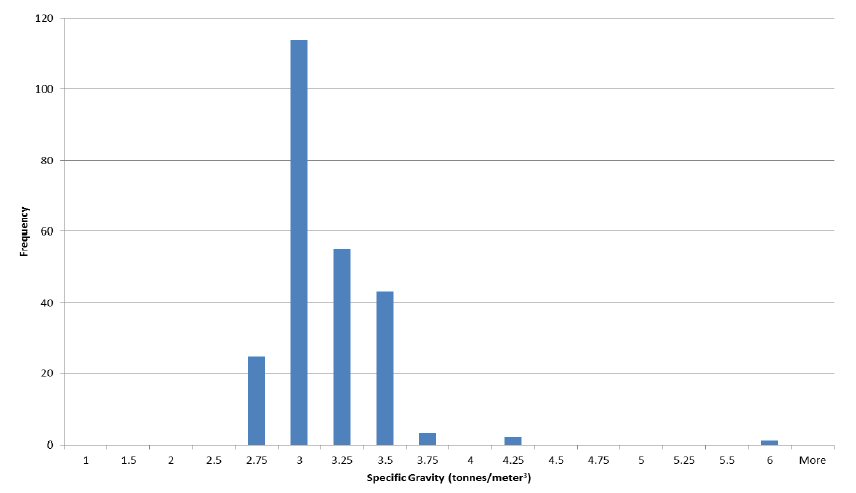
| Figure 33: Specific gravity distribution by solid; Manto | 78 |
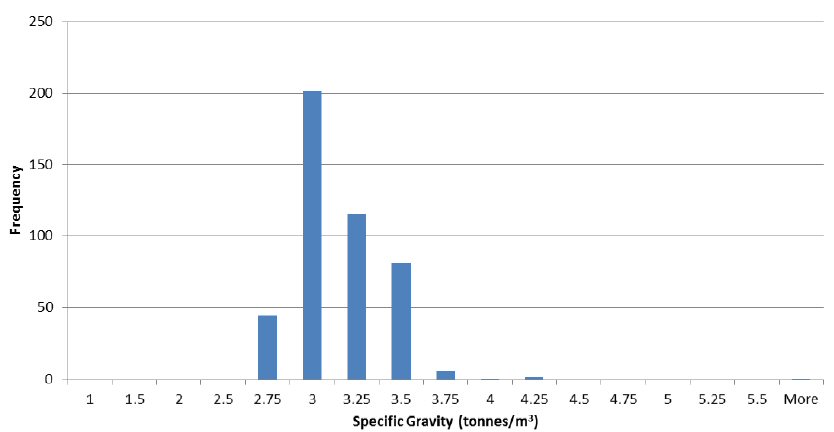
| Figure 34: Specific gravity distribution by solid: Contact Skarn | 79 |
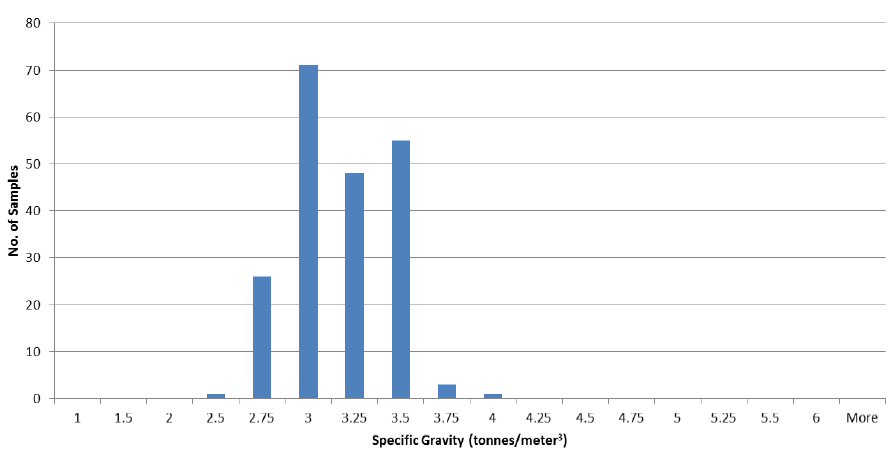
| Figure 35: Specific gravity distribution by solid: Structure | 79 |
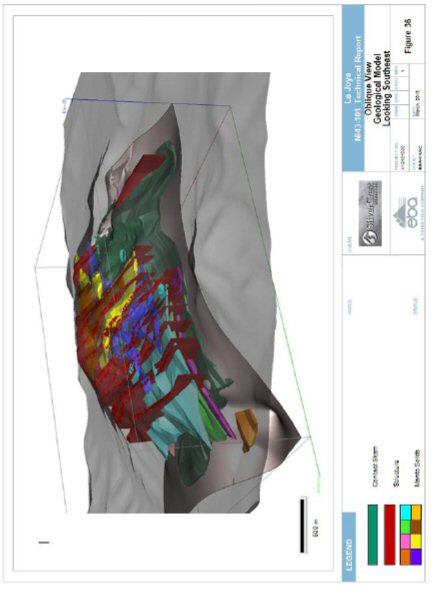
| Figure 36: 3D screen shot of GEMS MMT geological model | 82 |
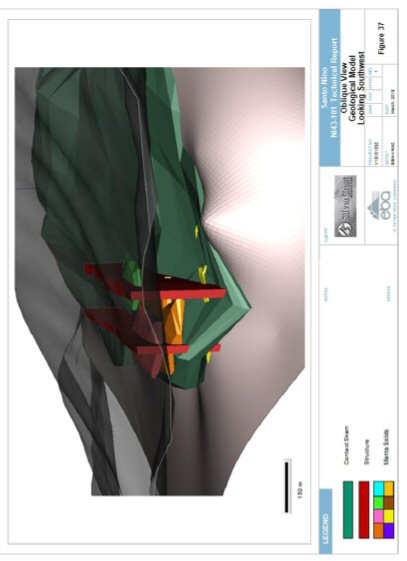
| Figure 37: 3D screen shot of GEMS Santo Nino geological model | 83 |
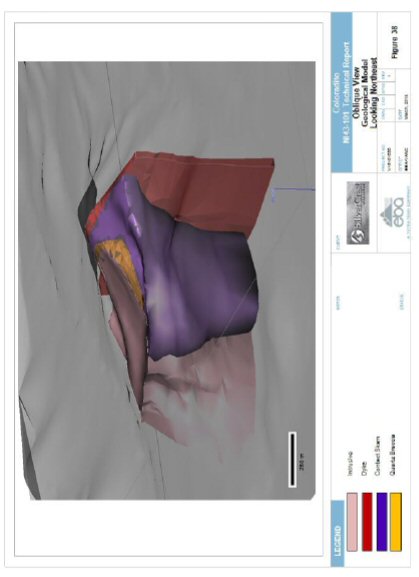
| Figure 38: 3D screen shot of GEMS Coloradito geological model | 84 |
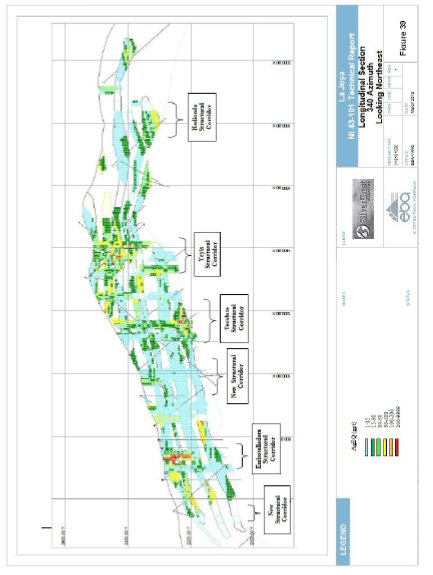
| Figure 39: Vertical cross section view of La Joya block model and mineralized solids | 85 |
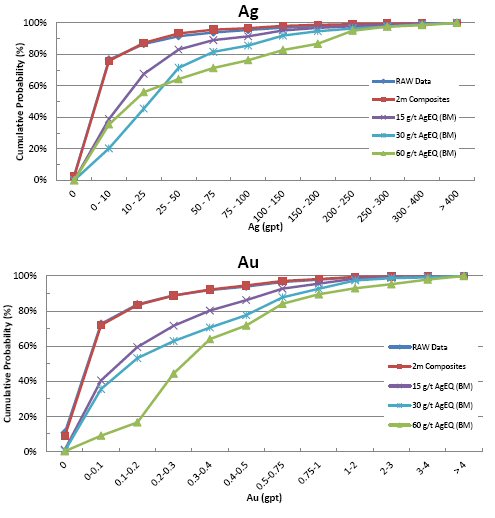
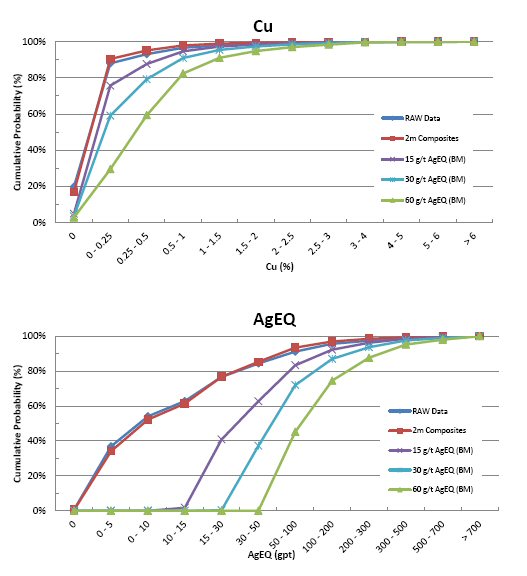
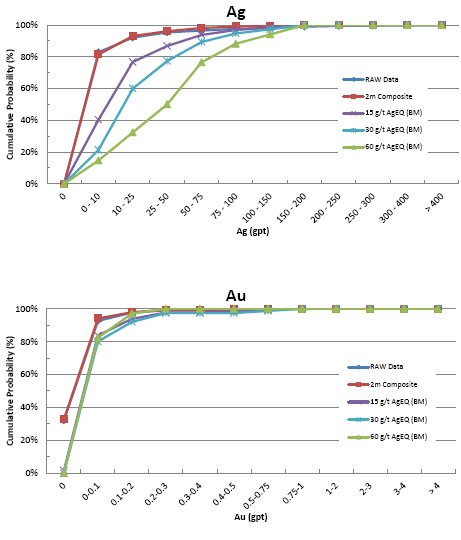
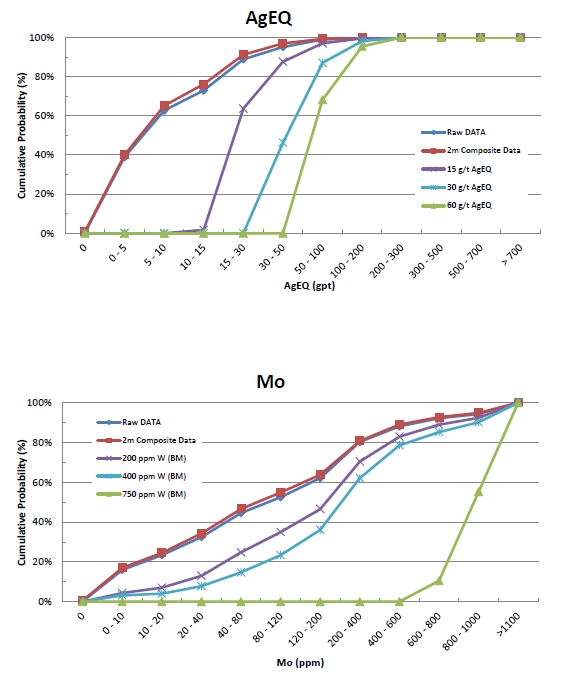
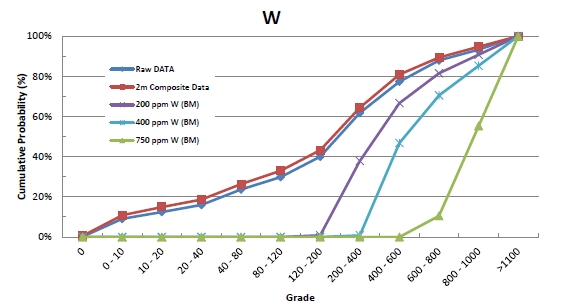
| Figure 40: MMT cumulative probability plots for silver, gold, copper, AgEQ, molybdenum and tungsten | 95 |
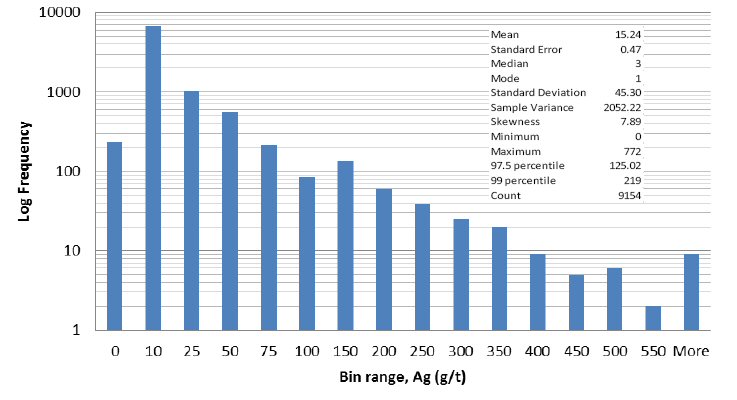
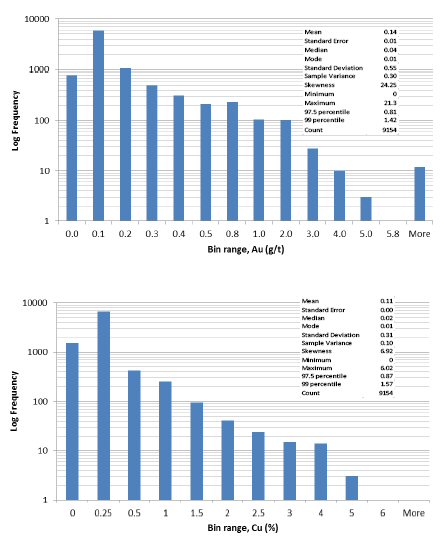
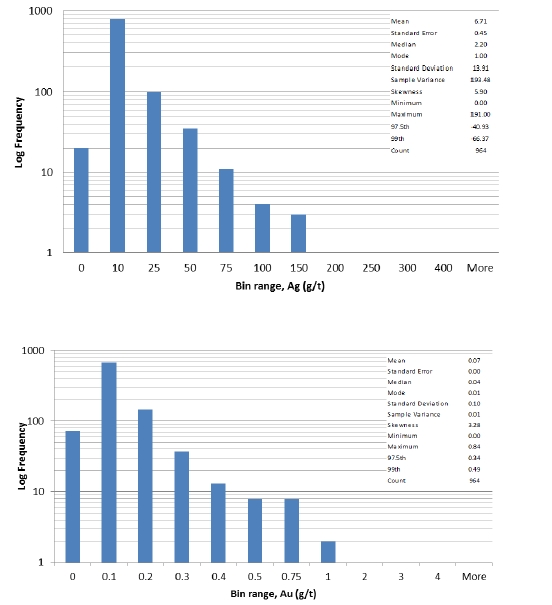
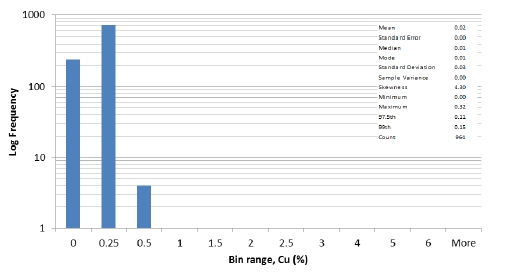
| Figure 41: MMT histogram distributions of 2 metre composite data | 98 |
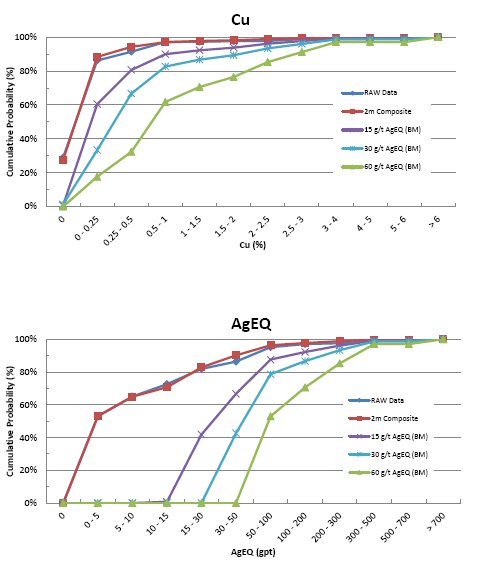
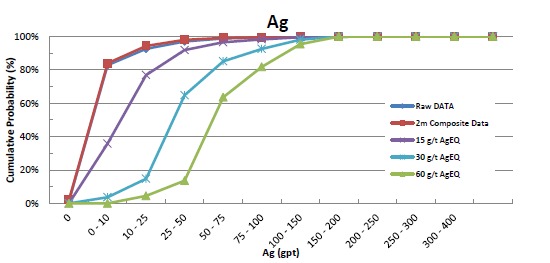
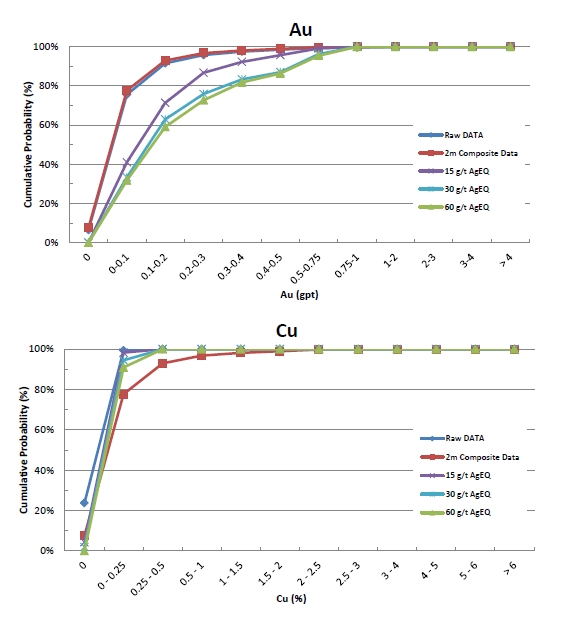
| Figure 42: Santo Nino cumulative probability plots for silver, gold, copper, AgEQ, molybdenum and tungsten | 109 |
vi
| | LA JOYA, NI 43-101 TECHNICAL REPORT |
| | RELEASED: MARCH 27, 2013 |
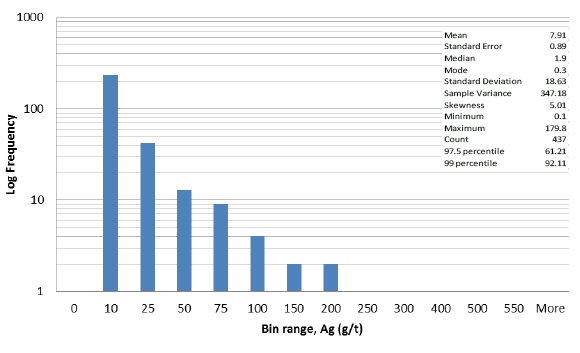
| Figure 43: Santo Nino histogram for distributions of 2 metre composite data | 112 |
| Figure 44: Coloradito cumulative probability plots for silver, gold, copper, AgEQ, Molybdenum and Tungsten | 119 |
| Figure 45: Coloradito histogram distributions of 2 metre composite data | 123 |
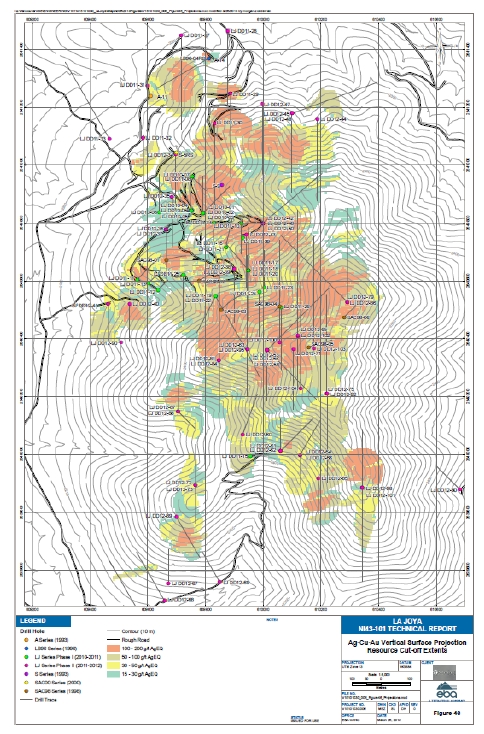
| Figure 46: Resource contours of 15, 30, 50, 100 and 200 gpt AgEQ cut-offs for MMT | 130 |
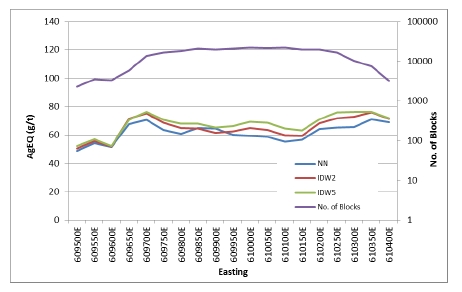
| Figure 47: Comparison of >30 gpt AgEQ from NN, IDW2 and IDW5methods of easting corridor through the La Joya MMT model | 132 |
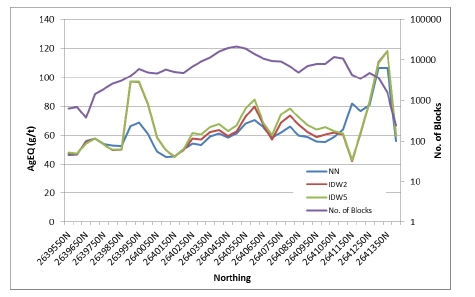
| Figure 48: Comparison of >30 gpt AgEQ from NN, IDW2 and IDW5 methods of northing corridors through the La Joya MMT model | 132 |
| |
| PHOTOGRAPHS | |
| | |
| Photo 1: | Physiography of La Joya region | 19 |
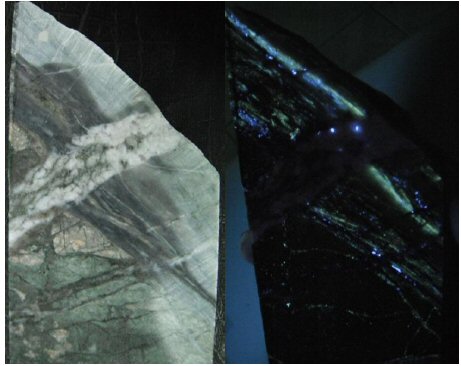
| Photo 2: | Close-up of Scheelite mineraliization in contact skarn in natural and UV light | 44 |
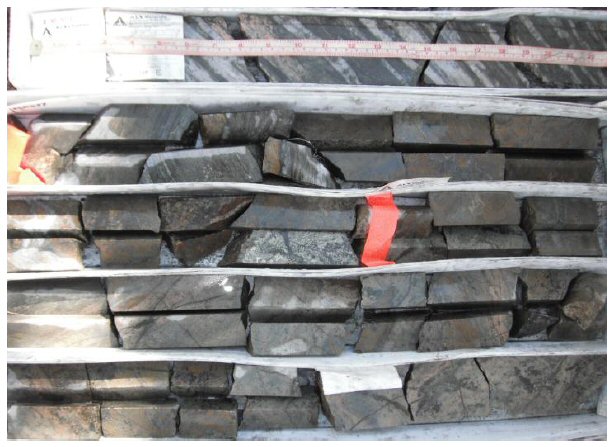
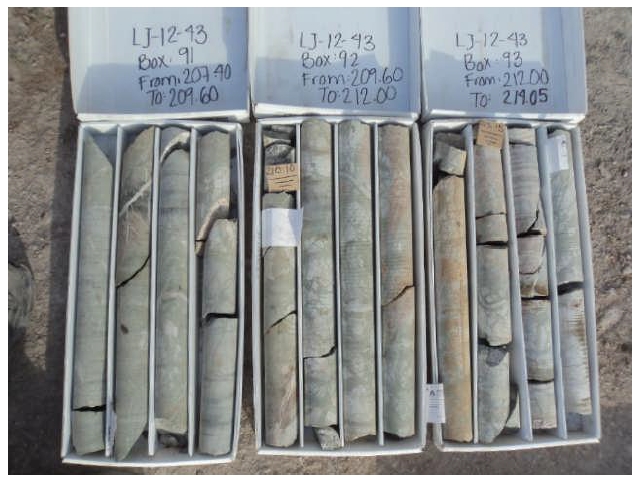
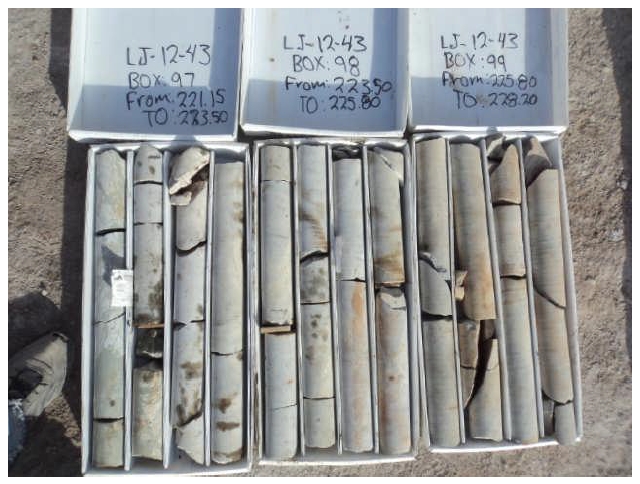
| Photo 3: | Verification sample of SilverCrest drill core, LJ DD12-74 # 90037 | 48 |
Appendix A Qualified Person Certificates of Qualifications
Appendix B Certified Reference Standard Data Sheets
Appendix C Metallurgical Investigation, Summary Reports
vii
| | LA JOYA, NI 43-101 TECHNICAL REPORT |
| | RELEASED: MARCH 27, 2013 |
| AAS | Atomic absorption spectrometry |
| Ag | Silver |
| AgEQ | Silver Equivalent |
| Au | Gold |
| BC | British Columbia |
| CIM | Canadian Institute for Mining, Metallurgy and Petroleum |
| CRM | Certified reference material |
| DDH | Diamond Drill Hole |
| DTM | Digital terrain model |
| EBA | EBA Engineering Consultants Ltd. operating as EBA, A Tetra Tech Company |
| EM | Electromagnetic |
| FA | Fire Assay |
ID2 | Inverse Distance Squared |
| INEGI | Instituto Nacional de Geografía y Estadística de México |
| IP | Induced Polarization |
| JV | Joint Venture |
| Luismin | Minas SanLuis |
| Mo | Molybdenum |
| MMT | Main Mineralized Trend |
| NI43-101 | National Instrument 43-101 Standards of Disclosure for Mineral Projects |
| NSR | Net Smelter Returns |
| Olvera | Señior Sergio Gabriel Olvera Alevedo and Family |
| P.Eng | Professional Engineer |
| P.Geo | Professional Geologist |
| Pb | Lead |
| PEA | Preliminary economic assessment |
| pop. | Population |
| QA/QC | Quality Assurance and Quality Control |
| QP | Qualified Person |
| RC | Reverse Circulation |
| REE | Rare Earth Elements |
| RQD | Rock Quality Designation |
| S.A. de C.V. | Sociedad Anónima de Capital Variable |
| SCdM | SilverCrest de Mexico S.A. de C.V. |
| SCSV | Structurally controlled stockwork and veins |
| SEM | Scanning Electron Microscopy |
| SEMARNAT | Secretaria de Medio Ambiente y Recursos Naturales |
| SilverCrest | SilverCrest Mines Inc. |
| STFZ | San Luis-Tepehuanes Fault System |
| TDL | Total Drilled Length |
| UTM | Universal Transverse Mercator |
viii
| | LA JOYA, NI 43-101 TECHNICAL REPORT |
| | RELEASED: MARCH 27, 2013 |
| Vargas | Señior Pedro Vargas | |
| W | Tungsten | |
WO3 | Tungsten trioxide | |
| WEI | Wardrop, A Tetra Tech Company |
| XRD | X-ray diffraction analysis | |
| Zn | Zinc | |
| | | |
| UNITS OF MEASUREMENT AND CONVERSION |
| |
| $USD | United States Dollar | |
| % | Percent | |
| °C | Degree Celcius | |
| gpt | Grams per tonne | |
| ha | Hectare (10,000 square meters) | |
| km | Kilometer | |
| M | Million | |
| m | Metre | |
| Ma | Million Years | |
| mm | Millimetre | |
| MxnPeso$ | Mexican Pesos | |
| oz | Ounce (troy) | |
| ppb | Part per billion | |
| ppm | Parts per million | |
| sec | Second | |
|
ix
| | LA JOYA, NI 43-101 TECHNICAL REPORT |
| | RELEASED: MARCH 27, 2013 |
EBA Engineering Consultants Ltd. operating as EBA, A Tetra Tech Company (EBA), has prepared this Technical Report for SilverCrest Mines Inc. (SilverCrest) of Vancouver for the La Joya property, located in south-eastern portion of the state of Durango, Mexico, bordering with the state of Zacatecas. SilverCrest de Mexico S.A. de C.V. a 100% owned Mexican subsidiary of SilverCrest (SilverCrest for the purposes of this report) is the holder of the rights to the La Joya property and a legal operating entity of SilverCrest.
This report has been prepared by EBA and is co-authored by James Barr, P.Geo, consultant with EBA, a Tetra Tech Company and Ting Lu, P.Eng, consultant of Tetra Tech (Wardrop Engineering, WEI). Information contained in this report has been derived from work carried out by SilverCrest, historic documentation on the property, field observations and discussions with SilverCrest personnel.
The purpose of this report is to document the current La Joya property holdings, update the mineral resource estimate for the Main Mineralized Trend (MMT), and to support an initial estimate of Mineral Resources for Santo Nino and Coloradito based on information available to EBA from the Phase I and II exploration campaigns. This Technical Report conforms to National Instrument 43-101 Standards of Disclosure for Mineral Projects (NI 43-101) and incorporates the Canadian Institute for Mining, Metallurgy and Petroleum Definition Standards for Mineral Resources and Mineral Reserves (CIM Definition Standards).
Inferred2 silver, copper and gold Mineral Resources are reported at a 30 gpt AgEQ1 cut-off for the Manto and Structure within MMT and Santo Nino deposits in Table 1, below. Block model sensitivities using 15 gpt AgEQ1and 60 gpt AgEQ1 are included. Inferred4 tungsten and molybdenum Mineral Resources are reported at a 0.05% WO3 cut-off for the Contact Zone within the MMT, Santo Nino and Coloradito deposits in Table 2, below. Block model sensitivities using 0.025% WO3 and 0.095% WO3 are included. All reported tonnages for Manto and Structure mineralization are exclusive of tonnages reported for Contact Zone mineralization.
1
| | LA JOYA, NI 43-101 TECHNICAL REPORT |
| | RELEASED: MARCH 27, 2013 |
| | |
| | |
| Table 1: Inferred Ag-Cu-Au-W-Mo Resource Estimation for the MMT and Santo Nino Deposits, Effective Date December 16, 2012 | |
| | |
| | |
| | | | AgEQ Cut | | | Rounded | | | | | | Ag | | | Au | | | Cu | | | Contained | | | Contained | | | Contained | | | Contained | |
| Zone | Category2 | | off (gpt) 1 | | | Tonnes | | | SG | | | (gpt) | | | (gpt) | | | (%) | | | Ag (oz) | | | Au (oz) | | | Cu (lbs) | | | AgEQ (oz) 1 | |
| | |
| | | | | 15 | | | | 120,570,000 | | | | 3.00 | | | | 23.7 | | | | 0.18 | | | | 0.18 | | | | 91,855,000 | | | | 708,000 | | | | 466,474,000 | | | | 185,757,000 | |
MMT 3 | | | | | | | | | | | | | | | | | | | | | | | | | | | | | | | | | | | | | | | | | |
| (Ag, Au, | Inferred | | | 30 | | | | 67,618,000 | | | | 3.00 | | | | 34.6 | | | | 0.24 | | | | 0.25 | | | | 75,367,000 | | | | 519,000 | | | | 377,392,000 | | | | 148,671,000 | |
| Cu) | | | | | | | | | | | | | | | | | | | | | | | | | | | | | | | | | | | | | | | | | |
| | | | | 60 | | | | 26,109,000 | | | | 3.00 | | | | 58.5 | | | | 0.3 | | | | 0.42 | | | | 49,129,000 | | | | 256,000 | | | | 240,114,000 | | | | 92,035,000 | |
| Santo | | | | 15 | | | | 6,169,000 | | | | 3.00 | | | | 20.3 | | | | 0.04 | | | | 0.49 | | | | 4,039,000 | | | | 8,000 | | | | 66,775,000 | | | | 12,826,000 | |
Nino 3 | Inferred | | | 30 | | | | 3,586,000 | | | | 3.00 | | | | 29.1 | | | | 0.05 | | | | 0.75 | | | | 3,363,000 | | | | 5,000 | | | | 59,384,000 | | | | 11,079,000 | |
| (Ag, Au, | | | | | | | | | | | | | | | | | | | | | | | | | | | | | | | | | | | | | | | | | |
| Cu) | | | | 60 | | | | 1,818,000 | | | | 3.00 | | | | 43.0 | | | | 0.05 | | | | 1.2 | | | | 2,517,000 | | | | 3,000 | | | | 48,269,000 | | | | 872,000 | |
| | |
| | | | | 15 | | | | 126,739,000 | | | | | | | | 23.5 | | | | 0.17 | | | | 0.20 | | | | 95,894,000 | | | | 716,000 | | | | 533,249,000 | | | | 198,583,000 | |
| TOTAL | Inferred | | | 30 | | | | 71,204,000 | | | | | | | | 34.4 | | | | 0.23 | | | | 0.28 | | | | 78,730,000 | | | | 524,000 | | | | 436,776,000 | | | | 159,750,000 | |
| | | | | 60 | | | | 27,927,000 | | | | | | | | 57.5 | | | | 0.28 | | | | 0.47 | | | | 51,646,000 | | | | 259,000 | | | | 288,383,000 | | | | 92,907,000 | |
| 1. | Silver equivalency includes silver, gold and copper and excludes lead, zinc, molybdenum and tungsten values. Ag:Au is 50:1, Ag:Cu is 86:1, based on 5 year historic metal price trends of US$24/oz silver, US$1200/oz gold, US$3/lb copper. 100% metallurgical recovery is assumed. |
| 2. | Classified by EBA, A Tetra Tech Company and conforms to NI 43-101 and CIM definitions for resources. All numbers are rounded. Inferred Resources have been estimated from geological evidence and limited sampling and must be treated with a lower level of confidence than Measured and Indicated Resources. The reported Mineral Resource for each zone is based on the 30 gpt AgEQ cut-off and is highlighted in light blue. |
| 3. | Mineralization boundaries used in the interpretation of the geological model and resource estimate are based on a cut-off of 15 gpt AgEQ using the metal price ratios described above. Manto and Structure Resource blocks, and their associated volumes, are exclusive of Contact Zone blocks. |
Table 2: Inferred W-Mo Resource Estimation for the MMT, Santo Nino and Coloradito Deposits, Effective Date December 16, 2012
| Zone | Category 4 | | W03cut- | | | Rounded | | | SG | | | Mo (%) | | | WO3 (%) | | | Contained | | | Contained | |
| | | | off (%) | | | Tonnes | | | | | | | | | | | | W03(lbs) | | | Mo (lbs) | |
| | |
| | | | | 0.025 | | | | 60,508,000 | | | | 3.00 | | | | 0.0035 | | | | 0.053 | | | | 70,526,000 | | | | 4,232,000 | |
MMT 5 | | | | | | | | | | | | | | | | | | | | | | | | | | | | | |
| Contact Zone | Inferred | | | 0.05 | | | | 25,136,000 | | | | 3.00 | | | | 0.0039 | | | | 0.075 | | | | 41,438,000 | | | | 1,942,000 | |
| (W, Mo, Ag, Au, | | | | | | | | | | | | | | | | | | | | | | | | | | | | | |
| Cu) | | | | 0.095 | | | | 4,395,000 | | | | 3.00 | | | | 0.0023 | | | | 0.109 | | | | 10,587,000 | | | | 205,000 | |
| Santo Nino | | | | 0.025 | | | | 5,220,000 | | | | 3.00 | | | | 0.0077 | | | | 0.040 | | | | 4,591,000 | | | | 806,000 | |
Contact Zone 5 | Inferred | | | 0.050 | | | | 950,000 | | | | 3.00 | | | | 0.0132 | | | | 0.070 | | | | 1,456,000 | | | | 250,000 | |
| (W, Mo, Ag, Au, | | | | | | | | | | | | | | | | | | | | | | | | | | | | | |
| Cu) | | | | | | | | | | | | | | | | | | | | | | | | | | | | | |
| | | | | 0.095 | | | | 750 | | | | 3.00 | | | | 0.0115 | | | | 0.101 | | | | 2,000 | | | | 172 | |
| Coloradito | | | | 0.025 | | | | 31,907,000 | | | | 3.00 | | | | 0.0283 | | | | 0.062 | | | | 43,302,000 | | | | 18,045,000 | |
Contact Zone 5 | Inferred | | | 0.050 | | | | 18,486,000 | | | | 3.00 | | | | 0.0322 | | | | 0.079 | | | | 32,252,000 | | | | 11,921,000 | |
| (W, Mo, Ag, Au, | | | | | | | | | | | | | | | | | | | | | | | | | | | | | |
| Cu) | | | | | | | | | | | | | | | | | | | | | | | | | | | | | |
| | | | | 0.095 | | | | 4,159,000 | | | | 3.00 | | | | 0.0335 | | | | 0.112 | | | | 10,282,000 | | | | 2,784,000 | |
| | |
| | | | | 0.025 | | | | 97,635,000 | | | | | | | | 0.0118 | | | | 0.055 | | | | 118,419,000 | | | | 23,083,000 | |
| TOTAL | Inferred | | | 0.050 | | | | 44,573,000 | | | | | | | | 0.0158 | | | | 0.076 | | | | 75,147,000 | | | | 14,113,000 | |
| | | | | 0.095 | | | | 4,159,184 | | | | | | | | 0.0175 | | | | 0.111 | | | | 20,871,000 | | | | 2,989,000 | |
| 4. | Classified by EBA and conforms to NI 43-101 and CIM definitions for resources. All numbers are rounded. Inferred Resources have been estimated from geological evidence and limited sampling and must be treated with a lower level of confidence than Measured and Indicated Resources. The reported Mineral Resource for each zone is based on the 0.05% WO3cut-off and is highlighted in light blue. |
| 5. | Mineralization boundaries used in the interpretation of the geological model and resource estimate are based on a cut-off grade of 0.05% WO3. Contact Zone Resource blocks and associated volumes are exclusive of Manto and Structure blocks. |
2
| | LA JOYA, NI 43-101 TECHNICAL REPORT |
| | RELEASED: MARCH 27, 2013 |
The La Joya property is approximately 75 km directly southeast of the state capital city of Durango, in the State of Durango, Mexico and approximately 9 km east of the community of La Joya. The property can be accessed year round by road, commencing by a paved highway going south east from city of Durango to the city of Vincente Guerrero, a distance of approximately 80 km, then north along a paved secondary road to the community of La Joya a distance of approximately 10 km, and then by a network of farming and agricultural access dirt roads that span approximately 10 km east of the community of La Joya. There is currently no maintained infrastructure on the La Joya property. Rail and power are both located in close proximity to the property.
The property consists of 15 mineral concessions totalling 9,023 hectares. SilverCrest established option agreements with 2 local concession owners in 2010, which entitle SilverCrest to 100% ownership based on staged payments over a 36 month period followed by a lump sum payment and allocation of NSR entitlements. SilverCrest is registered as the primary holder of the remaining three mineral concessions staked in 2011. All concessions have been surveyed on the ground by a registered land surveyor at the time of location.
On January 20, 2011, SilverCrest signed an agreement with the civil co-operative for the community of La Joya for a three year lease on surface rights for a maximum of 3,935 ha with respect to exploration work.
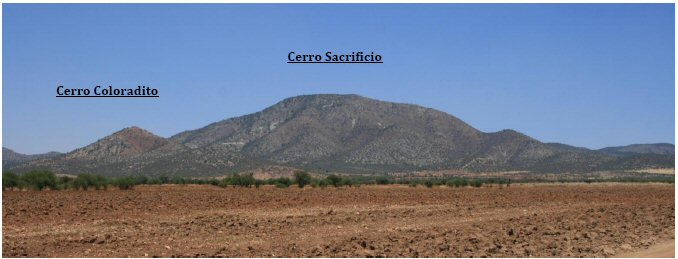
The La Joya and Santo Nino deposits lie within Cerro Sacrificio, one of two prominent topographic features on the property. The Coloradito deposit lies within Cerro Coloradito, a smaller secondary topographic feature located adjacent to the west of Cerro Sacrificio. These prominent features are the result of localized doming of sedimentary units from the emplacement of a mid-Tertiary granitic intrusion
1.2 Geology and Mineralization
The La Joya property is underlain by Cretaceous sedimentary rocks along the western margin of the Mexican Mesa Central, at the transition from the Sierra Madre Occidental, along the broadly defined San Luis-Tepehuanes fault system. The fault system is commonly referred to as the Mexican Silver Belt based on the country scale distribution of silver producing mines juxtaposed along the trend. The sedimentary package at La Joya consists of the Cuesta del Cura Limestone comprised of limestone with minor chert and siltstone, overlain by calcareous siltstone, mudstone and siliciclastic rocks of the younger Indidura Formation.
Multiple deformation events related to the Laramide orogeny during the late-Cretaceous to mid-Tertiary resulted in folding of the Cretaceous sedimentary rocks along northeast-southwest directed axes, followed by extensional basin and range style faulting generally oriented north-south throughout the mid to late Tertiary. The extension was accompanied by emplacement of intrusive stocks of various ages. These late Cretaceous and early to mid-Tertiary orogenic-related intrusions influenced both regional metamorphism as well as local metasomatic alteration within the Cretaceous sediments. The MMT of the La Joya deposit and peripheral Santo Nino is underlain by the Sacrificio quartz-feldspar phyric granite which is attributed to the mineralizing fluids responsible for skarn development and sulphide deposition within the limestone unit.
3
| | LA JOYA, NI 43-101 TECHNICAL REPORT |
| | RELEASED: MARCH 27, 2013 |
The La Joya deposits are carbonate hosted copper skarn deposits with associated silver and gold mineralization, similar in style to the Fortitude-Copper Canyon deposit in Nevada, USA, and to the adjacent Sabinas/San Martin mines in Zacatecas, Mexico. Calcsilicate skarn mineralization is found on the property as andradite garnet, pyroxene, actinolite and wollastonite and is distributed amongst three styles of mineralization recognized to exist on the property. Silver-Copper-Gold (Ag-Cu-Au) mineralization is concentrated within stratiform manto-style skarn controlled along sub-horizontal bedding. Silver-Copper- Gold, Lead-Zinc and Tungsten (Ag-Cu-Au, Pb-Zn, and W) mineralization is concentrated within structurally controlled stockwork and veining related skarn. Finally, tungsten mineralization is found within late stage retrograde skarn development along the intrusive contact. Sulphide mineralization generally transitions from chalcopyrite-dominant in proximal skarn to bornite-dominant in distal skarn. Late sub-vertical laminated quartz-calcite veins bearing freibergite and arsenopyrite cross-cut pre-existing skarn mineralization and, although related to magmatic fluids, are not considered to be related to the skarn mineralizing events. Trace amounts of oxide from meteoric weathering processes are present within the structural corridors at depth.
Bedrock is exposed on Cerro Sacrificio with few locations exhibiting minor organics as an overburden layer. Formation of caliche is a common calcium leachate overlying calcareous sediments and as an encasing matrix to alluvium fill along the lower slopes of Cerro Sacrificio outwards within the valleys. Alluvial overburden ranges in depth from 3 to 25 metre as documented in historic drilling to the north of the hill.
Cerro Coloradito occurs 1 kilometre to the west of Cerro Sacrificio and is the second prominent feature in the area. Cerro Coloradito has a surface footprint of approximately 500 x 500 metres and is centred on a Quartz Feldspar Porphyry intrusive stock with related quartz-rich breccia, possibly to the result of late stage intrusive fluids. A green garnet skarn forms a southerly located, but northerly open cuspate, mineralised zone around the intrusive. The skarn unit is hosted within the Cretaceous Indidura Formation bedded limestone and shale and most likely developed due to stock emplacement in the early to mid- Tertiary. The Coloradito deposit showing has been described as a low sulphidation style epithermal gold- silver deposit, related to mid to late Tertiary faulting, in addition to the skarn component that has anomalous tungsten +/- molybdenum. A near vertical north-south Quartz Porphyry dyke cuts the skarn and sidles the intrusive unit and is thought to be a late stage feature. Several artisanal and historic workings are located around Coloradito. It is suggested that the mineralization at Coloradito is younger than the MMT and Santo Nino.
The Santo Nino deposit is located on the eastern flank of Cerro Sacrificio. No distinct topographical features are noted for Santo Nino. The surface footprint is approximately 400 x 400 metres. A NNW-SSE near vertical lense of skarn with visible bornite and chalcopyrite mineralization was the locus of the most recent drilling program. Similarly to the MMT Silver-Copper-Gold (Ag-Cu-Au) mineralization is concentrated within stratiform manto-style skarn controlled along sub-horizontal bedding. Silver-Copper-Gold, Lead- Zinc and Tungsten (Ag-Cu-Au, Pb-Zn, and W) mineralization is concentrated within structurally controlled stockwork and veining related skarn. Finally, tungsten mineralization is found within late stage retrograde skarn development along the intrusive contact. The Contact Zone is not as thick at Santo Nino compared to the MMT. Sulphide mineralization generally transitions from chalcopyrite-dominant in proximal skarn to bornite-dominant in distal skarn. Copper mineralization is more dominant at Santo Nino compared to the MMT.
4
| | LA JOYA, NI 43-101 TECHNICAL REPORT |
| | RELEASED: MARCH 27, 2013 |
1.3 Drilling and Exploration
Evidence of historic pit and small underground mining operations within Cerro Sacrificio is seen in numerous small adits and excavations along the hillside. Today, the adits remain open and are accessible for sampling and identifying structures related to mineralization on the property. Exploitation from these small historic operations is considered to be volumetrically insignificant in respect to the current resource estimate.
Recent exploration activities began on the property in 1977 when Minas SanLuis (Luismin) entered into option agreements with local mineral concession holders and staked additional concessions. From 1977 to 1997, Luismin completed extensive drilling, mapping and geophysical surveying on the property. In total, 37 diamond and RC drill holes (9,767.34 metres) were completed across the property during this period, targeting silver-copper-gold skarn and tungsten mineralization. Between 1998 and 2001, Boliden Limited entered into a joint venture agreement with Luismin and continued to drill 15 more diamond drill holes (4,095.41 metres) targeting skarn and epithermal mineralization. Luismin did not complete the terms of the option agreement and withdrew from their interest in 2001. Mineral concessions staked by Luismin (Goldcorp) that are adjacent to the SilverCrest concessions were maintained and are now held by Goldcorp through acquisition of the Luismin assets.
In 2006, Solid Resources Ltd. completed four diamond drill holes (1,856.34 metres) to test for deep seated copper-molybdenum porphyry style mineralization in the center of the Sacrificio intrusion. Solid Resources did not consider the results to indicate significant evidence for a porphyry style deposit at that time.
SilverCrest commenced exploration on the property in June of 2010 at which time property scale mapping and chip sampling established targets for the Phase I drilling campaign. A total of 27 diamond drill holes (totalling 5,753.7 metres) were completed during the campaign between October, 2010, and July, 2011. The Phase I drill holes have been logged, sampled and analyzed a total of 2,303 core samples.
Independent validation of the SilverCrest and historic sampling was completed by EBA QP, James Barr, over 3 site visits between November 2010 and October 2011. Eight historic drill holes (2,574.35 metres) were validated in addition to the 27 SilverCrest holes (5,753.7 metres) and 177 SilverCrest surface samples, totalling 3,764 validated assay samples, for inclusion into the Phase I mineral resource estimate.
Phase II independent validation of the SilverCrest and historic sampling was completed by EBA QP, James Barr over an additional 3 site visits between November 2011 to November 2012. Phase II drilling consisted of 78 SilverCrest holes (25,812.65 metres) and 542 surface samples (not used in the resource). This program consisted of infill drilling of the Phase I resource area and drilling to extended mineralization in all directions of the MMT.
1.4 Mineral Processing and Metallurgical Testing
The initial metallurgical test work completed in 2011 suggested that the MMT may be amenable to conventional flotation processes with production of copper concentrates with gold and silver credits. Subsequent metallurgical test work in 2012 and 2103 at ALS Metallurgy in Kamloops, BC, Canada support the initial testwork from 2011. The ALS test work was still in progress during the preparation of this report; however the current available test results are reported herein that covers from head assay, mineralogy, harness testing, gravity, batch rougher and flotation, to batch cleaner flotation tests.
5
| | LA JOYA, NI 43-101 TECHNICAL REPORT |
| | RELEASED: MARCH 27, 2013 |
Preliminary metal recoveries for near-surface (priority) Manto and Structure zones range from 81.4 to 87.7% Cu, 74.9 to 84.3% Ag, and 18.2 to 56.6% Au depending on mineralization style and testwork conditions. High copper grade bulk concentrates (the 3rd cleaner Cu/Ag/Au concentrate, >30% Cu) were obtained from batch flotation tests after adding cyanide at cleaner stages as compared with baseline test results (Table 3 and Table 4). Specifically, Manto bulk concentrate grades up to 40% Cu, 4,780 gpt Ag, and 13.1 gpt Au and Structure concentrate has approximately 38% Cu, 4,760 gpt Ag, and 9.37 gpt Au. The high grade copper results in the concentrates reflect the bornite-rich nature of the MMT mineralization. The concentrate produced from Contact Zone composite sample grades at 28.9% Cu.
Recoveries of molybdenum and tungsten from Contact zone composite were considered in the ALS test work. The molybdenum level in the 3rd cleaner concentrate ranges from 2 to 3% at a recovery from 51.4 to 65.4%. That suggests a separate molybdenum concentrate may be produced. The assessment of tungsten recoveries by gravity methods produced marginal recoveries of 7% W. Further tests on tungsten and molybdenum are recommended for next phase.
Table 3: Batch Cleaner Flotation Test Results- Baseline
| | | | | | Head | | | | | | | | | | | | | | | 3rd Cleaner Concentrate | | | | | | | | | | |
| Composite | | | | | Assay (%, gpt) | | | | | | | | | | | | Assay (%, gpt) | | | | | | | | | Recovery (%) | | | | |
| | | Cu | | | Ag | | | Au | | | AgEQ* | | | Mo | | | Cu | | | Ag | | | Au | | | AgEQ* | | | Mo | | | Cu | | | Ag | | | Au | | | Mo | |
| Manto | | | 0.34 | | | | 45 | | | | 0.15 | | | | 81.74 | | | | 0.004 | | | | 36.3 | | | | 4,700 | | | | 3.40 | | | | 7991.8 | | | | 0.27 | | | | 86.7 | | | | 84.3 | | | | 18.2 | | | | 59.6 | |
| Structure | | | 0.46 | | | | 58 | | | | 0.25 | | | | 110.06 | | | | 0.003 | | | | 34.3 | | | | 3,980 | | | | 9.45 | | | | 7402.3 | | | | 0.17 | | | | 82.7 | | | | 76.7 | | | | 42.4 | | | | 59.7 | |
| Contact** | | | 0.07 | | | | 4 | | | | 0.10 | | | | 15.02 | | | | 0.011 | | | | 16.7 | | | | 670 | | | | 17.40 | | | | 2976.2 | | | | 2.02 | | | | 83.6 | | | | 63.7 | | | | 66.4 | | | | 65.4 | |
Note: all the metal grades are based on weighted average values
| · | Silver equivalency includes silver, gold and copper and excludes lead, zinc, molybdenum and tungsten values. Ag:Au is 50:1, Ag:Cu is 86:1, based on 5 year historic metal price trends of US$24/oz silver, US$1200/oz gold, US$3/lb copper. 100% metallurgical recovery is assumed until testwork is finalized |
| · | Contact composite was collected to target tungsten and molybdenum recoveries |
Table 4: Batch Cleaner Flotation Test Results- with Cyanide
| | | Head | | | | | 3rd Cleaner Concentrate | | | |
| Composite | | Assay (%, gpt) | | | Assay (%, gpt) | | | Recovery (%) | |
| | Cu | Ag | Au | AgEQ* | Mo | Cu | Ag | Au | AgEQ* | Mo | Cu | Ag | Au | Mo |
| Manto | 0.34 | 44 | 0.17 | 81.74 | 0.004 | 40.1 | 4,780 | 13.1 | 8883.6 | 0.26 | 87.7 | 80.7 | 56.6 | 48 |
| Structure | 0.44 | 60 | 0.25 | 110.34 | 0.003 | 38.1 | 4,760 | 9.37 | 8505.1 | 0.18 | 81.4 | 74.9 | 35 | 53.1 |
| Contact** | 0.07 | 4 | 0.07 | 13.52 | 0.012 | 28.9 | 818 | 18.8 | 4243.4 | 3.05 | 81.4 | 45.9 | 57 | 51.4 |
Note: all the metal grades are based on weighted average values
| · | Silver equivalency includes silver, gold and copper and excludes lead, zinc, molybdenum and tungsten values. Ag:Au is 50:1, Ag:Cu is 86:1, based on 5 year historic metal price trends of US$24/oz silver, US$1200/oz gold, US$3/lb copper. 100% metallurgical recovery is assumed until testwork is finalized. |
| · | Contact composite was collected to target tungsten and molybdenum recoveries |
The bulk copper concentrates produced from Manto and Structure composites have indicated the presences of penalty elements such as of As, Sb and Bi. Adding cyanide at cleaner flotation stages can reduce the arsenic content to the market limits without sacrificing copper, silver and gold.. The Contact bulk flotation concentrate has much lower concentrations of As, Sb, and Bi that may be accepted by the market.
6
| | LA JOYA, NI 43-101 TECHNICAL REPORT |
| | RELEASED: MARCH 27, 2013 |
Gold appears to be amenable to gravity as shown in test work on the Contact Zone with a 24% Au recovery. Further testwork is recommended for possible additional increase in gold recovery. Tungsten and tin recoveries from gravity separation appear low.
Continued metallurgical testwork should specifically investigate the nature and distribution of gold speciation and distribution. Further work should include investigation on tungsten deportment in Contact Zone samples, and to conduct gravity tests on both Manto and Structure samples to evaluate potential gold and tin recoveries. It is also recommended to conduct amenability flotation tests on the blended composites, and to carry out variability flotation tests on representative samples from the north and south areas of the MMT. Furthermore, test work on leaching of cleaner tails is recommended for possible increase in Au an Ag recoveries.
1.5 Mineral Resource Estimation
A mineral resource estimate for the La Joya deposit has been prepared by EBA in accordance with National Instrument 43-101 Standards of Disclosure and has incorporated terms as defined by the Canadian Institute of Mining, Metallurgy and Petroleum Standards on Mineral Resources and Reserves: Definitions and Guidelines.
The estimate is based on Phase I verified sampling from 27 recent SilverCrest drill holes and eight validated historic Luismin holes (totalling 8,328.05 metres), for a grand total of 3,764 assayed samples, collected between 1998 and 2011. Phase II drilling incorporated an additional 78 drill holes (25,812.65 metres) and a further 10 historic validated partial drill holes bringing the total historic drill holes to 5,907.26 metres. For Phase II, three areas were focused on for resource estimation in three geographically distinct but adjoining areas of MMT, Santo Nino, and Coloradito. The analytical data were used as the basis for geological interpretation and construction of mineralized solids created as triangulations using Gemcom GEMS software (GEMS). The analytical data was interpolated into a percent block model using the inverse distance squared (ID2) interpolation method and was constrained by mineralized solids segmented into three sets determined by mineralization style.
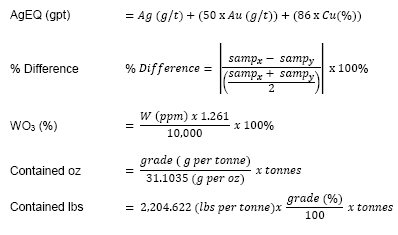
The MMT and Santo Nino deposits are considered to be a polymetallic Ag-Cu-Au-W-Mo deposits with metal distributions for W-Mo as part of, or immediately adjacent to, the Ag-Cu-Au resources. Ag-Cu-Au data is reported as a silver equivalent value (AgEQ) which is based on per tonne value of the metals using five-year historical price trends summarized in Table 5. AgEQ is calculated as Ag(gpt)+50*Au(gpt)+86*Cu(%). Three individual mineral resource estimates are presented below for Ag-Cu-Au concentrations, Pb-Zn concentrations and W concentrations, respectively. Molybdenum concentrations have not been considered as part of this resource estimation.
7
| | LA JOYA, NI 43-101 TECHNICAL REPORT |
| | RELEASED: MARCH 27, 2013 |
Table 5: 5-Year Metal Price Trends and AgEQ Calculation for Silver, Copper and Gold
| Metal | 5-year Trend Metal Price | Price/tonne ratio to Ag |
| Ag | $24/oz (troy) | 1:1 |
| Cu | $3/lb ($6,615/t) | 86:1 |
| Au | $1,200/oz(troy) | 50:1 |
| |
| AgEQ | =Ag(gpt) + 86*Cu% + 50*Au(gpt) |
Analytical data from drill sampling on the property that was considered valid for resource estimation was composited to two metre lengths before the interpretation and construction of the mineralized wireframes. These composites were used as the explicit analytical data for the resource estimate. A value of 15 gpt AgEQ was used as an initial grade threshold for cross-sectional interpretation of mineralized wireframes defining continuous mineralization on the property. Three sets of mineralized solids were constructed using GEMS from these wireframes representing Manto, Structurally controlled stockwork and veining, or Contact Zone- skarn styles of mineralization. Twenty-nine (MMT) six (Santo Nino) and two (Coloradito) mineralized solids were used to reduce the two metre composite data set and to constrain interpolation within the block model. Block model interpolation methods were designed to control grade distribution within each mineralization style.
Anomalous high grade values from the two metre composite data set were capped at 550 gpt silver, 5.5 gpt Au and 6 % copper based on visual inspection of histogram and log-histogram population distribution.
A representative average value for specific gravity was determined to be 3.0 based on laboratory analysis of 1,279 drill core samples. This value was applied to all materials that were included in the Mineral Resource.
All mineral resource estimates in this report have been classified as Inferred based on the CIM Definition Standards for Mineral Resources and Mineral Reserves. Analytical data available from exploration on the property to date is sufficient to allow a reasonable geological interpretation and assumption of grade continuity, however, the geological understanding of the property is considered to be in early stages for the project.
The Resource Estimate for silver, copper, gold and silver equivalent concentrations has been reported based on a silver equivalent cut-off value as summarized in (Table 5). A value of 30gpt AgEQ was used as a minimum grade cut-off for reporting purposes.
Exploration potential on the La Joya property is considered excellent based on previous and current work. The defined area of alteration with subsequent potential mineralization is estimated at 2.5 km by 2.5 km. This area encompasses three defined targets, each has potential for extension and infill drilling;
| 1. | La Joya Main Mineralized Trend with Ag-Cu-Au-W- Mo +/- Pb-Zn mineralization; |
| 2. | Coloradito with Mo-W-Ag-Au-Cu mineralization; and, |
8
| | LA JOYA, NI 43-101 TECHNICAL REPORT |
| | RELEASED: MARCH 27, 2013 |
3. Santa Nino with Cu-Ag-Au-W-Mo mineralization.
The second phase of the exploration and delineation program conducted by SilverCrest for the La Joya property (including Santo Nino) has increased the Inferred Resource significantly.
The recommended Phase III program aims to further define the total extent of mineralization on the property, gain further understanding on the extent of mineralization and further define areas of higher grades to increase overall confidence in the established deposit. SilverCrest currently has ongoing metallurgical work scheduled to be completed in 2013. Estimated costs for this recommended program totals $3,030,000 and is outlined in Table 6.
Table 6: Recommended Phase III Work and Estimated Costs for the La Joya Property
| Phase III | | | | | | |
| | Description | Units | Cost/Unit ($CAN) | | Cost ($CAN) | |
| Work Type | | | | | | |
| | Regional mapping to the East of | | | | | |
| Geological | Cerro Sacrificio to Santo Nino and | 30 days | $1,000/day | | $ | 30,000 | |
| Mapping | beyond and to the south of Cerro | | | | | | |
| | Sacrificio | | | | | | |
| | Drilling within currently defined | | | | | | |
| | block model to increase confidence | | | | | | |
| Infill Drilling | | 10,000 metres | $200/metre | | $ | 2,000,000 | |
| | in mineral and grade distribution | | | | | | |
| | around areas of high grade | | | | | | |
| Expansion | Drilling beyond the limit of the | | | | | | |
| Drilling & | currently defined block model to | 5,000 metres | $200/metre | | $ | 1,000,000 | |
| Metallurgical | test for potential deposit expansion | | | | | | |
| Work | along established mineral trends | | | | | | |
| | | | TOTAL | | $ | 3,030,000 | |
9
| | LA JOYA, NI 43-101 TECHNICAL REPORT |
| | RELEASED: MARCH 27, 2013 |
2.0 INTRODUCTION AND TERMS OF REFERENCE
EBA Engineering Consultants Ltd. operating as EBA, A Tetra Tech Company (EBA) has prepared this Technical Report for SilverCrest Mines Inc. (SilverCrest) of on the La Joya property, located in south- eastern Durango, Mexico. SilverCrest de Mexico S.A. de C.V. (SilverCrest) is a legal operating entity for SilverCrest in Mexico.
The purpose of this report is to document the La Joya property holdings and to support an update estimate of Mineral Resources based on information available to EBA from the Phase II exploration campaign and the use of historical data for the property. This Technical Report conforms to National Instrument 43-101 Standards of Disclosure for Mineral Projects (NI 43-101) and incorporates the Canadian Institute for Mining, Metallurgy and Petroleum Definition Standards for Mineral Resources and Mineral Reserves (CIM Definition Standards).
2.1 Report Authors and EBA Quality Control
This report has been prepared by EBA and is co-authored by James Barr, P.Geo, independent consultant with EBA and Ting Lu, P.Eng, independent consultant of Tetra Tech WEI. EBA Peer Review process has been completed by Cameron Bartsch, P.Geo. Data compilation and verification, geological solid modelling and report preparation has been completed by Darryn Hitchcock of EBA.
The information, conclusions, opinions, and estimates contained herein are based on:
| · | Information available to the authors at the time of preparation of this report; |
| · | Assumptions, conditions, and qualifications as set forth in this report; and |
| · | Data, reports, and other information supplied by SilverCrest and other third party sources. |
Several site visits have been completed by James Barr to the La Joya property: November 23rd-26th, 2010, Feb 4th-6th, 2011, May 6th-7th & 13th-17th, 2011, June 19th-20th, 2011, Sept 25th-Oct 4th, 2011, May 8th, 2012, and Oct 18th, 2012. The purpose the site visits was to conduct QA/QC of drilling practices, review and conduct re-logging of drill core; and the collection of verification samples.
Ting Lu visited the site from May 14th to 17th, 2012, at which time she reviewed geological material, site layout and regional infrastructure.
3.0 RELIANCE ON OTHER EXPERTS
Ownership information has been provided by SilverCrest. SilverCrest has obtained a Title Opinion completed by Urias Romero Y Asociados, S.C. of Mazatlan, Sinaloa, Mexico that confirms no outstanding agreements or liens exist on the property and that SilverCrest holds legal rights to the claimed areas. EBA has not independently confirmed the legality of this information and relies on the Title Opinion completed in 2012 to confirm these legal rights.
10
| | LA JOYA, NI 43-101 TECHNICAL REPORT |
| | RELEASED: MARCH 27, 2013 |
4.0 PROPERTY DESCRIPTION AND LOCATION
4.1 Location
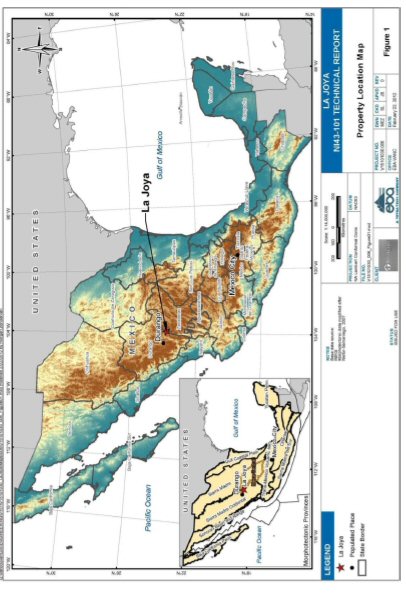
The La Joya property is approximately 75 km southeast of the state capital city of Durango, state of Durango, Mexico near the intersection of 23º 52' north latitude, and 103º 55' west longitude or 609,700E and 2,640,100 N (UTM WGS 84, zone 13Q) (Figure 1). The property elevation ranges from 2,000 to 2,600 metres above sea level. The community of La Joya has a population of approximately 1,000 people and is located 9 km southwest of the La Joya property. Topographic information for the area is covered by the
Instituto Nacional de Geografía y Estadística de México (INEGI) "La Joya" map; sheet F13B14, at a scale of 1:50,000.
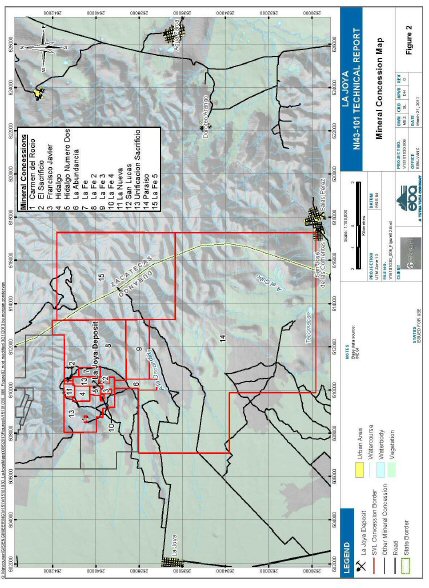
The property consists of 15 concessions with a total nominal area of 8,473.6 hectares (Table 7). The La Joya concessions are contiguous within the area and are registered with the Mexico Mines Registry in the city of Durango and Mexico City in the name of Señior Sergio Gabriel Olvera Alevedo and Family (9 concessions), Señior Pedro Vargas (3 concessions), and SilverCrest de Mexico S.A de C.V. (3 concessions). SilverCrest has option agreements to acquire the concessions held by Sr. Olvera and Sr. Vargas as described below. Subsequent to negotiating these option agreements, SilverCrest staked and filed for ownership of the La Abundancia and Parasio concessions at the southern extent of the existing 12 concessions. All concessions were surveyed on the ground by a registered land surveyor at the time of location (Figure 2). Mineral concessions contiguous to the west and north of the La Joya property are currently owned by Goldcorp through acquisition of Luismin assets.
11
| | LA JOYA, NI 43-101 TECHNICAL REPORT |
| | RELEASED: MARCH 27, 2013 |
Under the terms of an agreement dated June 21, 2010, SilverCrest has the right to acquire a 100% interest in the La Joya mineral concessions (La Joya West) owned by Sr. Sergio Gabriel Olvera Alevedo and Family (Olvera) by making staged payments (all amounts in $USD) of $2,680,000 over a period of three years, beginning with a payment of $20,000 on signing (completed), followed by $20,000 four months after signing (completed), $60,000 six months after the second payment (completed), and $80,000 twelve months after the second payment (completed). Thirty six months after the first payment (June 2013) a single payment of $2,500,000 is to be paid to receive 100% ownership of the Olvera concessions. SilverCrest has the option to pay 50% or less of the final payment in company shares at the market price and approval of the BC Securities Commission and Toronto Stock Exchange. At any point during the term of this agreement SilverCrest has the option to purchase the concessions for the full price of the option agreement. A 2% NSR from commercial production would be payable to Olvera upon fulfillment of this agreement.
12
| | LA JOYA, NI 43-101 TECHNICAL REPORT |
| | RELEASED: MARCH 27, 2013 |
Figure 1: Property scale location map
13
| | LA JOYA, NI 43-101 TECHNICAL REPORT |
| | RELEASED: MARCH 27, 2013 |
Table 7: SilverCrest Mineral Concessions for the La Joya Property
| | | | | | | Original | | | | | | | | | | | | |
| Map | | | Concession | | | | | | Recent | | | Expiry | | Concession | | | | |
| | | | | | | Staking | | | | | | | | | Owner | | Size (ha) | |
| Index | | | number | | | | | | Renewal | | | Date | | name | | | | |
| | | | | | | Date | | | | | | | | | | | | |
| | | | | | | | | | | | | | | CARMEN DEL | SERGIO GABRIEL OLVERA | | | |
| | 1 | | | | 126712 | | | | 1954 | | | Nov 2010 | | | | 2060 | | | | | | 3.03 | |
| | | | | | | | | | | | | | | | | | | ROCÍO | ACEVEDO | | | | |
| | | | | | | | | | | | | | | | | | | | SERGIO GABRIEL OLVERA | | | | |
| | 2 | | | | 25/37726 | | | | 2011 | | | | n/a | | | | 2061 | | EL SACRIFICIO | | | | 5.92 | |
| | | | | | | | | | | | | | | | | | | | | ACEVEDO | | | | |
| | | | | | | | | | | | | | | | | | | | FRANCISCO | SERGIO GABRIEL OLVERA | | | | |
| | 3 | | | | 121114 | | | | 1954 | | | Nov 2010 | | | | 2060 | | | | | | 10 | |
| | | | | | | | | | | | | | | | | | | | JAVIER | ACEVEDO | | | | |
| | | | | | | | | | | | | | | | | | | | | SERGIO GABRIEL OLVERA | | | | |
| | 4 | | | | 163510 | | | | 1954 | | | Nov 2010 | | | | 2060 | | HIDALGO | | | | 51 | |
| | | | | | | | | | | | | | | | | | | | | ACEVEDO | | | | |
| | | | | | | | | | | | | | | | | | | | HIDALGO | SERGIO GABRIEL OLVERA | | | | |
| | 5 | | | | 122149 | | | | 1954 | | | Nov 2010 | | | | 2060 | | | | | | 42 | |
| | | | | | | | | | | | | | | | | | | | NÚMERO DOS | ACEVEDO | | | | |
| | | | | | | | | | | | | | | | | | | | | SILVERCREST DE MEXICO | | | | |
| | 6 | | | | 25/37722 | | | | 2011 | | | | n/a | | | | 2061 | | LA ABUNDANCIA | | | | 86.57 | |
| | | | | | | | | | | | | | | | | | | | | S.A. DE C.V. | | | | |
| | 7 | | | | 231202 | | | | 2008 | | | | n/a | | | | 2058 | | LA FE | PEDRO VARGAS AGUIRRE | | | 42.87 | |
| | 8 | | | | 232199 | | | | 2008 | | | | n/a | | | | 2058 | | LA FE 2 | PEDRO VARGAS AGUIRRE | | | 760.79 | |
| | 9 | | | | 237706 | | | | 2011 | | | | n/a | | | | 2061 | | LA FE 3 | PEDRO VARGAS AGUIRRE | | | 308 | |
| | | | | | | | | | | | | | | | | | | | | SERGIO GABRIEL OLVERA | | | | |
| | 10 | | | | 25/37304 | | | | 2011 | | | | n/a | | | | 2061 | | LA FE 4 | | | | 2.79 | |
| | | | | | | | | | | | | | | | | | | | | ACEVEDO | | | | |
| | | | | | | | | | | | | | | | | | | | | SERGIO GABRIEL OLVERA | | | | |
| | 11 | | | | 119602 | | | | 1953 | | | Nov 2010 | | | | 2060 | | LA NUEVA | | | | 29.48 | |
| | | | | | | | | | | | | | | | | | | | | ACEVEDO | | | | |
| | | | | | | | | | | | | | | | | | | | | SERGIO GABRIEL OLVERA | | | | |
| | 12 | | | | 130550 | | | | 1957 | | | Nov 2010 | | | | 2060 | | SAN LUCAS | | | | 15.17 | |
| | | | | | | | | | | | | | | | | | | | | ACEVEDO | | | | |
| | | | | | | | | | | | | | | | | | | | UNIFICACIÓN | SERGIO GABRIEL OLVERA | | | | |
| | 13 | | | | 183039 | | | | 1988 | | | Nov 2010 | | | | 2060 | | | | | | 370.97 | |
| | | | | | | | | | | | | | | | | | | | SACRIFICIO | ACEVEDO | | | | |
| | 14 | | | | 25/37740 | | | | 2011 | | | | n/a | | | | 2061 | | PARAISO | SILVERCREST DE MEXICO | | | 6,745 | |
| | | | | | | | | | | | | | | | | | | | | S.A. DE C.V. | | | | |
| | | | | | | | | | | | | | | | | | | | | SILVERCREST DE MEXICO | | | | |
| SN 15 | | | | 025/38116 | | | | 2012 | | | | n/a | | | | 2062 | | LA FE 5 | | | | 594.4 | |
| | | | | | | | | | | | | | | | | | | | | S.A. DE C.V. | | | | |
| | | | | | | | | | | | | | | | | | | | | TOTAL | | | 9023 | |
14
| | LA JOYA, NI 43-101 TECHNICAL REPORT |
| | RELEASED: MARCH 27, 2013 |
Figure 2: Mineral concession map
15
| | LA JOYA, NI 43-101 TECHNICAL REPORT |
| | RELEASED: MARCH 27, 2013 |
Under the terms of an agreement dated Dec 7, 2010, SilverCrest has the right to acquire a 100% interest in the La Joya mineral concessions (La Joya East) owned by Sr. Pedro Vargas by making staged payments (all amounts in $USD) of $1,500,000 over a period of three years, beginning with a payment of $25,000, 45 days after signing (completed), followed by payments of $20,000 six months after the first payment (completed), $50,000 due twelve months after the first payment (completed), $60,000 to be paid eighteen months after the first payment (completed), $70,000 to be paid twenty four months after the first payment (paid), and $100,000 to be paid thirty months after the first payment. No later than thirty six months after the first payment a lump sum of $1,175,000 is to be paid in cash or up to 50% in shares at the discretion of SilverCrest. At any point during the term of this agreement SilverCrest has the option to purchase the concessions for the full price of the option agreement. A 2% NSR from commercial production would be payable to the to the property owners upon fulfillment of the agreement.
On January 20, 2011, SilverCrest signed an agreement with the civil co-operative for the community of La Joya for a three-year lease on surface rights for a maximum of 3,935 ha with respect to exploration work. Lease payments are dependent (at SilverCrest's discretion) on the number of hectares required for a given year. The annual cost per year will be approximately MxnPesos $1,000 to $10,000, payable to the community, dependent on the number of hectares required. A payment of approximately MxnPesos $1,000 has been made to initiate the agreement and cover the first year of the lease. The second payment is due Q2, 2103.
4.4 Mexican Mine Permitting and Regulations
Mining Law (enacted by congress on June 26, 1992) is jurisdiction of the Federal body as declared in Article 27 of the Mexican Constitution, adopted in 1917. The Mining Law deems essentially all minerals to be owned by the Mexican nation.
The right to explore for or exploit minerals is given to private parties, through mining concessions issued by the Federal executive branch. Amendments to the Mining Law in April 2005, and put into effect in January 2006, provide for all mining concessions to be valid for a period of 50 years and may be extended for an equal period given notification 5 years prior to expiration and no other cause for cancellation of the concession is evident. A concession in Mexico does not confer any ownership of surface rights. However, use of surface rights for exploration and production can be obtained under the terms of various acts and regulations if the concession is on government land.
Concession taxes payable to the Secretaria de Economia, division the Mexican Government, based on the surface area of the concession, are due in January and July of each year at an annual cost of approximately USD$11,000 for the current La Joya property configuration. All tax payments have been paid by SilverCrest to date.
Work permits required for the exploration work have been obtained for Phase I and II which are now complete. Phase III drilling permit is under review and awaits issuance. The Mexican government issued an environmental permit (Environmental Assessment) for all proposed exploration work in December, 2010. Phase I inspection of the site was conducted in May 2011.
No water permits are required for exploration work since the water is purchased locally from private active wells.
16
| | LA JOYA, NI 43-101 TECHNICAL REPORT |
| | RELEASED: MARCH 27, 2013 |
5.0 ACCESSIBILITY, CLIMATE, LOCAL RESOURCES, INFRASTRUCTURE AND PHYSIOGRAPHY
5.1 Accessibility
The La Joya property can be accessed year round by road, commencing by a paved highway going southeast from city of Durango to the city of Vicente Guerrero, a distance of approximately 80 km, then north along a paved secondary road to the community of La Joya, a distance of approximately 10 km, and then by a network of farming and agricultural access dirt roads that span approximately 10 km east of the community of La Joya. The city of Durango has an international airport with multiple daily flights between Mexico and the USA.
Regional climate is warm and semi-arid with rain generally occurring between July and September. The average rainfall is estimated at 590 mm. The average temperature is approximately 22°C, with the lowest monthly average of 19.7°C occurring in February, and highest monthly average of 30.5° C occurring in May. Due to the high elevation of the region, freezing temperatures in the region have been recorded. Periods of freezing can last from 1 to 20 days, typically during the month of February (regional information extracted from INEGI, Instituto Nacional de Geografía y Estadística de México).
Water for drilling is currently being transported to the property and stored in a lined sump from two active wells, the first located at 608333 E, 2639173 N elev. 1,948 metres which is reported by local ranchers to yield approximately 20 litres/sec, and the second located at 604531 E, 2634627 N which is reported to yield approximately 15 litres/sec. Water for a production facility could come from a local groundwater source or a pre-constructed reservoir. The characteristics of the well, water supply and water quality have not been verified by EBA.
Electrical power is readily available from nearby sources that currently supply municipalities and agriculture. Regional reliable grid power could be considered if a mining operation is justifiable. The main high voltage electrical transmission lines are located approximately 15 km from the property.
Sufficient area is available for a processing plant, waste dumps and tailings disposal on the property. Surface rights are held by a local civil co-operative and need to be obtained if mining facilities are required as described in Section 4.3. No permanent structures occupy the property.
The town of Vicente Guerrero is the closest urban area of any size (pop. est. 15,000), and is about 20 km southwest of the La Joya property by paved and unpaved road from the property. Many services and supplies are available in Vicente Guerrero, but it may be necessary to go to Durango for heavier machine shop, fabrication, and engineering services. While Vicente Guerrero is more of an agricultural community, Durango is considered to be an exploration and mining centre within a prolific mining state.
Northern Central Mexico has significant precious and base metal mines and there are a significant number of people with experience in mining and processing of those commodities. Many of the trades and skills learned there would be transferable to a new operation. The San Martin, Sabinas and La Parrilla mines are the major mines operating within 20 kilometres of the La Joya property (Figure 3).
17
| | LA JOYA, NI 43-101 TECHNICAL REPORT |
| | RELEASED: MARCH 27, 2013 |
Figure 3: Regional map showing mineral concession, local infrastructure, and proximal mines
18
| | LA JOYA, NI 43-101 TECHNICAL REPORT |
| | RELEASED: MARCH 27, 2013 |
5.4 Infrastructure
Currently, infrastructure on the La Joya property is limited to access roads, historical open cut and underground workings and an abandoned low-voltage power transmission line which crosses the property between Cerro Sacrificio and Cerro Coloradito.
Several drifts to accommodate underground mining were excavated during the early 20th century along with several small hillside excavations (<100m3 each). There is very little information that has been recorded from these exploitation activities, however, the underground workings do not appear to be extensive. They are all accessible with very few signs of rock failure or collapse.
Local ranchers have installed small water catchments and pipe diversions to supply livestock and agriculture with water from local run-off. On the west side of the property, a well exists that supplies water for local agriculture irrigation. The well is reported to be artesian with temperatures in excess of 30°C. The characteristics of the well, water supply and water quality are not known to EBA at this time.
SilverCrest rents and maintains a house, core processing facility and separate core storage facility within the town of La Joya. The house accommodates SilverCrest personnel and sub-contractors and is used as the company's exploration office for the area. Samples collected from surface sampling are securely stored within this building. Drill core is delivered to the core storage facility adjacent to the house where all logging and sampling of the core is completed. Samples collected from drill core are securely stored within the fenced and locked facility. EBA considers both facilities to be secure.
An active railway is located west of the community of La Joya, which connects the area to cities and ports in central and southern Mexico (Figure 3).
The landscape surrounding the La Joya property is controlled predominantly by large scale north-south directed horst and graben geological features. The grabens have been filled with alluvium eroded from the horst blocks to form relatively flat-lying valleys. The community of La Joya is situated within a valley that is roughly 20 km wide and that is typically cultivated for agriculture or livestock.
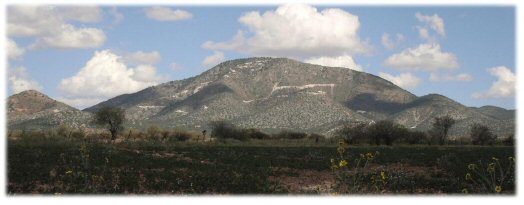
Two prominent topographic features exist on the northern portion of the La Joya property, located on the uplifted horst block along with numerous rolling hills of exposed and incised bedrock features. Cerro Coloradito is the smaller of the two with and approximate vertical rise of 400 metres and is located to the west of and Cerro Sacrificio. Cerro Sacrificio has approximately 600 metres of vertical rise and is the host to the La Joya deposit Photo 1.
19
| | LA JOYA, NI 43-101 TECHNICAL REPORT |
| | RELEASED: MARCH 27, 2013 |
Photo 1: Physiography of La Joya region (photo taken Nov 2010)
Bedrock is exposed on Cerro Sacrificio with few locations exhibiting minor organics as an overburden layer. Formation of caliche is a common calcium leachate overlying calcareous sediments, and encasing alluvium fill along the lower slopes of Cerro Sacrificio outwards within the valleys. Alluvium overburden ranges in depth from 3 to 25 metres as documented in historic drilling to the north of the cerro. No significant overburden was documented in recent SilverCrest drilling.
Water drainage from the elevated horst features flows towards the valley, where locally, the water gradient is to the north in the Arroyo Suchil and ultimately south-west through the Sierra Madre Occidental towards the Pacific coast.
Early records exist of exploration and mining by Spanish explorers in the nearby Real de San Martin district starting from 1548. Continued development is seen in the region at other mines from this era, such as Fresnillo and La Colorada. By inference, it can be expected that similar historical exploration efforts were directed towards the area surrounding Cerro Sacrificio on the La Joya property as part of regional initiatives. No detailed records of the discovery or early Spanish exploitation of the property were available to EBA.
Evidence of historic pit and small underground mining operations within Cerro Sacrificio is seen by numerous small adits and excavations along the hillside. Today, the adits remain open and are accessible for sampling and identifying structures related to mineralization on the property. At least two periods of small scale artesian mining are thought to have occurred on the La Joya property dating back to the early 20th century prior to recent exploration initiatives. The first period occurred for roughly 50 years prior to the 1960's (Burkhardt, 2006). Historic records on the specific nature of the land ownership, the parties responsible for the exploitation or production figures have not been recovered to date.
20
| | LA JOYA, NI 43-101 TECHNICAL REPORT |
| | RELEASED: MARCH 27, 2013 |
The second period occurred through the 1960'S to the mid-1970s, and based on property ownership at the time it is expected that the operations would have been carried out by the Olvera family. An estimated 40,000 tonnes of ore were mined over a fifteen year period (from Patterson ref. Albinson and Sanchez, 1977), much of which was extracted from the Embotelladora mine, the Rosas de Diciembre mine and Mina Patricia. Patterson (2001) describes in brief the exploitation at the Embotelladora mine during this time and references Albinson and Sanchez (1977), who described the ore as skarn-related sulphide mineralization with grades of 50 gpt Ag, 0.5% Cu, 0.05% Pb, and 0.05% Zn. The context of these grades is not clear to EBA and they are considered only in historical context.
6.3 1977 to 2006, Luismin
The first records of recent activity on the property arises in 1977 when Minas Sanluis S.A de C.V, an operating subsidiary of Mexican industrial group Sanluis Corp.'s mining division Luismin (Luismin, now Goldcorp) began their exploration activities on the property. The exact details of the land ownership and exploration agreements for this period are not known, however, the property has been held by the Olvera family since the 1950's and agreements during this period are assumed.
Luismin explored the property with varied geological programs which continued until 1997 (Patterson, 2001). Programs included: mapping; geochemical analysis; geophysical surveying (IP in 1979 and 1989, ground magnetics 1981, resistivity, EM3 and borehole-EM 1999); and RC drilling and diamond drilling programs for a combined total of 52 drill holes (totalling 13,863.87 metres). These programs targeted skarn mineralization on both Cerro Sacrificio and Cerro Coloradito by Luismin and their joint venture partner, described in more below. The programs also included a brief campaign to explore the epithermal mineralization mapped on surface along the major range front fault bordering Cerro Coloradito. Significant drilling intercepts from the Luismin drilling include: drill holes LB96-04 located north of Mina Embotelladora which intercepted 24.3 metres of manto sulphides at a down hole depth of 401.65 metres averaging 0.3 gpt Au, 121 gpt Ag and 1.72% Cu (Terry et al., 1999); drill hole S-5a drilled near the Embotelladora mine which intercepted 15.24 metres of mineralization at 42.67 metres grading 3.85 gpt Au, 34 gpt Ag and 0.335 % Cu; and drill hole SAC98-03 which assayed 174 gpt Ag and 1.33% Cu over 16.61 metres from 97.39 metres depth.
6.3.1 1997 to 2001, Luismin-Boliden Joint Venture
In November 1997 Boliden Limited (Boliden) of Vancouver, Canada, entered into an agreement with Luismin on a joint venture exploration program. Details of the joint venture are not known to EBA.
Initial investigations led to a diamond drilling program targeting skarn mineralization on Cerro Sacrificio from November through December, 1998 (Terry et al., 1999). A total of 1,656 metres in six holes were drilled (SAC98-01 to SAC98-06). The program targeted the conceptual hinge zone of the large anticline found on the northern flank of Cerro el Sacrificio. This zone has been modeled to be skarn-hosted sulphide mineralization.
21
| | LA JOYA, NI 43-101 TECHNICAL REPORT |
| | RELEASED: MARCH 27, 2013 |
During the period of April to June 1999, Boliden completed grid mapping the area at a scale of 1:2,000 along 100 metres spaced grid lines for approximately 70 line km of coverage on the property (Terry et al., 1999).
A second drilling program west of Cerro Coloradito along the western portion of the Sacrificio claim block bounding the eastern margin of the fault bounded basin was designed to test epithermal veins for Au and Ag mineralization (Terry et al., 1999). This system was labeled the Coloradito Epithermal Zone and characterized as a system of quartz-calcite veins with epithermal textures. The subsequent drilling program consisted of four diamond drill holes totaling 980.9 metres (COL99-10 to COL99-04) from January through February, 1999.
Five drill holes were completed in 2000, totalling 1,458.51 metres (SAC00-01 to SAC00-05). The holes were drilled into skarn mineralization located on the crest of Cerro Coloradito which exhibits similar characteristics to the skarn present on Cerro Sacrificio. The five holes shared the same collar location and were completed as fan drilling using a variety of orientations.
Terry et al. et al (1999) concluded that the property had a good potential for hosting polymetallic structurally-controlled skarn and manto mineralization, however, it appears the property was dropped following Luismin's acquisition by Wheaton River Minerals (2002) and subsequent acquisition of Wheaton
River by Goldcorp (2005).
A complete listing of the historic drilling in the property is shown in Table 5.
In 2005, Solid Resources Ltd, Canada entered into an agreement with Olvera to carry out drilling to further evaluate the potential of the property. A total of 4 holes were drilled (totaling 1,856.34 metres) between December, 2005, and May, 2006. The holes targeted the main plutonic body underlying Cerro Sacrificio and tested for porphyry style Cu-Mo mineralization (Table 8).
A total of 599 one metre drill core samples were collected and sent to ACME Analytical Lab of Vancouver, Canada. The assessment report received by EBA on this work was incomplete and did not provide verifiable assay results. Therefore, none of the information as to mineralization was used in EBA's interpretations for resource estimation.
Historical information documenting the property ownership and transfer of ownership between Luismin, Solid Resources and Sr. Olvera was not available to EBA. It is thought the property reverted to complete ownership by Sr. Olvera and no exploration was conducted on the property from 2006 to 2010. SilverCrest entered into agreement with Sr. Olvera in 2010.
22
| | LA JOYA, NI 43-101 TECHNICAL REPORT |
| | RELEASED: MARCH 27, 2013 |
Table 8: Summary of Historical Drilling on the La Joya Property
| | | | Total | | | TDL | | | | Drilled | | | RC | | | DDH | | |
| Year | Company | | | | | | | Hole ID | | | | | | | | | | Location |
| | | | Drilled | | | (m) | | | | Holes | | | (m) | | | (m) | | |
| 1981 | | | | | | | | BS-Series | | | 15 | | | | n/a | | | | 2,677.97 | | |
| 1993 | | | | | | | | S-Series | | | 14 | 1 | | | 2,180 | | | | 1,166 | | |
| | Luismin | | | 37 | | | | 9,767.34 | | | | | | | | | | | | | | | Sacrificio |
| 1996 | | | | | | | | | | LB-Series | | | 2 | | | | n/a | | | | 957.50 | | |
| 1997 | | | | | | | | | | A-Series2 | | | 6 | | | | 2,785.87 | | | | n/a | | |
| 1998 | | | | | | | | | | SAC98-01 to 06 | | | 6 | | | | n/a | | | | 1656 | | Sacrificio |
| 1999 | Luismin-Boliden | | | 15 | | | | 4,095.41 | | COL99-01 to 04 | | | 4 | | | | n/a | | | | 980.9 | | Coloradito |
| 2000 | | | | | | | | | | SAC00-01 to 05 | | | 5 | | | | n/a | | | | 1,458.51 | | Coloradito |
| 2006 | Solid Resources | | | 4 | | | | 1,856.34 | | SAC06-01 to 04 | | | 4 | | | | n/a | | | | 1,856.34 | | Sacrificio |
| | TOTAL | | | 56 | | | | 15,720.21 | | | | | | | | | 4,965.87 | | | | 10,753.22 | | |
| 1. | Includes duplicate holes on S4 and S5 |
| 2. | Only 6 holes drilled on the property of a planned 14-hole program2. Only 6 holes drilled on the property of a planned 14-hole program |
| | TDL: Total Drilled Length in metres RC: Reverse Drilling length in metres DDH: Diamond Drill length in metres |
6.5 Historical Resource Estimations
In 2001, Luismin and Boliden Joint Venture (JV) completed a resource estimate based on its JV drill hole program which included nine core holes. Criteria for resource estimation is poorly documented but considered polygonal interpolation of high grade drill hole intercepts (cut-off grade unknown) with a search radius of 25 metres from each hole. Figure 4 shows a section with an example of the Boliden estimation technique (in red blocks).
Selective lead and zinc drill hole intercepts were included in the historic resource estimation. Total Luismin/Boliden resources for these metals were 57,075 tonnes at 1.58% Pb and 2.52% Zn with Au, Ag, and Cu grade reported in Table 9 as Block 7.
These estimates are historical in nature and were prepared as an internal company file and in no way do they conform to NI 43-101 standards. The estimates have not been validated by the author and should not be relied upon as being relevant or accurate.
23
| | LA JOYA, NI 43-101 TECHNICAL REPORT |
| | RELEASED: MARCH 27, 2013 |
Figure 4: Historical non-NI 43-101 compliant resource of Luismin and Boliden
Table 9: Historical Luismin Estimates (non-NI 43-101 Compliant)
| Block | | | Tonnes | | | Au (gpt) | | | Ag (gpt) | | | Cu (%) | |
| | 1 | | | | 19,305 | | | | 0.20 | | | | 705.0 | | | | 3.01 | |
| | 2 | | | | 34,155 | | | | 0.10 | | | | 134.0 | | | | 0.93 | |
| | 3 | | | | 41,040 | | | | 0.10 | | | | 223.0 | | | | 1.06 | |
| | 4 | | | | 81,000 | | | | 0.30 | | | | 141.0 | | | | 0.44 | |
| | 5 | | | | 60,750 | | | | 0.30 | | | | 350.0 | | | | 1.56 | |
| | 6 | | | | 164,160 | | | | 0.30 | | | | 121.0 | | | | 1.72 | |
| | 7 | | | | 57,075 | | | | 0.14 | | | | 273.0 | | | | 2.44 | |
| | 8 | | | | 51,638 | | | | 3.85 | | | | 34.0 | | | | 0.49 | |
| | 9 | | | | 18,225 | | | | 0.16 | | | | 214.0 | | | | 0.08 | |
| | 10 | | | | 18,225 | | | | 0.59 | | | | 141.0 | | | | 0.09 | |
| Total | | | | 545,573 | | | | 0.59 | | | | 190.1 | | | | 1.31 | |
24
| | LA JOYA, NI 43-101 TECHNICAL REPORT |
| | RELEASED: MARCH 27, 2013 |
7.0 GEOLOGICAL SETTING AND MINERALIZATION
7.1 Regional Geology
The La Joya property is underlain by Cretaceous to Tertiary sedimentary and igneous rocks of the Mexican Mesa Central at the transition from the Sierra Madre Occidental and the Mesa Central. This transition between tectonostratigraphic provinces is marked by transition from extensive volcanic complexes of the Sierra Madre Occidental to the thick carbonate sequences of the Mesa Central. The San Luis-Tepehuanes fault system (STFZ) trends southeast-northwest and broadly defines the western boundary of the Mesa Central (Nieto-Samaniego et al., 2007). The STFZ is commonly referred to as the Mexican Silver Belt as it is coincident with a trend containing numerous epithermal silver vein and skarn deposits, including Sombrerete, Fresnillo and Zacatecas mining districts.
The Sierra Madre Occidental spans western Mexico and was formed between the Cenozoic and Cretaceous Periods from compression and uplift resulting from the subduction of the Farrallon plate beneath the North American plate. The Sierra Madre Occidental is predominantly comprised of lava flows, tuffs and agglomerates with overall andesitic composition grading to rhyolitic composition towards the east (Aranda-Gomez, 1978). The Mesa Central is a broad upland comprising thick marine sediments in the central portion of the Mexico, a gradational transition area between the eastern ranges of the Sierra Madre Occidental and the western ranges of the Sierra Madre Oriental. The Mesa is considered to lie within the western portion of the Sierra Madre Oriental.
Forces caused by the Laramide Orogeny during the late-Cretaceous to mid-Tertiary resulted in folding of the sedimentary rocks along northwest-southeast directed axes. Normal faulting, related to extensional basin and range style deformation trends oriented north-south throughout the Mesa Central. This mid-late Tertiary extension was accompanied by emplacement of intrusive stocks of various ages. Uplifted horst structures have exposed thick successions of carbonate rocks that were deposited within a Cretaceous eugeosyncline formed in an early subduction-related deformational back-arc basin along the western margin of the North American continental plate. Late Cretaceous and early to mid-Tertiary orogenic intrusions affected both regional metamorphism as well as local metasomatic alteration within the Cretaceous sedimentary rocks.
Figure 5 shows regional geology of the La Joya area and highlights the typical northwest-southeast trending valleys from post Laramide extension as seen in the valley expanse separating the La Joya property from the La Parilla mine to the west. In addition, uplift and exposed Cretaceous sedimentary rocks due to underlying igneous intrusions are prominently seen near the La Parilla, San Martin/Sabinas and La Joya deposits.
The La Joya property is located on a horst block which has exposed mid-Cretaceous limestone, shales and mudstones of the Cuesta del Cura Limetone and the Indidura Formation (Figure 6). Intrusion of the Sacrificio stock has locally uplifted and domed the limestone package that hosts the La Joya deposit. Five major stages of deformation have contributed to the mineralizing events at the deposit (Patterson, 2001). Local metasomatism has resulted in widespread skarnification of portions of the Cuesta del Cura Limestone unit on the La Joya property.
25
| | LA JOYA, NI 43-101 TECHNICAL REPORT |
| | RELEASED: MARCH 27, 2013 |
Figure 5: Regional geology map
26
| | LA JOYA, NI 43-101 TECHNICAL REPORT |
| | RELEASED: MARCH 27, 2013 |
Figure 6: Local property geology
27
| | LA JOYA, NI 43-101 TECHNICAL REPORT |
| | RELEASED: MARCH 27, 2013 |
7.2.1 Sedimentary Units
Sedimentary rocks of the Cuesta del Cura Limestone (Albian to early Cenomian) unit are host to the La Joya deposits. The Cuesta del Cura rocks are overlain by sedimentary rocks of the Indidura Formation (mid- Cenomian to Turonian). The gradual transition between the packages is marked by an increase in presence and bedding thicknesses of siliciclastic rocks, and a change from a calcareous to iron enriched composition.
The unaltered limestone found on the property is generally fine-grained, light grey, and displays occasional primary bedding. Moderate to intense alteration of the limestone has occurred from contact metamorphism and hydrothermal metasomatic effects proximal to the intrusive. Alteration observed in the limestone includes weak recrystallization, marble formation and complete skarnification to calc-silicate phase mineralogy.
The younger Indidura Formation is estimated to have been deposited in gradual transition from the underlying the Cuesta del Cura Limestone (mid-Cenomian to Turonian). The Indidura has typically been eroded from the crest of Cerro Sacrificio, but has been mapped by Luismin on the surface at Cerro Coloradito and occurs in historic drilling and outcrop to the north of the property and on the lower flanks surrounding Cerro Sacrificio. The Cuesta del Cura Limestone extends from the exposed contact with the younger Indidura Formation in the west with inferred extension over Cerro Sacrificio to Santo Nino in the east.
The sedimentary package ranges in thicknesses up to a maximum of 250 metres directly overlying the Sacrificio intrusion.
Three intrusive units have been mapped on the property to date (Patterson, 2001), the most recent of which are considered to be multiphase intrusions and the source of mineralizing hydrothermal fluids.
The oldest intrusive dated on the property exists as a north-northwest trending dyke on Cerro Sacrificio (colloquially named 'dique vijeo') and numerous smaller dykes outcropping southeast of Cerro Coloradito. The dikes are typically feldspar phyric monzonites dated by Patterson (2001) at 109.1 ±0.4 Ma (U-Pb dating). The dikes are cross-cut by younger intrusive phases and contain only minor chlorite and epidote alteration. Rare earth element (REE) patterns (Patterson, 2001) suggest the magmas were derived from deep crustal or mantle sources. The emplacement of these dikes pre-dates the major deformation events of the Laramide orogeny and generally strike along similar trends to the regional fabric and main fold axis of Cerro Sacrificio, suggesting intrusion along earlier deep seated structures. These dikes are not currently thought to be related to the mineralizing fluids on the La Joya property.
Uplift of Cerro Sacrificio is attributed to the emplacement of the Sacrificio stock, a quartz and feldspar (orthoclase) phyric granite dated at 39.8 ±0.1 Ma (Patterson, 2001, U-Pb dating). Sharp contacts of multiple phases are visible in drill core. A margin of grey to olive green coloured, quartz phyric and silica rich felsic porphyry is seen in drill core as 15 to 50 metres in thickness at the contact of the sediments and the granitic stock. This may represent an endoskarn rind or the remnants of pooling fluids along the contact. The margin within the intrusive has minor mineralization. The intrusion is cross-cut by small quartz veinlets containing trace amounts of chalcopyrite, arsenopyrite, pyrite with occasional fluorite phenocrysts and possible secondary biotite in vein envelopes. REE patterns are suggestive of shallow crustal melts that have undergone significant fractionation of plagioclase (Patterson, 2001). The intrusion is estimated to have been emplaced at approximately 1.5 to 3 km depth using fluid inclusion data completed by Patterson (2001). A large weathered exposure of the intrusive exists near the southern end of Cerro Sacrificio. This intrusion has almost certainly convectively driven fluids into the Cretaceous sediments, resulting in regional silicification and local skarnification on the property and providing increased resistance to physical weathering of the area. The subsurface intrusive contact appears to dip abruptly beyond the surficial expression of the hillside slope.
28
| | LA JOYA, NI 43-101 TECHNICAL REPORT |
| | RELEASED: MARCH 27, 2013 |
Cerro Coloradito is underlain by a second late Eocene intrusive dated at 40.3 ±0.2 Ma (Patterson, 2001, U- Pb dating), which is exposed on western flank of the hillside. The rocks, similar to the Sacrificio stock, are multiphase fine-grained granite with quartz-orthoclase-plagioclase phenocrysts. A layer of fine- to medium-grained biotite-rich granite surrounds the core intrusion. Based on field observation, the skarnoid alteration halo surrounding this stock is less extensive than at Cerro Sacrificio.
Five separate deformation events (Table 10) have been mapped on the property (Patterson, 2001). Three episodes of pre-intrusion regional deformation (D1 to D3) are associated with the late Cretaceous to Middle Eocene (~70-45Ma) Mexican fold and thrust belt. The deformation events are contemporaneous with the Laramide Orogeny and are responsible for the northwest-southeast orientation of the regional fabric. Two periods of deformation (D4 and D5) are related to the emplacement of the Sacrificio intrusion (39.8 ±0.1 Ma) and the formation of mineralized skarn (Patterson, 2001).
Meinert's investigations (2011) also indicate that D1 and D2 events occurred prior to metasomatism. Where calc-silicate alteration has occurred in deformed rocks, skarnoid is generally continuous and unbroken suggesting fluid creep along contacts followed the folding events. Numerous boudins of recrystallized limestone can also be seen encased in calc-silicate material, suggesting a late ingress of metasomatic fluids.
Deformation event D3 is considered to be related to formation of a major upright anticlinorium within the sedimentary rocks. Early fluid migration upwards through conduits within the northwest-southeast trending axial plane may have been responsible for early manto mineralization. The prominent northeast - southwest directed fabric is reflected in the elongated skarn fabric in Deformation event D4 involved the doming of the sedimentary units causing the double north and south plunge observed in D3 structures. D5 is likely continuous with D4 and is attributed to the formation of the late northeast-southwest trending corridors contributing to permeability and migration of late mineralizing fluids. Five corridors were mapped by Luismin (), a sixth corridor, called the 'New' has been identified from Phase I with each corridor being further refined into multiple structural domains from Phase II modelling.
29
| | LA JOYA, NI 43-101 TECHNICAL REPORT |
| | RELEASED: MARCH 27, 2013 |
Table 10: Major Deformation Events (Patterson, 2001)
| Event | | Type | Axial trend | Comments |
| | D1 | | Ductile, shortening | ~330 | Tight to isoclinal, asymmetric, amplitudes of 10 |
| | | | | | cm to 3 m |
| | D2 | | Ductile, shortening | ~060 | Type 2 refolding of D1, similar amplitude to D1 |
| | | | | | folds |
| | | | | | Large amplitude, upright and open folds, Type 3 |
| | D3 | | Ductile/brittle, shortening | ~330 | refolding of D1, mineralization along anticlinal |
| | | | | | fold axes |
| | D4 | | Ductile/brittle, doming | | Related to emplacement of Sacrificio intrusion |
| | D5 | | Extensional / hydrofracturing | ~060 - 085 | Exsolution of magmatic fluids from intrusion |
7.3 Mineralization
Three distinct styles of mineralization have been identified at La Joya; 1) Manto, 2) Structurally- controlled stockwork and veining, and 3) contact skarn ('Contact Zone') .
Manto style mineralization of Silver-Copper-Gold (Ag-Cu-Au) is concentrated within stratiform manto-style skarn controlled along sub-horizontal bedding. From field and drill observations mineralization is more concentrated (volume and grade) at locations where these sub horizontal beds intercept the structurally controlled stockwork and veining described below.
Structurally controlled stockwork and veining mineralization of Silver-Copper-Gold, Lead-Zinc and Tungsten (Ag-Cu-Au, Pb-Zn, and W) is concentrated within related skarn. This is the latest stage of mineralization where the structural domain acted as a fluid conduit.
Contact Zone tungsten mineralization is found within late stage retrograde skarn development along the intrusive contact. This intrusive contact is thought to underlie most of the MMT, Santo Nino and Coloradito areas, effectively draping the Sacrificio intrusive.
7.3.1 La Joya and Santo Nino
Skarn mineralization on the La Joya property is a product of metasomatism and is found to be stratigraphically and structurally controlled. Prograde skarn mineral zonation as described by Meinert (1993), and Einaudi (1982) can be seen throughout the rocks across the property. Mineralogy proximal to fluid conduits typically includes andradite garnet > pyroxene ± vesuvianite (where garnet is coarse- grained, dark red to brown in colour) grading towards distal mineralogy as pyroxene + wollastonite + vesuvianite > garnet (where garnet is fine to medium grained, tan to green in colour). Late, retrograde skarn is seen on the property as relatively fine-grained green amphibole ± black chlorite. Silver-copper- gold, lead-zinc, molybdenum and tungsten mineralization found at the La Joya property can be categorized within three distinct, but spatially related, styles as described below.
Possibly the most widely distributed style of mineralization is related to stratiform replacement, where disseminated bornite>chalcopyrite in association with wollastonite ± garnet ± pyroxene has replaced the limestone. The term manto is herein used to describe this style, characterized by mineralization that has spread laterally along bedding or permeable zones, from a main conduit or feeder of chemically reactive hydrothermal fluids. Distal expression of manto mineralization is seen as overprinteding by skarnoid mineralization along bedding contacts and thin siliciclastic interbeds. Progressive coarsening of garnet and pyroxene proximal to the manto intersection with vertical structurally controlled mineralization is noted to be texturally destructive, however, is not observed to be laterally extensive. The highest silver grades occur in a bornite-wollastonite +/- vesuvianite association at the contact of massive skarn and distal skarnoid. Silver, copper and gold grades are interpreted to be associated with this style of mineralization. Skarnoid is ubiquitous on the property, the original rock composition may be reflected in its mineralogy.
30
| | LA JOYA, NI 43-101 TECHNICAL REPORT |
| | RELEASED: MARCH 27, 2013 |
Mapping by Luismin (2001) delineated up to 5 zones containing sub-vertical structurally related mineralization: Embotelladora, Tecolote, Yeyis, Hedionda and Rosas de Diciembre. Historic workings are generally located along, and within, the bounds of these zones. The zones range in width from 5 to 50 metres, are continuous along an east-northeast striking trend (~077° azimuth) and are steeply to vertically dipping. Coarse grained garnet and sulphides are evident in the corridors at the intersection of, and adjacent to, manto mineralization. Concentrations of chalcopyrite > bornite >> covellite is observed within these structurally controlled zones. Planar and stockwork quartz veining is common within these corridors (Meinert, 2011), possibly related to D4 deformation as described by Patterson (2001). Silver, copper, gold, lead, zinc, molybdenum and tungsten grades are interpreted to be associated with this style of mineralization. Sub-vertical, laminated quartz-calcite veins ranging from 1-10 cm are generally confined within these corridors and cross-cut all other styles of mineralization, possibly representing a late-stage pulse of hydrothermal fluids into the system. The veins contain sulphosalts including freibergite ± tetrahedrite ± arsenopyrite. Evidence of these laminated veins exposed in outcrop from drill road construction have been noted to continue to depth in the outer siliceous shell of the Sacrificio intrusive near drill hole LJDD11-15. These corridors are related to the D5 deformation event as described by Patterson (2001), and are herein referred to as corridors of structurally controlled stockwork and veining (SCSV) corridors.
Finer grained green skarn containing amphibole and black chlorite ± garnet ± pyroxene occurs near the base of the sediments in proximity to the intrusive contact along fractures and veining. This hydrous mineralization is thought to be retrograde skarn phase and has been termed the 'Contact Skarn or Zone'. Black alteration haloes enveloping the late stage D5 veins, as noted above, may be related to the amphibole and chlorite retrograde mineralization. The Tecolote zone hosts this style of mineralization at distances away from the contact, as seen in drill hole LJDD11-19.
Tungsten mineralization, present as scheelite, appears to be related to the Contact Zone, the exact nature is not yet understood. SilverCrest and historic work completed by Union Carbide (1980) and Luismin suggest pervasive tungsten mineralization over a minimum area of 1.5 km by 1 km adjacent to sediment-intrusive contacts. Phase II drilling and subsequent modelling has extended this area of tungsten mineralization to 1.6 km by 1.9 km extending north and east to Santo Nino.
Limited drilling into the intrusive targeting possible Cu-Mo mineralization associated with a porphyry style deposit was conducted by Solid Resources, in 2006, and SilverCrest in 2010. Results from these drill programs have confirmed the presence of a large porphyritic quartz-monzonite with varying alteration, often propylitic as indicated by the presence of epidote and late quartz veinlets containing arsenopyrite, pyrite, chalcopyrite with local molybdenite and locally weakly developed biotite alteration haloes.
31
| | LA JOYA, NI 43-101 TECHNICAL REPORT |
| | RELEASED: MARCH 27, 2013 |
The La Joya deposit shows sulphide mineralization with minimal oxidation. Minor copper oxides are noted in surface outcrops and historic workings.
Mineralization at Coloradito is predominantly related to the multiphase fine-grained granite intruded into country rock. A layer of fine to medium-grained biotite-rich granite with quartz breccia surrounds the core intrusion with the surrounding contact skarn hosting mineralization (Unit Q in Figure 6). To the east of Cerro Coloradito a porphyry dyke (Qp) cut country rock but is not mineralized. These intrusive are hosted in the country rock of the Indidura Formation that has less carbonate bearing rocks and more shale and chert interbeds.
Hornfelsing and skarnoid of host rocks is seen as an alteration halo to the intrusive that occur in a cuspate shaped zone on the southern-western flank of the intrusive. The development of localized fine grained skarn mineralization (amphibole, etc) with strong hematite alteration from oxidation of magnetite or pyrrhotite is observed in drill core from this halo, typically coarse grained skarn mineralization is absent.
Weak Ag-Cu-Au mineralization is interpreted to occur in stratified carbonate-skarn beds that have a moderate to steeply dipping northerly orientation. W-Mo is the primary style of mineralization within grey translucent veinlets cross cutting skarn mineralization, these are mainly restricted to the halo and a small outlier on the east of the N-S orientated intrusive dyke.
The La Joya deposit closely resembles several of the carbonate hosted copper skarn deposit as described by Meinert (1993) with associated silver and gold mineralization. Most notably, the Cu-Au skarns at Fortitude- Copper Canyon, Nevada (Myers and Meinert, 1991), and the nearby San Martin and Sabinas skarn systems (Rubin and Kyle, 1988) have similar characteristics. Calcsilicate mineralization found on the property is dominated by andradite garnet and pyroxene where sulphide mineralization exists. Metasomatic fluids are thought to have been derived from the Sacrificio intrusion, a local magmatic water source dated at 39.8 ±0.1 Ma (Patterson, 2001), and are thought to be related to the bornite and chalcopyrite skarn mineralizing events. Skarnification has been cross-cut by multi-staged SCSV which appears to enhance mineralization. Late quartz-calcite laminated veins cross-cut pre-existing skarn mineralization and, although related to magmatic fluids, are not considered to be related to the skarn mineralizing events (Figure 7).
The Sabinas underground mine, currently operated by Mexican miner Peñoles, is located 25 km south-east of La Joya. The mine is adjacent to the historic producing San Martin mine, currently owned by Grupo Mexico, and provides a local analogy of a producing skarn deposit. Both deposits overlay the multiphase Cerro del Gloria quartz monzonite intrusive stock which is thought to have been emplaced at approximately ±46 Ma (mid-Eocene, personal comm. with company geologist). The deposits are hosted within the Cuesta del Cura Limestone unit, at depth along the inclined contact of the stock. Sedimentary contacts with the intrusive are discordant, however, they strike parallel to the contact and the beds dip outwards from intrusive suggesting that the intrusive was forcefully injected into the limestone (Aranda-Gomez, 1978). A margin of quartz-phyric rhyolite surrounds the Cerro de Gloria stock at both mines.
32
| | LA JOYA, NI 43-101 TECHNICAL REPORT |
| | RELEASED: MARCH 27, 2013 |
SCSV at San Martin and Sabinas mines are approximately 1 to 3 metres in thickness and contain high grade polymetallic mineralization which has historically and is currently being mined. Extraction of Ag, Cu, Zn and Pb concentrate from the Sabinas is from a 13-15 metres thick skarn zone along the contact of the intrusive as sphalerite, chalcopyrite and bornite and in sub-vertical quartz-calcite veins which cross-cut the skarn.
The economic success of the San Martin and Sabinas deposits do not infer that the La Joya deposit supports economic viability at this time and are used here as a geological analogy only.
Figure 7: La Joya deposit model schematic
33
| | LA JOYA, NI 43-101 TECHNICAL REPORT |
| | RELEASED: MARCH 27, 2013 |
9.0 EXPLORATION
Exploration efforts completed by SilverCrest since acquiring the property in 2010 have been directed to improving the property scale understanding of skarn and SCSV distribution and control of mineralization on Cerro Sacrificio. The results of surface mapping and sampling confirmed the surface expression of zoned manto and structurally related skarn mineralization as targets for the Phase I and recent Phase II drilling campaigns. A compilation of historic drilling data and review of preserved historic drill core was used in support of this drilling. Regional airborne geophysics acquired from an historic survey has been reprocessed and will be used by SilverCrest for local and regional exploration target generation.
Exploration potential on the La Joya property is currently defined within a broad area of calc-silicate alteration over an area of 2.5 km by 2.5 km. The Phase I and Phase II exploration has extended the Main Mineralized Trend (MMT) area (Ag-Cu-Au-W-Zn-Pb-Mo), incorporating the southerly Rosas de Diciembre and northerly Esperenza (Ag-Cu-Au-W-Zn-Pb & Mo) and abutting up to the easterly located Santo Nino (Cu-Ag-Au-W-Mo) showing that itself was drilled over the 2011-2013 period. Phase II work has included developing the historically drilled Coloradito (W-Mo Ag-Cu-Au) showing. Additional exploration potential also exists outside of the MMT.
9.1 Surface Sampling and Mapping
Confirmatory chip sampling of visible mineralization in historic pits, workings and outcrop was continued by SilverCrest on Cerro Sacrificio during 2012, with an additional 320 chip samples from the MMT and 44 samples from Coloraditio. These chip channel samples are in addition to the 119 chip samples that were collected primarily within the 2010 Phase I drill area. In 2011, a total of 58 chip samples were collected to the south of the Phase I drilling area near the Hedionda and Rosas di Diciembre corridors, primarily as confirmatory chip sampling.
All sampling was conducted by SilverCrest personnel using rock hammer and chisel in two to three spaced lines perpendicular to bedding contacts and structures from 0.50 to 8 metres in overall sample length. Samples generally targeted rocks where mineralization was visible. Chip sample locations were marked on outcrop with red spray paint and labelled with their respective sample numbers.
9.2 Exploration History Compilation and Database Development
EBA has compiled and maintained a drill hole database for documentation, including: SilverCrest drill results from Phase I reports; internal company reports; and field observations.
SilverCrest based on all available and II; historic company assessment
The database was imported for geological modeling into Gemcom GEMS® software. Only those drill holes that could be located in the field and that had representative analytical results that could be selectively verified from historic drill core were considered to be reliable and used for the mineral resource estimation described in "Resource Estimation for the La Joya Property Durango, Mexico. NI 43-101 Technical Report Prepared for SilverCrest Mines Inc." (Effective date: January 5th 2012).
The complete database includes 175 diamond and RC drill holes comprising 52,674.02 metres of lithological data and a cumulative 15,745 samples (42018.48 metres) of laboratory analytical data. An additional 542 surface samples from the SilverCrest campaign are excluded, but total 1845.2 metres of analytical information. Surface samples have not been included in the updated mineral resource.
34
| | LA JOYA, NI 43-101 TECHNICAL REPORT |
| | RELEASED: MARCH 27, 2013 |
Regional airborne magnetic and gravity geophysics were flown over the La Joya property as one of five areas in 2005 by a Canadian-based company. SilverCrest obtained the dataset through an agreement in 2010.
In February, 2011, Eagle Mapping of Vancouver, Canada, conducted an aerial photographic survey covering approximately 3 square kilometres km of the property registered to UTM WGS 84. A digital terrain model (DTM) with 2 metre resolution and digital vector base map of the survey area was provided by Eagle Mapping.
Further reference to historical compilation and database development can be found in Resource Estimation for the La Joya Property Durango, Mexico. NI 43-101 Technical Report Prepared for SilverCrest Mines Inc. (Effective date: January 5th 2012).
9.2.1 Rock Coding in Database
Rock codes used for interpretation of the geological database were extracted from SilverCrest drill logs for the Phase I program and historical logs or reports for previous drilling. For interpretation purposes and geological modeling, standardized geological rock coding was applied to the datasets by EBA during the database and historical compilation. Table 11 lists the rockcodes used by SilverCrest geologists during geological logging in the Phase I drilling programs.
Table 11: Rockcoding Used in Phase I and II SilverCrest Drill Logs and in GEMS Drill Hole Database
| Rockcode | Description |
| MAR | Marble |
| HORN | Hornfels |
| LM | Limestone |
| SK | Skarn |
| LH | Limestone-hornfels |
| LMAR | Limestone-marble |
| LS | Limestone with skarn bands |
| MS | Marble with skarn bands |
| SH | Skarn with hornfels |
| INT | Intrusive |
35
| | LA JOYA, NI 43-101 TECHNICAL REPORT |
| | RELEASED: MARCH 27, 2013 |
10.0 DRILLING
10.1 Phase 1 Drilling, Oct 2010 to July 2011
SilverCrest's Phase I drilling program commenced in October of 2010 and was completed in July of 2011. The program collected exploration data for use in geologic interpretation at a spacing suitable for deposit delineation and resource estimation. The Phase I program focused on the Main Mineralized Trend (MMT) (Figure 8) situated on the north western portion of Cerro Sacrificio. The program included 26 completed diamond drill holes and one lost drill hole, totalling 5,753.7 metres of HQ diameter core. Further details of this program are reported in "Resource Estimate for the La Joya Property Durango, Mexico. NI 43-101 Technical Report Prepared for SilverCrest Mines Inc." (January 5th 2012).
10.2 Phase II Drilling, Nov 2011 to Dec 2012
The Phase II drilling (78 DDH totalling 25,812.65 metres) began in November 2011 and was completed in December 2012. This program consisted of infill drilling of the Phase I resource area and drilling to extended mineralization in all directions of the MMT (Figure 8). The peripherally located, historically drilled and geological similar areas of Rosas de Diciembre (Figure 8) and Santo Nino (Figure 9) were also drilled during the Phase II program with the additional of the geologically distinct Cerro Coloradito (Figure 10). Table 10 includes a summary of the SilverCrest drilling conducted on the property to date.
Coring was completed by three Mexican drilling contractors; Sonora Perforaciones HAR S.A de C.V. based out of Hermosillo, State of Sonora; G4 Drilling/Forage based in Hermosillo, State of Sonora and Baja Drilling San Luis Potosí S.L.P. All casings have been removed from the completed historic and SilverCrest drill holes and most locations have been marked with cement monuments labelled with hole number, depth and orientation. A list of significant intervals for the Phase II drilling campaign is provided in Table 12, below.
Competent rock was intersected by drilling with core recoveries and RQD values dominantly in the range of 80-100%. Local soft rock related to alteration near structures returned lower values. Some historic drill hole data reports voids encountered in core where drilling was near to old workings, however, these areas were not tested by SilverCrest drilling.
Drilling has tested all three known styles of mineralization found on the property. Drilling was oriented as both vertical and inclined holes according to ground conditions and the specific target. Due to the difficult and steep topography of the property, all drill collars have been constrained to the limits of the newly constructed exploration roads around both Cerro Sacrificio and Cerro Coloradito.
A handheld GPS, with an accuracy of ±5 metres, was initially used to record the location of drill holes. Professional surveying was contracted by SilverCrest following the completion of the Phase II program to measure the location of each drill hole. Most drill holes were able to be located. All collar elevations were then vertically corrected to fit the Eagle Mapping DTM using GEMS software by EBA, which generally resulted in a -8 to -14 metre shift from GPS to DTM elevation. Down hole deviation surveying using a Reflex digital down hole tool was completed on drill hole LJ DD11-19 only, with only minor deviations observed.
36
| | LA JOYA, NI 43-101 TECHNICAL REPORT |
| | RELEASED: MARCH 27, 2013 |
Figure 8: Phase I and II drill hole location map of the MMT
37
| | LA JOYA, NI 43-101 TECHNICAL REPORT |
| | RELEASED: MARCH 27, 2013 |
Figure 9: Phase II drill hole map of Santo Nino
38
| | LA JOYA, NI 43-101 TECHNICAL REPORT |
| | RELEASED: MARCH 27, 2013 |
Figure 10: Phase II drill hole map of Coloradito
39
| | LA JOYA, NI 43-101 TECHNICAL REPORT |
| | RELEASED: MARCH 27, 2013 |
Drill holes that intersected the Sacrificio intrusive were generally continued for an additional 20-30 metres depth below the contact. Holes LJ DD11-15 and LJ DD11-19 were extended further to depth into the intrusive to test for possible Cu-Mo porphyry style mineralization. These holes were drilled to depths of 492.6 metres and 491.10 metres, respectively. Anomalous grades of Cu and Mo were rare, however, local veining in hole LJ-DD11-19 returned a grade highlight of 0.707% Mo over 1.52 metres within the intrusive from 277.25 to 278.77 metres (down hole depth). Further work by SilverCrest to evaluate if porphyry style mineralization exists on the property involved several drill holes from Phase II continued into the intrusive testing for porphyry style mineralization: LJ DD12-67 to 166.5 metres (120 metres into intrusive); LJ DD12-68 to 274.5 metres (84.5 metres into intrusive); and LJ DD12-73 to 204 metres (65 metres into the intrusive).
Table 12: Summary of SilverCrest Drilling on the La Joya Property
| | | # of Holes | | | | |
| Year | Company | | Series Name | Drill Type | Core Size | Total (m) |
| | | Drilled | | | | |
| 2010 (PI) | SilverCrest-MMT | 81 | LJDD10- | Core | HQ | 1,338.99 |
| 2011 (PI) | SilverCrest-MMT | 27 | LJDD11- | Core | HQ | 5,753.70 |
| 2012 (PII) | SilverCrest-MMT | 58 | LJDD12- | Core | HQ | 18,431.15 |
| Incl. | -Santo Nino | 9 | LJDD12- | Core | HQ | 2,515.00 |
| Incl. | -Coloradito | 11 | LJDD12- | Core | HQ | 4,866.50 |
| | | | | | TOTAL | 32,905.34 |
1. Includes lost hole LJ-DD10-05 and redrill LJ-DD10-05a
Significant mineralized drill hole intercepts from the Phase II program (>5 metres) are presented in Table 13 and Error! Reference source not found..
Table 13: Significant Drill Hole Intercepts > 5 M Length from Phase II Drilling
| | | | | | | | | Length* | | | Ag | | | Au | | | | | | AgEq* | |
| Hole | | From (m) | | | To (m) | | | | | | | | | | | | Cu (%) | | | | |
| | | | | | | | | (m) | | | (gpt) | | | (gpt) | | | | | | (gpt) | |
| LJ DD11-27 | | | 150.9 | | | | 160.1 | | | | 9.2 | | | | 12.4 | | | | 0.03 | | | | 0.25 | | | | 35.4 | |
| | | | 277.4 | | | | 309.6 | | | | 32.3 | | | | 20.6 | | | | 0.84 | | | | 0.39 | | | | 96.1 | |
| | | | 326.5 | | | | 341.5 | | | | 15.0 | | | | 6.5 | | | | 0.39 | | | | 0.13 | | | | 37.2 | |
| LJ DD11-28 | | | 165.5 | | | | 179.0 | | | | 13.5 | | | | 7.6 | | | | 0.03 | | | | 0.10 | | | | 17.7 | |
| | | | 298.5 | | | | 303.0 | | | | 4.5 | | | | 74.9 | | | | 0.33 | | | | 1.14 | | | | 189.4 | |
| LJ DD11-29 | | | 135.0 | | | | 186.3 | | | | 51.3 | | | | 43.4 | | | | 0.15 | | | | 0.46 | | | | 90.5 | |
| | | | 360.0 | | | | 372.0 | | | | 12.0 | | | | 10.0 | | | | 0.02 | | | | 0.07 | | | | 17.0 | |
| LJ DD11-30 | | | 68.0 | | | | 142.5 | | | | 74.5 | | | | 26.3 | | | | 0.19 | | | | 0.30 | | | | 61.6 | |
| | | | 310.0 | | | | 338.0 | | | | 28.0 | | | | 9.2 | | | | 0.20 | | | | 0.06 | | | | 24.4 | |
| | | | 367.0 | | | | 377.0 | | | | 10.0 | | | | 9.7 | | | | 0.34 | | | | 0.07 | | | | 32.7 | |
| | | | 421.0 | | | | 429.0 | | | | 8.0 | | | | 9.6 | | | | 0.40 | | | | 0.11 | | | | 39.1 | |
| LJ DD11-32 | | | 104.0 | | | | 113.0 | | | | 9.0 | | | | 40.2 | | | | 0.06 | | | | 0.23 | | | | 63.0 | |
40
| | LA JOYA, NI 43-101 TECHNICAL REPORT |
| | RELEASED: MARCH 27, 2013 |
Table 13: Significant Drill Hole Intercepts > 5 M Length from Phase II Drilling
| | | | | | | | | Length* | | | Ag | | | Au | | | | | | AgEq* | |
| Hole | | From (m) | | | To (m) | | | | | | | | | | | | Cu (%) | | | | |
| | | | | | | | | (m) | | | (gpt) | | | (gpt) | | | | | | (gpt) | |
| LJ DD11-33 | | | 421.0 | | | | 433.5 | | | | 12.5 | | | | 2.6 | | | | 0.32 | | | | 0.08 | | | | 25.5 | |
| L DD12-34 | | | 50.0 | | | | 76.7 | | | | 26.7 | | | | 20.0 | | | | 0.32 | | | | 0.14 | | | | 48.0 | |
| | | | 140.5 | | | | 146.1 | | | | 5.7 | | | | 120.4 | | | | 0.12 | | | | 0.83 | | | | 197.7 | |
| LJ DD12-35 | | | 60.0 | | | | 68.0 | | | | 8.0 | | | | 21.5 | | | | 0.03 | | | | 0.01 | | | | 23.9 | |
| LJ DD12-36 | | | 156.0 | | | | 185.0 | | | | 29.0 | | | | 16.5 | | | | 0.06 | | | | 0.14 | | | | 31.5 | |
| | | | 44.0 | | | | 52.0 | | | | 8.0 | | | | 13.9 | | | | 0.12 | | | | 0.18 | | | | 35.4 | |
| | | | 88.0 | | | | 91.5 | | | | 3.5 | | | | 49.5 | | | | 0.06 | | | | 0.26 | | | | 74.9 | |
| | | | 173.9 | | | | 191.7 | | | | 17.8 | | | | 11.8 | | | | 0.34 | | | | 0.03 | | | | 31.4 | |
| | | | 139.6 | | | | 150.0 | | | | 10.4 | | | | 7.0 | | | | 0.43 | | | | 0.03 | | | | 31.1 | |
| | | | 169.2 | | | | 189.0 | | | | 19.8 | | | | 34.3 | | | | 0.25 | | | | 0.23 | | | | 66.6 | |
| LJ DD12-39 | | | 32.0 | | | | 56.0 | | | | 24.0 | | | | 20.7 | | | | 0.02 | | | | 0.07 | | | | 27.7 | |
| LJ DD12-40 | | | 29.3 | | | | 64.8 | | | | 35.5 | | | | 17.2 | | | | 0.08 | | | | 0.30 | | | | 47.0 | |
| | | | 136.5 | | | | 144.3 | | | | 7.8 | | | | 10.6 | | | | 0.13 | | | | 0.17 | | | | 31.7 | |
| LJ DD12-41 | | | 0.0 | | | | 8.0 | | | | 8.0 | | | | 26.7 | | | | 0.10 | | | | 0.11 | | | | 41.2 | |
| | | | 115.5 | | | | 126.0 | | | | 10.5 | | | | 18.6 | | | | 0.12 | | | | 0.40 | | | | 59.0 | |
| LJ DD12-42 | | | 31.0 | | | | 158.4 | | | | 127.4 | | | | 20.3 | | | | 0.64 | | | | 0.16 | | | | 66.1 | |
| LJ DD12-43 | | | 0.0 | | | | 115.0 | | | | 115.0 | | | | 23.5 | | | | 0.11 | | | | 0.17 | | | | 43.6 | |
| | | | 140.5 | | | | 152.5 | | | | 12.0 | | | | 38.6 | | | | 0.09 | | | | 0.20 | | | | 60.3 | |
| LJ DD12-44) | | | 91.0 | | | | 104.6 | | | | 13.6 | | | | 15.7 | | | | 0.01 | | | | 0.12 | | | | 26.5 | |
| | | | 288.2 | | | | 308.0 | | | | 19.8 | | | | 13.5 | | | | 0.10 | | | | 0.10 | | | | 27.1 | |
| LJ DD12-45 | | | 112.9 | | | | 191.2 | | | | 78.3 | | | | 32.2 | | | | 0.28 | | | | 0.20 | | | | 63.4 | |
| | | | 223.0 | | | | 231.0 | | | | 8.0 | | | | 37.1 | | | | 0.80 | | | | 0.15 | | | | 90.0 | |
| LJ DD12-46 | | | 106.6 | | | | 122.0 | | | | 15.5 | | | | 30.5 | | | | 0.10 | | | | 0.23 | | | | 55.3 | |
| | | | 154.0 | | | | 169.6 | | | | 15.6 | | | | 19.3 | | | | 0.06 | | | | 0.11 | | | | 31.8 | |
| | | | 208.2 | | | | 217.0 | | | | 8.8 | | | | 26.6 | | | | 0.34 | | | | 0.14 | | | | 55.6 | |
| LJ DD12-47 | | | 108.0 | | | | 132.0 | | | | 24.0 | | | | 15.5 | | | | 0.01 | | | | 0.16 | | | | 29.8 | |
| | | | 175.7 | | | | 222.6 | | | | 46.9 | | | | 34.2 | | | | 0.32 | | | | 0.23 | | | | 70.0 | |
| LJ DD12-48 | | | 72.0 | | | | 84.0 | | | | 12.0 | | | | 45.0 | | | | 0.02 | | | | 0.52 | | | | 90.7 | |
| | | | 193.5 | | | | 202.5 | | | | 9.0 | | | | 38.9 | | | | 0.01 | | | | 0.20 | | | | 56.6 | |
| | | | 254.2 | | | | 259.9 | | | | 5.7 | | | | 34.3 | | | | 0.31 | | | | 0.27 | | | | 73.0 | |
| LJ DD12-60 | | | 0.0 | | | | 82.5 | | | | 82.5 | | | | 8.6 | | | | 0.12 | | | | 0.14 | | | | 26.6 | |
| LJ DD12-61 | | | 0.0 | | | | 80.0 | | | | 80.0 | | | | 2.4 | | | | 0.15 | | | | 0.06 | | | | 15.1 | |
| LJ DD12-62 | | | 0.0 | | | | 152.3 | | | | 152.3 | | | | 4.9 | | | | 0.22 | | | | 0.16 | | | | 29.7 | |
| LJ DD12-63 | | | 92.0 | | | | 117.0 | | | | 25.0 | | | | 17.5 | | | | 0.06 | | | | 0.36 | | | | 51.5 | |
| LJ DD12-63 | | | 97.0 | | | | 201.0 | | | | 104.0 | | | | 7.7 | | | | 0.08 | | | | 0.16 | | | | 25.5 | |
| LJ DD12-64 | | | 4.0 | | | | 156.0 | | | | 154.0 | | | | 1.6 | | | | 0.10 | | | | 0.04 | | | | 10.0 | |
| LJ DD12-65 | | | 4.0 | | | | 161.0 | | | | 157.0 | | | | 52.0 | | | | 0.24 | | | | 0.35 | | | | 94.1 | |
| LJ DD12-66 | | | 4.0 | | | | 106.5 | | | | 102.5 | | | | 4.8 | | | | 0.20 | | | | 0.15 | | | | 27.7 | |
41
| | LA JOYA, NI 43-101 TECHNICAL REPORT |
| | RELEASED: MARCH 27, 2013 |
Table 13: Significant Drill Hole Intercepts > 5 M Length from Phase II Drilling
| | | | | | | | | Length* | | | Ag | | | Au | | | | | | AgEq* | |
| Hole | | From (m) | | | To (m) | | | | | | | | | | | | Cu (%) | | | | |
| | | | | | | | | (m) | | | (gpt) | | | (gpt) | | | | | | (gpt) | |
| LJ DD12-68 | | | 164.4 | | | | 190.6 | | | | 31.2 | | | | 20.3 | | | | 0.12 | | | | 0.43 | | | | 63.3 | |
| LJ DD12-70 | | | 199.6 | | | | 208.5 | | | | 8.9 | | | | 23.4 | | | | 0.04 | | | | 0.42 | | | | 61.5 | |
| LJ DD12-71 | | | 0.0 | | | | 126.0 | | | | 126.0 | | | | 13.0 | | | | 0.40 | | | | 0.10 | | | | 41.6 | |
| | | | 162.0 | | | | 171.0 | | | | 9.0 | | | | 17.9 | | | | 0.16 | | | | 0.36 | | | | 56.9 | |
| LJ DD12-72 | | | 0.0 | | | | 127.0 | | | | 127.0 | | | | 3.0 | | | | 0.08 | | | | 0.06 | | | | 12.2 | |
| LJ DD12-73 | | | 4.0 | | | | 116.0 | | | | 110.0 | | | | 6.7 | | | | 0.07 | | | | 0.07 | | | | 16.2 | |
| LJ DD12-74 | | | 47.0 | | | | 278.0 | | | | 231.0 | | | | 13.5 | | | | 0.03 | | | | 0.31 | | | | 41.7 | |
| LJ DD12-75 | | | 114.0 | | | | 132.0 | | | | 18.0 | | | | 14.2 | | | | 0.80 | | | | 0.08 | | | | 61.1 | |
| | | | 208.0 | | | | 251.0 | | | | 43.0 | | | | 28.2 | | | | 0.06 | | | | 0.19 | | | | 47.5 | |
| | | | 332.0 | | | | 354.0 | | | | 22.0 | | | | 66.4 | | | | 0.31 | | | | 0.12 | | | | 92.2 | |
| LJ DD12-76 | | | 11.7 | | | | 19.7 | | | | 8.0 | | | | 28.8 | | | | 0.07 | | | | 0.07 | | | | 38.3 | |
| | | | 36.6 | | | | 67.0 | | | | 30.4 | | | | 10.8 | | | | 0.05 | | | | 0.10 | | | | 21.9 | |
| LJ DD12-79 | | | 102.0 | | | | 150.8 | | | | 48.8 | | | | 53.1 | | | | 0.06 | | | | 0.37 | | | | 87.9 | |
| LJ DD12-81 | | | 4.0 | | | | 24.0 | | | | 20.0 | | | | 20.0 | | | | 0.03 | | | | 0.09 | | | | 29.2 | |
| | | | 99.0 | | | | 114.2 | | | | 15.2 | | | | 22.1 | | | | 0.08 | | | | 0.37 | | | | 57.9 | |
| | | | 131.3 | | | | 206.0 | | | | 74.7 | | | | 3.3 | | | | 0.18 | | | | 0.08 | | | | 19.2 | |
| LJ DD12-82 | | | 118.5 | | | | 126.8 | | | | 8.3 | | | | 13.0 | | | | 0.09 | | | | 0.06 | | | | 22.7 | |
| | | | 149.3 | | | | 167.7 | | | | 18.4 | | | | 20.1 | | | | 0.04 | | | | 0.43 | | | | 59.1 | |
| LJ DD12-83 | | | 86.0 | | | | 139.3 | | | | 53.3 | | | | 12.6 | | | | 0.05 | | | | 0.30 | | | | 40.9 | |
| LJ DD12-84 | | | 60.3 | | | | 349.0 | | | | 288.7 | | | | 28.3 | | | | 0.09 | | | | 0.11 | | | | 42.3 | |
| LJ DD12-85 | | | 16.0 | | | | 139.5 | | | | 82.5 | | | | 13.5 | | | | 0.13 | | | | 0.09 | | | | 27.7 | |
| | | | 116.0 | | | | 139.5 | | | | 23.5 | | | | 43.7 | | | | 0.15 | | | | 0.25 | | | | 72.7 | |
| LJ DD12-86 | | | 67.0 | | | | 112.0 | | | | 45.0 | | | | 135.5 | | | | 0.11 | | | | 1.14 | | | | 239.0 | |
| | | | 168.0 | | | | 247.5 | | | | 79.5 | | | | 8.1 | | | | 0.41 | | | | 0.08 | | | | 35.5 | |
| | | | 316.7 | | | | 334.0 | | | | 17.3 | | | | 17.2 | | | | 0.43 | | | | 0.18 | | | | 54.2 | |
| | | | 378.0 | | | | 436.5 | | | | 58.5 | | | | 12.2 | | | | 0.54 | | | | 0.11 | | | | 48.7 | |
| LJ DD12-87 | | | 48.5 | | | | 106.0 | | | | 57.5 | | | | 5.4 | | | | 0.48 | | | | 0.11 | | | | 38.9 | |
| LJ DD12-88 | | | 12.0 | | | | 79.5 | | | | 67.5 | | | | 4.4 | | | | 0.17 | | | | 0.11 | | | | 22.4 | |
| LJ DD12-89 | | | 0.0 | | | | 217.0 | | | | 217.0 | | | | 13.1 | | | | 0.21 | | | | 0.06 | | | | 28.8 | |
| LJ DD12-91 | | | 9.6 | | | | 198.0 | | | | 188.4 | | | | 7.9 | | | | 0.08 | | | | 0.02 | | | | 13.6 | |
| | | | 71.0 | | | | 97.0 | | | | 26.0 | | | | 17.0 | | | | 0.22 | | | | 0.02 | | | | 29.7 | |
| LJ DD12-92 | | | 111.0 | | | | 126.8 | | | | 15.8 | | | | 11.9 | | | | 0.50 | | | | 0.11 | | | | 46.4 | |
| | | | 150.5 | | | | 161.5 | | | | 11.0 | | | | 23.8 | | | | 0.32 | | | | 0.35 | | | | 69.9 | |
| | | | 198.0 | | | | 208.0 | | | | 10.0 | | | | 6.9 | | | | 0.54 | | | | 0.08 | | | | 40.8 | |
| | | | 312.0 | | | | 402.0 | | | | 90.0 | | | | 6.6 | | | | 0.30 | | | | 0.20 | | | | 38.8 | |
| LJ DD12-94 | | | 0.0 | | | | 251.0 | | | | 251.0 | | | | 6.1 | | | | 0.08 | | | | 0.04 | | | | 13.5 | |
| | | | 168.0 | | | | 251.0 | | | | 83.0 | | | | 10.9 | | | | 0.10 | | | | 0.02 | | | | 17.6 | |
| LJ DD12-95 | | | 44.0 | | | | 76.0 | | | | 32.0 | | | | 29.4 | | | | 0.08 | | | | 0.22 | | | | 52.3 | |
42
| | LA JOYA, NI 43-101 TECHNICAL REPORT |
| | RELEASED: MARCH 27, 2013 |
Table 13: Significant Drill Hole Intercepts > 5 M Length from Phase II Drilling
| | | | | | | | | Length* | | | Ag | | | Au | | | | | | AgEq* | |
| Hole | | From (m) | | | To (m) | | | | | | | | | | | | Cu (%) | | | | |
| | | | | | | | | (m) | | | (gpt) | | | (gpt) | | | | | | (gpt) | |
| | | | 174.4 | | | | 206.8 | | | | 32.4 | | | | 17.5 | | | | 0.12 | | | | 0.07 | | | | 29.5 | |
| | | | 273.0 | | | | 286.5 | | | | 13.5 | | | | 75.9 | | | | 0.16 | | | | 0.47 | | | | 124.3 | |
| | | | 318.5 | | | | 338.0 | | | | 19.5 | | | | 7.1 | | | | 0.37 | | | | 0.07 | | | | 31.6 | |
| | | | 406.6 | | | | 429.4 | | | | 22.8 | | | | 20.3 | | | | 0.19 | | | | 0.09 | | | | 37.5 | |
| LJ DD12-96 | | | 60.0 | | | | 111.0 | | | | 51.0 | | | | 1.9 | | | | 0.24 | | | | 0.02 | | | | 15.6 | |
| LJ DD12-97 | | | 53.5 | | | | 98.0 | | | | 44.5 | | | | 15.0 | | | | 0.04 | | | | 0.08 | | | | 23.9 | |
| | | | 157.0 | | | | 184.2 | | | | 27.2 | | | | 5.9 | | | | 0.04 | | | | 0.48 | | | | 49.2 | |
| LJ DD12-98 | | | 60.0 | | | | 93.5 | | | | 33.5 | | | | 51.7 | | | | 0.83 | | | | 0.34 | | | | 122.4 | |
| | | | 125.5 | | | | 135.5 | | | | 10.0 | | | | 25.2 | | | | 0.13 | | | | 0.03 | | | | 34.3 | |
| L J DD12-100 | | | 78.6 | | | | 124.0 | | | | 45.4 | | | | 16.2 | | | | 0.44 | | | | 0.04 | | | | 41.6 | |
| | | | 168.0 | | | | 248.0 | | | | 80.0 | | | | 78.8 | | | | 0.31 | | | | 0.50 | | | | 137.3 | |
| | | | 299.5 | | | | 308.0 | | | | 8.5 | | | | 16.4 | | | | 0.40 | | | | 0.11 | | | | 45.9 | |
| | | | 400.0 | | | | 425.5 | | | | 25.5 | | | | 22.0 | | | | 0.04 | | | | 0.14 | | | | 36.0 | |
| LJ DD12-101 | | | 18.0 | | | | 64.0 | | | | 46.0 | | | | 10.9 | | | | 0.22 | | | | 0.07 | | | | 27.9 | |
| | | | 161.0 | | | | 211.0 | | | | 50.0 | | | | 6.1 | | | | 0.46 | | | | 0.10 | | | | 37.7 | |
| | | | 239.0 | | | | 256.0 | | | | 17.0 | | | | 12.8 | | | | 0.13 | | | | 0.14 | | | | 31.3 | |
| LJ DD12-102 | | | 20.0 | | | | 27.6 | | | | 7.6 | | | | 16.4 | | | | 0.11 | | | | 0.15 | | | | 34.8 | |
| | | | 228.5 | | | | 250.0 | | | | 21.5 | | | | 20.5 | | | | 0.19 | | | | 0.14 | | | | 42.0 | |
| | | | 342.0 | | | | 354.0 | | | | 12.0 | | | | 44.2 | | | | 0.83 | | | | 0.29 | | | | 110.6 | |
| | | | 380.0 | | | | 394.0 | | | | 14.0 | | | | 11.8 | | | | 0.54 | | | | 0.17 | | | | 53.4 | |
| | | | 463.0 | | | | 475.8 | | | | 12.8 | | | | 16.3 | | | | 0.14 | | | | 0.14 | | | | 35.3 | |
| | | | 542.9 | | | | 550.0 | | | | 7.1 | | | | 85.4 | | | | 0.19 | | | | 0.19 | | | | 111.2 | |
| LJ DD12-103 | | | 32.0 | | | | 70.0 | | | | 38.0 | | | | 9.6 | | | | 2.88 | | | | 0.06 | | | | 158.8 | |
| | | | 134.0 | | | | 288.3 | | | | 154.3 | | | | 28.1 | | | | 0.19 | | | | 0.22 | | | | 56.5 | |
| LJ DD12-104 | | | 61.5 | | | | 145.0 | | | | 83.5 | | | | 21.0 | | | | 0.26 | | | | 0.12 | | | | 44.3 | |
| | | | 200.2 | | | | 229.2 | | | | 29.0 | | | | 26.5 | | | | 0.03 | | | | 0.15 | | | | 40.9 | |
| | | | 302.5 | | | | 395.0 | | | | 91.0 | | | | 31.0 | | | | 0.18 | | | | 0.23 | | | | 59.8 | |
SilverCrest hole LJ DD11-86 presented in Table 13 intercepted 45.0 metres, near surface, grading 135.5 gpt Ag, 1.14 % Cu and 0.11 gpt Au. All sample preparation for SilverCrest-drilled holes and validation sampling was completed by ALS Chemex with sample preparation occurring in Zacatecas, Mexico, and analysis North Vancouver, Canada. Significant tungsten intervals include LJ DD12-94 with 93.0 metres at 0.101 % WO3 (Table 14).
43
| | LA JOYA, NI 43-101 TECHNICAL REPORT |
| | RELEASED: MARCH 27, 2013 |
Table 14: Recent Significant Tungsten Drill Intersections
| Hole | | From (m) | | | To (m) | | | Length (m) | | | WO3(%*) | | | Mo (%) | |
| | |
| | | | 9.6 | | | | 198.0 | | | | 188.4 | | | | 0.074 | | | | 0.042 | |
| LJ DD12-91 | | | | | | | | | | | | | | | | | | | | |
| | | | 71.0 | | | | 97.0 | | | | 26.0 | | | | 0.105 | | | | 0.080 | |
| | | | 0.0 | | | | 251.0 | | | | 251.0 | | | | 0.064 | | | | 0.013 | |
| LJ DD12-94 | | | | | | | | | | | | | | | | | | | | |
| | | | 168.0 | | | | 251.0 | | | | 83.0 | | | | 0.101 | | | | 0.017 | |
| LJ DD12-96 | | | 60.0 | | | | 111.0 | | | | 51.0 | | | | 0.013 | | | | 0.002 | |
| | | | 53.5 | | | | 98.0 | | | | 44.5 | | | | 0.044 | | | | 0.016 | |
| LJ DD12-97 | | | | | | | | | | | | | | | | | | | | |
| | | | 157.0 | | | | 184.2 | | | | 27.2 | | | | 0.066 | | | | 0.002 | |
| | | | 16.0 | | | | 139.5 | | | | 82.5 | | | | 0.034 | | | | 0.011 | |
| LJ DD12-85 | | | | | | | | | | | | | | | | | | | | |
| | | | 116.0 | | | | 139.5 | | | | 23.5 | | | | 0.028 | | | | 0.005 | |
| LJ DD12-87 | | | 48.5 | | | | 106.0 | | | | 57.5 | | | | 0.048 | | | | 0.001 | |
| LJ DD12-88 | | | 12.0 | | | | 79.5 | | | | 67.5 | | | | 0.064 | | | | 0.006 | |
| | | | 0.0 | | | | 217.0 | | | | 217.0 | | | | 0.018 | | | | 0.002 | |
| LJ DD12-89 | | | | | | | | | | | | | | | | | | | | |
| | | | 113.0 | | | | 127.9 | | | | 14.9 | | | | 0.023 | | | | 0.002 | |
| | | | 11.7 | | | | 19.7 | | | | 8.0 | | | | 0.010 | | | | 0.001 | |
| LJ DD12-76 | | | | | | | | | | | | | | | | | | | | |
| | | | 36.6 | | | | 67.0 | | | | 30.4 | | | | 0.010 | | | | 0.005 | |
| | | | 118.5 | | | | 126.8 | | | | 8.3 | | | | 0.023 | | | | 0.001 | |
| LJ DD12-82 | | | | | | | | | | | | | | | | | | | | |
| | | | 149.3 | | | | 167.7 | | | | 18.4 | | | | 0.010 | | | | 0.000 | |
| LJ DD12-83 | | | 86.0 | | | | 139.3 | | | | 53.3 | | | | 0.036 | | | | 0.003 | |
| LJ DD12-60 | | | 0.0 | | | | 82.5 | | | | 82.5 | | | | 0.063 | | | | 0.006 | |
| LJ DD12-61 | | | 0.0 | | | | 80.0 | | | | 80.0 | | | | 0.055 | | | | 0.005 | |
| LJ DD12-62 | | | 0.0 | | | | 152.3 | | | | 152.3 | | | | 0.059 | | | | 0.004 | |
| LJ DD12-63 | | | 97.0 | | | | 201.0 | | | | 104.0 | | | | 0.022 | | | | 0.004 | |
| LJ DD12-64 | | | 4.0 | | | | 156.0 | | | | 154.0 | | | | 0.052 | | | | 0.005 | |
| LJ DD12-66 | | | 4.0 | | | | 106.5 | | | | 102.5 | | | | 0.063 | | | | 0.005 | |
| LJ DD12-72 | | | 0.0 | | | | 127.0 | | | | 127.0 | | | | 0.059 | | | | 0.003 | |
| LJ DD12-73 | | | 4.0 | | | | 116.0 | | | | 110.0 | | | | 0.056 | | | | 0.003 | |
| LJ DD12-74 | | | 47.0 | | | | 278.0 | | | | 231.0 | | | | 0.028 | | | | 0.007 | |
| incl. | | | 212.3 | | | | 247.5 | | | | 35.2 | | | | 0.037 | | | | 0.002 | |
* Cut-off of 0.05% W. WO3 = W x 1.26. All numbers are rounded
Phase II drilling within the contact skarn confirms the tungsten mineralization in the form of scheelite hosted in dark grey translucent veining near to the intrusive contact (Photo 2). Ongoing labwork in being conducted to determine mineralogy of the hydrothermal system.
44
| | LA JOYA, NI 43-101 TECHNICAL REPORT |
| | RELEASED: MARCH 27, 2013 |
Photo 2: Close-up of Scheelite mineralization contact skarn in natural (left) and UV (right) light. Width of rock is 63mm.
11.0 SAMPLE PREPARATION, ANALYSES AND SECURITY
11.1 Historic Sample Preparation
Limited information on sample preparation and analysis by historical operators prior to SilverCrest was available to EBA. Historical drill core was stored at a locked and secured facility currently managed by Goldcorp in Vicente Guerrero, a small city 10 kilometres to the south of the village of La Joya. Based on this field investigation, EBA feels that sampling methodology for the SAC98-series, COL99-series, LB96-series and selective S-series drill holes are appropriate and of quality that is adequate at the exploration stage and resource estimation. Information regarding sample preparation of the past operators; Luismin (1977- 1997); Luismin-Boliden (1998 - 2002) and Solid Resources (2006 - 2009) is summarized in the Phase I resource estimation: "Resource Estimation for the La Joya Property Durango, Mexico. NI 43-101 Technical Report Prepared for SilverCrest Mines Inc." (Effective date: January 5th 2012).
11.2 SilverCrest Sample Preparation and Analysis, 2010-2013
The Phase I and II drill programs included procedures for the collection and labelling of the drill core. HQ size drill core (63.5 mm diameter) was recovered from drilling and stored in vinyl boxes, each of which contains approximately 2.25 metres of core. Drill runs were identified in the field by drillers using markers in the core boxes at 3 metre intervals. These intervals were validated by SilverCrest geologists. Core recovery values were measured relative to these markers.
Recovered drill core was boxed by the drillers on-site. The core boxes were collected and delivered twice daily to the SilverCrest core logging facility in the community of La Joya where the core was logged and sampled by SilverCrest technical staff. Core is currently stored inside this facility for future viewing and reference.
45
| | LA JOYA, NI 43-101 TECHNICAL REPORT |
| | RELEASED: MARCH 27, 2013 |
Core logging procedures included review of the core quality and recording of recovery, lithological, geotechnical and mineralogical data within standardized company logging forms. After characterizing the mineralized zone, SilverCrest geologists marked the start and end of each interval for sampling. Every drill hole was sampled in its entirety, with unmineralized core samples having lengths ranging from 1.5 to 5 metres and samples with disseminated to massive mineralization having sample lengths ranging from 0.3 to 1.5 metres. A histogram distribution of sample length is shown in Figure 11 and Figure 12.
Figure 11: Log histogram distribution of sample lengths from Phase II
Figure 12: Log histogram distribution of sample lengths from Historic, Phase I and II drilling
46
| | LA JOYA, NI 43-101 TECHNICAL REPORT |
| | RELEASED: MARCH 27, 2013 |
Sample intervals were recorded on the core box with sample tags. The intervals were marked on the drill core which was cut in half by a SilverCrest technician using a diamond saw blade within the core storage facility. Half of the core was sealed in a sample bag with the corresponding sample tag. The other half of the core sample was returned to the core box for company record and future viewing. Sample numbers, intervals, and descriptions were recorded on the standardized drill logs. Besides typical laboratory standards, SilverCrest did not insert reference standard or blank material, and no company duplicates were collected in the Phase I program. During the Phase II program, a procedure was established for the insertion of blank and standard reference material. No company duplicates were collected. Discussion of SilverCrest's QA/QC program is included in Sections 12.2 and 12.3.
11.2.1 Laboratory Selection
For the Phase 1 program, samples collected by SilverCrest for analysis were sent to the Mina Santa Elena on-site laboratory located in Banamichi, state of Sonora Mexico, operated by Nusantara de Mexico SA de CV, a subsidiary of SilverCrest Mines Inc. Samples flagged as containing anomalous grades of silver, copper or gold were shipped for verification analysis to the ISO 9001:2008 certified Inspectorate Laboratories, Exploration and Mining Services, located in Reno, Nevada, USA. The remaining sample pulps and coarse rejects were stored at the Nusantara mine facility and later sent to the ISO/IEC 17025:2005 certified ALS- Chemex Laboratories of North Vancouver, Canada, for analysis. Following the completion of hole LJ-DD10- 04, all samples were sent to the ALS-Chemex facility following screening at the Nusantara laboratory.
Phase I laboratory selection and analytical procedures for; SilverCrest's Mina Santa Elena; Inspectorate and ALS Chemex laboratories are described in Section 11.4 of: "Resource Estimation for the La Joya Property Durango, Mexico. NI 43-101 Technical Report Prepared for SilverCrest Mines Inc." (Effective date: January 5th 2012).
All Phase II samples were sent directly to the ISO/IEC 17025:2005 certified ALS-Chemex facilities. Samples were transported to ALS-Chemex in Zacatecas, Mexico for preparation, with subsequent shipping of sample pulps by ALS-Chemex to their North Vancouver, BC lab for geochemical analysis.
Sample pulps sent to the ALS-Chemex laboratory were subjected to digestion using an aqua regia solution, and analysis was completed by an ICP-AES 35 element package (ME-ICP41) as well as by fire assay with AA finish for gold (Au-AA23) and ore grade methods for silver and copper (Ag-OG46, Cu-OG46).
A suite of samples selected to best represent the different rock types on the property were submitted to ALS for specific gravity determination using the pycnometer method for pulps (OA-GRAb). Specific gravity is discussed below in Section 14.2.3.
11.2.3 Sample Storage and Security
All samples were stored within SilverCrest's secure core storage facility and transported by SilverCrest personnel to the Inspectorate analytical laboratory preparation facility located in the city of Durango, state of Durango, or were picked up by an ALS-Chemex representative for delivery to their preparatory facility located in Zacatecas, state of Zacatecas. Sample tracking up to delivery at the laboratory was conducted by the certified laboratory as standard practice with reporting of analyses upon completion.
47
| | LA JOYA, NI 43-101 TECHNICAL REPORT |
| | RELEASED: MARCH 27, 2013 |
11.3 QP Statement
James Barr, P.Geo of EBA and independent QP has reviewed the original laboratory analytical certificates for SilverCrest Phase I and laboratory certificates for the Phase II diamond drilling, and has reviewed the sampling protocols that have been implemented by SilverCrest personnel on site. EBA is of the opinion that sampling methods and analytical procedures have been conducted in an appropriate manner and are reliable and sufficient for inclusion to mineral resource estimation and NI 43-101 reporting. Improved QA/QC diligence was recommended by EBA and has been implemented during the Phase II program.
James Barr, P.Geo, of EBA and independent QP has visited the La Joya property on seven occasions between November 2010 and October 2012. Sampling of the recent SilverCrest drill core and chip samples and preserved historic drill core samples were collected for independent laboratory analysis during four of these site visits as a means to verify reported analytical results. EBA collected duplicate samples from core available at the SilverCrest core logging facility in the community of La Joya, and a core storage facility managed by Goldcorp in the city of Vincente Guerrero. Certified Reference Material (CRM) were inserted to validate the precision of laboratory analysis for each site visit.
12.1 Site Visit IV: October 2012
During the fourth verification site visit by James Barr, P.Geo., from October 8th to 18th, 2012, nine verification samples were taken from 6 of the Phase II SilverCrest drill holes from MMT, Santo Nino and Coloradito that had been stored at a secured on site facility (Photo 3) (Table 15).
The samples were transported from the core facility in La Joya to the ALS-Chemex preparation facility in Zacatecas, Mexico, by ALS personnel. The samples were sent for analysis at the ALS-Chemex Laboratory in Vancouver, BC, Canada, to replicate the methodology used by SilverCrest methods outlined in Section 11.3.1. CRM CDN-ME-16 and CDN-W-4 Table 16 and Table 17) were included with the core samples, no control samples were inserted for verification of the specific gravity testing.
A percent difference is calculated for comparison between the EBA duplicates and the recorded historical results. CRM certificates are in Appendix B.
48
| | LA JOYA, NI 43-101 TECHNICAL REPORT |
| | RELEASED: MARCH 27, 2013 |
Photo 3: Verification sample of SilverCrest drill core LJ DD12-74 Sample # 90037
Table 15: Drill Core Samples and Duplicates Collected by EBA, October 2012
| | | Depth From | | | Au | Ag | | Mo | W | Pb | Zn |
| Hole | Area | | Company | SAMPLE | | | Cu (%) | | | | |
| | | - To (m) | | | (gpt) | (gpt) | | (ppm) | (ppm) | (ppm) | (ppm) |
| |
| | | | SilverCrest | 21977 | 0.042 | 0.6 | 0.0241 | 126 | 1760 | 4 | 118 |
| LJ DD12-72 | MMT | 101.85-102.45 | EBA | 500424 | 0.022 | 0.4 | 0.0076 | 120 | 1380 | 8 | 55 |
| | | | % Difference | 62.50 | 40.00 | 104.10 | 4.88 | 24.20 | -66.67 | 72.83 |
| | | | SilverCrest | 21580 | 0.239 | 7.2 | 0.285 | 38 | 320 | 3 | 248 |
| LJ DD12-66 | MMT | 50 -52 | EBA | 500426 | 0.342 | 6.6 | 0.255 | 37 | 370 | 4 | 297 |
| | | | % Difference | -35.46 | 8.70 | 11.11 | 2.67 | -14.49 | -28.57 | -17.98 |
| | | | SilverCrest | 90557 | 0.043 | 9.8 | 0.0487 | 17 | 20 | 500 | 1725 |
| LJ DD12-75 | MMT | 299 - 301 | EBA | 500416 | 0.048 | 10.6 | 0.086 | 22 | 70 | 479 | 1530 |
| | | | % Difference | -10.99 | -7.84 | -55.38 | -25.64 | -111.11 | 4.29 | 11.98 |
| | | | SilverCrest | 90587 | 0.13 | 713 | 0.423 | 16 | 1500 | 47600 | 52200 |
| LJ DD12-75 | MMT | 352.8 - 354 | EBA | 500417 | 0.093 | 646 | 0.417 | 21 | 1270 | 41700 | 45600 |
| | | | % Difference | 33.18 | 9.86 | 1.43 | -27.03 | 16.61 | 13.21 | 13.50 |
| | | | SilverCrest | 90821 | 0.346 | 487 | 4.78 | 4 | <10 | 57 | 70 |
| LJ DD12-86 | MMT | 93.75 - 94.75 | EBA | 500418 | 0.261 | 378 | 3.17 | 7 | 330 | 8500 | 10650 |
| | | | % Difference | 28.01 | 25.20 | 40.50 | -54.55 | N/A | -197.34 | -197.39 |
| LJ DD12-86 | MMT | 426.5 - 428.5 | SilverCrest | 90995 | 1.515 | 75.8 | 0.926 | 7 | <10 | 10 | 206 |
49
| | LA JOYA, NI 43-101 TECHNICAL REPORT |
| | RELEASED: MARCH 27, 2013 |
| |
| |
| Table 15: Drill Core Samples and Duplicates Collected by EBA, October 2012 | | | | | | | |
| |
| | | | Depth From | | | Au | Ag | | Mo | W | Pb | Zn | |
| Hole | Area | | Company | SAMPLE | | | | | Cu (%) | | | | | |
| | | | - To (m) | | | (gpt) | (gpt) | | (ppm) | (ppm) | (ppm) | (ppm) | |
| |
| | | | | | EBA | 500419 | 1.59 | 61.1 | 0.701 | 4 | 10 | 96 | 153 | |
| | | | | | % Difference | -4.83 | 21.48 | 27.66 | 54.55 | N/A | -162.26 | 29.53 | |
| | | | | | SilverCrest | 90037 | 0.114 | 301 | 10.25 | 7 | 480 | 9 | 7130 | |
| | Santo | | | | | | | | | | | | | | |
| LJ DD12-74 | Nino | 221.5-222.5 | | EBA | 500421 | 0.117 | 315 | 11.2 | 3 | 430 | 27 | 8560 | |
| | | | | | % Difference | -2.60 | -4.55 | -8.86 | 80.00 | 10.99 | -100.00 | -18.23 | |
| | | | | | SilverCrest | 27536 | 0.091 | 20.5 | 0.0165 | 2080 | 760 | 202 | 397 | |
| LJ DD12-91 | COL | 60 - 61 | | EBA | 500422 | 0.077 | 21.7 | 0.0323 | 1760 | 570 | 385 | 511 | |
| |
| | | | | | % Difference | 16.67 | -5.69 | -64.75 | 16.67 | 28.57 | -62.35 | -25.11 | |
| | | | | | SilverCrest | 27510 | 0.031 | 5.4 | 0.412 | 57 | 340 | 11 | 35 | |
| LJ DD12-91 | COL | 14 - 15 | | EBA | 500423 | 0.044 | 6.3 | 0.46 | 31 | 220 | 4 | 62 | |
| | | | | | % Difference | -34.67 | -15.38 | -11.01 | 59.09 | 42.86 | 93.33 | -55.67 | |
| |
| |
| Table 16: Certified Reference Material CDN-ME-16 Comparison - October 2012 | | | | | | |
| |
| CRM | | | Sample | Au (gpt) | Ag (gpt) | Cu (%) | |
| | | | 500420 | Returned | 1.56 | 32.7 | 0.687 | |
| CDN-ME-16 | CDN-ME-16 | Expected | 1.48±0.14 | 30.8±2.2 | 0.671±0.036 | |
| | | | % Difference | -5.26 | -5.98 | -2.36 | |
| |
| Table 17: Certified Reference Material CDN-W-4 Comparison - October 2012 | | | | | | | |
| |
| CRM | | | Sample | Au (gpt) | Cu (%) | Mo (%) | W (%) | |
| | | | 500425 | Returned | 0.331 | 0.141 | 0.0665 | 0.273 | |
| CDN-W-4 | | | CDN-W-4 | Expected | 0.319±0.040 | 0.139±0.008 | 0.11±0.008 | 0.366±0.024 | |
| | | | % Difference | -3.69 | -1.43 | 49.29 | 29.11 | |
Duplicate samples were generally reproduced within an acceptable level of variability, with the exception of the first sample taken from drill hole LJ DD12-86 where analytical results from the EBA duplicate sample report higher for W, Pb and Zn. This, again, suggests heterogeneity within the skarn mineralization.
The CRM analysis indicates a slightly positive bias grade for Au, Ag, and Cu in both standard reference material samples; however results are well within the acceptable error limits, as reported by CDN Laboratories. This confirms that laboratory methods used by ALS are appropriate. Mo and W results show negative bias outside acceptable error limits but given field observations is most likely due to the nature of W and Mo mineralization.
50
| | LA JOYA, NI 43-101 TECHNICAL REPORT |
| | RELEASED: MARCH 27, 2013 |
12.2 Phase II Sampling QA/QC
12.2. SilverCrest Certified Reference Material Insertions
Insertion of certified reference materials (CRM) was included in the Phase II drill program. In the early stages of the drill program the inclusion of CRM was sporadic, later in the program material was consistently included, typically as one CRM and one blank per drill hole or sample batch. Table 18 outlines the standards that were sourced from CDN Resource Laboratories Ltd in Vancouver by SilverCrest.
Table 18: Certified Reference Material Reporting Values Used in Phase II by SilverCrest.
| CRM | Au gpt | Ag gpt | Cu % |
| CDN-GS-5J | 4.95+/-0.42 | 72.5+/-4.8 | Not Reported |
| CDN-CM-17 | 1.37+/-0.13 | 14.4 +/- 1.4 | 0.791+/-0.13 |
| CDN-ME-5 | 1.07+/-0.14 | 206.1+/-13.1 | 0.840+/-0.048 |
CRM insertion were not routinely noted in the drill hole logs or database received from SilverCrest and when noted it was labelled as a "bco", or rarely as "STD" notation. Distinguishing between blanks and standards, and differentiating the individual CRM references relied heavily on the comparison of results and observation of where relative sample grades plotted on scatter plots. The criteria for identifying CRM was based on finding positive co-relation of two metal results from each assay being within +/-2SD of the average reported SRM. EBA flagged 51 samples as CRM based on this criteria. The remaining insertions were determined as being blanks. CRM certificates are in Appendix B.
The samples identified as CRM are plotted in Figure 13 to Figure 20 below relative to the mean (red line) and +/- 2SD (purple lines) reported by CDN Laboratories for each CRM.
Figure 13: CRM CDN-CM-17 (Ag)
51
| | LA JOYA, NI 43-101 TECHNICAL REPORT |
| | RELEASED: MARCH 27, 2013 |
Figure 14: CRM CDN-CM-17 (Au)
Figure 15: CRM CDN-CM-17 (Cu%)
CDN-CM-17 shows a general correlation with +/-2SD, apart from the single standard from ZA12231215 that may be a blank but thought to be a CRM based on the high Au and conforming Ag value.
52
| | LA JOYA, NI 43-101 TECHNICAL REPORT |
| | RELEASED: MARCH 27, 2013 |
Figure 16: CRM CDN-GS-5J (Ag)
Figure 17: CRM CDN-GS-5J (Au)
Figure 16 and Figure 17 show only two metals are reported in CRM CDN-GS-5J. Ag result comparisons generally follow the +/-2 SD with two samples slightly above the upper +2 SD threshold. The Au CRM in batch number ZA12139360 reported <0.005 but due to the conformity of the Ag value being appropriate for CRM it was proposed it may be CRM with a non-reporting Au value.
53
| | LA JOYA, NI 43-101 TECHNICAL REPORT |
| | RELEASED: MARCH 27, 2013 |
Figure 18: CRM CDN-ME-5 (Ag)
Figure 19: CRM CDN-ME-5 (Au)
54
| | LA JOYA, NI 43-101 TECHNICAL REPORT |
| | RELEASED: MARCH 27, 2013 |
Figure 20: CRM CDN-ME-5 (Cu)
CRM CDN-ME-5 reported Ag conforming to the +/-2SD threshold values, sporadic Au values and two Cu CRM certificate values, ZA12119378 and ZA12106919, that were of zero value, but were included due to their conforming Ag and Au values.
12.2.2 SilverCrest Blank Material Insertions
Of the complete set of "bco" and "STD" extracted from the database 176 assay results where sub-setted as blank material based on their non conformity to two or more of the CRM (or one in the case of CRM CDN- GS-5J). Figure 21 to Figure 23 show the 176 samples of blank material with variable metal values and the lower detection limit (red line) at 0.005 (Au), 0.2 (Ag) & 0.001 (Cu).
55
| | LA JOYA, NI 43-101 TECHNICAL REPORT |
| | RELEASED: MARCH 27, 2013 |
Figure 21: SilverCrest Phase II mineralized blank material Ag (gpt)
Figure 22: SilverCrest Phase II mineralized blank material Au (gpt)
56
| | LA JOYA, NI 43-101 TECHNICAL REPORT |
| | RELEASED: MARCH 27, 2013 |
Figure 23: SilverCrest Phase II mineralized blank material Cu (%)
The majority of the blank samples inserted by SVL for QA-QC control exhibit anomalous metal content. EBA determined it was unlikely that the results indicated contamination to the samples on site or during laboratory preparation through inspection of individual assay records. Samples containing the seven highest Au grades and were compared to the adjacent, and consecutive samples, from each respective sample batch. In all but two cases, a sample sequentially before and after the anomalous sample had a higher Au value. In one situation the four preceding and subsequent samples were below detection limit (<0.005). It is concluded that the source blank material selected and used by SilverCrest is influenced by the skarn metasomatic alteration and most likely contains anomalous metal concentrations.
12.3 QP Statement
James Barr, P.Geo, has reviewed and collected duplicate samples from drill core. EBA has no reason to believe that the SilverCrest grades reported from the Phase II drill programs were misrepresented or incorrectly sampled. Differences observed in the reported grades do not appear to be biased and can be attributed to heterogeneity in mineral distribution.
Verification sampling of SilverCrest drill core show a weak positive bias in average gold, silver, and copper results relative to the historical Luismin data. The duplicate samples collected by EBA returned results that are similar in magnitude and generally within acceptable limits for QA-QC and for use in mineral resource estimation. The data supports some heterogeneity exists in mineral distribution.
The QA-QC insertion program implemented by SilverCrest during the Phase II campaign included CRM and blanks. The CRM insertions appeared to be poorly identified in sampling records and blank insertions show the presence of anomalous metals. As there is no evidence of contamination of the samples either at the site or at the prep lab, it is felt the source of these metals is from the blank material being used. EBA strongly recommends that SilverCrest select proper blank material and discontinue the use of limestone from recent company drilling on the property. EBA also recommends that a detailed duplicate sampling procedure be implemented in future work to quantify and isolate the source of heterogeneity. Based on the independent inspection of drill core and personal observation, it is felt that the data can be verified. However, it is strongly recommended that SilverCrest implement a reliable QA-QC regime for more advanced exploration on the property.
57
| | LA JOYA, NI 43-101 TECHNICAL REPORT |
| | RELEASED: MARCH 27, 2013 |
13.0 MINERAL PROCESSING AND METALLURGICAL TESTING
SilverCrest completed preliminary metallurgical testwork in 2011 on core samples collected from three mineralization zones within the MMT as representative composites for Manto, Structure and Contact Zone mineralization. The tests were directed under Dr. José Refugio Parga in the Laboratories of Instituto Tecnológico de Saltillo to explore the amenability of the conventional flotation for copper concentrating with gold and silver components. In addition, the preliminary tungsten recovery process was investigated by using magnetic/gravity separation methods. The results of this test work were was included within the report titled "Resource Estimate for the La Joya Property Durango, Mexico. NI 43-101 Technical Report Prepared for SilverCrest Mines Inc." (January 5th 2012) and are summarized below in Section 13.1.
Recently, a subsequent metallurgical test program was initiated on September 2012 at G&T Metallurgical Services, now ALS Metallurgy (ALS), in Kamloops, BC, Canada. This test program was designed to confirm the amenability of conventional flotation of mineralized materials from the MMT using processes for production of copper concentrates with gold and silver credits. The test work consists of head analysis, chemical element and mineralogy analysis, crushing ability and grindability, batch scale flotation tests, lock cycle flotation tests and concentrate quality investigation.
The ALS test work is still in progress in preparing this report, however, preliminary results are stated below together with the previous work supervised by Dr. José Refugio Parga. The final test report is expected to be available by end of April 2013.
13.1 Initial Test Work at Instituto Tecnológico de Saltillo - 2011
SilverCrest completed preliminary metallurgical testwork in 2011 on core samples collected from three mineralization zones within the MMT as representative composites for Manto, Structure and Contact Zone mineralization. The tests were directed under Dr. José Refugio Parga in the Laboratories of Instituto Tecnológico de Saltillo to explore the amenability of the conventional flotation for copper concentrating with gold and silver components. In addition, the preliminary tungsten recovery process was investigated by using magnetic/gravity separation methods.
The three samples are identified as follows:
Sample CZ: Contact Zone with Ag-Cu-Pb-Zn-Au-W mineralization
Sample ST: Vertical structure stockwork zone with Ag-Cu-Au-Pb-Zn mineralization, and
Sample MA: Multistacked polymetallic mantos with Ag-Cu-Au-Pb-Zn mineralization
Each sample was crushed and ground to minus 2 mm (-10 mesh) and then blended to have homogeneous composites. X-ray diffraction analysis (XRD) was employed to determine the element species and concentration. The mineralogy analysis was performed by using Scanning Electron Microscopy (SEM) technology.
58
| | LA JOYA, NI 43-101 TECHNICAL REPORT |
| | RELEASED: MARCH 27, 2013 |
The chemical analysis results are presented in Table 19. Gold concentration seems uniform among all the samples ranged from 0.27 to 0.34 gpt. Silver grades are high in Sample ST and MA, about 131 gpt and 119 gpt respectively, while Sample CZ contained the lowest silver component of 17 gpt. The copper grade in Sample CA is very low with an average of 0.06%, whilst in the other two samples ST and MA it is relatively high of about 0.9% and 0.8%, respectively. Presence of tungsten was identified in Sample CA in an average of 0.021% WO3.
Table 19: Element Analysis - Samples CZ, ST and MA
| | Au | Ag | Pb | Zn | Cu | Fe | As | Sb | WO3 |
| SAMPLE | | | | | | | | | |
| | (gpt) | (gpt) | (%) | (%) | (%) | (%) | (%) | (%) | (%) |
| CZ | 0.26 | 17 | 0.10 | 0.19 | 0.07 | 2.05 | 0.02 | 0.10 | |
| CZ | 0.27 | 18 | 0.11 | 0.16 | 0.06 | 2.20 | 0.03 | 0.07 | |
| Average CZ | 0.265 | 17.5 | 0.105 | 0.175 | 0.065 | 2.125 | 0.025 | 0.085 | 0.021 |
| ST | 0.32 | 131 | 0.20 | 0.43 | 0.91 | 3.40 | 0.62 | 0.40 | |
| ST | 0.36 | 132 | 0.20 | 0.42 | 0.90 | 5.01 | 0.77 | 0.35 | |
| Average ST | 0.34 | 131.5 | 0.20 | 0.425 | 0.905 | 4.205 | 0.695 | 0.375 | ND |
| MA | 0.25 | 117 | 0.01 | 0.06 | 0.80 | 1.23 | 0.02 | 0.06 | |
| MA | 0.27 | 120 | 0.01 | 0.04 | 0.75 | 1.50 | 0.02 | 0.03 | |
| Average MA | 0.26 | 118.5 | 0.01 | 0.05 | 0.775 | 1.365 | 0.02 | 0.045 | ND |
The main mineral species identified in the samples are indicated in Table 20 to Table 22. For Sample CZ, it was determined that silver is associated with galena, and gold is associated with iron ore (pyrite and magnetite). Chalcopyrite was also identified. For Sample ST, silver is associated with copper species and gold with arsenopyrite. For Sample MA, copper was found with silver. Bornite and chalcopyrite were identified.
Table 20: Mineral Species - Sample CZ. Samples
| NAME | FORMULA |
| Quartz | SiO2 |
| Pyrite | FeS2 |
| Galena | PbS |
| Troilite | FeS |
| Silver, Aluminum, Zinc Sulfide | (AgOAlZn)S |
| Calcite | CaCO3 |
| Chalcopyrite | CuFeS2 |
| Magnetite | Fe3O4 |
Scheellitea | CaWO4 |
a Work is undergoing to determine the mineralogical nature and proportions of the tungsten species.
59
| | LA JOYA, NI 43-101 TECHNICAL REPORT |
| | RELEASED: MARCH 27, 2013 |
Table 21: Mineral Species - Sample ST
| NAME | FORMULA |
| Stannite | Cu2(Fe,Zn)SnS4 |
| Pyrite | FeS2 |
| Galena | PbS |
| Sphalerite | ZnS |
| Arsenopyrite | AsFeS2 |
| Choloalite | Te6(Cu,Sb)(Pb,Ca)O18Cl |
| Quartz | SiO2 |
| Freibergite | AgCuSbS |
| Magnetite | Fe3O4 |
Table 22: Mineral Species - Sample MA
| NAME | FORMULA |
| Freibergite | AgCuSbS |
| Bornite | Cu5FeS4 |
| Chalcopyrite | CuFeS2 |
| Sphalerite | ZnS |
| Quartz | SiO2 |
| Lead Sulfate Oxide | PbSO4(PbO)2 |
| Magnetite | Fe3O4 |
| Arsenopyrite | FeAsS2 |
The preliminary test results are summarized in the following paragraphs.
| | A series of flotation tests were done with varied reagents dosage. The bulk concentrate from the CZ sample was low in quality, grading at 3.10 gpt Au, 423 gpt Ag, 2.1% Cu, 3.44% Zn and 2.71% Pb. |
| | Additionally, preliminary testwork was done to find out if tungsten components could be upgraded with a magnetic treatment and/or a gravity separation stage. In both cases the concentration of tungsten increased but not significantly to consider the products of commercial grade. More work is ongoing to define the operational parameters and possible routes for tungsten recovery. |
| | The flotation circuit arrangement was rougher/scavenger with scavenger concentrates back to rougher flotation stage. Zinc and pyrite were depressed in the process. A concentrate better than 20% Cu can be obtained in this way with gold and silver values in the range of 3 gpt Au and 1800 gpt Ag. The recoveries for copper, silver and gold were 82%, 92% and 67% respectively. |
60
| | LA JOYA, NI 43-101 TECHNICAL REPORT |
| | RELEASED: MARCH 27, 2013 |
| | The flotation circuit was the same as for samples ST. It was shown that sample MA was floated easily and responded very well with depression of zinc, pyrite and arsenopyrite. Typical bulk concentrates were grading above 4 gpt Au, 2600 gpt Ag and 20% Cu. The average recoveries for silver and copper were all above 90%. The average gold recovery was about 60%. |
13.2 Test Work at ALS - 2012 to 2013
The sample composites were selected from drill cores from central Main Mineralized Trend (MMT) to represent three mineralogical types of materials including Manto, Structure, and Contact Zones.
A memo regarding sample selection was generated by EBA after discussions between SilverCrest, WEI and EBA (Appendix C). EBA selected a suite of drill core samples based on information available at that time, which included the geological model for the Phase I program, complete drill logs and assay data for drill holes LJ-DD10-01 through LJ-DD11-26, and partial drill logs and assay information for drill holes LJ-DD11- 27 through LJ-DD12-54. A summary of the three composites is listed in Table 23.
Table 23: Composite Samples of Manto, Structure and Contact, 2012 Memo of La Joya Metallurgical Sample Selection
| | | | | | | Calculated | | Pb | Zn | | |
| Rock | Total | Estimated | Ag | Cu | Au | Average | W | Grade | Grade | Mo | Sn |
| | Length | | Grade | Grade | Grade | | Grade | | | Grade | Grade |
| Type | (m) | Mass (kg) | (gpt) | (%) | (gpt) | AgEQ | (%) | (%) | (%) | (%) | (%) |
| | | | | | | (gpt)* | | | | | |
| Manto | 37.7 | 91 | 51 | 0.29 | 0.38 | 94.94 | 0.002 | 0.01 | 0.02 | 0.002 | n/a |
| Structure | 35.9 | 86 | 66 | 0.47 | 0.17 | 114.92 | 0.002 | 0.05 | 0.085 | 0.002 | n/a |
| Contact | 49.6 | 119 | 3.76 | 0.07 | 0.10 | 14.78 | 0.046 | 0.003 | 0.015 | 0.009 | n/a |
Note: all the metal grades are based on weighted average values
* Silver equivalency includes silver, gold and copper and excludes lead, zinc, molybdenum and tungsten values. Ag:Au is 50:1, Ag:Cu is 86:1, based on 5 year historic metal price trends of US$24/oz silver, US$1200/oz gold, US$3/lb copper. 100% metallurgical recovery is assumed until testwork is finalized.
13.2.2 Test Program Scope
The ongoing test work consists of the following major components. Test work on lead, zinc, tungsten, molybdenum, and tin is included if head grades suggest potential economic levels.
| · | Head chemical analysis, whole rock analysis, and specific gravity tests |
| · | Head mineralogy/liberation tests |
| · | Crushability and grindability tests |
| · | Cu/Ag/Au flotation recovery tests |
| · | Concentrate quality tests |
61
| | LA JOYA, NI 43-101 TECHNICAL REPORT |
| | RELEASED: MARCH 27, 2013 |
The received drill core samples were stage crushed and screened to allow sub-sampling of metallurgical charges and comminution test charges. All test charges were sealed into plastic bags and stored at minus 10 degree Celsius.
Head assays were performed on representative and duplicate composite samples, and included determinations for Cu, Au, Ag, Fe, total S and total C, Cu(oxide), Cu(cyanide), Pb, Zn, Sn, W, Mo, as well as a multi-element ICP scan and whole rock analysis. Grind calibration and solids specific gravity were performed as well.
Mineralogy examinations included Particle Mineral Analysis (PMA) by QEMSCAN to provide liberation and mineral composition information.
Comminution tests for each composite included Bond ball mill work index and abrasion test.
Knelson gravity tests investigated gold, silver, tin, and tungsten recoveries on composite samples for the Contact Zone. Panning of Knelson concentrate were included. Further gravity test work is ongoing for the Manto and Structure Zones.
Flotation tests consisted of i) rougher flotation tests to determine the effects of primary grinding particle size, pH level, and reagent schedule; ii) cleaner flotation tests to determine regrinding particle size and reagent schedule; and iii) lock cycle tests on each composite sample.
13.2.3 Sample Preparation
Drill core samples from La Joya were received in 44 bags and prepared into three composites representing Manto, Structure, and Contact Zone material. Table 24 summarises the mass received of each sample composites. Each sample was prepared into head assay samples, comminution test charges and metallurgical charges.
Table 24: Sample Composites Summary
| Composite | Received Mass (kg) |
| Manto | 73.3 |
| Structure | 79.7 |
| Contact | 106.8 |
| Total | 259.8 |
| |
13.2.4 Sample Characterization
13.2.4.1 Head Assay and Specific Gravity
A chemical element analysis was performed on each composite sample. The measurement of tin (Sn) concentration was performed by using trace level XRF analysis in ALS's laboratory facility in North Vancouver, BC. Table 25 lists the average results from the analysis.
62
| | LA JOYA, NI 43-101 TECHNICAL REPORT |
| | RELEASED: MARCH 27, 2013 |
Table 25: Chemical Element Analysis
| | Cu | Pb | Zn | Fe | Mo | Ag | Au | S | C | CuOx | CuCN | W | Sn | TOC |
| Composite | | | | | | | | | | | | | | |
| | % | % | % | % | % | gpt | gpt | % | % | % | % | % | % | % |
| Manto | 0.36 | 0.03 | 0.02 | 3.90 | 0.003 | 51 | 0.15 | 0.21 | 1.90 | 0.020 | 0.27 | 0.008 | 0.083 | 0.05 |
| Structure | 0.45 | 0.07 | 0.11 | 5.28 | 0.002 | 64 | 0.24 | 0.28 | 1.81 | 0.053 | 0.36 | <0.002 | 0.086 | 0.04 |
| Contact | 0.07 | <0.01 | 0.01 | 2.43 | 0.011 | 3 | 0.09 | 0.26 | 0.15 | <0.001 | 0.003 | 0.042 | 0.01 | 0.04 |
13.2.4.2 JKTech SMC Tests
The SMC (SAG Mill Comminution) test was developed to provide a cost effective means of obtaining parameters from limited samples or drill cores, which are conventionally obtained from the standard JKTech drop-weight tests. Drill core samples were tested for JKTech SMC tests. The results are summarised in Table 26. Both Manto and Structure are medium hard in terms of resistance to impact breakage; while the Contact Zone sample composite has a lower A x b value and thus presents a harder resistance to impact breakage.
Table 26: JK Tech SMC Data
| | DWI | Mia | Mih | Mic | | Specific | | T10 @ 10 |
| Composite | kWh/m3 | kWh/t | kWh/t | kWh/t | A x b | Gravity | Ta | kWh/t |
| Manto | 7.13 | 17.5 | 13.1 | 6.8 | 44.2 | 3.16 | 0.36 | 0.33 |
| Structure | 6.89 | 17.7 | 13.2 | 6.8 | 44.2 | 3.04 | 0.38 | 0.33 |
| Contact | 10.58 | 24.5 | 19.9 | 10.3 | 29.0 | 3.09 | 0.24 | 0.50 |
13.2.4.3 Bond Ball Mill Grindability Tests
The three composites were submitted for Bond ball mill grindability tests (BWi). The test results are summarized in Table 27. All three composites presented a BWi in a range of 13 to 15 kwh/t, which indicate the tested materials are medium hardness.
63
| | LA JOYA, NI 43-101 TECHNICAL REPORT |
| | RELEASED: MARCH 27, 2013 |
Table 27: Bond Ball Grindability Test and Abrasion Test Results
| Composite | F80 (µm) | P80 (µm) | BWi * (kWh/t) |
| Manto | 2,464 | 80 | 14.9 |
| Structure | 2,329 | 82 | 14.6 |
| Contact | 2,304 | 83 | 13.2 |
* Note: All tests were conducted using a closing screen size of 106 µm
13.2.4.4 Abrasion Tests
The abrasion tests were conducted on the three composites with results presented in Table 28. All of the MMT composites can be categorised as mild abrasive materials.
Table 28: Abrasion Test Results
| Composite | Abrasion Index (g) |
| Manto | 0.088 |
| Structure | 0.149 |
| Contact | 0.142 |
13.2.5 Mineralogy Analysis
The mineralogy analyses with QEMSCAN were carried out on the composites at a particle size P80 of 150 µm. The mineral compositions are listed in Table 29. It can be seen that Structure zone composite has the highest concentration of sulphide minerals, followed by Manto and Contact Zone composites. Scheelite is mainly identified with Contact Zone sample. Molybdenite distribution is similarly to scheelite where the Contact Zone composite presents the highest concentration.
Table 29: Mineral Compositions
| Mineral | Manto (%) | Structure (%) | Contact (%) |
| Copper Sulphides | 0.59 | 0.74 | 0.24 |
| Pyrite/Arsenopyrite | 0.23 | 0.33 | 0.37 |
| Pyrrhotite | 0.01 | 0.02 | 0.05 |
| Scheelite | 0.01 | 0.00 | 0.07 |
| Molybdenite | 0.00 | 0.00 | 0,02 |
| Amphibole/Pyroxene | 20.0 | 18.2 | 40.0 |
| Feldspars | 2.6 | 4.6 | 19.6 |
| Quartz | 2.3 | 5.9 | 13.9 |
| Garnet | 37.8 | 38.6 | 10.7 |
| Non-Sulphide Gangue | 36.5 | 31.6 | 15.0 |
| Total | 100.0 | 100.0 | 100.0 |
64
| | LA JOYA, NI 43-101 TECHNICAL REPORT |
| | RELEASED: MARCH 27, 2013 |
The copper minerals deportments are listed in Table 30, together with other sulphide minerals distributions. The predominant copper minerals are Bornite> Chalcopyrite > Covellite/Chalcocite for Manto Zone composite, Covellite/Chalcocite Chalcopyrite > Bornite for Structure Zone composite, and Chalcopyrite > Bornite > Covellite/Chalcocite for Contact Zone composite.
The MMT is zoned metallugically in elevation from simple (closer to pre-erosion surface) to more complex with depth. The Manto and Structure mineralization defined as near-surface (0.0m to 100m average, post- erosion) are consisted highest grade in bornite transitioning into chalcopyrite closer to the intrusive contact or the Contact Zone. The near-surface Manto and Structure Zones are considered priority for evaluation of the La Joya Project.
Table 30: Copper Minerals Deportment
| Cu Minerals | Manto | Structure | Contact |
| | (%) | (%) | (%) |
| Chalcopyrite | 26.8 | 25.8 | 93.7 |
| Bornite | 41.4 | 16.6 | 4.4 |
| Covellite/Chalcocite | 26.7 | 55.7 | 1.8 |
| Enargite | 0.62 | 0.25 | 0.00 |
| Total | 100.0 | 100.0 | 100.0 |
| Other Sulphide Minerals | | | |
| Galena | 0.06 | 0.12 | 0.01 |
| Stibnite | 0.02 | 0.02 | 0.00 |
| Sphalerite | 0.04 | 0.11 | 0.02 |
| Bismuthinite | 0.00 | 0.01 | 0.00 |
13.2.6 Gravity Concentration
A series of preliminary gravity tests were carried out on contact sample for tungsten, tin, and precious metal recoveries. The results show a low tungsten recovery that may indicate tungsten is finely associated within the samples. More work is recommended to fully understand tungsten deportment to facilitate its recovery process. Silver and tin recoveries are both lower than 4%; however, the calculated gold recovery to gravity concentrate is about 24%. It is recommended to perform gravity concentration tests on both manto and structure composites to investigate tin and gold recoveries. The preliminary test results are shown in Table 31.
65
| | LA JOYA, NI 43-101 TECHNICAL REPORT |
| | RELEASED: MARCH 27, 2013 |
Table 31: Gravity Test Results On Contact Composite Samples
| | | Weight | | | Assay - percent or gpt | | | Distribution - percent | |
| Product | | | | | | | | | | | | | | | | | | | | | | | | | | | | | | | | | | | | | | | | | | | | | | | | | | | | | | | | | | | | | | | | | | |
| | | % | | | grams | | | Cu | | | Mo | | | Pb | | | Zn | | | Fe | | | | S | | | | W | | | Sn | | | Ag | | | Au | | | Cu | | | Mo | | | Pb | | | Zn | | | Fe | | | | S | | | | W | | | Sn | | | Ag | | | Au | |
| | |
| Pan Concentrate | | | 1.2 | | | | 23.9 | | | | 0.11 | | | | 0.013 | | | | 0.03 | | | | 0.03 | | | | 5.8 | | | | 2.14 | | | | 3009 | | | | 249 | | | | 4 | | | | 8.0 | | | | 2.0 | | | | 1.5 | | | | 3.4 | | | | 3.4 | | | | 2.6 | | | | 9.2 | | | | 7.4 | | | | 3.6 | | | | 2.2 | | | | 24.1 | |
| Pan Tail | | | 3.3 | | | | 64.9 | | | | 0.23 | | | | 0.027 | | | | 0.02 | | | | 0.02 | | | | 2.9 | | | | 0.82 | | | | 1710 | | | | 110 | | | | 8 | | | | 6.66 | �� | | | 11.2 | | | | 8.3 | | | | 6.2 | | | | 6.2 | | | | 3.5 | | | | 9.6 | | | | 11.5 | | | | 4.3 | | | | 11.8 | | | | 54.4 | |
| Knelson Tail | | | 95.5 | | | | 1895.8 | | | | 0.06 | | | | 0.010 | | | | 0.010 | | | | 0.01 | | | | 2.69 | | | | 0.24 | | | | 413 | | | | 80 | | | | 2 | | | | 0.09 | | | | 86.8 | | | | 90.2 | | | | 90.4 | | | | 90.4 | | | | 94.0 | | | | 81.2 | | | | 81.1 | | | | 92.1 | | | | 86.0 | | | | 21.5 | |
| | |
| Feed | | | 100.0 | | | | 1984.6 | | | | 0.07 | | | | 0.011 | | | | 0.01 | | | | 0.01 | | | | 2.73 | | | | 0.28 | | | | 487 | | | | 83 | | | | 2 | | | | 0.40 | | | | 100 | | | | 100 | | | | 100 | | | | 100 | | | | 100 | | | | 100 | | | | 100 | | | | 100 | | | | 100 | | | | 100 | |
13.2.7 Batch Rougher Flotation Tests
Batch rougher flotation tests were performed at natural pH on three composite samples ground to a particle size P80 of 150 µm and 180 µm. Reagent fuel oil was added in primary grinding mill while PAX was added in rougher flotation process. A total rougher retention time was of 12 minutes. The floated materials were collected every two minutes and assayed for Cu, Ag, Au, Mo and W.
The manto and structure composites showed a higher natural pH of 10.0 and 9.7, respectively; while contact had a natural pH value of 8.9. Figure 24 to Figure 27 show the impacts of primary grind size on copper, silver, gold, and molybdenum recoveries in rougher concentrate.
Figure 24: Copper Recovery vs.Rougher Concentrate Mass Pull
66
| | LA JOYA, NI 43-101 TECHNICAL REPORT |
| | RELEASED: MARCH 27, 2013 |
Figure 25: Silver Recovery vs. Rougher Concentrate Mass Pull
Figure 26: Gold Recovery vs. Rougher Concentrate Mass Pull
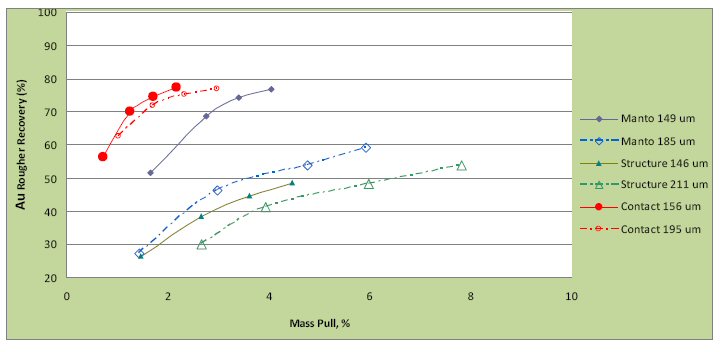
Figure 27: Molybdenum Recovery vs. Rougher Concentrate Mass Pull
67
| | LA JOYA, NI 43-101 TECHNICAL REPORT |
| | RELEASED: MARCH 27, 2013 |
13.2.8 Batch Cleaner Flotation Tests
The basic process flowsheet used in batch cleaner flotation test work is shown in Figure 28. The sample composite is ground to 80% passing 150 µm. Collectors PAX and fuel oil was added for a bulk concentrate flotation. Then the rougher concentrate is reground to a P80 of 20 µm prior to a three-stage cleaner circuit. Both rougher and cleaner stages floatation were performed at natural pH.
Figure 28: La Joya Batch Cleaner Flotation Test Diagram
The batch cleaner test results of the three composites reground to 80% passing 20 µm are summarised in Table 32. The copper grade in the third cleaner concentrate is high for both manto and structure composites with a value of 36.3% and 34.3%, respectively. Meanwhile, copper recovery to the third cleaner concentrate is promising of 86.7% for manto and 82.7 for structure. Contact composite has the lowest copper grade of 16.7% at a recovery of 83.6%.
68
| | LA JOYA, NI 43-101 TECHNICAL REPORT |
| | RELEASED: MARCH 27, 2013 |
Table 32: Summary of Batch Cleaner Test Results -Baseline
| | Wt | | | | Assay (%, gpt) | | | | | | | Distribution (%) | | | |
| Manto | | | | | | | | | | | | | | | | | |
| | % | Cu | Mo | Pb | Zn | Fe | S | Ag | Au | Cu | Mo | Pb | Zn | Fe | S | Ag | Au |
| 3rd Cl Conc | 0.8 | 36.3 | 0.27 | 1.95 | 1.25 | 11.1 | 20.9 | 4700 | 3.4 | 86.7 | 59.6 | 38.8 | 47.4 | 1.9 | 52.3 | 84.3 | 18.2 |
| 2nd Cl Conc | 1.0 | 28.6 | 0.22 | 1.59 | 0.99 | 10.1 | 16.6 | 3717 | 2.9 | 88.1 | 61.1 | 40.7 | 48.1 | 2.3 | 53.7 | 85.9 | 19.9 |
| 1st Cl Con | 2.0 | 15.7 | 0.12 | 0.92 | 0.55 | 8.1 | 9.27 | 2051 | 2.09 | 90.1 | 64.1 | 43.8 | 49.8 | 3.4 | 55.7 | 88.3 | 26.6 |
| Rough Con | 6.8 | 4.72 | 0.04 | 0.33 | 0.18 | 6.3 | 2.92 | 624 | 0.88 | 94.5 | 73.4 | 54.5 | 56.6 | 9.2 | 61.3 | 93.8 | 39.2 |
| Rough Tail | 93.2 | 0.02 | 0.001 | 0.02 | 0.01 | 4.6 | 0.14 | 3 | 0.10 | 5.5 | 26.6 | 45.5 | 43.4 | 90.8 | 38.7 | 6.2 | 60.8 |
| Feed (Calc.) | 100.0 | 0.34 | 0.004 | 0.04 | 0.02 | 4.7 | 0.33 | 45 | 0.15 | 100 | 100 | 100 | 100 | 100 | 100 | 100 | 100 |
| |
| | Wt | | | | Assay (%, gpt) | | | | | | | Distribution (%) | | | |
| Structure | | | | | | | | | | | | | | | | | |
| | % | Cu | Mo | Pb | Zn | Fe | S | Ag | Au | Cu | Mo | Pb | Zn | Fe | S | Ag | Au |
| 3rd Cl Conc | 1.1 | 34.3 | 0.17 | 1.82 | 3.56 | 10.8 | 20.0 | 3980 | 9.45 | 82.7 | 59.7 | 16.8 | 43.8 | 2.1 | 52.3 | 76.7 | 42.4 |
| 2nd Cl Conc | 1.4 | 28.1 | 0.14 | 1.53 | 2.91 | 10.2 | 16.5 | 3277 | 7.88 | 83.5 | 60.7 | 17.4 | 44.2 | 2.4 | 53.7 | 77.9 | 43.7 |
| 1st Cl Con | 2.4 | 16.2 | 0.08 | 0.94 | 1.71 | 8.7 | 9.64 | 1917 | 5.00 | 84.9 | 63.2 | 18.7 | 45.5 | 3.6 | 55.7 | 80.0 | 48.7 |
| Rough Con | 8.1 | 5.06 | 0.03 | 0.36 | 0.55 | 7.1 | 3.13 | 614 | 1.95 | 88.4 | 71.4 | 23.8 | 49.2 | 9.9 | 61.3 | 85.7 | 63.4 |
| Rough Tail | 91.9 | 0.06 | 0.001 | 0.10 | 0.05 | 5.7 | 0.07 | 9 | 0.10 | 11.6 | 28.6 | 76.2 | 50.8 | 90.1 | 38.7 | 14.3 | 36.6 |
| Feed (Calc.) | 100.0 | 0.46 | 0.003 | 0.12 | 0.09 | 5.8 | 0.32 | 58 | 0.25 | 100 | 100 | 100 | 100 | 100 | 100 | 100 | 100 |
| |
| | Wt | | | | Assay (%, gpt) | | | | | | | Distribution (%) | | | |
| Contact | | | | | | | | | | | | | | | | | |
| | % | Cu | Mo | Pb | Zn | Fe | S | Ag | Au | Cu | Mo | Pb | Zn | Fe | S | Ag | Au |
| 3rd Cl Conc | 0.4 | 16.7 | 2.02 | 0.61 | 0.94 | 31.9 | 40.1 | 670 | 17.4 | 83.6 | 65.4 | 9.8 | 22.0 | 4.7 | 43.9 | 63.7 | 66.4 |
| 2nd Cl Conc | 0.4 | 14.0 | 1.67 | 0.53 | 0.85 | 29.5 | 35.6 | 570 | 14.5 | 85.1 | 66.1 | 10.3 | 24.2 | 5.3 | 47.4 | 66.0 | 67.5 |
| 1st Cl Con | 0.8 | 7.85 | 0.92 | 0.33 | 0.54 | 20.5 | 21.4 | 325 | 8.49 | 87.9 | 67.1 | 11.8 | 28.0 | 6.8 | 52.5 | 69.1 | 72.5 |
| Rough Con | 2.9 | 2.41 | 0.28 | 0.12 | 0.21 | 10.9 | 7.60 | 101 | 2.70 | 93.4 | 69.9 | 15.4 | 38.4 | 12.6 | 64.5 | 74.9 | 79.8 |
| Rough Tail | 97.1 | 0.01 | 0.004 | 0.02 | 0.01 | 2.2 | 0.12 | 1 | 0.02 | 6.6 | 30.1 | 84.6 | 61.6 | 87.4 | 35.5 | 25.1 | 20.2 |
| Feed (Calc.) | 100.0 | 0.07 | 0.011 | 0.02 | 0.02 | 2.5 | 0.34 | 4 | 0.10 | 100 | 100 | 100 | 100 | 100 | 100 | 100 | 100 |
It was also noted that for Manto and Structure composites, penalty elements including arsenic (As), antimony (Sb), and bismuth (Bi) in the third cleaner concentrates seem higher in some typical smelter requirements. Table 33 lists the concentration of these elements.
Table 33: Penalty Element Concentration in 3rd Cleaner Concentrate
| | | Assay (%) | |
| Composite | | | | | | | | | |
| | | As | | | Sb | | | Bi | |
| Manto | | | 2.92 | | | | 1.29 | | | | 1.29 | |
| Structure | | | 3.89 | | | | 0.60 | | | | 0.77 | |
| Contact | | | 0.51 | | | | 0.10 | | | | 0.82 | |
13.2.9 Optimization Tests to Control Penalty Elements
Additional test work was completed to reduce these element concentration levels at the ALS laboratory as stated below.
69
| | LA JOYA, NI 43-101 TECHNICAL REPORT |
| | RELEASED: MARCH 27, 2013 |
13.2.9.1 Arsenic Control Test Work
Two methods were tested to reduce arsenic concentration by increasing pH level at cleaner stages, and by adding cyanide at cleaner stages. Table 34 summarise test results. Adding cyanide can reduce the concentration of arsenic significantly for all the three composites.
Table 34: As Concentration in 3rd Cleaner Concentrate after Treatment
| | | | | | As Assay (%) | | | | |
| Composite | | | | | | | | | |
| | | Baseline | | | pH 11.0 | | | NaCN | |
| Manto | | | 2.92 | | | | 3.77 | | | | 0.63 | |
| Structure | | | 3.89 | | | | 3.35 | | | | 0.72 | |
| Contact | | | 0.51 | | | | 0.18 | | | | 0.06 | |
The metal grades and distribution of the cyanide added batch cleaner tests are presented in
Table 35. It can be seen that adding cyanide has little impact on copper grades and recoveries of the 3rd cleaner concentrate for manto and structure composites; furthermore it improves copper grade of contact composite sample.
On the other hand, adding cyanide depressed silver recovery to the 3rd cleaner concentrate for manto (minor) and contact composites. The Contact Zone sample, which is being tested specifically for tungsten, shows the highest loss on silver recovery from 63.7% at a grade of 670 gpt to 45.9% at a grade of 818 gpt.
Gold recovery to the 3rd cleaner concentrate is depressed for structure and contact composites; while the gold recovery increases from baseline test 18.2% at 3.4 gpt to 56.6% at 13.1 gpt.
Table 35: Summary of Batch Cleaner Test Results - with Cyanide
| | Wt | Assay (%, gpt) | Distribution (%) |
| Manto | | | | | | | | | | | | | | | | | |
| | % | Cu | Mo | Pb | Zn | Fe | S | Ag | Au | Cu | Mo | Pb | Zn | Fe | S | Ag | Au |
| 3rd Cl Conc | 0.7 | 40.1 | 0.26 | 2.23 | 1.36 | 11.9 | 22.5 | 4780 | 13.1 | 87.7 | 48.0 | 33.6 | 48.6 | 2.2 | 73.0 | 80.7 | 56.6 |
| 2nd Cl Conc | 0.9 | 33.1 | 0.24 | 1.87 | 1.12 | 10.9 | 18.8 | 3958 | 10.8 | 89.1 | 55.4 | 34.7 | 49.4 | 2.5 | 74.9 | 82.2 | 57.5 |
| 1st Cl Con | 1.8 | 17.5 | 0.13 | 1.02 | 0.60 | 8.4 | 10.3 | 2119 | 6.00 | 90.9 | 59.8 | 36.6 | 50.6 | 3.7 | 79.3 | 85.1 | 61.9 |
| Rough Con | 5.8 | 5.50 | 0.05 | 0.36 | 0.19 | 6.2 | 3.5 | 688 | 2.12 | 94.7 | 70.2 | 42.4 | 54.5 | 9.1 | 88.7 | 91.4 | 72.4 |
| Rough Tail | 94.2 | 0.019 | 0.001 | 0.03 | 0.01 | 3.9 | 0.0 | 4 | 0.05 | 5.3 | 29.8 | 57.6 | 45.5 | 90.9 | 11.3 | 8.6 | 27.6 |
| Feed (Calc.) | 100.0 | 0.34 | 0.004 | 0.05 | 0.02 | 4.0 | 0.2 | 44 | 0.17 | 100 | 100 | 100 | 100 | 100 | 100 | 100 | 100 |
| |
| | Wt | Assay (%, gpt) | Distribution (%) |
| Structure | | | | | | | | | | | | | | | | | |
| | % | Cu | Mo | Pb | Zn | Fe | S | Ag | Au | Cu | Mo | Pb | Zn | Fe | S | Ag | Au |
| 3rd Cl Conc | 0.9 | 38.1 | 0.18 | 2.08 | 4.59 | 11.3 | 21.4 | 4760 | 9.37 | 81.4 | 53.1 | 27.2 | 45.6 | 1.9 | 68.1 | 74.9 | 35.0 |
| 2nd Cl Conc | 1.1 | 32.1 | 0.16 | 1.78 | 3.84 | 10.7 | 18.2 | 4041 | 8.05 | 83.0 | 55.5 | 28.2 | 46.1 | 2.2 | 70.0 | 77.0 | 36.3 |
| 1st Cl Con | 1.9 | 19.7 | 0.10 | 1.13 | 2.36 | 9.2 | 11.3 | 2519 | 5.54 | 84.9 | 59.0 | 29.9 | 47.2 | 3.1 | 72.7 | 79.9 | 41.6 |
| Rough Con | 6.5 | 6.14 | 0.04 | 0.40 | 0.75 | 7.8 | 3.8 | 812 | 2.19 | 89.9 | 70.9 | 35.6 | 51.0 | 9.0 | 83.5 | 87.6 | 55.9 |
| Rough Tail | 93.5 | 0.048 | 0.001 | 0.05 | 0.05 | 5.5 | 0.1 | 8 | 0.12 | 10.1 | 29.1 | 64.4 | 49.0 | 91.0 | 16.5 | 12.4 | 44.1 |
| Feed (Calc.) | 100.0 | 0.44 | 0.003 | 0.07 | 0.10 | 5.6 | 0.3 | 60 | 0.25 | 100 | 100 | 100 | 100 | 100 | 100 | 100 | 100 |
70
| | LA JOYA, NI 43-101 TECHNICAL REPORT |
| | RELEASED: MARCH 27, 2013 |
Table 35: Summary of Batch Cleaner Test Results - with Cyanide
| | Wt | Assay (%, gpt) | Distribution (%) |
| Contact | | | | | | | | | | | | | | | | | |
| | % | Cu | Mo | Pb | Zn | Fe | S | Ag | Au | Cu | Mo | Pb | Zn | Fe | S | Ag | Au |
| 3rd Cl Conc | 0.2 | 28.9 | 3.05 | 0.38 | 1.35 | 26.0 | 32.0 | 818 | 18.8 | 81.4 | 51.4 | 6.7 | 17.1 | 1.9 | 24.2 | 45.9 | 57.0 |
| 2nd Cl Conc | 0.3 | 24.3 | 2.92 | 0.35 | 1.26 | 23.6 | 28.5 | 732 | 15.7 | 84.5 | 60.5 | 7.7 | 19.6 | 2.2 | 26.6 | 50.6 | 58.5 |
| 1st Cl Con | 0.5 | 12.7 | 1.59 | 0.22 | 0.77 | 17.5 | 18.1 | 410 | 8.87 | 88.3 | 66.4 | 9.6 | 24.1 | 3.2 | 33.9 | 57.0 | 66.5 |
| Rough Con | 2.5 | 2.75 | 0.35 | 0.08 | 0.26 | 12.4 | 9.2 | 107 | 2.31 | 94.7 | 72.9 | 16.5 | 40.2 | 11.3 | 85.3 | 73.5 | 85.7 |
| Rough Tail | 97.5 | 0.004 | 0.003 | 0.01 | 0.01 | 2.5 | 0.0 | 1 | 0.01 | 5.3 | 27.1 | 83.5 | 59.8 | 88.7 | 14.7 | 26.5 | 14.3 |
| Feed (Calc.) | 100.0 | 0.07 | 0.012 | 0.01 | 0.02 | 2.8 | 0.3 | 4 | 0.07 | 100 | 100 | 100 | 100 | 100 | 100 | 100 | 100 |
13.2.9.2 Antimony and Bismuth Control Test Work
Antimony depression test work is in progress to test the Manto composite to develop a baseline. Multiple methods have been investigated including increasing cleaner pH further to 11.5, adding depressant F250, and adding depressant D910. All these options did not generate satisfying results. Table 36 summarises the results on the Manto composite. Although D910 presents depression impact on three elements, it also depressed copper recovery to the 3rd cleaner concentrate which reduced to 17.9% compared with a recovery of 86.7% in baseline tests.
Table 36: Depressant Screening Tests Summary
| | Assay (%) |
| Manto | | |
| | Sb% | Bi% |
| Baseline | 1.29 | 1.29 |
| pH11.5 | 1.45 | 1.62 |
| F250 | 1.33 | 1.51 |
| D910 | 0.95 | 0.98 |
The bulk copper concentrates produced from Manto and Structure composites have indicated the presence of penalty elements such as As, Sb and Bi. Adding cyanide at cleaner flotation stages can reduce the arsenic content to the market limits without sacrificing copper and silver recoveries. The contact bulk flotation concentrate has low concentrations of As, Sb, and Bi.
Gold appears to be amenable to gravity as shown in test work on the Contact Zone with a 24% Au recovery. Further testwork is recommended for possible additional increase in gold recovery. Tungsten and tin recoveries from gravity separation appear low. The molybdenum level in the 3rd cleaner concentrate ranges from 2 to 3% at a recovery from 51.4 to 65.4% suggesting a separate molybdenum concentrate may be produced. Further tests on tungsten and molybdenum are recommended for next phase.
Continued metallurgical testwork should specifically investigate the nature and distribution of gold speciation and distribution. Further investigation on tungsten deportment in Contact Zone samples, and to conduct gravity tests on both manto and structure samples to evaluate potential tin and gold recoveries. It is also recommended to conduct amenability flotation tests to on the blended composites, and to carry out variability flotation tests on representative samples from the north and south areas of the deposit. Furthermore, test work on leaching of cleaner tails is recommended for possible increase in Au an Ag recoveries.
71
| | LA JOYA, NI 43-101 TECHNICAL REPORT |
| | RELEASED: MARCH 27, 2013 |
14.0 MINERAL RESOURCE ESTIMATE
The mineral resource estimates described in this section has been prepared for the La Joya property by EBA to conform to the guidelines set forth by National Instrument 43-101 and incorporates terms as defined by the Canadian Institute of Mining, Metallurgy and Petroleum Standards on Mineral Resources and Reserves: Definitions and Guidelines. The interpretation, assumptions and parameters used in preparing this estimate are described in the following sections.
The MMT and Santo Nino deposits are considered to be polymetallic Ag-Cu-Au-W-Mo skarn deposits, with metal distributions for W and Mo spatially related to the Ag-Cu-Au resources. The Coloradito deposit is recognized as a polymetallic W-Mo deposit with associated Ag-Au-Cu. Three individual mineral resource estimates are presented for MMT, Santo Nino and Coloradito.
14.1 Previous NI 43-101 Resource Estimate (Phase 1, Jan 5, 2012)
EBA prepared an initial mineral resource estimate for the property in February 2012. The resource estimate was based on verified sampling from the 27 hole (5,753.70 metres) SilverCrest Phase I program, eight validated Luismin core holes (2,574.35 metres) and 177 surface chip samples (totalling 3,764 assayed samples) collected between 1998 and 2011. The analytical data was used as the basis for geological interpretation and for the construction of mineralized solids created as triangulations using Gemcom GEMS software. The resource estimate was limited to the MMT zone and did not include Santo Nino or Coloradito. The analytical data was interpolated into a percent block model using the inverse distance squared (ID2) method and was constrained by the mineralized solids. Three mineral resource estimates representing silver-copper-gold, lead-zinc and tungsten distribution were reported in the report as outlined in Table 37 through Table 39, below.
Table 37: Phase I Inferred Ag-Cu-Au Resource Estimation for the La Joya Deposit, Effective Date January. 5, 2012
| | | | | | | | | | | |
| Category** | | | SG | | Au | Cu | | | | Contained |
| | Grade | Tonnes | | (gpt) | (gpt) | (%) | Ag Ounces | Au Ounces | Cu Pounds | |
| | (gpt) | | | | | | | | | Ounces* |
| | | | | | | | | | | 101,918,00 |
| Inferred*** | 15 | 57,940,000 | 3 | 28 | 0.18 | 0.21 | 51,348,000 | 333,400 | 270,296,000 | |
| | | | | | | | | | | 0 |
| Inferred | 30 | 35,546,000 | 3 | 39 | 0.22 | 0.30 | 44,277,000 | 245,900 | 237,539,000 | 86,365,000 |
| Inferred | 50 | 19,622,000 | 3 | 55 | 0.24 | 0.45 | 34,636,000 | 153,800 | 194,187,000 | 66,679,000 |
| Inferred | 100 | 6,312,000 | 3 | 99 | 0.21 | 0.85 | 20,117,000 | 43,500 | 117,846,000 | 37,070,000 |
| Inferred | 200 | 1,841,000 | 3 | 156 | 0.24 | 1.45 | 9,258,000 | 14,200 | 58,826,000 | 17,346,000 |
| Inferred | >300 | 572,000 | 3 | 218 | 0.38 | 2.17 | 4,017,000 | 6,900 | 27,443,000 | 7,806,000 |
*Silver equivalency includes silver, gold and copper and excludes lead, zinc, molybdenum and tungsten values. Ag:Au is 50:1, Ag:Cu is 86:1, based on 5 year historic metal price trends of US$24/oz silver, US$1200/oz gold, US$3/lb copper. 100% metallurgical recovery is assumed.
**Classified by EBA, A Tetra Tech Company and conforms to NI 43-101 and CIM definitions for resources. All numbers are rounded. Inferred Resources have been estimated from geological evidence and limited sampling and must be treated with a lower level of confidence than Measured and Indicated Resources.
***Mineralization boundaries used in the interpretation of the geological model and resource estimate are based on a cut-off grade of 15 gpt AgEQ using the metal price ratios described above.
72
| | LA JOYA, NI 43-101 TECHNICAL REPORT |
| | RELEASED: MARCH 27, 2013 |
Table 38: Phase I Inferred Zn-Pb Resource Estimation for the La Joya Deposit, Effective Date January 5, 2012
| Category* | Pb+Zn Cut-off Grade (%) | Rounded Tonnes | Zn (%) | Pb (%) | Pb+Zn (%) |
| Inferred | 0.5 | 2,199,000 | 0.66 | 0.29 | 0.95 |
| Inferred | 0.75 | 914,000 | 1.01 | 0.40 | 1.42 |
| Inferred | 1 | 533,000 | 1.32 | 0.49 | 1.81 |
| Inferred | 2 | 138,000 | 2.44 | 0.80 | 3.24 |
| Inferred | 3 | 77,000 | 3.04 | 0.87 | 3.91 |
| Inferred | >5 | 6,000 | 4.16 | 1.12 | 5.28 |
*Classified by EBA, A Tetra Tech Company and conforms to NI 43-101, and CIM definitions for resources. All numbers are rounded. Inferred Resources have been estimated from geological evidence and limited sampling and must be treated with a lower level of confidence than Measured and Indicated Resources.
Table 39: Phase I Inferred W Resource Estimation for the La Joya Deposit, Effective Date January 5, 2012
| Category* | WO3 Cut-off (%) | Rounded Tonnes | WO3 (%) |
| Inferred | 0.025 | 17,270,000 | 0.024 |
| Inferred | 0.05 | 5,308,000 | 0.064 |
| Inferred | 0.10 | 598,000 | 0.101 |
| Inferred | >1.261 | 54,000 | 0.147 |
*Classified by EBA, A Tetra Tech Company and conforms to NI 43-101 and CIM definitions for resources. All numbers are rounded. Inferred Resources have been estimated from geological evidence and limited sampling and must be treated with a lower level of confidence than Measured and Indicated Resources.
Methodology used in the 2012 estimation is generally consistent with the methodology applied in the current, 2013 estimate. The block model derived from the Phase I drilling was limited in spatial extent to the northern portion of the MMT relative to the increased overall coverage of the Phase II drilling.
The 2012 mineral resource estimate is now superseded by the current, 2013, estimate and should be regarded as historical in the context of the La Joya property.
14.2 Current NI 43-101 Resource Estimation (Phase II)
14.2.1 Basis of Current Estimate
This 2013 resource estimate (Phase II) is based on the sampling from an additional 78 SilverCrest core holes (25,812.65 metres) drilled during 2011-2012, and an additional 11 validated Luismin core holes (4,272.63 metres).
The MMT 2013 resource update is based on an additional 51 SilverCrest drill holes (13,994.35 metres) and a further two (1,239.72 metres) validated or resampled Luismin drill holes, drilled between 1998 and 2011. Two additional unverified low grade Luismin RC holes (A-11 & A-14; 1,115.57 metres) were incorporated to bracket high grade in one isolated hole LB96-04RS during interpolation runs.
73
| | LA JOYA, NI 43-101 TECHNICAL REPORT |
| | RELEASED: MARCH 27, 2013 |
The Coloraditio resource component is based on 11 Phase II SilverCrest drill holes (4,866.50 metres) and 6 resampled or validated Luismin core holes (1,886.71 metres) totalling 6,753.21 metres, with a total of 2,127 assayed samples for the period during 2008 and 2012.
The 2013 Santo Nino resource estimate is based on nine SilverCrest drill holes (2,515.00 metres) and three validated Luismin core holes (1,146.20 metres) and uses 1,146 samples.
The analytical data was used as the basis for geological interpretation and for the construction of mineralized solids created as triangulations using Gemcom GEMS v6.4.1 software. The analytical data was interpolated into a block model using the inverse distance squared (ID2) method and was constrained by the mineralized solids. Three mineral resource estimates representing silver-copper-gold, tungsten and molybdenum distribution have been reported in Section 14.4 below.
Additional drill campaigns have been conducted on the property both before and during the 1998-2011 period, however, the data sets from these programs could not be verified and were not considered to provide an adequate level of confidence for use in resource estimation. Geological information from these datasets may have selectively been used to aid in the geological interpretation of the model, however, in these cases the analytical data has not been used in the resource estimate.
The geological model has been built referencing the WGS 84 zone 13Q co-ordinate system, the origins and bounds of the block model are listed in Table 40. Topographic data used in the model was collected by Eagle Mapping in November of 2010 using a fixed wing aircraft to create a digital terrain model (DTM) accurate to 2 metre resolution. Elevations collected by SilverCrest personal at drill hole casings using handheld GPS generally reported 10-14 metres higher than the DTM surface. This observation was confirmed by EBA in the field. Consistent deviations such as this are not considered to be uncommon and are a result of differences in the geodetic datum used by the handheld GPS and the aerial survey. All surface drill hole and sample locations were vertically adjusted to fit the DTM.
Table 40: GEMS Block Model Bounds, Dimensions and Rotation Used for the LJ_2012, LJ2012COL and LJ_2012_SN Database
| | | | Block Size | Number of | Dimension | Rotation |
| Database | Direction | Origin | (m) | Blocks | (m) | (deg) |
| | East | 609,250 | 5 | 270 | 1350 | 0 |
| LJ_2012 | North Origin | 2,639,400 | 5 | 420 | 2100 | 0 |
| | Elevation Origin | 2,650 | 5 | 210 | 1050 | 0 |
| | East | 608,000 | 5 | 200 | 1000 | 0 |
| LJ2012COL | North Origin | 2,640,375 | 5 | 125 | 625 | 0 |
| | Elevation Origin | 2,350 | 5 | 102 | 510 | 0 |
| | East | 610,600 | 5 | 90 | 450 | 0 |
| LJ_2012_SN | North Origin | 2,639,800 | 5 | 160 | 800 | 0 |
| | Elevation Origin | 2,500 | 5 | 120 | 600 | 0 |
| Note: origin is based on the UTM WGS 84 projection, and is located at the upper northwest corner of the model | |
14.2.2 Metal Price Analysis and Silver Equivalent Calculation
The La Joya deposit is polymetallic and demonstrates mineralogical correlation between silver, copper and gold concentrations. Based on current metal prices, silver is demonstrated to be the most abundant metal of the three and was selected as the base of a metal equivalency for both interpretation and reporting purposes.
74
| | LA JOYA, NI 43-101 TECHNICAL REPORT |
| | RELEASED: MARCH 27, 2013 |
A dataset of average monthly metal prices for silver, copper and gold were used by EBA to determine 5-year metal price trends as seen in Figure 29 to
75
| | LA JOYA, NI 43-101 TECHNICAL REPORT |
| | RELEASED: MARCH 27, 2013 |
Figure 31. A silver equivalent value (AgEQ) was calculated based on these price ratios, as presented in Table 41. An assumption of 100% metal recovery was used for all metals for the purposes of this resource estimation while metallurgical testwork is ongoing.
Figure 29: 5-year silver metal price trend
Figure 30: 5-year gold price trend
76
| | LA JOYA, NI 43-101 TECHNICAL REPORT |
| | RELEASED: MARCH 27, 2013 |
Figure 31: 5 year copper price trend
Table 41: 5-Year Metal Price Trends and AgEQ Calculation for Silver, Copper and Gold
| Metal | 5-year Trend Metal Price | Price/tonne ratio to Ag |
| Ag | $24/oz (troy) | 1:1 |
| Cu | $3/lb ($6,615/t) | 86:1 |
| Au | $1,200/oz(troy) | 50:1 |
| |
| AgEQ | =Ag(gpt) + 86*Cu% + 50*Au(gpt) |
14.2.3 Specific Gravity Used in Resource Estimation
Routine in situ SG testing was introduced in Phase II drill hole samples. Drill core samples were tested on site by SilverCrest personnel using a standard scale and bucket measuring apparatus and results were tabulated in the corresponding drill hole logs. During Phase I all samples were sent to ALS Chemex for specific gravity testing using the pycnometer method for pulps (OA-GRAb).
Samples were tested to characterize specific gravity variation by rock code as discussed in Section 9.2.1. A total of 1,279 SG samples from Phase I and II have been grouped based on lithology, averaged and plotted. The modified box and whisper plot (Figure 32) show the SG mean with whiskers showing the range of each sample for each lithology. Samples have been grouped into Breccia (Brx), Intrusive (Int), Hornfels (H), Limestone (Lm), Sandy grits (Lut), Marble (M) and Skarn (Sk). Mineralization is typically in association with samples reported as SK and HORN, and is rarely in association with samples reported as LM, INT and MAR (Table 11).
Some outliers exist in the dataset, such as in INT and LUT lithologies while SK shows the greatest consistent range in specific gravity values which is attributed to varying sulphide and metal concentrations in association with the skarn mineralization. A specific gravity value of 3.0 was selected based on the approximate average values for those rock codes associated with mineralization and was applied to all blocks within the model for resource estimation.
77
| | LA JOYA, NI 43-101 TECHNICAL REPORT |
| | RELEASED: MARCH 27, 2013 |
Figure 32: Distribution of specific gravity by rockcode. (n=1279).
Figure 33 through Figure 35 show the further SG segregation for each of the three modeled solids (Manto, Contact Skarn & Structure) created for the 2012 La Joya resource estimation. Due to the interpretation of drill core logging and solid creation based on the grade, each of the three solids has a range of lithologies included within. For each solid the average SG is calculated which when rounded equates to an overall average SG of 3 g/cm3 that has been adopted for the 2013 La Joya block model.
Figure 33: Specific gravity distribution by solid; Manto
78
| | LA JOYA, NI 43-101 TECHNICAL REPORT |
| | RELEASED: MARCH 27, 2013 |
Figure 34: Specific gravity distribution by solid: Contact Skarn
Figure 35: Specific gravity distribution by solid: Structure
Table 42 shows the summary statistics for each of the main three domains used in the GEMS model. Note that only the samples that occur within these solids are used in these calculations.
79
| | LA JOYA, NI 43-101 TECHNICAL REPORT |
| | RELEASED: MARCH 27, 2013 |
Table 42 : GEMS Solid SG Distribution Summary
| | Manto | Contact Skarn | Structure |
| Mean | 3.05 | 3.07 | 3.04 |
| Median | 3.0 | 3.10 | 3.00 |
| Mode | 2.8 | 3.20 | 2.80 |
| Standard Deviation | 0.2784 | 0.2673 | 0.3050 |
| Range | 2.92 | 1.40 | 2.92 |
| Minimum | 2.6 | 2.50 | 2.60 |
| Maximum | 5.52 | 3.90 | 5.52 |
| Count | 444 | 202 | 243 |
14.3 Geological Model Used in the Interpretation
Interpretation used for the geological model was prepared by EBA through discussions with SilverCrest personnel, independent field observations and review of documentation. The block model and resulting resource estimate was completed by EBA using Gemcom GEMS v6.4.1 geological modelling software.
Initial grade thresholds for cross-sectional interpretation in defining continuous mineralization on the property were defined for each of the three styles of mineralization discussed in Section 7.3. Three sets of mineralized solids representing these styles of mineralization, were created in GEMS and coded as manto, structure or contact skarn. The mineralized solids were used to constrain interpolation within the block model.
Manto solids (Figure 36 and Figure 37) were interpreted from lithological data from drill logs and using a >15gpt AgEQ low grade threshold, which generally conformed to upper and lower contacts of the stratiform manto horizons. Internal dilution interspersed within the manto horizon was preserved to ensure that mineral distribution heterogeneity was incorporated into the block model. The manto solids were oriented as sub-horizontal bodies and were extended to 50 metres laterally beyond the most peripheral drill hole. In total, eight solids were used to model the stacked stratiform nature of the manto mineralization in the model.
Mineralization contained within the structural corridors (Figure 36 and Figure 37) was constrained by 16 sub-vertical solids ranging from 15 to 50 metres in thickness. These solids are interpreted to contain the SCSV mineralization and were modelled to include both proximal skarn mineralization and the late stage vein filled fractures that have been interpreted to occupy the northeast-southwest trending corridors. A grade threshold of 15 gpt silver and an antimony concentration of >50ppm in conjunction with lithological data were used as the basis for interpretation of these solids. These structural solids were extended to the range of the manto solids.
The contact skarn mineralization (Figure 36 and Figure 37) was constrained by one solid that was divided into three sections due to the large extent with variable orientations due to its draping morphology. The solids were modelled to constrain interpolation of tungsten grades within the retrograde skarn along the contact between the Sacrificio intrusion and the Cuesta del Cura Limestone. A lower limit of 200 ppm tungsten in addition to lithological data was used as the basis for the interpretation of the solids. The solids range from 20 to 75 metres (averaging approximately 40 metres) in vertical thickness. Manto mineralization and SCSV mineralization have been interpreted to overprint the contact skarn. The contact skarn solids were extended to 50 metres laterally beyond the most peripheral drill hole. Further drilling in the contact skarn is recommended to fully quantify the lateral extent between the MMT and Santo Nino and evaluate the potential extension to the east beyond Santo Nino.
80
| | LA JOYA, NI 43-101 TECHNICAL REPORT |
| | RELEASED: MARCH 27, 2013 |
Coloradito had a different model arrangement due to the different style of geology (Figure 38). A mineralized contact skarn partially cusps the Coloradito intrusive. The skarn and quartz breccia are both mineralized and have been taken into account in the model.
81
| | LA JOYA, NI 43-101 TECHNICAL REPORT |
| | RELEASED: MARCH 27, 2013 |
Figure 36: 3D screen shot of GEMS MMT geological model
82
| | LA JOYA, NI 43-101 TECHNICAL REPORT |
| | RELEASED: MARCH 27, 2013 |
Figure 37: 3D screen shot of GEMS Santo Nino geological model
83
| | LA JOYA, NI 43-101 TECHNICAL REPORT |
| | RELEASED: MARCH 27, 2013 |
Figure 38: 3D screen shot of GEMS Coloradito geological model
84
| | LA JOYA, NI 43-101 TECHNICAL REPORT |
| | RELEASED: MARCH 27, 2013 |
Figure 39: Vertical cross section view of La Joya block model and mineralized solids
85
| | LA JOYA, NI 43-101 TECHNICAL REPORT |
| | RELEASED: MARCH 27, 2013 |
14.3.1 Lithocoding used in the GEMS block model
Table 43 lists the lithocodes that have been applied to the MMT and Santo Nino block model (Figure 36 to Figure 37, and Figure 39). These codes do not necessarily correspond with the rockcodes presented in Table 11, but rather represent a generalized coding based on the geological model interpretation. All blocks that were contained by more than 0.1% with the SCSV solids were assigned the STRUCT lithocode. All blocks within the manto solids but external to the SCSV solids were assigned the MANTO lithocode. All other blocks within the model were assigned codes according to the description provided in Section 7. Based on the averaged specific gravity (Section 14.2.3), a value of 3.0 was applied to all material with the exception of blocks coded as AIR.
Table 43: Rockcodes Applied to MMT and Santo Nino Block Model
| Block Model Rockcode | Description |
| SKARN | Includes both proximal and distal skarn formed within the interpreted manto solids |
| STRUCT | Includes both proximal skarn, stockwork and vein mineralization contained within the |
| | SCSV solids |
| HT | Includes blocks at intercepting manto and structures. |
| SKCTC | Includes all material that drapes INT |
| INT | Includes all material below the intrusive contact |
| AIR | Includes all blocks above the topographic surface |
| WASTE | Includes all remaining blocks bound between the topographic surface and the intrusive, |
| | and that are external to the manto and SCSV solids |
Table 44 lists the lithocodes that have been applied to all blocks contained within the Coloradito model. These codes do not necessarily correspond with the rockcodes presented in Table 11, but rather represent a coding based on the interpreted geological model. Based on the averaged specific gravity (Section 14.2.3), a value of 3.0 was calculated for each rockcode and applied to all of the materials with the exception of blocks coded as AIR.
Table 44: Rockcodes Applied to Coloradito Block Model
| Block Model Rockcode | Description |
| SKARN | Includes both proximal and distal skarn formed within the interpreted solids |
| QTZBRX | Includes quartz breccia the crescent shaped deposit present between the intrusive and |
| | skarn. |
| INT | Includes all material below the intrusive contact |
| AIR | Includes all blocks above the topographic surface |
| LM | Includes all remaining blocks bound between the topographic surface and the intrusive, |
| | and that are external to the manto and SCSV solids |
| DYKE | All material in the bounding dyke to the east of INT |
| SKCTC | Includes material in solid on the east adjacent to dyke |
86
| | LA JOYA, NI 43-101 TECHNICAL REPORT |
| | RELEASED: MARCH 27, 2013 |
14.3.2 Main Mineralized Trend (MMT) Geostatistics
The MMT had a total of 7,560 raw samples contained within three mineralized domains (Structure, Manto, Contact Skarn) collected from core sampling (Phase I and II, verified historic) that were used in the geological model for resource estimation. Raw samples were composited to 2 metre weighted averages and only composite samples contained within the mineralized solids were included for resource estimation. Table 45 to Table 59 detail raw sample data for each domain type of the MMT, followed by normalization and 'reduction'. The result is a total of 11,067 normalized 2 metre composite samples. Of these, 6,570 samples represented manto mineralization with an average of 821 samples per manto, 3,692 samples were SCSV mineralization, and 805 samples represented contact skarn mineralization. The 2 metre composite samples used for interpolation were not used for calculations in more than one style of mineralization in the resource estimate. The statistics of data points represented below only account for each data point once. Resulting blocks interpolated >15 gpt, >30 gpt and >60 gpt AgEQ cut-off are listed within Table 45 to Table 59.
Table 45: Main Mineralized Trend - Manto Raw Non-Composited Descriptive Metal Data
| MMT- RAW Non - | | | | | | | |
| Composited | Ag (gpt) | Au (gpt) | Cu (%) | Pb (%) | Zn (%) | W (ppm) | Mo (ppm) |
| Data- Manto | | | | | | | |
| Mean | 15.63 | 0.16 | 0.14 | 0.028 | 0.048 | 121.28 | 481.91 |
| Standard Error | 0.95 | 0.02 | 0.01 | 0.003 | 0.005 | 4.52 | 46.94 |
| Median | 2.7 | 0.04 | 0.03 | 0.000 | 0.010 | 10 | 71 |
| Mode | 1 | 0.01 | 0.01 | 0.000 | 0.010 | 10 | 30 |
| Standard Deviation | 51.214 | 1.117 | 0.510 | 0.165 | 0.251 | 241.211 | 2505.729 |
| Sample Variance | 2622.848 | 1.247 | 0.260 | 0.027 | 0.063 | 58182.921 | 6278675.728 |
| Skewness | 7.743 | 42.219 | 11.878 | 10.667 | 11.375 | 3.661 | 11.419 |
| Range | 834 | 55 | 11.9 | 4.000 | 5.340 | 2619 | 53399 |
| Minimum | 0 | 0 | 0 | 0.000 | 0.000 | 1 | 1 |
| Maximum | 834 | 55 | 11.9 | 4.000 | 5.340 | 2620 | 53400 |
| Count | 2914 | 2914 | 2914 | 2833 | 2833 | 2848 | 2850 |
| 97.5th | 118.18 | 0.95 | 1.00 | 0.280 | 0.282 | 760.00 | 2841.00 |
| 99th | 264.19 | 1.65 | 1.88 | 1.000 | 1.034 | 1135.30 | 10227.60 |
87
| | LA JOYA, NI 43-101 TECHNICAL REPORT |
| | RELEASED: MARCH 27, 2013 |
Table 46: Main Mineralized Trend - Manto 2 metre Composited Descriptive Metal Data
| MMT- 2m | | | | | | | |
| Composited Data- | Ag (gpt) | Au (gpt) | Cu (%) | Pb (%) | Zn (%) | W (ppm) | Mo (ppm) |
| Manto | | | | | | | |
| Mean | 16.64 | 0.16 | 0.12 | 0.033 | 0.036 | 79.96 | 32.29 |
| Standard Error | 0.59 | 0.01 | 0.00 | 0.002 | 0.002 | 2.14 | 1.27 |
| Median | 3.3 | 0.04 | 0.03 | 0.000 | 0.007 | 10 | 10 |
| Mode | 1 | 0.01 | 0.01 | 0.000 | 0.003 | 10 | 3 |
| Standard Deviation | 47.46 | 0.61 | 0.33 | 0.151 | 0.164 | 173.83 | 102.57 |
| Sample Variance | 2252.61 | 0.38 | 0.11 | 0.023 | 0.027 | 30216.63 | 10520.93 |
| Skewness | 7.50 | 23.12 | 6.71 | 6.670 | 15.098 | 4.49 | 16.81 |
| Range | 772 | 21.3 | 6.02 | 2.912 | 5.340 | 3100 | 3247 |
| Minimum | 0 | 0 | 0 | 0.000 | 0.000 | 0 | 0 |
| Maximum | 772.00 | 21.30 | 6.02 | 2.912 | 5.340 | 3100.00 | 3247.00 |
| Count | 6570 | 6570 | 6570 | 6570 | 6570 | 6570 | 6570 |
| 97.5th | 132.18 | 0.90 | 0.95 | 0.456 | 0.266 | 600.78 | 163.00 |
| 99th | 238.87 | 1.60 | 1.75 | 1.000 | 0.597 | 840.00 | 290.31 |
Table 47: Main Mineralized Trend - Manto 2 metre Composited >15 AgEQ Descriptive Metal Data
| MMT- 2 m | | | | | | | |
| Composited | | | | | | | |
| Manto Data; | Ag (gpt) | Au (gpt) | Cu (%) | Pb (%) | Zn (%) | W (ppm) | Mo (ppm) |
| AgEQ >15 gpt | | | | | | | |
| Mean | 36.57 | 0.32 | 0.26 | 0.046 | 0.069 | 102.56 | 31.90 |
| Standard Error | 1.30 | 0.02 | 0.01 | 0.003 | 0.005 | 4.04 | 1.74 |
| Median | 14.25 | 0.15 | 0.11 | 0.000 | 0.012 | 14 | 11.00 |
| Mode | 5.00 | 0.03 | 0.01 | 0.000 | 0.003 | 10 | 1.00 |
| Standard Deviation | 68.3 | 0.9 | 0.5 | 0.166 | 0.247 | 212.7 | 91.4 |
| Sample Variance | 4663.9 | 0.8 | 0.2 | 0.027 | 0.061 | 45224.1 | 8354.7 |
| Skewness | 5.10 | 15.82 | 4.53 | 6.592 | 10.107 | 4.27 | 12.81 |
| Range | 772.0 | 21.3 | 6.0 | 2.912 | 5.340 | 3100.0 | 2037.0 |
| Minimum | 0.0 | 0.0 | 0.0 | 0.000 | 0.000 | 0.0 | 0.0 |
| Maximum | 772.0 | 21.3 | 6.0 | 2.912 | 5.340 | 3100.0 | 2037.0 |
| Count | 2764.0 | 2764.0 | 2764.0 | 2764 | 2764 | 2764.0 | 2764.0 |
| 97.5th | 233.1 | 1.6 | 1.7 | 0.517 | 0.562 | 710.0 | 173.7 |
| 99th | 343.0 | 2.4 | 2.3 | 1.000 | 0.979 | 1028.7 | 304.8 |
88
| | LA JOYA, NI 43-101 TECHNICAL REPORT |
| | RELEASED: MARCH 27, 2013 |
Table 48: Main Mineralized Trend - Manto 2 metre Composited >30 AgEQ Descriptive Metal Data
| MMT- 2 m | | | | | | | |
| Composited Manto | Ag (gpt) | Au (gpt) | Cu (%) | Pb (%) | Zn (%) | W (ppm) | Mo (ppm) |
| Data; AgEQ >30 | | | | | | | |
| gpt | | | | | | | |
| Mean | 54.00 | 0.43 | 0.39 | 0.059 | 0.093 | 111.42 | 33.34 |
| Standard Error | 1.98 | 0.03 | 0.01 | 0.005 | 0.007 | 5.69 | 2.51 |
| Median | 27.9 | 0.18 | 0.21 | 0.001 | 0.012 | 15 | 12 |
| Mode | 26 | 0.03 | 0.01 | 0.000 | 0.003 | 10 | 1 |
| Standard Deviation | 81.96 | 1.15 | 0.56 | 0.187 | 0.304 | 235.23 | 103.97 |
| Sample Variance | 6717.41 | 1.32 | 0.31 | 0.035 | 0.092 | 55335.33 | 10808.99 |
| Skewness | 4.15 | 12.75 | 3.65 | 6.119 | 8.372 | 4.25 | 12.88 |
| Range | 772 | 21.3 | 6.02 | 2.912 | 5.340 | 3100 | 2037 |
| Minimum | 0 | 0 | 0 | 0.000 | 0.000 | 0 | 0 |
| Maximum | 772 | 21.3 | 6.02 | 2.912 | 5.340 | 3100 | 2037 |
| Count | 1712 | 1712 | 1712 | 1712 | 1712 | 1712 | 1712 |
| 97.5th | 280.12 | 2.13 | 2.02 | 0.601 | 0.688 | 818.45 | 165.00 |
| 99th | 409.12 | 3.56 | 2.94 | 0.994 | 1.407 | 1049.34 | 373.68 |
Table 49: Main Mineralized Trend - Manto 2 metre Composited >60 AgEQ Descriptive Metal Data
| MMT- 2m | | | | | | | |
| Composited Data | Ag (gpt) | Au (gpt) | Cu (%) | Pb (%) | Zn (%) | W (ppm) | Mo (ppm) |
| Manto AgEQ >60 gpt | | | | | | | |
| Mean | 88.540 | 0.571 | 0.621 | 0.080 | 0.130 | 107.554 | 34.478 |
| Standard Error | 3.442 | 0.053 | 0.023 | 0.008 | 0.014 | 8.650 | 3.366 |
| Median | 53.900 | 0.180 | 0.410 | 0.002 | 0.011 | 15.000 | 11.000 |
| Mode | 36.000 | 0.030 | 0.000 | 0.000 | 0.006 | 10.000 | 1.000 |
| Standard Deviation | 102.267 | 1.569 | 0.696 | 0.232 | 0.405 | 257.039 | 100.034 |
| Sample Variance | 10458.463 | 2.461 | 0.484 | 0.054 | 0.164 | 66068.801 | 10006.785 |
| Skewness | 3.145 | 9.492 | 2.680 | 5.333 | 6.527 | 4.987 | 9.392 |
| Range | 772 | 21.29 | 6.02 | 2.912 | 5.34 | 3100 | 1722 |
| Minimum | 0 | 0.01 | 0 | 0 | 0 | 0 | 0 |
| Maximum | 772 | 21.3 | 6.02 | 2.912 | 5.34 | 3100 | 1722 |
| Count | 883 | 883 | 883 | 883 | 883 | 883 | 883 |
| 97.5th | 364.92 | 2.99 | 2.62 | 0.76 | 1.15 | 900.30 | 207.25 |
| 99th | 488.92 | 5.66 | 3.67 | 1.13 | 2.06 | 1264.40 | 475.86 |
89
| | LA JOYA, NI 43-101 TECHNICAL REPORT |
| | RELEASED: MARCH 27, 2013 |
| Table 50: Main Mineralized Trend - Raw Non-Composited Structure Descriptive Metal Data | | | |
| |
| MMT- RAW Non - | | | | | | | |
| Composited Data- | Ag (gpt) | Au (gpt) | Cu (%) | Pb (%) | Zn (%) | W (ppm) | Mo (ppm) |
| Structure | | | | | | | |
| Mean | 30.49 | 0.17 | 0.21 | 0.063 | 0.064 | 81.91 | 35.08 |
| Standard Error | 1.65 | 0.01 | 0.01 | 0.005 | 0.006 | 3.56 | 3.57 |
| Median | 4 | 0.04 | 0.03 | 0.000 | 0.010 | 10 | 9 |
| Mode | 1 | 0.01 | 0.01 | 0.000 | 0.010 | 10 | 1 |
| Standard Deviation | 95.02 | 0.66 | 0.69 | 0.271 | 0.332 | 201.21 | 204.43 |
| Sample Variance | 9029.68 | 0.44 | 0.47 | 0.074 | 0.110 | 40487.34 | 41793.60 |
| Skewness | 8.01 | 19.33 | 10.62 | 7.694 | 12.949 | 5.98 | 35.85 |
| Range | 1730 | 21.3 | 19.25 | 4.930 | 8.150 | 3100 | 9760 |
| Minimum | 0 | 0 | 0 | 0.000 | 0.000 | 0 | 0 |
| Maximum | 1730 | 21.3 | 19.25 | 4.930 | 8.150 | 3100 | 9760 |
| Count | 3336 | 3336 | 3336 | 3272 | 3272 | 3186 | 3288 |
| 97.5th | 245.63 | 1.00 | 1.91 | 1.000 | 0.510 | 630.00 | 181.47 |
| 99th | 469.55 | 1.86 | 3.06 | 1.000 | 1.296 | 1003.00 | 354.65 |
| |
| |
| |
| Table 51: Main Mineralized Trend -Structure Descriptive Statistics for 2 metre Composited, Metal Data | | |
| |
| MMT- 2 m | | | | | | | |
| Composited Data- | Ag (gpt) | Au (gpt) | Cu (%) | Pb (%) | Zn (%) | W (ppm) | Mo (ppm) |
| Structure | | | | | | | |
| Mean | 18.99 | 0.15 | 0.13 | 0.046 | 0.041 | 64.57 | 28.74 |
| Standard Error | 0.85 | 0.01 | 0.01 | 0.003 | 0.003 | 2.54 | 1.54 |
| Median | 3.7 | 0.04 | 0.02 | 0.000 | 0.007 | 10 | 9 |
| Mode | 1 | 0.01 | 0.01 | 0.000 | 0.003 | 10 | 1 |
| Standard Deviation | 51.51 | 0.60 | 0.36 | 0.187 | 0.172 | 154.48 | 93.68 |
| Sample Variance | 2653.54 | 0.36 | 0.13 | 0.035 | 0.030 | 23864.85 | 8775.60 |
| Skewness | 6.57 | 22.69 | 6.24 | 5.806 | 10.479 | 6.61 | 18.01 |
| Range | 772 | 21.3 | 6.02 | 2.912 | 3.200 | 3100 | 3247 |
| Minimum | 0 | 0 | 0 | 0.000 | 0.000 | 0 | 0 |
| Maximum | 772.00 | 21.30 | 6.02 | 2.912 | 3.200 | 3100.00 | 3247.00 |
| Count | 3692 | 3692 | 3692 | 3692 | 3692 | 3692 | 3692 |
| 97.5th | 149.41 | 0.83 | 1.10 | 0.796 | 0.337 | 460.73 | 155.00 |
| 99th | 256.59 | 1.39 | 1.81 | 1.000 | 0.684 | 704.54 | 289.18 |
90
| | LA JOYA, NI 43-101 TECHNICAL REPORT |
| | RELEASED: MARCH 27, 2013 |
| Table 52: Main Mineralized Trend -2 metre Composited Structure>15 AgEQ Descriptive Metal Data | | |
| |
| MMT- 2 m | | | | | | | |
| Composited | Ag (gpt) | Au (gpt) | Cu (%) | Pb (%) | Zn (%) | W (ppm) | Mo (ppm) |
| Structure Data; | | | | | | | |
| AgEQ >15 gpt | | | | | | | |
| Mean | 74.34 | 0.23 | 0.50 | 0.092 | 0.132 | 93.29 | 1319.53 |
| Standard Error | 3.20 | 0.03 | 0.02 | 0.009 | 0.012 | 7.85 | 122.38 |
| Median | 40.70 | 0.10 | 0.29 | 0.004 | 0.016 | 18 | 158 |
| Mode | 20.00 | 0.04 | 0.03 | 0.000 | 0.006 | 10 | 60 |
| Standard Deviation | 90.82 | 0.80 | 0.64 | 0.254 | 0.347 | 222.39 | 3467.80 |
| Sample Variance | 8248.34 | 0.65 | 0.41 | 0.064 | 0.120 | 49457.59 | 12025625.27 |
| Skewness | 3.49 | 22.69 | 3.13 | 5.267 | 5.041 | 6.52 | 5.04 |
| Range | 757.00 | 21.30 | 6.02 | 2.912 | 3.200 | 3100 | 31996 |
| Minimum | 15 | 0 | 0 | 0.000 | 0.000 | 0 | 0 |
| Maximum | 772 | 21.3 | 6.02 | 2.912 | 3.200 | 3100 | 31996 |
| Count | 803 | 803 | 803 | 803 | 803 | 803 | 803 |
| 97.5th | 333.42 | 0.96 | 2.44 | 0.799 | 1.004 | 579.50 | 10037.05 |
| 99th | 445.29 | 1.40 | 3.12 | 1.359 | 2.009 | 1034.86 | 20092.00 |
| |
| |
| Table 53: Main Mineralized Trend Structure Descriptive Statistics for 2 metre Composited >30 AgEQ Metal Data | |
| |
| MMT- 2 m | | | | | | | |
| Composited | | | | | | | |
| Structure Data; | Ag (gpt) | Au (gpt) | Cu (%) | Pb (%) | Zn (%) | W (ppm) | Mo (ppm) |
| AgEQ >30 gpt | | | | | | | |
| Mean | 78.24 | 0.24 | 0.53 | 0.094 | 0.134 | 96.61 | 31.11 |
| Standard Error | 3.38 | 0.03 | 0.02 | 0.010 | 0.013 | 8.35 | 4.24 |
| Median | 44.20 | 0.11 | 0.30 | 0.003 | 0.014 | 19 | 10.00 |
| Mode | 20.00 | 0.04 | 0.17 | 0.000 | 0.006 | 10 | 1.00 |
| Standard Deviation | 92.66 | 0.83 | 0.65 | 0.262 | 0.356 | 228.961825 | 116.09 |
| Sample Variance | 8585.36 | 0.69 | 0.42 | 0.069 | 0.127 | 52423.52 | 13477.28 |
| Skewness | 3.40 | 22.03 | 3.07 | 5.113 | 4.943 | 6.34 | 12.74 |
| Range | 757 | 21.3 | 6.02 | 2.912 | 3.200 | 3100 | 2037 |
| Minimum | 15.00 | 0.00 | 0.00 | 0.000 | 0.000 | 0 | 0.00 |
| Maximum | 772.00 | 21.30 | 6.02 | 2.912 | 3.200 | 3100 | 2037.00 |
| Count | 751 | 751 | 751 | 751 | 751 | 751 | 751 |
| 97.5th | 338.50 | 0.98 | 2.58 | 0.837 | 1.085 | 605.00 | 138.50 |
| 99th | 452.25 | 1.41 | 3.14 | 1.391 | 2.032 | 1087.5 | 306.50 |
91
| | LA JOYA, NI 43-101 TECHNICAL REPORT |
| | RELEASED: MARCH 27, 2013 |
Table 54: Main Mineralized Trend Structure Descriptive Statistics for 2 metre Composited >60 AgEQ Metal Data
| MMT- 2m Composited | | | | | | | |
| Data Structure AgEQ | Ag (gpt) | Au (gpt) | Cu (%) | Pb (%) | Zn (%) | W (ppm) | Mo (ppm) |
| >60 gpt | | | | | | | |
| Mean | 104.614 | 0.304 | 0.717 | 0.114 | 0.161 | 112.125 | 32.416 |
| Standard Error | 4.623 | 0.045 | 0.032 | 0.014 | 0.018 | 11.600 | 4.742 |
| Median | 66.200 | 0.130 | 0.500 | 0.003 | 0.013 | 20.000 | 11.000 |
| Mode | 36.000 | 0.060 | 0.290 | 0.000 | 0.006 | 10.000 | 1.000 |
| Standard Deviation | 103.571 | 1.005 | 0.721 | 0.305 | 0.407 | 259.897 | 106.241 |
| Sample Variance | 10726.878 | 1.011 | 0.520 | 0.093 | 0.166 | 67546.533 | 11287.249 |
| Skewness | 2.939 | 18.401 | 2.618 | 4.515 | 4.231 | 5.883 | 11.229 |
| Range | 756.6 | 21.29 | 6.02 | 2.912 | 3.1996 | 3100 | 1722 |
| Minimum | 15.4 | 0.01 | 0 | 0 | 0 | 0.00 | 0 |
| Maximum | 772.00 | 21.30 | 6.02 | 2.91 | 3.20 | 3100.00 | 1722.00 |
| Count | 502.00 | 502.00 | 502.00 | 502.00 | 502.00 | 502.00 | 502.00 |
| 97.5th | 377.35 | 1.33 | 2.93 | 1.01 | 774.27 | 1.42 | 152.28 |
| 99th | 533.55 | 2.27 | 3.66 | 1.51 | 1199.40 | 2.15 | 361.87 |
Table 55: Main Mineralized Trend Contact Skarn Descriptive Statistics for Raw, Non-Composited Descriptive Metal Data
| MMT- RAW Non - | | | | | | | |
| Composited Data | Ag (gpt) | Au (gpt) | Cu (%) | Pb (%) | Zn (%) | W (ppm) | Mo (ppm) |
| Contact Skarn | | | | | | | |
| Mean | 3.04 | 0.09 | 0.04 | 0.009 | 226 | 0.00 | 38.60 |
| Standard Error | 0.20 | 0.01 | 0.00 | 0.002 | 0.001 | 8.35 | 1.71 |
| Median | 1 | 0.03 | 0.01 | 0.000 | 0.010 | 180 | 21 |
| Mode | 0.2 | 0.01 | 0 | 0.000 | 0.010 | 10 | 1 |
| Standard Deviation | 7.07 | 0.21 | 0.10 | 0.062 | 0.052 | 301.68 | 61.80 |
| Sample Variance | 49.98 | 0.05 | 0.01 | 0.004 | 0.003 | 91012.13 | 3818.79 |
| Skewness | 8.32 | 6.88 | 7.42 | 13.496 | 6.080 | 2.29 | 6.18 |
| Range | 108 | 2.69 | 1.39 | 1.000 | 0.580 | 2380 | 823 |
| Minimum | 0 | 0 | 0 | 0.000 | 0.000 | 10 | 1 |
| Maximum | 108 | 2.69 | 1.39 | 1.000 | 0.580 | 2390 | 824 |
| Count | 1310 | 1310 | 1310 | 1304 | 1304 | 1304 | 1304 |
| 97.5th | 17.90 | 0.55 | 0.28 | 0.050 | 0.140 | 1050.00 | 163.00 |
| 99th | 27.96 | 0.92 | 0.37 | 0.180 | 0.300 | 1474.60 | 245.91 |
92
| | LA JOYA, NI 43-101 TECHNICAL REPORT |
| | RELEASED: MARCH 27, 2013 |
Table 56: Main Mineralized Trend Contact Skarn Descriptive Statistics for 2 metre-Composited Descriptive Metal Data
| MMT- 2 m | | | | | | | |
| Composited Data- | Ag (gpt) | Au (gpt) | Cu (%) | Pb (%) | Zn (%) | W (ppm) | Mo (ppm) |
| Contact Skarn | | | | | | | |
| Mean | 2.95 | 0.08 | 0.04 | 0.0094 | 0.0235 | 256.09 | 234.64 |
| Standard Error | 0.18 | 0.01 | 0.00 | 0.0021 | 0.0029 | 9.18 | 29.26 |
| Median | 1.3 | 0.03 | 0.01 | 0.0000 | 0.0095 | 180 | 95 |
| Mode | 0.2 | 0.01 | 0 | 0.0000 | 0.0027 | 10 | 27 |
| Standard Deviation | 5.20 | 0.15 | 0.07 | 0.0598 | 0.0830 | 260.43 | 830.26 |
| Sample Variance | 27.03 | 0.02 | 0.01 | 0.0036 | 0.0069 | 67821.65 | 689328.05 |
| Skewness | 5.15 | 4.27 | 5.24 | 12.8490 | 19.3079 | 1.66 | 19.31 |
| Range | 57.30 | 1.48 | 0.94 | 1.0000 | 2.0640 | 1574.00 | 20640.00 |
| Minimum | 0 | 0 | 0 | 0.0000 | 0.0000 | 0 | 0 |
| Maximum | 57.30 | 1.48 | 0.94 | 1.0000 | 2.0640 | 1574.00 | 20640.00 |
| Count | 805 | 805 | 805 | 805 | 805 | 805 | 805 |
| 97.5th | 16.04 | 0.529 | 0.21 | 0.0781 | 0.1268 | 936.5 | 1268 |
| 99th | 23.75 | 0.80 | 0.31 | 0.1850 | 0.2422 | 1197.20 | 2421.76 |
| |
| Table 57: Main Mineralized Trend Contact Skarn Descriptive Statistics for 2 metre Composited >15 AgEQ Metal Data | |
| |
| MMT- 2 m | | | | | | | |
| Composited | | | | | | | |
| Contact Skarn | Ag (gpt) | Au (gpt) | Cu (%) | Pb (%) | Zn (%) | W (ppm) | Mo (ppm) |
| Data: AgEQ >15 gpt | | | | | | | |
| Mean | 13.60 | 0.45 | 0.19 | 0.022 | 0.092 | 409.02 | 25.44 |
| Standard Error | 1.98 | 0.05 | 0.03 | 0.007 | 0.043 | 39.39 | 3.03 |
| Median | 7.5 | 0.315 | 0.115 | 0.000 | 0.024 | 363 | 22 |
| Mode | 4.8 | 0.23 | 0 | 0.000 | 0.000 | 0 | 2 |
| Standard Deviation | 13.70 | 0.34 | 0.19 | 0.051 | 0.299 | 272.89 | 20.97 |
| Sample Variance | 187.63 | 0.12 | 0.04 | 0.003 | 0.089 | 74468.45 | 439.66 |
| Skewness | 1.66 | 1.05 | 1.82 | 2.983 | 6.377 | 0.67 | 0.95 |
| Range | 55.8 | 1.43 | 0.94 | 0.251 | 2.064 | 1249 | 76 |
| Minimum | 1.5 | 0.05 | 0 | 0.000 | 0.000 | 0 | 0 |
| Maximum | 57.3 | 1.48 | 0.94 | 0.251 | 2.064 | 1249 | 76 |
| Count | 48 | 48 | 48 | 48.00 | 48.00 | 48 | 48 |
| 97.5th | 48.53 | 1.24 | 0.61 | 0.160 | 0.292 | 899.93 | 74.30 |
| 99th | 53.35 | 1.39 | 0.79 | 0.208 | 1.235 | 1087.32 | 75.53 |
93
| | LA JOYA, NI 43-101 TECHNICAL REPORT |
| | RELEASED: MARCH 27, 2013 |
Table 58: Main Mineralized Trend Contact Skarn Descriptive Statistics for 2 metre Composited >30 AgEQ Metal Data
| MMT- 2 m | | | | | | | |
| Composited Contact | | | | | | | |
| Skarn Data; AgEQ | Ag (gpt) | Au (gpt) | Cu (%) | Pb (%) | Zn (%) | W (ppm) | Mo (ppm) |
| >30 gpt | | | | | | | |
| Mean | 12.87 | 0.41 | 0.17 | 0.019 | 0.079 | 371.33 | 25.85 |
| Standard Error | 1.63 | 0.04 | 0.02 | 0.006 | 0.035 | 35.06 | 2.80 |
| Median | 8.2 | 0.28 | 0.115 | 0.000 | 0.024 | 311 | 22 |
| Mode | 4.8 | 0.23 | 0 | 0.000 | 0.004 | 10 | 2 |
| Standard Deviation | 12.61 | 0.33 | 0.17 | 0.047 | 0.268 | 271.61 | 21.71 |
| Sample Variance | 158.92 | 0.11 | 0.03 | 0.002 | 0.072 | 73772.63 | 471.21 |
| Skewness | 1.82 | 1.19 | 2.03 | 3.300 | 7.111 | 0.82 | 0.91 |
| Range | 56.2 | 1.46 | 0.94 | 0.251 | 2.064 | 1249 | 77 |
| Minimum | 1.1 | 0.02 | 0 | 0.000 | 0.000 | 0 | 0 |
| Maximum | 57.3 | 1.48 | 0.94 | 0.251 | 2.064 | 1249 | 77 |
| Count | 60 | 60 | 60 | 60 | 60 | 60 | 60 |
| 97.5th | 47.90 | 1.18 | 0.58 | 0.160 | 0.279 | 891.23 | 75.53 |
| 99th | 52.34 | 1.36 | 0.76 | 0.197 | 1.023 | 1046.04 | 76.41 |
Table 59: Main Mineralized Trend Contact Skarn Descriptive Statistics for 2 metre Composited >60 AgEQ Metal Data
| MMT- 2m | | | | | | | |
| Composited Data | | | | | | | |
| Contact Skarn AgEQ | Ag (gpt) | Au (gpt) | Cu (%) | Pb (%) | Zn (%) | W (ppm) | Mo (ppm) |
| >60 gpt | | | | | | | |
| Mean | 24.762 | 0.524 | 0.350 | 0.041 | 0.242 | 640.000 | 19.692 |
| Standard Error | 5.199 | 0.142 | 0.071 | 0.020 | 0.154 | 77.160 | 2.697 |
| Median | 22.300 | 0.240 | 0.310 | 0.008 | 0.052 | 654.000 | 19.000 |
| Mode | #N/A | #N/A | #N/A | #N/A | #N/A | #N/A | #N/A |
| Standard Deviation | 18.744 | 0.512 | 0.255 | 0.073 | 0.555 | 278.204 | 9.724 |
| Sample Variance | 351.351 | 0.262 | 0.065 | 0.005 | 0.308 | 77397.500 | 94.564 |
| Skewness | 0.467 | 0.863 | 0.924 | 2.338 | 3.436 | 0.575 | 0.370 |
| Range | 54.9 | 1.43 | 0.94 | 0.2505 | 2.0613 | 1074 | 35 |
| Minimum | 2.4 | 0.05 | 0 | 0 | 0.0027 | 175 | 5 |
| Maximum | 57.3 | 1.48 | 0.94 | 0.2505 | 2.064 | 1249 | 40 |
| Count | 13 | 13 | 13 | 13 | 13 | 13 | 13 |
| 97.5th | 54.78 | 1.42 | 0.85 | 0.21 | 1.53 | 1145.80 | 36.70 |
| 99th | 56.29 | 1.46 | 0.90 | 0.23 | 1.85 | 1207.72 | 38.68 |
94
| | LA JOYA, NI 43-101 TECHNICAL REPORT |
| | RELEASED: MARCH 27, 2013 |
EBA feels that the reduction and interpolation of data values into the block model is well constrained and representative of the raw assay values. Cumulative probability plots shown in Figure 40 show an increase in grade control and elimination of lower grade dilution with successive data constraint.
Figure 40: MMT cumulative probability plots for silver, gold, copper, AgEQ, molybdenum and tungsten.
95
| | LA JOYA, NI 43-101 TECHNICAL REPORT |
| | RELEASED: MARCH 27, 2013 |
96
| | LA JOYA, NI 43-101 TECHNICAL REPORT |
| | RELEASED: MARCH 27, 2013 |
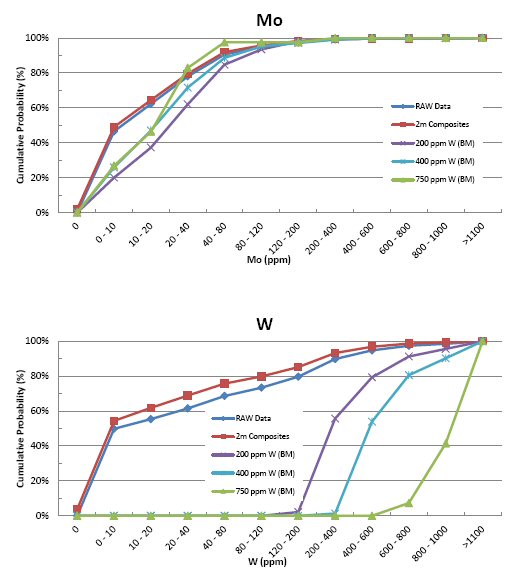
14.3.2.1 MMT High Grade Capping
Inspection of 2 metre composite grade distributions (Figure 41) for the MMT for silver, copper, gold, tungsten and molybdenum indicated that the data populations were positively skewed and may include multiple internal grade populations. Histogram distributions for each metal were used for visual determination of anomalous values and as the basis of high grade metal cap. High grade caps were applied to the 2 metre composites during interpolation of the block model using values of 550 gpt for silver, 6% for copper and 5.8 gpt for gold. No high grade cap was applied to molybdenum or tungsten data as distributions appear to be continuous and where outliers were noted, visual inspection confirmed that these samples occurred adjacent to other high grade samples in drill core records and are thereby not felt to be anomalous.
97
| | LA JOYA, NI 43-101 TECHNICAL REPORT |
| | RELEASED: MARCH 27, 2013 |
Figure 41: MMT histogram distributions of 2 metre composite data
98
| | LA JOYA, NI 43-101 TECHNICAL REPORT |
| | RELEASED: MARCH 27, 2013 |
99
| | LA JOYA, NI 43-101 TECHNICAL REPORT |
| | RELEASED: MARCH 27, 2013 |
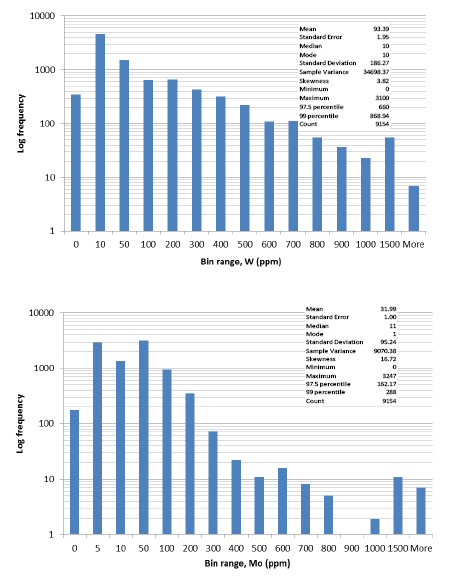
100
| | LA JOYA, NI 43-101 TECHNICAL REPORT |
| | RELEASED: MARCH 27, 2013 |
14.3.3 Santo Nino Geostatistics
Santo Nino had a total of 583 raw samples hosted within three mineralized domains (Structure, Manto, and Contact Skarn). The samples were selected from core sampling data and were used in the development of the geological model used in resource estimation. The raw samples were composited to 2 metre weighted averages and only composite samples contained within mineralized solids were included for geostatistical analysis and interpolation. Table 60 to Table 74 show sample statistics for each of the three domains of Santo Nino. Data normalization and 'reduction' resulted in a total of 595 2 metre composite samples used in interpolation. Of these, 223 samples represented manto mineralization with an average of 56 per manto, 166 represented SCSV, and 206 the contact skarn. The 2 metre composite samples were used for interpolation in only one mineralization domain. Descriptive statistics for the raw and 2 metre composites and resulting >15 gpt, >30 gpt and >60 gpt AgEQ cutoffs are listed in Table 60 to Table 74.
Table 60: Santo Nino - Manto Descriptive Statistics for Raw, Non-Composited, Metal Data
| Santo Nino - | | | | | | | |
| RAW Non - | | | | | | | |
| Composited | Ag (gpt) | Au (gpt) | Cu (%) | Pb (%) | Zn (%) | W (ppm) | Mo (ppm) |
| Data-Manto | | | | | | | |
| Mean | 7.74 | 0.04 | 0.17 | 0.012 | 0.099 | 193.24 | 64.06 |
| Standard Error | 1.22 | 0.01 | 0.03 | 0.003 | 0.015 | 16.53 | 8.74 |
| Median | 2.3 | 0.02 | 0.02 | 0.000 | 0.015 | 90 | 18 |
| Mode | 0.5 | 0 | 0 | 0.000 | 0.010 | 10 | 1 |
| Standard Deviation | 18.13 | 0.12 | 0.38 | 0.051 | 0.221 | 246.34 | 130.17 |
| Sample Variance | 328.87 | 0.01 | 0.14 | 0.003 | 0.049 | 60682.65 | 16943.59 |
| Skewness | 5.68 | 10.28 | 4.47 | 7.222 | 3.353 | 1.90 | 4.76 |
| Range | 178.9 | 1.61 | 2.86 | 0.540 | 1.280 | 1190 | 1149 |
| Minimum | 0.1 | 0 | 0 | 0.000 | 0.000 | 10 | 1 |
| Maximum | 179 | 1.61 | 2.86 | 0.540 | 1.280 | 1200 | 1150 |
| Count | 222 | 222 | 222 | 222 | 222 | 222 | 222 |
| 97.5th | 53.63 | 0.18 | 0.91 | 0.120 | 0.894 | 878.00 | 396.13 |
| 99th | 88.06 | 0.45 | 2.08 | 0.240 | 1.131 | 1027.90 | 607.56 |
101
| | LA JOYA, NI 43-101 TECHNICAL REPORT |
| | RELEASED: MARCH 27, 2013 |
| |
| Table 61: Santo Nino - Manto 2 metre Composited Descriptive Metal Data |
| |
| Santo Nino- 2 m- | | | | | | | |
| Composited | Ag (gpt) | Au (gpt) | Cu (%) | Pb (%) | Zn (%) | W (ppm) | Mo (ppm) |
| Data-Manto | | | | | | | |
| Mean | 5.41 | 0.03 | 0.10 | 0.009 | 0.068 | 137.83 | 63.13 |
| Standard Error | 0.665 | 0.005 | 0.016 | 0.002 | 0.010 | 12.431 | 7.686 |
| Median | 1.8 | 0.01 | 0.01 | 0.001 | 0.015 | 60 | 19 |
| Mode | 0.1 | 0.01 | 0 | 0.000 | 0.006 | 10 | 5 |
| Standard Deviation | 9.93 | 0.08 | 0.23 | 0.027 | 0.155 | 185.64 | 114.78 |
| Sample Variance | 98.54 | 0.01 | 0.05 | 0.001 | 0.024 | 34462.10 | 13174.79 |
| Skewness | 3.945 | 7.463 | 5.076 | 4.428 | 4.615 | 2.230 | 3.718 |
| Range | 74.4 | 0.89 | 2.21 | 0.200 | 1.173 | 1010 | 850 |
| Minimum | 0.1 | 0 | 0 | 0.000 | 0.002 | 10 | 1 |
| Maximum | 74.5 | 0.89 | 2.21 | 0.200 | 1.175 | 1020 | 851 |
| Count | 223 | 223 | 223 | 223 | 223 | 223 | 223 |
| 97.5th | 55.78 | 0.456 | 1.136 | 0.157 | 0.929 | 829 | 121.4 |
| 99th | 64.708 | 0.6468 | 1.73 | 0.184 | 1.035 | 978.4 | 127.76 |
| |
| |
| Table 62: Santo Nino - Manto 2 metre Composited >15 AgEQ Descriptive Metal Data | | | |
| |
| Santo Nino- 2 m | | | | | | | |
| Composited | Ag (gpt) | Au (gpt) | Cu (%) | Pb (%) | Zn (%) | W (ppm) | Mo (ppm) |
| Manto Data; | | | | | | | |
| AgEQ >15 gpt | | | | | | | |
| Mean | 44.34 | 0.07 | 0.31 | 0.019 | 0.143 | 239.86 | 26.74 |
| Standard Error | 4.72 | 0.02 | 0.04 | 0.005 | 0.029 | 29.54 | 3.96 |
| Median | 33.85 | 0.04 | 0.22 | 0.001 | 0.049 | 150 | 12 |
| Mode | 16 | 0.04 | 0.17 | 0.000 | 0.026 | 20 | 7 |
| Standard Deviation | 38.05 | 0.13 | 0.35 | 0.042 | 0.232 | 238.12 | 31.92 |
| Sample Variance | 1447.94 | 0.02 | 0.12 | 0.002 | 0.054 | 56702.00 | 1018.57 |
| Skewness | 3.76 | 4.58 | 3.21 | 2.866 | 2.931 | 1.49 | 1.87 |
| Range | 250.48 | 0.89 | 2.21 | 0.2 | 1.169 | 1010 | 137 |
| Minimum | 15.22 | 0 | 0 | 0 | 0.006 | 10 | 1 |
| Maximum | 265.7 | 0.89 | 2.21 | 0.2 | 1.175 | 1020 | 138 |
| Count | 65 | 65 | 65 | 65 | 65 | 65 | 65 |
| 97.5th | 55.78 | 0.456 | 1.136 | 0.157 | 0.929 | 829 | 121.4 |
| 99th | 64.708 | 0.6468 | 1.73 | 0.184 | 1.035 | 978.4 | 127.76 |
102
| | LA JOYA, NI 43-101 TECHNICAL REPORT |
| | RELEASED: MARCH 27, 2013 |
Table 63: Santo Nino - Manto 2 metre Composited >30 AgEQ Descriptive Metal Data
| Santo Nino- 2 m | | | | | | | |
| Composited | | | | | | | |
| Manto Data; | Ag (gpt) | Au (gpt) | Cu (%) | Pb (%) | Zn (%) | W (ppm) | Mo (ppm) |
| AgEQ >30 gpt | | | | | | | |
| Mean | 19.08 | 0.09 | 0.44 | 0.027 | 0.189 | 299.16 | 30.84 |
| Standard Error | 2.94 | 0.03 | 0.07 | 0.009 | 0.047 | 45.72 | 5.43 |
| Median | 11.6 | 0.04 | 0.34 | 0.001 | 0.059 | 195 | 18 |
| Mode | 4.8 | 0.04 | 0.23 | 0.000 | 0.026 | 75 | 5 |
| Standard Deviation | 17.89 | 0.16 | 0.42 | 0.053 | 0.288 | 278.10 | 33.01 |
| Sample Variance | 320.23 | 0.03 | 0.17 | 0.003 | 0.083 | 77341.92 | 1089.75 |
| Skewness | 1.48 | 4.07 | 2.56 | 2.15 | 2.28 | 1.09 | 1.60 |
| Range | 73.1 | 0.88 | 2.21 | 0.200 | 1.169 | 990 | 121 |
| Minimum | 1.4 | 0.01 | 0 | 0.000 | 0.006 | 30 | 1 |
| Maximum | 74.5 | 0.89 | 2.21 | 0.200 | 1.175 | 1020 | 122 |
| Count | 37 | 37 | 37 | 37 | 37 | 37 | 37 |
| 97.5th | 60.73 | 0.55 | 1.54 | 0.178 | 0.979 | 961.50 | 121.10 |
| 99th | 68.99 | 0.75 | 1.94 | 0.191 | 1.097 | 996.60 | 121.64 |
Table 64: Santo Nino - Manto 2 metre Composited >60 AgEQ Descriptive Metal Data
| Santo Nino- 2m | | | | | | | |
| Composited | | | | | | | |
| Data-Manto | Ag (gpt) | Au (gpt) | Cu (%) | Pb (%) | Zn (%) | W (ppm) | Mo (ppm) |
| AgEQ >60 gpt | | | | | | | |
| Mean | 28.764 | 0.046 | 0.724 | 0.040 | 0.180 | 427.500 | 31.429 |
| Standard Error | 6.267 | 0.008 | 0.146 | 0.019 | 0.065 | 88.058 | 10.814 |
| Median | 26.650 | 0.040 | 0.640 | 0.000 | 0.113 | 367.500 | 15.000 |
| Mode | 6.800 | 0.030 | 0.640 | 0.000 | #N/A | 710.000 | 4.000 |
| Standard | | | | | | | |
| Deviation | 23.451 | 0.028 | 0.545 | 0.070 | 0.244 | 329.482 | 40.462 |
| Sample Variance | 549.935 | 0.001 | 0.298 | 0.005 | 0.060 | 108558.269 | 1637.187 |
| Skewness | 0.573 | 1.709 | 1.712 | 1.670 | 2.783 | 0.525 | 1.809 |
| Range | 69.700 | 0.100 | 2.160 | 0.200 | 0.946 | 990.000 | 121.000 |
| Minimum | 4.8 | 0.02 | 0.05 | 0 | 0.0114 | 30 | 1 |
| Maximum | 74.5 | 0.12 | 2.21 | 0.2 | 0.957 | 1020 | 122 |
| Count | 14 | 14 | 14 | 14 | 14 | 14 | 14 |
| 97.5th | 69.528 | 0.110 | 1.966 | 0.192 | 0.743 | 998.875 | 121.675 |
| 99th | 72.511 | 0.116 | 2.113 | 0.197 | 0.871 | 1011.550 | 121.870 |
103
| | LA JOYA, NI 43-101 TECHNICAL REPORT |
| | RELEASED: MARCH 27, 2013 |
| Table 65: Santo Nino Structure Descriptive Statistics for Raw, Non-Composited, Metal Data | | | |
| |
| Santo Nino- RAW | | | | | | | |
| Non - | | | | | | | |
| Composited | Ag (gpt) | Au (gpt) | Cu (%) | Pb (%) | Zn (%) | W (ppm) | Mo (ppm) |
| Data-Structure | | | | | | | |
| Mean | 22.42 | 0.04 | 0.45 | 0.025 | 0.253 | 208.54 | 71.18 |
| Standard Error | 4.00 | 0.00 | 0.11 | 0.009 | 0.069 | 16.04 | 8.50 |
| Median | 3.85 | 0.02 | 0.03 | 0.000 | 0.020 | 130 | 24.5 |
| Mode | 0.3 | 0.01 | 0.01 | 0.000 | 0.010 | 10 | 5 |
| Standard Deviation | 53.38 | 0.06 | 1.43 | 0.116 | 0.914 | 214.03 | 113.37 |
| Sample Variance | 2849.54 | 0.00 | 2.03 | 0.014 | 0.836 | 45808.02 | 12851.83 |
| Skewness | 3.64 | 3.09 | 4.64 | 6.675 | 5.684 | 1.35 | 3.30 |
| Range | 300.7 | 0.48 | 10.25 | 1.000 | 7.540 | 900 | 699 |
| Minimum | 0.3 | 0 | 0 | 0.000 | 0.000 | 10 | 1 |
| Maximum | 301 | 0.48 | 10.25 | 1.000 | 7.540 | 910 | 700 |
| Count | 178 | 178 | 178 | 178 | 178 | 178 | 178 |
| 97.5th | 221.80 | 0.22 | 6.01 | 0.199 | 2.857 | 747.25 | 365.70 |
| 99th | 279.44 | 0.25 | 7.48 | 0.747 | 5.545 | 852.30 | 644.49 |
| Table 66: Santo Nino Structure Descriptive Statistics for 2 metre Composited, Metal Data | | | |
| |
| Santo Nino- 2 m- | | | | | | | |
| Composited | Ag (gpt) | Au (gpt) | Cu (%) | Pb %) | Zn (%) | W (ppm) | Mo (ppm) |
| Data-Structure | | | | | | | |
| Mean | 12.84 | 0.03 | 0.24 | 0.015 | 0.142 | 169.08 | 69.43 |
| Standard Error | 2.09 | 0.00 | 0.06 | 0.004 | 0.036 | 14.16 | 8.35 |
| Median | 2.9 | 0.01 | 0.03 | 0.000 | 0.020 | 100 | 27 |
| Mode | 0.3 | 0.01 | 0 | 0.000 | 0.007 | 10 | 14 |
| Standard Deviation | 26.99 | 0.04 | 0.73 | 0.056 | 0.462 | 182.41 | 107.58 |
| Sample Variance | 728.51 | 0.00 | 0.53 | 0.003 | 0.213 | 33272.61 | 11573.45 |
| Skewness | 3.61 | 2.33 | 4.93 | 5.589 | 5.304 | 1.39 | 3.24 |
| Range | 179.6 | 0.24 | 6.06 | 0.397 | 3.115 | 810 | 699 |
| Minimum | 0.2 | 0 | 0 | 0.000 | 0.002 | 10 | 1 |
| Maximum | 179.8 | 0.24 | 6.06 | 0.397 | 3.118 | 820 | 700 |
| Count | 166 | 166 | 166 | 166 | 166 | 166 | 166 |
| 97.5th | 92.63 | 0.15 | 2.51 | 0.178 | 1.412 | 651.75 | 389.75 |
| 99th | 123.15 | 0.20 | 3.21 | 0.344 | 3.046 | 710.50 | 525.35 |
104
| | LA JOYA, NI 43-101 TECHNICAL REPORT |
| | RELEASED: MARCH 27, 2013 |
Table 67: Santo Nino Structure Descriptive Statistics for 2 metre Composited >15 AgEQ Descriptive Metal Data
| Santo Nino- 2 m- | | | | | | | |
| Composited | Ag (gpt) | Au (gpt) | Cu (%) | Pb %) | Zn (%) | W (ppm) | Mo (ppm) |
| Structure Data; | | | | | | | |
| AgEQ >15 gpt | | | | | | | |
| Mean | 34.67 | 0.06 | 0.71 | 0.037 | 0.367 | 254.50 | 47.83 |
| Standard Error | 5.34 | 0.01 | 0.16 | 0.013 | 0.102 | 25.96 | 7.94 |
| Median | 16 | 0.04 | 0.195 | 0.000 | 0.095 | 199.5 | 21.5 |
| Mode | 5.1 | 0.01 | 0.11 | 0.000 | #N/A | 120 | 12 |
| Standard Deviation | 39.22 | 0.06 | 1.15 | 0.095 | 0.746 | 190.74 | 58.36 |
| Sample Variance | 1538.30 | 0.00 | 1.33 | 0.009 | 0.557 | 36383.61 | 3405.58 |
| Skewness | 1.89 | 1.59 | 2.68 | 3.003 | 2.989 | 0.99 | 2.02 |
| Range | 177.2 | 0.23 | 6.04 | 0.397 | 3.106 | 800 | 233 |
| Minimum | 2.6 | 0.01 | 0.02 | 0.000 | 0.012 | 20 | 4 |
| Maximum | 179.8 | 0.24 | 6.06 | 0.397 | 3.118 | 820 | 237 |
| Count | 54 | 54 | 54 | 54 | 54 | 54 | 54 |
| 97.5th | 139.725 | 0.21375 | 3.35375 | 0.357 | 3.061 | 690.25 | 223.175 |
| 99th | 167.345 | 0.2347 | 4.7032 | 0.383 | 3.095 | 756.4 | 233.29 |
Table 68: Santo Nino Structure Descriptive Statistics for 2 metre Composited >30 AgEQ Descriptive Metal Data
| Santo Nino- 2 m | | | | | | | |
| Composited | | | | | | | |
| Structure Data; | Ag (gpt) | Au (gpt) | Cu (%) | Pb (%) | Zn (%) | W (ppm) | Mo (ppm) |
| AgEQ >30 gpt | | | | | | | |
| Mean | 18.8 | 0.136 | 0.226 | 0.05 | 0.53 | 213.4 | 31.8 |
| Standard Error | 4.22 | 0.05 | 0.04 | 0.02 | 0.16 | 100.03 | 12.11 |
| Median | 14.6 | 0.2 | 0.24 | 0 | 0.1519 | 115 | 30 |
| Mode | #N/A | #N/A | #N/A | 0 | #N/A | #N/A | #N/A |
| Standard Deviation | 9.45 | 0.11 | 0.10 | 0.12 | 0.91 | 223.67 | 27.09 |
| Sample Variance | 89.22 | 0.01 | 0.01 | 0.01 | 0.83 | 50029.30 | 733.70 |
| Skewness | 1.76 | -0.57 | -1.23 | 2.20 | 2.25 | 2.09 | 1.18 |
| Range | 23.7 | 0.22 | 0.25 | 0.40 | 3.10 | 533 | 68 |
| Minimum | 11.2 | 0.01 | 0.07 | 0 | 0.0216 | 75 | 7 |
| Maximum | 34.9 | 0.23 | 0.32 | 0.40 | 3.12 | 608 | 75 |
| Count | 5 | 5 | 5 | 33 | 33 | 5 | 5 |
| 97.5th | 31.37 | 0.23 | 0.31 | 0.38 | 3.08 | 718.05 | 227.68 |
| 99th | 33.49 | 0.23 | 0.32 | 0.39 | 3.10 | 737.22 | 254.27 |
105
| | LA JOYA, NI 43-101 TECHNICAL REPORT |
| | RELEASED: MARCH 27, 2013 |
Table 69: Santo Nino Structure Descriptive Statistics for 2 metre Composited >60 AgEQ Descriptive Metal Data
| Santo Nino - 2m | | | | | | | |
| Composited Data- | Ag (gpt) | Au (gpt) | Cu (%) | Pb (%) | Zn (%) | W (ppm) | Mo (ppm) |
| Structure AgEQ >60 gpt | | | | | | | |
| Mean | 71.495 | 0.082 | 1.606 | 0.065 | 0.816 | 297.550 | 36.550 |
| Standard Error | 9.697 | 0.011 | 0.341 | 0.029 | 0.241 | 37.010 | 8.168 |
| Median | 61.250 | 0.075 | 1.410 | 0.000 | 0.278 | 273.500 | 20.500 |
| Mode | #N/A | 0.040 | #N/A | 0.000 | #N/A | #N/A | 9.000 |
| Standard Deviation | 43.366 | 0.051 | 1.525 | 0.129 | 1.079 | 165.514 | 36.530 |
| Sample Variance | 1880.585 | 0.003 | 2.326 | 0.017 | 1.165 | 27394.787 | 1334.471 |
| Skewness | 0.976 | 1.347 | 1.333 | 1.845 | 1.509 | 0.583 | 1.154 |
| Range | 164 | 0.22 | 6.04 | 0.3965 | 3.0834 | 585 | 117 |
| Minimum | 15.8 | 0.01 | 0.02 | 0 | 0.0342 | 85 | 4 |
| Maximum | 179.8 | 0.23 | 6.06 | 0.3965 | 3.1176 | 670 | 121 |
| Count | 20 | 20 | 20 | 20 | 20 | 20 | 20 |
| 97.5th | 168.638 | 0.192 | 4.844 | 0.365 | 3.098 | 603.500 | 109.125 |
| 99th | 175.335 | 0.215 | 5.574 | 0.384 | 3.110 | 643.400 | 116.250 |
Table 70: Santo Nino Contact Skarn Descriptive Statistics for Raw, Non-Composited Descriptive Metal Data
| Santo Nino - RAW Non | | | | | | | |
| - Composited Data- | Ag (gpt) | Au (gpt) | Cu (%) | Pb (%) | Zn (%) | W (ppm) | Mo (ppm) |
| Contact Skarn | | | | | | | |
| Mean | 2.697 | 0.017 | 0.027 | 0.007 | 0.055 | 152.099 | 57.481 |
| Standard Error | 0.499 | 0.004 | 0.006 | 0.003 | 0.013 | 17.071 | 6.091 |
| Median | 0.7 | 0 | 0.01 | 0.0005 | 0.01 | 70 | 31 |
| Mode | 0.2 | 0 | 0 | 0 | 0.01 | 10 | 3 |
| Standard Deviation | 6.72 | 0.05 | 0.08 | 0.04 | 0.17 | 229.67 | 81.95 |
| Sample Variance | 45.112 | 0.003 | 0.007 | 0.002 | 0.030 | 52748.901 | 6716.051 |
| Skewness | 5.250 | 5.905 | 5.726 | 10.903 | 5.943 | 3.912 | 3.255 |
| Range | 56.300 | 0.440 | 0.690 | 0.500 | 1.480 | 1870.000 | 559.000 |
| Minimum | 0.1 | 0 | 0 | 0 | 0 | 10 | 1 |
| Maximum | 56.4 | 0.44 | 0.69 | 0.5 | 1.48 | 1880 | 560 |
| Count | 181 | 181 | 181 | 181 | 181 | 181 | 181 |
| 97.5th | 20.15 | 0.145 | 0.2 | 0.04 | 0.4405 | 695 | 258 |
| 99th | 35.44 | 0.3 | 0.476 | 0.098 | 1.004 | 1024 | 370.4 |
106
| | LA JOYA, NI 43-101 TECHNICAL REPORT |
| | RELEASED: MARCH 27, 2013 |
| Table 71: Santo Nino Contact Skarn Descriptive Statistics for 2 metre Composited Descriptive Metal Data | | |
| |
| Santo Nino - 2 m | | | | | | | |
| Composited Contact | Ag (gpt) | Au (gpt) | Cu (%) | Pb (%) | Zn (%) | W (ppm) | Mo (ppm) |
| Skarn Data | | | | | | | |
| Mean | 2.00 | 0.01 | 0.02 | 0.005 | 0.050 | 122.49 | 53.33 |
| Standard Error | 0.28 | 0.00 | 0.00 | 0.002 | 0.011 | 11.35 | 4.99 |
| Median | 0.6 | 0.01 | 0.01 | 0.001 | 0.008 | 63 | 28 |
| Mode | 0.2 | 0 | 0 | 0.000 | 0.003 | 10 | 3 |
| Standard Deviation | 3.99 | 0.03 | 0.04 | 0.028 | 0.162 | 162.90 | 71.66 |
| Sample Variance | 15.91 | 0.00 | 0.00 | 0.001 | 0.026 | 26537.57 | 5134.85 |
| Skewness | 4.46 | 4.74 | 4.76 | 12.544 | 6.769 | 2.59 | 2.89 |
| Range | 34.8 | 0.23 | 0.32 | 0.385 | 1.478 | 1025 | 539 |
| Minimum | 0.1 | 0 | 0 | 0.000 | 0.002 | 10 | 1 |
| Maximum | 34.9 | 0.23 | 0.32 | 0.385 | 1.480 | 1035 | 540 |
| Count | 206 | 206 | 206 | 206 | 206 | 206 | 206 |
| 97.5th | 14.10 | 0.08 | 0.12 | 0.033 | 0.439 | 573.75 | 243.25 |
| 99th | 17.25 | 0.21 | 0.24 | 0.040 | 0.643 | 759.50 | 314.05 |
| Table 72: Santo Nino Contact Skarn Descriptive Statistics for 2 metre Composited >15 AgEQ Metal Data | | |
| |
| Santo Nino - 2 m | | | | | | | |
| Composited Contact | | | | | | | |
| Skarn Data; AgEQ | Ag (gpt) | Au (gpt) | Cu (%) | Pb (%) | Zn (%) | W (ppm) | Mo (ppm) |
| >15 gpt | | | | | | | |
| Mean | 15.82 | 0.089 | 0.167 | 0.050 | 0.180 | 266.2 | 50.6 |
| Standard Error | 2.39 | 0.03 | 0.03 | 0.037 | 0.077 | 78.18 | 25.37 |
| Median | 14.35 | 0.045 | 0.165 | 0.005 | 0.040 | 144.5 | 24 |
| Mode | #N/A | 0.01 | 0.12 | 0.002 | #N/A | 95 | #N/A |
| Standard Deviation | 7.56 | 0.09 | 0.10 | 0.118 | 0.242 | 247.22 | 80.24 |
| Sample Variance | 57.20 | 0.01 | 0.01 | 0.014 | 0.059 | 61119.29 | 6438.27 |
| Skewness | 1.95 | 0.88 | 0.02 | 3.072 | 1.312 | 1.19 | 2.84 |
| Range | 27.4 | 0.22 | 0.31 | 0.385 | 0.642 | 687 | 265 |
| Minimum | 7.5 | 0.01 | 0.01 | 0.000 | 0.005 | 63 | 7 |
| Maximum | 34.9 | 0.23 | 0.32 | 0.385 | 0.647 | 750 | 272 |
| Count | 10 | 10 | 10 | 10 | 10 | 10 | 10 |
| 97.5th | 31.37 | 0.23 | 0.31 | 0.307 | 0.627 | 718.05 | 227.68 |
| 99th | 33.49 | 0.23 | 0.32 | 0.353 | 0.639 | 737.22 | 254.27 |
107
| | LA JOYA, NI 43-101 TECHNICAL REPORT |
| | RELEASED: MARCH 27, 2013 |
Table 73: Santo Nino Contact Skarn Descriptive Statistics for 2 metre Composited >30 AgEQ Metal Data
| Santo Nino - 2 m | | | | | | | |
| Composited | Ag (gpt) | Au (gpt) | Cu (%) | Pb (%) | Zn (%) | W (ppm) | Mo (ppm) |
| Contact Skarn Data; | | | | | | | |
| AgEQ >30 gpt | | | | | | | |
| Mean | 18.8 | 0.136 | 0.226 | 0.080 | 0.211 | 213.4 | 31.8 |
| Standard Error | 4.22 | 0.05 | 0.04 | 0.076 | 0.122 | 100.03 | 12.11 |
| Median | 14.6 | 0.2 | 0.24 | 0.005 | 0.043 | 115 | 30 |
| Mode | #N/A | #N/A | #N/A | #N/A | #N/A | #N/A | #N/A |
| Standard Deviation | 9.45 | 0.11 | 0.10 | 0.170 | 0.274 | 223.67 | 27.09 |
| Sample Variance | 89.22 | 0.01 | 0.01 | 0.029 | 0.075 | 50029.30 | 733.70 |
| Skewness | 1.76 | -0.57 | -1.23 | 2.236 | 1.347 | 2.09 | 1.18 |
| Range | 23.7 | 0.22 | 0.25 | 0.383 | 0.636 | 533 | 68 |
| Minimum | 11.2 | 0.01 | 0.07 | 0.002 | 0.012 | 75 | 7 |
| Maximum | 34.9 | 0.23 | 0.32 | 0.385 | 0.647 | 608 | 75 |
| Count | 5 | 5 | 5 | 5 | 5 | 5 | 5 |
| 97.5th | 31.37 | 0.23 | 0.31 | 0.347 | 0.614 | 718.05 | 227.68 |
| 99th | 33.49 | 0.23 | 0.32 | 0.369 | 0.634 | 737.22 | 254.27 |
Table 74: Santo Nino Contact Skarn Descriptive Statistics for 2 metre Composited >60 AgEQ Metal Data
| Santo Nino - 2m | | | | | | | |
| Composited Data-Contact | Ag (gpt) | Au (gpt) | Cu (%) | Pb (%) | Zn (%) | W (ppm) | Mo (ppm) |
| Skarn AgEQ >60 gpt | | | | | | | |
| Count | 0 | 0 | 0 | 0 | 0 | 0 | 0 |
EBA feels that the reduction and interpolation of data values into the Santo Nino block model is well constrained and representative of the raw assay values. Cumulative probability plots shown in Figure 42 show an increase in grade control and elimination of lower grade dilution with successive data constraint.
108
| | LA JOYA, NI 43-101 TECHNICAL REPORT |
| | RELEASED: MARCH 27, 2013 |
Figure 42: Santo Nino cumulative probability plots for silver, gold, copper, AgEQ, molybdenum and tungsten
109
| | LA JOYA, NI 43-101 TECHNICAL REPORT |
| | RELEASED: MARCH 27, 2013 |
110
| | LA JOYA, NI 43-101 TECHNICAL REPORT |
| | RELEASED: MARCH 27, 2013 |
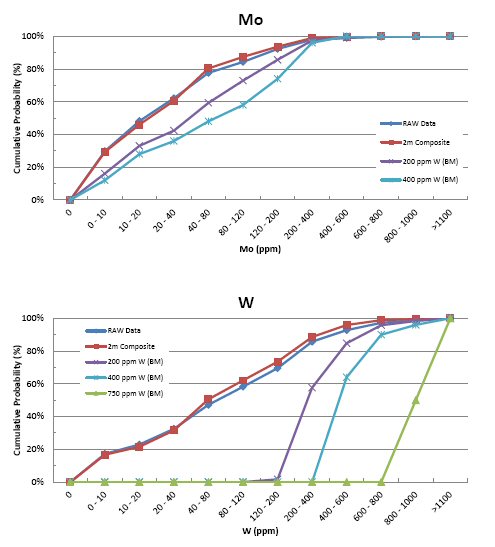
111
| | LA JOYA, NI 43-101 TECHNICAL REPORT |
| | RELEASED: MARCH 27, 2013 |
14.3.3.1 Santo Nino High Grade Capping
Inspection of 2 metre composite grade distributions (Figure 43) in Santo Nino mineralized solids for silver, copper, gold, tungsten and molybdenum indicated that the data populations were positively skewed and may include multiple internal grade populations. Histogram distributions for each metal were used for visual determination of anomalous values and for the basis of high grade metal caps. High grade caps were applied to the 2 metre composites during interpolation of the block model using values of 550 gpt for silver, 6% for copper and 5.8 gpt for gold. No grade cap was applied to molybdenum or tungsten data as distributions appear to be continuous and where outliers were noted, visual inspection confirmed that these samples occurred adjacent to other high grade samples in drill core records and are thereby not felt to be anomalous.
Figure 43: Santo Nino histogram for distributions of 2 metre composite data
112
| | LA JOYA, NI 43-101 TECHNICAL REPORT |
| | RELEASED: MARCH 27, 2013 |
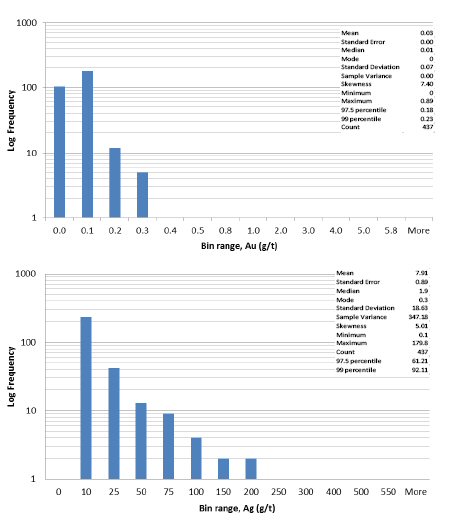
113
| | LA JOYA, NI 43-101 TECHNICAL REPORT |
| | RELEASED: MARCH 27, 2013 |
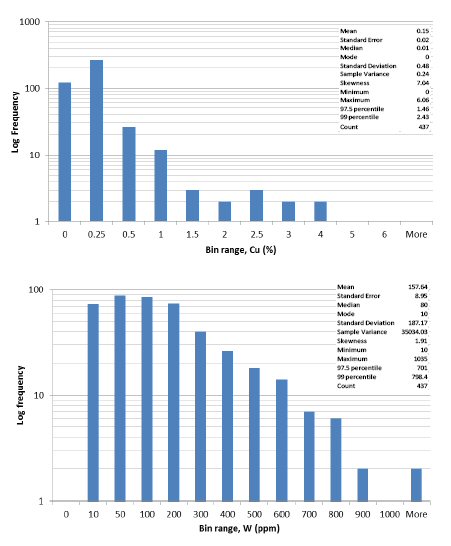
114
| | LA JOYA, NI 43-101 TECHNICAL REPORT |
| | RELEASED: MARCH 27, 2013 |
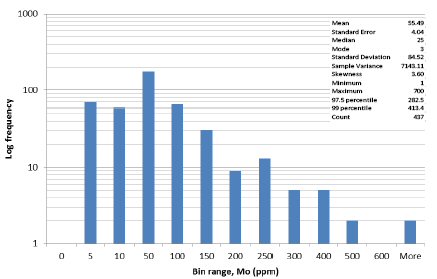
Coloradito used 2,784 recent and historically verified raw samples within two solids of contact skarn designation, one large primary solid and a second smaller solid constrained by 200 ppm W. These were used in the development of the geological and resource estimation model. Raw samples within the contact skarn were composited to 2 metre weighted averages, with the data 'reduction' resulting in 964 normalized composite samples. Minor Ag, Au & Cu mineralization was also located in the primary and secondary solids. Descriptive statistics for the raw and 2 metre composite samples contained within contact skarn, along with the resulting >15 gpt, 30 gpt and >60 gpt AgEQ cutoff and 200 ppm and 400 ppm W cutoffs, are listed in Table 75 to Table 81.
115
| | LA JOYA, NI 43-101 TECHNICAL REPORT |
| | RELEASED: MARCH 27, 2013 |
| Table 75: Coloradito Contact Skarn - Descriptive Statistics for Raw, Non-Composited, Metal Data | | |
| |
| Coloradito - | | | | | |
| | Ag (gpt) | Au (gpt) | Cu (%) | Mo (ppm) | W (ppm) |
| RAW Data Contact Skarn | | | | | |
| Mean | 7.85 | 0.08 | 0.03 | 274.91 | 390.82 |
| Standard Error | 0.33 | 0.00 | 0.00 | 9.24 | 7.57 |
| Median | 2.4 | 0.04 | 0.01 | 105.5 | 300 |
| Mode | 1 | 0.01 | 0.01 | 4 | 10 |
| Standard Deviation | 17.55 | 0.12 | 0.04 | 487.74 | 399.32 |
| Sample Variance | 307.94 | 0.02 | 0.00 | 237889.66 | 159459.83 |
| Skewness | 6.18 | 4.78 | 4.00 | 5.20 | 2.33 |
| Minimum | 0 | 0 | 0 | 0 | 0 |
| Maximum | 230 | 1.43 | 0.41 | 6520 | 3970 |
| Count | 2784 | 2784 | 2784 | 2784 | 2784 |
| 97.5th | 58 | 0.39 | 0.17 | 1570 | 1360.2 |
| 99th | 83 | 0.5651 | 0.2217 | 2240 | 1816.8 |
| |
| Table 76: Coloradito Contact Skarn - 2 metre Composited Descriptive Metal Data | | |
| Coloradito - 2 metre- | Ag (gpt) | Au (gpt) | Cu (%) | Mo (ppm) | W (ppm) |
| Composited Data | | | | | |
| Mean | 6.71 | 0.07 | 0.02 | 254.08 | 352.60 |
| Standard Error | 0.45 | 0.00 | 0.00 | 13.67 | 11.34 |
| Median | 2.20 | 0.04 | 0.01 | 94.00 | 260 |
| Mode | 1.00 | 0.01 | 0.01 | 4.00 | 10 |
| Standard Deviation | 13.91 | 0.10 | 0.03 | 424.41 | 352.07 |
| Sample Variance | 193.48 | 0.01 | 0.00 | 180125.57 | 123950.77 |
| Skewness | 5.90 | 3.28 | 4.30 | 4.22 | 1.84 |
| Minimum | 0.00 | 0.00 | 0.00 | 0.00 | 0 |
| Maximum | 191.00 | 0.84 | 0.32 | 4710.00 | 3060 |
| Count | 964 | 964 | 964 | 964 | 964 |
| 97.5th | 40.93 | 0.34 | 0.11 | 1470.13 | 1272.00 |
| 99th | 66.37 | 0.49 | 0.15 | 2048.10 | 1512.36 |
116
| | LA JOYA, NI 43-101 TECHNICAL REPORT |
| | RELEASED: MARCH 27, 2013 |
| |
| |
| |
| |
| Table 77: Coloradito Contact Skarn - Composited >15 AgEQ Descriptive Metal Data | | |
| |
| Coloradito - 2 metre- | | | | | |
| Composited Contact Skarn | Ag (gpt) | Au (gpt) | Cu (%) | Mo (ppm) | W (ppm) |
| Data; >15 gpt AgEQ | | | | | |
| Mean | 20.4 | 0.2 | 0.0 | 469.2 | 531.6 |
| Standard Error | 1.5 | 0.0 | 0.0 | 43.8 | 25.1 |
| Median | 13.2 | 0.13 | 0.02 | 238.5 | 478 |
| Mode | 13.10 | 0.06 | 0.01 | 4 | 40 |
| Standard Deviation | 23.2 | 0.1 | 0.1 | 670.6 | 383.5 |
| Sample Variance | 536.1 | 0.0 | 0.0 | 449750.9 | 147070.8 |
| Skewness | 3.4 | 1.9 | 2.7 | 3.0 | 1.2 |
| Minimum | 0.8 | 0.01 | 0 | 1 | 10 |
| Maximum | 191 | 0.84 | 0.32 | 4710 | 2430 |
| Count | 234 | 234 | 234 | 234 | 234 |
| 97.5th | 94.01 | 0.54275 | 0.21525 | 2165.75 | 1394.675 |
| |
| |
| |
| Table 78: Coloradito Contact Skarn - >30 AgEQ Descriptive Metal Data | | | |
| |
| Coloradito - 2 metre- | | | | | |
| Composited Contact Skarn | Ag (gpt) | Au (gpt) | Cu (%) | Mo (ppm) | W (ppm) |
| Data; >30 gpt AgEQ | | | | | |
| Mean | 37.69 | 0.23 | 0.05 | 559.14 | 503.05 |
| Standard Error | 3.21 | 0.02 | 0.01 | 81.50 | 40.63 |
| Median | 29.75 | 0.175 | 0.03 | 242 | 481.5 |
| Mode | 60 | 0.05 | 0.02 | 20 | 30 |
| Standard Deviation | 30.08 | 0.19 | 0.07 | 764.56 | 381.13 |
| Sample Variance | 904.74 | 0.04 | 0.00 | 584551.06 | 145258.85 |
| Skewness | 2.32 | 1.50 | 2.65 | 2.46 | 1.63 |
| Minimum | 1.3 | 0.03 | 0 | 2 | 10 |
| Maximum | 191 | 0.84 | 0.32 | 3670 | 2430 |
| 97.5th | 103.40 | 0.72 | 0.27 | 3271.25 | 1125.00 |
| 99th | 141.15 | 0.81 | 0.31 | 3574.30 | 1442.55 |
LA JOYA, NI 43-101 TECHNICAL REPORT
RELEASED : MARCH 27, 2013
Table 79: Coloradito Contact Skarn - >60 AgEQ Descriptive Metal Data
| Coloradito - 2m- | | | | | |
| Composited Data-60 gpt | Ag (gpt) | Au (gpt) | Cu (%) | Mo (ppm) | W (ppm) |
| AgEQ | | | | | |
| Mean | 7.75 | 2.57 | 0.005 | 31 | 10 |
| Standard Error | 2.25 | 0.79 | 0.005 | 3 | 0 |
| Median | 7.75 | 2.57 | 0.005 | 31 | 10 |
| Mode | N/A | N/A | N/A | N/A | 10 |
| Standard Deviation | 3.18 | 1.12 | 0.01 | 4.24 | 0 |
| Sample Variance | 10.13 | 1.25 | 0.00 | 18.00 | 0 |
| Skewness | N/A | N/A | N/A | N/A | N/A |
| Minimum | 5.5 | 1.78 | 0 | 28 | 10 |
| Maximum | 10 | 3.36 | 0.01 | 34 | 10 |
| Count | 2 | 2 | 2 | 2 | 2 |
| 97.5th | 9.888 | 3.321 | 0.010 | 33.850 | 10.000 |
| 99th | 9.955 | 3.344 | 0.010 | 33.940 | 10.000 |
Table 80: Coloradito Contact Skarn - >200 ppm W Descriptive Metal Data
| Coloradito - 2 metre Composited Data | | |
| >200 ppm W | Mo (ppm) | W (ppm) |
| Mean | 360.85 | 562.46 |
| Standard Error | 18.98 | 14.17 |
| Median | 226.50 | 471.50 |
| Mode | 13 | 240 |
| Standard Deviation | 445.87 | 332.86 |
| Sample Variance | 198799.48 | 110797.83 |
| Skewness | 3.33 | 2.16 |
| Minimum | 2 | 200 |
| Maximum | 4710 | 3060 |
| Count | 552 | 552 |
| 97.5th | 0.07225 | 288.45 |
| 99th | 0.1298 | 390.98 |
118
LA JOYA, NI 43-101 TECHNICAL REPORT
RELEASED : MARCH 27, 2013
Table 81: Coloradito Contact Skarn - >200 ppm W Descriptive Metal Data
| Coloradito - 2 metre- Composited Data | | |
| >400 ppm W | Mo (ppm) | W (ppm) |
| Mean | 432.47 | 720.16 |
| Standard Error | 25.64 | 17.68 |
| Median | 289 | 625 |
| Mode | 829 | 420 |
| Standard Deviation | 476.88 | 328.92 |
| Sample Variance | 227413.20 | 108187.87 |
| Skewness | 3.33 | 2.39 |
| Minimum | 2 | 400 |
| Maximum | 4710 | 3060 |
| Count | 346 | 346 |
| 97.5th | 1541.25 | 1662.75 |
| 99th | 1758.65 | 2074.25 |
EBA feels that the reduction and interpolation of data values into the Coloradito block model is well constrained and representative of the raw assay values. Cumulative probability plots shown in Figure 44 show an increase in grade control and elimination of lower grade dilution with successive data constraint.
Figure 44: Coloradito cumulative probability plots for silver, gold, copper, AgEQ, Molybdenum and Tungsten.
LA JOYA, NI 43-101 TECHNICAL REPORT
RELEASED : MARCH 27, 2013
120
LA JOYA, NI 43-101 TECHNICAL REPORT
RELEASED : MARCH 27, 2013
LA JOYA, NI 43-101 TECHNICAL REPORT
RELEASED : MARCH 27, 2013
14.3.4.1 Coloradito High Grade Capping
Inspection of 2 metre composite (Figure 45) grade distributions of the Coloradito for tungsten, molybdenum, silver, copper and gold indicated that the data populations were positively skewed and may include multiple internal grade populations. Histogram distributions for each metal were used for visual determination of anomalous values and as the basis of high grade metal caps. High grade caps were applied to the 2 metre composites during interpolation of the block model using values of 550 gpt for silver, 6% for copper and 5.8 gpt for gold. No high grade caps were applied to the composite dataset as distributions appear to be continuous and where outliers were noted, visual inspection confirmed that these samples occurred adjacent to other high grade samples in drill core records and are thereby not felt to be anomalous.
LA JOYA, NI 43-101 TECHNICAL REPORT RELEASED : MARCH 27, 2013
Figure 45: Coloradito histogram distributions of 2 metre composite data
LA JOYA, NI 43-101 TECHNICAL REPORT RELEASED : MARCH 27, 2013
LA JOYA, NI 43-101 TECHNICAL REPORT RELEASED : MARCH 27, 2013
| 14.3.5 | Interpolation and Modelling Parameters |
Based on the low sample density available within each mineralized solid, EBA determined that variography analysis was not effective in determination of orientation and anisotropy values of elliptical search parameters. Instead, the orientations of the search ellipses were aligned corresponding to the geological interpretation. Anisotropy and search axis ranges listed in Table 82 were based on iterative interpolation and field observations.
14.3.5.1 Main Mineralized Trend
The resource is based on verified information from historical and recent (Phase I and II) SilverCrest sources. Raw assay data was composited to 2 metre and interpolated into a block model using 5 m x 5 m x 5 m block size using inverse distance squared (ID2) methodology. A series of distinct search ellipses were defined for each mineralized domains based on geological field observation, geostatistical analysis and iterative interpolation. High grade ranges are based on +2SD from the mean values of each reporting metal for this specific model.
Table 82 lists the anisotropic search ellipses for silver, copper and gold mineralization within the stratabound mantos. High grade range limiting ellipses, where manto grades exceeded 150 gpt Ag, 1 gpt Au, or 1 % Cu, are shown in parentheses. High grade ranges limits the lateral influence of high grades associated with proximal skarn near the SCSV corridors.
LA JOYA, NI 43-101 TECHNICAL REPORT RELEASED : MARCH 27, 2013
Table 82: Model Search Parametres
| | Mineralization | | Major Axis | Semi-major | Minor Axis | Min - Max | Reporting |
| | | Orientation | | | | | |
| | Type | | Range | Axis Range | Range | Composites | Composites |
| |
| | Manto | 110,5,0 (Z,Y,Z) | 75 (40*) | 75 (40*) | 35 (20*) | 2 to 12 | 3 |
| | SCSV | 10,90,-90 (Z,Y,Z) | 80 (30*) | 80 (30*) | 20 (15*) | 2 to 12 | 3 |
| | Contact Skarn | 0,-15,0 (Z,Y,Z) | 150 | 150 | 75 | 2 to 12 | 5 |
| MMT | | | | | | | |
| | Contact Skarn | 240,-10,0 (Z,Y,Z) | 200 | 200 | 100 | 2 to 12 | 5 |
| | Contact Skarn | 0,0,0 (Z,Y,Z) | 200 | 200 | 100 | 2 to 12 | 5 |
| | HT | 10,-90,90 (Z,Y,Z) | 70 | 70 | 35 | 2 to 12 | 3 |
| | Manto | 55,10,55 (Z,Y,Z) | 75 (40**) | 75 (40**) | 30 (20**) | 2 to 12 | 3 |
| | SCSV | 10, 90,-90 (Z,Y,Z) | 80 (30**) | 80 (30**) | 20 (15**) | 2 to 12 | 3 |
| Santo Nino | | | | | | | |
| | Contact Skarn | 50,12, 0 (Z,Y,Z) | 150 | 150 | 75 | 2 to 12 | 5 |
| | HT | 30,90,-90 (Z,Y,Z) | 100 | 100 | 40 | 2 to 12 | 3 |
| | Manto | 250,25,250 (Z,Y,Z) | 90 | 75 | 50 | 2 to 20 | 6 |
| Coloradito | Contact Skarn A | 250,25,145 (Z,Y,Z) | 125 | 125 | 60 | 2 to 20 | 6 |
| | Contact Skarn B | 18, 80, 60 (Z,Y,Z) | 60 | 50 | 20 | 2 to 20 | 6 |
*MMT high grade threshold (150 gpt Ag, 1 gpt Au and 1% Cu) limiting search ellipse ranges **Santo Nino high grade threshold (92 gpt Ag, 0.21 gpt Au and 2.39% Cu) limiting search ellipse ranges
Silver, copper, gold, lead, zinc, tungsten and molybdenum grades were interpolated into blocks contained within the interpreted SCSV corridors Table 82 list search ellipse orientation and ranges. High grade range limiting ellipses, where manto grades exceeded 150 gpt Ag, 1 gpt Au, or 1 % Cu, are shown in parentheses. Mineralization contained within these solids demonstrated continuity and is considered to be the most recent mineralization event. Grades within the SCSV solids were interpolated into the block model to overprint all other forms of mineralization.
Tungsten and molybdenum mineralization has been recognized as continuous within the intrusive draping contact skarn. Table 82 list the three search ellipses orientations and ranges relating to the three individual solids segregated from the contact skarn to aid interpolation.
For volume and grade calculations in the mineralized and overprinting manto and structure (SCSV) intercepts, a series of HT solids were created. The HT solids constrained grade interpolation bleed into the adjoining manto and SCSV zones. The HT zones interpolated silver, copper, silver, lead, zinc, tungsten and molybdenum with the search ellipse and ranges listed in Table 82.
Table 83 provides a summary of average reporting composite data by solid. Average reporting composite distances indicate that sample density may be low. Infill drilling is recommended in order to increase sample density and improve geostatistical characterization of the individual mineralized trends.
LA JOYA, NI 43-101 TECHNICAL REPORT RELEASED : MARCH 27, 2013
Table 83: Average Reporting Composite Data for Block Model by Mineralized Solid Type for the MMT
| | Average Distance to Nearest | Average Number of | Average Number of |
| Solid Type | Reporting Composite (m) | Reporting Composites | Reporting Drill holes |
| Manto | 53 | 7 | 2 |
| SCSV | 60 | 7 | 2 |
| Contact Skarn | 108 | 9 | 3 |
| HT | 40 | 7 | 2 |
14.3.5.2 Santo Nino
The resource is based on verified historical and recent (Phase II) SilverCrest drilling. Raw assay data was composited to 2 metre and interpolated into a block model using 5 m x 5 m x 5 m block size model using inverse distance squared (ID2) methodology. A series of distinct search ellipses were defined for each of spatially associated mineralized domain, based on geological field observation, geostatistical analysis and iterative interpolation. High grade ranges are based on +2SD from the mean values of each reporting metal for this specific model.
Table 82 lists the anisotropic search ellipses for silver, copper and gold mineralization within the stratabound mantos. High grade range limiting search ellipses, where manto grades exceeded 92 gpt Ag, 0.21 gpt Au, or 2.39%, are shown in parentheses. High grade ranges limits the lateral influence of high grades associated with proximal skarn near the SCSV corridors.
Silver, copper, gold, lead, zinc, tungsten and molybdenum grades were interpolated into blocks contained within the interpreted SCSV corridors using an anisotropic ellipse with orientation and ranges listed in Table 82. High grade range limiting ellipses, where manto grades exceeded 92 gpt Ag, 0.21 gpt Au, or 2.39% Cu, are shown in parentheses. Mineralization contained within these solids has demonstrated continuity and is considered to be the most recent mineralization event. Grades within the SCSV solids were interpolated into the block model to overprint all other forms of mineralization. Tungsten and molybdenum mineralization has been recognized to be continuous within the contact skarn. Grades were interpolated into blocks contained within the interpreted contact skarn using an anisotropic ellipse (Table 82).
The HT solids restricted grade interpolation into the adjoining manto and SCSV corridors. These zones interpolated silver, copper, silver, lead, zinc, tungsten and molybdenum. Table 82 list the search ellipse orientation and range parameters.
Table 84 provides a summary of the average reporting composite data by solid. Average distances indicate that sample density may be moderate. Infill drilling is recommended to increase sample density with the aim to improve geostatistical characterization of the individual mineralized trends.
| | | LA JOYA, NI 43-101 TECHNICAL REPORT |
| | | | RELEASED : MARCH 27, 2013 |
| |
| |
| |
| |
| Table 84: Main Mineralized Trend - Manto 2 metre Composited >30 AgEQ Descriptive Metal Data | |
| |
| | Average Distance to Nearest | Average Number of | Average Number of |
| Solid Type | Reporting Composite (m) | Reporting Composites | Reporting Drill holes |
| Manto | 15 | 6 | 2 |
| SCSV | 24 | 7 | 53 |
| Contact Skarn | 2 | 8 | 91 |
| HT | 12 | 10 | 50 |
| |
| 14.3.5.3 Coloradito | | | |
The resource is based on verified and resampled historical and recent Phase II SilverCrest drilling. Raw assay data was composited to 2 metre and interpolated into a block model using 5 m x 5 m x 5 m block size model using inverse distance squared (ID2) methodology. A series of distinct search ellipses were defined for each of spatially associated mineralized domain, based on geological field observation, geostatistical analysis and iterative interpolation. Tungsten and molybdenum mineralization is of primary interest at Coloradito and occur in two grade solids. Both are constrained by tungsten grades with a >200 ppm cut off. Table 82 lists search ellipse orientation and ranges.
Table 85 lists the average data of blocks within the >200 ppm W tungsten contact skarn grade solid. Average distances indicate that sample density may be low for contact skarn A. Infill drilling is recommended to increase sample density with the aim to improve geostatistical characterization of the individual mineralized trends.
Table 85: Average Reporting Composite Data for Block Model by Mineralized Solid Type for Coloradito
| | Solid Type | Average Distance to Nearest | Average Number of | Average Number of |
| | | Reporting Composite (m) | Reporting Composites | Reporting Drill holes |
| Contact Skarn A | 71 | 11 | 2 |
| Contact Skarn B | 30 | 5 | 2 |
14.4 | Resource Estimate | | |
An updated Mineral Resource has been estimated for the MMT deposit and initial Mineral Resources have been estimated for the Santo Nino and Coloradito deposits.
Silver, copper, gold, tungsten and molybdenum hosted in Manto and Structure mineralization at the MMT and Santo Nino deposits have been reported as Inferred Mineral Resources at a 30 gpt AgEQ6 cut-off in Table 86 below. Block model sensitivities using 15 gpt AgEQ6 and 60 gpt AgEQ6 cut-offs have been included in the table. Grade contours for MMT of the 15, 30, 50, 100 and 200 gpt AgEQ6 are plotted in Figure 46.
Tungsten and molybdenum hosted in Contact Zone mineralization at the MMT, Santo Nino and Coloradito deposits have been reported as Inferred Mineral Resources at a 0.050% WO3 cut-off in Table 87, below. Block model sensitivities using 0.025% WO3 and 0.095% WO3 cut-offs have been included in the table. EBA considers the 30gpt AgEQ and 0.05% WO3 (tungsten trioxide) as an appropriate reporting cut-off for this inferred mineral resource estimate.
| | | | | | | | | | | LA JOYA, NI 43-101 TECHNICAL REPORT |
| | | | | | | | | | | | RELEASED : MARCH 27, 2013 |
| |
| |
| |
| | Table 86: Inferred Ag-Cu-Au- Resource Estimation for MMT and, Santo Nino Deposits, Effective Date Dec. 16, 2012 | | |
| |
| |
| | | | | | | | Au | | | | | | |
| | | 7 | AgEQ Cut | Rounded | | Ag | | Cu | Contained | Contained | Contained | Contained |
| | Zone | Category | off (gpt) 6 | Tonnes | SG | (gpt) | (gpt | (%) | Ag (oz) | Au (oz) | Cu (lbs) | AgEQ (oz)6 |
| | | | | | | | ) | | | | | | |
| |
| | | | 15 | 120,570,000 | 3.00 | 23.7 | 0.18 | 0.18 | 91,855,000 | 708,000 | 466,474,000 | 185,757,000 | |
| | MMT 8 | | | | | | | | | | | | |
| | (Ag, Au, | Inferred | 30 | 67,618,000 | 3.00 | 34.6 | 0.24 | 0.25 | 75,367,000 | 519,000 | 377,392,000 | 148,671,000 | |
| | Cu) | | | | | | | | | | | | |
| | | | 60 | 26,109,000 | 3.00 | 58.5 | 0.3 | 0.42 | 49,129,000 | 256,000 | 240,114,000 | 92,035,000 | |
| | Santo | | 15 | 6,169,000 | 3.00 | 20.3 | 0.04 | 0.49 | 4,039,000 | 8,000 | 66,775,000 | 12,826,000 | |
| | Nino 8 | Inferred | 30 | 3,586,000 | 3.00 | 29.1 | 0.05 | 0.75 | 3,363,000 | 5,000 | 59,384,000 | 11,079,000 | |
| | (Ag, Au, | | | | | | | | | | | | |
| | Cu) | | 60 | 1,818,000 | 3.00 | 43.0 | 0.05 | 1.2 | 2,517,000 | 3,000 | 48,269,000 | 872,000 | |
| |
| | | | 15 | 126,739,000 | | 23.5 | 0.17 | 0.20 | 95,894,000 | 716,000 | 533,249,000 | 198,583,000 | |
| | TOTAL | Inferred | 30 | 71,204,000 | | 34.4 | 0.23 | 0.28 | 78,730,000 | 524,000 | 436,776,000 | 159,750,000 | |
| | | | 60 | 27,927,000 | | 57.5 | 0.28 | 0.47 | 51,646,000 | 259,000 | 288,383,000 | 92,907,000 | |
| 6. | Silver equivalency includes silver, gold and copper and excludes lead, zinc, molybdenum and tungsten values. Ag:Au is 50:1, Ag:Cu is 86:1, based on 5 year historic metal price trends of US$24/oz silver, US$1200/oz gold, US$3/lb copper. 100% metallurgical recovery is assumed. |
| 7. | Classified by EBA, A Tetra Tech Company and conforms to NI 43-101 and CIM definitions for resources. All numbers are rounded. Inferred Resources have been estimated from geological evidence and limited sampling and must be treated with a lower level of confidence than Measured and Indicated Resources. The reported Mineral Resource for each zone is based on the 30 gpt AgEQ cut-off and is highlighted in light blue. |
| 8. | Mineralization boundaries used in the interpretation of the geological model and resource estimate are based on a cut-off of 15 gpt AgEQ using the metal price ratios described above. Manto and Structure Resource blocks, and their associated volumes, are exclusive of Contact Zone blocks. |
Table 87: Inferred W-Mo- Resource Estimation for MMT, Santo Nino and Coloradito Deposits, Effective Date Dec. 16, 2012
| Zone | Category9 | WO3 Cut | Rounded | SG | Mo (%) | WO3 (%) | Contained | Contained |
| | | off (%) | Tonnes | | | | WO3 (lbs) | Mo (lbs) |
| |
| | | 0.025 | 60,508,000 | 3 | 0.0035 | 0.053 | 70,526,000 | 4,232,000 |
| MMT | | | | | | | | |
Contact Zone 10 | Inferred | 0.050 | 25,136,000 | 3 | 0.0039 | 0.075 | 41,438,000 | 1,942,000 |
| (W, Mo, Ag, Au, | | 0.095 | 4,395,000 | 3 | 0.0023 | 0.109 | 10,587,000 | 205,000 |
| Cu) | | | | | | | | |
| Santo Nino | | 0.025 | 5,220,000 | 3 | 0.0077 | 0.04 | 4,591,000 | 806,000 |
Contact Zone 10 | Inferred | 0.050 | 950,000 | 3 | 0.0132 | 0.07 | 1,456,000 | 250,000 |
| (W, Mo, Ag, Au, | | | | | | | | |
| Cu) | | | | | | | | |
| | | 0.095 | 750 | 3 | 0.0115 | 0.101 | 2,000 | 172 |
| Coloradito | | 0.025 | 31,907,000 | 3 | 0.0283 | 0.062 | 43,302,000 | 18,045,000 |
Contact Zone 10 | Inferred | 0.050 | 18,486,000 | 3 | 0.0322 | 0.079 | 32,252,000 | 11,921,000 |
| (W, Mo, Ag, Au, | | | | | | | | |
| Cu) | | | | | | | | |
| | | 0.095 | 4,159,000 | 3 | 0.0335 | 0.112 | 10,282,000 | 2,784,000 |
| |
| | | 0.025 | 97,635,000 | | 0.0118 | 0.055 | 118,419,000 | 23,083,000 |
| TOTAL | Inferred | 0.05 | 44,573,000 | | 0.0158 | 0.076 | 75,147,000 | 14,113,000 |
| | | 0.095 | 4,159,184 | | 0.0175 | 0.111 | 20,871,000 | 2,989,000 |
LA JOYA, NI 43-101 TECHNICAL REPORT RELEASED : MARCH 27, 2013
Figure 46: Resource contours of 15, 30, 50, 100 and 200 gpt AgEQ cut-offs for MMT
LA JOYA, NI 43-101 TECHNICAL REPORT RELEASED : MARCH 27, 2013
| 14.4.1 | Mineral Resource Classification |
Mineral Resources have been classified by James Barr, P.Geo, an independent Qualified Person, based on the CIM Definition Standards for Mineral Resources and Mineral Reserves. The category for which the resources have been assigned is based on the confidence in geological information available relating to the mineral deposit, the quantity and quality of data available on the deposit, the level of detail of the technical and economic information which has been generated for the deposit and the interpretation of the data and information.
All mineral resources for the La Joya Deposit, as presented in the above discussion, are classified as Inferred Resources. Drilling, surface sampling and mapping information from exploration on the property to date is sufficient to allow a reasonable geological interpretation and assumption of grade continuity. Drill spacing remains wide and the associated level of confidence in the ranges of mineralized zones remains low. The geological understanding of the property is considered to remain in the developing stages for the project and will require further ongoing detailed knowledge on the distribution of mineralization to improve overall confidence of the deposit. In particular, detailed logging and study of the SCSV and intercepting manto mineralization, manto and mineralization variability and the relationships between other controls on mineralization including distribution along axial planes to D3 deformation and the extent of lateral manto and SCSV development would be beneficial to future resource estimation.
Visual estimated block grade were compared to drill hole grades along sections for Santo Nino, Coloradito and the MMT with statistical method also used for the latter. Nearest Neighbor (NN) and Inverse Distance Weighted method (IDW5) grade models were run for AgEQ (gpt) along 50m wide corridors in both the easterly and northerly directions throughout the MMT. The results from each section of each direction were plotted (Figure 47 and Figure 48) to check for potential global biases in the inverse distance grade models (IDW2) using grade summaries for the 30 gpt AgEQ attribute..
LA JOYA, NI 43-101 TECHNICAL REPORT RELEASED : MARCH 27, 2013
Figure 47: Comparison of >30 gpt AgEQ from NN, IDW2 and IDW5 methods of easting corridor through the La Joya MMT model.
Figure 48: Comparison of >30 gpt AgEQ from NN, IDW2 and IDW5 methods of northing corridors through the La Joya MMT model.
Figure 47 shows good correlation and increasing offset with less influence. Figure 48 shows a general correlation between the different interpolation methods with decreased grades of the NN method with samples receiving identical weighting compared to the IDW2 and IDW5 method where samples closer to the sample point have a higher weighting increasing grades with the increased power. Overall the repeatability of the NN and IDW5 model display acceptable levels and the original model is valid and unbiased. The number of reporting blocks per sections over AgEQ 30 gpt are also plotted.
LA JOYA, NI 43-101 TECHNICAL REPORT RELEASED : MARCH 27, 2013
| 15.0 | MINERAL RESERVE ESTIMATES |
No mineral reserves estimates exist for the property at this time.
Mining engineering studies have not yet been completed for the property.
Process engineering studies have not yet been completed for the property.
18.0 PROJECT INFRASTRUCTURE
Infrastructure engineering studies have not been completed for the property. A description of the existing infrastructure on the property is included in Section 5.0.
19.0 MARKET STUDIES AND CONTRACTS
No market studies have yet been completed for the property,
20.0 ENVIRONMENTAL STUDIES, PERMITTING AND SOCIAL OR COMMUNITY IMPACT
An ecological study was completed on the property between October 2010 and February 2011 by Juan Ramon Gonzalez Garcia, the Mine Ecologist for Nusantara de Mexico S.A de CV (Mexican subsidiary of SilverCrest). This study was entitled "Aviso De Inicio De Actividades Del Proyecto Exploracion Geológica
"Cerro El Sacrificio" De Conformidad Con La Nom-120-Semarnat-1997". Mr. Gonzalez reported on local flora and fauna, as well as surface characteristics of the site.
The wildlife species observed directly or indirectly during this study include deer, snakes, foxes, pigeons, coyotes, lizards, rattlesnakes and grey falcons. Rattlesnakes in this area are considered a protected species under NOM-059-SEMARNAT-2010, which specifies risk categories for the protection of species native to Mexico. Rescue and relocation is necessary if they are found.
The report describes the various types of flora native to the Sierra Madre Occidental region. This includes economically important crops in areas close to the site. The report also briefly touched on community impact, saying the project should create jobs for locals, but it is necessary to minimize the impact on the local flora.
In addition, SilverCrest has conducted community consultation with the La Joya community and local community co-operative regarding community issues including the use and upgrade of dirt roads that grant access to ranching and agricultural land surrounding the village in addition to providing access to the La Joya property.
LA JOYA, NI 43-101 TECHNICAL REPORT RELEASED : MARCH 27, 2013
La Joya is located in a prolific mining area along a major defined Mexico Silver Trend. Nearby mines include
First Majestic's La Parrilla silver mine, Penoles's Sabinas Ag-Pb-Zn mine and Grupo Mexico's San Martin mine. The La Joya Deposit has similar geologic and mineralization characteristics to the nearby Sabinas-San
Martin mining district which has been in intermittent production since the 1500's. These mines do not border the La Joya property and their successful operations are not necessarily indicative of economic viability of the La Joya Property.
| 21.0 | CAPITAL AND OPERATING COSTS |
Engineering and economic studies have not been completed for the property.
Engineering and economic studies have not been completed for the property.
No significant properties are currently adjacent to the La Joya property. Epithermal, and related, exploration projects exist in the area but are considered to be in early stages of exploration.
| 24.0 | OTHER RELEVANT DATA AND INFORMATION |
No other relevant data or information exists for the property at this time.
| 25.0 | INTERPRETATION AND CONCLUSIONS |
The La Joya property is located near the community of La Joya in the State of Durango, Mexico, approximately 75 km south east of the city of Durango, the state capital. The current definition of the La Joya deposit (MMT and Santo Nino) lies within the northwestern portion of the property and is hosted by Cuesta del Cura Limestone of Cretaceous age and is underlain by the Sacrificio quartz monzonite intrusion of early to mid-Tertiary in age. The property is currently in the process of being fully investigated by surface sampling and drilling for mineral distribution and the current extent of mineralization tested by SilverCrest drilling remains open in all lateral directions. Phase II drilling and resource estimates of the MMT have encompassed outlying historic showings of Rosas de Diciembre and Esperanza. Two additional areas, Coloradito and Santo Nino are in close proximity to the MMT and are subject to their own resource estimate.
Review and verification sampling of core from 105 recent SilverCrest drill holes, seven selected verified historic (plus two low-grade constraining RC holes; A11 and 14) and 10 resampled historic drill holes indicates that the sampling methodology employed is appropriate and representative of the mineralization on the property. Analysis of the laboratory data indicates that concentrations of silver, copper and gold grades are reproducible within acceptable limits and is heterogeneously distributed at higher grades within the skarn mineralization. An inherent amount of dilution is interpreted to exist within the skarn system.
LA JOYA, NI 43-101 TECHNICAL REPORT RELEASED : MARCH 27, 2013
Mineral resources have been estimated for Ag-Cu-Au and W-Mo mineralization using block modelling in Gemcom GEMS software for the MMT and Santo Nino deposits. Interpolation of grade into the block model has been constrained by lithocoding of mineralized solids representing three distinct, but spatially related domains. No variography was performed on the dataset due to the low density of drilling within each solid. Coloradito has also been subject to an Inferred Mineral Resource Estimates resource estimate based on one mineralized domain solid calculating Ag-Cu-Au and W-Mo mineralization.
All estimates are categorized as Inferred based on the quantity and quality of data available for interpretation, the current geological understanding of the interrelationship of the mineralizing systems, and the low density of drilling for this style of deposit. The geological understanding of the property is considered to be good relative to the current developing stages of the project. Greater knowledge is required to distinguish skarn styles within the deposit and their controls on mineralization, and to refine the distribution of structurally controlled mineralization and the relationship with manto style mineralization in order improve overall confidence of the deposit.
The initial metallurgical test work completed in 2011 suggested that the La Joya deposit may be amenable to conventional flotation processes for copper concentrating with gold and silver components. The 2012 and 2013 metallurgical test work at ALS is still in progress; however the preliminary results indicate that La Joya composites are amenable to conventional flotation process.
Preliminary metal recoveries for near-surface (priority) Manto and Structure zones range from 81.4 to 87.7% Cu, 74.9 to 84.3% Ag, and 18.2 to 56.6% Au depending on mineralization type and test conditions applied. Higher copper grade bulk concentrates (the 3rd Cleaner Cu/Ag/Au concentrate) were obtained from batch flotation tests with cyanide as compared with baseline test results. Specifically, Manto bulk concentrate grades up to 40% Cu, 4.78 kg/t Ag, and 13.1 gpt Au; Structure concentrate has approximately 38% Cu, 4.76 kg/t Ag, and 9.37 gpt Au. The high grade copper represents a high percent bornite-rich concentrate (Tables 28). The concentrate produced from Contact zone sample grades at 28.9% Cu due to its chalcopyrite rich mineralogy (Table 28).
The bulk copper concentrates produced from Manto and Structure composites are moderate to high in penalty elements of As, Sb and Bi. Adding cyanide at cleaner flotation stages can reduce the arsenic content to the market limits without sacrificing copper and silver recoveries. The contact bulk flotation concentrate has much lower concentrations of As, Sb, and Bi that can be marginally accepted by the market.
Gold appears to be amenable to gravity and further testwork is underway for possible increase in gold recovery. While as tungsten and tin recoveries from gravity separation appear low.
Results of the work completed to date on the property is considered positive. The defined area of alteration with subsequent potential mineralization, estimated at 2.5 km by 2.5 km, has been explored encompassing the 4 recommended targets from Phase II.
Further work on the property is recommended based on observations from Phase II field investigations and the results of the inferred mineral resource estimates discussed in this report. EBA considers that the property exhibits potential to extend the current resource beyond the defined block model limits based on
LA JOYA, NI 43-101 TECHNICAL REPORT RELEASED : MARCH 27, 2013
the results of the Phase II program. Additional drilling is recommended in order to test for potential expansion of resources to the MMT and Santo Nino deposit, and to increase overall confidence in the mineral continuity recognized along established trends within the current deposit limits. Infill drilling should be oriented to best capture information from the SCSV and manto trends and the relationships of these two mineralized domains. The program should be designed to test along strike and down dip of each structure to ensure true two-dimensional continuity within the structural plane.
Exploration should include geological mapping in an effort to map occurrences of exposed quartz monzonite, skarn mineralization or Cuesta del Cura limestone as a result of doming to the overlying sediments based on the La Joya deposit model. Re-interpretation of the historic airborne geophysics recently acquired by SilverCrest may give rise to regional targets by using information from the La Joya property to calibrate search parameters.
Based on site visits and review of SilverCrest QA-QC data and procedures, improvement is strongly recommended by EBA. This is to ensure that data being collected in the field is reliable and representative. Specifically during drilling activities, regular insertion of certified reference materials, blanks and strategic duplicate sampling procedures and protocols should be implemented by SilverCrest for the planned Phase III drill program. All QA-QC insertion interval data should be recorded in drill logs and drill hole databases.
Based in the current geological interpretation, many drill holes near the surface are interpreting mineralization within a very large area of influence down to the intrusive contact. Increased data density in strategic areas of mineralization may be necessary to perform variography within isolated solids along both the SCSV and manto trends.
A continued improvement to the understanding of mineral speciation and distribution is strongly recommended by EBA as there is complexity found in this multiphase polymetallic deposit. Continued refinement to drill logging and sample collection procedures should focus on distinguishing skarn mineralogy.
The bulk copper concentrates produced from Manto and Structure composites have indicated the presence of penalty elements such as As, Sb and Bi. Adding cyanide at cleaner flotation stages can reduce the arsenic content to the market limits without sacrificing copper and silver recoveries. The contact bulk flotation concentrate has low concentrations of As, Sb, and Bi.
Gold appears to be amenable to gravity as shown in test work on the Contact Zone with a 24% Au recovery. Further testwork is recommended for possible additional increase in gold recovery. Tungsten and tin recoveries from gravity separation appear low. The molybdenum level in the 3rd cleaner concentrate ranges from 2 to 3% at a recovery from 51.4 to 65.4% suggesting a separate molybdenum concentrate may be produced. Further tests on tungsten and molybdenum are recommended for next phase.
Continued metallurgical testwork should specifically investigate the nature and distribution of gold speciation and distribution. Further investigation is recommended on tungsten deportment in Contact Zone samples, and to conduct gravity tests on both Manto and Structure samples to evaluate potential tin and gold recoveries. It is also recommended to conduct amenability flotation tests to on the blended composites, and to carry out variability flotation tests on representative samples from the north and south areas of the deposit. Furthermore, test work on leaching of cleaner tails is recommended for possible increase in Au and Ag recoveries.
LA JOYA, NI 43-101 TECHNICAL REPORT RELEASED : MARCH 27, 2013
Estimated costs for proposed work programs on the La Joya property are presented in Table 88 as Phase III.
Table 88: Recommended Phase III Work and Estimated Costs for the La Joya Property
| Phase III | | | | |
| | Description | Units | Cost/Unit ($CAN) | Cost ($CAN) |
| Work Type | | | | |
| | Regional mapping to the East of | | | |
| | Cerro Sacrificio to Santo Nino and | | | |
| Geological Mapping | | 30 days | $1,000/day | $30,000 |
| | beyond and to the south of Cerro | | | |
| | Sacrificio | | | |
| | Drilling within currently defined block | | | |
| | model to increase confidence in | | | |
| Infill Drilling | | 10,000 metres | $200/metre | $2,000,000 |
| | mineral and grade distribution | | | |
| | around areas of high grade | | | |
| | Drilling beyond the limit of the | | | |
| Expansion Drilling & | currently defined block model to test | 5,000 metres | $200/metre | $1,000,000 |
| Metallurgical Studies | for potential deposit expansion | | | |
| | along established mineral trends | | | |
| | | | TOTAL | $3,300,000 |
Respectfully submitted,
[original signed and sealed]
__________________________________________
P. James F. Barr, P.Geo
Senior Geologist
EBA, Engineering Consultants Ltd.
[original signed and sealed]
__________________________________________
Ting Lu P. Eng. MSc.
Senior Metallurgical Engineer
Mining and Minerals
Tetra Tech Inc.
LA JOYA, NI 43-101 TECHNICAL REPORT RELEASED : MARCH 27, 2013
REFERENCES
Albinson, T.F. and Sanchez, E. (1977), Geologic evaluation of the Sacrificio Prospect, Puanas Municipality, Durango, Minas San Luis, S.A. geologic report, 51 p.
Burkhardt, R. (2006), Sacrificio Project, Durango Mexico. Vancouver: Solid Resources Ltd.
Barr, P.J.F. (2012) Resource Estimation for the La Joya Property Durango, Mexico. NI 43-101 Technical Report Prepared for SilverCrest Mines Inc. (Effective date: January 5th 2012), 83 p.
Einaudi, M.T., and Burt, D.M., (1982), Introduction - Terminology, Classification and Composition of Skarn Deposits, Economic Geology, v77, pp. 745-754.
Ferrari, L. Valencia-Moreo, M., Bryan, S., (2007), Magmatism and tectonics of the Sierra Madre Occidental and its relation with the evolution of the western margin of north America, p. 1-29; in Geology of Mexico: Celebrating the Centenary of the Geological Society of Mexico, The Geological Society of America, Special Paper 422, 2007, edited by Susana A. Alaniz-Alvarez and Angel F. Nieto- Samaniego; 465pp.
Meinert, L. D. (1993), Skarns and Skarn Deposits, in Ore Deposit Models Volume II, edited by P. A. Sheaman and M. E. Cherry, Geological Association of Canada Series, 1993, 154pp.
Meinert, L. D. (2011), Exploration Review of La Joya (Sacrificio) district, unpublished. Vancouver: SilverCrest Mines Inc.
Megaw, P.K.M., Ruiz, J., and Titley, S.R. (1988), High-temperature, carbonate-hosted, Ag-Pb-Zn-(Cu) deposits of northern Mexico: Economic Geology, v. 83, p. 1856-1885.
Myers, G.L., and Meinert, L.D. (1991), Alteration, mineralization, and gold distribution in the Fortitude gold skarn: in Raines, G.L., Lisle, R.E., Schafer, R.W., and Wilkinson, W.H. (eds), Geology and Ore Deposits of the Great Basin, Geol. Soc. Nevada, Reno, v.1,p 407-418.
Nieto-Samaniego, A.F., Alaniz-Alvarez, S.A., and Camprubi, A. (2007), Mesa Central of Mexico: Stratigraphy, structure, and Cenozoic tectonic evolution, p. 41-70; in Geology of Mexico: Celebrating the Centenary of the Geological Society of Mexico, The Geological Society of America, Special Paper 422, 2007, edited by Susana A. Alaniz-Alvarez and Angel F. Nieto-Samaniego; 465pp.
Patterson. K, M. (2001), Structural Controls on Mineralization and Constraints on Fluid Evolution at the Sacrificio Cu (Zn-Pb-Ag-Au) Skarn, Durango, Mexico. Vancouver: Department of Earth and Ocean Sciences. The University of British Columbia.
Rubin, J.N. and Kyle, J.R. (1988), Mineralogy and Geochemistry of the San Martin Skarn Deposit, Zacatecas, Mexico: Economic Geology, v. 83, p. 1760-1781
Terry, D. P. (1999), Report on Diamond Drilling, Geological Mapping and Geophysical Surveys carried out on the Cerro Sacrificio Project, Durango State, Mexico. Ontario: Boliden Limited.
LA JOYA, NI 43-101 TECHNICAL REPORT RELEASED : MARCH 27, 2013
APPENDIX A
QUALIFIED PERSON CERTIFICATES OF QUALIFICATIONS
LA JOYA, NI 43-101 TECHNICAL REPORT RELEASED : MARCH 27, 2013
DATE AND SIGNATURE PAGE
I, P. James F. Barr, do hereby declare that:
| 1) | I currently reside in Vancouver, British Columbia, Canada, and am currently employed as a geologist by EBA, Engineering Consultants Ltd., My office address is 9th floor, 1066 W Hastings Street, Vancouver, British Columbia. |
| 2) | I hold a Bachelors of Science with Honours from the University of Waterloo (2003), Ontario, Canada, with a major in Environmental Science, Earth Science and Chemistry and I have practiced as an exploration and resource geologist in Canada and Mexico since 2003. |
| 3) | I am a member in good standing in the Association of Professional Engineers and Geoscientists of British Columbia (APEGBC), member 35150. |
| 4) | I am the principal author and Qualified Person responsible for the preparation of the Technical Report entitled: |
UPDATED RESOURCE ESTIMATE FOR THE LA JOYA PROPERTY
DURANGO, MEXICO
NI 43-101 TECHNICAL REPORT
PREPARED FOR SILVERCREST MINES INC
March 27th, 2013
Effective Date: December 16th, 2012
| 5) | I am responsible for all sections of this Technical Report, with the exception of Section 13. |
| 6) | As a Qualified Person for this report, I have read the National Instrument 43-101 and Companion Policy and confirm that this report has been prepared in compliance to National Instrument 43-101. |
| 7) | I have visited the La Joya property on seven separate occasions during the periods from November 23-26, 2010, Feb 4-6,2011, May 6-7 and 13-17, 2011, June 19-20, 2011, Sept 25-Oct4, 2011, May 8th, 2012 and October 18th, 2012. |
| 8) | I have visited numerous skarn and geologically related properties in Mexico, including an underground mine tour of Peñoles' Mina Sabinas located in the State of Zacatecas on June 18th, 2011, and again on May 9th, 2012. |
| 9) | I am independent of SilverCrest Mines Inc. as independence is described in Section 1.5 of the National Instrument 43-101. In addition, I am currently not a shareholder of SilverCrest nor am I directly entitled to financially benefit from its success. |
| 10) | Prior to this report, I was the principal author of the February 20th, 2012, Technical Report titled "Resource Estimate for the La Joya Property, Durango, Mexico, NI 43-101 Technical Report, Prepared for SilverCrest Mines Inc.", with Effective Date January 5th, 2012. |
| 11) | To the best of my knowledge, information and belief, as of the Effective Date of the report, the Technical Report contains all scientific and technical information that is required to be disclosed to make the Technical Report not mis-leading. |
Dated this 27th day of March. 2013
[Original signed and sealed]
________________________________
P. James F. Barr, P.Geo
Senior Geologist
EBA Engineering Consultants Ltd.
LA JOYA, NI 43-101 TECHNICAL REPORT RELEASED : MARCH 27, 2013
DATE AND SIGNATURE PAGE
I, Ting Lu, do hereby declare that:
| 1) | I currently reside in Vancouver, British Columbia, Canada, and am currently employed as a Professional Engineer by Wardrop Engineering, A Tetra Tech Company, located at 800-555 West Hastings Street in Vancouver, British Columbia, Canada. |
| 2) | I hold a Master of Engineering degree from Queen's University, Ontario, Canada, with a major in mineral processing. My relevant experience includes 15 years of experience in the mineral processing industry. |
| 3) | I am a member in good standing in the Association of Professional Engineers and Geoscientists of British Columbia (APEGBC), registration # 32897. |
| 4) | I am a Qualified Person (within the meaning of National Instrument 43-101) responsible for the preparation of Section 13 of the Technical Report entitled: |
UPDATED RESOURCE ESTIMATE FOR THE LA JOYA PROPERTY
DURANGO, MEXICO
NI 43-101 TECHNICAL REPORT
PREPARED FOR SILVERCREST MINES INC.
March 27th, 2013
Effective Date: December 16th, 2012
| 5) | As a Qualified Person for this report, I have read National Instrument 43-101 and Companion Policy and can confirm that this report has been prepared in compliance to National Instrument 43-101. |
| 6) | I have not visited the La Joya property. |
| 7) | I am independent of SilverCrest Mines as independence is described in Section 1.5 of the National Instrument 43 - 101. In addition I am currently not a shareholder of SilverCrest nor am I directly entitled to financially benefit from its success. |
| 8) | Prior to this report, I was a co-author of the February 20th, 2012, Technical Report titled "Resource Estimate for the La Joya Property, Durango, Mexico, NI 43-101 Technical Report, Prepared for SilverCrest Mines Inc.", withEffective Date January 5th, 2012. |
| 9) | To the best of my knowledge, information and belief, as of the effective date of the Technical Report, the portion of the Technical Report for which I am responsible contains all scientific and technical information that is required to be disclosed to make the Technical Report not misleading. |
Dated this 27th of March, 2013,
[original signed and sealed]
________________________________
Ting Lu, M.Sc., P.Eng.
Senior Metallurgical Engineer
Mining and Minerals
Tetra Tech Inc.
LA JOYA, NI 43-101 TECHNICAL REPORT RELEASED : MARCH 27, 2013
APPENDIX B
CERTIFIED REFERENCE STANDARD DATA SHEETS
CDN Resource Laboratories Ltd.
#2, 20148 - 102nd Ave, Langley, B.C., Canada, V1M 4B4, 604-882-8422, Fax: 604-882-8466 (www.cdnlabs.com)
REFERENCE MATERIAL: CDN-CM-17
Recommended values and the "Between Lab" Two Standard Deviations
| Gold | 1.37 g/t | ± | 0.13 g/t | Certified value | 30g FA / ICP or AA |
| Copper | 0.791 % ± 0.040 % | Certified value | 4-acid / ICP or AA |
| Copper | 0.798 % ± 0.034 % | Certified value | Aqua regia / ICP or AA |
| Molybdenum | 0.075 % ± 0.008 % | Certified value | 4-acid / ICP or AA |
| Molybdenum | 0.073 % ± 0.014 % | **Provisional** | Aqua regia / ICP or AA |
| Silver | 14.4 | g/t | ± | 1.4 g/t | Certified value | 4-acid / ICP or AA |
| Silver | 14.9 | g/t | ± | 1.4 g/t | Certified value | Aqua regia / ICP or AA |
| Note: | Standards with an RSD of near or less than 5% are certified; RSD's of between 5% and 15% are Provisional; RSD's over 15% are Indicated. Provisional and Indicated values cannot be used to monitor accuracy with a high degree of certainty. |
PREPARED BY: | CDN Resource Laboratories Ltd. |
| CERTIFIED BY: | Duncan Sanderson, B.Sc., Licensed Assayer of British Columbia |
INDEPENDENT GEOCHEMIST: Dr. Barry Smee., Ph.D., P. Geo.
DATE OF CERTIFICATION: December 8, 2011
METHOD OF PREPARATION:
Reject ore material was dried, crushed, pulverized and then passed through a 270 mesh screen. The +270 material was discarded. The -270 material was mixed for 5 days in a double-cone mixer. Splits were taken and sent to 15 laboratories for round robin assaying.
ORIGIN OF REFERENCE MATERIAL:
Standard CDN-CM-17 was prepared using 770 kg of a granitic rock blended with 29 kg of a Cu-Au-Mo concentrate and 5 kg of a high grade Ag ore.
Approximate chemical composition (from whole rock analysis) is as follows:
| | Percent | | Percent |
| SiO2 | 68.0 | MgO | 2.1 |
| Al2O3 | 11.8 | K2O | 1.1 |
| Fe2O3 | 6.8 | TiO2 | 0.6 |
| CaO | 3.3 | LOI | 2.0 |
| Na2O | 2.8 | S | 1.0 |
| C | 0.1 | | |
Statistical Procedures:
The final limits were calculated after first determining if all data was compatible within a spread normally expected for similar analytical methods done by reputable laboratories. Data from any one laboratory was removed from further calculations when the mean of all analyses from that laboratory failed a t test of the global means of the other laboratories. The means and standard deviations were calculated using all remaining data. Any analysis that fell outside of the mean ±2 standard deviations was removed from the ensuing data base. The mean and standard deviations were again calculated using the remaining data. This method is different from that used by Government agencies in that the actual "between-laboratory" standard deviation is used in the calculations. This produces upper and lower limits that reflect actual individual analyses rather than a grouped set of analyses. The limits can therefore be used to monitor accuracy from individual analyses, unlike the Confidence Limits published on other standards.
| REFERENCE MATERIAL | CDN-CM-17 | | | | | | | | | | | |
| |
| |
| Results from round-robin assaying: | | | | | | | | | | | | | | |
| |
| | | | Lab 1 | Lab 2 | Lab 3 | Lab 4 | Lab 5 | Lab 6 | Lab 7 | Lab 8 | Lab 9 | Lab 10 | Lab 11 | Lab 12 | Lab 13 | Lab 14 | Lab 15 | | |
| | | | Au g/t | Au g/t | Au g/t | Au g/t | Au g/t | Au g/t | Au g/t | Au g/t | Au g/t | Au g/t | Au g/t | Au g/t | Au g/t | Au g/t | Au g/t | | |
| | | CM-17-1 | 1.35 | 1.29 | 1.20 | 1.43 | 1.38 | 1.36 | 1.36 | 1.32 | 1.43 | 1.40 | 1.33 | 1.41 | 1.30 | 1.41 | 1.45 | | |
| | | CM-17-2 | 1.40 | 1.23 | 1.29 | 1.39 | 1.28 | 1.35 | 1.41 | 1.34 | 1.42 | 1.39 | 1.33 | 1.42 | 1.37 | 1.38 | 1.33 | | |
| | | CM-17-3 | 1.35 | 1.17 | 1.21 | 1.42 | 1.34 | 1.26 | 1.33 | 1.26 | 1.45 | 1.49 | 1.32 | 1.42 | 1.35 | 1.42 | 1.31 | | |
| | | CM-17-4 | 1.43 | 1.45 | 1.26 | 1.41 | 1.33 | 1.29 | 1.44 | 1.23 | 1.35 | 1.47 | 1.32 | 1.44 | 1.34 | 1.42 | 1.30 | | |
| | | CM-17-5 | 1.42 | 1.39 | 1.32 | 1.36 | 1.41 | 1.31 | 1.32 | 1.31 | 1.42 | 1.40 | 1.30 | 1.45 | 1.43 | 1.40 | 1.34 | | |
| | | CM-17-6 | 1.48 | 1.25 | 1.41 | 1.42 | 1.32 | 1.24 | 1.44 | 1.27 | 1.53 | 1.36 | 1.36 | 1.45 | 1.29 | 1.42 | 1.37 | | |
| | | CM-17-7 | 1.45 | 1.34 | 1.40 | 1.37 | 1.42 | 1.28 | 1.40 | 1.28 | 1.40 | 1.36 | 1.33 | 1.44 | 1.55 | 1.40 | 1.34 | | |
| | | CM-17-8 | 1.33 | 1.29 | 1.56 | 1.39 | 1.26 | 1.33 | 1.35 | 1.28 | 1.45 | 1.46 | 1.30 | 1.41 | 1.45 | 1.42 | 1.29 | | |
| | | CM-17-9 | 1.37 | 1.47 | 1.24 | 1.43 | 1.37 | 1.27 | 1.42 | 1.32 | 1.48 | 1.49 | 1.34 | 1.45 | 1.29 | 1.40 | 1.39 | | |
| | | CM-17-10 1.44 | 1.34 | 1.22 | 1.45 | 1.31 | 1.38 | 1.45 | 1.31 | 1.42 | 1.34 | 1.30 | 1.45 | 1.38 | 1.40 | 1.32 | | |
| | | Mean | 1.40 | 1.32 | 1.31 | 1.41 | 1.34 | 1.30 | 1.39 | 1.29 | 1.44 | 1.42 | 1.32 | 1.44 | 1.38 | 1.41 | 1.35 | | |
| | | Std. Devn. | 0.0498 | 0.0958 | 0.1160 | 0.0292 | 0.0526 | 0.0470 | 0.0483 | 0.0336 0.0479 0.0568 0.0195 0.0175 0.0825 | 0.0123 | 0.0473 | | |
| | | % RSD | 3.55 | 7.27 | 8.84 | 2.08 | 3.92 | 3.61 | 3.47 | 2.60 | 3.34 | 4.01 | 1.47 | 1.22 | 6.00 | 0.88 | 3.51 | | |
| |
| |
| | | Total | Ag g/t | Ag g/t | Ag g/t | Ag g/t | Ag g/t | Ag g/t | Ag g/t | Ag g/t | Ag g/t | Ag g/t | Ag g/t | Ag g/t | Ag g/t | Ag g/t | Ag g/t | | |
| | | CM-17-1 | 14 | 13.1 | 14.6 | 14.4 | 14.0 | 15.5 | 15 | 15 | 14.2 | 13.5 | 14.3 | 15.0 | | 13.8 | 16 | | |
| | | CM-17-2 | 14 | 14.1 | 14.6 | 14.3 | 14.2 | 14.9 | 14 | 15 | 14.9 | 13.4 | 15.7 | 14.9 | | 13.9 | 17 | | |
| | | CM-17-3 | 15 | 14.1 | 14.1 | 14.0 | 14.0 | 15.5 | 14 | 15 | 14.7 | 13.9 | 14.4 | 15.3 | 16.6 | 13.7 | 16 | | |
| | | CM-17-4 | 14 | 13.3 | 14.4 | 14.1 | 13.8 | 15.0 | 15 | 13 | 15.0 | 14.2 | 15.1 | 15.2 | 14.7 | 13.9 | 16 | | |
| | | CM-17-5 | 15 | 12.4 | 14.6 | 13.9 | 13.7 | 14.5 | 14 | 13 | 14.2 | 14.2 | 13.4 | 15.2 | 16.2 | 13.8 | 17 | | |
| | | CM-17-6 | 14 | 12.7 | 14.7 | 14.7 | 14.2 | 15.1 | 14 | 13 | 14.7 | 13.7 | 14.2 | 15.2 | 15.8 | 14.3 | 16 | | |
| | | CM-17-7 | 14 | 12.9 | 14.6 | 14.1 | 14.4 | 15.2 | 14 | 15 | 15.0 | 13.3 | 15.3 | 15.1 | 15.1 | 14.4 | 15 | | |
| | | CM-17-8 | 14 | 13.5 | 14.3 | 14.7 | 14.0 | 14.3 | 13 | 14 | 14.6 | 14.7 | 13.7 | 15.0 | 16.1 | 13.7 | 15 | | |
| | | CM-17-9 | 14 | 12.9 | 14.7 | 13.8 | 14.1 | 15.8 | 15 | 15 | 14.8 | 13.7 | 14.6 | 14.8 | 15.2 | 14.5 | 13 | | |
| | | CM-17-10 | 15 | 12.8 | 14.0 | 14.2 | 13.8 | 14.8 | 14 | 14 | 14.5 | 13.9 | 13.4 | 15.0 | 17.4 | 14.3 | 14 | | |
| | | Mean | 14.3 | 13.2 | 14.5 | 14.2 | 14.0 | 15.1 | 14.2 | 14.2 | 14.7 | 13.9 | 14.4 | 15.1 | 15.9 | 14.0 | 15.5 | | |
| | | Std. Devn. | 0.4830 | 0.5731 | 0.2503 | 0.3084 | 0.2150 | 0.4648 | 0.6325 | 0.9189 0.2914 0.4275 0.7866 0.1567 0.8854 | 0.3173 | 1.2693 | | |
| | | % RSD | 3.38 | 4.35 | 1.73 | 2.17 | 1.53 | 3.09 | 4.45 | 6.47 | 1.99 | 3.09 | 5.46 | 1.04 | 5.57 | 2.26 | 8.19 | | |
| |
| |
| | | Aqua Regia | Ag g/t | Ag g/t | Ag g/t | Ag g/t | Ag g/t | Ag g/t | Ag g/t | Ag g/t | Ag g/t | Ag g/t | Ag g/t | Ag g/t | Ag g/t | Ag g/t | Ag g/t | | |
| | | CM-17-1 | 15 | 14.8 | 15.0 | 14.0 | 13.9 | 16.2 | 13 | 15 | 14.9 | 15.6 | 16 | 14.8 | | 14.5 | 16.0 | | |
| | | CM-17-2 | 16 | 14.9 | 14.7 | 14.1 | 14.3 | 15.9 | 15 | 15 | 15.6 | 14.9 | 17 | 14.9 | | 13.7 | 15.8 | | |
| | | CM-17-3 | 15 | 14.6 | 14.4 | 14.9 | 13.9 | 15.6 | 15 | 15 | 15.1 | 14.7 | 16 | 14.8 | 14.0 | 14.0 | 14.8 | | |
| | | CM-17-4 | 15 | 14.8 | 15.0 | 15.6 | 14.2 | 15.4 | 14 | 15 | 15.2 | 14.4 | 16 | 15.1 | 14.2 | 13.9 | 14.6 | | |
| | | CM-17-5 | 16 | 14.5 | 14.5 | 13.3 | 13.7 | 15.3 | 14 | 15 | 14.8 | 13.7 | 17 | 14.7 | 14.3 | 13.9 | 17.2 | | |
| | | CM-17-6 | 15 | 15.9 | 14.1 | 14.4 | 13.8 | 15.2 | 14 | 15 | 15.1 | 15.6 | 16 | 15.1 | 13.4 | 13.1 | 16.0 | | |
| | | CM-17-7 | 15 | 14.8 | 14.6 | 15.0 | 14.5 | 15.9 | 14 | 15 | 14.8 | 13.7 | 17 | 15.0 | 13.7 | 14.0 | 14.6 | | |
| | | CM-17-8 | 16 | 14.2 | 14.5 | 15.1 | 14.3 | 15.7 | 14 | 15 | 14.8 | 15.7 | 16 | 15.0 | 15.0 | 13.7 | 15.8 | | |
| | | CM-17-9 | 16 | 14.6 | 14.9 | 14.3 | 14.6 | 16.5 | 13 | 15 | 14.9 | 15.5 | 16 | 14.8 | 13.6 | 14.2 | 14.6 | | |
| | | CM-17-10 | 16 | 16.0 | 14.3 | 14.7 | 14.0 | 15.9 | 13 | 15 | 14.9 | 15.2 | 16 | 14.8 | 13.5 | 13.1 | 15.8 | | |
| | | Mean | 15.5 | 14.9 | 14.6 | 14.5 | 14.1 | 15.8 | 13.9 | 15.0 | 15.0 | 14.9 | 16.3 | 14.9 | 14.0 | 13.8 | 15.5 | | |
| | | Std. Devn. | 0.5270 | 0.5840 | 0.3018 | 0.6586 | 0.3048 | 0.4061 | 0.7379 | 0.0000 0.2514 0.7630 0.4830 0.1414 0.5165 | 0.4413 | 0.8548 | | |
| | | % RSD | 3.40 | 3.92 | 2.07 | 4.53 | 2.16 | 2.58 | 5.31 | 0.00 | 1.68 | 5.12 | 2.96 | 0.95 | 3.70 | 3.20 | 5.51 | | |
REFERENCE MATERIAL CDN-CM-17
Results from round-robin assaying:
| | | Lab 1 | Lab 2 | Lab 3 | Lab 4 | Lab 5 | Lab 6 | Lab 7 | Lab 8 | Lab 9 | Lab 10 | Lab 11 | Lab 12 | Lab 13 | Lab 14 | Lab 15 | |
| | Total | % Cu | % Cu | % Cu | % Cu | % Cu | % Cu % Cu % Cu | % Cu % Cu % Cu | % Cu | % Cu % Cu % Cu | |
| | CM-17-1 0.766 | 0.759 | 0.81 | 0.789 | 0.80 | 0.812 | 0.780 | 0.767 | 0.802 | 0.756 | 0.809 | 0.83 | | 0.785 | 0.777 | | |
| | CM-17-2 0.780 | 0.762 | 0.79 | 0.791 | 0.81 | 0.801 | 0.788 | 0.790 | 0.804 | 0.754 | 0.798 | 0.82 | | 0.786 | 0.792 | | |
| | CM-17-3 0.780 | 0.760 | 0.80 | 0.795 | 0.80 | 0.806 | 0.766 | 0.796 | 0.789 | 0.755 | 0.777 | 0.83 | 0.859 | 0.788 | 0.777 | | |
| | CM-17-4 0.785 | 0.755 | 0.83 | 0.786 | 0.81 | 0.805 | 0.785 | 0.791 | 0.801 | 0.768 | 0.798 | 0.81 | 0.827 | 0.785 | 0.789 | | |
| | CM-17-5 0.790 | 0.763 | 0.82 | 0.790 | 0.82 | 0.795 | 0.783 | 0.769 | 0.792 | 0.750 | 0.804 | 0.80 | 0.848 | 0.783 | 0.808 | | |
| | CM-17-6 0.785 | 0.767 | 0.83 | 0.796 | 0.82 | 0.800 | 0.786 | 0.788 | 0.792 | 0.744 | 0.780 | 0.83 | 0.854 | 0.778 | 0.807 | | |
| | CM-17-7 0.775 | 0.751 | 0.78 | 0.795 | 0.80 | 0.796 | 0.768 | 0.757 | 0.798 | 0.765 | 0.812 | 0.81 | 0.810 | 0.785 | 0.803 | | |
| | CM-17-8 0.778 | 0.779 | 0.83 | 0.793 | 0.81 | 0.793 | 0.775 | 0.770 | 0.810 | 0.766 | 0.775 | 0.82 | 0.816 | 0.788 | 0.798 | | |
| | CM-17-9 0.803 | 0.753 | 0.80 | 0.794 | 0.81 | 0.808 | 0.762 | 0.781 | 0.802 | 0.759 | 0.800 | 0.82 | 0.791 | 0.793 | 0.789 | | |
| | CM-17-10 0.795 0.748 | 0.80 | 0.796 | 0.82 | 0.809 | 0.762 | 0.767 | 0.807 | 0.749 | 0.777 | 0.82 | 0.820 | 0.786 | 0.786 | | |
| | Mean | 0.784 | 0.760 | 0.809 | 0.793 | 0.810 | 0.803 | 0.776 | 0.778 | 0.800 | 0.757 | 0.793 | 0.819 | 0.828 | 0.786 | 0.793 | | |
| | Std. Devn. | 0.0105 | 0.0090 | 0.0179 | 0.0034 0.0082 0.0065 0.0102 0.0132 0.0069 0.0080 0.0143 | 0.0099 | 0.0235 | 0.0039 | 0.0113 | | |
| | % RSD | 1.34 | 1.18 | 2.22 | 0.43 | 1.01 | 0.81 | 1.32 | 1.70 | 0.86 | 1.06 | 1.80 | 1.21 | 2.84 | 0.49 | 1.42 | | |
| |
| |
| | Aqua Regia | % Cu | % Cu | % Cu | % Cu | % Cu | % Cu % Cu % Cu | % Cu % Cu % Cu | % Cu | % Cu % Cu % Cu | |
| | CM-17-1 0.816 | 0.790 | 0.78 | 0.820 | 0.80 | 0.792 | 0.745 | 0.802 | 0.819 | 0.836 | 0.792 | 0.82 | | 0.654 | 0.817 | | |
| | CM-17-2 0.810 | 0.788 | 0.81 | 0.773 | 0.81 | 0.801 | 0.740 | 0.792 | 0.813 | 0.809 | 0.789 | 0.81 | | 0.626 | 0.797 | | |
| | CM-17-3 0.791 | 0.799 | 0.74 | 0.787 | 0.80 | 0.785 | 0.775 | 0.811 | 0.813 | 0.820 | 0.755 | 0.82 | 0.799 | 0.643 | 0.778 | | |
| | CM-17-4 0.810 | 0.795 | 0.74 | 0.777 | 0.81 | 0.813 | 0.753 | 0.791 | 0.818 | 0.814 | 0.798 | 0.81 | 0.790 | 0.666 | 0.780 | | |
| | CM-17-5 0.808 | 0.792 | 0.76 | 0.773 | 0.80 | 0.815 | 0.745 | 0.789 | 0.816 | 0.828 | 0.778 | 0.80 | 0.803 | 0.670 | 0.745 | | |
| | CM-17-6 0.775 | 0.800 | 0.75 | 0.774 | 0.81 | 0.804 | 0.750 | 0.791 | 0.815 | 0.814 | 0.781 | 0.81 | 0.798 | 0.630 | 0.762 | | |
| | CM-17-7 0.799 | 0.787 | 0.78 | 0.789 | 0.81 | 0.821 | 0.750 | 0.757 | 0.810 | 0.826 | 0.781 | 0.81 | 0.793 | 0.620 | 0.758 | | |
| | CM-17-8 0.805 | 0.782 | 0.80 | 0.785 | 0.81 | 0.814 | 0.750 | 0.801 | 0.816 | 0.842 | 0.789 | 0.81 | 0.803 | 0.635 | 0.791 | | |
| | CM-17-9 0.795 | 0.783 | 0.79 | 0.773 | 0.81 | 0.803 | 0.754 | 0.785 | 0.814 | 0.814 | 0.810 | 0.80 | 0.799 | 0.652 | 0.772 | | |
| | CM-17-10 0.811 0.799 | 0.80 | 0.792 | 0.81 | 0.826 | 0.759 | 0.781 | 0.815 | 0.819 | 0.800 | 0.80 | 0.792 | 0.662 | 0.786 | | |
| | Mean | 0.802 | 0.792 | 0.775 | 0.784 | 0.807 | 0.807 | 0.752 | 0.790 | 0.815 | 0.822 | 0.787 | 0.809 | 0.797 | 0.646 | 0.779 | | |
| | Std. Devn. | 0.0123 | 0.0066 | 0.0259 | 0.0146 0.0048 0.0128 0.0096 0.0146 0.0026 0.0107 0.0150 | 0.0074 | 0.0051 | 0.0175 | 0.0208 | | |
| | % RSD | 1.53 | 0.84 | 3.35 | 1.86 | 0.60 | 1.59 | 1.28 | 1.84 | 0.32 | 1.30 | 1.91 | 0.91 | 0.63 | 2.71 | 2.67 | | |
| |
| |
| | Total | % Mo | % Mo | % Mo | % Mo | % Mo | % Mo % Mo % Mo | % Mo % Mo % Mo | % Mo | % Mo % Mo % Mo | |
| | CM-17-1 0.073 | 0.075 | 0.07 | 0.072 | 0.082 | 0.074 | 0.077 | 0.080 | 0.074 | 0.074 | 0.079 | 0.07 | | 0.075 | 0.074 | | |
| | CM-17-2 0.074 | 0.075 | 0.07 | 0.071 | 0.080 | 0.073 | 0.078 | 0.079 | 0.073 | 0.074 | 0.079 | 0.07 | | 0.075 | 0.076 | | |
| | CM-17-3 0.075 | 0.076 | 0.07 | 0.073 | 0.084 | 0.072 | 0.076 | 0.079 | 0.074 | 0.075 | 0.078 | 0.07 | 0.085 | 0.076 | 0.074 | | |
| | CM-17-4 0.074 | 0.074 | 0.07 | 0.072 | 0.082 | 0.071 | 0.076 | 0.077 | 0.073 | 0.076 | 0.080 | 0.07 | 0.081 | 0.076 | 0.076 | | |
| | CM-17-5 0.074 | 0.075 | 0.07 | 0.072 | 0.083 | 0.071 | 0.074 | 0.079 | 0.074 | 0.075 | 0.078 | 0.07 | 0.084 | 0.077 | 0.083 | | |
| | CM-17-6 0.074 | 0.077 | 0.07 | 0.070 | 0.082 | 0.071 | 0.079 | 0.079 | 0.074 | 0.075 | 0.075 | 0.07 | 0.084 | 0.075 | 0.076 | | |
| | CM-17-7 0.076 | 0.073 | 0.07 | 0.071 | 0.084 | 0.071 | 0.076 | 0.081 | 0.073 | 0.076 | 0.077 | 0.07 | 0.081 | 0.076 | 0.074 | | |
| | CM-17-8 0.076 | 0.075 | 0.07 | 0.072 | 0.083 | 0.072 | 0.077 | 0.084 | 0.073 | 0.076 | 0.077 | 0.07 | 0.081 | 0.076 | 0.075 | | |
| | CM-17-9 0.076 | 0.072 | 0.07 | 0.072 | 0.083 | 0.073 | 0.076 | 0.081 | 0.074 | 0.074 | 0.081 | 0.07 | 0.078 | 0.076 | 0.076 | | |
| | CM-17-10 0.075 0.071 | 0.07 | 0.072 | 0.082 | 0.073 | 0.075 | 0.080 | 0.075 | 0.075 | 0.078 | 0.07 | 0.081 | 0.076 | 0.074 | | |
| | Mean | 0.075 | 0.074 | 0.070 | 0.072 | 0.083 | 0.072 | 0.076 | 0.080 | 0.074 | 0.075 | 0.078 | 0.070 | 0.082 | 0.076 | 0.076 | | |
| | Std. Devn. | 0.0011 | 0.0017 | 0.0000 | 0.0008 0.0012 0.0011 0.0014 0.0019 0.0007 0.0009 0.0017 | 0.0000 | 0.0023 | 0.0004 | 0.0026 | | |
| | % RSD | 1.42 | 2.30 | 0.00 | 1.15 | 1.43 | 1.53 | 1.87 | 2.32 | 0.92 | 1.17 | 2.16 | 0.00 | 2.83 | 0.59 | 3.42 | | |
| |
| |
| | Aqua Regia | % Mo | % Mo | % Mo | % Mo | % Mo | % Mo % Mo % Mo | % Mo % Mo % Mo | % Mo | % Mo % Mo % Mo | |
| | CM-17-1 0.076 | 0.054 | 0.07 | 0.072 | 0.082 | 0.063 | 0.078 | 0.077 | 0.066 | 0.085 | 0.075 | 0.07 | | 0.050 | 0.078 | | |
| | CM-17-2 0.075 | 0.051 | 0.07 | 0.071 | 0.083 | 0.054 | 0.080 | 0.076 | 0.068 | 0.084 | 0.074 | 0.07 | | 0.046 | 0.075 | | |
| | CM-17-3 0.075 | 0.054 | 0.07 | 0.071 | 0.083 | 0.056 | 0.079 | 0.078 | 0.068 | 0.082 | 0.069 | 0.07 | 0.074 | 0.046 | 0.074 | | |
| | CM-17-4 0.075 | 0.052 | 0.07 | 0.073 | 0.082 | 0.055 | 0.078 | 0.078 | 0.065 | 0.084 | 0.074 | 0.07 | 0.071 | 0.049 | 0.073 | | |
| | CM-17-5 0.076 | 0.053 | 0.07 | 0.071 | 0.082 | 0.059 | 0.080 | 0.075 | 0.067 | 0.084 | 0.072 | 0.06 | 0.073 | 0.049 | 0.069 | | |
| | CM-17-6 0.073 | 0.056 | 0.07 | 0.071 | 0.082 | 0.057 | 0.079 | 0.076 | 0.068 | 0.083 | 0.072 | 0.06 | 0.077 | 0.048 | 0.070 | | |
| | CM-17-7 0.075 | 0.051 | 0.07 | 0.070 | 0.083 | 0.059 | 0.080 | 0.075 | 0.067 | 0.083 | 0.073 | 0.06 | 0.074 | 0.050 | 0.071 | | |
| | CM-17-8 0.074 | 0.053 | 0.07 | 0.071 | 0.081 | 0.058 | 0.078 | 0.076 | 0.067 | 0.086 | 0.071 | 0.07 | 0.076 | 0.046 | 0.078 | | |
| | CM-17-9 0.075 | 0.054 | 0.07 | 0.071 | 0.082 | 0.063 | 0.081 | 0.076 | 0.069 | 0.084 | 0.075 | 0.07 | 0.076 | 0.046 | 0.074 | | |
| | CM-17-10 0.076 0.054 | 0.08 | 0.072 | 0.081 | 0.061 | 0.079 | 0.076 | 0.067 | 0.083 | 0.072 | 0.06 | 0.073 | 0.048 | 0.071 | | |
| | Mean | 0.075 | 0.053 | 0.071 | 0.071 | 0.082 | 0.059 | 0.079 | 0.076 | 0.067 | 0.084 | 0.073 | 0.066 | 0.074 | 0.048 | 0.073 | | |
| | Std. Devn. | 0.0009 | 0.0015 | 0.0032 | 0.0008 0.0007 0.0031 0.0010 0.0011 0.0011 0.0010 0.0019 | 0.0052 | 0.0017 | 0.0015 | 0.0031 | | |
| | % RSD | 1.26 | 2.78 | 4.45 | 1.15 | 0.90 | 5.36 | 1.30 | 1.39 | 1.69 | 1.19 | 2.60 | 7.82 | 2.33 | 3.17 | 4.17 | | |
Note: Both Cu and Mo aqua regia data from Lab 14 was excluded for failing the t test.
REFERENCE MATERIAL CDN-CM-17
Participating Laboratories:
(not in same order as listed in table of results)
Acme Analytical Laboratories Ltd., Vancouver, B.C., Canada
Actlabs, Ancaster, Ontario, Canada
Actlabs, Stewart, B.C., Canada
Actlabs, Thunder Bay, Ontario, Canada
ALS Chemex Laboratories, North Vancouver, B.C., Canada
AGAT, Mississauga, Ontario, Canada
AHK, Alaska, USA
Alex Stewart Argentina SA
Stewart Group, Kamloops, B.C., Canada
CIMM, Lima, Peru
Inspectorate, Richmond, B.C., Canada
Omac, Ireland
SGS, Lima, Peru
Skyline Assayers & Laboratories, Arizona, USA
TSL Laboratories, Saskatoon, Canada
Legal Notice:
This certificate and the reference material described in it have been prepared with due care and attention. However CDN Resource Laboratories Ltd. or Barry Smee accept no liability for any decisions or actions taken following the use of the reference material. Our liability is limited solely to the cost of the reference material.
Certified by /s/ Duncan Sanderson
Duncan Sanderson, Certified Assayer of B.C.
Geochemist /s/ Barry Smee
Dr. Barry Smee, Ph.D., P. Geo.
CDN Resource Laboratories Ltd.
#2, 20148 - 102nd Avenue, Langley, B.C., Canada, V1M 4B4, 604-882-8422, Fax: 604-882-8466 (www.cdnlabs.com)
STANDARD REFERENCE MATERIAL: CDN-GS-5J
Recommended values and the "Between Lab" Two Standard Deviations
| Gold | 4.96 g/t | ± | 0.42 g/t | 30g | FA, instrumental | Certified value |
| Gold | 4.90 g/t | ± | 0.45 g/t | 30g | FA, gravimetric | Certified value |
| Silver | 72.5 g/t | ± | 4.8 g/t | 4-acid, instrumental | Certified value |
PREPARED BY: | CDN Resource Laboratories Ltd. | |
| CERTIFIED BY: | Duncan Sanderson, B.Sc., Licensed Assayer of British Columbia | |
INDEPENDENT GEOCHEMIST: Dr. Barry Smee., Ph.D., P. Geo. | |
DATE OF CERTIFICATION: November 4, 2011 | |
ORIGIN OF REFERENCE MATERIAL:
Standard CDN-GS-5J was prepared using 747 kg of granitic rock blended with 53 kg of a high grade Au-Ag ore.
METHOD OF PREPARATION:
Reject ore material was dried, crushed, pulverized and then passed through a 270 mesh screen. The +270 material was discarded. The -270 material was mixed for 5 days in a double-cone blender. Splits were taken and sent to 15 commercial laboratories for round robin assaying.
Approximate chemical composition (by whole rock analysis) is as follows:
| | Percent | | Percent |
| SiO2 | 73.7 | MgO | 1.4 |
| Al2O3 | 10.4 | K2O | 1.2 |
| Fe2O3 | 5.3 | TiO2 | 0.5 |
| CaO | 2.4 | LOI | 1.8 |
| Na2O | 2.6 | S | 0.4 |
Statistical Procedures:
The final limits were calculated after first determining if all data was compatible within a spread normally expected for similar analytical methods done by reputable laboratories. Data from any one laboratory was removed from further calculations when the mean of all analyses from that laboratory failed a t test of the global means of the other laboratories. The means and standard deviations were calculated using all remaining data. Any analysis that fell outside of the mean ±2 standard deviations was removed from the ensuing data base. The mean and standard deviations were again calculated using the remaining data. This method is different from that used by Government agencies in that the actual "between- laboratory" standard deviation is used in the calculations. This produces upper and lower limits that reflect actual individual analyses rather than a grouped set of analyses. The limits can therefore be used to monitor accuracy from individual analyses, unlike the Confidence Limits published on other standards.
Results from round-robin assaying are displayed on the following page.
STANDARD REFERENCE MATERIAL CDN-GS-5J
| | | Lab 1 | Lab 2 | Lab 3 | Lab 4 | Lab 5 | Lab 6 | Lab 7 | Lab 8 | Lab 9 | Lab 10 | Lab 11 | Lab 12 | Lab 13 | Lab 14 | Lab 15 | |
| | Instrumental | Au g/t | Au g/t | Au g/t | Au g/t | Au g/t | Au g/t | Au g/t | Au g/t | Au g/t | Au g/t | Au g/t | Au g/t | Au g/t | Au g/t | Au g/t | |
| | GS-5J-1 | 4.91 | 5.07 | 4.57 | 4.99 | 5.22 | | 4.88 | 4.67 | 5.05 | 4.93 | | | | | 5.08 | |
| | GS-5J-2 | 4.74 | 4.90 | 4.48 | 5.25 | 4.87 | | 5.10 | 4.48 | 5.13 | 5.09 | | | | | 5.00 | |
| | GS-5J-3 | 4.84 | 4.96 | 4.41 | 5.16 | 4.94 | | 5.10 | 4.46 | 5.23 | 4.98 | | | | | 5.34 | |
| | GS-5J-4 | 4.80 | 4.93 | 4.48 | 5.28 | 5.10 | | 4.70 | 4.81 | 5.49 | 4.96 | | | | | 5.25 | |
| | GS-5J-5 | 4.46 | 5.13 | 4.50 | 5.05 | 5.13 | | 4.92 | 5.00 | 5.15 | 4.99 | | | | | 5.19 | |
| | GS-5J-6 | 4.84 | 4.86 | 4.73 | 5.29 | 5.08 | | 5.02 | 4.72 | 5.27 | 5.00 | | | | | 4.98 | |
| | GS-5J-7 | 4.88 | 5.03 | 4.57 | 5.09 | 4.85 | | 4.78 | 4.84 | 5.11 | 4.89 | | | | | 4.99 | |
| | GS-5J-8 | 4.96 | 5.13 | 4.62 | 5.08 | 4.93 | | 4.99 | 4.70 | 5.19 | 5.01 | | | | | 5.12 | |
| | GS-5J-9 | 4.79 | 5.07 | 4.45 | 4.84 | 4.94 | | 5.01 | 5.01 | 5.24 | 4.80 | | | | | 5.12 | |
| | GS-5J-10 | 4.89 | 5.03 | 4.46 | 5.32 | 4.92 | | 4.87 | 4.53 | 5.22 | 4.85 | | | | | 5.21 | |
| | Mean | 4.81 | 5.01 | 4.53 | 5.13 | 5.00 | | 4.94 | 4.72 | 5.21 | 4.95 | | | | | 5.13 | |
| | Std. Dev'n | 0.1388 | 0.0945 | 0.0956 | 0.1552 | 0.1235 | | 0.1334 | 0.1967 | 0.1204 | 0.0849 | | | | | 0.1199 | |
| | % RSD | 2.89 | 1.88 | 2.11 | 3.02 | 2.47 | | 2.70 | 4.17 | 2.31 | 1.71 | | | | | 2.34 | |
| |
| |
| | Gravimetric | Au g/t | Au g/t | Au g/t | Au g/t | Au g/t | Au g/t | Au g/t | Au g/t | Au g/t | Au g/t | Au g/t | Au g/t | Au g/t | Au g/t | Au g/t | |
| | GS-5J-1 | 5.01 | 5.13 | 4.55 | 4.86 | 5.51 | 4.69 | 5.07 | 4.70 | 5.05 | 5.10 | 4.73 | 5.03 | 5.01 | 4.95 | 4.73 | |
| | GS-5J-2 | 5.24 | 4.93 | 4.52 | 4.80 | 4.89 | 5.30 | 4.89 | 4.59 | 5.45 | 5.00 | 4.82 | 5.15 | 4.51 | 5.01 | 4.66 | |
| | GS-5J-3 | 4.68 | 5.13 | 4.67 | 4.91 | 4.82 | 4.78 | 4.94 | 4.53 | 5.00 | 4.93 | 4.91 | 5.22 | 4.47 | 4.97 | 4.90 | |
| | GS-5J-4 | 5.00 | 5.00 | 4.57 | 4.54 | 5.11 | 4.92 | 4.89 | 4.46 | 5.68 | 4.83 | 5.01 | 5.37 | 4.90 | 4.88 | 4.93 | |
| | GS-5J-5 | 5.16 | 5.00 | 4.50 | 4.89 | 4.85 | 5.22 | 5.09 | 4.66 | 5.24 | 4.76 | 4.70 | 4.97 | 4.66 | 4.96 | 4.93 | |
| | GS-5J-6 | 4.98 | 4.90 | 4.57 | 4.45 | 4.71 | 4.68 | 4.83 | 4.49 | 5.32 | 5.22 | 5.10 | 4.85 | 4.74 | 5.06 | 4.95 | |
| | GS-5J-7 | 4.76 | 5.16 | 4.68 | 4.78 | 4.86 | 4.70 | 4.94 | 4.66 | 5.02 | 5.23 | 5.01 | 5.39 | 4.80 | 4.92 | 5.17 | |
| | GS-5J-8 | 4.72 | 5.09 | 4.44 | 4.70 | 4.89 | 4.79 | 4.99 | 4.70 | 5.17 | 5.09 | 5.29 | 5.07 | 4.51 | 4.93 | 4.91 | |
| | GS-5J-9 | 5.04 | 4.88 | 4.72 | 4.83 | 4.83 | 4.73 | 5.04 | 4.56 | 5.09 | 5.06 | 5.35 | 4.92 | 4.96 | 4.88 | 4.51 | |
| | GS-5J-10 | 4.80 | 4.99 | 4.70 | 4.64 | 4.65 | 4.84 | 5.48 | 4.49 | 5.08 | 5.06 | 5.34 | 5.20 | 5.18 | 5.05 | 5.20 | |
| | Mean | 4.94 | 5.02 | 4.59 | 4.74 | 4.91 | 4.87 | 5.01 | 4.58 | 5.21 | 5.03 | 5.03 | 5.12 | 4.77 | 4.96 | 4.89 | |
| | Std. Dev'n | 0.190 | 0.101 | 0.095 | 0.154 | 0.243 | 0.222 | 0.184 | 0.091 | 0.220 | 0.153 | 0.242 | 0.182 | 0.240 | 0.063 | 0.212 | |
| | % RSD | 3.86 | 2.02 | 2.08 | 3.26 | 4.95 | 4.56 | 3.67 | 1.99 | 4.23 | 3.04 | 4.82 | 3.56 | 5.02 | 1.28 | 4.34 | |
| |
| |
| | SAMPLE | Ag g/t | Ag g/t | Ag g/t | Ag g/t | Ag g/t | Ag g/t | Ag g/t | Ag g/t | Ag g/t | Ag g/t | Ag g/t | Ag g/t | Ag g/t | Ag g/t | Ag g/t | |
| | GS-5J-1 | 68.9 | 74.4 | 76.7 | 74 | 69.3 | 72.7 | 73.0 | 68 | 74.6 | 75.2 | 75 | 74 | | 69.2 | 74.2 | |
| | GS-5J-2 | 67.1 | 74.7 | 73.8 | 75 | 70.3 | 73.1 | 70.8 | 69 | 74.9 | 74.7 | 74 | 73 | | 70.3 | 71.8 | |
| | GS-5J-3 | 64.7 | 73.1 | 74.7 | 76 | 72.0 | 71.8 | 72.7 | 68 | 75.5 | 76.5 | 74 | 74 | | 71.7 | 71.5 | |
| | GS-5J-4 | 67.7 | 72.9 | 72.0 | 74 | 70.3 | 71.8 | 74.3 | 72 | 74.8 | 73.6 | 73 | 72 | | 71.2 | 72.9 | |
| | GS-5J-5 | 68.1 | 74.0 | 74.3 | 71 | 69.8 | 72.7 | 74.1 | 66 | 74.7 | 75.5 | 78 | 71 | | 69.9 | 74.2 | |
| | GS-5J-6 | 68.2 | 73.7 | 72.7 | 76 | 71.7 | 73.2 | 74.6 | 68 | 74.3 | 73.7 | 77 | 73 | | 69.0 | 70.9 | |
| | GS-5J-7 | 64.5 | 73.3 | 73.8 | 75 | 70.6 | 71.8 | 71.7 | 67 | 75.1 | 74.0 | 72 | 73 | | 70.6 | 73.8 | |
| | GS-5J-8 | 68.2 | 74.1 | 73.2 | 74 | 71.2 | 72.9 | 76.6 | 69 | 74.2 | 75.9 | 78 | 71 | | 70.2 | 71.7 | |
| | GS-5J-9 | 67.3 | 74.6 | 76.0 | 69 | 71.5 | 71.5 | 72.2 | 69 | 74.6 | 75.9 | 76 | 72 | | 69.7 | 71.2 | |
| | GS-5J-10 | 68.6 | 73.8 | 71.4 | 68 | 71.0 | 71.8 | 72.6 | 65 | 74.4 | 73.5 | 76 | 73 | | 69.4 | 72.4 | |
| | Mean | 67.3 | 73.9 | 73.9 | 73.2 | 70.8 | 72.3 | 73.3 | 68.1 | 74.7 | 74.9 | 75.3 | 72.6 | | 70.1 | 72.5 | |
| | Std. Dev'n | 1.538 | 0.620 | 1.661 | 2.860 | 0.864 | 0.646 | 1.672 | 1.912 | 0.388 | 1.102 | 2.058 | 1.075 | | 0.868 | 1.247 | |
| | % RSD | 2.28 | 0.84 | 2.25 | 3.91 | 1.22 | 0.89 | 2.28 | 2.81 | 0.52 | 1.47 | 2.73 | 1.48 | | 1.24 | 1.72 | |
Note: some labs did not supply all data.
STANDARD REFERENCE MATERIAL CDN-GS-5J
Participating Laboratories:
(not in same order as listed in table of results)
Acme Analytical Laboratories Ltd., Vancouver, B.C., Canada
Activation Laboratories, Ancaster, Ontario, Canada
Activation Laboratories, Stewart, B.C., Canada
Activation Laboratories, Thunder Bay, Ontario, Canada
ALS Chemex, North Vancouver, B.C., Canada
AGAT, Mississauga, Ontario, Canada
AHK, Alaska, USA
CIMM Peru SA
Inspectorate, Richmond, B.C., Canada
Omac, Ireland
Skyline Laboratory, Arizona, USA
SGS - Lima, Peru
Stewart Group, Kamloops, B.C., Canada
Alex Stewart Argentina SA
TSL Laboratories Ltd., Saskatoon, SK, Canada
Legal Notice:
This certificate and the reference material described in it have been prepared with due care and attention. However CDN Resource Laboratories Ltd. or Barry Smee accept no liability for any decisions or actions taken following the use of the reference material. Our liability is limited solely to the cost of the reference material.
Certified by /s/ Duncan Sanderson
Duncan Sanderson, Certified Assayer of B.C.
Geochemist /s/ Barry Smee
Dr. Barry Smee, Ph.D., P. Geo.
CDN Resource Laboratories Ltd.
#2, 20148 - 102nd Ave, Langley, B.C., Canada, V1M 4B4, 604-882-8422, Fax: 604-882-8466 (www.cdnlabs.com)
REFERENCE MATERIAL: CDN-ME-5
Recommended values and the "Between Lab" Two Standard Deviations
| Gold | 1.07 g/t Au | ± | 0.14 g/t Au | ** provisional value only ** |
| Silver | 206.1 | g/t Ag | ± | 13.1 | g/t | Ag | (FA / Grav) |
| Silver | 205.6 | g/t Ag | ± | 9.3 | g/t | Ag | (Digestion, ICP) |
| Copper | 0.840 % Cu ± 0.048 % Cu | |
| Lead | 2.13 % Pb | ± | 0.12 % Pb | |
| Zinc | 0.579 % Zn | ± | 0.020 % Zn | |
** Note:
Standards with an RSD of near or less than 5% are certified, RSD's of between 5% and 15% are Provisional, and RSD's over 15% are Indicated. Provisional and Indicated values cannot be used to monitor accuracy with a high degree of certainty.
PREPARED BY: | CDN Resource Laboratories Ltd. |
| CERTIFIED BY: | Duncan Sanderson, B.Sc., Licensed Assayer of British Columbia |
| INDEPENDENT GEOCHEMIST: | Dr. Barry Smee., Ph.D., P. Geo. |
| DATE OF CERTIFICATION: | September 3, 2009 |
METHOD OF PREPARATION:
Reject ore material was dried, crushed, pulverized and then passed through a 270 mesh screen. The +270 material was discarded. The -270 material was mixed for 5 days in a double-cone mixer. Splits were taken and sent to twelve laboratories for round robin assaying.
ORIGIN OF REFERENCE MATERIAL:
This standard is made primarily from ore supplied by US Silver from the Coeur d'Alene mining district in northern Idaho. The mineralization occurs as veins hosted by weakly metamorphosed, siliceous sediments. Ag-Cu ore occurs as tetrahedrite, and variable amounts of pyrite and chalcopyrite. Minor Pb is associated with Ag-Cu veins. Other portions of the mineralized areas include Pb-Ag veins primarily consisting of galena and quartz. The standard was made by mixing 200 kg of US Silver ore with 40 kg of a high grade Au ore, 22 kg of a Cu, Zn concentrate and 535 kg of a blank granitic material.
Approximate chemical composition is as follows:
| | Percent | | Percent |
| SiO2 | 65.7 | MgO | 1.5 |
| Al2O3 | 9.2 | K2O | 1.1 |
| Fe2O3 | 10.0 | TiO2 | 0.4 |
| CaO | 2.2 | LOI | 4.5 |
| Na2O | 2.2 | S | 1.8 |
Statistical Procedures:
The final limits were calculated after first determining if all data was compatible within a spread normally expected for similar analytical methods done by reputable laboratories. Data from any one laboratory was removed from further calculations when the mean of all analyses from that laboratory failed a t test of the global means of the other laboratories. The means and standard deviations were calculated using all remaining data. Any analysis that fell outside of the mean ±2 standard deviations was removed from the ensuing data base. The mean and standard deviations were again calculated using the remaining data. This method is different from that used by Government agencies in that the actual "between-laboratory" standard deviation is used in the calculations. This produces upper and lower limits that reflect actual individual analyses rather than a grouped set of analyses. The limits can therefore be used to monitor accuracy from individual analyses, unlike the Confidence Limits published on other standards.
Assay Procedures:
| Fire assay pre-concentration, AA or ICP finish (30g sub-sample). |
| Ag: Fire assay pre-concentration, gravimetric finish (30g sub-sample). |
| Ag, Cu, Pb, Zn: 4-acid digestion, AA or ICP finish. |
REFERENCE MATERIAL CDN-ME-5
Results from round-robin assaying:
| | | Lab 1 | Lab 2 | Lab 3 | Lab 4 | Lab 5 | Lab 6 | Lab 7 | Lab 8 | Lab 9 | Lab 10 | Lab 11 | Lab 12 | Lab 13 | |
| | | Au g/t | Au g/t | Au g/t | Au g/t | Au g/t | Au g/t | Au g/t | Au g/t | Au g/t | Au g/t | Au g/t | Au g/t | Au g/t | |
| | CDN-ME-5-1 | 0.82 | 0.92 | 1.06 | 0.99 | 1.08 | 1.19 | 1.10 | 0.91 | 1.17 | 1.10 | 0.99 | 1.08 | 1.02 | |
| | CDN-ME-5-2 | 1.32 | 1.12 | 1.02 | 0.96 | 1.17 | 1.07 | 1.20 | 1.08 | 0.84 | 1.26 | 1.21 | 1.28 | 1.01 | |
| | CDN-ME-5-3 | 1.28 | 1.16 | 1.05 | 1.02 | 1.18 | 1.13 | 1.17 | 1.02 | 1.12 | 1.02 | 1.45 | 0.99 | 1.03 | |
| | CDN-ME-5-4 | 0.91 | 1.26 | 1.10 | 1.11 | 1.08 | 1.02 | 1.18 | 1.06 | 1.16 | 1.19 | 1.60 | 1.07 | 1.01 | |
| | CDN-ME-5-5 | 1.40 | 0.89 | 1.12 | 1.03 | 1.15 | 1.09 | 1.27 | 1.01 | 1.01 | 1.02 | 1.26 | 1.09 | 1.03 | |
| | CDN-ME-5-6 | 0.91 | 0.97 | 1.11 | 1.16 | 1.14 | 1.05 | 1.26 | 1.11 | 1.04 | 1.00 | 1.10 | 1.12 | 1.01 | |
| | CDN-ME-5-7 | 1.24 | 1.08 | 1.10 | 1.11 | 1.17 | 1.04 | 1.13 | 1.17 | 1.06 | 0.91 | 0.88 | 0.98 | 1.03 | |
| | CDN-ME-5-8 | 1.08 | 0.99 | 1.08 | 1.07 | 1.01 | 1.04 | 1.19 | 1.15 | 1.20 | 1.04 | 1.47 | 0.94 | 1.02 | |
| | CDN-ME-5-9 | 1.01 | 1.07 | 1.12 | 0.95 | 1.12 | 1.14 | 1.10 | 0.98 | 1.12 | 1.01 | 1.00 | 0.99 | 1.03 | |
| | CDN-ME-5-10 0.99 | 1.06 | 1.02 | 1.13 | 1.25 | 1.09 | 1.10 | 1.13 | 1.05 | 0.97 | 1.18 | 0.99 | 1.01 | |
| | Mean | 1.10 | 1.05 | 1.08 | 1.05 | 1.14 | 1.09 | 1.17 | 1.06 | 1.08 | 1.05 | 1.21 | 1.05 | 1.02 | |
| | Std. Devn. | 0.2004 | 0.1109 | 0.0385 | 0.0738 | 0.0665 | 0.0536 | 0.0622 | 0.0823 | 0.1040 | 0.1044 | 0.2348 | 0.0993 | 0.0094 | |
| | % RSD | 18.28 | 10.54 | 3.57 | 7.01 | 5.86 | 4.93 | 5.33 | 7.75 | 9.66 | 9.93 | 19.35 | 9.44 | 0.92 | |
| |
| | (FA / Grav.) | Ag g/t | Ag g/t | Ag g/t | Ag g/t | Ag g/t | Ag g/t | Ag g/t | Ag g/t | Ag g/t | Ag g/t | Ag g/t | Ag g/t | Ag g/t | |
| | CDN-ME-5-1 | 204 | 206 | 206.4 | 211 | 205 | 197 | 216.2 | 212 | 200 | 210 | 197 | | | |
| | CDN-ME-5-2 | 207 | 205 | 214.6 | 206 | 192 | 197 | 210.2 | 186 | 203 | 208 | 199 | | | |
| | CDN-ME-5-3 | 206 | 207 | 212.5 | 210 | 209 | 200 | 212.5 | 197 | 204 | 214 | 197 | | | |
| | CDN-ME-5-4 | 203 | 206 | 210.3 | 219 | 207 | 203 | 218.2 | 202 | 202 | 217 | 194 | | | |
| | CDN-ME-5-5 | 210 | 204 | 209.7 | 219 | 201 | 200 | 209.5 | 198 | 201 | 212 | 194 | | | |
| | CDN-ME-5-6 | 212 | 203 | 204.9 | 224 | 202 | 202 | 215.3 | 198 | 201 | 208 | 196 | | | |
| | CDN-ME-5-7 | 208 | 204 | 205.9 | 218 | 205 | 203 | 217.1 | 203 | 205 | 212 | 191 | | | |
| | CDN-ME-5-8 | 201 | 210 | 211.3 | 215 | 199 | 200 | 212.2 | 204 | 206 | 216 | 200 | | | |
| | CDN-ME-5-9 | 201 | 205 | 213.5 | 213 | 205 | 201 | 215.4 | 202 | 202 | 208 | 213 | | | |
| | CDN-ME-5-10 204 | 203 | 210.9 | 217 | 206 | 199 | 215.8 | 198 | 202 | 212 | 195 | | | |
| | Mean | 205.6 | 205.3 | 210.0 | 215.2 | 203.1 | 200.2 | 214.2 | 200.0 | 202.6 | 211.7 | 197.6 | | | |
| | Std. Devn. | 3.688 | 2.111 | 3.302 | 5.287 | 4.886 | 2.150 | 2.955 | 6.616 | 1.897 | 3.268 | 6.004 | | | |
| | % RSD | 1.79 | 1.03 | 1.57 | 2.46 | 2.41 | 1.07 | 1.38 | 3.31 | 0.94 | 1.54 | 3.04 | | | |
| |
| | Digestion / ICP | Ag g/t | Ag g/t | Ag g/t | Ag g/t | Ag g/t | Ag g/t | Ag g/t | Ag g/t | Ag g/t | Ag g/t | Ag g/t | Ag g/t | Ag g/t | |
| | CDN-ME-5-1 | 201 | 200 | 206.1 | 202 | 211 | 209 | 215.0 | 205 | 211 | 201 | 213 | 194 | 212 | |
| | CDN-ME-5-2 | 203 | 204 | 208.7 | 202 | 211 | 213 | 209.5 | 193 | 211 | 205 | 212 | 202 | 211 | |
| | CDN-ME-5-3 | 203 | 206 | 208.2 | 204 | 216 | 215 | 209.0 | 200 | 211 | 201 | 217 | 194 | 207 | |
| | CDN-ME-5-4 | 205 | 205 | 205.2 | 206 | 210 | 208 | 207.6 | 197 | 211 | 203 | 217 | 198 | 205 | |
| | CDN-ME-5-5 | 208 | 209 | 202.3 | 204 | 211 | 208 | 210.5 | 191 | 213 | 200 | 216 | 200 | 216 | |
| | CDN-ME-5-6 | 202 | 210 | 210.2 | 202 | 215 | 210 | 210.5 | 196 | 207 | 203 | 219 | 196 | 209 | |
| | CDN-ME-5-7 | 204 | 208 | 210.7 | 202 | 208 | 206 | 211.1 | 201 | 207 | 198 | 218 | 200 | 210 | |
| | CDN-ME-5-8 | 205 | 205 | 205.5 | 206 | 206 | 201 | 208.7 | 202 | 205 | 197 | 215 | 200 | 207 | |
| | CDN-ME-5-9 | 207 | 204 | 210.1 | 204 | 203 | 211 | 206.2 | 197 | 205 | 199 | 211 | 198 | 212 | |
| | CDN-ME-5-10 200 | 202 | 207.2 | 200 | 209 | 212 | 211.6 | 197 | 204 | 201 | 215 | 204 | 210 | |
| | Mean | 203.8 | 205.3 | 207.4 | 203.2 | 210.0 | 209.3 | 210.0 | 197.9 | 208.5 | 200.8 | 215.3 | 198.6 | 209.9 | |
| | Std. Devn. | 2.530 | 3.093 | 2.678 | 1.932 | 3.859 | 3.945 | 2.413 | 4.202 | 3.240 | 2.440 | 2.627 | 3.273 | 3.143 | |
| | % RSD | 1.24 | 1.51 | 1.29 | 0.95 | 1.84 | 1.89 | 1.15 | 2.12 | 1.55 | 1.22 | 1.22 | 1.65 | 1.50 | |
NOTE: Au data from Labs 1 and 11 was excluded due to poor precision.
Ag data (digestion / ICP) from Lab 11 was excluded for failing the "t" test
| REFERENCE MATERIAL | CDN-ME-5 | | | | | | | | | | |
| |
| Results from round-robin assaying: | | | | | | | | | | | | | |
| |
| | | | Lab 1 | Lab 2 | Lab 3 | Lab 4 | Lab 5 | Lab 6 | Lab 7 | Lab 8 | Lab 9 | Lab 10 | Lab 11 | Lab 12 | Lab 13 | | |
| | | | % Cu % Cu % Cu | % Cu | % Cu | % Cu | % Cu | % Cu | % Cu | % Cu % Cu % Cu | % Cu | | |
| | | CDN-ME-5-1 0.846 | 0.842 | 0.871 | 0.816 | 0.860 | 0.811 | 0.858 | 0.80 | 0.827 | 0.859 | 0.839 | 0.888 | 0.809 | | |
| | | CDN-ME-5-2 0.847 | 0.846 | 0.857 | 0.825 | 0.941 | 0.845 | 0.872 | 0.83 | 0.798 | 0.872 | 0.834 | 0.900 | 0.815 | | |
| | | CDN-ME-5-3 0.847 | 0.835 | 0.846 | 0.821 | 0.889 | 0.838 | 0.853 | 0.86 | 0.812 | 0.870 | 0.840 | 0.866 | 0.802 | | |
| | | CDN-ME-5-4 0.858 | 0.872 | 0.867 | 0.826 | 0.870 | 0.800 | 0.839 | 0.85 | 0.824 | 0.867 | 0.844 | 0.862 | 0.813 | | |
| | | CDN-ME-5-5 0.843 | 0.847 | 0.866 | 0.820 | 0.899 | 0.799 | 0.854 | 0.81 | 0.806 | 0.870 | 0.840 | 0.899 | 0.815 | | |
| | | CDN-ME-5-6 0.848 | 0.828 | 0.860 | 0.833 | 0.911 | 0.811 | 0.853 | 0.88 | 0.801 | 0.873 | 0.836 | 0.850 | 0.801 | | |
| | | CDN-ME-5-7 0.852 | 0.839 | 0.862 | 0.836 | 0.871 | 0.779 | 0.839 | 0.85 | 0.801 | 0.872 | 0.844 | 0.860 | 0.810 | | |
| | | CDN-ME-5-8 0.857 | 0.844 | 0.862 | 0.830 | 0.891 | 0.794 | 0.849 | 0.85 | 0.797 | 0.874 | 0.837 | 0.885 | 0.802 | | |
| | | CDN-ME-5-9 0.871 | 0.837 | 0.865 | 0.827 | 0.878 | 0.824 | 0.870 | 0.84 | 0.789 | 0.866 | 0.841 | 0.854 | 0.805 | | |
| | | CDN-ME-5-10 0.857 0.843 0.854 | 0.823 | 0.924 | 0.830 | 0.845 | 0.82 | 0.795 | 0.870 | 0.838 | 0.888 | 0.809 | | |
| | | Mean | 0.853 | 0.843 | 0.861 | 0.826 | 0.893 | 0.813 | 0.853 | 0.839 | 0.805 | 0.869 | 0.839 | 0.875 | 0.808 | | |
| | | Std. Devn. | 0.0083 | 0.0116 | 0.0072 | 0.0060 | 0.0258 | 0.0209 | 0.0113 | 0.0242 | 0.0125 | 0.0044 | 0.0032 | 0.0188 | 0.0052 | | |
| | | % RSD | 0.98 | 1.37 | 0.84 | 0.73 | 2.88 | 2.58 | 1.32 | 2.89 | 1.55 | 0.51 | 0.39 | 2.15 | 0.64 | | |
| |
| | | | % Pb % Pb % Pb | % Pb | % Pb | % Pb | % Pb | % Pb | % Pb | % Pb % Pb % Pb | | | |
| | | CDN-ME-5-1 | 2.16 | 2.03 | 2.13 | 2.25 | 2.11 | 2.11 | 2.25 | 2.00 | 2.10 | 2.07 | 2.169 | 2.17 | 2.08 | | |
| | | CDN-ME-5-2 | 2.19 | 2.07 | 2.12 | 2.26 | 2.18 | 2.16 | 2.20 | 2.06 | 2.06 | 2.09 | 2.150 | 2.17 | 2.10 | | |
| | | CDN-ME-5-3 | 2.20 | 2.07 | 2.12 | 2.31 | 2.20 | 2.22 | 2.20 | 2.11 | 2.06 | 2.08 | 2.164 | 2.17 | 2.06 | | |
| | | CDN-ME-5-4 | 2.19 | 2.05 | 2.18 | 2.29 | 2.16 | 2.03 | 2.27 | 2.11 | 2.10 | 2.09 | 2.192 | 2.14 | 2.06 | | |
| | | CDN-ME-5-5 | 2.20 | 2.07 | 2.17 | 2.28 | 2.18 | 2.17 | 2.21 | 2.00 | 2.06 | 2.08 | 2.173 | 2.18 | 2.11 | | |
| | | CDN-ME-5-6 | 2.17 | 2.07 | 2.17 | 2.32 | 2.20 | 2.03 | 2.20 | 2.14 | 2.03 | 2.09 | 2.159 | 2.16 | 2.06 | | |
| | | CDN-ME-5-7 | 2.19 | 2.09 | 2.15 | 2.34 | 2.13 | 2.11 | 2.23 | 2.07 | 2.02 | 2.06 | 2.188 | 2.14 | 2.09 | | |
| | | CDN-ME-5-8 | 2.20 | 2.06 | 2.13 | 2.35 | 2.12 | 2.07 | 2.20 | 2.10 | 1.99 | 2.04 | 2.165 | 2.22 | 2.11 | | |
| | | CDN-ME-5-9 | 2.20 | 2.04 | 2.16 | 2.33 | 2.09 | 2.21 | 2.23 | 2.09 | 1.98 | 2.04 | 2.184 | 2.20 | 2.08 | | |
| | | CDN-ME-5-10 2.17 | 2.07 | 2.10 | 2.22 | 2.18 | 2.17 | 2.28 | 2.02 | 1.99 | 2.04 | 2.164 | 2.22 | 2.02 | | |
| | | Mean | 2.19 | 2.06 | 2.14 | 2.30 | 2.16 | 2.13 | 2.23 | 2.07 | 2.04 | 2.07 | 2.17 | 2.18 | 2.08 | | |
| | | Std. Devn. | 0.0149 | 0.0175 | 0.0267 | 0.0425 | 0.0395 | 0.0691 | 0.0302 | 0.0492 | 0.0441 | 0.0215 | 0.0134 | 0.0287 | 0.0268 | | |
| | | % RSD | 0.68 | 0.85 | 1.25 | 1.85 | 1.83 | 3.25 | 1.35 | 2.38 | 2.16 | 1.04 | 0.62 | 1.32 | 1.29 | | |
| |
| | | | % Zn % Zn % Zn | % Zn | % Zn | % Zn | % Zn | % Zn | % Zn | % Zn % Zn % Zn | | | |
| | | CDN-ME-5-1 | 0.59 | 0.583 | 0.58 | 0.602 | 0.574 | 0.555 | 0.577 | 0.54 | 0.594 | 0.562 | 0.585 | 0.585 | 0.588 | | |
| | | CDN-ME-5-2 | 0.58 | 0.584 | 0.58 | 0.596 | 0.590 | 0.568 | 0.583 | 0.56 | 0.587 | 0.567 | 0.582 | 0.585 | 0.577 | | |
| | | CDN-ME-5-3 | 0.58 | 0.582 | 0.57 | 0.610 | 0.595 | 0.579 | 0.561 | 0.57 | 0.599 | 0.560 | 0.588 | 0.585 | 0.585 | | |
| | | CDN-ME-5-4 | 0.59 | 0.607 | 0.58 | 0.608 | 0.581 | 0.557 | 0.555 | 0.57 | 0.607 | 0.566 | 0.584 | 0.582 | 0.591 | | |
| | | CDN-ME-5-5 | 0.58 | 0.596 | 0.59 | 0.604 | 0.580 | 0.558 | 0.582 | 0.55 | 0.595 | 0.555 | 0.597 | 0.586 | 0.588 | | |
| | | CDN-ME-5-6 | 0.58 | 0.578 | 0.57 | 0.623 | 0.589 | 0.563 | 0.592 | 0.58 | 0.596 | 0.567 | 0.581 | 0.588 | 0.579 | | |
| | | CDN-ME-5-7 | 0.59 | 0.587 | 0.57 | 0.622 | 0.570 | 0.552 | 0.584 | 0.57 | 0.588 | 0.548 | 0.589 | 0.584 | 0.585 | | |
| | | CDN-ME-5-8 | 0.59 | 0.583 | 0.56 | 0.602 | 0.564 | 0.536 | 0.587 | 0.58 | 0.608 | 0.551 | 0.585 | 0.582 | 0.588 | | |
| | | CDN-ME-5-9 | 0.60 | 0.583 | 0.57 | 0.602 | 0.565 | 0.563 | 0.573 | 0.57 | 0.599 | 0.551 | 0.583 | 0.577 | 0.590 | | |
| | | CDN-ME-5-10 0.59 | 0.588 | 0.57 | 0.600 | 0.578 | 0.572 | 0.581 | 0.56 | 0.602 | 0.559 | 0.582 | 0.597 | 0.579 | | |
| | | Mean | 0.587 | 0.587 | 0.574 | 0.607 | 0.579 | 0.560 | 0.578 | 0.565 | 0.598 | 0.559 | 0.586 | 0.585 | 0.585 | | |
| | | Std. Devn. | 0.0067 | 0.0085 | 0.0084 | 0.0091 | 0.0106 | 0.0119 | 0.0116 | 0.0127 | 0.007 | 0.0071 | 0.0048 | 0.0051 | 0.005 | | |
| | | % RSD | 1.15 | 1.44 | 1.47 | 1.50 | 1.83 | 2.12 | 2.00 | 2.25 | 1.18 | 1.27 | 0.81 | 0.88 | 0.85 | | |
NOTE: Cu data from Lab 5 was excluded for failing the "t" test.
Pb data from Lab 4 was excluded for failing the "t"test.
Zn data from Lab 4 was excluded for failing the "t"test.
REFERENCE MATERIAL CDN-ME-5
Participating Laboratories:
(not in same order as listed in table of results)
Acme Analytical Laboratories Ltd., Vancouver
Actlabs-Ancaster, Ontario, Canada
Actlabs-Thunder Bay, Ontario, Canada
ALS Chemex Laboratories, North Vancouver
Alaska Assay Laboratories, Alaska, USA
Assayers Canada Ltd., Vancouver
Eco Tech, B.C., Canada
Genalysis Laboratory, Australia
Labtium Laboratory, Finland
SGS Toronto, Ontario, Canada
Skyline Laboratories, Arizona, USA
TSL Laboratories Ltd., Saskatoon
Ultra Trace Analytical Laboratories, Australia
Legal Notice:
This certificate and the reference material described in it have been prepared with due care and attention. However CDN Resource Laboratories Ltd. or Barry Smee accept no liability for any decisions or actions taken following the use of the reference material. Our liability is limited solely to the cost of the reference material.
Certified by /s/ Duncan Sanderson
Duncan Sanderson, Certified Assayer of B.C.
Geochemist /s/ Barry Smee
Dr. Barry Smee, Ph.D., P. Geo.
CDN Resource Laboratories Ltd.
#2, 20148 - 102nd Ave, Langley, B.C., Canada, V1M 4B4, 604-882-8422, Fax: 604-882-8466 (www.cdnlabs.com)
REFERENCE MATERIAL: CDN-ME-16
Recommended values and the "Between Lab" Two Standard Deviations
| Gold 1.48 g/t ± 0.14 g/t |
| Silver 30.8 g/t ± 2.2 g/t |
| Copper 0.671 % ± 0.036 % |
| Lead 0.879 % ± 0.040 % |
| Zinc 0.807 % ± 0.040 % |
| |
| |
| PREPARED BY: CDN Resource Laboratories Ltd. |
| CERTIFIED BY: Duncan Sanderson, B.Sc., Licensed Assayer of British Columbia |
INDEPENDENT GEOCHEMIST: Dr. Barry Smee., Ph.D., P. Geo.
DATE OF CERTIFICATION: January 31, 2011
METHOD OF PREPARATION:
Reject ore material was dried, crushed, pulverized and then passed through a 270 mesh screen. The +270 material was discarded. The -270 material was mixed for 5 days in a double-cone mixer. Splits were taken and sent to 14 laboratories for round robin assaying.
ORIGIN OF REFERENCE MATERIAL:
This standard is made from a mixture of ores.
Approximate chemical composition (from whole rock analysis) is as follows:
| | Percent | | Percent |
| SiO2 | 47.8 | MgO | 3.9 |
| Al2O3 | 14.0 | K2O | 1.2 |
| Fe2O3 | 14.6 | TiO2 | 0 |
| CaO | 9.0 | LOI | 5.3 |
| Na2O | 1.2 | S | 6.5 |
| C | 0.8 | | |
Statistical Procedures:
The final limits were calculated after first determining if all data was compatible within a spread normally expected for similar analytical methods done by reputable laboratories. Data from any one laboratory was removed from further calculations when the mean of all analyses from that laboratory failed a t test of the global means of the other laboratories. The means and standard deviations were calculated using all remaining data. Any analysis that fell outside of the mean ±2 standard deviations was removed from the ensuing data base. The mean and standard deviations were again calculated using the remaining data. This method is different from that used by Government agencies in that the actual "between-laboratory" standard deviation is used in the calculations. This produces upper and lower limits that reflect actual individual analyses rather than a grouped set of analyses. The limits can therefore be used to monitor accuracy from individual analyses, unlike the Confidence Limits published on other standards.
| Assay Procedures: |
| |
| Au: Fire assay pre-concentration, AA or ICP finish (30g sub-sample). |
| Ag, Cu, Pb, Zn: 4-acid digestion, AA or ICP finish. |
REFERENCE MATERIAL CDN-ME-16
Results from round-robin assaying:
| | | Lab 1 | Lab 2 | Lab 3 | Lab 4 | Lab 5 | Lab 6 | Lab 7 | Lab 8 | Lab 9 | Lab 10 | Lab 11 | Lab 12 | Lab 13 | Lab 14 | Lab 15 | |
| | | Au g/t | Au g/t | Au g/t | Au g/t | Au g/t | Au g/t | Au g/t | Au g/t | Au g/t | Au g/t | Au g/t | Au g/t | Au g/t | Au g/t | Au g/t | |
| | ME-16-1 | 1.56 | 1.50 | 1.51 | 1.55 | 1.55 | 1.53 | 1.47 | 1.16 | 1.27 | 1.50 | 1.29 | 1.46 | 1.48 | 1.45 | 1.48 | |
| | ME-16-2 | 1.47 | 1.42 | 1.51 | 1.52 | 1.50 | 1.62 | 1.46 | 1.46 | 1.23 | 1.55 | 1.52 | 1.48 | 1.45 | 1.43 | 1.50 | |
| | ME-16-3 | 1.51 | 1.42 | 1.46 | 1.56 | 1.52 | 1.46 | 1.43 | 1.28 | 1.26 | 1.55 | 1.29 | 1.36 | 1.55 | 1.37 | 1.45 | |
| | ME-16-4 | 1.58 | 1.46 | 1.50 | 1.52 | 1.54 | 1.69 | 1.54 | 1.25 | 1.18 | 1.51 | 1.50 | 1.34 | 1.54 | 1.40 | 1.59 | |
| | ME-16-5 | 1.40 | 1.46 | 1.51 | 1.51 | 1.48 | 1.58 | 1.25 | 1.32 | 1.35 | 1.59 | 1.46 | 1.47 | 1.57 | 1.45 | 1.53 | |
| | ME-16-6 | 1.43 | 1.39 | 1.42 | 1.45 | 1.58 | 1.49 | 1.47 | 1.22 | 1.18 | 1.35 | 1.29 | 1.32 | 1.51 | 1.46 | 1.48 | |
| | ME-16-7 | 1.42 | 1.49 | 1.51 | 1.65 | 1.51 | 1.51 | 1.50 | 1.31 | 1.10 | 1.46 | 1.52 | 1.37 | 1.46 | 1.51 | 1.52 | |
| | ME-16-8 | 1.56 | 1.42 | 1.49 | 1.37 | 1.45 | 1.64 | 1.48 | 1.18 | 1.31 | 1.55 | 1.35 | 1.45 | 1.55 | 1.49 | 1.54 | |
| | ME-16-9 | 1.56 | 1.47 | 1.50 | 1.58 | 1.57 | 1.52 | 1.69 | 1.51 | 1.15 | 1.68 | 1.24 | 1.46 | 1.55 | 1.42 | 1.45 | |
| | ME-16-10 1.53 | 1.45 | 1.48 | 1.43 | 1.54 | 1.52 | 1.53 | 1.45 | 1.29 | 1.42 | 1.50 | 1.38 | 1.52 | 1.45 | 1.48 | |
| | Mean | 1.50 | 1.45 | 1.49 | 1.51 | 1.52 | 1.56 | 1.48 | 1.31 | 1.23 | 1.52 | 1.40 | 1.41 | 1.52 | 1.44 | 1.50 | |
| | Std. Devn. | 0.0673 | 0.0364 | 0.0292 | 0.0804 | 0.0409 0.0725 0.1089 0.1208 0.0790 0.0912 0.1138 0.0606 | 0.0418 | 0.0408 | 0.0437 | |
| | % RSD | 4.48 | 2.52 | 1.96 | 5.31 | 2.69 | 4.66 | 7.34 | 9.20 | 6.41 | 6.02 | 8.15 | 4.30 | 2.76 | 2.83 | 2.91 | |
| |
| | | Ag g/t | Ag g/t | Ag g/t | Ag g/t | Ag g/t | Ag g/t | Ag g/t | Ag g/t | Ag g/t | Ag g/t | Ag g/t | Ag g/t | Ag g/t | Ag g/t | Ag g/t | |
| | ME-16-1 | 32.9 | 32 | 30.0 | 31 | 30.0 | 30.4 | 32 | 30.9 | 26.2 | 30.6 | 31.2 | 31 | 30 | 29.4 | 30.8 | |
| | ME-16-2 | 33.0 | 29 | 31.0 | 31 | 31.2 | 30.0 | 32 | 30.6 | 25.7 | 30.5 | 34.7 | 29 | 30 | 30.2 | 31.1 | |
| | ME-16-3 | 32.5 | 29 | 29.5 | 30 | 31.9 | 30.3 | 32 | 31.2 | 24.8 | 30.0 | 29.1 | 31 | 30 | 29.7 | 31.6 | |
| | ME-16-4 | 32.0 | 30 | 31.5 | 30 | 30.3 | 29.9 | 32 | 31.6 | 25.4 | 30.4 | 38.7 | 32 | 29 | 31.1 | 31.3 | |
| | ME-16-5 | 32.8 | 30 | 30.5 | 30 | 31.1 | 30.0 | 33 | 30.0 | 27.4 | 29.8 | 29.2 | 31 | 29 | 30.1 | 31.1 | |
| | ME-16-6 | 32.7 | 30 | 32.0 | 30 | 30.4 | 28.8 | 32 | 30.0 | 27.5 | 30.0 | 29.3 | 30 | 30 | 28.9 | 30.8 | |
| | ME-16-7 | 32.4 | 33 | 30.5 | 30 | 30.2 | 33.0 | 32 | 33.2 | 28.1 | 30.4 | 29.5 | 32 | 31 | 31.6 | 30.8 | |
| | ME-16-8 | 32.5 | 33 | 30.0 | 30 | 31.0 | 31.4 | 32 | 32.4 | 28.4 | 32.0 | 39.0 | 31 | 30 | 29.5 | 30.5 | |
| | ME-16-9 | 33.9 | 30 | 30.0 | 32 | 30.8 | 30.0 | 32 | 31.6 | 27.0 | 31.7 | 23.3 | 32 | 30 | 30.4 | 32.0 | |
| | ME-16-10 32.6 | 31 | 30.5 | 31 | 30.7 | 30.2 | 31 | 31.9 | 26.8 | 30.7 | 29.7 | 30 | 30 | 29.3 | 30.4 | |
| | Mean | 32.7 | 30.7 | 30.6 | 30.5 | 30.8 | 30.4 | 32.0 | 31.3 | 26.7 | 30.6 | 31.4 | 30.9 | 29.9 | 30.0 | 31.0 | |
| | Std. Devn. | 0.4990 | 1.4944 | 0.7619 | 0.7071 | 0.5728 1.1106 0.4714 1.0309 1.1842 0.7138 4.8146 0.9944 | 0.5676 | 0.8417 | 0.4926 | |
| | % RSD | 1.52 | 4.87 | 2.49 | 2.32 | 1.86 | 3.65 | 1.47 | 3.29 | 4.43 | 2.33 | 15.35 | 3.22 | 1.90 | 2.80 | 1.59 | |
Note: Both Au and Ag results from Laboratory 9 were removed for failing the "t" test.
REFERENCE MATERIAL CDN-ME-16
Results from round-robin assaying:
| | | Lab 1 | Lab 2 | Lab 3 | Lab 4 | Lab 5 | Lab 6 | Lab 7 | Lab 8 | Lab 9 | Lab 10 | Lab 11 | Lab 12 | Lab 13 | Lab 14 | Lab 15 | |
| | | % Cu | % Cu % Cu % Cu % Cu | % Cu | % Cu | % Cu | % Cu % Cu % Cu % Cu % Cu | % Cu | % Cu | |
| | ME-16-1 | 0.70 | 0.688 | 0.676 | 0.684 | 0.674 | 0.68 | 0.681 | 0.69 | 0.687 | 0.680 | 0.654 | 0.656 | 0.652 | 0.670 | 0.645 | | |
| | ME-16-2 | 0.71 | 0.680 | 0.651 | 0.664 | 0.675 | 0.68 | 0.679 | 0.69 | 0.673 | 0.657 | 0.661 | 0.605 | 0.653 | 0.664 | 0.648 | | |
| | ME-16-3 | 0.68 | 0.675 | 0.648 | 0.666 | 0.677 | 0.69 | 0.698 | 0.70 | 0.656 | 0.655 | 0.691 | 0.636 | 0.662 | 0.685 | 0.647 | | |
| | ME-16-4 | 0.70 | 0.680 | 0.678 | 0.664 | 0.669 | 0.70 | 0.696 | 0.71 | 0.649 | 0.667 | 0.692 | 0.631 | 0.661 | 0.675 | 0.640 | | |
| | ME-16-5 | 0.70 | 0.684 | 0.652 | 0.657 | 0.675 | 0.69 | 0.694 | 0.68 | 0.718 | 0.657 | 0.666 | 0.634 | 0.660 | 0.671 | 0.648 | | |
| | ME-16-6 | 0.68 | 0.672 | 0.655 | 0.665 | 0.660 | 0.68 | 0.699 | 0.70 | 0.725 | 0.660 | 0.639 | 0.627 | 0.652 | 0.669 | 0.645 | | |
| | ME-16-7 | 0.69 | 0.679 | 0.657 | 0.675 | 0.670 | 0.69 | 0.691 | 0.67 | 0.711 | 0.665 | 0.653 | 0.655 | 0.657 | 0.674 | 0.647 | | |
| | ME-16-8 | 0.69 | 0.683 | 0.646 | 0.659 | 0.672 | 0.68 | 0.690 | 0.69 | 0.726 | 0.666 | 0.653 | 0.651 | 0.639 | 0.679 | 0.651 | | |
| | ME-16-9 | 0.69 | 0.680 | 0.663 | 0.662 | 0.675 | 0.68 | 0.692 | 0.70 | 0.698 | 0.679 | 0.658 | 0.666 | 0.643 | 0.683 | 0.647 | | |
| | ME-16-10 0.69 | 0.692 | 0.667 | 0.663 | 0.674 | 0.68 | 0.690 | 0.70 | 0.684 | 0.666 | 0.642 | 0.632 | 0.645 | 0.672 | 0.651 | | |
| | Mean | 0.693 | 0.681 | 0.659 | 0.666 | 0.672 | 0.685 | 0.691 | 0.693 | 0.693 | 0.665 | 0.661 | 0.639 | 0.652 | 0.674 | 0.647 | | |
| | Std. Devn. | 0.0095 | 0.0058 | 0.0113 | 0.0078 | 0.0048 | 0.0071 0.0066 0.0116 0.0277 0.0085 0.0180 0.0178 0.0079 0.0065 0.0032 | | |
| | % RSD | 1.37 | 0.86 | 1.72 | 1.17 | 0.72 | 1.03 | 0.96 | 1.67 | 4.00 | 1.28 | 2.72 | 2.79 | 1.22 | 0.97 | 0.49 | | |
| |
| | | % Pb | % Pb % Pb % Pb % Pb | % Pb | % Pb | % Pb | % Pb % Pb % Pb | % Pb | % Pb | % Pb | % Pb | |
| | ME-16-1 | 0.94 | 0.861 | 0.870 | 0.882 | 0.884 | 0.88 | 0.890 | 0.88 | 0.948 | 0.902 | 0.898 | 0.906 | 0.889 | 0.87 | 0.883 | | |
| | ME-16-2 | 0.93 | 0.849 | 0.867 | 0.852 | 0.902 | 0.85 | 0.880 | 0.88 | 0.936 | 0.906 | 0.903 | 0.826 | 0.897 | 0.87 | 0.877 | | |
| | ME-16-3 | 0.94 | 0.836 | 0.879 | 0.847 | 0.901 | 0.87 | 0.890 | 0.87 | 0.912 | 0.904 | 0.943 | 0.858 | 0.901 | 0.89 | 0.889 | | |
| | ME-16-4 | 0.95 | 0.853 | 0.906 | 0.860 | 0.883 | 0.87 | 0.890 | 0.84 | 0.901 | 0.914 | 0.962 | 0.859 | 0.891 | 0.86 | 0.872 | | |
| | ME-16-5 | 0.95 | 0.852 | 0.890 | 0.846 | 0.888 | 0.86 | 0.890 | 0.89 | 1.008 | 0.893 | 0.903 | 0.854 | 0.895 | 0.87 | 0.888 | | |
| | ME-16-6 | 0.96 | 0.837 | 0.892 | 0.857 | 0.896 | 0.85 | 0.890 | 0.87 | 1.011 | 0.910 | 0.881 | 0.845 | 0.903 | 0.86 | 0.880 | | |
| | ME-16-7 | 0.95 | 0.852 | 0.885 | 0.878 | 0.890 | 0.86 | 0.880 | 0.91 | 0.990 | 0.904 | 0.876 | 0.881 | 0.901 | 0.87 | 0.893 | | |
| | ME-16-8 | 0.95 | 0.847 | 0.873 | 0.858 | 0.899 | 0.86 | 0.880 | 0.90 | 1.040 | 0.907 | 0.860 | 0.886 | 0.879 | 0.85 | 0.892 | | |
| | ME-16-9 | 0.96 | 0.841 | 0.867 | 0.848 | 0.901 | 0.86 | 0.880 | 0.89 | 0.973 | 0.923 | 0.880 | 0.862 | 0.904 | 0.88 | 0.888 | | |
| | ME-16-10 0.95 | 0.860 | 0.880 | 0.852 | 0.901 | 0.86 | 0.880 | 0.90 | 0.949 | 0.905 | 0.892 | 0.870 | 0.898 | 0.85 | 0.877 | | |
| | Mean | 0.948 | 0.849 | 0.881 | 0.858 | 0.894 | 0.862 | 0.885 | 0.883 | 0.967 | 0.907 | 0.900 | 0.844 | 0.896 | 0.867 | 0.884 | | |
| | Std. Devn. | 0.0092 | 0.0087 | 0.0126 | 0.0125 | 0.0075 | 0.0092 0.0053 0.0200 0.0454 0.0081 0.0311 0.0459 0.0077 0.0125 0.0072 | | |
| | % RSD | 0.97 | 1.02 | 1.43 | 1.46 | 0.84 | 1.07 | 0.60 | 2.27 | 4.69 | 0.89 | 3.46 | 5.44 | 0.86 | 1.44 | 0.81 | | |
| |
| | | % Zn | % Zn % Zn % Zn % Zn | % Zn | % Zn | % Zn | % Zn % Zn % Zn | % Zn | % Zn | % Zn | % Zn | |
| | ME-16-1 | 0.78 | 0.830 | 0.78 | 0.840 | 0.800 | 0.83 | 0.850 | 0.81 | 0.750 | 0.819 | 0.871 | 0.820 | 0.801 | 0.81 | 0.797 | | |
| | ME-16-2 | 0.77 | 0.816 | 0.80 | 0.828 | 0.801 | 0.82 | 0.850 | 0.81 | 0.737 | 0.798 | 0.865 | 0.761 | 0.816 | 0.81 | 0.792 | | |
| | ME-16-3 | 0.78 | 0.807 | 0.80 | 0.825 | 0.800 | 0.83 | 0.850 | 0.79 | 0.724 | 0.808 | 0.885 | 0.776 | 0.804 | 0.82 | 0.786 | | |
| | ME-16-4 | 0.79 | 0.824 | 0.81 | 0.827 | 0.802 | 0.83 | 0.870 | 0.77 | 0.719 | 0.821 | 0.933 | 0.776 | 0.796 | 0.81 | 0.793 | | |
| | ME-16-5 | 0.80 | 0.827 | 0.79 | 0.816 | 0.802 | 0.82 | 0.870 | 0.81 | 0.792 | 0.803 | 0.835 | 0.780 | 0.804 | 0.81 | 0.783 | | |
| | ME-16-6 | 0.80 | 0.809 | 0.80 | 0.827 | 0.801 | 0.81 | 0.870 | 0.80 | 0.799 | 0.803 | 0.842 | 0.772 | 0.819 | 0.80 | 0.799 | | |
| | ME-16-7 | 0.79 | 0.825 | 0.80 | 0.848 | 0.800 | 0.83 | 0.850 | 0.83 | 0.786 | 0.812 | 0.810 | 0.799 | 0.803 | 0.83 | 0.793 | | |
| | ME-16-8 | 0.79 | 0.821 | 0.78 | 0.823 | 0.803 | 0.82 | 0.850 | 0.82 | 0.793 | 0.811 | 0.781 | 0.803 | 0.807 | 0.82 | 0.796 | | |
| | ME-16-9 | 0.79 | 0.822 | 0.78 | 0.825 | 0.807 | 0.82 | 0.850 | 0.82 | 0.778 | 0.819 | 0.791 | 0.781 | 0.800 | 0.82 | 0.784 | | |
| | ME-16-10 0.79 | 0.835 | 0.79 | 0.829 | 0.802 | 0.82 | 0.850 | 0.81 | 0.760 | 0.810 | 0.831 | 0.784 | 0.792 | 0.81 | 0.791 | | |
| | Mean | 0.788 | 0.822 | 0.793 | 0.829 | 0.802 | 0.823 | 0.856 | 0.807 | 0.764 | 0.810 | 0.844 | 0.785 | 0.804 | 0.814 | 0.791 | | |
| | Std. Devn. | 0.0092 | 0.0088 | 0.0106 | 0.0090 | 0.0021 | 0.0067 0.0097 0.0170 0.0300 0.0076 0.0459 0.0173 0.0082 0.0084 0.0055 | | |
| | % RSD | 1.17 | 1.07 | 1.34 | 1.08 | 0.26 | 0.82 | 1.13 | 2.11 | 3.93 | 0.93 | 5.44 | 2.20 | 1.03 | 1.04 | 0.69 | | |
Note: Pb data from Laboratory 9 was removed for failing the "t" test.
REFERENCE MATERIAL CDN-ME-16
Participating Laboratories:
(not in same order as listed in table of results)
Acme Analytical Laboratories Ltd., Vancouver
Actlabs-Ancaster, Ontario, Canada
Actlabs-Thunder Bay, Ontario, Canada
AGAT Laboratories, Ontario, Canada
AHK Geochem, Alaska, USA
ALS Chemex Laboratories, North Vancouver
Genalysis Laboratory, Australia
Inspectorate, Richmond, B.C. Canada
Omac Laboratories Ltd., Ireland
Skyline Assayers and Laboratories, Arizona, USA
SGS - Vancouver, B.C., Canada
Stewart Group, Kamloops, B.C., Canada
Alex Stewart Argentina SA
TSL Laboratories Ltd., Saskatoon
Ultra Trace Analytical Laboratories, Australia
Legal Notice:
This certificate and the reference material described in it have been prepared with due care and attention. However CDN Resource Laboratories Ltd. or Barry Smee accept no liability for any decisions or actions taken following the use of the reference material. Our liability is limited solely to the cost of the reference material.
Certified by /s/ Duncan Sanderson
Duncan Sanderson, Certified Assayer of B.C.
Geochemist /s/ Barry Smee
Dr. Barry Smee, Ph.D., P. Geo.
CDN Resource Laboratories Ltd.
#2, 20148 - 102nd Avenue, Langley, B.C., Canada, V1M 4B4, Ph: 604-882-8422 Fax: 604-882-8466
(www.cdnlabs.com) |
| ORE REFERENCE STANDARD: CDN-W-4 |
| |
| Recommended values and the "Between Lab" Two Standard Deviations |
| |
| Gold ± 0.040 g/t ("provisional value, RSD = 6.4%) |
| Copper 0.139 ± 0.008 % |
| Molybdenum0.110 ± 0.008 % |
| Tungsten ± 0.024 % |
| ** Note: | | | | |
Standards with an RSD of near or less than 5 % are certified, RSD's of between 5 % and 15 % are Provisional, and RSD's over 15 % are Indicated. Provisional and Indicated values cannot be used to monitor accuracy with a high degree of certainty.
| PREPARED BY: CDN Resource Laboratories Ltd. |
| CERTIFIED BY: Duncan Sanderson, B.Sc., Licensed Assayer of British Columbia |
INDEPENDENT GEOCHEMIST: Dr. Barry Smee., Ph.D., P. Geo.
DATE OF CERTIFICATION: February 15, 2008
METHOD OF PREPARATION:
Reject ore material was dried, crushed, pulverized and then passed through a 200 mesh screen. The +200 material was discarded. The -200 material was mixed for 5 days in a double-cone blender. Splits were taken and sent to twelve laboratories for round robin assaying.
ORIGIN OF REFERENCE MATERIAL:
The tungsten ore was supplied from underground workings at North America Tungsten's Cantung mine in the NWT. It is high sulphide consisting primarily of pyrite containing chalcopyrite. Native gold and bismuth are associated with the chalcopyrite. The tungsten occurs as scheelite. 155 kg of this ore was combined with various Cu / Mo / Au ores to make 800 kg of standard CDN-W4
Approximate chemical composition is as follows:
| | Percent | | Percent |
| SiO2 | 56.2 | MgO | 2.3 |
| Al2O3 | 12.7 | K2O | 2.4 |
| Fe2O3 | 13.7 | TiO2 | 0.5 |
| CaO | 3.8 | LOI | 4.5 |
| Na2O | 2.0 | S | 0.3 |
Statistical Procedures:
The final limits were calculated after first determining if all data was compatible within a spread normally expected for similar analytical methods done by reputable laboratories. Data from any one laboratory was removed from further calculations when the mean of all analyses from that laboratory failed a t test of the global means of the other laboratories. The means and standard deviations were calculated using all remaining data. Any analysis that fell outside of the mean ±2 standard deviations was removed from the ensuing data base. The mean and standard deviations were again calculated using the remaining data. This method is different from that used by Government agencies in that the actual "between- laboratory" standard deviation is used in the calculations. This produces upper and lower limits that reflect actual individual analyses rather than a grouped set of analyses. The limits can therefore be used to monitor accuracy from individual analyses, unlike the Confidence Limits published on other standards.
| STANDARD REFERENCE MATERIAL | CDN-W-4 | | | | | | | |
| |
| Results from round-robin assaying: | | | | | | | | | | | | |
| Assay Procedures: | | | | | | | | | | | | | | |
| |
| | Au: | Fire assay pre-concentration, AA or ICP finish (30g sub-sample). | | | | | | |
| | Cu, Mo: | 4-acid digestion, AA or ICP finish. | | | | | | | | | | | |
| | W: | variety of methods: fusion/XRF, pressed pellet/XRF, 4-acid/AA or ICP | | | | | |
| |
| |
| | | Lab 1 | Lab 2 | Lab 3 | Lab 4 | Lab 5 | | Lab 6 | Lab 7 | Lab 8 | Lab 9 | Lab 10 | Lab 11 | Lab 12 | | |
| |
| | | Au g/t | Au g/t | Au g/t | Au g/t | Au g/t | | Au g/t | Au g/t | Au g/t | Au g/t | Au g/t | Au g/t | Au g/t | | |
| |
| | CDN-W4-1 | 0.339 | 0.311 | 0.343 | 0.339 | 0.314 | 0.30 | 0.328 | 0.308 | 0.324 | 0.305 | 0.399 | 0.317 | | |
| | CDN-W4-2 | 0.302 | 0.297 | 0.294 | 0.341 | 0.317 | 0.30 | 0.326 | 0.307 | 0.313 | 0.310 | 0.326 | 0.325 | | |
| | CDN-W4-3 | 0.356 | 0.307 | 0.290 | 0.333 | 0.330 | 0.36 | 0.304 | 0.306 | 0.355 | 0.315 | 0.323 | 0.322 | | |
| | CDN-W4-4 | 0.347 | 0.332 | 0.297 | 0.341 | 0.337 | 0.31 | 0.356 | 0.289 | 0.335 | 0.280 | 0.295 | 0.325 | | |
| | CDN-W4-5 | 0.325 | 0.319 | 0.299 | 0.285 | 0.327 | 0.33 | 0.303 | 0.296 | 0.335 | 0.283 | 0.329 | 0.330 | | |
| | CDN-W4-6 | 0.304 | 0.297 | 0.301 | 0.348 | 0.314 | 0.27 | 0.322 | 0.288 | 0.319 | 0.304 | 0.357 | 0.393 | | |
| | CDN-W4-7 | 0.330 | 0.334 | 0.333 | 0.315 | 0.326 | 0.32 | 0.340 | 0.315 | 0.380 | 0.304 | 0.326 | 0.305 | | |
| | CDN-W4-8 | 0.307 | 0.306 | 0.296 | 0.359 | 0.324 | 0.34 | 0.315 | 0.344 | 0.346 | 0.326 | 0.347 | 0.322 | | |
| | CDN-W4-9 | 0.311 | 0.297 | 0.322 | 0.325 | 0.326 | 0.34 | 0.325 | 0.301 | 0.303 | 0.308 | 0.288 | 0.308 | | |
| | CDN-W4-10 | 0.302 | 0.297 | 0.289 | 0.363 | 0.334 | 0.31 | 0.315 | 0.293 | 0.312 | 0.291 | 0.331 | 0.320 | | |
| |
| | Mean | 0.322 | 0.310 | 0.306 | 0.335 | 0.325 | 0.318 | 0.323 | 0.305 | 0.332 | 0.303 | 0.332 | 0.327 | | |
| | Std. Devn. | 0.0200 | 0.0143 | 0.0191 | 0.0227 | 0.0080 | 0.0257 | 0.0160 | 0.0164 | 0.0233 | 0.0142 | 0.0313 | 0.0245 | | |
| | % RSD | 6.22 | 4.62 | 6.25 | 6.77 | 2.45 | 8.09 | 4.95 | 5.38 | 7.01 | 4.71 | 9.42 | 7.51 | | |
| |
| | | Cu % Cu % Cu % Cu % | Cu % | Cu % | Cu % | Cu % | Cu % | Cu % Cu % Cu % | | |
| |
| | CDN-W4-1 | 0.136 | 0.144 | 0.139 | 0.126 | 0.144 | 0.139 | 0.141 | 0.134 | 0.139 | 0.144 | 0.136 | 0.137 | | |
| | CDN-W4-2 | 0.136 | 0.146 | 0.139 | 0.126 | 0.143 | 0.138 | 0.141 | 0.133 | 0.138 | 0.143 | 0.140 | 0.135 | | |
| | CDN-W4-3 | 0.135 | 0.144 | 0.135 | 0.122 | 0.142 | 0.139 | 0.141 | 0.133 | 0.138 | 0.143 | 0.138 | 0.133 | | |
| | CDN-W4-4 | 0.137 | 0.144 | 0.135 | 0.127 | 0.145 | 0.139 | 0.141 | 0.132 | 0.139 | 0.142 | 0.134 | 0.136 | | |
| | CDN-W4-5 | 0.132 | 0.144 | 0.139 | 0.134 | 0.143 | 0.140 | 0.141 | 0.132 | 0.137 | 0.142 | 0.143 | 0.135 | | |
| | CDN-W4-6 | 0.138 | 0.143 | 0.136 | 0.120 | 0.143 | 0.137 | 0.141 | 0.132 | 0.140 | 0.143 | 0.132 | 0.134 | | |
| | CDN-W4-7 | 0.136 | 0.139 | 0.138 | 0.117 | 0.144 | 0.139 | 0.142 | 0.133 | 0.140 | 0.143 | 0.145 | 0.140 | | |
| | CDN-W4-8 | 0.135 | 0.142 | 0.137 | 0.121 | 0.145 | 0.138 | 0.141 | 0.133 | 0.138 | 0.142 | 0.128 | 0.142 | | |
| | CDN-W4-9 | 0.137 | 0.140 | 0.139 | 0.117 | 0.143 | 0.139 | 0.142 | 0.133 | 0.139 | 0.144 | 0.143 | 0.141 | | |
| | CDN-W4-10 | 0.145 | 0.144 | 0.136 | 0.120 | 0.145 | 0.140 | 0.141 | 0.133 | 0.138 | 0.143 | 0.130 | 0.144 | | |
| | Mean | 0.137 | 0.143 | 0.137 | 0.123 | 0.144 | 0.139 | 0.141 | 0.133 | 0.139 | 0.143 | 0.137 | 0.138 | | |
| | Std. Devn. | 0.0033 | 0.0021 | 0.0017 | 0.0053 | 0.0011 | 0.0009 | 0.0004 | 0.0006 | 0.0010 | 0.0007 | 0.0059 | 0.0038 | | |
| | % RSD | 2.44 | 1.47 | 1.24 | 4.28 | 0.74 | 0.66 | 0.30 | 0.48 | 0.70 | 0.52 | 4.29 | 2.74 | | |
Note: 1. "Cu" data from laboratory 4 was excluded from the calculations for failing the "t" test
STANDARD REFERENCE MATERIAL CDN-W-4
| | | | Lab 1 | Lab 2 | Lab 3 | Lab 4 | Lab 5 | Lab 6 | Lab 7 | Lab 8 | Lab 9 | Lab 10 | Lab 11 | Lab 12 | | |
| |
| | | | Mo % | Mo % | Mo % Mo % Mo % | Mo % Mo % Mo % | Mo % Mo % Mo % Mo % | | |
| |
| | | CDN-W4-1 | 0.109 | 0.109 | 0.104 | 0.108 | 0.115 | 0.106 | 0.115 | 0.108 | 0.105 | 0.120 | 0.112 | 0.111 | | | |
| | | CDN-W4-2 | 0.110 | 0.111 | 0.105 | 0.114 | 0.114 | 0.105 | 0.115 | 0.108 | 0.103 | 0.119 | 0.114 | 0.111 | | | |
| | | CDN-W4-3 | 0.111 | 0.109 | 0.110 | 0.111 | 0.113 | 0.108 | 0.115 | 0.109 | 0.104 | 0.121 | 0.117 | 0.113 | | | |
| | | CDN-W4-4 | 0.109 | 0.110 | 0.107 | 0.108 | 0.114 | 0.106 | 0.115 | 0.107 | 0.102 | 0.119 | 0.114 | 0.114 | | | |
| | | CDN-W4-5 | 0.110 | 0.112 | 0.108 | 0.107 | 0.115 | 0.105 | 0.115 | 0.108 | 0.101 | 0.119 | 0.117 | 0.113 | | | |
| | | CDN-W4-6 | 0.107 | 0.111 | 0.103 | 0.109 | 0.113 | 0.106 | 0.117 | 0.107 | 0.103 | 0.118 | 0.116 | 0.115 | | | |
| | | CDN-W4-7 | 0.110 | 0.109 | 0.109 | 0.107 | 0.113 | 0.107 | 0.118 | 0.108 | 0.107 | 0.121 | 0.118 | 0.115 | | | |
| | | CDN-W4-8 | 0.111 | 0.108 | 0.108 | 0.113 | 0.116 | 0.107 | 0.117 | 0.106 | 0.104 | 0.119 | 0.114 | 0.111 | | | |
| | | CDN-W4-9 | 0.111 | 0.110 | 0.102 | 0.111 | 0.113 | 0.107 | 0.117 | 0.108 | 0.105 | 0.120 | 0.120 | 0.112 | | | |
| | | CDN-W4-10 0.112 | 0.114 | 0.106 | 0.108 | 0.113 | 0.108 | 0.117 | 0.108 | 0.103 | 0.118 | 0.119 | 0.116 | | | |
| | | Mean | 0.110 | 0.110 | 0.106 | 0.110 | 0.114 | 0.107 | 0.116 | 0.108 | 0.104 | 0.119 | 0.116 | 0.113 | | | |
| | | Std. Devn. | 0.0014 | 0.0018 | 0.0027 | 0.0025 | 0.0011 | 0.0011 | 0.0012 | 0.0008 | 0.0017 | 0.0011 | 0.0026 | 0.0019 | | | |
| | | % RSD | 1.29 | 1.60 | 2.50 | 2.28 | 0.97 | 1.01 | 1.03 | 0.76 | 1.64 | 0.90 | 2.20 | 1.64 | | | |
| |
| | | | W % W % W % W % W % W % W % W % W % W % W % W % | | |
| |
| | | CDN-W4-1 | 0.373 | 0.34 | 0.369 | 0.365 | 0.289 | 0.353 | 0.364 | 0.392 | | 0.362 | 0.375 | 0.368 | | | |
| | | CDN-W4-2 | 0.375 | 0.34 | 0.370 | 0.363 | 0.300 | 0.354 | 0.364 | 0.403 | | 0.361 | 0.355 | 0.368 | | | |
| | | CDN-W4-3 | 0.375 | 0.35 | 0.368 | 0.358 | 0.262 | 0.359 | 0.370 | 0.385 | | 0.356 | 0.369 | 0.368 | | | |
| | | CDN-W4-4 | 0.369 | 0.34 | 0.382 | 0.365 | 0.231 | 0.360 | 0.365 | 0.396 | | 0.365 | 0.386 | 0.369 | | | |
| | | CDN-W4-5 | 0.376 | 0.35 | 0.367 | 0.366 | 0.281 | 0.350 | 0.373 | 0.377 | | 0.362 | 0.369 | 0.368 | | | |
| | | CDN-W4-6 | 0.372 | 0.34 | 0.403 | 0.372 | 0.284 | 0.346 | 0.366 | 0.391 | | 0.356 | 0.371 | 0.366 | | | |
| | | CDN-W4-7 | 0.376 | 0.35 | 0.393 | 0.366 | 0.260 | 0.345 | 0.365 | 0.378 | | 0.362 | 0.359 | 0.367 | | | |
| | | CDN-W4-8 | 0.381 | 0.35 | 0.395 | 0.359 | 0.295 | 0.361 | 0.370 | 0.367 | | 0.365 | 0.362 | 0.362 | | | |
| | | CDN-W4-9 | 0.386 | 0.35 | 0.394 | 0.366 | 0.278 | 0.343 | 0.372 | 0.374 | | 0.365 | 0.363 | 0.368 | | | |
| | | CDN-W4-10 0.386 | 0.34 | 0.391 | 0.369 | 0.300 | 0.336 | 0.369 | 0.372 | | 0.361 | 0.351 | 0.366 | | | |
| | | Mean | 0.377 | 0.345 | 0.383 | 0.365 | 0.278 | 0.351 | 0.368 | 0.384 | | 0.362 | 0.366 | 0.367 | | | |
| | | Std. Devn. | 0.0057 | 0.0053 | 0.0136 | 0.0042 | 0.0215 | 0.0082 | 0.0034 | 0.0117 | | 0.0033 | 0.0102 | 0.0020 | | | |
| | | % RSD | 1.51 | 1.53 | 3.56 | 1.14 | 7.75 | 2.34 | 0.92 | 3.05 | | 0.92 | 2.80 | 0.54 | | | |
Note: 1. " Mo" data from laboratory 10 was excluded from the calculations for failing the "t" test
2. "W" data from laboratory 5 was excluded from the calculations for failing the "t" test
3. Lab 9 was unable to perform the"W" assays.
STANDARD REFERENCE MATERIAL CDN-W-4
Participating Laboratories:
(not in same order as listed in table of results)
Acme Analytical Laboratories Ltd., Vancouver
Assayers Canada Ltd., Vancouver
Actlabs, Ontario, Canada
Alex Stewart Argentina SA
ALS Chemex Laboratories, North Vancouver
Genalysis Laboratory Services Ltd., Perth
Labtium Laboratory, Finland
OMAC Laboratory Ltd., Ireland
Skyline Assayers and Laboratories, Arizona, USA
Teck Cominco - Global Discovery Laboratory, Vancouver
TSL Laboratories Ltd., Saskatoon
UltraTrace Laboratories, Perth, Australia
Legal Notice:
This certificate and the reference material described in it have been prepared with due care and attention. However CDN Resource Laboratories Ltd. or Barry Smee accept no liability for any decisions or actions taken following the use of the reference material. Our liability is limited solely to the cost of the reference material.
Certified by /s/ Duncan Sanderson
Duncan Sanderson, Certified Assayer of B.C.
Geochemist /s/ Barry Smee
Dr. Barry Smee, Ph.D., P. Geo.
LA JOYA, NI 43-101 TECHNICAL REPORT RELEASED : MARCH 27, 2013
APPENDIX C
METALLURGICAL INVESTIGATION, SUMMARY REPORTS
| | EBA Engineering Consultants Ltd. operating as EBA, A Tetra Tech Company |
| | Oceanic Plaza, 9th Floor, 1066 West Hastings Street |
| TECHNICAL MEMO | Vancouver, BC V6E 3X2 CANADA |
| | p. 604.685.0275 f. 604.684.6241 |
| |
| ISSUED FOR REVIEW | |
| | |
TO: | Ting Lu, WEI | DATE: | August 9, 2012 |
C: | SVL: Salvador Aguayo, Ramon Gomez, Rosy Fier WEI: Hassan Ghaffari | MEMO NO.: | V15101030.072712 |
| | EBA: Keith Prytherch | | |
FROM: | James Barr, EBA | EBA FILE: | 704-V15101030.007 |
| | | | |
SUBJECT: | Sample selection for the La Joya Phase II metallurgical test work program |
| 1.0 INTRODUCTION | |
As part of the Phase II exploration campaign on the La Joya property, SilverCrest Mines Inc. (SilverCrest) has asked Tetratech Wardrop (WEI) to develop a metallurgical test program for the development of a conceptual processing flow sheet for the Ag-Cu-Au enriched rocks found on the property. The testwork and the resulting design will conform to guidelines defined under National Instrument 43-101 (NI 43-101) and the Canadian Institute of Mining, Metallurgy and Petroleum (CIM).
Discussions between SilverCrest, WEI and EBA, A Tetratech Company (EBA) have concluded that the sample material shall consist of a representative mineralized drill core from rock types depicted as manto, structure and contact, as described below. Laboratory test work will be conducted at G&T Laboratories based in Kamloops, British Columbia, and will be managed by Ting Lu of WEI.
EBA has selected a suite of drill core samples and is presenting them herein to WEI for further communication to SilverCrest. Sample selection has been based on information available to date which includes a geological model for the Phase I program, complete drill logs and assay data for drill holes LJ- DD10-01 through LJ-DD11-26, and partial drill logs and assay information for drill holes LJ-DD11-27 through LJ-DD12-54. Samples that have been selected to be included in the composite materials have been reviewed using core photos graphs provided by SilverCrest for visual confirmation that the sample is representative. The aim here was to select a suite of samples representing manto, structure and contact material that exhibit representative weighted average grades similar to that of the original resource estimate reported early 2012 in the NI 43-101 Technical Report (Tables 1 &2). In general, the composite samples presented here for the manto and structural material have slightly higher weighted average grades than those of the resource estimate.
Table 1: NI 43:101 Technical Report Resource estimate (Feb.2012) values for Ag, Au, Cu and AgEQ
| | | Average | Average | Average | Average AgEQ |
| | | Ag (g/t) | Au (g/t) | Cu (%) | (g/t) |
| AgEQ Cut-off | 15 | 28 | 0.18 | 0.21 | 55.06 |
| Grade g/t | 30 | 39 | 0.22 | 0.30 | 75.80 |
La Joya MET Revised August 9th 2012.docx
LA JOYA PHASE II, METALLURGICAL SAMPLE SELECTION
EBA FILE: 704-V15101030.007 | AUGUST 9, 2012 | ISSUED FOR REVIEW
Table 2: NI 43:101 Technical Report Resource estimate (Feb. 2012) values for Tungsten
| | Average | Average |
| | W | WO3 |
| | (ppm) | (%) |
| 0.05% WO3 cut-off | 508 | 0.064 |
The samples are to be 1/4 cut, using a diamond impregnated rock saw, and assembled into three composite samples for the respective manto, structure and contact materials. A minimum mass of material required for the test work was 60kg. EBA has used the reported density of 3.0 g/cm3 from the recent Technical Report on the La Joya Property (Barr, February 2012) to estimate the approximate mass for the composite sample of 1/4 core. It is anticipated that the actual density of the materials will vary.
A total of 37.7 metres of drill core, with an estimated mass of 91kg, is proposed as a representative sample for the Manto rock type material. A summary of this composite sample is listed below in Table 3.
Table 3: Summary table for Manto composite sample
| | | | Weighted | Weighted | Weighted | Calculated |
| Rock Type | Total Length | Estimated | Average Ag | Average Cu | Average Au | Average |
| | (m) | Mass (kg) | Grade (g/t) | Grade (%) | Grade (g/t) | AgEQ (g/t) |
| Manto | 37.7 | 91 | 51 | 0.29 | 0.38 | 94.94 |
The samples for the manto material were selected using geological solids from the GEMS database which formed the basis for the 2012 La Joya Mineral Resource estimate. The samples were cross referenced with geological logs, geochemical data and with available core photos. Table 4, below, lists the individual samples which make up the composite sample and those which should be collected by SilverCrest from drill core remaining on site. Photos shown in Appendix A are of the actual core that is to be included in the composite sample. Core photos for hole LJ-DD12-42 were not available at the time of this memo.
2
La Joya MET Revised August 9th 2012.docx
| | | | | | | | | | LA JOYA PHASE II, METALLURGICAL SAMPLE SELECTION | |
| | | | | | | | | EBA FILE: 704-V15101030.007 | AUGUST 9, 2012 | ISSUED FOR REVIEW | |
| |
| |
| |
| | Table 4: Detailed list of the individual samples to be collected for the manto composite sample | | | | |
| |
| | | | From | | Length | SAMPLE | AG | AU | CU | PB | ZN | AS | W | SB | |
| | HOLE-ID | (m) | To (m) | (m) | # | (GPT) | (GPT) | (PCT) | (PPM) | (PPM) | (PPM) | (PPM) | (PPM) | |
| | LJ DD10-06 | 182.6 | 184.1 | 1.5 | 44674 | 16 | 0.03 | 0.07 | 7 | 271 | 232 | 10 | 55 | |
| | LJ DD10-06 | 184.1 | 186.1 | 2 | 44675 | 17.0 | 0.0 | 0.0 | 152.0 | 258.0 | 40.0 | 10.0 | 17.0 | |
| | LJ DD10-07 | 56.6 | 58.6 | 2 | 44708 | 24 | 0.12 | 0.32 | 13 | 33 | 92 | 10 | 827 | |
| | LJ DD11-08 | 204.15 | 206.15 | 2 | 44816 | 62.0 | 0.1 | 0.1 | 0.0 | 0.0 | 0.0 | 0.0 | 0.0 | |
| | LJ DD11-09 | 24 | 26 | 2 | 44839 | 56 | 0.5 | 0.52 | 10 | 24 | 80 | 10 | 0 | |
| | LJ DD11-10 | 36 | 38 | 2 | 44918 | 57.0 | 0.2 | 0.5 | 15.0 | 200.0 | 82.0 | 20.0 | 131.0 | |
| | LJ DD11-11 | 34.5 | 36 | 1.5 | 44983 | 152.0 | 0.0 | 0.8 | 28.0 | 83.0 | 102.0 | 10.0 | 34.0 | |
| | LJ DD11-13 | 11 | 13 | 2 | 286072 | 34 | 0.07 | 0.2 | 20 | 43 | 130 | 10 | 0 | |
| | LJ DD11-14 | 29 | 31 | 2 | 286105 | 136.0 | 0.2 | 1.2 | 20.0 | 50.0 | 187.0 | 10.0 | 104.0 | |
| | LJ DD11-16 | 60 | 63 | 3 | 286324 | 24.0 | 0.2 | 0.2 | 91.0 | | 146.0 | 58.0 | 0.0 | |
| | LJ DD11-17 | 111 | 113 | 2 | 286395 | 28.0 | 0.0 | 0.4 | 430.0 | 39.0 | 55.0 | 10.0 | 29.0 | |
| | LJ DD11-19 | 78 | 81 | 3 | 286494 | 62 | 0.23 | 0.32 | 52 | 361 | 64 | 20 | 0 | |
| | LJ DD11-20 | 91.5 | 93 | 1.5 | 286652 | 94.0 | 0.4 | 0.2 | 1020.0 | 1015.0 | 77.0 | 220.0 | 210.0 | |
| | LJ DD11-21 | 43.53 | 46.53 | 3 | 286846 | 20 | 0.02 | 0.21 | 4 | 145 | 189 | 10 | 0 | |
| | LJ DD11-22 | 74.6 | 75.2 | 0.6 | 286969 | 190.0 | 0.0 | 0.5 | 27.0 | 41.0 | 100.0 | 10.0 | 29.0 | |
| | LJ DD11-23 | 165.2 | 166 | 0.8 | 500107 | 94.0 | 0.1 | 0.9 | 17.0 | 270.0 | 109.0 | 40.0 | 40.0 | |
| | LJ DD11-24 | 157.2 | 158 | 0.8 | 500177 | 109.0 | 0.4 | 0.9 | 16.0 | 31.0 | 72.0 | 10.0 | 35.0 | |
| | LJ DD12-42* | 82 | 85 | 3 | 614017 | 12.8 | 2.4 | 0.1 | 5.0 | 56.0 | 55.0 | 10.0 | 97.0 | |
| | * Gold sample | | | | | | | | | | | | | |
| | 3.0 | STRUCTURE MATERIAL | | | | | | | | | |
A total of 35.91 metres of drill core, with an estimated mass of 86.6 kg, is proposed as a representative sample for the structure rock type material. A summary of this composite sample is listed below in Table 5.
Table 5: Summary table for Structure composite sample
| | | | Weighted | Weighted | Weighted | Calculated |
| Rock Type | Total Length | Estimated | Average Ag | Average Cu | Average Au | Average |
| | (m) | Mass (kg) | Grade (g/t) | Grade (%) | Grade (g/t) | AgEQ (g/t) |
| Structure | 35.91 | 86.6 | 66 | 0.47 | 0.17 | 114.92 |
The samples for the Structure material were selected using geological solids from the GEMS database which formed the basis for the 2012 La Joya Mineral Resource estimate. The samples were cross referenced with geological logs, geochemical data and with available core photos. Table 6, below, lists the individual samples which make up the composite sample and those which should be collected by SilverCrest from drill core remaining on site. Photos shown in Appendix B are of the actual core that is to be included in the composite sample. Note, core photos were not available for drill holes LJ DD11-42 and 43 at the time of this memo.
La Joya MET Revised August 9th 2012.docx
LA JOYA PHASE II, METALLURGICAL SAMPLE SELECTION
EBA FILE: 704-V15101030.007 | AUGUST 9, 2012 | ISSUED FOR REVIEW
Table 6: Detailed list of the individual samples to be collected for the Structure composite sample
| | From | To | Length | SAMPLE | AG | AU | CU | PB | ZN | AS | W | SB |
| HOLE-ID | (m) | (m) | (m) | # | (GPT) | (GPT) | (PCT) | (PPM) | (PPM) | (PPM) | (PPM) | (PPM) |
| LJ DD10-04 | 23.5 | 24.57 | 1.07 | 17335 | 42.0 | 0.1 | 0.7 | 1914.0 | 254.0 | 215.0 | 90.0 | 116.0 |
| |
| LJ DD10-05a | 167.16 | 170.16 | 3 | 17493 | 18.0 | 0.1 | 0.0 | 34.0 | 272.0 | 1550.0 | 70.0 | 113.0 |
| LJ DD10-06 | 63.6 | 65.1 | 1.5 | 44628 | 21.0 | 0.0 | 0.2 | 10.0 | 49.0 | 201.0 | 10.0 | 102.0 |
| LJ DD10-06 | 193.35 | 194.85 | 1.5 | 44679 | 42.0 | 0.1 | 0.0 | 1505.0 | 2390.0 | 5780.0 | 10.0 | 1540.0 |
| LJ DD10-06 | 194.85 | 196.85 | 2 | 44680 | 34.0 | 0.1 | 0.0 | 1810.0 | 2650.0 | 10000.0 | 20.0 | 659.0 |
| LJ DD10-07 | 80 | 82 | 2 | 44718 | 30.0 | 0.1 | 0.3 | 6.0 | 35.0 | 138.0 | 10.0 | 38.0 |
| LJ DD11-10 | 71 | 73.15 | 2.15 | 44934 | 22.0 | 0.0 | 0.3 | 7.0 | 70.0 | 1395.0 | 10.0 | 60.0 |
| LJ DD11-10 | 73.15 | 75.15 | 2 | 44935 | 152.0 | 0.1 | 1.1 | 13.0 | 66.0 | 89.0 | 30.0 | 13.0 |
| LJ DD11-13 | 24.5 | 26 | 1.5 | 286078 | 51.0 | 0.0 | 0.3 | 15.0 | 42.0 | 296.0 | 10.0 | 92.0 |
| LJ DD11-18 | 32.26 | 34 | 1.74 | 286558 | 23.0 | 0.1 | 0.2 | 15.0 | 29.0 | 25.0 | 10.0 | 20.0 |
| LJ DD11-19 | 72 | 74 | 2 | 286491 | 123.0 | 0.1 | 0.8 | 72.0 | 83.0 | 130.0 | 20.0 | 42.0 |
| LJ DD11-21** | 32.6 | 35.6 | 3 | 286839 | 12.0 | 0.8 | 0.1 | 13.0 | 21.0 | 54.0 | 10.0 | 32.0 |
| LJ DD11-21 | 78 | 80 | 2 | 286859 | 129.0 | 0.1 | 1.5 | 13.0 | 18.0 | 60.0 | 10.0 | 14.0 |
| LJ DD11-24 | 98.25 | 100.2 | 1.95 | 500157 | 142.0 | 0.2 | 0.4 | 3300.0 | 3040.0 | 3630.0 | 20.0 | 51.0 |
| LJ DD11-26** | 10 | 12 | 2 | 500321 | 219.0 | 0.2 | 2.1 | 90.0 | 4850.0 | 2820.0 | 40.0 | 55.0 |
| LJ DD11-26** | 12 | 14 | 2 | 500322 | 37.0 | 0.2 | 0.3 | 38.0 | 67.0 | 327.0 | 10.0 | 316.0 |
| LJ DD12-42 | 133.8 | 135.5 | 1.7 | 614035 | 53.3 | 0.3 | 0.2 | 1515.0 | 2340.0 | 2860.0 | 40.0 | 259.0 |
| LJ DD12-43 | 147 | 149.8 | 2.8 | 614122 | 52.3 | 0.1 | 0.3 | 16.0 | 44.0 | 241.0 | 30.0 | 198.0 |
** Samples may contain some Cu-oxide
A total of 49.55 meters of drill core, with an estimated mass of 119.55 kg, is proposed as a representative sample of contact rock material type. A summary of this composite is listed in Table 7, below.
Table 7: Summary table for Contact composite sample
| | | | | | | Weighted | Weighted | Weighted |
| Rock | Total | Estimated | Weighted | Weighted | Weighted | Average | Average | Average |
| Type | Length | Mass (kg) | Average Ag | Average Cu | Average Au | W Grade | Pb Grade | Zn Grade |
| | (m) | | Grade (g/t) | Grade (%) | Grade (g/t) | (ppm) | (ppm) | (ppm) |
| Contact | 49.55 | 119.55 | 3.76 | 0.077 | 0.10 | 461 | 31 | 154 |
The samples for the contact material were selected using geological solids from the GEMS database which formed the basis for the 2012 La Joya Mineral Resource estimate. The samples were cross referenced with geological logs, geochemical data. Table 8, below, lists the individual samples which make up the composite sample and those which should be collected by SilverCrest from drill core remaining on site. Core photos for samples from holes LJ-DD12-38, 39, and 43 are shown in Appendix C.
La Joya MET Revised August 9th 2012.docx
LA JOYA PHASE II, METALLURGICAL SAMPLE SELECTION
EBA FILE: 704-V15101030.007 | AUGUST 9, 2012 | ISSUED FOR REVIEW
Table 8: Detailed list of the individual samples to be collected for the Contact composite sample
| | From | | Length | SAMPLE | AG | AU | CU | PB | ZN | AS | W | SB |
| HOLE-ID | (m) | To (m) | (m) | # | (GPT) | (GPT) | (PCT) | (PPM) | (PPM) | (PPM) | (PPM) | (PPM) |
| |
| LJ DD12-39 | 175 | 177.1 | 2.1 | 613858 | 1 | 0 | 0.03 | 9 | 31 | 341 | 1070 | 2 |
| LJ DD12-39 | 177.1 | 179 | 1.9 | 613859 | 0.3 | 0 | 0.01 | 5 | 169 | 15 | 710 | 2 |
| LJ DD12-39 | 179 | 181 | 2 | 613860 | 0.3 | 0 | 0 | 10 | 162 | 11 | 810 | 5 |
| LJ DD12-39 | 181 | 183 | 2 | 613861 | 0.2 | 0.09 | 0 | 4 | 58 | 5 | 360 | 2 |
| LJ DD12-39 | 183 | 184.75 | 1.75 | 613862 | 0.3 | 0.1 | 0 | 7 | 72 | 4 | 270 | 3 |
| LJ DD12-39 | 184.75 | 187.65 | 2.9 | 613863 | 0.7 | 0 | 0.01 | 7 | 23 | 212 | 170 | 2 |
| LJ DD12-39 | 187.65 | 189 | 1.35 | 613864 | 11.2 | 0.07 | 0.01 | 468 | 606 | 494 | 920 | 91 |
| LJ DD12-39 | 189 | 190.5 | 1.5 | 613865 | 0.3 | 0 | 0 | 8 | 61 | 10 | 350 | 4 |
| LJ DD12-39 | 190.5 | 192 | 1.5 | 613866 | 1 | 0 | 0.01 | 12 | 25 | 155 | 160 | 9 |
| LJ DD12-39 | 192 | 193 | 1 | 613867 | 3.7 | 0.04 | 0.08 | 9 | 339 | 1105 | 600 | 3 |
| LJ DD12-38 | 226.5 | 227.2 | 0.7 | 613792 | 6.7 | 0.06 | 0.21 | 7 | 153 | 385 | 710 | 6 |
| LJ DD12-38 | 227.2 | 228.8 | 1.6 | 613793 | 0.5 | 0.03 | 0.01 | 8 | 28 | 74 | 310 | 2 |
| LJ DD12-38 | 228.8 | 230 | 1.2 | 613794 | 1.3 | 0.12 | 0.02 | 13 | 75 | 492 | 730 | 12 |
| LJ DD12-38 | 237.8 | 238.8 | 1 | 613800 | 2.9 | 0.16 | 0.09 | 6 | 69 | 515 | 1430 | 2 |
| LJ DD12-38 | 238.8 | 242 | 3.2 | 613801 | 3.3 | 0.03 | 0.01 | 90 | 58 | 170 | 220 | 16 |
| LJ DD12-43 | 204.1 | 206 | 1.9 | 614145 | 0.7 | 0.01 | 0 | 10 | 144 | 249 | 130 | 7 |
| LJ DD12-43 | 206 | 208 | 2 | 614146 | 1.3 | 0.12 | 0 | 9 | 228 | 287 | 90 | 25 |
| LJ DD12-43 | 218 | 219.5 | 1.5 | 614152 | 1.5 | 0 | 0 | 45 | 158 | 39 | 240 | 9 |
| LJ DD12-43 | 219.5 | 221.95 | 2.45 | 614153 | 1.4 | 0 | 0.01 | 97 | 304 | 99 | 310 | 97 |
| LJ DD12-53 | 184 | 186 | 2 | 883888 | 24.5 | 0.52 | 0.54 | 12 | 251 | 150 | 270 | 3 |
| LJ DD12-53 | 186 | 188 | 2 | 883889 | 21.6 | 0.36 | 0.41 | 8 | 175 | 30 | 440 | 4 |
| LJ DD12-53 | 198 | 200 | 2 | 883895 | 2.8 | 0.19 | 0.06 | 8 | 71 | 43 | 260 | 2 |
| LJ DD12-53 | 200 | 202 | 2 | 883896 | 1.9 | 0.19 | 0.07 | 3 | 81 | 8 | 390 | 2 |
| LJ DD12-53 | 202 | 204 | 2 | 883897 | 2.3 | 0.07 | 0.1 | 4 | 193 | 41 | 460 | 2 |
| LJ DD12-53 | 204 | 206 | 2 | 883898 | 2.5 | 0.1 | 0.11 | 2 | 234 | 31 | 960 | 5 |
| LJ DD12-53 | 206 | 208 | 2 | 883899 | 7.1 | 0.26 | 0.25 | 4 | 336 | 46 | 630 | 2 |
| LJ DD12-53 | 208 | 210 | 2 | 883900 | 2 | 0.18 | 0.08 | 2 | 211 | 26 | 490 | 2 |
5.0 | RECOMMENDED SAMPLING METHODOLOGY | | | | | | | | |
The samples listed above are to be collected by qualified SilverCrest personnel. The sample number should be located within the archived core boxes and the core should be clearly marked along the axis of the 'half core' to delineate a line where the core will be cut into the quarter core samples. One of the cut quarter core samples should be placed in a plastic sampling bag and the remaining quarter core should be left in
La Joya MET Revised August 9th 2012.docx
LA JOYA PHASE II, METALLURGICAL SAMPLE SELECTION
EBA FILE: 704-V15101030.007 | AUGUST 9, 2012 | ISSUED FOR REVIEW
the core box along with a marker indicating that a metallurgical sample was extracted from this location. All core should be 1/4 cut using a diamond impregnated rock saw (Figure 1).
One sample bag (rice bag) should be prepared for each of the sample material types (i.e. Manto and Structure) consisting of each of the individually selected samples from Tables 4, 6 and 8, as shown in Figure 2.
Upon completion of the sample collection, the rice bags should be securely sealed and shipped directly to G&T laboratories.
Figure 2: Example of sample bag collection and distribution
6
La Joya MET Revised August 9th 2012.docx
LA JOYA PHASE II, METALLURGICAL SAMPLE SELECTION
EBA FILE: 704-V15101030.007 | AUGUST 9, 2012 | ISSUED FOR REVIEW
It is strongly recommended that the SilverCrest personnel responsible for the sample collection take notes and photographs for the procedure. Items which are of interest for record keeping include:
| · | the date and personnel involved with the sample collection, |
| · | the condition of the core when sampled, |
| · | whether the full length of the 1/4 core sample was extracted from the archived core, |
| · | Any surficial weathering (i.e. malachite/chrysocolla staining, surficial Fe-Ox staining, etc.), |
| · | Other notes of interest. |
| 7.0 | LIMITATIONS OF REPORT |
This report and its contents are intended for the sole use of SilverCrest Mines Inc., Tetratech Wardrop and their agents. EBA Engineering Consultants Ltd. does not accept any responsibility for the accuracy of any of the data, the analysis, or the recommendations contained or referenced in the report when the report is used or relied upon by any Party other than SilverCrest Mines Inc. or Tetratech Wardrop, or for any Project other than the proposed development at the subject site. Any such unauthorized use of this report is at the sole risk of the user. Use of this report is subject to the terms and conditions stated in EBA's Services Agreement.
| Sincerely, | |
| |
| James Barr, P.Geo | Keith Prytherch |
| Geologist | Junior Geologist |
| EBA, A Tetratech Company | EBA, A Tetratech Company |
La Joya MET Revised August 9th 2012.docx
LA JOYA PHASE II, METALLURGICAL SAMPLE SELECTION
EBA FILE: 704-V15101030.007 | AUGUST 9, 2012 | ISSUED FOR REVIEW
APPENDIX A
PHOTOGRAPHS OF MANTO MATERIAL SAMPLE SELECTION
| Appendix A | Manto Material Sample Selection |
Figure 1: LJDD-10-06 (SAMPLE: 44674 & 44675) INTERVAL 182.6 to 186.1 m
| Appendix A | Manto Material Sample Selection |
Figure 2: LJDD-10-07 (SAMPLE: 44708) INTERVAL 56.6 TO 58.6 m
Figure 3: LJDD-11-08 (SAMPLE: 44816) INTERVAL 204.15 to 206.15 m
| Appendix A | Manto Material Sample Selection |
Figure 4: LJ DD-11-09 (SAMPLE 44839) INTERVAL 24 to 26
Figure 5: LJDD-11-10 (SAMPLE 44918) INTERVAL 36 to 38 m
Figure 6: LJDD-11-11 (SAMPLE: 44983) INTERVAL 34.5 to 36 m
| Appendix A | Manto Material Sample Selection |
Figure 7: LJ DD-11-13 (SAMPLE 286072) INTERVAL 11 to 13 m
Figure 8: LJDD-11-14 (SAMPLE: 286105 & 286106) INTERVAL 29 to 33 m
| Appendix A | Manto Material Sample Selection |
Figure 9: LJDD-11-16 (SAMPLE: 286324) INTERVAL 60 to 63 m
Figure 10: LJDD-11-17 (SAMPLE: 286395 & 286396) INTERVAL 111 to 115 m
| Appendix A | Manto Material Sample Selection |
Figure 11:LJ DD-11-19 (SAMPLE 286494) INTERVAL 78 to 81 m
| Appendix A | Manto Material Sample Selection |
Figure 12: LJDD-11-20 (SAMPLE: 286652) INTERVAL 91.5 to 93 m
| Appendix A | Manto Material Sample Selection |
Figure 13: LJDD-11-21 (SAMPLE: 286846) INTERVAL 43.53 to 46.53 m
| Appendix A | Manto Material Sample Selection |
Figure 14: LJDD-11-22 (SAMPLE: 286969) INTERVAL 74.6 to 75.2 m
Figure 15: LJDD-11-23 (SAMPLE: 500107) INTERVAL 165.2 to 166 m
Figure 16: LJDD-11-24 (SAMPLE: 500177) INTERVAL 157.2 to 158 m
LA JOYA PHASE II, METALLURGICAL SAMPLE SELECTION
EBA FILE: 704-V15101030.007 | AUGUST 9, 2012 | ISSUED FOR REVIEW
APPENDIX B
PHOTOGRAPHS OF STRUCTURE MATERIAL SAMPLE SELECTION
| Appendix B | Structure Material Sample Selection |
Figure 1: LJDD-10-04 (SAMPLE: 17335) INTERVAL 23.5 to 24.57 m
Figure 2: LJDD-10-05A (SAMPLE: 17493) INTERVAL 167.16 to 170.16 m
| Appendix B | Structure Material Sample Selection |
Figure 3: LJDD-10-06 (SAMPLE: 44628) INTERVAL 63.6 to 65.1 m
| Appendix B | �� Structure Material Sample Selection |
Figure 4: LJDD-10-06 (SAMPLE: 44679 & 44680) INTERVAL 193.35 to 196.85 m
| Appendix B | Structure Material Sample Selection |
Figure 5: LJDD-10-07 (SAMPLE: 44718) INTERVAL 80 to 82
Figure 6: LJDD-11-10 (SAMPLE: 44934) INTERVAL 71 to 75.15 m
Figure 7: LJDD-11-13 (SAMPLE: 286078) INTERVAL 24.4 to 26 m
Figure 8: LJDD-11-18 (SAMPLE: 286558) INTERVAL 32.26 to 34 m
Figure 9: LJDD-11-19 (SAMPLE: 286491) INTERVAL 72 to 74 m
| Appendix B | Structure Material Sample Selection |
Figure 10: LJDD-21 (SAMPLE: 286839) INTERVAL 32.6 to 35.6 m
| Appendix B | Structure Material Sample Selection |
Figure 11: LJDD-11-21 (SAMPLE: 286859) INTERVAL 78 to 80 m
| Appendix B | Structure Material Sample Selection |
Figure 12: LJDD-11-24 (SAMPLE: 500157) INTERVAL 98.25 to 100.2 m
LA JOYA PHASE II, METALLURGICAL SAMPLE SELECTION
EBA FILE: 704-V15101030.007 | AUGUST 9, 2012 | ISSUED FOR REVIEW
APPENDIX C
PHOTOGRAPHS OF CONTACT MATERIAL SAMPLE SELECTION
| Appendix C | Contact Material Sample Selection |
Figure 1: LJ DD-12-38 (SAMPLES 613792, 613793 & 613794) INTERVAL 225.35 to 232.15 m
Figure 2: LJ DD-12-38 (SAMPLES 613800) INTERVAL 232.15 to 238.95 m
Figure 3: LJ DD-12-39 (SAMPLE 613801) INTERVAL 238.95 to 245.55
Figure 4: LJ DD-12-43 (SAMPLES 614146) INTERVAL 207.40 to 214.05 m
Figure 5: LJ DD-12-43 (SAMPLES 614152 & 614153) INTERVAL 214.05 to 221.15 m
Figure 6: Figure 7: LJ DD-12-43 (SAMPLES 614152 & 614153) INTERVAL 221.15 to 228.20
LA JOYA, NI 43-101 TECHNICAL REPORT
RELEASED MARCH 27, 2013
DATE AND SIGNATURE PAGE
I, P. James F. Barr, do hereby declare that:
| 1) | I currently reside in Vancouver, British Columbia, Canada, and am currently employed as a geologist by EBA, Engineering Consultants Ltd., My office address is 9th floor, 1066 W Hastings Street, Vancouver, British Columbia. |
| 2) | I hold a Bachelors of Science with Honours from the University of Waterloo (2003), Ontario, Canada, with a major in Environmental Science, Earth Science and Chemistry and I have practiced as an exploration and resource geologist in Canada and Mexico since 2003. |
| 3) | I am a member in good standing in the Association of Professional Engineers and Geoscientists of British Columbia (APEGBC), member 35150. |
| 4) | I am the principal author and Qualified Person responsible for the preparation of the Technical Report entitled: |
UPDATED RESOURCE ESTIMATE FOR THE LA JOYA PROPERTY
DURANGO, MEXICO
NI 43-101 TECHNICAL REPORT
PREPARED FOR SILVERCREST MINES INC
March 27th, 2013
Effective Date: December 16th, 2012
| 5) | I am responsible for all sections of this Technical Report, with the exception of Section 13. |
| 6) | As a Qualified Person for this report, I have read the National Instrument 43-101 and Companion Policy and confirm that this report has been prepared in compliance to National Instrument 43-101. |
| 7) | I have visited the La Joya property on seven separate occasions during the periods from November 23-26, 2010, Feb 4-6,2011, May 6-7 and 13-17, 2011, June 19-20, 2011, Sept 25-Oct4, 2011, May 8th, 2012 and October 18th, 2012. |
| 8) | I have visited numerous skarn and geologically related properties in Mexico, including an underground mine tour of Peñoles’ Mina Sabinas located in the State of Zacatecas on June 18th, 2011, and again on May 9th, 2012. |
| 9) | I am independent of SilverCrest Mines Inc. as independence is described in Section 1.5 of the National Instrument 43-101. In addition, I am currently not a shareholder of SilverCrest nor am I directly entitled to financially benefit from its success. |
| 10) | Prior to this report, I was the principal author of the February 20th, 2012, Technical Report titled “Resource Estimate for the La Joya Property, Durango, Mexico, NI 43-101 Technical Report, Prepared for SilverCrest Mines Inc.”, with Effective Date January 5th, 2012. |
| 11) | To the best of my knowledge, information and belief, as of the Effective Date of the report, the Technical Report contains all scientific and technical information that is required to be disclosed to make the Technical Report not mis-leading. |
Dated this 27th day of March. 2013
[original signed and sealed]
________________________________
P. James F. Barr, P.Geo
Senior Geologist
EBA Engineering Consultants Ltd.
LA JOYA, NI 43-101 TECHNICAL REPORT
RELEASED MARCH 27, 2013
DATE AND SIGNATURE PAGE
I, Ting Lu, do hereby declare that:
| 1) | I currently reside in Vancouver, British Columbia, Canada, and am currently employed as a Professional Engineer by Wardrop Engineering, A Tetra Tech Company, located at 800-555 West Hastings Street in Vancouver, British Columbia, Canada. |
| 2) | I hold a Master of Engineering degree from Queen’s University, Ontario, Canada, with a major in mineral processing. My relevant experience includes 15 years of experience in the mineral processing industry. |
| 3) | I am a member in good standing in the Association of Professional Engineers and Geoscientists of British Columbia (APEGBC), registration # 32897. |
| 4) | I am a Qualified Person (within the meaning of National Instrument 43-101) responsible for the preparation of Section 13 of the Technical Report entitled: |
UPDATED RESOURCE ESTIMATE FOR THE LA JOYA PROPERTY
DURANGO, MEXICO
NI 43-101 TECHNICAL REPORT
PREPARED FOR SILVERCREST MINES INC.
March 27th, 2013
Effective Date: December 16th, 2012
| 5) | As a Qualified Person for this report, I have read National Instrument 43-101 and Companion Policy and can confirm that this report has been prepared in compliance to National Instrument 43-101. |
| 6) | I have not visited the La Joya property. |
| 7) | I am independent of SilverCrest Mines as independence is described in Section 1.5 of the National Instrument 43-101. In addition I am currently not a shareholder of SilverCrest nor am I directly entitled to financially benefit from its success. |
| 8) | Prior to this report, I was a co-author of the February 20th, 2012, Technical Report titled “Resource Estimate for the La Joya Property, Durango, Mexico, NI 43-101 Technical Report, Prepared for SilverCrest Mines Inc.”, with Effective Date January 5th, 2012. |
| 9) | To the best of my knowledge, information and belief, as of the effective date of the Technical Report, the portion of the Technical Report for which I am responsible contains all scientific and technical information that is required to be disclosed to make the Technical Report not misleading. |
Dated this 27th of March, 2013,
[original signed and sealed]
________________________________
Ting Lu, M.Sc., P.Eng.
Senior Metallurgical Engineer
Mining and Minerals
Tetra Tech Inc.
QUALIFIED PERSONS’ CONSENTS UNDER NI 43-101
FILED BY SEDAR
British Columbia Securities Commission
Alberta Securities Commission
Saskatchewan Financial Services Commission
Manitoba Securities Commission
Ontario Securities Commission
New Brunswick Securities Commission
Nova Scotia Securities Commission
Prince Edward Island Securities Office
Securities Commission of Newfoundland and Labrador
Re: SilverCrest Mines Inc. (the “Company”)
Reference is made to the Company’s news release dated January 29th, 2013 (the “News Release”).
Further reference is made to the technical report dated effective December 16th, 2012, titled “Updated Resource Estimate for the La Joya Property, Durango, Mexico, NI 43-101 Technical Report, Prepared for SilverCrest Mines Inc.” (the “Technical Report”) which has been prepared by the undersigned.
Each of the undersigned hereby consents to the public filing of the Technical Report and to the use of extracts from, or a summary of, the Technical Report in the News Release.
Each of the undersigned hereby confirms that he or she has read the News Release and that it fairly and accurately represents the information in the Technical Report that supports the News Release.
Dated: March 27, 2013
“P. James F. Barr” [sealed] P. James F. Barr, P.Geo. Senior Geologist Mining Group EBA Engineering Consultants Ltd. | “Ting Lu” [sealed] Ting Lu, P.Eng, M.Sc. Senior Metallurgical Engineer Mining and Minerals Tetra Tech Inc. |
LA JOYA, NI 43-101
TECHNICAL
REPORT RELEASED : March 27, 2013
Estimated costs for proposed work programs on the La Joya property are presented in Table 88 as Phase III.
Table 88: Recommended Phase III Work and Estimated Costs for the La Joya Property |
Phase III Work Type | Description | Units | Cost/Unit ($CAN) | Cost ($CAN) |
| Geological Mapping | Regional mapping to the East of Cerro Sacrificio to Santo Nino and beyond and to the south of Cerro Sacrificio | 30 days | $1,000/day | $30,000 |
| Infill Drilling | Drilling within currently defined block model to increase confidence in mineral and grade distribution around areas of high grade | 10,000 metres | $200/metre | $2,000,000 |
| Expansion Drilling & Metallurgical Studies | Drilling beyond the limit of the currently defined block model to test for potential deposit expansion along established mineral trends | 5,000 metres | $200/metre | $1,000,000 |
| | | | TOTAL | $3,300,000 |
Respectfully submitted,
[original signed and sealed] __________________________________________ P. James F. Barr, P.Geo Senior Geologist EBA, Engineering Consultants Ltd. | |
[original signed and sealed] __________________________________________ Ting Lu P. Eng. MSc. Senior Metallurgical Engineer Mining and Minerals Tetra Tech Inc. | |