Exhibit 99.1
Update to sANTA eLENA Pre-Feasibility Study
Sonora, Mexico
SilverCrest Mines Inc.
EFFECTIVE DATE: DECEMBER 31, 2014
fILING date: mARCH 31, 2015
Contributors:
| § | N. Eric Fier, C.P.G., P. Eng., Chief Operating Officer - SilverCrest Mines Inc. |

| | SANTA ELENA UPDATE TECHNICAL REPORT |
| | EFFECTIVE DATE: DECEMBER 31, 2014 |
| | |
table of contents
| 1.0 | Executive Summary | 1 |
| | 1.1 | Introduction | 1 |
| | 1.2 | Santa Elena Update to Mineral Resources and Mineral Reserves | 1 |
| | | 1.2.1 | Reserve Criteria | 4 |
| | 1.3 | Mining Methods | 5 |
| | 1.4 | Mining Schedule | 5 |
| | | 1.4.1 | Underground Production | 6 |
| | 1.5 | Recovery Methods | 6 |
| | 1.6 | Project Infrastructure | 7 |
| | 1.7 | Capital and Operating Costs | 8 |
| | 1.8 | Economic Analyses | 8 |
| | 1.9 | Update to Pre-Feasibility Recommendations | 10 |
| | | |
| 2.0 | Introduction | 11 |
| | 2.1 | Report Author and Qualified Person | 11 |
| | | |
| 3.0 | Reliance on other Experts | 11 |
| | | |
| 4.0 | Property Description and Location | 12 |
| | 4.1 | Mining Titles and Agreements | 14 |
| | 4.2 | Royalties | 17 |
| | 4.3 | Sandstorm Gold Stream | 17 |
| | 4.4 | Environmental Liabilities and Permitting | 17 |
| | | | |
| 5.0 | Accessibility, Climate, Local Resources, Infrastructure and Physiography | 19 |
| | 5.1 | Accessibility | 19 |
| | 5.2 | Climate | 19 |
| | 5.3 | Local Resources | 19 |
| | | 5.3.1 | Water Supply | 19 |
| | | 5.3.2 | Power | 20 |
| | | 5.3.3 | Community Services | 20 |
| | 5.4 | Existing Infrastructure | 20 |
| | 5.5 | Physiography | 21 |
| | | |
| 6.0 | History | 21 |
| | | |
| 7.0 | Geological Setting and Mineralization | 22 |
| | 7.1 | Regional Geological Setting | 23 |
| | 7.2 | Local and Property Geology | 23 |
| | | 7.2.1 | Santa Elena | 23 |
| | | | 7.2.1.1 Structural Geology at Santa Elena | 25 |
| | | 7.2.2 | Ermitaño | 26 |
| | | 7.2.3 | Cumobabi | 29 |
| | SANTA ELENA UPDATE TECHNICAL REPORT |
| | EFFECTIVE DATE: DECEMBER 31, 2014 |
| | |
| 8.0 | Deposit Types | 30 |
| | 8.1 | Mineralization | 30 |
| | | |
| 9.0 | Exploration | 31 |
| | | |
| 10.0 | Drilling | 31 |
| | 10.1 | Santa Elena | 31 |
| | 10.2 | Ermitaño | 38 |
| | | | |
| 11.0 | Sample Preparation, Analyses and Security | 39 |
| | 11.1 | Historical Sample collection methods | 39 |
| | 11.2 | Previous SilverCrest sample collection methods | 39 |
| | 11.3 | 2012 -2013 Sample Collection Methods | 39 |
| | 11.4 | 2013 -2014 Sample Collection Methods | 40 |
| | 11.5 | 2014 -2015 UG Sample Collection Methods | 41 |
| | 11.6 | 2012-2013 Laboratory Analytical Methods | 43 |
| | 11.7 | 2013-2014 Laboratory Analytical Methods | 43 |
| | | 11.7.1 | Nusantara Lab Preparation and Analyses (2012-2014) | 43 |
| | | 11.7.2 | ALS-Chemex Lab preparation and Analyses (2012-2014) | 44 |
| | 11.8 | Inspectorate Lab preparation and Analyses (2013-2014) | 44 |
| | 11.9 | Heap Leach Sampling, preparation and Analyses (2012-2013) | 45 |
| | 11.10 | QP Statement | 46 |
| | | |
| 12.0 | Data Verification | 47 |
| | 12.1 | Historical Data Verification | 47 |
| | 12.2 | 2006-2008 SilverCrest Data verification | 47 |
| | 12.3 | 2012-2013 Independent Data verification | 47 |
| | | 12.3.1 | SilverCrest Certified Reference Material Insertion | 49 |
| | 12.4 | SilverCrest Blank Material Insertions | 54 |
| | 12.5 | QP Statement on Data Verification | 55 |
| | | |
| 13.0 | Mineral Processing and Metallurgical Testing | 55 |
| | 13.1 | Previous Mineral Processing and Metallurgical test work | 55 |
| | | 13.1.1 | Previous Metallurgical Test Work Summary For Santa Elena | 55 |
| | 13.2 | Recent Mineral Processing and Metallurgical test work | 55 |
| | | 13.2.1 | Leaching Cyanidation of Samples from Santa Elena Deposit | 56 |
| | | 13.2.2 | Filtering and Thickening Test work | 65 |
| | 13.3 | Metallurgical Operational Results Up To December 31, 2014 | 66 |
| | | |
| 14.0 | Mineral Resource Estimates | 67 |
| | 14.1 | Previous Mineral Resource Estimates | 67 |
| | | 14.1.1 | Previous Underground Resource Estimate | 67 |
| | | 14.1.2 | Previous Spent Ore on Leach Pad Resource Estimate | 69 |
| | | 14.1.3 | Previous Open Pit Resource Estimate | 70 |
| | 14.2 | Current Underground Mineral Resource Estimate | 70 |
| | | 14.2.1 | Gold Equivalent (AuEq) Calculations and Assumptions | 70 |
| | | 14.2.2 | Specific Gravity used in the Resource Estimation | 71 |
| | SANTA ELENA UPDATE TECHNICAL REPORT |
| | EFFECTIVE DATE: DECEMBER 31, 2014 |
| | |
| | | 14.2.3 | MMZ Geostatistics | 71 |
| | | | 14.2.3.1 High Grade Capping | 75 |
| | | | 14.2.3.2 Compositing | 77 |
| | | 14.2.4 El Cholugo Geostatistics | 79 |
| | | 14.2.5 Tortuga Geostatistics | 80 |
| | | 14.2.6 Basis of Current Underground Mineral Resource Estimation | 81 |
| | | 14.2.7 | Drill Holes Used in Underground Mineral Resource | 82 |
| | | 14.2.8 | Lithological Interpretation Used in the Model | 83 |
| | | 14.2.9 | Interpolation Method and Variography | 86 |
| | | 14.2.10 | Block Classification | 88 |
| | | 14.2.11 | Underground Mineral Resource Estimate | 88 |
| | | 14.2.12 | Underground Validation | 92 |
| | 14.3 | Current Heap Leach Mineral Resource Estimate | 94 |
| | | 14.3.1 | Heap Leach Resource Validation | 95 |
| | | 14.3.2 | Heap Leach Mineral Resource Statement | 95 |
| | | |
| 15.0 | Mineral Reserve Estimates | 96 |
| | 15.1 | Introduction | 96 |
| | 15.2 | Previous Reserve Estimates | 96 |
| | 15.3 | Current Reserve Estimate Parameters | 97 |
| | 15.4 | Basis for Underground Mineral Reserve | 98 |
| | | 15.4.1 | Underground Mining Method Consideration for Underground Reserves | 100 |
| | 15.5 | Open Pit Reserve | 100 |
| | 15.6 | Heap Leach Reserve | 100 |
| | 15.7 | Current Santa Elena Reserve Statement | 100 |
| | | |
| 16.0 | Mining Methods | 102 |
| | 16.1 | Introduction | 102 |
| | 16.2 | Geotechnical Analyses for Underground Mining | 102 |
| | | 16.2.1 | General | 102 |
| | | 16.2.2 | Geotechnical Data Collection | 103 |
| | | | 16.2.2.1 Drill Program | 103 |
| | | 16.2.3 Rock Mass Characteristics | 103 |
| | | 16.2.4 Design Parameters | 103 |
| | | | 16.2.4.1 Rock Mass parameters | 103 |
| | | | 16.2.4.2 Rock Strength | 104 |
| | | 16.2.5 Design Approach | 104 |
| | | | 16.2.5.1 General | 104 |
| | | | 16.2.5.2 Design Assumptions | 104 |
| | | | 16.2.5.3 Tabulation of Results | 105 |
| | | | 16.2.5.4 Methodology of Stability Graph for Stope Design | 105 |
| | | 16.2.6 Span Length Design – Longitudinal | 106 |
| | | 16.2.7 Stope Back Width Design | 106 |
| | | 16.2.8 Cut and Fill | 107 |
| | | | 16.2.8.1 Crown Pillar Design | 107 |
| | SANTA ELENA UPDATE TECHNICAL REPORT |
| | EFFECTIVE DATE: DECEMBER 31, 2014 |
| | |
| | 16.3 | Proposed Underground Mining Methods | 107 |
| | | 16.3.1 | Avoca Long Hole Stoping | 108 |
| | | 16.3.2 | Mechanized Cut and Fill | 111 |
| | | 16.3.3 | Mining Equipment | 113 |
| | 16.4 | Mine Design | 113 |
| | | 16.4.1 | Stope Layout | 113 |
| | | 16.4.2 | Development Layout | 118 |
| | 16.5 | Backfill | 121 |
| | | 16.5.1 | Backfilling Cut and Fill Stopes | 121 |
| | | 16.5.2 | Backfilling Long Hole Stopes (Avoca Technique) | 121 |
| | 16.6 | Overall Mining Schedule | 121 |
| | | 16.6.1 | Underground Mine Production Schedule | 122 |
| | | 16.6.2 | Open Pit Mining Schedule | 124 |
| | | 16.6.3 | Heap Leach Mining Schedule | 124 |
| | 16.7 | Ventilation | 124 |
| | | 16.7.1 | Ventilation Requirements | 124 |
| | | 16.7.2 | Ventilation Model | 125 |
| | | | 16.7.2.1 Conceptual ventilation design | 125 |
| | | | 16.7.2.2 Intake airway / Escape way Raise | 125 |
| | | | 16.7.2.3 Fresh Air Raise Head Without separate man way | 126 |
| | | | 16.7.2.4 Raised Bore for main exhaust ventilation airway | 126 |
| | | | 16.7.2.5 Vent Tubing Head For Tunnels and Ore drifts | 127 |
| | | | 16.7.2.6 Setup of Ventilation Model | 128 |
| | | 16.7.3 | Interpretation of Ventilation Conceptual Design | 131 |
| | 16.8 | Open Pit Mining Method | 131 |
| | 16.9 | Spent Ore (Pad Ore) Mining And Re-handling Methods | 132 |
| | 16.10 | Tailings Disposal | 132 |
| | | |
| 17.0 | Recovery Methods | 133 |
| | | |
| 18.0 | Project Infrastructure | 139 |
| | 18.1 | Surface Infrastructure for the Expansion Plan | 142 |
| | | 18.1.1 | Access Roads | 142 |
| | | 18.1.2 | Offices, Cafeteria, Warehouse and Change Houses | 142 |
| | | 18.1.3 | Fuel Storage Facility | 142 |
| | | 18.1.4 | Water storage facility | 142 |
| | | 18.1.5 | Electrical Distribution | 142 |
| | | 18.1.6 | Explosive Magazine | 142 |
| | | 18.1.7 | Maintenance Shop | 142 |
| | | 18.1.8 | On-site Laboratory | 142 |
| | 18.2 | Underground Infrastructure | 143 |
| | | 18.2.1 | Underground Maintenance Shop/Warehouse | 143 |
| | | 18.2.2 | Refuge Station | 143 |
| | | 18.2.3 | Dewatering | 143 |
| | | 18.2.4 | Underground Electrical Installations | 143 |
| | SANTA ELENA UPDATE TECHNICAL REPORT |
| | EFFECTIVE DATE: DECEMBER 31, 2014 |
| | |
| | | 18.2.5 | Water Services | 144 |
| | | 18.2.6 | Powder Storage | 144 |
| | | 18.2.7 | Compressed Air | 144 |
| | 18.3 | Processing Plant Infrastructure | 144 |
| | 18.4 | Waste Rock and Tailings Storage Facilities | 145 |
| | | |
| 19.0 | Market Studies and Contracts | 146 |
| | 19.1 | Metal Pricing | 146 |
| | 19.2 | Sales of gold and silver doré | 146 |
| | | |
| 20.0 | Environmental Studies, Permitting and Social or Community Impact | 146 |
| | 20.1 | Land Use Change Permit | 146 |
| | | 20.1.1 | Summary of ARD/ML Work for Santa Elena | 147 |
| | 20.2 | Closure Planning | 148 |
| | | |
| 21.0 | Capital and Operating Costs | 148 |
| | 21.1 | Capital Costs | 149 |
| | | 21.1.1 | Site infrastructure | 150 |
| | | 21.1.2 | Processing Capital Costs | 150 |
| | | 21.1.3 | Underground Development | 150 |
| | | 21.1.4 | Underground Equipment and Infrastructure | 150 |
| | | 21.1.5 | Sunk Costs | 151 |
| | 21.2 | Operating Costs | 151 |
| | | 21.2.1 | Underground Mining Cost Estimate | 153 |
| | | 21.2.2 | Costs for Loading and Transporting Existing Heap Leach Material to the Mill for Reprocessing | 155 |
| | | 21.2.3 | Processing Plant Operating Costs | 156 |
| | 21.3 | Tailings Handling Costs | 157 |
| | 21.4 | General and Administrative Operating Costs | 157 |
| | | |
| 22.0 | Economic Analyses | 158 |
| | 22.1 | Introduction | 158 |
| | 22.2 | Technical Assumptions | 158 |
| | 22.3 | Summary of Economic Results | 159 |
| | 22.4 | Cash flows | 160 |
| | 22.5 | Post - tax Results and Sensitivity Analyses | 161 |
| | 22.6 | Purchase Agreement | 165 |
| | 22.7 | Smelter Terms | 165 |
| | | |
| 23.0 | Adjacent Properties | 166 |
| | | |
| 24.0 | Other Relevant Data and Information | 166 |
| | | |
| 25.0 | Interpretation and Conclusions | 166 |
| | 25.1 | Geology and Underground Resource Estimate | 166 |
| | 25.2 | Underground Reserves and Mining Methods | 166 |
| | 25.3 | Costs and Project Economic | 166 |
| | SANTA ELENA UPDATE TECHNICAL REPORT |
| | EFFECTIVE DATE: DECEMBER 31, 2014 |
| | |
| 26.0 | RECOMMENDATIONS | 166 |
| | 26.1 | Geology and Underground Resource Estimate | 166 |
| | | 26.1.1 | Risks and Opportunities | 166 |
| | 26.2 | Geotechnical Recommendation | 167 |
| | | 26.2.1 | Stope Size and Pillar Dimensioning | 167 |
| | | | 26.2.1.1 Hanging wall and orebody NGI-Q values | 167 |
| | | | 26.2.1.2 Joint set orientation | 167 |
| | | | 26.2.1.3 In-situ stress regime | 167 |
| | | 26.2.2 | Geotechnical Considerations in Overall Mine Design | 167 |
| | 26.3 | Metallurgical Testing | 168 |
| | 26.4 | Breakdown of costs for future work | 168 |
| | 168 |
| references | 169 |
List of Tables in Text
| Table 4.1: List of Mining Titles for Santa Elena and Surrounding Properties | 14 |
| Table 4.2: Permits for Santa Elena | 18 |
| Table 4.3: Permits for Ermitaño | 18 |
| Table 10.1: Significant Drill hole Intersections from 2014 Surface Drilling at Santa Elena | 32 |
| Table 10.2: Table Summary of Drill Holes | 34 |
| Table 10.3: Trench and Bulk Composite Samples | 37 |
| Table 10.4: SilverCrest Drilling Results at Ermitaño –Durazno Target | 38 |
| Table 11.1: RC Cutting Sample Length (From ‘SERC’- series drill holes) and frequency from the hanging wall | 39 |
| Table 11.2: Number and preparation method of samples sent to ALS-Chemex from Santa Elena mine (2012-2013) | 44 |
| Table 12.1:Drill core grade verification sampling (Oct 2012) | 48 |
| Table 12.2: Certified Reference Material Reporting Values used in the Santa Elena 2013-2014 Drilling by SilverCrest | 49 |
| Table 13.1: Baseline Cyanidation Performance | 56 |
| Table 13.2: Leach Optimization Test Summary | 59 |
| Table 13.3: Confirmatory Test Comp. 4 +/- 0 Nivel | 61 |
| Table 13.4: Average Recovery Rates for Underground Bulk Samples | 63 |
| Table 13.5: Results of Additional Testing on Samples 4, 6 and 8. | 63 |
| Table 13.6: Bulk Leach Summary | 65 |
| Table 14.1: Previous Underground Mineral Resource Estimate Including Reserves for Santa Elena (EBA, April 30th, 2013) | 68 |
| Table 14.2: Previous Underground Mineral Resource Estimate and Sensitivity, Excluding Reserves for Santa Elena (EBA April 30th, 2013) | 69 |
| Table 14.3: Previous Leach Pad Material Mineral Resource Estimate (April 30th, 2013) | 70 |
| Table 14.4: Specific Gravity | 71 |
| Table 14.5: Block Model Origin and Demission of the Santa Elena Model | 82 |
| Table 14.6: Drill Holes Used in Estimating MMZ | 82 |
| | SANTA ELENA UPDATE TECHNICAL REPORT |
| | EFFECTIVE DATE: DECEMBER 31, 2014 |
| | |
| Table 14.7: Drill Holes Used in Estimating El Cholugo | 82 |
| Table 14.8: Drill Holes Used in Estimating Tortuga | 82 |
| Table 14.9: Block Model Codes | 84 |
| Table 14.10: Variography by Domain | 87 |
| Table 14.11: Ellipse Parameters Summary | 87 |
| Table 14.12: Underground Mineral Resource Estimate Excluding Reserves for Santa Elena (SilverCrest, Dec 31, 2014) | 89 |
| Table 14.13: Validation of Heap Leach Resource Estimate (April 30th, 2013) | 95 |
| Table 14.14: Leach Pad Material Mineral Resource Estimate (Effective December 31st, 2014) | 95 |
| Table 15.1: Previous Santa Elena Open Pit Reserves (January, 2011) | 96 |
| Table 15.2: Previous Reserves disclosed in 2013 Technical Report (April, 2013) | 97 |
| Table 15.3: Santa Elena Mineral Reserve Estimate, diluted and recoverable (Effective Date: December 31, 2014) | 101 |
| Table 16.1: RMR’ and NGI-Q’ Values for Design – at 50% | 104 |
| Table 16.2: NGI-Q' Values for Stope Design | 106 |
| Table 16.3: Mining Method Selection Criteria | 107 |
| Table 16.4: Mining Equipment List | 113 |
| Table 16.5: Linear Meters of development remaining for life of mine | 118 |
| Table 16.6: Summary of Overall Production Schedule | 121 |
| Table 16.7: Scheduling Parameters | 122 |
| Table 16.8: Equipment Power and Utilization | 124 |
| Table 16.9: Design Parameters for Escape Way Raise | 125 |
| Table 16.10: Design Parameters for Fresh Air Raise | 126 |
| Table 16.11: Design Parameters for Exhaust Raise | 127 |
| Table 16.12: Design Parameters for Vent Tubing | 128 |
| Table 16.13: Dimensions and Friction Factors for Underground Workings | 129 |
| Table 18.1: Major Equipment Components as part of the Processing Plant | 144 |
| Table 21.1: Sustaining Capital Cost Summary | 149 |
| Table 21.2: Underground waste development for remaining life of mine | 150 |
| Table 21.3: Operating Costs | 152 |
| Table 21.4: Long Hole Mining Cost Summary (based on 2014 budget and actuals) | 153 |
| Table 22.1: Technical-Economic Modeling Assumptions | 158 |
| Table 22.2: Base Case Economic Analyses Results | 159 |
| Table 22.3: Comparison of Base Case Post Tax Results used in the PFS with Spot Price Post Tax Results at mid-December 2014 | 160 |
| Table 22.4: Discounted Post Tax Cash Flow Model | 163 |
| Table 26.1: Breakdown of future costs related to recommendations | 168 |
| | SANTA ELENA UPDATE TECHNICAL REPORT |
| | EFFECTIVE DATE: DECEMBER 31, 2014 |
| | |
List of Figures in Text
| Figure 1.1: Summary of annual tonnes and grade for the life of mine | 6 |
| Figure 4.1: Santa Elena Property Location | 13 |
| Figure 4.2: Santa Elena and Surrounding Area Property Map; | 16 |
| Figure 7.1: Santa Elena Property Geology Map | 24 |
| Figure 7.2: El Durazno property Geology | 27 |
| Figure 10.1: Map Showing Drilling at Santa Elena, 2014 Drilling is Highlighted | 35 |
| Figure 10.2: Drill Program in Santa Elena MMZ by Year, Longitudinal Section | 36 |
| Figure 11.1: Santa Elena Sample Length Frequency used in 2013 Resource Estimate | 40 |
| Figure 12.1: Grade Verification Sampling, Silver | 48 |
| Figure 12.2: Grade Verification Sampling, Gold | 49 |
| Figure 12.3: CRM: CDN-GS-P5D – Gold | 50 |
| Figure 12.4: CRM: CDN-GS-P5D – Silver | 50 |
| Figure 12.5: CRM: CDN-ME-1303 – Gold | 51 |
| Figure 12.6: CRM: CDN-ME-1303 – Silver | 51 |
| Figure 12.7: CRM: CDN-ME-16 – Gold | 52 |
| Figure 12.8: CRM: CDN-ME-16 – Silver | 52 |
| Figure 12.9: CRM: CDN-ME-19 – Gold | 53 |
| Figure 12.10: CRM: CDN-ME-19 – Silver | 53 |
| Figure 12.11: SilverCrest 2013-2014 Reported Blank Material Au (gpt) | 54 |
| Figure 12.12: SilverCrest 2013-2014 Reported Blank Material Ag (gpt) | 54 |
| Figure 13.1: Gold Leach Kinetics on Milled NIVEL 4 Comp | 57 |
| Figure 13.2: Silver Leach Kinetics on Milled NIVEL 4 Comp | 58 |
| Figure 13.3: Optimization Gold Extraction Kinetics | 59 |
| Figure 13.4: Optimization Silver Extraction Kinetics | 60 |
| Figure 13.5: Confirmatory Extraction Kinetics | 61 |
| Figure 13.6: Confirmatory Silver Extraction Kinetics | 62 |
| Figure 13.7: Additional Testing of Composite Sample #4. | 64 |
| Figure 13.8: Additional Testing of Composite Sample #6. | 64 |
| Figure 13.9: Additional Testing of Composite Sample #8. | 65 |
| Figure 14.1: Boxplot for Raw Gold and Silver within MMZ | 71 |
| Figure 14.2: Histogram and Probability Curve for Raw Silver within MMZ | 72 |
| Figure 14.3: Histogram and Probability Curve for Raw Gold within MMZ | 72 |
| Figure 14.4: Boxplot for Composited Gold and Silver within MMZ | 73 |
| Figure 14.5: Statistical Analyses for Stockwork | 74 |
| Figure 14.6: Statistical Analyses for Breccia | 75 |
| Figure 14.7: Cumulative Log-Probability Graph for Raw Gold Grades | 76 |
| Figure 14.8: Cumulative Log-Probability Curve for Raw Silver Grades | 76 |
| Figure 14.9: Histogram and Probability Plot of Raw Length Values within the MMZ | 77 |
| Figure 14.10: Box Plots with Capped and Uncapped Samples within MMZ | 78 |
| Figure 14.11: Box Plots with Capped and Uncapped Samples within the Stockwork | 78 |
| Figure 14.12: Box Plots with Capped and Uncapped Samples within the Breccia | 79 |
| Figure 14.13: El Cholugo Vein Statistical Analyses | 80 |
| Figure 14.14: Histogram and Probability Curve for Raw Gold and Silver within Tortuga Vein | 81 |
| | SANTA ELENA UPDATE TECHNICAL REPORT |
| | EFFECTIVE DATE: DECEMBER 31, 2014 |
| | |
| Figure 14.15: Location of Drill Holes used in 2015 Mineral and Solid Resource Update | 83 |
| Figure 14.16: Geological Model Showing Vein Domains, Looking Northwest | 85 |
| Figure 14.17: Geological Model Showing Lithology Units: Main Mineralized Zone (red), Breccia(grey) and Stockwork (green), Looking Northwest | 85 |
| Figure 14.18: Geological Model Showing El Cholugo, Looking Northwest | 86 |
| Figure 14.19: Oblique View of MMZ Block Model Showing Indicated AuEq Blocks, Looking Northeast | 90 |
| Figure 14.20: Grade Tonnage Curve for Indicated Mineral Resources | 91 |
| Figure 14.21: Grade Tonnage Curve for Inferred Mineral Resources | 92 |
| Figure 14.22: Gold Swath Plot | 93 |
| Figure 14.23: Silver Swath Plot: | 94 |
| Figure 15.1: Stope Shapes defined for use in Reserve Definition | 99 |
| Figure 16.1: General Sublevel Stoping Operation | 110 |
| Figure 16.2: General Mechanized Cut and Fill Stoping Method | 112 |
| Figure 16.3: Longitudinal View of Stopes, Looking North | 115 |
| Figure 16.4: 3D View of Stope Layout, Looking Northwest | 116 |
| Figure 16.5: 3D View of Stope Layout Showing El Cholugo and MMZ, Looking Down and to South | 117 |
| Figure 16.6: Development and Stope Layout, Looking North | 119 |
| Figure 16.7: 3D View of Stope and Development Layout, Looking South (Footwall Side) | 120 |
| Figure 16.8: Summary of Annual Tonnes by Underground Mining Methods and Grade for the Life of Mine | 123 |
| Figure 16.9: Phase 1 Ventilation Air Flow Diagram | 130 |
| Figure 17.1: Santa Elena Expansion 3000 tpd Process Flowsheet | 137 |
| Figure 17.2: Santa Elena Expansion Plan Plant Mechanical General Arrangement | 138 |
| Figure 18.1: Site General Arrangement Plan | 141 |
| Figure 22.1: Pre-tax and Post-tax Cash Flows | 161 |
| Figure 22.2: NPV Sensitivity Analyses | 164 |
| Figure 22.3: Gold and Silver Recoveries NPV Sensitivity Analyses | 165 |
List of PHOTOGRAPHS in Text
| Photo 7.1: View of Vein Outcrop at Ermitaño West | 28 |
| Photo 7.2: Showing Veta Valentia Epithermal Vein Outcrop | 29 |
| Photo 11.1: Heap Leach Sampling | 46 |
| Photo 16.1: View of Stope 2 (Long hole stoping with Hangingwall Cable Bolting) | 109 |
| Photo 16.2: Showing Pad Ore on Leach Pad and Recovery Conveyor System | 132 |
| Photo 17.1: Showing Pad Ore Recovery Conveyor and Stockpile with CCD Tanks in Background | 134 |
| Photo 17.2: Showing Two Stockpiles for Underground (White) and Pad Ore (Brown) | 135 |
| | SANTA ELENA UPDATE TECHNICAL REPORT |
| | EFFECTIVE DATE: DECEMBER 31, 2014 |
| | |
Acronyms & Abbreviations
| AA | Atomic Absorption |
| Au | Gold |
| AuEq | Gold equivalent |
| BC | British Columbia |
| CIM | Canadian Institute for Mining, Metallurgy and Petroleum |
| CNCF | Cumulative Net Cash Flow |
| CONAGUA | Comision Nacional Del Agua |
| CRM | Certified Reference Material |
| DCF | Discounted Cash Flow |
| DDH | Diamond Drill Hole |
| DGGFS | Dirección General de Gestión Forestal y de Suelos |
| DTM | Digital terrain model |
| EBA | Tetra Tech EBA Inc. |
| Evrim | Evrim Resources Corp. |
| FA | Fire Assay |
| GRA | Gravimetric Determination |
| ICP-AES | Inductively coupled plasma-atomic emission spectrometry |
| IDW | Inverse Distance Weighted |
| INAH | Nation Institute of Archaeology and History |
| INEGI | Instituto Nacional de Geografía y Estadística de México |
| LOM | Life of Mine |
| LOMP | Life of Mine Plan |
| NCF | Net Cash Flow |
| NI 43-101 | National Instrument 43-101 Standards of Disclosure for Mineral Projects |
| NGI | Norwegian Geotechnical Institute |
| NN | Nearest Neighbor |
| NSR | Net Smelter Returns |
| NPV | Net present Value |
| OK | Ordinary Kriging |
| PFS | Pre-Feasibility Study |
| P.Eng | Professional Engineer |
| P.Geo | Professional Geologist |
| QA-QC | Quality Assurance and Quality Control |
| QP | Qualified Person |
| RC | Reverse Circulation |
| RMR | Rock Mass Rating |
| RQD | Rock Quality Designation |
| S.A. de C.V. | Sociedad Anónima de Capital Variable |
| SCdM | SilverCrest de Mexico S.A. de C.V. |
| SD | Standard Deviation |
| SEDENA | Mexican Secretariat of National Defense |
| SEMARNAT | Secretaría de Medio Ambiente y Recursos Naturales |
| | SANTA ELENA UPDATE TECHNICAL REPORT |
| | EFFECTIVE DATE: DECEMBER 31, 2014 |
| | |
| SWRPA | Scott Wilson Roscoe Postle Associates |
| UBC | University of British Columbia |
| UG | Underground |
| UTM | Universal Transverse Mercator |
| WGS | World Geodetic System |
| XRD | X-ray diffraction analyses |
| | SANTA ELENA UPDATE TECHNICAL REPORT |
| | EFFECTIVE DATE: DECEMBER 31, 2014 |
| | |
Units of Measurement and Conversions
| $USD | United States Dollar |
| % | Percent |
| °C | Degree Celsius |
| Bhp | Brake Horse Power |
| cu.m/s | Cubic Metre per Second |
| deg | Degrees |
| gal | Gallon |
| gpt | Grams per tonne |
| ha | Hectare (10,000 square meters) |
| HP | Horsepower |
| hrs | Hours |
| kg | Kilogram |
| km | Kilometre |
| kV | Kilovolt |
| kW | Kilowatt |
| kWhr | Kilowatt Hour |
| Lps | Litres per second |
| M | Million |
| M | Metre |
| m/s | Metre per second |
| m3/s | Metre cubed per second |
| Ma | Million Years |
| mm | Millimetre |
| MxnPeso$ | Mexican Pesos |
| MW | MegaWattPascal |
| Pa | Pascal |
| oz | Ounce (troy) |
| ppb | Part per billion |
| ppm | Parts per million |
| Sec | Second |
| V | Volt |
| AuEq (gpt) | 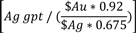 |
| % Difference |  |
| Contained oz |  |
| Contained lbs |  |
| | SANTA ELENA UPDATE TECHNICAL REPORT |
| | EFFECTIVE DATE: DECEMBER 31, 2014 |
| | |
SilverCrest Mines Inc. (SilverCrest, SVL) of Vancouver, British Columbia, Canada has prepared this Update to Pre-Feasibility Study for the Santa Elena Mine, located in central Sonora, Mexico. The Technical Report prepared is in compliance with National Instrument 43-101 Standards of Disclosure for Mineral Projects (“NI 43-101”) titled, “Update to Santa Elena Pre-Feasibility Study, Sonora Mexico” (the “UPFS”), for its operating Santa Elena mine. The UPFS updates the Santa Elena Pre-Feasibility Study and Open Pit Resource Update dated effective April 30, 2013, as amended March 4, 2014 (the “2013 PFS”). Summaries of the revised Reserves and Resources, Life of Mine Plan (“LOMP or LOM”), operating costs, sustaining capital costs and project economics are presented in tables below. All dollar amounts are expressed in U.S. dollars unless otherwise specified. The effective date of this Technical Report is December 31, 2014. Refer to the “Santa Elena Expansion Pre-Feasibility Study and Open Pit Reserve Update” with effective date of April 30, 2013, and amended date of March 4, 2014 for further information being referenced in this report.
Nusantara de Mexico S.A. de C.V., a 100% owned Mexican subsidiary and a legal operating entity of SilverCrest, holds the rights to the Santa Elena Mine and associated exploration concessions.
The Santa Elena Mine is currently producing gold and silver from a 3,000 tonne per day open pit, underground and reprocessing of heap leaching material using a new fully commissioned Merrill Crowe/CCD processing facility. The Santa Elena Project involves combined processing of ore from the remaining reserves in the open pit, updated reserves from underground development and reprocessing of spent ore from the existing heap leach pad. Commercial production for the 3,000 tonne per day mill and plant facility was declared on August 1, 2014. Underground development has been ongoing since January 2013 with commercial production declared on October 1, 2014. As of December 2014, the decline had been developed to approximately the 575 metre elevation with development drifts on the 700, 675, 650, 625, 600, and 575 metre levels (elevations above sea level). Underground stope production in late 2014 consisting of long hole stoping of Stope #1 which is located between the 575 to 600 metre levels and preparation and of stope #2 and #3.
The purpose of this report is to document an update to the 2013 Pre-Feasibility Study completed for the Santa Elena Project supported by updated Mineral Resource, Mineral Reserve Estimates, mine design, Life of Mine Plan, sustaining capital and operating costs and economic analyses.
This report conforms to National Instrument 43-101 Standards of Disclosure for Mineral Projects (NI 43-101 and Form 43-101F1), and incorporates the Canadian Institute for Mining, Metallurgy and Petroleum Definition Standards for Mineral Resources and Mineral Reserves (CIM Definition Standards).
| 1.2 | Santa Elena Update to Mineral Resources and Mineral Reserves |
Update to the Mineral Reserves and Resources (open pit, underground and leach pad) are shown in the table below. Only Indicated Resources were used to define Mineral Reserves in the UPFS mine plan, schedule and economic analyses. To summarize, Total Reserves are 7.45 million tonnes grading 1.23 gpt Au and 78.4 gpt Ag, containing 295 thousand ounces of gold and 18.76 million ounces of silver. This represents a 10% decrease in contained gold and 5% decrease in contained silver over previous Probable Reserves stated in the 2013 PFS Technical Report. Updated Indicated Resources (exclusive of Probable Reserves) are estimated at 1.1 million tonnes grading 1.39 gpt Au and 89.7 gpt Ag, containing 50 thousand ounces of gold and 3.2 million ounces of silver. This represents a 57% decrease in contained gold ounces and 59% decrease in contained silver ounces over previous Indicated Resources. Updated Inferred Resources are estimated at 0.56 million tonnes grading 1.69 gpt Au and 106.5 gpt Ag, containing 31 thousand ounces of gold and 1.9 million ounces of silver. This represents a 57% decrease in contained gold ounces and 74% decrease in contained silver ounces. The percentage differences in gold and silver from PFS (April 30, 2013) are based on:
| | SANTA ELENA UPDATE TECHNICAL REPORT |
| | EFFECTIVE DATE: DECEMBER 31, 2014 |
| | |
| § | A minimal of decrease of overall reserves from mining depletion even with base case metal price used for cut off analyses changed from $1,450 per ounce of gold to $1300 and $28 per ounce of silver to $19.50. |
| § | A decrease in open pit reserves due to mining depletion due to mining from April 30, 2013 to April 1, 2014. |
| § | An increase in leach pad reserves with continuation of open pit mining in 2013 and 2014 and partial leaching (300 day leach cycle) of ore. |
| § | Overall, increase in mine life after mining depletion. |
| § | Resources have been impacted by conversion to reserves, lower base case metal prices, update geological model incorporating infill drilling, changes in estimation supported by additional drilling completed in 2013 and 2014 and production data generated during the life of mine at the open pit operations. |
Table 1.1: Update to Mineral Reserve and Resource Estimates (December 31, 2014)
| SANTA ELENA RESERVES (DECEMBER 31, 2014) |
| Classification | Tonnes | Au gpt | Ag gpt | Contained Au oz | Contained ag
oz |
| Santa Elena Underground Diluted And Recoverable Reserves* |
| Probable | 3,981,557 | 1.67 | 115.0 | 214,000 | 14,724,000 |
| Santa Elena Open Pit Reserves** |
| Probable | 121,706 | 2.75 | 117.0 | 11,000 | 458,000 |
| Santa Elena Leach Pad Reserves*** |
| Probable | 3,344,652 | 0.65 | 33.3 | 70,000 | 3,582,000 |
| Total Santa Elena Reserves |
| Probable | 7,447,915 | 1.23 | 78.4 | 295,000 | 18,764,000 |
| Santa Elena Resources (December 31, 2014) **** |
| Indicated | 1,117,032 | 1.39 | 89.7 | 50,000 | 3,220,000 |
| Inferred | 564,073 | 1.69 | 106.5 | 31,000 | 1,932,000 |
Note: All numbers are rounded. Underground and Leach Pad Reserves and Resources are based on LOMP metal price trends of $1,300/oz gold and $19.50/oz silver, and metallurgical recoveries of 92% Au and 67.5% Ag. All Mineral Resources and Reserves conform to NI 43-101 and CIM definitions for Resources and Reserves. Inferred Resources have been estimated from geological evidence and limited sampling and must be treated with a lower level of confidence than Indicated Resources.
*Underground Probable Reserve is based on a cut-off grade of 2.49 gpt AuEq with an average est. 10% dilution and 90% mine recovery. Average true thickness of the designed stopes is 10 metres.
** Open Pit Reserve is based on a cut-off grade of 0.20 gpt AuEq in a constrained pit shell with applied capping of 8 gpt Au and 300 gpt Ag.
*** Leach Pad Reserve based on production and drill hole data for volumetrics and grade model using a cut-off grade of 0.5 gpt AuEq. No capping was applied.
****Mineral Resources exclude Mineral Reserves and are based on a 1.5 gpt AuEq cut-off grade using assumptions for prices and recoveries as stated in note above. Capping was applied at 12 gpt Au and 700 gpt Ag.
| | SANTA ELENA UPDATE TECHNICAL REPORT |
| | EFFECTIVE DATE: DECEMBER 31, 2014 |
| | |
Table 1.2: Previous Reserve and Resource Estimates (2013 PFS) for comparative purposes
| Classification1 | Tonnes | Au Gpt | Ag Gpt | Au Oz | Ag Oz |
| Santa Elena Underground Diluted and Recoverable Reserves2 |
| Probable | 3,920,510 | 1.57 | 108.1 | 198,170 | 13,624,640 |
| Santa Elena Open Pit Reserves3 |
| Probable | 1,426,710 | 1.52 | 66.8 | 69,830 | 3,062,200 |
| Santa Elena Leach Pad Reserves4 |
| Probable | 2,844,530 | 0.65 | 33.3 | 59,420 | 3,048,200 |
| Total Reserves | 8,191,760 | 1.24 | 74.9 | 327,430 | 19,735,050 |
| Santa Elena Underground Resources5 |
| Indicated | 2,142,820 | 1.69 | 114.9 | 116,000 | 7,919,000 |
| Inferred | 1,489,750 | 1.50 | 155.6 | 72,000 | 7,453,000 |
Note:
All numbers are rounded. Underground and Leach Pad Reserves and Resources are based on 3 year historic metal price trends of US$28/oz silver, US$1450/oz gold and metallurgical recoveries of 92% Au and 67.5% Ag with a metal ratio of Ag:Au at 70:1 used for grade cut-off determination . All Mineral Resources and Reserves conform to NI 43-101 and CIM definitions for Resources and Reserves. Inferred Resources have been estimated from geological evidence and limited sampling and must be treated with a lower level of confidence than Indicated Resources.
1Open Pit and Leach Pad Probable Reserves were classified by SilverCrest. Underground Reserves and Resources were classified by EBA, a Tetra Tech Company.
2Underground Probable Reserve is based on a cut-off grade of 1.47 gpt AuEq with an average 10% dilution and 90% mine recovery. Average true thickness of the designed stopes is 13.4 metres.
3Open Pit Reserve is based on a cut-off grade of 0.20 gpt AuEq in a constrained pit shell with applied capping of 8 gpt Au and 300 gpt Ag.
4Leach Pad Reserve based on production and drill hole data for volumetrics and grade model using a cut-off grade of 0.5 gpt AuEq. No capping was applied.
5Underground Resources are exclusive of Probable Reserves and based on 1 gpt AuEq grade shell, a cut-off grade of 1.4 gpt AuEq, and applied capping of 12 gpt Au and 600 gpt Ag.
The update to underground Reserves and Resources have been estimated by SilverCrest utilizing 2013 and 2014 drilling and production results along with previous independently-validated data (see 2013 PFS and previous NI 43-101 compliant Technical Reports on SEDAR at www.sedar.com). Drilling in 2013 and 2014 was focused on underground and surface infill drilling, conversion and expansion of underground Resources to Reserves with an average drill hole spacing of approximately 35 to 45 metres.
The update to open pit Reserves have been estimated by SilverCrest utilizing extensive production data (blastholes), exploration drilling data drilling data and a 3D computer modelling. All Indicated Resources in the currently operating open pit have been converted to Reserves.
The Leach Pad Reserves (spent ore) have been estimated by SilverCrest utilizing production data, crusher composite samples, drill data from verification holes on the pad, bottle roll tests to process design specifications and SilverCrest production leach curves. Spent ore material on the leach pad is currently being reprocessed through the new processing facility. No further leach pad material is anticipated to be loaded on the pad.
Drilling data used for Resource estimation from discovery of the deposit (2006) to December 2014 included 366 holes (88,881 metres). A total of 1,983 two metre composite samples were used as the basis for the block model, with 1,871 within the Main Mineralized Zones, 88 for El Cholugo, and 24 for Tortuga.
| | SANTA ELENA UPDATE TECHNICAL REPORT |
| | EFFECTIVE DATE: DECEMBER 31, 2014 |
| | |
As of April 2011 before commencement of initial production at Santa Elena, the Reserve was stated as 5.1 million tonnes grading 1.72 gpt Au and 73.4 gpt Ag (refer to 2013 PFS). As of April 2103, the Santa Elena open pit had a Reserve of 1.43 million tonnes grading 1.52 gpt Au and 66.8 gpt Ag (refer to Technical Report dated April 30, 2013). In December 2014, the open pit Reserve was depleted by approximately 3.75 year of production and optimized with the remaining 4.79 million tonnes grading 1.81 gpt Au and 75.9 gpt Ag (reported in Technical Report dated April 1, 2011). By January 2012, the open pit was depleted from 2011 production and re-optimized with a resultant Reserve of 3.45 million tonnes grading 1.96 gpt Au and 87.3 gpt Ag showing lesser tonnes and higher grade. Re-optimization of the open pit between April 2011 and December 2014 has reclassified approximately 1.4 million tonnes of open pit Reserve to underground Resources which was converted mostly to the new underground Reserves. The main purpose for re-optimization was to avoid a higher open pit strip ratio at higher cost in future years in the mine life but still be able to mine the displaced Reserves from underground.
Extensive metallurgical test work including ongoing operations data show that all declared Reserves are amenable to conventional leaching by standard CCD milling with a Merrill Crowe recovery system for doré bar production. Estimated recovery grades are stated in Table 1.3 below, and in Section 1.5.
The updated Santa Elena Mineral Reserves as stated above were completed using GEMS resource models for defining open pit, underground and leach pad Reserves along with criteria as presented in the following table.
Table 1.3: Santa Elena Reserve Estimation Criteria
| Base Case Metal Prices1 | All US$ | | | |
| Gold | $1,300.00 | | | |
| Silver | $19.50 | | | |
| Mining Method | Open Pit | U/G Long Hole | U/G Cut & Fill | Leach Pad |
| Process Method | CCD Mill | CCD Mill | CCD Mill | CCD Mill |
| Mining Cost/T ore | $9.9 | $28.72 | $50.02 | $0.03 |
| Processing Cost/T3 | $24.5 | $24.5 | $24.5 | $24.5 |
| General & Administration4 | $5.3 | $5.3 | $5.3 | $5.3 |
| Overall Metal Recoveries (Life of Pad)5 | | | | |
| Gold | 92% | 92% | 92% | 92% |
| Silver | 67.5% | 67.5% | 67.5% | 67.5% |
| Ramp Width (metres) | 10 to 15 | 4.5 | 4.5 | NA |
| Average Dilution | 5% | 10%2 | 10%2 | NA |
| Ave. Mining Recovery | 95% | 90%2 | 90%2 | 100% |
1Based on LOMP metal price trends
2 Underground mining costs, dilution and mine recovery are based on stope type, either long hole (89% of design stopes) or cut and fill (11% of designed stopes) mining method.
3 Processing includes leach pad costs, crushing, milling, site refining and dry stack tailings disposal.
4 Estimated based on current operations and may vary on an annual basis.
5 Recoveries for leach pad material are based on recent Company production leach cycles of 300 days for life of pad to assess together with data the available reserves. During the period from 2010 through 2014, an average recovery of 60% Au and 30% Ag was achieved. Recoveries reflect partial 300 day leach cycle with pad leaching discontinued prematurely in Q2 2014. Leach pad CCD mill recoveries are based on in-situ remaining ounces on the pad.
* For economic analyses, the gold prices range is defined as $1250 (2015), $1275(2016) and $1300 for remaining years for LOMP. For silver prices, the range is defined as $18 (2015), $19(2016), $20 (2017) and $21 for remaining years for LOMP.
| | SANTA ELENA UPDATE TECHNICAL REPORT |
| | EFFECTIVE DATE: DECEMBER 31, 2014 |
| | |
Ore development costs are estimated at $36/t and represent approximately 6% of total underground ore planned to be mined during LOMP.
The Santa Elena ore body varies in dip and thickness along strike and at depth. As a result, two well established underground mining methods have been selected for ore extraction. These mining methods are categorized in Table 1.4 below:
Table 1.4: Mining Method Selection Criteria
| Orebody Geometry | Mining Method |
| Dip > 55 degrees, Thickness > 5m | Longitudinal Long hole Stoping (including Avoca) |
| Dip < 55 Degrees, > 5m | Mechanized Cut and Fill |
In general, conventional mechanized mining methods have been selected. The basis of the development of the mining methods and consequent equipment selection has been that SilverCrest will undertake production drilling, blasting and loading using a contractor for the waste rock and ore haulage to surface. Initially a contractor will be retained to carry out mine development, with jumbo drill rigs purchased later in the mining life, after which development will be done in house. Approximately 81% of stoping will be by long hole method and 11% by cut and fill methods. Most long hole stopes are produced early in the mine schedule. Average stope width is 10.0 metres.
Conventional open pit mining will continue using a contractor until the second quarter of 2015 when open pit reserves are depleted. Mining of the heap leach spent ore (“pad ore”) will be completed by loader and conveyor to transport material to the plant until 2021.
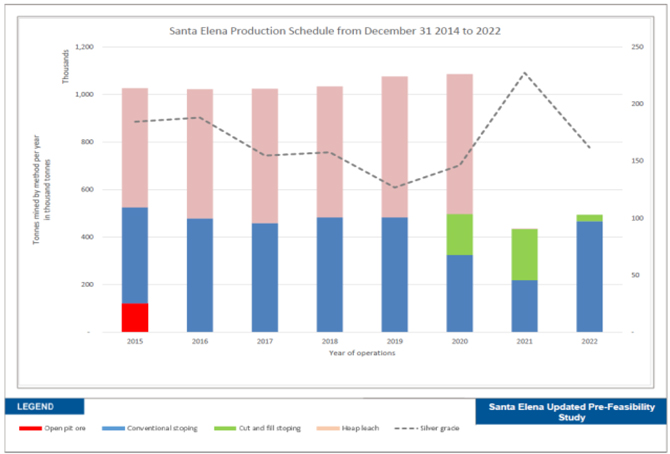
The mining schedule estimates the tonnages to be mined from the underground, open pit and the existing heap leach facility to feed the process plant at a nominal rate of 3,000 tpd. Table 1.5 shows the combined schedule for the Santa Elena Project. The schedule is based on optimizing higher grade long hole stopes first, with more costly cut and fill mining left for later in the mine life.
Table 1.5: Summary of Mining Schedule
| Aspect of operations | 2015 | 2016 | 2017 | 2018 | 2019 | 2020 | 2021 | 2022 | Total
Life of
Mine |
| Total Tonnes Underground | 462,200 | 543,000 | 521,100 | 535,400 | 493,700 | 497,600 | 434,300 | 494,300 | 3,981,600 |
| Total Tonnes Leach Pad | 502,300 | 543,200 | 565,100 | 550,800 | 592,500 | 588,600 | 2,200 | - | 3,344,700 |
| Total Tonnes Open pit | 121,700 | - | - | - | - | - | - | - | 121,700 |
| Total Tonnes Processed | 1,086,200 | 1,086,200 | 1,086,200 | 1,086,200 | 1,086,200 | 1,086,200 | 436,500 | 494,300 | 7,448,000 |
| Total Gold Ounces Sold | 45,000 | 45,500 | 37,200 | 35,800 | 29,400 | 38,300 | 23,500 | 16,100 | 270,700 |
| Total Silver Ounces Sold | 2,048,400 | 2,111,400 | 1,750,000 | 1,888,800 | 1,487,200 | 1,492,100 | 953,500 | 914,800 | 12,646,200 |
Note: all numbers rounded
| | SANTA ELENA UPDATE TECHNICAL REPORT |
| | EFFECTIVE DATE: DECEMBER 31, 2014 |
| | |
| 1.4.1 | Underground Production |
For the purpose of this UPFS, an underground mining schedule has been developed for the stopes in the reserve model and for development required to access the stopes throughout the life of mine. The mining schedule results in grade and tonnage performance as shown in Figure 1.1. Peak production is reached in year 6. A 50/50% mix (underground to pad ore) is assumed for the first 6 years in the schedule.
Figure 1.1: Summary of annual tonnes and grade for the life of mine
The ore from both underground and open pit resources will be processed by conventional milling and cyanide leaching technology. In addition partially leached material from the existing heap leach operations will be blended with open pit and underground ore at a variable rate and reprocessed through the same plant.
Santa Elena ore (Open Pit, Underground and Leach Pad) contains an estimated grade of 1.23 g/t Au and 78.4 g/t Ag and after crushing and grinding can be leached in cyanide to yield approximately 92% Au recovery and 67.5% Ag recovery. Because of the relatively high level of silver in the ore (and hence solutions) there are advantages and benefits to using traditional CCD and Merrill-Crowe for metal recovery rather than CIL/CIP. The partially leached heap ore yielded recoveries of approximately 60% Au and 30% Ag when crushed to 10 mm and processed on the heap leach (partial leach cycle to Q2 2014). On re-leaching after grinding in the new plant, the balance of the metals are recovered to the level expected from new ore from open pit and underground indicates as 92% for gold and 67.5% for Ag.
| | SANTA ELENA UPDATE TECHNICAL REPORT |
| | EFFECTIVE DATE: DECEMBER 31, 2014 |
| | |
The process plant has been designed to treat a nominal 3000 tonne per day (tpd) of ore, a mixture of freshly mined material and partially leached heap leach residue. The plant has been designed to treat any proportion of these two types of feed.
| 1.6 | Project Infrastructure |
Initially, the Santa Elena open pit heap leach mine was constructed in late 2009 and 2010, and was operational from 2010 to 2014. During 2013 and 2014 the open pit heap leach was transitioned into an underground, milling, and CCD/Merrill Crowe 3,000 tpd processing facility. As of December 31, 2014, all transition projects have been fully constructed, commissioned and commercial production announced. There are a number of facilities currently in use at the Santa Elena site.
Much of the same infrastructure facilities utilized for the open pit mine continue to be used for the new operations, including, but not limited to, access roads, waste dumps, explosive magazines, office buildings, fuel storage facilities, power generation, primary crushing equipment, heap leach pads and solution collection ponds. The material on the existing heap leach facility will be removed, adding additional space on the facility for rehandling of the tailings prior to transport by truck to the waste dump as dry stack tailings. With the removal of pad ore, areas will be open for additional pad loading in the future. The additional commissioned facilities as part of the UPFS include:
| 1. | A new CCD – MC processing facility. |
| 2. | Upgrade of surface power generation facility. |
| 3. | Construction of the underground decline and development (ongoing). |
| 4. | A ventilation shaft with ventilation fans (shaft completed from 625m level to surface, fans installed in H1 2015). |
| 5. | A fresh air raise which will act as an escape way. |
| 6. | Underground water recirculation facilities. |
| 7. | Underground electrical distribution system. |
| 8. | Underground maintenance facilities (ongoing). |
| 9. | Dry stack tailings disposal facility (incorporated onto existing waste rock dump -. |
| 10. | Additional surface facilities such as mine dry and maintenance shops for the underground mine. |
| 11. | New warehouse for storage and inventory. |
| 12. | Expansion of on-site laboratory (ongoing). |
| 13. | Upgrade to electronic security system including CCTV. |
| 14. | Expansion of exploration core storage facility (ongoing). |
| | SANTA ELENA UPDATE TECHNICAL REPORT |
| | EFFECTIVE DATE: DECEMBER 31, 2014 |
| | |
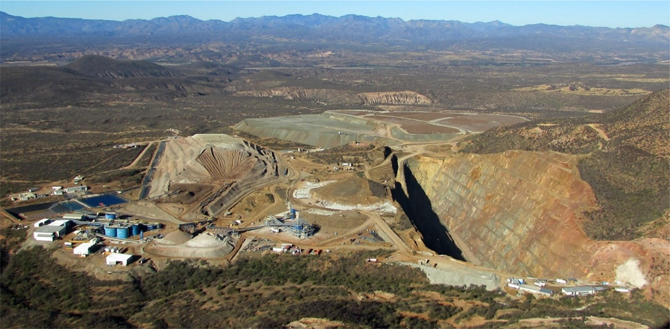
The Santa Elena Mine is located in the foothills of a north-south trending mountain range. Foothills area provides ample space to all required facilities and potential for future expansion.
| 1.7 | Capital and Operating Costs |
SilverCrest has estimated total sustaining capital costs during the LOM of $31 million dollars including contingency, which includes $4.8 million budgeted for surface and underground drilling. SilverCrest has estimated total operating costs ranging between $43 and $69 per tonne of ore processed, depending on mining method. The majority of the revised Reserve in this UPFS has assumed an approximate 50% underground ore to 50% pad ore blend. An average operating cost based on this assumption is $46.85 per tonne of ore including sustaining capital.
Table 1.6: Capital Cost Summary
| Sustaining capital cost table including exploration drilling expense |
| Site infrastructure | $2,066,200 |
| Mill sustaining capital | $1,785,000 |
| Underground waste development expenses | $16,086,600 |
| Underground equipment and infrastructure | $6,236,300 |
| Underground and 2015 surface drilling | $4,783,300 |
| Total capital costs | $30,957,400 |
Operating costs for the Santa Elena Project have been estimated for the underground mining, processing costs and general and administrative costs as summarized in Table 1.7. SilverCrest has estimated the LOMP operating costs at an average of $46.85 per tonne of ore processed.
Table 1.7: Operating Costs
| Mining Method | Open Pit | Underground Long Hole Average | Underground Cut & Fill Average | Leach Pad Reprocess |
| Process Method | CCD Mill | CCD Mill | CCD Mill | CCD Mill |
| Mining Cost/T ore1 | $ 9.90 | $28.71 | $50.00 | $0.002 |
| Processing Cost/T3 | $24.49 | $24.49 | $24.49 | $24.49 |
| General & Administration/T4 | $ 5.41 | $ 5.41 | $ 5.41 | $ 5.41 |
1Long hole stopes are 89% of designed stopes by volume and cut & fill stopes are 11% of designed stopes by reserve volume. Excludes ore development costs. It includes adjustment for exchange ratio impact in the mining costs.
2Mining cost of spent ore on leach pad is covered under processing costs.
3Processing includes crushing, milling, site refining and dry stack tailings disposal.
4Estimated based on current operations and may vary on an annual basis. A 4% annual inflation rate has been applied to general and administrative costs.
SilverCrest prepared an economic evaluation of the Santa Elena Project based on a pre-tax economic model and a post-tax model. For the economic analyses long-term consensus metal prices and exchange rate (as of December 31, 2014) used in the base case were as follows:
| § | Price of gold – range defined as $1,250 (2015), $1,275 (2016) and $1,300 for remaining years for LOMP; |
| § | Price of silver - range defined as $18 (2015), $19 (2016), $20 (2017) and $21 for remaining years for LOMP; |
| | SANTA ELENA UPDATE TECHNICAL REPORT |
| | EFFECTIVE DATE: DECEMBER 31, 2014 |
| | |
| § | Closure costs of $6 million; and |
| § | Sandstorm receives 54,133 ounces of gold and pays SilverCrest an average price of $412/oz. |
The pre-tax economic model was established on a 100% equity basis, excluding debt financing and loan interest charges. The economic results of the base case and the two alternative cases are presented in Table 1.8.
Table 1.8: Base Case Economic Analyses Results
| Aspects of Santa Elena UPFS Economic Analyses (Base Case) |
| Production |
| Gold Ounces Sold - post refiner credit1 | 270,700 |
| Silver Ounces Sold - post refiner credit | 12,646,200 |
| Revenue | $(000) |
| Gross Sales2 | $554,530 |
| Operating Expenses3 |
| Total Operating Costs4 | $348,900 |
| Freight & Refining | $5,750 |
| Closure Costs | $6,000 |
| Sustaining Capital Expenses |
| Underground & Surface Drilling 5 | $4,780 |
| Sustaining Capital Costs6 | $26,170 |
| Pre-Tax Undiscounted Cash Flow |
| Total Cash Flow | $162,930 |
| Pre-Tax Economic Results |
| Pre-Tax NPV, DCF @ 5% | $143,840 |
| Post-Tax Economic Results |
| Post-Tax NPV, DCF @ 5% | $119,170 |
Note: All numbers rounded.
1Sandstorm to be delivered an estimated 54,000 ounce of gold over remaining LOMP.
2The financial model adopted a range of realized spot prices from 2015 to 2022. Gold prices ranged from $1,250 to $1,300 per ounce and silver prices ranged from $18 to $21 per ounce.
3Excludes 0.5% governmental environmental fee of an estimated $3 million.
4Approximate operating cost per AgEq ounce sold varies between $9 and $16 over the life of mine
5All LOMP underground drilling costs and only 2015 surface program costs included.
6Excludes sunk costs, up to December 31, 2014.
Metal price sensitivities were completed including spot price as $1,193/oz Au and $16.16/oz Ag (representing spot price at the middle of December, 2014) which showed a pre-tax NPV (DCF @ 5%) of $84.3 million.
| | SANTA ELENA UPDATE TECHNICAL REPORT |
| | EFFECTIVE DATE: DECEMBER 31, 2014 |
| | |
Table 1.9: Comparison between the Base Case and the Spot Price for the Pre-Tax Economic Results
| Item | Base Case | Spot Price |
| Gold Price (US$/oz.) | Range of Prices/yr | $ 1,193 |
| Silver price (US$/oz.) | Range of Prices /yr | $ 16.16 |
| | | |
| Pre Tax DCF NPV @ 5.0% in millions | $144 | $84 |
| Post Tax DCF NPV @ 5.0% in millions* | $119 | $76 |
* Post tax results have been included in section 22 for a 30% tax rate, Mexico Mining royalty and Environmental fee
The economic analyses considers SilverCrest delivering 54,133 ounces of gold to Sandstorm Gold Ltd. (“Sandstorm”) at an average price of $412 per ounce ($350 to $450 per ounce with annual 1% inflationary increases) under the Sandstorm Purchase Agreement executed on May 14, 2009. The Purchase Agreement includes an option for Sandstorm to participate in the Santa Elena underground mine, which Sandstorm had elected to exercise in February 2014. The Purchase Agreement only applies to the original Santa Elena concessions and excludes recent regional acquisitions.
| 1.9 | Update to Pre-Feasibility Recommendations |
Further optimization of the mine schedule is warranted to investigate continued grade optimization versus stoping costs (long hole or cut and fill), potential to expand and accelerate increased underground production with a second ramp and expand resources with subsequent reserves. Further underground geotechnical studies are required to better optimize development and stoping and to ensure a safe working environment. Mineralization at Santa Elena is open in most directions with excellent potential to further increase resources and reserves for increased production and mine life. Further infill and expansion drilling is recommended. The El Cholugo zone is located immediately adjacent to the Main Mineralized Zone or MMZ and is a priority target in 2015 for potential resource and reserve expansion. Silver recoveries in the new plant facility need further metallurgical work to potentially increase recovery rates. Recommended budget for further work is estimated at $5 million to be spent over several years.
SilverCrest has estimated the costs for completion of the above recommended studies as summarized in the Table 1.10 below:
Table 1.10: Breakdown of future costs related to recommendations
| Recommendation | Future work | Estimated cost |
| Geology and Underground Resources | An infill drilling program consisting of roughly 20,000m of drilling | $4.70 million |
| Geotechnical Recommendations | Geotechnical design study for underground | $ 200,000 |
| Metallurgical Test work | Grinding, CN rates, oxidation, PbNO3, retention timing for better silver recoveries | $ 100,000 |
| Total future costs related to recommendations | $ 5 million |
| | SANTA ELENA UPDATE TECHNICAL REPORT |
| | EFFECTIVE DATE: DECEMBER 31, 2014 |
| | |
This Technical Report has been completed by SilverCrest Mines Inc. (SilverCrest) as an update to the Pre-Feasibility Report (“UPFS”) completed in April 2014, and to support a revised Mineral Reserve Estimate and Life of Mine Plan. The effective date of the report is December 31, 2014. This date acts as a cut-off to all data used for the calculation of Mineral Resources, Mineral Reserves and the Economic Analyses. Discussion on recent exploration and acquisition following the effective is included within the report.
Nusantara de Mexico S.A. de C.V., a 100% owned Mexican subsidiary of SilverCrest (SilverCrest for the purposes of this report), holds the rights to the Santa Elena Mine and is a legal operating entity of SilverCrest.
This report conforms to National Instrument 43-101 Standards of Disclosure for Mineral Projects (NI 43-101 and Form 43-101F1) and incorporates the Canadian Institute for Mining, Metallurgy and Petroleum Definition Standards for Mineral Resources and Mineral Reserves (CIM Definition Standards).
| 2.1 | Report Author and Qualified Person |
SilverCrest is a Producing Issuer, as defined by National Instrument 43-101, and as such are entitled to Qualify and disclose material and technical information relating to the Santa Elena Mine with non-independent Qualified Persons. This report has been prepared by, and under the supervision of, Mr. N. Eric Fier, C.P.G., P. Eng, Chief Operating Officer of SilverCrest Mines Inc. Mr. Fier is a Qualified Person as defined by CIM Definition Standards.
| 3.0 | Reliance on other Experts |
Several independent consultants provide Iinformation from other experts has not been used for the completion of this report. These consultants are not considered qualified persons for this Technical Report. The following assisted with providing SilverCrest with information within this report;
| A. | Bruce Davis, P.Geo. – February 2015 Santa Elena Resource Model Audit and Comment. |
| B. | Golder & Associates – March 2015 Santa Elena Mine – Life of Mine Plan Completed Work Summary. |
| C. | Larry Breckenridge, P.E., 2013 Asset Retirement Obligation Calculation, Technical Report, Global Resources Engineering, January 30, 2014. |
| D. | Larry Breckenridge, P.E., Geochemical Characterization of Tailings, Technical Memo, Global Resources Engineering, September 30, 2014. |
Other contributors to the report include:
| A. | Brent McFarlene, V.P. Operations for SilverCrest Mines Inc. |
| B. | Marcio Fonseca, P. Geo., V.P. Corporate Development for SilverCrest Mines Inc. |
| C. | Stephany Fier, Manager Technical Services for SilverCrest Mines Inc. |
| D. | Claudio Villamizar, Chief Mine Engineer for Santa Elena Mine |
| E. | Mohammad Dadmanesh, P. Eng., Mine Engineer consultant for SilverCrest Mines Inc. |
| | SANTA ELENA UPDATE TECHNICAL REPORT |
| | EFFECTIVE DATE: DECEMBER 31, 2014 |
| | |
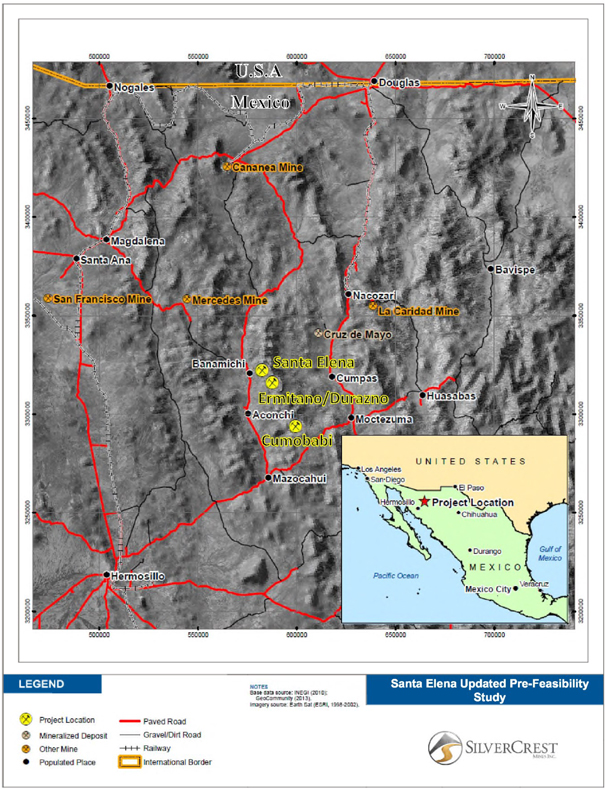
| 4.0 | Property Description and Location |
The Santa Elena mine site is approximately 150 km northeast of the state capital city of Hermosillo, Sonora, Mexico near the intersection of 30º 01' north latitude, and 110º 09' west longitude (Figure 4.1). The community of Banamichi is located 7 km west of the property. The area is covered by the INEGI “Banamichi” 1:50,000 topographic map H12-B83.
The Ermitaño property consists of two concessions, Ermitaño I and Ermitaño II approximately 145 kilometres northeast of Hermosillo and contiguous with SilverCrest’s Santa Elena Mine. Ermitaño I is near intersection 29° 59´ 29.25” north latitude and 110° 05´24.95” west longitude and 12km west of Banamichi. Ermitaño II is near intersection 29°55´ 18.97” North latitude and 110° 03´58.65” west longitude and 13km west of the community of Huepec. The Ermitaño I area is covered by the INEGI “Agua Caliente” 1:50,000 topographic map H12-B84 and Ermitaño II area is covered by the INEGI maps “Aconchi” H12-D13 and “Cumpas” H12-D14, 1:50,000 topographic maps.
The Cumobabi property consists of nine concessions approximately 140 kilometres northeast of Hermosillo near intersection 29° 45´ 34.88” North latitude and 109° 58´ 21.33” west longitude (Figure 4.1) and contiguous with SilverCrest’s Santa Elena Mine. The community of Baviacora is located 19km south west of the property. This area is covered by the INEGI maps “Aconchi” H12-D13, “Cumpas” H12-D14, “Baviacor”H12-D23 and “Rodeo” H12-D24, 1:50,000 topographic maps.
| | SANTA ELENA UPDATE TECHNICAL REPORT |
| | EFFECTIVE DATE: DECEMBER 31, 2014 |
| | |
Figure 4.1: Santa Elena Property Location
| | SANTA ELENA UPDATE TECHNICAL REPORT |
| | EFFECTIVE DATE: DECEMBER 31, 2014 |
| | |
| 4.1 | Mining Titles and Agreements |
Total hectares controlled by SilverCrest in the Santa Elena area are 51,173 (Table 4.1, Figure 4.2). The Santa Elena property consists of nine contiguous concessions with a total nominal area of 9,424.54 hectares, the Ermitaño properties consist of two concessions with a total nominal area of 16,526.77 ha, the Cumobabi property consist of eight concessions with a total nominal area of 25,221.2 hectares. The Santa Elena concessions are registered with Mexico Mines Registry in Hermosillo and Mexico City in the name of Nusantara de Mexico S.A. de C.V. (Nusantara), a wholly-owned subsidiary of SilverCrest. Nusantara filed the Santa Elena 7 concession which surrounds the five other concessions. All concessions were ground surveyed by a registered land surveyor at the time of staking. Ermitaño and Cumobabi are registered with Mexico Mines Registry in Hermosillo and Mexico City in the name of Minera Evrim S.A. de C.V., a subsidiary of Evrim Resource Corporation.
Table 4.1: List of Mining Titles for Santa Elena and Surrounding Properties
| Area | Concession
Number | Date | Concession Name | Owner | Size (ha) |
| Santa Elena | 192174 | 1983 | Santa Elena | Nusantara de Mexico | 24.2 |
| Santa Elena | 178094 | 1983 | Santa Elena No 4 Fraccion SE | Nusantara de Mexico | 0.06 |
| Santa Elena | 176544 | 1983 | California Nusantara de Mexico | Nusantara de Mexico | 18.0 |
| Santa Elena | 221460 | 1995 | Elena 5 | Nusantara de Mexico | 399.9 |
| Santa Elena | 223533 | 2003 | Santa Elena 6 | Nusantara de Mexico | 416.0 |
| Santa Elena | 227239 | 2006 | Santa Elena 7 | Nusantara de Mexico | 1,868.3 |
| Santa Elena | 180494 | 1983 | Santa Elena No 3 Fraccion SW Tungsteno de | Nusantara de Mexico | 0.06 |
| Santa Elena | 82/38909 | 2014 | El SALTO | Nusantara de Mexico | 1,710.0 |
| Santa Elena | 82/38917 | 2014 | EL SALTO 1 | Nusantara de Mexico | 4,988.0 |
| EL ERMITAÑO | 230421 | 2007 | EL ERMITAÑO 1 | Minera Evrim | 12,267.6 |
| EL ERMITAÑO | 235605 | 2010 | EL ERMITAÑO 2 | Minera Evrim | 4,259.2 |
| Cumobabi | 228838 | 2004 | EL APURO | Minera Evrim | 16,721.5 |
| Cumobabi | 232857 | 2008 | MARK 1 | Minera Evrim | 1,713.6 |
| Cumobabi | 232858 | 2008 | MARK 1 Fracción 1 | Minera Evrim | 5.7 |
| Cumobabi | 232856 | 2008 | MARK 2 | Minera Evrim | 3,499.1 |
| Cumobabi | 229051 | 2007 | POTRERITO | Minera Evrim | 1,913.2 |
| Cumobabi | 221119 | 2003 | LA CALMA | Minera Evrim | 150.0 |
| Cumobabi | 232855 | 2008 | MARK 3 | Minera Evrim | 169.0 |
| Cumobabi | 236794 | 2010 | BABI | Minera Evrim | 1,049.2 |
| | Total | 51,172.5 |
*Note: The surface areas (hectares) have been updated using post-2013 PFS from revised surveys. Minera Evrim concessions are
under option to Nusantara and can be 100% acquired after meeting agreement obligations, as presented below.
Mining regulations in Mexico provides that all concessions are to be valid for a period of 50 years. Taxes are based on the surface area of each concession and are due in January and June of each year at a total annual cost of approximately $380,000. All tax payments have been paid by Nusantara to date.
| | SANTA ELENA UPDATE TECHNICAL REPORT |
| | EFFECTIVE DATE: DECEMBER 31, 2014 |
| | |
On December 8, 2005, Nusantara had the right to acquire a 100% interest in the Santa Elena property from Tungsteno de Mexico SA de C.V. On August 14, 2009, Nusantara exercised the option to acquire 100% of the Santa Elena property.
On November 12, 2007, Nusantara signed an agreement with the Community of Banamichi (Ejido) for a 20 year lease on surface rights for a maximum of 841 ha with respect to exploration and exploitation. Lease payments were dependent (at Nusantara’s discretion) on the number of hectares required for a given year. A minimum of 285 ha was required for initial exploitation. Currently 431 ha are under lease for exploitation and exploration. The annual cost per year ranged from approximately $55,000 to $160,000 dependent on the number of hectares required. Lease obligations have been met to date.
On January 30, 2014, Nusantara signed an option agreement with Evrim Resources Corp. (Evrim) whereby SilverCrest can acquire a 100% interest in Evrim’s Ermitaño Property after paying US$75,000 upon signing (paid) and US$50,000 each anniversary thereafter, complete a minimum of US$500,000 in exploration expenditures in the first year, and deliver a Production Notice within five years, specifying mine and construction plans with accompanying permits. Upon completion of this exercise, the annual payments will cease and Evrim will retain a 2% Net Smelter Royalty (NSR).
On November 7, 2014, Nusantara signed a five year option agreement with Evrim Resources Corp whereby SilverCrest can acquire 100% interest in Evrim’s Cumobabi Property after paying UG$75,000 upon signing and US$50,000 on each anniversary thereafter, completing a minimum of US$500,000 in exploration expenditures by the second anniversary and delivering a Production Notice within five years, specifying mine and construction plans with accompanying permits. Upon completion of this exercise, the annual payments will cease and Evrim will retain a 1.5% Net Smelter Royalty (NSR).
| | SANTA ELENA UPDATE TECHNICAL REPORT |
| | EFFECTIVE DATE: DECEMBER 31, 2014 |
| | |
Figure 4.2: Santa Elena and Surrounding Area Property Map;
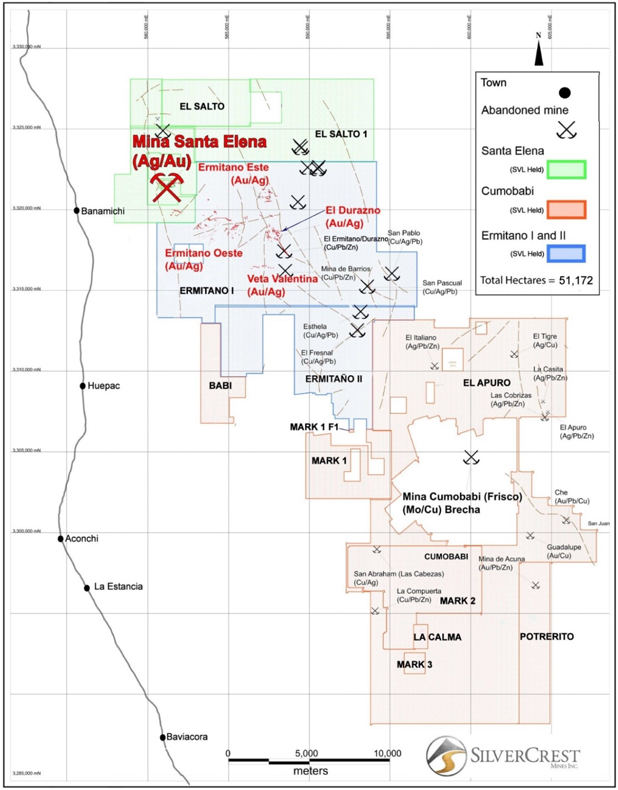
Note: boundaries shown on concession map are approximate and not confirmed from legal survey, and surrounding land and concession title owners are omitted from the map
| | SANTA ELENA UPDATE TECHNICAL REPORT |
| | EFFECTIVE DATE: DECEMBER 31, 2014 |
| | |
No known private or state royalties currently exist for the Santa Elena Mine. Ermitaño I and II are subject to a 2% NSR and Cumobabi is subject to a 1.5% NSR upon to Evrim Resources Corp. upon completion of the option agreements. A 3rd party underlying 2% NSR applies to all Evrim concessions.
On May 14, 2009, SilverCrest entered into a definitive Purchase Agreement with Sandstorm Gold Ltd. (Sandstorm) under which SilverCrest’s wholly-owned Mexican subsidiary, Nusantara de Mexico S.A. de C.V., agreed to sell 20% of future gold production from the Santa Elena open pit, or a total of 50,000 ounces gold, to Sandstorm in exchange for an Upfront Deposit of $12,000,000. The agreement also provides for ongoing per-ounce payments by Sandstorm equal to the lesser of $350 and the prevailing spot gold market price upon delivery of gold. In addition, Sandstorm issued $3.5 million common shares to SilverCrest. The per ounce price of $350 is subject to an increase of 1% per annum commencing on the 3rd anniversary of the date that Santa Elena Project began commercial production (i.e. July 2014).
On February 25, 2014 Sandstorm Gold Ltd. gave notice to exercise the Underground Mine Option for the Santa Elena Property. This Option allows Sandstorm to purchase 20% of the gold produced from underground operations (includes reprocessing the spent leach ore) at the Santa Elena Mine. In consideration of the exercised option, Sandstorm made an additional upfront deposit of US$10 million to SilverCrest on March 10, 2014 (paid) and will continue to make ongoing per ounce payments of US$350 until 50,000 ounces of gold have been delivered to Sandstorm, inclusive of 23,559 ounces (at December 31, 2014) already received, at which time the payments will increase to US$450 per ounce of gold (or the lesser prevailing spot gold market price), subject to an increase of 1% per annum.
| 4.4 | Environmental Liabilities and Permitting |
Currently, Nusantara has maintained all of the necessary permits for exploration and exploitation at the Santa Elena mine site. A Manifestacion de Impacto Ambiental (MIA) was submitted to Secretaría de Medio Ambiente y Recursos Naturales (SEMARNAT) in early January of 2013 for amendment of the land use licence related to the underground expansion project and was approved in May, 2013. This amendment approval allows for tailings facilities that were not previously required for the open pit and heap leach operation.
A mining concession in Mexico does not confer any ownership of surface rights. However, use of surface rights for exploration and production can be obtained under the terms of various acts and regulations if the concession is on government land. The Santa Elena concessions are located on Ejido (community or co-op) land, and as of November 12, 2007, an agreement with the surface owners has been signed which allows SilverCrest access and authorization to complete exploration and mine operations activities.
| | SANTA ELENA UPDATE TECHNICAL REPORT |
| | EFFECTIVE DATE: DECEMBER 31, 2014 |
| | |
Table 4.2: Permits for Santa Elena
| Permit | Mining Stage | Agency | Status |
| Environmental Impact Statement (MIA) | Construction/operation/abandonment | Secretary of environment and natural Resources (SEMARNAT)-State offices | in place |
| Land use change study | Construction/operation | SEMARNAT-General Department of Permitting for Forestry and soils (DGGFS)-State offices | in place |
| Land use license | Construction | Banamichi Municipality | in place |
| Explosive handling and storage permits | Construction | National Secretary of Defense (SEDENA). (Need approval from state and municipal authorities) | in place |
| Archaeological release letter | Construction | Construction Nation Institute of Archaeology and History (INAH) | in place |
| Water use concession title | Construction/operation/prior to utilization of water | National Commission of Water (CAN)-State offices | in place |
| Water discharge permit | Operation | CAN-(State offices) | in place |
| Construction permit | Construction | Municipality of Banamichi | in place |
SilverCrest has maintained all of the necessary permits for direct exploration and drilling at the Ermitaño and Cumobabi project site. Ermitaño concessions are located on private properties and an agreement with the surface owners has been signed which allows SilverCrest access and authorization to complete exploration and mine operations activities.
Table 4.3: Permits for Ermitaño
| Permit | Mining Stage | Agency | Status |
| Preventive Environmental Impact Report and Resolution | Road conditioning and Direct Exploration | Secretary of Environment and Natural Resources (SEMARNAT) – State Offices | In place |
| Surface Owners Agreement | Access, Direct Exploration and Drilling | Surface Owners | In place |
| Drilling and Direct Exploration “Ermitaño 1” | Direct Exploration | Secretary of Environment and Natural Resources (SEMARNAT) – State Offices | In Place |
| Drilling and Direct Exploration “Ermitaño 2” | Direct Exploration | Secretary of Environment and Natural Resources (SEMARNAT) – State Offices | In Place |
| Drilling and Direct Exploration “Durazno” | Direct Exploration | Secretary of Environment and Natural Resources (SEMARNAT) – State Offices | In Place |
| Drilling and Direct Exploration “Ampliación Durazno” | Direct Exploration | Secretary of Environment and Natural Resources (SEMARNAT) – State Offices | In Place |
| | SANTA ELENA UPDATE TECHNICAL REPORT |
| | EFFECTIVE DATE: DECEMBER 31, 2014 |
| | |
| 5.0 | Accessibility, Climate, Local Resources, Infrastructure and Physiography |
The Santa Elena property can be accessed easily year round by paved highways 90 km east from Hermosillo to Ures, then 50 km north along a paved secondary road to the community of Banamichi, then by a maintained gravel road that runs east for 7 km to the mine site.
The climate is typical for the Sonoran desert, with a dry season from October to May. Average rainfall is estimated at 300 mm per annum. There are two wet seasons, one in the summer (July to September) and another in the winter (December). The summer rains are short with heavy thunderstorms whereas the winter rains are longer and lighter. Seasonal temperatures vary from 0ºC to 40ºC. Summer afternoon thunderstorms are common and can temporarily impact the local electrical service. Flash flooding is common in the area.
The main supply well currently used at the mine site, PSA-1, was installed and tested in September 2009 and a pump installed at approximately 109 metres depth. Pumping tests indicated the well was located in a confined aquifer with a potential association to geothermal sources and an estimated sustained supply of 25 L/s, sufficient to support the open pit mining operation (Breckenridge, 2010).
Well PSA-2 was constructed in the summer of 2011 as a back-up well to support Santa Elena Mine’s primary water supply, Well PSA-1 (formally MW-1). The well is 171 metres deep, and screened from a depth of 72m to the base of the well. There is a steel casing that extends from surface to a depth of 72m. The casing and screen section are eight inches in diameter. The well was started by using an air rotary drill; however, due to the unstable and unconsolidated nature of sediment in this portion of the sand and gravel aquifer the well was completed using a mud rotary drill.
The well was pumped at a rate of 10.6 litres per second (lps) over a 72 hour period, and the final measured drawdown in the well was approximately 20 metres. During the pumping test the water level dropped from its static level at 68m to a depth of 90m within a few minutes. The water level stabilized at 90 metres after two hours of pumping. The testing suggests that the well could be pumped indefinitely at a rate of 10.6 lps with no increase in drawdown (GRE, 2011a). The safe yield of the well is 12.9 lps, based on the criterion that drawdown equivalent to 25% of the aquifer thickness is allowable (GRE, 2011a).
Due to the presence of the screen and the fact that it is open to a smaller aquifer depth, it is noted that Well PSA-2, although very productive, is less productive than Well PSA-1. The screen in general reduces the ability of water to enter the well, and the vertical-slot screen used in Well PSA-2 was not optimized for maximum yield. The pumping test indicates that there is minor hydraulic interference between the two water wells, and that the cumulative safe yield of the well field, with both wells pumping at the same time is 35 lps (GRE, 2011a).
The mine site including newly completed expansion has adequate water supply for operations.
| | SANTA ELENA UPDATE TECHNICAL REPORT |
| | EFFECTIVE DATE: DECEMBER 31, 2014 |
| | |
A minor amount of electrical line power available from nearby sources currently supplies municipalities and agriculture, but is insufficient for the Santa Elena operation. Power for current operations is provided by diesel generators. Provision of grid power is possible in the future, but requires permitting and a significant capital expenditure.
The Santa Elena Mine is located near to the village of Banamichi for which accommodations and local food services are found. The mining centre of Cananea is the closest sizable urban area (pop. est. 30,000), and is located approximately 100 km north by road from the Santa Elena mine site. Most services and supplies are available in Cananea. Sonora’s capital city, Hermosillo, is located approximately 150 km southwest of the property, and is regarded as the main industrial hub for the majority of the local mining operations. Services are available for heavy machine purchase and repair, materials fabrication, and engineering services. Alternatively, Tucson Arizona is approximately a 4 hour drive north across the international Mexican USA border from the Santa Elena mine site.
Northern Mexico has significant precious and base metal mines and there is a significant workforce of trained mining and processing personnel. Many of the trades and skills learned in the region would be transferable to the new operations. The nearby Cananea and La Caridad mines are amongst the largest mines in North America.
| 5.4 | Existing Infrastructure |
The Santa Elena mine and processing facility was initially constructed between 2009 and 2010 with expansion in 2013 and 2014. The new mine infrastructure is described in further detail in Section 18.0. Generally, the following operational infrastructure is in place or under ongoing construction:
| § | A new CCD – MC processing facility; |
| § | Upgrade of surface power generation facility; |
| § | Construction of the underground decline and development (ongoing); |
| § | A ventilation shaft with ventilation fans (shaft completed from 625m level to surface, fans installed in H1 2015); |
| § | A fresh air raise which will act as an escape way; |
| § | Underground water recirculation facilities; |
| § | Underground electrical distribution system; |
| § | Underground maintenance facilities (ongoing); |
| § | Dry stack tailings disposal facility (incorporated onto existing waste rock dump); |
| § | Additional surface facilities such as mine dry and maintenance shops for the underground mine; |
| § | New warehouse for storage and inventory; |
| § | Expansion of on-site laboratory (ongoing); |
| § | Upgrade to electronic security system including CCTV; and |
| § | Expansion of exploration core storage facility (ongoing). |
| | SANTA ELENA UPDATE TECHNICAL REPORT |
| | EFFECTIVE DATE: DECEMBER 31, 2014 |
| | |
The Santa Elena property is located on the western edge of the north trending Sierra Madre Occidental mountain range geographically adjacent to the Sonora River Valley. Property elevation ranges from 800 m ASL to 1,000 m ASL. The property is located on the range front at a low elevation in relation to the mountains immediately east and west respectively.
Vegetation is scarce during the dry season, limited primarily to juvenile and mature mesquite trees and cactus plants. During the wet season, various blooming cactus, trees and grasses are abundant in drainage areas.
This section has been adapted from the initial Mineral Resource report authored by Fier (2007), who conducted much of the original research into historical work on the property through archived company and government records. This historical account is considered informational and has not been relied upon for the current study. Most of the historical underground workings have been removed by the SilverCrest open pit mining operations.
Earliest records of work on the property are from the late 19th to early 20th century when an English company by the name of Consolidated Fields operated a mining operation at Santa Elena until the onset of the Mexican Revolution in 1910. It is estimated that the most extensive underground development on the property occurred during this period. The development included a 450 ft. (137 metres) two compartment shaft, a single compartment 100 m inclined shaft, and eight to nine working levels at a spacing of approximately 15 m to 20 m with numerous cross-cuts and raises. The two compartment shaft was caved near the surface prior to current development and the depth was not been verified. Four of the levels (surface to 75 m in depth) and a total of approximately 1.5 km of development were accessed by SilverCrest in 2006. The other levels were not accessible due to unsafe ground conditions. Stoping in the upper accessible levels removed an estimated 57,000 tonnes as determined by a void survey conducted by SilverCrest in 2010. No detailed production records are available for the Consolidated Fields work; however, SilverCrest estimates that approximately 35,000 tonnes of the original tailings from Consolidated Fields’ operations remain on-site. During the 1960’s, Industrias Peñoles S.A de C.V. drilled two or three holes on the property. No records are available for this drilling.
During the early 1980’s, Tungsteno de Baviacora (Tungsteno) mined 45,000 tonnes grading 3.5 g/t gold and 60 g/t silver from an open cut at Santa Elena. This material was shipped for processing to the company’s flotation mill near Baviacora, approximately 30 km southwest of Santa Elena. The 50 tonne (short tonne) per day mill was specifically built for processing tungsten ores from a nearby deposit from 1977 to 1983. The tonnage from Santa Elena was supplemental to the tungsten production. Very limited records from the production are available but the owner has stated that recovery was adequate for the Santa Elena tonnage but that some metal concentration still remains in the tailings on site.
After 2003, Tungsteno periodically surface mined high silica/low fluorine material from Santa Elena and shipped it to the Grupo Mexico smelter in El Tajo near Nacozari, approximately 60 km to the northeast.
During 2003, Sergio A. Trelles Monge, CPG and Qualified Person conducted an exploration program for Tungsteno at Santa Elena. Sr. Trelles was not considered an “independent” QP for the purposes of this work. The program consisted of the collection of 117 surface and underground samples. A sample summary report is available for review but sample lengths and locations are not clear. In late 2003, Nevada Pacific Gold Inc. of Vancouver, BC completed a brief surface and underground sampling program with the collection of 119 samples. A report was completed but subsequently misplaced. Only the ALS-Chemex assay sheets and a rough location map were available for review. The property remained under control of Tungsteno.
| | SANTA ELENA UPDATE TECHNICAL REPORT |
| | EFFECTIVE DATE: DECEMBER 31, 2014 |
| | |
In early 2004, Fronteer Development Group of Vancouver, BC, completed an extensive surface and underground mapping and sampling program. A total of 145 channel samples (89 underground and 56 surfaces) were collected and analyzed by ALS-Chemex of Hermosillo, Mexico. The property remained under control of Tungsteno. This data was used by SilverCrest for early exploration and target development.
On December 8, 2005, SilverCrest, through its 100% owned subsidiary Nusantara, entered into an option agreement with Tungsteno to acquire a 100% interest in the Santa Elena property through staged option payments over 5 years. SilverCrest completed payments as per the terms of the agreement in August of 2009. SilverCrest’s Santa Elena mine has been in commercial production of gold and silver since July, 2011.
| 7.0 | Geological Setting and Mineralization |
| 7.1 | Regional Geological Setting |
Santa Elena is located in northwestern Mexico where much of the geology can be attributed to the subduction and related volcanism of the Farallon Plate beneath the North American Plate. The east-directed subduction of the Farallon Plate began approximately 200 Ma ago with the tectonic rifting of the supercontinent Pangea (Rogers 2004). The resulting NW-SE trending Sierra Madre Occidental extends from the USA-Mexican border to Guadalajara in the southeast, a distance of over 1,200 kilometres.
Delgado-Granados et al. (2000) propose that subduction of the Farallon Plate occurred at a relatively shallow angle, resulting in continental uplift across northern Mexico with accretionary terrains developing along the western fringes. The shallow subduction is also thought to be responsible for the tectonics that produced the Laramide orogeny.
Continental arc volcanism culminated with the Laramide orogeny in the early to late Eocene (Alaniz-Alvarez et al., 2007). The waning of compression coincides with E-W directed extension between late Eocene to the early Oligocene (Wark et al., 1990; Aguirre-Diaz and McDowell, 1991, 1993) along the eastern Sierra Madre Occidental flank and is considered to be the first formation stage of the Basin and Range province. By early to mid-Miocene, extension migrated west into Northern Sonora and along the western flank of the Sierra Madre Occidental resulting in N-NW striking normal faults. This extensional regime caused major deformation across the Sierra Madre Occidental resulting in exhumation of pre-Cambrian basement rocks, especially in the Northern Sierra Madre Occidental (Ferrari et. al., 2007).
Northwest trending shear and fault zones appear to be an important control on mineralization in the Sonora region. Mineralizing fluids may have been sourced from Cenozoic intrusions. The structural separation along the faults formed conduits for mineral bearing solutions. The heat source for the mineralizing fluids was likely from the plutonic rocks that commonly outcrop in Sonora.
Many significant porphyry deposits of the Sierra Madre Occidental occur in the Lower Volcanics and are correlated with the various Middle Jurassic through to Tertiary aged intrusions. These include Cananea, Nacozari and La Caridad. (Ferrari et. al., 2007). In Sonora, emplacement of these systems has been influenced by the early Eocene E-W and ENE-WSW directed extension. The Santa Elena vein has a similar orientation to this extensional trend.
The silicic volcanism is thought to be related to fractional crystallisation of mantle sourced basalts from subduction (Johnson, 1991; Wark, 1991). Ferrari et al (2007) summarises five main igneous deposits of the Sierra Madre Occidental:
| § | Plutonic/volcanic rocks: Late Cretaceous –Paleocene; |
| § | Andesite and lesser Dacite-Rhyolite: Eocene (Lower Volcanic Complex); |
| | SANTA ELENA UPDATE TECHNICAL REPORT |
| | EFFECTIVE DATE: DECEMBER 31, 2014 |
| | |
| § | Silicic ignimbrites: Early Oligocene & Miocene (Upper Volcanic Complex); |
| § | Basaltic-andesitic flows: late stage of and after ignimbrites pulses; and |
| § | Repeat and episodic volcanic events related to rifting of the Gulf of California (alkaline basalt and ignimbrite) emplaced to western flanks: Late Miocene Pliocene and Quaternary. |
To the west of the Sierra Madre Occidental are the parallel ranges and valleys that show structural similarities to the extensional tectonic regimes of the Basin and Ranges Province to the east. Elevations in the west are lower than the eastern Provinces, with transition to the Coastal plains and Gulf of California.
| 7.2 | Local and Property Geology |
The Santa Elena property is located at the northwestern extent of the Sierra Madre Occidental. The primary rock types observed on the property are Tertiary andesite and rhyolite flows (Figure 7.1). These units strike approximately N-S and dip 10º to 45º E-NE. The volcanic units in the immediate vicinity of the Santa Elena deposit exhibit propylitic to silicic alteration. Within the main mineralized structure, widespread argillic alteration and silicification proximal to quartz veining is present. Chloritic alteration increases away from the mineralized zone in the andesite beds.
| | SANTA ELENA UPDATE TECHNICAL REPORT |
| | EFFECTIVE DATE: DECEMBER 31, 2014 |
| | |
Figure 7.1: Santa Elena Property Geology Map

| | SANTA ELENA UPDATE TECHNICAL REPORT |
| | EFFECTIVE DATE: DECEMBER 31, 2014 |
| | |
The Main Mineralized Zone (MMZ) is hosted within an E-W trending structure that cross-cuts the volcanic units. The structure hosts an epithermal quartz calcite vein that has been mapped for approximately 1.2 kilometres in length, and ranges from 1 to 35 metres wide, averaging approximately 15 metres. The structure dips from 40º to 60º to the south, and has been drill-tested to approximately 600 m below surface.
Andesite and granodiorite dykes have been identified at the Santa Elena deposit which are adjacent and sub-parallel to the MMZ. The location of the mineralizing heat source has not yet been linked to any local plutonic phases. However, a large intrusion that exists approximately 10 km east and north of Santa Elena may be associated with the mineralization.
Mineralization along the MMZ is hosted in quartz and stockwork veining, and displays typical epithermal textures, including: banded quartz; vuggy quartz; and brown-black bladed calcite (pseudomorph to quartz) with many of these textures intermixed with hydrobreccia reworking. Some fracturing is found at localized fault intersections and adularia has been identified in many of the core holes.
In late 2007, an induced polarization (IP), resistivity and magnetometer geophysical survey was completed by Pacific Geophysical Ltd. of Vancouver, BC. Results showed the Main Mineralized Zone is a resistivity high (silica) and IP low (minor sulphides) that can be traced for approximately 1.2 km along strike of the zone.
The oxidation-reduction (redox) boundary within the deposit is noted to persist to a depth of approximately 100 metres below surface, with a transitional horizon for an additional 20-30 metres, or 120-130 metres total depth. Visually, the oxidized material is characterized by the presence of iron oxides, including limonite, jarosite, goethite and hematite along fractures and joints. The iron oxides are associated with gold and silver mineralization. Below the redox boundary, the vein remains intact as a milky white quartz-calcite vein with rare traces of fine grained pyrite, or primary iron-sulphides.
| 7.2.1.1 | Structural Geology at Santa Elena |
Northwest-Trending Veins
Northwest-trending splay and cross-cutting structures appear to influence mineralization at intersections with the MMZ and along a NW-SE (striking approximately 135 with steep westerly dip) trend in the footwall of the vein. These narrow quartz and calcite filled planar brittle structures appear to cross-cut and postdate the emplacement of the MMZ at Santa Elena.
The structures display weak alteration haloes of fine grained pyrite in addition to the presence of anomalous gold and silver concentrations. One of the thicker splays is the Tortuga Vein which strikes at 170 degrees and dips 75 degrees to the southwest. It has a strike length of approximately 300 metres with a true thickness varying between 0.2 to 4.46 metres, and averaging 2 metres. The Tortuga Vein is characterized by a greater presence of quartz and calcite with rhodochrosite and manganese. The vein tends to branch out into stock work zones and is erratic with pinching and swelling.
The El Cholugo Veins (I & II) are located in the footwall of the MMZ. The overall strike of these veins is 120 degrees and the dip is 65 degrees to the southwest. They are characterized by banded adularia throughout the majority of the vein. The veins thickness varies between 0.15 and 4.0 metres. To the northwest, the veins transitions into veinlets and stockwork.
| | SANTA ELENA UPDATE TECHNICAL REPORT |
| | EFFECTIVE DATE: DECEMBER 31, 2014 |
| | |
Interpreted Faults
Interpretation from surface, open pit and underground mapping, and drill hole intercepts has shown that there are eight major faults directly related to the Santa Elena MMZ.
"Major failures" are defined as the failures that have certainty to have cross-cut the MMZ, they are identified by letters.
The “Main Fault“ is located in the hanging wall of the MMZ and runs parallel to it. The fault has evidence of reactivation affecting the MMZ. The fault is in direct contact with the MMZ and is mapped at distances of greater than 30 metres from the vein. The main fault tends to diverge from the vein at depth.
"Faults" are defined as the secondary faults that cross-cut the MMZ and the Main Fault, and they are identified by letters (see Figure 10.1) .
Fault A typically forms cavities which are regularly filled with carbonates and have strong iron and manganese oxidation. This fault strikes at approximately 150 degrees with a dip of 48 degrees to the southwest until level 575 where the dip increases to 65 degrees. On level 600 and 575 there is a 2-3 metre displacement caused by the fault.
Fault B typically forms cavities with abundant presence of iron and manganese oxides. This fault strikes at approximately 130 degrees and dips 60 degrees to the southwest. There are zones where banded quartz is present with propylitic alteration and galena. On level 600 and 625 there are areas of up to 3 metres of displacement.
Fault C is striking 140 degrees and dips 60 degrees to the southwest. This fault is the eastern boundary of an internal stock work zone and contains supergene enrichment in the bottom of the fault.
Fault D is striking 135 degrees and dips 90 degrees to the southwest. This fault is the western boundary of an internal stock work zone.
Fault E strikes at 190 degrees and dips 72 degrees to the northwest. This fault causes a 5 metre displacement of the MMZ to the south. There is gouge present in the exposures of this fault and supergene enrichment at the bottom.
Fault F strikes at 130 degrees and dips 85 degrees to the southwest. This fault runs parallel to the Tortuga Vein.
Fault G strike nearly east-west and dips 45 to 70 degrees to the south paralleling the MMZ.
The Ermitaño Property hosts Late Cretaceous andesite and rhyolite volcanic rocks with major structures controlling the Santa Elena silver and gold low sulphidation epithermal mineralization. There are four main targets with widespread epithermal mineralization including:
| § | El Durazno - Comprises of two parallel east-west trending corridors of veining and stockwork mineralization with thickness ranging from 4 metres to 50 metres with outcropping for a defined cumulative strike length of approximately 900 metres. The first corridor (see attached Figure 7.2) is defined by outcropping of veining and stockwork in an area of 400 metres along strike and 50 metres wide with a total of 86 surface channel samples averaging 1.28 gpt Au. The second corridor is defined by outcropping of veining and stockwork in an area of 500 metres along strike and 50 metres wide with 129 surface channel samples averaging 0.34 gpt gold, trace silver. Evidence based on epithermal textures and more detailed mineralogical studies suggest a shallower level exposure in a low sulphidation epithermal environment compared to Santa Elena. |
| | SANTA ELENA UPDATE TECHNICAL REPORT |
| | EFFECTIVE DATE: DECEMBER 31, 2014 |
| | |
Figure 7.2: El Durazno property Geology
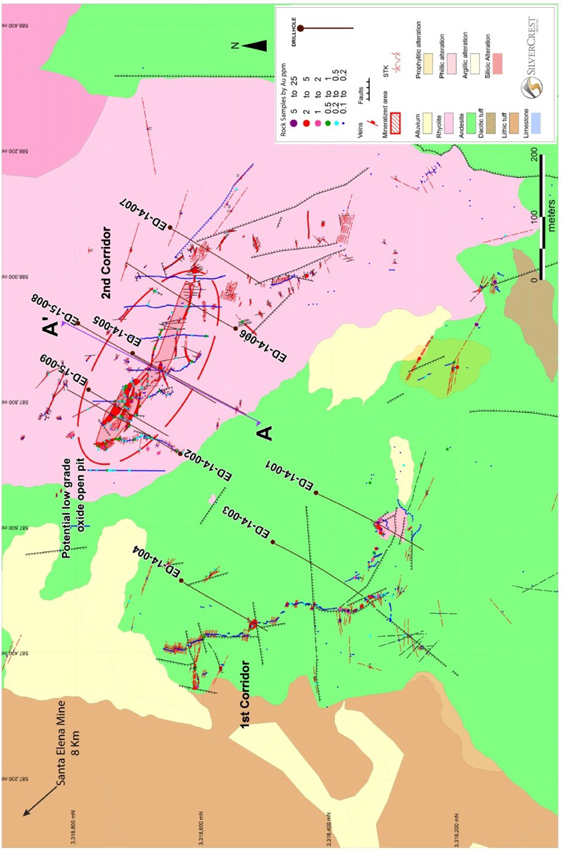
| | SANTA ELENA UPDATE TECHNICAL REPORT |
| | EFFECTIVE DATE: DECEMBER 31, 2014 |
| | |
| § | Ermitaño West - Contains a network of low sulphidation east–west trending epithermal veins and stockwork within an area of 1,200 metres long 600 metres wide with 546 surface channel samples averaging 0.17 gpt Au with surface grades up to 4.8 gpt gold, trace silver over 2.5 metres. Vein textures suggest a shallower level of exposure in the low sulphidation epithermal environment compared to Santa Elena. |
Photo 7.1: View of Vein Outcrop at Ermitaño West
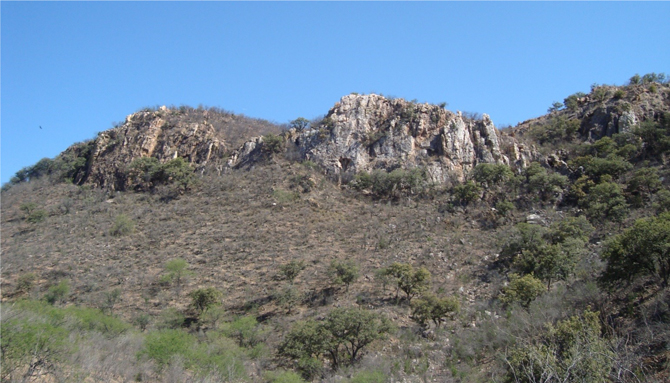
| § | Ermitaño East - Is an east–west trending galena bearing silver vein system with indications of two different levels of epithermal exposure (deep and shallow) compared to Santa Elena. Several select surface channel samples over 0.1 to 2.0 metres grade over 300 gpt silver. |
| § | Veta Valentina - Hosts a 1.2 kilometres long and 10 metres wide east-west trending structural corridor with low sulphidation epithermal veining. Results to date show 37 individual surface channel samples from a central zone (50 metres long – 10 metres wide) averaging 1.34 gpt gold and 33.2 gpt silver. |
| | SANTA ELENA UPDATE TECHNICAL REPORT |
| | EFFECTIVE DATE: DECEMBER 31, 2014 |
| | |
Photo 7.2: Showing Veta Valentia Epithermal Vein Outcrop
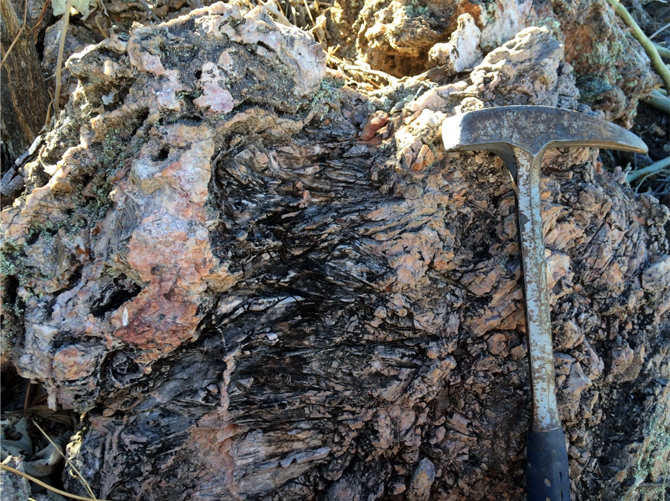
The Cumobabi Property is hosted within the same early Tertiary andesite and rhyolite volcanic rocks and with similarly oriented structures as those at the Santa Elena. Similarly, it is targeted as being a low sulphidaton silver and gold epithermal system. Initial exploration work is planned on Cumobabi in 2015.
All properties acquired or currently being acquired by SilverCrest are within a developing northwest – southeast trend estimated to be 25 kilometres long and 10 kilometres wide.
| | SANTA ELENA UPDATE TECHNICAL REPORT |
| | EFFECTIVE DATE: DECEMBER 31, 2014 |
| | |
Mineralization at Santa Elena occurs as a series of replacement veins, stockwork and hydrothermal breccias typical of other low-sulphidation epithermal deposits found in the Sierra Madre, and elsewhere in the world. Similar deposits include the La Colorada deposit in Sonora Mexico, Pinos Altos deposit in Chihuahau Mexico, El Peñón deposit in Chile, and those deposits occurring in the Midas and Oatman districts of Nevada and Arizona in the USA. These deposits form in predominantly sub-aerial felsic volcanic complexes in extensional and strike-slip structural regimes. Samples previously collected by various parties, including SilverCrest, show a geochemical signature consistent with a high calcium, high level, low-sulphidation system (Au-Ag-Sb-Pb-Zn-Ba-Ca-Mn).
The mineralization is the result of silica-rich fluids ascending into a structurally controlled, near-surface environment. Mineral deposition takes place as the fluids undergo cooling by fluid mixing, boiling and decompression. Brecciation of the mineralized zone appears to be due to explosive venting from an assumed intrusive at depth. The Main Mineralized Zone is hosted in major E-W structure cross-cutting the andesite units close to contact with Rhyolite.
The Santa Elena deposit contains gold and silver (typically as electrum) with minor lead, zinc and copper. The structure consists of multiple banded quartz veins and stockwork with associated adularia, fluorite, calcite and minor sulphides. Bonanza ore shoots (greater than 500 gpt silver and 30 gpt gold) appear to be locally present (hole SE-12-106 with average uncapped grades of 35.94 gpt Au and 1,027 gpt Ag over 2.37 metres, not true width) but require more definition to determine their full extent.
The permeable nature of the fractured zones has allowed partial oxidation to locally occur to maximum depth of 400 metres below the surface in selective fractured zones. Minor disseminated sulphides and possibly rhodonite have been noted at approximately 530 vertical metres.
Metal zonation appears to exist with higher grades and thicker mineralized widths near the epithermal boiling zones, one of which daylights in the open pit area. A trend of higher grades and thicker veining is apparent with a plunge of approximately 25° to the east. Drill hole SE-12-74 intersected the vein at approximately 500 vertical metres depth with an average uncapped grade of 1.56 gpt Au and 133 gpt Ag over 7 metres (not calculated as true width) along this plunging trend from the current open pit operation.
Zonation also appears to correspond to northwest-trending structures that cross-cut the Main Mineralized Zone forming high grade shoots. Vertical zonation shows gold content consistent with depth and silver content increasing. At the surface, the silver to gold ratio is 20:1. At 500 m below surface, the ratio is approximately 100:1.
Minor sulphides have been observed in a few locations within the mineralized zone. The andesite in the hanging wall shows disseminated pyrite averaging 5%. Calcite is found in close proximity to pyrite and averages about the same. Select locations in the hanging wall show +30% finely disseminated pyrite spatially associated with +30% disseminated and veinlet calcite. Hydrothermal breccias exist in the hanging wall andesite proximal to the Main Zone with drill holes (SE 07-20 and 21) intersecting up to 200 m of breccia with a pyrite/calcite matrix. Selective sampling shows some anomalous lead, zinc and copper, suggesting a possible mineralized intrusive (porphyry) at depth. Initial results from the 2007 geophysical program indicate deep-seated IP highs.
Alteration within the deposit is widespread and pervasive with the most significant being silicification, kaolinization, and chloritization. Kaolin and alunite occur primarily along deeply weathered and oxidized structures and the fractured-andesite contact. Limonite within the oxide zone consists of a brick-red colour after pyrite, brown goethite and local yellow jarosite. Manganese occurs locally as pyrolusite and minor psilomelane near the surface.
| | SANTA ELENA UPDATE TECHNICAL REPORT |
| | EFFECTIVE DATE: DECEMBER 31, 2014 |
| | |
Gangue minerals consist of quartz, calcite, adularia, chlorite and fluorite. Black calcite can be a significant gangue mineral found within the Main Mineralized Zone. Analyses shows calcite content of up to approximately 15% which has a direct metallurgical benefit for processing ore.
From 2006 to 2015, SilverCrest has completed several extensive exploration programs at Santa Elena. Description of work completed up to April 2013 is included in the previous Technical Report “Santa Elena Expansion Pre-Feasibility Study and Open Pit Reserve Update, Effective Date: April 30, 2013, Amended Date: March 4, 2014”.
The 2013-2014 exploration programs included surface mapping and channel sampling, underground mapping, underground channel sampling and core drilling.
The Exploration Department at Santa Elena Mine completed a more detailed geological map of the open pit, compiling all geological and structural information defining a revised surface exposure of main geological units and structural setting.
An underground mapping and sampling program has been ongoing since 2013 at Santa Elena and includes the underground developed areas. The majority of the sampling and mapping has been done in the exploration cross-cuts. As of December 31, 2015 there have been 1092 samples taken on the 575, 600, 625, 650, 675 levels. These samples were used in geological modelling and visual validation of the interpolation results.
Surface mapping and sampling for the Ermitaño property began in early 2014. The first drill exploration drill program on site started in October 2014 and is currently ongoing.
SilverCrest completed four drill programs from early 2006 thru 2011. For more detailed information please refer to the Santa Elena Expansion Pre-Feasibility Study and Open Pit Reserve Update effective April 30, 2014 and amended March 4, 2014.
In 2012-2013, SilverCrest targeted delineation of shallow, below-pit mineralization and deep mineralization, mostly trending to the east, with additional drilling and the first underground drilling program to take place at Santa Elena in fall 2013. Three drilling companies were contracted; Major Drilling de Mexico based in Hermosillo, Mexico, Guardian Drilling from Saskatchewan, Canada, and DrilCor based in Durango, Mexico. All companies were involved in surface drilling programs, however, only DrilCor worked with the underground exploration drilling. This drilling focused on delineating and extending the areas along trend and down-dip of the MMZ. Other drilling was located off strike to explore for near parallel mineralization. A total of 20 drill holes were collared using reverse circulation (RC) to expedite hanging wall drilling, then finished with diamond core from approximately 40-50 metres before the vein target depth through to the barren footwall. This practice was discontinued due to significant deviation in the pre-collared holes. A total of 21 DD holes (1590.7metres) were drilled in the underground 2013 program. A total of 218 holes (72,965m including RC with DD tails) were drilled during the 2012-13 program, including holes drilled from within the current pit and the 2013 underground program.
| | SANTA ELENA UPDATE TECHNICAL REPORT |
| | EFFECTIVE DATE: DECEMBER 31, 2014 |
| | |
During 2014, SilverCrest targeted infill drilling in the underground area for the initial stopes. This drilling resulted in approximate spacing of about 25 metres in the initial stope area, which was previously around 50m, allowing us to create a more defined model and giving a better idea of grade distribution. This drilling was completed by Major Drilling de Mexico based in Hermosillo, Mexico and DrilCor based in Durango. A series of additional deep drill holes to both the east and the west of the MMZ were done to focus on the delineation and extension of the ore body to depth and also some drill holes targeting the extension of the El Cholugo and Tortuga vein were completed in 2014. Figures 10.1 and 10.2 show the location of all surface and underground drill holes completed at Santa Elena to date, with the 2014 drill hole program emphasized. Highlights from the 2014 drill program are shown in Table 10.1.
Table 10.1: Significant Drill hole Intersections from 2014 Surface Drilling at Santa Elena
| Hole # | From (m) | To (m) | Intercept
(m) | Au gpt | Ag gpt |
| Santa Elena West (includes Tortuga deep intercepts) |
| SE-14-02 | 172.8 | 183.8 | 11.0 | 0.72 | 28.7 |
| includes | 174.4 | 175.6 | 1.2 | 2.00 | 60.8 |
| SE-14-02 | 241.1 | 242.1 | 1.0 | 1.17 | 176.2 |
| SE-14-02 | 299.7 | 302.9 | 3.2 | 1.33 | 103.6 |
| includes | 302.0 | 302.9 | 1.0 | 3.94 | 201.6 |
| SE-14-03 | 79.8 | 82.8 | 3.0 | 2.15 | 98.0 |
| SE-14-06 | 283.8 | 285.0 | 1.3 | 0.77 | 34.9 |
| SE-14-06 | 289.3 | 293.8 | 4.5 | 0.64 | 43.5 |
| SE-14-06 | 308.0 | 323.6 | 15.6 | 1.60 | 104.4 |
| includes | 308.0 | 312.0 | 4.0 | 2.87 | 161.5 |
| includes | 314.0 | 315.9 | 1.9 | 3.35 | 150.0 |
| SE-14-06 | 326.2 | 328.7 | 2.5 | 0.69 | 56.3 |
| SE-14-06 | 333.0 | 335.1 | 2.1 | 0.13 | 12.9 |
| SE-14-06 | 216.8 | 217.7 | 0.9 | 0.27 | 96.0 |
| SE-14-06 | 252.0 | 270.0 | 18.0 | 0.20 | 43.2 |
| SE-14-10 | 283.8 | 285.9 | 2.1 | 0.55 | 59.7 |
| SE-14-10 | 295.1 | 301.0 | 5.9 | 0.60 | 53.6 |
| SE-14-12 | 304.1 | 308.3 | 4.2 | 0.68 | 17.0 |
| SE-14-12 | 313.9 | 315.5 | 1.6 | 0.34 | 59.8 |
| SE-14-14 | 396.6 | 398.6 | 1.8 | 0.33 | 48.9 |
| Tortuga |
| SE-14-04 | 76.6 | 77.5 | 0.9 | 5.46 | 108.0 |
| SE-14-04 | 90.0 | 91.1 | 1.1 | 2.99 | 38.3 |
| SE-14-04 | 261.6 | 262.6 | 1.0 | 2.96 | 1110.0 |
| SE-14-07 | 73.3 | 78.2 | 4.9 | 0.27 | 35.8 |
| SE-14-07 | 273.5 | 276.0 | 2.5 | 0.36 | 38.3 |
| SE-14-07 | 311.4 | 315.3 | 3.9 | 0.53 | 46.1 |
| SE-14-07 | 382.5 | 383.5 | 1.0 | 0.17 | 82.1 |
| SE-14-09 | 15.9 | 18.0 | 2.1 | 6.68 | 27.2 |
| | SANTA ELENA UPDATE TECHNICAL REPORT |
| | EFFECTIVE DATE: DECEMBER 31, 2014 |
| | |
| Hole # | From (m) | To (m) | Intercept
(m) | Au gpt | Ag gpt |
| El Cholugo (I & II) |
| SE-14-11 | 158.7 | 159.6 | 0.9 | 0.97 | 29.8 |
| SE-14-11 | 209.1 | 211.1 | 2.0 | 0.38 | 27.6 |
| SE-14-11 | 299.4 | 300.5 | 1.1 | 0.56 | 43.2 |
| SE-14-11 | 340.7 | 342.0 | 1.3 | 1.53 | 83.2 |
| SE-14-11 | 345.6 | 355.2 | 9.6 | 0.77 | 69.0 |
| SE-14-15 | 59.4 | 79.8 | 20.4 | 3.15 | 41.2 |
| includes | 59.4 | 62.5 | 3.1 | 8.66 | 102.6 |
| includes | 67.1 | 70.1 | 3.0 | 8.52 | 112.7 |
| includes | 74.6 | 78.0 | 3.4 | 2.91 | 18.2 |
| SE-14-15 | 95.0 | 96.0 | 1.0 | 1.24 | 35.2 |
| SE-14-15 | 194.2 | 195.5 | 1.3 | 2.50 | 158.0 |
| SE-14-15 | 236.3 | 241.4 | 5.1 | 0.47 | 37.1 |
| includes | 236.3 | 237.9 | 1.6 | 1.19 | 84.1 |
| Santa Elena East |
| SE-14-16 | 256.5 | 259.8 | 1.2 | 0.14 | 28.4 |
| SE-14-17 | 513.1 | 522.0 | 8.9 | 0.76 | 46.4 |
| includes | 514.5 | 518.9 | 4.4 | 1.26 | 75.2 |
| SE-14-18A | 623.8 | 629.5 | 5.7 | 0.21 | 33.2 |
| SE-14-21 | 1,060.2 | 1,061.2 | 1.0 | 0.17 | 44.4 |
| SE-14-21 | 1,070.1 | 1,074.7 | 4.6 | 0.52 | 89.3 |
| includes | 1,072.2 | 1,072.6 | 0.5 | 4.60 | 773.0 |
| SE-14-21 | 1,092.2 | 1,094.6 | 2.4 | 1.94 | 5.5 |
| SE-14-21 | 1,143.0 | 1,147.2 | 4.2 | 0.02 | 78.9 |
| includes | 1,144.4 | 1,145.3 | 0.8 | 0.07 | 376.0 |
| | SANTA ELENA UPDATE TECHNICAL REPORT |
| | EFFECTIVE DATE: DECEMBER 31, 2014 |
| | |
The table below gives an overview of all drill holes completed to date by SilverCrest.
Table 10.2: Table Summary of Drill Holes
| Year | DiamondHole from surface | Reverse Circulation | RC with DD tail |
| | No. | Length (m) | No. | Length (m) | No. | Length (m) |
| 2006 | 19 | 2579.99 | | | | |
| 2007 | 50 | 5864.13 | | | | |
| 2008 | 34 | 10983.94 | 21 | 4164 | | |
| 2009 | | | 20 | 1461.39 | | |
| 2011 | 5 | 1264.95 | 14 | 1077.5 | | |
| 2012 | 77 | 24098.9 | 20 | 2140.5 | 15 | 6838.1 |
| 2013 | 71 | 25542 | | | | |
2013 (UG) | 21 | 1590.7 | | | | |
| 2014 | 21 | 9165.2 | | | | |
2014 (UG) | 24 | 2865.2 | | | | |
| TOTAL FOR FEB 2015 | 322 | 83955.01 | 75 | 8843.39 | 15 | 6838.1 |
To date, down hole surveys were completed on the majority of the drill holes including all 2014 drill holes both at surface and underground drilling. For the 2014 drilling surveys were taken at an interval of approximately 30 metres, an initial reading at 10 meter was first taken to ensure no deviation had occurred during set up for the drill rig.
| | SANTA ELENA UPDATE TECHNICAL REPORT |
| | EFFECTIVE DATE: DECEMBER 31, 2014 |
| | |
Figure 10.1: Map Showing Drilling at Santa Elena, 2014 Drilling is Highlighted
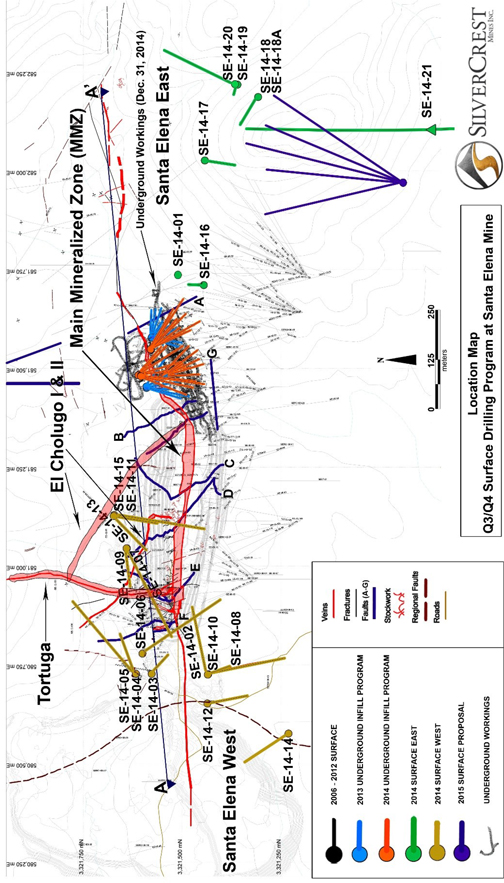
| | SANTA ELENA UPDATE TECHNICAL REPORT |
| | EFFECTIVE DATE: DECEMBER 31, 2014 |
| | |
Figure 10.2: Drill Program in Santa Elena MMZ by Year, Longitudinal Section

| | SANTA ELENA UPDATE TECHNICAL REPORT |
| | EFFECTIVE DATE: DECEMBER 31, 2014 |
| | |
Also in 2012, 10 trenches and subsequent bulk composite samples were excavated using an excavator to an average depth of 5 metres on the leach pad. Sampling was to test spent ore metallurgy for estimated recovery rates through the milling process. Assay results are presented in Table 10.3.
Table 10.3: Trench and Bulk Composite Samples
| Muestra | Ley de Cabeza |
Au
g/ton | Ag
g/ton | Cu
g/ton |
| Patios 1 Gastado | 0.75 | 33.60 | 43.00 |
| Patios 2 Gastado | 0.22 | 14.20 | 28.10 |
| Patios 3 Gastado | 0.86 | 32.83 | 53.35 |
| Patios 4 Gastado | 0.64 | 33.60 | 46.18 |
| Patios 5 Gastado | 2.17 | 77.40 | 64.50 |
| Patios 6 Gastado | 1.02 | 33.23 | 43.18 |
| Patios 7 Gastado | 0.57 | 19.80 | 38.50 |
| Patios 8 Gastado | 2.50 | 68.90 | 59.03 |
| Patios 9 Gastado | 0.43 | 40.55 | 51.68 |
| Patios 10 Gastado | 0.36 | 24.20 | 48.50 |
| | SANTA ELENA UPDATE TECHNICAL REPORT |
| | EFFECTIVE DATE: DECEMBER 31, 2014 |
| | |
From October 2014 – January 2015 nine drill holes (2,656m) were completed at the Ermitaño property on the El Durazno target (Table 10.4). The most significant assay results from this initial exploration drilling program at El Durazno target are shown in the following table. Intervals are considered near-true thickness. Refer to Figure 7.2 for drill hole locations.
Table 10.4: SilverCrest Drilling Results at Ermitaño –Durazno Target
| Hole ID | From (m) | To (m) | Interval (m) | Au gpt | Ag gpt |
| ED-14-001 | 131.0 | 132.6 | 1.6 | 0.27 | 3.9 |
| ED-14-003 | 116.5 | 118.0 | 1.5 | 0.21 | 1.3 |
| ED-14-005 | 40.5 | 60.0 | 19.5 | 0.61 | 4.1 |
| including | 46.1 | 60.0 | 13.9 | 0.72 | 4.3 |
| including | 54.0 | 57.0 | 3.0 | 1.17 | 7.1 |
| | 76.5 | 78.0 | 1.5 | 0.21 | 1.7 |
| | 85.5 | 93.5 | 8.0 | 0.21 | 1.1 |
| | 163.5 | 169.0 | 5.5 | 0.36 | 1.3 |
| including | 165.0 | 169.0 | 4.0 | 0.42 | 0.75 |
| | 185.0 | 198.0 | 13.0 | 0.86 | 14.1 |
| including | 193.4 | 198.0 | 4.6 | 2.10 | 35.5 |
| | 263.1 | 265.3 | 2.2 | 0.25 | 7.6 |
| ED-14-006 | 74.4 | 95.3 | 21.0 | 0.21 | 3.0 |
| including | 90.3 | 95.3 | 5.0 | 0.36 | 6.7 |
| | 144.3 | 146.3 | 2.0 | 0.38 | 1.9 |
| ED-14-007 | 69.0 | 72.0 | 3.0 | 0.24 | 1.6 |
| ED-14-008 | 53.0 | 54.2 | 1.2 | 0.22 | 3.4 |
| | 175.0 | 191.7 | 16.7 | 0.42 | 13.2 |
| including | 189.2 | 191.7 | 2.5 | 1.58 | 58.8 |
| ED-14-009 | 65.0 | 90.0 | 25.0 | 0.59 | 2.5 |
| including | 65.0 | 70.0 | 5.0 | 1.00 | 1.9 |
| including | 82.3 | 90.0 | 7.7 | 1.11 | 4.2 |
** Note; Drilling was announced on February 19, 2015 after the effective date of this report but was included for completeness.
| | SANTA ELENA UPDATE TECHNICAL REPORT |
| | EFFECTIVE DATE: DECEMBER 31, 2014 |
| | |
| 11.0 | Sample Preparation, Analyses and Security |
| 11.1 | Historical Sample collection methods |
Knowledge of the sampling methods for work completed prior to 2004 is limited. No data from this period has been used in previous NI-43 101 Technical Reports as sampling completed by Tungsteno and Nevada Pacific was inadequately documented and insufficient to determine the approach.
In 2004, Fronteer completed surface and underground sampling at Santa Elena. Written documentation on sampling methods is limited but investigations by SilverCrest confirmed the underground sample locations. The sampling method was found to be of contradictory “discontinuous” channels and this approach was considered adequate at the early exploration stage.
| 11.2 | Previous SilverCrest sample collection methods |
The 2006 sampling by SilverCrest consisted of continuous surface channel sampling along exposed road cuts and outcrops. The underground verification channel sampling program consisted of semi-continuous horizontal sampling of identified Fronteer sample locations. The samples were collected over selected intervals, placed in plastic bags and periodically shipped to ALS-Chemex in Hermosillo Mexico for preparation, with sample pulps shipped to and analysed by ALS-Chemex, North Vancouver, BC.
The 2006, 2007 and 2008 core drilling procedure included the collection and labelling of the drill core. After logging and identifying the mineralized zone, core was selected for splitting and sampling. The 2008 RC drilling program consisted of collecting chips and cataloguing.
| 11.3 | 2012 -2013 Sample Collection Methods |
The 2012 and 2013 drilling program included procedures for the collection and labelling of the drill core. A total of 15 drill holes (Table 11.1) where first drilled by RC methods and finished with diamond core tails with a further 4 drilled purely as RC of HQ size drill core (63.5 mm diameter). Although RC cuttings were not retained a number of samples from the hanging wall were sampled. (Figure 11.1)
Table 11.1: RC Cutting Sample Length (From ‘SERC’- series drill holes) and frequency from the hanging wall
| Length (m) | Frequency |
| 0.5 | 0 |
| 1 | 9 |
| 1.5 | 12 |
| 2 | 91 |
| 2.5 | 11 |
| 3 | 490 |
| 3.5 | 0 |
| 3.5+ | 1 |
| Total | 614 |
| | SANTA ELENA UPDATE TECHNICAL REPORT |
| | EFFECTIVE DATE: DECEMBER 31, 2014 |
| | |
The drill core was recovered and stored in vinyl boxes, each of which contains approximately 2.25 metres of core. Drill runs were identified in the field by drillers using markers in the core boxes at 3 metre intervals. These intervals were validated by SilverCrest geologists. Recovered drill core was boxed by the drillers on-site. The core boxes were collected and delivered twice daily to the on-site core logging facility where the core was logged and sampled by SilverCrest technical staff. Core is currently stored on-site for future viewing and reference.
Core logging procedures included review of the core quality and recording of recovery, lithological, geotechnical and mineralogical data within standardized company logging forms. After characterizing the mineralization, SilverCrest geologists marked the start and end of each interval for sampling. The range in drill core sample lengths can be seen in Figure 11.1 which shows lengths ranging from 0.11 to 36.7 metres (the latter was checked in supplied drill logs as being correct) and mode of approximately 2 metres. Not all drill holes were entirely sampled and only samples are presented in Figure 11.1 below. This did not include RC sample intervals. The average sample length used in the 2013 resource is 1.74 metres.
Figure 11.1: Santa Elena Sample Length Frequency used in 2013 Resource Estimate

Sample intervals were recorded on the core box with sample tags. The intervals were marked on the drill core which was cut in half by a SilverCrest technician using a diamond saw blade. Half of the core was sealed in a sample bag with the corresponding sample tag. The other half of the core sample was returned to the core box for company record and future viewing. Sample numbers, intervals, and descriptions were recorded on the standardized drill logs.
SilverCrest inserted Certified Reference Material (CRM’s), blanks and duplicates samples at regular intervals into the sampling stream. In addition internal laboratory QA-QC procedures were followed.
| 11.4 | 2013 -2014 Sample Collection Methods |
The 2013-2014 drilling program included procedures for the collection and labelling of the drill core. The entire core was checked to make sure it is placed and oriented well. The core boxes are marked with the start and end of each box run. While doing this the geologists look over the core to have a general idea of the geology and mineralization before starting their description. The core is photographed and logged in detail. For sampling Assay log included:
| | SANTA ELENA UPDATE TECHNICAL REPORT |
| | EFFECTIVE DATE: DECEMBER 31, 2014 |
| | |
| - | STD = Standard Name– This is taken from the certificate |
| - | BCO= (Specifics on grade) – This is taken from assay results |
| - | DUP= This is taken from Splitting the core in the field |
The samples are measured based on the above sample requirements and includes the % recovery with in the drill run. There are marker tags put in at the start of each sample. If there is a sample that has no sampling to be done after because of waste rock then a marker is put in to indicate the end of the sample for the core cutter. The core is then cut with an electrical diamond saw into halves. The uncut half of the core is carefully placed back into the correct location in the box. After cutting the interval, samples are placed in a bag marked with the sample number, hole name and project name. The sample identification tag is then placed in the bag and the bag is tied.
For standards, certified reference materials (CRMs) contain known metal concentrations (grade and variability). They are used to assess analytical accuracy and to detect biases by comparing the assay results against the expected grade of the standard. For the insertion of STD a reference standard was created from the source deposit and processed in CDN Laboratory from that result material were measured out on a scale and put into envelopes containing 100 grams.
Lab sheets are filled out and the samples are delivered to the lab.
Rejects and pulps are picked up directly from the lab as soon as the assay has been completed and stored in the core storage in Santa Elena.
Samples collected, that are to be used for resource or reserve evaluation, should contain a minimum of 1kg of sampled material when appropriate. Exceptions may include narrow widths sampled in outcrop or core intervals where collecting a 1kg sample is impractical. However, in these cases the sample must be representative of the total material being assessed.
| 11.5 | 2014 -2015 UG Sample Collection Methods |
There are three different sample types taken at the underground Santa Elena mine.
| § | Channel Samples (chip samples): |
| · | Every round of a new development face is sampled, for that purpose the geologist mark the channel to be taken to the geology helpers. |
| | SANTA ELENA UPDATE TECHNICAL REPORT |
| | EFFECTIVE DATE: DECEMBER 31, 2014 |
| | |
| · | This mark is done around 1.5 metres from the floor elevation, from the foot wall to the hanging wall. The channel is divided according the lithology or features of the face, not taking samples greater than 1.5 metres. |
| · | The sampler takes the samples based on the marked provided by the geologist using a chisel and hammer. |
| · | To recover the sample the crew use a plastic canvas that is cleaned after every sample is collected. |
| · | The samples has an identification number that helps recognize the precedence and assay from the lab. |
| · | On every face the geologist marks a composite line that is for QA/QC duplicates. A blank sample is introduced every face, usually after the highest grade are identified by the geologist. |
| · | Channels are marked by the geologist every 10 metres long the back to be sampled. |
| · | From the footwall to the hanging wall. The channel is divided according the lithology or features of the back, not taking samples greater than 1.5 metres. |
| · | The sampler arrives to the area and takes the samples based on the mark provided by the geologist. This samples are taken on the lifter (tele handler), using a chisel and hammer. |
| · | To recover the sample the crew use a plastic canvas that is cleaned after every sample is collected. This is on the floor of the lifter. |
| · | The samples have an identification number that help recognize the procedure and assay from the lab. |
| - | Exploration Crosscuts sample |
| · | This mark is done around 1.5 metres from the floor elevation, from the footwall to the hanging wall. The channel is divided according the lithology or features of the face, not taking samples greater than 1.5 metres, marks are done in both walls of the cross-cut. |
| · | The sampler arrives to the face and takes the samples based on the mark provided by the geologist using a chisel and hammer. |
| · | To recover the sample the crew use a plastic canvas that is cleaned after every sample is collected. |
| · | The samples has an identification number that helprecognize the precedence and assay from the lab. |
| - | All the trucks that are sent from UG as ore (from stopes, slashes, development) that are dumped in the stock piles of the primary crusher are sampled. |
| - | Every morning and afternoon the samplers arrive to site and wash the muck. |
| - | From every muck pile, a 75cm distance grid is marked; they take a sample in all of the intersections of that grid. |
| | SANTA ELENA UPDATE TECHNICAL REPORT |
| | EFFECTIVE DATE: DECEMBER 31, 2014 |
| | |
| - | The samples has an id number that help recognize the precedence and assay from the lab. |
| - | QA/QC control consists of rejects resampled from the highest grade samples. |
| § | Cuts from Long hole drilling samples |
| · | The objective is to sample all the holes that are going to be drilled in that shift. The geologist communicates with the operations to know where they are going to be drilling. |
| · | The person that is in charge of the sample collection has to take a sample of the cuts of the drill hole every 2 rods (Approx. 3 metres). |
| · | There are as many bags as the length of the hole, all of the bags have the name of the hole that is being drilled. |
| · | Then the bags are analyzed by the geologist, to choose one or two representative samples. To do that the geologist will use a splitter. |
| · | The samples have an identification number that helprecognize the precedence and assay from the lab. |
| 11.6 | 2012-2013 Laboratory Analytical Methods |
For the 2012-2013 sampling, two independent analytical laboratories were used for sample analyses: Nusantara de Mexico S.A. de C.V (Nusantara), an on-site grade control laboratory for Santa Elena operations; and ALS-Chemex. Nusantara either prepared and analysed samples, or prepared and transported samples to ALS-Chemex in Chihuahua or Hermosillo for further preparation before being sent to ALS-Chemex in Vancouver for analyses.
| 11.7 | 2013-2014 Laboratory Analytical Methods |
For the 2013-2014 sampling, three independent analytical laboratories were used for sample analyses: Nusantara de Mexico S.A. de C.V (Nusantara), an on-site grade control laboratory for Santa Elena operations; ALS-Chemex and Inspectorate. Nusantara either prepared and analysed samples, or prepared and transported samples to ALS-Chemex or Inspectorate in Hermosillo for further preparation before being sent to ALS-Chemex or Inspectorate in Vancouver for analyses.
| 11.7.1 | Nusantara Lab Preparation and Analyses (2012-2014) |
Nusantara analysed a number of samples using Gravimetric Fire analyses and Atomic Absorption Fire Assay for Au and Ag. The following sample preparation procedures have been translated from Spanish and are summarized for this report.
Received samples are dried, weighed and crushed to 90% passing the minus 150 mesh. Gold is analyzed using fire assay fusion with atomic absorption finish and by gravimetric methods. Silver is analyzed using an aqua regia digestion and atomic absorption finish.
Nusantara’s internal QAQC includes adding one duplicate, one reference and one blank to every 27 samples. All samples analysed by AAS outside the range of calibration are retested. There are measures in place for oven time and contamination by chemical additives. The Nusantara analyses are not used for the interpolation of grades in the resource model, only using the independent labs referred to in this report.
| | SANTA ELENA UPDATE TECHNICAL REPORT |
| | EFFECTIVE DATE: DECEMBER 31, 2014 |
| | |
Table 11.2: Number and preparation method of samples sent to ALS-Chemex from Santa Elena mine (2012-2013)
| Sample Type | No. of Samples |
| Drill Core | 4,884 |
| Pulp | 2,985 |
| RC Cuttings | 426 |
| Total | 8,295 |
Table 11.2 outlines the number and form of samples transported to ALS-Chemex from Nusantara for analyses. A total of 2,985 pulp samples are recorded as having been received by ALS-Chemex in Chihuahua or Hermosillo.
| 11.7.2 | ALS-Chemex Lab preparation and Analyses (2012-2014) |
ALS-Chemex labs in Chihuahua and Hermosillo prepared the samples using the Prep-31 procedure typically used for rock and drill core. The samples were dried, weighed, and crushed to obtain 70 % passing a 2 mm (Tyler 9 mesh, US Std. No.10) screen. A split of up to 250 g was taken and pulverized to >85 % passing a 75 micron (Tyler 200 mesh, US Std. No. 200) screen.
ALS-Chemex in Vancouver, BC, analysed samples using the ME-ICP41 analytical procedure. Samples were digested with aqua regia in a graphite heating block. After cooling the resulting solution was diluted to 12.5 mL with deionized water, mixed and analyzed by inductively coupled plasma-atomic emission spectrometry (ICP-AES) and reported 36 element grades including silver (ME-ICP41). The analytical results are corrected for inter-element spectral interferences.
Samples containing grades of silver exceeding 100 ppm were re-digested in aqua regia and run using ore grade detection limits with ICP (Ag-OG46), and where grades exceeded the detection limit 1,500 ppm, silver was analyzed using fire assay (Ag-GRA21) with AA finish.
Gold was analyzed using fire assay fusion with AA finish (Au-AA23) and default overlimit analyses using gravimetric determination (Au-GRA21). A nominal weight 30+/-3 grams was used for the analyses. Silver analysed by the GRA21 finish has a lower detection limit of 5 ppm to an upper limit of 10,000 ppm with gold having a lower detection limit of 0.05 ppm and an upper limit of 1000 ppm.
No ALS laboratory SG testing was undertaken.
| 11.8 | Inspectorate Lab preparation and Analyses (2013-2014) |
Inspectorate labs in Hermosillo prepared the samples using the Prep- 70 procedure typically used for rock and drill core. The samples are dried weight andcrushed to 70% passing 10 mesh (2mm), homogenized, riffle split (250g, 500g, or 1000g subsample) and pulverized to 85% passing 200 mesh (75 microns). Crusher and pulveriser are cleaned by brush and compressed air between routine samples. Granite/Quartz wash scours equipment after high-grade samples, between changes in rock colour and at end of each file. Granite/Quartz is crushed and pulverized as first sample in sequence and carried through to analyses. Fire assay is completed for each sample on a 30g sample size and by aqua regia with an ICP finish on a 0.5g sample size.
| | SANTA ELENA UPDATE TECHNICAL REPORT |
| | EFFECTIVE DATE: DECEMBER 31, 2014 |
| | |
| 11.9 | Heap Leach Sampling, preparation and Analyses (2012-2013) |
All sampling was carried out by SilverCrest’s geologists and sampling protocols adopted the following procedures:
| § | Plastic bags were placed in a tray in the vertical outlet of the cyclone and into a container to avoid loss of material (Figure 11.2). |
| § | Full interval was sampled and samples were taken at multiple orders according to the depth of the hole. For holes with a length of 10 and 20 metres, samples were taken every 2 metres. Holes with length of 15 metres, samples were collected every 3 metres and only one 5 metre sample was collected for holes with 5m length. |
| § | All bags were labelled with the corresponding depth. |
| § | The samples were delivered to the Santa Site lab for splitting to pulverization and additional splitting to generate aliquot for analyses. |
A sampling procedure allowed for a very good sample recovery. All samples were handled by geologists at Santa Elena site. Samples were sent to Santa Elena lab for analyses. Analytical method for gold included Fire Assay finishing in AA as well as gravimetric analyses for comparison purposes and for silver an Aqua Regia digestion finishing in AA. Blanks and Certified Reference Material (“CRM”) were inserted by exploration personnel prior to the sampling preparation at the Santa Elena Lab to carry out a QA/QC protocol in the preparation and analyses of the samples collected by the drilling program on the pad. The results did not indicate deviations from the blanks and CRM assay values.
| | SANTA ELENA UPDATE TECHNICAL REPORT |
| | EFFECTIVE DATE: DECEMBER 31, 2014 |
| | |
Photo 11.1: Heap Leach Sampling
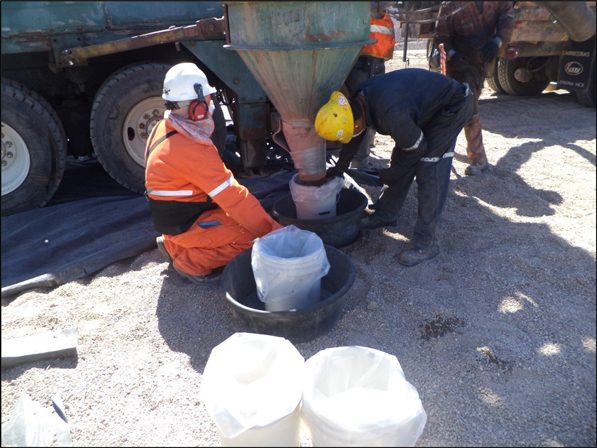
N. Eric Fier has observed the core and RC sampling methods on site and have reviewed the leach material sampling protocol and believes the methods meet an industry standard of practice. N. Eric Fier feels the sample collection procedures were carried out in a methodical and unbiased manner sufficient to support a database for estimation of Mineral Resources and Reserves.
| | SANTA ELENA UPDATE TECHNICAL REPORT |
| | EFFECTIVE DATE: DECEMBER 31, 2014 |
| | |
| 12.1 | Historical Data Verification |
Historical data prior to the 2006 SilverCrest drilling campaign is not included in the current geological database.
| 12.2 | 2006-2008 SilverCrest Data verification |
The following description of historical verification has been summarized from the Technical Report on the Pre-Feasibility Study for the Santa Elena Project, Sonora Mexico, by Scott Wilson Roscoe Postle Associates, (SWRPA, August 11, 2008) and the Technical Report on the Cruz de Mayo Property, Sonora, Mexico, by N. Eric Fier and C. Stewart Wallis (December 10, 2007). These technical reports were independent and NI 43-101 compliant.
In April of 2006, SWRPA collected select samples for verification, including an underground continuous channel sample and quarter splits of drill core and sent to ALS-Chemex in Hermosillo with a regular shipment of core samples. Overall, the grade comparisons are considered to be within acceptable ranges.
In May 2006, SilverCrest collected 15 underground channel samples to verify the sampling results of Fronteer. The SilverCrest silver assays showed a bias of up to 60% lower than the corresponding Fronteer assays with gold assays 50% to 100% lower. SWRPA considered it acceptable at this stage of property development to use the Fronteer data in the resource estimate.
Gravimetric silver grades were consistently higher compared to both Fronteer and the SilverCrest silver fire with AA finish results. The result lends support to the higher values. The fire assay with AA results was used in the resource estimate as they were more similar to the Fronteer results which were also used
In addition to the underground sampling, SilverCrest also completed silver geochemical analyses on 289 surface samples for fire assay AA finish and fire assay gravimetric analyses. Results show an overall 20.3% increase in silver grade using silver gravimetric assays. AA silver results were used in the resource estimation and are considered conservative for grade estimation. QA-QC was completed by duplicate analyses on 16 of the above 298 samples at ACME Laboratories in Vancouver on ALS-Chemex pulps from core sampling and preparation. Although the ACME results have a higher detection limit, the limited results on the duplicate pulps show consistent correlation of grades between laboratories.
During the 2008 drilling approximately every 20th sample was duplicated in a different laboratory for QA/QC purposes. The comparison for 2008 drill sample results show average gold and silver results to be similar and within acceptable limits for QA/QC.
| 12.3 | 2012-2013 Independent Data verification |
James Barr, P.Geo, from EBA Engineering Consulting (now Tetra Tech EBA) visited the Santa Elena mine between May 10-11, 2012, and October 13-14, 2012 (during the 2012-2013 drilling campaign). At this time, rock exposure in the open pit and exploration underground decline was inspected, sample collection and logging procedures were reviewed, verification samples were collected (Table 12.1, Figures 12.1 and 12.2) and recommendations for sampling quality control measures were made. Further details of the site visit and verification are available in the previous Technical Report.
| | SANTA ELENA UPDATE TECHNICAL REPORT |
| | EFFECTIVE DATE: DECEMBER 31, 2014 |
| | |
Table 12.1: Drill core grade verification sampling (Oct 2012)
| Hole | From | To | Source | Samples | Au (g/t) | Ag (g/t) |
| SE-12-98 | 97.4 | 98.86 | SVL | 155228* | 7.87 | 274 |
| EBA** | 500427 | 6.07 | 281 |
| SE-12-54 | 111.85 | 112.85 | SVL | 176561 | 10.75 | 233 |
| EBA** | 500432 | 9.9 | 184 |
| SE-12-39 | 158.34 | 159.55 | SVL | 176392 | 4.08 | 339 |
| EBA** | 500428 | 4.42 | 296 |
| CRM | CDN-ME-19 | | CDN | n/a | 0.62 +/- 0.062 | 103 +/- 7 |
| EBA** | 500430 | 0.673 | 109 |
| SE-12-50 | 227.9 | 228.35 | SVL | 176937 | 4.29 | 918 |
| EBA** | 500429 | 3.09 | 794 |
| SERC-12-23 | 0.32 | 30.8 | SVL | 176251 | 0.32 | 30.8 |
| EBA** | 500431 | 0.304 | 38.3 |
*Results reported from Nusantara lab
**EBA results reporting from ALS certificate HE12244041
Figure 12.1: Grade Verification Sampling, Silver
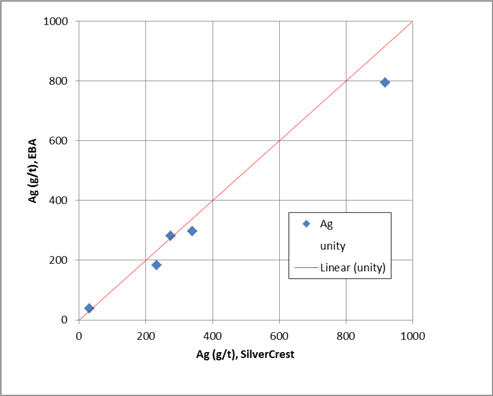
| | SANTA ELENA UPDATE TECHNICAL REPORT |
| | EFFECTIVE DATE: DECEMBER 31, 2014 |
| | |
Figure 12.2: Grade Verification Sampling, Gold
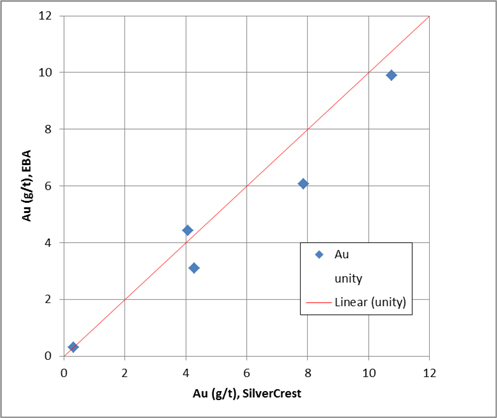
| 12.3.1 | SilverCrest Certified Reference Material Insertion |
Insertion of certified reference materials (CRM) at regular intervals was completed by SilverCrest staff during the 2013-2014 Santa Elena drill program.
Table 12.2 shows the count and mineralization values and ranges to ±2 standard deviations of the CRM’s used. Table 12.2 outlines the standards that were sourced by SilverCrest from CDN Resource Laboratories Ltd in Vancouver.
Table 12.2: Certified Reference Material Reporting Values used in the Santa Elena 2013-2014 Drilling by SilverCrest
| CRM | Au gpt | Ag gpt | Count | Source |
| CDN-GS-P5D | 0.645 +/-0.062 | 66.0 +/- 6.9 | 13 | CDN Laboratories |
| CDN-ME-16 | 1.48 +/-0.14 | 30.8+/-2.2 | 9 | CDN Laboratories |
| CDN-ME-19 | 0.620+/-0.062 | 103+/-7 | 16 | CDN Laboratories |
| CDN-ME-1303 | 0.924 +/-0.1 | 152 +/- 10 | 4 | CDN Laboratories |
Samples identified as CRM are plotted (light blue) in Figures 12.4 to Figure 12.10 below relative to the mean (red line) and ±2 standard deviations (orange lines) reported by CDN Laboratories for each CRM.
| | SANTA ELENA UPDATE TECHNICAL REPORT |
| | EFFECTIVE DATE: DECEMBER 31, 2014 |
| | |
Figure 12.3: CRM: CDN-GS-P5D – Gold

Figure 12.4: CRM: CDN-GS-P5D – Silver
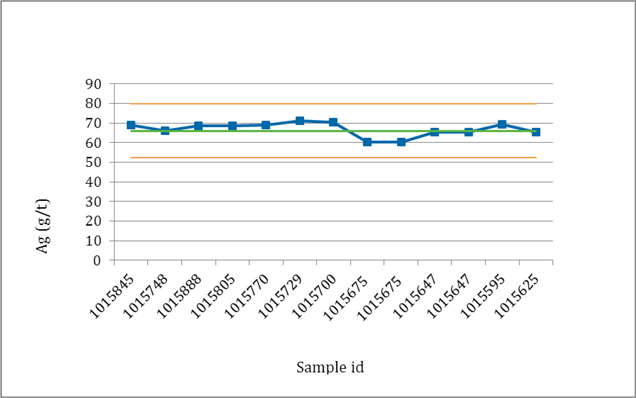
| | SANTA ELENA UPDATE TECHNICAL REPORT |
| | EFFECTIVE DATE: DECEMBER 31, 2014 |
| | |
Figure 12.5: CRM: CDN-ME-1303 – Gold
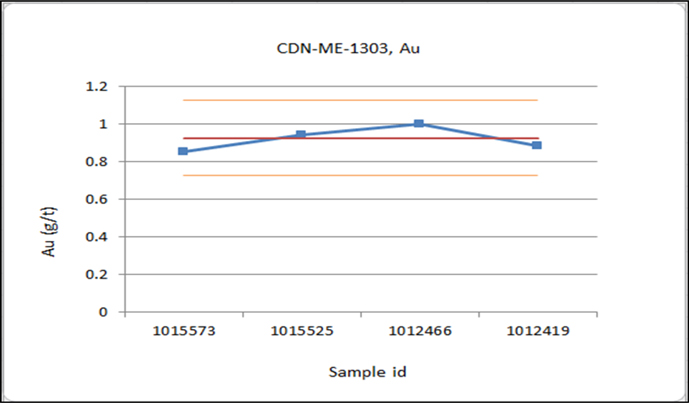
Figure 12.6: CRM: CDN-ME-1303 – Silver

| | SANTA ELENA UPDATE TECHNICAL REPORT |
| | EFFECTIVE DATE: DECEMBER 31, 2014 |
| | |
Figure 12.7: CRM: CDN-ME-16 – Gold

Figure 12.8: CRM: CDN-ME-16 – Silver
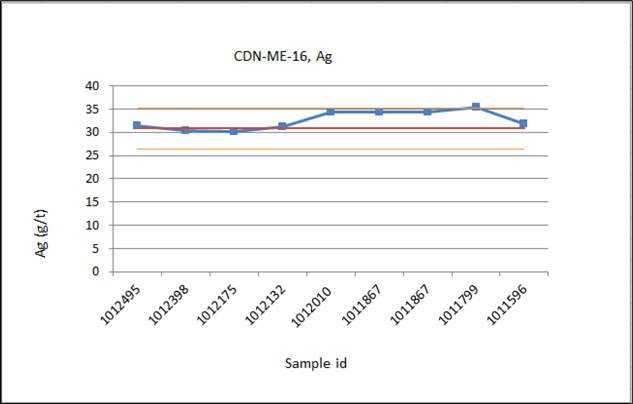
| | SANTA ELENA UPDATE TECHNICAL REPORT |
| | EFFECTIVE DATE: DECEMBER 31, 2014 |
| | |
Figure 12.9: CRM: CDN-ME-19 – Gold
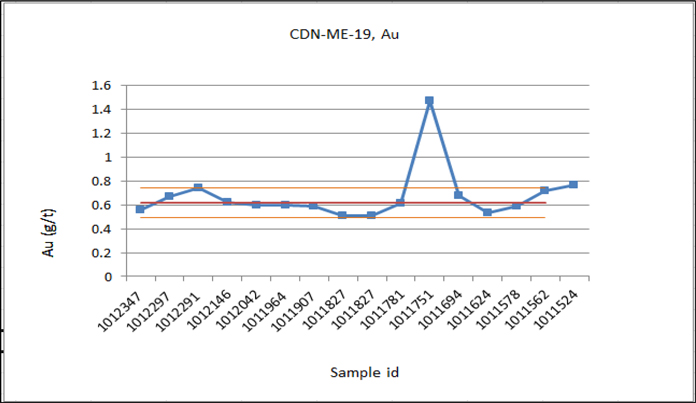
Figure 12.10: CRM: CDN-ME-19 – Silver
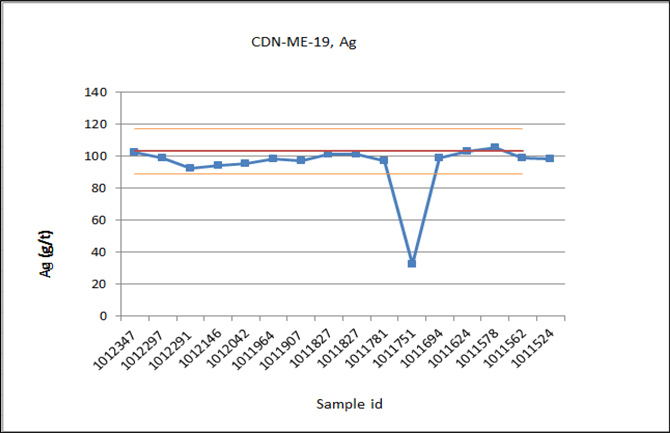
| | SANTA ELENA UPDATE TECHNICAL REPORT |
| | EFFECTIVE DATE: DECEMBER 31, 2014 |
| | |
| 12.4 | SilverCrest Blank Material Insertions |
SilverCrest inserted 114 blank samples in a random fashion and near to expected high grade samples during the 2013-2014 drilling program, each blank was labelled “Blank” or “Blanco” in the drill hole data base. Figures 12.11 and 12.12 show the 39 samples of blank material plotted.
Figure 12.11: SilverCrest 2013-2014 Reported Blank Material Au (gpt)
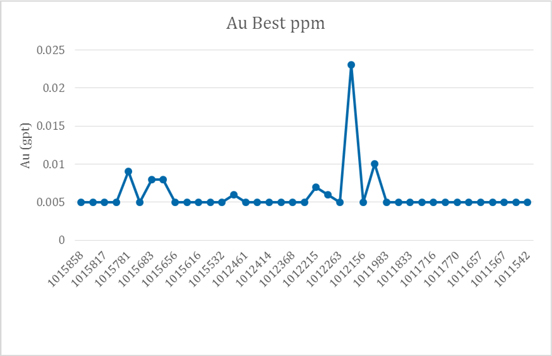
Figure 12.12: SilverCrest 2013-2014 Reported Blank Material Ag (gpt)
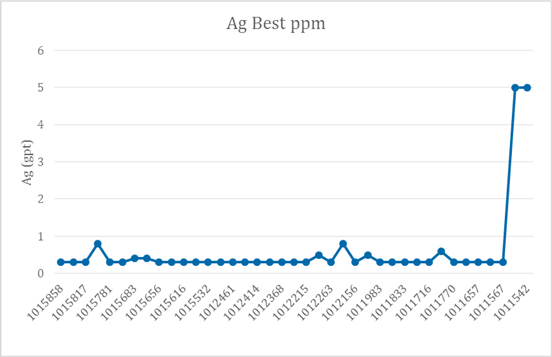
| | SANTA ELENA UPDATE TECHNICAL REPORT |
| | EFFECTIVE DATE: DECEMBER 31, 2014 |
| | |
Blank sample results show a range of results that indicate no major concerns.
| 12.5 | QP Statement on Data Verification |
N. Eric Fier has reviewed the data verification methods at Santa Elena and believes the methods meet an industry standard of practice and are sufficient to support estimation of Mineral Resources and Reserves.
| 13.0 | Mineral Processing and Metallurgical Testing |
| 13.1 | Previous Mineral Processing and Metallurgical test work |
The following sections were documented in a previous Technical Report for Santa Elena (May, 2011 and 2013 PFS) and have been extracted from the Technical Report on the Pre-Feasibility Study for the Santa Elena Project, Sonora, Mexico, by Scott Wilson Roscoe Postle and Associates (SWRPA) (August 11, 2008). This technical report is NI 43-101 compliant. All test work covers the Santa Elena Project.
| 13.1.1 | Previous Metallurgical Test Work Summary For Santa Elena |
There has been varied metallurgical test work done on the Santa Elena property over the last thirty years. The test work was reviewed in 2008 by Mr. Geoff Allard (Allard), P.E., of Allard Engineering Services of Tucson, Arizona.
The previous metallurgical test work and Allard’s audit of overall findings are summarized in the 2013 PFS Technical Report on SEDAR.
| 13.2 | Recent Mineral Processing and Metallurgical test work |
Metallurgical test work was carried out by Inspectorate Mining and Metals in their Richmond, BC facility on samples from Santa Elena. Inspectorate also generated slurry samples for testing at Pocock Industrial in Salt Lake City for thickening and filtration characterization. Additional test work was carried out in Sonora at the University of Sonora.
The broad conclusions from the Inspectorate test work can be summarized as follows.
| § | A grind of 80% passing (P80)100 µm is suitable for treating Santa Elena ore. |
| § | A cyanide strength of 1g/L is suitable for leaching Santa Elena ore |
| § | A leach time of 72 hours was indicated by the standard test procedure but the leaching rate can be accelerated significantly if the leach solution is changed after an initial period of 10 hours and shortened to under 40 hours as well as improving silver recoveries. |
| § | A gold recovery of >92% and silver recovery of 68% was indicated. |
Additional findings from recent test work is a Bond Ball Mill (metric) work index of 14. The filtration test work indicated that filtration of Santa Elena tailings was highly susceptible to the flocculent selected.
Open pit heap leach metallurgical test work is based on previous work and approximately 3 years of production data which has been publicly announced and filed on SEDAR. Overall, actual average heap leach recoveries are estimated for ore under a 300 day leach cycle at 65% gold and 35% silver. Since the leach pad will be decommissioned prematurely (before 300 day cycle is completed for most of 2013 ore placement), the estimated final open pit heap leach recoveries are 60% gold and 30% silver.
| | SANTA ELENA UPDATE TECHNICAL REPORT |
| | EFFECTIVE DATE: DECEMBER 31, 2014 |
| | |
| 13.2.1 | Leaching Cyanidation of Samples from Santa Elena Deposit |
Bottle roll cyanide leaching was mainly performed on Santa Elena NIVEL 4 whole ore at various grind sizes and different cyanide dosages to assess gold and silver recovery potentials.
Baseline Bottle Roll Tests on Ground Whole Ore (Underground)
Baseline bottle roll tests (C1 to C6) were conducted on ground whole ore to assess the grind- and cyanide-sensitivity of gold and silver recoveries as well as kinetics and reagent requirements. The leach tests were carried out for 72 hours at 40% solids at target P80 grinds of 120 microns and 74 microns. Three cyanide dosages of 0.5-, 1.0- and 1.5 g/L cyanide were tested at each grind, and pH ≥10.0 was maintained with hydrated lime.
Composites C1 to C12 were collected as bulk samples on the 4th level (est. 80 m below surface) of the old underground working which would be near the bottom of the operating open pit. The baseline test results are summarized in Table 13.1, whilst Au and Ag leach profiles are plotted in Figures 13.1 and 13.2.
Table 13.1: Baseline Cyanidation Performance
| | Test Conditions | Measured Head | Calculated Head | 72-h Extraction | Residue Grade | Consumption (kg/t) | |
| Test | | | | | | | | | | | | | |
| No | P80 Size, | NaCN, | Au (g/t) | Ag (g/t) | Au (g/t) | Ag (g/t) | Au (%) | Ag (%) | Au (g/t) | Ag (g/t) | NaCN | Lime | |
| | |
| | um | g/L | | | | | | | | | | | |
| | | | | | | | | | | | | | |
| C1 | 121 | 0.5 | 3.31 | 119.1 | 2.66 | 113.0 | 94.2 | 42.4 | 0.16 | 65.10 | 0.78 | 0.08 | |
| C2 | 119 | 1.0 | 3.31 | 119.1 | 2.98 | 128.9 | 96.1 | 59.2 | 0.12 | 52.60 | 1.30 | 0.11 | |
| C3 | 119 | 1.5 | 3.31 | 119.1 | 2.78 | 125.9 | 95.5 | 64.5 | 0.12 | 44.70 | 1.55 | 0.10 | |
| C4 | 75 | 0.5 | 3.31 | 119.1 | 2.73 | 115.0 | 96.5 | 47.3 | 0.10 | 60.60 | 0.90 | 0.10 | |
| C5 | 73 | 1.0 | 3.31 | 119.1 | 3.01 | 125.7 | 94.2 | 61.3 | 0.17 | 48.70 | 1.29 | 0.07 | |
| C6 | 74 | 1.5 | 3.31 | 119.1 | 2.91 | 128.2 | 97.4 | 65.2 | 0.08 | 44.60 | 1.82 | 0.05 | |
As shown in Table 13.9, the gold responded much better to cyanidation than the silver in these exploratory baseline tests, averaging 95.6% Au versus 56.6% Ag. In general, residue gold and silver grades decreased with finer grinding and higher cyanide concentration. In the range of 0.5-1.5 g/L cyanide, higher cyanide strength benefited silver extraction, but not gold.
Cyanide consumption was in the neighborhood of 1.3 kg/t at a level of 1 g/L NaCN. In general, less than 0.1 kg/t lime were required to maintain slurry pH ≥10. Increasing the cyanide strength from 0.5 g/L to 1.5 g/L doubled the NaCN consumption.
Leach kinetics showed that both gold and silver dissolution was fast in the first 8 hours of retention and subsequently slowed down. Finer grind and higher cyanidation strength resulted in faster metal dissolution and better extraction. Gold and silver extractions might improve by extending the residence time to over 72 hours without replacing leach liquor.
| | SANTA ELENA UPDATE TECHNICAL REPORT |
| | EFFECTIVE DATE: DECEMBER 31, 2014 |
| | |
Figure 13.1: Gold Leach Kinetics on Milled NIVEL 4 Comp
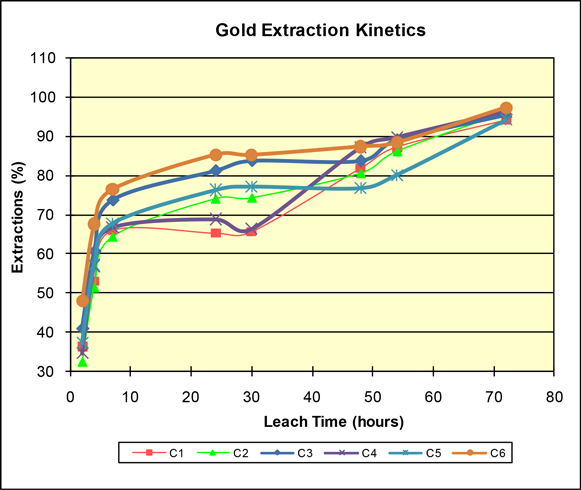
| | SANTA ELENA UPDATE TECHNICAL REPORT |
| | EFFECTIVE DATE: DECEMBER 31, 2014 |
| | |
Figure 13.2: Silver Leach Kinetics on Milled NIVEL 4 Comp
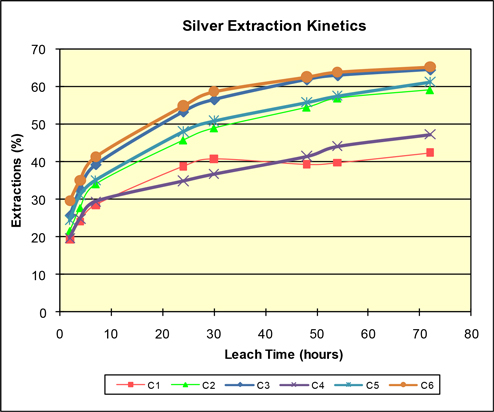
Leach Optimization
The optimization tests (C7 to C12) were conducted on the NIVEL (Level) 4 Composite at a moderate grind of 100 µm at various cyanide dosages with leach solution replacement at various leach intervals. Test conditions and leach results are summarized in Table 13.2, while leach profiles are plotted in Figures 13.3 and 13.4.
In comparison to the baseline test results, leaching with solution replacement resulted in better silver extraction, and faster gold and silver leach kinetics. By replacing the leach solution, up to 70% silver recovery is achievable, and residence time can be shortened to 30 hours for gold. Double the number of solution exchanges and NaCN dosages as well as the addition of oxidants resulted in negligible gains in gold and silver extractions. In general, approximately 96% Au and 70% Ag extraction can be achieved at 40% solids in 1.0g/L NaCN solution with single solution replacement at the target grind of 100 µm.
| | SANTA ELENA UPDATE TECHNICAL REPORT |
| | EFFECTIVE DATE: DECEMBER 31, 2014 |
| | |
Table 13.2: Leach Optimization Test Summary
| | | Test Conditions | Measured Head | Calculated Head | 72-h Extraction | Residue Grade | Consumption (kg/t) | |
| Test No | NaCN, g/L | Oxidant | Sol'n
Replacement | Au (g/t) | Ag (g/t) | Au (g/t) | Ag (g/t) | Au (%) | Ag (%) | Au (g/t) | Ag (g/t) | NaCN | Lime | |
| | | | | | | | | | | | | | | |
| C7 | 1.0 | | @ 24 hrs | 3.31 | 119.1 | 2.58 | 131.8 | 95.6 | 67.6 | 0.11 | 42.7 | 1.23 | 0.17 | |
| | | | | | | | | | | | | | | |
| C8 | 1.0 | 0.25kg/t
Pb(NO3)2 | @ 24 hrs | 3.31 | 119.1 | 2.63 | 126.9 | 95.8 | 70.3 | 0.11 | 37.7 | 1.31 | 0.16 | |
| | | | | | | | | | | | | | | |
| C9 | 1.0 | 0.1kg/t
H2O2 | @ 24 hrs | 3.31 | 119.1 | 2.80 | 133.7 | 95.5 | 67.9 | 0.13 | 42.9 | 1.31 | 0.15 | |
| | | | | | | | | | | | | | | |
| C10 | 1.5 | | @ 24 hrs | 3.31 | 119.1 | 2.87 | 135.7 | 96.0 | 70.2 | 0.11 | 40.4 | 1.24 | 0.16 | |
| | | | | | | | | | | | | | | |
| C11 | 1.5 | | @ 14- & 24 hrs | 3.31 | 119.1 | 3.00 | 125.9 | 96.3 | 67.0 | 0.11 | 41.6 | 1.97 | 0.12 | |
| | | | | | | | | | | | | | | |
| C12 | 2.0 | | @ 14- & 24 hrs | 3.31 | 119.1 | 2.85 | 127.6 | 96.5 | 69.2 | 0.10 | 39.3 | 2.68 | 0.16 | |
| | | | | | | | | | | | | | | |
Figure 13.3: Optimization Gold Extraction Kinetics
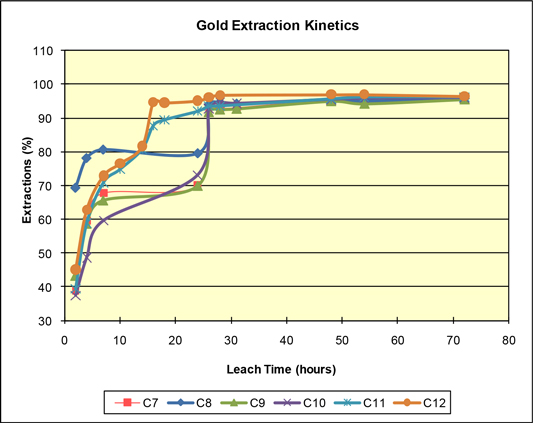
| | SANTA ELENA UPDATE TECHNICAL REPORT |
| | EFFECTIVE DATE: DECEMBER 31, 2014 |
| | |
Figure 13.4: Optimization Silver Extraction Kinetics
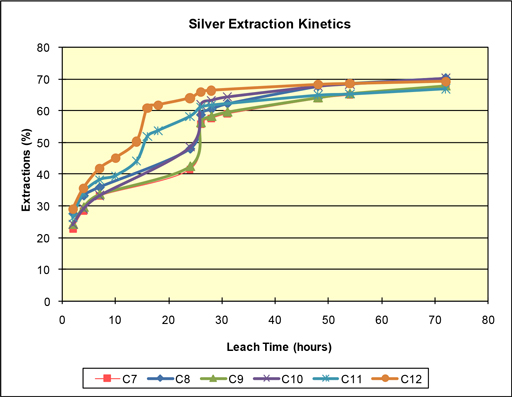
Confirmatory Leach on New Santa Elena Feed
Confirmatory leach tests (C15 to C17) were carried out on another Santa Elena NIVEL (Level) composite (Comp. 4 ± 0 Nivel) with mine water (also referred as site water in the test spreadsheets) provided by SilverCrest. Leach pulp density increased from 40 wt.% for the baseline tests to 45%. During the leach tests, the pregnant leach solution was replaced with fresh mine water after 10 hours leach. Leach conditions and results are summarized in Table 13.3.
Results showed that over 97% gold extraction is achievable by leaching the Comp. 4 ± 0 Nivel in 1.0g/L cyanide at 45% solids by replacing partial or full leach liquor. Increasing cyanide dosage to 1.5g/L did not result in significant improvement of gold recovery. Silver extraction was ~43% in all three cases.
| | SANTA ELENA UPDATE TECHNICAL REPORT |
| | EFFECTIVE DATE: DECEMBER 31, 2014 |
| | |
Table 13.3: Confirmatory Test Comp. 4 +/- 0 Nivel
| | | Test Conditions | Measured Head | Calculated Head | 72-h Extraction | Residue Grade | Consumption (kg/t) | |
| Test No | NaCN, g/L | Oxidant | | Sol'n
Replacement | Au (g/t) | | Ag (g/t) | Au (g/t) | | Ag (g/t) | Au (%) | | Ag (%) | Au (g/t) | | Ag (g/t) | NaCN | | Lime | |
| | | | | | | | | | | | | | | | | | | | | |
| C7 | 1.0 | | | @ 24 hrs | 3.31 | | 119.1 | 2.58 | | 131.8 | 95.6 | | 67.6 | 0.11 | | 42.7 | 1.23 | | 0.17 | |
| | | | | | | | | | | | | | | | | | | | | |
| C8 | 1.0 | 0.25kg/t
Pb(NO3)2 | | @ 24 hrs | 3.31 | | 119.1 | 2.63 | | 126.9 | 95.8 | | 70.3 | 0.11 | | 37.7 | 1.31 | | 0.16 | |
| | | | | | | | | | | | | | | | | | | | | |
| C9 | 1.0 | 0.1kg/t
H2O2 | | @ 24 hrs | 3.31 | | 119.1 | 2.80 | | 133.7 | 95.5 | | 67.9 | 0.13 | | 42.9 | 1.31 | | 0.15 | |
| C10 | 1.5 | | | @ 24 hrs | 3.31 | | 119.1 | 2.87 | | 135.7 | 96.0 | | 70.2 | 0.11 | | 40.4 | 1.24 | | 0.16 | |
| | | | | | | | | | | | | | | | | | | | | |
| C11 | 1.5 | | | @ 14- & 24 hrs | 3.31 | | 119.1 | 3.00 | | 125.9 | 96.3 | | 67.0 | 0.11 | | 41.6 | 1.97 | | 0.12 | |
| C12 | 2.0 | | | @ 14- & 24 hrs | 3.31 | | 119.1 | 2.85 | | 127.6 | 96.5 | | 69.2 | 0.10 | | 39.3 | 2.68 | | 0.16 | |
| | | | | | | | | | | | | | | | | | | | | |
Figure 13.5: Confirmatory Extraction Kinetics

| | SANTA ELENA UPDATE TECHNICAL REPORT |
| | EFFECTIVE DATE: DECEMBER 31, 2014 |
| | |
Figure 13.6: Confirmatory Silver Extraction Kinetics
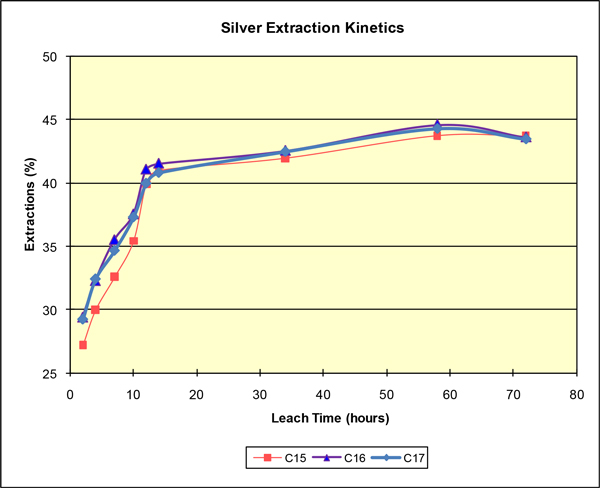
Baseline Bottle Roll Tests on Spent Ore
During 2012, 10 representative bulk samples from trenching were collected from spent ore on the leach pad and analysed using mill design specifications. Analyses consisted of bottle roll leach tests for 72 hours at approximately 33.3% solids at target P80 grinds of 74 µm. The cyanide dosage of 1.0 g/L cyanide was tested at a pH ≥10.0 maintained with hydrated lime. Test work was completed at the on-site Santa Elena lab which has a fully functional wet lab with extensive external QA/QC reviews (refer to Section 12 – Data Verification).
Results in Table 13.4 show average recovery rates of 91.4% gold and 72.5% silver which is consistent with results tested on underground bulk samples and bottle roll tests used for mill design. Recovery rates of 92% gold and 67.5% silver are used for all milling ores including spent ore from the leach pad.
| | SANTA ELENA UPDATE TECHNICAL REPORT |
| | EFFECTIVE DATE: DECEMBER 31, 2014 |
| | |
Table 13.4: Average Recovery Rates for Underground Bulk Samples
| Muestra | Recuperacion | NaCN Consumido kg/ton | Cal Agregada kq/ton |
Au % | Ag % | Cu % |
| PR- Patios 1 Gastado | 89.01 | 74.21 | 26.60 | 0.38 | 1.30 |
| PR- Patios 2 Gastado | 84.10 | 67.43 | 22.60 | 0.56 | 1.40 |
| PR- Patios 3 Gastado | 91.90 | 75.36 | 13.93 | 0.44 | 1.50 |
| PR- Patios 4 Gastado | 94.40 | 86.32 | 18.92 | 0.74 | 1.20 |
| PR- Patios 5 Gastado | 96.19 | 85.78 | 28.71 | 0.86 | 1.70 |
| PR- Patios 6 Gastado | 92.44 | 54.71 | 10.85 | 0.44 | 1.10 |
| PR- Patios 7 Gastado | 94.82 | 65.39 | 20.09 | 0.78 | 1.60 |
| PR- Patios 8 Gastado | 93.25 | 84.00 | 24.73 | 0.58 | 1.00 |
| PR- Patios 9 Gastado | 91.88 | 66.93 | 22.42 | 0.64 | 1.50 |
| PR- Patios 10 Gastado | 86.32 | 65.71 | 18.89 | 0.56 | 1.20 |
Three additional tests were completed on composites 4, 6 and 8 (Table 13.5) to check for reproducibility and graphically report results in Figures 13.7 to 13.9.
Table 13.5: Results of Additional Testing on Samples 4, 6 and 8.
| Muestra | Recuperacion | NaCN Consumido kg/ton | Cal Agregada kg/ton |
Au % | Ag % | Cu % |
| PR- Patios 4 Gastado-Reemplazo | 94.89 | 87.24 | 21.36 | 1.06 | 1.60 |
| PR- Patios 6 Gastado-Reemplazo | 93.32 | 56.27 | 12.59 | 0 74 | 1.50 |
| PR- Patios 8 Gastado-Reemplazo | 92.66 | 84.79 | 27.46 | 0.74 | 1.60 |
| | SANTA ELENA UPDATE TECHNICAL REPORT |
| | EFFECTIVE DATE: DECEMBER 31, 2014 |
| | |
Figure 13.7: Additional Testing of Composite Sample #4.
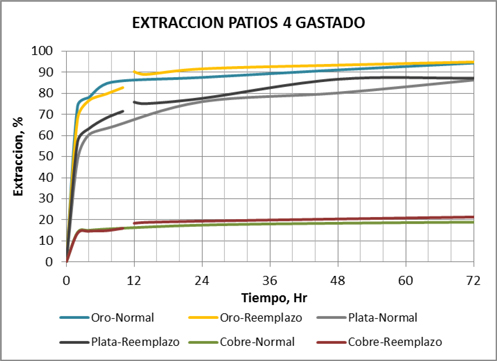
Figure 13.8: Additional Testing of Composite Sample #6.

| | SANTA ELENA UPDATE TECHNICAL REPORT |
| | EFFECTIVE DATE: DECEMBER 31, 2014 |
| | |
Figure 13.9: Additional Testing of Composite Sample #8.
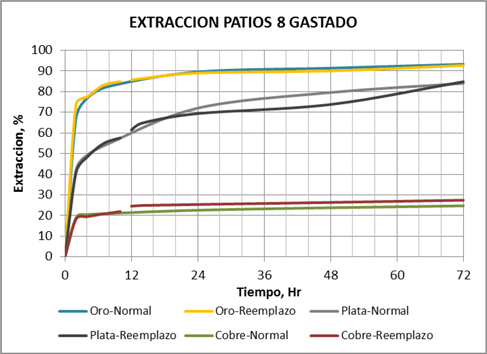
Leach Tailings Production
All remaining Santa Elena feed samples, including 20kg of Composite Nivel 4 and 5.5kg of Comp. 4 ± 0 Nivel, were leached to produce sufficient tailing samples for thickening studies at Pocock Industrial. The two feed samples were processed separately due to their difference in colour. The leach tests (C18-C19) were carried out at 48% solids with synthetic mine water in 1.5g/L NaCN at a target P80 grind of 100mm. The leach results are summarized in
Table 13.6.
Table 13.6: Bulk Leach Summary
Test No | | | Test Conditions | | | Extraction | Residue Grade | Consumption (kg/t) | |
| Sample ID | P80 Size,mm | % Solids | | NaCN, g/L | | Retention | Au (%) | | Ag (%) | Au (g/t) | | Ag (g/t) | NaCN | | Lime | |
| | | | | | |
| | | | | | | | | | | | | | | | | | |
| C18 | Comp. 4 ± 0
Nivel | 97 | 48 | | 1.5 | | 20 hours | 94.4 | | 42.4 | 0.06 | | 21.2 | 0.52 | | 0.13 | |
| C19 | Nivel 4 Comp. | 111 | 48 | | 1.5 | | 8 hours | 84.9 | | 51.8 | 0.29 | | 54.9 | 0.35 | | 0.12 | |
| 13.2.2 | Filtering and Thickening Test work |
Pocock Industrial carried out a series of tests on leach residue produced by Inspectorate to determine design parameters for plant design. A flocculent screening programme was carried out and it was determined that flocculent performance was highly variable. The best performance was achieved using a Hychem Flocculent (N301) for both thickening and a filter aid. Using this flocculent in thickening over 70% solids could be achieved from feed densities in the 20-25% solids range with an indicated thickener area (for a conventional thickener) of 0.11m2/tpd. This same flocculent used as a filter aid could produce an 18% moisture cake at a filtration rate of 777kg/m2/hr.
| | SANTA ELENA UPDATE TECHNICAL REPORT |
| | EFFECTIVE DATE: DECEMBER 31, 2014 |
| | |
| 13.3 | Metallurgical Operational Results Up To December 31, 2014 |
The Santa Elena heap leach operations was completed in mid- 2014 with the transition to the new CCD/Merrill Crowe (CCD/MC) processing facility. The shutdown of the of the pad took several months as residual leaching provide metal ounces for production and water balance was adjusted as the new processing facility was brought on line as of December 31, 2014, 3.34 million tonnes of leach pad material remain and has been fully or partial leached with overall recovery rates of 60% gold and 30% silver.
The leach pad material or ore is currently being reprocessed through the new processing facility. No crushing is required for this ore with direct feed to a reclaim stockpile area where it is mixed with crushed underground or open pit ore.
The new 3,000 tpd conventional CCD/MC processing facility was commissioned between May to August 2014 and commercial production was declared on August 1, 2014. For 2014, a total of 526,525 tonnes grade 1.03 gpt Au and 68.23 gpt Ag at recovery rates of 90% Au and 66% Ag were processed through the new facility. The overall blend (mix) of pad ore and underground ore was approximately 70/30. The open pit was shut down on April 1, 2014 and not reopened until January 2015, therefore no open pit ore was blended in the new process in 2014. A total of 27,609 ounces of gold and 2,813,559 ounces of silver were produced from the final stages of pad leaching and the new facility in 2014.
As of the end of 2014, optimization and efficiencies were underway to improve process throughput and recovery rates. Work is being focused on; 1) ball mill grind size to achieve P80, 80% passing 100 microns with December throughput showing 72 to 74% passing, 2) leach tank cyanidation levels ranging from 750 ppm to 1200 ppm, 3) leach tank increased oxidation using air and/or lead nitrates, 4) lab work on silver sulphide mineralogy and metallurgical responses for increased recovery, and 5) process tailings washing to collect and recirculate cyanide back into the process.
| | SANTA ELENA UPDATE TECHNICAL REPORT |
| | EFFECTIVE DATE: DECEMBER 31, 2014 |
| | |
| 14.0 | Mineral Resource Estimates |
Mineral resource estimate have been revised and compiled for the Santa Elena Underground and the Spent Ore on the Heap Leach. These are updated to reflect a revised geological model that has been created using data from additional surface and underground drilling and information obtained from underground development.
A resource estimate is not reported here for the Open Pit at Santa Elena as all the material had previously, and are currently, declared as mineral reserves.
| 14.1 | Previous Mineral Resource Estimates |
Three individual Mineral Resource Estimates were prepared in 2013 within the 2013 PFS. These estimates included:
| 1) | An estimate for spent ore material on the existing leach pads that was prepared by Eric Fier, Chief Operating Officer of SilverCrest and non-Independent Qualified Person; |
| 2) | An estimate for the material outside of, and below, the ultimate open pit (considered the underground resource estimate) that was prepared by James Barr, P.Geo, Senior Geologist with EBA and an Independent Qualified Person; and |
| 3) | An open pit resource for material within the ultimate pit, prepared by Eric Fier, Chief Operating Officer of SilverCrest and non-Independent Qualified Person. |
| 14.1.1 | Previous Underground Resource Estimate |
The previous Underground Resource Estimate was completed by Tetra Tech EBA, effective April 30, 2013, which included mineralization within the MMZ, El Cholugo and El Cholugo Dos that were interpreted to exist external to the ultimate pit design available at that time.
The estimates were confined by geological and mineralogical control based on Tetra Tech EBA interpretation from surface drilling (included 256 holes up to end of March 15th, 2013) and from information received from SilverCrest personnel. A gold equivalent (AuEq) was estimated using a metal value ratio (Au:Ag) of 70:1 based on three and five year trailing historical metal prices and the proposed metal recoveries. An estimated cut-off grade of 1.4 gpt AuEq was determined by applying conceptual underground mining costs, mining dilution and mining recovery values to the trailing gold price. A cut-off grade of 1.0 gpt AuEq was used to define the outer boundary of the mineralized grade shells which constrained the resource estimate.
A specific gravity value of 2.60 was applied to mineralized material and 2.65 applied to waste based on the results of statistical analyses of 766 routine in-situ specific gravity tests.
Raw assay data was composited and normalized to 2 metre intervals. High grade caps of 12 gpt gold and 600 gpt silver were applied to the composite data set based on interpretation of histogram and log-probability plots to remove grade values considered to be population outliers.
Variogram analyses was performed using the composited assay data from operational blast holes, and delineation drilling on both downhole and between holes basis to determine a reasonable search range. The mineralized shells were subdivided into nine structural domains, within which search ellipse orientations were adjusted to match local trends. Grade was interpolated using ordinary kriging and verified visually, and by comparing various interpolation methods on swath plots against the raw and composited data.
| | SANTA ELENA UPDATE TECHNICAL REPORT |
| | EFFECTIVE DATE: DECEMBER 31, 2014 |
| | |
Table 14.1: Previous Underground Mineral Resource Estimate Including Reserves for Santa Elena (EBA, April 30th, 2013)
| Area | Classification* | AuEQ** Cut-off (g/t) | Tonnage | Au | Ag | Contained Au
Ounces | Contained Ag Ounces |
| Santa Elena | Indicated | 1.50 | 5,443,000 | 1.83 | 125 | 321,000 | 21,828,000 |
| Santa Elena | Indicated | 1.40 | 5,632,000 | 1.79 | 123 | 324,000 | 22,183,000 |
| Santa Elena | Indicated | 1.30 | 5,816,000 | 1.75 | 120 | 328,000 | 22,505,000 |
| | | | | | | | |
| Santa Elena | Inferred | 1.50 | 787,000 | 1.50 | 170 | 38,000 | 4,305,000 |
| Santa Elena | Inferred | 1.40 | 815,000 | 1.47 | 166 | 38,000 | 4,357,000 |
| Santa Elena | Inferred | 1.30 | 874,000 | 1.40 | 159 | 39,000 | 4,463,000 |
| | | | | | | | |
| El Cholugos | Inferred | 1.50 | 699,000 | 1.67 | 147 | 37,000 | 3,305,000 |
| El Cholugos | Inferred | 1.40 | 737,000 | 1.61 | 143 | 38,000 | 3,378,000 |
| El Cholugos | Inferred | 1.30 | 782,000 | 1.55 | 138 | 39,000 | 3,457,000 |
| Total | Indicated | 1.40 | 5,632,000 | 1.79 | 123 | 324,000 | 22,183,000 |
| Total | Inferred | 1.40 | 1,552,000 | 1.54 | 155 | 76,000 | 7,735,000 |
* Mineral Resources have been estimated from geological evidence and limited sampling and must not be considered to imply direct mineability. The reported baseline Mineral Resource for each zone is based on a 1.4 gpt AuEq cut-off and is highlighted in light blue. Grade capping has been applied at 12 gpt Au and 600 gpt Ag,
**Based on Au:Ag ratio of 70, incorporating metal price assumptions of $1,450/oz Au, $28/oz Ag and using metallurgical recoveries of 92% Au and 67.5% Ag.
*** Tonnage and contained ounces have been rounded to the nearest thousand.
| | SANTA ELENA UPDATE TECHNICAL REPORT |
| | EFFECTIVE DATE: DECEMBER 31, 2014 |
| | |
Table 14.2: Previous Underground Mineral Resource Estimate and Sensitivity, Excluding Reserves for Santa Elena (EBA April 30th, 2013)
| Area | Classification* | AuEq** Cut-off
(g/t) | Tonnage | Au | Ag | Contained Au Ounces | Contained Ag Ounces |
| Santa Elena | Indicated | 1.50 | 2,055,000 | 1.73 | 117 | 114,000 | 7,753,000 |
| Santa Elena | Indicated | 1.40 | 2,143,000 | 1.69 | 115 | 116,000 | 7,919,000 |
| Santa Elena | Indicated | 1.30 | 2,235,000 | 1.64 | 112 | 118,000 | 8,082,000 |
| | | | | | | | |
| Santa Elena | Inferred | 1.50 | 725,000 | 1.42 | 173 | 33,000 | 4,026,000 |
| Santa Elena | Inferred | 1.40 | 752,000 | 1.39 | 168 | 34,000 | 4,075,000 |
| Santa Elena | Inferred | 1.30 | 811,000 | 1.33 | 160 | 35,000 | 4,181,000 |
| | | | | | | | |
| El Cholugos | Inferred | 1.50 | | | | | |
| El Cholugos | Inferred | 1.40 | 737,000 | 1.61 | 143 | 38,000 | 3,378,000 |
| El Cholugos | Inferred | 1.30 | 782,000 | 1.55 | 138 | 39,000 | 3,457,000 |
| Total | Indicated | 1.40 | 2,143,000 | 1.69 | 115 | 116,000 | 7,919,000 |
| Total | Inferred | 1.40 | 1,490,000 | 1.50 | 156 | 72,000 | 7,453,000 |
* Mineral Resources have been estimated from geological evidence and limited sampling and must not be considered to imply direct mineability. The reported baseline Mineral Resource for each zone was based on a 1.4 gpt AuEq cut-off and is highlighted in light blue. Grade capping has been applied at 12 gpt Au and 600 gpt Ag,
**Based on Au:Ag ratio of 70, incorporating metal price assumptions of $1,450/oz Au, $28/oz Ag and using metallurgical recoveries of 92% Au and 67.5% Ag.
*** Tonnage and contained ounces have been rounded to the nearest thousand.
| 14.1.2 | Previous Spent Ore on Leach Pad Resource Estimate |
The previous Leach Pad Resource Estimate (spent ore) was estimated by SilverCrest utilizing daily production, grade and mass records obtained at the crushing plant when conveying mineralized material to the pad commencing with the start-up of the mine operations. A detailed leach pad survey was completed in April 2013 which provided volumes of material placed on the pad. This volume was compared with weightometer data collected on the crushing plant to validate tonnes on the pad using operating spent ore specific gravity of 1.85 g/cm3.
Twenty-five drill holes (total of 169 samples) were completed in 2013 on the leachpad and were used to construct a block model for the spent ore on the leach pad. Block sizes were 100m x 100m x 6m. The Block model average grades were then used to compare and validate the average grade estimated from the mine’s daily production data.
The Spent Ore on Leach Pad Resource Estimate reported in 2013 is reported in Table 14.3 below. This resource estimate is now superseded by the current Spent Ore on Leach Pad Resource Estimate which is based on current mine site information and should no longer be relied upon.
| | SANTA ELENA UPDATE TECHNICAL REPORT |
| | EFFECTIVE DATE: DECEMBER 31, 2014 |
| | |
Table 14.3: Previous Leach Pad Material Mineral Resource Estimate (April 30th, 2013)
| Area | Classification* | AuEq**Cut-
off (gpt) | Tonnage | Au | Ag | Contained Au
Ounces | Contained Ag Ounces |
| Leach Pad | Indicated | 0.00 | | | | | |
| Leach Pad | Indicated | 0.50 | 2,844,530 | 0.65 | 33.3 | 59,420 | 3,048,200 |
| Leach Pad | Indicated | 1.00 | | | | | |
| Total | Indicated | 0.50 | 2,844,530 | 0.65 | 33.3 | 59,420 | 3,048,200 |
*Classified by SilverCrest Mines Inc. and conforms to NI 43-101 and CIM definitions for resources. Mineral Resources were estimated from drill hole data and validated using company production data and sampling. The estimate must not be considered to imply economic mineability. The reported baseline Mineral Resource for the leach pad material is based on a 0.5 gpt AuEq cut-off and is highlighted in light blue. No grade capping has been applied.
**Based on Au:Ag ratio of 70, incorporating metal price assumptions of $1,450/oz Au, $28/oz Ag and using metallurgical recoveries of 92% Au and 67.5% Ag. All leach pad spent ore was considered above cut-off grade of 1.0 gpt AuEq.
| 14.1.3 | Previous Open Pit Resource Estimate |
The previous open pit resources were estimated by SilverCrest using production data (blastholes), exploration drilling data and computer modelling. All resources were classified as Indicated in the operating open pit and were converted to Reserves.
The Open Pit Mineral Resource estimates were based on verified information from historical and recent SilverCrest sources. Solid boundaries for the mineralization were constrained at 0.20 gpt AuEq cut off and the open pit limits defines the mineralized material dated as December 31, 2012. Capping of 8 gpt Au and 300 gpt Ag was applied to core and RC data only. The blasthole resource model was compared against the production data for verification purposes.
| 14.2 | Current Underground Mineral Resource Estimate |
Interpretation used for the geological, grade and block modelling of the Santa Elena deposit was prepared by SilverCrest personnel. The block model used in this Mineral Resource Estimate has been completed by SilverCrest using Dassault Systemes GEMS v6.5 software.
| 14.2.1 | Gold Equivalent (AuEq) Calculations and Assumptions |
The Santa Elena deposit demonstrates mineralogical correlation between gold and silver concentrations. Based on current metal prices, SilverCrest applied criteria to define the AuEq, defined below, to be applied for both interpretation and reporting purposes.
Inputs for metal prices were based on $1,200 gold and discounted with the effect of the gold stream resulting in a value $1072 and $18 silver as currently adopted for site mining production cut off analyses. These values are conservative compared to the variable prices used in the financial model.
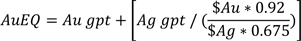
| | SANTA ELENA UPDATE TECHNICAL REPORT |
| | EFFECTIVE DATE: DECEMBER 31, 2014 |
| | |
| 14.2.2 | Specific Gravity used in the Resource Estimation |
Routine in-situ specific gravity (SG) testing was conducted by SilverCrest personnel throughout the 2012-2014 drilling programs. A total of 378 measurements in the MMZ, breccia and stock work were collected from drill core with a standard scale and bucket measuring apparatus. Results were tabulated in the corresponding drill hole logs. Table 14.4 below gives an overview of the average density factors found from these measurements.
Table 14.4: Specific Gravity
| Lithology | Density Factor | # Samples used |
| Main Vein | 2.6 | 127 |
| Breccia | 2.69 | 98 |
| Stock work | 2.64 | 153 |
The overall drill hole database was coded allowing the selection of samples only inside the MMZ. This reduced the total number of core samples to be investigated from 15,552 down to a value of 2,532. The statistical analyses confirms a single population is supported by the MMZ geological model (low sulphidation quartz vein). Figure 14.1 shows the box plots for raw data within the MMZ, Figure 14.2 shows the histogram and probability curve for silver, and Figure 14.3 shows the histogram and probability curve for gold. Figure 14.4 shows the box plots after compositing gold and silver grades in regular two metre intervals within the MMZ.
Figure 14.1: Boxplot for Raw Gold and Silver within MMZ
| | SANTA ELENA UPDATE TECHNICAL REPORT |
| | EFFECTIVE DATE: DECEMBER 31, 2014 |
| | |
Figure 14.2: Histogram and Probability Curve for Raw Silver within MMZ
Figure 14.3: Histogram and Probability Curve for Raw Gold within MMZ
| | SANTA ELENA UPDATE TECHNICAL REPORT |
| | EFFECTIVE DATE: DECEMBER 31, 2014 |
| | |
Figure 14.4: Boxplot for Composited Gold and Silver within MMZ
Stockwork
Samples within this modelled lithology are considered to be low grade with the exception of few outliers. As illustrated in Figure 14.5, the majority of samples lie below 30 g/t silver (90%) and 0.1 g/t gold (98%).
| | SANTA ELENA UPDATE TECHNICAL REPORT |
| | EFFECTIVE DATE: DECEMBER 31, 2014 |
| | |
Figure 14.5: Statistical Analyses for Stockwork
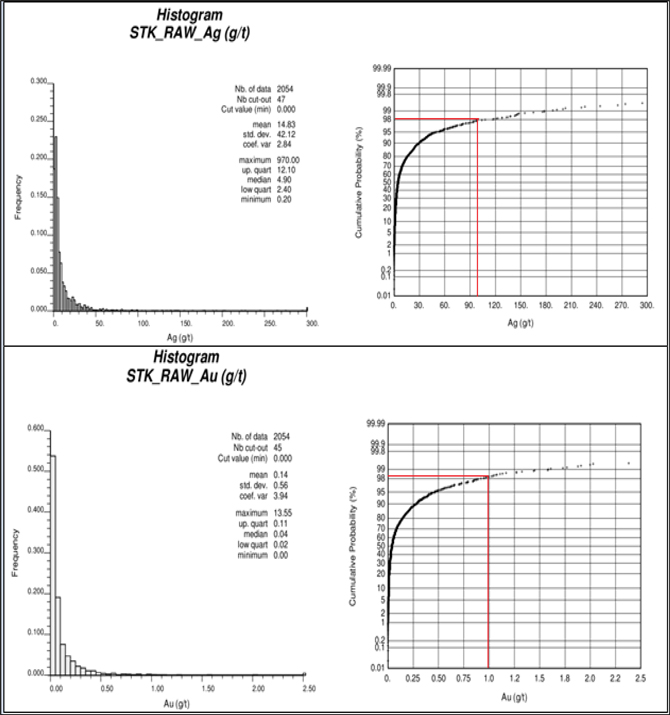
| | SANTA ELENA UPDATE TECHNICAL REPORT |
| | EFFECTIVE DATE: DECEMBER 31, 2014 |
| | |
Breccia
Similarly to stockwork, samples within this modelled lithology are considered to be low grade with the exception of few outliers. As illustrated in Figure 14.6, the majority of samples lie below 100 g/t silver and 1 g/t gold.
Figure 14.6: Statistical Analyses for Breccia
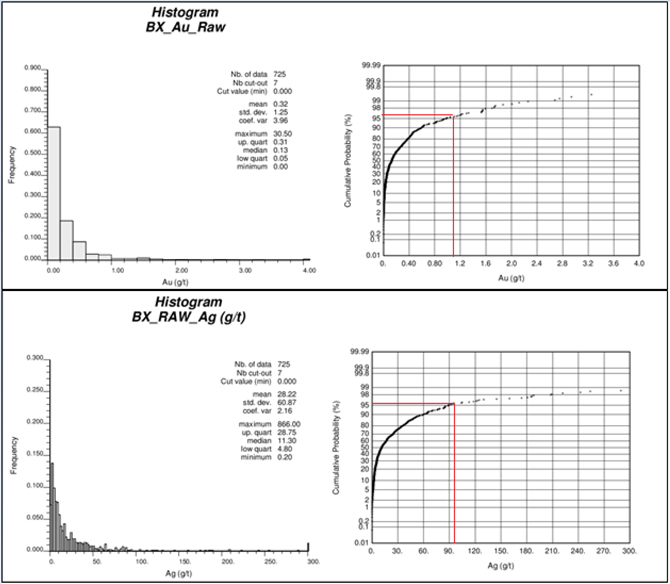
| 14.2.3.1 | High Grade Capping |
Inspection of the raw data for all lithological domains indicated the population is positively skewed with some anomalous outliers. Histogram and probability plots for gold and silver distribution were used for visual determination of anomalous values and as the basis of selection for grade capping prior to composite the data for grade interpolation in MMZ, Stockwork, and Breccia lithological domains.
| | SANTA ELENA UPDATE TECHNICAL REPORT |
| | EFFECTIVE DATE: DECEMBER 31, 2014 |
| | |
Capping within MMZ
Capping was defined at the 98th percentile along the cumulative probability curve where the data behaviour is less continuous and moves away from the main curve trend. Gold and Silver were capped using vales of 700 gpt for silver and 12 gpt for gold. Figure 14.7 and 14.8 highlight the capped gold and silver values on cumulative log-probability plots.
Figure 14.7: Cumulative Log-Probability Graph for Raw Gold Grades
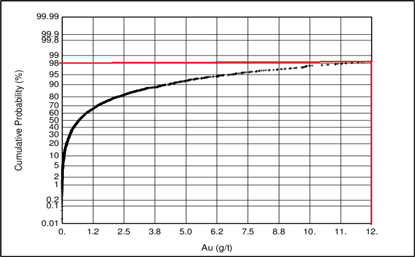
Figure 14.8: Cumulative Log-Probability Curve for Raw Silver Grades
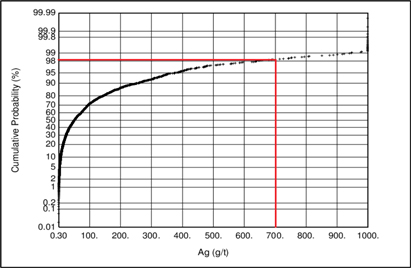
46 samples were capped at 12 gpt for gold which represents less than two percent of total number of samples. 43 samples were capped at 700 gpt silver which is again less than two percent of total number of samples.
High Grade Capping in Stockwork and Breccia
Stockwork and Breccia are both modelled as low grade dilution zones. Outliers in these two lithological domains were capped using the 98th percentile values in the probability curves (similar to MMZ). Gold was capped at 1 gpt and silver was capped at 100 gpt (refer to Figure 14.6).
| | SANTA ELENA UPDATE TECHNICAL REPORT |
| | EFFECTIVE DATE: DECEMBER 31, 2014 |
| | |
Raw samples were composited to an equal length of two metres starting from collar points. A two metre length was selected based on high frequency of this sampling interval. The composting honored the boundaries defined by the footwall and hanging wall for the MMZ, breccia and stockwork, El Cholugo and Tortuga.
An analyses of sample length was completed in order to assess best composite length and also take into consideration most frequent sample length. Also about 50% of the samples are greater than one metre in length and about 8% are greater than two metres. It was defined that a two metre composite would provide more support for generation of regular length data and also fit the purpose of grade interpolation and definition of resources. Due to the low number of samples with length less than 1 metre, composites with length of less than two metres were also used in the grade interpolation.
Below is the histogram and Q-Q plot used to determine the composite length.
Figure 14.9: Histogram and Probability Plot of Raw Length Values within the MMZ

The cut-off date for data analyses and compositing was December 15th of 2014. Figure below summarizes the resulting geostatistical results of compositing the population.
Compositing was performed on uncapped and capped samples for comparison. Capping was applied before compositing for samples used in the resource estimate. There were 1,871 two metre composites used in support of the resource estimate for the MMZ.
| | SANTA ELENA UPDATE TECHNICAL REPORT |
| | EFFECTIVE DATE: DECEMBER 31, 2014 |
| | |
Figure 14.10: Box Plots with Capped and Uncapped Samples within MMZ
Figure 14.11: Box Plots with Capped and Uncapped Samples within the Stockwork

| | SANTA ELENA UPDATE TECHNICAL REPORT |
| | EFFECTIVE DATE: DECEMBER 31, 2014 |
| | |
Figure 14.12: Box Plots with Capped and Uncapped Samples within the Breccia

| 14.2.4 | El Cholugo Geostatistics |
The drill hole database was coded allowing the selection of samples only inside the El Cholugo vein solid to be used. This reduced the total number of core samples to be investigated from 15,552 down to a value of 56. Figure 14.3 shows histograms and probability plots raw data within the El Cholugo Vein. There were 88 two metre composites used in support of the resource estimate for El Cholulgo.
| | SANTA ELENA UPDATE TECHNICAL REPORT |
| | EFFECTIVE DATE: DECEMBER 31, 2014 |
| | |
Figure 14.13: El Cholugo Vein Statistical Analyses
| 14.2.5 | Tortuga Geostatistics |
Only 22 samples exist within the Tortuga vein. All samples were composited and used in this estimate. There were 24 two metre composites used in support of the resource estimate for Tortuga.
| | SANTA ELENA UPDATE TECHNICAL REPORT |
| | EFFECTIVE DATE: DECEMBER 31, 2014 |
| | |
Figure 14.14: Histogram and Probability Curve for Raw Gold and Silver within Tortuga Vein
80 percent of samples have gold grade below 1 gpt and 75 gpt Ag. There are isolated high grade intervals (as shown in figure above) requiring further investigation and modelling in any future resource estimation.
| 14.2.6 | Basis of Current Underground Mineral Resource Estimation |
The underground Mineral Resource Estimate described in this section has been prepared for mineralized material outside of the ultimate pit design and located within the Main Mineralized Zone (MMZ), El Cholugo and Tortuga veins, and the breccia and stockwork associated with the MMZ. These have been interpreted geologically using drill hole and underground mapping information, where available, and constructed as solids using Leapfrog 2.1.1 and Gemcom 6.5.
The analytical data was interpolated into a block model using the Ordinary Kriging (OK) method for the MMZ east only, inverse distance (ID2) was used for the MMZ west and all other lithological units. All input data and grade interpolation was constrained by the geology solids.
The geological grade model has been built referencing the WGS 84 zone 12 coordinate system, the origins and bounds of the block model are listed in Table 5.1.1, no rotation has been applied. Topographic data used in the model was collected by Eagle Mapping in November of 2010 using a fixed wing aircraft to create a digital terrain model (DTM) accurate to 2 metre resolution; this topography was updated from the end of pit January 2015 topo to give an accurate estimate of mineral resources available after the mining of the open pit concluded. Drill hole collar elevations were surveyed by SilverCrest personnel using Trimble survey equipment.
| | SANTA ELENA UPDATE TECHNICAL REPORT |
| | EFFECTIVE DATE: DECEMBER 31, 2014 |
| | |
| Table 14.5: Block Model Origin and Demission of the Santa Elena Model |
| Database | Direction | Origin | Block
Size (m) | Number of
Blocks | Dimension
(m) | Rotation
(deg) |
| BelowPIT2015 | East (rows) | 580,450 | 5 | 200 | 1000 | 0 |
| North (columns) | 3,321,000 | 5 | 360 | 1800 | 0 |
| Elevation (levels) | 975 | 5 | 145 | 725 | 0 |
| 14.2.7 | Drill Holes Used in Underground Mineral Resource |
This 2015 Santa Elena MMZ resource estimate is based on the sampling from 313 core and RC holes (75,932.8 metres), the El Cholugo estimate is based on the sampling from 38 core and Rc holes (9464.33 metres) and the Tortuga estimate is based on 15 core and RC holes (3484.45 metres). All holes for these estimates were drilled during 2006-2014 by SilverCrest Mines Inc. Figure 14.15 shows the total number of drill holes used the 2015 resource estimation. Drill holes for this resource were selected from 2006 up to the effective date of December 31, 2014. The tables below display the number of drill holes available for resource estimation for each of the difference vein systems.
Table 14.6: Drill Holes Used in Estimating MMZ
| Drill Type | No. of Holes Drilled | Total Meters |
| Diamond | 263 | 66,762.31 |
| RC | 36 | 2,864.39 |
| RC with Diamond Tail | 14 | 6,306.10 |
Table 14.7: Drill Holes Used in Estimating El Cholugo
| Drill Type | No. of Holes Drilled | Total Meters |
| Diamond | 37 | 9362.33 |
| RC | 1 | 102 |
Table 14.8: Drill Holes Used in Estimating Tortuga
| Drill Type | No. of Holes Drilled | Total Meters |
| Diamond | 14 | 3309.45 |
| RC | 1 | 175 |
| | SANTA ELENA UPDATE TECHNICAL REPORT |
| | EFFECTIVE DATE: DECEMBER 31, 2014 |
| | |
Figure 14.15: Location of Drill Holes used in 2015 Mineral and Solid Resource Update
| 14.2.8 | Lithological Interpretation Used in the Model |
Interpretation used for the geological model was prepared by SilverCrest through discussions with Nusantara personnel, field observations and review of documentation provided by on site geologists. The block model and resulting resource estimate was completed by SilverCrest using Dassault Systemes GEMS 6.5v geological modelling software.
The Santa Elena deposit is a semi-continuous quartz and calcite filled brittle structure that strikes approximately 090 degrees and dips approximately 55 degrees to the south with a predominant south easterly directed plunge on mineralization with a rake of approximately 25 degrees. Local variations in both the strike and dip in the vein orientation is seen across the vein and may be associated with several faults that cross-cut the vein (Figures 16.16 and 16.17).
| | SANTA ELENA UPDATE TECHNICAL REPORT |
| | EFFECTIVE DATE: DECEMBER 31, 2014 |
| | |
A lithology solid model including MMZ, main fault, breccia, stock work and El Cholugo vein was generated using both Leapfrog 2.1. and Gemcom 6.5 (Figure 16.18). Hard boundaries are suited to the nature of epithermal vein lithology and directly from evidence seen in drill holes at Santa Elena. Because there were two separate populations seen in the geostatistical analyses the MMZ was split into two domains; MMZ west and MMZ east. The Fault F that is seen in both the surface mapping and drill holes was used to generate this hard boundary. The main fault was modeled to assist the underground mining group with geotechnical considerations and with dilution. In the footwall of the MMZ there is one additional vein zone identified at mid to shallow depths named El Cholugo.
The Tortuga vein is on the west side of the MMZ and trends north south with a 65 degree dip. A unique code was applied to each domain for modelling purposes, described in Table 14.9 below.
| Table 14.9: Block Model Codes |
Block Model
Name | Block Model Rock
Code | Description |
| Mvein (west) | 1000 | MMZ ore material (80-100% quartz) to the west of Fault F |
| Mvein (east) | 2000 | MMZ ore material (80-100% quartz) to the east of Fault F |
| MainFault | 20 | Main Fault associated with the MMZ |
| Breccia | 30 | Brecciated rock (50-80% quartz) low grade material |
| Stock work | 40 | Stock work (20-50% quartz) low grade material |
| Dike | 50 | Series of three small dykes seen cross-cutting units in the model |
| El Cholugo | 60 | Parallel vein behind Santa Elena vein |
| Tortuga | 70 | West N-S trending vein |
| | SANTA ELENA UPDATE TECHNICAL REPORT |
| | EFFECTIVE DATE: DECEMBER 31, 2014 |
| | |
Figure 14.16:Geological Model Showing Vein Domains, Looking Northwest
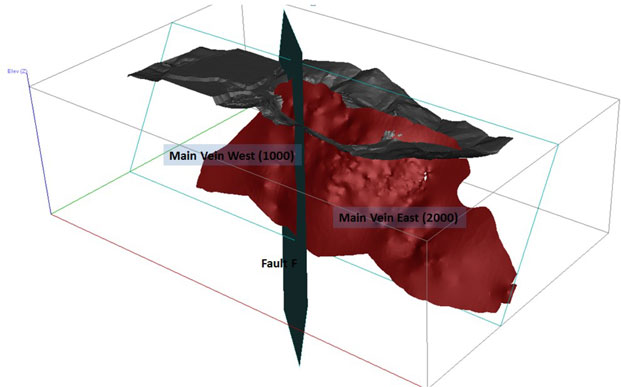
Figure 14.17:Geological Model Showing Lithology Units: Main Mineralized Zone (red), Breccia (grey) and Stockwork (green), Looking Northwest

| | SANTA ELENA UPDATE TECHNICAL REPORT |
| | EFFECTIVE DATE: DECEMBER 31, 2014 |
| | |
Figure 14.18: Geological Model Showing El Cholugo, Looking Northwest
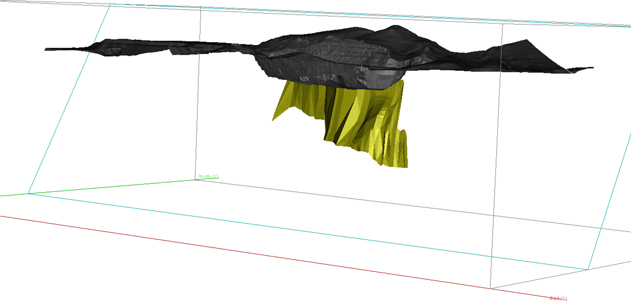
| 14.2.9 | Interpolation Method and Variography |
The model is based on verified drilling completed by SilverCrest between 2006 and 2014 which has provided near continuous drill intersection at approximately 40 metre spacing within the mineralization overall and 25 metre spacing within the initial underground stoping area. Grade distribution and the drill sample density supports variography analyses to estimate the orientation and anisotropy of elliptical search parameters for modelling the mineralization for estimation of the east MMZ only, all other lithological units lacked sample density for meaningful variography.
Variograms (correlogram) were created for both gold and silver. The variograms were verified with field observation and matched well with expected grade trends within the MMZ. Table 14.10 below summarizes the spherical model parameters that were fitted to the variograms.
| | SANTA ELENA UPDATE TECHNICAL REPORT |
| | EFFECTIVE DATE: DECEMBER 31, 2014 |
| | |
Table 14.10: Variography by Domain
| Domain | Component -
Increment | Angle 1
Z
Rotation | Angle 2
Y
Rotation | Angle 3
Z
Rotation | Range X
(m) | Range Y
(m) | Range Z
(m) | |
| |
| |
| MMZ East Au | Co - 0.3 | - | - | - | - | - | - | |
| C1 - 0.56 | -74 | 32 | 66 | 18 | 6 | 11 | |
| C2 - 0.14 | -2 | 90 | -68 | 25 | 60 | 80 | |
| MMZ East Ag | Co - 0.3 | - | - | - | - | - | - | |
| C1 - 0.616 | 34 | 35 | 56 | 5.2 | 9.9 | 7.2 | |
| C2 - 0.084 | 27 | 59 | 51 | 12 | 69.7 | 212.7 | |
The MMZ west, breccia, stock work, El Cholugo vein and Tortuga vein were all interpolated using inverse distance. Table 14.11 below summarizes the ellipse parameters that were used for pass 1, 2 and 3.
Table 14.11: Ellipse Parameters Summary
| | | Rotation | Anisotropy |
| | Pass | Z | Y | Z | X | Y | Z |
| | 1 | 270 | 55 | 0 | 25 | 50 | 5 |
| Mvein | 2 | 270 | 55 | 0 | 50 | 75 | 10 |
| | 3 | 270 | 55 | 0 | 400 | 500 | 300 |
| | 1 | 270 | 55 | 0 | 25 | 50 | 5 |
| Breccia | 2 | 270 | 55 | 0 | 50 | 75 | 10 |
| | 3 | 270 | 55 | 0 | 400 | 500 | 10 |
| | 1 | 270 | 55 | 0 | 25 | 50 | 5 |
| Stockwork | 2 | 270 | 55 | 0 | 50 | 75 | 10 |
| | 3 | 270 | 55 | 0 | 400 | 500 | 10 |
| | 1 | 180 | 70 | 0 | 10 | 20 | 5 |
| Tortuga | 2 | 180 | 70 | 0 | 20 | 40 | 10 |
| | 3 | 180 | 70 | 0 | 400 | 800 | 100 |
| | 1 | 270 | 55 | 0 | 25 | 50 | 5 |
| El Cholugo | 2 | 270 | 55 | 0 | 50 | 75 | 10 |
| | 3 | 270 | 55 | 0 | 400 | 500 | 300 |
Metal grade values were interpolated into the block model using the following parameters;
| § | Minimum / maximum numbers of composites for MMZ: set to 5 / 20 per block |
| § | Minimum / maximum numbers of composites for Breccia, Stockwork, Tortuga and El Cholugo: set to 3 / 20 per block |
| § | Discretization for Main East Ordinary Kriging: 2 x 2 x 2 |
| | SANTA ELENA UPDATE TECHNICAL REPORT |
| | EFFECTIVE DATE: DECEMBER 31, 2014 |
| | |
| § | Minimum number of samples per drill hole for MMZ : 4 |
| § | Minimum number of samples per drill hole for Breccia, Stockwork, Tortuga and El Cholugo: 2. |
| 14.2.10 | Block Classification |
Mineral resources have been classified based on the CIM Definition Standards for Mineral Resources and Mineral Reserves. The category the resources have been assigned is based on the confidence in geological information available relating to the mineral deposit, the quantity and quality of data available, the level of detail of the technical and economic information which has been generated and the interpretation of the data and information. SilverCrest confirms that the resources for the Santa Elena deposit meet the test of being a reasonable prospect for consideration of economic extraction based on the success of currently open pit production and continuity of mineralization along defined structural trends.
Interpolation of gold and silver grades used the variogram and search parameters outlined above as the basis for estimation. Following the interpolation, a script was run to assign classification scheme to each block to represent a level of confidence for the reported grades.
An Inferred classification has been applied to the block model to target peripheral blocks that indicate the presence and continuity of mineralization, but lack the density of data necessary for confirmation. Inferred blocks within the Santa Elena deposit lie within the maximum variogram range of 500 metres and have grade support from at least four drill hole and a minimum of five individual composite grades. All mineralized blocks within the Tortuga vein were assigned as Inferred.
An Indicated classification has been applied to the block model to target portions of the mineralized body where data density confirms the presence and continuity of mineralization with a moderate level of confidence. Indicated blocks within the Santa Elena deposit lie within the range of 50 metres and have grade support from at least two drill holes and being interpolated within the first two passes (second pass having a maximum search radius of 50m). All mineralized blocks within the Tortuga vein were assigned as Inferred.
| 14.2.11 | Underground Mineral Resource Estimate |
Mineral Resource Estimates have been completed for the underground portion of the Santa Elena MMZ, including the co-trending El Cholugo zones. The estimates have been prepared by SilverCrest using to the Standards of Disclosure for Mineral Projects as documented in National Instrument 43-101 and adhering to the Canadian Institute of Mining, Metallurgy and Petroleum Best Practice Guidelines. A summary of the estimates are presented with a 1.5 AuEq cut-off grade in Table 14.12.
| | SANTA ELENA UPDATE TECHNICAL REPORT |
| | EFFECTIVE DATE: DECEMBER 31, 2014 |
| | |
Table 14.12: Underground Mineral Resource Estimate Excluding Reserves for Santa Elena (SilverCrest, Dec 31, 2014)
| Area | Classification | AuEq
cut-off
(gpt) | Tonnes | Au gpt | Ag
gpt | Au ounces | Ag ounces |
| MMZ | Indicated | 1.5 | 1,077,550 | 1.38 | 88 | 48,000 | 3,063,000 |
| El Cholugo | Indicated | 1.5 | 39,482 | 1.79 | 124 | 2,000 | 157,000 |
| Total | Indicated | 1.5 | 1,117,032 | 1.39 | 89.7 | 50,000 | 3,220,000 |
| MMZ | Inferred | 1.5 | 338,068 | 1.10 | 75 | 12,000 | 813,000 |
| El Cholugo | Inferred | 1.5 | 216,313 | 2.67 | 157 | 19,000 | 1,095,000 |
| Tortuga | Inferred | 1.5 | 9,692 | 0.76 | 76 | 200 | 24,000 |
| Total | Inferred | 1.5 | 564,073 | 1.69 | 106.5 | 31,000 | 1,932,000 |
Note: contained ounces are rounded to nearest thousand.
Figure 14.19 below shows the block model for the Santa Elena underground resource, inclusive of reserves. Blocks displayed are classified as Indicated.
| | SANTA ELENA UPDATE TECHNICAL REPORT |
| | EFFECTIVE DATE: DECEMBER 31, 2014 |
| | |
Figure 14.19: Oblique View of MMZ Block Model Showing Indicated AuEq Blocks, Looking Northeast

Note: AuEq metals prices for the resource model at US$1072/oz, US$18/oz silver after accommodation for Sandstorm Purchase Agreement and metallurgical recoveries of 92% Au and 67.5%Ag.
| | SANTA ELENA UPDATE TECHNICAL REPORT |
| | EFFECTIVE DATE: DECEMBER 31, 2014 |
| | |
Grade tonnage curves for the MMZ Indicated and Inferred resources are shown below in Figures 14.20 and 14.21.
Figure 14.20: Grade Tonnage Curve for Indicated Mineral Resources
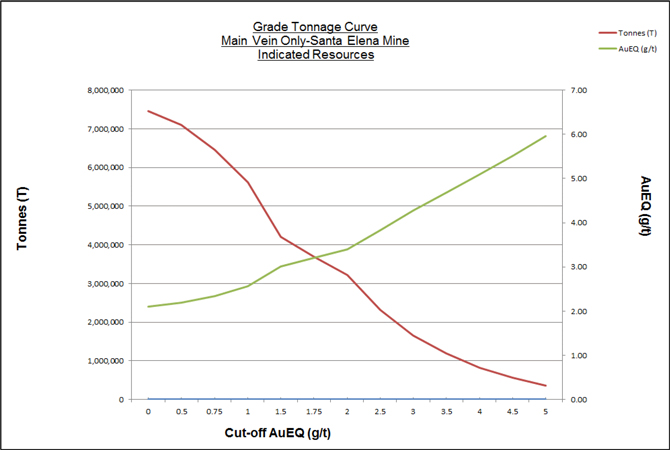
Note: AuEq metals prices for the resource model at US$1072/oz, US$18/oz silver after accommodation for Sandstorm Purchase Agreement and metallurgical recoveries of 92% Au and 67.5%Ag.
| | SANTA ELENA UPDATE TECHNICAL REPORT |
| | EFFECTIVE DATE: DECEMBER 31, 2014 |
| | |
Figure 14.21: Grade Tonnage Curve for Inferred Mineral Resources
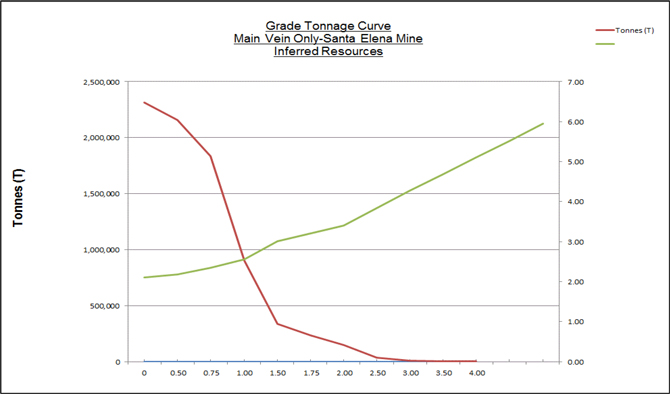
Note: AuEq metals prices for the resource model at US$1072/oz, US$18/oz silver after accommodation for Sandstorm Purchase Agreement and metallurgical recoveries of 92% Au and 67.5%Ag.
| 14.2.12 | Underground Validation |
Estimated block grades were visually compared to drill hole lithology along horizontal and vertical sections using the Santa Elena GEMS model (Figures 14.13 to 14.16). In addition, Nearest Neighbor (NN), Inverse Distance Weighted methods, (IDW5 and IDW3) were run to compare against the Ordinary Kriging method (OK) used in the actual resource estimate. Average Au and Ag grades were reported for 25 metre vertical and horizontal slices of the resulting verification and plotted for comparison against the average input composite grades within the same sections. The results were compared to check for potential global biases of the primary OK calculation method. In general, an overall grade smoothing trend is observed in all methods.
| | SANTA ELENA UPDATE TECHNICAL REPORT |
| | EFFECTIVE DATE: DECEMBER 31, 2014 |
| | |
Figure 14.22: Gold Swath Plot
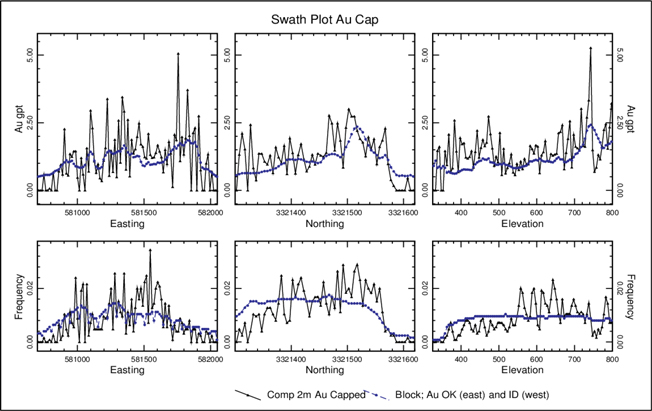
| | SANTA ELENA UPDATE TECHNICAL REPORT |
| | EFFECTIVE DATE: DECEMBER 31, 2014 |
| | |
Figure 14.23: Silver Swath Plot:

A close approximation between the composite sampling data and the modelled grade. Inspection of the swath plots does not indicate that a bias has been introduced during the modelling process. The OK method is thought to support the local variation in grade and is felt to be an adequate representation of the grade distribution throughout the deposit.
| 14.3 | Current Heap Leach Mineral Resource Estimate |
The Heap Leach Resource represents spent ore residing on the active heap leach which is intended to be reprocessed within the new Santa Elena mill. The resource estimation methods are summarized below, however, the resource has been entirely converted to mineral reserves as disclosed in Section 15.
This resource has been estimated by SilverCrest utilizing daily production, grade and mass records obtained at the crushing plant when conveying mineralized material to the pad, and updated survey information. These records represent a complete production dataset since start-up of the operations at Santa Elena.
A detailed leach pad survey was completed in April 2013 to provide volumes of material placed on the pad and updated most recently in Q4 2014 to reflect additional material added to the heap from open pit mining and depletion of spent ore from the pad that has been fed to the mill up to, and including, December 31, 2014.
The current heap leach mineral resource estimate incorporates the most recent survey for volume and tonnage calculations, and incorporates the cumulative and weighted average grade estimates calculated from production data.
| | SANTA ELENA UPDATE TECHNICAL REPORT |
| | EFFECTIVE DATE: DECEMBER 31, 2014 |
| | |
| 14.3.1 | Heap Leach Resource Validation |
In 2013, the existing volume estimated from the topographic survey and the as-built liner elevation was compared with weightometer data collected on the crushing plant to validate tonnes on the pad using the well-known specific gravity on the leach pad of 1.85 g/cm3.
Grade estimates derived from production data was validated using a block model that was created using 25 vertical drill holes on the heap that were spaced on a 25 metre by 25 metre grid using a large diameter reverse circulation Becker Hammer, tandem mounted hydraulic drill. Samples were collected from the drill at 6 metre composite lengths and used as the basis for generation of the validation model. The grades reported in the current estimate are unchanged from the 2013 estimate.
The validation of tonnage and grade estimated from production data was supported by the drilling and surveying data. The comparison of both methods is shown in Table 14.13, below. The tonnage reported in the current estimate is larger than the 2013 estimate due to net increase in tonnages from open pit mining relative to the material that has been sent to the mill.
Table 14.13: Validation of Heap Leach Resource Estimate (April 30th, 2013)
| | Tonnage | Au | Ag |
| | x 1000 | Grade
(g/t) | Grade
(g/t) |
| Tonnage and grade based on daily production | 2,844.568 | 0.65 | 33.3 |
| Tonnage and grade based on block model | 2,853.949 | 0.54 | 30.10 |
Further information on the drilling and initial block model creation used to validate the use of production data is included in the previous Technical Report “Santa Elena Expansion Pre-Feasibility Study and Open Pit Reserve Update, Effective Date: April 30, 2013, Amended Date: March 4, 2014”.
Since April 30, 2013, an estimated 923,000 tonnes of open pit ore were placed on the leach pad and partially leached. With the addition of these tonnes, the total tonnes on the pad as of December 31, 2014 is 3.3 million tonnes after depletion from mining part of the pad in H2 2014 for mill feed.
| 14.3.2 | Heap Leach Mineral Resource Statement |
The resource estimation methods are summarized here, however, the resource has been entirely converted to mineral reserves as disclosed in Section 15.
Table 14.14: Leach Pad Material Mineral Resource Estimate (Effective December 31st, 2014)
| Area | Classification* | Tonnage | Au Grade
(gpt) | Ag Grade (gpt) | Contained Gold
(troy oz) | Contained Silver
(troy oz) |
| Leach Pad | Indicated | 3,344,652 | 0.65 | 33.3 | 69,852 | 3,581,687 |
| Total | Indicated | 3,344,652 | 0.65 | 33.3 | 69,852 | 3,581,687 |
| * | Classified by SilverCrest Mines Inc. and conforms to NI 43-101 and CIM definitions for resources. Mineral Resources have been estimated from using company production data and sampling and validated from drill hole and survey data. The estimate must not be considered to imply economic mineability. No grade capping has been applied. |
| | SANTA ELENA UPDATE TECHNICAL REPORT |
| | EFFECTIVE DATE: DECEMBER 31, 2014 |
| | |
| 15.0 | Mineral Reserve Estimates |
Three individual mineral reserve estimates are presented as updates to the previous PFS (EBA, 2013) in this report and are combined together into the mine schedule and economic analyses. On the basis of indicated mineral resources in Section 14, SilverCrest has determined mineral reserves which are reported including dilution and considering mining recovery, as applicable. The total reserve includes the open pit, underground and the spent ore leach pad estimates with an effective date of December 31, 2014.
| 15.2 | Previous Reserve Estimates |
Reserve estimates have been documented in two previous Technical Reports for the Santa Elena mine.
The first was completed by SilverCrest, with the assistance of Dassault Systemes Software International, and reviewed by EBA in January, 2011. This estimate was released by EBA Engineering in May 2011 in the report “NI 43-101 Technical Report, Reserve Update for the Santa Elena Open Pit and Preliminary Assessment for the Santa Elena and Cruz de Mayo Expansion Project, Sonora Mexico (amended date May 11, 2011)”.
The second was completed by EBA Engineering (now Tetra Tech EBA), in 2013 and released in the report “Santa Elena Expansion Pre-Feasibility Study and Open Pit Reserve Update. National Instrument 43-101 Technical Report.” The latter had effective date April 2013 (amended in March 2014).
Between 2011 and 2013 SilverCrest commenced operations and as such a portion of open pit reserves from 2011 were mined out prior to 2013 in additional to pit design changes. The 2013 technical report which included the Santa Elena expansion and most notably a change from heap leach processing to a process mill, enabled addition of underground reserves as well spent ore placed on the heap leach which was considered for processing to recover residual gold and silver not recoverable from heap leaching processes.
These previous estimates were not subject to the recent depletion of material from recent mining activities, were evaluated using different sized of open pits, and evaluated using traditional top-down longhole stoping and cut and fill mining methods. Reserves were not previously declared at El Cholugo.
It is noted that commodity prices for silver and gold have had an effect on the delineation of reserves, as reflected by changes in cut-off grades applied to specific mining methods.
Both of the 2011 and 2013 mineral reserves estimates, as shown in Tables 15.1 and 15.2, are now superseded by the current reserve estimate and should no longer be relied upon.
Table 15.1: Previous Santa Elena Open Pit Reserves (January, 2011)
| Classification | Tonnes | Au Grade
(gpt) | Ag Grade (gpt) | Contained Gold
(troy oz) | Contained Silver
(troy oz) |
| Probable | 4,794,790 | 1.81 | 75.9 | 278,560 | 11,711,000 |
| * Represents the diluted and mine recoverable Reserves based on $USD1,000/oz Au and $USD18/oz of Ag, cut-off grade of 0.38g/t AuEq with applied metallurgical recoveries. Capped grades at 12 gpt Au and 400 gpt Ag. Based on a bulk density of 2.60 t/m3. No previous Reserve Estimates were completed for underground or leach pad. |
| | SANTA ELENA UPDATE TECHNICAL REPORT |
| | EFFECTIVE DATE: DECEMBER 31, 2014 |
| | |
Table 15.2: Previous Reserves disclosed in 2013 Technical Report (April, 2013)
| Classification1 | Tonnes | Au Grade (gpt) | Ag Grade (gpt) | Contained
Gold (troy oz) | Contained
Silver (troy oz) |
| SANTA ELENA UNDERGROUND DILUTED AND RECOVERABLE RESERVES2 |
| PROBABLE | 3,920,510 | 1.57 | 108.1 | 198,350 | 13,637,010 |
| SANTA ELENA OPEN PIT RESERVES (As of April 30, 2013)3 |
| PROBABLE | 1,426,710 | 1.52 | 66.8 | 69,890 | 3,064,980 |
| SANTA ELENA LEACH PAD RESERVES4 |
| PROBABLE | 2,844,530 | 0.66 | 29 | 60,390 | 2,653,810 |
| Total Reserves | 8,191,760 | 1.25 | 73.4 | 328,640 | 19,355,800 |
Note: Tonnes and ounces are rounded. Underground and Leach Pad Reserves are based on 3 year historic metal price trends of US$28/oz silver, US$1450/oz gold and metallurgical recoveries of 92% Au and 67.5% Ag with a metal ratio of Au:Ag at 70:1. All Mineral Resources and Reserves conform to NI 43-101 and CIM definitions for Resources and Reserves.
1 Open Pit and Leach Pad Probable Reserves were classified by SilverCrest. Underground Reserves and Resources were classified by EBA.
2 Underground Probable Reserve is based on a cut-off grade of 1.47 gpt AuEq with an average 11% dilution and 90% mine recovery.
3 Open Pit Reserve is based on a cut-off grade of 0.20 gpt AuEq in a constrained pit shell with applied capping of 8 gpt Au and 300 gpt Ag.
4 Leach Pad Reserve based on production and drill hole data for volumetrics and grade model using a cut-off grade of 0.5 gpt AuEq. No capping was applied.
| 15.3 | Current Reserve Estimate Parameters |
The classification of Reserves follows the Standards of Disclosure for Mineral Projects as documented in National Instrument 43-101 and adheres to the Canadian Institute of Mining, Metallurgy and Petroleum Best Practice Guidelines. Indicated Resources demonstrating economic viability are assigned the Probable category. No Measured Resources have been estimated, and therefore none of the Reserves estimated will be classified as Proven. The Mineral Reserves (open pit, underground, and leach pad) in table 15.2 are based on the following parameters where applicable (in US$):
| § | Gold price of $ 1,300 / troy ounce (based corporate decision and price analyses for LOM scheduling cut-off - as of December 31st 2014); |
| § | Silver price of $19.50 / troy ounce (based on corporate decision and price analyses for LOM scheduling cut-off - as of December 31st 2015); |
| § | Silver grade was converted to a gold equivalent (AuEq) using a 66:1 Ag (g/t) to Au (g/t) ration recoveries were not used in determining the AuEq value; |
| § | Mining recovery of 90% for long hole stoping (Avoca method); |
| § | Mining recovery of 95% for mechanized cut and fill mining methods; |
| § | Global AuEq cut-off grade of 2.49 g/t for stope design; |
| § | Specific cut off grades applied to each stope based on type of stoping and stope dimensions and following the vein geometry as defined in the new geological and resource model; |
| § | Total Cost per tonne of $39.7 for open pit milling; |
| § | Total cost per tonne $58.5 (undiluted- weighted average with development tonnes) for long hole stoping methods including stope development, sustaining capital, processing and G & A costs; |
| | SANTA ELENA UPDATE TECHNICAL REPORT |
| | EFFECTIVE DATE: DECEMBER 31, 2014 |
| | |
| § | Total cost per tonne of $80 (undiluted) for mechanized cut and fill stoping methods including stope development, processing and G & A costs; |
| § | Total cost per tonne of $29.8 for leach pad spent ore milling including G & A; and |
| § | Ore density of 2.6 tonnes / m3 for open pit and underground, 1.85 tonnes/m3leach pad ore. |
| 15.4 | Basis for Underground Mineral Reserve |
The underground Mineral Reserve tonnages are based on detailed mine design using only the indicated resource model (for the MMZ and El Cholugo zones. The block model has been developed using 5 metre x 5 metre x 5 metre blocks and confined by the geological solids modeled using drill hole intersections, channel samples and underground mapping. The Block model represents estimated Au and Ag grades interpolated using 2 metre capped composites (composited on capped raw assay). The block model is clipped to the topography and/or the currently planned ultimate pit and it also take into account the areas mined underground up to and including December 31, 2014.
Reserves were estimated using the geological models, restricted laterally by the vein model, and running various stope length and height iterations to obtain the optimal stope dimension along the MMZ and El Cholugo zones.
SilverCrest estimated reserve grade and tonnage through cost approximation and thereby determination of a cut-off grade for AuEq based on gold price and metallurgical recovery. A cut-off of 2.49 g/t AuEq for all stopes was the major guideline to define stope boundaries respecting the continuity and geological information. Specific cut-off grades were then determined by mining method after mining costs were established by an iterative optimization process. Within the stope shapes, Indicated resources above and below the cut-off grades were then considered for definition of undiluted Reserves. Other material within the stope shapes, including Inferred resources, are considered as zero grade dilution, resulting in internally diluted Reserves.
| | SANTA ELENA UPDATE TECHNICAL REPORT |
| | EFFECTIVE DATE: DECEMBER 31, 2014 |
| | |
Figure 15.1: Stope Shapes defined for use in Reserve Definition

| | SANTA ELENA UPDATE TECHNICAL REPORT |
| | EFFECTIVE DATE: DECEMBER 31, 2014 |
| | |
| 15.4.1 | Underground Mining Method Consideration for Underground Reserves |
Two primary mining methods were considered for estimation of costs and thereby mineral reserves, namely; longitudinal long hole stoping and mechanized cut and fill.
Longitudinal long hole stoping using a modified Avoca technique (representing the majority of the mine plan) has the highest estimated external dilution for the two methods, with an approximate LOM average of 15%. This method constitutes the lowest overall operating cost and has been applied to all stopes with widths less than 15 m (hanging wall to footwall) and a footwall dip angle of greater than 55 °.
Mechanised cut and fill stoping has been applied to selectively in some areas with footwall dip angle of less than 55° from the horizontal. This method has the highest cost, due to footwall development requirements and productivity constraints due to reduced size of cuts taken at any point and the need to backfill. External dilution is estimated to be less for mechanized cut and fill due to hanging wall exposures being limited to a single cut at any point. In addition, sloughage of the hanging wall will be controlled by the backfill.
All mineral resources within the life of mine open pit are declared as Reserves as of December 31, 2014. The block model data and open pit geology was used to define ore boundaries by applying a cut off of 0.20 g/t AuEq. The resource block model was used to extract information of Au and Ag grades between planned mine benches scheduled for mining in 2015.
Section 14.3 details the estimation of heap leach indicated resources. Based on mining practicality, no cut-off grade has between applied. All average grades for the leach pad spent ore are above 1gpt AuEq, therefore all tested resource tonnes on the pad are considered reserves.
All spent ore material on the leach pad is scheduled to be reprocessed through the processing facility once. Active leaching operations were shut down on the pad in mid-2014, and all the material has been declared as Reserves. Approximately 3.3 Mt of spent ore remains on the leach pad as of December 31st 2014, based on topographic survey and reconciliation with production data.
Extensive metallurgical test work including ongoing operations data show that all declared spent ore Reserves are amenable to conventional leaching either by heap leach technology or standard CCD milling with a Merrill Crowe recovery system for doré bar production.
| 15.7 | Current Santa Elena Reserve Statement |
The updated reserve statement for Santa Elena is shown in Table 15.3 below.
| | SANTA ELENA UPDATE TECHNICAL REPORT |
| | EFFECTIVE DATE: DECEMBER 31, 2014 |
| | |
Table 15.3: Santa Elena Mineral Reserve Estimate, diluted and recoverable (Effective Date: December 31, 2014)
| Classification* | Tonnes | Au
Grade
(gpt) | Ag
Grade
(gpt) | Contained
Gold (troy oz) | Contained Silver (troy oz) |
| Santa Elena Underground Diluted and Recoverable Reserves2 |
| Probable | 3,981,557 | 1.67 | 115.0 | 214,000 | 14,724,000 |
| Santa Elena Open Pit Reserves** |
| Probable | 121,706 | 2.75 | 117.0 | 11,000 | 458,000 |
| Santa Elena Leach Pad Reserves*** |
| Probable | 3,344,652 | 0.65 | 33.3 | 70,000 | 3,582,000 |
| Total Reserves | 7,447,915 | 1.23 | 78.4 | 295,000 | 18,764,000 |
Note:
*All numbers are rounded. Underground and Leach Pad Reserves are based on LOMP metal price trends of US$19.50/oz silver, US$1,300/oz gold and metallurgical recoveries of 92% Au and 67.5% Ag. All Mineral Resources and Reserves conform to NI 43-101 and CIM definitions for Resources and Reserves. Inferred Resources have been estimated from geological evidence and limited sampling and must be treated with a lower level of confidence than Indicated Resources.
* Underground Probable Reserve is based on a cut-off grade of 2.49 gpt AuEq with an average est. 10% dilution and 90% mine recovery. Average true thickness of the designed stopes is 10 metres.
** Open Pit Reserve is based on a cut-off grade of 0.20 gpt AuEq in a constrained pit shell with applied capping of 8 gpt Au and 300 gpt Ag.
*** Leach Pad Reserve based on production and drill hole data for volumetrics and grade model using a cut-off grade of 0.5 gpt AuEq. No capping was applied.
| | SANTA ELENA UPDATE TECHNICAL REPORT |
| | EFFECTIVE DATE: DECEMBER 31, 2014 |
| | |
This section includes a geotechnical analyses, explanation of mining methods and mine design methodology completed for the Update to Pre-Feasibility Study is based on the information available and with the assumption that further investigation and detailed engineering will be completed prior to or during development. In practice the actual conditions will vary based on actual ground conditions encountered. As more drilling is completed and the mine is developed, the mining methods, stope layouts and rock engineering criteria will be modified in favour of actual conditions.
With the reopening of the pit in January of 2015, conventional open pit mining will continue using a contractor until the second quarter of 2015 when the open pit reserves will be depleted. Mining of the heap leach spent ore will be completed by loader and conveyor to transport material to the plant for the remaining LOMP.
The analyses was completed using the basis of assumptions for geological model described in Section 14, and mining methods were selected based on the results of preliminary geotechnical and rock mechanic analyses and to account for variations in vein thickness and orientation. A detailed geotechnical analyses was conducted to determine specific parameters for each mining method.
| 16.2 | Geotechnical Analyses for Underground Mining |
Based on initial underground development and production using the Avoca mining method completed to date, the geotechnical as-built experience shows that previous data collected and presented in the 2013 PFS is accurate. Experience with development drifting using a 4 metre by 4.5 metre profile has shown little to no geotechnical risk with relationship to structure and alteration of lithologies.
Mining of Stope number 1 on the 575 to 600 metre elevations show roof span width up to 15 metres wide with little to no geotechnical risk except were the mineralization periodically intersects cross-cutting faults and where the hangingwall fault is exposed. Standard cable bolting of span widths greater than 8 metres is being completed on a grid pattern of 1.5 metres by 1.5 metres and testing is underway to increase the grid spacing. Where exposed, the hangingwall fault is cable bolted; currently using a random but practical pattern.
For details of geotechnical analyses of underground production stoping at Santa Elena, refer to the 2013 PFS.
In summary, geotechnical data in 2012 and 2013 was collected from sixteen exploration drill holes, six of which were oriented, advanced as part of the 2012 subsurface exploration program and test work conducted on core samples at the University of Sonora, Hermosillo, Mexico.
The original PFS collected and analyzed data intended for traditional top down long hole stoping, transverse long holes stoping and mechanized cut and fill methods which included the design of rib and sill pillars. The long hole stoping method (Avoca) currently used by SilverCrest incorporates different design principles and varies from the initial design work. Most of the data and analyses are applicable to either mining method with most of the focus on span width and hangingwall fault geotechnical constraints.
This section summarizes the work conducted for the ongoing Santa Elena Expansion Project up to April 2013 and provides a summary of the range of variance of the rock mass conditions (by means of RMR76 and NGI-Q classification systems) at the following five zones:
| | SANTA ELENA UPDATE TECHNICAL REPORT |
| | EFFECTIVE DATE: DECEMBER 31, 2014 |
| | |
| § | Ore zone (referred herein as Zone D1). |
| § | Country rock above the hanging wall, from 5-6 m to 50-60 m above the upper ore zone/country rock interface (referred here in as Zone D2). |
| § | Country rock above the hanging wall, between the upper ore zone/country rock interface and about 5-6 m above it (referred here in as Zone D3). |
| § | Country rock below the foot wall, from 5-6 m to 50-60 m below the lower ore zone/country rock interface (referred here in as Zone D4). |
| § | Country rock below the foot wall, between the lower ore zone/country rock interface and about 5-6 m below it (referred here in as Zone D5). |
| 16.2.2 | Geotechnical Data Collection |
The geotechnical investigation consisted of:
| § | Geotechnical data collection on 16 exploration drill holes advanced as part of the 2012 subsurface exploration program. |
| § | Geological and geotechnical logging of the drill holes was conducted by Silver Crest’s mine geologist prior to splitting the core. The geotechnical logging includes collection of geotechnical parameters to estimate the Rock Mass Rating (RMR) system (Bieniawski 1976) and the Norwegian Geotechnical Institute’s NGI Q-System (after Barton et al. 1974). EBA undertook QA/QC of the rock core during site visits at the Santa Elena project. |
| § | Six (6) of the 16 drill holes were drilled with core orientation. |
| § | Collection of rock samples for geotechnical laboratory purposes. |
| 16.2.3 | Rock Mass Characteristics |
In 2013, EBA evaluated the rock mass quality using the NGI-Q and RMR systems for the 16 drill holes listed in Table 16.1. For this purpose, the geotechnical logs were processed in raw spread sheets. During this process, EBA reviewed (QA/QC) the geotechnical logs against the core photos and made corrections where appropriate.
The rock mass was subdivided into five geotechnically distinct zones as described in Section 16.2.4.
| 16.2.4.1 | Rock Mass parameters |
The cumulative percentage distributions of the NGI-Q and RMR values were calculated for the 5 zones. The cumulative percentage distribution plots provide the means of progressively estimating the likelihood that an RMR or NGI-Q value will be equaled or exceeded. For this Pre-Feasibility study the NGI-Q and RMR values at 50% were chosen. The purpose of adopting the 50% design values for Pre-Feasibility design is to provide stope dimension and reinforcement that are not too conservative or too optimistic, and therefore serve for reasonable economic estimation.
| | SANTA ELENA UPDATE TECHNICAL REPORT |
| | EFFECTIVE DATE: DECEMBER 31, 2014 |
| | |
Table 16.1 summarizes the NGI-Q and RMR values used for the preliminary design.
Table 16.1: RMR’ and NGI-Q’ Values for Design – at 50%
| Zone | Elevation | RMR’76 | NGI-Q’ |
| D1 | Above El. 580 m | 75 | 29 |
| Below El. 580 m | 76 | 11 |
| D2 | From surface to bottom of planned workings | 52 | 4 |
| D3 | Above El. 580 m | 67 (711) | 12 (211) |
| Below El. 580 m | 52 | 3 |
| D4 | Above El. 580 m | 70 | 13 |
| Below El. 580 m | 67 | 13 |
| D5 | Above El. 580 m | 67 | 7 |
| Below El. 580 m | 72 | 14 |
| 1Two values are presented; (i) the first value considers the data from all the drill holes, and (ii) the second (in brackets) does not consider three of the drill holes where potential faults were encountered. |
In addition to this assessment set out in Table 16.2, NGI-Q values were assessed for the 655 Level. Core runs were isolated over a 45 metre run length at this level to give an individual rock mass characterization for stoping at this level. NGI-Q values of 15 and 6 were calculated for zones D1 and D3 for stopes at this level.
Rock strength is based on laboratory testing results from University of Sonora together with a small sample of test work undertaken at University of British Columbia, Vancouver. The test work completed at Sonora consisted of simple Uniaxial Compressive Tests (UCS) without strain measurements, Brazilian Tests and Point Load Tests (PLT). The test work at UBC consisted of simple UCS and Brazilian tests for comparison.
The average ore body strength from the test work undertaken at the two institutes is 87 MPa.
The strength of the hanging wall for the prefeasibility analyses is taken as 92 MPa. This is based on the average point load testing data from University of Sonora. Three UCS tests were carried out in hanging wall material at University of Sonora giving an average of 95 MPa which ties in closely with the PLT results.
The design approach presented in this report consists of empirical and analytical methods using the rock mass quality approach. In this respect, it should be noted that as with all the empirical methods, assumptions should be validated once mining starts by comparing actual with anticipated results. Below is presented the empirical method used for the assessment.
| 16.2.5.2 | Design Assumptions |
The following assumptions have been made during the geotechnical design approach at Pre-Feasibility level for Santa Elena.
| | SANTA ELENA UPDATE TECHNICAL REPORT |
| | EFFECTIVE DATE: DECEMBER 31, 2014 |
| | |
| § | Modelling of the orebody and mine openings was undertaken using RocScience Examine 2Dtm software. As such, the rockmass is assumed isotropic and homogenous. See geotechnical recommendations in section 26.2. |
| § | Hoek-Brown parameters and deformation characteristics are generic dependent on rock type as established from the RocScience RocLabtmsoftware program. |
| § | The orebody was split into three sections – West, Central and East and an average dip and strike was assigned to each. |
| § | Stopes are assumed to be of fixed width along strike with average dip and strike dependent on their location within the orebody. |
| § | Stope vertical height is set at 25 m. |
| § | No stress data is available at site. Stress is assumed to be depth dependent based on overburden. No variation in the horizontal to vertical stress ratio was incorporated at prefeasibility level. |
| § | Based on the ground water report undertaken by Global Resource Engineering (2011) and observations undertaken during ramp development the excavations were assumed to be dry or have minor inflow. A second hydro-geological assessment is recommended to confirm the initial findings of Global Resource Engineering. |
| 16.2.5.3 | Tabulation of Results |
The stope configuration were summarized for each level for longitudinal and cut and fill mining. They indicate a stable span without support, a stable span with support and a measure of anticipated dilution with greater span lengths. Effective cable bolt support has been considered when designing maximum spans for stable spans with support. These stope design summary tables present the results of the analyses with respect to the rectangular stope design and are referred to in the body of this summary. They are split into West, Central and East locations at each level dependent on average strike and dip of the orebody.
These reference tables are meant for general design purposes only at a Pre-Feasibility level as the stope spans assume continuous width and dip profiles. As actual stopes vary in width and dip across their span, further geotechnical study of individual stopes is advised beyond Pre-Feasibility level.
Actual stope and pillar performance should be consistently monitored during mining and a database created. This will allow for any modifications of initial design to be made based on actual mining of the orebody.
Dilution levels for span lengths greater than those recommended from Potvin’s method are indicative only and it is strongly recommended that a site based dilution data base be established to monitor sloughage based on stope spans and rockmass quality. Further rockmass classification through mapping and logging can assist in defining stope dimensions to a higher level of detail. Actual stope and pillar performance should be consistently monitored during mining. This will allow for any modifications of initial design to be made based on actual mining of the orebody.
| 16.2.5.4 | Methodology of Stability Graph for Stope Design |
The stability graph method (developed by Mathews et al. (1981) and modified by Potvin (1988) and Nickson (1992) is widely used by designers to qualitatively assess the stability of open stopes.
| | SANTA ELENA UPDATE TECHNICAL REPORT |
| | EFFECTIVE DATE: DECEMBER 31, 2014 |
| | |
The stability number N is defined as:
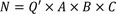 | (1) |
Where A is the stress factor (ratio of intact rock strength to induced stress), B is rock defect orientation factor, and C is the gravity factor related to orientation of design surface.
See Table 16.2 for summary of NGI-Q’ values.
Table 16.2: NGI-Q' Values for Stope Design
| Zone | Elevation | NGI-Q’ (50% level of cumulative frequency) |
| Mineralized Vein | Above El. 580 m | 29 |
| Below El. 580 m | 11 |
| Waste Rock | Above El. 580 m | 12 |
| Below El. 580 m | 3 |
In addition to this NGI-Q values were assessed for the 655 Level. Core runs were isolated over a 45m run length at this level to give an individual rock mass characterization for stoping at this level. NGI-Q values of 15 and 6 were calculated for zones D1 and D3 for stopes at this level.
| 16.2.6 | Span Length Design – Longitudinal |
The following key mining parameters / assumptions were used as the basis of the initial stope design:
| § | Non-man entry to production level. |
| § | With an initial assessment of the effect of both hanging wall and the stope back it was found that the hanging wall will govern the stope size. Therefore, the hanging wall effect was considered throughout the design process. |
| § | Cable bolted stopes and stable stope spans were assessed. |
| § | Two scenarios were considered for stope length design in longitudinal mining: When the hanging wall is excavated in waste rock, and when mineralized vein is left in place as part of the hanging wall. |
| § | Stope widths of 7 metres, 12 metres, 17 metres and 22 metres were considered. |
Sloughage was considered using the ELOS graph developed by Clark and Pakalnis (1997). This seeks to quantify the degree of dilution anticipated for a given span length and corresponding shape factor. It must be noted that this graph was developed for weak rock masses. There is no measure of time dependent behaviour but nevertheless this approach provides an indication as to predicted dilution at this stage and should be used in conjunction with observational data during mining. Acceptable sloughage levels of 15% or less were also calculated for stope design utilizing the ELOS criteria for the stability graph after Clark and Pakalnis (1997).
| 16.2.7 | Stope Back Width Design |
The stability graph method was utilized for designing the “stable” back length similar to hanging wall stope length design.
At this Pre-Feasibility level it may be advisable to consider supporting stope backs greater than 10 metres width with cable bolts at the 536 Level and below due to stress effects. However, as spans will likely vary across levels and also in individual stopes, the magnitude and orientation of the in-situ stress regime is recommended beyond Pre-Feasibility level to verify stress effects on the mine openings and hence the need for localized support in individual stopes.
| | SANTA ELENA UPDATE TECHNICAL REPORT |
| | EFFECTIVE DATE: DECEMBER 31, 2014 |
| | |
The dimensions for the cut and fill mining method were estimated using the span design curve (Lang, 1994).
A maximum span of 15 metres is recommended in current cut and fill mining levels. The spans refer to spans which may not require intensive ground support such as timber sets, cable bolts or post pillars, but still requires local support within the immediate back to confine potential blocks (loose) which may open due to nearby blasting and/or redistribution caused by subsequent mining activity. 2 metre by 2 metre pattern bolting is recommended in slashed stopes with spans less than these stable back span figures. Due to the nature of the ore body, spans will vary across levels and also in individual stopes. An assessment of the need of support required for individual stopes needs to be undertaken at a stage beyond the scope of this PFS.
With a 5 metre cut and a maximum stope length of 100 metres dilution from blast damage only along the hanging wall should be expected.
| 16.2.8.1 | Crown Pillar Design |
Underground mining will result in a temporary surface crown pillar below the open pit, as well as permanent crown pillars in some areas. The minimum thickness for crown pillar design was assessed as 25 metres using the empirical crown pillar stability graph (Carter, 1990) taking a typical Q value of 11.6 for the ore at near surface stress conditions. The maximum span of the orebody was taken as 25 metres giving a thickness/span ratio of 1.
| 16.3 | Proposed Underground Mining Methods |
The Santa Elena ore body varies in dip and thickness along strike and at depth. As a result, three well established underground mining methods have been selected for ore extraction. These mining methods are categorized in Table 16.3 below:
Table 16.3: Mining Method Selection Criteria
| Orebody Geometry | Mining Method |
| Dip > 55 degrees, Thickness < 15m | Longitudinal Long hole Stoping (including Avoca) |
| Dip < 55 Degrees, Any Thickness | Mechanized Cut and Fill |
In general, conventional mechanized mining methods have been selected. The basis of the development of the mining methods and consequent equipment selection has been that SilverCrest will undertake production drilling, blasting and loading using a contractor for the waste rock and ore haulage to surface. Initially a contractor will be retained to carry out mine development, with jumbo drill rigs purchased later in the mining life, after which development will be done in-house. The roles played for operation of the underground mine will be as follows:
| § | SilverCrest has or will undertake: |
| - | General mine infrastructure development, |
| - | Mine management and planning, |
| - | General underground maintenance and provision of supplies, |
| | SANTA ELENA UPDATE TECHNICAL REPORT |
| | EFFECTIVE DATE: DECEMBER 31, 2014 |
| | |
| - | Ore drilling and blasting, |
| - | Ore development and tunnelling (after purchase of a drilling jumbo) |
| § | Haulage contractor will undertake: |
| - | Haulage of all waste rock and ore to surface. |
| - | Backhaul of all backfill rock and tailings to underground. |
| § | Development contractor will undertake: |
| - | Initial ramp, ore drift and other tunnelling underground |
| 16.3.1 | Avoca Long Hole Stoping |
Avoca mining consists of an undercut level and an overcut level. The cross-cuts are in waste and connect the main transport drift to one end of the stope, after which ore development is completed along the length of the stope. The overcut level contains a backfill drift which goes to the opposite end of the stope. With this method, there is no limit to the length of the stope, and two tasks are occurring at once. First, ore is drilled by longhole and then drawn off in retreating vertical slices. Second, unconsolidated backfill is placed over the bench through the back of the stope from the drift in the footwall.
| | SANTA ELENA UPDATE TECHNICAL REPORT |
| | EFFECTIVE DATE: DECEMBER 31, 2014 |
| | |
Photo 16.1: View of Stope 2 (Long hole stoping with Hangingwall Cable Bolting)
Where the mineralized zone is dipping at, or steeper than 55°, the stopes are designed at 25 metre vertical heights, with no sublevels. A sill pillar will be established on the 575 metre level. Long hole stoping has proceeded longitudinally and upwards along the defined mineralized zone. Stability within in the mining will be established during as-built development and stope by stope basis. Figure 16.1 below shows a typical layout for the Avoca long hole stoping method that will be applied at the Santa Elena Mine.
| | SANTA ELENA UPDATE TECHNICAL REPORT |
| | EFFECTIVE DATE: DECEMBER 31, 2014 |
| | |
Figure 16.1: General Sublevel Stoping Operation
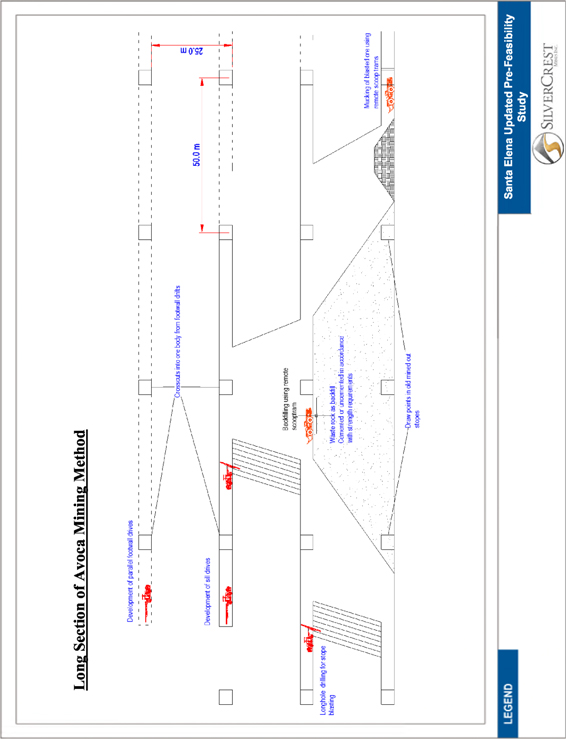
| | SANTA ELENA UPDATE TECHNICAL REPORT |
| | EFFECTIVE DATE: DECEMBER 31, 2014 |
| | |
| 16.3.2 | Mechanized Cut and Fill |
Where the dip of ore body results in stopes with a footwall inclination of less than 55°, long hole stoping will not be suitable due to the increased length of blastholes, potential blast hole inaccuracy and the potential for ore to hang up on the footwall. SilverCrest has thus considered mechanized cut and fill mining for these areas. The lower east portion of the reserve model, as seen in Figure 15.1, has been assessed to have conditions conducive to cut and fill mining.
Once each cut is mined out, it will be filled with cemented rock fill, which can include tailings and waste rock from ongoing underground development. Dilution from hanging wall geotechnical failure will be minimal with cut and fill mining because there will be limited exposure to the hanging wall during mining. Support will be required for the exposed cut back (roof) of each cut during mining, for safety of personnel operating machinery and working in the stopes.
The ore will typically be mined in 5 metre high cuts, with each cut silled out from hanging wall to footwall. Each cut will be accessed by attack ramps from the footwall development drifts. Once the cut has been filled all the way back into the attack ramp, the brow of the ramp is slashed into, and another cut can begin. This process will continue until the attack ramp grade becomes too steep for ore haulage. The orebody is then accessed from a higher footwall development. Figure 16.3 below represents the cut and fill method discussed here.
Trucks will backhaul fill material from tailings and waste rock stockpiles on surface, when rock is not available from underground development. This material will be mixed with water and 5% cement to create a consolidated fill, and be placed in the stopes via scoop tram.
| | SANTA ELENA UPDATE TECHNICAL REPORT |
| | EFFECTIVE DATE: DECEMBER 31, 2014 |
| | |
Figure 16.2: General Mechanized Cut and Fill Stoping Method
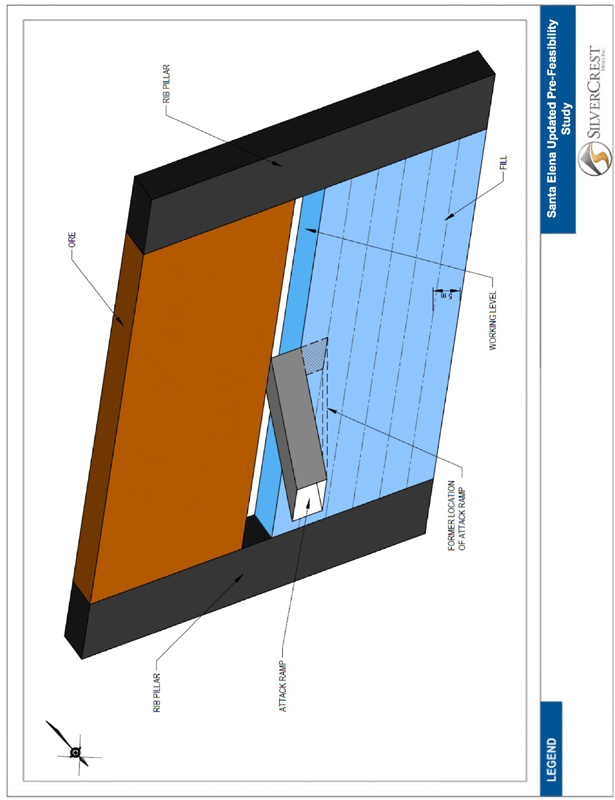
| | SANTA ELENA UPDATE TECHNICAL REPORT |
| | EFFECTIVE DATE: DECEMBER 31, 2014 |
| | |
Table 16.4 shows the mining equipment selected for the underground mine. The purchasing of the equipment has been scheduled based on when the equipment will be required in the capital cost estimate schedule (Table 21.2), with consideration for equipment delivery lead times. Note that the mine trucks and one jumbo drilling are based on contractor equipment hire.
Table 16.4: Mining Equipment List
| Description | Number | kW | Ownership |
| Mine Trucks (20tons) | 6 | 250 | Contractor |
| Long Hole Drill (Sandvik) | 1 | 130 | SilverCrest |
| Scoop Trams (Sandvik) | 5 | 276 | Contractor and SilverCrest |
| Jackleg/ Stoppers (based on 200 cfm air consumption) | 4 | 37 | Contractor |
| Jumbo drills (cut and fill stopes) DD311-40 (110kW) | 2 | 110 | Contractor |
| Telehandler (Caterpillar) | 2 | 75 | Contractor |
| Scissor Lift 92 HP | 1 | 69 | Contractor |
| Grader -110HP | 1 | 82 | SilverCrest |
| Kubota/s | 3 | 14 | SilverCrest |
| Crew transportation | 1 | 96 | SilverCrest |
| Service Truck | 3 | 96 | SilverCrest |
| Shotcrete Pump (Airplaco Shotcrete Mixer/Pump) | 1 | 34 | Contractor |
| Underground Diamond Dill/Gopher (Hydra Core Gopher) | 2 | 37 | Contractor |
For other equipment and machinery related to mining refer to Section 18.
For the purpose of completion of this Pre-Feasibility study, the layout of the Santa Elena underground was completed using Dassault Systemes GEMS 6.5 software. This allowed for the digitization and visualization of the mine stope layout as it evolved through the design process.
The underground layout for Santa Elena was developed by using Indicated Resources, rock engineering criteria, the depth of the open pit and the desired crown pillar vertical thickness. Refer to section 16.2 for the geotechnical analyses and geotechnical design parameters and resulting sill pillar thickness.
Solids were digitized which delineated the mineable area of the underground Indicated Resources. These solids provided the initial stope shapes to calculate internally diluted grade and tonnage. These initial reports highlighted stopes which could be feasibly mined where grades were higher than cut-off grade for the planned mining method, and allowed the exclusion of stopes that had grades below the economic cut-off grade. Where stopes where found to have grades lower than the cut-off grade of 2.49 g/t AuEq or the stopes grades where only marginally higher than the cut-off grade, the stopes were clipped or adjusted to exclude some low grade materials on the stope edges. In some instances entire stopes were excluded from the reserves as the stope grades were below the cut-off grade and there was too little material to justify reasonable extraction.
| | SANTA ELENA UPDATE TECHNICAL REPORT |
| | EFFECTIVE DATE: DECEMBER 31, 2014 |
| | |
The layout of the cut and fill stopes was undertaken to create shapes above cut-off grade in the lower east portion of the mine where the deposit shallows out in dip. More flexibility in the stope shape is possible for the cut and fill stopes, due to the mining method, though as far as possible stope shapes were kept to blocks with strike lengths of a maximum of 100 m to limit the hanging wall spans within the cuts. The stopes that are situated directly underneath the open pit include material that is considered crown pillar for the duration of mining. These stopes are scheduled for extraction at the end of the mine life. These stopes will be mined by long hole methods, but will only require a single development drift on the bottom sublevel for haulage. The other access points for these stopes will be via drop-raises through the bottom of the open pit.
Figures 16.4 and 16.5 show the UPFS arrangement of stopes, coloured by mining method.
| | SANTA ELENA UPDATE TECHNICAL REPORT |
| | EFFECTIVE DATE: DECEMBER 31, 2014 |
| | |
Figure 16.3: Longitudinal View of Stopes, Looking North
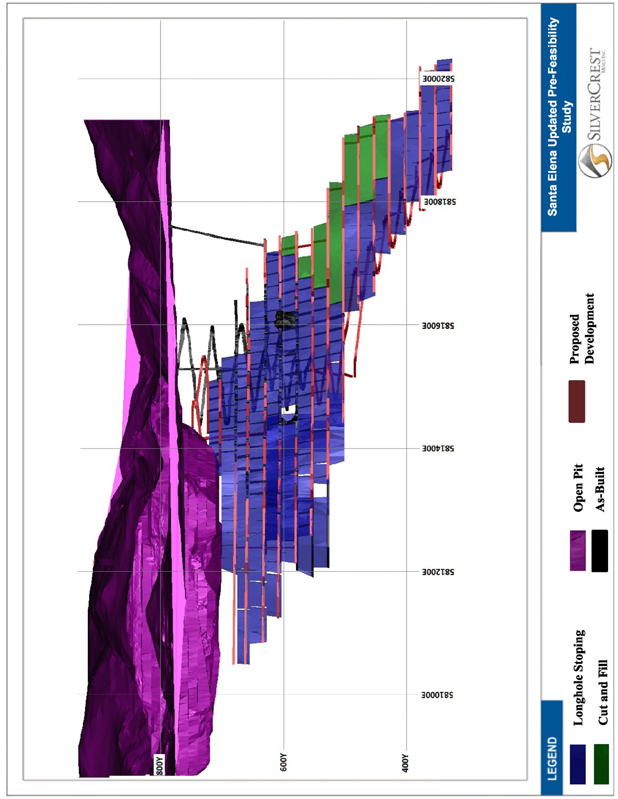
| | SANTA ELENA UPDATE TECHNICAL REPORT |
| | EFFECTIVE DATE: DECEMBER 31, 2014 |
| | |
Figure 16.4: 3D View of Stope Layout, Looking Northwest
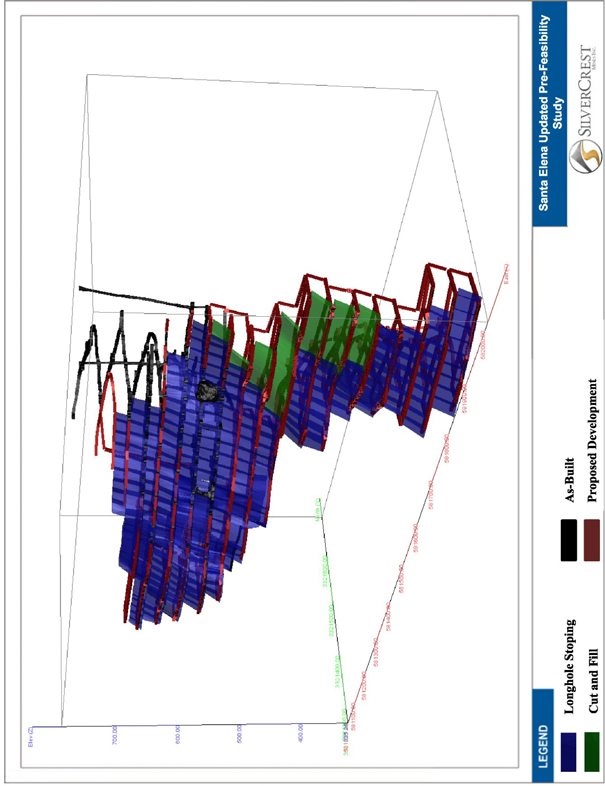
| | SANTA ELENA UPDATE TECHNICAL REPORT |
| | EFFECTIVE DATE: DECEMBER 31, 2014 |
| | |
Figure 16.5: 3D View of Stope Layout Showing El Cholugo and MMZ, Looking Down and to South
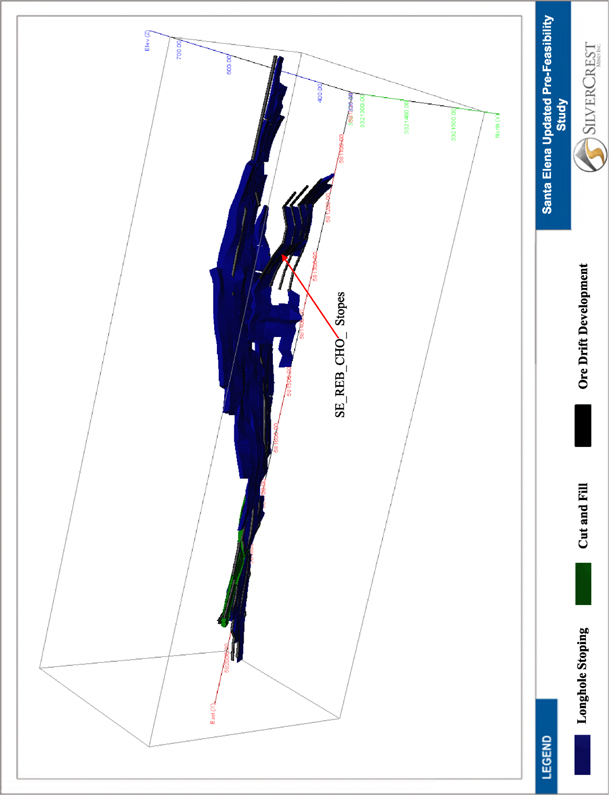
| | SANTA ELENA UPDATE TECHNICAL REPORT |
| | EFFECTIVE DATE: DECEMBER 31, 2014 |
| | |
Figure 16.6 and 16.7 show the development layout included in the UPFS. At the effective date of this report (December 31, 2014) development had advanced such that the main ramp had reached 575 level including footwall drifts (ongoing development as required for stoping).
Access to the underground stopes will continue to be via the current main ramp. The main ramp will be ventilated using a shaft that is driven within the centroid of the ramp with the fresh air carried by ducting to the face. A main exhaust ventilation shaft will be developed to the east of the main ramp. Details of the preliminary ventilation design are in section 16.7 of this report.
From the main ramp at 25 m intervals footwall drifts and ore sill drives are driven as production levels providing access to the stopes for drilling, blasting and mucking. Crosscuts link the footwall drifts with ore drives prior to stoping.
For longitudinal stopes (Avoca technique), the stope development includes drifts within the ore, meaning this material will be sent for processing and recovery of gold and silver if above the marginal cut-off grade of 0.75 g/t AuEq to ensure the ore will at minimum pay the processing costs.
The cut and fill stopes access will be developed in the footwall waste rock. The stopes will be accessed using attack ramps from these main development drifts. As each sublevel is finished, the backfill provides a working floor from which to mine the next cut.
Table 16.5 shows a summary of the linear metres of waste development over the life of mine, by development aspect.
Table 16.5: Linear Meters of development remaining for life of mine
| Development | 2015 | 2016 | 2017 | 2018 |
| Main Ramp & Ancillary (m) | 980 | 720 | 705 | 0 |
| Lateral (m) | 2,144 | 2,888 | 1,794 | 760 |
| Vertical (m) | 161 | 300 | 50 | 0 |
| Total Development | 3,286 | 3,908 | 2,549 | 760 |
Figure 16.6 and figure 16.7 shows the developments in relation to the planned stopes. Stope identification is shown in Figure 16.1.
| | SANTA ELENA UPDATE TECHNICAL REPORT |
| | EFFECTIVE DATE: DECEMBER 31, 2014 |
| | |
Figure 16.6: Development and Stope Layout, Looking North
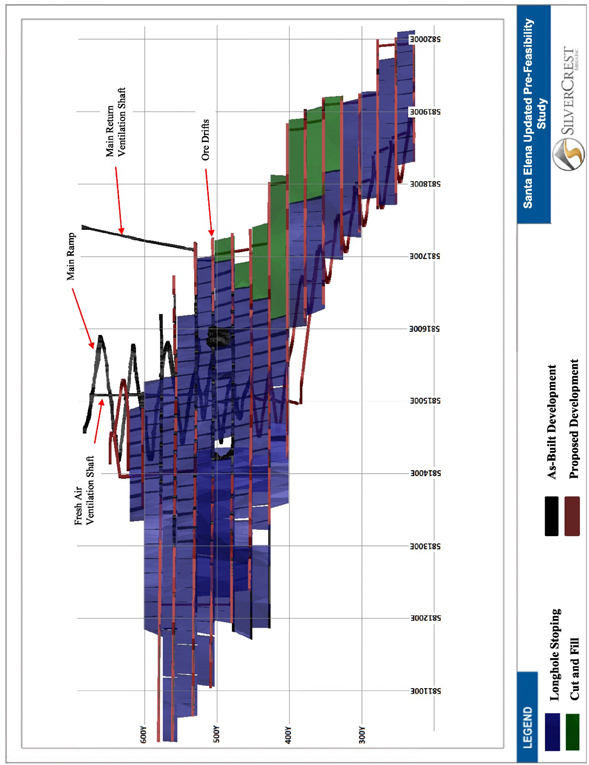
| | SANTA ELENA UPDATE TECHNICAL REPORT |
| | EFFECTIVE DATE: DECEMBER 31, 2014 |
| | |
Figure 16.7: 3D View of Stope and Development Layout, Looking South (Footwall Side)
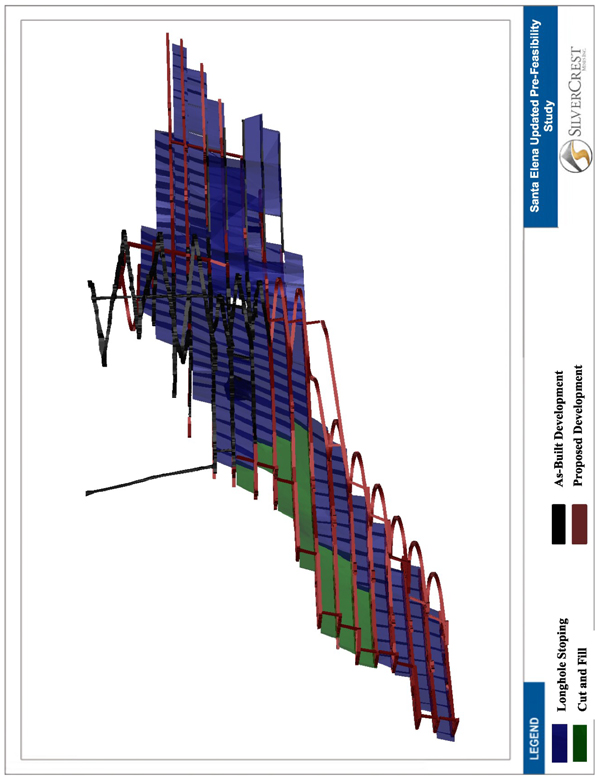
| | SANTA ELENA UPDATE TECHNICAL REPORT |
| | EFFECTIVE DATE: DECEMBER 31, 2014 |
| | |
For the long hole stoping using Avoca technique and mechanized cut and fill mining methods, backfilling is required. For the long hole stoping the backfill will be comprised of a combination of waste rock which may be mixed with 5% Portland cement by weight if required to create a consolidated fill where future mining may be considered beneath filled areas. For cut and fill stoping the backfill does not need to be cemented as mining of cut and fill stopes is planned from the bottom up.
The waste rock will either be transported from surface waste dumps or from adjacent mining stopes. Rock fill will be run of mine and therefore the overall sizing curve will be short on fines, however detoxified mill tailings may also be available for use in backfilling.
| 16.5.1 | Backfilling Cut and Fill Stopes |
Mining will begin at the lower most section of each stope by slashing through the width of the ore body in (5 metre) lifts. The openings will then be backfilled with cemented rock fill. During mining of each 5 metre high cut, support in the form of rock bolts or split sets will be installed in the back and sidewalls as informed by geotechnical conditions and daily inspections. The backfill is placed in order to provide a new working platform for the level above.
| 16.5.2 | Backfilling Long Hole Stopes (Avoca Technique) |
To backfill the longhole stopes using the Avoca technique, mined out areas will be filled from cross-cuts used for drill rig access prior to stopes. Backfill rock will be hauled to the stoping areas using haul trucks which will dump into muck bays designed for the purpose (back slashed to enable tipping). The backfill will be placed using scooptrams, using remote control where needed. Necessary steps will be taken to prevent equipment from inadvertently rolling into the stopes using bump beams or other standard techniques.
| 16.6 | Overall Mining Schedule |
The mining schedule describes the estimates tonnages which will be mined from the underground, open pit and the existing heap leach facility to feed the expansion plan process plant. Table 16.6 shows the combined schedule for the Santa Elena Project.
Table 16.6: Summary of Overall Production Schedule
Aspect of
operations | 2015 | 2016 | 2017 | 2018 | 2019 | 2020 | 2021 | 2022 | Total life
of mine |
| Total tonnes from underground | 462,200 | 543,000 | 521,100 | 535,400 | 493,700 | 497,600 | 434,300 | 494,300 | 3,981,600 |
| Spent ore from old heap leach | 502,300 | 543,200 | 565,100 | 550,800 | 592,500 | 588,600 | 2,200 | | 3,344,700 |
| Total tonnes from open pit | 121,700 | | | | | | | | 121,700 |
| Total tonnes processed | 1,086,200 | 1,086,200 | 1,086,200 | 1,086,200 | 1,086,200 | 1,086,200 | 436,500 | 494,300 | 7,448,000 |
| Total Gold Ounces Sold* | 45,000 | 45,500 | 37,200 | 35,800 | 29,400 | 38,300 | 23,500 | 16,000 | 270,700 |
| Total Silver Ounces Sold* | 2,048,400 | 2,111,400 | 1,750,000 | 1,888,800 | 1,487,200 | 1,492,100 | 953,500 | 914,800 | 12,646,200 |
Note: All numbers rounded. *Ounces based on sold, not insitu Reserve. |
| | SANTA ELENA UPDATE TECHNICAL REPORT |
| | EFFECTIVE DATE: DECEMBER 31, 2014 |
| | |
| 16.6.1 | Underground Mine Production Schedule |
For the purpose of the UPFS, a preliminary schedule has been developed so that the stope tonnes and grades can be applied to a mining timeline. The mining schedule has been developed for the stopes in the reserve model and for the required development to access the stopes throughout the life of mine.
The mining schedule has been developed based on the parameters as shown in Table 16.7 below.
Table 16.7: Scheduling Parameters
| Scheduling parameters | Value |
| Maximum daily production from each longitudinal long hole stope | 1,500 tonnes per day |
| Maximum daily production from each cut and fill stope | 500 tonnes per day |
| Heading/ drift advance rate per blast round | 3.8 m |
| Maximum development advance per jumbo drill with one heading available | 1.5 rounds |
Based on the above parameters the mine stoping and development schedule was developed by targeting high grade stopes for the earlier in the schedule, where possible and ensuring that at all times at least 3 stopes are available for production, to allow flexibility in the mining operation. Additionally, mechanized cut and fill stoping areas have been scheduled for the end of the life of mine. The development schedule was established by ensuring that the required development for all stopes operating in a particular time period was completed in advance of production commencing. Allowance has also been made for a ramp up period.
After completion of the schedule, verification has been undertaken to ensure that the ore tonnes and grade in the schedule are consistent with the Probable Reserve numbers for underground as shown in Section 15.
Mining costs applicable to various types of stoping have been applied to each stope in the Probable Reserves and scheduled. Development costs are included separately as the timing of development of a stope and mining of a stope may be months apart and thus need separate consideration.
Figure 16.8 shows the underground mining schedule developed for the PFS.
| | SANTA ELENA UPDATE TECHNICAL REPORT |
| | EFFECTIVE DATE: DECEMBER 31, 2014 |
| | |
Figure 16.8: Summary of Annual Tonnes by Underground Mining Methods and Grade for the Life of Mine
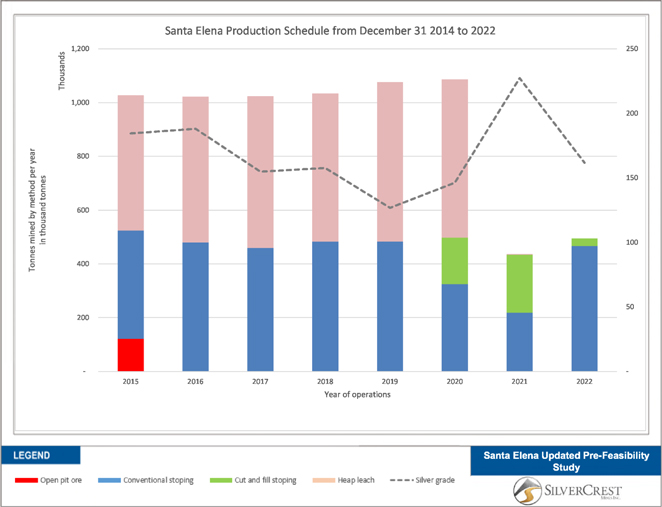
| | SANTA ELENA UPDATE TECHNICAL REPORT |
| | EFFECTIVE DATE: DECEMBER 31, 2014 |
| | |
| 16.6.2 | Open Pit Mining Schedule |
The remaining ore reserves as shown in section 15, within the open pit reserves. The open pit was closed prematurely on April 1, 2014. Subsequent to this report, the open pit was reopened in January 2015.
| 16.6.3 | Heap Leach Mining Schedule |
The heap leach mining schedule has been created in such a way as to increase mill feed to mill capacity for each year of operation. The final (after 2014 depletion to the mill) heap leach resulted in a tonnage of 3.3M tonnes at an average grade of 0.65 g/t Au and 33.3 g/t Ag for the life of mine. This schedule is not optimized and increases in grade have been noted in reprocessing of pad ore with the new facility in 2014. In 2014, an estimated 191,500 tonnes of pad ore grading 0.75 gpt Au and 52.47 gpt Ag were reprocessed in the new facility. .
A preliminary ventilation study was performed for the Santa Elena Mine for the 2013 PFS. The purpose of the ventilation study was to determine the ventilation requirements in terms of airflow and circuits, as well as provide an estimate of ventilation equipment, infrastructure and the excavations required.
| 16.7.1 | Ventilation Requirements |
Ventilation requirements were based on a common industry minimum of 0.06 m3/s per kW of equipment. Based on the equipment usage at the mine, the total air requirement is 239 m3/s. Table 16.8 shows the estimated power and utilization of the underground equipment.
Table 16.8: Equipment Power and Utilization
| Equipment | Engine | No | Utilization | Required |
| | Kw | In Use | % | mt3/sec |
| Mine Trucks (20tons) | 250 | 6 | 100% | 53 |
| Long Hole Drill (Sandvik) | 130 | 1 | 6% | 0 |
| Scoop Trams (Sandvik) | 276 | 5 | 100% | 49 |
| Jackleg/ Stoppers (based on 200 cfm air consumption) | 37 | 4 | 100% | 5 |
| Jumbo drills (cut and fill stopes) DD311-40 (110kW) | 110 | 2 | 6% | 0 |
| Telehandler (Caterpillar) | 75 | 2 | 75% | 4 |
| Scissor Lift 92 HP | 69 | 1 | 50% | 1 |
| Grader -110HP | 82 | 1 | 20% | 1 |
| Kubota/s | 14 | 3 | 33% | 0 |
| Crew transportation | 96 | 1 | 10% | 0 |
| Service Truck | 96 | 3 | 50% | 5 |
| Shotcrete Pump (Airplaco Shotcrete Mixer/Pump) | 34 | 1 | 50% | 1 |
| Underground Diamond Dill/Gopher (Hydra Core Gopher) | 37 | 2 | | 120 |
| Total | 1306 | | | 239 |
| | SANTA ELENA UPDATE TECHNICAL REPORT |
| | EFFECTIVE DATE: DECEMBER 31, 2014 |
| | |
Operational constraints guided the ventilation design. In particular, hauling will be performed on the lower drift of each stope. LHD’s are a large proportion of the overall ventilation load, and the ventilation has been planned to avoid ventilation doors on haulage levels. As a result, air flow has been routed to reach the haulage drifts last.
| 16.7.2.1 | Conceptual ventilation design |
In order to undertake the ventilation design, conceptual design work was undertaken to create parameters for friction for various types of conduits. This resulted in conceptual designs for ventilation as shown in Tables 16.9 through 16.13.
| 16.7.2.2 | Intake airway / Escape way Raise |
This arrangement may apply to the intake fresh air raise, as is currently being excavated along with the main ramp. The complete raise has dimensions of 2.13 m by 3.05 m. This raise was sized to provide ventilation, and an escape way route, for the ramp development only (3 trucks, 1 scoop, 1 jumbo, 1 Kabota). It is not meant to be the sole conduit of fresh air for the mine when in production.
Table 16.9: Design Parameters for Escape Way Raise
| Friction Factor (K) | 100 | x10-10lb.*min2/ft4 |
| Friction Factor (K) | 0.019 | kg/m3 |
| Perimeter (P) | 7.9 | M |
| Length (L) | 152 | M |
| Area (A) | 3.9 | m2 |
| Air Flow (Q) | 61.4 | m3/s required |
| Velocity (V) | 15.75 | m/s |
| Static Pressure (Ps) | 1426 | Pa |
| Velocity Pressure (Pv) | 152 | Pa |
| Total Pressure (Pt) | 1578 | Pa |
| Fan Power | 97 | kW |
| Fan Power @ 70% efficiency | 138 | kW |
| | SANTA ELENA UPDATE TECHNICAL REPORT |
| | EFFECTIVE DATE: DECEMBER 31, 2014 |
| | |
| 16.7.2.3 | Fresh Air Raise Head Without separate man way |
This arrangement applies to a fresh air raise without a separate man way. The dimensions used to study the discussed fresh air raise are for a square with 3.4 m sides (Figure 16.10).
Table 16.10: Design Parameters for Fresh Air Raise
| Friction Factor (K) | 70 | x10-10lb.*min2/ft4 |
| Friction Factor (K) | 0.013 | kg/m3 |
| Perimeter (P) | 13.6 | M |
| Length (L) | 455 | M |
| Area (A) | 11.6 | m2 |
| Air Flow (Q) | 146 | m3/s required |
| Velocity (V) | 12.63 | m/s |
| Static Pressure (Ps) | 1109 | Pa |
| Velocity Pressure (Pv) | 98 | Pa |
| Total Pressure (Pt) | 1207 | Pa |
| Fan Power | 176 | kW |
| Fan Power @ 70% efficiency | 252 | kW |
| 16.7.2.4 | Raised Bore for main exhaust ventilation airway |
In late 2014, an Alimak raise was completed for exhaust ventilation. This raise is approximately 3.5 metres in diameter and 170 metres long from the 625 metre level to surface. Once completed, without exhaust fan, air circulation improved dramatically. A concrete shaft collar and exhaust fan will be installed in early 2015.
Table 16.11 below shows the design parameters and resulting fan power required for an exhaust raise bore or equivalent with a 3.3 m diameter.
| | SANTA ELENA UPDATE TECHNICAL REPORT |
| | EFFECTIVE DATE: DECEMBER 31, 2014 |
| | |
Table 16.11: Design Parameters for Exhaust Raise
| Friction Factor (K) | 27 | x10-10lb.*min2/ft4 |
| Friction Factor (K) | 0.005 | kg/m3 |
| Perimeter (P) | 10.4 | M |
| Length (L) | 455 | M |
| Area (A) | 8.55 | m2 |
| Air Flow (Q) | 146 | m3/s required |
| Velocity (V) | 17 | m/s |
| Static Pressure (Ps) | 805 | Pa |
| Velocity Pressure (Pv) | 178 | Pa |
| Total Pressure (Pt) | 983 | Pa |
| Fan Power | 144 | kW |
| Fan Power @ 70% efficiency | 205 | kW |
| 16.7.2.5 | Vent Tubing Head For Tunnels and Ore drifts |
The design parameters covered in Table 16.12 below are calculated for the infrastructure needed to achieve the airflow required at the working faces. The friction factor used is for a smooth plastic fabric, which would be most representative of the material used for the tubing throughout the tunnels and ore drifts. The results take into account both static and velocity pressure head as well as any coupling and exit losses. The size of the tubing was chosen to be 1.07 m in diameter.
| | SANTA ELENA UPDATE TECHNICAL REPORT |
| | EFFECTIVE DATE: DECEMBER 31, 2014 |
| | |
Table 16.12: Design Parameters for Vent Tubing
| Friction Factor (K) | 20 | x10-10lb.*min2/ft4 |
| Friction Factor (K) | 0.004 | kg/m3 |
| Perimeter (P) | 3.4 | M |
| Length (L) | 305 | M |
| Area (A) | 0.89 | m2 |
| Air Flow (Q) | 14.17 | m3/s required |
| Velocity (V) | 15.84 | m/s |
| Coupling Loss Equivalent Length | 34.76 | M |
| Exit loss Equivalent Length | 30.49 | M |
| Number of 90o Bends | 0 | M |
| Bend Loss | 0 | M |
| Total Theoretical Length of Tubing | 370 | M |
| Static Pressure (Ps) | 1292 | Pa |
| Velocity Pressure (Pv) | 154 | Pa |
| Total Pressure (Pt) | 1446 | Pa |
| Fan Power | 20.5 | kW |
| Fan Power @ 70% efficiency | 29 | kW |
| 16.7.2.6 | Setup of Ventilation Model |
Ventsim Visual Advanced (Ventsim) was used as the ventilation modelling software. Ventsim provides a number of features useful for underground ventilation design, including fan specification, and airflow modelling throughout the mine workings. The software utilizes the Hardy-Cross method to iterate to a ventilation solution. Minimum inputs to the software are a tunnel system, surface connection, and air moving device, such as a fan.
Initially, solid files were imported from the mine design software as centerlines of the mine workings. Tunnels were constructed around the centerlines, and then set as their actual type. Group properties were set for each of the tunnel types. The tunnel types have specific shapes, as well as friction factors. Tunnel types and their properties are shown in Table 16.13.
| | SANTA ELENA UPDATE TECHNICAL REPORT |
| | EFFECTIVE DATE: DECEMBER 31, 2014 |
| | |
Table 16.13: Dimensions and Friction Factors for Underground Workings
| Type | Dimension 1 | Dimension 2 | Shape | Material | Friction Factor |
| Drifts | 4 | 4 | Square | Average Blasted | 0.01 |
| Ramps | 4 | 4 | Square | Average Blasted | 0.01 |
| Duct | 1.07 | 1.07 | Round | Smooth Plastic Duct | 0.00371 |
| Vent Shaft | 3 | 3 | Round | Bored Raise | 0.005 |
| Stope Raises | 2 | 2 | Round | Average Blasted | 0.01 |
| Stope Access | 4 | 4 | Square | Average Blasted | 0.01 |
The ventilation model is sensitive to an accurate friction factor being chosen. The friction factors ultimately chosen are shown in Table 16.17. After the initial setup of the model, three phases were created for ventilation planning purposes only. These phases are representative of early, mid, and late mining stages. Figures 16.12, 16.13 and 16.14 show the ventilation phases and the ventilation requirements for each phase.
Ventsim supports a forced airflow method that allows a specific required airflow to be placed where a fan would be placed, and the required fan pressure, and then models the airflow throughout the mine. A forced airflow of 146 cu.m/s was selected from the initial ventilation calculations, and used throughout the modelling as the target flow rate.
A final step was connecting the various workings to the ramps and drifts with attack ramps and small ventilation raises. These were selected for ease of ventilation modelling and not mining feasibility. As a result, the actual location of access ramps into the drifts is not reflected in the Ventsim model. Additionally, some of the drifts will require in-place ducting to supply air to the working face.
| | SANTA ELENA UPDATE TECHNICAL REPORT |
| | EFFECTIVE DATE: DECEMBER 31, 2014 |
| | |
Figure 16.9: Phase 1 Ventilation Air Flow Diagram
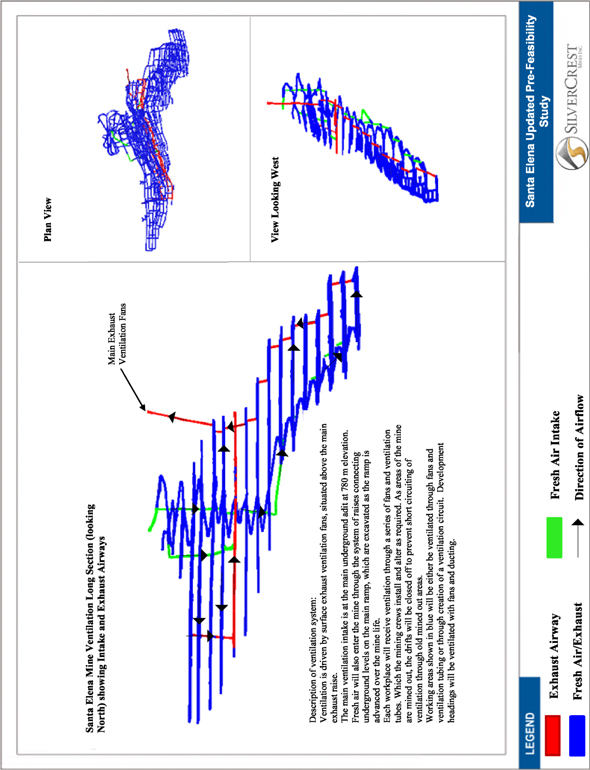
| | SANTA ELENA UPDATE TECHNICAL REPORT |
| | EFFECTIVE DATE: DECEMBER 31, 2014 |
| | |
| 16.7.3 | Interpretation of Ventilation Conceptual Design |
Based on the three sample phases, Santa Elena can be ventilated by one main exhaust fan. During development under the pit, auxiliary fans and ducting will be required, until the under pit developments are attached to the main developments. Ventilation velocities are reasonable in the ramp and shafts, and airflow is adequate at the most distant drifts.
It may be advantageous to use two main fans, to provide redundancy in the event of mechanical failures. As well, a stench gas system should be installed as warning to evacuate the mine in case of emergency.
| 16.8 | Open Pit Mining Method |
Santa Elena is a conventional open pit. All drilling, blasting and mining is completed by a local Mexican mine contractor utilizing a fleet of:
| § | 4 – 40 tonnes Caterpillar 740 articulating trucks. |
| § | Support equipment including one D8 and two D9 dozers, two excavators, two air track drills (Tamrock and G. Denver), one 140H Caterpillar grader, explosives truck, and maintenance vehicles. |
| § | Auxiliary equipment includes a water truck and light vehicles. |
Standard operating procedures for the open pit includes:
| § | Daily meetings between owner (Santa Elena operations) and mine contractor to review safety, production objectives and ore control for the day. |
| § | Blasthole drilling of ore is on an average 3.5 by 3.0 metre pattern, 6 metre hole depth with a 1 metre sub-drill. Blasthole drilling of waste is on an average of 4.0 by 4.0 metre pattern. |
| § | Blastholes are loaded with mixture of ANFO or emulsions depending on standing water in the hole. Standing ignition is used for basting and fragmentation. |
| § | Typically, a blast pattern consists of 50 to 100 blastholes with blasting occurring on average 3 times per week. |
| § | Blastholes considered to be in or near ore are systematically sampled and sent to the on-site lab for gold, silver and copper analyses. Turnaround time for the lab is estimated at 24 hours. Analytical results are given to the geology department and standard ore control is completed using AutoCAD and Gemcom software. |
| § | Ore control is flagged and cut lines are established in the pit for extraction of ore and waste. |
| § | Daily surveys are completed in the pit to determine volumes extracted and for floor grade control. Truck counts are also completed by the mine contractor and owner personnel. Invoicing for the contractor is based on a cost per tonne with the reconciliation of surveys and truck counts. |
| § | Mine production is guided by a pre-set mine design that is considered geotechnically adequate to extract materials while operating in a safe manner. |
| § | Blasted ore from the pit is hauled to the nearby crushing facility and either end dumped into the primary jaw crusher or stockpiled for loader feed crushing. |
| | SANTA ELENA UPDATE TECHNICAL REPORT |
| | EFFECTIVE DATE: DECEMBER 31, 2014 |
| | |
| § | Blasted waste rock from the pit is hauled to the waste dump on the northwest of the pit. |
| 16.9 | Spent Ore (Pad Ore) Mining And Re-handling Methods |
Spent ore (pad ore) is being delivered to the mill using of a 3.5 cubic meter loader and a conveyor belt (grasshopper and stacker). A loader is loading the spent ore from the leach pad on to a 24 inch wide conveyor belt capable of handling 220 tonnes per hour to be delivered to a stockpile area for blending with underground ore using a reclaim tunnel at the processing facility (see Photo 16.2). Grade control will be performed on spent ore as using a belt sampler. The amount of spent ore required to be processed is flexible. For this report a 50/50 blend is used to maintain a nominal 3,000 tonnes per day feed to the processing facility (1,500 tonnes per day underground ore and 1,500 tonne per day spent ore from the leach pad). Refer to Figure 17.2 for a layout of the plant and 16.15 for the overall site layout which shows the heap leach facility in relation to the plant site and ROM stockpiles.
Photo 16.2: Showing Pad Ore on Leach Pad and Recovery Conveyor System
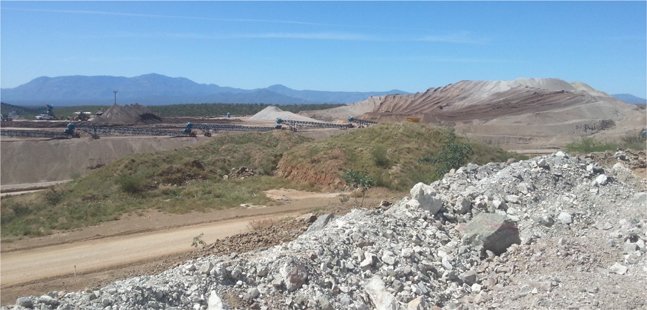
The tailings produced from the processing facility is being filtered and deposited as dry-stack tailings. The tailings handling circuit will have the following equipment:
| § | final CCD thickener underflow pumps |
| § | filter feed slurry pumps |
| § | filter feed stock tank; 3,200 mm diameter × 7,600 mm |
| § | two belt filters with adequate capacity |
| § | filter press conveyor belts |
| | SANTA ELENA UPDATE TECHNICAL REPORT |
| | EFFECTIVE DATE: DECEMBER 31, 2014 |
| | |
| § | tailings filtrate pump box |
The final CCD thickener underflow is the final plant tailings. The thickened tailings are be pumped from the final CCD thickener at a density of approximately 65% solids. Slurry enters the pump box which feeds the tailings filter feed stock tank. The plate and frame filters dewater the tailings slurry to a moisture content of about 20%. The dewatered solids will be conveyed to the lined leach pad for aeration and cyanide destruction. Once the cyanide toxicity in the dry tailings is at acceptable levels, it is being transported by conveyor to the waste facility for deposition and reclamation in the future. The filtrate from the filter presses will be collected in a filtrate pump box and will be pumped to the barren solution tank for reuse within the leach circuit.
The ore from both underground and open pit resources will be processed by conventional cyanide leaching technology, shown in Figures 17.1 and 17.2. In addition pad ore from the existing heap leach operations will be blended with underground ore at a variable rate and reprocessed through the same plant.
Metallurgical test work has demonstrated that Santa Elena ore is amenable to conventional processing. Test work has also demonstrated that the existing heap leach residue can be further treated to recover most of the residual gold and silver.
Santa Elena ore contains an estimated average grade (open pit, underground and heap leach) of 1.23 g/t Au and 78.4 g/t Ag and after crushing and grinding can be leached in cyanide to yield approximately 92% Au Recovery and 67.5% Ag recovery. Because of the relatively high level of silver in the ore (and hence solutions) there are advantages and benefits to using traditional CCD and Merrill-Crowe for metal recovery rather than CIL/CIP. The partially leached heap ore yielded recoveries of approximately 60% Au and 30% Ag when crushed to 10 mm and processed on the heap leach. Since the leach cycle is being prematurely terminated to start the mill on re-leaching after grinding the balance of the metals are recovered to the level expected from new ore.
The process plant has been designed to treat a nominal 3000 tonne per day (tpd) of ore, a mixture of freshly mined material and partially leached heap residue. The plant has been designed to treat any proportion of these two types of feed (see Photo 17.1).
| | SANTA ELENA UPDATE TECHNICAL REPORT |
| | EFFECTIVE DATE: DECEMBER 31, 2014 |
| | |
Photo 17.1: Showing Pad Ore Recovery Conveyor and Stockpile with CCD Tanks in Background
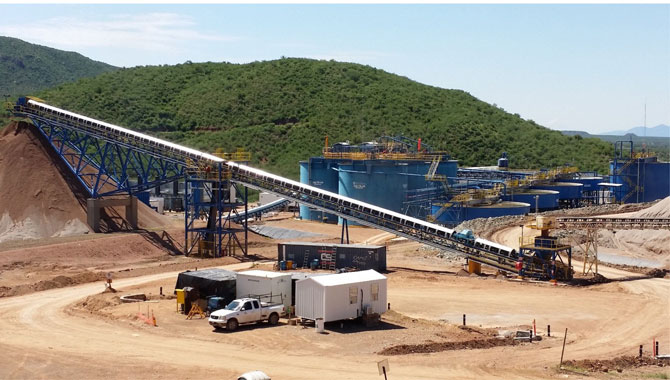
ROM ore is delivered to a dump pocket ahead of the crushing plant. Ore is reclaimed from the dump pocket by vibrating grizzly feeder and fed to a 30``x54`` jaw crusher (the one from the existing heap leach crushing plant). Product is screened and oversize fed to a XL400 secondary cone crusher. The cone crushed product is again screened and the oversize to a bin ahead of two XL 400 tertiary cone crushers, operated on close circuit with the same screen.
Crushed ore is placed on an open stockpile above a reclaim tunnel. Reclaimed heap leach material (pad ore) is collected and conveyed to a second stockpile located above the same reclaim tunnel. Each stockpile has two feeders under it (total 4). Open pit, underground and pad ore are blended by adjusting the feeder rates (see Photo 17.2). There is a weightometer between the two piles on the reclaim conveyor and another after the reclaimed material has been combined (as well as a sampler) to allow for accounting of both the fresh ore and heap leach residue. The stacking belts feeding the stockpiles also have weightometers and cross belt samplers.
| | SANTA ELENA UPDATE TECHNICAL REPORT |
| | EFFECTIVE DATE: DECEMBER 31, 2014 |
| | |
Photo 17.2: Showing Two Stockpiles for Underground (White) and Pad Ore (Brown)
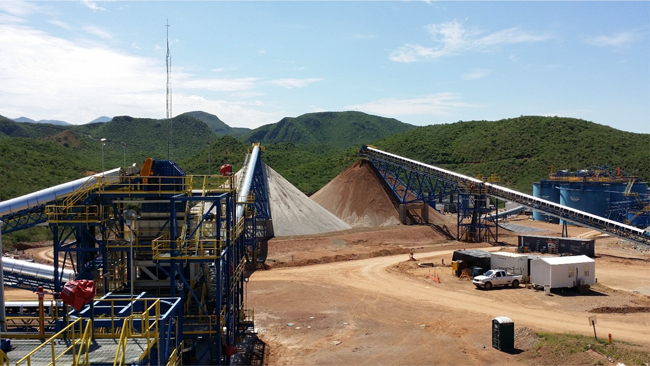
Ore is reclaimed from the stockpiles and fed to a 15’x21’ (4.62 m x 6.77 m) ball mill fitted with a 2200 kW motor. This mill is designed to produce a 100µm (P80) product and the mill circuit is closed by Hydrocyclones. The ore grinding takes place in barren solution and so significant amounts of gold and silver will dissolve in the grinding circuit. The cyclone overflow is thickened ahead of the leach circuit, and the supernatant solution advanced as pregnant solution or used elsewhere in the circuit depending on the grade. Lime and Cyanide are also added to the grinding circuit to maintain desired leaching conditions of pH10.5 and 1000mg/L NaCN strength.
The thickener underflow pulp at 55% solids is fed to the leach circuit consisting of five 13.6mx 12.8m high tanks giving a total of 48 hrs. resonance time. These tanks are aerated. In a slight departure from conventional practice after the first leach tank the leach slurry can be diluted and washed with lower grade solution before being re-introduced into the leach circuit (tank #2). This solution change has been shown to boost the leaching rate, reducing the overall leach time required which provides opportunities to maximize capacity at the plant.
The last leach tank discharges to the CCD (counter current decantation) circuit: This consists of three thickeners in addition to the grinding circuit thickener and the intermediate thickener, making 5 thickeners in all. A wash water ratio of 3.2:1 is anticipated.
The washed residue from the final CCD thickener underflow is fed to a surge tank ahead of the two tailings belt filters. Filtration of tailings and dry stacking the cake was selected to minimize water usage, and produce stable tailings. The dry tailings will be conveyed to an intermediate point adjacent to the disposal area (leach pads), and then distributed over the disposal area (waste dump) after detoxification. Provision has been made for cyanide detoxification of residue, but calculation of the likely concentration in the residue suggests it will not be required. The intermediate transfer point will be sealed and any drainage from the residue collected and returned to the ore process plant.
| | SANTA ELENA UPDATE TECHNICAL REPORT |
| | EFFECTIVE DATE: DECEMBER 31, 2014 |
| | |
The pregnant solution is collected in the existing pregnant solution pond. The various qualities of the possible solution (grinding thickener, intermediate thickener and #1 CCD thickener overflows) will be monitored to maintain a relatively high grade solution, with lower tenor solutions used elsewhere in the circuit.
The pregnant solution is reclaimed from the pond and fed to a conventional Merrill-Crowe (MC) recovery circuit. Solution is first clarified in a vertical leaf precoat clarifier using DE (diatomaceous earth) as the clarifying medium. The solutions are then de-aerated under vacuum to remove oxygen, and then zinc dust is added to precipitate gold and silver which is removed from the solution by plate and frame filter press. The existing MC plant will be utilized alongside a new MC plant.
The barren solution from the precipitation press is recycled for reuse in the plant as process water. The filter cake is discharged, dried and mixed with flux for smelting to Dore.
The plant also has reagent handling systems. Lime is added dry to the mill feed belt. Cyanide is mixed as a 10% solution and distributed in the plant. Flocculent, zinc, anti-scalent, systems are in place as well as systems for Copper Sulphate and Sodium Metabisulphate if required for cyanide de-toxification.
| | SANTA ELENA UPDATE TECHNICAL REPORT |
| | EFFECTIVE DATE: DECEMBER 31, 2014 |
| | |
Figure 17.1: Santa Elena Expansion 3000 tpd Process Flowsheet
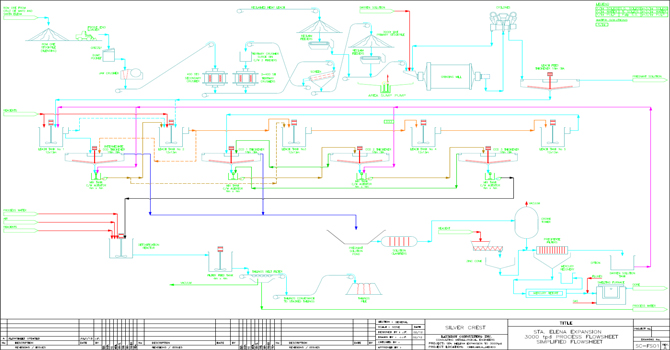
| | SANTA ELENA UPDATE TECHNICAL REPORT |
| | EFFECTIVE DATE: DECEMBER 31, 2014 |
| | |
Figure 17.2: Santa Elena Expansion Plan Plant Mechanical General Arrangement

| | SANTA ELENA UPDATE TECHNICAL REPORT |
| | EFFECTIVE DATE: DECEMBER 31, 2014 |
| | |
| 18.0 | Project Infrastructure |
The project infrastructure is shown in Figure 18.1
The Santa Elena open pit heap leach mine was constructed in late 2009 and 2010, and has been operational since 2010. There are a number of facilities currently in use at the Santa Elena site.
The Santa Elena Expansion Project was completed between 2012 and 2014 utilizing the current leach pad infrastructure.
Current facilities at the mine consist of (see Figure 18.1 for general site plan):
| § | 7 km long main access road from paved highway and local community of Banamichi; |
| § | Open pit mine closed April 2014; |
| § | Waste dump with the capacity of an estimated 35 million tonnes; |
| § | Underground ramp, levels, ventilation, water pumping stations and subsequent infrastructure; |
| § | 3-stage crusher provided by Excel Machinery of Amarillo, Texas (out of commission); |
| § | New 3-stage crusher provided by FLSmidth; |
| § | New 3,000 tpd CCD/MC processing facility provided FLSmidth, Outotec, W.W.Williams and various local contractors; |
| § | Lined and certified leach pad designed by Vector Engineering of Denver, Colorado; |
| § | Lined and certified barren and pregnant solution pond designed by Vector Engineering of Denver, Colorado; |
| § | Lined and certified emergency pond designed for 100 year event; |
| § | Old Merrill Crowe plant and refinery (out of commission); |
| § | On-site laboratory for production and exploration work; |
| § | Maintenance shop for mine contractor; |
| § | New warehouse for inventory; |
| § | Diesel generators (some decommissioned); and |
| § | All required piping, power and security. |
The material on the existing heap leach facility will be removed, and there is space on the facility for rehandling of the tailings prior to transport to the waste dump as dry stack tailings. Once pad ore is removed space will be available for reloading lower grade material for other resources.
| | SANTA ELENA UPDATE TECHNICAL REPORT |
| | EFFECTIVE DATE: DECEMBER 31, 2014 |
| | |
In January of 2012, the expansion of the mine from an open pit heap leach operation to an underground mill operation commenced with ground breaking of the underground portal. As of December 31, 2014, the expansion was completed with all major equipment purchased and the completion of all earthworks for the new processing facility and underground development to approximately the 575 metre elevation.
The Santa Elena Mine is located in the foothills of a north-south trending mountain range. Foothills area provides ample space to all required facilities and potential for future expansion.
NATIONAL INSTRUMENT 43-101 TECHNICAL REPORT
EFFECTIVE DATE: APRIL 30, 2013 | AMENDED DATE: MARCH 04, 2014
Figure 18.1: Site General Arrangement Plan

| | SANTA ELENA UPDATE TECHNICAL REPORT |
| | EFFECTIVE DATE: DECEMBER 31, 2014 |
| | |
| 18.1 | Surface Infrastructure for the Expansion Plan |
The access road to the Santa Elena mine is a 7 km unpaved road, which connects to a nearby paved highway and the local community of Banamichi. This road is currently operated and maintained by SilverCrest.
| 18.1.2 | Offices, Cafeteria, Warehouse and Change Houses |
The existing offices, cafeteria, warehouse and change house at Santa Elena are expected to be adequate for the Santa Elena Project. Currently, the office space consists of a main office located where the access road enters the mine area and a smaller mobile office for the surveying and the underground manager/s. The process plant includes office space for the technical staff operating the processing facility. No additional office space is required.
| 18.1.3 | Fuel Storage Facility |
The diesel storage requirements for the mining machinery for the open pit mine will be sufficient for the underground mining equipment. The consumption of each individual equipment type is highlighted in table 18.1 with the total daily diesel consumption also listed. Diesel for power generation will be stored at the power generation site/facility.
| 18.1.4 | Water storage facility |
A water storage facility is located as shown in Figure 18.1, no additional water storage is required for the LOMP.
| 18.1.5 | Electrical Distribution |
The underground mine receives power from surface generators supplying power to the process plant and the underground mine. The overall installed capacity will be in the order of 6.5 MW. Roughly 1 MW of the installed capacity will be required for underground. The generators will produce power which will feed a surface substation, from which power will be drawn for the process facility and the underground. A 5 kV cable will take power underground, either via the fresh air raise or via a borehole.
Santa Elena currently has powder magazines for the open pit mining. This will be used for surface bulk storage of explosives for the underground operation. Underground temporary storage of explosives will be undertaken in suitable areas or containers, as directed by Mexican mining health and safety regulations.
A maintenance shop exists for the underground machinery used in the ramp development. This shop is adjacent to the current underground adit as seen in figure 18.1 above. In addition to surface maintenance shops, and underground maintenance shop will be constructed on the 536 level. This shop will consist of 3 to 4 bays, which have been slashed to accommodate an underground truck with the load body in the tipping position. The underground shops will be fitted with overhead trolleys for lifting of heavy equipment and will include tools and equipment as required for maintenance.
The existing laboratory is used for the open pit, and will continue to be used for the underground mining and milling.
| | SANTA ELENA UPDATE TECHNICAL REPORT |
| | EFFECTIVE DATE: DECEMBER 31, 2014 |
| | |
| 18.2 | Underground Infrastructure |
Additional facilities will be required to support the mining operations underground. SilverCrest has completed the main ramp from the adit at 780 elevation to approximately the 575 level as of the end of 2014. The current ramp includes muck bays, sumps and a fresh air raise to surface. This arrangement will be continued to the proposed 536 level after which a return airway will be raise bored from surface to create a ventilation circuit. In addition to the ramp, cross-cuts and drifts required for the mining of the ore, further infrastructure is required as stated below. A ventilation shaft has been completed from the 625 level to surface and is being equipped with a fan and infrastructure as of December 2014.
| 18.2.1 | Underground Maintenance Shop/Warehouse |
The underground shop will be situated on the 536 level, in a more central location where equipment from all areas of the mine can easily access the shop. The shop will include 3 bays with dimensions to allow for work on scoop trams, jumbo drills, and underground haul trucks. The bays will accommodate scoop trams with a raised bucket. Next to the maintenance shop will be a bay equipped with shelving to store frequently used parts as well as other parts on consignment, consumables, and tires. A concrete floor will be placed in working areas in the workshop to enable working on level surfaces and for containment of spilled contaminants.
A prefabricated refuge station will be located in an unused drift or a muck bay to serve as an emergency shelter, as required by health and safety regulations.
All development headings will be sloped at a 2% gradient towards the ramps to allow for water to drain in a controlled direction. Sumps will be developed on each level to collect any inflow water and from there the water will be either recycled and used as drill water, or pumped to surface. The sumps will be installed at a vertical interval of 60 to 70 metres. Equipment and flow rates are expected to be 300 to 400 gpm over the life of mine.
| 18.2.4 | Underground Electrical Installations |
The site currently has no grid power and the use of diesel power generators will continue for the Expansion of the project. The power generation capacity will be increased to supply power for the process plant and the underground mining requirements. The underground power consumption has been estimated at 800 kW effective power, requiring an estimated 1MW of installed power generation capacity. The primary use of power underground will be by ventilation fans, drills, lighting plants, sump pumps and the workshop, while the majority of power used on the overall Santa Elena site will be by the crusher and process plant. To extend the services to underground, a 5 kV high tension power cable will be run down the ventilation raises or a dedicated borehole, connecting to a substation on each of the active levels. The underground machinery will be run on 440 V, with step down transformers mounted on skids delivering the power to the levels as required. Where required, smaller transformers will step down the voltage for underground lighting, shops and lunch rooms. All electrical installations will be done under supervision of a qualified electrician. The electrical equipment required for underground has been installed or will include:
| § | Underground cable vacuum breaker |
| § | Main underground cable from substation to adit – 5kV |
| | SANTA ELENA UPDATE TECHNICAL REPORT |
| | EFFECTIVE DATE: DECEMBER 31, 2014 |
| | |
| § | Cable from adit to ventilation shaft collar – 5kV |
| § | Ventilation fan transformers and switchgear |
| § | Main underground cable – 5 kV |
| § | Underground power centres mounted on skids including circuit protection, transformers, 5 kV feed couplings and 480/440 /120 V output couplings |
| § | 480/440 V underground feeder cables |
| § | Surface cap lamp charger stations |
| § | Miscellaneous electrical equipment including distribution boards, lighting and low voltage cables |
Underground water requirements include both potable and non-potable water. Non potable water for the jumbo and long hole drills will be sourced from sumps on each level if possible, or from surface water storage tanks. A service water pipeline will be provided down the ramp or down the ventilation shafts as required. Potable water will be taken down in bottles for each shift.
The main explosives magazine will be on surface. A temporary storage area for a short term supply will be developed on some of the levels underground. The underground explosive magazines will hold enough charge and detonators to be able to supply the underground workings for 1 week.
A mobile compressor will be used to provide compressed air for jackleg drilling power as well as ANFO loading. This compressor will be powered by electricity.
| 18.3 | Processing Plant Infrastructure |
The major equipment to be installed by January 2014 for the processing plant is shown in Table 18.1 (see Figure 17.1, 17.2 and 18.1 for details and layouts for the processing plant):
| | SANTA ELENA UPDATE TECHNICAL REPORT |
| | EFFECTIVE DATE: DECEMBER 31, 2014 |
| | |
Table 18.1: Major Equipment Components as part of the Processing Plant
| Class | Vendor | Item |
| Crushing & Screening | FLS | Cone Crushers |
| FLS | Vibrating Screens (Secondary & Tertiary) |
| BATSA | Conveyor Belts |
| FLS | Vibrating Pan Feeders |
| PPI Pella | Conveyor Idlers |
| THERMOSFISHER | Conveyor Belt Sampler |
| Grinding & Crushing | FLS | Ball Mill |
| FLS | Cyclones |
| Leaching & CCD | Outotec | Thickeners |
| Mixtec | 12 Agitators |
| Recovery (MC Plant) | FLS | MC Plant + Refinery |
| FLOWSERVE | Process Water Pumps |
| Warehouse & Management | FLS | Slurry Pumps |
| Kolberg Pioneer, Inc. | Belt Feeders |
| Reagents | BASF | Flocculant Mixing System |
| Process IQ | Wad Analyzer |
| Thickening & Tailings Management | FLS | Horizontal Belt Filters |
| Auxiliary Buildings | LYM (IR) | Compressor Air Equipment |
| Generators | WWWILLIAMS | Power House Project Gear |
| WWWILLIAMS | 7-E9000 Evolution LV MCC |
| GE | Switchgears |
| CONDUMEX | Transformers |
| Other Equipment | BATSA | Grasshoppers/Stackers |
| Nixon Grua | Crane 2004 Link Belt RTC |
| | Dozer |
| 18.4 | Waste Rock and Tailings Storage Facilities |
The waste rock storage facility at Santa Elena has been designed for a capacity of 35 million tonnes and fully covers all planned open pit and underground waste and dry stack tailings. Of the 35 million tonne capacity, 20 million tonnes has been used for the open pit waste rock, leaving roughly 15 million tonnes of capacity for underground waste rock and tailings. Note that not all waste rock from underground will be deposited at the waste dump sites as roughly 14% will be used to backfill some of the underground stopes. Figure 18.1 above shows the waste dump location and design.
Tailings from the processing facility is being washed, filtered to approximately 18% moisture content, drained on an exposed portion of the existing leach pad and conveyed for dry stacking on top of the ROM waste rock dump. Removal and cyanide detoxification will be achieved in combination with multiple filtering, a wash cycle and photo-degradation on the leach pad prior to be conveyed to the waste dump. The estimated tonnage of tailings to be delivered to the waste dump will depend on the plant processing capacity, with a planned nominal throughput of 3,000 tpd. The tailings are estimated to have a bulk density of 1.61 t/m3.
The infrastructure required for handling the dry stack tailings that has been included for the updated PFS including current contractor truck haul and an a longer-term overland conveyor to transport the material to the waste rock storage dump and a loader to rehandle the material from the heap leach pad onto the over land conveyor. Note that the existing bull dozer used on the current heap leach facility is of sufficient size to move 3,000 tonnes of dry stack tailings per day on the waste rock dump.
Additional capacity will also be available for detoxified tailings material on the current heap leach facility, later in the mine life, when a significant portion of the material on the existing heap leach has been reprocessed. No further waste rock storage facilities are foreseeably required.
| | SANTA ELENA UPDATE TECHNICAL REPORT |
| | EFFECTIVE DATE: DECEMBER 31, 2014 |
| | |
| 19.0 | Market Studies and Contracts |
The gold and silver prices used in this Technical Report are based on an internal assessment of the most recent public domain information as of December 31st 2014 for market prices, long term forward curve prices and consensus amongst analysts regarding price estimates. For the “base case” economic analyses in this Technical Report, a variable gold and silver prices were used for specific periods as outlined as follows:
| § | 2015 – US$1,250/oz Au, US$18/oz Ag; |
| § | 2016- US$1,275/oz Au, US$19/oz Ag; |
| § | 2017- US$1,300/oz Au, US$20/oz Ag; and |
| § | 2018 to 2022- US$1,300/oz Au, US$21/oz Ag. |
| 19.2 | Sales of gold and silver doré |
SilverCrest currently produces and sells gold and silver doré bars from the operation in Mexico. The dore refining terms are typical and consistent with standard industry prices. SilverCrest has included costs for refining, transportation and customs expenses for selling of the mine poured doré bars within the economic analyses presented in Section 22. SilverCrest has not relied upon assistance of external consultants or market studies to assist with sales terms and metal prices projections in this Technical Report.
| 20.0 | Environmental Studies, Permitting and Social or Community Impact |
| 20.1 | Land Use Change Permit |
Nusantara is authorized by SEMARNAT (May 2, 2013) from the environmental impact assessment view to develop the Project Expansion of the Santa Elena Mine which consists on adding 71.12 ha surrounding the already authorized surface of 99.35 ha for a total of 170.47 ha. The authorization is valid for 10 years from the next day of the day of reception of this document. It may be extended by written request within 30 days before the date of expiration.
The permitted new construction includes: portal and ramp, diesel gens, crusher and mill, tanks construction for leaching by CCD for underground mining, Merrill Crowe area, stacking area for ROM material, offices, mill shop and warehouse and internal road network to communicate the area of underground process.
As of March, 2014, Nusantara is authorized by SEMARNAT from the environmental impact assessment view to continue exploration on the Ermitaño concessions. The authorization is valid for 10 years from the next day of the day of the reception of this document may be extended by written request within 30 days before the date of expiration.
| | SANTA ELENA UPDATE TECHNICAL REPORT |
| | EFFECTIVE DATE: DECEMBER 31, 2014 |
| | |
| 20.1.1 | Summary of ARD/ML Work for Santa Elena |
Geochemical characterization of mine waste and geochemical modelling has been undertaken at the Santa Elena Mine and includes consideration for acid rock drainage (ARD) and metal leaching (ML) potential from the open pit, underground mine, ROM waste rock and plant tailings. This work was undertaken by Global Resource Engineering Ltd. (GRE, Breckenridge, 2009 and updated 2014). Testing has been completed in three phases, the first in 2006, the second in 2009, and most recently the third in 2014. Phase II of the program was based on preliminary findings in Phase I and includes additional analyses and measured analytes. Phase III characterized tailings material extract from test cases of the heap leach ore and the underground ore. The tests were tailored for placement of tailings as a dry stack.
Phase I & II (2006, 2009)
Mine waste material was characterized by a series of static tests, including acid base accounting (ABA), whole rock metals analyses and Synthetic Precipitation Leaching Procedure (SPLP). Testing was completed on a variety of lithological units defined as andesite. Apart from the mineralized andesite ore, the mine waste material considered for geochemical characterization include the following:
| § | Geo-thermally altered andesite near the mineralized zone - Andesite within the sulfide-rich halo |
| § | Unaltered andesite distant from the mineralized zone - Andesite outside the mineralized halo |
ABA testing has been completed on 42 samples. Results indicate that the andesite units inside and outside of the sulfide-rich halo are classified as potentially acid-generating (PAG) and that the andesite in the calcite-rich zones is net neutralizing. Samples from the sulfide-rich halo zone show a strong variance in net neutralization potential, with variable levels of sulfide and calcite present.
Whole Rock Metals analyses was completed on 14 samples. Results indicate that there is a significant difference in calcite concentrations between the various lithological groupings, and no significant difference in sulfide concentrations. Manganese was noted in elevated concentrations in select samples, and has also been noted in elevated levels in groundwater samples from site.
SPLP testing, with variable analyses measured, has been completed on a total of 42 samples. Results indicate that only concentrations of aluminium in the acid leachate are elevated. Key indicators of alkaline rock drainage, including arsenic, selenium and zinc were not noted at high concentrations.
Based on the results of the static testing, kinetic test cells were established to evaluate reaction kinetics and the potential time to onset of acidic conditions. Six samples were composited to form two kinetic test cells.
Geochemical modelling was undertaken to predict ARD/ML potential for the mine waste material over an extended period of storage on surface at the mine site. The geochemical model includes consideration for precipitation, surface water flow, reaction kinetics and geochemical reactions.
Kinetic test result and the experience of storing mine waste on surface at the mine site indicate that geochemical reactions at the site are slow. This is in large part due to the water supply and flow dynamics of the site. It is not expected that the mine waste material will generate acidic leachate or leachate with elevated metal concentrations. The current geochemical risk mitigation plan includes infiltration management to manage any leachate and runoff that may develop. The mitigation plan includes continual testing and monitoring as well as concurrent reclamation.
| | SANTA ELENA UPDATE TECHNICAL REPORT |
| | EFFECTIVE DATE: DECEMBER 31, 2014 |
| | |
Phase III
To accommodate changes to the mine plan including stacking of dry tailings on top of the existing waste rock facility, additional testwork was completed to characterize the geochemical reactivity of the tailings material, and compare predictive leachate metal concentrations to standards prescribed by SEMARNAT nom-127 SSA1-1994. Tailings material recovered from metallurgical testwork was collected as two composite samples, representing tailings produced from processed Pad Ore and tailings produced from processed Underground Ore.
The samples were submitted for static (ABA), whole rock (ICP/MS), metal mobility (SPLP and MWMP) and kinetic cell leachate tests. The results of the testwork indicate that the tailings material is comprised primarily of silica with abundant carbonate concentrations. Probability that tailings will produce ARD or significant alkaline metal leaching was considered low, however, it is noted that that some residual total cyanide and manganese in leachate may be present at levels below guideline values.
Due to the effects of season variability in precipitation between dry and wet seasons, a recommendation for a sediment pond was included for capture of ‘first flush’ runoff following early wet-season effluent from the dry stack tailings facility.
An independent Closure and Mine Reclamation Plan was created for the Santa Elena project in March, 2010, and updated in January, 2014, by Global Resource Engineering Ltd. (Breckenridge, 2010 & 2014). This initial plan incorporated study results from baseline environmental impact, water quality and geotechnical stability studies for the original open pit, processing and waste dump.
The updated plan in 2014 incorporates plans for earthworks in regards to topsoil placement on impacted grounds, earthworks for erosion control, demolition and removal of old buildings. A value of $3.9M was estimated to complete this work.
Consideration for mine closure, remediation and ongoing monitoring and stewardship activities are included within the economic model at an estimated value of $USD 6M. A revision to this closure plan is recommended.
| 21.0 | Capital and Operating Costs |
The capital and operating costs in this Technical Report are based on a combination of most recent operating data and budgetary estimates at the Santa Elena. SilverCrest considers the capital costs to be sustaining capital and are estimated to be US$26.1 million for the LOM. An additional $4.8 million has been included in the economics, for drilling which may result in increased resources and/or reserves.
SilverCrest has estimated the LOMP operating costs at an average of $46.85 per tonne of ore processed.
The sources of information for these costs include:
| § | Overall cost and equipment and materials for the processing plant |
| § | Underground design work for pre-production development costs and underground design for production |
| | SANTA ELENA UPDATE TECHNICAL REPORT |
| | EFFECTIVE DATE: DECEMBER 31, 2014 |
| | |
| § | Quotes from services, contractors and equipment suppliers |
| § | Equipment operating costs from equipment suppliers |
| § | SilverCrest financial reporting |
Santa Elena actual costs including most recent data on mining and processing cost, salaries, general and administrative costs (G and A), and consumables costs per unit
The sustaining capital costs have been entered into a sustaining capital cost schedule, which takes into consideration when the expense occurs, as well as lead times on equipment purchases and payment terms for equipment. As of December 31st, 2014, the new process facility and underground operations had been fully commissioned.
The operating costs reflects the cost per tonne of rock material handled to the processing plant or to surface, whether waste or mineralized material. The operating cost is divided into cost per tonne underground mining, cost per tonne processing and cost per tonne General and Administrative.
SilverCrest has collected information on the budgeted sustaining capital costs for the Santa Elena Mine, and used the most recent underground mine design to estimate the capital required to sustain the operation. Table 21.1 below shows a summary of the breakdown of the sustaining capital estimate. Total sustaining capital required including sustaining, direct and indirect and contingency but excluding sunk costs is estimated at $US 26.1 M.
Table 21.1: Sustaining Capital Cost Summary
| Capital cost table excluding exploration drilling expense1 |
| Year | 2015 | 2016 | 2017 | 2018 | 2019 | 2020 | 2021 | 2022 | Total mine life in $000 |
Site
infrastructure | $491,215 | $315,000 | $315,000 | $315,000 | $315,000 | $315,000 | $0 | $0 | $2,066 |
Process
sustaining
capital | $535,000 | $250,000 | $250,000 | $250,000 | $250,000 | $250,000 | $0 | $0 | $1,785 |
UG Waste
development
expenses | $4,773,168 | $6,091,603 | $4,130,922 | $1,090,862 | $0 | $0 | $0 | $0 | $16,087 |
Underground
Equipment
and
Infrastructure | $2,787,116 | $772,050 | $802,050 | $753,050 | $712,050 | $234,000 | $108,000 | $68,000 | $6,236 |
Total capital
costs2 | $8,586,499 | $7,428,653 | $5,497,972 | $2,408,912 | $1,277,050 | $799,000 | $108,000 | $68,000 | $26,174 |
1 Drilling costs are included in economic results but are not included in capital costs.
2 Does not include underground and surface drilling costs.
| | SANTA ELENA UPDATE TECHNICAL REPORT |
| | EFFECTIVE DATE: DECEMBER 31, 2014 |
| | |
| 21.1.1 | Site infrastructure |
SilverCrest has estimated sustaining capital expenditures for the site infrastructure as shown in table 21.1 based on recent costs and on expected costs that may include site vehicles, security, environmental expenses, general human resource expenses and laboratory equipment costs.
| 21.1.2 | Processing Capital Costs |
SilverCrest has estimated sustaining capital expenditures for the processing plant for the LOM based on the most recent records of operation and assessment of areas for further investment. The summary is shown in table 21.1 and will include the additional equipment purchases, tailings facility expansion, engineering procurement and construction management, as well as equipment for power generation.
| 21.1.3 | Underground Development |
SilverCrest has estimated the required pre-production and sustaining development required for the underground operations. This is summarized in Table 21.2.
Table 21.2: Underground waste development for remaining life of mine
Underground waste development | 2015 | 2016 | 2017 | 2018 | 2019 | 2020 | 2021 | 2022 | Total |
| Main Ramp (m) | 980 | 720 | 705 | 0 | 0 | 0 | 0 | 0 | 2,405 |
| Lateral (m) | 2,144 | 2,888 | 1,794 | 760 | 0 | 0 | 0 | 0 | 7,586 |
| Vertical (m) | 161 | 300 | 50 | 0 | 0 | 0 | 0 | 0 | 511 |
| Total meters | 3,286 | 3,908 | 2,549 | 760 | 0 | 0 | 0 | 0 | 10,503 |
Cost of development in
$000 | $4,773 | $6,091 | $4,130 | $1,090 | $0 | $0 | $0 | $0 | $16,087 |
Average cost per
meter | $1,453 | $1,559 | $1,620 | $1,435 | $0 | $0 | $0 | $0 | $1,532 |
| 21.1.4 | Underground Equipment and Infrastructure |
Mining equipment expenses for the LOM are based on purchases of equipment as summarized in the list below. The estimate of expense is based on the mining schedule, ventilation requirements, and general operational requirements including provision for ongoing mining related equipment expenses over the LOM.
Ongoing Mobile Equipment expenses and Equipment components include:
| § | Explosives cassette (transport) |
| | SANTA ELENA UPDATE TECHNICAL REPORT |
| | EFFECTIVE DATE: DECEMBER 31, 2014 |
| | |
SilverCrest has advised that the capital spent up to the December 31st, 2014, reached a total of US$106 million. These sunk costs have not been included in the economic analyses.
The estimation of operating costs by SilverCrest based on the most recent operational data and recent quotes has been undertaken by dividing the operation into five areas for costing, these are:
| § | Mining of the underground ore |
| § | Mining of the open pit ore |
| § | Mining of the reprocessing ore on the heap leach facility |
| § | Processing the ore estimated by SilverCrest in the LOM |
| § | General and Administrative (G and A) costs |
SilverCrest has summarized the mining costs in Table 21.3 below:
| | SANTA ELENA UPDATE TECHNICAL REPORT |
| | EFFECTIVE DATE: DECEMBER 31, 2014 |
| | |
Table 21.3: Operating Costs
| Mine Site Operating Costs in US$ |
| Year | 2015 | 2016 | 2017 | 2018 | 2019 | 2020 | 2021 | 2022 | Total mine life |
| Long hole stoping | $11,566,840 | $13,753,156 | $13,173,070 | $13,866,705 | $13,875,899 | $9,331,470 | $6,281,089 | $13,402,618 | $95,250,847 |
| Cut and fill stoping | $0 | $0 | $0 | $0 | $0 | $8,624,550 | $10,777,350 | $1,370,050 | $20,771,950 |
| Underground development | $2,156,234 | $2,324,082 | $2,262,312 | $1,903,009 | $374,711 | $0 | $0 | $0 | $9,020,348 |
| Open pit mining | $1,204,888 | $0 | $0 | $0 | $0 | $0 | $0 | $0 | $1,204,888 |
| Total mining costs | $14,927,963 | $16,077,237 | $15,435,381 | $15,769,714 | $14,250,610 | $17,956,020 | $17,058,439 | $14,772,668 | $126,248,033 |
| Total processing costs | $26,600,793 | $26,600,793 | $26,600,793 | $26,600,793 | $26,600,793 | $26,600,793 | $10,687,114 | $12,104,703 | $182,396,575 |
| G & A costs | $5,742,460 | $5,742,460 | $5,742,460 | $5,972,159 | $5,972,159 | $5,972,159 | $2,399,370 | $2,717,634 | $40,260,861 |
| Total mine site operating costs | $47,271,216 | $48,420,491 | $47,778,635 | $48,342,666 | $46,823,562 | $50,528,972 | $30,144,922 | $29,595,005 | $348,905,469 |
| U/G Mining cost per tonne UG mill feed | $30 | $30 | $30 | $29 | $29 | $36 | $39 | $30 | $33 |
| Open pit mining per tonne mill feed | $9.90 | | | | | | | | $9.90 |
| Overall mining per tonne mill feed1 | $13.74 | $14.80 | $14.21 | $14.52 | $13.12 | $16.53 | $39.09 | $29.89 | $16.95 |
| Process per tonne mill feed | $24.49 | $24.49 | $24.49 | $24.49 | $24.49 | $24.49 | $24.49 | $24.49 | $24.49 |
| G & A costs per tonne mill feed2 | $5.29 | $5.29 | $5.29 | $5.50 | $5.50 | $5.50 | $5.50 | $5.50 | $5.41 |
| Overall cost per tonne mill feed | $43.52 | $44.58 | $43.99 | $44.51 | $43.11 | $46.52 | $69.08 | $59.88 | $46.85 |
1 Overall mine costs exclude mining of spent or on the old heap leach facility. These costs are included in the processing operating costs.
2 G & A costs include the cost of employee profit sharing over life of mine
| | SANTA ELENA UPDATE TECHNICAL REPORT |
| | EFFECTIVE DATE: DECEMBER 31, 2014 |
| | |
| 21.2.1 | Underground Mining Cost Estimate |
Assumptions for Underground Mining Costs Estimation
The interim cost estimates for the Santa Elena underground are based on several assumptions. These assumptions include:
| § | Parts of the ore body that dip shallower than 55° cannot be mined by long hole stoping, and will be extracted using mechanized cut and fill, which has been deferred to the final periods of the LOM. |
| § | All underground development has been costed at $2,105/ m for the Main Ramp, $1,435/m for lateral and vertical development, as per recent quote by contractor on site. |
| § | Diesel cost is $0.95 / litre of diesel or $3.57 / gal. |
| § | Ammonium nitrate explosives is costed at $1.90/ kg of explosive, with emulsion or water gel cost at $3.49 per kg. |
| § | Underground haulage of ore is carried out by contractor using a 20 tonne truck and costs are already incorporated in the unit costs in Table 21.3 |
| § | The rock engineering work has been completed at the level required for PFS. |
Summary of mining operating costs for long hole stoping is shown in Table 21.4.
Table 21.4: Long Hole Mining Cost Summary (based on 2014 budget and actuals)
| Summary of estimated costs and cut-off grade calculation - Long Hole |
| | Long hole
stopes | Units |
| Salary staff1 | $1.35 | |
| Production labour | $3.35 | $/tonne |
| Drilling | $1.06 | $/tonne |
| Blasting (Explosives and Freight) | $2.06 | $/tonne |
| Loading | $2.02 | $/tonne |
| Service vehicle costs | $1.96 | $/tonne |
| Diesel Power GenSets | $3.98 | $/tonne |
| Diesel Mobile Equipment | $2.08 | $/tonne |
| Gen Sets Rental | $1.00 | $/tonne |
| Underground haulage ore Contractors2 | $2.65 | $/tonne |
| Bits & Steel | $2.99 | $/tonne |
| Maintenance labour | $1.76 | $/tonne |
| Maintenance Ore Production (Others) | $0.66 | |
| Laboratory Analyses | $0.20 | $/tonne |
| General & Tools & Others | $1.59 | |
Underground mining cost diluted ore per tonne
(including stope development- weighted average LOM) | $28.71 | $/tonne |
| | SANTA ELENA UPDATE TECHNICAL REPORT |
| | EFFECTIVE DATE: DECEMBER 31, 2014 |
| | |
Notes
| - | Currency is in US dollars |
| - | Price used for cut-off grade is US $1,300 for gold and $19.5 for silver, based on projected prices and recovery |
| - | Cut-off grades are presented as gold equivalent grades using a gold to silver ratio of 66.67:1 SilverCrest has undertaken costing for two mining methods, namely long hole stoping and mechanized cut and fill. . The costing has further been divided by stoping width, this has been done to provide for the fact that some costs are fixed per length of stope, whereas others are estimable per tonne regardless of the width of the stope. |
Summary of mining operating costs for mechanized cut and fill stoping is shown in Table 21.5
Table 21.5: Cut and Fill Cost Summary (based on 2014 budget and actuals)
| Summary of estimated costs and cut-off grade calculation - Cut and Fill |
| | | Units |
| Salary staff on mining1 | $1.35 | $/tonne |
| Production labour | $5.35 | $/tonne |
| Drilling | $3.82 | $/tonne |
| Blasting | $2.06 | $/tonne |
| Loading | $2.14 | $/tonne |
| Service vehicle costs | $2.96 | $/tonne |
| Power costs | $10.88 | $/tonne |
| Underground haulage ore2 | $2.65 | $/tonne |
| Backfilling of stopes3 | $8.56 | $/tonne |
| Bolting | $4.08 | $/tonne |
| Maintenance labour | $2.76 | $/tonne |
| General, Exploration & Tools | $3.39 | $/tonne |
| Underground mining cost diluted ore per tonne | $50.00 | $/tonne |
1 This includes salary staff over and above that already included in Santa Elena open pit operations which is costed under G and A
2 Underground haulage by contractor at an estimated contract rate of $45/hour for trucking which is averaged over the life of mine
3 Backfilling is considered to be done with waste rock and dry stack tailings, with up to 5% cement, hydraulic backfill may also be considered involving pulping underground
| | SANTA ELENA UPDATE TECHNICAL REPORT |
| | EFFECTIVE DATE: DECEMBER 31, 2014 |
| | |
| 21.2.2 | Costs for Loading and Transporting Existing Heap Leach Material to the Mill for Reprocessing |
SilverCrest has estimated the cost of loading and transporting the material on the existing heap leach pad to the mill for reprocessing. This cost is based on using a loader (by contractor, including 25% markup) to load the material onto grasshoppers (portable jump conveyors) which will deliver the material to the reprocess stockpile. Tables 21.6 to 21.8 show the heap leach reprocessing cost and assumptions.
Table 21.6: Reprocess Material Re-handling Cost
| Loader Cost |
| Fuel Consumption Rate | 0.04 | gallons/HP/hour |
| CAT 950K | 211 | HP |
Fuel Consumption per hour | 8.44 | gallons/hour |
| 32.07 | Litres/hour |
| Fuel Cost/Liter | $0.78 | $/L |
| Cost of Fuel per hour | $25.02 | $/hour |
| Labour Cost per hour | $8.00 | $/hour |
| Overhaul | *Costs taken from 2010 Costmine Estimators
Guide for 3.8 m3 Wheeled Loader. Converted to 2013 costs |
| Parts | $1.64 |
| Labour | $1.51 |
| Maintenance |
| Parts | $3.05 |
| Labour | $2.81 |
| Lube | $2.14 |
| Tires | $11.36 |
| Wear Parts | $0.39 |
| Loader Maintenance Cost/hour | $22.89 | $/hour |
| Total Cost per hour | $55.91 | $/hour total |
| Total Cost per Day | $782.73 | $/day |
| Final Cost per tonne | $0.39 | $/tonne |
| Contractor Cost per tonne | $0.49 | $/tonne |
| | SANTA ELENA UPDATE TECHNICAL REPORT |
| | EFFECTIVE DATE: DECEMBER 31, 2014 |
| | |
Table 21.7: Grasshopper Conveyor Costs
| Grasshopper Conveyor Operating Costs |
| Consumables/Grasshopper |
| Replacement Part | Cost/Unit | Replacements/Year | Cost |
| Motor | $2300/motor | 0.5 | $1,152 |
| Belt | $31/meter | 25 | $773 |
| Idlers | $210/Idler | 12 | $2,520 |
| Bearings | $164/Bearing | 4 | $656 |
| | | Total Consumables Cost | $5,101 |
| Electrical Cost |
| | 7.5 HP conversion to kW | 5.63 | kW |
| | Power Draw kWhr | 47.25 | kWhr |
| | Power Cost @ $0.22/kWhr | $10.40 | Cost/Day |
| | | Total Power Cost | $3,794 |
| | | Total Cost/Grasshopper | $8,895 |
| | | Cost for 10 Grasshopper | $88,949 |
| | | Cost/tonne | $0.12 |
Table 21.8: Material Handling Cost from Heap Leach to Mill
| Aspect | Value | Units |
| Front end loader to grasshopper | $0.49 | $/tonne |
| Grasshopper operating costs | $0.12 | $/tonne |
| Total Heap Leach to Processing Cost/tonne | $0.61 | $/tonne |
The total heap leach to processing cost/tonnes is incorporated in the processing operating costs when estimating processing costs for the material sourced from the heap leach pad.
| 21.2.3 | Processing Plant Operating Costs |
The proposed plant for Santa Elena was designed and built to process at a nominal rate of 3,000 tonnes of ore per day (1.1 million tonnes per year). Power is generated on site from diesel fuel. Reagent consumption is based on test work for the major consumables (Lime, Cyanide, etc.), but general experience for minor reagents (Zinc, DE etc.). Steel consumption in comminution is based on power consumption and other relationships established by FC Bond. Manpower levels and maintenance supplies are based on experience in similar operations. The breakdown of the estimates for processing cost is shown in Table 21.9.
| | SANTA ELENA UPDATE TECHNICAL REPORT |
| | EFFECTIVE DATE: DECEMBER 31, 2014 |
| | |
Table 21.9: Summary of Processing Costs (based on 2014 budgets and actuals)
| | US$/year | US$/Tonne |
| Crushing | 1,000,790 | 0.92 |
| Mill Stockpile | 177,918 | 0.16 |
| Milling | 2,168,001 | 2.00 |
| Mill Merrill Crowe | 942,279 | 0.87 |
| Power Gensets | 9,642,500 | 8.88 |
| Mill Filtering | 782,496 | 0.72 |
| Mill Tailings | 2,017,350 | 1.86 |
| Mill Refinery | 1,299,397 | 1.20 |
| Mill -CCD | 2,570,045 | 2.37 |
| Miscellany and Contingency | 6,600,000 | 5.51 |
| Total | | 24.49 |
The figures in Table 21.9 are averaged for the whole reserves (mined ore and reclaimed heap leach) for the LOM. Underground and Open Pit ore has to be crushed and the heap leach material doesn’t require crushing. Approximately 50% of the processing costs are Mexican Peso denominated and applying an exchange rate of MXN$ 14.50/USD1 for the LOM the weighted average total processing cost/tonne is US$24.49/t.
| 21.3 | Tailings Handling Costs |
SilverCrest has estimated, from experience, the cost of handling of tailings by from end loader, overland conveyor and a bull dozer onto the waste rock dump at $1.86 / tonne ore processed as indicated on the table 21.9 above.
| 21.4 | General and Administrative Operating Costs |
In order to assess the general and administrative costs associated with the cost of production, SilverCrest has reviewed the 2014 financial statements and the 2015 operational budget. It is the opinion of SilverCrest that the current and historic costs are a reflection of the expected costs for the existing operation. SilverCrest has determined that the operational cost framework for the base case G & A is roughly $5.41 per tonne with inflation and exchange adjustments / over the remaining mine life. SilverCrest expects that G & A will remain relatively constant, motivated by the following points:
| § | The current open pit and underground are operated by contractor mining, and therefore much of the skilled staff required for mining are included in the G and A cost and not the mining cost. At the underground operations the contractor is handling ore development, while at the open pit mainly blasting and hauling ore. |
| § | The operational scenario applicable to the Santa Elena include the most recent costs relative to current operations, therefore additional costs are included in the mining and /or processing cost. |
G & A costs for the remaining mine life have been estimated at $5.74 Million per year.
| | SANTA ELENA UPDATE TECHNICAL REPORT |
| | EFFECTIVE DATE: DECEMBER 31, 2014 |
| | |
SilverCrest prepared an economic evaluation of the Santa Elena operations based on a pre-tax financial model and post-tax economic results. The analyses are based on Q24 2014 US dollars. No gearing or adjustment for inflation/currency gap is assumed. This economic analyses includes current Sandstorm agreement terms (see section 4.3). Note that Sandstorm’s participation in the underground production is no longer pending. This economic analyses does not include sunk costs for all expenses applicable to the Santa Elena expansion up to the 31th of December 2014.
| 22.2 | Technical Assumptions |
Technical-Economic assumptions used in the analyses are summarized in Table 22.1.
Currency exchange rates are based on six months trailing averages (June to November 2014) and also using the most recent data on forecasted exchange rates between Mexican Pesos US Dollar for the period of the LOMP is also applied in the economic analyses.
Refinery costs, as described in Section19.1, reflect actual contract terms and include provision for freight and marketing costs.
Income tax is calculated at a rate of 30% on operating profit less depreciation, applicable loss-carry forwards, deduction for historic exploration pool, Mexican royalty paid, environmental fee and employee profit share payments. Employee profit share is included in the G&A and is structured according to current SilverCrest operations.
Table 22.1: Technical-Economic Modeling Assumptions
| Parameter | Value |
| Markets: | |
| Gold Price1 | US$1,250/troy-oz(2015), US$1275/troy-oz (2016), US$1300/troy-oz (2017-2022) |
| Silver Price1 | US$18.00/troy-oz(2015), US$19.00/troy-oz (2016), US$20,00 (2017), US$21,00(2018-2022) |
| Currency Exchange CDN:US$2 | 1.00:1.00 |
| Currency Exchange US$:MEX$2 | 1.00:13.25 |
| Refinery Terms: | |
| Gold | Pay for 99.85%, US$ x/payable oz |
| Silver | Pay For 99.85%, US$ y/payable oz |
| Financing: | |
| Analyses Basis | Q4 2014 US dollars |
| Gearing | None |
| Income Tax Rate | 30% |
| Depreciation | 10-year, Straight Line |
| i. | metal prices assumptions during the LOMP |
| ii. | Based on 6 months trailing average (as of December 01, 2014) and rounded –off to two decimals. Costs adjusted to reflect the impact of the forecasted exchange rate US$:MEX$ during the LOMP |
| | SANTA ELENA UPDATE TECHNICAL REPORT |
| | EFFECTIVE DATE: DECEMBER 31, 2014 |
| | |
| 22.3 | Summary of Economic Results |
The pre-tax and post-tax economic analyses results for the base case are shown in table 22.2.
Table 22.2: Base Case Economic Analyses Results
| Aspects of Economic Analyses | Units | Value | Per Au oz eq produced | Per Ag oz eq produced |
| Production |
| Gold Sold post refinery | k.oz | 270 | | |
| Silver Sold post refinery | k.oz | 12,650 | | |
| Gold Eq ounces | k.oz | 460 | | |
| Silver Eq ounces | k.oz | 30,690 | | |
| Revenue |
| Gold Sales | US$’000 | $301,080 | | |
| Silver Sales | US$’000 | $253,450 | | |
| Gross Sales | US$’000 | $554,530 | | |
| Operating Expenses |
| Underground mining* | US$’000 | $125,040 | 365.5 | 5.48 |
| Open pit mining** | US$’000 | $1,200 | 82.9 | 1.24 |
| | | | | |
| Processing | US$’000 | $182,400 | 396.21 | 6.06 |
| G&A | US$’000 | $40,260 | 87.46 | 1.34 |
| Total Operating Costs*** | US$’000 | $348,900 | 757.9 | 11.6 |
| | | | | |
| Freight & Refining | US$’000 | $5,750 | 12.48 | 0.19 |
| Pre-tax Economic Results |
| Operating Margin | US$’000 | $205,620 | 446.7 | 6.83 |
| Capital Costs | US$’000 | -$30,960 | -67.3 | -1.03 |
| Mine closure costs | US$’000 | -$6,000 | -13.0 | -0.2 |
| Pre-tax cash flow | US$’000 | $162,930 | 353.9 | 5.41 |
| Pre-tax NPV 5% | US$’000 | $143,840 | 298.4 | 4.6 |
| Post-tax Economic Analyses Results |
| Environmental Fee | US$’000 | $3,050 | -6.62 | -0.10 |
| Mexican Royalty | US$’000 | $7,200 | -15.63 | -0.24 |
| Income Taxes | US$’000 | $19,000 | -41.29 | -0.63 |
| Cash Flow post tax | US$’000 | $133,670 | 290.4 | 4.44 |
| Post tax NPV 5% | US$’000 | $119,170 | 248.2 | 3.8 |
* Operating cost per AuEq oz reflects only ounces produced from ore sourced from underground operation.
** Operating cost per AuEq oz reflects only ounces produced from ore sourced from open pit operation.
*** Operating cost per AuEq oz. sold varies between $624 and $994 over the life of mine, with an average of US$758 for the LOM. Operating cost per AG EQ oz. sold varies between $9.13 and $15.5 over the life of mine, with an average of US$11.6 for the LOM.
| | SANTA ELENA UPDATE TECHNICAL REPORT |
| | EFFECTIVE DATE: DECEMBER 31, 2014 |
| | |
The economic analyses includes processing of 121kt of ore from open pit in 2014 with ore being processed in the current 3,000 tpd milling facility The economics also includes blending of spent ore (heap leach pad reserves) with underground ore at a rate ranging from 46% to 54% with average LOM blending participation of spent ore of 45%.The heap leach pad reserves are restated as ofDecember 31, 2014, to reflect material already processed in the processing plant in 2014.
The economic analyses considers SilverCrest delivering 54,133 ounces of gold to Sandstorm Gold Ltd. (“Sandstorm”) at an average price of $412 per ounce ($350 to $450 per ounce with annual 1% inflationary increases) under the Sandstorm Purchase Agreement (the “Purchase Agreement”) executed on May 14, 2009. The Purchase Agreement includes an option for Sandstorm to participate in the Santa Elena underground mine, which Sandstorm had elected to exercise in February 2014. The Purchase Agreement only applies to the original Santa Elena concessions and excludes recent regional acquisitions.
The post-tax economic model was established on a 100% equity basis, excluding debt financing and loan interest charges. The post-tax economic results of the base case are compared to roughly the spot price in the last week of December 2014 in Table 22.3 below.
Table 22.3: Comparison of Base Case Post Tax Results used in the PFS with Spot Price Post Tax Results at mid-December 2014
| | Item | Base Case | Spot Price Mid Dec 2014 |
| Gold Price (US$/oz) | variable * | $1,193 |
| Silver price (US$/oz | variable* | $16.16 |
| Pre tax | | | |
| DCF NPV @ 5.0% in millions | $143.8 | $84.3 |
| DCF NPV @ 7.0% in millions | $137.4 | $81.2 |
| Post tax | | | |
| DCF NPV @ 5.0% in millions | $119.2 | $76.3 |
| DCF NPV @ 7.0% in millions | $114.2 | $73.7 |
| | | |
Figure 22.1 shows the pre-tax and post-tax cash flows. The peak cash flow occurs in sixth year of operation when higher underground production is achieved and higher grades are being mined in the schedule.
| | SANTA ELENA UPDATE TECHNICAL REPORT |
| | EFFECTIVE DATE: DECEMBER 31, 2014 |
| | |
Figure 22.1: Pre-tax and Post-tax Cash Flows
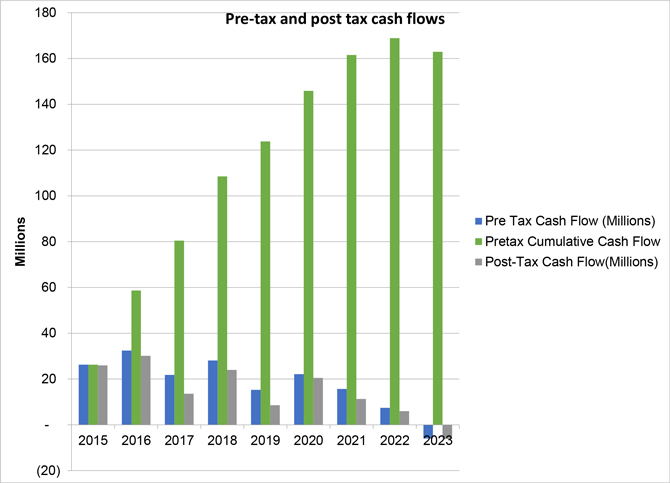
| 22.5 | Post - tax Results and Sensitivity Analyses |
The post-tax model has been developed by SilverCrest, using current information on taxable income, mining royalties, environmental fees and depreciation in Mexico. The following assumptions have been used in development of the after tax model:
| § | A tax rate of 30%, with allowances for deduction of mining tax royalty, environmental fees and historical exploration costs pool; |
| § | An environmental tax of 0.5%. |
| § | Mining Tax Royalty of 7.5% with allowance for deduction of depreciation, concession fees; |
| § | Any employee profit share is included in the G & A and is structured according to current SilverCrest operations; |
| § | Depreciation has been deducted from taxable earning as straight-line depreciation over 8 years using the most recent information from SilverCrest operations and financial statements; and |
| | SANTA ELENA UPDATE TECHNICAL REPORT |
| | EFFECTIVE DATE: DECEMBER 31, 2014 |
| | |
| § | A total of $15.6 million in losses have been carried forward in the financial model for taxable income assessment. |
The base case as shown Table 22.3 above is used as the base case for the sensitivity analyses. The sensitivities are determined by initially determining which key variable the project is most sensitive to and then selecting those for further analyses. In the case of the Santa Elena Mine, these are in order of most sensitive to least sensitive; gold and silver price, operating and capital cost. The key variables are adjusted from -20% to +20%. The results for NPV and are IRR shown in Figures 22.2 and 22.3. Tables 22.4 shows the cash flow analyses used to derive the post-tax sensitivities.
To evaluate the economic performance of the future operations, the production schedule was incorporated into the 100% equity pre-tax economic model to develop annual recovered metal production from the relationships of tonnage processed, head grades, and recoveries.
All costs and revenues were assumed to occur at the end of each year in which they were scheduled to occur.
Gold and silver payable values were calculated based on base case metal price and exchange rate. Unit operating costs for mining, processing and G&A were applied to cumulative annual mined or processed tonnages, to determine the overall operating cost, which was deducted from the revenues to derive annual operating cash flow. Operating cash flows are totalled into annual cash flows, and the economic analyses was run on annual cash flows.
Initial and sustaining capital costs were incorporated on a year-by-year basis over the LOM and SilverCrest most recent annual budget. Closure costs been included in the analyses. Capital expenditures were then deducted from the operating cash flow to determine the net cash flow before taxes.
Sustaining capital expenditures presented in this study include costs forecasted for the mining and process facility additions, equipment replacement, including budgeted costs for underground drilling exploration.
The undiscounted annual net cash flow (NCF) and cumulative net cash flow (CNCF) are shown in Figure 22.1
| | SANTA ELENA UPDATE TECHNICAL REPORT |
| | EFFECTIVE DATE: DECEMBER 31, 2014 |
| | |
Table 22.4: Discounted Post Tax Cash Flow Model
| Discounted cash flow model |
| | Units | Total | Year 1 | Year 2 | Year 3 | Year 4 | Year 5 | Year 6 | Year 7 | Year 8 | Year 9 |
| Operating revenue | $ | 554,527,648 | 85,112,344 | 89,754,119 | 76,356,734 | 80,099,910 | 64,473,862 | 74,687,590 | 46,630,434 | 37,412,654 | - |
| | | | | | | | | | | | |
| Dore transport and selling costs | $ | (5,746,591) | (988,273) | (985,630) | (795,475) | (783,703) | (631,492) | (737,754) | (459,762) | (364,501) | - |
| | | | | | | | | | | | |
| Operating costs | $ | (348,905,469) | (47,271,216) | (48,420,491) | (47,778,635) | (48,342,666) | (46,823,562) | (50,528,972) | (30,144,922) | (29,595,005) | - |
| | | | | | | | | | | | |
| Operating Profit | $ | $205,622,179 | $37,841,128 | $41,333,629 | $28,578,099 | $31,757,244 | $17,650,300 | $24,158,618 | $16,485,512 | $7,817,649 | $0 |
| | | | | | | | | | | | |
| Sustaining Capital | $ | -$30,957,353 | -$10,619,766 | -$7,928,653 | -$5,997,972 | -$2,908,912 | -$1,777,050 | -$1,299,000 | -$358,000 | -$68,000 | $0 |
| | | | | | | | | | | | |
| Closure costs | $ | -$6,000,000 | - | - | - | - | - | - | - | - | -$6,000,000 |
| | | | | | | | | | | | |
| Pre-tax cash flow | $ | $162,918,234 | $26,233,090 | $32,419,345 | $21,784,651 | $28,064,629 | $15,241,757 | $22,121,864 | $15,667,750 | $7,385,148 | -$6,000,000 |
| | | | | | | | | | | | |
| Mining Royalty & Env Fee | $ | -$10,243,638 | -$275,000 | -$1,868,562 | -$2,170,771 | -$1,307,784 | -$1,794,500 | -$751,369 | -$1,282,438 | -$606,152 | -$187,063 |
| | | | | | | | | | | | |
| Income Tax Payable | $ | -$19,006,000 | - | -$398,000 | -$6,051,000 | -$2,779,000 | -$4,907,000 | -$902,000 | -$3,136,000 | -$833,000 | - |
| | | | | | | | | | | | |
| Post-tax cash flow | $ | $133,668,596 | $25,958,090 | $30,152,783 | $13,562,881 | $23,977,845 | $8,540,258 | $20,468,495 | $11,249,312 | $5,945,995 | -$6,187,063 |
| | | | | | | | | | | | |
| Discount Rate | % | | 5% | | | | | | | | |
| Pre-tax NPV | $ | | 143,842,956 | | | | | | | | |
| Post-tax NPV | $ | | 119,170,354 | | | | | | | | |
**** Capital costs included in the economics are $26.1 million mine site capital plus $4.8 million for exploration totalling $30.1 million
| | SANTA ELENA UPDATE TECHNICAL REPORT |
| | EFFECTIVE DATE: DECEMBER 31, 2014 |
| | |
Figure 22.2: NPV Sensitivity Analyses
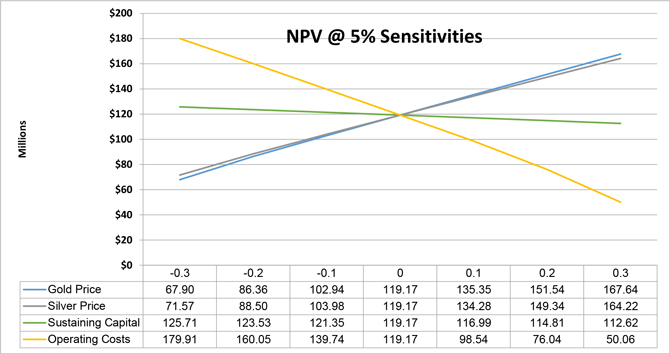
| | SANTA ELENA UPDATE TECHNICAL REPORT |
| | EFFECTIVE DATE: DECEMBER 31, 2014 |
| | |
Figure 22.3: Gold and Silver Recoveries NPV Sensitivity Analyses
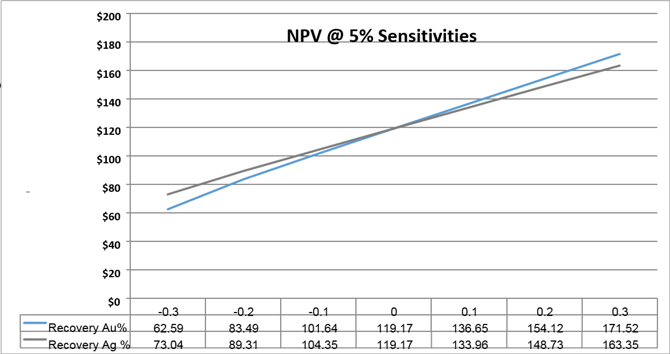
For the gold and silver recoveries, there is a small difference when comparing the NPV sensitivity impact when varying each recovery.
On May 14, 2009, SilverCrest entered into a definitive Purchase Agreement with Sandstorm Gold Ltd. under which Nusantara agreed to sell 20% of future gold production from the Santa Elena open pit to Sandstorm, up to 50,000 ounces of gold, in exchange for an Upfront Deposit of $USD 12,000,000. The agreement also provides for ongoing per-ounce payments by Sandstorm equal to the lesser of $350 and the prevailing spot gold market price upon delivery of gold. The per ounce price of $USD 350 is subject to an increase of 1% per annum commencing on the 3rd anniversary of the date that Santa Elena Project began commercial production (i.e. July 2014). The agreement also contemplates an Underground Mine Option from Sandstorm Gold Ltd. for the Santa Elena Mine, where Sandstorm would make an additional upfront deposit of US$10 million to SilverCrest on or before March 17, 2014 and it would continue to make ongoing per ounce payments of US$350 until 50,000 ounces of gold have been delivered to Sandstorm at which time the payments will increase to US$450 per ounce of gold. On February 25, 2014 Sandstorm exercised the Underground Mine Option for the Santa Elena underground mine. The economic analyses incorporates the adjustment of the per ounce payment to US$450 once SilverCrest complete delivery of a total of 50,000 ounces to Sandstorm.
Santa Elena is an operating mine and currently sells gold and silver as part of ongoing operations SilverCrest, has added a cost to account for smelter and refinery costs.
| | SANTA ELENA UPDATE TECHNICAL REPORT |
| | EFFECTIVE DATE: DECEMBER 31, 2014 |
| | |
There are no adjacent properties to report.
| 24.0 | Other Relevant Data and Information |
There is no other relevant data to report.
| 25.0 | Interpretation and Conclusions |
| 25.1 | Geology and Underground Resource Estimate |
The Santa Elena vein system (MMZ) is a low sulphidation quartz-calcite epithermal vein striking in E-NE and dipping between 45-75° to the south. The principal trend of mineralization has a rake of approximately 25° to the southeast and has been delineated to a depth of approximately 475 metres below surface. Gold and silver grades are constrained within the main quartz vein with some additional mineralization noted in stringers and quartz breccia along the hanging wall and footwall contacts of the veins. The metal grades are zoned with silver proportions increasing with depth.
The deposit is strongly oxidized at surface and down to depths of at least 150 metres below surface. However, weak to moderate alteration associated with disseminated fine grained pyrite is noted where northwest trending structures cross-cut the MMZ. The oxide zone transitions at depth to sulphide bearing visible argentite noted in new excavated underground development.
| 25.2 | Underground Reserves and Mining Methods |
Underground probable reserves of 3.98 million tonnes at an average grade of 3.1 gpt gold equivalent (see Section 15.7 for equivalency determination) have potential for economic extraction at current metal prices. A combination of long hole stoping (89%) and mechanized cut and fill (11%) methods will be suitable for underground mining.
| 25.3 | Costs and Project Economic |
SilverCrest has estimated that approximately $31 million in sustaining capital investment is required to continue with production over the life of mine, this including contingency over the life of mine. Operating costs are estimated to be approximately $758 per ounce of gold equivalent and $11.6 per ounce silver equivalent. At the base case metal prices the estimated post tax net present value estimate of the operation is roughly $119 million at a discount rate of 5%.
| 26.1 | Geology and Underground Resource Estimate |
| 26.1.1 | Risks and Opportunities |
Mineralization within the southeasterly plunging trend has been well delineated by the recent 2013-2014 drilling campaigns; however, more drilling is required in preparation for underground mining. Additional drilling on the property should aim to test and confirm the following items:
| § | Delineation drilling along the eastern strike extent of the MMZ between the 600 and the 400 metre level elevation to delineate trends with elevated grades and increase resource classification for blocks in this area, |
| | SANTA ELENA UPDATE TECHNICAL REPORT |
| | EFFECTIVE DATE: DECEMBER 31, 2014 |
| | |
| § | Infill drilling on 15 to 25 metre centres within the current Indicated resource for production zones in years 4 and beyond to upgrade block model confidence for underground mining, |
| § | Accurately delineate the distribution of sulphide bearing mineralization and the transition from near surface oxide to un-oxidized material at depth as this change in mineralogy may have a significant impact of metal recoveries, |
| § | Dedicated drilling within the El Cholugo zone (I & II) to add more resources and upgrade current resource to reserve, and |
| § | Conduct detailed underground mapping to assist in determining control and orientation of high grade mineralization trends and ore shoots. |
| 26.2 | Geotechnical Recommendation |
Geotechnical recommendations are split into two sections for this Update to Pre-Feasibility report:
| § | Key recommendations to improve stope size. |
| § | Geotechnical considerations in overall mine design. |
| 26.2.1 | Stope Size and Pillar Dimensioning |
| 26.2.1.1 | Hanging wall and orebody NGI-Q values |
| § | Due to the apparent degradation of rock mass quality within the hangingwall as observed in new underground development, further mapping and geotechnical drilling is recommended. This apparent degradation could create overly conservative stope design parameters. |
| 26.2.1.2 | Joint set orientation |
Joint set orientation can play a key role in stope stability. The orientation data at Santa Elena is limited with six orientated holes gleaning a limited number of measurements to gain joint set data for stope layout.
| § | Further joint set measurements can be taken through consistent geotechnical mapping of the ore zone and hanging wall during mining activities. |
| § | Further orientated boreholes can be undertaken during subsurface and surface exploration. |
| 26.2.1.3 | In-situ stress regime |
The in-situ stress regime at Santa Elena needs clarification as the stress regime has been assumed at Pre-Feasibility level.
| § | It is advised that in-situ stress analyses be conducted at Santa Elena in order to determine principal stress magnitude and trajectory and horizontal to vertical stress ratio. This should be done in order to maximize ore extraction and minimize support cost to local rather than regional zones based on the in-situ stress regime. |
| 26.2.2 | Geotechnical Considerations in Overall Mine Design |
| § | As the orebody varies in dip and dip direction and thickness, both along strike and down dip, it is strongly advised that three dimensional geotechnical analyses be conducted on the orebody once the stress regime and rock deformation characteristics have been determined. This can be advantageous to mine sequencing, backfill addition and pillar recovery in order to further maximize ore extraction. |
| | SANTA ELENA UPDATE TECHNICAL REPORT |
| | EFFECTIVE DATE: DECEMBER 31, 2014 |
| | |
| § | This PFS does not consider the interaction between the pit and the proposed underground stopes. This should be reviewed now that a new LOMP is available. |
| 26.3 | Metallurgical Testing |
| § | Further Metallurgical test work is recommended to better understand and predict silver recoveries for underground ore. |
| § | Increased silver recovery work, combined with geologic recommendations on grade control and mineralogy, and should consist of: optimizing mill grind size, increasing cyanide rates, oxidation injection, use of lead nitrate, flotation after leaching, pebble mill usage, re- heap leaching of mill tailing based on a longer retention time. |
| 26.4 | Breakdown of costs for future work |
| § | SilverCrest has estimated the costs for completion of the above recommended studies as summarized in the Table 26.1 below: |
Table 26.1: Breakdown of future costs related to recommendations
| Recommendation | Future work | Estimated cost |
| Geology and Underground Resources | An infill drilling program consisting of roughly 20,000m of drilling | $4.70 million |
| Geotechnical Recommendations | Geotechnical design study for underground | $ 200,000 |
| Metallurgical Test work | Grinding, CN rates, oxidation, PbNO3, retention timing for better silver recoveries | $ 100,000 |
| Total future costs related to recommendations | $ 5 million |
Note that since Santa Elena is an operating mine, much of the above work is ongoing or is being undertaken in house with current in house equipment and expertise.
| | SANTA ELENA UPDATE TECHNICAL REPORT |
| | EFFECTIVE DATE: DECEMBER 31, 2014 |
| | |
references
Aguirre-Díaz, G., and McDowell, F., 1991, The volcanic section at Nazas, Durango, Mexico, and the possibility of widespread Eocene volcanism within the Sierra Madre Occidental: Journal of Geophysical Research, v. 96, p. 13,373–13,388.
Aguirre-Díaz, G., and McDowell, F., 1993, Nature and timing of faulting and synextensional magmatism in the southern Basin and Range, central-eastern Durango, Mexico: Geological Society of America Bulletin, v. 105, p. 1435–1444.
Alaniz-Alvarez and Nieto-Samaniego, A.F., 2007, the Taxco-San Miguel de Allende fault system and the Trans-Mexican Volcanic Belt: Two tectonic boundaries in central Mexico active during the Cenozoic, in Alaniz-Alvarez, S.A and Nieto-Samaniego, A.F., ed., Geology of Mexico: Celebrating the Centenary of the Geological Society of Mexico: Geological society of America special Paper 422, p. 301-316.
Anderson, T. A., and Schmidt, V. A., 1983, The evolution of Middle America and the Gulf of Mexico-Caribbean Sea during Mesozoic time: Geological Society of America Bulletin, v. 9, p. 941–966.
Barr, P.J.F, Chow, J., Allard, G. and Wallis, C.S. 2011.NI 43-101 Technical Report Reserve Update for the Santa Elena Open Pit and Preliminary Assessment for the Santa Elena and Cruz de Mayo Expansion Project Sonora, Mexico. Prepared for SilverCrest Mines Ltd, Effective Date; April 1st, 2011.
Barton, N.R., Lien, R. and Lunde, J. 1974. Engineering classification of rock masses for the design of tunnel support. Rock Mech. 6(4), 189-239. Global Resource Engineering (2011).
Breckenridge, L., 2013 Asset Retirement Obligation Calculation, Technical Report, Global Resources Engineering, January 30, 2014.
Breckenridge, L., Geochemical Characterization of Tailings, Technical Memo, Global Resources Engineering, September 30, 2014.Bieniawski, Z.T. 1976. Rock mass classification in rock engineering. In exploration for rock engineering, proc. of the symp., (ed. Z.T. Bieniawski) 1, 97-106. Cape Town: Balkema.
Campa, M. F., and P., Coney, 1983, Tectonostratigraphic terranes and mineral resources distribution in Mexico: Canadian Journal of Earth Sciences, v. 20, p. 1040–1051.
Carter, 1990) or Carter, T.G. (1992), ..A new approach to Surface Crown Pillar Design, Proc. 16th Can. Rock Mechanics Symposium, Sudbury, pp. 75-83.
Clark, L.M. and Pakalnis, R.C. (1997). An Empirical Design Approach for Estimating Unplanned Dilution from Open Stope Hanging walls and Footwalls. Proceedings of the 99th AGM - CIM. Vancouver, pp. 25.
Davis, B., 2015. Santa Elena Resource Model Audit and Comment.
EBA, A Tetra Tech Company, Santa Elena Expansion Pre-Feasibility Study and Open Pit Reserve Update, Effective Date: April 30, 2013, Amended Date: March 4, 2014.
Ferrari, L. Valencia-Moreo, M., Bryan, S., (2007), Magmatism and tectonics of the Sierra Madre Occidental and its relation with the evolution of the western margin of north America, p. 1-29; in Geology of Mexico: Celebrating the Centenary of the Geological Society of Mexico, The Geological Society of America, Special Paper 422, 2007, edited by Susana A. Alaniz-Alvarez and Angel F. Nieto-Samaniego; 465pp.
Fier, E.N, and Wallis, C.S., 2007, Technical Report On The Cruz De Mayo Property, Sonora Mexico, Prepared For SilverCrest Mines Inc. December 10, 2007.
Fier, E. N., 2009, Technical Report On The Santa Elena Property, Sonora Mexico, Prepared For SilverCrest Mines Inc., February 15, 2009.
Golder & Associates. 2015. Santa Elena Mine – Life of Mine plan Completed Work Summary.
Index Mundi. >http://www.indexmundi.com/<. Accessed May 20th 2013.
| | SANTA ELENA UPDATE TECHNICAL REPORT |
| | EFFECTIVE DATE: DECEMBER 31, 2014 |
| | |
Johnson, C. M., 1991, Large-scale crust formation and lithosphere modification beneath middle to late Cenozoic calderas and volcanic fields, Western North-America: Journal of Geophysical Research, v. 96, p. 13485–13507.
Lang, B., 1994, Span Design for entry type excavations, MASC Thesis, University of British Columbia, Vancouver, BC.
Mathews, K.E. et al., 1981, Prediction of stable excavation spans for mining at depths below 1000m in hard rock, CAMMET) Report DSS Serial No. OSQ80-00081.
Mining Cost Service. 2012. Costmine Infomine USA, Inc.
Nieto-Samaniego, A.F., Alaniz-Alvarez, S.A., and Camprubi, A. (2007), Mesa Central of Mexico: Stratigraphy, structure, and Cenozoic tectonic evolution, p. 41-70; in Geology of Mexico: Celebrating the Centenary of the Geological Society of Mexico, The Geological Society of America, Special Paper 422, 2007, edited by Susana A. Alaniz-Alvarez and Angel F. Nieto-Samaniego; 465pp.
Prosser, B.S and Wallace K.G 1999. Practical Values of Friction Factors. Mine Ventilation Services, Inc. (MVS)
Potvin, Y., M. Hudyma, H.D.S. Miller, 1988, Design guidelines for open stope support, CIM Bulletin, vol. 82, No. 926, June, pp. 53-62.Nickson (1992)
Rogers, John J.W et.al 2004. Continents and Supercontinents. Chapter 6. p85.
Wark, D. A., Kempter, K. A., and McDowell, F. W., 1990, Evolution of waning subduction-related magmatism, northern Sierra Madre Occidental, Mexico: Geological Society of America Bulletin, v. 102, p. 1555–1564.
| | SANTA ELENA UPDATE TECHNICAL REPORT |
| | | | EFFECTIVE DATE: DECEMBER 31, 2014 |
| | |
Appendix A
Qualified Person Certificates
| | SANTA ELENA UPDATE TECHNICAL REPORT |
| | | | EFFECTIVE DATE: DECEMBER 31, 2014 |
| | |
Certificate of qualified person – Nathan Eric Fier
I, Nathan Eric Fier, do hereby declare that:
| 1. | I currently reside in Mission, British Columbia, Canada, and am currently the President and Chief Operating Officer for SilverCrest Mines Inc. My office address is Suite 501, 570 Granville Street, Vancouver, BC, V6C 3P1. |
| 2. | I hold two Bachelors of Science degrees in Geological Engineering (1984) and Mining Engineering (1986) from Montana Tech, Butte, Montana. |
| 3. | I am a member in good standing in the Association of Professional Engineers and Geoscientists of British Columbia (APEGBC), member # 135165, (APEGSK), member # 23381 and a Certified Professional Geologist registered with the American Institute of Professional Geologists (AIPG, USA) member # 10622. |
| 4. | I am an author and Qualified Person (within the meaning of National Instrument 43-101) responsible for the preparation of the Technical Report entitled: |
“UPDATE TO SANTA ELENA PRE-FEASIBILITY STUDY, SONORA, MEXICO”
Effective Date: December 31, 2014
| 5. | I am responsible for ALL sections |
| 6. | As a Qualified Person for this report, I have read the National Instrument 43-101 and Companion Policy and confirm that the sections of this report for which I am responsible have been prepared in compliance to National Instrument 43-101. |
| 7. | I have visited the Santa Elena property on numerous occasions betweenJanuary 2005 to December 2014. |
| 8. | I have worked on numerous related properties over 28 years of worldwide geologic and mining experience including but not limited to; |
| a. | Various Technical Reports on Santa Elena Property, Mexico – low sulfidation epithermal deposit (LSED). |
| b. | Technical Report on Cruz de Mayo Property, Mexico – LSED. |
| c. | Technical Report on San Marcial Property, Mexico – LSED. |
| d. | Due Diligence on Gold Road Property, Arizona – LSED. |
| e. | Technical Report on La Joya Property, Mexico – Skarn. |
| f. | Development manager for the La Colorada and La Trinidad mines, Mexico – LSED. |
| g. | Technical Report on El Zapote Property, El Salvador – Breccia Pipe. |
| h. | Technical Report on El Ocote Property, Honduras – Breccia Pipe. |
| i. | Work on several Carlin-type gold deposits – Gold Quarry, Betze-Post, Leeville. |
| j. | Work on several Copper-gold-moly porphyry deposits – Batu Hijau, Endako. |
| 9. | I am not independent of SilverCrest Mines as independence is described in Section 1.5 of the National Instrument 43-101. In addition I am currently a shareholder of SilverCrest and am I directly entitled to financially benefit from its success. |
| 10. | Prior to this report, I have had extensive prior involvement on the Santa Elena property including multiple previous Technical Reports, exploration, development, construction and production. |
| 11. | To the best of my knowledge, information and belief, as of the effective date of the Technical Report, the Technical Report contains all scientific and technical information that is required to be disclosed to make the Technical Report not misleading. |
Dated this March 31, 2015,
Original signed and sealed by
“N. Eric Fier”