Exhibit 99.1
Q1 FY2016 Financial Results PresentationOctober 14, 2015
Forward-Looking Statements Notice Regarding Forward Looking StatementsThis presentation contains forward-looking statements within the meaning of the Private Securities Litigation Reform Act of 1995. All statements regarding AngioDynamics’ expected future financial position, results of operations, cash flows, business strategy, budgets, projected costs, capital expenditures, products, competitive positions, growth opportunities, plans and objectives of management for future operations, as well as statements that include the words such as “expects,” “reaffirms,” “intends,” “anticipates,” “plans,” “believes,” “seeks,” “estimates,” “optimistic,” or variations of such words and similar expressions, are forward-looking statements. These forward looking statements are not guarantees of future performance and are subject to risks and uncertainties. Investors are cautioned that actual events or results may differ from AngioDynamics’ expectations. Factors that may affect the actual results achieved by AngioDynamics include, without limitation, the ability of AngioDynamics to develop its existing and new products, technological advances and patents attained by competitors, future actions by the FDA or other regulatory agencies, domestic and foreign health care reforms and government regulations, results of pending or future clinical trials, overall economic conditions, the results of on-going litigation, the effects of economic, credit and capital market conditions, general market conditions, market acceptance, foreign currency exchange rate fluctuations, the effects on pricing from group purchasing organizations and competition, the ability of AngioDynamics to integrate purchased businesses, as well as the risk factors listed from time to time in AngioDynamics’ SEC filings, including but not limited to its Annual Report on Form 10-K for the year ended May 31, 2015. AngioDynamics does not assume any obligation to publicly update or revise any forward-looking statements for any reason. In the United States, the NanoKnife System has received a 510(k) clearance by the Food and Drug Administration for use in the surgical ablation of soft tissue, and is similarly approved for commercialization in Canada, the European Union and Australia. The NanoKnife System has not been cleared for the treatment or therapy of a specific disease or condition.EmboMedics microsphere products have not been reviewed by the U.S. Food and Drug Administration or any other international regulatory body at this time; as such they are currently not available for sale by AngioDynamics.Notice Regarding Non-GAAP Financial MeasuresManagement uses non-GAAP measures to establish operational goals, and believes that non-GAAP measures may assist investors in analyzing the underlying trends in AngioDynamics’ business over time. Investors should consider these non-GAAP measures in addition to, not as a substitute for or as superior to, financial reporting measures prepared in accordance with GAAP. In this presentation, AngioDynamics has reported non-GAAP sales growth, non-GAAP gross margin, non-GAAP operating income, adjusted EBITDA (income before interest, taxes, depreciation and amortization), non-GAAP net income and non-GAAP earnings per share. Additionally, this press release evaluates results on a constant currency basis. As a non-GAAP measure, constant currency excludes the impact of foreign currency exchange rate fluctuations. Management uses these measures in its internal analysis and review of operational performance. Management believes that these measures provide investors with useful information in comparing AngioDynamics’ performance over different periods. By using these non-GAAP measures, management believes that investors get a better picture of the performance of AngioDynamics’ underlying business. Management encourages investors to review AngioDynamics’ financial results prepared in accordance with GAAP to understand AngioDynamics’ performance taking into account all relevant factors, including those that may only occur from time to time but have a material impact on AngioDynamics’ financial results. Please see the tables that follow for a reconciliation of non-GAAP measures to measures prepared in accordance with GAAP. *
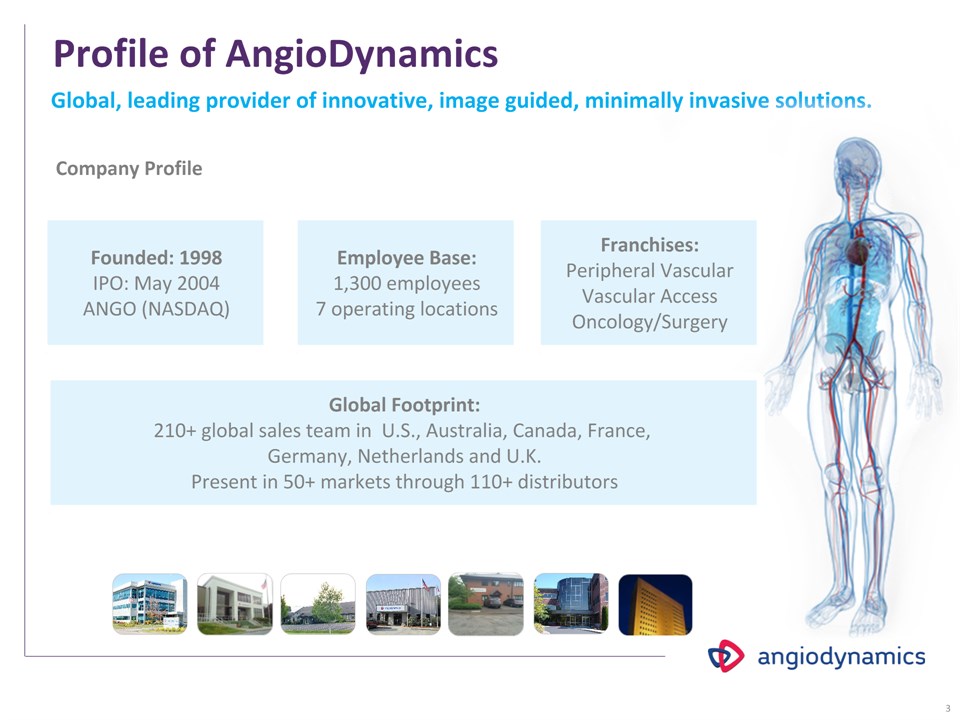
Profile of AngioDynamics Global, leading provider of innovative, image guided, minimally invasive solutions. Company Profile * Franchises:Peripheral VascularVascular AccessOncology/Surgery Founded: 1998IPO: May 2004ANGO (NASDAQ) Employee Base:1,300 employees7 operating locations Global Footprint:210+ global sales team in U.S., Australia, Canada, France, Germany, Netherlands and U.K.Present in 50+ markets through 110+ distributors
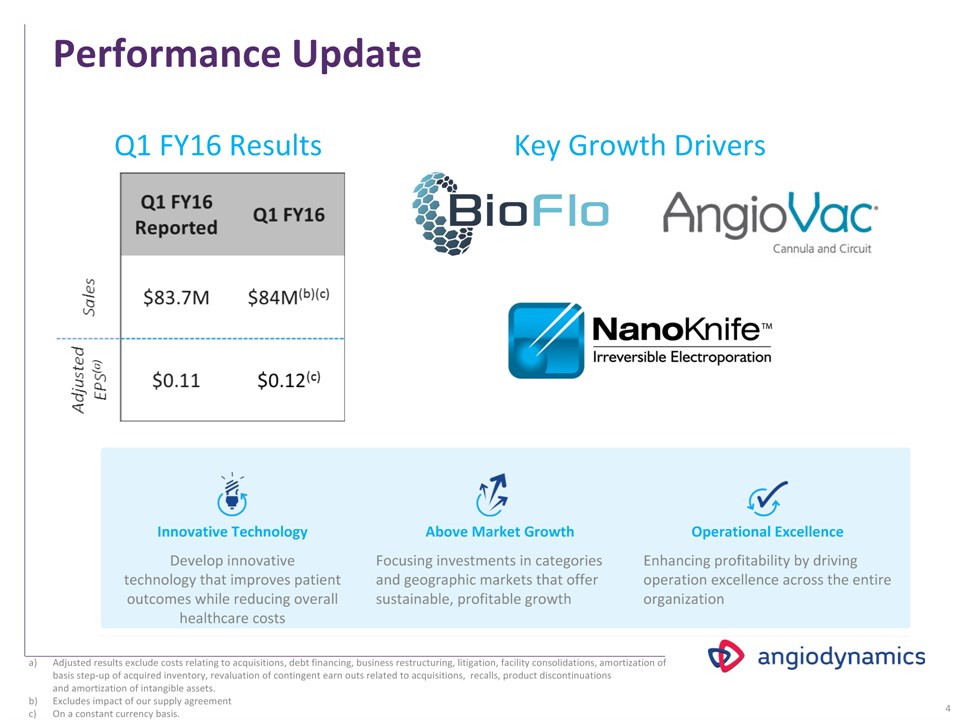
Performance Update * Adjusted results exclude costs relating to acquisitions, debt financing, business restructuring, litigation, facility consolidations, amortization of basis step-up of acquired inventory, revaluation of contingent earn outs related to acquisitions, recalls, product discontinuations and amortization of intangible assets.Excludes impact of our supply agreement On a constant currency basis. Q1 FY16 Results Innovative Technology Above Market Growth Operational Excellence Develop innovative technology that improves patient outcomes while reducing overall healthcare costs Focusing investments in categories and geographic markets that offer sustainable, profitable growth Enhancing profitability by driving operation excellence across the entire organization Key Growth Drivers

Leadership Joseph M. DeVivoPresident & CEO Mark FrostEVP & CFO John SotoEVP & CCO Stephen TrowbridgeSVP & General Counsel Barbara KucharczykSVP, Operations Mark StephensSVP, Administration Gary BarrettSVP, RA/QA * Benjamin DavisSVP, Business Development
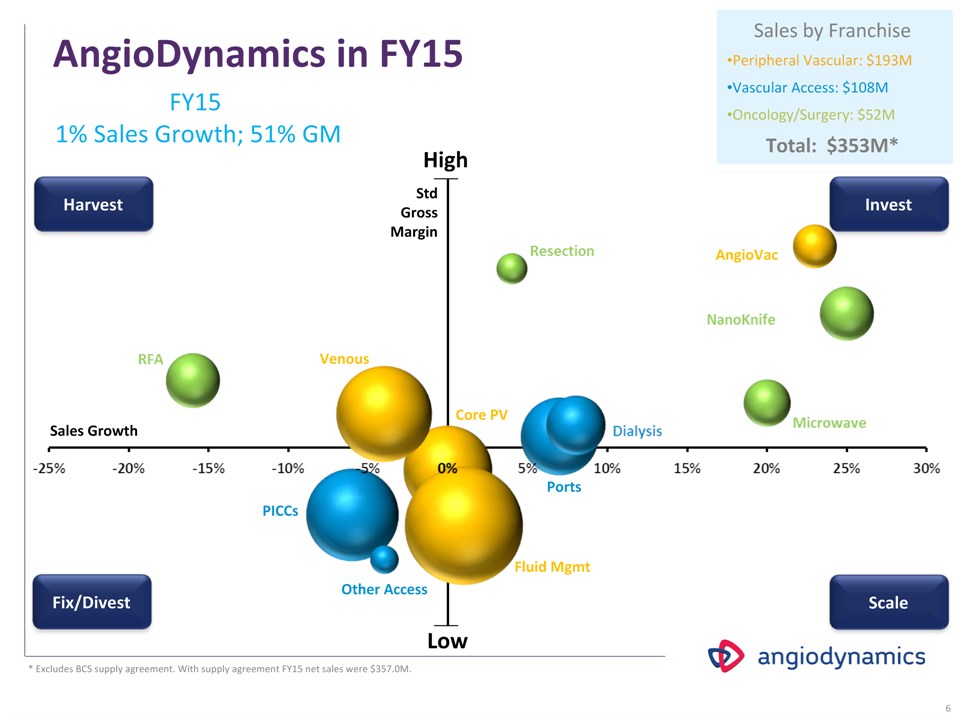
* Ports PICCs Other Access Core PV Fluid Mgmt Venous AngioDynamics in FY15 AngioVac FY15 1% Sales Growth; 51% GM Sales by FranchisePeripheral Vascular: $193MVascular Access: $108MOncology/Surgery: $52MTotal: $353M* Sales Growth High Low StdGrossMargin Harvest Fix/Divest Invest Scale * Excludes BCS supply agreement. With supply agreement FY15 net sales were $357.0M.

Implement near term product family consolidation / elimination opportunitiesTarget indirect procurement supplier consolidation and processesCompress Queensbury shift structure through deployment of Operational Excellence and CapexRe-align manufacturing organizational leadership Site consolidation:Queensbury repurposed as Distribution Center for NY regionProducts moved from Queensbury to Glens Falls Manchester as center of excellence for Hardware, Disposables and PortsComprehensive product family consolidationDirect procurement consolidation Phase 3 - PLANNING Global distribution strategyAssess global manufacturing footprintSelective off shoring – e.g. Costa Rica, Malaysia, Singapore Phase 2 – EXECUTING Phase 1 - COMPLETE OpEx Net Savings Per Year $ in millions INPROCESS INPROCESS INPROCESS INPROCESS INPROCESS INPROCESS INPROCESS Operational Improvements Plan and Impact *
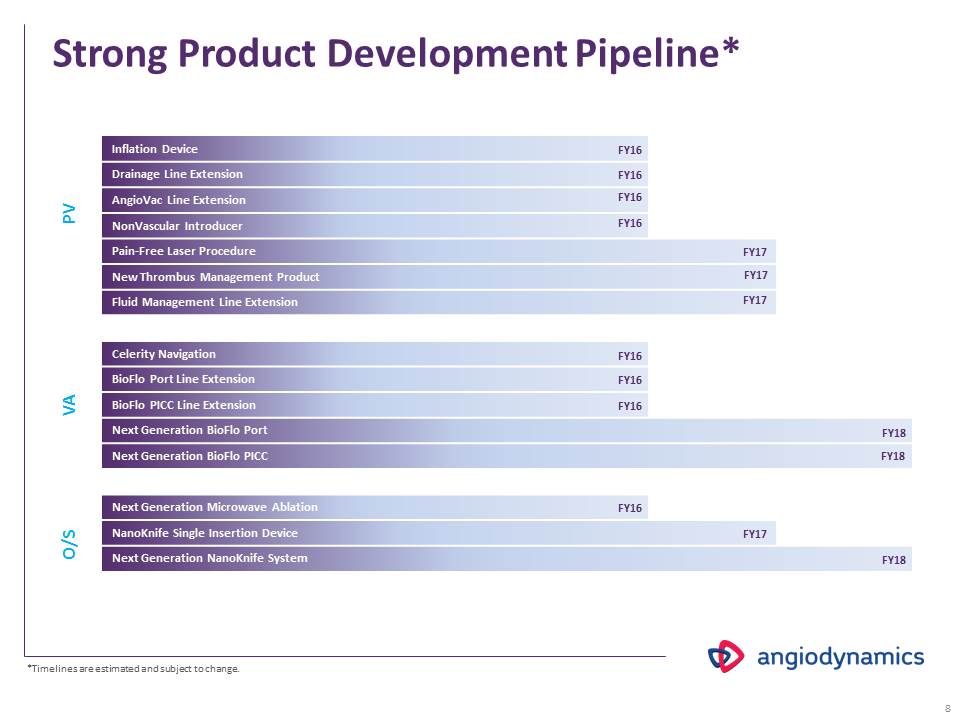
* FY16 FY16 FY16 FY16 FY16 FY16 FY16 FY17 FY17 FY17 FY18 FY18 FY18 Strong Product Development Pipeline* *Timelines are estimated and subject to change. FY16 FY17
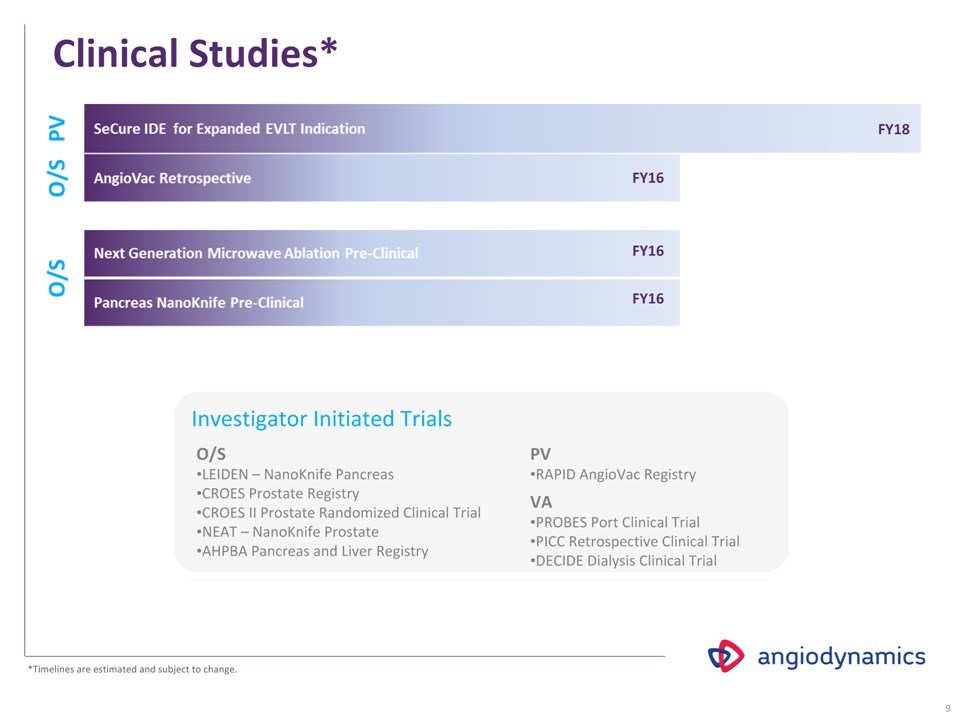
* FY18 FY16 Clinical Studies* O/SLEIDEN – NanoKnife Pancreas CROES Prostate Registry CROES II Prostate Randomized Clinical TrialNEAT – NanoKnife Prostate AHPBA Pancreas and Liver Registry Investigator Initiated Trials PVRAPID AngioVac Registry VAPROBES Port Clinical TrialPICC Retrospective Clinical TrialDECIDE Dialysis Clinical Trial *Timelines are estimated and subject to change. FY16 FY16
Resection Core PV Dialysis NanoKnife AngioVac PICCs FluidMgmt Ports Other Access Microwave RFA Venous Sales Growth StdGrossMargin High Low AngioDynamics in FY20 FY209% 5YR Sales CAGR; 59% GM Sales by FranchisePeripheral Vascular: ̴$271.5MVascular Access: ̴$173.5MOncology/Surgery: ̴$108.0MTotal: ̴$553M Embolics *
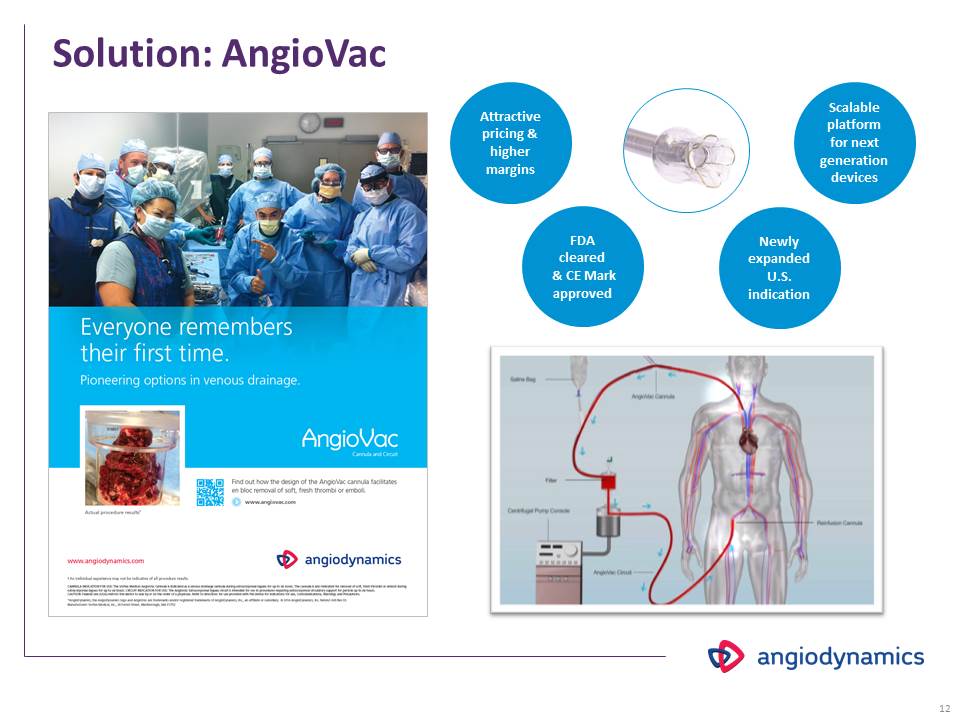
Peripheral Vascular Franchise * $1.6B Market 12% Share $ in millions Q1 FY16 YoY Growth FY15 YoY Growth Fluid Mgmt. $19 -9% 1% Venous $12 4% -4% Thrombus Mgmt. $4 14% 5% Other Core Products $12 4% 0% Total PV $47 0% 0% Recent Events:Next generation AngioVac launchedUCLA initiated RAPID, a multicenter, prospective registry of real world AngioVac use SeCure clinical trial launched for expanded EVLT indication

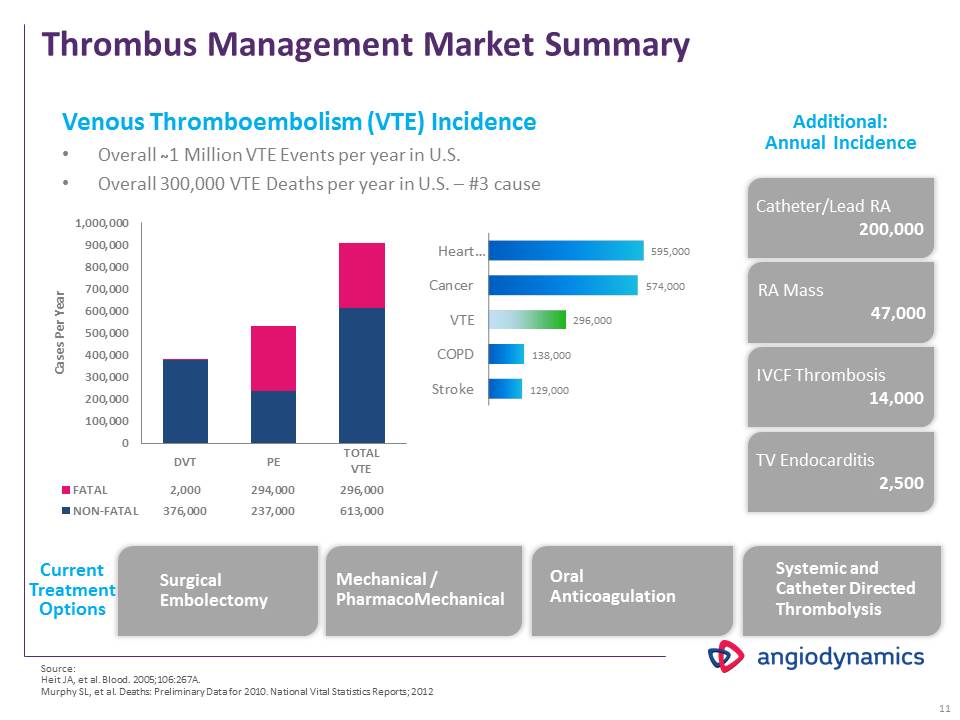
Source:Heit JA, et al. Blood. 2005;106:267A.Murphy SL, et al. Deaths: Preliminary Data for 2010. National Vital Statistics Reports; 2012 Thrombus Management Market Summary Additional:Annual Incidence Catheter/Lead RA200,000 RA Mass47,000 IVCF Thrombosis14,000 TV Endocarditis2,500 Surgical Embolectomy Mechanical / PharmacoMechanical Oral Anticoagulation Systemic and Catheter Directed Thrombolysis CurrentTreatmentOptions Venous Thromboembolism (VTE) Incidence Overall ̴̴1 Million VTE Events per year in U.S.Overall 300,000 VTE Deaths per year in U.S. – #3 cause *
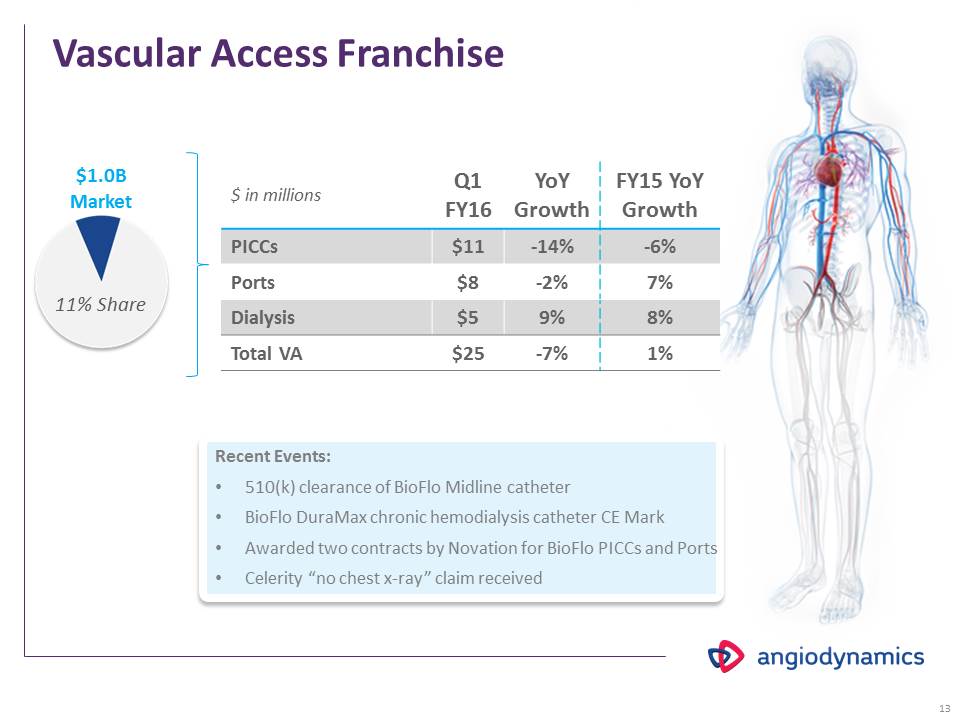
Vascular Access Franchise * $1.0B Market 11% Share $ in millions Q1 FY16 YoY Growth FY15 YoY Growth PICCs $11 -14% -6% Ports $8 -2% 7% Dialysis 5 9% 8% Total VA $25 -7% 1% Recent Events:510(k) clearance of BioFlo Midline catheterBioFlo DuraMax chronic hemodialysis catheter CE MarkAwarded two contracts by Novation for BioFlo PICCs and PortsCelerity “no chest x-ray” claim received
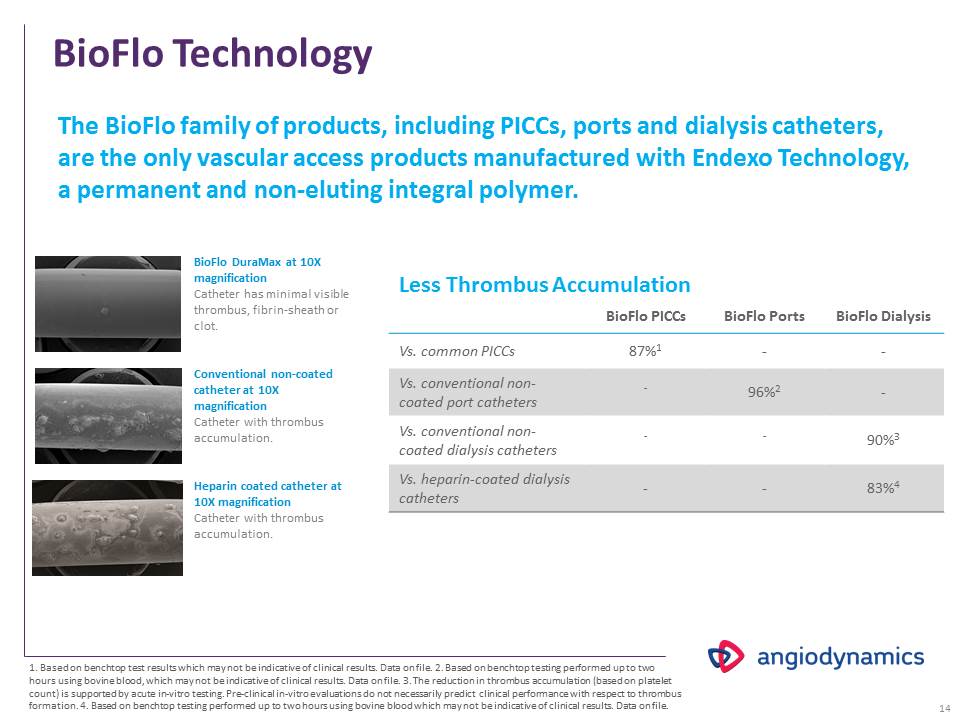
BioFlo Technology The BioFlo family of products, including PICCs, ports and dialysis catheters, are the only vascular access products manufactured with Endexo Technology, a permanent and non-eluting integral polymer. 1. Based on benchtop test results which may not be indicative of clinical results. Data on file. 2. Based on benchtop testing performed up to two hours using bovine blood, which may not be indicative of clinical results. Data on file. 3. The reduction in thrombus accumulation (based on platelet count) is supported by acute in-vitro testing. Pre-clinical in-vitro evaluations do not necessarily predict clinical performance with respect to thrombus formation. 4. Based on benchtop testing performed up to two hours using bovine blood which may not be indicative of clinical results. Data on file. * BioFlo PICCs BioFlo Ports BioFlo Dialysis Vs. common PICCs 87%1 - - Vs. conventional non-coated port catheters - 96%2 - Vs. conventional non-coated dialysis catheters - - 90%3 Vs. heparin-coated dialysis catheters - - 83%4 Less Thrombus Accumulation BioFlo DuraMax at 10X magnificationCatheter has minimal visible thrombus, fibrin-sheath or clot.Conventional non-coated catheter at 10X magnificationCatheter with thrombus accumulation.Heparin coated catheter at 10X magnificationCatheter with thrombus accumulation.

Reducing Healthcare Costs Facility 1 1,251 BioFlo PICCs placed85% reduction in symptomatic UEDVT 7 UEDVTs reported from 1251 PICCsUEDVT rate of .45% versus prior 3.1% Facility 2272 BioFlo PICCs placed42% reduction in Occlusions19.7% reduction in baseline occlusion rate Facility 3776 BioFlo PICCs placed65% reduction in tPA use47% reduction in occlusionsFacility 41,212 BioFlo PICCs placed65% reduction in declots36% reduction in DVTs Clinical Results* *Clinical results were publicly reported by independent facilities based upon their individual clinical experience. These results do not reflect data gathered by AngioDynamics pursuant to a clinical trial. Individual results may vary from those set forth above. Facility 5533 BioFlo PICCs placed66% reduction on occlusions75% reduction in tPA25% reduction in DVTs *
Celerity Tip Location Tip location, coupled with our innovative BioFlo Technology, will improve our competitive position in the PICC market. Ease of use Use with existing ultrasound Three lead EKG-based platformPredictable and reliable confirmation 50% less cost vs. competitors Clinical efficacy Cost effective Fall 2013: Canadian Launch March 6, 2014: Acquired regulatory control over Celerity platform and rights to next generation technology Mid-summer 2014: U.S. Clearance Fall 2014: File for no x-ray Winter 2014/15: No x-ray clearance Winter 2016: Navigation * 
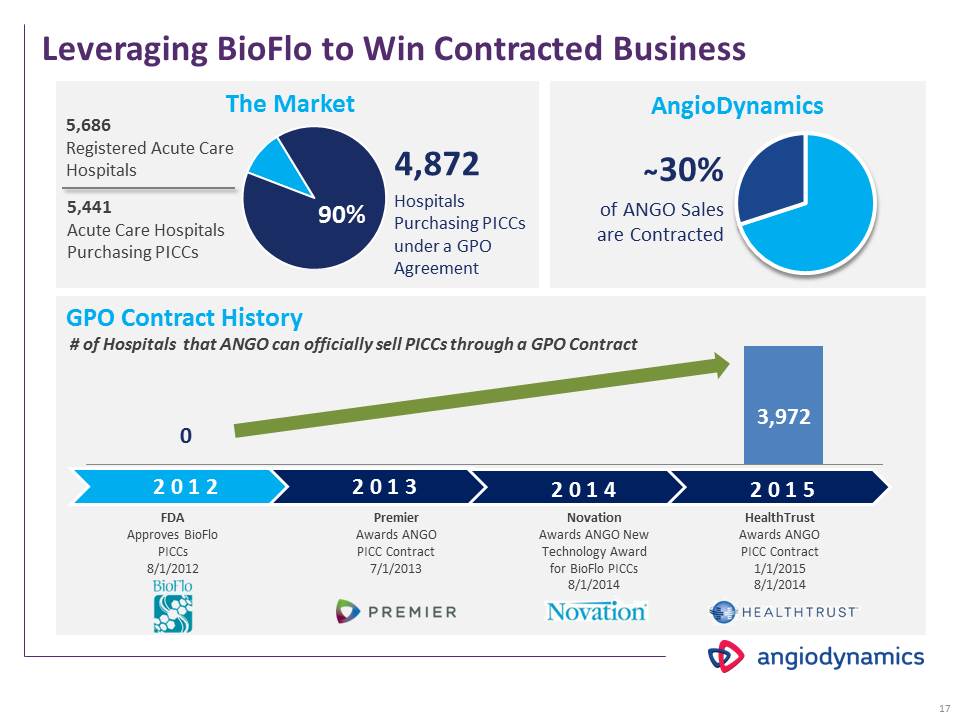
Leveraging BioFlo to Win Contracted Business The Market ̴30% of ANGO Sales are Contracted AngioDynamics 2 0 1 2 2 0 1 3 2 0 1 4 2 0 1 5 Novation Awards ANGO New Technology Award for BioFlo PICCs8/1/2014 Premier Awards ANGO PICC Contract 7/1/2013 HealthTrust Awards ANGO PICC Contract 1/1/20158/1/2014 FDA Approves BioFlo PICCs8/1/2012 4,872Hospitals Purchasing PICCs under a GPO Agreement 90% 5,686Registered Acute Care Hospitals 5,441Acute Care Hospitals Purchasing PICCs GPO Contract History 3,972 # of Hospitals that ANGO can officially sell PICCs through a GPO Contract 0

Oncology/Surgery Franchise * $225M Market 22% Share $ in millions Q1 FY16 YoY Growth FY15 YoY Growth Thermal Ablation $7 5% -3% NanoKnife $3 -20% 25% Resection/Other $1 -33% 4% Total O/S $11 -9% 6% Recent Events:Dr. Robert Martin, Director of Surgical Oncology, published pancreatic cancer study in the Annals of Surgery510(k) clearance of NanoKnife System generator and FDA issued certificates to Foreign Governments (CFGs)First patient treated in CROES NanoKnife prostate cancer trialEmboMedics Agreement136 total NanoNnife installs as of Aug. 31, 2016

Expanding Leadership in Tissue Ablation THERMAL NON-THERMAL AngioDynamics offers a full complement of tissue ablation products that provide clinicians maximum choice in treating patients. *
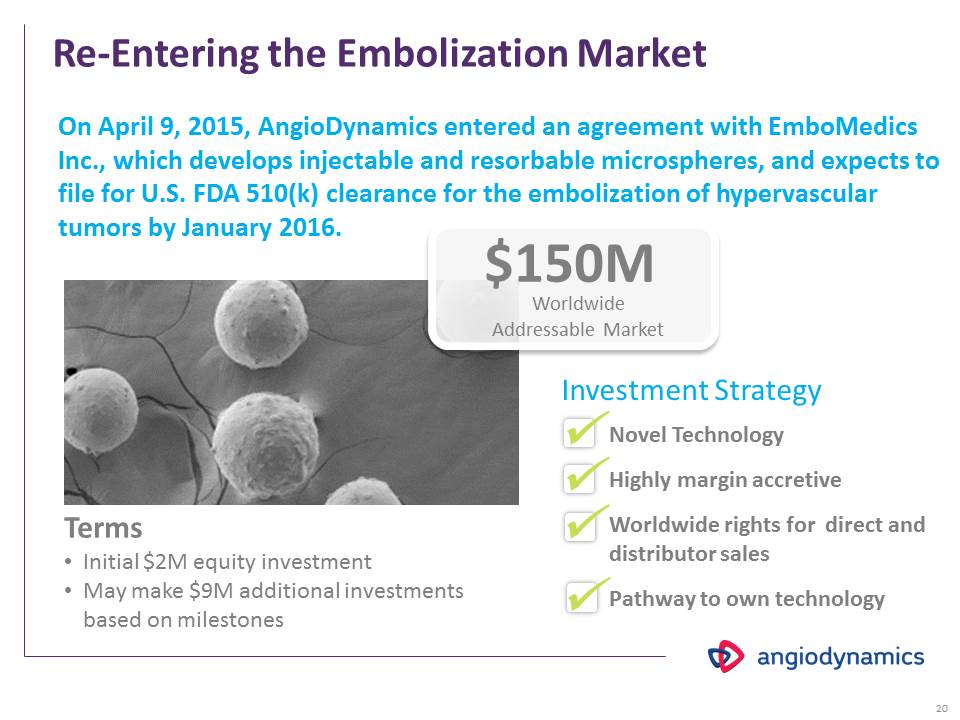
Re-Entering the Embolization Market On April 9, 2015, AngioDynamics entered an agreement with EmboMedics Inc., which develops injectable and resorbable microspheres, and expects to file for U.S. FDA 510(k) clearance for the embolization of hypervascular tumors by January 2016. Novel Technology Highly margin accretive Worldwide rights for direct and distributor sales Pathway to own technology * Investment Strategy Terms Initial $2M equity investmentMay make $9M additional investments based on milestones $150M WorldwideAddressable Market
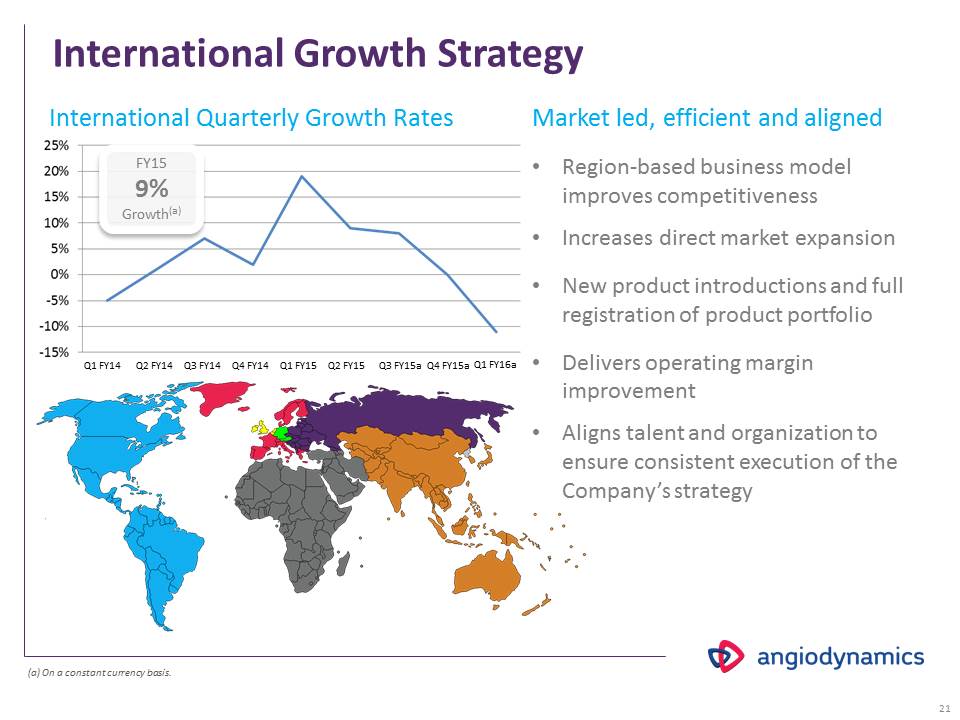
International Growth Strategy Market led, efficient and aligned Region-based business model improves competitivenessIncreases direct market expansionNew product introductions and full registration of product portfolioDelivers operating margin improvementAligns talent and organization to ensure consistent execution of the Company’s strategy * International Quarterly Growth Rates FY159%Growth(a) (a) On a constant currency basis. Q1 FY14 Q2 FY14 Q3 FY14 Q4 FY14 Q1 FY15 Q2 FY15 Q3 FY15a Q4 FY15a Q1 FY16a
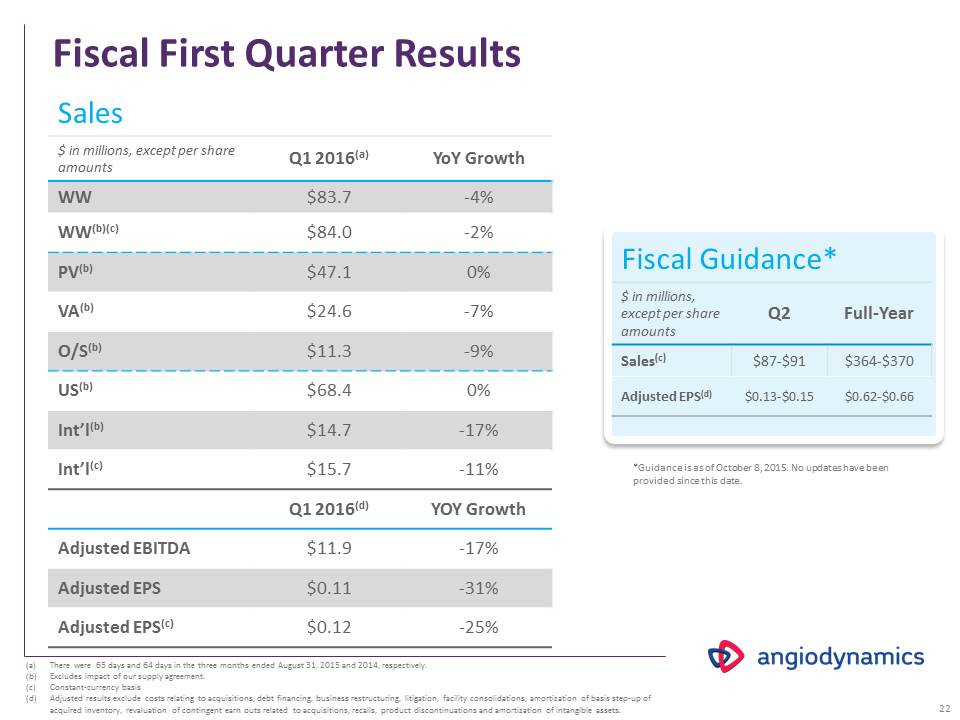
* Sales $ in millions, except per share amounts Q1 2016(a) YoY Growth WW $83.7 -4% WW(b)(c) $84.0 -2% PV(b) $47.1 0% VA(b) 24.6 -7% O/S(b) $11.3 -9% US(b) $68.4 0% Int’l(b) $14.7 -17% Int’l(c) $15.7 -11% Q1 2016(d) YOY Growth Adjusted EBITDA $11.9 -17% Adjusted EPS $0.11 -31% Adjusted EPS(c) $0.12 -25% Fiscal First Quarter Results There were 65 days and 64 days in the three months ended August 31, 2015 and 2014, respectively.Excludes impact of our supply agreement.Constant-currency basisAdjusted results exclude costs relating to acquisitions, debt financing, business restructuring, litigation, facility consolidations, amortization of basis step-up of acquired inventory, revaluation of contingent earn outs related to acquisitions, recalls, product discontinuations and amortization of intangible assets. Fiscal Guidance* Fiscal Guidance* Fiscal Guidance* $ in millions, except per share amounts Q2 Full-Year Sales(c) $87-$91 $364-$370 Adjusted EPS(d) $0.13-$0.15 $0.62-$0.66 *Guidance is as of October 8, 2015. No updates have been provided since this date.
AngioDynamics Transformation On a pro forma basis prior year sales for AngioDynamics and Navilyst Medical were $344.6 million.Excludes impact of our supply agreement.Constant-currency basis Investor Profile Major acquisitions – Navilyst (2012), Vortex Medical (2012), Microsulis (2013)Disruptive technology in PV, VA and O/S markets with strong product pipelineSignificant international opportunityOperational Excellence Program in place to drive margin expansionEmerging GPO presence Net Sales FY20 Net Sales$553M59%Gross Margin * FY11 FY12 FY13 FY14 FY15 Net Sales $216M $222M $342M $354M $357M Reported Growth 0% 3% 54% 4% 1% Pro Forma 0% 3% -1%(a) 4% 1% Adjusted Growth - - - 5%(b) 2%(b)(c)
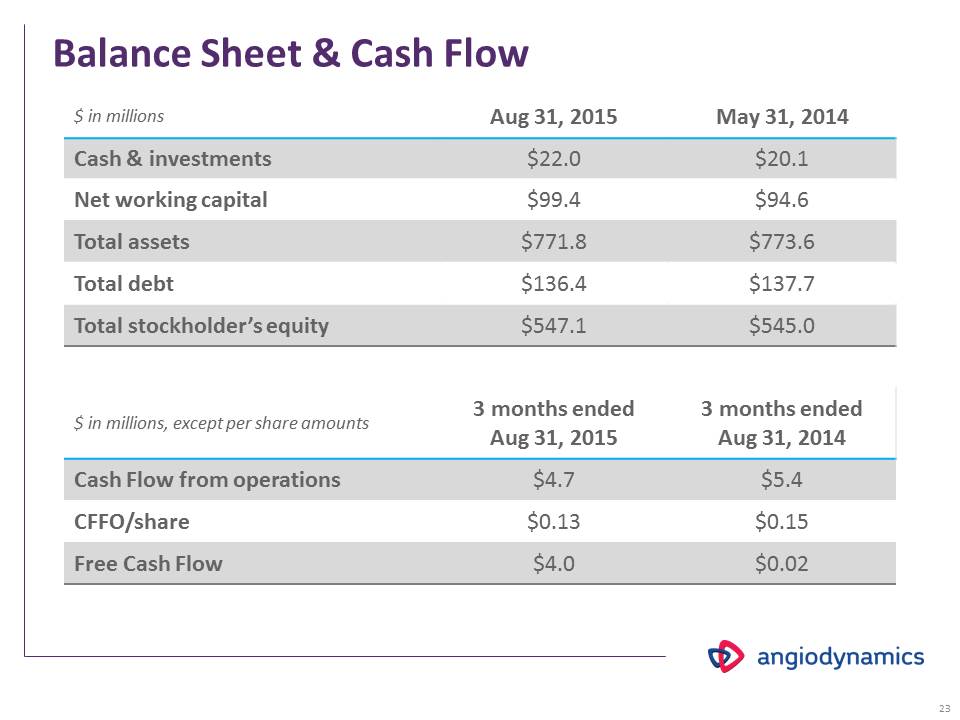
* $ in millions Aug 31, 2015 May 31, 2014 Cash & investments $22.0 $20.1 Net working capital $99.4 $94.6 Total assets $771.8 $773.6 Total debt $136.4 $137.7 Total stockholder’s equity $547.1 $545.0 $ in millions, except per share amounts 3 months ended Aug 31, 2015 3 months ended Aug 31, 2014 Cash Flow from operations $4.7 $5.4 CFFO/share $0.13 $0.15 Free Cash Flow $4.0 $0.02 Balance Sheet & Cash Flow
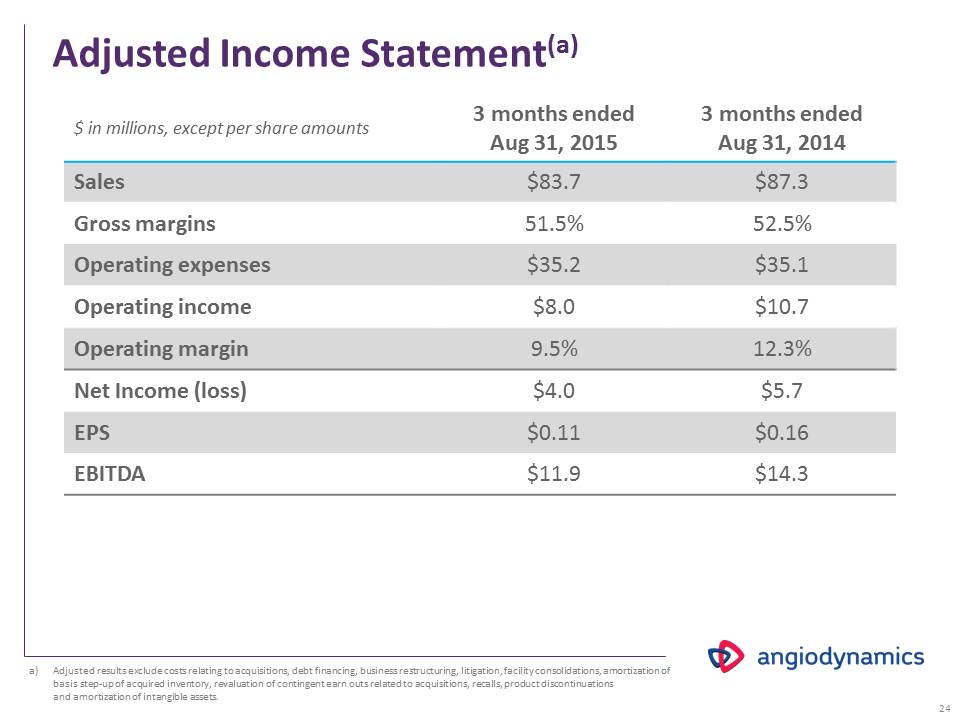
* $ in millions, except per share amounts 3 months ended Aug 31, 2015 3 months ended Aug 31, 2014 Sales $83.7 $87.3 Gross margins 51.5% 52.5% Operating expenses $35.2 $35.1 Operating income $8.0 $10.7 Operating margin 9.5% 12.3% Net Income (loss) $4.0 $5.7 EPS $0.11 $0.16 EBITDA $11.9 $14.3 Adjusted Income Statement(a) Adjusted results exclude costs relating to acquisitions, debt financing, business restructuring, litigation, facility consolidations, amortization of basis step-up of acquired inventory, revaluation of contingent earn outs related to acquisitions, recalls, product discontinuations and amortization of intangible assets.