Exhibit 99.1
Link to searchable text of slide shown above
Link to searchable text of slide shown above
Link to searchable text of slide shown above

Link to searchable text of slide shown above

Link to searchable text of slide shown above
Searchable text section of graphics shown above
Bimini Mortgage Management, Inc. Asset Information
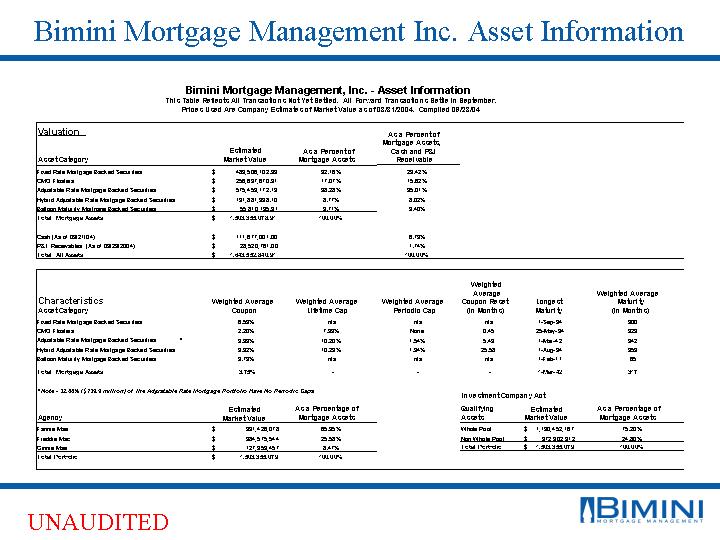
Bimini Mortgage Management, Inc. - Asset Information
This Table Reflects All Transactions Not Yet Settled. All Forward Transactions Settle In September.
Prices Used Are Company Estimates of Market Value as of 08/31/2004. Compiled 09/23/04
Valuation
Asset Category |
| Estimated |
| As a Percent of |
| As a Percent of |
| |
Fixed Rate Mortgage Backed Securities |
| $ | 483,506,102.39 |
| 32.16 | % | 29.42 | % |
CMO Floaters |
| $ | 256,697,670.31 |
| 17.07 | % | 15.62 | % |
Adjustable Rate Mortgage Backed Securities |
| $ | 575,459,172.19 |
| 38.28 | % | 35.01 | % |
Hybrid Adjustable Rate Mortgage Backed Securities |
| $ | 131,881,938.10 |
| 8.77 | % | 8.02 | % |
Balloon Maturity Mortgage Backed Securities |
| $ | 55,810,195.91 |
| 3.71 | % | 3.40 | % |
Total: Mortgage Assets |
| $ | 1,503,355,078.91 |
| 100.00 | % |
|
|
|
|
|
|
|
|
|
| |
Cash (As of 09/21/04) |
| $ | 111,677,001.00 |
|
|
| 6.79 | % |
P&I Receivables (As of 09/23/2004) |
| $ | 28,520,761.00 |
|
|
| 1.74 | % |
Total: All Assets |
| $ | 1,643,552,840.91 |
|
|
| 100.00 | % |
Characteristics
Asset Category |
| Weighted Average |
| Weighted Average |
| Weighted Average |
| Weighted |
| Longest |
| Weighted Average |
|
|
|
|
|
|
|
|
| (in Months) |
|
|
| (in Months) |
|
Fixed Rate Mortgage Backed Securities |
| 6.53 | % | n/a |
| n/a |
| n/a |
| 1-Sep-34 |
| 300 |
|
CMO Floaters |
| 2.20 | % | 7.93 | % | None |
| 0.45 |
| 25-May-34 |
| 329 |
|
Adjustable Rate Mortgage Backed Securities * |
| 3.33 | % | 10.20 | % | 1.54 | % | 5.43 |
| 1-Mar-42 |
| 342 |
|
Hybrid Adjustable Rate Mortgage Backed Securities |
| 3.92 | % | 10.23 | % | 1.94 | % | 25.58 |
| 1-Aug-34 |
| 353 |
|
Balloon Maturity Mortgage Backed Securities |
| 3.79 | % | n/a |
| n/a |
| n/a |
| 1-Feb-11 |
| 65 |
|
Total: Mortgage Assets |
| 3.75 | % | — |
| — |
| — |
| 1-Mar-42 |
| 317 |
|
* Note - 32.68% ($139.9 million) of The Adjustable Rate Mortgage Portfolio Have No Periodic Caps
Agency |
| Estimated |
| As a Percentage of |
| |
Fannie Mae |
| $ | 991,426,078 |
| 65.95 | % |
Freddie Mac |
| $ | 384,575,544 |
| 25.58 | % |
Ginnie Mae |
| $ | 127,353,457 |
| 8.47 | % |
Total Portfolio |
| $ | 1,503,355,079 |
| 100.00 | % |
Investment Company Act
Qualifying |
| Estimated |
| As a Percentage of |
| |
Whole Pool |
| $ | 1,130,452,167 |
| 75.20 | % |
Non Whole Pool |
| $ | 372,902,912 |
| 24.80 | % |
Total Portfolio |
| $ | 1,503,355,079 |
| 100.00 | % |
UNAUDITED | [LOGO] |
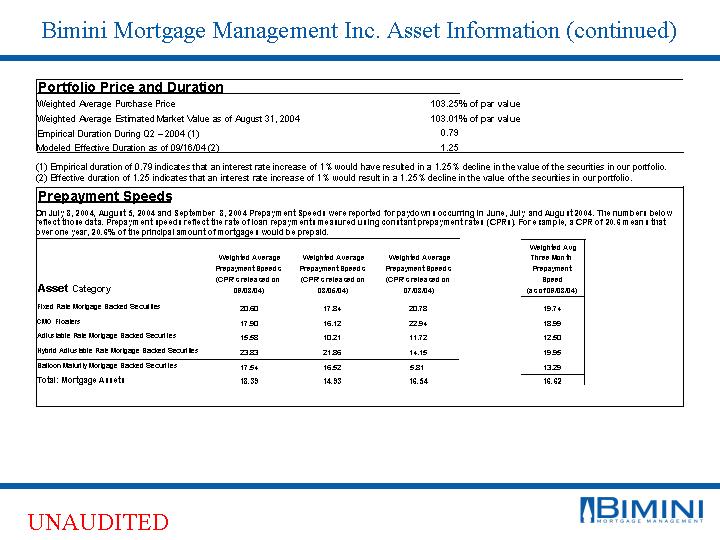
Portfolio Price and Duration
Weighted Average Purchase Price |
|
| 103.25 | % of par value |
Weighted Average Estimated Market Value as of August 31, 2004 |
|
| 103.01 | % of par value |
Empirical Duration During Q2 - 2004 (1) |
| 0.79 |
| |
Modeled Effective Duration as of 09/16/04 (2) |
| 1.25 |
| |
(1) Empirical duration of 0.79 indicates that an interest rate increase of 1% would have resulted in a 0.79% decline in the value of the securities in our portfolio.
(2) Effective duration of 1.25 indicates that an interest rate increase of 1% would result in a 1.25% decline in the value of the securities in our portfolio.
Prepayment Speeds
On July 8, 2004, August 5, 2004 and September 8, 2004 Prepayment Speeds were reported for paydowns occurring in June, July and August 2004. The numbers below reflect those data. Prepayment speeds reflect the rate of loan repayments measured using constant prepayment rates (CPRs). For example, a CPR of 20.6 means that over one year, 20.6% of the principal amount of mortgages would be prepaid.
Asset Category |
| Weighted Average |
| Weighted Average |
| Weighted Average |
| Weighted Avg |
|
Fixed Rate Mortgage Backed Securities |
| 20.60 |
| 17.84 |
| 20.78 |
| 19.74 |
|
CMO Floaters |
| 17.90 |
| 16.12 |
| 22.94 |
| 18.99 |
|
Adjustable Rate Mortgage Backed Securities |
| 15.58 |
| 10.21 |
| 11.72 |
| 12.50 |
|
Hybrid Adjustable Rate Mortgage Backed Securities |
| 23.83 |
| 21.86 |
| 14.15 |
| 19.95 |
|
Balloon Maturity Mortgage Backed Securities |
| 17.54 |
| 16.52 |
| 5.81 |
| 13.29 |
|
Total: Mortgage Assets |
| 18.39 |
| 14.93 |
| 16.54 |
| 16.62 |
|
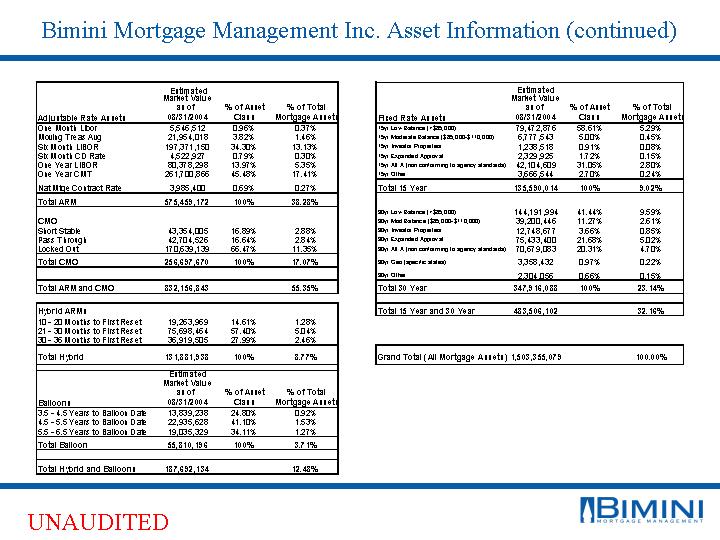
Adjustable Rate Assets |
| Market Value |
| % of Asset |
| % of Total |
|
One Month Libor |
| 5,546,512 |
| 0.96 | % | 0.37 | % |
Moving Treas Avg |
| 21,954,018 |
| 3.82 | % | 1.46 | % |
Six Month LIBOR |
| 197,371,150 |
| 34.30 | % | 13.13 | % |
Six Month CD Rate |
| 4,522,927 |
| 0.79 | % | 0.30 | % |
One Year LIBOR |
| 80,378,298 |
| 13.97 | % | 5.35 | % |
One Year CMT |
| 261,700,866 |
| 45.48 | % | 17.41 | % |
|
|
|
|
|
|
|
|
Nat Mtge Contract Rate |
| 3,985,400 |
| 0.69 | % | 0.27 | % |
Total ARM |
| 575,459,172 |
| 100 | % | 38.28 | % |
|
|
|
|
|
|
|
|
CMO |
|
|
|
|
|
|
|
Short Stable |
| 43,354,005 |
| 16.89 | % | 2.88 | % |
Pass Through |
| 42,704,526 |
| 16.64 | % | 2.84 | % |
Locked Out |
| 170,639,139 |
| 66.47 | % | 11.35 | % |
Total CMO |
| 256,697,670 |
| 100 | % | 17.07 | % |
|
|
|
|
|
|
|
|
Total ARM and CMO |
| 832,156,843 |
|
|
| 55.35 | % |
Hybrid ARMs |
|
|
|
|
|
|
|
10 - 20 Months to First Reset |
| 19,263,969 |
| 14.61 | % | 1.28 | % |
21 - 30 Months to First Reset |
| 75,698,464 |
| 57.40 | % | 5.04 | % |
30 - 36 Months to First Reset |
| 36,919,505 |
| 27.99 | % | 2.46 | % |
|
|
|
|
|
|
|
|
Total Hybrid |
| 131,881,938 |
| 100 | % | 8.77 | % |
Balloons |
| Estimated |
| % of Asset |
| % of Total |
|
3.5 - 4.5 Years to Balloon Date |
| 13,839,238 |
| 24.80 | % | 0.92 | % |
4.5 - 5.5 Years to Balloon Date |
| 22,935,628 |
| 41.10 | % | 1.53 | % |
5.5 - 6.5 Years to Balloon Date |
| 19,035,329 |
| 34.11 | % | 1.27 | % |
Total Balloon |
| 55,810,196 |
| 100 | % | 3.71 | % |
|
|
|
|
|
|
|
|
Total Hybrid and Balloons |
| 187,692,134 |
|
|
| 12.48 | % |
Fixed Rate Assets |
| Estimated |
| % of Asset |
| % of Total |
|
15yr Low Balance (<$85,000) |
| 79,472,876 |
| 58.61 | % | 5.29 | % |
15yr Moderate Balance ($85,000 - $110,000) |
| 6,777,543 |
| 5.00 | % | 0.45 | % |
15yr Investor Properties |
| 1,238,518 |
| 0.91 | % | 0.08 | % |
15yr Expanded Approval |
| 2,329,925 |
| 1.72 | % | 0.15 | % |
15yr Alt A (non conforming to agency standards) |
| 42,104,609 |
| 31.05 | % | 2.80 | % |
15yr Other |
| 3,666,544 |
| 2.70 | % | 0.24 | % |
Total 15 Year |
| 135,590,014 |
| 100 | % | 9.02 | % |
|
|
|
|
|
|
|
|
30yr Low Balance (<$85,000) |
| 144,191,994 |
| 41.44 | % | 9.59 | % |
30yr Mod Balance ($85,000 - $110,000) |
| 39,200,446 |
| 11.27 | % | 2.61 | % |
30yr Investor Properties |
| 12,748,677 |
| 3.66 | % | 0.85 | % |
30yr Expanded Approval |
| 75,433,400 |
| 21.68 | % | 5.02 | % |
30yr Alt A (non conforming to agency standards) |
| 70,679,083 |
| 20.31 | % | 4.70 | % |
30yr Geo (specific states) |
| 3,358,432 |
| 0.97 | % | 0.22 | % |
30yr Other |
| 2,304,056 |
| 0.66 | % | 0.15 | % |
Total 30 Year |
| 347,916,088 |
| 100 | % | 23.14 | % |
|
|
|
|
|
|
|
|
Total 15 Year and 30 Year |
| 483,506,102 |
|
|
| 32.16 | % |
|
|
|
|
|
|
|
|
Grand Total (All Mortgage Assets) |
| 1,503,355,079 |
|
|
| 100.00 | % |
The Value of ARMs In A Diversified Portfolio
ARM Portfolio Reset (Interest Rate Adjustment) Schedule as A Percent of
Bimini’s ARM and Hybrid Current Value as of 09/23/2004
[CHART]
Bimini Mortgage Management, Inc. Liability Information (09/23/2004)
|
|
|
| Wtd Avg |
| Longest |
| |
Counterparty |
| $ Outstanding |
| Maturity (days) |
| Maturity |
| |
Bear Stearns |
| 58,043,000 |
| 37 |
| 15-Dec-04 |
| |
Countrywide Secs |
| 43,429,000 |
| 103 |
| 1-Jun-05 |
| |
Daiwa Secs |
| 70,160,000 |
| 21 |
| 20-Oct-04 |
| |
Bank of America |
| 183,608,000 |
| 60 |
| 31-Jan-05 |
| |
Deutsche Bank |
| 305,028,000 |
| 70 |
| 4-Feb-05 |
| |
Nomura |
| 189,189,000 |
| 136 |
| 23-Mar-05 |
| |
JP Morgan Secs |
| 4,086,000 |
| 265 |
| 15-Jun-05 |
| |
Lehman Bros |
| — |
|
|
| 0-Jan-00 |
| |
UBS Securities |
| 251,267,000 |
| 44 |
| 15-Dec-04 |
| |
Goldman Sachs |
| 56,150,000 |
| 1 |
| 24-Sep-04 |
| |
Cantor Fitzgerald |
| 33,845,000 |
| 51 |
| 15-Feb-05 |
| |
Freddie Mac |
| 224,613,000 |
| 97 |
| 15-Feb-05 |
| |
Citigroup |
| 4,421,000 |
| 28 |
| 21-Oct-04 |
| |
Morgan Stanley |
| 17,644,000 |
| 55 |
| 18-Nov-04 |
| |
Total |
| $ | 1,441,483,000 |
|
|
|
|
|
|
|
|
| Longest |
|
Sector |
| Wtd Avg Maturity |
| Maturity |
|
|
| (days) |
|
|
|
Fixed Rate |
| 68 |
| 15-Jun-05 |
|
Adjst Rate MBS |
| 103 |
| 1-Jun-05 |
|
Hybrids Adj Rate |
| 67 |
| 23-Mar-05 |
|
CMO Floating Rate |
| 16 |
| 26-Oct-04 |
|
Baloon Maturity |
| 46 |
| 19-Nov-04 |
|