


Searchable text section of graphics shown above
Safe Harbor Statement
These materials contain forward-looking statements made pursuant to the “safe harbor” provisions of the Private Securities Litigation Reform Act of 1995. The reader is cautioned that such forward-looking statements are based on information available at the time and on management’s good faith belief with respect to future events, and are subject to risks and uncertainties that could cause actual performance or results to differ materially from those expressed in the statements. Important factors that could cause such differences are described in the Company’s periodic filings with the Securities and Exchange Commission, including the Company’s Form 10-K and quarterly reports on Form 10-Q. The Company assumes no obligation to update forward looking information to reflect actual results, changes in assumptions or changes in other factors affecting forward-looking information.
[LOGO]
2
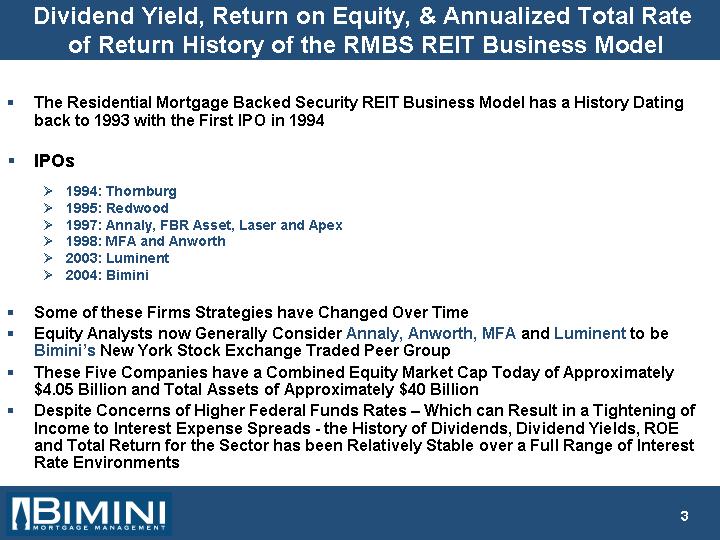
Dividend Yield, Return on Equity, & Annualized Total Rate
of Return History of the RMBS REIT Business Model
• The Residential Mortgage Backed Security REIT Business Model has a History Dating back to 1993 with the First IPO in 1994
• IPOs
• 1994: Thornburg
• 1995: Redwood
• 1997: Annaly, FBR Asset, Laser and Apex
• 1998: MFA and Anworth
• 2003: Luminent
• 2004: Bimini
• Some of these Firms Strategies have Changed Over Time
• Equity Analysts now Generally Consider Annaly, Anworth, MFA and Luminent to be Bimini’s New York Stock Exchange Traded Peer Group
• These Five Companies have a Combined Equity Market Cap Today of Approximately $4.05 Billion and Total Assets of Approximately $40 Billion
• Despite Concerns of Higher Federal Funds Rates – Which can Result in a Tightening of Income to Interest Expense Spreads - the History of Dividends, Dividend Yields, ROE and Total Return for the Sector has been Relatively Stable over a Full Range of Interest Rate Environments
3
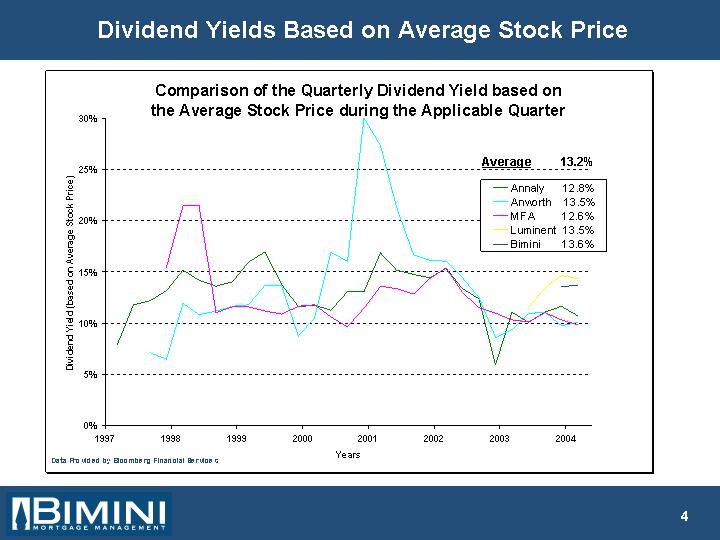
Dividend Yields Based on Average Stock Price
Comparison of the Quarterly Dividend Yield based on
the Average Stock Price during the Applicable Quarter
[CHART]
Data Provided by Bloomberg Financial Services
4
Dividend Yields Based on Average Book Value
Comparison of the Quarterly Return on Equity Based on the Average
Quarterly Book Value (ie: Beginning & End of the Quarter)
[CHART]
Data Provided by Bloomberg Financial Services & Flagstone Securities
5
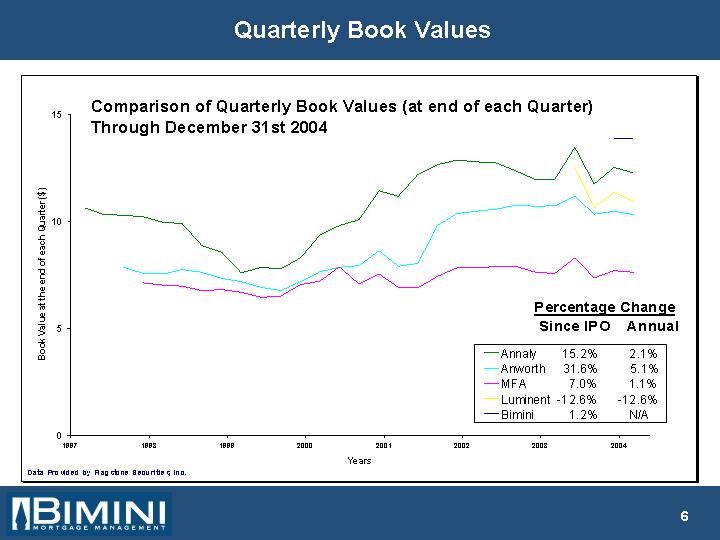
Quarterly Book Values
Comparison of Quarterly Book Values (at end of each Quarter)
Through December 31st 2004
[CHART]
Data Provided by Flagstone Securities, Inc.
6
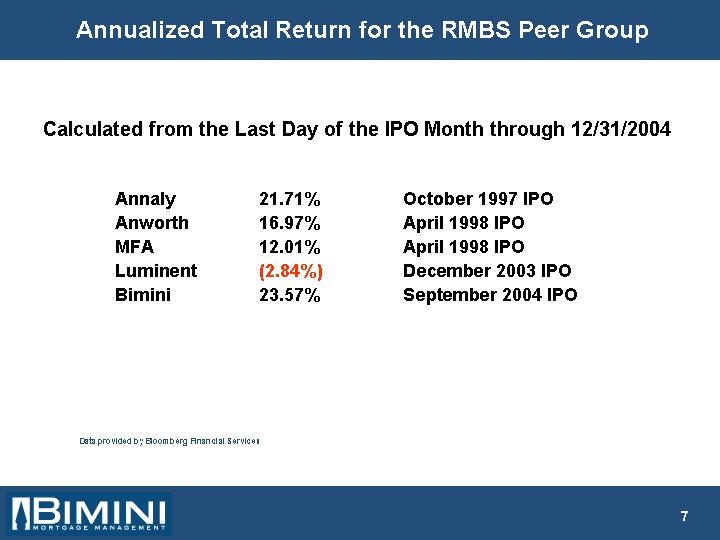
Annualized Total Return for the RMBS Peer Group
Calculated from the Last Day of the IPO Month through 12/31/2004
Annaly |
| 21.71 | % | October 1997 IPO |
|
Anworth |
| 16.97 | % | April 1998 IPO |
|
MFA |
| 12.01 | % | April 1998 IPO |
|
Luminent |
| (2.84 | )% | December 2003 IPO |
|
Bimini |
| 23.57 | % | September 2004 IPO |
|
Data provided by Bloomberg Financial Services
7
Studying the Business Model
• “Best Practices” - Two Years Researching the Sector
• Identify “Best Practices”
• Clarify “Not-So Best Practices”
• Strength and Weakness in the Business Model
• Biggest Strength
• Permanent Equity to Invest in Fixed Income Instruments
• Stock price can go down but that does not force the investment manager to sell assets
• Hedge fund investors often times withdraw their funds at precisely the moment when they should be buying, forcing the hedge fund manager to sell at the wrong time
• Biggest Weakness
• Event Risk
• Margin Call
8
How does Bimini Effectively Address Weaknesses in the
Business Model & Make the Business Model Better?
• Clearly Defined Investment Objectives
• Book Value Preservation
• Grow Book Value
• Stable Returns Over Time
• Avoid Event Risk
• Event Risk Scenarios Manifest Themselves through Margin Calls
• Major Price Movements
• Very High Prepayments
• Spread Widening
• Reduction in the Availability of Credit
9
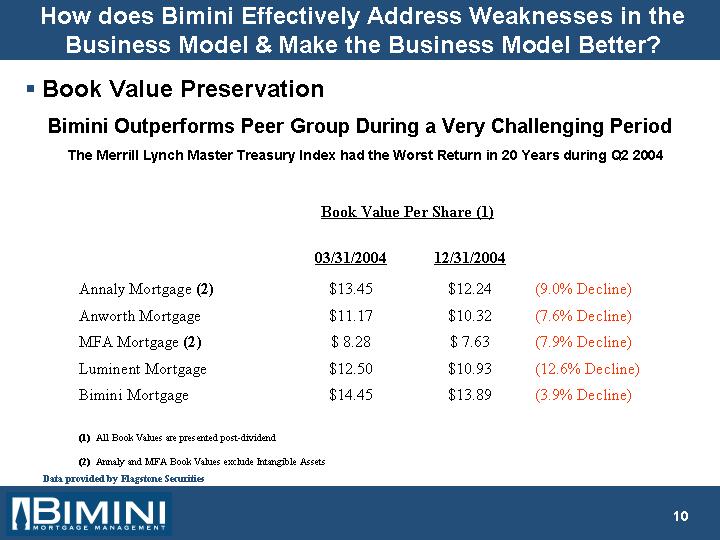
• Book Value Preservation
Bimini Outperforms Peer Group During a Very Challenging Period
The Merrill Lynch Master Treasury Index had the Worst Return in 20 Years during Q2 2004
|
| Book Value Per Share (1) |
|
|
| ||||
|
| 03/31/2004 |
| 12/31/2004 |
|
|
| ||
Annaly Mortgage (2) |
| $ | 13.45 |
| $ | 12.24 |
| (9.0 | % Decline) |
Anworth Mortgage |
| $ | 11.17 |
| $ | 10.32 |
| (7.6 | % Decline) |
MFA Mortgage (2) |
| $ | 8.28 |
| $ | 7.63 |
| (7.9 | % Decline) |
Luminent Mortgage |
| $ | 12.50 |
| $ | 10.93 |
| (12.6 | % Decline) |
Bimini Mortgage |
| $ | 14.45 |
| $ | 13.89 |
| (3.9 | % Decline) |
(1) All Book Values are presented post-dividend
(2) Annaly and MFA Book Values exclude Intangible Assets
Data provided by Flagstone Securities
10
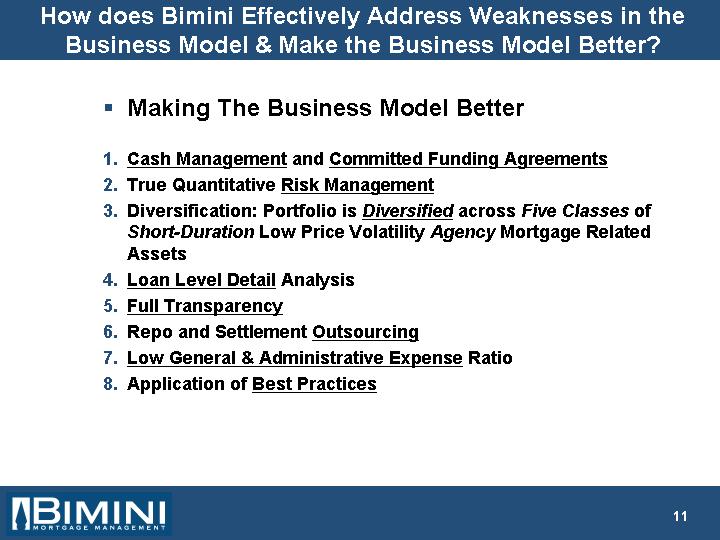
• Making The Business Model Better
1. Cash Management and Committed Funding Agreements
2. True Quantitative Risk Management
3. Diversification: Portfolio is Diversified across Five Classes of Short-Duration Low Price Volatility Agency Mortgage Related Assets
4. Loan Level Detail Analysis
5. Full Transparency
6. Repo and Settlement Outsourcing
7. Low General & Administrative Expense Ratio
8. Application of Best Practices
11
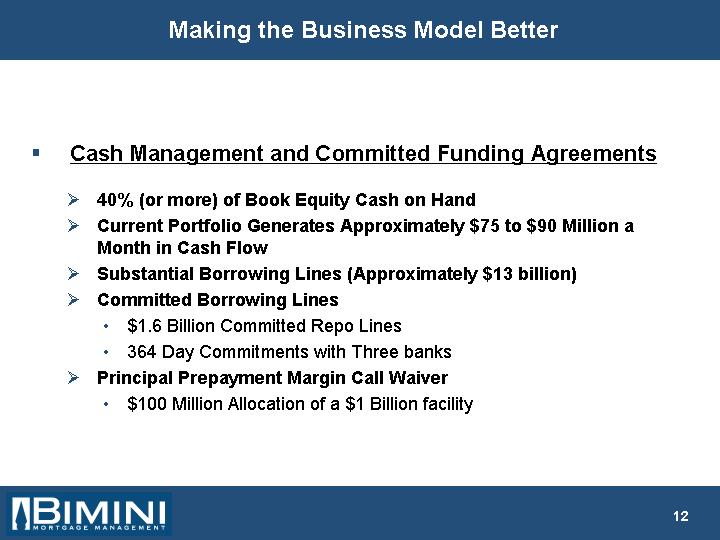
• Cash Management and Committed Funding Agreements
• 40% (or more) of Book Equity Cash on Hand
• Current Portfolio Generates Approximately $75 to $90 Million a Month in Cash Flow
• Substantial Borrowing Lines (Approximately $13 billion)
• Committed Borrowing Lines
• $1.6 Billion Committed Repo Lines
• 364 Day Commitments with Three banks
• Principal Prepayment Margin Call Waiver
• $100 Million Allocation of a $1 Billion facility
12
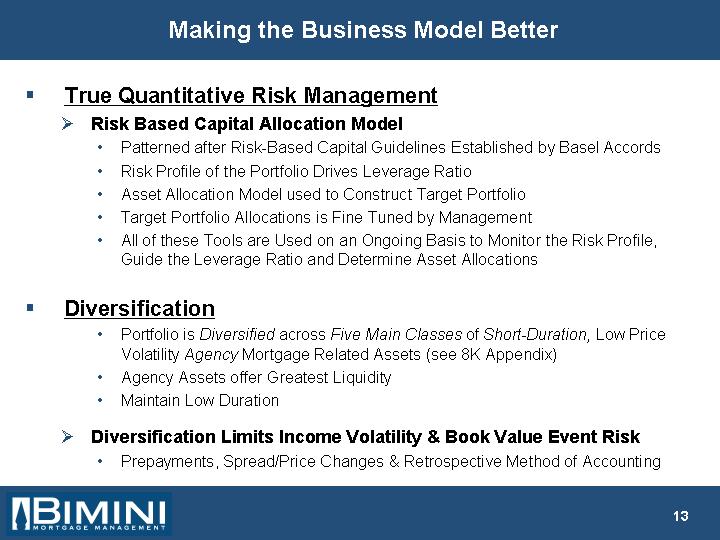
• True Quantitative Risk Management
• Risk Based Capital Allocation Model
• Patterned after Risk-Based Capital Guidelines Established by Basel Accords
• Risk Profile of the Portfolio Drives Leverage Ratio
• Asset Allocation Model used to Construct Target Portfolio
• Target Portfolio Allocations is Fine Tuned by Management
• All of these Tools are Used on an Ongoing Basis to Monitor the Risk Profile, Guide the Leverage Ratio and Determine Asset Allocations
• Diversification
• Portfolio is Diversified across Five Main Classes of Short-Duration, Low Price Volatility Agency Mortgage Related Assets (see 8K Appendix)
• Agency Assets offer Greatest Liquidity
• Maintain Low Duration
• Diversification Limits Income Volatility & Book Value Event Risk
• Prepayments, Spread/Price Changes & Retrospective Method of Accounting
13
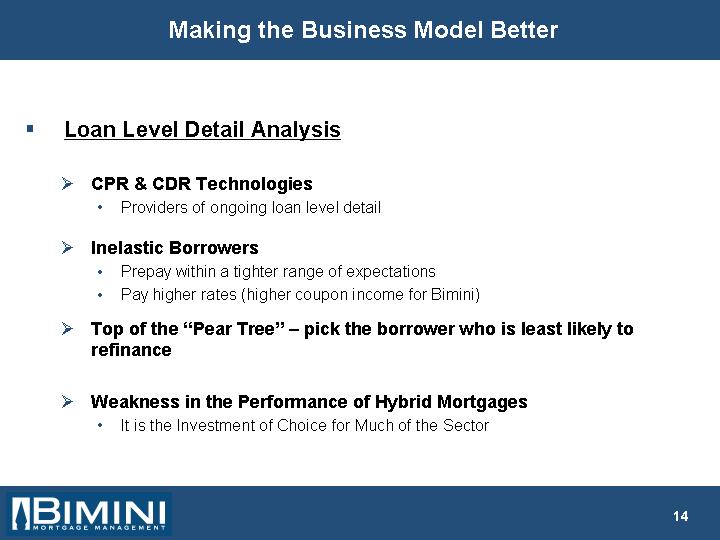
• CPR & CDR Technologies
• Providers of ongoing loan level detail
• Inelastic Borrowers
• Prepay within a tighter range of expectations
• Pay higher rates (higher coupon income for Bimini)
• Top of the “Pear Tree” – pick the borrower who is least likely to refinance
• Weakness in the Performance of Hybrid Mortgages
• It is the Investment of Choice for Much of the Sector
14
• BMM Releases its Portfolio and Liabilities at Least Every Six Weeks
• 8K (See Appendix)
• Credit officers always know what Bimini owns
• Lenders take great comfort in knowing Bimini’s financial condition
• Investors take comfort in knowing Bimini is willing to show all that they own and what they have borrowed
• Top of the “Pear Tree” – be the firm the creditors are least likely to worry about in a financial crisis situation
15
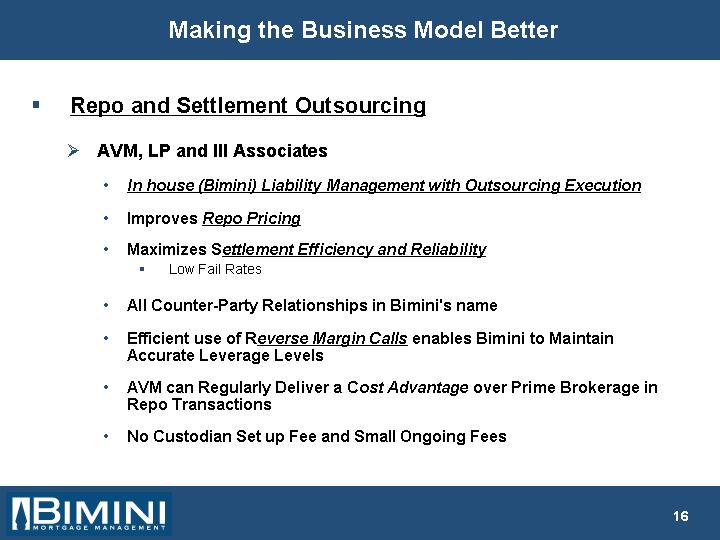
• Repo and Settlement Outsourcing
• AVM, LP and III Associates
• In house (Bimini) Liability Management with Outsourcing Execution
• Improves Repo Pricing
• Maximizes Settlement Efficiency and Reliability
• Low Fail Rates
• All Counter-Party Relationships in Bimini’s name
• Efficient use of Reverse Margin Calls enables Bimini to Maintain Accurate Leverage Levels
• AVM can Regularly Deliver a Cost Advantage over Prime Brokerage in Repo Transactions
• No Custodian Set up Fee and Small Ongoing Fees
16
• Diversified Repurchase Counter Parties
Bank of America Securities, LLC |
| JP Morgan Securities, Inc. |
|
|
|
Bear Stearns and Co. Inc. |
| Lehman Brothers |
|
|
|
Cantor Fitzgerald |
| Merrill Lynch |
|
|
|
Citibank |
| Morgan Stanley |
|
|
|
Countrywide Securities, Inc. |
| Nomura Securities International |
|
|
|
Daiwa |
| REFCO |
|
|
|
Deutsche Bank Securities, Inc. |
| UBS Investment Bank, LLC |
|
|
|
Goldman Sachs |
| Wachovia |
|
|
|
Greenwich Capital |
| Washington Mutual |
17
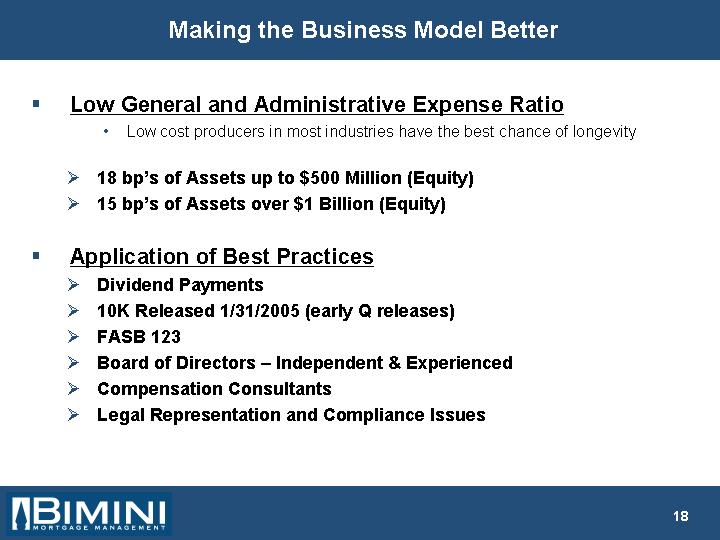
• Low General and Administrative Expense Ratio
• Low cost producers in most industries have the best chance of longevity
• 18 bp’s of Assets up to $500 Million (Equity)
• 15 bp’s of Assets over $1 Billion (Equity)
• Application of Best Practices
• Dividend Payments
• 10K Released 1/31/2005 (early Q releases)
• FASB 123
• Board of Directors – Independent & Experienced
• Compensation Consultants
• Legal Representation and Compliance Issues
18
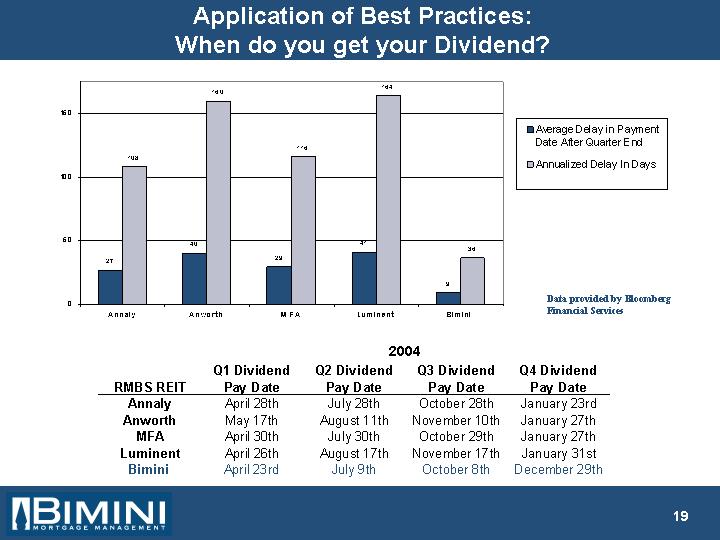
Application of Best Practices:
When do you get your Dividend?
[CHART]
| Data provided by Bloomberg |
| Financial Services |
|
| 2004 |
| ||||||
RMBS REIT |
| Q1 Dividend |
| Q2 Dividend |
| Q3 Dividend |
| Q4 Dividend |
|
Annaly |
| April 28th |
| July 28th |
| October 28th |
| January 23rd |
|
Anworth |
| May 17th |
| August 11th |
| November 10th |
| January 27th |
|
MFA |
| April 30th |
| July 30th |
| October 29th |
| January 27th |
|
Luminent |
| April 26th |
| August 17th |
| November 17th |
| January 31st |
|
Bimini |
| April 23rd |
| July 9th |
| October 8th |
| December 29th |
|
19
Portfolio Highlights
• Bimini owns Agency Mortgage Related Securities – Little Credit Risk
• Diversification Across Five Short-Duration Asset Classes
• Short-Duration Assets have Historically Exhibited Low Price Volatility
• Diversification Limits Potential Volatility from Overexposure to any One Asset Class
1. Adjustable Rate Securities (those that reset within 12 months)
2. CMO Monthly Resetting Floaters
3. Hybrid ARMS and Balloons
4. Fixed Rate Assets (specified pools, sequential CMO’s, agency debt - with low durations)
5. Cash (Bimini typically has 40% to 60% of its equity in cash)
• Leverage, Defined as Debt to Equity, Ranging from 8x to 12x
• Portfolio Constructed with the Aim of Performing Well in Both Rising and Falling Interest Rate Environments
• Inelastic Borrowers and Adjustable Rate Assets
20
Value of Fixed-Rate MBS in A Diversified Portfolio
• Bimini’s Fixed Rate Assets are Generally Niche “Specified” Assets
• Low Loan Balances
• Expanded Approval – Level 3
• ALT-A
• Investor Properties
• Geographic Preferences
• Seasoning Preferences
• Usually High Coupons are Preferable
22
High Coupon, Specialty Fixed Rate Assets can
Outperform in Both Rising and Falling Rate Environments
• High / Rising Rate Environment
• Yields Rise as Prepayments Slow for Premium Priced Assets
• Premium Fixed Rate Mortgages still Generate Significant Cash Flow to reinvest at higher yields
• Premium Mortgage Assets have Lower Duration than Par-Priced Mortgages
• Lower Price Volatility
• The Mortgage Prepayment “S” Curve
• Low / Falling Rate Environment
• Prepay at Significantly Lower Rates than Similar Coupon Generic Pools
• Prepay Rates Accelerate less Quickly than Generic Pools
• Slower Prepays Limit Reinvestment Risk at Lower Yields
23
www.biminireit.com
Visit our website at www.biminireit.com where
you will find more information about
Bimini Mortgage Management, Inc.
24
All 3/31 Information Subject to |
|
Change Prior to Release of | Portfolio & Liability Information (8K) |
10Q for 1st Quarter 2005 |
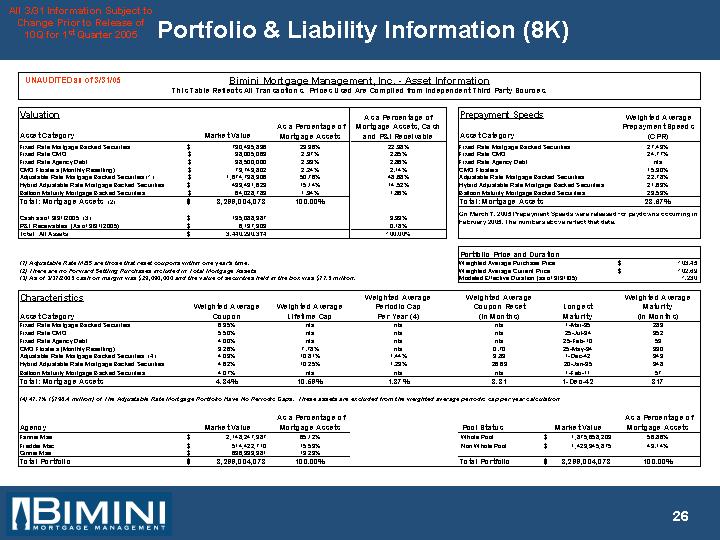
UNAUDITED as of 3/31/05 | Bimini Mortgage Management, Inc. - Asset Information |
This Table Reflects All Transactions. Prices Used Are Compiled from Independent Third Party Sources. | |
Valuation
Asset Category |
| Market Value |
| As a Percentage of |
| As a Percentage of |
| |
Fixed Rate Mortgage Backed Securities |
| $ | 790,495,896 |
| 23.96 | % | 22.98 | % |
Fixed Rate CMO |
| $ | 98,005,069 |
| 2.97 | % | 2.85 | % |
Fixed Rate Agency Debt |
| $ | 98,500,000 |
| 2.99 | % | 2.86 | % |
CMO Floaters (Monthly Resetting) |
| $ | 73,743,802 |
| 2.24 | % | 2.14 | % |
Adjustable Rate Mortgage Backed Securities (1) |
| $ | 1,674,738,906 |
| 50.76 | % | 48.68 | % |
Hybrid Adjustable Rate Mortgage Backed Securities |
| $ | 499,491,623 |
| 15.14 | % | 14.52 | % |
Balloon Maturity Mortgage Backed Securities |
| $ | 64,028,783 |
| 1.94 | % | 1.86 | % |
Total: Mortgage Assets (2) |
| $ | 3,299,004,078 |
| 100.00 | % |
|
|
|
|
|
|
|
|
|
| |
Cash as of 3/31/2005 (3) |
| $ | 135,088,987 |
|
|
| 3.93 | % |
P&I Receivables (As of 3/31/2005) |
| $ | 6,197,309 |
|
|
| 0.18 | % |
Total: All Assets |
| $ | 3,440,290,374 |
|
|
| 100.00 | % |
(1) Adjustable Rate MBS are those that reset coupons within one year’s time.
(2) There are no Forward Settling Purchases included in Total Mortgage Assets
(3) As of 3/31/2005 cash on margin was $29,090,000 and the value of securities held in the box was $11.5 million.
Prepayment Speeds
Asset Category |
| Weighted Average |
|
Fixed Rate Mortgage Backed Securities |
| 27.43 | % |
Fixed Rate CMO |
| 24.77 |
|
Fixed Rate Agency Debt |
| n/a |
|
CMO Floaters |
| 15.90 | % |
Adjustable Rate Mortgage Backed Securities |
| 22.78 | % |
Hybrid Adjustable Rate Mortgage Backed Securities |
| 21.63 | % |
Balloon Maturity Mortgage Backed Securities |
| 23.69 | % |
Total: Mortgage Assets |
| 23.67 | % |
On March 7, 2005 Prepayment Speeds were released for paydowns occurring in February 2005. The numbers above reflect that data.
Portfolio Price and Duration |
|
|
| |
Weighted Average Purchase Price |
| $ | 103.45 |
|
Weighted Average Current Price |
| $ | 102.69 |
|
Modeled Effective Duration (as of 3/31/05) |
| 1.230 |
| |
Characteristics
Asset Category |
| Weighted Average |
| Weighted Average |
| Weighted Average |
| Weighted Average |
| Longest |
| Weighted Average |
|
Fixed Rate Mortgage Backed Securities |
| 6.95 | % | n/a |
| n/a |
| n/a |
| 1-Mar-35 |
| 289 |
|
Fixed Rate CMO |
| 5.50 | % | n/a |
| n/a |
| n/a |
| 25-Jul-34 |
| 352 |
|
Fixed Rate Agency Debt |
| 4.00 | % | n/a |
| n/a |
| n/a |
| 25-Feb-10 |
| 59 |
|
CMO Floaters (Monthly Resetting) |
| 3.26 | % | 7.78 | % | n/a |
| 0.70 |
| 25-May-34 |
| 330 |
|
Adjustable Rate Mortgage Backed Securities (4) |
| 4.03 | % | 10.81 | % | 1.44 | % | 3.83 |
| 1-Dec-42 |
| 343 |
|
Hybrid Adjustable Rate Mortgage Backed Securities |
| 4.62 | % | 10.25 | % | 1.23 | % | 26.69 |
| 20-Jan-35 |
| 348 |
|
Balloon Maturity Mortgage Backed Securities |
| 4.07 | % | n/a |
| n/a |
| n/a |
| 1-Feb-11 |
| 57 |
|
Total: Mortgage Assets |
| 4.84 | % | 10.59 | % | 1.37 | % | 8.81 |
| 1-Dec-42 |
| 317 |
|
(4) 47.7% ($798.4 million) of The Adjustable Rate Mortgage Portfolio Have No Periodic Caps. These assets are excluded from the weighted average periodic cap per year calculation
Agency |
| Market Value |
| As a Percentage of |
| |
Fannie Mae |
| $ | 2,148,247,387 |
| 65.12 | % |
Freddie Mac |
| $ | 514,422,710 |
| 15.59 | % |
Ginnie Mae |
| $ | 636,333,981 |
| 19.29 | % |
Total Portfolio |
| $ | 3,299,004,078 |
| 100.00 | % |
Pool Status |
| Market Value |
| As a Percentage of |
| |
Whole Pool |
| $ | 1,875,658,203 |
| 56.86 | % |
Non Whole Pool |
| $ | 1,423,345,875 |
| 43.14 | % |
|
|
|
|
|
| |
Total Portfolio |
| $ | 3,299,004,078 |
| 100.00 | % |
26
|
| Market Value |
| % of Asset |
| % of Total |
| ||||
|
|
|
|
|
|
|
| ||||
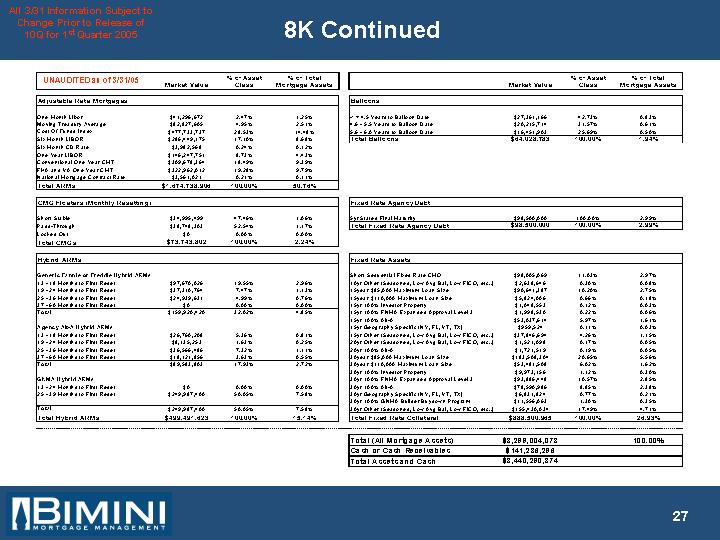
Adjustable Rate Mortgages |
|
|
|
|
|
|
| ||||
|
|
|
|
|
|
|
| ||||
One Month Libor |
| $ | 41,296,672 |
| 2.47 | % | 1.25 | % | |||
Moving Treasury Average |
| $ | 82,827,605 |
| 4.95 | % | 2.51 | % | |||
Cost Of Funds Index |
| $ | 477,733,737 |
| 28.53 | % | 14.48 | % | |||
Six Month LIBOR |
| $ | 286,449,175 |
| 17.10 | % | 8.68 | % | |||
Six Month CD Rate |
| $ | 3,982,568 |
| 0.24 | % | 0.12 | % | |||
One Year LIBOR |
| $ | 146,247,751 |
| 8.73 | % | 4.43 | % | |||
Conventional One Year CMT |
| $ | 309,678,364 |
| 18.49 | % | 9.39 | % | |||
FHA and VA One Year CMT |
| $ | 322,962,012 |
| 19.28 | % | 9.79 | % | |||
National Mortgage Contract Rate |
| $ | 3,561,021 |
| 0.21 | % | 0.11 | % | |||
Total ARMs |
| $ | 1,674,738,906 |
| 100.00 | % | 50.76 | % | |||
|
|
|
|
|
|
|
|
| |||
CMO Floaters (Monthly Resetting) |
|
|
|
|
|
|
|
| |||
|
|
|
|
|
|
|
|
| |||
Short Stable |
| $ | 34,995,499 |
| 47.46 | % | 1.06 | % | |||
Pass-Through |
| $ | 38,748,303 |
| 52.54 | % | 1.17 | % | |||
Locked Out |
| $ | 0 |
| 0.00 | % | 0.00 | % | |||
Total CMOs |
| $ | 73,743,802 |
| 100.00 | % | 2.24 | % | |||
|
|
|
|
|
|
|
| ||||
Hybrid ARMs |
|
|
|
|
|
|
| ||||
|
|
|
|
|
|
|
| ||||
Generic Fannie or Freddie Hybrid ARMs |
|
|
|
|
|
|
| ||||
13 - 18 Months to First Reset |
| $ | 97,670,026 |
| 19.55 | % | 2.96 | % | |||
19 - 24 Months to First Reset |
| $ | 37,310,764 |
| 7.47 | % | 1.13 | % | |||
25 - 36 Months to First Reset |
| $ | 24,939,631 |
| 4.99 | % | 0.76 | % | |||
37 - 60 Months to First Reset |
| $ | 0 |
| 0.00 | % | 0.00 | % | |||
Total |
| $ | 159,920,420 |
| 32.02 | % | 4.85 | % | |||
|
|
|
|
|
|
|
| ||||
Agency Alt-A Hybrid ARMs |
|
|
|
|
|
|
| ||||
13 - 18 Months to First Reset |
| $ | 26,760,208 |
| 5.36 | % | 0.81 | % | |||
19 - 24 Months to First Reset |
| $ | 8,135,253 |
| 1.63 | % | 0.25 | % | |||
25 - 36 Months to First Reset |
| $ | 36,566,486 |
| 7.32 | % | 1.11 | % | |||
37 - 60 Months to First Reset |
| $ | 18,121,856 |
| 3.63 | % | 0.55 | % | |||
Total |
| $ | 89,583,803 |
| 17.93 | % | 2.72 | % | |||
|
|
|
|
|
|
|
| ||||
GNMA Hybrid ARMs |
|
|
|
|
|
|
| ||||
13 - 24 Months to First Reset |
| $ | 0 |
| 0.00 | % | 0.00 | % | |||
25 - 39 Months to First Reset |
| $ | 249,987,400 |
| 50.05 | % | 7.58 | % | |||
|
|
|
|
|
|
|
| ||||
Total |
| $ | 249,987,400 |
| 50.05 | % | 7.58 | % | |||
Total Hybrid ARMs |
| $ | 499,491,623 |
| 100.00 | % | 15.14 | % | |||
|
|
|
|
|
|
|
| ||||
Balloons |
|
|
|
|
|
|
| ||||
|
|
|
|
|
|
|
| ||||
< = 4.5 Years to Balloon Date |
| $ | 27,361,166 |
| 42.73 | % | 0.83 | % | |||
4.6 - 5.5 Years to Balloon Date |
| $ | 20,215,714 |
| 31.57 | % | 0.61 | % | |||
5.6 - 6.0 Years to Balloon Date |
| $ | 16,451,903 |
| 25.69 | % | 0.50 | % | |||
Total Balloons |
| $ | 64,028,783 |
| 100.00 | % | 1.94 | % | |||
|
|
|
|
|
|
|
| ||||
Fixed Rate Agency Debt |
|
|
|
|
|
|
| ||||
|
|
|
|
|
|
|
| ||||
5yr Stated Final Maturity |
| $ | 98,500,000 |
| 100.00 | % | 2.99 | % | |||
Total Fixed Rate Agency Debt |
| $ | 98,500,000 |
| 100.00 | % | 2.99 | % | |||
|
|
|
|
|
|
|
| ||||
Fixed Rate Assets |
|
|
|
|
|
|
| ||||
|
|
|
|
|
|
|
| ||||
Short Sequential Fixed Rate CMO |
| $ | 98,005,069 |
| 11.03 | % | 2.97 | % | |||
10yr Other (Seasoned, Low Avg Bal, Low FICO, etc) |
| $ | 2,638,646 |
| 0.30 | % | 0.08 | % | |||
15year $85,000 Maximum Loan Size |
| $ | 90,641,387 |
| 10.20 | % | 2.75 | % | |||
15year $110,000 Maximum Loan Size |
| $ | 5,824,006 |
| 0.66 | % | 0.18 | % | |||
15yr 100% Investor Property |
| $ | 1,048,553 |
| 0.12 | % | 0.03 | % | |||
15yr 100% FNMA Expanded Approval Level 3 |
| $ | 1,998,530 |
| 0.22 | % | 0.06 | % | |||
15yr 100% Alt-A |
| $ | 53,037,614 |
| 5.97 | % | 1.61 | % | |||
15yr Geography Specific (NY, FL, VT, TX) |
| $ | 959,524 |
| 0.11 | % | 0.03 | % | |||
15yr Other (Seasoned, Low Avg Bal, Low FICO, etc) |
| $ | 37,846,694 |
| 4.26 | % | 1.15 | % | |||
20yr Other (Seasoned, Low Avg Bal, Low FICO, etc) |
| $ | 1,521,098 |
| 0.17 | % | 0.05 | % | |||
20yr 100% Alt-A |
| $ | 1,721,519 |
| 0.19 | % | 0.05 | % | |||
30year $85,000 Maximum Loan Size |
| $ | 183,508,304 |
| 20.65 | % | 5.56 | % | |||
30year $110,000 Maximum Loan Size |
| $ | 53,481,508 |
| 6.02 | % | 1.62 | % | |||
30yr 100% Investor Property |
| $ | 9,973,156 |
| 1.12 | % | 0.30 | % | |||
30yr 100% FNMA Expanded Approval Level 3 |
| $ | 93,886,448 |
| 10.57 | % | 2.85 | % | |||
30yr 100% Alt-A |
| $ | 78,590,986 |
| 8.85 | % | 2.38 | % | |||
30yr Geography Specific (NY, FL, VT, TX) |
| $ | 6,831,824 |
| 0.77 | % | 0.21 | % | |||
30yr 100% GNMA Builder Buydown Program |
| $ | 11,556,063 |
| 1.30 | % | 0.35 | % | |||
30yr Other (Seasoned, Low Avg Bal, Low FICO, etc) |
| $ | 155,430,034 |
| 17.49 | % | 4.71 | % | |||
Total Fixed Rate Collateral |
| $ | 888,500,965 |
| 100.00 | % | 26.93 | % | |||
|
|
|
|
|
|
|
| ||||
Total (All Mortgage Assets) |
| $ | 3,299,004,078 |
|
|
| 100.00 | % | |||
Cash or Cash Receivables |
| $ | 141,286,296 |
|
|
|
|
| |||
Total Assets and Cash |
| $ | 3,440,290,374 |
|
|
|
|
| |||
27
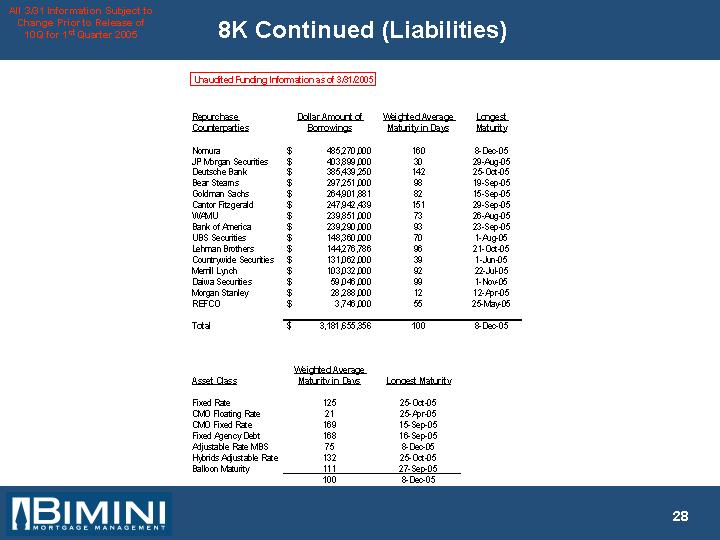
Unaudited Funding Information as of 3/31/2005
Repurchase |
| Dollar Amount of |
| Weighted Average |
| Longest |
| |
|
|
|
|
|
|
|
| |
Nomura |
| $ | 485,270,000 |
| 160 |
| 8-Dec-05 |
|
JP Morgan Securities |
| $ | 403,899,000 |
| 30 |
| 29-Aug-05 |
|
Deutsche Bank |
| $ | 385,439,250 |
| 142 |
| 25-Oct-05 |
|
Bear Stearns |
| $ | 297,251,000 |
| 98 |
| 19-Sep-05 |
|
Goldman Sachs |
| $ | 264,901,881 |
| 82 |
| 15-Sep-05 |
|
Cantor Fitzgerald |
| $ | 247,942,439 |
| 151 |
| 29-Sep-05 |
|
WAMU |
| $ | 239,851,000 |
| 73 |
| 26-Aug-05 |
|
Bank of America |
| $ | 239,290,000 |
| 93 |
| 23-Sep-05 |
|
UBS Securities |
| $ | 148,360,000 |
| 70 |
| 1-Aug-05 |
|
Lehman Brothers |
| $ | 144,276,786 |
| 96 |
| 21-Oct-05 |
|
Countrywide Securities |
| $ | 131,062,000 |
| 39 |
| 1-Jun-05 |
|
Merrill Lynch |
| $ | 103,032,000 |
| 92 |
| 22-Jul-05 |
|
Daiwa Securities |
| $ | 59,046,000 |
| 99 |
| 1-Nov-05 |
|
Morgan Stanley |
| $ | 28,288,000 |
| 12 |
| 12-Apr-05 |
|
REFCO |
| $ | 3,746,000 |
| 55 |
| 25-May-05 |
|
Total |
| $ | 3,181,655,356 |
| 100 |
| 8-Dec-05 |
|
Asset Class |
| Weighted Average |
| Longest Maturity |
|
|
|
|
|
|
|
Fixed Rate |
| 125 |
| 25-Oct-05 |
|
CMO Floating Rate |
| 21 |
| 25-Apr-05 |
|
CMO Fixed Rate |
| 169 |
| 15-Sep-05 |
|
Fixed Agency Debt |
| 168 |
| 16-Sep-05 |
|
Adjustable Rate MBS |
| 75 |
| 8-Dec-05 |
|
Hybrids Adjustable Rate |
| 132 |
| 25-Oct-05 |
|
Balloon Maturity |
| 111 |
| 27-Sep-05 |
|
|
| 100 |
| 8-Dec-05 |
|
28