| Six Months Ended December 31, 2022 | Year Ended December 31, 2022 | |||||||
Cohen & Steers Infrastructure Fund at Net Asset Valuea | –1.04 | % | –7.42 | % | ||||
Cohen & Steers Infrastructure Fund at Market Valuea | ‑1.58 | % | –9.53 | % | ||||
Blended Benchmark—80% FTSE Global Core Infrastructure 50/50 Net Tax Index / 20% ICE BofA Fixed Rate Preferred Securities Indexb | –0.72 | % | –6.74 | % | ||||
S&P 500 Indexb | 2.31 | % | –18.11 | % | ||||
| a | As a closed‑end investment company, the price of the Fund’s exchange-traded shares will be set by market forces and can deviate from the net asset value (NAV) per share of the Fund. |
| b | The FTSE Global Core Infrastructure 50/50 Net Tax Index is a market-capitalization-weighted index of worldwide infrastructure and infrastructure-related securities and is net of dividend withholding taxes. Constituent weights are adjusted semi-annually according to three broad industry sectors: 50% utilities, 30% transportation, and a 20% mix of other sectors, including pipelines, satellites, and telecommunication towers. The ICE BofA Fixed Rate Preferred Securities Index tracks the performance of fixed-rate U.S. dollar-denominated preferred securities issued in the U.S. domestic market. The S&P 500 Index is an unmanaged index of 500 large-capitalization stocks that is frequently used as a general measure of U.S. stock market performance. |
 |  | |
| BEN MORTON | WILLIAM F. SCAPELL | |
| Portfolio Manager | Portfolio Manager | |
 |  | |
| ELAINE ZAHARIS-NIKAS | TYLER S. ROSENLICHT | |
| Portfolio Manager | Portfolio Manager | |

| Leverage (as a % of managed assets) | 29% | |
| % Variable Rate Financing | 15% | |
| Variable Rate | 5.2% | |
% Fixed Rate Financingc | 85% | |
| Weighted Average Rate on Fixed Financing | 1.9% | |
| Weighted Average Term on Fixed Financing | 3.5 years |
| a | Data as of December 31, 2022. Information is subject to change. |
| b | See Note 7 in Notes to Financial Statements. |
| c | Represents fixed payer interest rate swap contracts on variable rate borrowing. |
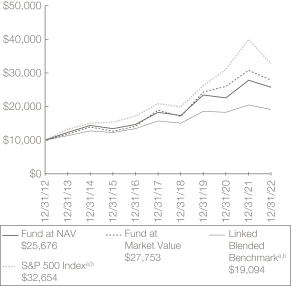
| 1 Year | 5 Years | 10 Years | Since Inceptionc | |||||||||||||
| Fund at NAV | –7.42 | % | 7.02 | % | 9.89 | % | 9.69 | % | ||||||||
| Fund at Market Value | –9.53 | % | 8.02 | % | 10.75 | % | 9.33 | % | ||||||||
| a | The Linked Blended Benchmark is represented by the performance of 80% UBS Global Infrastructure & Utilities 50/50 Index Net (UBS 50/50) / 20% ICE BofA Fixed Rate Preferred Securities Index through March 31, 2015 and 80% FTSE Global Core Infrastructure 50/50 Net Tax Index (FTSE 50/50) / 20% ICE BofA Fixed Rate Preferred Securities Index thereafter. The benchmark was replaced on March 31, 2015 because UBS retired the UBS 50/50. The UBS 50/50 tracked a 50% exposure to the global developed market utilities sector and a 50% exposure to the global developed market infrastructure sector. The index was a free-float market-capitalization weighted index and reconstituted |
| annually with quarterly rebalances and was net of dividend withholding taxes. The FTSE 50/50 is a market-capitalization-weighted index of worldwide infrastructure and infrastructure-related securities and is net of dividend withholding taxes. Constituent weights are adjusted semi-annually according to three broad industry sectors: 50% utilities, 30% transportation, and a 20% mix of other sectors, including pipelines, satellites and telecommunication towers. The ICE BofA Fixed Rate Preferred Securities Index tracks the performance of fixed-rate U.S. dollar-denominated preferred securities issued in the U.S. domestic market. The S&P 500 Index is an unmanaged index of 500 large-capitalization stocks that is frequently used as a general measure of U.S. stock market performance. |
| b | The comparative indexes are not adjusted to reflect expenses or other fees that the U.S. Securities and Exchange Commission (SEC) requires to be reflected in the Fund’s performance. Index performance does not reflect the deduction of any fees, taxes or expenses. An investor cannot invest directly in an index. The Fund’s performance assumes the reinvestment of all dividends and distributions at prices obtained under the Fund’s dividend reinvestment plan. |
| c | Commencement of investment operations is March 30, 2004. |
| Common Share | Common Share | Premium/ (Discount) as a Percentage of | ||||||||||||||||||||||
| Market Price | Net Asset Value | Net Asset Value | ||||||||||||||||||||||
| For the Quarter Ended | High | Low | High | Low | High | Low | ||||||||||||||||||
| December 31, 2022 | $ | 25.32 | $ | 21.14 | $ | 25.38 | $ | 21.22 | 2.36 | % | (3.90 | )% | ||||||||||||
| September 30, 2022 | $ | 28.19 | $ | 23.24 | $ | 27.97 | $ | 22.52 | 4.00 | % | (2.90 | )% | ||||||||||||
| June 30, 2022 | $ | 29.35 | $ | 22.99 | $ | 29.13 | $ | 24.15 | 3.67 | % | (5.09 | )% | ||||||||||||
| March 31, 2022 | $ | 28.96 | $ | 25.40 | $ | 28.78 | $ | 25.56 | 3.15 | % | (3.78 | )% | ||||||||||||
| December 31, 2021 | $ | 28.90 | $ | 27.23 | $ | 28.28 | $ | 26.19 | 6.01 | % | (0.25 | )% | ||||||||||||
| September 30, 2021 | $ | 29.83 | $ | 26.97 | $ | 28.12 | $ | 26.09 | 8.84 | % | 2.78 | % | ||||||||||||
| June 30, 2021 | $ | 29.70 | $ | 27.37 | $ | 27.98 | $ | 25.83 | 12.38 | % | 1.62 | % | ||||||||||||
| March 31, 2021 | $ | 27.93 | $ | 25.16 | $ | 25.72 | $ | 23.74 | 10.84 | % | 2.73 | % | ||||||||||||
| Stockholder Transaction Expenses | ||||
| Sales Load (as a percentage of offering price) | — | (1) | ||
| Offering Expenses Borne by the Fund (as a percentage of offering price) | — | (1) | ||
| Dividend Reinvestment Fees | None | (2) | ||
| Percentage of Net Assets Attributable to Common Shares | ||||
| Annual Expenses (as a percentage of net assets attributable to common shares) | ||||
| Management Fees | 1.18 | %(3) | ||
| Interest Payments on Borrowed Funds | 1.10 | %(4) | ||
| Other Expenses | 0.16 | %(5) | ||
| Total Annual Expenses | 2.44 | % | ||
| (1) | If Common Shares are sold to or through underwriters, a prospectus or prospectus supplement will set forth any applicable sales commission and the estimated offering expenses borne by the Fund. Under the Fund’s effective registration statement, as of December 31, 2022, the Fund had commenced an offering of its shares made at-the-market with a maximum sales commission of 1.00% of the offering price. |
| (2) | Stockholders participating in the Fund’s Reinvestment Plan generally do not incur any additional fees. You will pay brokerage charges if you direct your broker or the plan agent to sell your Common Shares that you acquired pursuant to a dividend reinvestment plan. You may also pay a pro-rata share of brokerage commissions incurred in connection with open-market purchases pursuant to the Fund’s Dividend Reinvestment Plan. |
| (3) | The Investment Manager’s fee is accrued daily, paid monthly, at an annual rate of 0.85% of the Fund’s average daily Managed Assets. Consequently, since the Fund has borrowings outstanding, the investment management fees and other expenses as a percentage of net assets attributable to common shares are higher than if the Fund did not utilize a leveraged capital structure. |
| (4) | Assumes borrowings from financial institution representing 29% of Managed Assets. The actual amount of interest expense borne by the Fund may significantly vary over time. Interest expense is required to be treated as an expense of the Fund for accounting purposes. |
| (5) | Other Expenses shown in the table are based upon those incurred during the Fund’s current year ended December 31, 2022. The Fund and the Investment Manager have entered into an administration agreement (the Administration Agreement) and the Fund and State Street have entered into a co‑administration agreement (the Co‑Administration Agreement). Other Expenses include |
| amounts paid to the Investment Manager under the Administration Agreement, which requires the Fund to pay the Investment Manager an amount equal to, on an annual basis, 0.06% of the Fund’s average daily Managed Assets, and amounts paid to State Street under the Co‑Administration Agreement. |
| 1 Year | 3 Years | 5 Years | 10 Years | |||
| 34 | 85 | 139 | 285 |
| * | The example above should not be considered a representation of future expenses. Actual expenses may be higher or lower. The example assumes that the estimated Other Expenses set forth in the Annual Expenses table is accurate and that all dividends and distributions are reinvested at NAV. Actual expenses may be greater or less than those assumed. Moreover, the Fund’s actual rate of return may be greater or less than the hypothetical 5% return shown in the example. |
| (1) | Notwithstanding this assumption, in actuality, these fees will be indirectly borne by all holders of Common Shares. |
| Security | Value | % of Managed Assets | ||||||
| NextEra Energy, Inc. | $ | 182,832,030 | 5.6 | |||||
| Norfolk Southern Corp. | 130,891,897 | 4.0 | ||||||
| American Tower Corp. | 119,803,652 | 3.6 | ||||||
| Transurban Group | 117,854,890 | 3.6 | ||||||
| Enbridge, Inc. | 97,040,936 | 3.0 | ||||||
| Canadian National Railway Co. | 81,820,639 | 2.5 | ||||||
| FirstEnergy Corp. | 78,666,648 | 2.4 | ||||||
| Southern Co./The | 75,234,291 | 2.3 | ||||||
| PPL Corp. | 71,090,419 | 2.2 | ||||||
| Alliant Energy Corp. | 70,100,413 | 2.1 | ||||||
| a | Top ten holdings (excluding short-term investments and derivative instruments) are determined on the basis of the value of individual securities held. The Fund may also hold position in other securities issued by the companies listed above. See the Schedule of Investments for additional details on such other positions. |
| b | Excludes derivative instruments. |
| Shares/Units | Value | |||||||||||
COMMON STOCK | 113.6% | |||||||||||
AUSTRALIA | 8.1% | |||||||||||
RAILWAYS | 0.5% | |||||||||||
| Aurizon Holdings Ltd. | 4,522,025 | $ | 11,484,003 | |||||||||
TOLL ROADS | 7.6% | |||||||||||
Atlas Arteria Ltd.a | 13,385,769 | 60,241,575 | ||||||||||
Transurban Groupa,b | 13,335,871 | 117,854,890 | ||||||||||
| 178,096,465 | ||||||||||||
TOTAL AUSTRALIA | 189,580,468 | |||||||||||
CANADA | 15.0% | |||||||||||
DIVERSIFIED UTILITIES | 1.3% | |||||||||||
| AltaGas Ltd. | 1,709,971 | 29,526,678 | ||||||||||
ELECTRIC | 1.6% | |||||||||||
| Emera, Inc. | 579,706 | 22,156,415 | ||||||||||
Hydro One Ltd., 144Ac | 586,251 | 15,704,079 | ||||||||||
| 37,860,494 | ||||||||||||
PIPELINES—C‑CORP | 8.3% | |||||||||||
Enbridge, Inc.b | 2,482,869 | 97,040,936 | ||||||||||
| Pembina Pipeline Corp. | 1,608,873 | 54,611,376 | ||||||||||
| TC Energy Corp. | 1,077,413 | 42,953,289 | ||||||||||
| 194,605,601 | ||||||||||||
RAILWAYS | 3.5% | |||||||||||
| Canadian National Railway Co. | 688,791 | 81,820,639 | ||||||||||
RENEWABLE ENERGY | 0.3% | |||||||||||
Tidewater Renewables Ltd.d | 789,442 | 6,710,840 | ||||||||||
TOTAL CANADA | 350,524,252 | |||||||||||
CHINA | 2.8% | |||||||||||
GAS DISTRIBUTION | 1.6% | |||||||||||
| Enn Energy Holdings Ltd., (H shares) | 2,775,921 | 38,978,014 | ||||||||||
TOLL ROADS | 1.2% | |||||||||||
| Jiangsu Expressway Co., Ltd., (H shares) | 15,514,000 | 14,171,485 | ||||||||||
| Zhejiang Expressway Co., Ltd., (Class H) | 17,288,000 | 13,311,325 | ||||||||||
| 27,482,810 | ||||||||||||
TOTAL CHINA | 66,460,824 | |||||||||||
| Shares/Units | Value | |||||||||||
HONG KONG | 1.2% | |||||||||||
ELECTRIC | ||||||||||||
Power Assets Holdings Ltd.b | 5,153,500 | $ | 28,225,423 | |||||||||
INDIA | 1.0% | |||||||||||
ELECTRIC | 0.6% | |||||||||||
| Power Grid Corp of India Ltd. | 5,807,459 | 15,018,807 | ||||||||||
MARINE PORTS | 0.4% | |||||||||||
| Adani Ports & Special Economic Zone Ltd. | 866,887 | 8,581,898 | ||||||||||
TOTAL INDIA | 23,600,705 | |||||||||||
ITALY | 1.2% | |||||||||||
ELECTRIC—INTEGRATED ELECTRIC | ||||||||||||
| Enel SpA | 5,142,570 | 27,689,453 | ||||||||||
JAPAN | 2.8% | |||||||||||
ELECTRIC | 0.8% | |||||||||||
| Kansai Electric Power Co., Inc. /The | 1,889,800 | 18,417,054 | ||||||||||
GAS DISTRIBUTION | 0.5% | |||||||||||
| Osaka Gas Co., Ltd. | 804,700 | 13,060,127 | ||||||||||
RAILWAYS | 1.5% | |||||||||||
West Japan Railway Co.b | 792,100 | 34,577,422 | ||||||||||
TOTAL JAPAN | 66,054,603 | |||||||||||
LUXEMBOURG | 1.7% | |||||||||||
COMMUNICATIONS—SATELLITES | ||||||||||||
| SES SA | 5,948,989 | 38,781,682 | ||||||||||
MEXICO | 1.8% | |||||||||||
AIRPORTS | ||||||||||||
| Grupo Aeroportuario del Pacifico SAB de CV, Class B | 2,930,692 | 42,020,647 | ||||||||||
NEW ZEALAND | 1.4% | |||||||||||
AIRPORTS | ||||||||||||
Auckland International Airport Ltd.b,d | 6,665,359 | 33,050,647 | ||||||||||
SPAIN | 3.8% | |||||||||||
AIRPORTS | 1.6% | |||||||||||
Aena SME SA, 144Ac,d | 299,557 | 37,613,493 | ||||||||||
COMMUNICATIONS | 2.2% | |||||||||||
Cellnex Telecom SA, 144Ac | 1,538,868 | 50,933,912 | ||||||||||
TOTAL SPAIN | 88,547,405 | |||||||||||
| Shares/Units | Value | |||||||||||
THAILAND | 2.1% | |||||||||||
AIRPORTS | ||||||||||||
Airports of Thailand PCLd | 22,244,500 | $ | 48,169,121 | |||||||||
UNITED KINGDOM | 3.3% | |||||||||||
ELECTRIC | 2.3% | |||||||||||
| National Grid PLC | 4,408,768 | 53,161,226 | ||||||||||
UTILITIES—WATER | 1.0% | |||||||||||
| Pennon Group PLC | 2,239,838 | 24,059,268 | ||||||||||
TOTAL UNITED KINGDOM | 77,220,494 | |||||||||||
UNITED STATES | 67.4% | |||||||||||
COMMUNICATIONS | 9.3% | |||||||||||
DATA CENTERS | 0.7% | |||||||||||
| Digital Realty Trust, Inc. | 173,310 | 17,377,794 | ||||||||||
TOWERS | 8.6% | |||||||||||
American Tower Corp.b,e | 565,485 | 119,803,652 | ||||||||||
Crown Castle, Inc.b,e | 458,121 | 62,139,532 | ||||||||||
SBA Communications Corp.b,e | 62,900 | 17,631,499 | ||||||||||
| 199,574,683 | ||||||||||||
TOTAL COMMUNICATIONS | 216,952,477 | |||||||||||
ELECTRIC | 34.6% | |||||||||||
Alliant Energy Corp.b,e | 1,269,705 | 70,100,413 | ||||||||||
CenterPoint Energy, Inc.b,e,f | 1,821,518 | 54,627,325 | ||||||||||
CMS Energy Corp.b,e | 565,740 | 35,828,314 | ||||||||||
| Dominion Energy, Inc. | 720,148 | 44,159,476 | ||||||||||
Duke Energy Corp.b,e,f | 556,349 | 57,298,384 | ||||||||||
Entergy Corp.b,e,f | 425,010 | 47,813,625 | ||||||||||
Evergy, Inc.b,e | 763,369 | 48,038,811 | ||||||||||
FirstEnergy Corp.b,e | 1,875,695 | 78,666,648 | ||||||||||
NextEra Energy, Inc.b,e | 2,186,986 | 182,832,030 | ||||||||||
PNM Resources, Inc.b | 304,053 | 14,834,746 | ||||||||||
Portland General Electric Co.b,e | 263,923 | 12,932,227 | ||||||||||
PPL Corp.b,e | 2,432,937 | 71,090,419 | ||||||||||
Public Service Enterprise Group, Inc.b,e | 245,468 | 15,039,824 | ||||||||||
Southern Co./Theb | 1,053,554 | 75,234,291 | ||||||||||
| 808,496,533 | ||||||||||||
ENERGY—OIL & GAS STORAGE & TRANSPORTATION | 1.4% | |||||||||||
Hess Midstream LP, Class Ab,e | 409,705 | 12,258,374 | ||||||||||
| Shares/Units | Value | |||||||||||
Plains All American Pipeline LPb,e | 1,764,432 | $ | 20,749,720 | |||||||||
| 33,008,094 | ||||||||||||
FINANCIAL—DIVERSIFIED FINANCIAL SERVICES | 1.0% | |||||||||||
Rice Acquisition Corp. IId | 731,336 | 7,679,028 | ||||||||||
Zimmer Energy Transition Acquisition Corp.b,d | 1,452,434 | 14,371,834 | ||||||||||
| 22,050,862 | ||||||||||||
FOOD—FOOD PRODUCTS | 0.1% | |||||||||||
Benson Hill, Inc.d | 962,500 | 2,454,375 | ||||||||||
GAS DISTRIBUTION | 5.0% | |||||||||||
NiSource, Inc.b | 1,927,027 | 52,839,080 | ||||||||||
Sempra Energyb,e | 413,766 | 63,943,398 | ||||||||||
| 116,782,478 | ||||||||||||
PIPELINES | 7.4% | |||||||||||
PIPELINES—C‑CORP | 5.2% | |||||||||||
Cheniere Energy, Inc.b,e | 282,908 | 42,424,884 | ||||||||||
DT Midstream, Inc.b,d | 631,724 | 34,909,068 | ||||||||||
ONEOK, Inc.b,e | 655,386 | 43,058,860 | ||||||||||
| 120,392,812 | ||||||||||||
PIPELINES—MLP | 2.2% | |||||||||||
| Crestwood Equity Partners LP | 591,002 | 15,478,342 | ||||||||||
Energy Transfer LPb | 1,606,191 | 19,065,487 | ||||||||||
MPLX LPb,e | 514,959 | 16,911,254 | ||||||||||
| 51,455,083 | ||||||||||||
TOTAL PIPELINES | 171,847,895 | |||||||||||
RAILWAYS | 6.4% | |||||||||||
Norfolk Southern Corp.b,e | 531,174 | 130,891,897 | ||||||||||
| Union Pacific Corp. | 85,700 | 17,745,899 | ||||||||||
| 148,637,796 | ||||||||||||
RENEWABLE ENERGY | 0.2% | |||||||||||
Stem, Inc.d | 637,750 | 5,701,485 | ||||||||||
| Shares/Units | Value | |||||||||||
UTILITIES—WATER | 2.0% | |||||||||||
American Water Works Co., Inc.b,e | 208,862 | $ | 31,834,746 | |||||||||
Essential Utilities, Inc.b,e,f | 324,963 | 15,510,484 | ||||||||||
| 47,345,230 | ||||||||||||
TOTAL UNITED STATES | 1,573,277,225 | |||||||||||
TOTAL COMMON STOCK (Identified cost—$2,098,139,680) | 2,653,202,949 | |||||||||||
PREFERRED SECURITIES—$25 PAR VALUE | 3.4% | |||||||||||
BERMUDA | 0.0% | |||||||||||
REINSURANCE | ||||||||||||
RenaissanceRe Holdings Ltd., 5.75% , Series Fb,g | 7,000 | 151,620 | ||||||||||
CANADA | 0.2% | |||||||||||
FINANCIAL | 0.1% | |||||||||||
Brookfield BRP Holdings Canada, Inc., 4.625% g | 100,000 | 1,387,000 | ||||||||||
UTILITIES | 0.1% | |||||||||||
Algonquin Power & Utilities Corp., 6.875% to 10/17/23, due 10/17/78h | 29,974 | 689,402 | ||||||||||
Algonquin Power & Utilities Corp., 6.20% to 7/1/24, due 7/1/79, Series 19‑Ah | 89,073 | 1,899,036 | ||||||||||
| 2,588,438 | ||||||||||||
TOTAL CANADA | 3,975,438 | |||||||||||
NETHERLANDS | 0.1% | |||||||||||
INSURANCE | ||||||||||||
AEGON Funding Co. LLC, 5.10% , due 12/15/49b | 65,287 | 1,244,370 | ||||||||||
UNITED STATES | 3.1% | |||||||||||
BANKS | 0.7% | |||||||||||
Bank of America Corp., 6.00% , Series GGg | 184,373 | 4,410,202 | ||||||||||
KeyCorp., 6.20% to 12/15/27, Series Hb,g,h | 45,600 | 1,118,568 | ||||||||||
New York Community Bancorp, Inc., 6.375% to 3/17/27, Series Ab,g,h | 58,930 | 1,279,370 | ||||||||||
Regions Financial Corp., 5.70% to 5/15/29, Series Cb,g,h | 140,630 | 3,203,552 | ||||||||||
Wells Fargo & Co., 4.70% , Series AAg | 142,405 | 2,618,828 | ||||||||||
Wells Fargo & Co., 4.375% , Series CCg | 58,968 | 1,004,225 | ||||||||||
Wells Fargo & Co., 4.75% , Series Zb,g | 206,575 | 3,784,454 | ||||||||||
| 17,419,199 | ||||||||||||
| Shares/Units | Value | |||||||||||
CONSUMER CYCLICAL | 0.1% | |||||||||||
Ford Motor Co., 6.50% , due 8/15/62b | 144,325 | $ | 3,369,989 | |||||||||
ELECTRIC | 0.4% | |||||||||||
CMS Energy Corp., 5.875% , due 3/1/79b | 99,975 | 2,239,440 | ||||||||||
Duke Energy Corp., 5.75% , Series Ab,g | 141,350 | 3,306,177 | ||||||||||
Southern Co./The, 4.95% , due 1/30/80, Series 2020b | 230,000 | 4,517,200 | ||||||||||
| 10,062,817 | ||||||||||||
FINANCIAL | 0.5% | |||||||||||
DIVERSIFIED FINANCIAL SERVICES | 0.4% | |||||||||||
Apollo Asset Management, Inc., 6.375%, Series Ag | 57,982 | 1,266,327 | ||||||||||
Apollo Asset Management, Inc., 6.375%, Series Bg | 6,321 | 137,102 | ||||||||||
| Carlyle Finance LLC, 4.625%, due 5/15/61 | 70,000 | 1,133,300 | ||||||||||
Oaktree Capital Group LLC, 6.625%, Series Ab,g | 100,000 | 2,139,000 | ||||||||||
Oaktree Capital Group LLC, 6.55%, Series Bb,g | 66,071 | 1,411,937 | ||||||||||
Synchrony Financial, 5.625%, Series Ab,g | 114,545 | 1,964,447 | ||||||||||
| 8,052,113 | ||||||||||||
INVESTMENT BANKER/BROKER | 0.1% | |||||||||||
Morgan Stanley, 6.375% to 10/15/24, Series Ib,g,h | 118,969 | 2,886,188 | ||||||||||
TOTAL FINANCIAL | 10,938,301 | |||||||||||
INDUSTRIALS—CHEMICALS | 0.3% | |||||||||||
CHS, Inc., 7.10% to 3/31/24, Series 2b,g,h | 135,283 | 3,291,435 | ||||||||||
CHS, Inc., 6.75% to 9/30/24, Series 3b,g,h | 137,935 | 3,314,578 | ||||||||||
| 6,606,013 | ||||||||||||
INSURANCE | 0.4% | |||||||||||
LIFE/HEALTH INSURANCE | 0.2% | |||||||||||
Athene Holding Ltd., 6.35% to 6/30/29, Series Ab,g,h | 115,223 | 2,471,533 | ||||||||||
Athene Holding Ltd., 4.875% , Series Dg | 55,443 | 944,749 | ||||||||||
Equitable Holdings, Inc., 5.25% , Series Ag | 52,000 | 978,120 | ||||||||||
Voya Financial, Inc., 5.35% to 9/15/29, Series Bg,h | 45,010 | 980,768 | ||||||||||
| 5,375,170 | ||||||||||||
MULTI-LINE | 0.0% | |||||||||||
American International Group, Inc., 5.85% , Series Ag | 516 | 11,048 | ||||||||||
PROPERTY CASUALTY | 0.1% | |||||||||||
Enstar Group Ltd., 7.00% to 9/1/28, Series Dg,h | 77,050 | 1,648,870 | ||||||||||
| Shares/Units | Value | |||||||||||
REINSURANCE | 0.1% | |||||||||||
Arch Capital Group Ltd., 5.45% , Series Fb,g | 80,000 | $ | 1,624,000 | |||||||||
TOTAL INSURANCE | 8,659,088 | |||||||||||
INTEGRATED TELECOMMUNICATIONS SERVICES | 0.2% | |||||||||||
AT&T, Inc., 4.75% , Series Cb,g | 182,869 | 3,189,235 | ||||||||||
United States Cellular Corp., 5.50% , due 6/1/70 | 94,315 | 1,363,795 | ||||||||||
| 4,553,030 | ||||||||||||
PIPELINES | 0.3% | |||||||||||
Energy Transfer LP, 7.375% to 5/15/23, Series Cg,h | 109,692 | 2,387,995 | ||||||||||
Energy Transfer LP, 7.625% to 8/15/23, Series Dg,h | 89,991 | 1,979,802 | ||||||||||
Energy Transfer LP, 7.60% to 5/15/24, Series Eg,h | 113,416 | 2,482,676 | ||||||||||
| 6,850,473 | ||||||||||||
UTILITIES | 0.2% | |||||||||||
NiSource, Inc., 6.50% to 3/15/24, Series Bb,g,h | 30,015 | 729,065 | ||||||||||
Sempra Energy, 5.75% , due 7/1/79b | 99,837 | 2,159,474 | ||||||||||
Spire, Inc., 5.90% , Series Ab,g | 76,071 | 1,717,683 | ||||||||||
| 4,606,222 | ||||||||||||
TOTAL UNITED STATES | 73,065,132 | |||||||||||
TOTAL PREFERRED SECURITIES—$25 PAR VALUE (Identified cost—$91,871,098) | 78,436,560 | |||||||||||
| Principal Amount | ||||||||||||
PREFERRED SECURITIES—CAPITAL SECURITIES | 19.5% | |||||||||||
AUSTRALIA | 0.5% | |||||||||||
BANKS | 0.2% | |||||||||||
Australia & New Zealand Banking Group Ltd./United Kingdom, 6.75% to 6/15/26, 144Ab,c,g,h,i | $ | 4,000,000 | 3,988,972 | |||||||||
Macquarie Bank Ltd./London, 6.125% to 3/8/27, 144Ac,g,h,i | 1,000,000 | 862,692 | ||||||||||
| 4,851,664 | ||||||||||||
INSURANCE—PROPERTY CASUALTY | 0.3% | |||||||||||
QBE Insurance Group Ltd., 5.875% to 6/17/26, due 6/17/46, Series EMTNh,j | 1,800,000 | 1,686,852 | ||||||||||
QBE Insurance Group Ltd., 6.75% to 12/2/24, due 12/2/44h,j | 5,155,000 | 5,034,443 | ||||||||||
| 6,721,295 | ||||||||||||
TOTAL AUSTRALIA | 11,572,959 | |||||||||||
| Principal Amount | Value | |||||||||||
CANADA | 2.0% | |||||||||||
BANKS | 0.4% | |||||||||||
Bank of Nova Scotia/The, 4.90% to 6/4/25g,h | $ | 2,000,000 | $ | 1,922,500 | ||||||||
Bank of Nova Scotia/The, 8.625% to 10/27/27, due 10/27/82h | 3,400,000 | 3,540,580 | ||||||||||
Toronto-Dominion Bank/The, 8.125% to 10/31/27, due 10/31/82h | 3,200,000 | 3,336,000 | ||||||||||
| 8,799,080 | ||||||||||||
ELECTRIC | 0.3% | |||||||||||
Emera, Inc., 6.75% to 6/15/26, due 6/15/76, Series 16‑Ab,e,h | 7,268,000 | 7,006,134 | ||||||||||
PIPELINES | 1.3% | |||||||||||
Enbridge, Inc., 5.75% to 4/15/30, due 7/15/80, Series 20‑Ab,h | 5,980,000 | 5,422,173 | ||||||||||
Enbridge, Inc., 6.00% to 1/15/27, due 1/15/77, Series 16‑Ab,h | 4,155,000 | 3,821,233 | ||||||||||
Enbridge, Inc., 6.25% to 3/1/28, due 3/1/78b,h | 5,913,000 | 5,389,126 | ||||||||||
Enbridge, Inc., 7.375% to 10/15/27, due 1/15/83b,h | 3,985,000 | 3,883,194 | ||||||||||
Enbridge, Inc., 7.625% to 10/15/32, due 1/15/83b,h | 1,920,000 | 1,903,893 | ||||||||||
Transcanada Trust, 5.50% to 9/15/29, due 9/15/79b,h | 5,008,000 | 4,341,784 | ||||||||||
Transcanada Trust, 5.875% to 8/15/26, due 8/15/76, Series 16‑Ab,e,h | 6,499,000 | 6,194,121 | ||||||||||
| 30,955,524 | ||||||||||||
TOTAL CANADA | 46,760,738 | |||||||||||
FINLAND | 0.1% | |||||||||||
BANKS | ||||||||||||
Nordea Bank Abp, 6.625% to 3/26/26, 144Ab,c,g,h,i | 1,400,000 | 1,381,887 | ||||||||||
FRANCE | 1.8% | |||||||||||
BANKS | 1.7% | |||||||||||
BNP Paribas SA, 6.625% to 3/25/24, 144Ab,c,g,h,i | 3,660,000 | 3,549,233 | ||||||||||
BNP Paribas SA, 7.00% to 8/16/28, 144Ab,c,g,h,i | 1,000,000 | 946,013 | ||||||||||
BNP Paribas SA, 7.375% to 8/19/25, 144Ab,c,g,h,i | 6,200,000 | 6,134,729 | ||||||||||
BNP Paribas SA, 7.75% to 8/16/29, 144Ab,c,g,h,i | 3,200,000 | 3,168,000 | ||||||||||
BNP Paribas SA, 9.25% to 11/17/27, 144Ac,g,h,i | 3,200,000 | 3,344,154 | ||||||||||
Credit Agricole SA, 6.875% to 9/23/24, 144Ab,c,g,h,i | 2,600,000 | 2,494,830 | ||||||||||
Credit Agricole SA, 7.875% to 1/23/24, 144Ab,c,g,h,i | 5,600,000 | 5,566,714 | ||||||||||
Credit Agricole SA, 8.125% to 12/23/25, 144Ab,c,g,h,i | 3,950,000 | 4,013,990 | ||||||||||
Societe Generale SA, 6.75% to 4/6/28, 144Ab,c,g,h,i | 3,400,000 | 3,053,030 | ||||||||||
Societe Generale SA, 7.875% to 12/18/23, 144Ab,c,g,h,i | 5,400,000 | 5,358,521 | ||||||||||
Societe Generale SA, 8.00% to 9/29/25, 144Ab,c,g,h,i | 1,800,000 | 1,803,375 | ||||||||||
| 39,432,589 | ||||||||||||
| Principal Amount | Value | |||||||||||
INSURANCE—FINANCE | 0.1% | |||||||||||
CNP Assurances, 4.875% to 10/7/30g,h,i,j | $ | 2,200,000 | $ | 1,740,750 | ||||||||
TOTAL FRANCE | 41,173,339 | |||||||||||
GERMANY | 0.1% | |||||||||||
BANKS | ||||||||||||
Dresdner Funding Trust I, 8.151% , due 6/30/31, 144A (TruPS)c | 2,000,000 | 2,071,390 | ||||||||||
ITALY | 0.4% | |||||||||||
BANKS | 0.1% | |||||||||||
Intesa Sanpaolo SpA, 7.70% to 9/17/25, 144Ab,c,g,h,i | 2,900,000 | 2,638,470 | ||||||||||
ELECTRIC | 0.3% | |||||||||||
Enel SpA, 8.75% to 9/24/23, due 9/24/73, 144Ab,c,h | 6,400,000 | 6,420,502 | ||||||||||
TOTAL ITALY | 9,058,972 | |||||||||||
JAPAN | 0.4% | |||||||||||
INSURANCE—LIFE/HEALTH INSURANCE | ||||||||||||
Dai‑ichi Life Insurance Co., Ltd./The, 5.10% to 10/28/24, 144Ab,c,g,h | 2,000,000 | 1,954,661 | ||||||||||
Fukoku Mutual Life Insurance Co., 5.00% to 7/28/25g,h,j | 2,800,000 | 2,693,320 | ||||||||||
Nippon Life Insurance Co., 5.10% to 10/16/24, due 10/16/44, 144Ab,c,h | 5,600,000 | 5,479,176 | ||||||||||
| 10,127,157 | ||||||||||||
NETHERLANDS | 0.5% | |||||||||||
BANKS | 0.4% | |||||||||||
ING Groep N.V., 5.75% to 11/16/26b,g,h,i | 5,000,000 | 4,441,100 | ||||||||||
ING Groep N.V., 6.50% to 4/16/25b,g,h,i | 2,600,000 | 2,464,249 | ||||||||||
ING Groep N.V., 6.75% to 4/16/24g,h,i,j | 3,000,000 | 2,892,825 | ||||||||||
| 9,798,174 | ||||||||||||
INSURANCE—MULTI-LINE | 0.1% | |||||||||||
Aegon NV, 5.50% to 4/11/28, due 4/11/48b,h | 2,875,000 | 2,589,456 | ||||||||||
TOTAL NETHERLANDS | 12,387,630 | |||||||||||
SPAIN | 0.2% | |||||||||||
BANKS | ||||||||||||
Banco Bilbao Vizcaya Argentaria SA, 6.50% to 3/5/25, Series 9b,g,h,i | 3,800,000 | 3,648,022 | ||||||||||
Banco Santander SA, 7.50% to 2/8/24g,h,i,j | 1,200,000 | 1,175,928 | ||||||||||
| 4,823,950 | ||||||||||||
| Principal Amount | Value | |||||||||||
SWITZERLAND | 1.2% | |||||||||||
BANKS | 0.8% | |||||||||||
Credit Suisse Group AG, 5.25% to 2/11/27, 144Ac,g,h,i | $ | 1,600,000 | $ | 1,045,090 | ||||||||
Credit Suisse Group AG, 6.375% to 8/21/26, 144Ab,c,g,h,i | 3,000,000 | 2,157,502 | ||||||||||
Credit Suisse Group AG, 7.25% to 9/12/25, 144Ab,c,g,h,i | 1,400,000 | 1,006,612 | ||||||||||
Credit Suisse Group AG, 7.50% to 7/17/23, 144Ab,c,e,g,h,i | 4,800,000 | 3,847,775 | ||||||||||
Credit Suisse Group AG, 9.75% to 6/23/27, 144Ac,g,h,i | 1,800,000 | 1,572,421 | ||||||||||
UBS Group AG, 6.875% to 8/7/25g,h,i,j | 5,400,000 | 5,289,651 | ||||||||||
UBS Group AG, 7.00% to 1/31/24, 144Ab,c,e,g,h,i | 5,400,000 | 5,326,146 | ||||||||||
| 20,245,197 | ||||||||||||
INSURANCE | 0.4% | |||||||||||
FINANCE | 0.1% | |||||||||||
Zurich Finance Ireland Designated Activity Co., 3.00% to 1/19/31, due 4/19/51, Series EMTNh,j | 3,600,000 | 2,768,292 | ||||||||||
MULTI-LINE | 0.3% | |||||||||||
Argentum Netherlands BV for Zurich Insurance Co. Ltd., 5.125% to 6/1/28, due 6/1/48h,j | 7,000,000 | 6,367,620 | ||||||||||
TOTAL INSURANCE | 9,135,912 | |||||||||||
TOTAL SWITZERLAND | 29,381,109 | |||||||||||
UNITED KINGDOM | 2.6% | |||||||||||
BANKS | 1.6% | |||||||||||
Barclays PLC, 8.00% to 6/15/24b,g,h,i | 5,000,000 | 4,870,529 | ||||||||||
Barclays PLC, 8.00% to 3/15/29g,h,i | 4,400,000 | 4,125,000 | ||||||||||
HSBC Capital Funding Dollar 1 LP, 10.176% to 6/30/30, 144Ab,c,g,h | 7,524,000 | 9,066,389 | ||||||||||
HSBC Holdings PLC, 6.50% to 3/23/28b,g,h,i | 2,800,000 | 2,584,177 | ||||||||||
Lloyds Banking Group PLC, 7.50% to 6/27/24b,g,h,i | 4,534,000 | 4,404,781 | ||||||||||
Lloyds Banking Group PLC, 7.50% to 9/27/25b,g,h,i | 3,400,000 | 3,288,504 | ||||||||||
Natwest Group PLC, 6.00% to 12/29/25b,g,h,i | 2,000,000 | 1,851,893 | ||||||||||
Natwest Group PLC, 8.00% to 8/10/25b,g,h,i | 6,000,000 | 5,916,450 | ||||||||||
Standard Chartered PLC, 7.75% to 4/2/23, 144Ab,c,g,h,i | 600,000 | 596,780 | ||||||||||
| 36,704,503 | ||||||||||||
INSURANCE | 0.3% | |||||||||||
Beazley Insurance DAC, 5.50% , due 9/10/29j | 2,000,000 | 1,779,000 | ||||||||||
Lancashire Holdings Ltd., 5.625% to 3/18/31, due 9/18/41h,j | 500,000 | 393,856 | ||||||||||
Phoenix Group Holdings PLC, 5.625% to 1/29/25g,h,i,j | 4,400,000 | 4,061,948 | ||||||||||
| 6,234,804 | ||||||||||||
| Principal Amount | Value | |||||||||||
INTEGRATED TELECOMMUNICATIONS SERVICES | 0.5% | |||||||||||
Vodafone Group PLC, 4.125% to 3/4/31, due 6/4/81h | $ | 2,090,000 | $ | 1,554,064 | ||||||||
Vodafone Group PLC, 6.25% to 7/3/24, due 10/3/78h,j | 5,731,000 | 5,504,912 | ||||||||||
Vodafone Group PLC, 7.00% to 1/4/29, due 4/4/79b,h | 4,500,000 | 4,530,555 | ||||||||||
| 11,589,531 | ||||||||||||
OIL & GAS | 0.2% | |||||||||||
BP Capital Markets PLC, 4.375% to 6/22/25b,g,h | 3,000,000 | 2,872,500 | ||||||||||
BP Capital Markets PLC, 4.875% to 3/22/30b,g,h | 3,550,000 | 3,117,344 | ||||||||||
| 5,989,844 | ||||||||||||
TOTAL UNITED KINGDOM | 60,518,682 | |||||||||||
UNITED STATES | 9.7% | |||||||||||
BANKS | 5.6% | |||||||||||
AgriBank FCB, 6.875% to 1/1/24b,g,h | 37,000 | † | 3,691,675 | |||||||||
Ally Financial, Inc., 4.70% to 5/15/28, Series Cb,g,h | 1,936,000 | 1,217,260 | ||||||||||
Bank of America Corp., 5.875% to 3/15/28, Series FFb,g,h | 2,682,000 | 2,365,283 | ||||||||||
Bank of America Corp., 6.10% to 3/17/25, Series AAb,g,h | 7,429,000 | 7,174,148 | ||||||||||
Bank of America Corp., 6.25% to 9/5/24, Series Xb,g,h | 7,423,000 | 7,147,316 | ||||||||||
Bank of America Corp., 6.30% to 3/10/26, Series DDb,g,h | 6,000,000 | 5,985,442 | ||||||||||
Bank of America Corp., 6.50% to 10/23/24, Series Zb,g,h | 6,806,000 | 6,729,989 | ||||||||||
Bank of New York Mellon Corp./The, 4.625% to 9/20/26, Series Fg,h | 3,500,000 | 2,993,340 | ||||||||||
Citigroup, Inc., 3.875% to 2/18/26, Series Xg,h | 3,250,000 | 2,778,750 | ||||||||||
Citigroup, Inc., 4.15% to 11/15/26, Series Yg,h | 2,310,000 | 1,891,726 | ||||||||||
Citigroup, Inc., 5.00% to 9/12/24, Series Ub,g,h | 4,704,000 | 4,198,378 | ||||||||||
Citigroup, Inc., 5.90% to 2/15/23, Series Bb,e,g,h | 5,675,000 | 5,630,056 | ||||||||||
Citigroup, Inc., 5.95% to 5/15/25, Series Pb,e,g,h | 6,000,000 | 5,411,700 | ||||||||||
Citigroup, Inc., 6.25% to 8/15/26, Series Tb,e,g,h | 7,850,000 | 7,634,125 | ||||||||||
Citizens Financial Group, Inc., 5.65% to 10/6/25, Series Fb,g,h | 2,000,000 | 1,920,255 | ||||||||||
Citizens Financial Group, Inc., 6.375% to 4/6/24, Series Cb,g,h | 1,200,000 | 1,098,930 | ||||||||||
CoBank ACB, 6.25% to 10/1/26, Series Ib,e,g,h | 2,866,000 | 2,784,319 | ||||||||||
Comerica, Inc., 5.625% to 7/1/25, Series Ag,h | 1,997,000 | 1,931,898 | ||||||||||
Farm Credit Bank of Texas, 6.75% to 9/15/23, 144Ab,c,g,h | 35,300 | † | 3,525,729 | |||||||||
First Horizon Bank, 4.759% (3 Month US LIBOR + 0.85%, Floor 3.75%), 144A (FRN)c,g,k | 1,076 | † | 850,040 | |||||||||
Goldman Sachs Group, Inc./The, 3.65% to 8/10/26, Series Ub,g,h | 4,170,000 | 3,377,700 | ||||||||||
Goldman Sachs Group, Inc./The, 4.125% to 11/10/26, Series Vg,h | 1,000,000 | 833,653 | ||||||||||
| Principal Amount | Value | |||||||||||
Goldman Sachs Group, Inc./The, 5.30% to 11/10/26, Series Ob,g,h | $ | 1,645,000 | $ | 1,565,198 | ||||||||
Goldman Sachs Group, Inc./The, 5.50% to 8/10/24, Series Qg,h | 1,000,000 | 973,224 | ||||||||||
Huntington Bancshares, Inc., 4.45% to 10/15/27, Series Gg,h | 1,000,000 | 897,056 | ||||||||||
Huntington Bancshares, Inc., 5.625% to 7/15/30, Series Fg,h | 894,000 | 834,390 | ||||||||||
JPMorgan Chase & Co., 5.00% to 8/1/24, Series FFb,g,h | 1,043,000 | 954,925 | ||||||||||
JPMorgan Chase & Co., 6.10% to 10/1/24, Series Xb,g,h | 2,500,000 | 2,434,738 | ||||||||||
JPMorgan Chase & Co., 6.125% to 4/30/24, Series Ub,g,h | 1,436,000 | 1,402,594 | ||||||||||
JPMorgan Chase & Co., 6.75% to 2/1/24, Series Sb,g,h | 8,790,000 | 8,761,564 | ||||||||||
PNC Financial Services Group, Inc./The, 6.20% to 9/15/27, Series Vb,g,h | 4,450,000 | 4,359,887 | ||||||||||
PNC Financial Services Group, Inc./The, 8.118% (3 Month US LIBOR + 3.678%), Series O (FRN)g,k | 1,000,000 | 1,000,998 | ||||||||||
SVB Financial Group, 4.00% to 5/15/26, Series Cb,g,h | 2,980,000 | 1,970,585 | ||||||||||
SVB Financial Group, 4.25% to 11/15/26, Series Db,g,h | 2,850,000 | 1,875,083 | ||||||||||
Truist Financial Corp., 4.80% to 9/1/24, Series Nb,g,h | 1,810,000 | 1,633,982 | ||||||||||
Truist Financial Corp., 5.10% to 3/1/30, Series Qg,h | 2,109,000 | 1,961,370 | ||||||||||
Truist Financial Corp., 5.125% to 12/15/27, Series Mg,h | 500,000 | 407,547 | ||||||||||
US Bancorp., 5.30% to 4/15/27, Series Jg,h | 1,500,000 | 1,311,105 | ||||||||||
Wells Fargo & Co., 3.90% to 3/15/26, Series BBb,g,h | 7,400,000 | 6,481,586 | ||||||||||
Wells Fargo & Co., 5.875% to 6/15/25, Series Ub,g,h | 7,521,000 | 7,276,567 | ||||||||||
Wells Fargo & Co., 5.95% , due 12/15/36b | 2,830,000 | 2,744,853 | ||||||||||
| 130,018,964 | ||||||||||||
ELECTRIC | 1.0% | |||||||||||
American Electric Power Co., Inc., 3.875% to 11/15/26, due 2/15/62b,h | 4,200,000 | 3,277,181 | ||||||||||
CenterPoint Energy, Inc., 6.125% to 9/1/23, Series Ab,g,h | 1,960,000 | 1,843,625 | ||||||||||
CMS Energy Corp., 4.75% to 3/1/30, due 6/1/50b,h | 1,125,000 | 975,892 | ||||||||||
Dominion Energy, Inc., 4.35% to 1/15/27, Series Cg,h | 8,000,000 | 6,759,468 | ||||||||||
Duke Energy Corp., 4.875% to 9/16/24b,g,h | 3,580,000 | 3,275,700 | ||||||||||
Southern Co./The, 4.00% to 10/15/25, due 1/15/51, Series Bb,h | 3,000,000 | 2,737,500 | ||||||||||
Southern Co./The, 5.113% , due 8/1/27b | 6,000,000 | 5,987,803 | ||||||||||
| 24,857,169 | ||||||||||||
| Principal Amount | Value | |||||||||||
FINANCIAL | 0.7% | |||||||||||
CREDIT CARD | 0.3% | |||||||||||
Discover Financial Services, 6.125% to 6/23/25, Series Db,g,h | $ | 7,200,000 | $ | 7,006,272 | ||||||||
INVESTMENT BANKER/BROKER | 0.4% | |||||||||||
Charles Schwab Corp./The, 4.00% to 6/1/26, Series Ib,e,g,h | 6,983,000 | 6,066,481 | ||||||||||
Charles Schwab Corp./The, 5.375% to 6/1/25, Series Gb,g,h | 2,936,000 | 2,886,088 | ||||||||||
| 8,952,569 | ||||||||||||
TOTAL FINANCIAL | 15,958,841 | |||||||||||
INFRASTRUCTURE—GAS—DISTRIBUTION | 0.2% | |||||||||||
Sempra Energy, 4.875% to 10/15/25b,g,h | 5,780,000 | 5,359,100 | ||||||||||
INSURANCE | 1.9% | |||||||||||
LIFE/HEALTH INSURANCE | 1.5% | |||||||||||
Corebridge Financial, Inc., 6.875% to 9/15/27, due 12/15/52, 144Ab,c,h | 7,170,000 | 6,658,711 | ||||||||||
MetLife Capital Trust IV, 7.875% , due 12/15/37, 144A (TruPS)b,c,e | 5,850,000 | 6,333,256 | ||||||||||
MetLife, Inc., 9.25% , due 4/8/38, 144Ab,c | 6,500,000 | 7,580,971 | ||||||||||
Prudential Financial, Inc., 5.625% to 6/15/23, due 6/15/43b,e,h | 9,275,000 | 9,125,302 | ||||||||||
Prudential Financial, Inc., 6.00% to 6/1/32, due 9/1/52b,h | 4,500,000 | 4,362,230 | ||||||||||
Voya Financial, Inc., 5.65% to 5/15/23, due 5/15/53b,h | 1,396,000 | 1,365,504 | ||||||||||
Voya Financial, Inc., 6.125% to 9/15/23, Series Ab,g,h | 1,310,000 | 1,278,922 | ||||||||||
| 36,704,896 | ||||||||||||
MULTI-LINE | 0.1% | |||||||||||
MetLife, Inc., 10.75% , due 8/1/39b | 1,000,000 | 1,330,910 | ||||||||||
PROPERTY CASUALTY | 0.2% | |||||||||||
Assurant, Inc., 7.00% to 3/27/28, due 3/27/48b,h | 3,200,000 | 3,103,659 | ||||||||||
Liberty Mutual Group, Inc., 7.80% , due 3/15/37, 144Ab,c | 1,680,000 | 1,865,447 | ||||||||||
| 4,969,106 | ||||||||||||
REINSURANCE | 0.1% | |||||||||||
AXIS Specialty Finance LLC, 4.90% to 1/15/30, due 1/15/40b,h | 1,760,000 | 1,447,081 | ||||||||||
TOTAL INSURANCE | 44,451,993 | |||||||||||
PIPELINES | 0.1% | |||||||||||
Energy Transfer LP, 7.125% to 5/15/30, Series Gb,g,h | 1,857,000 | 1,555,237 | ||||||||||
| Principal Amount | Value | |||||||||||
REAL ESTATE | 0.1% | |||||||||||
VICI Properties LP/VICI Note Co., Inc., 5.75% , due 2/1/27, 144Ac | $ | 1,700,000 | $ | 1,659,304 | ||||||||
UTILITIES | 0.1% | |||||||||||
NextEra Energy Capital Holdings, Inc., 5.65% to 5/1/29, due 5/1/79b,h | 3,438,000 | 3,129,570 | ||||||||||
TOTAL UNITED STATES | 226,990,178 | |||||||||||
TOTAL PREFERRED SECURITIES—CAPITAL SECURITIES (Identified cost—$476,529,765) | 456,247,991 | |||||||||||
CORPORATE BONDS | 0.3% | |||||||||||
ITALY | 0.1% | |||||||||||
ELECTRIC | ||||||||||||
Enel Finance America LLC, 7.10%, due 10/14/27, 144A (USD)c | 600,000 | 621,463 | ||||||||||
Enel Finance International NV, 7.50%, due 10/14/32, 144A (USD)c | 400,000 | 423,915 | ||||||||||
| 1,045,378 | ||||||||||||
UNITED STATES | 0.2% | |||||||||||
COMMUNICATIONS—TOWERS | 0.0% | |||||||||||
SBA Communications Corp., 3.125%, due 2/1/29b | 572,000 | 476,616 | ||||||||||
ELECTRIC | 0.1% | |||||||||||
| American Electric Power Co., Inc., 5.75%, due 11/1/27 | 1,015,000 | 1,043,630 | ||||||||||
| Southern California Edison Co., 5.85%, due 11/1/27 | 1,000,000 | 1,031,056 | ||||||||||
| 2,074,686 | ||||||||||||
REAL ESTATE | 0.1% | |||||||||||
| Spirit Realty LP, 3.40%, due 1/15/30 | 3,060,000 | 2,555,663 | ||||||||||
TOTAL UNITED STATES | 5,106,965 | |||||||||||
TOTAL CORPORATE BONDS (Identified cost—$6,070,854) | 6,152,343 | |||||||||||
| Number of Shares | Value | |||||||||||
SHORT-TERM INVESTMENTS | 2.8% | |||||||||||
MONEY MARKET FUNDS | ||||||||||||
State Street Institutional Treasury Money Market Fund, Premier Class, 3.79%l | 65,868,828 | $ | 65,868,828 | |||||||||
TOTAL SHORT-TERM INVESTMENTS (Identified cost—$65,868,828) | 65,868,828 | |||||||||||
PURCHASED OPTIONS CONTRACTS (Premiums paid—$162,047) | 0.0% | 7,452 | ||||||||||
TOTAL INVESTMENTS IN SECURITIES (Identified cost—$2,738,642,272) | 139.6% | 3,259,916,123 | ||||||||||
WRITTEN OPTION CONTRACTS (Premiums received—$336,999) | (0.0 | ) | (139,462 | ) | ||||||||
LIABILITIES IN EXCESS OF OTHER ASSETS | (39.6) | (925,404,627 | ) | |||||||||
NET ASSETS (Equivalent to $24.36 per share based on 95,820,437 shares of common stock outstanding) | 100.0% | $ | 2,334,372,034 | |||||||||
| Description | Exercise Price | Expiration Date | Number of Contracts | Notional Amountm | Premiums Paid | Value | ||||||||||||||||
| Call—Cheniere Energy, Inc. | $175.00 | 1/20/23 | 414 | $6,208,344 | $162,047 | $7,452 | ||||||||||||||||
| Description | Exercise Price | Expiration Date | Number of Contracts | Notional Amountm | Premiums Received | Value | ||||||||||||||||
| Call—Cheniere Energy, Inc. | $180.00 | 1/20/23 | (828) | $(12,416,688) | $(197,541) | $(11,592) | ||||||||||||||||
| Call—Duke Energy Corp. | 105.00 | 1/20/23 | (1,346) | (13,862,454) | (139,458) | (127,870) | ||||||||||||||||
| (2,174) | $(26,279,142) | $(336,999) | $(139,462) | |||||||||||||||||||
| Notional Amount | Fixed Rate Payable | Fixed Payment Frequency | Floating Rate Receivable (resets monthly) | Floating Payment Frequency | Maturity Date | Value | Upfront Receipts (Payments) | Unrealized Appreciation (Depreciation) | ||||||||||||||||||||||
| $255,000,000 | 0.670% | Monthly | 4.353%n | Monthly | 9/15/25 | $ | 23,400,084 | $ | — | $ | 23,400,084 | |||||||||||||||||||
| 212,500,000 | 1.240% | Monthly | 4.185%n | Monthly | 2/3/26 | 18,063,587 | (54,155 | ) | 18,009,432 | |||||||||||||||||||||
| 85,000,000 | 0.898% | Monthly | 4.120%n | Monthly | 5/1/26 | 8,519,726 | — | 8,519,726 | ||||||||||||||||||||||
| 255,000,000 | 1.237% | Monthly | 4.387%n | Monthly | 9/15/27 | 28,564,579 | — | 28,564,579 | ||||||||||||||||||||||
| $ | 78,547,976 | $ | (54,155 | ) | $ | 78,493,821 | ||||||||||||||||||||||||
| EMTN | Euro Medium Term Note | |
| FRN | Floating Rate Note | |
| LIBOR | London Interbank Offered Rate | |
| MLP | Master Limited Partnership | |
| TruPS | Trust Preferred Securities | |
| USD | United States Dollar |
| † | Represents shares. |
| a | Stapled security. A security contractually bound to one or more other securities to form a single saleable unit which cannot be sold separately. |
| b | All or a portion of the security is pledged as collateral in connection with the Fund’s revolving credit agreement. $1,924,405,379 in aggregate has been pledged as collateral. |
| c | Securities exempt from registration under Rule 144A of the Securities Act of 1933. These securities may only be resold to qualified institutional buyers. Aggregate holdings amounted to $222,619,374 which represents 9.5% of the net assets of the Fund, of which 0.0% are illiquid. |
| d | Non‑income producing security. |
| e | A portion of the security has been rehypothecated in connection with the Fund’s revolving credit agreement. $853,445,959 in aggregate has been rehypothecated. |
| f | All or a portion of the security is pledged in connection with written option contracts. $29,887,774 in aggregate has been pledged as collateral. |
| g | Perpetual security. Perpetual securities have no stated maturity date, but they may be called/redeemed by the issuer. |
| h | Security converts to floating rate after the indicated fixed-rate coupon period. |
| i | Contingent Capital security (CoCo). CoCos are debt or preferred securities with loss absorption characteristics built into the terms of the security for the benefit of the issuer. Aggregate holdings amounted to $116,612,743 which represents 5.0% of the net assets of the Fund (3.6% of the managed assets of the Fund). |
| j | Securities exempt from registration under Regulation S of the Securities Act of 1933. These securities are subject to resale restrictions. Aggregate holdings amounted to $41,389,397 which represents 1.8% of the net assets of the Fund, of which 0.0% are illiquid. |
| k | Variable rate. Rate shown is in effect at December 31, 2022. |
| l | Rate quoted represents the annualized seven‑day yield. |
| m | Represents the number of contracts multiplied by notional contract size multiplied by the underlying price. |
| n | Based on 1‑Month LIBOR. Represents rates in effect at December 31, 2022. |
| Sector Summary | % of Managed Assets | |||
| Electric | 31.7 | |||
| Pipelines | 12.4 | |||
| Communications—Towers | 9.3 | |||
| Banks | 8.5 | |||
| Railways | 8.4 | |||
| Toll Roads | 6.3 | |||
| Gas Distribution | 5.1 | |||
| Airports | 4.9 | |||
| Insurance | 2.8 | |||
| Utilities | 2.5 | |||
| Financial | 1.5 | |||
| Energy | 1.0 | |||
| Diversified Utilities | 0.9 | |||
| Integrated Telecommunications Services | 0.5 | |||
| Other | 4.2 | |||
| 100.0 | ||||
| ASSETS: | ||||
Investments in securities, at valuea (Identified cost—$2,738,642,272) | $ | 3,259,916,123 | ||
| Cash | 886,673 | |||
| Cash collateral pledged for interest rate swap contracts | 19,313,696 | |||
| Foreign currency, at value (Identified cost—$1,245,081) | 1,261,379 | |||
| Receivable for dividends and interest | 14,021,413 | |||
| Other assets | 214,823 | |||
| Total Assets | 3,295,614,107 | |||
| LIABILITIES: | ||||
| Written option contracts, at value (Premiums received—$336,999) | 139,462 | |||
| Payable for: | ||||
| Credit agreement | 950,000,000 | |||
| Interest expense | 3,785,535 | |||
| Investment management fees | 2,398,864 | |||
| Foreign capital gains tax | 2,007,131 | |||
| Investment securities purchased | 886,673 | |||
| Dividends and distributions declared | 739,959 | |||
| Administration fees | 169,332 | |||
| Variation margin on interest rate swap contracts | 52,805 | |||
| Directors’ fees | 666 | |||
| Other liabilities | 1,061,646 | |||
| Total Liabilities | 961,242,073 | |||
| NET ASSETS | $ | 2,334,372,034 | ||
| NET ASSETS consist of: | ||||
| Paid‑in capital | $ | 1,742,477,674 | ||
| Total distributable earnings/(accumulated loss) | 591,894,360 | |||
| $ | 2,334,372,034 | |||
| NET ASSET VALUE PER SHARE: | ||||
| ($2,334,372,034 ÷ 95,820,437 shares outstanding) | $ | 24.36 | ||
| MARKET PRICE PER SHARE | $ | 23.99 | ||
| MARKET PRICE PREMIUM (DISCOUNT) TO NET ASSET VALUE PER SHARE | (1.52 | )% | ||
| a | Includes $1,924,405,379 pledged as collateral, of which $853,445,959 has been rehypothecated in connection with the Fund’s credit agreement, as described in Note 7. |
| Investment Income: | ||||
| Dividend income (net of $4,830,266 of foreign withholding tax) | $ | 88,754,122 | ||
| Interest income | 18,807,899 | |||
| Rehypothecation income | 964,663 | |||
| Total Investment Income | 108,526,684 | |||
| Expenses: | ||||
| Investment management fees | 29,169,649 | |||
| Interest expense | 27,343,992 | |||
| Administration fees | 2,280,889 | |||
| Shareholder reporting expenses | 910,623 | |||
| Custodian fees and expenses | 247,467 | |||
| Professional fees | 200,468 | |||
| Directors’ fees and expenses | 84,676 | |||
| Transfer agent fees and expenses | 21,597 | |||
| Miscellaneous | 222,759 | |||
| Total Expenses | 60,482,120 | |||
| Net Investment Income (Loss) | 48,044,564 | |||
| Net Realized and Unrealized Gain (Loss): | ||||
| Net realized gain (loss) on: | ||||
| Investments in securities | 58,802,185 | |||
| Written option contracts | 4,612,917 | |||
| Interest rate swap contracts | 2,994,937 | |||
| Foreign currency transactions | 433,970 | |||
| Net realized gain (loss) | 66,844,009 | |||
| Net change in unrealized appreciation (depreciation) on: | ||||
| Investments in securities (net of increase in accrued foreign capital gains tax of $1,011,581) | (383,191,531 | ) | ||
| Written option contracts | 639,050 | |||
| Interest rate swap contracts | 71,504,305 | |||
| Foreign currency translations | (53,037 | ) | ||
| Net change in unrealized appreciation (depreciation) | (311,101,213 | ) | ||
| Net Realized and Unrealized Gain (Loss) | (244,257,204 | ) | ||
| Net Increase (Decrease) in Net Assets Resulting from Operations | $ | (196,212,640 | ) | |
| For the Year Ended December 31, 2022 | For the Year Ended December 31, 2021 | |||||||
| Change in Net Assets: | ||||||||
| From Operations: | ||||||||
| Net investment income (loss) | $ | 48,044,564 | $ | 52,283,408 | ||||
| Net realized gain (loss) | 66,844,009 | 167,805,596 | ||||||
| Net change in unrealized appreciation (depreciation) | (311,101,213 | ) | 297,913,564 | |||||
| Net increase (decrease) in net assets resulting from operations | (196,212,640 | ) | 518,002,568 | |||||
| Distributions to Shareholders | (177,437,070 | ) | (174,769,290 | ) | ||||
| Capital Stock Transactions: | ||||||||
| Issued as reinvestment of dividends and distributions (See Note 6) | 5,174,453 | 6,517,557 | ||||||
| Net proceeds from sale of shares (See Note 6) | 17,542,514 | a | 31,376,636 | b | ||||
| Total increase (decrease) in net assets | (350,932,743 | ) | 381,127,471 | |||||
| Net Assets: | ||||||||
| Beginning of year | 2,685,304,777 | 2,304,177,306 | ||||||
| End of year | $ | 2,334,372,034 | $ | 2,685,304,777 | ||||
| a | Net of offering costs of $21,775 and sales charges of $141,721. |
| b | Net of offering costs of $46,241 and sales charges of $253,539. |
| Increase (Decrease) in Cash: | ||||
| Cash Flows from Operating Activities: | ||||
| Net increase (decrease) in net assets resulting from operations | $ | (196,212,640 | ) | |
| Adjustments to reconcile net increase (decrease) in net assets resulting from operations to net cash provided by operating activities: | ||||
| Purchases of long-term investments | (1,273,079,352 | ) | ||
| Proceeds from sales and maturities of long-term investments | 1,326,901,608 | |||
| Net purchases, sales and maturities of short-term investments | (22,499,770 | ) | ||
| Net amortization of premium on investments in securities | 1,527,746 | |||
| Net increase in dividends and interest receivable and other assets | (3,981,041 | ) | ||
| Net increase in interest expense payable, accrued expenses and other liabilities | 2,218,816 | |||
| Net decrease in payable for variation margin on interest rate swap contracts | (361,398 | ) | ||
| Net decrease in premiums received from written option contracts | (68,603 | ) | ||
| Net change in unrealized appreciation on written option contracts | (639,050 | ) | ||
| Net change in unrealized depreciation on investments in securities | 383,191,531 | |||
| Net realized gain on investments in securities | (58,802,185 | ) | ||
| Cash provided by operating activities | 158,195,662 | |||
| Cash Flows from Financing Activities: | ||||
| Proceeds from sale of shares | 17,542,514 | |||
| Dividends and distributions paid | (171,522,658 | ) | ||
| Cash used for financing activities | (153,980,144 | ) | ||
| Increase (decrease) in cash and restricted cash | 4,215,518 | |||
| Cash and restricted cash at beginning of year (including foreign currency) | 17,246,230 | |||
| Cash and restricted cash at end of year (including foreign currency) | $ | 21,461,748 | ||
| Cash | $ | 886,673 | ||
| Restricted cash | 19,313,696 | |||
| Foreign currency | 1,261,379 | |||
| Total cash and restricted cash shown on the Statement of Cash Flows | $ | 21,461,748 | ||
| For the Year Ended December 31, | ||||||||||||||||||||
| 2022 | 2021 | 2020 | 2019 | 2018 | ||||||||||||||||
Per Share Operating Data: | ||||||||||||||||||||
| Net asset value, beginning of year | $28.28 | $24.62 | $27.73 | $22.08 | $25.53 | |||||||||||||||
| Income (loss) from investment operations: | ||||||||||||||||||||
Net investment income (loss)a | 0.50 | 0.56 | 0.41 | 0.57 | 0.52 | |||||||||||||||
| Net realized and unrealized gain (loss) | (2.56 | ) | 4.95 | (1.66 | ) | 6.94 | (1.97 | ) | ||||||||||||
| Total from investment operations | (2.06 | ) | 5.51 | (1.25 | ) | 7.51 | (1.45 | ) | ||||||||||||
| Less dividends and distributions to shareholders from: | ||||||||||||||||||||
| Net investment income | (0.64 | ) | (0.54 | ) | (0.41 | ) | (0.58 | ) | (0.53 | ) | ||||||||||
| Net realized gain | (1.22 | ) | (1.32 | ) | (1.45 | ) | (1.28 | ) | (1.47 | ) | ||||||||||
| Total dividends and distributions to shareholders | (1.86 | ) | (1.86 | ) | (1.86 | ) | (1.86 | ) | (2.00 | ) | ||||||||||
| Anti-dilutive effect from the issuance of shares | 0.00 | b | 0.01 | — | — | — | ||||||||||||||
| Net increase (decrease) in net asset value | (3.92 | ) | 3.66 | (3.11 | ) | 5.65 | (3.45 | ) | ||||||||||||
| Net asset value, end of year | $24.36 | $28.28 | $24.62 | $27.73 | $22.08 | |||||||||||||||
| Market value, end of year | $23.99 | $28.50 | $25.82 | $26.20 | $19.76 | |||||||||||||||
Total net asset value returnc | -7.42 | % | 23.10 | % | -3.66 | % | 35.09 | % | -5.34 | % | ||||||||||
Total market value returnc | -9.53 | % | 18.29 | % | 6.94 | % | 42.63 | % | -9.89 | % | ||||||||||
| For the Year Ended December 31, | ||||||||||||||||||||
| 2022 | 2021 | 2020 | 2019 | 2018 | ||||||||||||||||
Ratios/Supplemental Data: | ||||||||||||||||||||
| Net assets, end of year (in millions) | $2,334.4 | $2,685.3 | $2,304.1 | $2,593.6 | $1,883.8 | |||||||||||||||
| Ratios to average daily net assets: | ||||||||||||||||||||
| Expenses | 2.44 | % | 2.19 | % | 2.53 | % | 2.50 | % | 2.44 | % | ||||||||||
| Expenses (excluding interest expense) | 1.34 | % | 1.34 | % | 1.35 | % | 1.36 | % | 1.39 | % | ||||||||||
| Net investment income (loss) | 1.94 | % | 2.10 | % | 1.73 | % | 2.18 | % | 2.18 | % | ||||||||||
Ratio of expenses to average daily managed assetsd | 1.76 | % | 1.59 | % | 1.83 | % | 1.81 | % | 1.73 | % | ||||||||||
| Portfolio turnover rate | 38 | % | 47 | % | 54 | % | 41 | % | 37 | % | ||||||||||
Credit Agreement | ||||||||||||||||||||
| Asset coverage ratio for credit agreement | 346 | % | 383 | % | 371 | % | 405 | % | 322 | % | ||||||||||
| Asset coverage per $1,000 for credit agreement | $3,457 | $3,827 | $3,711 | $4,051 | $3,216 | |||||||||||||||
| Amount of loan outstanding (in millions) | $950.0 | $950.0 | $850.0 | $850.0 | $850.0 | |||||||||||||||
| a | Calculation based on average shares outstanding. |
| b | Amount is less than $0.005. |
| c | Total net asset value return measures the change in net asset value per share over the period indicated. Total market value return is computed based upon the Fund’s market price per share and excludes the effects of brokerage commissions. Dividends and distributions are assumed, for purposes of these calculations, to be reinvested at prices obtained under the Fund’s dividend reinvestment plan. |
| d | Average daily managed assets represent net assets plus the outstanding balance of the credit agreement. |
| • | Level 1—quoted prices in active markets for identical investments |
| • | Level 2—other significant observable inputs (including quoted prices for similar investments, interest rates, credit risk, etc.) |
| • | Level 3—significant unobservable inputs (including the Fund’s own assumptions in determining the fair value of investments) |
| Quoted Prices in Active Markets for Identical Investments (Level 1) | Other Significant Observable Inputs (Level 2) | Significant Unobservable Inputs (Level 3) | Total | |||||||||||||
| Common Stock: | ||||||||||||||||
| Thailand | $ | — | $ | 48,169,121 | $ | — | $ | 48,169,121 | ||||||||
| United States | 1,558,905,391 | 14,371,834 | — | 1,573,277,225 | ||||||||||||
| Other Countries | 1,031,756,603 | — | — | 1,031,756,603 | ||||||||||||
| Preferred Securities— $25 Par Value | 78,436,560 | — | — | 78,436,560 | ||||||||||||
| Preferred Securities— Capital Securities | — | 456,247,991 | — | 456,247,991 | ||||||||||||
| Corporate Bonds | — | 6,152,343 | — | 6,152,343 | ||||||||||||
| Short-Term Investments | — | 65,868,828 | — | 65,868,828 | ||||||||||||
| Purchased Option Contracts | 7,452 | — | — | 7,452 | ||||||||||||
Total Investments in Securitiesa | $ | 2,669,106,006 | $ | 590,810,117 | $ | — | $ | 3,259,916,123 | ||||||||
| Interest Rate Swap Contracts | $ | — | $ | 78,493,821 | $ | — | $ | 78,493,821 | ||||||||
Total Derivative Assetsa | $ | — | $ | 78,493,821 | $ | — | $ | 78,493,821 | ||||||||
| Written Option Contracts | $ | (139,462 | ) | $ | — | $ | — | $ | (139,462 | ) | ||||||
Total Derivative Liabilitiesa | $ | (139,462 | ) | $ | — | $ | — | $ | (139,462 | ) | ||||||
| a | Portfolio holdings are disclosed individually on the Schedule of Investments. |
| Ex‑Date | Record Date | Payable Date | Amount | |||
| 1/17/23 | 1/18/23 | 1/31/23 | $0.155 | |||
| 2/14/23 | 2/15/23 | 2/28/23 | $0.155 | |||
| 3/14/23 | 3/15/23 | 3/31/23 | $0.155 |
| Assets | Liabilities | |||||||||||
| Derivatives | Location | Fair Value | Location | Fair Value | ||||||||
| Equity Risk: | ||||||||||||
Purchased Option Contracts—Exchange‑Tradeda | Investments in securities, at value | $ | 7,452 | — | $ | — | ||||||
Written Option Contracts—Exchange-Tradeda | — | — | Written option contracts, at value | 139,462 | ||||||||
| Interest Rate Risk: | ||||||||||||
Interest Rate Swap Contractsa | — | — | Payable for variation margin on interest rate swap contracts | 78,493,821 | b | |||||||
| a | Not subject to a master netting agreement or another similar arrangement. |
| b | Amount represents the cumulative appreciation on interest rate swap contracts as reported on the Schedule of Investments. The Statement of Assets and Liabilities only reflects the current day variation margin payable to the broker. |
| Derivatives | Location | Realized Gain (Loss) | Change in Unrealized Appreciation (Depreciation) | |||||||
| Equity Risk: | ||||||||||
Purchased Option Contractsa | Net Realized and Unrealized Gain (Loss) | $ | (119,738 | ) | $ | (154,595 | ) | |||
| Written Option Contracts | Net Realized and Unrealized Gain (Loss) | 4,612,917 | 639,050 | |||||||
| Interest Rate Risk: | ||||||||||
| Interest Rate Swap Contracts | Net Realized and Unrealized Gain (Loss) | 2,994,937 | 71,504,305 | |||||||
| a | Purchased option contracts are included in net realized gain (loss) and change in unrealized appreciation (depreciation) on investments in securities. |
| Purchased Option Contracts | Written Option Contracts | |||||||
Average Notional Amounta,b | $ | 16,699,348 | $ | 41,582,943 | ||||
| a | Notional amount is calculated using the number of contracts multiplied by notional contract size multiplied by the underlying price. |
| b | Average notional amounts represent the average for all months in which the Fund had option contracts outstanding at month end. For the period, this represents three months for purchased options and twelve months for written option contracts. |
| For the Year Ended December 31, | ||||||||
| 2022 | 2021 | |||||||
| Ordinary income | $ | 82,163,091 | $ | 93,283,817 | ||||
| Long-term capital gain | 95,273,979 | 81,485,473 | ||||||
| Total dividends and distributions | $ | 177,437,070 | $ | 174,769,290 | ||||
| Cost of investments in securities for federal income tax purposes | $ | 2,745,436,598 | ||
| Gross unrealized appreciation on investments | $ | 718,578,488 | ||
| Gross unrealized depreciation on investments | (127,466,247 | ) | ||
| Net unrealized appreciation (depreciation) on investments | $ | 591,112,241 | ||
| For the Year Ended | Title of Security | Total Principal Amount Outstanding | Asset Coverage Per $1,000 of Principal Amount | |||
| 12/31/2022 | Borrowings | $950,000,000 | $3,457 | |||
| 12/31/2021 | Borrowings | $950,000,000 | $3,827 | |||
| 12/31/2020 | Borrowings | $850,000,000 | $3,711 | |||
| 12/31/2019 | Borrowings | $850,000,000 | $4,051 | |||
| 12/31/2018 | Borrowings | $850,000,000 | $3,216 | |||
| 12/31/2017 | Borrowings | $850,000,000 | $3,562 | |||
| 12/31/2016 | Borrowings | $850,000,000 | $3,208 | |||
| 12/31/2015 | Borrowings | $850,000,000 | $3,230 | |||
| 12/31/2014 | Borrowings | $850,000,000 | $3,600 | |||
| 12/31/2013 | Borrowings | $850,000,000 | $3,362 |
| • | generation, transmission, sale or distribution of electric energy; |
| • | distribution, purification and treatment of water; |
| • | production, transmission or distribution of natural resources used to produce energy; and |
| • | provision of communication services, including cable television, satellite, microwave, radio, telephone and other communications media. |
| • | high interest costs in connection with capital construction and improvement programs; |
| • | difficulty in raising capital in adequate amounts on reasonable terms in periods of high inflation and unsettled capital markets; |
| • | inexperience with and potential losses resulting from a developing deregulatory environment; |
| • | costs associated with compliance with and changes in environmental and other regulations; |
| • | regulation or adverse actions by various government authorities; |
| • | government regulation of rates charged to customers; |
| • | service interruption due to environmental, operational or other mishaps; |
| • | the imposition of special tariffs and changes in tax laws, regulatory policies and accounting standards; |
| • | technological innovations that may render existing plants, equipment or products obsolete; and |
| • | general changes in market sentiment towards infrastructure and utilities assets. |
| • | Deferral and Omission Risk. Preferred securities may include provisions that permit the issuer, at its discretion, to defer or omit distributions for a stated period without any adverse consequences to the issuer. In certain cases, deferring or omitting distributions may be mandatory. If the Fund owns a preferred security that is deferring its distributions, the Fund may be required to report income for tax purposes although it has not yet received such income. In addition, recent changes in bank regulations may increase the likelihood for issuers to defer or omit distributions. |
| • | Credit and Subordination Risk. Credit risk is the risk that a preferred security in the Fund’s portfolio will decline in price or the issuer of the security will fail to make dividend, interest or principal payments when due because the issuer experiences a decline in its financial status. Preferred securities are generally subordinated to bonds and other debt instruments in a company’s capital structure in terms of having priority to corporate income, claims to corporate assets and liquidation payments, and therefore will be subject to greater credit risk than more senior debt instruments. |
| • | Interest Rate Risk. Interest rate risk is the risk that preferred securities will decline in value because of changes in market interest rates. When market interest rates rise, the market value of such securities generally will fall, and therefore the Fund may underperform during periods of rising interest rates. The Fund may be subject to a greater risk of rising interest rates than would normally be the case due to the current period of historically low rates, the effect of government monetary policy initiatives and resulting market reaction to those initiatives and recent inflationary price movements. Preferred securities without maturities or with longer periods before maturity may be more sensitive to interest rate changes. |
| • | Prepayment and Extension Risk. Prepayment risk is the risk that changes in interest rates, credit spreads or other factors will result in the call (repayment) of a preferred security more quickly than expected, such that the Fund may have to invest the proceeds in lower yielding securities, or that expectations of such early call will negatively impact the market price of the security. Extension risk is the risk that changes in the interest rates or credit spreads may result in diminishing call expectations, which can cause prices to fall. |
| • | Floating-Rate and Fixed‑to‑Floating‑Rate Securities Risk. The market value of floating-rate securities is a reflection of discounted expected cash flows based on expectations for future interest rate resets. The market value of such securities may fall in a declining interest rate environment and may also fall in a rising interest rate environment if there is a lag between the rise in interest rates and the reset. This risk may also be present with respect to fixed‑to‑floating‑rate securities in which the Fund may invest. A secondary risk associated with declining interest rates is the risk that income earned by the Fund on floating-rate and fixed‑to‑floating‑rate securities will decline due to lower coupon payments on floating-rate securities. |
| • | Call, Reinvestment and Income Risk. During periods of declining interest rates, an issuer may be able to exercise an option to redeem its issue at par earlier than scheduled which is generally known as call risk. Recent regulatory changes may increase call risk with respect to certain types of preferred securities. If this occurs, the Fund may be forced to reinvest in lower yielding securities. This is known as reinvestment risk. Preferred securities frequently have call |
| features that allow the issuer to repurchase the security prior to its stated maturity. An issuer may redeem preferred securities if the issuer can refinance the preferred securities at a lower cost due to declining interest rates or an improvement in the credit standing of the issuer, or in the event of regulatory changes affecting the capital treatment of a security. Another risk associated with a declining interest rate environment is that the income from the Fund’s portfolio may decline over time when the Fund invests the proceeds from new share sales at market rates that are below the portfolio’s current earnings rate. |
| • | Liquidity Risk. Certain preferred securities may be substantially less liquid than many other securities, such as common stocks or U.S. government securities. Illiquid securities involve the risk that the securities will not be able to be sold at the time desired by the Fund or at prices approximating the value at which the Fund is carrying the securities on its books. |
| • | Limited Voting Rights Risk. Generally, traditional preferred securities offer no voting rights with respect to the issuer unless preferred dividends have been in arrears for a specified number of periods, at which time the preferred security holders may elect a number of directors to the issuer’s board of directors. Generally, once all the arrearages have been paid, the preferred security holders no longer have voting rights. Hybrid-preferred security holders generally have no voting rights. |
| • | Special Redemption Rights. In certain varying circumstances, an issuer of preferred securities may redeem the securities prior to a specified date. For instance, for certain types of preferred securities, a redemption may be triggered by a change in U.S. federal income tax or securities laws. As with call provisions, a redemption by the issuer may have a negative impact on the return of the security held by the Fund. See “Call, Reinvestment and Income Risk” above and “Regulatory Risk” below. |
| • | New Types of Securities. From time to time, preferred securities, including hybrid-preferred securities, have been, and may in the future be, offered having features other than those described herein. The Fund reserves the right to invest in these securities if the investment manager believes that doing so would be consistent with the Fund’s investment objective and policies. Since the market for these instruments would be new, the Fund may have difficulty disposing of them at a suitable price and time. In addition to limited liquidity, these instruments may present other risks, such as high price volatility. |
| • | Credit Risk. Credit risk refers to the possibility that the issuer of a security will not be able to make payments of interest and principal when due because the issuer of the security experiences a decline in its financial status. Changes in an issuer’s credit rating or the market’s perception of an issuer’s creditworthiness may also affect the value of the Fund’s investment in that issuer. |
| • | Interest Rate Risk. Interest rate risk is the risk that debt securities will decline in value because of changes in market interest rates. When market interest rates rise, the market value of such securities generally will fall, and therefore the Fund may underperform during periods of rising interest rates. The Fund may be subject to a greater risk of rising interest rates than would normally be the case due to the current period of historically low rates, the effect of government |
| monetary policy initiatives and resulting market reaction to those initiatives and recent inflationary price movements. Debt securities with longer periods before maturity may be more sensitive to interest rate changes. |
| • | Prepayment and Extension Risk. Prepayment risk is the risk that changes in interest rates, credit spreads or other factors will result in the call (repayment) of a debt security more quickly than expected, such that the Fund may have to invest the proceeds in lower yielding securities, or that expectations of such early call will negatively impact the market price of the security. Extension risk is the risk that changes in the interest rates or credit spreads may result in diminishing call expectations, which can cause prices to fall. |
| • | Call Risk. Call risk is the risk that, during a period of falling interest rates, the issuer may redeem a security by repaying it early, which may reduce the Fund’s income if the proceeds are reinvested at lower interest rates. |
| • | Liquidity Risk. Certain debt securities may be substantially less liquid than many other securities, such as common stocks or U.S. government securities. Illiquid securities involve the risk that the securities will not be able to be sold at the time desired by the Fund or at prices approximating the value at which the Fund is carrying the securities on its books. |
| • | Convertible Securities Risk. The market value of a convertible security performs like that of a regular debt security; that is, if market interest rates rise, the value of a convertible security usually falls. In addition, convertible securities are subject to the risk that the issuer will not be able to pay interest or dividends when due, and their market value may change based on changes in the issuer’s credit rating or the market’s perception of the issuer’s creditworthiness. Because it derives a portion of its value from the common stock into which it may be converted, a convertible security is also subject to the same types of market and issuer risk as apply to the underlying common stock. |
| • | future foreign economic, financial, political and social developments; |
| • | different legal systems; |
| • | the possible imposition of exchange controls or other foreign governmental laws or restrictions; |
| • | less governmental supervision; |
| • | regulation changes; |
| • | less publicly available information about foreign companies due to less rigorous disclosure and accounting standards or regulatory practices; |
| • | high and volatile rates of inflation; |
| • | Foreign currency devaluation; |
| • | fluctuating interest rates; and |
| • | different accounting, auditing and financial record-keeping standards and requirements. |
| • | the possibility of expropriation of assets; |
| • | confiscatory taxation; |
| • | difficulty in obtaining or enforcing a court judgment; |
| • | economic, political or social instability; and |
| • | diplomatic developments that could affect investments in those countries. |
| • | growth of gross domestic product; |
| • | rates of inflation; |
| • | capital reinvestment; |
| • | resources; |
| • | self-sufficiency; and |
| • | balance of payments position. |
| • | Limited Partner Risk. An investment in MLPs involves risks that differ from a similar investment in equity securities, such as common stock, of a corporation. Holders of equity securities issued by MLPs have the rights typically afforded to limited partners in a limited partnership. As compared to common stockholders of a corporation, holders of such equity securities have more limited control and limited rights to vote on matters affecting the partnership. There are certain tax risks associated with an investment in certain MLP units (described further under “Tax Risk” below). Additionally, conflicts of interest may exist among common unit holders, subordinated unit holders and the general partner or managing member of an MLP; for example, a conflict may arise as a result of incentive distribution payments. |
| • | Affiliated Party Risk. Certain MLPs in which the Fund may invest depend upon their parent or sponsor entities for the majority of their revenues. If their parent or sponsor entities fail to make such payments or satisfy their obligations, the revenues and cash flows of such MLPs and ability of such MLPs to make distributions to unit holders, such as the Fund, would be adversely affected. |
| • | General Equity Securities Risk. Equity securities issued by MLPs also are subject to the risks associated with all equity investments, including the risk that the value of such securities will fall due to general market or economic conditions, perceptions regarding the industries in which the issuers of securities held by the Fund participate, changes in interest rates, and the particular circumstances and performance of particular companies whose securities the Fund holds. The price of an equity security of an issuer may be particularly sensitive to general movements in the stock market, or a drop in the stock market may depress the price of most or all of the equity securities held by the Fund. In addition, equity securities of MLPs and MLP affiliates held by the Fund may decline in price if the issuer fails to make anticipated |
| distributions or dividend payments because, among other reasons, the issuer experiences a decline in its financial condition. |
| • | MLP Subordinated Units. MLP subordinated units are MLP units that are subordinate in the capital structure to common units. The Fund will typically purchase MLP subordinated units through negotiated transactions directly with affiliates of MLPs and institutional holders of such units or will purchase newly-issued subordinated units directly from MLPs. Holders of MLP subordinated units are typically entitled to receive minimum quarterly distributions (MQDs) after payments to holders of common units have been satisfied and prior to incentive distributions to the general partner or managing member. MLP subordinated units do not typically provide arrearage rights. MLP subordinated units typically are convertible to MLP common units at a one‑to‑one ratio. The price of MLP subordinated units is typically tied to the price of the corresponding MLP common unit, less a discount. The size of the discount depends upon a variety of factors, including the likelihood of conversion, the length of time remaining until conversion and the size of the block of subordinated units being purchased or sold. |
| • | Debt Securities. Debt securities issued by MLPs are subject to the risks associated with all debt investments, including interest rate risk, credit risk and lower rated securities risk. Interest rate risk is the risk that bond prices will decline because of rising interest rates. Credit risk is the risk that a security in the Fund’s portfolio will decline in price or the issuer will fail to make dividend, interest or principal payments when due because the issuer of the security experiences a decline in its financial status. Lower rated securities generally involve greater volatility of price and risk of loss of income and principal, and may be more susceptible to real or perceived adverse economic and competitive industry conditions than higher grade securities. |
| • | MLP Affiliates and MLP I‑Shares. Affiliates of MLPs, such as general partners or managing members of MLPs, may issue equity securities in which the Fund may invest. Many issuers of such equity securities are treated as C corporations for U.S. federal income tax purposes and such securities therefore will have different tax characteristics than securities of QPTPs. MLP I‑Shares are securities issued by MLP affiliates that use the proceeds from the sale of MLP I‑Shares to purchase limited partnership interests in the MLP in the form of MLP i‑units. Securities of MLP affiliates and MLP I‑Shares represent an indirect investment in the equity securities of MLPs. Prices and volatilities of the securities of MLP affiliates and MLP I‑Shares tend to correlate to the price of MLP common units. Holders of the securities of MLP affiliates and MLP I‑Shares are therefore subject to the same risks as holders of equity securities of MLPs. |
| • | MLP Funds. An investment in the shares of another fund is subject to the risks associated with that fund’s portfolio securities. To the extent the Fund invests in shares of another fund, Fund stockholders would indirectly pay a portion of that fund’s expenses, including advisory fees, brokerage and other distribution expenses. These fees and expenses are in addition to the direct expenses of the Fund’s own operations. |
| • | ETNs. An ETN is typically an unsecured, unsubordinated debt security issued by a sponsoring institution, which may include a government entity, financial institution or corporation. ETNs are subject to the credit risk of the sponsoring institution as well as market risk. ETNs that track the performance of MLPs or MLP indices are also subject to the risks applicable to investments in MLPs. |
| • | Fluctuations in commodity prices may impact the volume of commodities transported, processed, stored or distributed. |
| • | Reduced volumes of natural gas or other energy commodities available for transporting, processing, storing or distributing may affect the profitability of MLPs and Energy Investments. |
| • | Slowdowns in new construction and acquisitions can limit growth potential. |
| • | A sustained reduced demand for crude oil, natural gas and refined petroleum products that could adversely affect revenues and cash flows. |
| • | Depletion of the natural gas reserves or other commodities if not replaced, which could impact the ability of MLPs and Energy Investments to make distributions. |
| • | Changes in the regulatory environment could adversely affect the profitability of MLPs and Energy Investments. |
| • | Extreme weather or other natural disasters could impact the value of MLPs and Energy Investments. |
| • | Rising interest rates which could result in a higher cost of capital and divert investors into other investment opportunities. |
| • | Threats of attack by terrorists on energy assets could impact the market for MLPs and Energy Investments. |
| • | Weakening energy market fundamentals may increase counterparty risk and impact MLP profitability. Specifically, energy companies suffering financial distress may be able to abrogate contracts with MLPs, decreasing or eliminating sources of revenue. |
| • | Manager Risk. The Fund’s investments in other funds are subject to the ability of the managers of those funds to achieve the funds’ investment objective. |
| • | Dilution Risk. Strategies employed by a closed‑end fund, such as rights offerings, may, under certain circumstances, have the effect of reducing its share price and the Fund’s proportionate interest. |
| • | Foreign Fund Risk. Risks associated with investments in non‑U.S. funds may be different than those of investments in U.S. funds. Non‑U.S. funds are subject to different regulatory regimes that may be less rigorous than in the United States in areas such as governance and financial reporting requirements. There also may be less publicly available information about such funds, |
| and investments in these funds may carry special tax consequences. In addition, non‑U.S. funds are generally subject to the risks of investing in other types of foreign securities. |
| • | Business Development Companies (BDCs) Risk. Investments in closed‑end funds that are BDCs may be subject to a high degree of risk. BDCs typically invest in small and medium‑sized companies that may not have access to public equity markets for capital raising. As a result, a BDC’s portfolio typically will include a substantial amount of securities purchased in private placements, and the portfolio may carry risks similar to those of a private equity or venture capital fund. Securities that are not publicly registered may be difficult to value and may be difficult to sell at a price representative of their intrinsic value. |
| • | ETF Risk. An ETF that is based on a specific index, whether securities, commodities or a combination of the two, may not be able to replicate and maintain exactly the composition and relative weighting of securities in the index. An ETF also incurs certain expenses not incurred by its applicable index. The market value of an ETF share may differ from its NAV; the share may trade at a premium or discount to its NAV, which may be due to, among other things, differences in the supply and demand in the market for the share and the supply and demand in the market for the underlying assets of the ETF. In addition, certain securities that are part of the index tracked by an ETF may, at times, be unavailable, which may impede the ETF’s ability to track its index. An ETF that utilizes leverage can, at times, be relatively illiquid, which can affect whether its share price approximates NAV. As a result of using leverage, a leveraged ETF is subject to the risk of failure in the futures and options markets it uses to obtain leverage and the risk that a counterparty will default on its obligations, which can result in a loss to the Fund. |
| • | declines in the value of real estate; |
| • | risks related to general and local economic conditions; |
| • | possible lack of availability of mortgage funds; |
| • | overbuilding; |
| • | extended vacancies of properties; |
| • | increased competition; |
| • | increases in property taxes and operating expenses; |
| • | changes in zoning laws; |
| • | losses due to costs resulting from the clean‑up of environmental problems; |
| • | liability to third parties for damages resulting from environmental problems; |
| • | casualty or condemnation losses; |
| • | limitations on rents; |
| • | changes in neighborhood values and the appeal of properties to tenants; |
| • | changes in interest rates; |
| • | financial condition of tenants, buyers and sellers of real estate; |
| • | quality of maintenance, insurance and management services; |
| • | falling home prices; |
| • | failure of borrowers to repay their loans; |
| • | early payment or restricting of mortgage loans; |
| • | slower mortgage origination; and |
| • | rising construction costs. |
| Assumed Portfolio Total Return | –10 | % | –5 | % | 0 | % | 5 | % | 10 | % | ||||||||||
| Common Share Total Return | (16.2 | )% | (9.2 | )% | (2.1 | )% | 4.9 | % | 12.0 | % |
| • | the possibility of expropriation of assets; |
| • | confiscatory taxation; |
| • | difficulty in obtaining or enforcing a court judgment; |
| • | economic, political or social instability; and |
| • | diplomatic developments that could affect investments in those countries. |
| • | Price Limits. Some futures exchanges impose on each futures contract traded on that exchange a maximum permissible price movement for each trading session. If the maximum permissible price movement is achieved on any trading day, no more trades may be executed above (or below, if the price has moved downward) that limit. If the Fund wishes to execute a trade outside the daily permissible price movement, it would be prevented from doing so by exchange rules, and would have to wait for another trading session to execute its transaction. |
| • | Price Volatility. Despite the daily price limits on various futures exchanges, the price volatility of futures contracts has been historically greater than that for traditional securities such as stocks and bonds. To the extent that the Fund invests in futures contracts, the assets of the Fund, and therefore the prices of Fund shares, may be subject to greater volatility. |
| • | Margin. In connection with futures contracts and options on futures contracts, the Fund typically posts margin directly to a futures commission merchant (FCM), who is expected typically to re‑hypothecate the margin to an exchange or clearinghouse. Prior to re‑hypothecation, such margin may be held by the FCM in commingled accounts with margin from other clients of the FCM, but must be segregated from the FCM’s proprietary funds. The margin maintained by the FCM is not subject to the same regulatory protections provided by bank custody arrangements. If margin is posted to the FCM and re‑hypothecated, neither the Fund nor the FCM to whom the margin was posted will have custody of the margin. If margin posted by the Fund is not maintained with the Fund’s custodian, the Fund is fully exposed to the fraud and unsecured credit risk of the FCM to whom the margin is posted. |
| • | Credit Risk. To the extent the Fund engages in futures transactions, it will be exposed to the credit risk of the central clearinghouse on which the futures contract is cleared and to the credit/ |
| counterparty risk of its FCM. If the Fund’s FCM becomes bankrupt or insolvent, or otherwise defaults on its obligations to the Fund, the Fund may not receive all amounts owed to it in respect of its trading, even if the clearinghouse fully discharges all of its obligations. The CEA requires an FCM to segregate all funds received from its customers with respect to regulated futures transactions from such FCM’s proprietary funds. If an FCM were not to do so to the full extent required by law, the assets of an account might not be fully protected in the event of the bankruptcy of an FCM. Furthermore, in the event of an FCM’s bankruptcy, the Fund may under certain circumstances be limited to recovering only a pro rata share of all available funds segregated on behalf of an FCM’s combined customer accounts, even if certain property held by an FCM is specifically traceable to the Fund. It is possible that the Fund would be unable to recover from the FCM’s estate the full amount of its funds on deposit with such FCM and owing to the Fund. Such situations could arise due to various factors, or a combination of factors, including inadequate FCM capitalization, inadequate controls on customer trading and inadequate customer capital. In addition, in the event of the bankruptcy or insolvency of a clearinghouse, the Fund might experience a loss of funds deposited through its FCM as margin with the clearing house, a loss of unrealized profits on its open positions and the loss of funds owed to it as realized profits on closed positions. Such a bankruptcy or insolvency might also cause a substantial delay before the Fund could obtain the return of funds owed to it by an FCM who is a member of such clearing house. |
| • | Position Limits. Speculative position limits prescribe the maximum net long or short futures contract and options positions which any person or group may hold or control in particular futures contracts. Most futures contracts and options on futures contracts traded on exchanges located in the United States are subject to speculative position limits established either by the CFTC or the relevant exchange. In addition, the CFTC recently finalized a rule which, once effective, will materially expand the scope of contracts subject to federal limits to include additional futures and options and certain swaps. Such regulations may adversely affect the investment manager’s ability to maintain positions in certain futures contracts and related options and swaps for the Fund. Generally, no speculative position limits are in effect with respect to the trading of spot currency and forward contracts. |
| • | An interest rate swap agreement involves the exchange of cash flows based on interest rate specifications and a specified principal amount, often a fixed payment for a floating payment that is linked to an interest rate. In an interest rate cap one party receives payments at the end of each period in which a specified interest rate on a specified principal amount exceeds an agreed rate; conversely, in an interest rate floor one party may receive payments if a specified interest rate on a specified principal amount falls below an agreed rate. Interest rate collars involve selling a cap and purchasing a floor, or vice versa, to protect the Fund against interest rate movements exceeding given minimum or maximum levels. |
| • | Credit default swap agreements and similar agreements may have as reference obligations debt securities that are or are not currently held by the Fund. The protection “buyer” in a credit default contract may be obligated to pay the protection “seller” an upfront payment or a |
| periodic stream of payments over the term of the contract. If a credit event occurs, the seller generally must pay the buyer the “par value” (full notional value) of the swap in exchange for an equal face amount of deliverable obligations of the reference entity described in the swap, or the seller will be required to deliver net cash amount generally representing the difference between the market value of the reference obligation and the par value of the reference obligation, if the swap is cash settled. |
| • | In a total return or “equity” swap agreement, one party makes payments based on a set rate, either fixed or variable, while the other party makes payments based on the return of an underlying asset, which includes both the income it generates and any capital gains. The underlying reference asset of a total return swap may include an individual security, an equity index, loans or bonds. |
| 1. | Issue senior securities (including borrowing money for other than temporary purposes) except in conformity with the limits set forth in the 1940 Act; or pledge its assets other than to secure such issuances or borrowings or in connection with permitted investment strategies; provided that, notwithstanding the foregoing, the Fund may borrow up to an additional 5% of its total assets for temporary purposes; |
| 2. | Act as an underwriter of securities issued by other persons, except insofar as the Fund may be deemed an underwriter in connection with the disposition of securities; |
| 3. | Purchase or sell real estate, mortgages on real estate or commodities, except that the Fund may invest in securities of companies that deal in real estate or are engaged in the real estate business, including REITs, and securities secured by real estate or interests therein and the Fund may hold and sell real estate or mortgages on real estate acquired through default, liquidation, or other distributions of an interest in real estate as a result of the Fund’s ownership of such securities; |
| 4. | Purchase or sell commodities or commodity futures contracts, except that the Fund may invest in financial futures contracts, options thereon and such similar instruments; |
| 5. | Make loans to other persons except through the lending of securities held by it (but not to exceed a value of one‑third of total assets), through repurchase agreements, and by the purchase of debt securities; |
| 6. | Invest more than 25% of its Managed Assets in securities of issuers in any one industry, except for securities in infrastructure companies; |
| 7. | Pledge, mortgage or hypothecate its assets other than to secure such issuances or borrowings or in connection with permitted investment strategies; provided that, notwithstanding the foregoing, the Fund may borrow up to an additional 5% of its total assets for temporary purposes. |
| 1. | Invest in oil, gas or other mineral exploration programs, development programs or leases, except that the Fund may purchase securities of companies engaging in whole or in part in such activities. |
| 2. | Acquire or retain securities of any investment company, except that the Fund may (a) acquire securities of investment companies up to the limits permitted by Section 12(d)(1) of the 1940 |
| Act, or any exemption granted under the 1940 Act and the rules thereunder, and (b) through the acquisition of securities of any investment company as part of a merger, consolidation or similar transaction. |
Name, Address and Year of Birth1 | Position(s) Held With Fund | Term of Office2 | Principal Occupation During At Least The Past 5 Years (Including Other Directorships Held) | Number of Funds Within Fund Complex Overseen by Director (Including the Fund) | Length of Time Served3 | |||||||
| Interested Directors4 | ||||||||||||
Joseph M. Harvey 1963 | Director, Chair | Until Next Election of Directors | Chief Executive Officer since 2022 and President since 2003 of Cohen & Steers Capital Management, Inc. (“CSCM”), and Chief Executive Officer since 2022 and President since 2004 of Cohen & Steers, Inc. (“CNS”). Chief Investment Officer of CSCM from 2003 to 2019. Prior to that, Senior Vice President and Director of Investment Research of CSCM. | 21 | Since 2014 | |||||||
Adam M. Derechin 1964 | Director | Until Next Election of Directors | Chief Operating Officer of CSCM since 2003 and CNS since 2004. President and Chief Executive Officer of the Funds from 2005 to 2021. | 21 | Since 2021 | |||||||
| Independent Directors | ||||||||||||
Michael G. Clark 1965 | Director | Until Next Election of Directors | CFA; From 2006 to 2011, President and Chief Executive Officer of DWS Funds and Managing Director of Deutsche Asset Management. | 21 | Since 2011 | |||||||
Name, Address and Year of Birth1 | Position(s) Held With Fund | Term of Office2 | Principal Occupation During At Least The Past 5 Years (Including Other Directorships Held) | Number of Funds Within Fund Complex Overseen by Director (Including the Fund) | Length of Time Served3 | |||||
George Grossman 1953 | Director | Until Next Election of Directors | Attorney‑at‑law. | 21 | Since 1993 | |||||
Dean A. Junkans 1959 | Director | Until Next Election of Directors | CFA; Advisor to SigFig (a registered investment advisor) since July, 2018; Chief Investment Officer at Wells Fargo Private Bank from 2004 to 2014 and Chief Investment Officer of the Wealth, Brokerage and Retirement group at Wells Fargo & Company from 2011 to 2014; former Member and Chair, Claritas Advisory Committee at the CFA Institute from 2013 to 2015; former Adjunct Professor and Executive-In-Residence, Bethel University, 2015 to 2022; former Board Member and Investment Committee member, Bethel University Foundation, 2010 to 2022; former Corporate Executive Board Member of the National Chief Investment Officers Circle, 2010 to 2015; formerly, Member of the Board of Governors of the University of Wisconsin Foundation, River Falls, 1996 to 2004; U.S. Army Veteran, Gulf War. | 21 | Since 2015 | |||||
Name, Address and Year of Birth1 | Position(s) Held With Fund | Term of Office2 | Principal Occupation During At Least The Past 5 Years (Including Other Directorships Held) | Number of Funds Within Fund Complex Overseen by Director (Including the Fund) | Length of Time Served3 | |||||
Gerald J. Maginnis 1955 | Director | Until Next Election of Directors | Philadelphia Office Managing Partner, KPMG LLP from 2006 to 2015; Partner in Charge, KPMG Pennsylvania Audit Practice from 2002 to 2008; President, Pennsylvania Institute of Certified Public Accountants (PICPA) from 2014 to 2015; Member, PICPA Board of Directors from 2012 to 2016; Member, Council of the American Institute of Certified Public Accountants (AICPA) from 2013 to 2017; Member, Board of Trustees of AICPA Foundation from 2015 to 2020; Board member and Audit Committee Chairman of inTEST Corporation since 2020; Chairman of the Advisory Board of Centri Consulting LLC since 2022. | 21 | Since 2015 | |||||
Jane F. Magpiong 1960 | Director | Until Next Election of Directors | President, Untap Potential since 2013; Senior Managing Director, TIAA-CREF, from 2011 to 2013; National Head of Wealth Management, TIAA- CREF, from 2008 to 2011; President, Bank of America Private Bank from 2005 to 2008; and prior to that, Executive Vice President, Fleet Private Clients Group, from 2003 to 2004. | 21 | Since 2015 | |||||
Name, Address and Year of Birth1 | Position(s) Held With Fund | Term of Office2 | Principal Occupation During At Least The Past 5 Years (Including Other Directorships Held) | Number of Funds Within Fund Complex Overseen by Director (Including the Fund) | Length of Time Served3 | |||||
Daphne L. Richards 1966 | Director | Until Next Election of Directors | President and CIO of Ledge Harbor Management since 2016; Investment Committee Member of the Berkshire Taconic Community Foundation since 2015 and Member of the Advisory Board of Northeast Dutchess Fund since 2016; former Independent Director of Cartica Management, LLC, 2015 to 2022; formerly, worked at Bessemer Trust Company from 1999 to 2014; Frank Russell Company from 1996 to 1999. Union Bank of Switzerland from 1993 to 1996; Credit Suisse from 1990 to 1993; and Hambros International Venture Capital Fund from 1988 to 1989. | 21 | Since 2017 | |||||
Name, Address and Year of Birth1 | Position(s) Held With Fund | Term of Office2 | Principal Occupation During At Least The Past 5 Years (Including Other Directorships Held) | Number of Funds Within Fund Complex Overseen by Director (Including the Fund) | Length of Time Served3 | |||||
Ramona Rogers‑Windsor 1960 | Director | Until Next Election of Directors | CFA; Member, Capital Southwest Board of Directors since March 2021; member, Thomas Jefferson University Board of Trustees since 2020; Managing Director, Public Investments Department, Northwestern Mutual Investment Management Company, LLC from 2012 to 2019; member, Milwaukee Film, LLC Board of Directors from 2016 to 2019. | 21 | Since 2021 | |||||
| 1 | The address for each director is 280 Park Avenue, New York, NY 10017. |
| 2 | On March 12, 2008, the Board of Directors adopted a mandatory retirement policy stating a Director must retire from the Board on December 31st of the year in which he or she turns 75 years of age. |
| 3 | The length of time served represents the year in which the Director was first elected or appointed to any fund in the Cohen & Steers Fund Complex. |
| 4 | “Interested person” as defined in the 1940 Act, of the Fund because of affiliation with CSCM (Interested Directors). |
Name, Address and Year of Birth1 | Position(s) Held With Fund | Principal Occupation During At Least the Past 5 Years | Length of Time Served2 | |||
James Giallanza 1966 | President and Chief Executive Officer | Executive Vice President of CSCM since 2014. Prior to that, Senior Vice President of CSCM since 2006. | Since 2006 | |||
Albert Laskaj 1977 | Treasurer and Chief Financial Officer | Senior Vice President of CSCM since 2019. Prior to that, Vice President of CSCM since 2015. | Since 2015 | |||
Dana A. DeVivo 1981 | Secretary and Chief Legal Officer | Senior Vice President of CSCM since 2019. Prior to that, Vice President of CSCM since 2013. | Since 2015 | |||
Stephen Murphy 1966 | Chief Compliance Officer and Vice President | Senior Vice President of CSCM since 2019. Prior to that, Managing Director at Mirae Asset Securities (USA) Inc. since 2017. Prior to that, Vice President & Chief Compliance Officer of Weiss Multi-Strategy Adviser LLC since 2011. | Since 2019 | |||
Benjamin Morton 1974 | Vice President | Executive Vice President of CSCM since 2019. Prior to that, Senior Vice President of CSCM since 2010. | Since 2013 | |||
Tyler S. Rosenlicht 1985 | Vice President | Senior Vice President of CSCM since 2018. Prior to that, Vice President of CSCM since 2015. | Since 2015 | |||
Thuy Quynh Dang 1978 | Vice President | Vice President of CSCM since 2011. | Since 2022 | |||
William F. Scapell 1967 | Vice President | Executive Vice President of CSCM since 2014. Prior to that, Senior Vice President of CSCM since 2003. | Since 2004 | |||
Yigal D. Jhirad 1964 | Vice President | Senior Vice President of CSCM since 2007. | Since 2008 | |||
| 1 | The address of each officer is 280 Park Avenue, New York, NY 10017. |
| 2 | Officers serve one‑year terms. The length of time served represents the year in which the officer was first elected as an officer of any fund in the Cohen & Steers fund complex. All of the officers listed above are officers of one or more of the other funds in the complex. |
| Facts | What Does Cohen & Steers Do With Your Personal Information? | |
| Why? | Financial companies choose how they share your personal information. Federal law gives consumers the right to limit some but not all sharing. Federal law also requires us to tell you how we collect, share, and protect your personal information. Please read this notice carefully to understand what we do. | |
| What? | The types of personal information we collect and share depend on the product or service you have with us. This information can include: • Social Security number and account balances • Transaction history and account transactions • Purchase history and wire transfer instructions | |
| How? | All financial companies need to share customers’ personal information to run their everyday business. In the section below, we list the reasons financial companies can share their customers’ personal information; the reasons Cohen & Steers chooses to share; and whether you can limit this sharing. | |
| Reasons we can share your personal information | Does Cohen & Steers share? | Can you limit this sharing? | ||
For our everyday business purposes— such as to process your transactions, maintain your account(s), respond to court orders and legal investigations, or reports to credit bureaus | Yes | No | ||
For our marketing purposes— to offer our products and services to you | Yes | No | ||
| For joint marketing with other financial companies— | No | We don’t share | ||
For our affiliates’ everyday business purposes— information about your transactions and experiences | No | We don’t share | ||
For our affiliates’ everyday business purposes— information about your creditworthiness | No | We don’t share | ||
| For our affiliates to market to you— | No | We don’t share | ||
| For non‑affiliates to market to you— | No | We don’t share | ||
| Questions? Call 800.330.7348 | ||||
| Who we are | ||
| Who is providing this notice? | Cohen & Steers Capital Management, Inc., Cohen & Steers Asia Limited, Cohen & Steers Japan Limited, Cohen & Steers UK Limited, Cohen & Steers Ireland Limited, Cohen & Steers Securities, LLC, Cohen & Steers Private Funds and Cohen & Steers Open and Closed‑End Funds (collectively, Cohen & Steers). | |
| What we do | ||
| How does Cohen & Steers protect my personal information? | To protect your personal information from unauthorized access and use, we use security measures that comply with federal law. These measures include computer safeguards and secured files and buildings. We restrict access to your information to those employees who need it to perform their jobs, and also require companies that provide services on our behalf to protect your information. | |
| How does Cohen & Steers collect my personal information? | We collect your personal information, for example, when you: • Open an account or buy securities from us • Provide account information or give us your contact information • Make deposits or withdrawals from your account We also collect your personal information from other companies. | |
| Why can’t I limit all sharing? | Federal law gives you the right to limit only: • sharing for affiliates’ everyday business purposes—information about your creditworthiness • affiliates from using your information to market to you • sharing for non‑affiliates to market to you State law and individual companies may give you additional rights to limit sharing. | |
| Definitions | ||
| Affiliates | Companies related by common ownership or control. They can be financial and nonfinancial companies. • Cohen & Steers does not share with affiliates. | |
| Non‑affiliates | Companies not related by common ownership or control. They can be financial and nonfinancial companies. • Cohen & Steers does not share with non‑affiliates. | |
| Joint marketing | A formal agreement between non‑affiliated financial companies that together market financial products or services to you. • Cohen & Steers does not jointly market. | |
| • | Designed for investors seeking total return, investing primarily in U.S. real estate securities |
| • | Symbols: CSJAX, CSJCX, CSJIX, CSRSX, CSJRX, CSJZX |
| • | Designed for investors seeking total return, investing primarily in U.S. real estate securities |
| • | Symbols: CSEIX, CSCIX, CREFX, CSDIX, CIRRX, CSZIX |
| • | Designed for institutional investors seeking total return, investing primarily in U.S. real estate securities |
| • | Symbol: CSRIX |
| • | Designed for investors seeking total return, investing primarily in global real estate equity securities |
| • | Symbols: CSFAX, CSFCX, CSSPX, GRSRX, CSFZX |
| • | Designed for investors seeking total return, investing primarily in international (non‑U.S.) real estate securities |
| • | Symbols: IRFAX, IRFCX, IRFIX, IRFRX, IRFZX |
| • | Designed for investors seeking total return and the maximization of real returns during inflationary environments by investing primarily in real assets |
| • | Symbols: RAPAX, RAPCX, RAPIX, RAPRX, RAPZX |
| • | Designed for investors seeking total return (high current income and capital appreciation), investing primarily in preferred and debt securities issued by U.S. and non‑U.S. companies |
| • | Symbols: CPXAX, CPXCX, CPXFX, CPXIX, CPRRX, CPXZX |
| • | Designed for investors seeking high current income and capital preservation by investing in low‑duration preferred and other income securities issued by U.S. and non‑U.S. companies |
| • | Symbols: LPXAX, LPXCX, LPXFX, LPXIX, LPXRX, LPXZX |
| • | Designed for investors seeking total return, investing primarily in midstream energy master limited partnership (MLP) units and related stocks |
| • | Symbols: MLOAX, MLOCX, MLOIX, MLORX, MLOZX |
| • | Designed for investors seeking total return, investing primarily in global infrastructure securities |
| • | Symbols: CSUAX, CSUCX, CSUIX, CSURX, CSUZX |
| • | Designed for investors seeking high current income and capital appreciation, investing in equity, preferred and debt securities, focused on real assets and alternative income strategies |
| • | Symbols: DVFAX, DVFCX, DVFIX, DVFRX, DVFZX |
| New York Stock Exchange Symbol: | UTF |

Item 2. Code of Ethics.
The registrant has adopted a code of ethics as defined in Item 2 of Form N-CSR (the “Code of Ethics”) that applies to its Principal Executive Officer and Principal Financial Officer. The Code of Ethics was in effect during the reporting period. The registrant has not amended the Code of Ethics as described in Form N-CSR during the reporting period. The registrant has not granted any waiver, including an implicit waiver, from a provision of the Code of Ethics, as described in Form N-CSR, during the reporting period. A current copy of the Code of Ethics is available on the registrant’s website at https://assets.cohenandsteers.com/assets/content/uploads/
Code_of_Ethics_for_Principal_Executive_and_Principal_Financial_Officers_of_the_Funds.pdf. Upon request, a copy of the Code of Ethics can be obtained free of charge by calling 800-330-7348 or writing to the Secretary of the Registrant, 280 Park Avenue, 10th floor, New York, NY 10017.
Item 3. Audit Committee Financial Expert.
The registrant’s board has determined that Gerald J. Maginnis qualifies as an audit committee financial expert based on his years of experience in the public accounting profession. The registrant’s board has determined that Michael G. Clark qualifies as an audit committee financial expert based on his years of experience in the public accounting profession and the investment management and financial services industry. The registrant’s board has determined that Ramona Rogers-Windsor qualifies as an audit committee financial expert based on her years of experience in the investment management and financial services industry. Each of Messrs. Maginnis and Clark and Ms. Rogers-Windsor is a member of the board’s audit committee, and each is independent as such term is defined in Form N-CSR.
Item 4. Principal Accountant Fees and Services.
(a) – (d) Aggregate fees billed to the registrant for the last two fiscal years ended December 31, 2022 and December 31, 2021 for professional services rendered by the registrant’s principal accountant were as follows:
| 2022 | 2021 | |||
Audit Fees | $52,648 | $50,623 | ||
Audit-Related Fees | $2,500 | $2,500 | ||
Tax Fees | $23,083 | $22,195 | ||
All Other Fees | $0 | $0 |
Tax fees were billed in connection with tax compliance services, including the preparation and review of federal and state tax returns and the computation of corporate and franchise tax amounts.
(e)(1) The registrant’s audit committee is required to pre-approve audit and non-audit services performed for the registrant by the principal accountant. The audit committee also is required to pre-approve non-audit services performed by the registrant’s principal accountant for the registrant’s investment advisor (not including any sub-advisor whose role is primarily portfolio management and is subcontracted with or overseen by another investment advisor) and/or to any entity controlling, controlled by or under common control with the registrant’s investment advisor that provides ongoing services to the registrant, if the engagement for services relates directly to the operations and financial reporting of the registrant.
The audit committee may delegate pre-approval authority to one or more of its members who are independent members of the board of directors of the registrant. The member or members to whom such authority is delegated shall report any pre-approval decisions to the audit committee at its next scheduled meeting. The audit committee may not delegate its responsibility to pre-approve services to be performed by the registrant’s principal accountant to the investment advisor.
(e)(2) No services included in (b) – (d) above were approved by the audit committee pursuant to paragraphs (c)(7)(i)(C) of Rule 2-01 of Regulation S-X.
(f) Not applicable.
(g) For the fiscal years ended December 31, 2022 and December 31, 2021, the aggregate fees billed by the registrant’s principal accountant for non-audit services rendered to the registrant and for non-audit services rendered to the registrant’s investment advisor (not including any sub-advisor whose role is primarily portfolio management and is subcontracted with or overseen by another investment advisor) and/or to any entity controlling, controlled by or under common control with the registrant’s investment advisor that provides ongoing services to the registrant were:
| 2022 | 2021 | |||
Registrant | $23,083 | $22,195 | ||
Investment Advisor | $0 | $0 |
(h) The registrant’s audit committee considered whether the provision of non-audit services that were rendered to the registrant’s investment advisor (not including any sub-advisor whose role is primarily portfolio management and is subcontracted with or overseen by another investment advisor) and/or to any entity controlling, controlled by or under common control with the registrant’s investment advisor that provides ongoing services to the registrant that were not required to be pre-approved pursuant to paragraph (c)(7)(ii) of Rule 2-01 of Regulation S-X was compatible with maintaining the principal accountant’s independence.
Item 5. Audit Committee of Listed Registrants.
The registrant has a separately-designated standing audit committee established in accordance with Section 3(a)(58)(A) of the Securities Exchange Act of 1934. The members of the committee are Gerald J. Maginnis (chairman), Michael G. Clark and Ramona Rogers-Windsor.
Item 6. Schedule of Investments.
Included in Item 1 above.
Item 7. Disclosure of Proxy Voting Policies and Procedures for Closed-End Management Investment Companies.
The registrant has delegated voting of proxies in respect of portfolio holdings to Cohen & Steers Capital Management, Inc. (“C&S”), in accordance with the policies and procedures set forth below.
COHEN & STEERS CAPITAL MANAGEMENT, INC.
STATEMENT OF POLICIES AND PROCEDURES REGARDING THE VOTING OF SECURITIES
This statement sets forth the policies and procedures that Cohen & Steers Capital Management, Inc. and its affiliated advisors (“Cohen & Steers”, “we” or “us”) follow in exercising voting rights with respect to securities held in its client portfolios. All proxy-voting rights that are exercised by Cohen & Steers shall be subject to this Statement of Policy and Procedures.
General Proxy Voting Guidelines
Objectives
Voting rights are an important component of corporate governance. Cohen & Steers has three overall objectives in exercising voting rights:
| • | Responsibility. Cohen & Steers shall seek to ensure that there is an effective means in place to hold companies accountable for their actions. While management must be accountable to its board, the board must be accountable to a company’s shareholders. Although accountability can be promoted in a variety of ways, protecting shareholder voting rights may be among our most important tools. |
| • | Rationalizing Management and Shareholder Concerns. Cohen & Steers seeks to ensure that the interests of a company’s management and board are aligned with those of the company’s shareholders. In this respect, compensation must be structured to reward the creation of shareholder value. |
| • | Shareholder Communication. Since companies are owned by their shareholders, Cohen & Steers seeks to ensure that management effectively communicates with its owners about the company’s business operations and financial performance. It is only with effective communication that shareholders will be able to assess the performance of management and to make informed decisions on when to buy, sell or hold a company’s securities. |
General Principles
In exercising voting rights, Cohen & Steers shall conduct itself in accordance with the general principles set forth below.
| • | The ability to exercise a voting right with respect to a security is a valuable right and, therefore, must be viewed as part of the asset itself. |
| • | In exercising voting rights, Cohen & Steers shall engage in a careful evaluation of issues that may materially affect the rights of shareholders and the value of the security. |
| • | Consistent with general fiduciary duties, the exercise of voting rights shall always be conducted with reasonable care, prudence and diligence. |
| • | In exercising voting rights on behalf of clients, Cohen & Steers shall conduct itself in the same manner as if Cohen & Steers were the beneficial owner of the securities. |
| • | To the extent reasonably possible, Cohen & Steers shall participate in each shareholder voting opportunity. |
| • | Voting rights shall not automatically be exercised in favor of management-supported proposals. |
| • | Cohen & Steers, and its officers and employees, shall never accept any item of value in consideration of a favorable proxy vote. |
General Guidelines
Set forth below are general guidelines that Cohen & Steers shall follow in exercising proxy voting rights:
| • | Prudence. In making a proxy voting decision, Cohen & Steers shall give appropriate consideration to all relevant facts and circumstances, including the value of the securities to be voted and the likely effect any vote may have on that value. Since voting rights must be exercised on the basis of an informed judgment, investigation shall be a critical initial step. |
| • | Third Party Views. While Cohen & Steers may consider the views of third parties, Cohen & Steers shall never base a proxy voting decision solely on the opinion of a third party. Rather, decisions shall be based on a reasonable and good faith determination as to how best to maximize shareholder value. |
| • | Shareholder Value. Just as the decision whether to purchase or sell a security is a matter of judgment, determining whether a specific proxy resolution will increase the market value of a security is a matter of judgment as to which informed parties may differ. In determining how a proxy vote may affect the economic value of a security, Cohen & Steers shall consider both short-term and long-term views about a company’s business and prospects, especially in light of our projected holding period on the stock (e.g., Cohen & Steers may discount long-term views on a short-term holding). |
Specific Guidelines
Board and Director Proposals
Election of Directors
Voting for Director Nominees in Uncontested Elections
Votes on director nominees are made on a case-by-case basis using a “mosaic” approach, where all factors are considered and no single factor is determinative. In evaluating director nominees, Cohen & Steers considers the following factors:
| • | Whether the nominee attended less than 75 percent of the board and committee meetings without a valid excuse for the absences; |
| • | Whether the nominee is an inside or affiliated outside director and sits on the audit, compensation, or nominating committees and/or the full board serves as the audit, compensation, or nominating committees or the company does not have one of these committees; |
| ��� | Whether the board ignored a significant shareholder proposal that was approved by a majority of the votes cast in the previous year; |
| • | Whether the board, without shareholder approval, instituted a new poison pill plan, extended an existing plan, or adopted a new plan upon the expiration of an existing plan during the past year; |
| • | Whether the nominee is the chairman or CEO of a publicly-traded company who serves on more than two (2) public company boards; |
| • | In the case of nominees other than the chairman or CEO, whether the nominee serves on more than four (4) public company boards; |
| • | If the nominee is an incumbent director, the length of tenure taking into account tenure limits recommended by local corporate governance codes1; |
| • | Whether the nominee has a material related party transaction or a material conflict of interest with the company; |
| • | Whether the nominee (or the entire board) has a record of making poor corporate or strategic decisions or has demonstrated an overall lack of good business judgment; |
| • | Material failures of governance, stewardship, or fiduciary responsibilities at the company; |
| • | Materials failures of risk oversight including, but not limited to: |
| • | Bribery; |
| • | Large or serial fines from regulatory bodies; |
| • | Demonstrably poor risk oversight of environmental and social issues, including climate change; |
| • | Significant adverse legal judgments or settlements; |
| • | Hedging of company stock by employees or directors of a company; or |
| • | Significant pledging of company stock in the aggregate by officers or directors of a company; |
| • | Whether the board has oversight of material climate-related risks and opportunities including, but not limited to: |
| • | The transition and physical risks the company faces related to climate change on its operations and investments in terms of the impact on its business and financial condition, including the company’s related disclosures; |
| • | How the board identifies, measures and manages such risks; and |
| • | The board’s oversight of climate-related risk as a part of governance, strategy, risk management, and metrics and targets; |
| • | Actions related to a nominee’s service on other boards that raise substantial doubt about such nominee’s ability to effectively oversee management and serve the best interests of shareholders at any company; and |
| • | In the case of a nominee that is the chair of the nominating committee (or other directors on a case-by-case basis), whether the company’s board lacks diversity including, but not limited to, diversity of gender, ethnicity, race and background. |
Voting for Director Nominees in Contested Elections
Votes in a contested election of directors are evaluated on a case-by-case basis considering the long-term financial performance of the company relative to its industry management’s track record, the qualifications of the nominees and other relevant factors.
| 1 | For example, in the UK, independent directors of publicly traded companies with tenure exceeding nine (9) years are reclassified as non-independent unless the company can explain why they remain independent. |
Board Composition and Gender Diversity
Cohen & Steers encourages companies to continue to evolve diversity and inclusion practices. Cohen & Steers generally votes against the chair of the nominating committee (or other directors on a case-by-case basis) at companies where the post-election board contains no female directors if the board has not included a female director during the last 12 months and the company has not articulated a plan to include a qualified female nominee.
Non-Disclosure of Board Nominees
Cohen & Steers generally votes against the election of director nominees if the names of the nominees are not disclosed prior to the meeting. However, Cohen & Steers recognizes that companies in certain emerging markets may have legitimate reasons for not disclosing nominee names. In such cases, if a company discloses a legitimate reason why such nominee names have not been disclosed, Cohen & Steers may vote for the nominees even if nominee names are not disclosed.
Majority Vote Requirement for Directors (SP)2
Cohen & Steers generally votes for proposals asking the board to amend the company’s governance documents (charter or bylaws) to provide that director nominees will be elected by the affirmative vote of the majority of votes cast.
Separation of Chairman and CEO (SP)
Cohen & Steers generally votes for proposals to separate the CEO and chairman positions. However, Cohen & Steers does recognize that under certain circumstances, it may be in the company’s best interest for the CEO and chairman positions to be held by one person.
Independent Chairman (SP)
Cohen & Steers reviews on a case-by-case basis proposals requiring the chairman’s position to be filled by an independent director taking into account the company’s current board leadership and governance structure, company performance, and any other factors that may be relevant.
Lead Independent Director (SP)
In cases where the CEO and chairman roles are combined or the chairman is not independent, Cohen & Steers votes for the appointment of a lead independent director.
Board Independence (SP)
Cohen & Steers believes that boards should have a majority of independent directors. Therefore, Cohen & Steers vote for proposals that require the board to be comprised of a majority of independent directors.
In general, Cohen & Steers considers a director independent if the director satisfies the independence definition set forth in local corporate governance codes and/or the applicable listing standards of the exchange on which the company’s stock is listed.
In addition, Cohen & Steers generally considers a director independent if the director has no significant financial, familial or other ties with the company that may pose a conflict and has not been employed by the company in an executive capacity.
Board Size (SP)
Cohen & Steers generally votes for proposals to limit the size of the board to 15 members or less.
| 2 | “SP” refers to a shareholder proposal. |
Classified Boards (SP)
Cohen & Steers generally votes in favor of proposals to declassify boards of directors. In voting on proposals to declassify a board of directors, Cohen & Steers evaluates all facts and circumstances, including whether: (i) the current management and board have a history of making good corporate and strategic decisions and (ii) the proposal is in the best interests of shareholders.
Tiered Boards (non-U.S.)
Cohen & Steers votes in favor of unitary boards as opposed to tiered board structures. Cohen & Steers believes that unitary boards offer flexibility while, with a tiered structure, there is a risk of upper tier directors becoming remote from the business, while lower tier directors become deprived of contact with outsiders of wider experience. No director should be excluded from the requirement to submit him/herself for re-election on a regular basis.
Independent Committees (SP)
Cohen & Steers votes for proposals requesting that a board’s audit, compensation and nominating committees consist only of independent directors.
Adoption of a Board with Audit Committee Structure (JAPAN)
Cohen & Steers votes for article amendments to adopt a board with an audit committee structure unless the structure obstructs shareholders’ ability to submit proposals on income allocation related issues or the company already has a 3-committee (U.S. style) structure.
Non-Disclosure of Board Compensation
Cohen & Steers generally votes against the election of director nominees at companies if the compensation paid to such directors is not disclosed prior to the meeting. However, Cohen & Steers recognizes that companies in certain emerging markets may have legitimate reasons for not disclosing such compensation. In such cases, if a company discloses a legitimate reason why such compensation should not be disclosed, Cohen & Steers may vote for the nominees even if compensation is not disclosed.
Director and Officer Indemnification and Liability Protection
Cohen & Steers votes in favor of proposals providing indemnification for directors and officers for acts conducted in the normal course of business that is consistent with the laws of the jurisdiction of formation. Cohen & Steers also vote in favor of proposals that expand coverage for directors and officers where, despite an unsuccessful legal defense, the director or officer acted in good faith and in the best interests of the company. Cohen & Steers votes against proposals that would expand indemnification beyond coverage of legal expenses to coverage of acts, such as gross negligence, that are violations of fiduciary obligations.
Directors’ Liability (non-U.S.)
These proposals ask shareholders to give discharge from responsibility for all decisions made during the previous financial year. Depending on the country, this resolution may or may not be legally binding, may not release the board from its legal responsibility, and does not necessarily eliminate the possibility of future shareholder action (although it does make such action more difficult to pursue).
Cohen & Steers will generally vote for the discharge of directors, including members of the management board and/or supervisory board, unless the board is not fulfilling its fiduciary duties as evidenced by:
| • | A lack of oversight or actions by board members that amount to malfeasance or poor supervision, such as operating in private or company interest rather than in shareholder interest; |
| • | Any legal issues (e.g., civil/criminal) aimed to hold the board liable for past or current actions that constitute a breach of trust, such as price fixing, insider trading, bribery, fraud, or other illegal actions; or |
| • | Other egregious governance issues where shareholders are likely to bring legal action against the company or its directors. |
Directors’ Contracts (non-U.S.)
Best market practice about the appropriate length of directors’ service contracts varies by jurisdiction. As such, Cohen & Steers votes these proposals on a case-by-case basis taking into account the best interests of the company and its shareholders and local market practice.
Compensation Proposals
Votes on Executive Compensation. “Say-on-Pay” votes are determined on a case-by-case basis taking into account the reasonableness of the company’s compensation structure and the adequacy of the disclosure.
COHEN & STEERS GENERALLY VOTES AGAINST IN CIRCUMSTANCES WHERE THERE ARE AN UNACCEPTABLE NUMBER OF PROBLEMATIC PAY PRACTICES INCLUDING:
| • | Poor linkage between executive pay and company performance and profitability; |
| • | The presence of objectionable structural features in the compensation plan, such as excessive perquisites, golden parachutes, tax-gross up provisions, and automatic benchmarking of pay in the top half of the peer group; and |
| • | A lack of proportionality in the plan relative to the company’s size and peer group. |
Additional Disclosure of Executive and Director Pay (SP). Cohen & Steers generally votes for shareholder proposals that seek additional disclosure of executive and director pay information.
Frequency of Shareholder Votes on Executive Compensation. Cohen & Steers generally votes for annual shareholder advisory votes to approve executive compensation.
Golden Parachutes. In general, Cohen & Steers votes against golden parachutes because they impede potential takeovers that shareholders should be free to consider. Cohen & Steers opposes the use of employment agreements that result in excessive cash payments and generally withhold our vote at the next shareholder meeting for directors who approved golden parachutes.
In the context of an acquisition, merger, consolidation, or proposed sale, Cohen & Steers votes on a case-by-case basis on proposals to approve golden parachute payments. Factors that may result in a vote against include:
| • | Potentially excessive severance payments; |
| • | Agreements that include excessive excise tax gross-up provisions; |
| • | Single-trigger payments upon a change in control (“CIC”), including cash payments and the acceleration of performance-based equity despite the failure to achieve performance measures; |
| • | Single-trigger vesting of equity based on a definition of change in control that requires only shareholder approval of the transaction (rather than consummation); |
| • | Recent amendments or other changes that may make packages so attractive as to encourage transactions that may not be in the best interests of shareholders; or |
| • | The company’s assertion that a proposed transaction is conditioned on shareholder approval of the golden parachute advisory vote. |
Non-Executive Director Remuneration (non-U.S.). Cohen & Steers evaluates these proposals on a case-by-case basis taking into account the remuneration mix and the adequacy of the disclosure. Cohen & Steers believes that non-executive directors should be compensated with a mix of cash and equity to align their interests with the interests of shareholders. The details of such remuneration should be fully disclosed and provided with sufficient time for us to consider our vote.
Approval of Annual Bonuses for Directors and Statutory Auditors (JAPAN). Cohen & Steers generally supports the payment of annual bonuses to directors and statutory auditors except in cases of scandals or extreme underperformance.
Equity Compensation Plans. Votes on proposals related to compensation plans are determined on a case-by-case basis taking into account plan features and equity grant practices, where positive factors may counterbalance negative factors (and vice versa), as evaluated based on three pillars:
| • | Plan Cost: the total estimated cost of the company’s equity plans relative to industry/market cap peers measured by the company’s estimated shareholder value transfer (SVT) in relation to peers, considering: |
| • | SVT based on new shares requested plus shares remaining for future grants, plus outstanding unvested/unexercised grants; and |
| • | SVT based only on new shares requested plus shares remaining for future grants. |
| • | Plan Features: |
| • | Automatic single-trigger award vesting upon a CIC; |
| • | Discretionary vesting authority; |
| • | Liberal share recycling on various award types; and |
| • | Minimum vesting period for grants made under the plan. |
| • | Grant Practices: |
| • | The company’s three year burn rate relative to its industry/market cap peers; |
| • | Vesting requirements for most recent CEO equity grants (3-year look-back); |
| • | The estimated duration of the plan based on the sum of shares remaining available and the new shares requested divided by the average annual shares granted in the prior three years; |
| • | The proportion of the CEO’s most recent equity grants/awards subject to performance conditions; |
| • | Whether the company maintains a claw-back policy; and |
| • | Whether the company has established post exercise/vesting shareholding requirements. |
Cohen & Steers generally votes against compensation plan proposals if the combination of factors indicates that the plan, overall is not, in the interests of shareholders, or if any of the following apply:
| • | Awards may vest in connection with a liberal CIC; |
| • | The plan would permit re-pricing or cash buyout of underwater options without shareholder approval; |
| • | The plan is a vehicle for problematic pay practices or a pay-for-performance disconnect; or |
| • | Any other plan features that are determined to have a significant negative impact on shareholder interests. |
Equity Compensation Plans (non-U.S.). Cohen & Steers evaluates these proposals on a case-by-case basis. Share option plans should be clearly explained and fully disclosed to both shareholders and participants and put to shareholders for approval. Each director’s share options should be detailed, including exercise prices, expiration dates and the market price of the shares at the date of exercise. They should take into account appropriate levels of dilution. Options should vest in reference to challenging performance criteria, which are disclosed in advance. Share options should be fully expensed so that shareholders can assess their true cost to the company. The assumptions and methodology behind the expensing calculation should also be disclosed to shareholders.
Long-Term Incentive Plans (non-U.S.). A long-term incentive plan refers to any arrangement, other than deferred bonuses and retirement benefit plans, which require one or more conditions in respect of service and/or performance to be satisfied over more than one financial year.
Cohen & Steers evaluates these proposals on a case-by-case basis. Cohen & Steers generally votes in favor of plans with robust incentives and challenging performance criteria that are fully disclosed to shareholders in advance and vote against plans that are excessive or contain easily achievable performance metrics or where there is excessive discretion delegated to remuneration committees. Cohen & Steers would expect remuneration committees to explain why criteria are considered to be challenging and how they align the interests of shareholders with the interests of the plan participants. Cohen & Steers will also vote against proposals that lack sufficient disclosure.
Transferable Stock Options. Cohen & Steers evaluates on a case-by-case basis proposals to grant transferable stock options or otherwise permit the transfer of outstanding stock options, including the cost of the proposal and alignment with shareholder interests.
Approval of Cash or Cash-and-Stock Bonus Plans. Cohen & Steers votes to approve cash or cash-and-stock bonus plans that seek to exempt executive compensation from limits on deductibility imposed by Section 162(m) of the Internal Revenue Code.
Employee Stock Purchase Plans. Cohen & Steers votes for the approval of employee stock purchase plans, although Cohen & Steers generally believes the discounted purchase price should not exceed 15% of the current market price.
401(k) Employee Benefit Plans. Cohen & Steers votes for proposals to implement a 401(k) savings plan for employees.
Pension Arrangements (non-U.S.). Cohen & Steers evaluates these proposals on a case-by-case basis. Pension arrangements should be transparent and cost-neutral to shareholders. Cohen & Steers believes it is inappropriate for executives to participate in pension arrangements that are materially different than those offered to other employees (such as continuing to participate in a final salary arrangement when employees have been transferred to a money purchase plan). One-off payments into individual director’s pension plans, changes to pension entitlements, and waivers concerning early retirement provisions must be fully disclosed and justified to shareholders.
Stock Ownership Requirements (SP). Cohen & Steers supports proposals requiring senior executives and directors to hold a minimum amount of stock in a company (often expressed as a percentage of annual compensation), which may include restricted stock or restricted stock units.
Stock Holding Periods (SP). Cohen & Steers generally votes against proposals requiring executives to hold stock received upon option exercise for a specific period of time.
Recovery of Incentive Compensation (SP). Cohen & Steers generally votes for proposals to recover incentive bonuses or other incentive payments made to senior executives if it is later determined that fraud, misconduct, or negligence significantly contributed to a restatement of financial results that led to the award of incentive compensation.
Capital Structure Changes and Anti-Takeover Proposals
Increase to Authorized Shares. Cohen & Steers generally votes for increases in authorized shares, provided that the increase is not greater than three times the number of shares outstanding and reserved for issuance (including shares reserved for stock-related plans and securities convertible into common stock, but not shares reserved for any poison pill plan).
Blank Check Preferred Stock. Cohen & Steers generally votes against proposals authorizing the creation of new classes of preferred stock without specific voting, conversion, distribution and other rights, and proposals to increase the number of authorized blank check preferred shares. Cohen & Steers may vote in favor of these proposals if Cohen & Steers receives reasonable assurances that (i) the preferred stock was
authorized by the board for legitimate capital formation purposes and not for anti-takeover purposes, and (ii) no preferred stock will be issued with voting power that is disproportionate to the economic interests of the preferred stock. These representations should be made either in the proxy statement or in a separate letter from the company to us.
Pre-Emptive Rights. Cohen & Steers generally votes against the issuance of equity shares with pre-emptive rights. However, Cohen & Steers may vote for shareholder pre-emptive rights where such pre-emptive rights are necessary taking into account the best interests of the company’s shareholders. In addition, we acknowledge that international local practices may call for shareholder pre-emptive rights when a company seeks authority to issue shares (e.g., UK authority for the issuance of only up to 5% of outstanding shares without pre-emptive rights). While Cohen & Steers prefers that companies be permitted to issue shares without pre-emptive rights, in deference to international local practices, Cohen & Steers will approve issuance requests with pre-emptive rights.
Dual Class Capitalizations. Because classes of common stock with unequal voting rights limit the rights of certain shareholders, Cohen & Steers votes against the adoption of a dual or multiple class capitalization structure. Cohen & Steers supports the one-share, one-vote principle for voting.
Restructurings/Recapitalizations. Cohen & Steers reviews proposals to increase common and/or preferred shares and to issue shares as part of a debt restructuring plan on a case-by-case basis. In voting, Cohen & Steers considers the following:
| • | Dilution: how much will the ownership interest of existing shareholders be reduced, and how extreme will dilution to any future earnings be? |
| • | Change in control: will the transaction result in a change in control of the company? |
| • | Bankruptcy: generally approve proposals that facilitate debt restructurings unless there are clear signs of self-dealing or other abuses. |
Share Repurchase Programs. Cohen & Steers generally votes in favor of such programs where the repurchase would be in the long-term best interests of shareholders and where we believe that this is a good use of the company’s cash.
Cohen & Steers will vote against such programs when shareholders’ interests could be better served by deployment of the cash for alternative uses, or where the repurchase is a defensive maneuver or an attempt to entrench management.
Targeted Share Placements (SP). Cohen & Steers votes these proposals on a case-by-case basis. These proposals ask companies to seek shareholder approval before placing 10% or more of their voting stock with a single investor. The proposals are typically in reaction to the placement of a large block of voting stock in an employee stock option plan, parent capital fund or with a single friendly investor, with the aim of protecting the company against a hostile tender offer.
Shareholder Rights Plans. Cohen & Steers reviews proposals to ratify shareholder rights plans (poison pills) on a case-by-case basis taking into consideration the length of the plan.
Shareholder Rights Plans (JAPAN). Cohen & Steers reviews proposals on a case-by-case basis examining not only the features of the plan itself but also factors including share price movements, shareholder composition, board composition, and the company’s announced plans to improve shareholder value.
Reincorporation Proposals. Proposals to change a company’s jurisdiction of incorporation are examined on a case-by-case basis. When evaluating such proposals, Cohen & Steers reviews management’s rationale for the proposal, changes to the charter/bylaws, and differences in the applicable laws governing the companies.
Voting on State Takeover Statutes (SP). Cohen & Steers reviews on a case-by-case basis proposals to opt in or out of state takeover statutes (including control share acquisition statutes, control share cash-out
statutes, freeze-out provisions, fair price provisions, stakeholder laws, poison pill endorsements, severance pay and labor contract provisions and disgorgement provisions). In voting on these proposals, Cohen & Steers takes into account whether the proposal is in the long-term best interests of the company and whether it would be in the best interests of the company to thwart a shareholder’s attempt to control the board of directors.
Mergers and Corporate Restructurings
Mergers and Acquisitions. Votes on mergers and acquisitions are considered on a case-by-case basis, taking into account the anticipated financial and operating benefits, offer price (cost vs. premium), prospects of the combined companies, how the deal was negotiated and changes in corporate governance and their impact on shareholder rights.
Cohen & Steers votes against proposals that require a super-majority of shareholders to approve a merger or other significant business combination.
Nonfinancial Effects of a Merger or Acquisition. Some companies have proposed charter provisions that specify that the board of directors may examine the nonfinancial effects of a merger or acquisition on the company. This provision would allow the board to evaluate the impact a proposed change in control would have on employees, host communities, suppliers and/or others. Cohen & Steers generally vote against proposals to adopt such charter provisions. Directors should base their decisions solely on the financial interests of the shareholders.
Spin-offs. Cohen & Steers evaluates spin-offs on a case-by-case basis taking into account the tax and regulatory advantages, planned use of sale proceeds, market focus, and managerial incentives.
Asset Sales. Cohen & Steers evaluates asset sales on a case-by-case basis taking into account the impact on the balance sheet/working capital, value received for the assets, and potential elimination of diseconomies.
Liquidations. Cohen & Steers evaluates liquidations on a case-by-case basis taking into account management’s efforts to pursue other alternatives, appraisal value of the assets, and the compensation plan for executives managing the liquidation.
Issuance of Debt (non-U.S.). Cohen & Steers evaluates these proposals on a case-by-case basis. Reasons for increased bank borrowing powers are numerous and varied, including allowing for normal growth of the company, the financing of acquisitions, and allowing increased financial leverage. Management may also attempt to borrow as part of a takeover defense. Cohen & Steers generally votes in favor of proposals that will enhance a company’s long-term prospects. Cohen & Steers votes against any uncapped or poorly-defined increase in bank borrowing powers or borrowing limits, issuances that would result in the company reaching an unacceptable level of financial leverage or a material reduction in shareholder value, or where such borrowing is expressly intended as part of a takeover defense.
Ratification of Auditors
Cohen & Steers generally votes for proposals to ratify auditors, auditor remuneration and/or proposals authorizing the board to fix audit fees, unless:
| • | an auditor has a financial interest in or association with the company, and is therefore not independent; |
| • | there is reason to believe that the independent auditor has rendered an opinion that is neither accurate nor indicative of the company’s financial position; |
| • | the name of the proposed auditor and/or fees paid to the audit firm are not disclosed by the company prior to the meeting; |
| • | the auditors are being changed without explanation; or |
| • | fees paid for non-audit related services are excessive and/or exceed fees paid for audit services or limits set by local best practice recommendations or law. |
Where fees for non-audit services include fees related to significant one-time capital structure events, initial public offerings, bankruptcy emergence, and spinoffs, and the company makes public disclosure of the amount and nature of those fees, then such fees may be excluded from the non-audit fees considered in determining whether non-audit related fees are excessive.
Auditor Rotation
Cohen & Steers evaluates auditor rotation proposals on a case-by-case basis taking into account the following factors: the tenure of the audit firm; establishment and disclosure of a review process whereby the auditor is regularly evaluated for both audit quality and competitive pricing; length of the rotation period advocated in the proposal; and any significant audit related issues.
Auditor Indemnification
Cohen & Steers generally votes against auditor indemnification and limitation of liability. However, Cohen & Steers recognizes there may be situations where indemnification and limitations on liability may be appropriate.
Annual Accounts and Reports (non-U.S.)
Annual reports and accounts should be detailed and transparent and should be submitted to shareholders for approval in a timely manner as prescribed by law. They should meet accepted reporting standards such as those prescribed by the International Accounting Standards Board (IASB).
Cohen & Steers generally approves proposals relating to the adoption of annual accounts provided that:
| • | The report has been examined by an independent external accountant and the accuracy of material items in the report is not in doubt; |
| • | The report complies with legal and regulatory requirements and best practice provisions in local markets; |
| • | the company discloses which portion of the remuneration paid to the external accountant relates to auditing activities and which portion relates to non-auditing advisory assignments; |
| • | A report on the implementation of risk management and internal control measures is incorporated, including an in-control statement from company management; |
| • | A report should include a statement of compliance with relevant codes of best practice for markets where they exist (e.g. for UK companies a statement of compliance with the Corporate Governance Code should be made, together with detailed explanations about any area(s) of non-compliance); |
| • | A conclusive response is given to all queries from shareholders; and |
| • | Other concerns about corporate governance have not been identified. |
Appointment of Internal Statutory Auditor (JAPAN)
Cohen & Steers evaluates these proposals on a case-by-case basis taking into account the work history of each nominee. If the nominee is designated as independent but has worked the majority of his or her career for one of the company’s major shareholders, lenders, or business partners, Cohen & Steers considers the nominee affiliated and will withhold support.
Shareholder Access and Voting Proposals
Proxy Access. Cohen & Steers reviews proxy access proposals on a case-by-case basis taking into account the parameters of proxy access use in light of a company’s specific circumstances. Cohen & Steers generally supports proposals that provide shareholders with a reasonable opportunity to use the right without stipulating overly restrictive or onerous parameters for use and also provide assurances that the mechanism will not be subject to abuse by short-term investors, investors without a substantial investment in the company or investors seeking to take control of the board.
Bylaw Amendments. Cohen & Steers votes on a case-by-case basis on proposals requesting companies grant shareholders the ability to amend bylaws. Similar to proxy access, Cohen & Steers generally supports proposals that provide assurances that this right will not be subject to abuse by short-term investors or investors without a substantial investment in a company.
Reimbursement of Proxy Solicitation Expenses (SP). In the absence of compelling reasons, Cohen & Steers will generally not support such proposals.
Shareholder Ability to Call Special Meetings (SP). Cohen & Steers votes on a case-by-case basis on proposals requesting companies amend their governance documents (bylaws and/or charter) in order to allow shareholders to call special meetings.
Shareholder Ability to Act by Written Consent (SP). Cohen & Steers generally votes against proposals to allow or facilitate shareholder action by written consent to provide reasonable protection of minority shareholder rights.
Shareholder Ability to Alter the Size of the Board. Cohen & Steers generally votes for proposals that seek to fix the size of the board and vote against proposals that give the board the ability to alter the size of the board without shareholder approval. While Cohen & Steers recognizes the importance of such proposals, these proposals may be set forth in order to promote the agenda(s) of certain special interest groups and could be disruptive to management of the company.
Cumulative Voting (SP). Having the ability to cumulate votes for the election of directors (i.e., to cast more than one vote for a director) generally increases shareholders’ rights to effect change in the management of a company. However, Cohen & Steers acknowledges that cumulative voting promotes special candidates who may not represent the interests of all, or even a majority, of shareholders. Therefore, when voting on proposals to institute cumulative voting, Cohen & Steers evaluates all facts and circumstances surrounding such proposal and generally vote against cumulative voting where the company has good corporate governance practices in place, including majority voting for director elections and a de-classified board.
Supermajority Vote Requirements (SP). Cohen & Steers generally supports proposals that seek to lower supermajority voting requirements.
Confidential Voting. Cohen & Steers votes for proposals requesting that companies adopt confidential voting, use independent tabulators, and use independent inspectors of election as long as such proposals permit management to request that dissident groups honor its confidential voting policy in the case of proxy contests.
Virtual Shareholder Meetings (SP). Cohen & Steers generally votes for management proposals allowing for the convening of shareholder meetings by electronic means, so long as they do not preclude in-person meetings and companies allow for comparable rights and opportunities for shareholders to participate electronically as they would have during an in-person meeting.
Date/Location of Meeting (SP). Cohen & Steers votes against shareholder proposals to change the date or location of the shareholders’ meeting.
Adjourn Meeting if Votes Are Insufficient. Cohen & Steers generally votes against open-end requests for adjournment of a shareholder meeting. However, where management specifically states the reason for requesting an adjournment and the requested adjournment is necessary to permit a proposal that would otherwise be supported under this policy to be carried out, the adjournment request will be supported.
Disclosure of Shareholder Proponents (SP). Cohen & Steers votes for shareholder proposals requesting that companies disclose the names of shareholder proponents. Shareholders may wish to contact the proponents of a shareholder proposal for additional information.
Environmental and Social Proposals
Cohen & Steers believes that well-managed companies should be identifying, evaluating and assessing environmental and social issues and, where material to its business, managing exposure to environmental and social risks related to these issues. When considering management or shareholder proposals relating to these issues, because of the diverse nature of environmental and social proposals, Cohen & Steers evaluates these proposals on a case-by-case basis. The principles guiding our evaluation of these proposals include, but are not limited to:
| • | The current level of publicly available disclosure from the company or other publicly available sources, including if the company already discloses similar information through existing reports or policies; |
| • | Whether implementation of a proposal is likely to enhance or protect shareholder value; |
| • | Whether a proposal can be implemented at a reasonable cost; |
| • | Whether the information requested concerns business issues that relate to a meaningful percentage of the company’s business; |
| • | The degree to which the company’s stated position on the issues raised in the proposal could affect its reputation or sales; |
| • | Whether the company has already responded in some appropriate manner to the request embodied in the proposal; |
| • | What other companies in the relevant industry have done in response to the issue addressed in the proposal; and |
| • | Whether implementation would reveal proprietary or confidential information that could place the company at a competitive disadvantage. |
Environmental Proposals (SP). Cohen & Steers acknowledges that environmental considerations can pose significant investment risks and opportunities. Therefore, Cohen & Steers generally votes in favor of proposals requesting a company disclose information that will aid in the determination of material environmental issues impacting the company and, where material to its business, how the company is managing exposure to environmental risks related to these issues, taking into consideration the following factors:
| • | The general factors listed above; and |
| • | Whether the issues presented have already been effectively dealt with through governmental regulation or legislation; |
In particular in relation to climate-related risk and opportunities material to its business, we expect companies to help their investors understand how they may be impacted by such risk and opportunities, and how these factors are considered within strategy in a manner consistent with the company’s business model and sector. The principles guiding our evaluation of these proposals are:
| • | The general factors listed above; |
| • | The transition and physical risks the company faces related to climate change on its operations and investment in terms of the impact on its business and financial condition, including the company’s related disclosures; |
| • | How the company identifies, measures and manages such risks; and |
| • | The company’s approach to climate-related risk as part of governance, strategy, risk management, and metrics and targets. |
Social Proposals (SP). Cohen & Steers acknowledges that social considerations can pose significant risks and opportunities. There, Cohen & Steers generally votes in favor of proposals requesting a company disclose information that will aid in the determination of material social issues impacting the company and, where material to its business, how the company is managing exposure to social risks related to these issues.
Cohen & Steers believes board and workforce diversity are beneficial to the decision-making process and can enhance long-term profitability. Therefore, Cohen & Steers generally votes in favor of proposals that seek to increase board and workforce diversity including, but not limited to, diversity of gender, ethnicity, race and background. Cohen & Steers votes all other social proposals on a case-by-case basis, including, but not limited to, proposals related to political and charitable contributions, lobbying, and gender equality and the gender pay gap.
Miscellaneous Proposals
Bundled Proposals. Cohen & Steers reviews on a case-by-case basis bundled or “conditioned” proposals. For items that are conditioned upon each other, Cohen & Steers examines the benefits and costs of the bundled items. In instances where the combined effect of the conditioned items is not in shareholders’ best interests, Cohen & Steers votes against such proposals. If the combined effect is positive, Cohen & Steers supports such proposals. In the case of bundled director proposals, Cohen & Steers will vote for the entire slate only if Cohen & Steers would have otherwise voted for each director on an individual basis.
Other Business. Cohen & Steers generally votes against proposals to approve other business where Cohen & Steers cannot determine the exact nature of the proposal(s) to be voted on.
Item 8. Portfolio Managers of Closed-End Investment Companies.
Information pertaining to the portfolio managers of the registrant, as of March 8, 2023, is set forth below.
William F. Scapell
• Vice President
• Portfolio manager since inception | Executive Vice President of C&S since 2014. Prior to that, Senior Vice President of C&S since 2003. | |
Ben Morton
• Vice President
• Portfolio manager since 2009 | Executive Vice President of C&S since 2019. Prior to that, Senior Vice President of C&S since 2010. | |
Elaine Zaharis-Nikas
• Portfolio manager since 2012 | Senior Vice President of C&S since 2014. Prior to that, Vice President of C&S since 2005 | |
Tyler Rosenlicht
• Vice President
• Portfolio manager since 2022 | Senior Vice President of C&S since 2018. Prior to that, Vice President of C&S since 2015. | |
Thuy Quynh Dang
• Vice President
• Portfolio manager since 2022 | Vice President of C&S since 2011. | |
C&S utilizes a team-based approach in managing the registrant. Mr. Morton, Mr. Rosenlicht, and Ms. Dang direct and supervise the execution of the registrant’s investment strategy, and lead and guide the other members of the team. Mr. Scapell and Ms. Zaharis-Nikas manage the registrant’s preferred securities investments.
Each portfolio manager listed above manages other investment companies and/or investment vehicles and accounts in addition to the registrant. The following tables show, as of December 31, 2022, the number of other accounts each portfolio manager managed in each of the listed categories and the total assets in the accounts managed within each category. The portfolio managers do not receive performance-based fees with respect to any of the registered investment companies, other pooled investment vehicles or other accounts that they manage.
| William F. Scapell | Number of accounts | Total assets | ||||
• Registered investment companies | 13 | $ | 18,678,945,203 | |||
• Other pooled investment vehicles | 17 | $ | 3,034,590,838 | |||
• Other accounts | 23 | $ | 3,003,826,101 | |||
| Ben Morton | Number of accounts | Total assets | ||||
• Registered investment companies | 5 | $ | 2,466,498,928 | |||
• Other pooled investment vehicles | 15 | $ | 1,395,151,085 | |||
• Other accounts | 21 | $ | 3,382,109,673 | |||
| Elaine Zaharis-Nikas | Number of accounts | Total assets | ||||
• Registered investment companies | 11 | $ | 16,015,393,303 | |||
• Other pooled investment vehicles | 16 | $ | 3,012,202,705 | |||
• Other accounts | 20 | $ | 2,499,623,124 | |||
| Tyler Rosenlicht | Number of accounts | Total assets | ||||
• Registered investment companies | 2 | $ | 1,056,433,257 | |||
• Other pooled investment vehicles | 14 | $ | 1,273,566,224 | |||
• Other accounts | 18 | $ | 3,131,585,367 | |||
| Thuy Quynh Dang | Number of accounts | Total assets | ||||
• Registered investment companies | 1 | $ | 921,633,067 | |||
• Other pooled investment vehicles | 14 | $ | 1,273,566,224 | |||
• Other accounts | 17 | $ | 3,069,468,773 | |||
Share Ownership. The following table indicates the dollar range of securities of the registrant owned by the registrant’s portfolio managers as of December 31, 2022:
| Dollar Range of Securities Owned | ||
William F. Scapell | None | |
Ben Morton | $10,001–$50,000 | |
Elaine Zaharis-Nikas | None | |
Tyler Rosenlicht | None | |
Thuy Quynh Dang | None |
Conflicts of Interest. It is possible that conflicts of interest may arise in connection with the portfolio manager’s management of the registrant’s investments on the one hand and the investments of other accounts or vehicles for which the portfolio managers are responsible on the other. For example, a portfolio manager may have conflicts of interest in allocating management time, resources and investment opportunities among the registrant and the other accounts or vehicles he advises. In addition, due to differences in the investment strategies or restrictions among the registrant and the other accounts, a portfolio manager may take action with respect to another account that differs from the action taken with respect to the registrant.
In some cases, another account managed by a portfolio manager may provide more revenue to the registrant’s investment advisor. While this may appear to create additional conflicts of interest for the portfolio manager in the allocation of management time, resources and investment opportunities, the investment advisor strives to ensure that portfolio managers endeavor to exercise their discretion in a manner that is equitable to all interested persons. In this regard, in the absence of specific account-related impediments (such as client-imposed restrictions or lack of available cash), it is the policy of the investment advisor to allocate investment ideas pro rata to all accounts with the same primary investment objective.
In addition, certain of the portfolio managers may from time to time manage one or more accounts on behalf of the registrant’s investment advisor and its affiliated companies (the “CNS Accounts”). Certain securities held and traded in the CNS Accounts also may be held and traded in one or more client accounts. It is the policy of the Advisor however not to put the interests of the CNS Accounts ahead of the interests of client accounts. The Advisor may aggregate orders of client accounts with those of the CNS Accounts; however, under no circumstances will preferential treatment be given to the CNS Accounts. For all orders involving the CNS Accounts, purchases or sales will be allocated prior to trade placement, and orders that are only partially filled will be allocated across all accounts in proportion to the shares each account, including the CNS Accounts, was designated to receive prior to trading. As a result, it is expected that the CNS Accounts will receive the same average price as other accounts included in the aggregated order. Shares will not be allocated or re-allocated to the CNS Accounts after trade execution or after the average price is known. In the event so few shares of an order are executed that a pro-rata allocation is not practical, a rotational system of allocation may be used; however, the CNS Accounts will never be part of that rotation or receive shares of a partially filled order other than on a pro-rata basis.
Because certain CNS Accounts are managed with a cash management objective, it is possible that a security will be sold out of the CNS Accounts but continue to be held for one or more client accounts. In situations when this occurs, such security will remain in a client account only if the portfolio manager, acting in its reasonable judgment and consistent with its fiduciary duties, believes this is appropriate for, and consistent with the objectives and profile of, the client account.
Advisor Compensation Structure. Compensation of the investment advisor’s portfolio managers and other investment professionals has three primary components: (1) a base salary, (2) an annual cash bonus and (3) annual stock-based compensation consisting generally of restricted stock units of the investment advisor’s parent, CNS. The investment advisor’s investment professionals, including the portfolio managers, also receive certain retirement, insurance and other benefits that are broadly available to all of its employees. Compensation of the investment advisor’s investment professionals is reviewed primarily on an annual basis.
Method to Determine Compensation. The registrant’s investment advisor compensates its portfolio managers based primarily on the total return performance of funds and accounts managed by the portfolio manager versus appropriate peer groups or benchmarks. C&S uses a variety of benchmarks to evaluate each portfolio managers’ performance for compensation purposes, including the FTSE Global Core Infrastructure 50/50 Net Tax Index, the ICE BofA Fixed-Rate Preferred Securities Index, the S&P 500 Index and other broad based indexes based on the asset classes managed by each portfolio manager. In evaluating the performance of a portfolio manager, primary emphasis is normally placed on one- and three-year performance, with secondary consideration of performance over longer periods of time. Performance is evaluated on a pre-tax and pre-expense basis. In addition to rankings within peer groups of funds on the basis of absolute performance, consideration may also be given to risk-adjusted performance. For funds and accounts with a primary investment objective of high current income, consideration will also be given to the fund’s and account’s success in achieving this objective. For portfolio managers responsible for multiple funds and accounts, investment performance is evaluated on an aggregate basis. The investment advisor has three funds or accounts with performance-based advisory fees. Portfolio managers are also evaluated on the basis of their success in managing their dedicated team of analysts. Base compensation for portfolio managers of the Advisor varies in line with the portfolio manager’s seniority and position with the firm.
Salaries, bonuses and stock-based compensation are also influenced by the operating performance of the registrant’s investment advisor and CNS. While the annual salaries of the investment advisor’s portfolio managers are fixed, cash bonuses and stock based compensation may fluctuate significantly from year to year, based on changes in manager performance and other factors.
Item 9. Purchases of Equity Securities by Closed-End Management Investment Company and Affiliated Purchasers.
None.
Note: On December 13, 2022, the Board of Directors of the Fund approved continuation of the delegation of its authority to management to effect repurchases, pursuant to management’s discretion and subject to market conditions and investment considerations, of up to 10% of the Fund’s common shares outstanding (“Share Repurchase Program”) as of January 1, 2023 through December 31, 2023.
Item 10. Submission of Matters to a Vote of Security Holders.
There have been no material changes to the procedures by which shareholders may recommend nominees to the registrant’s Board implemented after the registrant last provided disclosure in response to this Item.
Item 11. Controls and Procedures.
| (a) | The registrant’s principal executive officer and principal financial officer have concluded that the registrant’s disclosure controls and procedures are reasonably designed to ensure that information required to be disclosed by the registrant in this Form N-CSR was recorded, processed, summarized and reported within the time periods specified in the Securities and Exchange Commission’s rules and forms, based upon such officers’ evaluation of these controls and procedures as of a date within 90 days of the filing date of this report. |
| (b) | There were no changes in the registrant’s internal control over financial reporting that occurred during the period covered by this report that have materially affected, or are reasonably likely to materially affect, the registrant’s internal control over financial reporting. |
Item 12. Disclosure of Securities Lending Activities for Closed-End Management Investment Companies.
| (a) | For the fiscal year ended December 31, 2022, the registrant had the following dollar amounts of income and fees/compensation related to its securities lending activities: |
| Total | ||||
| Gross income from securities lending activities | $1,313,331 | |||
Fees and/or compensation for securities lending activities and related services | ||||
Fees paid to securities lending agent from a revenue split | $348,668 | |||
Fees paid for cash collateral management services (including fees deducted from a pooled cash collateral reinvestment vehicle) that are not included in the revenue split | — | |||
Administrative fees that are not included in the revenue split | — | |||
Indemnification fee not included in the revenue split | — | |||
Rebates paid to borrowers; | — | |||
Other fees relating to the securities lending program not included in the revenue split | — | |||
| Aggregate fees/compensation for securities lending activities and related services | $348,668 | |||
| Net income from securities lending activities | $964,663 | |||
| (b) | During the registrants most recent fiscal year ended December 31, 2022, BNP Paribas (“BNPP”) served as the registrant’s securities lending agent. |
As a securities lending agent, BNPP is responsible for the implementation and administration of the registrant’s securities lending program. Pursuant to its respective Securities Lending Agreement (“Securities Lending Agreement”) with the registrant, BNPP, as a general matter, performs various services, including the following:
| • | Locating borrowers; |
| • | Monitoring daily the value of the loaned securities and collateral (i.e., the collateral posted by the party borrowing); |
| • | Negotiation of loan terms; |
| • | Selection of securities to be loaned; |
| • | Recordkeeping and account servicing; |
| • | Monitoring of dividend activity and material proxy votes relating to loaned securities, and; |
| • | Arranging for return of loaned securities to the registrant at loan termination. |
BNPP is compensated for the above-described services from its securities lending revenue split. The table above shows what the registrant earned and the fees and compensation it paid in connections with its securities lending activities during its most recent fiscal year.
Item 13. Exhibits.
(a)(1) Not applicable.
(a)(3) Not applicable.
(a)(4) Not applicable.
(d) Consent of Independent Registered Public Accounting Firm.
SIGNATURES
Pursuant to the requirements of the Securities Exchange Act of 1934 and the Investment Company Act of 1940, the registrant has duly caused this report to be signed on its behalf by the undersigned, thereunto duly authorized.
COHEN & STEERS INFRASTRUCTURE FUND, INC.
| By: | /s/ James Giallanza | |||
Name: James Giallanza | ||||
Title: Principal Executive Officer | ||||
(President and Chief Executive Officer) | ||||
| Date: | March 8, 2023 | |||
Pursuant to the requirements of the Securities Exchange Act of 1934 and the Investment Company Act of 1940, this report has been signed below by the following persons on behalf of the registrant and in the capacities and on the dates indicated.
| By: | /s/ James Giallanza | |||
Name: James Giallanza | ||||
Title: Principal Executive Officer | ||||
(President and Chief Executive Officer) | ||||
| By: | /s/ Albert Laskaj | |||
Name: Albert Laskaj | ||||
Title: Principal Financial Officer | ||||
(Treasurer and Chief Financial Officer) | ||||
| Date: March 8, 2023 | ||||