UNITED STATES
SECURITIES AND EXCHANGE COMMISSION
Washington, D.C. 20549
FORM N-CSR
CERTIFIED SHAREHOLDER REPORT OF REGISTERED
MANAGEMENT INVESTMENT COMPANIES
Investment Company Act file number | 811-21488 |
|
Cohen & Steers Utility Fund, Inc. |
(Exact name of registrant as specified in charter) |
|
280 Park Avenue, New York, NY | | 10017 |
(Address of principal executive offices) | | (Zip code) |
|
Adam M. Derechin Cohen & Steers Capital Management, Inc. 280 Park Avenue New York, New York 10017 |
(Name and address of agent for service) |
|
Registrant’s telephone number, including area code: | (212) 832-3232 | |
|
Date of fiscal year end: | December 31 | |
|
Date of reporting period: | December 31, 2005 | |
| | | | | | | | |
Item 1. Reports to Stockholders.
COHEN & STEERS UTILITY FUND, INC.
February 9, 2006
To Our Shareholders:
We are pleased to submit to you our report for the six-months and year ended December 31, 2005. The net asset values per share at that date were $15.25, $15.19, and $15.20 for Class A, Class B, and Class C shares, respectively. Class I shares had a net asset value of $15.26. In addition, a regular quarterly distribution was declared for shareholders of record on December 22, 2005 and paid on December 23, 2005 to all four classes of shares as follows: Class A—$0.105; Class B—$0.08; Class C—$0.08 and Class I—$0.119.
Investment Review
The total return, including income and change in net asset value, for the Cohen & Steers Utility Fund and the comparative benchmarks were:
| | | Six Months Ended
12/31/05 | | Year Ended
12/31/05 | |
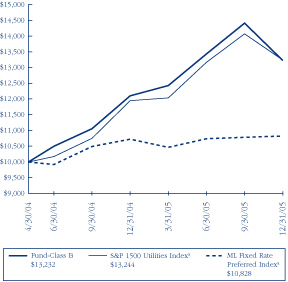
| Cohen & Steers Utility Fund—Class A | | | 1.83 | % | | | 13.33 | % | |
| Cohen & Steers Utility Fund—Class B | | | 1.47 | % | | | 12.59 | % | |
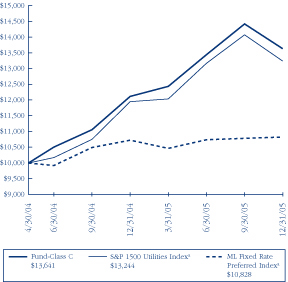
| Cohen & Steers Utility Fund—Class C | | | 1.47 | % | | | 12.58 | % | |
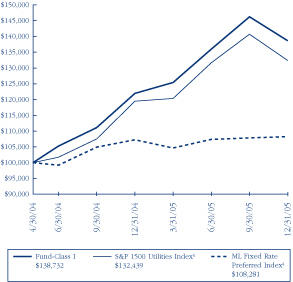
| Cohen & Steers Utility Fund—Class I | | | 1.97 | % | | | 13.73 | % | |
| S&P 1500 Utilities Indexa | | | 0.56 | % | | | 15.17 | % | |
| Merrill Lynch Fixed Rate Preferred Indexa | | | 0.82 | % | | | 0.96 | % | |
| S&P 500 Indexa | | | 5.77 | % | | | 4.91 | % | |
The performance data quoted represent past performance. Past performance is no guarantee of future results. The investment return and the principal value of an investment will fluctuate and shares, if redeemed, may be worth more or less than their original cost. Current performance may be lower or higher than the performance data quoted. Total returns of the fund current to the most recent month-end can be obtained by visiting our website at cohenandsteers.com. Performance does not include the effect of sales charges. If sales charges were included, returns would have been lower.
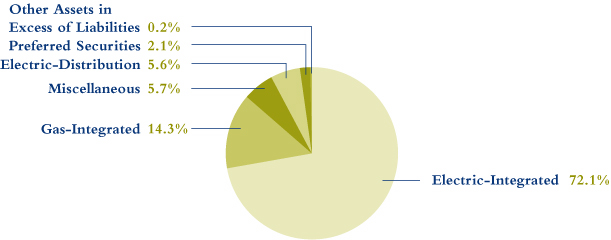
The asset mix of the fund as of December 31, 2005 consisted of 97.3% utility common stocks, 2.1% preferred and other fixed income investments, with the remaining 0.6% in cash. The fund previously had a higher allocation to fixed income. We reduced the fixed income allocation to provide the fund with greater flexibility in seeking to maximize total return.
a S&P 1500 Utilities Index is an unmanaged market capitalization weighted index of 82 companies whose primary business involves the generation, transmission and/or distribution of electricity and/or natural gas. The Merrill Lynch Fixed Rate Preferred Index is an unmanaged index of preferred securities. The S&P 500 Index is an unmanaged index of common stocks that is frequently used as a general measure of stock market performance.
1
COHEN & STEERS UTILITY FUND, INC.
Utility shares performed well during the year despite a decline during the fourth quarter. A combination of attractive industry fundamentals, strong financial performance and an increase in consolidation led to attractive stock price performance for the group.
Utilities benefited from a favorable commodity price environment in 2005 as an improving supply-demand balance for power and natural gas led to rising prices and improving profit margins for many utilities. Within the wholesale power sector, a slowdown of new plant construction and rising demand has resulted in an improvement in the balance between supply and demand. At the same time, rising natural gas prices have become more influential in determining power prices because of large-scale additions of natural gas-fired generation in the late 1990s. These two trends have led to higher wholesale power prices, and as a result, greater profit margins for many utilities with low-cost coal and nuclear generation. Higher commodity prices have also led to improving profits for utilities with natural gas or oil exploration and production businesses. Wholesale power prices increased 44% to $59.86 per megawatt hour in 2005. The price of crude oil incre ased 38% during the year to $57.35 per barrel, while the price of natural gas rose 78% to $10.99 per MMBtu.
Utilities delivered solid financial performance in 2005 in the form of strong earnings and dividend growth. While fourth quarter results have not been reported, we estimate utilities as a group will produce earnings per share growth of 8% to 10% for the full year. The strong growth in earnings in 2005 drove dividend growth that was equally impressive. In 2005, 48 utilities increased their dividends by an average of 8%, while no utilities cut their dividends.
Consolidation in the utility sector returned in 2005. Four major utility acquisitions have been announced over the last 14 months: Exelon's purchase of Public Service Enterprise Group, Duke Energy's acquisition of Cinergy, MidAmerican Energy's (controlled by Warren Buffet's Berkshire Hathaway) acquisition of PacifiCorp, and FPL's acquisition of Constellation Energy. We are pleased to report that the fund owned all of the takeover targets, all of which realized attractive premiums. The recent merger announcements followed four years of minimal consolidation activity as managements worked to rationalize unregulated businesses, strengthen balance sheets, and bolster core utility franchises.
Utility stocks had their first correction in several years, resulting in a –5.9% total return of the S&P 1500 Utilities Index during the fourth quarter. We believe this was primarily the result of profit taking, as utilities were the second best performing sector in the S&P 500 in both 2004 and 2005. We also believe that there were investor concerns about political risks, the potential for decreased demand stemming from the energy price spikes from the Gulf Coast hurricanes, and earnings sensitivity to the commodity cycle. Despite this correction, utilities delivered a 15.2% total return for the full year.
The top contributor to performance for the year was Edison International, a Southern California utility with substantial merchant power operations, which had a total return of 39.6%. Edison International's strong relative performance was driven by expectations for improved earnings at the company's unregulated power subsidiary due to rising wholesale power prices. Other top contributors to performance included Questar Corp. and Equitable Resources Inc., which generated total returns of 50.6% and 24.1%, respectively. Questar and Equitable both benefited
2
COHEN & STEERS UTILITY FUND, INC.
from attractive natural gas prices and expanded drilling programs at their Rockies and Appalachian properties. Laggards included Fairpoint Communications, with a total return of –37.9% (since its IPO in February) and Energy East, which had a total return of –10.8%. The fund's performance for the year trailed the utility indexes and this was largely attributable to our fixed income allocation. The fund's fixed income positions, which were utilized to enhance the income potential of the fund, detracted from performance due to the better overall performance of utility stocks. The Merrill Lynch Fixed Rate Preferred Index was up only 1.0% for the year, compared with the S&P 1500 Utilities Index, which was up 15.2%.
Investment Outlook
In 2006, we believe the key drivers of performance will be higher power prices combined with the expiration of retail rate freezes and below-market wholesale sales contracts for electricity production. As part of many state plans to transition to electricity market competition, many utilities have operated under multi-year retail rate freezes that are now coming to an end. With power prices and operating costs currently much higher than they were when the rate freezes were enacted, utilities are generally being allowed to charge retail customers higher rates. Additionally, utilities that sell excess generation into the wholesale power markets should experience margin expansion to the extent they renew expiring sales contracts at current market prices. Utilities that own low-cost coal and nuclear plants may benefit the most from these trends.
We also anticipate attractive earnings growth in utilities in 2006. With dividend payout ratios in the industry that are low by historical standards (55% currently versus 66% over the past twenty years), we believe that potentially strong earnings growth would, in turn, support attractive dividend growth. Over the longer term, we expect growth in the industry to be driven by infrastructure investment. It has been estimated that tens of billions of dollars of investment will be required to upgrade the nation's power generation, transmission, and natural gas pipeline infrastructure. If the broadly constructive regulatory environment that exists today continues, this would allow utilities to earn potentially attractive returns on these investments.
We believe that valuations should provide support for utility stock prices. The ratio of utility stock prices to earnings estimates for 2006 stands at about 13.8x, which is in line with the long-term historical average of 14.0x. Dividend yields appear attractive based upon the historical relationship of after-tax yields relative to 10-year Treasury bond yields. The current relative yield of utility stocks to 10-year Treasury bond yields is 104%, which compares favorably with the long-term average of 95%. While utilities appear mildly undervalued based on these metrics, we believe a premium to historical averages is warranted given the potential long-term growth outlook.
We believe that further consolidation activity would also be a positive for the utility sector, as it provides the potential for greater growth from cost savings and economies of scale. In fact, the recent repeal of the Public Utility Holding Company Act (PUHCA), which hindered mergers among noncontiguous utilities, could stimulate further merger activity. Utilities could also benefit from non-utility investment in the sector now that restrictions on ownership have been eased with the repeal of PUHCA. Accordingly, we have invested in several utilities. Most are not only attractive on a stand-alone basis, but could also be potential takeover candidates.
3
COHEN & STEERS UTILITY FUND, INC.
While we expect utility stocks to benefit from several positive trends, the industry does face challenges. The key risk is managing the political impact of higher customer rates. Higher energy prices and greater capital spending for emissions control equipment for power plants and transmission grid upgrades will lead to large increases in electric rates. While these are much needed investments, history tells us that customers are likely to ask politicians and regulators for relief from the burden of increasing rates. Another impact of higher rates will be decreased demand in response to higher prices. We are closely monitoring these issues and will seek to invest in utilities that can manage these challenges successfully.
In closing, while there are challenges and risks ahead, we believe that the fundamental outlook for the utility sector is strong and that the sector stands to benefit from a growing demand for more conservative income-producing equity investments. Consequently, we believe Cohen & Steers Utility Fund is well positioned to deliver potentially attractive returns over time.
| Sincerely, | |
|
 | |  | |
|
| MARTIN COHEN | | ROBERT H. STEERS | |
|
| Co-chairman | | Co-chairman | |
|
 | |  | |
|
| ROBERT S. BECKER | | WILLIAM F. SCAPELL | |
|
| Portfolio Manager | | Portfolio Manager | |
|
The views and opinions in the preceding commentary are as of the date stated and are subject to change. This material represents an assessment of the market environment at a specific point in time, should not be relied upon as investment advice and is not intended to predict or depict performance of any investment.
Visit Cohen & Steers online at cohenandsteers.com
For more information about any of our funds, visit cohenandsteers.com, where you'll find daily net asset values, fund fact sheets and portfolio highlights. You can also access newsletters, education tools and market updates covering the REIT, utility and preferred securities sectors.
In addition, our Web site contains comprehensive information about our firm, including our most recent press releases, profiles of our senior investment professionals, and an overview of our investment approach.
4
COHEN & STEERS UTILITY FUND, INC.
Performance Review
Cohen & Steers Utility Fund—Class A
Growth of a $10,000 Investment

Cohen & Steers Utility Fund—Class B
Growth of a $10,000 Investment
Cohen & Steers Utility Fund—Class C
Growth of a $10,000 Investment
Cohen & Steers Utility Fund—Class I
Growth of a $100,000 Investment
5
COHEN & STEERS UTILITY FUND, INC.
Performance Review—(Continued)
| | | Class A Shares | | Class B Shares | | Class C Shares | | Class I Shares | |
| 1 Year (with sales charge) | | | 8.23 | %b | | | 7.59 | %c | | | 11.58 | %e | | | — | | |
| 1 Year (without sales charge) | | | 13.33 | % | | | 12.59 | % | | | 12.58 | % | | | 13.73 | % | |
Since Inceptionf
(with sales charge) | | | 18.00 | %b | | | 18.26 | %d | | | 20.44 | % | | | — | | |
Since Inceptionf
(without sales charge) | | | 21.30 | % | | | 20.39 | % | | | 20.44 | % | | | 21.66 | % | |
The performance data quoted represent past performance. Past performance is no guarantee of future results. The investment return and principal value of an investment will fluctuate and shares, when redeemed, may be worth more or less than their original cost. Current performance may be lower or higher than the performance data quoted. Performance information current to the most recent month-end can be obtained by visiting our Web site at cohenandsteers.com. The performance graph and table do not reflect the deduction of taxes that a shareholder would pay on fund distributions or the redemption of fund shares.
Through December 31, 2006, the fund's advisor has contractually agreed to waive certain fees and/or reimburse the fund for expenses. Absent such arrangements, returns would have been lower.
a The comparative indexes are not adjusted to reflect expenses or other fees that the SEC requires to be reflected in the fund's performance. The fund's performance assumes the reinvestment of all dividends and distributions. For more information, including charges and expenses, please read the prospectus carefully before you invest.
b Reflects a 4.50% front-end sales charge.
c Reflects a contingent deferred sales charge of 5%.
d Reflects a contingent deferred sales charge of 4%.
e Reflects a contingent deferred sales charge of 1%.
f Inception date of May 3, 2004.
6
COHEN & STEERS UTILITY FUND, INC.
Expense Example (Unaudited)
As a shareholder of the fund, you incur two types of costs: (1) transaction costs, including sales charges (loads) on purchase payments and redemption fees; and (2) ongoing costs including management fees; distribution and/or service (12b-1) fees; and other fund expenses. This example is intended to help you understand your ongoing costs (in dollars) of investing in the fund and to compare these costs with the ongoing costs of investing in other mutual funds.
The example is based on an investment of $1,000 invested at the beginning of the period and held for the entire period 07/01/05 – 12/31/05.
Actual Expenses
The first line of the table below provides information about actual account values and expenses. You may use the information in this line, together with the amount you invested, to estimate the expenses that you paid over the period. Simply divide your account value by $1,000 (for example, an $8,600 account value divided by $1,000 = 8.6), then multiply the result by the number in the first line under the heading entitled "Expenses Paid During Period" to estimate the expenses you paid on your account during this period.
Hypothetical Example for Comparison Purposes
The second line of the table below provides information about hypothetical account values and hypothetical expenses based on the fund's actual expense ratio and an assumed rate of return of 5% per year before expenses, which is not the fund's actual return. The hypothetical account values and expenses may not be used to estimate the actual ending account balance or expenses you paid for the period. You may use this information to compare the ongoing cost of investing in the fund and other funds. To do so, compare this 5% hypothetical example with the 5% hypothetical examples that appear in the shareholder reports of the other funds.
Please note that the expenses shown in the table are meant to highlight your ongoing costs only and do not reflect any transactional costs, such as sales charges (loads) and redemption fees. Therefore, the second line of the table is useful in comparing ongoing costs only, and will not help you determine the relative total costs of owning different funds. In addition, if these transactional costs were included, your costs would have been higher.
7
COHEN & STEERS UTILITY FUND, INC.
Expense Example—(Unaudited) (Continued)
| | | Beginning
Account Value | | Ending
Account Value | | Expenses Paid
During Period* | |
| | | 07/01/05 | | 12/31/05 | | 07/01/05–
12/31/05 | |
| Class A | |
| Actual (1.83% return) | | $ | 1,000.00 | | | $ | 1,018.30 | | | $ | 7.58 | | |
| Hypothetical (5% annual return before expenses) | | $ | 1,000.00 | | | $ | 1,017.69 | | | $ | 7.58 | | |
| Class B | |
| Actual (1.47% return) | | $ | 1,000.00 | | | $ | 1,014.70 | | | $ | 10.87 | | |
| Hypothetical (5% annual return before expenses) | | $ | 1,000.00 | | | $ | 1,014.42 | | | $ | 10.87 | | |
| Class C | |
| Actual (1.47% return) | | $ | 1,000.00 | | | $ | 1,014.70 | | | $ | 10.87 | | |
| Hypothetical (5% annual return before expenses) | | $ | 1,000.00 | | | $ | 1,014.42 | | | $ | 10.87 | | |
| Class I | |
| Actual (1.97% return) | | $ | 1,000.00 | | | $ | 1,019.70 | | | $ | 5.80 | | |
| Hypothetical (5% annual return before expenses) | | $ | 1,000.00 | | | $ | 1,019.46 | | | $ | 5.80 | | |
* Expenses are equal to the fund's Class A, Class B, Class C and Class I annualized expense ratio of 1.49%, 2.14%, 2.14% and 1.14%, respectively, multiplied by the average account value over the period, multiplied by 184/365 (to reflect the one-half year period). If the fund had borne all of its expenses that were assumed by the advisor, the annualized expense ratios would have been 1.53%, 2.18%, 2.17% and 1.18%, respectively.
8
COHEN & STEERS UTILITY FUND, INC.
DECEMBER 31, 2005
Top Ten Holdings
(Unaudited)
| Security | | Market
Value | | % of
Net
Assets | |
| 1. Exelon Corp. | | $ | 9,774,200 | | | | 5.6 | % | |
| 2. PG&E Corp. | | | 9,313,668 | | | | 5.4 | | |
| 3. Southern Co. | | | 8,332,918 | | | | 4.8 | | |
| 4. Duke Energy Corp | | | 8,114,000 | | | | 4.7 | | |
| 5. Edison International | | | 7,886,432 | | | | 4.5 | | |
| 6. Dominion Resources | | | 7,237,037 | | | | 4.2 | | |
| 7. TXU Corp. | | | 7,211,299 | | | | 4.2 | | |
| 8. FPL Group. | | | 7,156,050 | | | | 4.1 | | |
| 9. Entergy Corp | | | 6,264,587 | | | | 3.6 | | |
| 10. FirstEnergy Corp. | | | 6,180,333 | | | | 3.6 | | |
Sector Breakdown
(Based on Net Assets)
(Unaudited)
9
COHEN & STEERS UTILITY FUND, INC.
SCHEDULE OF INVESTMENTS
December 31, 2005
| | | | | Number
of Shares | | Value | |
| COMMON STOCK | | | 97.3 | % | | | | | | | | | |
| TRANSPORT—MARINE | | | 1.3 | % | | | | | | | | | |
| Teekay LNG Partners LP | | | | | | | 76,600 | | | $ | 2,268,892 | | |
| UTILITIES | | | 94.1 | % | | | | | | | | | |
| ELECTRIC—DISTRIBUTION | | | 5.6 | % | | | | | | | | | |
| Consolidated Edison | | | | | | | 67,848 | | | | 3,143,398 | | |
| Energy East Corp. | | | | | | | 78,980 | | | | 1,800,744 | | |
| NSTAR | | | | | | | 115,187 | | | | 3,305,867 | | |
| Pepco Holdings | | | | | | | 70,210 | | | | 1,570,597 | | |
| | | | | | | | 9,820,606 | | |
| ELECTRIC—INTEGRATED | | | 70.3 | % | | | | | | | | | |
| Ameren Corp. | | | | | | | 82,444 | | | | 4,224,431 | | |
| CINergy Corp. | | | | | | | 69,795 | | | | 2,963,496 | | |
| Cleco Corp. | | | | | | | 42,616 | | | | 888,544 | | |
| CMS Energy Corp.a | | | | | | | 202,400 | | | | 2,936,824 | | |
| Constellation Energy Group | | | | | | | 80,500 | | | | 4,636,800 | | |
| Dominion Resources | | | | | | | 93,744 | | | | 7,237,037 | | |
| DPL | | | | | | | 99,000 | | | | 2,574,990 | | |
| DTE Energy Co. | | | | | | | 43,586 | | | | 1,882,479 | | |
| Duke Energy Corp. | | | | | | | 295,592 | | | | 8,114,000 | | |
| E.ON AG (ADR) | | | | | | | 88,074 | | | | 3,040,314 | | |
| Edison International | | | | | | | 180,840 | | | | 7,886,432 | | |
| El Paso Electric Co.a | | | | | | | 28,200 | | | | 593,328 | | |
| Entergy Corp. | | | | | | | 91,254 | | | | 6,264,587 | | |
| Exelon Corp. | | | | | | | 183,933 | | | | 9,774,200 | | |
| FirstEnergy Corp. | | | | | | | 126,155 | | | | 6,180,333 | | |
| FPL Group | | | | | | | 172,186 | | | | 7,156,050 | | |
| NiSource | | | | | | | 82,681 | | | | 1,724,726 | | |
| Northeast Utilities | | | | | | | 108,500 | | | | 2,136,365 | | |
| PG&E Corp. | | | | | | | 250,907 | | | | 9,313,668 | | |
| PPL Corp. | | | | | | | 199,278 | | | | 5,858,773 | | |
| Public Service Enterprise Group | | | | | | | 76,443 | | | | 4,966,502 | | |
See accompanying notes to financial statements.
10
COHEN & STEERS UTILITY FUND, INC.
SCHEDULE OF INVESTMENTS—(Continued)
December 31, 2005
| | | | | Number
of Shares | | Value | |
| SCANA Corp. | | | | | | | 33,839 | | | $ | 1,332,580 | | |
| Southern Co. | | | | | | | 241,324 | | | | 8,332,918 | | |
| TXU Corp. | | | | | | | 143,680 | | | | 7,211,299 | | |
| Xcel Energy | | | | | | | 254,103 | | | | 4,690,741 | | |
| | | | | | | | 121,921,417 | | |
| ELECTRIC—TRANSMISSION | | | 2.2 | % | | | | | | | | | |
| ITC Holdings Corp. | | | | | | | 136,800 | | | | 3,842,712 | | |
| GAS—DISTRIBUTION | | | 1.7 | % | | | | | | | | | |
| AGL Resources | | | | | | | 85,896 | | | | 2,990,040 | | |
| GAS—INTEGRATED | | | 14.3 | % | | | | | | | | | |
| DCP Midstream Partners LPa | | | | | | | 18,000 | | | | 440,640 | | |
| Energen Corp. | | | | | | | 34,306 | | | | 1,245,994 | | |
| Equitable Resources | | | | | | | 135,020 | | | | 4,953,884 | | |
| Kinder Morgan | | | | | | | 20,000 | | | | 1,839,000 | | |
| Questar Corp. | | | | | | | 64,539 | | | | 4,885,602 | | |
| Sempra Energy | | | | | | | 101,068 | | | | 4,531,889 | | |
| Enterprise GP Holdings LP | | | | | | | 100,000 | | | | 3,772,000 | | |
| Williams Cos. (The) | | | | | | | 92,300 | | | | 2,138,591 | | |
| Williams Partners LP | | | | | | | 29,600 | | | | 922,040 | | |
| | | | | | | | 24,729,640 | | |
| TOTAL UTILITIES | | | | | | | | | | | 159,532,415 | | |
| UTILITY—FOREIGN | | | 1.9 | % | | | | | | | | | |
| ELECTRIC—INTEGRATED | | | 1.8 | % | | | | | | | | | |
| CEZ AS | | | | | | | 29,500 | | | | 887,096 | | |
| RWE AG | | | | | | | 30,618 | | | | 2,267,353 | | |
| | | | | | | | 3,154,449 | | |
| GAS—INTEGRATED | | | 0.1 | % | | | | | | | | | |
| Duke Energy Income Fund, 144Ab | | | | | | | 23,000 | | | | 221,601 | | |
| TOTAL UTILITY—FOREIGN | | | | | | | | | | | 3,376,050 | | |
| TOTAL COMMON STOCK (Identified cost—$155,497,709) | | | | | | | | | | | 168,949,357 | | |
See accompanying notes to financial statements.
11
COHEN & STEERS UTILITY FUND, INC.
SCHEDULE OF INVESTMENTS—(Continued)
December 31, 2005
| | | | | Number
of Shares | | Value | |
| PREFERRED SECURITIES—CAPITAL TRUST | | | 0.4 | % | | | | | | | | | |
| OIL COMPANY—EXPLORATION AND PRODUCTION | |
Pemex Project Funding Master Trust, 7.75%, due 9/29/49
(Identified cost—$610,430) | | | | | | | 600,000 | | | $ | 619,230 | | |
| PREFERRED SECURITIES—$25 PAR VALUE | | | 1.7 | % | | | | | | | | | |
| REAL ESTATE—HOTEL | | | 0.3 | % | | | | | | | | | |
| Innkeepers USA Trust, 8.00%, Series C | | | | | | | 20,600 | | | | 503,258 | | |
| UTILITIES | | | 1.4 | % | | | | | | | | | |
| ELECTRIC—INTEGRATED | |
| Aquila, 7.875%, due 3/01/32, Series | | | | | | | 35,500 | | | | 892,115 | | |
| NVP Capital I, 8.20%, due 3/31/37, Series A (QUIPS) | | | | | | | 5,900 | | | | 148,385 | | |
| NVP Capital III, 7.75%, due 9/30/38, Series B | | | | | | | 33,600 | | | | 845,712 | | |
| Sierra Pacific Power Co., 7.80%, Series 1 | | | | | | | 25,000 | | | | 630,000 | | |
| | | | | | | | 2,516,212 | | |
TOTAL PREFERRED SECURITIES—$25 PAR VALUE
(Identified cost—$3,050,413) | | | | | | | | | | | 3,019,470 | | |
| | | | | Principal
Amount | | | |
| COMMERCIAL PAPER | | | 0.4 | % | | | | | | | | | |
Citigroup Funding, 3.230%, due 1/3/06
(Identified cost—$646,884) | | | | | | $ | 647,000 | | | | 646,884 | | |
| TOTAL INVESTMENTS (Identified cost—$159,805,436) | | | 99.8 | % | | | | | | | 173,234,941 | | |
| OTHER ASSETS IN EXCESS OF LIABILITIES | | | 0.2 | % | | | | | | | 298,685 | | |
| NET ASSETS | | | 100.0 | % | | | | | | $ | 173,533,626 | | |
See accompanying notes to financial statements.
12
COHEN & STEERS UTILITY FUND, INC.
SCHEDULE OF INVESTMENTS—(Continued)
December 31, 2005
Glossary of Portfolio Abbreviations
ADR American Depositary Receipt
QUIPS Quarterly Income Preferred Securities
Note: Percentages indicated are based on the net assets of the fund.
a Non-income producing security.
b Resale is restricted to qualified institutional investors; aggregate holdings equal 0.1% of net assets.
See accompanying notes to financial statements.
13
COHEN & STEERS UTILITY FUND, INC.
STATEMENT OF ASSETS AND LIABILITIES
December 31, 2005
| ASSETS: | |
| Investments in securities, at value (Identified cost—$159,805,436) | | $ | 173,234,941 | | |
| Receivable for investments sold | | | 623,489 | | |
| Dividends and interest receivable | | | 395,993 | | |
| Receivable for fund shares sold | | | 114,518 | | |
| Receivable due from advisor | | | 12,806 | | |
| Other assets | | | 4,644 | | |
| Total Assets | | | 174,386,391 | | |
| LIABILITIES: | |
| Payable for investment securities purchased | | | 261,132 | | |
| Payable for fund shares redeemed | | | 242,896 | | |
| Payable to investment advisor | | | 111,170 | | |
| Payable for distribution fees | | | 60,539 | | |
| Payable for shareholder servicing fees | | | 21,810 | | |
| Payable to administrator | | | 2,965 | | |
| Other liabilities | | | 152,253 | | |
| Total Liabilities | | | 852,765 | | |
| NET ASSETS | | $ | 173,533,626 | | |
| NET ASSETS consist of: | |
| Paid-in capital | | $ | 160,338,977 | | |
| Accumulated net realized loss | | | (234,668 | ) | |
| Net unrealized appreciation | | | 13,429,317 | | |
| | | $ | 173,533,626 | | |
See accompanying notes to financial statements.
14
COHEN & STEERS UTILITY FUND, INC.
STATEMENT OF ASSETS AND LIABILITIES—(Continued)
December 31, 2005
| CLASS A SHARES: | |
| NET ASSETS | | $ | 114,510,073 | | |
| Shares issued and outstanding ($0.001 par value common stock outstanding) | | | 7,510,716 | | |
| Net asset value and redemption price per share | | $ | 15.25 | | |
| Maximum offering price per share ($15.25 ÷ 0.955)a | | $ | 15.97 | | |
| CLASS B SHARES: | |
| NET ASSETS | | $ | 7,733,300 | | |
| Shares issued and outstanding ($0.001 par value common stock outstanding) | | | 509,004 | | |
| Net asset value and offering price per shareb | | $ | 15.19 | | |
| CLASS C SHARES: | |
| NET ASSETS | | $ | 48,616,664 | | |
| Shares issued and outstanding ($0.001 par value common stock outstanding) | | | 3,197,747 | | |
| Net asset value and offering price per shareb | | $ | 15.20 | | |
| CLASS I SHARES: | |
| NET ASSETS | | $ | 2,673,589 | | |
| Shares issued and outstanding ($0.001 par value common stock outstanding) | | | 175,240 | | |
| Net asset value, offering and redemption price per share | | $ | 15.26 | | |
a On investments of $100,000 or more, the offering price is reduced.
b Redemption price per share is equal to the net asset value per share less any applicable deferred sales charge which varies with the length of time shares are held.
See accompanying notes to financial statements.
15
COHEN & STEERS UTILITY FUND, INC.
STATEMENT OF OPERATIONS
For the Year Ended December 31, 2005
| Investment Income: | |
| Dividend income (net of $26,341 of foreign withholding tax) | | $ | 4,778,552 | | |
| Interest income | | | 482,779 | | |
| Total Income | | | 5,261,331 | | |
| Expenses: | |
| Investment advisory fees | | | 981,692 | | |
| Distribution fees—Class A | | | 214,184 | | |
| Distribution fees—Class B | | | 42,891 | | |
| Distribution fees—Class C | | | 280,188 | | |
| Shareholder servicing fees—Class A | | | 85,674 | | |
| Shareholder servicing fees—Class B | | | 14,297 | | |
| Shareholder servicing fees—Class C | | | 93,396 | | |
| Professional fees | | | 138,638 | | |
| Shareholder reporting expenses | | | 119,962 | | |
| Administration fees | | | 110,984 | | |
| Transfer agent fees | | | 69,313 | | |
| Registration and filing fees | | | 64,501 | | |
| Custodian fees and expenses | | | 51,540 | | |
| Directors' fees and expenses | | | 51,267 | | |
| Line of credit fees | | | 6,559 | | |
| Miscellaneous | | | 13,589 | | |
| Total Expenses | | | 2,338,675 | | |
| Reduction of Expenses | | | (110,788 | ) | |
| Net Expenses | | | 2,227,887 | | |
| Net Investment Income | | | 3,033,444 | | |
| Net Realized and Unrealized Gain (Loss) on Investments: | |
| Net realized loss on: | |
| Investments | | | (171,621 | ) | |
| Foreign currency transactions | | | (4,716 | ) | |
| Net realized loss | | | (176,337 | ) | |
| Net change in unrealized appreciation on: | |
| Investments | | | 10,955,050 | | |
| Foreign currency translations | | | (188 | ) | |
| Net change in unrealized appreciation | | | 10,954,862 | | |
| Total net realized and unrealized gain on investments | | | 10,778,525 | | |
| Net Increase in Net Assets Resulting from Operations | | $ | 13,811,969 | | |
See accompanying notes to financial statements.
16
COHEN & STEERS UTILITY FUND, INC.
STATEMENT OF CHANGES IN NET ASSETS
| | | For the
Year Ended
December 31, 2005 | | For the Period
May 3, 2004a
through
December 31, 2004 | |
| Change in Net Assets: | |
| From Operations: | |
| Net investment income | | $ | 3,033,444 | | | $ | 265,959 | | |
| Net realized gain (loss) on investments | | | (176,337 | ) | | | 1,906 | | |
| Net change in unrealized appreciation on investments | | | 10,954,862 | | | | 2,474,455 | | |
| Net increase in net assets resulting from operations | | | 13,811,969 | | | | 2,742,320 | | |
| Dividends and Distributions to Shareholders from: | |
| Net investment income: | |
| Class A | | | (2,162,776 | ) | | | (164,473 | ) | |
| Class B | | | (106,440 | ) | | | (16,599 | ) | |
| Class C | | | (702,728 | ) | | | (72,168 | ) | |
| Class I | | | (56,784 | ) | | | (15,475 | ) | |
| Net realized gain on investments: | |
| Class A | | | (19,379 | ) | | | (22,004 | ) | |
| Class B | | | (954 | ) | | | (2,322 | ) | |
| Class C | | | (6,297 | ) | | | (11,877 | ) | |
| Class I | | | (509 | ) | | | (1,087 | ) | |
| Tax return of capital: | |
| Class A | | | (136,993 | ) | | | (7,584 | ) | |
| Class B | | | (6,742 | ) | | | (765 | ) | |
| Class C | | | (44,512 | ) | | | (3,328 | ) | |
| Class I | | | (3,597 | ) | | | (714 | ) | |
| Total dividends and distributions to shareholders | | | (3,247,711 | ) | | | (318,396 | ) | |
| Capital Stock Transactions: | |
| Increase in net assets from fund share transactions | | | 117,323,566 | | | | 43,121,603 | | |
| Total increase in net assets | | | 127,887,824 | | | | 45,545,527 | | |
| Net Assets: | |
| Beginning of period | | | 45,645,802 | | | | 100,275 | | |
| End of period | | $ | 173,533,626 | | | $ | 45,645,802 | | |
a Commencement of operations.
See accompanying notes to financial statements.
17
COHEN & STEERS UTILITY FUND, INC.
FINANCIAL HIGHLIGHTS
The following table includes selected data for a share outstanding throughout each period and other performance information derived from the financial statements. It should be read in conjunction with the financial statements and notes thereto.
| | | Class A | | Class B | |
| Per Share Operating Performance: | | For the
Year Ended
December 31, 2005 | | For the Period
May 3, 2004a
through
December 31, 2004 | | For the
Year Ended
December 31, 2005 | | For the Period
May 3, 2004a
through
December 31, 2004 | |
| Net asset value, beginning of period | | $ | 13.78 | | | $ | 11.46 | | | $ | 13.74 | | | $ | 11.46 | | |
| Income from investment operations: | |
| Net investment incomeb | | | 0.38 | | | | 0.29 | | | | 0.28 | | | | 0.21 | | |
| Net realized and unrealized gain on investments | | | 1.45 | | | | 2.20 | | | | 1.45 | | | | 2.20 | | |
| Total from investment operations | | | 1.83 | | | | 2.49 | | | | 1.73 | | | | 2.41 | | |
| Less dividends and distributions to shareholders from: | |
| Net investment income | | | (0.34 | ) | | | (0.14 | ) | | | (0.26 | ) | | | (0.10 | ) | |
| Net realized gain on investments | | | (0.00 | )f | | | (0.02 | ) | | | (0.00 | )f | | | (0.02 | ) | |
| Tax return of capital | | | (0.02 | ) | | | (0.01 | ) | | | (0.02 | ) | | | (0.01 | ) | |
Total dividends and distributions to
shareholders | | | (0.36 | ) | | | (0.17 | ) | | | (0.28 | ) | | | (0.13 | ) | |
| Redemption fees retained by the fund | | | 0.00 | f | | | — | | | | 0.00 | f | | | — | | |
| Net increase in net asset value | | | 1.47 | | | | 2.32 | | | | 1.45 | | | | 2.28 | | |
| Net asset value, end of period | | $ | 15.25 | | | $ | 13.78 | | | $ | 15.19 | | | $ | 13.74 | | |
| Total investment returnc | | | 13.33 | % | | | 21.80 | %d | | | 12.59 | % | | | 21.08 | %d | |
| Ratios/Supplemental Data: | |
| Net assets, end of period (in millions) | | $ | 114.5 | | | $ | 26.9 | | | $ | 7.7 | | | $ | 2.9 | | |
Ratio of expenses to average daily net assets
(before expense reduction) | | | 1.58 | % | | | 3.55 | %e | | | 2.23 | % | | | 4.66 | %e | |
Ratio of expenses to average daily net assets
(net of expense reduction) | | | 1.49 | % | | | 1.50 | %e | | | 2.14 | % | | | 2.15 | %e | |
Ratio of net investment income to average daily net
assets (before expense reduction) | | | 2.44 | % | | | 1.26 | %e | | | 1.76 | % | | | (0.11 | )%e | |
Ratio of net investment income to average daily net
assets (net of expense reduction) | | | 2.53 | % | | | 3.31 | %e | | | 1.85 | % | | | 2.39 | %e | |
| Portfolio turnover rate | | | 45 | % | | | 16 | %d | | | 45 | % | | | 16 | %d | |
a Commencement of operations.
b Calculation based on average shares outstanding.
c Does not reflect sales charges, which would reduce return.
d Not annualized.
e Annualized.
f Amount is less than $0.005.
See accompanying notes to financial statements.
18
COHEN & STEERS UTILITY FUND, INC.
FINANCIAL HIGHLIGHTS—(Continued)
| | | Class C | | Class I | |
| Per Share Operating Performance: | | For the
Year Ended
December 31, 2005 | | For the Period
May 3, 2004a
through
December 31, 2004 | | For the
Year Ended
December 31, 2005 | | For the Period
May 3, 2004a
through
December 31, 2004 | |
| Net asset value, beginning of period | | $ | 13.75 | | | $ | 11.46 | | | $ | 13.78 | | | $ | 11.46 | | |
| Income from investment operations: | |
| Net investment incomeb | | | 0.28 | | | | 0.22 | | | | 0.43 | | | | 0.27 | | |
| Net realized and unrealized gain on investments | | | 1.45 | | | | 2.20 | | | | 1.45 | | | | 2.24 | | |
| Total from investment operations | | | 1.73 | | | | 2.42 | | | | 1.88 | | | | 2.51 | | |
| Less dividends and distributions to shareholders from: | |
| Net investment income | | | (0.26 | ) | | | (0.10 | ) | | | (0.38 | ) | | | (0.17 | ) | |
| Net realized gain on investments | | | (0.00 | )f | | | (0.02 | ) | | | (0.00 | )f | | | (0.01 | ) | |
| Tax return of capital | | | (0.02 | ) | | | (0.01 | ) | | | (0.02 | ) | | | (0.01 | ) | |
| Total dividends and distributions to shareholders | | | (0.28 | ) | | | (0.13 | ) | | | (0.40 | ) | | | (0.19 | ) | |
| Redemption fees retained by the fund | | | 0.00 | f | | | — | | | | 0.00 | f | | | — | | |
| Net increase in net asset value | | | 1.45 | | | | 2.29 | | | | 1.48 | | | | 2.32 | | |
| Net asset value, end of period | | $ | 15.20 | | | $ | 13.75 | | | $ | 15.26 | | | $ | 13.78 | | |
| Total investment return | | | 12.58 | %c | | | 21.17 | %c,d | | | 13.73 | % | | | 21.98 | %d | |
| Ratios/Supplemental Data: | |
| Net assets, end of period (in millions) | | $ | 48.6 | | | $ | 14.6 | | | $ | 2.7 | | | $ | 1.3 | | |
Ratio of expenses to average daily net assets
(before expense reduction) | | | 2.23 | % | | | 4.49 | %e | | | 1.24 | % | | | 9.33 | %e | |
Ratio of expenses to average daily net assets
(net of expense reduction) | | | 2.14 | % | | | 2.15 | %e | | | 1.14 | % | | | 1.15 | %e | |
Ratio of net investment income to average daily net
assets (before expense reduction) | | | 1.79 | % | | | 0.15 | %e | | | 2.80 | % | | | (4.92 | )%e | |
Ratio of net investment income to average daily net
assets (net of expense reduction) | | | 1.87 | % | | | 2.49 | %e | | | 2.89 | % | | | 3.26 | %e | |
| Portfolio turnover rate | | | 45 | % | | | 16 | %d | | | 45 | % | | | 16 | %d | |
a Commencement of operations.
b Calculation based on average shares outstanding.
c Does not reflect sales charges, which would reduce return.
d Not annualized.
e Annualized.
f Amount is less than $0.005.
See accompanying notes to financial statements.
19
COHEN & STEERS UTILITY FUND, INC.
NOTES TO FINANCIAL STATEMENTS
Note 1. Significant Accounting Policies
Cohen & Steers Utility Fund, Inc. (the fund) was incorporated under the laws of the State of Maryland on January 13, 2004 and is registered under the Investment Company Act of 1940, as amended, as a nondiversified, open-end management investment company. The fund's investment objective is total return. The fund had no operations until March 19, 2004 when it sold 10 shares each of Class A, B, C, and 8,720 shares of Class I for $100,275 to Cohen & Steers Capital Management, Inc. Investment operations commenced on May 3, 2004. The authorized shares of the fund are divided into four classes designated Class A, B, C, and I shares. Each of the fund's shares has equal dividend, liquidation and voting rights (except for matters relating to distributions and shareholder servicing of such shares). Class B shares automatically convert to Class A shares at the end of the month which precedes the eighth anniversary of the purchase date.
The following is a summary of significant accounting policies consistently followed by the fund in the preparation of its financial statements. The policies are in conformity with accounting principles generally accepted in the United States of America (GAAP). The preparation of the financial statements in accordance with GAAP requires management to make estimates and assumptions that affect the reported amounts of assets and liabilities at the date of the financial statements and the reported amounts of income and expenses during the reporting period. Actual results could differ from those estimates.
Portfolio Valuation: Investments in securities that are listed on the New York Stock Exchange are valued, except as indicated below, at the last sale price reflected at the close of the New York Stock Exchange on the business day as of which such value is being determined. If there has been no sale on such day, the securities are valued at the mean of the closing bid and asked prices for the day or, if no asked price is available, at the bid price.
Securities not listed on the New York Stock Exchange but listed on other domestic or foreign securities exchanges or admitted to trading on the National Association of Securities Dealers Automated Quotations, Inc. (Nasdaq) national market system are valued in a similar manner. Securities traded on more than one securities exchange are valued at the last sale price on the business day as of which such value is being determined as reflected on the tape at the close of the exchange representing the principal market for such securities.
Readily marketable securities traded in the over-the-counter market, including listed securities whose primary market is believed by Cohen & Steers Capital Management, Inc. to be over-the-counter, but excluding securities admitted to trading on the Nasdaq National List, are valued at the official closing prices as reported by Nasdaq, the National Quotation Bureau, or such other comparable sources as the Board of Directors deem appropriate to reflect their fair market value. If there has been no sale on such day, the securities are valued at the mean of the closing bid and asked prices for the day, or if no asked price is available, at the bid price. However, certain fixed-income securities may be valued on the basis of prices provided by a pricing service when such prices are believed by the Board of Directors to reflect the fair market value of such securities. Where securities are traded on more than one exchange and also over-the-coun ter, the securities will generally be valued using the quotations the Board of Directors believes most closely reflect the value of such securities.
20
COHEN & STEERS UTILITY FUND, INC.
NOTES TO FINANCIAL STATEMENTS—(Continued)
Securities for which market prices are unavailable will be valued at fair value pursuant to procedures approved by the fund's Board of Directors. Circumstances in which market prices may be unavailable include, but are not limited to, when trading in a security is suspended, the exchange on which the security is traded is subject to an unscheduled close or disruption or material events occur after the close of the exchange on which the security is principally traded. In these circumstances, the fund determines fair value in a manner that fairly reflects the market value of the security on the valuation date based on consideration of any information or factors it deems appropriate. These may include recent transactions in comparable securities, information relating to the specific security and developments in the markets.
The fund's use of fair value pricing may cause the net asset value of fund shares to differ from the net asset value that would be calculated using market quotations. Fair value pricing involves subjective judgments and it is possible that the fair value determined for a security may be materially different than the value that could be realized upon the sale of that security.
To the extent the fund holds securities that are primarily listed on foreign exchanges that trade on weekends or days when the fund does not price its shares, the value of the securities held in the fund may change on days when you will not be able to purchase or redeem fund shares.
Short-term debt securities, which have a maturity date of 60 days or less, are valued at amortized cost, which approximates value.
Security Transactions and Investment Income: Security transactions are recorded on trade date. Realized gains and losses on investments sold are recorded on the basis of identified cost. Interest income is recorded on the accrual basis. Discounts are accreted and premiums are amortized over the life of the respective securities. Dividend income is recorded on the ex-dividend date. The fund records distributions received in excess of income from underlying investments as a reduction of cost of investments and/or realized gain. Such amounts are based on estimates if actual amounts are not available, and actual amounts of income, realized gain and return of capital may differ from the estimated amounts. The fund adjusts the estimated amounts of the components of distributions (and consequently its net investment income) as an increase to unrealized appreciation/ (dep reciation) and realized gain/(loss) on investments as necessary once the issuers provide information about the actual composition of the distributions. Income, expenses (other than expenses attributable to a specific class), and realized and unrealized gains or losses on investments are allocated to each class of shares based on its relative net assets.
Dividends and Distributions to Shareholders: Dividends from net investment income and capital gain distributions are determined in accordance with U.S. federal income tax regulations, which may differ from GAAP. Dividends from net investment income are declared and paid quarterly. Net realized capital gains, unless offset by any available capital loss carryforward, are distributed to shareholders annually. Dividends and distributions to shareholders are recorded on the ex-dividend date and are automatically reinvested in full and fractional shares
21
COHEN & STEERS UTILITY FUND, INC.
NOTES TO FINANCIAL STATEMENTS—(Continued)
of the fund based on the net asset value per share at the close of business on the ex-dividend date unless the shareholder has elected to have them paid in cash.
Distributions paid by the fund are subject to recharacterization for tax purposes. For the year ended December 31, 2005, a portion of the dividends paid have been reclassified to return of capital and distributions of net realized capital gains.
Federal Income Taxes: It is the policy of the fund to continue to qualify as a regulated investment company, if such qualification is in the best interest of the shareholders, by complying with the requirements of Subchapter M of the Internal Revenue Code applicable to regulated investment companies, and by distributing substantially all of its taxable earnings to its shareholders. Accordingly, no provision for federal income or excise tax is necessary.
Note 2. Investment Advisory and Administration Fees and Other Transactions with Affiliates
Investment Advisory Fees: Cohen & Steers Capital Management, Inc. (the advisor) serves as the fund's investment advisor pursuant to an investment advisory agreement (the advisory agreement). Under the terms of the advisory agreement, the advisor provides the fund with the day-to-day investment decisions and generally manages the fund's investments in accordance with the stated policies of the fund, subject to the supervision of the fund's Board of Directors. For the services provided to the fund, the advisor receives a fee, accrued daily and paid monthly at the annual rate of 0.75% of the average daily net assets of the fund up to and including $1.5 billion and 0.65% of the average daily net asset above $1.5 billion.
For the year ended December 31, 2005 and through December 31, 2006, the advisor has contractually agreed to waive its fee and/or reimburse the fund for expenses incurred to the extent necessary to maintain the fund's operating expenses at 1.50% for the Class A shares, 2.15% for the Class B shares and Class C shares and 1.15% for the Class I shares.
Administration Fees: The fund has entered into an administration agreement with the advisor under which the advisor performs certain administrative functions for the fund and receives a fee, accrued daily and paid monthly at the annual rate of 0.02% of the fund's average daily net assets. For the year ended December 31, 2005, the fund paid the advisor $26,178 in fees under this administration agreement.
Distribution Fees: Shares of the fund are distributed by Cohen & Steers Securities, LLC (the distributor), an affiliated entity of the advisor. The fund has adopted a distribution plan (the plan) pursuant to Rule 12b-1 under the Investment Company Act of 1940. The plan provides that the fund will pay the distributor a fee at an annual rate of up to 0.25% of the average daily net assets attributable to the Class A shares and 0.75% of the average daily net assets attributable to the Class B and Class C shares.
22
COHEN & STEERS UTILITY FUND, INC.
NOTES TO FINANCIAL STATEMENTS—(Continued)
For the year ended December 31, 2005, the fund has been advised that the distributor received $33,763 in sales commissions from the sale of Class A shares and that the distributor also received $8,408 and $8,375 of contingent deferred sales charges relating to redemptions of Class B and Class C shares, respectively. The distributor has advised the fund that proceeds from the contingent deferred sales charge on the Class B and C shares are paid to the distributor and are used by the distributor to defray its expenses related to providing distribution-related services to the fund in connection with the sale of the Class B and C shares, including payments to dealers and other financial intermediaries for selling Class B and C shares and interest and other financing costs associated with Class B and C shares.
Shareholder Servicing Fees: The fund has adopted a shareholder services plan which provides that the fund may obtain the services of qualified financial institutions to act as shareholder servicing agents for their customers. For these services, the fund may pay the shareholder servicing agent a fee at an annual rate of up to 0.10% of the average daily net asset value of the fund's Class A shares and up to 0.25% of the average daily net asset value of the fund's Class B and C shares.
Directors' and Officers' Fees: Certain directors and officers of the fund are also directors, officers, and/or employees of the advisor. The fund does not pay compensation to any affiliated directors and officers except for the Chief Compliance Officer, who received $2,209 from the fund for the year ended December 31, 2005.
Other: During the year ended December 31, 2005, the fund sold securities to other entities of which the advisor acts as either advisor or sub-advisor. Total proceeds from these sales amounted to $7,842,418.
Note 3. Purchases and Sales of Securities
Purchases and sales of securities, excluding short-term investments, for the year ended December 31, 2005 totaled $176,622,505 and $57,917,846, respectively.
Note 4. Income Tax Information
The tax character of dividends and distributions paid was as follows:
| | | For the Year Ended
December 31, | |
| | | 2005 | | 2004 | |
| Ordinary income | | $ | 3,028,356 | | | $ | 300,859 | | |
| Long-term capital gains | | | 27,511 | | | | 5,146 | | |
| Tax return of capital | | | 191,844 | | | | 12,391 | | |
| Total dividends and distributions | | $ | 3,247,711 | | | $ | 318,396 | | |
23
COHEN & STEERS UTILITY FUND, INC.
NOTES TO FINANCIAL STATEMENTS—(Continued)
As of December 31, 2005, the tax-basis components of accumulated earnings and the federal tax cost were as follows:
| Gross unrealized appreciation | | $ | 13,725,884 | | |
| Gross unrealized depreciation | | | (531,046 | ) | |
| Net unrealized appreciation | | $ | 13,194,838 | | |
| Cost for federal income tax purposes | | $ | 160,040,103 | | |
As of December 31, 2005, the fund had temporary book/tax differences primarily attributable to wash sales on portfolio securities and permanent book/tax differences primarily attributable to foreign cash reclassifications. To reflect reclassifications arising from the permanent differences, paid-in capital was credited $524, accumulated net realized loss was credited $4,192 and accumulated net investment income was charged $4,716.
Note 5. Capital Stock
The fund is authorized to issue 200 million shares of capital stock, at a par value of $0.001 per share. The Board of Directors of the fund may increase or decrease the aggregate number of shares of common stock that the fund has authority to issue. At December 31, 2005, Cohen & Steers Capital Management, Inc. owned 90,980 Class I shares. Transactions in fund shares were as follows:
| | | For the
Year Ended
December 31, 2005 | | For the Period
May 3, 2004*
through
December 31, 2004 | |
| | | Shares | | Amount | | Shares | | Amount | |
| Class A: | |
| Sold | | | 6,021,568 | | | $ | 87,820,888 | | | | 1,975,846 | | | $ | 26,027,711 | | |
Issued as reinvestment of
dividends and distributions | | | 22,846 | | | | 350,107 | | | | 2,670 | | | | 36,012 | | |
| Redeemed | | | (486,507 | ) | | | (7,308,866 | ) | | | (25,717 | ) | | | (335,483 | ) | |
Redemption fees retained by
the funda | | | — | | | | 15,301 | | | | — | | | | — | | |
| Net increase | | | 5,557,907 | | | $ | 80,877,430 | | | | 1,952,799 | | | $ | 25,728,240 | | |
* Commencement of operations
a The fund may charge a 1% redemption fee on shares sold within six months of the time of purchase.
24
COHEN & STEERS UTILITY FUND, INC.
NOTES TO FINANCIAL STATEMENTS—(Continued)
| | | For the
Year Ended
December 31, 2005 | | For the Period
May 3, 2004*
through
December 31, 2004 | |
| | | Shares | | Amount | | Shares | | Amount | |
| Class B: | |
| Sold | | | 324,528 | | | $ | 4,762,575 | | | | 223,491 | | | $ | 2,851,112 | | |
Issued as reinvestment of
dividends and distributions | | | 862 | | | | 13,125 | | | | 66 | | | | 905 | | |
| Redeemed | | | (25,167 | ) | | | (365,686 | ) | | | (14,786 | ) | | | (201,544 | ) | |
Redemption fees retained by
the funda | | | — | | | | 983 | | | | — | | | | — | | |
| Net increase. | | | 300,223 | | | $ | 4,410,997 | | | | 208,771 | | | $ | 2,650,473 | | |
| Class C: | |
| Sold | | | 2,355,189 | | | $ | 34,117,442 | | | | 1,082,605 | | | $ | 14,056,872 | | |
Issued as reinvestment of
dividends and distributions | | | 3,081 | | | | 46,938 | | | | 344 | | | | 4,638 | | |
| Redeemed | | | (219,774 | ) | | | (3,298,391 | ) | | | (23,708 | ) | | | (312,480 | ) | |
Redemption fees retained by
the funda | | | — | | | | 6,238 | | | | — | | | | — | | |
| Net increase | | | 2,138,496 | | | $ | 30,872,227 | | | | 1,059,241 | | | $ | 13,749,030 | | |
| Class I: | |
| Sold | | | 94,827 | | | $ | 1,374,290 | | | | 84,984 | | | $ | 983,321 | | |
Issued as reinvestment of
dividends and distributions | | | 3,978 | | | | 60,293 | | | | 1,309 | | | | 17,275 | | |
| Redeemed | | | (18,074 | ) | | | (272,014 | ) | | | (504 | ) | | | (6,736 | ) | |
Redemption fees retained by
the funda | | | — | | | | 343 | | | | — | | | | — | | |
| Net increase | | | 80,731 | | | $ | 1,162,912 | | | | 85,789 | | | $ | 993,860 | | |
* Commencement of operations
a The fund may charge a 1% redemption fee on shares sold within six months of the time of purchase.
25
COHEN & STEERS UTILITY FUND, INC.
NOTES TO FINANCIAL STATEMENTS—(Continued)
Note 6. Borrowings
The fund, in conjunction with other Cohen & Steers funds is a party to a $150,000,000 syndicated credit agreement (the credit agreement) with State Street Bank and Trust Company, as administrative agent and operations agent, and the lenders identified in the credit agreement.
During the year ended December 31, 2005, the fund did not utilize the line of credit.
Note 7. Other
In the normal course of business, the fund enters into contracts that provide general indemnifications. The fund's maximum exposure under these arrangements is dependent on claims that may be made against the fund in the future and, therefore, cannot be estimated; however, based on experience, the risk of material loss from such claims is considered remote.
26
COHEN & STEERS UTILITY FUND, INC.
REPORT OF INDEPENDENT REGISTERED PUBLIC ACCOUNTING FIRM
To the Board of Directors and Shareholders of
Cohen & Steers Utility Fund, Inc.
In our opinion, the accompanying statement of assets and liabilities, including the schedule of investments, and the related statements of operations and of changes in net assets and the financial highlights present fairly, in all material respects, the financial position of Cohen & Steers Utility Fund, Inc. (the "Fund") at December 31, 2005, the results of its operations for the year then ended, and the changes in its net assets and the financial highlights for each of the periods presented, in conformity with accounting principles generally accepted in the United States of America. These financial statements and financial highlights (hereafter referred to as "financial statements") are the responsibility of the Fund's management. Our responsibility is to express an opinion on these financial statements based on our audits. We conducted our audits of these financial statements in accordance with the standards of the Public Company Accou nting Oversight Board (United States). Those standards require that we plan and perform the audit to obtain reasonable assurance about whether the financial statements are free of material misstatement. An audit includes examining, on a test basis, evidence supporting the amounts and disclosures in the financial statements, assessing the accounting principles used and significant estimates made by management, and evaluating the overall financial statement presentation. We believe that our audits, which included confirmation of securities at December 31, 2005 by correspondence with the custodian and brokers, provide a reasonable basis for our opinion.
PricewaterhouseCoopers LLP
New York, New York
February 17, 2006
27
COHEN & STEERS UTILITY FUND, INC.
TAX INFORMATION—2005 (Unaudited)
Pursuant to the Jobs and Growth Relief Reconciliation Act of 2003, the fund designates qualified dividend income of $4,268,154. Additionally, 100 % of the ordinary dividends qualified for the dividends received deduction available to corporations. Also, the fund designates a long-term capital gain distribution of $27,511 at the 15% rate.
OTHER INFORMATION
A description of the policies and procedures that the fund uses to determine how to vote proxies relating to portfolio securities is available (i) without charge, upon request, by calling 1-800-330-7348, (ii) on our Web site at cohenandsteers.com or (iii) on the Securities and Exchange Commission's Web site at http://www.sec.gov. In addition, the fund's proxy voting record for the most recent 12-month period ended June 30 is available (i) without charge, upon request, by calling 1-800-330-7348 or (ii) on the SEC's Web site at http://www.sec.gov.
The fund files its complete schedule of portfolio holdings with the SEC for the first and third quarters of each fiscal year on Form N-Q. The fund's Forms N-Q are available (i) without charge, upon request by calling 1-800-330-7348, or (ii) on the SEC's Web site at http://www.sec.gov. In addition, the Forms N-Q may be reviewed and copied at the SEC's Public Reference Room in Washington, DC. Information on the operation of the Public Reference Room may be obtained by calling 1-800-SEC-0330.
Please note that the distributions paid by the fund to shareholders are subject to recharacterization for tax purposes. The final tax treatment of these distributions is reported to shareholders on their 1099-DIV forms, which are mailed to shareholders after the close of each fiscal year. The fund may pay distributions in excess of the fund's net investment company taxable income and this excess would be a tax-free return of capital distributed from the fund's assets. To the extent this occurs, the fund's shareholders of record will be notified of the estimated amount of capital returned to shareholders for each such distribution and this information will also be available at cohenandsteers.com. Distributions of capital decrease the fund's total assets and, therefore, could have the effect of increasing the fund's expense ratio. In addition, in order to make these distributions, the fund may have to sell portfolio securities at a less than o pportune time.
APPROVAL OF INVESTMENT ADVISORY AGREEMENT
The board of directors of the fund, including a majority of the directors who are not parties to the fund's Investment Advisory Agreement, or interested persons of any such party ("Independent Directors"), has the responsibility under the 1940 Act to approve the fund's Investment Advisory Agreement for its initial two year term and its continuation annually thereafter at a meeting called for the purpose of voting on the approval or continuation. At meetings held in person on December 5 and 6, 2005, the board, including the Independent Directors, discussed and unanimously approved the continuation of the Investment Advisory Agreement for a one-year term. The Independent Directors were represented by independent counsel who assisted them in their deliberations during the meeting and executive session.
28
COHEN & STEERS UTILITY FUND, INC.
In considering whether to continue the Investment Advisory Agreement, the board reviewed materials provided by the fund's investment advisor (the "Advisor") and fund counsel, which included, among other things, fee, expense and performance information of the fund compared to peer funds prepared by Morningstar Associates LLC ("Morningstar"), supplemental performance and summary information prepared by the Advisor, sales and redemption data for the fund and a memoranda outlining the legal duties of the board. The board also spoke directly with representatives of Morningstar and met with investment advisory personnel from the Advisor. The board considered factors relating to both the selection of the Advisor and the approval of the advisory fee when reviewing the Investment Advisory Agreement. In particular, the board considered the following:
(i) The nature, extent and quality of services to be provided by the Advisor: The directors reviewed the services that the Advisor provides to the fund, including, but not limited to, making the day-to-day investment decisions for the fund, and generally managing the fund's investments in accordance with the stated policies of the fund. The directors also discussed with officers and portfolio managers of the fund the amount of time the Advisor dedicated to the fund during the last year and the types of transactions that were being done on behalf of the fund. The directors also received a presentation by the Advisor on its investment philosophy with respect to the fund and the investment outlook for the fund. Additionally, the directors considered the services provided by the Advisor to other funds it advises that have similar investment objectives and strategies.
In addition, the board considered the education, background and experience of the personnel at the Advisor. They also took into consideration the favorable history and reputation of the portfolio managers for the fund, finding that this has had, and would likely continue to have, a favorable impact on the success of the fund. The board noted that the Advisor's experience in investing in utility securities generally helped further the fund's objectives. Lastly, the directors noted the Advisor's ability to attract quality and experienced personnel. The directors concluded that the scope of services provided by the Advisor to the fund, including compliance and tax reporting requirements, was satisfactory in both nature and quality.
(ii) Investment performance of the fund and the Advisor: The directors reviewed the past investment performance of the fund, as well as the past investment performance of the fund's peer group and benchmark, as identified by Morningstar. The directors noted that the fund's performance trailed both the peer group and benchmark. However, the directors gave consideration to the fact that the fund, unlike the peer group and benchmark, maintained a significant weighting to preferred securities, which hurt relative performance. In addition, the directors noted the Advisor's intention to substantially reduce or eliminate this preferred securities allocation in an effort to improve the fund's absolute and relative performance. The directors further noted that Morningstar's chosen benchmark had significant weightings in pure energy stocks that the fund does not generally i nvest in. The directors also considered the fund's performance against other recognized and customized benchmarks.
The directors then found that the Advisor had the necessary expertise to manage the fund in accordance with its investment objectives and strategies and determined that the Advisor would continue to be an appropriate investment adviser for the fund and that fund performance, in light of all considerations noted above, was satisfactory.
29
COHEN & STEERS UTILITY FUND, INC.
(iii) Cost of the services to be provided and profits to be realized by the Advisor from the relationship with the Fund: Next, the directors considered the cost of the services provided by the Advisor. As part of their analysis, the directors gave substantial consideration to the comparative fee and expense ratio information provided by Morningstar. The directors noted that advisory fee, management fee (advisory fee plus administration fee) and overall expense ratio were above the peer group median, but further noted that the relatively high expense ratio was primarily a function of the fund's size and that Cohen & Steers expected the expense ratio to decline as the fund grows so that overall expenses were projected to be in line with peer group funds. In fact, Morningstar's expense comparisons were based on year-end 2004 information and thus did not take into account the significant increase in net assets since that time. In light of this information, and considering the services provided by the fund to the Advisor, the directors concluded that the fund's investment advisory fee and overall expenses were reasonable.
The directors also reviewed information regarding the profitability to the Advisor of its relationship with the fund. The profitability analysis took into consideration fall out benefits from the Advisor's relationship with the fund, including the fees paid to the Advisor under an administration agreement. However, the directors noted that the Advisor was currently waiving fees and/or reimbursing expenses and thus operating the fund was currently not profitable.
(iv) The extent to which economies of scale would be realized as the fund grows and whether fee levels would reflect such economies of scale: The directors noted that since the fund is relatively new and small in size and that the Advisor is currently waiving fees and/or reimbursing expenses, there are not yet significant economies of scale. However, the directors will monitor fee levels as the fund continues to grow to ensure that economies of scale are passed on to the shareholders.
(v) Comparison of services rendered and fees paid to those under other investment advisory contracts, such as contracts of the same and other investment advisers or other clients: As discussed above in (i) and (iii), the directors compared both the services rendered and the fees paid under the Investment Advisory Agreement to other contracts of the Advisor and compared the fees paid under the Investment Advisory Agreement to contracts of other investment advisers. The directors determined that the services and fees were reasonable when compared to those being offered under those other contracts.
The directors took into consideration other benefits to be derived by the Advisor in connection with the Investment Advisory Agreement, noting particularly the research and related services, within the meaning of Section 28(e) of the Securities Exchange Act of 1934, as amended, that the Advisor would be eligible to receive by allocating the fund's brokerage transactions. The directors also noted the administrative services provided under the Administration Agreement by the Advisor for the fund such as operational services and furnishing office space and facilities for the fund, and providing persons satisfactory to the board to serve as officers of the fund, noting that these services were beneficial to the fund.
No single factor was determinative to the decision of the board. Rather, after weighing all of the reasons discussed above, the board, including the Independent Directors, unanimously approved the continuation of the Investment Advisory Agreement.
30
COHEN & STEERS UTILITY FUND, INC.
MANAGEMENT OF THE FUND
The business and affairs of the fund are managed under the direction of the board of directors. The board of directors approves all significant agreements between the fund and persons or companies furnishing services to it, including the fund's agreements with its advisor, administrator, custodian and transfer agent. The management of the fund's day-to-day operations is delegated to its officers, the advisor and the fund's administrator, subject always to the investment objective and policies of the fund and to the general supervision of the board of directors.
The directors and officers of the fund and their principal occupations during the past five years are set forth below. The statement of additional information (SAI) includes additional information about fund directors and is available, without charge, upon request by calling 1-800-330-7348.
| Name, Address and Age* | | Position(s) Held
With Fund | | Term of
Office | | Principal Occupation
During Past 5 Years
(Including Other
Directorships Held) | | Number of
Funds Within
Fund
Complex
Overseen by
Director
(Including
the Fund) | | Length
of Time
Served** | |
| Interested Directors1 | |
|
Robert H. Steers
Age: 52 | | Director and Co-Chairman | | Until next election of directors | | Co-Chairman and Co-Chief Executive Officer of Cohen & Steers Capital Management, Inc. (CSCM), the fund's investment manager, and its parent company, Cohen & Steers, Inc. (CNS) since 2004. President and Director, Cohen & Steers Securities, LLC (CSSL), the Cohen & Steers open-end funds' distributor. Prior thereto, Chairman of CSCM and the Cohen & Steers funds. | | | 17 | | | | 1991 | to present | |
|
Martin Cohen
Age: 56 | | Director and Co-Chairman | | Until next election of directors | | Co-Chairman and Co-Chief Executive Officer of CSCM and CNS. Vice President and Director of CSSL. Prior thereto, President of the CSCM and the Cohen & Steers funds. | | | 17 | | | | 1991 | to present | |
|
(table continued on next page)
* The address for each director is 280 Park Avenue, New York, NY 10017.
** The length of time served represents the year in which the director was first elected or appointed to any fund in the Cohen & Steers fund complex.
1 "Interested person", as defined in the 1940 Act, of the fund because of affiliation with CSCM.
31
COHEN & STEERS UTILITY FUND, INC.
(table continued from previous page)
| Name, Address and Age* | | Position(s) Held
With Fund | | Term of
Office | | Principal Occupation
During Past 5 Years
(Including Other
Directorships Held) | | Number of
Funds Within
Fund
Complex
Overseen by
Director
(Including
the Fund) | | Length
of Time
Served** | |
| Disinterested Directors | |
|
Bonnie Cohen2
Age: 63 | | Director | | Until next election of directors | | Consultant. Prior thereto, Undersecretary of State, United States Department of State. Director of Wellsford Real Properties, Inc. | | | 17 | | | | 2001 | to present | |
|
George Grossman
Age: 52 | | Director | | Until next election of directors | | Attorney-at-law. | | | 17 | | | | 1993 | to present | |
|
Richard E. Kroon
Age: 63 | | Director | | Until next election of directors | | Board member of Finlay Enterprises, Inc., (operator of department store fine jewelry leased departments) and several private companies; member of Investment Subcommittee, Monmouth University; retired Chairman and Managing Partner of the Sprout Group venture capital funds, then an affiliate of Donaldson, Lufkin & Jenrette Securities Corporation; and former Chairman of the National Venture Capital Association. | | | 17 | | | | 2004 | to present | |
|
Richard J. Norman
Age: 62 | | Director | | Until next election of directors | | Private Investor. President of the Board of Directors of Maryland Public Television, Board Member of the Salvation Army. Prior thereto, Investment Representative of Morgan Stanley Dean Witter. | | | 17 | | | | 2001 | to present | |
|
(table continued on next page)
* The address for each director is 280 Park Avenue, New York, NY 10017.
** The length of time served represents the year in which the director was first elected or appointed to any fund in the Cohen & Steers fund complex.
2 Martin Cohen and Bonnie Cohen are not related.
32
COHEN & STEERS UTILITY FUND, INC.
(table continued from previous page)
| Name, Address and Age* | | Position(s) Held
With Fund | | Term of
Office | | Principal Occupation
During Past 5 Years
(Including Other
Directorships Held) | | Number of
Funds Within
Fund
Complex
Overseen by
Director
(Including
the Fund) | | Length
of Time
Served** | |
Frank K. Ross
Age: 62 | | Director | | Until next election of directors | | Professor of Accounting, Howard University; Board member of NCRIC Group, Inc. (insurance) and Pepco Holdings, Inc. (electric utility). Formerly, Midatlantic Area Managing Partner for Audit and Risk Advisory Services at KPMG LLP and Managing Partner of its Washington, DC office. | | | 17 | | | | 2004 | to present | |
|
Willard H. Smith, Jr.
Age: 69 | | Director | | Until next election of directors | | Board member of Essex Property Trust Inc., Realty Income Corporation and Crest Net Lease, Inc. Managing Director at Merrill Lynch & Co., Equity Capital Markets Division from 1983 to 1995. | | | 17 | | | | 1996 | to present | |
|
C. Edward Ward, Jr.
Age: 59 | | Director | | Until next election of directors | | Member of the Board of Trustees of Directors Manhattan College, Riverdale, New York. Formerly head of closed-end fund listings for the New York Stock Exchange. | | | 17 | | | | 2004 | to present | |
|
* The address for each director is 280 Park Avenue, New York, NY 10017.
** The length of time served represents the year in which the director was first elected or appointed to any fund in the Cohen & Steers fund complex.
33
COHEN & STEERS UTILITY FUND, INC.
The officers of the fund (other than Messrs. Cohen and Steers, whose biographies are provided above), their address, their ages and their principal occupations for at least the past five years are set forth below.
| Name, Address and Age* | | Position(s) Held
With Fund | | Principal Occupation During Past 5 Years | | Length of
Time Served** | |
Adam M. Derechin
Age: 41 | | President and Chief Executive Officer | | Chief Operating Officer of CSCM (since 2003) and CNS (since 2004). Prior to that, Senior Vice President of CSCM and Vice President and Assistant Treasurer of the Cohen & Steers funds. | | Since 2005 | |
|
Joseph M. Harvey
Age: 42 | | Vice President | | President of CSCM (since 2003) and CNS (since 2004). Prior to that, Senior Vice President and Director of Investment Research of CSCM. | | Since 2004 | |
|
William F. Scapell
Age: 38 | | Vice President | | Senior Vice President of CSCM since 2003. Prior to that, chief strategist for preferred securities at Merrill Lynch & Co. | | Since 2003 | |
|
Robert Becker
Age: 36 | | Vice President | | Senior Vice President of CSCM since 2003. Prior to that, co-portfolio manager of the Franklin Utilities Fund at Franklin Templeton Investments. Mr. Becker has previously held positions in equity research for the utility sector at Salomon Smith Barney and Scudder, Stevens and Clark. | | Since 2003 | |
|
Lawrence B. Stoller
Age: 42 | | Secretary | | Executive Vice President and General Counsel of CSCM and CNS since 2004. Secretary of CSSL since 2006. Prior to that, Senior Vice President and General Counsel of CSCM and Assistant Secretary of the Cohen & Steers funds (since 1999) and Chief Legal Officer of CSSL (since 2002). | | Since 2005 | |
|
Jay J. Chen
Age: 42 | | Treasurer and Chief Financial Officer | | Senior Vice President of CSCM since August 2003 and Assistant Treasurer of CSSL since 2002. Prior to that, Vice President of CSCM. | | Since 2005 | |
|
John E. McLean
Age: 34 | | Chief Compliance Officer and Assistant Secretary | | Vice President and Associate General Counsel of CSCM since September 2003. Prior to that, Vice President, Law and Regulation, J&W Seligman & Co. Incorporated (money manager). | | Since 2004 | |
|
* The address of each officer is 280 Park Avenue, New York, NY 10017
** Officers serve one-year terms. The length of time served represents the year in which the officer was first elected to that position in any fund in the Cohen & Steers fund complex. All of the officers listed above are officers of one or more of the other funds in the complex.
34
COHEN & STEERS UTILITY FUND, INC.
Meet the Cohen & Steers family of open-end funds:

• Designed for investors seeking maximum total return, investing primarily in REITs
• Symbol: CSRSX

• Designed for institutional investors seeking maximum total return, investing primarily in REITs
• Symbol: CSRIX

• Designed for investors seeking high current income, investing primarily in REITs
• Symbols: CSEIX, CSBIX, CSCIX, CSDIX

• Designed for investors seeking maximum capital appreciation, investing in a limited number of REITs and other real estate securities
• Symbols: CSFAX, CSFBX, CSFCX, CSSPX

• Designed for investors seeking maximum total return, investing primarily in international real estate securities
• Symbols: IRFAX, IRFCX, IRFIX

• Designed for investors seeking maximum total return, investing primarily in utilities
• Symbols: CSUAX, CSUBX, CSUCX, CSUIX

• Designed for investors seeking high current income and long-term growth of income and capital appreciation, investing primarily in dividend paying common stocks and preferred stocks.
• Symbols: DVFAX, DVFCX, DVFIX
Please consider the investment objectives, risks, charges and expenses of the fund carefully before investing. A prospectus containing this and other information can be obtained by calling 800-330-7348 or by visting cohenandsteers.com. Please read the prospectus carefully before investing.
Cohen & Steers Securities, LLC, Distributor
35
COHEN & STEERS UTILITY FUND, INC.
OFFICERS AND DIRECTORS
Robert H. Steers
Director and co-chairman
Martin Cohen
Director and co-chairman
Bonnie Cohen
Director
George Grossman
Director
Richard E. Kroon
Director
Richard J. Norman
Director
Frank K. Ross
Director
Willard H. Smith Jr.
Director
C. Edward Ward, Jr.
Director
Adam Derechin
President and chief executive officer
Joseph M. Harvey
Vice president
Robert S. Becker
Vice president
William F. Scapell
Vice president
Lawrence B. Stoller
Secretary
Jay J. Chen
Treasurer and chief financial officer
John E. McLean
Chief compliance officer and assistant secretary
KEY INFORMATION
Investment Advisor
Cohen & Steers Capital Management, Inc.
280 Park Avenue
New York, NY 10017
(212) 832-3232
Subadministrator and Custodian
State Street Bank and Trust Company
225 Franklin Street
Boston, MA 02110
Transfer Agent
Boston Financial Data Services, Inc.
66 Brooks Drive
Braintree, MA 02184
(800) 437-9912
Legal Counsel
Stroock & Stroock & Lavan LLP
180 Maiden Lane
New York, NY 10038
Distributor
Cohen & Steers Securities, LLC
280 Park Avenue
New York, NY 10017
Nasdaq Symbol: Class A—CSUAX
Class B—CSUBX
Class C—CSUCX
Class I— CSUIX
Web site: cohenandsteers.com
This report is authorized for delivery only to shareholders of Cohen & Steers Utility Fund, Inc. unless accompanied or preceded by the delivery of a currently effective prospectus setting forth details of the fund. Past performance is of course no guarantee of future results and your investment may be worth more or less at the time you sell.
36
COHEN & STEERS
UTILITY FUND
280 PARK AVENUE
NEW YORK, NY 10017

ANNUAL REPORT
DECEMBER 31, 2005
Item 2. Code of Ethics.
The registrant has adopted a Code of Ethics that applies to its Principal Executive Officer and Principal Financial Officer. The registrant undertakes to provide to any person without charge, upon request, a copy of the Code of Ethics. Such request can be made by calling 800-330-7348 or writing to the Secretary of the registrant, 280 Park Avenue, New York, NY 10017.
Item 3. Audit Committee Financial Expert.
The registrant’s board has determined that Frank K. Ross, a member of the board’s audit committee, is an “audit committee financial expert”. Mr. Ross is “independent,” as such term is defined in this Item.
Item 4. Principal Accountant Fees and Services.
(a) – (d) Aggregate fees billed to the registrant for the last two fiscal years for professional services rendered by the registrant’s principal accountant were as follows:
| | 2005 | | 2004 | |
Audit Fees | | $ | 46,500 | | $ | 48,500 | |
Audit-Related Fees | | 4,500 | | — | |
Tax Fees | | 12,975 | | 12,600 | |
All Other Fees | | — | | — | |
| | | | | | | |
Audit-related fees were billed in connection with agreed upon procedures performed by the registrant’s principal accountant relating to after-tax return calculations. Tax fees were billed in connection with the preparation of tax returns, calculation and designation of dividends and other miscellaneous tax services.
Aggregate fees billed by the registrant’s principal accountant for the last two fiscal years for non-audit services provided to the registrant’s investment adviser (not including a sub-adviser whose role is primarily portfolio management and is subcontracted or overseen by another investment adviser) and any entity controlling, controlled by, or under common control with the investment adviser that provides ongoing services to the registered investment company, where the engagement relates directly to the operations and financial reporting of the registrant, were as follows:
| | 2005 | | 2004 | |
| | | | | |
Audit-Related Fees | | — | | — | |
Tax Fees | | — | | — | |
All Other Fees | | $ | 85,000 | | $ | 62,500 | |
| | | | | | | |
These other fees were billed in connection with internal control reviews and AIMR performance reviews.
(e)(1) The audit committee is required to pre-approve audit and non-audit services performed for the registrant by the principal accountant. The audit committee also is required to pre-approve non-audit services performed by the registrant’s principal accountant for the registrant’s investment adviser and any sub-adviser (not including any sub-adviser whose role is primarily portfolio management and is subcontracted with or overseen by another investment adviser) and/or to any entity controlling, controlled by or under common control with the registrant’s investment adviser that provides ongoing services to the registrant, if the engagement for services relates directly to the operations and financial reporting of the registrant.
The audit committee may delegate pre-approval authority to one or more of its members who are independent members of the board of directors of the registrant. The member or members to whom such authority is delegated shall report any pre-approval decisions to the audit committee at its next scheduled meeting. The audit committee may not delegate its responsibility to pre-approve services to be performed by the registrant’s principal accountant to the investment adviser.
(e) (2) No services included in (b) – (d) above were approved by the audit committee pursuant to paragraphs (c)(7)(i)(C) of Rule 2-01 of Regulation S-X.
(f) Not applicable.
(g) For the fiscal years ended December 31, 2005 and December 31, 2004, the aggregate fees billed by the registrant’s principal accountant for non-audit services rendered to the registrant and for non-audit services rendered to the registrant’s investment adviser (not including any sub-adviser whose role is primarily portfolio management and is subcontracted with or overseen by another investment adviser) and/or to any entity controlling, controlled by or under common control with the registrant’s investment adviser that provides ongoing services to the registrant were $102,475 and $80,600, respectively.
(h) The registrant’s audit committee considered whether the provision of non-audit services that were rendered to the registrant’s investment adviser (not including any sub-adviser whose role is primarily portfolio management and is subcontracted with or overseen by another investment adviser) and/or to any entity controlling, controlled by or under common control with the registrant’s investment adviser that provides ongoing services to the registrant that were not required to be pre-approved pursuant to paragraph (c)(7)(ii) of Rule 2-01 of Regulation S-X was compatible with maintaining the principal accountant’s independence.
Item 5. Audit Committee of Listed Registrants.
Not applicable.
Item 6. Schedule of Investments.
Included in Item 1 above.
Item 7. Disclosure of Proxy Voting Policies and Procedures for Closed-End Management Investment Companies.
Not applicable.
Item 8. Portfolio Managers of Closed-End Investment Companies.
Not applicable.
Item 9. Purchases of Equity Securities by Closed-End Management Investment Company and Affiliated Purchasers.
Not applicable.
Item 10. Submission of Matters to a Vote of Security Holders.
The board of directors of the registrant has adopted a Nominating Committee Charter which provides that the Nominating Committee (the “Committee”) will consider and evaluate nominee candidates properly submitted by shareholders on the same basis as it considers and evaluates candidates recommended by other sources. The shareholder must submit any such recommendation in writing to the registrant, to the attention of the Secretary, at the address of the principal executive offices of the registrant. A copy of the qualifications and procedures that must be met or followed by shareholders to properly submit a nominee candidate to the Committee may be obtained by submitting a request in writing to the Secretary of the registrant.
Item 11. Controls and Procedures.
(a) The registrant’s principal executive officer and principal financial officer have concluded that the registrant’s disclosure controls and procedures are reasonably designed to ensure that information required to be disclosed by the registrant in this Form N-CSR was recorded, processed, summarized and reported within the time periods specified in the Securities and Exchange Commission’s rules and forms, based upon such officers’ evaluation of these controls and procedures as of a date within 90 days of the filing date of this report.
(b) There were no changes in the registrant’s internal control over financial reporting that occurred during the second fiscal quarter of the period covered by this report that have materially affected, or are reasonably likely to materially affect, the registrant’s internal control over financial reporting.
Item 12. Exhibits.
(a)(1) Not applicable.
(a) (2) Certifications of principal executive officer and principal financial officer as required by Rule 30a-2(a) under the Investment Company Act of 1940.
(b) Certifications of chief executive officer and chief financial officer as required by Rule 30a- 2(b) under the Investment Company Act of 1940.
SIGNATURES
Pursuant to the requirements of the Securities Exchange Act of 1934 and the Investment Company Act of 1940, the registrant has duly caused this report to be signed on its behalf by the undersigned, thereunto duly authorized.
COHEN & STEERS UTILITY FUND, INC. | | |
| | |
| | |
| By: | /s/ Adam M. Derechin | | | |
| | Name: Adam M. Derechin | | |
| | Title: President and Chief Executive Officer | | |
| | | | |
| Date: March 6, 2006 | | |
| | |
Pursuant to the requirements of the Securities Exchange Act of 1934 and the Investment Company Act of 1940, this report has been signed below by the following persons on behalf of the registrant and in the capacities and on the dates indicated. |
| | |
| | |
| By: | /s/ Adam M. Derechin | | | |
| | Name: | Adam M. Derechin | | |
| | Title: | President and Chief Executive Officer | | |
| | | (principal executive officer) | | |
| | | | | |
| By: | /s/ Jay J. Chen | | | |
| | Name: | Jay J. Chen | | |
| | Title: | Treasurer | | |
| | | (principal financial officer) | | |
| | | | | |
| | | | | |
| Date: March 6, 2006 | | |
| | | | | | | |