April 2, 2013
Via EDGAR (Correspondence)
U.S. Securities and Exchange Commission
Division of Corporate Finance
100 F Street, N.E.
Washington, D.C. 20549
Attention: Ms. Stephanie J. Ciboroski, Senior Assistant Chief Accountant
Re: CORPBANCA
Form 20-F for the Fiscal Year Ended December 31, 2011
Filed April 30, 2012
Form 20-F/A for the Fiscal Year Ended December 31, 2011
Filed May 16, 2012
File No. 001-32305
Dear Ms. Ciboroski:
We are submitting this letter to amend and restate our response dated October 19, 2012 to the written comments of the staff (the “Staff”) of the United States Securities and Exchange Commission (the “SEC”) contained in your letter, dated September 6, 2012 (the “Comment Letter”), in connection with the annual report on Form 20-F for the fiscal year ended December 31, 2011 (No. 001-32305) and Amendment No. 1 on Form 20-F/A for the fiscal year ended December 31, 2011 (No. 001-32305) (collectively, the “Form 20-F”) filed by Corpbanca (“Corpbanca”) with the SEC on April 30, 2012 and May 16, 2012, respectively.
Certain of the Staff’s comments call for explanation of, or supplemental information as to, various matters relating to disclosures provided in the Form 20-F. Responses to these comments are set forth in this letter.
For your convenience, our responses are set forth below with the headings and numbered items of this letter corresponding to the headings and numbered items contained in the Comment Letter. Each of the comments from the Comment Letter is restated in bold and italics prior to the Company’s response. Capitalized terms used but not defined in this letter shall have the respective meanings given to such terms in the Form 20-F. All page number references in Corpbanca’s responses are to page numbers in the Form 20-F.
We have also underlined and italicized our proposed changes to the Form 20-F and consolidated financial statements that will be included in future filings.
In addition, we have included an overall assessment of the reclassifications and modifications to the financial statements and certain notes in the financial statements as to their materiality after the specific responses to the Staff’s comments.
General
| 1. | We note that you have posted monthly and quarterly financial statements through June 2012 on your website; however, such periodic interim financial information has not been furnished in a Form 6-K. Please tell us how you determined that the interim financial information was not required to be furnished on a Form 6-K. Refer to General Instruction B to Form 6-K. |
We acknowledge the Staff’s comment and respectfully advise that we have furnished on Form 6-K the monthly and quarterly financial statements posted on our website through the date of this letter. We will continue to promptly furnish on Form 6-K monthly and quarterly financial statements that are posted on our website. These aforementioned interim financial results are not a complete set of financial statements and were and will be prepared in accordance with Chilean Banking GAAP (SBIF standards) and not in accordance with IFRS.
Form 20-F for the Fiscal Period Ended December 31, 2011
Item 4. Information on the Company
Capital Adequacy Requirements, page 63
| 2. | We note your disclosure that you had a regulatory capital ratio of 11.7% as of December 31, 2011 and if Basel II regulations are adopted you could be required to inject additional capital in the future. We also note your basic capital and effective equity ratios of 7.4% and 14.6% disclosed on pages 128 and F-132 as of December 31, 2011. Please clarify for us whether the 11.7% ratio is based on current regulatory capital requirements or whether it is an estimate of your capital ratio under the proposed Basel II regulations. If the ratio is based on current regulatory requirements, please clarify how it reconciles to the disclosures on pages 128 and F-132. If the latter and this metric is not currently required to be disclosed by IFRS, Commission Rules or banking regulatory requirements, it would appear to be a non-GAAP measure as defined by Regulation G. If you are unable to support that this measure does not meet the criteria of a non-GAAP measure, please clearly label it as non-GAAP in your future filings and provide the disclosures required by Item 10(e) of Regulation S-K. Refer to General Instruction C (e) of Form 20-F. |
We acknowledge the Staff’s comment and respectfully advise that the ratios on pages 128 and F-132 are both correct and are presented under the Chilean banking system regulations. The ratio on page 63 is consistent with the same regulations and therefore should have been labeled as effective equity and should have been 14.6 %, which is consistent with pages 128 and F-132.
Loan Portfolio, page 80
| 3. | We note your disclosure of the activity in your renegotiated consumer loan portfolio on page 82 as well as the activity in your Normalization Portfolio on page 83. Please address the following: |
| • | It appears that your Normalization Portfolio represents your commercial renegotiation portfolio based on disclosures provided in prior filings. Please confirm whether this is true and if so, revise your disclosure in future filings to clarify this fact. |
The Normalization Portfolio table disclosed on page 83 of the 20-F represents the commercial loan portfolio managed by the normalization portfolio management team. Such portfolio includes renegotiated loans, loans paid regularly but with certain delay, and loans undergoing legal collection process. The complete definition of the Normalization Portfolio appears on page 83 and 84 of our 20-F.
We believe that providing the table on page 83 with respect to our Normalization Portfolio as defined therein provides more robust information to the reader about the activities of the functional area within the bank which manages renegotiated loans, loans which are delinquent as to payment on an ongoing basis as well as those loans which have entered into legal proceedings, therefore, we believe that a further breakdown of the table to separate out those loans defined specifically as “renegotiated” would not add value.
In conclusion, although our Normalization Portfolio does not represent our commercial renegotiation portfolio, as stated in the previous paragraph, we believe it appropriate and preferable to investors to continue to present this information rather than information specifically related to the renegotiated commercial loans.
We propose the following introductory disclosure to the table noted:
The Bank maintains a functional area dealing with loans as defined below as our Normalization Portfolio. The activities of which include:
| a. | Analysis of the status of borrowers to assess the chances of recovery; |
| b. | Establishing strategies and action plans to arrive at negotiated payment schedules; |
| c. | Making the decision, based on the compliance with negotiated payment schedules, whether to transfer debtors to court collection; |
| d. | Supervising and monitoring the progress of legal collection; and |
| e. | Establishing mechanisms for the control and monitoring of impaired customers and the transfer of such customers to the functional area of Normalization. |
Given that the function acts as one unit and the functions are directed toward the management of this portfolio as a whole, we believe that the activity in the table presented below best represents the activities that the Bank undertakes with respect to those loans. The primary difference between our Normalization Portfolio and a renegotiated portfolio for commercial loans is that loans may be transferred to the Normalization Portfolio prior to the commencement of the renegotiation process to the extent, as defined internally, that the loan has demonstrated evidence of credit deterioration through deterioration in rating category, etc. requiring specific portfolio management procedures.
| · | Clarify whether you have any other renegotiated loans that are not included in the tabular disclosures provided on pages 82 and 83 (e.g., mortgage loans or commercial loans not included in the Normalization portfolio) and if so, please revise your future filings to provide tabular disclosure of all renegotiated loan balances. |
We acknowledge the Staff’s comment and respectfully advise that the following table presents the information that will be incorporated in the 2012 20-F regarding the renegotiated mortgage loan portfolio, which is the only additional type of loan:
As of December 31, (in millions of Ch$) | |||
| 2010 | 2011 | ||
| Opening Balance (1) | 167 | 1,063 | |
| Renegotiated (2) | 898 | 735 | |
| Recovery (3) | 2 | 4 | |
| Write-offs (4) | |||
| Final Balance | 1,063 | 1,794 | |
(1) Corresponds to the renegotiated portfolio opening balance
(2) Corresponds to the additions to the renegotiated loans portfolio during each respective period.
(3) Corresponds to the recovery (which may include payments, or settlements by judicial action) obtained from renegotiated loans during each respective period.
(4) Corresponds to write-offs of renegotiated loans during each respective period
Risk Index of Our Loan Portfolio, page 84
| 4. | We note your disclosure that the risk index is calculated as total loans over allowances for loan losses. Based on the risk indexes disclosed, it appears that the reverse is actually true (i.e. risk index is calculated as allowance for loan losses divided by total loans). Please revise your disclosure in future filings to clarify. |
We acknowledge the Staff’s comment and respectfully advise that the explanation on page 84 of how the ratio is computed is incorrect. In future filings, we will revise the disclosure to state “allowances for loan losses over total loans” instead of “total loans over allowances for loan losses.” We confirm to the Staff that the ratios computed and presented in the document are correct, as set forth on pages 15, 102, 104 and 106. The following table demonstrates the calculations presented on page 102.
| Corpbanca | ||||||||
| 20 F at 31.12.11 | ||||||||
| Allowances for Loan Losses | ||||||||
| As of December 31, | ||||||||
| 2009 | 2010 | 2011 | ||||||
| (in millions of Ch$ except for percentages) | ||||||||
| Total allowances for loan losses | 99,264 | 104,215 | 102,500 | |||||
| Total allowance for loan losses as a percentage of total loans | 2.0% | 1.9% | 1.5% | |||||
| Total gross loans balances from customers | 5,011,656 | 5,469,195 | 6,814,445 | |||||
| 5. | We note the disclosure that the decrease in the risk index in the consumer loans portfolio as of December 31, 2011 is principally due to a portfolio cleansing in order to adapt your consumer loan portfolio to new risk and commercial models. Please tell us and revise future filings to describe in detail what you mean by a “portfolio cleansing” and the impact the change had to your provision for loan losses and allowance under IFRS. In your response address how you changed your risk models for the consumer loan portfolio as well. |
We acknowledge the Staff’s comment and respectfully advise that our disclosure related to portfolio cleansing did not fully explain the circumstances. We did not change provisioning models in 2011 for consumer loans. Instead, in 2011, we changed our credit underwriting policies to improve the quality of our consumer loan portfolio.
Our risk index as described decreased by the end of the year. In future filings, we will describe the portfolio cleansing procedures as stated above.
Classification of Banks and Loans; Provisions for Loan Losses, page 92
| 6. | We note your disclosures here as well as on pages 57 through 59 concerning your methodology to determine your provision and allowance for loan losses in accordance with SBIF regulations. We are unsure as to why you have provided such disclosures in |
your Form 20-F given that your financial statements have been prepared in accordance with IFRS which, for provision purposes, differs from SBIF regulations. Such disclosures appear to be confusing as you provide specific details regarding a provision methodology that does not apply to the actual amounts recorded in your financial statements prepared under IFRS. Accordingly, please revise your future filings as follows:
| • | Clearly indicate that this method of determining your provision and allowance for loan losses represents your accounting under Chilean GAAP and is a regulatory required disclosure and that your allowance and provision for loan losses as reported in your Form 20-F have been determined in accordance with IFRS. |
We will insert the following into our next 20-F, where applicable:
This method of determining the provision and allowance for loan losses represents Chilean GAAP accounting and is a regulatory required disclosure. This information has been provided in order to provide the reader with a more in-depth analysis. Notwithstanding, our allowance and provision for loan losses as recorded in our financial statements included herein have been determined in accordance with IFRS.
| • | Clearly label this information throughout the filing as Chilean GAAP and ensure that such disclosures are not given greater prominence than your accounting policy disclosures under IFRS. |
Please see response to comment above. We will also ensure that Chilean GAAP disclosures are not given greater prominence than accounting policy disclosures under IFRS in future 20-F filings.
| • | Disclose the differences in your allowance methodology under Chilean GAAP and IFRS and provide a reconciliation of the amounts. |
| The following is the proposed disclosure for future filings: |
Differences in allowance methodology between IFRS and SBIF requirements exist in the individually significant loan category due to the fact that the percentages prescribed by the SBIF to provision on individually significant loans are based on benchmarking within the Chilean market and also have a starting point which is an estimated range of losses. The benchmarking or the point estimate used by the bank within the estimated range of loss (which usually does not vary to a point outside of the range of loss provided by the SBIF with the exception of any loans which, for SBIF purposes, are required to be provisioned on an “expected loss” basis) may vary risk category by risk category under IFRS.
A summary of the difference between the Chilean GAAP provision and the IFRS provision is provided on page 99 of the 2011 20-F and such difference does not consist of offsetting adjustments of any significance.
| The following is the proposed disclosure for future filings: |
For individually large loans under IFRS, the Bank uses internal models to assign a risk category level to each client and their respective loans. We consider the following risk factors: industry or sector of the client, owners or managers of the client, client’s financial situation, its payment capacity and payment history to calculate the estimated incurred loan loss.
Through this categorization, we differentiate the normal loans from the impaired ones.
These are our risk categories:
1. Clients classified in risk categories A1, A2, A3, A4, A5, or A6 are current or less than 30 days overdue on their payment obligations and show no significant sign of deterioration in their credit quality. Clients classified in risk categories B1, B2, B3 or B4 are overdue between 30 and 89 days on their payment obligations, thus showing a certain level of indication of deterioration in credit quality. B category is different from the A because of a history of late payments.
2. Clients classified as C1, C2, C3, C4, C5,or C6 include clients whose loans with us have been charged off or are being administered by a specialized area.
For loans classified as A1, A2, A3, A4, A5, A6, B1, B2, B3 and B4, we assign a specific allowance percentage on an individual basis to each client. The amount of the allowance for loan losses is determined based on debt servicing capacity, the company´s financial history, solvency and capacity of shareholders and management and projections for the industry sector in which the client operates. There is a determined allowance percentage by group of borrowers with like characteristics, i.e., A1, A2, A3, A4, A5, A6, B1, B2, B3 and B4).
Estimated Incurred Loan Loss = Allowance for Loan Losses
The estimated incurred loss is obtained by multiplying the risk factors as defined in the following equation:

PNP ��= Probability of Non-Performance
EXP = Exposure
SEV = Severity
= Estimated Incurred Loss. The estimated incurred loss is how much could be lost in the event a client does not perform the obligations under the loan agreement.
PNP = Probability of Non-Performance. This variable, expressed as a percentage, indicates the probability that a client will default within the next 12 months. This percentage is associated with the rating that we give to each client, which is determined by analyzing such parameters as debt servicing capacity (including, usually, projected cash flows), the company’s financial history, the solvency and capacity of shareholders and management, and projections for the economic sector in which it operates.
EXP = Exposure. This corresponds to the value of the loan (unpaid principal balance).
SEV = Severity. This is the effective loss rate given for default for client in the same risk category, which is determined statistically based on the historical effective losses.
Every year the PNP and SEV assumptions, are tested by our Credit Department, which could result in a re-calibration of the PNP and the SEV.
Allowances for loan losses for each C risk category are based mainly on the fair value of the collateral, adjusted for the estimated cost to sell (7% on average), that each of these loans have. For example, a C1 category loan, among other conditions, may, at any given point in time, have collateral appraised at 105% of the total amount of the unpaid principal balance of the loan, thus ensuring that no more than 2% of the loan will be lost in case of non collection, assuming the Bank is able to exercise its rights and/or foreclose on the collateral. The calculation of allowance percentage follows the same rationale for the other C risk categories.
Finally, individual loan risk categories are periodically reviewed and any change in category for any particular client must be approved by the Credit Risk Committee.
As of December 31, 2011, loans classified in the C risk categories had the following allowance for loan loss requirement:
| Classification | Allowance percentage | Exposure Ch$mn | Allowance Ch$mn | |||
| C1 | 2% | 57,756 | 1,155 | |||
| C2 | 10% | 14,336 | 1,434 | |||
| C3 | 25% | 27,064 | 6,766 | |||
| C4 | 40% | 26,690 | 10,676 | |||
| C5 | 65% | 17,551 | 11,408 | |||
| C6 | 90% | 6,738 | 6,064 | |||
| Totals | 150,135 | 37,503 |
There is no difference between our SBIF provision and IFRS provisions for loans collectively evaluated for impairment.
With respect to consumer loans and commercial loans under MCH$200,000 (loans collectively evaluated for impairment (consumer and commercial)), allowances for loan losses are determined by mathematical models. The population is first profiled primarily using the characteristics of payment behavior, aging of the balance of the loan, “probability of default” factors indicating transfer into the Normalization area (see response to comment # 3), and socioeconomic status.
Each profile in the commercial portfolio has information aggregated by the bank – basically, historical loss experience (less recoveries).
This historical loss experience which represents the derived loan loss allowance percentage is applied by profile to the commercial portfolio, taking into consideration, if applicable, any additional factors, such as increase in the unemployment rate in the country, economic downswings, etc. based upon more recent experience, should they affect the level of loan loss reserve necessary.
The profiles in the consumer portfolio are based on a wider range of variables than those in the commercial model and the variables are weighted and scored. In the aggregate, the sufficiency of the provision is analyzed first by the number of months coverage of historical write-offs. Should the coverage appear inadequate (either high or low or fluctuating significantly in comparison with previous months), vintage model calculations (where loss models are based on the age of the accounts as formulated by a curve which generally reaches, at an identified point in time, a stabilized loss rate) are performed to determine/verify the appropriate allowance percentages to apply. At a minimum, vintage model analysis is performed every 6 months and are reported to the Risk Committee.
In contrast to the mathematical models used for provisioning of the commercial and consumer loan portfolio, the mortgage loan provisioning is performed using a statistical model based on the formula SEV x PNP X EXP as explained above in relation to individually significant loans. Segmentation is set up in a different way from the individually significant loans. There are profiles primarily using factors such as demographic characteristics, delinquency, collateral ratio to loan balance and external credit ratings which associated results are “scored” and then assigned to a segment where each has an allowance percentage assigned based on the above formula.
Classification of Loan Portfolio Based on the Borrower’s Payment Performance, page 102
| 7. | We note your disclosure that past due loans include only the portion of principal or interest that is 90 days or more overdue, and do not include the portion of such loans that is not overdue or that is less than 90 days overdue, unless legal proceedings have been commenced for the entire outstanding balance according to the terms of the loan. We also note that past due amounts reported in the tables on pages 103 to 106 and 119 to 120 have been presented on this basis. We note that this presentation appears inconsistent with your March 9, 2012 response to comment four whereby you agreed to include the loan balance amounts for such past due loans in your future filings. Accordingly, please provide us with a draft of your intended disclosure revisions consistent with your March 9, 2012 response and confirm that you will provide such disclosures in your future filings. As a reminder, please ensure that your non-performing loan disclosures are given equal or greater prominence than your past due loan disclosures that only include the installments past due. Also revise your future filings when presenting your allowance for loan losses ratios to include a ratio that shows your allowance for loan losses as a percentage of non-performing loans that includes the full amount of loans for which payments are past due. |
We have reviewed our document to assure it is clear. We acknowledge the fact that the 20-F includes terminology which could be clearer.
We acknowledge the Staff´s comment and we confirm to the Staff that, in future filings, we will revise our disclosure to be consistent with our March 9, 2012 response and include the non-performing loan disclosure. Furthermore, we will revise our future filings to include a ratio that shows our allowance for loan losses as a percentage of non-performing loans that includes the full amount of loans for which payments are past due.
We propose to include the following changes to the allowances for loan losses table on page 124 of the Form 20-F 2011 (changes are marked in italics and underlined):
| Allowances for loan losses | ||||||||||||||||
| As of December 31, | ||||||||||||||||
| 2010 | 2011 | 2012 | % Change from 2012/2011 | % Change from 2011/2010 | ||||||||||||
| (in millions of Ch$ except for percentages) | ||||||||||||||||
| Total loans | Ch$ 5,469,195 | Ch$ 6,814,445 | 24.6 | % | ||||||||||||
| Past due loans (1) | 46,851 | 46,379 | (1.0) | % | ||||||||||||
| Non -performing loans (2) | 111,421 | 107,978 | (3.1) | % | ||||||||||||
Impaired loans (3) | 346,641 | 296,584 | (14.4) | % | ||||||||||||
| Allowances for loan losses | 104,215 | 102,500 | (1.6) | % | ||||||||||||
| Allowances for loan losses as a percentage of total loans | 1.9% | 1.5% | (21.1) | % | ||||||||||||
| Allowances for loan losses as a percentage of non-performing loans | 93.5% | 94.9% | 1.5 | % | ||||||||||||
| Allowances for loan losses as a percentage of impaired loans | 30.1% | 34.6% | 15.0 | % | ||||||||||||
| Non -performing loans as a percentage of total loans | 2.0% | 1.6% | (22.2) | % | ||||||||||||
| Allowances for loan losses as a percentage of past due loans | 222.4% | 221.0% | (0.6) | % | ||||||||||||
| 1) | Past due loans include all installments and lines of credit more than 90 days overdue. Does not include the aggregate principal amount of such loans. |
| 2) | Non-performing loans include the principal and accrued interest on any loan with one installment more than 90 days overdue. |
| 3) | Impaired loans include those loans on which there is objective evidence that debtors will not meet some of their contractual payment obligations. |
| 8. | As a related matter, please clarify whether the line item “total loans for which at least one payment is past due” in your tabular disclosure on page 104 is the same thing as your non-performing loans. If so, revise your future filings to rename this line item or include clarifying footnote disclosure. |
We acknowledge the Staff’s comment and respectfully advise that in future filings we will change the disclosure to “interest and/or principal overdue on loans with payments of interest or principal 90 days or more overdue;” in other words, non-performing loans as per our response to comment #7.
| 9. | We note that your charge-off policy disclosed here does not appear to be consistent with that disclosed on page 106. For example, your disclosure here indicates that you write off overdue installments of commercial loans as they become overdue, notwithstanding your right, if any, to charge off the entire amount of the loan. Your disclosure on page 106, however, clearly states that once an installment of a commercial loan is written off, you must write off the entire amount of the loan. Please revise your future filings to clarify this apparent inconsistency in your disclosures. |
We acknowledge the Staff’s comment and respectfully advise the Staff that the write-off policy is described in Note 1g) Impaired loan and write-off to our financial statements, Summary of Significant Accounting Policies. It is important to note that the bank does not hold on its books any loan which has not been subject to that write –off policy.
The Bank’s write-off policy is as follows and our proposed disclosure will be as follows which we believe will clarify and replace Note 1g):
Write-offs of loans and accounts receivable are based on due, past due and current installments and the term must run from the commencement of the arrears, i.e., the write-off must be recorded when the arrears on an installment or portion of a loan in a given transaction reaches the time limit for write-off stipulated below.
Loans and receivables are written off (the entire unpaid principal balance and accrued interest balance) when we have determined that there is no longer any realistic prospect of recovery of part or all of the loans and receivable. The typical time frames from initial impairment to write-off are as follows:
| Type of loans | Deadline |
| Consumer loans with or without collateral | 6 months |
| Consumer leasing | 6 months |
| Other non-real estate leasing operations | 12 months |
Other operations without collateral | 24 months |
| Commercial loans with collateral | 36 months |
| Real estate leasing (commercial and mortgage) | 36 months |
Mortgage loans | 48 months |
Initial impairment starts from the date in which all or part of the loans and receivables fall into arrears.
Item 5. Operating and Financial Review and Prospects
F. Tabular Disclosure on Contractual Obligations, page 136
| 10. | We note that your table of contractual obligations appears to exclude the related interest expense on your interest-bearing deposits, bank obligations, and debt issued, which appears to be significant based on your disclosure of interest expense on page F-89. Please revise this table in future filings to include estimated interest payments on all applicable line items and disclose any assumptions you made to derive these amounts. To the extent that you can reasonably estimate the amount and/or timing of payments that you will be obligated to make under interest rate swaps or similar derivatives you use to manage interest rate risk related to your debt, please ensure these amounts are included in the table and disclose the fact that they are considered in the obligations. To the extent that you are unable to include these derivatives in your disclosure, clearly state that fact and provide quantification of the amount of your debt covered by these derivatives that have been excluded from the table. Finally, to the extent that you have excluded certain types of interest payments from the table, such as for structured notes where payment obligations are based on the performance of certain benchmarks or variable rate debt, provide quantification of the amount of obligations that have these types of interest rates and thus have been excluded from the table. |
We are modifying the Tabular Disclosure on Contractual Obligations presented on page 136 in response to the Staff’s comment and will incorporate this modified disclosure in future filings. The following table includes both the accrued interest and the interest expense projected over time of each contractual obligation. For variable rate debt and interest rate swaps and other derivatives, where applicable, the interest rates upon which we based our contractual obligations going forward are based on the applicable forward curves. For any cross-currency swaps or other derivatives as applicable, the foreign currency exchange rate used was spot. Where applicable, in future filings, these assumptions and a description of the financial derivative contracts included, will be explained in a footnote to the contractual obligations table. With respect to the 20ll information included below, no interest payments have been excluded of the nature you mentioned - structured notes, etc.
I) Contractual obligations therefore are as follows as of December 31, 2011:
| Contractual Obligations | Less than 1 year | 1-3 years | 3-5 years | More than 5 years | Total | |
| MCh$ | MCh$ | MCh$ | MCh$ | MCh$ | ||
| Time deposits and saving accounts | 4,856,138 | 71,850 | 965 | 36,639 | 4,965,592 | |
| Deposits and other demand liabilities | 686,868 | 686,868 | ||||
| Bank obligations | 645,637 | 20,962 | 0 | 0 | 666,599 | |
| Investments under repurchase agreements | 130,917 | 130,917 | ||||
| Issued debt Instruments | 140,157 | 276,634 | 536,556 | 1,185,396 | 2,138,743 | |
| Other financial liabilities | 11,656 | 4,241 | 2,955 | 2,204 | 21,056 | |
| Financial derivative contracts (all speculative and hedging instruments) | (2,352) | 15,091 | (1,563) | (3,270) | 7,906 | |
| Total contractual obligations | 6,469,021 | 388,778 | 538,913 | 1,220,969 | 8,617,681 | |
Page 9
Item 11. Quantitative and Qualitative Disclosure about Market Risk
Regulatory method to control market risk, page 176
| 11. | We note the disclosure beginning here regarding interest rate risk, foreign currency risk, market risk exposure of options, and inflation risk for your trading and non-trading portfolio. We also note the equations used by you and your regulators to measure these various market risks. Please tell us and revise future filings to provide a discussion of how your regulatory methods compare to your internal methods to control market risk and whether the limits set are higher or lower for your internal methods. In your response address the model or tool you use for each of the risks noted under the trading portfolio and non-trading portfolio on pages 176 and 177 for both your regulatory and internal risk measurement procedures and where the results of these models are located in your filing, if applicable. |
We acknowledge the Staff’s comment and respectfully advise the Staff that our internal and regulatory methods share common requirements such as segregating portfolios (i.e., segregating trading and non-trading portfolio activities) taking into account different types of businesses and markets.
We propose to include in future filings the following table which delineates between the internal and regulatory tools we use to control market risk:
| N° | Tools | Internal Limits/Tools | Regulatory Limits/Tools | ||
| Trading | Non-Trading | Trading | Non-Trading | ||
| 1 | AIS | X | < X | < X | |
| 2 | MVS | X | < X | < X | |
| 3 | CFM | X | X | < X | < X |
| 4 | KR | APR>10% Pat. | APR>10% Pat. | Exp MR+ APR> 8% Equity | Exp MR+ APR> 8% Equity |
| 5 | ST | X | X | X | X |
| 6 | VaR | X | |||
| 7 | DV(90) sensitivity | X | |||
| 8 | LCR (3 and 20) | X | X | ||
| 9 | MMAWC | X | X | ||
| 10 | NAC | X | X | ||
The abbreviated terms used in the table are (and which terms will be footnoted to the table above in future filings, as applicable) are as follows:
AIS: Annual Income Sensitivity: This analysis measures the impact on the bank’s interest margin (interest income less interest expense) of a 100 bps shift over the course of twelve months.
MVS: Market Value Sensitivity: The market value sensitivity of the asset- or liability-associated cash flow in the event of a parallel shift in the corresponding yield curve of 100bps.
CFM: Cash Flow Mismatches.
KT: Capital Requirements.
ST: Stress Testing.
VaR: Value at Risk
DV(90): Portfolio’s market value sensitivity in the event of a parallel shift in the corresponding yield curve of 90bps.
LCR 3 & 20: liquidity coverage ratio for 3 and 20 business days, where LCR(x) is computed: Liquid Assets / Net Cash flows for the next “x” days, x being = 3 or 20
MMAWC: Daily limit set on wholesale clients´ deposits´ maturity (in Chilean pesos)
NAC: Notional Amounts by Currency; corresponds to the maximum allowable daily limit of net foreign currency positions in foreign currency
Page 10
As is reflected in the table above, certain tools are used for both internal and regulatory purposes to control market risk. The internal tools, in these cases, are set 10% lower than the regulatory requirements for alert purposes. The following tools are used both for regulatory and internal purposes: (i) AIS; (ii) MVS; (iii) Cash Flow Mismatches; (iv) Capital Requirements; and (v) Stress Testing. Additionally, Corpbanca uses the following tools for internal purposes only: (i) VaR; (ii) DV (90) sensitivity; (iii) LCR (3 and 20); (iv) Max maturity amount for wholesale clients; and (v) Notional Amounts by currency. Our internal tools are reviewed throughout the year by the ALCO Committee and Board of Directors and once a year by our regulator during on-site visits as part of their regulatory report scope requirements. Finally, all the limits used by Corpbanca are described in Note 34.
Internal Methods to Control Market Risk – VaR Methodology, page 182
| 12. | We note your disclosure that you use a VaR methodology to measure and control both the interest rate risk of the trading portfolio and the currency risk related to your net foreign currency position. We also note your disclosures on page F-124 and that you calculate VaR for both your Trading Owner portfolio and Trading Market Making portfolio and set different daily VaR limits for each portfolio. Please address the following: |
| • | Tell us and revise future filings to disclose whether the VaR disclosures on page 182 are for one of the trading portfolios described on page F-124 or if it is the aggregation of the two portfolios. If the latter include a discussion in future filings to show how the VaR calculations for individual trading portfolios aggregate to total Trading VaR. |
We acknowledge the Staff’s comment and respectfully advise the Staff that the VaR disclosures at page 182 are the same for the two portfolios with the exception of the limits which are different for each portfolio. In future filings, we will rename the portfolios as : 1) Proprietary Trading; and 2) Market Making Trading, which are defined as follows: The Proprietary Trading portfolio is used to generate profits through risk taking with the market and the Market Making portfolio represents risk taking made through decisions with respect to acceptable levels of “client” positions. The proprietary trading daily limits has been set at Ch$250,000,000 and at Ch$700,000,000 for the market making portfolio.
The following table provides an example of the future proposed disclosure regarding the two portfolios mentioned above and the associated amounts:
Summary – Limits over Trading Securities Portfolio
Date: December 31, 2011
Value at Risk – Figures in Ch$ million

The definitions of the terms used in the table are:
Diversification Adjustment: This takes into account the correlating effects of having assets in the portfolio whose asset values do not move up and down together.
Interest Rate: Value at Risk for Interest Rate Risk at 95% confidence level
Currency: Value at Risk for Currency Risk at 95% confidence level.
In the above tables, we have broken out the foreign currency limits and the interest rate risk.
| • | You disclose a moving timeframe of 300 days on page F-124 and then 260 historical observations of market data for the VaR model described on page 182. Clarify in future filings the timeframe you use to calculate VaR for the individual trading portfolios and the aggregated Trading portfolio, if applicable. |
We respectfully advise the staff that our moving time frame is 300 observations for both portfolios. Such disclosure will be presented in future filings in Note 34 as well as in the section “Quantitative and Qualitative Analysis of Risk” of Item 11 of the Form 20-F.
| • | Revise your disclosures in future filings to separately present VaR for each trading portfolio and in the aggregate, if applicable, and for currency risk to your net foreign currency position. Discuss the material trends in the results for each. |
See response in the first bullet with regard to the separate presentation of VaR for each trading portfolio.
In future filings, we will include the relationship between our net foreign currency position and VaR (incremental VaR) as proposed in the table below:
Date: December 31, 2011
| Currency | Net Position | Inc. VaR 95%[CLP] | VaR 95%[CLP] |
| USD | -944,652 | 338,382 | 5,496,287 |
| EUR | -5,595,112 | -1,143,327 | 34,048,113 |
| JPY | 73,461 | -205,948 | 297,783 |
| GBP | 74,622 | -167,402 | 36,933 |
| NOK | 5,633 | -313 | 45,642 |
| DKK | 17,575 | 23,934 | 127,085 |
| SEK | 6,007 | -4,573 | 49,787 |
| CAD | 159,076 | -26,399 | 85,687 |
| CHF | 146,244 | 142,257 | 990,618 |
| WON | - | - | - |
| AUD | 69,980 | 1,426 | 550,049 |
| MXN | - | - | - |
| PEN | - | - | - |
| BRL | - | - | - |
| COP | - | - | - |
The abbreviated terms used in the table are:
Inc. VaR: Incremental VaR measures the impact of small changes in position through weighting scaled by portfolio rating.
VaR: Value at risk estimates, at 95% confidence level.
The VaR for the individual currencies will never be exceeded by such foreign currency´s net position at any date.
Our Proprietary Trading Portfolio does not reflect changes in the material trends related to our risk positions, as is shown in the following chart:

The VaR for our Proprietary Trading Portfolio experiences volatility by way of constant changes in the value of our liquid assets (currency and rate) and therefore we do not experience increases that are attributable to any particular risk.
The VaR usage increased in our Market Making Portfolio as a result of our entering into certain derivative positions during the last quarter, as is demonstrated in the following chart:

The increase mentioned above was generated by our entering into cross currency swaps and interest rate swaps.
| • | Revise future filings to disclose your average, high and low VaR by type of risk (e.g., interest rate risk, foreign currency exchange rate risk, commodity price risk, and other relevant market risks, such as equity price risk) for each period presented. Refer to Item 11 of Form 20-F. |
We acknowledge the Staff’s comment and respectfully advise the Staff that in future filings we will disclose our average, high and low VaR by interest rate risk and foreign currency exchange rate risk for each period presented (see table below with the results for each period presented ) as shown in the table below:
Date: December 31, 2011
| VaR(95%, 1d) | ||||
| Limit | Min | Average | Max | |
| TRADING ACTIVITIES | 139,562,444 | 259,324,596 | 485,219,171 | |
| Diversification Adjustment | 3,489,495 | -47,034,185 | -162,698,594 | |
| Interest Rate | 134,465,084 | 244,324,638 | 443,563,320 | |
| Currency | 1,607,865 | 62,034,143 | 204,354,445 | |
| PROP. TRADING | 250,000,000 | 277,211 | 94,500,400 | 198,836,194 |
| Diversification Adjustment | 248,656 | -22,991,030 | -185,179,941 | |
| Interest Rate | 164 | 69,882,627 | 190,714,052 | |
| Currency | 28,391 | 47,608,803 | 193,302,083 | |
| MARKET MAKING TRADING | 450,000,000 | 127,635,723 | 228,179,655 | 447,358,820 |
| Diversification Adjustment | 562,703 | -26,742,416 | -160,232,213 | |
| Interest Rate | 125,422,422 | 222,733,646 | 447,885,155 | |
| Currency | 1,650,598 | 32,188,426 | 159,705,878 | |
The definitions of terms used in the table are:
Diversification Adjustment: takes into account the correlating effects of having assets in the portfolio that do not move together.
Interest Rate: Value at Risk for Interest Rate Risk at 95% confidence level
Currency: Value at Risk for Currency Risk at 95% confidence level.
| • | We also note that based on a 95% confidence level you would expect trading losses to exceed VaR approximately five out of every 100 trading days or 15 days for a moving timeframe of 300 days. Please tell us and revise to disclose if your actual losses ever exceeded VaR for both of your trading portfolios and the currency risk measurement. |
We acknowledge the Staff’s comment and respectfully advise that Staff that in future filings we will include the following disclosure in Note 34 as well as in section “Quantitative and qualitative analysis of risk” of the forepart (with updated information as applicable to the period presented):
Over the course of 300 days, we observed that in our Proprietary Trading portfolio VaR is exceeded 9 times out of every 300 trading days, while our Market Making portfolio exceeded VaR 18 times out of every 300 trading days. Both results are within the acceptable range according to the Kupiec Excess Frequency Test.
| • | In future filings disclose any changes you made to your VaR methodology or assumptions during the periods presented and how you determine your VaR models are statistically appropriate (i.e. backtesting, etc). |
We acknowledge the Staff’s comment and respectfully advise the Staff that in future filings we will disclose any changes we made to our VaR methodology or assumptions during the periods presented and how we determine our VaR models are statistically appropriate (i.e., backtesting, etc.). Our proposed disclosure in Note 34 as well in section “Quantitative and Qualitative Analysis of Risk” of the forepart will include:
The determination of our VaR models as statistically appropriate is performed in accordance with the Kupiec Excess frequency test and Basel Committee guidelines. During 2011, no changes were made to the VaR methodology and assumptions.
| 13. | We also note several other tools you use to measure and manage market risks like non-statistical tools, interest rate sensitivity for the non-trading portfolio though a gap analysis, duration analysis, and sensitivity analysis. Further, we note disclosures on currency risk on page F-126, interest rate risk on page F-127, and cash flow mismatches on page F-129. Please tell us and revise future filings to explain how the disclosures in Note 34 relate to the tools and results of each analysis disclosed here. Also, discuss in detail how investors should view the output of the models and the inputs and assumptions for each model. |
We acknowledge the Staff’s comment and respectfully advise the Staff that our Non-statistical Tools for Controlling Market Risk included on page 183 and the corresponding results disclosed in Note 34 are explained in greater detail as follows (those portions which are proposed disclosure are underlined and italicized):
| The non-statistical tools mentioned on page 183 include certain limits we establish on our exposure to foreign currency risk and interest rate risk. We intend to include more expansive disclosure regarding such limits in our risk footnote to our financial statements based on the explanations below and we will reference any disclosure in the forepart about such non-statistical tools (on a one-by-one basis, if applicable) to that note in the financial statements. |
| The disclosure about currency risk on page F-126 takes into account our base currency (functional currency), the Chilean peso, and our exposure to other currencies. These exposures are monitored through the net balance positions plus derivative positions. Limits on the position in each currency are monitored and controlled by the Market Risk Unit. Investors should view these limits as the maximum exposure to currency risk that the bank is willing to incur. In future fillings, we will disclose these exposures showing the limits for the referred date as well as graphs displaying historical consumption usage. At the same time, the foreign currency balances presented on F-128 will be modified to include the relevant derivative positions. |
| The following is an example of the daily report for foreign currency exposure and limit for the referred date. |
Currency | Net Position (USD) | Limit (Absolute Value) USD |
USD | (944,642) | 45,000,000 |
EUR | (5,595,112) | 20,000,000 |
JPY | 73,461 | 10,000,000 |
GBP | 74,622 | 10,000,000 |
The disclosure about interest rate risk on page F-127 (Table 2 and Table 3) reflects the regulatory limits on the banking book exposures. Short term limits reflect the exposure affecting the: (i) net interest margin based on the bank’s structural position, (ii) the bank’s structural position caused by inflation; and (iii) fees at risk when key prices and rate are subject to a change determined by regulation. This measure cannot exceed the average margin of interest and inflation in the P&L accumulated during the past twelve months by a certain percentage that is defined by the bank’s board of Directors and reflects the bank’s willingness to accept short term interest rate risk. On page F-127, we note in table 2 the limit on usage is 92.90 % at $Ch79,835 million pesos. Investors should view these limits as the maximum volatility on the bank’s net interest margin (amount) that the bank is willing to face. Long term limits reflect the effect of market value sensitivity on the balance sheet. The limit consumption usage can be seen on table 2 with 42.07% consumption at $Ch 298,208 million pesos. Each long term limit includes variable for unpredictability in key prices and rates as set by our regulator and reflects the changes caused by inflation and yield curve / term structure of interest rates in a stressed scenario. Investors should view these limits as the sum of effects that may impact the value of our stock under a common stress scenario defined by our regulator.
The cash flows mismatch measures the difference between the sum of the outflows and inflows at 30 and 90 days. The 30 day cash flows mismatch is compared to regulatory required capital and the 90 days mismatch is compared to twice the regulatory required capital. A greater cash flows mismatch represents a greater liquidity risk. This ratio is regulatory and should be communicated by all banks, so each investor can compare the information described above and identify the banks that have greater liquidity risk.
Disclosures Regarding Derivative Financial Instruments, page 184
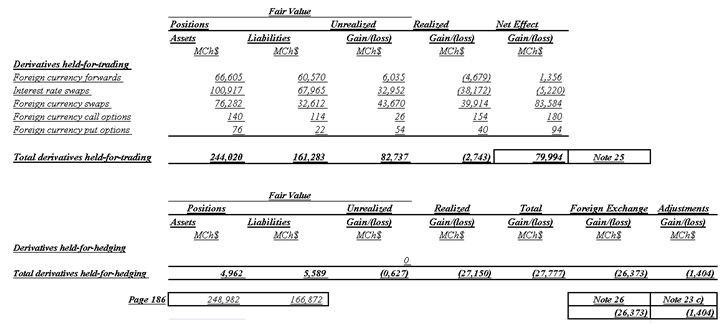
| 14. | We note your tabular disclosure of the derivative portfolio and the gross unrealized gains and losses on page 186. We also note your disclosure of gains and losses related to derivative financial instruments in Notes 25 and 26 and table (c) in Note 23. Please reconcile for us the gains and losses disclosed in these Notes with the amounts on page 186 and revise your future filings to clearly link these disclosures. |
We acknowledge the Staff’s comment and respectfully advise that in our tabular disclosure on page 186, we included the valuation of the derivatives held-for-hedging and the derivatives held-for-trading, such information is also detailed in Note 7- Derivative Financial Instrument and Hedge Accounting. The valuations are related to the results included in Notes 25 and 26. We included the result of the hedged items in Note 23.
Following the Staff’s suggestion, we will include the following information in future filings:
Item 18. Financial Statements
Consolidated Statement of Cash Flows, page F-9
| 15. | We note you begin your reconciliation of net cash used in operating activities with “Consolidated income before income taxes,” but we were unable to identify which line item in the reconciliation relates to cash flows from taxes on income. Per paragraph 35 of IAS 7 cash flows arising from taxes on income shall be separately disclosed and classified as cash flows from operating activities unless the taxes can be specifically identified with financing and investing activities. Please tell us and revise future filings to clearly disclose where cash flows arising from taxes on income are included in your statement of cash flows. |
We acknowledge the Staff’s comment and respectfully advise that in future filings the cash flows from taxes on income will be disclosed separately and will be classified as cash flows from operating activities unless taxes can be specifically classified as cash flows from investing activities or cash flows from financing activities. For the years presented, the amounts to be reclassified are within operating activities in the cash flow statement, and that, coupled with their magnitude, has led us to the conclusion that such reclassifications are immaterial.
| 16. | We note the line below “Financial investments available-for-sale” under cash flows from operating activities had no description though the outflow for 2011 was Ch$21.4 billion. Please tell us and revise future filings to include a description of this line item. If this line relates to the financial assets available-for-sale, please explain why the cash flows did not meet the “net” reporting criteria in paragraphs 22 through 23 of IAS 7. |
We acknowledge the Staff’s comment and respectfully advise that the Ch$21,382 amount corresponds to cash flows from operating activities (which line item was inadvertently omitted) relating to held-to-maturity investments, which is included in the financial statements as “Note 10 - Investment Instruments” in the amount of Ch$21,962. This line item does not relate to financial assets available for sale.
We will include the following disclosure in future filings:
Notes | 12.31.2009 | 12.31.2010 | 12.31.2011 | 12.31.2011 | |
| MCh$ | MCh$ | MCh$ | ThUS$ | ||
| CASH FLOWS FROM OPERATING ACTIVITIES: | (Note 1 gg) | ||||
| Income before income taxes | 102,441 | 141,926 | 140,621 | 270,904 | |
| Non controlling interest | - | (977) | (1,824) | (3,514) | |
| Charges (credits) to income not representing cash flows: | |||||
| Subtotals | (109,416) | (87,216) | (54,067) | (104,161) | |
| Increase/decrease in operating assets and liabilities: | |||||
| Financial investments available-for-sale | (120,228) | (24,293) | 72,927 | 140,493 | |
| Held to maturity investments | - | - | (21,382) | (41,192) | |
| Net cash (used in) provided by operating activities | (8,081) | (4,018) | (10,429) | (20,091) |
Note 1 – Summary of Significant Accounting Policies, page F-2f)
Allowance for loan losses, page F-24
| 17. | You disclose on page F-25 that impairment loss on loans individually evaluated are calculated based on the difference between the carrying amount of the loan and the present value of the expected future cash flows. However, on page F-26 you disclose that you must maintain specified reserves for loans classified in your risk categories Cl, C2, C3, C4, D1, and D2. Please provide us with a more detailed explanation of how this provision matrix interacts with your discounted cash flow analysis for a particular loan and how the ultimate allowance amount is determined for such loan. Please also explain how you verify that the specified reserves within this matrix are equal to or in the range of possible impairment loss calculated in accordance with paragraph 63 of IAS 39 and confirm that you do not recognize impairment in excess of losses determined on the basis of objective evidence about impairment on the identified individual financial assets. Refer to paragraphs E.4.5 and E.4.6 of IASB Staff Implementation Guidance on IAS 39. |
Please see our response to Comment 6. D categories have been replaced by C5 and C6.
Additionally, we confirm that we do not recognize impairment in excess of losses determined on the basis of objective evidence about impairment on the identified individual financial assets.
Note 7 – Derivative Financial Instrument and Hedge Accounting, page F-48
| 18. | We note your disclosure on page F-50 that the effective portion of the gain on hedging your net investment in foreign operations was Ch$245 million, after taxes, for the year ended December 31, 2011. We also note your other comprehensive income disclosure on page F-86 whereby you disclose a loss of Ch$1.3 billion and income tax impact of Ch$220 million. Please reconcile for us the difference between the after tax gain recognized in other comprehensive income with your disclosures on page F-86. |
We acknowledge the Staff’s comment and respectfully advise that pursuant to law 20.455/2010 which was published on July 31, 2010 in the Chilean Official Gazette, we had an effective income tax rate of 17.4% about profit in 2011 recognized as OCI. The law established that the rate applicable to companies as a first category income tax increased from 17% (which was the income tax rate on December 31, 2010) to 20% for 2011, 18.5% for 2012 and 17% for 2013 and thereafter.
On page F-50, we inadvertently omitted the word “cumulative” prior to the word “gain”. Therefore, we will include the appropriate terminology (if applicable) in future filings. As such amount is cumulative, it does not tie to the OCI.
The cumulative gain of Ch$245 million after taxes for the year ended December 31, 2011 corresponds to the result obtained from the sum of our income for the year ended December 31, 2011 in the amount of Ch$1,044 million after taxes and our loss for the year ended December 31, 2010 in the amount of Ch$799 million after taxes.
Following the Staff’s suggestion, below please find the reconciliation between our related accumulated other comprehensive income and our disclosure included on page F-86:
2011 MCh$ | Profit in 2011 Recognized as OCI | 2010 MCh$ | |
| Hedge of net investment in foreign operations | 301 | 1,264 | (963) |
| Tax rate | 18.5% | 17.4% | 17% |
| Assets (liabilities) deferred taxes | 56 | 220 | (164) |
| Profit or (loss) on the hedging instrument after tax | 245 | 1,044 | (799) |
| 19. | We note on page F-50 you disclose the effective portion of the cash flow hedging instruments included in other comprehensive income. Please tell us and revise future filings to disclose whether there was an ineffective portion of the cash flow hedges recognized in profit or loss and if so, tell us where it is disclosed in accordance with paragraph 24(b) of IFRS 7. |
We acknowledge the Staff’s comment and respectfully advise that in future filings we will include the following disclosure under “Note 7 – Derivative Financial Instrument and Hedge Accounting – b) Hedge accounting - Cash flow hedges”:
The effective portion of income from cash flow hedges, MCh$(2,576) (Note 22 – Shareholders Equity) and the ineffective portion of income from cash flow hedges, MCh$139 (Note 26 – Net Foreign Exchange Income (Losses) – Foreign exchange gains (losses) on hedging derivatives) as of December 31, 2011 and 2012, respectively, were as follows:
Effective portion | Ineffective portion | ||
| As of December 31, 2011 | |||
| MCh$ | MCh$ | ||
| Demand deposits | (1,613) | 108 | |
| Loans | (963) | 31 | |
| Net flows | (2,576) | 139 | |
Note 19 – Provisions, page F-74
| 20. | It appears that the line item descriptions in your provision rollforwards in part (b) of Note 19 may be reversed because (with the exception of your 2010 rollforward of your provision for short-term benefits and staff salaries) you show positive numbers for provisions used/released and negative numbers for increases in existing provisions. Please revise your future filings to correct this apparent inconsistency. Also disclose where in the Consolidated Statement of Income these provisions are recorded and how the amounts presented in these provision tables correspond to the contingency provisions/(releases) included in Other Operating (Expenses)/Income as disclosed in Note 31. |
We acknowledge the Staff’s comment and note that the line descriptions “Increase in existing provisions” and “Provisions released” or “Provisions used” had been reversed (as you note above); and respectfully advise the Staff that the following disclosure will be inserted in Note 19 - Provisions:
Short-term benefits and staff salaries are recorded in “Personnel salaries expenses.” Mandatory dividends are recorded against “Accrual for mandatory dividends” in the Shareholders Equity Statement, and the contingency provisions/(releases) are included in Other Operating (Expenses)/Income, depending on whether they are debit or a credit.
Additionally, as a result of our review associated with this comment, we realized that certain amounts had been misclassified in the Income Statement. The impact of the adjustments to the Income Statement appears below. (We also note that the descriptions of the line items within the rollforward of the contingency provision on page F-74 were reversed between “Provisions released” and “Provisions established.”)
The contingency provision is recorded in the income statement in other operating expenses. Releases of the provision are recorded in operating income. In reviewing the Staff´s comment, we realized that we had misclassified certain amounts between the line items “other operating income” and “other operating expenses” in both 2010 and 2011. The misclassification was due to the fact that expenses were not booked appropriately within the operating expenses line and had been inadvertently netted against other operating income, which expenses were not related to the contingency provision. For this reason the amounts changed in the information we had previously sent you on October 19, 2012.
We concluded that the misclassification is immaterial both qualitatively and quantitatively to the income statement line item as well as to any related note disclosure. We note that the effect on the line item “other operating income” was 18%. However, we believe that due to the overall insignificance of this line item to the income statement as a whole and the fact that it represents an error of only 2% to the subtotal into which the line item is incorporated, “Trading and Investment, Foreign Exchange Gains and Other Operating Income,” it is deemed immaterial.
The impact of the reclassification on the financial information presented in our Form 20-F 2011 is as follows:
| CONSOLIDATED STATEMENT OF INCOME | 2010 | 2011 | |||||||
| As reported | Adjustment and as a percentage of the historical balance | As adjusted | As reported | Adjustment and as a percentage of the historical balance | As adjusted | ||||
| Other operating income | 8,832 | 141 | 1.6% | 8,973 | 9,507 | 1,714 | 18.0% | 11,221 | |
Trading and Investment, Foreign Exchange Gains and Other Operating Income | 44,033 | 141 | 0.3% | 44,174 | 80,469 | 1,714 | 2.1% | 82,183 | |
| Other operating expenses | (7,312) | (141) | 1.9% | (7,453) | (13,643) | (1,714) | 12.6% | (15,357) | |
Total Operating Expenses | (132,683) | (141) | 0.1% | 132,824 | (152,706) | (1,714) | 1.1% | 154,420 | |
Notes 31(a) and (b), : Other Operating Income and Other Operating Expenses, as corrected would be as follows and are presented for informational purposes only as, as explained above, we have determined any adjustment to the financial statement line items as well as to the notes to be immaterial:
| Note 31 (a) Other Operating Income | 2010 | 2011 | ||||||||||||||||||||||
| As reported | Adjustment | As adjusted | As reported | Adjustment | As adjusted | |||||||||||||||||||
| (DR) CR | (DR) CR | (DR) CR | (DR) CR | (DR) CR | (DR) CR | |||||||||||||||||||
| MCh$ | MCh$ | MCh$ | MCh$ | MCh$ | MCh$ | |||||||||||||||||||
| Revenues for assets received in lieu of payment | ||||||||||||||||||||||||
| Gain on sales of assets received in lieu of payment | 859 | 859 | 872 | 872 | ||||||||||||||||||||
| Others | - | - | 416 | 416 | ||||||||||||||||||||
| Subtotal | 859 | 859 | 1,288 | 1,288 | ||||||||||||||||||||
| Contingency provisions released | ||||||||||||||||||||||||
| Other contingency provisions released | 77 | 141 | 218 | 156 | 1,714 | 1,870 | ||||||||||||||||||
| Subtotal | 77 | 141 | 218 | 156 | 1714 | 1870 | ||||||||||||||||||
| Other Revenues | ||||||||||||||||||||||||
| Gain on sales of property, plant and equipment | 557 | 557 | 17 | 17 | ||||||||||||||||||||
| Gain on sale of investment in other companies | - | - | 3,192 | 3,192 | ||||||||||||||||||||
| Subtotal | 557 | 557 | 3,209 | 3,209 | ||||||||||||||||||||
| Other income | 558 | 558 | 952 | 952 | ||||||||||||||||||||
| Leasing contributions revenue | 1,594 | 1,594 | 1,016 | 1,016 | ||||||||||||||||||||
| Other operating income of Subsidiaries | 3,123 | 3,123 | 854 | 854 | ||||||||||||||||||||
| Gain on sales of leased assets | 645 | 645 | 1,048 | 1,048 | ||||||||||||||||||||
| Other operating income -Leasing | 754 | 754 | 820 | 820 | ||||||||||||||||||||
| Revenues from leasing loans expenses recovered | 665 | 665 | 164 | 164 | ||||||||||||||||||||
| Subtotal | 7,339 | 7,339 | 4,854 | 4,854 | ||||||||||||||||||||
| Total | 8,832 | 141 | 8,973 | 9,507 | 1714 | 11,221 | ||||||||||||||||||
| Note 31 (b) Other Operating Expenses | 2010 | 2011 | ||||||||||||||||||||||
| As reported | Adjustment | As adjusted | As reported | Adjustment | As adjusted | |||||||||||||||||||
| (DR) CR | (DR) CR | (DR) CR | (DR) CR | (DR) CR | (DR) CR | |||||||||||||||||||
| MCh$ | MCh$ | MCh$ | MCh$ | MCh$ | MCh$ | |||||||||||||||||||
| Provisions and expenses for assets received in lieu of payment | ||||||||||||||||||||||||
| - Provisions for assets received in lieu of payment | (27 | ) | (27 | ) | (229 | ) | (229 | ) | ||||||||||||||||
| - Maintenance expenses of assets received in lieu of payment | (357 | ) | (357 | ) | (115 | ) | (115 | ) | ||||||||||||||||
| Subtotal | (384 | ) | (384 | ) | (344 | ) | (344 | ) | ||||||||||||||||
| Contingency provisions | ||||||||||||||||||||||||
| - Other contingency provisions | (1,360 | ) | 1,332 | (28 | ) | (1,657 | ) | (1,657 | ) | |||||||||||||||
| Subtotal | (1,360 | ) | 1,332 | (28 | ) | (1,657 | ) | (1,657 | ) | |||||||||||||||
| Other expenses | ||||||||||||||||||||||||
| - Other expenses | (5,568 | ) | (1,473 | ) | (7,041 | ) | (11,642 | ) | (1,370 | ) | (13,012 | ) | ||||||||||||
| Subtotal | (5,568 | ) | (1,473 | ) | (7,041 | ) | (11,642 | ) | (1,370 | ) | (13,012 | ) | ||||||||||||
| Total | (7,312 | ) | (141 | ) | (7,453 | ) | (13,643 | ) | (1,370 | ) | (15,013 | ) | ||||||||||||
Please note that the reclassifications are out of balance by MCh$344 in 2011 which amount is explained in the response to your comment number 22.
Note 26 – Net Foreign Exchange Income (Losses), page F-91
| 21. | We note that the foreign exchange losses on hedging derivatives was Ch$26.4 billion during 2011 compared to a total loss of Ch$26.8 billion on foreign exchange. We also note your disclosure on page 125 that you maintain positions that are reported as trading or foreign exchange transactions even though the position may provide an effective economic hedge. Please address the following: |
| • | Tell us and revise future filings to segregate the foreign exchange gains (losses) on hedging derivatives by economic hedges, accounting hedges (i.e. fair value hedge, cash flow hedge, etc.), or trading derivatives and then by type of derivative (i.e. interest rate swap, etc.) |
In “Note 26 – Net Foreign Exchange Income (Losses)”, the foreign exchange losses on hedging derivatives for the year ended December 31, 2011 was Ch$26.373 million. This line item included the results of currency, assets and liabilities (Note 7 – Derivative Financial Instrument and Hedge Accounting).
We will include the following disclosure in future filings:
| Cash Flows (CF) or | Fair Value | Gross Unrealized | ||
| Fair Value | Assets | Liabilities | Gain/(loss) | |
| (FV) Hedge | MCh$ | MCh$ | ||
| Derivatives held-for-hedging | ||||
| Foreign currency swap | VR | - | 2,936 | (2,360) |
| Foreign currency swaps | VR | 2,877 | 374 | (7,141) |
| Subtotal | 2,877 | 3,310 | (9,501) | |
| Foreign currency swaps | CF | - | 409 | (892) |
| Interest rate swaps | CF | 2,085 | 1,870 | (15,980) |
| Subtotal | 2,085 | 2,279 | (16,872) | |
| Total derivatives held-for-hedging | 4,962 | 5,589 | (26,373) | |
Additionally, we acknowledge the Staff’s comment and respectfully refer the Staff to our response to Comment #14 herein.
Our positions in derivatives corresponding to economic hedges are included in our trading derivatives portfolio. The inclusion of economic hedges in our trading derivatives portfolio is the result of a generic procedure to identify and control risk factors. The decrease in risk for these factors is recognized by us as an economic hedge.
Additionally, we had foreign exchange gains/loss on derivatives held-for-trading, which were recorded in trading and investment income.
| • | In future filings expand your discussion regarding other net operating income on page 125 to address the reason for the large foreign exchange loss in 2011. |
In 2010, our foreign currency exchange position was oversubscribed (liabilities > assets) with fluctuations in the currency exchange rate to under 11% annually. As a result, the lower value of our net liabilities resulted in a large amount of profit in 2010, which did not reoccur in 2011.
| • | Last, tell us and clearly disclose in future filings the derivatives that are used as economic hedges and a description of the types of risks they hedge. In this disclosure also clarify where gains and losses on these hedges are recorded. |
We acknowledge the Staff’s comment and respectfully advise that in future filings we will include the following disclosure:
Inflation forwards and inflation swaps. These derivatives are used to hedge the economic value of inflation indexed structures such as having inflation indexed assets funded with nominal liabilities.
OIS-Swap. These derivatives are used to hedge the economic value of long term assets funded with short term liabilities, fixing repricing of short term liabilities.
USD-CLP FX Forwards. USD-CLP FX Forwards are used to hedge US dollar denominated assets which will be funded by Chilean peso denominated short term liabilities.
The information related to hedges is included above in this response and in our response to Comment #14.
Note 27 Provision for Loan Losses, page F-92
| 22. | We note your charge to income for provisions established for loans and receivables from banks was Ch$141 million on page F-93, which differs from the Ch$485 million disclosed in the provision rollforward on page F-51. We also note differences in the totals of “charge to income for provisions established” and “credit to income for provisions released” for loans and receivables from customers disclosed here and on page F-55 for Fiscal 2011. Please reconcile the differences and revise future filings to clearly disclose how the information presented in this disclosure relates to the provision rollforwards in Notes 8 and 9. |
With respect to the discrepancy between Ch$141 million and Ch$485 mentioned above, in the column “Loans and receivables from banks,” an amount equivalent to Ch$ 344 million was not included as provision for loan losses and was misclassified as “Other Operating Expenses.” (See conclusion to this letter regarding Management´s determination of the materiality of the reclassifications found in response to the Staff´s comments, both individually and in the aggregate).
Note 27 “Provision for Loan Losses,” as corrected, and included for informational purposes only, is as follows:
| For the year ended December 31, 2011 | ||||||
| Loans and receivables from customers | ||||||
| Loans and receivables from banks | Commercial loans | Mortgage Loans | Consumer Loans | Total | ||
| MM$ | MM$ | MM$ | MM$ | MM$ | ||
| Established provision: | ||||||
| Individual Analysis | (485) | (42,862) | - | (1) | (43,348) | |
| Group Analysis | - | (12,617) | (3,669) | (35,021) | (51,307) | |
| Charge to income for provisions established | (485) | (55,479) | (3,669) | (35,022) | (94,655) | |
| Released provision: | ||||||
| Individual Analysis | 150 | 29,712 | - | 1 | 29,863 | |
| Group Analysis | - | 2,890 | 441 | 8,407 | 11,738 | |
| Credit to income for provisions released | 150 | 32,602 | 441 | 8,408 | 41,601 | |
| Recovery of loans and receivables previously written –off | 19 | 1,765 | 574 | 9,598 | 11,956 | |
| Net charge to income | (316) | (21,112) | (2,654) | (17,016) | (41,098) | |
The following tables present the significance of this error to the line items of the income statement.
| CONSOLIDATED STATEMENT OF INCOME | Percentage over Income before income taxes | As adjusted | ||
| 2011 | 2011 | % | 2011 | |
| Provisions for loan losses | (40,754) | (344) | 0.8% | (41,098) |
| Other operating expenses | (13,643) | 344 | 2.5% | (13,299) |
The above mentioned change does not affect Note 8 (F-51) nor Note 9 (F-53).
The following table presents the Consolidated Statement of Income line items affected by the reclassification noted above and the reclassification included in response to the Staff´s point number 20:
| 2010 | 2011 | ||||||||
| CONSOLIDATED STATEMENT OF INCOME | As reported | Adjustment and as a % of “as reported” | As Adjusted | As reported | Adjustment and as a % of “as reported” | As Adjusted | |||
| Other operating income | 8,832 | 141 | 1.6% | 8,973 | 9,507 | 1,714 | 18.0% | 11,221 | |
| Provisions for loan losses | (52,351) | (52,351) | (40,754) | (344) | 0.8% | (41,098) | |||
| Other operating expenses | (7,312) | (141) | 1.9% | (7,453) | (13,643) | (1,370) | 10.0% | (15,013) | |
Our analysis of all reclassifications noted above is that they are immaterial both qualitatively and quantitatively.
Additionally, as per your further notation as to differences between pages F-92 and F-55, we reconciled information disclosed in Note 9 and Note 27 related to established, released and recovery of provisions. From this analysis, we identified an immaterial difference of MCh$22 in recoveries of provisions for commercial loans, so instead of MCh$1,797, the amount of recoveries would have been MCh$1,765.
The differences explained above are presented as they would appear if corrected, for informational purposes only, in the following tables, demonstrating that all differences between Note 9 and Note 27 are reconciled.
Note 9: (*)
| Balances as January 1, 2011 | 54,355 | 49,860 | 104,215 | |||
| Impaired portfolio write-offs: | ||||||
| Commercial loans | ( 9,677) | ( 11,299) | ( 20,976) | |||
| Mortgage loans | ( 1,782) | ( 1,782) | ||||
| Consumer loans | ( 31,676) | ( 31,676) | ||||
| Total Write-offs | ( 9,677) | ( 44,757) | ( 54,434) | |||
| Established provision | 42,863 | a | 51,307 | b | 94,170 | |
| Released provision | ( 29,713) | c | ( 11,738) | d | ( 41,451) | |
| Impairment | - | - | - | |||
| Impairment Reversal | - | - | - | |||
| Balances as of December 31,2011 | 57,828 | 44,672 | 102,500 | |||
(*) This note does not include the loans and receivables from banks while the table below does.
Note 27:
| For the year ended December 31, 2011 | ||||||||
| Loans and receivables from customers | ||||||||
| Loans and receivables from banks | Commercial loans | Mortgage Loans | Consumer Loans | Total | ||||
| MM$ | MM$ | MM$ | MM$ | MM$ | ||||
| Established provision: | ||||||||
| Individual Analysis | (485) | (42,862) | a | - | (1) | a | (43,348) | |
| Group Analysis | - | (12,617) | b | (3,669) | b | (35,021) | b | (51,307) |
| Charge to income for provisions established | (485) | (55,479) | (3,669) | (35,022) | (94,655) | |||
| Released provisions: | ||||||||
| Individual Analysis | 150 | 29,712 | c | - | 1 | c | 29,863 | |
| Group Analysis | - | 2,890 | d | 441 | d | 8,407 | d | 11,738 |
| Credit to income for provisions released | 150 | 32,602 | 441 | 8,408 | 41,601 | |||
| Recovery of assets previously written -off | 19 | 1,765 | e | 574 | 9,598 | 11,956 | ||
| Net charge to income | (316) | (21,112) | (2,654) | (17,016) | (41,098) | |||
Reconciled is as follows:
| Note 27 | Individual Provisions | Group provisions | |||||||
| Established provision | 42,863 | a | 51,307 | b | |||||
| Released provision | ( 29,713) | c | ( 11,738) | d | |||||
| Note 9 | Commercial loans | Mortgage Loans | Consumer Loans | Subtotal | |||||
| Established provision: | |||||||||
| Individual Analysis | (42,862) | - | (1) | (42,863) | a | ||||
| Group Analysis | (12,617) | (3,669) | (35,021) | (51,307) | b | ||||
| Released provisions: | |||||||||
| Individual Analysis | 29,712 | - | 1 | 29,713 | c | ||||
| Group Analysis | 2,890 | 441 | 8,407 | 11,738 | d | ||||
The change above results in modifications to the table in page 107 that shows loan loss recoveries by loan category for all periods indicated:
| As of December 31, | ||||
| 2008 | 2009 | 2010 | 2011 | |
| (in millions of Ch$) | ||||
| Bank debt | - | - | - | 19 |
| Consumer loans | 9,143 | 11,329 | 11,893 | 9,598 |
| Residential mortgage loans | 285 | 111 | 90 | 574 |
| Commercial loans | 1,607 | 1,776 | 2,726 | 1,765 |
| Total | 11,035 | 13,216 | 14,709 | 11,956 |
Note 33 – Financial Assets and Liabilities Measured at Estimated Fair Value, page F-103
| 23. | We note that approximately 18% of your available-for-sale securities are classified within Level 2 of the fair value hierarchy; however we could not locate your disclosures describing the valuation techniques and assumptions used in determining the fair values of these securities other than your disclosure on page F-104 that the fair values take into account variables and additional inputs like estimated prepayment rates and issuers’ credit risk. We note that you do provide disclosure of certain valuation techniques on pages F-21 F-22, however these disclosures appear to be limited to your derivative instruments. Accordingly, please revise your future filings to describe the valuation techniques and related assumptions used to fair value your Level 2 available-for-sale securities. Refer to paragraph 27 of IFRS 7. |
We acknowledge the Staff’s comment and respectfully advise the Staff that available for sale securities consist of bonds and time deposits, which are all fixed income instruments.
We propose to include the following disclosure in the equivalent to Note 33 in future filings:
The Level 2 category also includes available-for-sale securities which are measured using a valuation technique primarily comprised of discounted cash flow models which incorporate assumptions supported by observable inputs from quoted market sources using bootstrapping for constructing a fixed-income yield curve. The majority of such securities are traded on an over-the-counter market or an inactive market.
The table below breaks down the detail as described in the proposed disclosure as of December 30, 2011:
Table (Fair value for level 2 instrument)
| Instrument | Yield Curve Name | Market Quote Source | Fair Value Model |
| Central Bank of Chile Bond | CurveBCP | Santiago Exchange | Discounted contractual cash flows |
| Central Bank of Chile Bond | CurveBCU | Santiago Exchange | Discounted contractual cash flows |
| Central Bank of Chile Bond | CurveCeros | Santiago Exchange | Discounted contractual cash flows |
| Treasury Bond | CurveBR | Santiago Exchange | Discounted contractual cash flows |
| Central Bank of Chile Bond | CurvePDBC | Santiago Exchange | Discounted contractual cash flows |
| Financial Institution Deposits | CurveDPF1 | Santiago Exchange | Discounted contractual cash flows |
| Financial Institution Deposits | CurveDPF2 | Santiago Exchange | Discounted contractual cash flows |
| Financial Institution Deposits | CurveDPR | Santiago Exchange | Discounted contractual cash flows |
| Mortgage Security | Mortgage Security | Santiago Exchange | Discounted contractual cash flows |
| Bond | Bond | Santiago Exchange - Bloomberg | Discounted contractual cash flows |
| 24. | As a related matter, please provide us with a more detailed breakdown of your available-for-sale securities by security type (i.e. how they are presented in Note 10) and level within the fair value hierarchy and consider providing this level of disclosure in your future filings. Please also discuss the extent of your use of unobservable inputs in the valuation of these securities and confirm that none of your available-for-sale securities should be classified as Level 3 fair value measurements. |
The valuations of our available-for-sale securities do not incorporate unobservable inputs nor are any of them classified as Level 3.
We acknowledge the Staff’s comment and respectfully advise that in future filings we will include the following disclosure:
As of December 31, 2011 | ||||
| Available-for-sale Securities | ||||
| MCh$ | MCh$ | MCh$ | MCh$ | |
Total | Level 1 | Level 2 | Level 3 | |
Chilean Central Bank and Government Securities | ||||
| Chilean Central Bank Securities | 307,122 | 307,122 | - | - |
| Chilean Treasury Bonds | 4,336 | 4,336 | - | - |
| Other government Securities | 57,480 | - | 57,480 | - |
| Other financial instruments | ||||
| Promissory notes related to deposits in local banks | 380,284 | 380,284 | - | - |
| Chilean mortgage finance bonds | 1,055 | - | 1,055 | - |
| Chilean financial institution bonds | 41,702 | - | 41,702 | - |
| Other local investments | 44,109 | - | 44,109 | - |
| Financial instruments issued abroad | ||||
| Foreign government and central bank instrument | - | - | - | - |
| Other foreign investments | 7,161 | 263 | 6,898 | - |
| Impairment Provisions | - | - | - | - |
| Totals | 843,250 | 692,005 | 151,245 | - |
| 25. | We note your valuation disclosure for loans and accounts receivable to customers and banks on page F-105 and that the carrying amount of this line item was only Ch$50 million less than the fair value as of December 31, 2011. Please address the following: |
During the review process and due to an involuntary error in the process of “Edgarizing” and filing the 20-F for 2011, an inadvertent mistake was made in the entry of the amounts into the table. The correct amounts are set forth in the following table:
| As of December 31, 2011 | |||
| Carrying amount | Estimated Fair value | Difference (Loss)/Gain | |
| Loans and receivables to customers | Ch$6,711,945 | $6,750,485 | $38,540 |
| · | Tell us and clarify in future filings whether your cash flow analyses are based on expected cash flows that already reflect assumptions about the uncertainty in future defaults or contractual cash flows with uncertainty about future defaults captured by the discount rate. |
Our proposed disclosure in future filings in the Note equivalent to 33 is as follows:
We consider probability of default and recovery rate information as derived from historical information when developing our expected cash flows. Therefore, our expected cash flows already reflect assumptions about the uncertainty in future defaults.
| • | Confirm that your cash flow analyses reflect all the factors discussed in paragraphs AG79 and AG82 of IAS 39 either through the adjustment of the cash flows or through the use of more than one discount rate. Also, enhance your disclosures on these factors and the impact they have on the valuation in accordance with paragraph 27 of IFRS 7, which requires disclosure of assumptions applied in determining fair values. |
Our cash flows analyses reflect all the relevant factors discussed in paragraphs AG79 and AG82 of IAS 39 through the use of more than one discount rate.
Primarily, the relevant factors are credit quality and remaining term to repayment (including any prepayment risk) and we propose the following disclosure:
Credit quality is taken into consideration by the use of observable interest rates charged by lenders for loans of credit ratings which we may deem to be similar to those used by the Bank based on our understanding of the local market from which such credit ratings are derived.
We do not believe that remaining term to repayment (including prepayment risk) is of sufficient importance to our fair value estimate as evidenced by internal sensitivity analyses performed based on historical information.
| • | Describe in greater detail the adjustments you made to quoted market prices for similar mortgage, credit card, and other consumer loans to account for the differences in loan characteristics and tell us the total adjustment as of December 31, 2011. |
In future filings we will revise the disclosure which you summarize above to the following as the statement above is not a description of methodology we used as of December 31, 2011. Specifically, we did not use quoted market prices plus/minus adjustments. All loan types are fair valued under the same methodology as described below and which description represents our proposed disclosure:
c) Loans and accounts receivables to customers and banks
For floating-rate loans that re-priced frequently and have no significant change in credit quality, the estimated fair values are based on their carrying values.
Fixed rate loans are valued using models that discount expected future cash flows. These models calculate fair value based on observable interest rates and unobservable credit spreads. Unobservable credit spreads are determined by extrapolating observable spreads.
Where there is significant uncertainty regarding loan performance, valuation is based on the underlying collateral, whose value is determined through property-specific information such as third party valuation reports and bids for the underlying properties.
Given that the loans for which you have requested the fair value adjustment are not analyzed, as explained above, through a segregation of the consumer, mortgage and credit card loans, we are unable to provide a disaggregated adjustment for that segment.
| · | Tell us whether impaired loans are also valued using the techniques described on page F-105 and if not, revise future filings to describe in detail the valuation method used for individually impaired loans. In your response address whether the present value of estimated future cash flows for impaired loans include future credit losses that have not been incurred as of December 31, 2011. |
Page 27
We confirm that we use the techniques described on page F-105.
Please refer to the second bullet point above as to the incorporation of probability of default information into our fair value measurements with respect to loans and receivables from customers.
Our present value of estimated cash flows for impaired loans does not include future credit losses that have not been incurred as of December 31, 2011.
| 26. | We note Ch$33 billion or 13% of derivative assets are measured at Level 3 and we note your valuation technique disclosures on pages F-22 and F-105. Please tell us and revise future filings to clarify which of your derivatives are measured at Level 3 and whether changing one or more of the assumptions included in the models to reasonably possible alternative assumptions would change the fair value significantly and the effect of those changes as required by paragraph 27B(e) of IFRS 7. |
We acknowledge the Staff’s comment and respectfully advise the Staff that the derivatives that are classified as Level 3 are interest rate swaps indexed to the TAB rate. The TAB rate is a weighted interbank inflation linked deposit rate observed among Chilean financial institutions that is published and provided by the Chilean Banking Association. Interest rate swaps indexed to the TAB rate are usually offered to nonfinancial institutions in order to hedge their TAB rate indexed debts. These interest rate swaps are traded on the OTC market and have lower market liquidity. The fair value measurement method applied involves creating a yield curve / term structure that allows us to quantify the unknown cash flows indexed to the TAB rate. This yield curve / term structure is created by using an OIS Swap (an overnight indexed swap), plus a spread that reflects the liquidity premiums. The difference between the TAB rate and the overnight rate is called TAB basis, which is needed for the TAB yield curve modeling.
As of December 31, 2011, no reasonably possible alternative assumptions would change the fair values of these Level 3 instruments significantly.
The Company has determined that all errors disclosed in the responses to the above comments, both individually and in the aggregate, are immaterial and that such errors do not have an impact on their risk assessment for internal control purposes.
The Company acknowledges that:
| • | The Company is responsible for the adequacy and accuracy of the disclosure in Form 20-F; |
| • | Staff comments or changes to disclosure in response to Staff comments do not foreclose the SEC from taking any action with respect to Form 20-F; and |
| • | the Company may not assert Staff comments as a defense in any proceeding initiated by the SEC or any person under the federal securities laws of the United States. |
* * *
We thank you for your prompt attention to this letter responding to the Comment Letter and look forward to hearing from you at your earliest convenience. Please direct any questions concerning this response to the undersigned at Rosario Norte 660, 10th floor, Las Condes, Santiago, Chile.
Yours truly,
/s/ Eugenio Gigogne
Eugenio Gigogne
Chief Financial Officer
Tel: 562-660-2351
Eugenio.gigogne@corpbanca.cl
c.c. Ms. Lindsay McCord
Ms. Angela Connell
Mr. Howard M. Kleinman
Dechert LLP
Tel. 212-698-3567
howard.kleinman@dechert.com