Exhibit 99.1


CorpBanca Announces
Second Quarter 2015 Financial Report;
Santiago, Chile, August 11, 2015. CORPBANCA (NYSE:BCA; SSE: CORPBANCA), a Chilean financial institution offering a wide variety of corporate and retail financial products and services, today announced its financial results for the second quarter ended June 30, 2015. This report is based on unaudited consolidated financial statements prepared in accordance with Chilean generally accepted accounting principles. Solely for the convenience of the reader, U.S. dollar amounts in this report have been translated from Chilean nominal peso at our internal exchange rate as of June 30, 2015 of Ch$638.47 per U.S. dollar. Industry data contained herein has been obtained from the information provided by the “Superintendencia de Bancos e Instituciones Financieras” (SBIF). Additionally Year over Year” (YoY) states for the comparison between 2Q 2015 and 2Q 2014 and “Quarter over Quarter” (QoQ) states for the comparison between 2Q 2015 and 1Q 2015;
| Financial Highlights In first half of 2015 (1H 2015), Net Income attributable to shareholders totaled Ch$96.22 billion (Ch$0.2827 per share, or US$0.6642 per ADR), equivalent to 8.7% decrease compared to first half of 2014. Sound loan growth in all business segments both in Chile and Colombia (when measured in each local currency), synergies already delivered in Colombia and lower tax rates were partially offset by higher provisions for loan losses and the negative impact of a lower inflation on net interest margin. Nonetheless we achieved 1H 2015 with 103% compliance regarding our budget for the period. In 2Q 2015, Net Income attributable to shareholders totaled Ch$56.5 billon (Ch$0.1661 per share, or US$0.3902 per ADR), equivalent to 42.4% increase QoQ and 13.4% decrease YoY. The main drivers for these periods results are explained below: Total loans1 reached Ch$14.7 trillion as of June 30, 2015, equivalent to a 2.4% increase QoQ and a 0.9% increase YoY. After achieving a long period of sustained growth in both countries, this quarter showed a flat loan growth activity in Chile, following a similar trend in the Chilean banking industry, and a slower pace in Colombia. | Mr. Fernando Massú, CEO 2Q 2015 net income achieved Ch$56.5 billion, an increase of 42.4% QoQ; that breaks in Ch$42.8 billion for Chile and Ch$13.8 billion for Colombia, confirming the low correlation between both economies and allowing CorpBanca to be in line with the budget for this period. In Colombia, the banking industry has faced a slower growth path than expected. Nevertheless CorpBanca Colombia has been able to offset this economic context with the positive impact of cost savings already achieved from the completion of some of the stages of the merger between CorpBanca Colombia and Helm Bank. In connection with the pending merger between Itaú Chile and CorpBanca, on June 26 and 30 CorpBanca and Itaú Chile´s extraordinary shareholders meetings approved the merger along with the amendments to the Transaction agreement. The amendments are related to a special dividend for current CorpBanca’s shareholders, a reduction of Itaú Chile dividend, a new dividend policy for 2015 fiscal year, an extension of the deadline for the purchase of stake in CorpBanca Colombia and set the closing date for the merger between January 1, 2016 and May 2, 2016. |

Net operating profit before loan losses respectively increased by 8.8% QoQ and decreased by 2.4% YoY. In 2Q 2015 we achieved an annualized net interest margin (NIM) of 4.23%, similar to 4.22% in 2Q 2014 and showing an improvement compared to 3.09% in 1Q 2015. This improvement is mainly the result of higher quarterly UF variation in Chile, as well as growth in commercial and consumer loans and investment portfolio in Colombia. Net provisions for loan losses increased by 12.7% QoQ and 30.8% YoY, mainly as the result of higher reserves in Colombia to prevent further deterioration in a complex economic context. Regarding YoY expenses 2Q 2014 provisions for loan losses were particularly low, due to extraordinary provision releases related to our corporate portfolio. Total operating expenses were flat QoQ and decreased by 5.7% YoY, primarily as the result of synergies that have been delivered in Colombia. | The special dividend agreed in May 2015 in order to ensure the extraordinary shareholders meetings (EGM) approval, was voted for by almost 90% of all CorpBanca’s shareholders. Accordingly once approved by Banco Itaú Chile EGM, CorpBanca recorded the corresponding provision for that payment. Despite the fact that the payment was wired on July 1, it impacted our capital ratios since June 30, 2015, decreasing from 11.8% in 1Q 2015 to 9.7% in 2Q 2015. The US$552 million pending capital injection committed by Itaú Unibanco prior to the merger in addition to Banco Itaú Chile ample TIER one Capital will significantly strengthen the capital base and ratios for the merged bank. We estimate merged BIS ratio to be between 13%-16%. Meanwhile CorpBanca will show temporary BIS ratios between 9.2%-10.2% always with room above the regulatory minimum. The next step towards the materialization of the merger will be the approval from the Chilean Superintendency of Banks (SBIF). |

Management’s Discussion and Analysis
I) Consolidated Financial Performance Review
The following table sets forth the components of our consolidated net income for the quarters ended June 30, 2015 and 2014 and March 31, 2015.
The 42.4% QoQ increase is mainly explained by higher Net operating profit before loan losses, due to higher net interest margin (NIM) as well as higher fees and commissions revenues.
The 13.4% reduction YoY is explained by lower fees and commission compared to 2Q 2014 (a remarkable quarter in that item) and higher loan loss provision, due to higher country risk loan loss provision and extraordinary allowances for credit losses releases observed in 2Q 2014.
| Quarterly Consolidated Income Statements (unaudited) | ||||||
| Quarter | Change (%) | |||||
| (Expressed in million of Chilean peso) | 2Q15 | 1Q15 | 2Q14 | 2Q15/2Q14 | 2Q15/1Q15 | |
| Net interest income | 174,496 | 125,202 | 162,961 | 7.1% | 39.4% | |
| Net fee and commission income | 40,044 | 36,579 | 44,954 | -10.9% | 9.5% | |
| Net total financial transactions | 31,499 | 49,735 | 37,109 | -15.1% | -36.7% | |
| Other operating income, net | (6,687) | 8,559 | 112 | - | - | |
| Net operating profit before loan losses | 239,352 | 220,075 | 245,136 | -2.4% | 8.8% | |
Provision for loan losses (1) | (43,935) | (38,970) | (33,602) | 30.8% | 12.7% | |
| Net operating profit | 195,417 | 181,105 | 211,534 | -7.6% | 7.9% | |
| Operating expenses | (112,968) | (112,580) | (119,825) | -5.7% | 0.3% | |
| Operating income | 82,449 | 68,525 | 91,709 | -10.1% | 20.3% | |
| Income from investments in other companies | 353 | 907 | 781 | -54.8% | -61.1% | |
| Income before taxes | 82,802 | 69,432 | 92,490 | -10.5% | 19.3% | |
| Income tax expense | (19,336) | (22,239) | (19,419) | -0.4% | -13.1% | |
| Net income | 63,466 | 47,193 | 73,071 | -13.1% | 34.5% | |
| Minority interest | (6,938) | (7,504) | (7,815) | -11.2% | -7.5% | |
| Net income attributable to shareholders | 56,528 | 39,689 | 65,256 | -13.4% | 42.4% | |
(1) Includes provision for contingent loans.
II) Unconsolidated Financial Performance Review: Chile and Colombia
The following table presents the results generated in Chile and Colombia separately for the 2Q 2015. The financial results of CorpBanca Chile include some expenses associated with our Colombian operations, which have to be excluded from our Chile’s book in order to observe Chile’s stand-alone results. Three are these adjustments: (i) interest expenses in connection with the portion of the acquisition of Banco Santander Colombia (known as CorpBanca Colombia since August 2012) that was not funded with equity, that impacted CorpBanca’s NIM in our Chilean operation; (ii) amortization of the intangible assets generated in the Banco Santander Colombia acquisition that affected operating expenses in Chile; and (iii) the impact of our fiscal hedge2, which is a consequence of a management’s decision to hedge the impact of the volatility of the US$/Ch$ exchange rate in the net income attributable to shareholders, which would not otherwise exist in the absence of such decision, that impacted net operating profits but is offset in income tax expenses.

The adjusted 2Q 2015 results present, in our opinion, the closest approximation of CorpBanca on a stand-alone basis:
| 2Q 2015 Financial Statements | 2Q 2015 Adjusted Financial Statements | |||||||||
| (Expressed in million of Chilean peso) | Consoli- dated | Chile | Colombia | Adjust- ments | Chile | Colombia | 2Q15/2Q14 | 2Q15/1Q15 | ||
| Chile | Colombia | Chile | Colombia | |||||||
| Net interest income | 174,496 | 95,244 | 79,252 | 6,481 | 101,725 | 72,771 | 4.2% | 11.4% | 49.0% | 27.8% |
| Net fee and commission income | 40,044 | 27,444 | 12,600 | - | 27,444 | 12,600 | -4.6% | -22.2% | 19.9% | -8.0% |
| Total financial transactions, net | 31,499 | 2,800 | 28,699 | (3,919) | (1,119) | 32,618 | -133.0% | -3.3% | -107.1% | -3.9% |
| Other operating income, net | (6,687) | 1,709 | (8,396) | 1 | 1,710 | (8,397) | - | -515.4% | - | -180.9% |
| Net operating profit before loan losses | 239,352 | 127,197 | 112,155 | 2,563 | 129,760 | 109,592 | 1.5% | -6.6% | 23.4% | -4.7% |
Provision for loan losses (1) | (43,935) | (11,447) | (32,488) | - | (11,447) | (32,488) | 156.3% | 11.5% | -1.0% | 18.5% |
| Net operating profit | 195,417 | 115,750 | 79,667 | 2,563 | 118,313 | 77,104 | -4.1% | -12.5% | 26.5% | -11.9% |
| Operating expenses | (112,968) | (62,842) | (50,126) | 2,034 | (60,808) | (52,160) | 11.1% | -19.9% | 7.2% | -6.6% |
| Operating income | 82,449 | 52,908 | 29,541 | 4,597 | 57,505 | 24,944 | -16.2% | 8.2% | 56.0% | -21.2% |
| Income from investments in other companies | 353 | 189 | 164 | - | 189 | 164 | 30.3% | -74.2% | - | -81.9% |
| Income before taxes | 82,802 | 53,097 | 29,705 | 4,597 | 57,694 | 25,108 | -16.1% | 6.0% | 56.6% | -22.9% |
| Income tax expense | (19,336) | (10,406) | (8,930) | 4,912 | (5,494) | (13,842) | -32.3% | 22.5% | 13.7% | -20.5% |
| Net income | 63,466 | 42,691 | 20,775 | 9,509 | 52,200 | 11,266 | -14.0% | -9.0% | 63.0% | -25.7% |
| Net income attributable to shareholders | 56,528 | 42,777 | 13,751 | 9,509 | 52,286 | 4,242 | 121.0% | 88.2% | 62.5% | -43.5% |
| Efficiency Ratio | 47.2% | 49.4% | 44.7% | 46.9% | 47.6% | |||||
(1) Includes Provision for contingent loans.
The adjustments aforementioned are related to:
| i. | Ch$6.5 billion associated with funding for the acquisition of CorpBanca Colombia. |
| ii. | Ch$3.9 billion of hedge taxes in US$. |
| iii. | Ch$2.0 billion of intangible assets amortization and integration costs in Colombia. |
Taking into account these adjustments, our estimated result for our stand-alone operations in Chile is Ch$52.27 billion of Adjusted Net Income in 2Q 2015.
The chart below shows our 12-month trailing Net Income from December 31, 2008 through June 30, 2015, in Chile and Colombia. During this period, our Consolidated Net Income reached Ch$217 billion, a 3.9% decrease QoQ and a 26.2% increase YoY. Our Chilean operation totaled Ch$142.4 billion and CorpBanca Colombia totaled Ch$74.6 billion, equivalent to one third of CorpBanca’s consolidated Net Income (compared to 15.3% in 2013).


Consolidated Net Interest Income
In 2Q 2015 our net interest income was Ch$174.50 billion, equivalent to a 39.4% increase QoQ and 7.1% increase YoY.
The QoQ increase was the result of higher quarterly UF variation in Chile (1.46% in 2Q 2015 vs (0.02%) in 1Q 2015), as well as growth in commercial and consumer loans and available for sale investment portfolio in Colombia.
The YoY increase was accounted for almost equally between CorpBanca Colombia and our Chilean operation. In Colombia higher interest income was the result of an increase in our available for sale investment portfolio while in Chile we experienced lower cost of funds in our time deposits as a consequence of a drop in monetary policy interest rate set by the Chilean Central Bank.
These factors impacted positively our net interest margin (net interest income divided by average interest- earning assets), that increased to 4.23%in 4Q 2015 from 3.09% in 1Q 2015 and remained stable QoQ (4.23% in 2Q 2015 vs 4.22% in 2Q 2014).
The gap between assets and liabilities indexed to the UF was approximately Ch$821.4 billion in 2Q 2015, resulting in an impact of Ch$8.2 billion in results for each 100 bp of variation of the UF.
Consolidated Fees and Commission from Services
| Quarter | Change (%) | |||||
| (Expressed in million of Chilean peso) | 2Q15 | 1Q15 | 2Q14 | 2Q15/2Q14 | 2Q15/1Q15 | |
Banking services(*) | 26,536 | 25,023 | 30,033 | -11.6% | 6.0% | |
| Securities brokerage services | 149 | 177 | 188 | -20.7% | -15.4% | |
| Mutual fund management | 1,989 | 1,854 | 1,806 | 10.1% | 7.3% | |
| Insurance brokerage | 3,065 | 2,433 | 2,966 | 3.3% | 25.9% | |
| Financial advisory services | 7,873 | 6,610 | 9,422 | -16.4% | 19.1% | |
| Legal advisory services | 432 | 482 | 537 | -19.6% | -10.4% | |
| Net fee and commission income | 40,044 | 36,579 | 44,954 | -10.9% | 9.5% | |
(*) Includes consolidation adjustments. | ||||||
In 2Q 2015 the net fee and commission income increased 9.5% QoQ and decreased 10.9% YoY.
On a QoQ basis, we benefited from higher structured fees in Financial Advisory Services in Chile and a positive repricing of the Redbanc (interconnected network between banks through ATM) rate applied to ATMs transactions.

On a YoY basis, we were impacted by lower flat fees and insurance commissions in Colombia and lower commissions from NY Branch due to a shift towards interest-bearing activities instead of commissions-based activities and structured fees in Financial Advisory Services in Chile.
Consolidated Net Total Financial Transaction
| Quarter | Change (%) | |||||
| (Expressed in million of Chilean peso) | 2Q15 | 1Q15 | 2Q14 | 2Q15/2Q14 | 2Q15/1Q15 | |
| Trading and investment income: | ||||||
| Trading investments* | 4,620 | 7,203 | 17,592 | -73.7% | -35.9% | |
| Trading financial derivatives contracts | 52,184 | 46,103 | 24,054 | 116.9% | 13.2% | |
| Other | (3,694) | 14,222 | 9,051 | - | - | |
| Net income from financial operations | 53,110 | 67,528 | 50,697 | 4.8% | -21.4% | |
| Foreign exchange profit (loss), net | (21,611) | (17,793) | (13,588) | 59.0% | 21.5% | |
| Net total financial transactions result | 31,499 | 49,735 | 37,109 | -15.1% | -36.7% | |
* Market risk exposure related to proprietary trading investment is strongly limited
In 2Q 2015 net total financial transactions result was Ch$31.5 billion, representing a decrease of 36.7% QoQ and 15.1% YoY.
This QoQ decrease was the result of lower sales of securities investment portfolio in Chile and a shift toward available for sale investment portfolio in Colombia, which result is reflected in NIM as aforementioned.
The YoY decrease is explained by the negative impact of high volatility of the US$/Ch$ and US$/Col$ exchange rates on our foreign exchange positions in Chile and Colombia and a shift toward available for sale investment portfolio in Colombia, which result is reflected in NIM as aforementioned.
Consolidated Provisions for Loan Losses (for Commercial and Retail Loans) (1)
| Quarter | Change (%) | |||||
| (Expressed in million of Chilean peso) | 2Q15 | 1Q14 | 2Q14 | 2Q15/2Q14 | 2Q15/1Q15 | |
| Commercial, net of loan loss recoveries | (25,082) | (25,788) | (12,851) | 95.2% | -2.7% | |
| Residential mortgage, net of loan loss recoveries | (1,314) | 3,904 | (519) | 153.2% | - | |
| Consumer, net of loan loss recoveries | (18,947) | (16,644) | (19,185) | -1.2% | 13.8% | |
| Others | 154 | (99) | (36) | - | - | |
| Net provisions for loan losses | (45,189) | (38,627) | (32,591) | 38.7% | 17.0% | |
(1) Excludes provisions for Contingent loans.
Net provisions from loan losses increased 17.0% QoQ and 38.7% YoY. During this second quarter our loan portfolio grew in all segments in Colombia, even though the pace decreased from two digits to one digit. At the same time, to improve our loan losses reserves we downgraded some specific loan positions in Colombia, in particular in the Oil and Gas sector and contractors in general. Our current exposure to Oil and Gas sector was barely 3.6% of our consolidated loan portfolio, of which 2.6% represented Colombian exposure to such sector. In Chile our provisions for loan losses increased due to the negative impact of the appreciation of US dollar against the Chilean peso on our US$ denominated loan portfolio. Additionally we downgraded a specific portion of our Chilean corporate loans due to the economic environment.
The YoY increase is mainly explained by significant provision releases in 2Q 2014, for the amount of Ch$9.10 billion related to prepayment of FIP Sinergia credit.
The chart below illustrates how our consolidated non-performing loan (NPL) ratio compares to the industry average in Chile. According to the SBIF, CorpBanca has maintained one of the lowest credit risk indexes (total loan loss allowances / total loans) in the Chilean banking industry over the past five years, consistent with one of our

core pillars relating to high quality loan portfolio. We believe that our risk management processes and methodology enable us to identify risks and resolve potential problems on a timely basis.
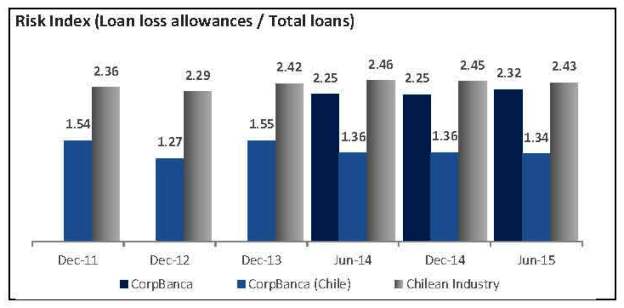
CorpBanca´s high asset quality was maintained following the acquisition of Banco Santander Colombia in May 2012 and Helm Bank in August 2013. For a country breakdown, see “Section VIII”, page 21.

Consolidated Operating Expenses
| Quarter | Change (%) | |||||
| (Expressed in million of Chilean peso) | 2Q15 | 1Q15 | 2Q14 | 2Q15/2Q14 | 2Q15/1Q15 | |
| Personnel salaries and expenses | 50,895 | 50,202 | 56,359 | -9.7% | 1.4% | |
| Administrative expenses | 51,197 | 51,561 | 49,894 | 2.6% | -0.7% | |
| Depreciation and amortization | 10,853 | 10,806 | 13,572 | -20.0% | 0.4% | |
| Impairment | 23 | 11 | - | - | 109.1% | |
| Operating expenses | 112,968 | 112,580 | 119,825 | -5.7% | 0.3% | |
Operating expenses were flat QoQ and decreased by 5.7% YoY in 2Q 2015, as the result of the synergies already delivered in Colombia and the absence of one-time expenses related to the merger process between CorpBanca Colombia and Helm Bank.
Regarding the expenses related to the merger process with Banco Itaú Chile we recorded a provision of approximately Ch$1.7 billion per month during this first half of 2015.

Consolidated Tax Expenses
Our Income tax expenses decreased 13.1% QoQ and were flat YoY. On a QoQ basis, tax expenses decrease is explained by a significant release of provisions in Colombia.
III) Consolidated Assets and Liabilities
Consolidated Loan portfolio (1)
| Quarter ended | Change (%) | |||||
| (Expressed in million of Chilean peso) | Jun-15 | Mar-15 | Jun-14 | Jun-15/ Jun-14 | Jun-15/ Mar-15 | |
| Wholesale lending | 10,686,200 | 10,451,460 | 10,553,087 | 1.3% | 2.2% | |
| Chile | 6,928,215 | 6,875,090 | 6,449,152 | 7.4% | 0.8% | |
| Commercial loans | 5,915,238 | 5,876,961 | 5,456,985 | 8.4% | 0.7% | |
| Foreign trade loans | 601,731 | 588,366 | 576,456 | 4.4% | 2.3% | |
| Leasing and factoring | 411,246 | 409,763 | 415,711 | -1.1% | 0.4% | |
| Colombia | 3,757,985 | 3,576,370 | 4,103,935 | -8.4% | 5.1% | |
| Commercial loans | 3,221,235 | 3,072,854 | 3,521,132 | -8.5% | 4.8% | |
| Foreign trade loans | - | - | - | - | - | |
| Leasing and factoring | 536,750 | 503,516 | 582,803 | -7.9% | 6.6% | |
| Retail lending | 4,054,480 | 3,949,370 | 4,049,406 | 0.1% | 2.7% | |
| Chile | 2,332,381 | 2,329,071 | 2,208,116 | 5.6% | 0.1% | |
| Consumer loans | 589,754 | 589,123 | 547,245 | 7.8% | 0.1% | |
| Residential mortgage loans | 1,742,627 | 1,739,948 | 1,660,871 | 4.9% | 0.2% | |
| Colombia | 1,722,099 | 1,620,299 | 1,841,290 | -6.5% | 6.3% | |
| Consumer loans | 1,203,675 | 1,129,775 | 1,308,547 | -8.0% | 6.5% | |
| Residential mortgage loans | 518,424 | 490,524 | 532,743 | -2.7% | 5.7% | |
| TOTAL LOANS | 14,740,680 | 14,400,830 | 14,602,493 | 0.9% | 2.4% | |
| Chile | 9,260,596 | 9,204,161 | 8,657,268 | 7.0% | 0.6% | |
| Colombia | 5,480,084 | 5,196,669 | 5,945,225 | -7.8% | 5.5% | |
(1) Contingent loans under IFRS are not considered part of the loan portfolio.
Our total loan portfolio increased by 2.4% QoQ and 0.9% YoY.
On a QoQ basis, growth in our loan portfolio was flat in all segments, reflecting a complex economic context, while in Colombia our loan book increased by 5.5% in the same period benefiting from lower banking penetration in that country and higher economic growth perspective than in Chile (3.2% economic growth in Colombia vs 2.7% in Chile according to Central Banks of Colombia and Chile) combined with higher loan growth to economic growth elasticity (3.2x in Colombia compared to 1.9x in Chile).
On a YoY basis, our loan portfolio increased in all segments in both countries. Nonetheless Colombian figures were affected by translation impacts due to a 16.9% depreciation of the Colombian peso against the Chilean peso in 2Q 2015 in comparison to 2Q 2014.

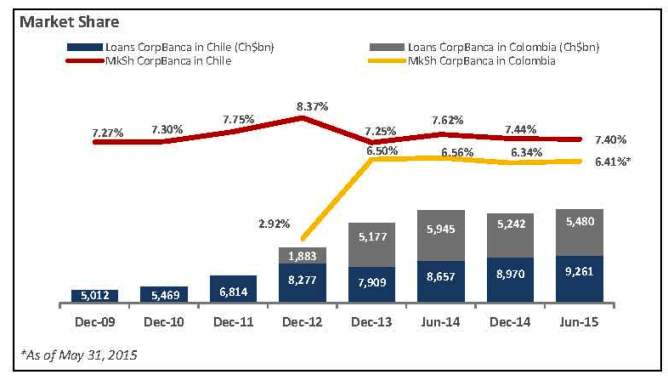
According to SBIF, our market share in Chile, on an unconsolidated basis, was 7.4% in June 2015, similar to December 31, 2014 and reflecting a decrease of 22 bp compared to June 30, 2014. In Colombia, despite the ongoing integration process related to the Helm Bank merger, our market share remained stable, reaching 6.4% as of May 31, 2015, according to the SFC. The chart below shows the evolution of our market share in both countries we operate.
Consolidated Securities Portfolio
| Quarter ended | Change (%) | |||||
| (Expressed in million of Chilean peso) | Jun-15 | Mar-15 | Jun-14 | Jun-15/ Jun-14 | Jun-15/ Mar-15 | |
| Trading investments | 405,981 | 543,155 | 497,366 | -18.4% | -25.3% | |
| Available-for-sale investments | 1,517,812 | 1,214,300 | 627,449 | 141.9% | 25.0% | |
| Held-to-maturity investments | 281,195 | 203,357 | 258,069 | 9.0% | 38.3% | |
| Total Financial Investments | 2,204,988 | 1,960,812 | 1,382,884 | 59.4% | 12.5% | |
Our total financial investments portfolio increased 12.5% QoQ and 59.4% YoY, as the result of an increase in our investment portfolio in CorpBanca Colombia.
Our investment portfolio consists of trading, available-for-sale and held-to-maturity securities. Trading instruments correspond to fixed income securities acquired to generate gains from short-term price fluctuations or brokerage margins. Trading instruments are stated at fair value.
Investment instruments are classified in two categories: held-to-maturity investments and instruments available-for-sale. On a consolidated basis, we currently have a small portfolio of held-to-maturity investments, related to our Colombian operations. All other investment instruments are considered available-for-sale. Investment instruments are initially recognized at cost, which includes transaction costs. Instruments available-for-sale at each subsequent period-end are valued at their fair value according to market prices or based on valuation models. Unrealized gains or losses arising from changes in the fair value are charged or credited to equity accounts.
In addition to regulatory liquidity risk controls, we have also set internal liquidity limits, in order to safeguard CorpBanca’s payment capacity in the event of illiquid conditions. We have also established a minimum for our instruments portfolio that enables cash flows to be quickly generated either through liquidation or because they can be used as collateral for new funding sources. As part of our policy, we have developed two internal liquidity models:

| 1. | Minimum Liquidity Requirement: In order to ensure that CorpBanca will permanently hold enough liquid assets to meet all payments derived from obligations to third parties over the next three days, we set a limit on the minimum amount of liquid assets to be held on a daily basis. |
| 2. | Liquidity Coverage Ratio (LCR): We seek to ensure that, even under adverse conditions, we have access to the funds necessary to cover client needs and maturing liabilities. The purpose of the LCR model is to evaluate our funding capacity assuming a hypothetical scenario of illiquidity. The LCR is based on a stress scenario which assumes that an unusually large proportion of liabilities will be withdrawn over the next 20 days according with a stressed volatility and liquid assets will have to cover excess requirements. |
Consolidated Funding Strategy
| As of the three months ended | Change (%) | Breakdown (%) | ||||||||
| (Expressed in million of Chilean peso) | Jun-15 | Mar-15 | Jun-14 | Jun-15/ Jun-14 | Jun-15/ Mar-15 | Jun-15 | Mar-15 | Jun-14 | ||
| Demand deposits | 4,068,518 | 3,863,103 | 4,170,880 | -2.5% | 5.3% | 23.1% | 23.0% | 25.2% | ||
| Time deposits and saving accounts | 8,299,949 | 8,142,065 | 7,897,235 | 5.1% | 1.9% | 47.1% | 48.4% | 47.8% | ||
| Investments sold under repurchase agreements | 591,079 | 429,097 | 296,380 | 99.4% | 37.7% | 3.4% | 2.6% | 1.8% | ||
| Mortgage finance bonds | 88,625 | 93,054 | 107,570 | -17.6% | -4.8% | 0.5% | 0.6% | 0.7% | ||
| Bonds | 2,141,713 | 2,029,977 | 1,647,939 | 30.0% | 5.5% | 12.2% | 12.1% | 10.0% | ||
| Subordinated bonds | 911,976 | 889,452 | 895,372 | 1.9% | 2.5% | 5.2% | 5.3% | 5.4% | ||
| Interbank borrowings | 14,589 | 14,499 | 15,220 | -4.1% | 0.6% | 0.1% | 0.1% | 0.1% | ||
| Foreign borrowings | 1,488,323 | 1,354,133 | 1,498,473 | -0.7% | 9.9% | 8.5% | 8.1% | 9.1% | ||
Our current funding strategy is to optimize all sources of funding in accordance with their costs, their availability and our general asset and liability management strategy. The funding structure in the period of time analyzed in this report remained stable; the limited changes are mostly related to debt maturity profile, debt placements and transitory situation such as:
| i. | Demand deposits increased from Ch$3,863.1 billion in 1Q 2015 to Ch$4,068.5 billion in 2Q 2015 due to higher surety bonds related to the renewal of the tender process of student loans guaranteed by the Chilean state. This situation is transitory and should be reversed during 3Q 2015. |
During the last twelve months we successfully placed two senior notes in local and international markets. On September 23th, 2014 CorpBanca placed US$750 million aggregate principal amount of 3.875% Senior Notes in the international market, primarily to fund lending activities. Between May and June 2015, we issued Ch$42.0 billion and UF 1.13 billion senior notes in local market, to refinance part of debt maturity profile and fund growth.

Consolidated Shareholders’ Equity and Regulatory Capital
| Quarter ended | Change (%) | |||||
| (Expressed in million of Chilean peso) | Jun-15 | Mar-15 | Jun-14 | Jun-15/ Jun-14 | Jun-15/ Mar-15 | |
| Equity | ||||||
| Capital | 781,559 | 781,559 | 781,559 | 0.0% | 0.0% | |
| Reserves | 515,618 | 515,618 | 515,618 | 0.0% | 0.0% | |
| Valuation adjustment | (130,891) | (149,718) | 50,963 | - | -12.6% | |
| Retained Earnings | ||||||
| Retained earnings or prior periods | - | 239,860 | 126,730 | -100.0% | -100.0% | |
| Income for the period | 96,217 | 39,689 | 105,405 | -8.7% | 142.4% | |
| Minus: Provision for mandatory dividend | (48,108) | (19,845) | (52,703) | -8.7% | 142.4% | |
| Attributable to Bank shareholders | 1,214,395 | 1,407,163 | 1,527,572 | -20.5% | -13.7% | |
| Non-controlling interest | 328,331 | 315,600 | 347,116 | -5.4% | 4.0% | |
| Total Equity | 1,542,726 | 1,722,763 | 1,874,688 | -17.7% | -10.5% | |
Quarterly RoAE (1) | 14.1% | 9.5% | 14.6% | |||
YTD RoAE(1) | 12.2% | 9.5% | 12.2% | |||
(1) Annualized figures
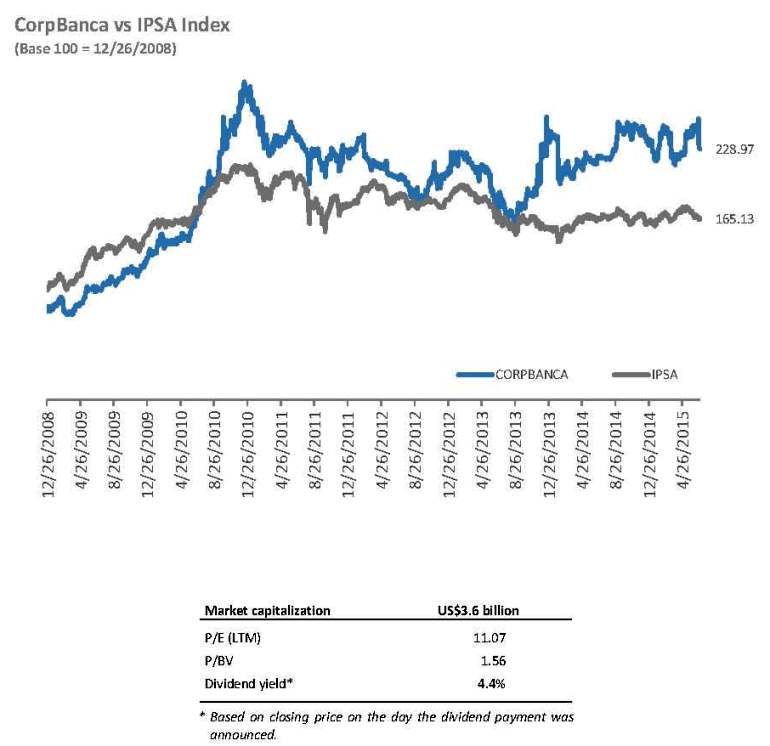
As of June 30, 2015, according to the SBIF, CorpBanca was the fourth largest private bank in Chile, based on equity (Ch$1,543 billion, or US$2,416 billion, as of June 30, 2015). Following a capital increase of 47,000,000,000 common shares during 1Q 2013, we had 340,358,194.2 thousand shares outstanding and a market capitalization of Ch$2,402.3 billion, or US$3.76 billion, (based on a share price of Ch$7.058 peso per share) as of June 30, 2015.
During the last two years we successfully increased twice our capital base which allowed us to fund our investments in Colombia and growth, though temporally impacted our RoEs. In 2012 we raised capital in the aggregate amount of Ch$268.75 billion or US$533 million, for the acquisition of Banco Santander Colombia. In 2013 we raised capital in the aggregate amount of US$623 million for the acquisition of Helm Bank in Colombia. During the last capital increase investment funds of the International Finance Corporation, or IFC, a member of the World Bank Group, acquired a 5% equity interest in CorpBanca, pursuant to an investment agreement with CorpGroup, Compañía Inmobiliaria y de Inversiones Saga SpA, and CorpGroup Inversiones Bancarias Ltda.
In 2Q 2015 total equity decreased by Ch$331.96 billion compared to 1Q 2015, mainly due to special dividend provision.
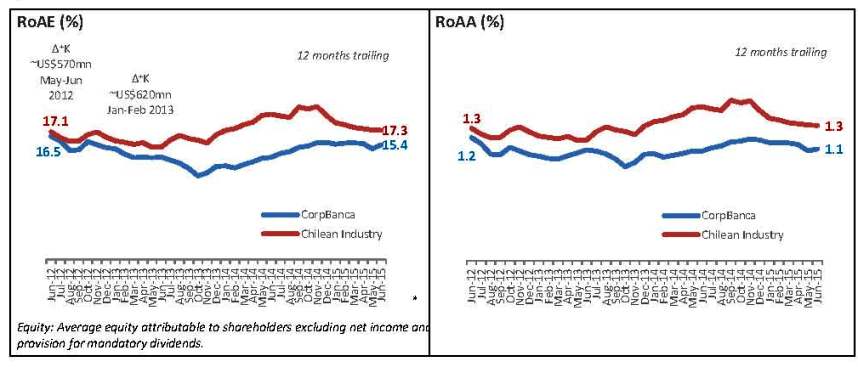
The trend in our returns on average asset (RoAA) and on average equity have (RoAE) changed since December 2013. This shift was the result of (i) consolidation of CorpBanca Colombia for a full year since 2013 and of Helm

Bank for a full year since 2014; and (ii) the higher UF variation in 2014 (Δ+2.05% in 2013 vs. Δ+5.65% in 2014) along with low monetary policy interest rate in Chile. During 2Q 2015 RoAE remained stable compared to December 2014 and the industry average.
In 2Q 2015 we achieved a return on average equity (RoAE*) of 15.4%, equivalent to an increase of 169 bp compared to 13.7% in 2Q 2014. After being impacted by the capital injections to enable our organic growth in Chile and our acquisitions in Colombia, between third quarter of 2011 and fourth quarter 2013 -totaling approximately US$1.57 billion (a 137.1% increase over the same time period), our RoAEs have been recovering showing the early stages of the ongoing merger process in Colombia .

Our 2Q 2015 returns demonstrated that greater business diversification has resulted in an increasing revenue stream as well as our focus on profitability.
| Quarter ended | Change (%) | |||||
| (Expressed in million of Chilean peso) | Jun-15 | Mar-15 | Jun-14 | Jun-15/ Jun-14 | Jun-15/ Mar-15 | |
| TIER I Capital (Core Capital) | 1,214,395 | 1,407,163 | 1,527,572 | -20.5% | -13.7% | |
| TIER II Capital | 479,782 | 622,211 | 629,093 | -23.7% | -22.9% | |
| Regulatory Capital | 1,694,177 | 2,029,374 | 2,156,665 | -21.4% | -16.5% | |
| Risk Weighted Assets | 17,442,229 | 17,149,965 | 16,952,331 | 2.9% | 1.7% | |
| TIER I (Core Capital) Ratio | 7.0% | 8.2% | 9.0% | |||
| BIS Ratio | 9.7% | 11.8% | 12.7% | |||
On January 29, 2014 Itaú Unibanco, Banco Itaú Chile, CorpBanca and CorpGroup entered into an agreement, involving:
| i. | The merger of Banco Itaú Chile and CorpBanca, creating Itaú CorpBanca |
| ii. | Itaú Unibanco will control Itaú CorpBanca |
| iii. | Itaú Unibanco and CorpGroup will sign a Shareholders’ Agreement |
| iv. | Itaú CorpBanca will control CorpBanca’s and Itaú Unibanco’s Colombian entities |
| v. | CorpBanca to be the surviving legal entity |
On June 26 and 30, 2015, CorpBanca and Banco Itaú Chile Extraordinary Shareholders Meetings (EGM) approved the proposed merger and agreed to modify the aforementioned agreement, involving:
| i. | Special dividend for current CorpBanca’s shareholders in amount of US$400 million, from which on July 1, 2015 were paid Ch$239.86 billion (the pending UF 124,105 will be paid at time of 2016 AGM) |
| ii. | Reduction of Itaú Chile 2014 dividend by Ch$16.4 billion |
| iii. | New dividend policy for 2015 fiscal year |
| iv. | Extension of the deadline for the purchase of CorpGroup’s stake in CorpBanca Colombia |
| v. | Closing date between January 1, 2016 and May 2, 2016 |
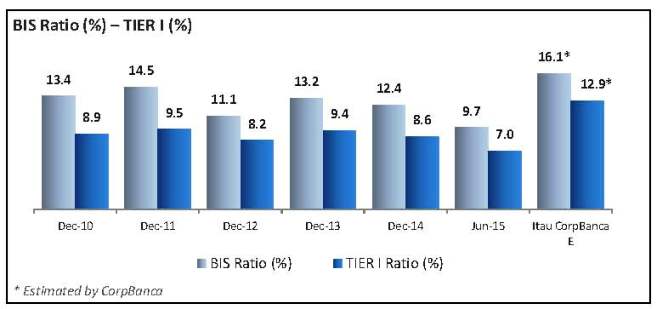
Following the approval of both EGM, a special dividend provision in the amount of Ch$239.86 billion was issued on June 30, 2015. In that specific context, our Capital ratios decreased from 11.8% in 1Q 2015 to 9.7% in 2Q 2015, as the result of the aforementioned provision that impacted regulatory capital combined with higher risk weighted assets due to loan growth during the second quarter.
Once the merger is consummated the combined capital ratios will improve significantly, boosted by US$552 million capital injection prior to the merger from Banco Itaú Chile. Furthermore the shareholders’ agreement with Itaú Unibanco has a strict policy regarding minimum capital levels of the merged bank, requiring the maximum between 1.2x above the regulatory minimum and the average of the three largest banks. CorpBanca estimates that the combined BIS Ratio should achieve a range between 15%-16% along with a TIER one Ratio between 12% and 13%.
Therefore, the capital ratios reported on June 2015 are temporary and limited to the period ending with the merger that will occur no later than May 2, 2016.
IV) Ownership Structure and Share Performance
Ownership structure
As of June 30, 2015, CorpBanca was controlled by Corp Group Banking S.A. and other companies related to Mr. Alvaro Saieh and his family:
| Stock Holder | % of Total Share Capital |
| Corp Group Banking S.A. | 43.73% |
Cía. Inmob. y de Inversiones Saga SpA(1) | 6.15% |
| Total Saieh Group | 49.88% |
| IFC | 5.00% |
| Sierra Nevada Investment Chile Dos Ltda. (Santo Domingo Group) | 2.88% |
| Others | 42.24% |
| ADRs holders and Foreign investors | 20.51% |
| Securities Brokerage | 8.37% |
| Insurance Companies | 2.61% |
| AFPs (Administradoras de Fondos de Pensiones) | 1.31% |
Other minority shareholders(2) | 9.45% |
| Total | 100.00% |
| (1) Includes 926,513,842 shares owned by Saga that are under custody. |
| (2) Includes Moneda’s funds, with a total of 3.06% ownership. |

ADR Price Evolution and Local Share Price Evolution


Dividends
The following table shows dividends per share distributed during the past five years:
| Charged to Fiscal Year | Year paid | Net Income (Ch$mn) | % Distributed | Distributed Income (Ch$mn) | Peso per Share (Ch$ of each year) | ||||||||||||
| 2010 | 2011 | 119,043 | 100% | 119,043 | 0.5246280300 | ||||||||||||
| 2011 | 2012 | 122,849 | 100% | 122,849 | 0.4906940357 | ||||||||||||
| 2012 | 2013 | 120,080 | 50% | 60,040 | 0.1764023878 | ||||||||||||
| 2013 | 2014 | 155,093 | 57% | 88,403 | 0.2597360038 | ||||||||||||
| 2014 | 2015 | 226,093 | 50% | 113,047 | 0.3321397925 | ||||||||||||
CorpBanca paid its annual dividend of Ch$0.3321397925/share in Chile on March, 13, 2015, equivalent to a payout ratio of 50% and to a dividend yield of 4.4%, as well as an increase of 27.9% compared to the dividend paid in 2014.

V) Credit Risk Ratings
International credit risk ratings
On a global scale, CorpBanca is rated by two world-wide recognized agencies: Moody´s Investors Service and Standard & Poor´s Ratings Services (S&P).
On June 15, 2015, Moody´s Investors Service (Moody’s) affirmed its rating review for ‘possible upgrade’, on the long and short term ratings of CorpBanca. On placing the ratings of CorpBanca on ‘review for upgrade’, Moody’s noted the benefits a change of control with respect to the merged bank could have on CorpBanca’s funding flexibility, margins, and capital.
| Moody´s | Rating |
| Long-term foreign currency deposits | Baa3 |
| Short-term foreign currency deposits | Prime-3 |
| Bank financial strength | D+ |
| Outlook | Review for upgrade |
On September 4, 2014, Standard & Poor´s Ratings Services (S&P) affirmed the ratings on CorpBanca and the ‘Watch Developing’ as consequence of the merger agreement with Itaú Chile. The creditwatch developing listing reflected the potential impact of the merger on the ratings of CorpBanca and S&P’s assessment of Itaú-CorpBanca’s capital, business position, funding and liquidity, and the nature and strength of external support (either from government or group support) that this new entity may receive.
| Standard & Poor´s | Rating |
| Long-term issuer credit rating | BBB |
| Short-term issuer credit rating | A-2 |
| CreditWatch | Developing |
Local Credit risk ratings
On a national scale, CorpBanca is rated by Feller Rate, International Credit Rating Chile and Humphreys.
On June 8, 2015, Feller Rate affirmed the ratings on CorpBanca following the announcement of the merger agreement with Itaú Chile. The outlook was confirmed as ‘Stable’, reflecting Feller Rate’s assessment that both banks will be successful in the integration process and that the new bank will benefit from (i) a strengthening competitive position, both locally and regionally; and (ii) significant synergies in the medium term.
| Feller Rate | Rating |
| Long-term issuer credit rating | AA |
| Senior unsecured bonds | AA |
| Subordinated bonds | AA- |
| Short-term issuer credit rating | Nivel 1+ |
| Shares | 1ª Clase Nivel 1 |
| Outlook | Stable |
On June 10, 2015, International Credit Rating Chile (ICR) affirmed CorpBanca’s ‘AA’ ratings on long term debt, ‘AA-’ rating on subordinated debt, ‘Nivel 1+’ on short term deposits and ‘Primera Clase Nivel 1’ rating on shares, and its ‘Developing’ outlook, in light of the fact that the merger between CorpBanca and Itaú Chile is still subject to regulatory and shareholders’ approval.

| ICR | Rating |
| Long-term issuer credit rating | AA |
| Senior unsecured bonds | AA |
| Subordinated bonds | AA- |
| Short-term issuer credit rating | Nivel 1+ |
| Shares | 1ª Clase Nivel 1 |
| Outlook | Developing |
On June 24, 2015, Humphreys affirmed CorpBanca’s ‘AA’ ratings on long term deposit and senior unsecured debt, ‘Nivel 1+’ ratings on short term deposit and ‘AA-’ ratings on long term subordinated debt and the outlook is considered ‘Stable’.
| Humphreys | Rating |
| Long-term issuer credit rating | AA |
| Senior unsecured bonds | AA |
| Subordinated bonds | AA- |
| Short-term issuer credit rating | Nivel 1+ |
| Shares | 1ª Clase Nivel 1 |
| Outlook | Stable |

VI) Quarterly Consolidated Income Statements (unaudited)
| For the three months ended | Change (%) | |||||||||||||||||||||||
| Jun-15 | Jun-15 | Mar-15 | Jun-14 | Jun.15/Jun.14 | Jun.15/Mar.15 | |||||||||||||||||||
US$ thousand | Ch$ million | |||||||||||||||||||||||
| Interest income | 552,219 | 352,575 | 268,976 | 347,260 | 1.5 | % | 31.1 | % | ||||||||||||||||
| Interest expense | (278,915 | ) | (178,079 | ) | (143,774 | ) | (184,299 | ) | -3.4 | % | 23.9 | % | ||||||||||||
| Net interest income | 273,303 | 174,496 | 125,202 | 162,961 | 7.1 | % | 39.4 | % | ||||||||||||||||
| Fee and commission income | 81,698 | 52,162 | 47,786 | 54,293 | -3.9 | % | 9.2 | % | ||||||||||||||||
| Fee and commission expense | (18,980 | ) | (12,118 | ) | (11,207 | ) | (9,339 | ) | 29.8 | % | 8.1 | % | ||||||||||||
| Net fee and commission income | 62,719 | 40,044 | 36,579 | 44,954 | -10.9 | % | 9.5 | % | ||||||||||||||||
| Net income from financial operations | 83,183 | 53,110 | 67,528 | 50,697 | 4.8 | % | -21.4 | % | ||||||||||||||||
| Foreign exchange profit (loss), net | (33,848 | ) | (21,611 | ) | (17,793 | ) | (13,588 | ) | 59.0 | % | 21.5 | % | ||||||||||||
| Total financial transactions, net | 49,335 | 31,499 | 49,735 | 37,109 | -15.1 | % | -36.7 | % | ||||||||||||||||
| Other operating income | (10,473 | ) | (6,687 | ) | 8,559 | 112 | - | - | ||||||||||||||||
| Net operating profit before loan losses | 374,884 | 239,352 | 220,075 | 245,136 | -2.4 | % | 8.8 | % | ||||||||||||||||
Provision for loan losses (1) | (68,813 | ) | (43,935 | ) | (38,970 | ) | (33,602 | ) | 30.8 | % | 12.7 | % | ||||||||||||
| Net operating profit | 306,071 | 195,417 | 181,105 | 211,534 | -7.6 | % | 7.9 | % | ||||||||||||||||
| Personnel salaries and expenses | (79,714 | ) | (50,895 | ) | (50,202 | ) | (56,359 | ) | -9.7 | % | 1.4 | % | ||||||||||||
| Administrative expenses | (80,187 | ) | (51,197 | ) | (51,561 | ) | (49,894 | ) | 2.6 | % | -0.7 | % | ||||||||||||
| Depreciation and amortization | (16,998 | ) | (10,853 | ) | (10,806 | ) | (13,572 | ) | -20.0 | % | 0.4 | % | ||||||||||||
| Impairment | (36 | ) | (23 | ) | (11 | ) | - | - | 109.1 | % | ||||||||||||||
| Operating expenses | (176,935 | ) | (112,968 | ) | (112,580 | ) | (119,825 | ) | -5.7 | % | 0.3 | % | ||||||||||||
| Operating income | 129,135 | 82,449 | 68,525 | 91,709 | -10.1 | % | 20.3 | % | ||||||||||||||||
| Income from investments in other companies | 553 | 353 | 907 | 781 | -54.8 | % | -61.1 | % | ||||||||||||||||
| Income before taxes | 129,688 | 82,802 | 69,432 | 92,490 | -10.5 | % | 19.3 | % | ||||||||||||||||
| Income tax expense | (30,285 | ) | (19,336 | ) | (22,239 | ) | (19,419 | ) | -0.4 | % | -13.1 | % | ||||||||||||
| Net income from ordinary activities | 99,403 | 63,466 | 47,193 | 73,071 | -13.1 | % | 34.5 | % | ||||||||||||||||
| Net income from discontinued operations | - | - | - | - | - | - | ||||||||||||||||||
| Net income attributable to: | ||||||||||||||||||||||||
| Minority interest | (10,867 | ) | (6,938 | ) | (7,504 | ) | (7,815 | ) | -11.2 | % | -7.5 | % | ||||||||||||
| Net income attributable to shareholders | 88,537 | 56,528 | 39,689 | 65,256 | -13.4 | % | 42.4 | % | ||||||||||||||||
(1) Includes provision for contingent loans and net of loan loss recoveries.

VII) Consolidated Balance Sheet (unaudited)
| As of the three months ended | Change (%) | |||||||||||||||||||||||
| Jun-15 | Jun-15 | Mar-15 | Jun-14 | Jun-15/Jun-14 | Jun-15/Mar-15 | |||||||||||||||||||
| US$ thousand | Ch$ million | |||||||||||||||||||||||
| Assets | ||||||||||||||||||||||||
| Cash and deposits in banks | 1,902,573 | 1,214,736 | 869,925 | 1,006,475 | 20.7 | % | 39.6 | % | ||||||||||||||||
| Unsettled transactions | 573,690 | 366,284 | 419,550 | 356,744 | 2.7 | % | -12.7 | % | ||||||||||||||||
| Trading investments | 635,865 | 405,981 | 543,155 | 497,366 | -18.4 | % | -25.3 | % | ||||||||||||||||
| Available-for-sale investments | 2,377,264 | 1,517,812 | 1,214,300 | 627,449 | 141.9 | % | 25.0 | % | ||||||||||||||||
| Held-to-maturity investments | 440,420 | 281,195 | 203,357 | 258,069 | 9.0 | % | 38.3 | % | ||||||||||||||||
| Investments under resale agreements | 113,385 | 72,393 | 103,492 | 198,415 | -63.5 | % | -30.0 | % | ||||||||||||||||
| Financial derivatives contracts | 1,362,180 | 869,711 | 876,133 | 581,755 | 49.5 | % | -0.7 | % | ||||||||||||||||
| Interbank loans, net | 751,367 | 479,725 | 466,511 | 505,480 | -5.1 | % | 2.8 | % | ||||||||||||||||
| Loans and accounts receivable from customers | 23,087,506 | 14,740,680 | 14,400,830 | 14,602,491 | 0.9 | % | 2.4 | % | ||||||||||||||||
| Loan loss allowances | (536,547 | ) | (342,569 | ) | (316,070 | ) | (329,084 | ) | 4.1 | % | 8.4 | % | ||||||||||||
| Loans and accounts receivable from customers, net of loan loss allowances | 22,550,959 | 14,398,111 | 14,084,760 | 14,273,408 | 0.9 | % | 2.2 | % | ||||||||||||||||
| Investments in other companies | 24,458 | 15,616 | 15,364 | 16,170 | -3.4 | % | 1.6 | % | ||||||||||||||||
| Intangible assets | 1,139,093 | 727,277 | 716,449 | 887,645 | -18.1 | % | 1.5 | % | ||||||||||||||||
| Property, plant and equipment | 144,044 | 91,968 | 90,304 | 100,366 | -8.4 | % | 1.8 | % | ||||||||||||||||
| Current taxes | 46,173 | 29,480 | 2,700 | - | - | 991.9 | % | |||||||||||||||||
| Deferred taxes | 191,804 | 122,461 | 115,264 | 94,124 | 30.1 | % | 6.2 | % | ||||||||||||||||
| Other assets | 517,382 | 330,333 | 329,518 | 275,886 | 19.7 | % | 0.2 | % | ||||||||||||||||
| Total Assets | 32,770,660 | 20,923,083 | 20,050,782 | 19,679,351 | 6.3 | % | 4.4 | % | ||||||||||||||||
| Liabilities | ||||||||||||||||||||||||
| Deposits and other demand liabilities | 6,372,293 | 4,068,518 | 3,863,103 | 4,170,880 | -2.5 | % | 5.3 | % | ||||||||||||||||
| Unsettled transactions | 456,194 | 291,266 | 350,929 | 328,697 | -11.4 | % | -17.0 | % | ||||||||||||||||
| Investments sold under repurchase agreements | 925,774 | 591,079 | 429,097 | 296,380 | 99.4 | % | 37.7 | % | ||||||||||||||||
| Time deposits and other time liabilities | 12,999,748 | 8,299,949 | 8,142,065 | 7,897,235 | 5.1 | % | 1.9 | % | ||||||||||||||||
| Financial derivatives contracts | 994,874 | 635,197 | 661,858 | 454,086 | 39.9 | % | -4.0 | % | ||||||||||||||||
| Interbank borrowings | 2,331,104 | 1,488,340 | 1,354,153 | 1,498,473 | -0.7 | % | 9.9 | % | ||||||||||||||||
| Issued debt instruments | 4,921,631 | 3,142,314 | 3,012,483 | 2,650,881 | 18.5 | % | 4.3 | % | ||||||||||||||||
| Other financial liabilities | 22,823 | 14,572 | 14,479 | 15,220 | -4.3 | % | 0.6 | % | ||||||||||||||||
| Current taxes | - | - | - | 8,485 | -100.0 | % | - | |||||||||||||||||
| Deferred taxes | 292,184 | 186,551 | 176,654 | 192,840 | -3.3 | % | 5.6 | % | ||||||||||||||||
| Provisions | 231,052 | 147,520 | 113,598 | 172,917 | -14.7 | % | 29.9 | % | ||||||||||||||||
| Other liabilities | 806,696 | 515,051 | 209,600 | 118,569 | 334.4 | % | 145.7 | % | ||||||||||||||||
| Total Liabilities | 30,354,374 | 19,380,357 | 18,328,019 | 17,804,663 | 8.8 | % | 5.7 | % | ||||||||||||||||
| Equity | - | - | ||||||||||||||||||||||
| Capital | 1,224,112 | 781,559 | 781,559 | 781,559 | 0.0 | % | 0.0 | % | ||||||||||||||||
| Reserves | 807,584 | 515,618 | 515,618 | 515,618 | 0.0 | % | 0.0 | % | ||||||||||||||||
| Valuation adjustment | (205,007 | ) | (130,891 | ) | (149,718 | ) | 50,963 | - | -12.6 | % | ||||||||||||||
| Retained Earnings: | ||||||||||||||||||||||||
| Retained earnings or prior periods | - | - | 239,860 | 126,730 | -100.0 | % | -100.0 | % | ||||||||||||||||
| Income for the period | 150,699 | 96,217 | 39,689 | 105,405 | -8.7 | % | 142.4 | % | ||||||||||||||||
| Minus: Provision for mandatory dividend | (75,349 | ) | (48,108 | ) | (19,845 | ) | (52,703 | ) | -8.7 | % | 142.4 | % | ||||||||||||
| Attributable to bank shareholders | 1,902,039 | 1,214,395 | 1,407,163 | 1,527,572 | -20.5 | % | -13.7 | % | ||||||||||||||||
| Non-controlling interest | 514,247 | 328,331 | 315,600 | 347,116 | -5.4 | % | 4.0 | % | ||||||||||||||||
| Total Equity | 2,416,286 | 1,542,726 | 1,722,763 | 1,874,688 | -17.7 | % | -10.5 | % | ||||||||||||||||
| Total Equity and Liabilities | 32,770,660 | 20,923,083 | 20,050,782 | 19,679,351 | 6.3 | % | 4.4 | % | ||||||||||||||||

VIII) Quarterly Consolidated Evolution Selected Performance Ratios (unaudited)
| As of and for the three months ended | ||||||||||||||||||||
| Jun-14 | Sep-14 | Dec-14 | Mar-14 | Jun-15 | ||||||||||||||||
| Profitability | ||||||||||||||||||||
Net interest income / Avg. interest-earning assets(1)(2) (NIM LTM) | 4.39 | % | 3.95 | % | 4.12 | % | 3.89 | % | 3.77 | % | ||||||||||
Net interest income / Avg. interest-earning assets(1)(2) (NIM annualized) | 4.22 | % | 3.74 | % | 4.03 | % | 3.09 | % | 4.23 | % | ||||||||||
Net operating profit before loan losses / Avg. total assets(1) | 5.04 | % | 4.98 | % | 4.81 | % | 4.36 | % | 4.67 | % | ||||||||||
Net operating profit before loan losses / Avg. interest-earning assets(1)(2) | 6.35 | % | 6.17 | % | 6.00 | % | 5.43 | % | 5.80 | % | ||||||||||
RoAA (before taxes), over Avg. total assets(1) | 1.90 | % | 1.92 | % | 1.54 | % | 1.37 | % | 1.62 | % | ||||||||||
RoAA (before taxes), over Avg. interest-earning assets(1)(2) | 2.40 | % | 2.38 | % | 1.92 | % | 1.71 | % | 2.01 | % | ||||||||||
RoAE (before taxes)(1)(3) | 21.62 | % | 22.86 | % | 20.32 | % | 17.97 | % | 21.64 | % | ||||||||||
RoAA, over Avg. total assets(1) | 1.50 | % | 1.31 | % | 1.54 | % | 0.93 | % | 1.24 | % | ||||||||||
RoAA, over Avg. interest-earning assets(1)(2) | 1.89 | % | 1.62 | % | 1.91 | % | 1.16 | % | 1.54 | % | ||||||||||
RoAE(1)(3) | 14.63 | % | 11.97 | % | 15.20 | % | 9.46 | % | 14.14 | % | ||||||||||
| Efficiency | ||||||||||||||||||||
Operating expenses / Avg. total assets(1) | 2.46 | % | 2.56 | % | 2.44 | % | 2.23 | % | 2.21 | % | ||||||||||
Operating expenses/ Avg. total loans(1) | 3.41 | % | 3.53 | % | 3.46 | % | 3.15 | % | 3.10 | % | ||||||||||
| Operating expenses / Operating revenues | 48.88 | % | 51.41 | % | 50.20 | % | 51.15 | % | 47.19 | % | ||||||||||
| Capitalization | ||||||||||||||||||||
TIER I (Core capital) Ratio(4) | 9.01 | % | 8.91 | % | 8.64 | % | 8.21 | % | 6.96 | % | ||||||||||
BIS Ratio(4) | 12.72 | % | 12.59 | % | 12.39 | % | 11.83 | % | 9.71 | % | ||||||||||
| Shareholders’ equity / Total assets | 9.53 | % | 9.27 | % | 8.68 | % | 8.59 | % | 7.37 | % | ||||||||||
| Shareholders’ equity / Total liabilities | 10.53 | % | 10.21 | % | 9.51 | % | 9.40 | % | 7.96 | % | ||||||||||
| Market information (period-end) | ||||||||||||||||||||
| Diluted Earnings per share before taxes (Ch$ per share) | 0.2717 | 0.2844 | 0.2312 | 0.2040 | 0.2433 | |||||||||||||||
| Diluted Earnings per ADR before taxes (US$ per ADR) | 0.7374 | 0.7137 | 0.5728 | 0.4904 | 0.5716 | |||||||||||||||
| Diluted Earnings per share (Ch$ per share) | 0.1917 | 0.1606 | 0.1945 | 0.1166 | 0.1661 | |||||||||||||||
| Diluted Earnings per ADR (US$ per ADR) | 0.5202 | 0.4030 | 0.4819 | 0.2803 | 0.3902 | |||||||||||||||
Total Shares Outstanding (Thousands)(4) | 340,358,194,2 | 340,358,194,2 | 340,358,194,2 | 340,358,194,2 | 340,358,194,2 | |||||||||||||||
| Ch$ exchange rate for US$1.0 | 552.81 | 597.66 | 605.48 | 623.96 | 638.47 | |||||||||||||||
| COP exchange rate for Ch$1.0 | 0.2945 | 0.2953 | 0.2532 | 0.2405 | 0.2454 | |||||||||||||||
| Quarterly UF variation | 1.75 | % | 0.60 | % | 1.89 | % | -0.02 | % | 1.46 | % | ||||||||||
Monetary Policy Interest Rate(5) | 4.00 | % | 3.25 | % | 3.00 | % | 3.00 | % | 3.00 | % | ||||||||||
(1) Annualized figures when appropriate.
(2) Interest-earning assets: Total loans and financial investments.
(3) Equity: Average equity attributable to shareholders excluding net income and accrual for mandatory dividends.
(4) During the second and first quarters 2012 and 2013, respectively, the bank increased its capital base.
(5) As of the close of the month.

| As of and for the three months ended | |||||
| Jun-14 | Sep-14 | Dec-14 | Mar-15 | Jun-15 | |
| Asset quality | |||||
| Risk Index (Loan loss allowances / Total loans ) | 2.25% | 2.27% | 2.25% | 2.19% | 2.32% |
Prov. for loan losses / Avg. total loans(1) | 0.96% | 0.70% | 1.19% | 1.09% | 1.21% |
Prov. for loan losses / Avg. total assets(1) | 0.69% | 0.51% | 0.84% | 0.77% | 0.86% |
| Prov. for loan losses / Net operating profit before loans losses | 13.7% | 10.2% | 17.4% | 17.7% | 18.4% |
| Prov. for loan losses / Net income | 46.0% | 38.9% | 54.5% | 82.6% | 69.2% |
PDL / Total loans(2) | 0.46% | 0.46% | 0.70% | 0.60% | 0.00% |
| Coverage PDLs | 490.2% | 498.4% | 322.4% | 363.2% | 0.0% |
NPL / Total loans(3) | 1.02% | 1.12% | 1.33% | 1.25% | 1.28% |
| Coverage NPLs | 225.71% | 205.63% | 172.42% | 179.03% | 184.86% |
| Total NPLs | 141,962 | 160,294 | 179,364 | 169,329 | 178,508 |
| NPLs Chile | 92,788 | 102,143 | 125,686 | 119,247 | 116,834 |
| NPLs Colombia | 49,174 | 58,151 | 53,678 | 50,082 | 61,674 |
| Total Loans | 13,917,125 | 14,282,941 | 13,510,286 | 13,572,250 | 13,962,608 |
| Loans Chile | 8,279,361 | 8,297,480 | 8,519,808 | 8,652,136 | 8,748,718 |
| Loans Colombia | 5,637,764 | 5,985,460 | 4,990,477 | 4,920,114 | 5,213,890 |
| Total NPLs / Total Loans | 1.02% | 1.12% | 1.33% | 1.25% | 1.28% |
| NPLs Chile / Loans Chile | 1.12% | 1.23% | 1.48% | 1.38% | 1.34% |
| NPLs Colombia / Loans Colombia | 0.87% | 0.97% | 1.08% | 1.02% | 1.18% |
| Total LLR | 320,420 | 329,610 | 309,257 | 303,150 | 329,989 |
| LLR Chile | 114,622 | 112,624 | 117,968 | 113,212 | 118,733 |
| LLR Colombia | 205,798 | 216,985 | 191,289 | 189,938 | 211,255 |
| Coverage Total NPL | 225.71% | 205.63% | 172.42% | 179.03% | 184.86% |
| Coverage NPL Chile | 123.53% | 110.26% | 93.86% | 94.94% | 101.63% |
| Coverage NPL Colombia | 418.51% | 373.14% | 356.37% | 379.25% | 342.53% |
| Total Write-offs | 29,519 | 28,782 | 19,797 | 28,411 | 26,981 |
| Write-offs Chile | 9,618 | 11,076 | 9,537 | 10,861 | 11,253 |
| Write-offs Colombia | 19,901 | 17,706 | 10,260 | 17,550 | 15,728 |
(1) Annualized figures when appropriate.
(2) PDL: Past due loans; all installments that are more than 90 days overdue.
(3) NPL: Non-performing loans; full balance of loans with one installment 90 days or more overdue.

IX) General Information
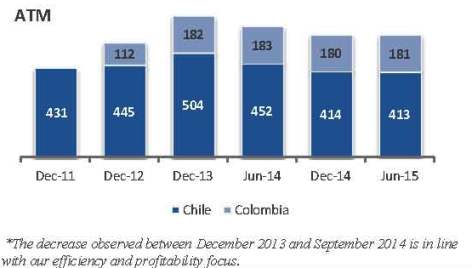
 | Our distribution network in Chile provides integrated financial services and products to our customers through diverse channels, including ATMs, traditional branches, internet banking and telephone banking. As of June 30, 2015, we operated 127 branch offices in Chile, which included 70 branches operating under the brand CorpBanca, one operating in New York and 56 branches operating under the Banco Condell brand -our consumer finance division-, in each case fully customized to attend our customer needs. In addition, as of June 30, 2015, we owned and operated 413 ATMs in Chile, and our customers had access to over 8,022 ATMs in Chile through our agreement with Redbanc. We utilize a number of different sales channels including account executives, sales forces and the internet to attract potential new clients. Our branch system serves as the main delivery network for our full range of products and services. As of June 30, 2015, CorpBanca Colombia operated 178 branches and owned and operated 181 ATMs, while providing its customers with access to over 14,424 ATMs through Colombia’s financial institutions. CorpBanca Colombia also utilizes a number of different sales channels including account executives, telemarketing and internet banking to attract potential new clients. CorpBanca Colombia’s branch systems serve as the main distribution network for its full range of products and services. As of June 30, 2015, we had a headcount of 3,790 employees in Chile, 3,724 employees in Colombia (including Panama) and 19 employees in the United States. |
 | |
 |

CAUTION REGARDING FORWARD-LOOKING STATEMENTS
This press release contains forward-looking statements. Forward-looking information is often, but not always, identified by the use of words such as “anticipate”, “believe”, “expect”, “plan”, “intend”, “forecast”, “target”, “project”, “may”, “will”, “should”, “could”, “estimate”, “predict” or similar words suggesting future outcomes or language suggesting an outlook. These forward-looking statements include, but are not limited to, statements regarding benefits of the pending Itaú Chile-CorpBanca’s merger, integration plans and expected synergies, the expected timing of completion of the transaction, anticipated future financial and operating performance and results, including estimates for growth, as well as risks and benefits of changes in law, including the New Tax Law. These statements are based on the current expectations of CorpBanca’s management. There are a number of risks and uncertainties that could cause actual results to differ materially from the forward-looking statements included in this communication. For example, (1) CorpBanca and Itaú Unibanco may be unable to obtain shareholder approvals required for the merger; (2) CorpBanca and Itaú Unibanco may be unable to obtain regulatory approvals required for the merger, or required regulatory approvals may delay the merger or result in the imposition of conditions that could have a material adverse effect on the combined company or cause CorpBanca and Itaú Unibanco to abandon the merger; (3) conditions to the closing of the merger may not be satisfied; (4) an unsolicited offer of another company to acquire assets or capital stock of Itaú Unibanco or CorpBanca could interfere with the merger; (5) problems may arise in successfully integrating the businesses of CorpBanca and Itaú Unibanco, which may result in the combined company not operating as effectively and efficiently as expected; (6) the combined company may be unable to achieve cost-cutting synergies or it may take longer than expected to achieve those synergies; (7) the credit ratings of the combined company or its subsidiaries may be different from what CorpBanca and Itaú Unibanco expect; (8) the businesses of CorpBanca and Itaú Unibanco may suffer as a result of uncertainty surrounding the merger; (9) the industry may be subject to future regulatory or legislative actions that could adversely affect CorpBanca and Itaú Unibanco; and (10) CorpBanca and Itaú Unibanco may be adversely affected by other economic, business, and/or competitive factors. Forward-looking statements and information are based on current beliefs as well as assumptions made by and information currently available to CorpBanca’s management. Although management considers these assumptions to be reasonable based on information currently available to it, they may prove to be incorrect. By their very nature, forward-looking statements involve inherent risks and uncertainties, both general and specific, and risks that predictions, forecasts, projections and other forward-looking statements will not be achieved. We caution readers not to place undue reliance on these statements as a number of important factors could cause the actual results to differ materially from the beliefs, plans, objectives, expectations and anticipations, estimates and intentions expressed in such forward-looking statements. More information on potential factors that could affect CorpBanca’s financial results is included from time to time in the “Risk Factors” section of CorpBanca’s Annual Report on Form 20-F for the fiscal year ended December 31, 2014, filed with the SEC. Furthermore, the forward-looking statements contained in this press release are made as of the date of this press release and CorpBanca does not undertake any obligation to update publicly or to revise any of the included forward-looking statements, whether as a result of new information, future events or otherwise. The forward-looking statements contained in this press release are expressly qualified by this cautionary statement.

| CONTACT INFORMATION: |
| Eugenio Gigogne |
| CFO, CorpBanca |
| Santiago, Chile |
| Phone: (562) 2660-2555 |
| IR@corpbanca.cl |
| Claudia Labbé |
| Head of Investor Relations, CorpBanca |
| Santiago, Chile |
| Phone: (562) 2660-2555 |
| claudia.labbe@corpbanca.cl |
| Nicolas Bornozis |
| President, Capital Link |
| New York, USA |
| Phone: (212) 661-7566 |
| nbornozis@capitallink.com |