Exhibit 99.3

CORPBANCA ANNOUNCES FOURTH QUARTER 2009 RESULTS
Santiago, Chile, February 10, 2010 CORPBANCA (NYSE: BCA), a Chilean financial institution offering a wide variety of corporate and retail financial products and services, today announced its financial results for the fourth quarter ended December 31, 2009. This report is based on unaudited consolidated financial statements and prepared in accordance with Chilean generally accepted accounting principles. Solely for the convenience of the reader, U.S. dollar amounts in this report have been translated from Chilean nominal pesos at our December 31, 2009 exchange rate of Ch$507,52 per U.S. dollar.
Financial highlights
| • | Net income for the fourth quarter of 2009 reached Ch$26.2 billion, an increase of Ch$2 billion when compared to the prior quarter. |
| • | Provision for loan losses during 4Q09 amounted to Ch$11.3 billion, a decrease of Ch$7.8 billion when compared to the prior quarter. |
| • | Total operating expenses increased 25% when compared to the prior quarter. |
| • | Financial investments totalled Ch$813,3 billion as of December 31, 2009, representing a quarter-on-quarter increase of 40%. |
Press Release
February 10, 2010
Page 2 / 12
Management’s Discussion and Analysis
I) Financial Performance Review
Net income for the fourth quarter of 2009 was Ch$26.2 billion, an increase of 8.3% when compared to Ch$24.2 billion for the third quarter of 2009. Total operating revenues reached Ch$76.9 billion, an increase of 1.9% when compared to Ch$75.4 billion for the third quarter of 2009, while provisions for loan losses decreased by Ch$7.8 billion, a decrease of 41% when compared to Ch$19.1 billion for the third quarter of 2009.
Our condensed income statement for the three-month periods ending September 30 and December 31, 2009 and for the years ended December 31, 2008 and 2009, expressed in millions of Chilean nominal pesos, is as follows:
| For three month period ended | For the year ended | |||||||||||||||||
| Sep - 09 | Dec - 09 | Change | 2008 | 2009 | Change | |||||||||||||
Net interest revenue | 52,477 | 59,247 | 6,770 | 212,985 | 193,388 | (19,597 | ) | |||||||||||
Fees and Income from services net | 9,631 | 12,253 | 2,622 | 42,052 | 43,261 | 1,209 | ||||||||||||
Treasury Business | 11,812 | 4,694 | (7,118 | ) | 12,110 | 54,198 | 42,088 | |||||||||||
Other revenue | 1,530 | 752 | (778 | ) | 7,833 | 5,087 | (2,746 | ) | ||||||||||
Total operating revenue | 75,450 | 76,946 | 1,496 | 274,980 | 295,934 | 20,954 | ||||||||||||
Provision for loan losses | (19,171 | ) | (11,316 | ) | 7,855 | (54,561 | ) | (68,855 | ) | (14,294 | ) | |||||||
Operating expenses | (27,718 | ) | (34,633 | ) | (6,915 | ) | (120,006 | ) | (126,388 | ) | (6,382 | ) | ||||||
Income attributable to inv in other comp. | 319 | 11 | (308 | ) | 418 | 445 | 27 | |||||||||||
Net Income before taxes | 28,880 | 31,008 | 2,128 | 67,177 | 101,136 | 33,959 | ||||||||||||
Income taxes | (4,361 | ) | (4,742 | ) | (381 | ) | (10,867 | ) | (16,027 | ) | (5,160 | ) | ||||||
Net Income | 24,249 | 26,266 | 2,017 | 56,310 | 85,109 | 28,799 | ||||||||||||
Net interest revenues
Net interest revenues increased quarter-on-quarter by Ch$6.77 billion or 12.9% when compared to the prior quarter. This increase in net revenues was mainly due to our balance sheet structure, which is short in pesos and foreign currency (mainly US dollars) and long in UF. The UF is revalued in monthly cycles according to the inflation rate of the previous month. During the fourth quarter the UF was up 0.5%, reflecting the period of low inflation the Chilean economy was experiencing.
Compared year over year, net interest revenues decreased by 9%, because of the same reason that the annual inflation rate was negative. The UF decreased 2.4% during the year.
Gross interest revenues decreased from Ch$559.7 billion during 2008 to Ch$314.1 billion in 2009. Approximately 60% of the decrease year over year is a result of the decrease of the UF during 2009.
Press Release
February 10, 2010
Page 3 / 12
Fees and income from services
Net fees and income from services for the fourth quarter amounted to Ch$12.2 billion, a Ch$2.6 billion increase when compared to the prior quarter. The following table is a summary of our fees and income from services for the three-month periods ended September 30 and December 31, 2009 and for the years ended December 31, 2008 and 2009, expressed in millions of Chilean nominal pesos:
| For three month period ended | For the year ended | |||||||||||||
| Sep - 09 | Dec - 09 | Change | 2008 | 2009 | Change | |||||||||
Bank(*) | 5,108 | 6,706 | 1,598 | 26,181 | 25,129 | (1,052 | ) | |||||||
Mutual Fund Management and Securities Brokerage Services | 2,151 | 2,519 | 368 | 6,819 | 8,102 | 1,283 | ||||||||
Insurance Brokerage | 1,785 | 1,776 | (9 | ) | 6,599 | 6,860 | 261 | |||||||
Financial Advisory Services | 270 | 804 | 534 | 1,120 | 1,940 | 820 | ||||||||
Legal Advisory Services | 317 | 448 | 131 | 1,331 | 1,230 | (101 | ) | |||||||
Total | 9,631 | 12,253 | 2,622 | 42,050 | 43,261 | 1,211 | ||||||||
| (*) | includes consolidation adjustments |
The increase of Ch$1.5 billion in fee revenues from banking operations during the fourth quarter as compared to the prior quarter was mainly a result of higher checking accounts fees and other fees for services rendered.
Fee based revenue from our mutual fund management area increased Ch$1,598 millions during the last quarter or 19% year over year. Our securities brokerage areas remained relatively unchanged.
Our financial advisory services, which provide a broad range of financial advisory services to a variety of corporations, including those related to debt restructuring, mergers and acquisitions, privatizations and company valuation, increased Ch$534 million during the last quarter, or 41%, and an increase of Ch$820 million or 73% year over year.
Our legal advisory services area created on January 2007, and whose principal mission is to provide legal advisory services related to our businesses increased 41% last quarter, but decreased 7.5% year over year.
Trading and investment income – Net Foreign exchange gains and losses
Trading and investment income primarily includes the results from our trading portfolio financial assets (interest, marked-to-market adjustments, gains and losses from sales), gains and losses from our derivative trading portfolio, and gains and losses from sales financial investments available-for-sale.
Net foreign exchange gains and losses include both the results of foreign exchange transactions as well as the recognition of the effect of exchange rate fluctuations on assets and liabilities stated in foreign currencies and loans and deposits in Chilean pesos indexed to foreign currencies. Derivatives and financial instruments that may provide effective economic hedges for managing risk positions are generally treated and reported as trading.
The following table is a summary of our trading and investment income and net foreign exchange gains and losses for the three-month periods ending September 30 and December 31, 2009 and for the years ended December 31, 2008 and 2009, expressed in millions of Chilean nominal pesos:
| For three month period ended | For the year ended | |||||||||||||||||
| Sep - 09 | Dec - 09 | Change | 2008 | 2009 | Change | |||||||||||||
Trading and investment income: | ||||||||||||||||||
Trading instruments | 2,267 | (44 | ) | (2,311 | ) | 2,598 | 2,612 | 14 | ||||||||||
Derivatives held-for-trading | 9,887 | (10,584 | ) | (20,471 | ) | 48,954 | (26,123 | ) | (75,077 | ) | ||||||||
Available-for-sale investments and other | 3,860 | (3,245 | ) | (7,105 | ) | 3,065 | 27,020 | 23,955 | ||||||||||
Total trading and investment income | 16,014 | (13,875 | ) | (29,889 | ) | 54,997 | 4,563 | (50,434 | ) | |||||||||
Net foreign exchange transactions | (4,202 | ) | 18,569 | 22,771 | (42,887 | ) | 49,635 | 92,522 | ||||||||||
Net gains (losses) from treasury business | 11,812 | 4,694 | (7,118 | ) | 12,110 | 54,198 | 42,088 | |||||||||||
Press Release
February 10, 2010
Page 4 / 12
Total income from our treasury business during the fourth quarter of 2009 decreased by Ch$7.1 billion when compared to the prior quarter. This decrease is explained by lower income from our trading and investment portfolio, which was partially offset by gains in our foreign exchange transactions. This is mainly as a result of the change in the exchange rate from CH$551.21 to CH$507.52.
The financial investments available-for-sale decreased because of an increase in the interest rate.
Provision for loan losses
The following table provides information relating to the composition of our provisions for loan losses for the three-month periods ending September 30 and December 31, 2009 and for the years ended December 31, 2008 and 2009, expressed in millions of Chilean nominal pesos:
| For three month period ended | For the year ended | |||||||||||||||||
| Sep - 09 | Dec - 09 | Change | 2008 | 2009 | Change | |||||||||||||
Comercial, net | (10,430 | ) | (2,957 | ) | 7,473 | (12,892 | ) | (29,238 | ) | (16,346 | ) | |||||||
Mortgage, net | (693 | ) | (255 | ) | 438 | (3,084 | ) | (1,861 | ) | 1,223 | ||||||||
Consumer, net | (8,048 | ) | (8,104 | ) | (56 | ) | (38,586 | ) | (37,756 | ) | 830 | |||||||
Net charge to income | (19,171 | ) | (11,316 | ) | 7,855 | (54,561 | ) | (68,855 | ) | (14,294 | ) | |||||||
Our provision for loan losses during the fourth quarter of 2009 was Ch$11.3 billion, a decrease of Ch$7.85 billion when compared to the prior quarter.
Last quarter provisions for loan losses from commercial loans was increased because of a change in risk classification of certain corporate customers related to the Chilean salmon industry crisis. During the fourth quarter there were no big issues like this one, so the provisions for loan losses decreased. If we consider the year over year difference, the salmon crisis explains an important part of the increase of provision for loan losses.
Operating expenses
The following table provides comparative information relating to our operating expenses for the three-month periods ending September 30 and December 31, 2009 and for the years ended December 31, 2008 and 2009, expressed in millions of Chilean nominal pesos:
| For three month period ended | For the year ended | ||||||||||||
| Sep - 09 | Dec - 09 | Change | 2008 | 2009 | Change | ||||||||
Personnel salaries expenses | 15,417 | 18,277 | 2,860 | 57,716 | 65,733 | 8,017 | |||||||
Administrative and other expenses | 9,647 | 11,719 | 2,072 | 50,511 | 44,592 | (5,919 | ) | ||||||
Depreciation, amortization and impairment | 1,615 | 1,677 | 62 | 4,916 | 6,310 | 1,394 | |||||||
Other operating expenses | 1,039 | 2,960 | 1,921 | 6,863 | 9,753 | 2,890 | |||||||
Total operating expenses | 27,718 | 34,633 | 6,915 | 120,006 | 126,388 | 6,382 | |||||||
Our total operating expenses increased during the fourth quarter of 2009 by 24.9% when compared to the last quarter. Personnel salaries expenses increased by Ch$2.8 billion pesos, or 18.5% quarter-on-quarter while administrative and other expenses increased by Ch$2.1 billion, or 21.4% quarter-on-quarter. The increase in personnel salaries expenses is related to an increase in compensation
Press Release
February 10, 2010
Page 5 / 12
payments and bonuses. In addition, the opening of our branch in New York in May 2009 contributed to the increase in personnel salaries expenses year over year.
As part of our strategy, we continue to maintain our efficiency leadership through our cost control culture and our state of the art technology. Our consolidated efficiency ratio (operating expenses / operating revenues) for the 3Q09 and 4Q09 was 36.7% and 45% respectively.
II) Financial Condition
Loan portfolio
Our total loan portfolio (excluding loans and receivables to banks) totalled Ch$ 5,001 billion as of December 31, 2009, representing an increase of 7% when compared to the prior quarter.
The following table provides comparative information related to our loan portfolio for December 31, 2008 and September 30 and December 31, 2009, expressed in millions of Chilean nominal pesos:
| Dec -08 | Sep - 09 | Dec - 09 | Quartely Change | Annual Change | ||||||||
Wholesale | 3,756,997 | 3,494,199 | 3,776,871 | 282,672 | 19,875 | |||||||
Comercial | 2,910,514 | 2,863,877 | 3,193,990 | 330,113 | 283,476 | |||||||
Foreign trade | 467,135 | 283,444 | 233,477 | (49,967 | ) | (233,658 | ) | |||||
Leasing and Factoring | 379,347 | 346,878 | 349,405 | 2,527 | (29,943 | ) | ||||||
Retail | 1,187,186 | 1,202,565 | 1,234,784 | 32,219 | 47,598 | |||||||
Consumer | 495,565 | 439,448 | 428,049 | (11,399 | ) | (67,515 | ) | |||||
Housing mortgages | 691,622 | 763,117 | 806,735 | 43,618 | 115,113 | |||||||
Total loans | 4,944,183 | 4,696,764 | 5,011,656 | 314,892 | 67,473 | |||||||
On a quarter-on-quarter basis our wholesale portfolio increased by 8%. This increase is primarily a result of Commercial operations, which increased from Ch$2,864 billion to Ch$3,194 billion, due to a bigger effort to end the year with a higher market share. But year over year this increase is offset by the decrease of foreign trade because of the appreciation of the Chilean Peso.
The quarter-on-quarter growth in retail loans was due to mortgage loans and partially offset by a decrease in our consumer loan portfolio.
Housing mortgages loans for the fourth quarter of 2009 were Ch$806.7 billion, a 5.7% increase when compared to the Ch$763.1 billion of the third quarter of 2009. This increase is principally a result of better economic conditions, including low interest rates.
Financial investments
Our financial investments totalled Ch$813,3 billion as of December 31, 2009, representing an increase of 40.1% quarter-on-quarter.
The following table provides comparative summary of our investment portfolio for the periods ended September 30 and December 31, 2009, expressed in millions of Chilean nominal pesos:
| Dec - 08 | Sep - 09 | Dec - 09 | Quartely Change | Annual Change | ||||||||
Trading portfolio financials assets | 85,105 | 105,498 | 76,156 | (29,342 | ) | (8,949 | ) | |||||
Financial investments available-for-sale | 576,478 | 474,881 | 737,162 | 262,281 | 160,684 | |||||||
Financial investments held-to-maturity | — | — | — | — | ||||||||
Total financial investments | 661,583 | 580,379 | 813,318 | 232,939 | 151,735 | |||||||
Press Release
February 10, 2010
Page 6 / 12
Our investment portfolio consists of trading and available-for-sale assets. Trading instruments correspond to financial instruments acquired to generate gains from short-term price fluctuations, brokerage margins, or that are included in a portfolio with a pattern of gaining profit in the short-term Trading instruments are stated at fair value.
Investment instruments are classified in two categories: held-to-maturity investments and instruments available-for-sale. Held-to-maturity investments include only those instruments which the Bank has the capacity and intent to hold until maturity. We currently do not have held-to-maturity investment. All other investment instruments are considered available-for-sale. Investment instruments are initially recognized at cost, which includes transaction costs. Instruments available-for-sale at each subsequent period-end are valued at their fair value according to market prices or based on valuation models. Unrealized gains or losses arising from changes in the fair value are charged or credited to equity accounts.
The quarter-on-quarter the 40% increase was principally a result of higher inflows from bonds issued during the fourth quarter (for more information se section III Other related information, “Subordinated Bonds”).
Funding strategy
The International and Treasury Division is responsible for providing liquidity, determining the financing structure, managing the investment portfolio and foreign currency positions.
The following table summarizes our funding as of December 31, 2008 and September 30 and December 31, 2009, in millions of Chilean nominal pesos:
| Dec - 08 | Sep - 09 | Dec - 09 | Quartely Change | Annual Change | ||||||||
Checking accounts | 259,454 | 286,147 | 328,078 | 41,931 | 68,624 | |||||||
Other non-interest bearing deposits | 25,988 | 131,695 | 168,191 | 36,496 | 142,203 | |||||||
Time deposits and savings accounts | 3,355,393 | 3,034,290 | 3,316,045 | 281,755 | (39,348 | ) | ||||||
Repurchase agreements | 307,300 | 290,469 | 465,514 | 175,045 | 158,214 | |||||||
Mortgages bonds | 331,658 | 286,653 | 271,430 | (15,223 | ) | (60,228 | ) | |||||
Banking bonds | 324,662 | 312,748 | 410,473 | 97,725 | 85,811 | |||||||
Subordinated bonds | 108,992 | 151,365 | 253,316 | 101,951 | 144,324 | |||||||
Domestic borrowings | 59,204 | 161,270 | 1,300 | (159,970 | ) | (57,904 | ) | |||||
Foreign borrowings | 433,401 | 369,019 | 357,094 | (11,925 | ) | (76,307 | ) | |||||
Our current funding strategy is to continue to utilize all sources of funding in accordance with their costs, their availability and our general asset and liability management strategy. As a result, during the fourth quarter our funding strategy was mainly driven by increasing our foreign borrowings through bonds and subordinated bonds.
The increase in total loans explains the increase of the top three items of the chart.
Shareholders’ Equity
We have 222,662,374.3 thousand shares outstanding and a market capitalization of Ch$912.9 billion (based on a share price of Ch$4.1 pesos per share). During the first quarter of 2009, we paid dividends totalling 100% of 2008 net income.
Press Release
February 10, 2010
Page 7 / 12
III) Other Related Information
Corpbanca N° 4
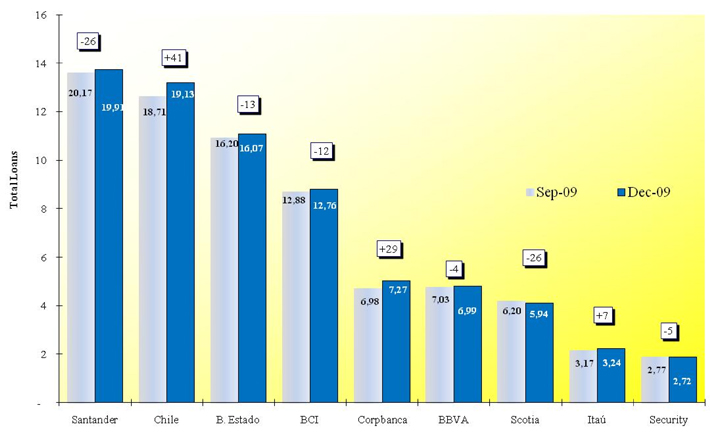
Corpbanca ended the year as the 4th biggest private bank in total loans (excluding loans and receivables to banks).To achieve this successful place, it was very important the effort made during the fourth quarter. Hard work, continue follow up of the results and focusing on the client to give the best service, were the keys to accomplish this achievement.
The following graph demonstrates that Corpbanca total loans market share increased from 6.98% to 7.27% in the last quarter, leaving the Bank in 4th place of private banks, above BBVA.
Subordinated bonds
In the 4th quarter Corpbanca issued UF 4,700,000 in subordinated bonds. After this action the bank raised the volume of loans because the new inflows helped the improvement of the Basel Index at a low cost
During the first half of 2009, Corpbanca issued UF 2,330,000 in subordinated bonds. On July 28th, we placed another U.F. 3,000,000 in subordinated bonds due on August 1, 2033. Those bonds were sold on the Santiago Stock Exchange. The proceeds were used to finance our normal business activities and improve our balance sheet structure.
Press Release
February 10, 2010
Page 8 / 12
CorpBanca’s Conference Call on Fourth Quarter 2009 Results
You are invited to participate in CorpBanca’s (NYSE: BCA, Santiago: CORPBANCA) conference call to discuss theFourth Quarter 2009 Results and respond to investor questions.
Date and Time: To be confirmed in a separated press release
Chairperson: Mr, Sergio Benavente, Chief Financial Officer
Slides and audio webcast:
There will also be a live -and then archived- webcast of the conference call with PowerPoint slides through the internet accessible through the website of Capital Link at www.capitallink.com, Please click on the button“FOURTH QUARTER 2009 FINANCIAL RESULTS WEBCAST”, The webcast will also be available on the company’s website at www.corpbanca.cl, Participants to the live webcast should register on the website approximately 10 minutes prior to the start of the webcast.
Press Release
February 10, 2010
Page 9 / 12
Consolidated Statements of Income (unaudited)
| For the three months ended | For the year ended | |||||||||||
| (Expressed in millions of Chilean pesos) | Sep-09 | Dic-09 | Dic-08 | Dic-09 | ||||||||
OPERATING INCOME | ||||||||||||
Interest revenue | 74,517 | 87,848 | 559,702 | 314,115 | ||||||||
Interest expense | (22,040 | ) | (28,601 | ) | (346,717 | ) | (120,727 | ) | ||||
Net interest revenue | 52,477 | 59,247 | 212,985 | 193,388 | ||||||||
Fees and income from services, net | 9,631 | 12,253 | 42,052 | 43,261 | ||||||||
Trading and investment income, net | 16,014 | (13,875 | ) | 54,997 | 4,563 | |||||||
Foreign exchange gains (losses), net | (4,202 | ) | 18,569 | (42,887 | ) | 49,635 | ||||||
Other operating revenue | 1,530 | 752 | 7,833 | 5,087 | ||||||||
Operating revenues | 75,450 | 76,946 | 274,980 | 295,934 | ||||||||
| — | ||||||||||||
Provisions for loan losses | (19,171 | ) | (11,316 | ) | (54,561 | ) | (68,855 | ) | ||||
| — | ||||||||||||
Net operating revenues | 56,279 | 65,630 | 220,419 | 227,079 | ||||||||
| — | ||||||||||||
Personnel salaries and expenses | (15,417 | ) | (18,277 | ) | (57,716 | ) | (65,733 | ) | ||||
Administration expenses | (9,647 | ) | (11,719 | ) | (50,511 | ) | (44,592 | ) | ||||
Depreciation, amortization and impairment | (1,615 | ) | (1,677 | ) | (4,916 | ) | (6,310 | ) | ||||
Other operating expenses | (1,039 | ) | (2,960 | ) | (6,863 | ) | (9,753 | ) | ||||
| — | ||||||||||||
Net operating income | 28,561 | 30,997 | 100,413 | 100,691 | ||||||||
| — | ||||||||||||
Income attributable to investments in other companies | 319 | 11 | 418 | 445 | ||||||||
Net loss from price-level restatement | 1 | 1 | (33,654 | ) | 3 | |||||||
| — | ||||||||||||
Income before income taxes | 28,880 | 31,009 | 67,177 | 101,136 | ||||||||
Income taxes | (4,631 | ) | (4,742 | ) | (10,867 | ) | (16,027 | ) | ||||
Income for the period | 24,249 | 26,267 | 56,310 | 85,109 | ||||||||
Press Release
February 10, 2010
Page 10 / 12
Consolidated Balance Sheets (unaudited)
| (Expressed in millions of Chilean pesos) | Dec 08 | Sept 09 | Dec 09 | ||||||
Assets | |||||||||
Cash and due from banks | 81,326 | 139,915 | 110,331 | ||||||
Items in course of collection | 117,703 | 189,735 | 95,796 | ||||||
Trading portfolio financial assets | 85,105 | 105,498 | 76,156 | ||||||
Financial investments available-for-sale | 576,478 | 474,881 | 737,162 | ||||||
Financial investments held-to-maturity | — | — | — | ||||||
Investments purchased under agreements to resell | 50,514 | 37,964 | 51,970 | ||||||
Derivative financial instruments | 209,482 | 94,836 | 126,140 | ||||||
Loans and receivables to banks | 37,671 | 19,283 | 86,220 | ||||||
Loans and receivables to customers | 4,944,183 | 4,696,764 | 5,011,656 | ||||||
Allowance for loan losses | (72,308 | ) | (94,940 | ) | (95,950 | ) | |||
Loans and receivables to customers, net | 4,871,875 | 4,601,824 | 4,915,706 | ||||||
Investments in other companies | 2,213 | 3,583 | 3,583 | ||||||
Intangibles | 2,861 | 13,408 | 13,630 | ||||||
Premises and equipment, net | 38,820 | 54,571 | 55,212 | ||||||
Income tax provision - current | 6,533 | 165 | — | ||||||
Deferred income taxes | 13,468 | 17,878 | 19,841 | ||||||
Other assets | 97,680 | 76,346 | 87,712 | ||||||
Total Assets | 6,191,729 | 5,829,887 | 6,379,459 | ||||||
Liabilities: | |||||||||
Deposits and other sight liabilities | 357,902 | 417,842 | 496,270 | ||||||
Items in course of collection | 86,176 | 156,969 | 64,854 | ||||||
Securities sold under agreements to resell | 351,471 | 290,469 | 465,513 | ||||||
Deposits and other term liabilities | 3,350,742 | 3,034,290 | 3,316,045 | ||||||
Derivative financial instruments | 195,608 | 83,718 | 114,703 | ||||||
Borrowings from financial institutions | 492,606 | 503,704 | 362,403 | ||||||
Debt instruments | 765,172 | 750,766 | 935,219 | ||||||
Other financial obligations | 47,394 | 26,585 | 26,853 | ||||||
Income tax provision - current | 45 | 2,674 | 7,831 | ||||||
Deferred income taxes | 9,550 | 16,845 | 15,644 | ||||||
Provisions | 33,204 | 38,506 | 53,118 | ||||||
Other liabilities | 18,552 | 15,454 | 17,471 | ||||||
Total Liabilities | 5,708,422,0 | 5,337,822,0 | 5,875,924,0 | ||||||
Shareholders’ equity: | |||||||||
Capital | 324,039 | 324,039 | 326,038 | ||||||
Reserves | 2,917 | 14,156 | 25,054 | ||||||
Valuation gains (losses) | 1,018 | (2,729 | ) | (6,557 | ) | ||||
Retained earnings: | |||||||||
Retained earnings from prior years | 127,178 | 127,178 | 116,445 | ||||||
Profit for the period | 56,310 | 58,843 | 85,109 | ||||||
Less: Accrual for mandatory dividends | (28,155 | ) | (29,422 | ) | (42,554 | ) | |||
Minority Interest | — | 3,0 | |||||||
Total Shareholders’ Equity | 483,307 | 492,065 | 503,538 | ||||||
Total equity and liabilities | 6,191,729 | 5,829,887 | 6,379,462 | ||||||
Press Release
February 10, 2010
Page 11 / 12
Selected Performance Ratios (unaudited)
| As of or for the three month period ended | For the year ended | |||||||||||
| Sep-09 | Dic-09 | 2008 | 2009 | |||||||||
Solvency indicators | ||||||||||||
Basle index(5) | 12.53 | % | 13.92 | % | 10.83 | % | 13.92 | % | ||||
Shareholders’ equity / total assets | 8.44 | % | 7.89 | % | 7.81 | % | 7.89 | % | ||||
Shareholders’ equity / total liabilities | 9.22 | % | 8.57 | % | 8.47 | % | 8.57 | % | ||||
Credit quality ratios | ||||||||||||
Risk index (Allowances / total loans ) | 2.02 | % | 1.91 | % | 1.46 | % | 1.91 | % | ||||
Provisions for loan losses / Total loans(1) | 1.63 | % | 0.90 | % | 1.10 | % | 1.37 | % | ||||
Provisions for loan losses / Total assets(1) | 1.32 | % | 0.71 | % | 0.9 | % | 1.1 | % | ||||
Provisions for loan losses / Gross operating income | 25.4 | % | 14.7 | % | 19.8 | % | 23.3 | % | ||||
Provisions for loan losses / Net income | 79.1 | % | 43.1 | % | 96.9 | % | 80.9 | % | ||||
Profitability ratios | ||||||||||||
Net interest revenue / Interest-earning assets(1)(2) | 4.01 | % | 4.03 | % | 3.80 | % | 3.28 | % | ||||
Gross operating income / Total assets(1) | 5.18 | % | 4.82 | % | 4.44 | % | 4.64 | % | ||||
Gross operating income / Interest-earning assets(1)(2) | 5.77 | % | 5.23 | % | 4.90 | % | 5.03 | % | ||||
ROA (before taxes), over total assets(1) | 1.98 | % | 1.94 | % | 1.08 | % | 1.59 | % | ||||
ROA (before taxes), over interest-earning assets(1)(2) | 2.21 | % | 2.11 | % | 1.2 | % | 1.7 | % | ||||
ROE (before taxes)(1) | 23.5 | % | 24.6 | % | 13.90 | % | 20.09 | % | ||||
ROA, over total assets(1) | 1.66 | % | 1.65 | % | 0.91 | % | 1.33 | % | ||||
ROA, over interest-earning assets(1)(2) | 1.86 | % | 1.78 | % | 1.00 | % | 1.45 | % | ||||
ROE(1) | 19.71 | % | 20.87 | % | 12.37 | % | 18.46 | % | ||||
Efficiency ratios | ||||||||||||
Operating expenses / Total assets(1) | 1.90 | % | 2.17 | % | 1.94 | % | 1.98 | % | ||||
Operating expenses/ Total loans(1) | 2.36 | % | 2.76 | % | 2.4 | % | 2.5 | % | ||||
Operating expenses / Operating revenues | 36.7 | % | 45.0 | % | 43.6 | % | 42.7 | % | ||||
Earnings | ||||||||||||
Diluted Earnings per share before taxes (Chilean pesos per share) | 0.1305 | 0.1402 | 0.3036 | 0.4542 | ||||||||
Diluted Earnings per ADR before taxes (U.S. dollars per ADR) | 1.1155 | 1.1976 | 2.3817 | 4.4750 | ||||||||
Diluted Earnings per share (Chilean pesos per share) | 0.1096 | 0.1187 | 0.2545 | 0.3822 | ||||||||
Diluted Earnings per ADR (U.S. dollars per ADR) | 0.9366 | 1.0145 | 1.9965 | 3.7658 | ||||||||
Total Shares Outstanding (Thousands)(4) | 221,236,558.3 | 222,662,374.3 | 221,236,558.3 | 222,662,374.3 | ||||||||
Peso exchange rate for US$1 | 551.21 | 507.52 | 637.44 | 507.52 | ||||||||
Press Release
February 10, 2010
Page 12 / 12
CAUTION REGARDING FORWARD-LOOKING STATEMENTS
This press release contains forward-looking statements, Forward-looking information is often, but not always, identified by the use of words such as “anticipate”, “believe”, “expect”, “plan”, “intend”, “forecast”, “target”, “project”, “may”, “will”, “should”, “could”, “estimate”, “predict” or similar words suggesting future outcomes or language suggesting an outlook. Forward-looking statements and information are based on current beliefs as well as assumptions made by and information currently available to Corpbanca concerning anticipated financial performance, business prospects, strategies and regulatory developments. Although management considers these assumptions to be reasonable based on information currently available to it, they may prove to be incorrect. By their very nature, forward-looking statements involve inherent risks and uncertainties, both general and specific, and risks that predictions, forecasts, projections and other forward-looking statements will not be achieved. We caution readers not to place undue reliance on these statements as a number of important factors could cause the actual results to differ materially from the beliefs, plans, objectives, expectations and anticipations, estimates and intentions expressed in such forward-looking statements. Furthermore, the forward-looking statements contained in this press release are made as of the date of this press release and Corp Banca does not undertake any obligation to update publicly or to revise any of the included forward-looking statements, whether as a result of new information, future events or otherwise. The forward-looking statements contained in this press release are expressly qualified by this cautionary statement.
CONTACTS:
Sergio Benavente
CFO, Corpbanca
Santiago, Chile
Phone: (562) 660-2559
investorrelations@corpbanca,cl
John Paul Fischer
Investor Relations, CorpBanca
Santiago, Chile
Phone: (562) 660-2141
john.fischer@corpbanca,cl
Nicolas Bornozis
President, Capital Link
New York, USA
Phone: (212) 661-7566
nbornozis@capitallink,com