Exhibit 99.1

Itaú CorpBanca Announces Third Quarter 2016 Management Discussion &
Analysis Report and Audit Review Report of Quarterly Financial
Statements
Santiago, Chile, October 30, 2016. ITAÚ CORPBANCA (NYSE: ITCB; SSE: ITAUCORP) announced today its Management Discussion & Analysis Report for the third quarter ended September 30, 2016 and the Audit Review Report of Quarterly Financial Statements.
In order to allow for comparison with previous periods, historical pro forma data of the consolidated, combined results of Banco Itaú Chile (“Itaú Chile”) and CorpBanca deconsolidating our subsidiary SMU Corp S.A. (which is no longer considered strategic as of June 30, 2016) and excluding non-recurring events for the periods prior to the second quarter of 2016 is presented in the Management Discussion & Analysis report. The pro forma income statement has been calculated as if the merger of Itaú Chile with and into CorpBanca occurred on January 1, 2015.
The pro forma information presented here is based on (i) the combined consolidated historical unaudited Financial Statements of each of CorpBanca and Banco Itaú Chile as filed with the “Superintendencia de Bancos e Instituciones Financieras” (“SBIF”), (ii) the deconsolidation of SMU Corp unaudited Financial Statements as filed with the SBIF and (iii) the exclusion of non-recurring events.
The pro forma combined financial information included in the MD&A Report is provided for illustrative purposes only, and does not purport to represent what the actual combined results of Itaú Chile and CorpBanca could have been had the acquisition occurred as of January 1, 2015.
For more information, please refer to the following link:
http://www.capitallink.com/press/2016_Q3_Earnings_Release.pdf
About Itaú CorpBanca
ITAÚ CORPBANCA (NYSE: ITCB; SSE: ITAUCORP) is the entity resulting from the merger of Banco Itaú Chile with and into CorpBanca on April 1, 2016. The current ownership structure is: 35.71% owned by Itaú Unibanco, 31.00% owned by CorpGroup and 33.29% owned minority shareholders. Itaú Unibanco is the sole controlling shareholder of the merged bank. Within this context and without limiting the above, Itaú Unibanco and CorpGroup have signed a shareholders’ agreement to determine aspects related to corporate governance, dividend policy (based on performance and capital metrics), transfer of shares, liquidity and other matters.
The merged bank has become the fourth largest private bank in Chile and will result in a banking platform for future expansion in Latin America, specifically in Chile, Colombia, Peru, and Central America. Itaú CorpBanca is a commercial bank based in Chile with operations also in Colombia and Panama. In addition, Itaú CorpBanca has a branch in New York and a representative office in Madrid. Focused on large and medium companies and in individuals, Itaú CorpBanca offers universal banking products. In 2012, the bank initiated a regionalization process and as of the date hereof has acquired
two banks in Colombia –Banco CorpBanca Colombia and Helm Bank–, becoming the first Chilean bank having banking subsidiaries abroad. The merger with Banco Itaú Chile and the business combination of our two banks in Colombia, represent the continued success of our regionalization process.
As of September 30, 2016, according to the Chilean Superintendency of Banks, Itaú CorpBanca was the fourth largest private bank in Chile in terms of the overall size of its customer loan portfolio, equivalent to 11.8% market share.
At the same date, according to the Colombian Superintendency of Finance, CorpBanca Colombia was the sixth largest bank in Colombia in terms of total loans and also the sixth largest bank in Colombia in terms of total deposits, as reported under local regulatory and accounting principles. As of August 31, 2016, its market share by loans reached 5.9%.
Investor Relations – Itaú CorpBanca
+56 (2) 2660-2555 / IR@corpbanca.cl

| | | | | | |
| |
03 | | Management Discussion & Analysis |
| | | | | | |
| | |
| | 05 | | Executive Summary |
| | | | | | |
| | |
| | 14 | | Income Statement and Balance Sheet Analysis |
| | | |
| | | | 15 | | Managerial results . Breakdown by country |
| | | |
| | | | 17 | | Managerial results - Breakdown for Chile |
| | | |
| | | | 27 | | Managerial results - Breakdown for Colombia |
| | | |
| | | | 37 | | Balance Sheet |
| | | |
| | | | 39 | | Solvency Ratios |
| | |
| | 40 | | Additional Information |
| | | | |
| | This report is based on Itaú CorpBanca audited financial statements for 3Q’16 and 2Q’16 and unaudited financial statements for 3Q’15 all of them prepared in accordance with the Compendium of Accounting Norms of the Superintendence of Banks and Financial Institutions (Superintendencia de Bancos e Instituciones Financieras, or the SBIF) pursuant to Chilean Generally Accepted Accounting Principles (Chilean GAAP) which conform with the international standards of accounting and financial reporting issued by the International Accounting Standards Board (IASB) to the extent that there are not specific instructions or regulations to the contrary by the SBIF. Solely for the convenience of the reader, U.S. dollar amounts (US$) in this report have been translated from Chilean nominal peso (Ch$) at our own exchange rate as of September 30, 2016 of Ch$658.20 per U.S. dollar. Industry data contained herein has been obtained from the information provided by the Chilean Superintendency of Banks and Financial Institutions (Superintendencia de Bancos e Instituciones Financieras, “SBIF”). | | |


(This page was intentionally left blank)

Itaú CorpBancaPro forma Information
| | | | |
| | Itaú CorpBanca is the entity resulting from the merger of Banco Itaú Chile (Itaú Chile) with and into CorpBanca on April 1, 2016 (“the Merger”). After the Merger, the surviving entity’s name changed to “Itaú CorpBanca”. The legal acquisition of Itaú Chile by CorpBanca is deemed a reverse acquisition pursuant to standard N° 3 of the International Financial Reporting Standards (or IFRS). Itaú Chile (the legal acquiree) is considered the accounting acquirer and CorpBanca (the legal acquirer) is considered the accounting acquiree for accounting purposes. Therefore, in accordance with IFRS after the date of the Merger, Itaú CorpBanca’s historical financial information (i) reflects Itaú Chile - and not CorpBanca - as the predecessor entity of Itaú CorpBanca, (ii) includes Itaú Chile’s historical financial information, and (iii) does not include CorpBanca’s historical financial information. Additionally, after the Merger our investment in SMU Corp S.A. (“SMU Corp”) is no longer considered strategic. Therefore the status of the investments changed to “available for sale” for accounting purposes. Management estimates that the sale of Itaú CorpBanca´s investment in SMU Corp is highly likely. Therefore, in accordance with standard N° 5 of IFRS as of June 30, 2016 SMU Corp has ceased to be consolidated in the Financial Statements of Itaú CorpBanca. SMU Corp is a joint venture with SMU S.A. —SMU is a retail business holding company controlled by CorpGroup— whose sole an exclusive purpose is the issuance, operation and management of “Unimarc” credit cards to customers of supermarkets associated with SMU. In order to allow for comparison with previous periods, historical pro forma data of the consolidated combined results of Itaú Chile and CorpBanca deconsolidating our subsidiary SMU Corp S.A. (which is no longer considered strategic as of June 30, 2016) and excluding non-recurring events for the periods prior to the second quarter of 2016 is presented in this Management Discussion & Analysis report. The pro forma income statement has been calculated as if the Merger occurred on January 1, 2015. The pro forma information presented here is based on (i) the combined consolidated historical unaudited Financial Statements of each of CorpBanca and Banco Itaú Chile as filed with the “Superintendencia de Bancos e Instituciones Financi-eras” (“SBIF”), (ii) the deconsolidation of SMU Corp unaudited Financial Statements as filed with the SBIF and (iii) the exclusion of non-recurring events. The pro forma combined financial information included in the MD&A Report is provided for illustrative purposes only, and does not purport to represent what the actual combined results of Itaú Chile and CorpBanca could have been if the acquisition occurred as of January 1, 2015. | | |
We present below pro forma financial information and operating information of Itaú CorpBanca in order to allow analysis on the same basis of comparison as the financial information presented as of September 30, 2016 and for the three months ended September 30, 2016.
Itaú CorpBancaPro forma Highlights
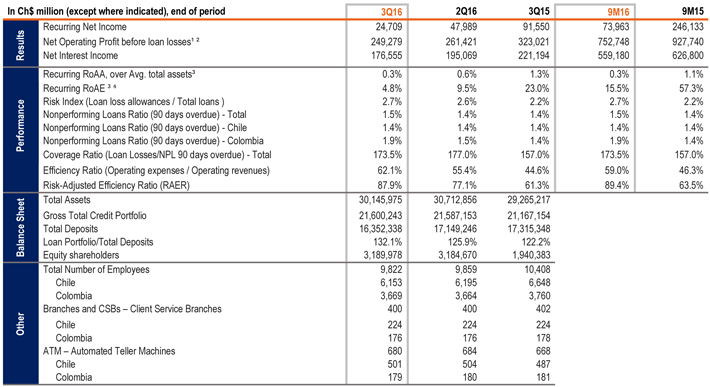
Note: (1) Net Operating Profit before loan losses = Net interest income + Commissions and Fees + Net total financial transactions + Other Operating Income, net.(2) We revised our criteria to reflect only the tax effect of the fiscal hedge as of 3Q 2016, though for comparison purpose we have adjusted accordingly previous periods.(3) Annualized figures when appropriate.(4) Equity: Average equity attributable to shareholders excluding net income and accrual for mandatory dividends.

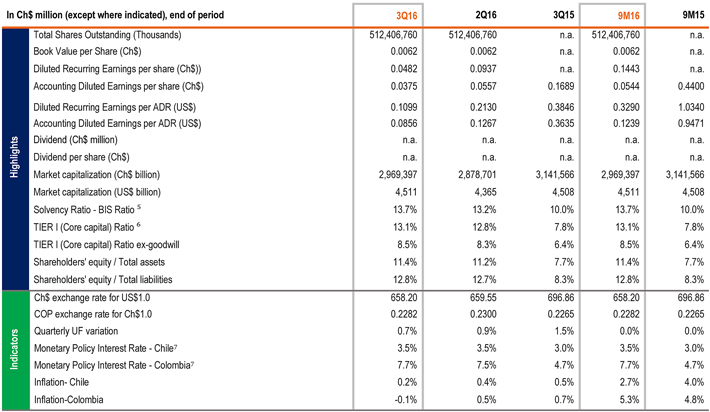
Note:(5) BIS Ratio= Regulatory capital / RWA, according to SBIF BIS I definitions.(6) Tier I Capital = Basic Capital, according to SBIF BIS I definitions.(7) End of each period.

Net Income and Recurring Net Income
Our recurring net income attributable to shareholders totaled Ch$24,709 million in the third quarter of 2016 as a result of the elimination of non-recurring events, which are presented in the table below, from net income attributable to shareholders of Ch$19,239 million for the period.
| | | | | | | | | | | | | | | | | | | | |
In Ch$ million | | 3Q16 | | | 2Q16 | | | 3Q15 | | | 9M16 | | | 9M15 | |
Net Income Attributable to Shareholders (Accounting) | | | 19,239 | | | | 28,544 | | | | 23,922 | | | | 53,921 | | | | 66,631 | |
| | | | | |
(+) Pro Forma consolidation effects | | | | | | | | | | | 62,713 | | | | (25,939) | | | | 159,180 | |
| | | | | |
Pro Forma Net Income Attributable to Shareholders | | | 19,239 | | | | 28,544 | | | | 86,635 | | | | 27,982 | | | | 225,811 | |
| | | | | |
Non-Recurring Events | | | 5,470 | | | | 19,445 | | | | 4,915 | | | | 45,981 | | | | 20,322 | |
| | | | | |
Restructuring Costs | | | 6,819 | | | | 9,518 | | | | | | | | 34,257 | | | | | |
| | | | | |
Transaction Costs | | | | | | | | | | | 6,342 | | | | | | | | 26,222 | |
| | | | | |
Regulatory / merger effects on loan loss provisions | | | | | | | 4,521 | | | | | | | | 13,119 | | | | | |
| | | | | |
Accounting Adjustments | | | 288 | | | | 8,876 | | | | | | | | 10,364 | | | | | |
| | | | | |
Tax Effects | | | (1,637) | | | | (3,470) | | | | (1,427) | | | | (11,759) | | | | (5,900) | |
Recurring Net Income Attributable to Shareholders (Managerial) | | | 24,709 | | | | 47,989 | | | | 91,550 | | | | 73,963 | | | | 246,133 | |
Non-Recurring Events
(a) Restructuring costs: one-time integration costs.
(b) Transactions costs: Costs related to the closing of the merger between Banco Itaú Chile and CorpBanca, such as investment banks, legal advisors, auditors and other related expenses.
(c) Regulatory / merger effects on loan loss provisions: Effects of one-time provisions for loan losses due to new regulatory criteria in 2016 and additional provisions for overlaping customers between Itaú Chile and CorpBanca.
(d) Accounting adjustments:Adjustments in light of new internal accounting policies.
Managerial Income Statement
For the managerial results, we apply the combined consolidated historical unaudited Financial Statements of each of CorpBanca and Banco Itaú Chile as filed with the SBIF and the deconsolidation criteria for SMU Corp. These effects are shown in the table on the following page (“Accounting and Managerial Statements Reconciliation”).
Additionally, we adjust for non-recurring events (as previously detailed) and for the tax effect of the hedge of our investment in Colombia – originally accounted for as income tax expense on our Net Income and then reclassified to the Net Financial transaction. For tax purposes, the “Servicio de Impuestos Internos” (Chilean Internal Revenue Service) considers that our investment in Colombia is denominated in U.S. As we have to translate the valuation of this investment from U.S. to Chilean peso in our book each month, the volatility of the exchange rate generates an impact on the net income attributable to shareholders. In order to limit that effect, management has decided to hedge this exposure with derivatives to be analyzed along with income tax expenses.
According to our strategy, we mitigate the foreign exchange translation risk of the capital invested abroad through financial instruments. As consolidated financial statements for Itaú CorpBanca use the Chilean peso as functional currency, foreign currencies are translated to Chilean peso. For our investment in Colombia we have decided to hedge this translation risk effect in our income statement.
In the third quarter of 2016, the Chilean peso depreciated 0.9% against the Colombian peso compared with a depreciation of 1.8% in the previous quarter. Approximately 24% of our loan portfolio is denominated in Colombian peso.

Accounting and Managerial Income Statement reconciliation for the past two quarters is presented below.
Accounting and Managerial Statements Reconciliation| 3rdQuarter of 2016
| | | | | | | | | | | | | | |
In Ch$ million | | Accounting | | | Non-recurring Events | | | Tax Effect of Hedge | | | Managerial |
Net Operating Profit before loan losses | | | 247,383 | | | | - | | | | 1,896 | | | 249,279 |
| | | | |
Net interest income | | | 176,555 | | | | | | | | | | | 176,555 |
| | | | |
Net fee and commission income | | | 45,335 | | | | | | | | | | | 45,335 |
| | | | |
Total financial transactions, net | | | 30,261 | | | | | | | | 1,896 | | | 32,157 |
| | | | |
Other operating income, net | | | (4,768) | | | | - | | | | | | | (4,768) |
| | | | |
Result from Loan Losses | | | (64,319) | | | | - | | | | | | | (64,319) |
| | | | |
Provision for loan losses | | | (72,008) | | | | - | | | | | | | (72,008) |
| | | | |
Recoveries off loan losses written-off as losses | | | 7,689 | | | | - | | | | | | | 7,689 |
| | | | |
Net operating Profit | | | 183,064 | | | | - | | | | 1,896 | | | 184,960 |
| | | | |
Operating expenses | | | (161,670) | | | | 6,819 | | | | | | | (154,851) |
| | | | |
Personnel expenses | | | (74,538) | | | | 5,674 | | | | | | | (68,864) |
| | | | |
Administrative expenses | | | (65,463) | | | | 1,119 | | | | | | | (64,344) |
| | | | |
Depreciation and amortization | | | (21,600) | | | | 25 | | | | | | | (21,575) |
| | | | |
Impairments | | | (69) | | | | - | | | | | | | (69) |
| | | | |
Operating income | | | 21,394 | | | | 6,819 | | | | 1,896 | | | 30,109 |
| | | | |
Income from investments in other companies | | | 87 | | | | - | | | | | | | 87 |
| | | | |
Income before taxes | | | 21,481 | | | | 6,819 | | | | 1,896 | | | 30,196 |
| | | | |
Income tax expense | | | (7,399) | | | | (1,637) | | | | (1,896) | | | (10,931) |
| | | | |
Result from discontinued operations | | | (288) | | | | 288 | | | | | | | - |
| | | | |
Net income | | | 13,794 | | | | 5,470 | | | | - | | | 19,264 |
| | | | |
Minority interests | | | 5,445 | | | | - | | | | | | | 5,445 |
Net income attributable to shareholders | | | 19,239 | | | | 5,470 | | | | - | | | 24,709 |
Accounting and Managerial Statements Reconciliation| 2rdQuarter of 2016
| | | | | | | | | | | | | | |
In Ch$ million | | Accounting | | | Non-recurring Events | | | Tax Effect of Hedge | | | Managerial |
Net Operating Profit before loan losses | | | 258,259 | | | | (1,200) | | | | 4,362 | | | 261,421 |
| | | | |
Net interest income | | | 195,069 | | | | | | | | | | | 195,069 |
| | | | |
Net fee and commission income | | | 46,757 | | | | | | | | | | | 46,757 |
| | | | |
Total financial transactions, net | | | 19,597 | | | | | | | | 4,362 | | | 23,959 |
| | | | |
Other operating income, net | | | (3,164) | | | | (1,200) | | | | | | | (4,364) |
| | | | |
Result from Loan Losses | | | (61,215) | | | | 4,521 | | | | | | | (56,694) |
| | | | |
Provision for loan losses | | | (68,685) | | | | 4,521 | | | | | | | (64,164) |
| | | | |
Recoveries off loan losses written-off as losses | | | 7,470 | | | | - | | | | | | | 7,470 |
| | | | |
Net operating Profit | | | 197,044 | | | | 3,321 | | | | 4,362 | | | 204,727 |
| | | | |
Operating expenses | | | (156,756) | | | | 11,803 | | | | | | | (144,953) |
| | | | |
Personnel expenses | | | (74,894) | | | | 6,505 | | | | | | | (68,389) |
| | | | |
Administrative expenses | | | (62,823) | | | | 3,675 | | | | | | | (59,148) |
| | | | |
Depreciation and amortization | | | (19,005) | | | | 1,623 | | | | | | | (17,382) |
| | | | |
Impairments | | | (34) | | | | - | | | | | | | (34) |
| | | | |
Operating income | | | 40,288 | | | | 15,124 | | | | 4,362 | | | 59,774 |
| | | | |
Income from investments in other companies | | | 348 | | | | - | | | | | | | 348 |
| | | | |
Income before taxes | | | 40,636 | | | | 15,124 | | | | 4,362 | | | 60,122 |
| | | | |
Income tax expense | | | (10,720) | | | | 4,321 | | | | (4,362) | | | (10,761) |
| | | | |
Result from discontinued operations | | | | | | | | | | | | | | - |
| | | | |
Net income | | | 29,916 | | | | 19,445 | | | | - | | | 49,361 |
| | | | |
Minority interests | | | (1,372) | | | | - | | | | | | | (1,372) |
Net income attributable to shareholders | | | 28,544 | | | | 19,445 | | | | - | | | 47,989 |

We present below the managerial income statements with the adjustments presented on the previous page:
Income Statement
| | | | | | | | | | | | | | | | | | | | | | | | | | | | | | | | | | | | | | | | | | | | | | |
In Ch$ million | | | | 3Q16 | | | 2Q16 | | | change | | | 3Q15 | | | change | | | 9M16 | | | 9M15 | | | change | |
Net Operating Profit before loan losses | | | | | 249,279 | | | | 261,421 | | | | (12,142) | | | | -4.6% | | | | 323,021 | | | | (73,742) | | | | -22.8% | | | | 752,748 | | | | 927,740 | | | | (174,992) | | | | -18.9% | |
| | | | | | | | | | | | |
Net interest income | | | | | 176,555 | | | | 195,069 | | | | (18,514) | | | | -9.5% | | | | 221,194 | | | | (44,639) | | | | -20.2% | | | | 559,180 | | | | 626,800 | | | | (67,621) | | | | -10.8% | |
| | | | | | | | | | | | |
Net fee and commission income | | | | | 45,335 | | | | 46,757 | | | | (1,422) | | | | -3.0% | | | | 52,055 | | | | (6,720) | | | | -12.9% | | | | 135,891 | | | | 163,478 | | | | (27,586) | | | | -16.9% | |
| | | | | | | | | | | | |
Total financial transactions, net | | | | | 32,157 | | | | 23,959 | | | | 8,198 | | | | 34.2% | | | | 51,058 | | | | (18,902) | | | | -37.0% | | | | 73,182 | | | | 139,043 | | | | (65,861) | | | | -47.4% | |
| | | | | | | | | | | | |
Other operating income, net | | | | | (4,768) | | | | (4,364) | | | | (404) | | | | 9.3% | | | | (1,286) | | | | (3,482) | | | | 270.8% | | | | (15,505) | | | | (1,581) | | | | (13,924) | | | | 880.7% | |
| | | | | | | | | | | | |
Result from Loan Losses | | | | | (64,319) | | | | (56,694) | | | | (7,625) | | | | 13.4% | | | | (54,030) | | | | (10,289) | | | | 19.0% | | | | (229,258) | | | | (159,578) | | | | (69,680) | | | | 43.7% | |
| | | | | | | | | | | | |
Provision for loan losses | | | | | (72,008) | | | | (64,164) | | | | (7,844) | | | | 12.2% | | | | (60,824) | | | | (11,184) | | | | 18.4% | | | | (249,600) | | | | (181,099) | | | | (68,501) | | | | 37.8% | |
| | | | | | | | | | | | |
Recoveries of loans written-off as losses | | | | | 7,689 | | | | 7,470 | | | | 219 | | | | 2.9% | | | | 6,794 | | | | 895 | | | | 13.2% | | | | 20,342 | | | | 21,521 | | | | (1,179) | | | | -5.5% | |
Net operating Profit | | | | | 184,960 | | | | 204,727 | | | | (19,767) | | | | -9.7% | | | | 268,991 | | | | (84,032) | | | | -31.2% | | | | 523,490 | | | | 768,162 | | | | (244,672) | | | | -31.9% | |
| | | | | | | | | | | | |
Operating expenses | | | | | (154,851) | | | | (144,953) | | | | (9,898) | | | | 6.8% | | | | (143,923) | | | | (10,929) | | | | 7.6% | | | | (444,028) | | | | (429,943) | | | | (14,085) | | | | 3.3% | |
| | | | | | | | | | | | |
Personnel expenses | | | | | (68,864) | | | | (68,389) | | | | (474) | | | | 0.7% | | | | (71,559) | | | | 2,695 | | | | -3.8% | | | | (204,741) | | | | (210,788) | | | | 6,047 | | | | -2.9% | |
| | | | | | | | | | | | |
Administrative expenses | | | | | (64,344) | | | | (59,148) | | | | (5,196) | | | | 8.8% | | | | (58,949) | | | | (5,395) | | | | 9.2% | | | | (187,312) | | | | (179,726) | | | | (7,586) | | | | 4.2% | |
| | | | | | | | | | | | |
Depreciation and amortization | | | | | (21,575) | | | | (17,382) | | | | (4,193) | | | | 24.1% | | | | (13,230) | | | | (8,344) | | | | 63.1% | | | | (51,855) | | | | (39,210) | | | | (12,644) | | | | 32.2% | |
| | | | | | | | | | | | |
Impairments | | | | | (69) | | | | (34) | | | | (35) | | | | 102.9% | | | | (184) | | | | 115 | | | | -62.5% | | | | (120) | | | | (218) | | | | 98 | | | | -45.0% | |
| | | | | | | | | | | | |
Operating income | | | | | 30,109 | | | | 59,774 | | | | (29,665) | | | | -49.6% | | | | 125,069 | | | | (94,960) | | | | -75.9% | | | | 79,461 | | | | 338,218 | | | | (258,757) | | | | -76.5% | |
| | | | | | | | | | | | |
Income from investments in other companies | | | | | 87 | | | | 348 | | | | (261) | | | | -75.0% | | | | 48 | | | | 39 | | | | 81.3% | | | | 953 | | | | 1,472 | | | | (519) | | | | -35.3% | |
| | | | | | | | | | | | |
Income before taxes | | | | | 30,196 | | | | 60,122 | | | | (29,926) | | | | -49.8% | | | | 125,117 | | | | (94,921) | | | | -75.9% | | | | 80,414 | | | | 339,690 | | | | (259,276) | | | | -76.3% | |
| | | | | | | | | | | | |
Income tax expense | | | | | (10,931) | | | | (10,761) | | | | (170) | | | | 1.6% | | | | (28,913) | | | | 17,982 | | | | -62.2% | | | | (10,141) | | | | (74,217) | | | | 64,077 | | | | -86.3% | |
| | | | | | | | | | | | |
Result from discontinued operations | | | | | - | | | | - | | | | - | | | | - | | | | - | | | | - | | | | - | | | | - | | | | - | | | | - | | | | - | |
Net income | | | | | 19,264 | | | | 49,361 | | | | (30,096) | | | | -61.0% | | | | 96,204 | | | | (76,939) | | | | -80.0% | | | | 70,274 | | | | 265,473 | | | | (195,199) | | | | -73.5% | |
| | | | | | | | | | | | |
Minority interests | | | | | 5,445 | | | | (1,372) | | | | 6,817 | | | | -496.9% | | | | (4,654) | | | | 10,099 | | | | -217.0% | | | | 3,689 | | | | (19,340) | | | | 23,029 | | | | -119.1% | |
Net income attributable to shareholders | | | | | 24,709 | | | | 47,989 | | | | (23,280) | | | | -48.5% | | | | 91,550 | | | | (66,841) | | | | -73.0% | | | | 73,963 | | | | 246,133 | | | | (172,170) | | | | -70.0% | |

Net income analysis presented below is based on the Managerial Income Statement with the adjustments shown on page 8:
Recurring Net Income
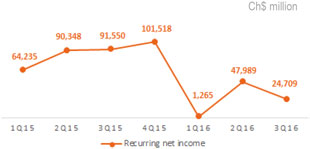
The recurring net income for the third quarter of 2016 amounted to Ch$24,709 million, representing a decrease of 48.5% from the previous quarter and a decrease of 73.0% from the same period of the previous year.
The quarterly results were impacted by a decrease in inflation-indexed net interest income, a 6.8% increase in operating expenses mainly due to higher amortization expenses and a 12.2% increase in provision for loan losses related to the risk rating revision of some of our corporate clients.
In the 9M’16, recurring net income was Ch$73,963 million, down 70.0% from the same period of the previous year, mainly driven by the increase in provisions for loan losses due to downgrades of corporate clients in the energy sector both in Chile and Colombia and the negative impact of higher monetary policy interest rates both in Chile and Colombia and slower economic activity.
Return on Average Equity
Pro forma shareholders’ equity ex goodwill totaled Ch$2,074 billion and the annualized recurring return on average equity ex-goodwill reached 4.8% in the third quarter of 2016.
Annualized recurring return on average assets ex goodwill reached 0.3% in the third quarter of 2016, down 30 basis points from the previous quarter.
Net Operating Profit before Loan Losses
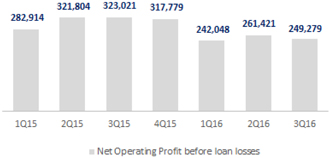
In the third quarter of 2016, net operating profit before loan losses, representing net interest income, net fee and commission income, net total financial transactions and other operating income, net totaled Ch$249,279 million, a 4.6% decrease from the previous quarter and a 22.8% decrease from the same period of the previous year. The main components of net operating profit before loan losses and other items of income statement are presented below.
Net Interest Income
The net interest income for the third quarter of 2016 totaled Ch$176,555 million, a decrease of Ch$18,514 million when compared to the previous quarter, mainly due to the decrease of Ch$28,694 million in our interest and inflation indexed income. This decrease is explained by a reduction in inflation in the quarter and the reclassification of some financial instrument to the trading category.
Our net interest margin reached 2.8% in the quarter a decrease of 21 basis points when compared to the previous quarter.
Net commissions and fees
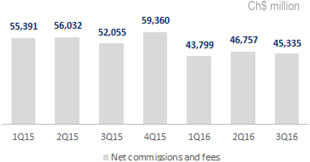
In the third quarter of 2016, commissions and fees decrease 3.0% when compared to the previous quarter, mainly driven by lower credit and account fees, and asset management and brokerage fees. Compared to the third quarter of 2015, these revenues decreased 12.9%, mainly driven by lower fees from structuring project financing and syndicated loans.
Result from Loan Losses
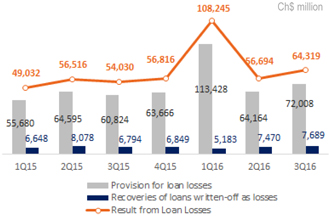
The result from loan losses, net of recoveries of loans written-off as losses, has increased 13.4% from the previous quarter, totaling Ch$ 64,319 million in the quarter. This deterioration was mainly due to a 12.2% (Ch$7,844 million) increase in our provision for loan losses mainly driven by more challenging economic scenario. Additionally, the recovery of loans written off as losses improved 2.9%.
Efficiency Ratio and Risk-Adjusted Efficiency Ratio
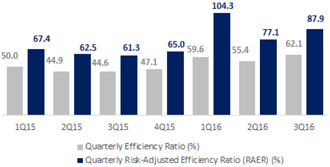
In the third quarter of 2016, the efficiency ratio, reached 62.1%, a deterioration of 667 basis points from the previous quarter, mainly driven by te increase in amortization expenses and the decrease in revenue growth.
In the third quarter of 2016, the risk-adjusted efficiency ratio, which also includes the result from loan losses, reached 87.9%, an increase of 10.8 percentage points from the previous quarter. This was primary due to a higher result from loan losses (13.4%).

Balance Sheet |Assets
| | | | | | | | | | | | | | | | | | | | |
In Ch$ million, end of period | | 3Q16 | | | 2Q16 | | | change | | | 3Q15 | | | change | |
Cash and deposits in banks | | | 1,816,907 | | | | 1,854,662 | | | | -2.0% | | | | 1,485,273 | | | | 22.3% | |
| | | | | |
Unsettled transactions | | | 470,531 | | | | 495,915 | | | | -5.1% | | | | 330,164 | | | | 42.5% | |
| | | | | |
Securities and Derivative Financial Trading Investments | | | 3,906,798 | | | | 3,772,428 | | | | 3.6% | | | | 4,432,809 | | | | -11.9% | |
| | | | | |
Interbank loans, net | | | 281,835 | | | | 853,773 | | | | -67.0% | | | | 486,163 | | | | -42.0% | |
| | | | | |
Loans and accounts receivable from customers | | | 21,600,243 | | | | 21,587,153 | | | | 0.1% | | | | 21,167,154 | | | | 2.0% | |
| | | | | |
Loan loss allowances | | | (581,355) | | | | (552,404) | | | | 5.2% | | | | (458,558) | | | | 26.8% | |
| | | | | |
Investments in other companies | | | 17,036 | | | | 15,727 | | | | 8.3% | | | | 17,669 | | | | -3.6% | |
| | | | | |
Intangible assets | | | 1,593,612 | | | | 1,586,744 | | | | 0.4% | | | | 718,462 | | | | 121.8% | |
| | | | | |
Other assets | | | 1,040,368 | | | | 1,098,858 | | | | -5.3% | | | | 1,086,081 | | | | -4.2% | |
Total Assets | | | 30,145,975 | | | | 30,712,856 | | | | -1.8% | | | | 29,265,217 | | | | 3.0% | |
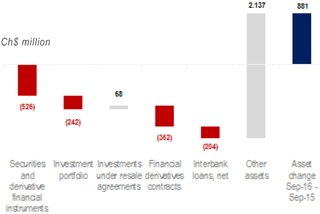
At the end of the third quarter of 2016, our assets totaled Ch$30.1 trillion, a decrease of 1.8% (Ch$0.6 billion) from the previous quarter. The main changes are presented below:
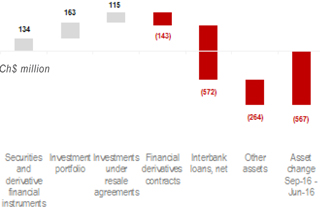
Compared to the previous year, the increase of 3.0% (Ch$0.8 billion) was mainly driven by a increase in our intangible assets.
Balance Sheet |Liabilities and Equity
| | | | | | | | | | | | | | | | | | | | |
In Ch$ million, end of period | | 3Q16 | | | 2Q16 | | | change | | | 3Q15 | | | change | |
Deposits and other demand liabilities | | | 4,285,401 | | | | 5,054,222 | | | | -15.2% | | | | 4,954,373 | | | | -13.5% | |
Unsettled transactions | | | 382,922 | | | | 421,293 | | | | -9.1% | | | | 266,532 | | | | 43.7% | |
| | | | | |
Investments sold under repurchase agreements | | | 699,898 | | | | 332,494 | | | | 110.5% | | | | 756,754 | | | | -7.5% | |
| | | | | |
Time deposits and other time liabilities | | | 12,066,937 | | | | 12,095,024 | | | | -0.2% | | | | 12,360,975 | | | | -2.4% | |
| | | | | |
Financial derivatives contracts | | | 1,002,115 | | | | 1,156,671 | | | | -13.4% | | | | 1,303,825 | | | | -23.1% | |
| | | | | |
Interbank borrowings | | | 2,299,507 | | | | 2,259,906 | | | | 1.8% | | | | 1,849,291 | | | | 24.3% | |
| | | | | |
Issued debt instruments | | | 5,281,692 | | | | 5,095,875 | | | | 3.6% | | | | 4,636,279 | | | | 13.9% | |
| | | | | |
Other financial liabilities | | | 20,944 | | | | 28,537 | | | | -26.6% | | | | 31,100 | | | | -32.7% | |
| | | | | |
Current taxes | | | - | | | | - | | | | - | | | | 33,506 | | | | -100.0% | |
| | | | | |
Deferred taxes | | | 237,643 | | | | 140,897 | | | | 68.7% | | | | 255,524 | | | | -7.0% | |
| | | | | |
Provisions | | | 172,383 | | | | 158,556 | | | | 8.7% | | | | 241,802 | | | | -28.7% | |
| | | | | |
Other liabilities | | | 267,728 | | | | 519,492 | | | | -48.5% | | | | 325,197 | | | | -17.7% | |
| | | | | |
Total Liabilities | | | 26,717,170 | | | | 27,262,967 | | | | -2.0% | | | | 27,015,158 | | | | -1.1% | |
| | | | | |
Attributable to bank shareholders | | | 3,189,978 | | | | 3,184,670 | | | | 0.2% | | | | 1,940,383 | | | | 64.4% | |
| | | | | |
Non-controlling interest | | | 238,827 | | | | 265,219 | | | | -10.0% | | | | 309,676 | | | | -22.9% | |
| | | | | |
Total equity and liabilities | | | 30,145,975 | | | | 30,712,856 | | | | -1.8% | | | | 29,265,217 | | | | 3.0% | |
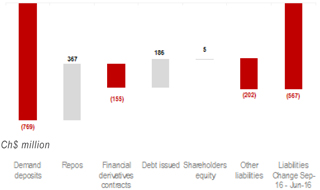
The main changes in liabilities at the end of the third quarter of 2016, compared to the previous quarter, are presented in the chart below:
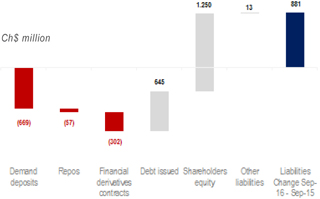
Compared to the previous year, the main changes are highlighted as follows:

Credit Portfolio
At the end of the third quarter of 2016, our total credit portfolio reached Ch$21,600 billion, increasing 0.1% from the previous quarter and 2.0% from the same period of the previous year.
In its local currency, total loans in Colombia increased 4.0% in the quarter and 2.5% in the twelve month period.
| | | | | | | | | | | | | | | | | | | | |
| In Ch$ million, end of period | | 3Q16 | | | 2Q16 | | | change | | | 3Q15 | | | change | |
Wholesale lending | | | 15,310,912 | | | | 15,342,964 | | | | -0.2% | | | | 15,012,765 | | | | 2.0% | |
| | | | | |
Chile | | | 11,724,347 | | | | 11,779,308 | | | | -0.5% | | | | 11,439,759 | | | | 2.5% | |
| | | | | |
Commercial loans | | | 10,209,915 | | | | 10,256,902 | | | | -0.5% | | | | 9,684,578 | | | | 5.4% | |
| | | | | |
Foreign trade loans | | | 864,988 | | | | 881,041 | | | | -1.8% | | | | 1,055,718 | | | | -18.1% | |
| | | | | |
Leasing and Factoring | | | 649,444 | | | | 641,365 | | | | 1.3% | | | | 699,463 | | | | -7.2% | |
| | | | | |
Colombia | | | 3,586,565 | | | | 3,563,656 | | | | 0.6% | | | | 3,573,006 | | | | 0.4% | |
| | | | | |
Commercial loans | | | 3,044,518 | | | | 3,015,502 | | | | 1.0% | | | | 3,056,517 | | | | -0.4% | |
| | | | | |
Leasing and Factoring | | | 542,047 | | | | 548,154 | | | | -1.1% | | | | 516,489 | | | | 4.9% | |
| | | | | |
Retail lending | | | 6,289,331 | | | | 6,244,189 | | | | 0.7% | | | | 6,154,389 | | | | 2.2% | |
| | | | | |
Chile | | | 4,615,810 | | | | 4,595,528 | | | | 0.4% | | | | 4,520,509 | | | | 2.1% | |
| | | | | |
Consumer loans | | | 1,300,582 | | | | 1,292,049 | | | | 0.7% | | | | 1,281,675 | | | | 1.5% | |
| | | | | |
Residential mortgage loans | | | 3,315,228 | | | | 3,303,479 | | | | 0.4% | | | | 3,238,834 | | | | 2.4% | |
| | | | | |
Colombia | | | 1,673,521 | | | | 1,648,661 | | | | 1.5% | | | | 1,633,880 | | | | 2.4% | |
| | | | | |
Consumer loans | | | 1,148,500 | | | | 1,137,219 | | | | 1.0% | | | | 1,141,309 | | | | 0.6% | |
| | | | | |
Residential mortgage loans | | | 525,021 | | | | 511,442 | | | | 2.7% | | | | 492,571 | | | | 6.6% | |
TOTAL LOANS | | | 21,600,243 | | | | 21,587,153 | | | | 0.1% | | | | 21,167,154 | | | | 2.0% | |
| | | | | |
Chile | | | 16.340.157 | | | | 16.374.836 | | | | -0.2% | | | | 15.960.268 | | | | 2.4% | |
| | | | | |
Colombia | | | 5.260.086 | | | | 5.212.317 | | | | 0.9% | | | | 5.206.886 | | | | 1.0% | |

Credit Portfolio - Currency Breakdown
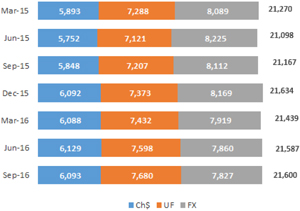
On September 30, 2016, Ch$7,827 million of our total credit portfolio was denominated in, or indexed to, foreign currencies. This portion decreased 0.4% in this quarter, mainly due to the appreciation of the Chilean peso against the U.S. dollar.
NPL Ratio (90 days overdue) by segment
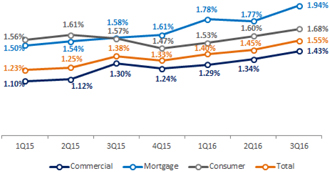
At the end of the third quarter of 2016, our total consolidated NPL ratio for operations 90 days overdue reached 1.55%, an increase of 10 basis points from the previous quarter and of 17 basis points from the same period of 2015. In Chile, the NPL ratio reached 1.42%, stable from the previous quarter.

(This page was intentionally left blank)

Managerial results - Breakdown by country
In this section we present and analyze our results from the operations in Chile and in Colombia separately 3Q’16, 2Q’16 and 3 Q’15:
| | | | | | | | | | | | | | | | | | | | | | | | | | | | | | | | | | | | | | | | |
| | | 3Q’16 | | | | | 2Q’16 | | | | | Change | |
In Ch$ million | | Consoli- dated | | | Chile | | | Colombia | | | | | Consoli- dated | | | Chile | | | Colombia | | | | | Consoli- dated | | | Chile | | | Colombia | |
Net interest income | | | 176,555 | | | | 121,512 | | | | 55,043 | | | | | | 195,069 | | | | 139,343 | | | | 55,726 | | | | | | -18,514 | | | | -17,831 | | | | -683 | |
| | | | | | | | | | | |
Net fee and commission income | | | 45,335 | | | | 34,580 | | | | 10,755 | | | | | | 46,757 | | | | 33,354 | | | | 13,403 | | | | | | -1,422 | | | | 1,226 | | | | -2,648 | |
| | | | | | | | | | | |
Total financial transactions, net | | | 32,157 | | | | 22,258 | | | | 9,899 | | | | | | 23,959 | | | | 7,140 | | | | 16,819 | | | | | | 8,198 | | | | 15,118 | | | | -6,920 | |
| | | | | | | | | | | |
Other operating income | | | -4,768 | | | | -1,912 | | | | -2,856 | | | | | | -4,364 | | | | -3,282 | | | | -1,082 | | | | | | -404 | | | | 1,370 | | | | -1,774 | |
| | | | | | | | | | | |
Net operating profit before loan losses | | | 249,279 | | | | 176,438 | | | | 72,841 | | | | | | 261,421 | | | | 176,555 | | | | 84,866 | | | | | | -12,142 | | | | -117 | | | | -12,025 | |
| | | | | | | | | | | |
Provision for loan losses | | | -64,319 | | | | -29,486 | | | | -34,833 | | | | | | -56,694 | | | | -27,860 | | | | -28,834 | | | | | | -7,625 | | | | -1,626 | | | | -5,999 | |
| | | | | | | | | | | |
Net operating profit | | | 184,960 | | | | 146,952 | | | | 38,008 | | | | | | 204,727 | | | | 148,695 | | | | 56,032 | | | | | | -19,767 | | | | -1,743 | | | | -18,024 | |
| | | | | | | | | | | |
Operating expenses | | | -154,851 | | | | -99,280 | | | | -55,571 | | | | | | -144,953 | | | | -95,194 | | | | -49,759 | | | | | | -9,898 | | | | -4,086 | | | | -5,812 | |
| | | | | | | | | | | |
Operating income | | | 30,109 | | | | 47,672 | | | | -17,563 | | | | | | 59,774 | | | | 53,501 | | | | 6,273 | | | | | | -29,665 | | | | -5,829 | | | | -23,836 | |
| | | | | | | | | | | |
Income from investments in other companies | | | 87 | | | | 80 | | | | 7 | | | | | | 348 | | | | 219 | | | | 129 | | | | | | -261 | | | | -139 | | | | -122 | |
| | | | | | | | | | | |
Income before taxes | | | 30,196 | | | | 47,752 | | | | -17,556 | | | | | | 60,122 | | | | 53,720 | | | | 6,402 | | | | | | -29,926 | | | | -5,968 | | | | -23,958 | |
| | | | | | | | | | | |
Income tax expense | | | -10,931 | | | | -7,238 | | | | -3,693 | | | | | | -10,761 | | | | -5,322 | | | | -5,439 | | | | | | -170 | | | | -1,916 | | | | 1,746 | |
| | | | | | | | | | | |
Net income | | | 19,264 | | | | 40,514 | | | | -21,249 | | | | | | 49,361 | | | | 48,398 | | | | 963 | | | | | | -30,096 | | | | -7,884 | | | | -22,212 | |
Net income attributable to shareholders | | | 24,709 | | | | 40,485 | | | | -15,776 | | | | | | 47,989 | | | | 49,071 | | | | -1,083 | | | | | | -23,279 | | | | -8,586 | | | | -14,694 | |
| | | | | | | | | | | |
| | | | | | | | | | | | | | | | | | | | | | | | | | | | | | | | | | | | | | | | |
| | | 3Q’16 | | | | | 3Q’15 | | | | | Change | |
In Ch$ million | | Consoli- dated | | | Chile | | | Colombia | | | | | Consoli- dated | | | Chile | | | Colombia | | | | | Consoli- dated | | | Chile | | | Colombia | |
Net interest income | | | 176,555 | | | | 121,512 | | | | 55,043 | | | | | | 221,194 | | | | 152,110 | | | | 69,084 | | | | | | -44,639 | | | | -30,598 | | | | -14,041 | |
| | | | | | | | | | | |
Net fee and commission income | | | 45,335 | | | | 34,580 | | | | 10,755 | | | | | | 52,055 | | | | 39,753 | | | | 12,302 | | | | | | -6,720 | | | | -5,173 | | | | -1,547 | |
| | | | | | | | | | | |
Total financial transactions, net | | | 32,157 | | | | 22,258 | | | | 9,899 | | | | | | 51,058 | | | | 33,292 | | | | 17,766 | | | | | | -18,902 | | | | -11,034 | | | | -7,867 | |
| | | | | | | | | | | |
Other operating income | | | -4,768 | | | | -1,912 | | | | -2,856 | | | | | | -1,286 | | | | -2,133 | | | | 847 | | | | | | -3,482 | | | | 221 | | | | -3,703 | |
| | | | | | | | | | | |
Net operating profit before loan losses | | | 249,279 | | | | 176,438 | | | | 72,841 | | | | | | 323,021 | | | | 223,022 | | | | 99,999 | | | | | | -73,742 | | | | -46,584 | | | | -27,158 | |
| | | | | | | | | | | |
Provision for loan losses | | | -64,319 | | | | -29,486 | | | | -34,833 | | | | | | -54,030 | | | | -24,224 | | | | -29,806 | | | | | | -10,289 | | | | -5,262 | | | | -5,027 | |
| | | | | | | | | | | |
Net operating profit | | | 184,960 | | | | 146,952 | | | | 38,008 | | | | | | 268,991 | | | | 198,798 | | | | 70,193 | | | | | | -84,032 | | | | -51,846 | | | | -32,185 | |
| | | | | | | | | | | |
Operating expenses | | | -154,851 | | | | -99,280 | | | | -55,571 | | | | | | -143,923 | | | | -91,608 | | | | -52,315 | | | | | | -10,929 | | | | -7,672 | | | | -3,256 | |
| | | | | | | | | | | |
Operating income | | | 30,109 | | | | 47,672 | | | | -17,563 | | | | | | 125,069 | | | | 107,190 | | | | 17,879 | | | | | | -94,960 | | | | -59,519 | | | | -35,442 | |
| | | | | | | | | | | |
Income from investments in other companies | | | 87 | | | | 80 | | | | 7 | | | | | | 48 | | | | 48 | | | | 0 | | | | | | 39 | | | | 32 | | | | 7 | |
| | | | | | | | | | | |
Income before taxes | | | 30,196 | | | | 47,752 | | | | -17,556 | | | | | | 125,117 | | | | 107,238 | | | | 17,879 | | | | | | -94,921 | | | | -59,487 | | | | -35,435 | |
| | | | | | | | | | | |
Income tax expense | | | -10,931 | | | | -7,238 | | | | -3,693 | | | | | | -28,913 | | | | -21,012 | | | | -7,901 | | | | | | 17,982 | | | | 13,774 | �� | | | 4,208 | |
| | | | | | | | | | | |
Net income | | | 19,264 | | | | 40,514 | | | | -21,249 | | | | | | 96,204 | | | | 86,226 | | | | 9,977 | | | | | | -76,939 | | | | -45,713 | | | | -31,227 | |
Net income attributable to shareholders | | | 24,709 | | | | 40,485 | | | | -15,776 | | | | | | 91,550 | | | | 86,175 | | | | 5,374 | | | | | | -66,840 | | | | -45,690 | | | | -21,150 | |
The financial results of Itau CorpBanca in Chile include some expenses associated with our Colombian operations. To provide a clear view of the contribution of each operation to our consolidated financial results we have reclassified from Chile to Colombia the cost of derivatives structures used to hedge the investment and its related tax effects, as well as the
amortization of intangible assets generated by the acquisition of Santander Colombia that were registered in Chile before the merger. For more details on the pro forma information, please refer to page 5 of this report.

The Accounting and Managerial Income Statement reconciliation for the 9M’16 and 9M’15 is presented below:
| | | | | | | | | | | | | | | | |
9M’16 In Ch$ million | | Accounting Net Income | | Pro forma
consolidation
effects | | Non recurring
events | | Recurrung Net Income | | Cost of Invest-
ment Hedge | | Cost of Fiscal
Hedge | | Amortization of Colombia’s Intangibles in Chile | | Managerial
Recurring
Net Income |
| | | | | | | | |
Consolidated Results | | 53,921 | | -25,939 | | 45,981 | | 73,963 | | - | | - | | - | | 73,963 |
| | | | | | | | |
Chile | | 62,716 | | -26,640 | | 45,981 | | 82,057 | | 6,893 | | 4,080 | | 1,141 | | 94,172 |
| | | | | | | | |
Colombia | | -8,795 | | 700 | | - | | -8,095 | | -6,893 | | -4,080 | | -1,141 | | -20,209 |
| | | | | | | | |
| | | | | | | | | | | | | | | | |
9M’15 In Ch$ million | | Accounting Net Income | | Pro forma
consolidation
effects | | Non recurring
events | | Recurrung Net Income | | Cost of Invest-
ment Hedge | | Cost of Fiscal
Hedge | | Amortization of Colombia’s Intangibles in Chile | | Managerial
Recurring
Net Income |
| | | | | | | | |
Consolidated Results | | 66,631 | | 159,180 | | 20,322 | | 246,133 | | - | | - | | - | | 246,133 |
| | | | | | | | |
Chile | | 66,631 | | 121,448 | | 20,322 | | 208,401 | | 996 | | 4,138 | | 3,907 | | 217,443 |
| | | | | | | | |
Colombia | | - | | 37,732 | | - | | 37,732 | | -996 | | -4,138 | | -3,907 | | 28,689 |
Managerial reclassifications:
| | |
| (a) | | Cost of investment Hedge: carry cost of the derivatives used for the economic hedge of the investment in Colombia booked in Chile. |
| (b) | | Cost of Fiscal Hedge: cost of the derivative structure used for the fiscal hedge of the investment in Colombia booked in Chile. |
| (c) | | Amortization of Colombia´s intangibles in Chile: amortization of intangibles generated by the acquisition of Santander Colombia. |

Managerial results - Breakdown for Chile
Net Income analysis for Chile presented below is based on the Managerial Income Statement with the adjustments shown on pages 16:
| | | | | | | | | | | | | | | | | | | | | | | | | | | | | | | | | | | | | | | | | | | | | | | | | | | | | | |
| | | | | | | | | | | change | | | | | | | | | | change | | | | | | | | | | | | | change | |
| In Ch$ million | | 3Q’16 | | | 2Q’16 | | | | | % | | | $ | | | | | 3Q’15 | | | | | % | | | $ | | | | | 9M’16 | | | 9M’15 | | | | | % | | | $ | |
| | | | | | | | | | | | | | | | |
| Net interest income | | | 121,512 | | | | 139,343 | | | | | | -12.8 | % | | | -17,831 | | | | | | 152,110 | | | | | | -20.1 | % | | | -30,598 | | | | | | 390,308 | | | | 418,756 | | | | | | -6.8 | % | | | -28,449 | |
| | | | | | | | | | | | | | | | |
| Net fee and commission income | | | 34,580 | | | | 33,354 | | | | | | 3.7 | % | | | 1,226 | | | | | | 39,753 | | | | | | -13.0 | % | | | -5,173 | | | | | | 99,108 | | | | 124,880 | | | | | | -20.6 | % | | | -25,771 | |
| | | | | | | | | | | | | | | | |
| Total financial transactions, net | | | 22,258 | | | | 7,140 | | | | | | 211.7 | % | | | 15,118 | | | | | | 33,292 | | | | | | -33.1 | % | | | -11,034 | | | | | | 34,197 | | | | 67,730 | | | | | | -49.5 | % | | | -33,533 | |
| | | | | | | | | | | | | | | | |
| Other operating income, net | | | -1,912 | | | | -3,282 | | | | | | -41.7 | % | | | 1,370 | | | | | | -2,133 | | | | | | -10.4 | % | | | 221 | | | | | | -11,189 | | | | -4,408 | | | | | | 153.8 | % | | | -6,781 | |
| | | | | | | | | | | | | | | | |
| Net operating profit before loan losses | | | 176,438 | | | | 176,555 | | | | | | -0.1 | % | | | -117 | | | | | | 223,022 | | | | | | -20.9 | % | | | -46,584 | | | | | | 512,424 | | | | 606,958 | | | | | | -15.6 | % | | | -94,534 | |
| Provision for loan losses | | | -29,486 | | | | -27,860 | | | | | | 5.8 | % | | | -1,626 | | | | | | -24,224 | | | | | | 21.7 | % | | | -5,262 | | | | | | -125,527 | | | | -69,872 | | | | | | 79.7 | % | | | -55,655 | |
| | | | | | | | | | | | | | | | |
| Net operating profit | | | 146,952 | | | | 148,695 | | | | | | -1.2 | % | | | -1,743 | | | | | | 198,798 | | | | | | -26.1 | % | | | -51,846 | | | | | | 386,897 | | | | 537,086 | | | | | | -28.0 | % | | | -150,189 | |
| | | | | | | | | | | | | | | | |
| Operating expenses | | | -99,280 | | | | -95,194 | | | | | | 4.3 | % | | | -4,086 | | | | | | -91,608 | | | | | | 8.4 | % | | | -7,672 | | | | | | -291,524 | | | | -269,848 | | | | | | 8.0 | % | | | -21,675 | |
| | | | | | | | | | | | | | | | |
| Operating income | | | 47,672 | | | | 53,501 | | | | | | -10.9 | % | | | -5,829 | | | | | | 107,190 | | | | | | -55.5 | % | | | -59,519 | | | | | | 95,373 | | | | 267,238 | | | | | | -64.3 | % | | | -171,864 | |
| | | | | | | | | | | | | | | | |
| Income from investments in other companies | | | 80 | | | | 219 | | | | | | -63.5 | % | | | -139 | | | | | | 48 | | | | | | 66.7 | % | | | 32 | | | | | | 301 | | | | 402 | | | | | | -25.1 | % | | | -101 | |
| | | | | | | | | | | | | | | | |
| Income before taxes | | | 47,752 | | | | 53,720 | | | | | | -11.1 | % | | | -5,968 | | | | | | 107,238 | | | | | | -55.5 | % | | | -59,487 | | | | | | 95,674 | | | | 267,640 | | | | | | -64.3 | % | | | -171,965 | |
| | | | | | | | | | | | | | | | |
| Income tax expense | | | -7,238 | | | | -5,322 | | | | | | 36.0 | % | | | -1,916 | | | | | | -21,012 | | | | | | -65.6 | % | | | 13,774 | | | | | | -2,157 | | | | -50,149 | | | | | | -95.7 | % | | | 47,992 | |
| | | | | | | | | | | | | | | | |
| Net income | | | 40,514 | | | | 48,398 | | | | | | -16.3 | % | | | -7,884 | | | | | | 86,226 | | | | | | -53.0 | % | | | -45,713 | | | | | | 93,517 | | | | 217,490 | | | | | | -57.0 | % | | | -123,973 | |
| Net income attributable to shareholders | | | 40,485 | | | | 49,071 | | | | | | -17.5 | % | | | -8,586 | | | | | | 86,175 | | | | | | -53.0 | % | | | -45,690 | | | | | | 94,172 | | | | 217,443 | | | | | | -56.7 | % | | | -123,271 | |

Net Interest Income
In the third quarter of 2016, the Net Interest Income totaled Ch$121,512 million, a 12.8% decrease compared to the previous quarter.
Compared to the same period of the previous year, the Net Interest Income decrease 20.1%.
| | | | | | | | | | | | | | | | | | | | | | | | | | | | |
In Ch$ million, end of period | | 3Q16 | | | 2Q16 | | | change | | | 3Q15 | | | change | |
Net Interest Income | | | 121,512 | | | | 139,343 | | | | -17,831 | | | | -12.8% | | | | 152,110 | | | | -30,598 | | | | -20.1% | |
| | | | | | | |
Interest Income | | | 287,445 | | | | 318,026 | | | | -30,581 | | | | -9.6% | | | | 347,307 | | | | -59,862 | | | | -17.2% | |
| | | | | | | |
Interest Expense | | | (165,933) | | | | (178,683) | | | | 12,750 | | | | -7.1% | | | | -195,198 | | | | 29,265 | | | | -15.0% | |
| | | | | | | |
Average Interest-Earning Assets | | | 18,883,711 | | | | 19,272,620 | | | | -388,909 | | | | -2.0% | | | | 18,539,963 | | | | 343,748 | | | | 1.9% | |
| | | | | | | |
Net Interest Margin | | | 2.6% | | | | 2.9% | | | | | | | | (28) bp | | | | 3.3% | | | | | | | | (65 bp) | |
| | | | | | | |
Net Interest Margin (ex-inflation indexation) | | | 2.4% | | | | 2.4% | | | | | | | | 0 bp | | | | 2.3% | | | | | | | | 2 bp | |
3Q16 versus 2Q16
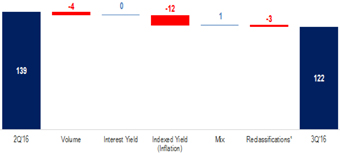
Our Net Interest Income in the third quarter of 2016 presented a decrease of Ch$17,831 million, or 12.8% when compared to the second quarter of 2016. This decrease is explained mainly by a reduction in inflation in the quarter. The UF (Unidad de Fomento), the official inflation-linked unit of account has increased 0.66% in the quarter compared to a 0.93% increase in the 2Q16, which led to a 28 basis points decline in our Net Interest Margin. Excluding inflation-indexation effects, our Net Interest Margin remained stable in the quarter.
The Net Interest Income in the 3Q16 was also impacted by the reclassification of some financial instruments from the available-for-sale to the held-for-trading category in the quarter. As a consequence of this, all year-to-date accrued income from these instruments was reclassified to Total Financial Transactions, net in our income statement.
3Q16 versus 3Q15
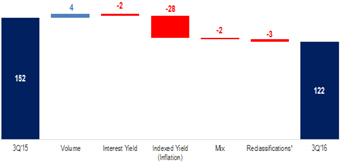
When compared to the third quarter of 2015, our Net Interest Income declined Ch$ 30,598 million, or 20.1%. The main driver for this decrease is the lower inflation in the quarter when compared to the same period of the previous year. The UF increased 1.46% in the third quarter of 2015, which is 2.2x the increase in the third quarter of 2016.
The comparison to the third quarter of 2015 is also affected by the reclassification of accrued income in the P&L as previously explained.
Excluding the inflation–indexing effects, our net interest margin presented 2 basis points improvement, slightly better than the Chilean financial system, reflecting in our debt spreads.
Quarterly change of the Net Interest Margin (Ch$ Billion)
Yearly change of the Net Interest Margin (Ch$ Billion)

Credit Portfolio by Products
In the table below, the loan portfolio is split into two groups: wholesale lending and retail lending. For a better understanding of the performance of these portfolios, the main product groups of each segment are presented below:
| | | | | | | | | | | | | | | | | | | | |
In Ch$ million, end of period | | 3Q16 | | | 2Q16 | | | change | | | 3Q15 | | | change | |
Wholesale lending - Chile | | | 11,724,347 | | | | 11,779,308 | | | | -0.5% | | | | 11,439,759 | | | | 2.5% | |
Commercial loans | | | 10,209,915 | | | | 10,256,902 | | | | -0.5% | | | | 9,684,578 | | | | 5.4% | |
| | | | | |
Foreign trade loans | | | 864,988 | | | | 881,041 | | | | -1.8% | | | | 1,055,718 | | | | -18.1% | |
| | | | | |
Leasing & Factoring | | | 649,444 | | | | 641,365 | | | | 1.3% | | | | 699,463 | | | | -7.2% | |
| | | | | |
Retail lending - Chile | | | 4,615,810 | | | | 4,595,528 | | | | 0.4% | | | | 4,520,509 | | | | 2.1% | |
| | | | | |
Residential Mortgage loans | | | 3,315,228 | | | | 3,303,479 | | | | 0.4% | | | | 3,238,834 | | | | 2.4% | |
| | | | | |
Consumer loans | | | 1,300,582 | | | | 1,292,049 | | | | 0.7% | | | | 1,281,675 | | | | 1.5% | |
| | | | | |
Consumer installment loans | | | 854,975 | | | | 838,351 | | | | 2.0% | | | | 846,859 | | | | 1.0% | |
| | | | | |
Current account overdrafts | | | 167,703 | | | | 162,185 | | | | 3.4% | | | | 156,791 | | | | 7.0% | |
| | | | | |
Credit card debtors | | | 276,946 | | | | 290,543 | | | | -4.7% | | | | 276,976 | | | | 0.0% | |
| | | | | |
Other loans and receivables | | | 958 | | | | 970 | | | | -1.2% | | | | 1,049 | | | | -8.7% | |
TOTAL LOANS | | | 16,340,157 | | | | 16,374,836 | | | | -0.2% | | | | 15,960,268 | | | | 2.4% | |
At the end of the third quarter of 2016, our total consolidated credit portfolio in Chile reached Ch$16,340 billion, a decrease of 0.2% from the previous quarter and an increase of 2.4% from the third quarter of the previous year.
Retail loan portfolio reached Ch$4,616 billion at the end of the third quarter of 2016, relatively stable compared to the previous quarter. Consumer loans reached Ch$1,300 billion, up 0.7% compared the previous quarter. Residential mortgage loans reached Ch$3,315 billion at the end of the third quarter, and increase of 0.4% compared to the previous quarter. The trend in residential mortgage loans reflects the impact of a significant lower pace driven by the bank´s decision to continue to focus on loans with loan-to-values (LTV) below 80% at origination.
On the other hand, wholesale loan portfolio decrease 0.5% in the third quarter of 2016, totaling Ch$11,724 billion. Changes in this portfolio were mainly driven by a decrease in commercial loans. This subdued decrease was mainly due to lower demand from companies, as a result of a more challenging economic environment.

Net provision for Loan Losses - Breakdown for Chile
| | | | | | | | | | | | | | | | | | | | | | | | | | | | | | | | | | | | | | | | | | | | |
In Ch$ million | | 3Q16 | | | 2Q16 | | | change | | | 3Q15 | | | change | | | 9M16 | | | 9M15 | | | change | |
| | | | | | | | | | | |
Provision for Loan Losses | | | -35,161 | | | | -33,201 | | | | -1,960 | | | | 5.9 | % | | | -28,902 | | | | -6,259 | | | | 21.7 | % | | | -140,313 | | | | -85,363 | | | | -54,950 | | | | 64.4 | % |
| | | | | | | | | | | |
Recoveries of loans written-off as losses | | | 5,675 | | | | 5,341 | | | | 334 | | | | 6.3 | % | | | 4,678 | | | | 997 | | | | 21.3 | % | | | 14,786 | | | | 15,491 | | | | -705 | | | | -4.6 | % |
Net provision for Loan Losses | | | -29,486 | | | | -27,860 | | | | -1,626 | | | | 5.8 | % | | | -24,224 | | | | -5,262 | | | | 21.7 | % | | | -125,527 | | | | -69,872 | | | | -55,655 | | | | 79.7 | % |
In the third quarter of 2016, net provision for loan losses (provision for loan losses, net of recovery of loans written off as losses) totaled Ch$29,486 million, a 5.8% increase from the previous quarter, mainly due to the increase in provision expenses due to the revision of ratings for some of our corporate clients.
Provision for loan losses increased 5.9% compared to the previous quarter reflecting corporate clients downgrades. The recovery of loans written off as losses increased 6.3% from the second quarter of 2016.
Net provision for loan losses totaled Ch$125,527 million in the 9M’16, an increase of 79.7% from the same period of 2015. This increase was driven by higher provision for loan losses, which totaled Ch$140,313 million in the period. In the first quarter of 2016, there was an increase due to downgrades of corporate clients in the energy sector. Additionally, income from recovery of loans written off as losses decreased 4.6% compared to the same period of the previous year, and reached Ch$14,786 million in the
Provision for Loan Losses and Loan Portfolio
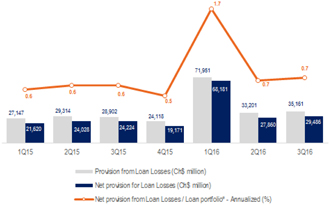
At the end of the third quarter of 2016, our provision for loan losses over loan portfolio was stable at 0.7% compared to the previous quarter and slightly higher than the 0.6% ratio for the third quarter of last year reflecting the slowdown in economic growth.
Net Provision for Loan Losses and Loan Portfolio
Allowance for Loan Losses and Loan Portfolio
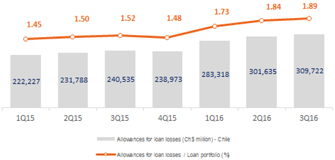
As of September 30, 2016, the loan portfolio decreased 0.2% from June 30, 2016, reaching Ch$16,340 million, whereas the allowance for loan losses increased 2.7% in the quarter, totaling Ch$309,722 million. The ratio of allowance for loan losses to loan portfolio went from 1.84% as of June 30, 2016 to 1.89% as of September 30, 2016, an increase of 5 basis points in the period.

Delinquency Ratios Chile
Non performing Loans
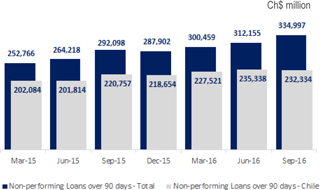
The portfolio of credits overdue for over 90 days decreased 1.3% from June 30, 2016 and increased 5.2% from the same period of the previous year, mainly driven by an increase in the retail segment.
NPL Ratio (%)|over 90 days
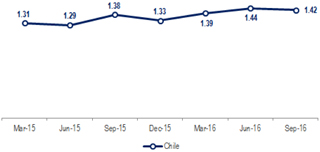
The NPL ratio of credits overdue for over 90 days increased 2 basis points compared to the previous quarter, and reached 1.42% in the end of September 2016. Compared to the same period of 2015, the ratio increased 4 basis points.
In Chile, this ratio reached 1.44% in June 2016, with an increase of 4 basis points compared to the previous quarter. Compared to the same period of 2015, the ratio increased 14 basis points.
NPL Ratio (%) by Segments|over 90 days
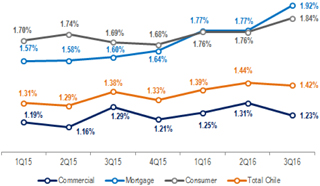
In September 2016, the NPL ratio over 90 days for consumer loans increased from 1.76% to 1.84%. The NPL ratio for mortgage loans also increased by 15 basis points (from 1.77% to 1.92%) from the previous quarter mainly driven by the economic slowdown.
The NPL ratio decreased by 8 basis points for commercial loans from 1.31% to 1.23% compared to June 2016.
Coverage Ratio (%) |90 days
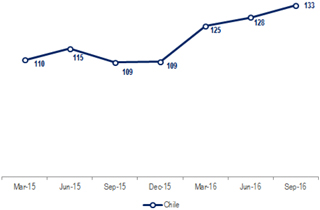
As of September 30, 2016, the 90-days coverage ratio reached 133%, an increase of 500 basis points from the previous quarter.
Compared to September 30, 2015, the total 90-days coverage ratio increased 24 percentage points, mainly due to the increase in complementary allowance of the third quarter of 2015 and also to the increase in the provision for specific economic sectors.
The increasing coverage ratios is driven by an adverse macroeconomic environment.

Loan Portfolio Write-Off
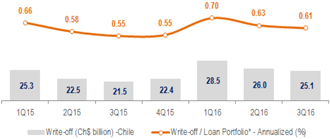
* Loan portfolio average balance of the two previous quarters.
In the third quarter of 2016, the loan portfolio write-off totaled Ch$25.1 billion, a 3.5% decrease compared to the previous quarter. The ratio of written-off operations to loan portfolio average balance reached 0.61%, stable compared with the second quarter of 2016.
Recovery of Loans Written-off as Losses
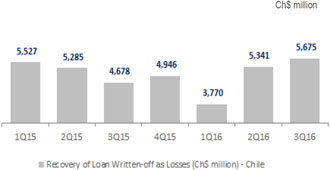
In this quarter, income from recovery of loans written-off as losses increased Ch$334 million, or 6.3%, from the previous quarter.
In the 9’M16, the income from recovery of loans written-off as losses decreased Ch$705 million, or 4.6%, compared to the same period of the previous year, mainly driven by the challenging economic scenario.
NPL Creation
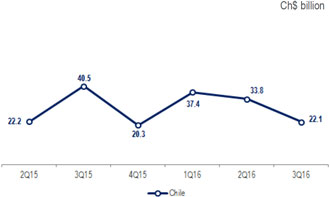
In the third quarter of 2016, the NPL Creation, reached Ch$22.1 billion down 34.6% compared to the previous period.
NPL Creation Coverage
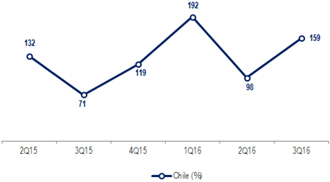
In the third quarter of 2016, the total NPL Creation coverage reached 159%, which means that the provision for loan losses in the quarter was higher than the NPL Creation.

Commissions and Fees Chile
| | | | | | | | | | | | | | | | | | | | | | | | | | | | | | | | | | | | | | | | | | | | |
In Ch$ million | | 3Q16 | | | 2Q16 | | | change | | | 2Q15 | | | change | | | 9M16 | | | 9M15 | | | change | |
Credit & account fees | | | 14,064 | | | | 16,639 | | | | (2,575) | | | | -15.5% | | | | 17,858 | | | | (3,794) | | | | -21.2% | | | | 47,309 | | | | 51,841 | | | | (4,531) | | | | -8.7% | |
| | | | | | | | | | | |
Asset Management & Brokerage fees | | | 3,527 | | | | 6,565 | | | | (3,038) | | | | -46.3% | | | | 7,595 | | | | (4,068) | | | | -53.6% | | | | 16,435 | | | | 22,215 | | | | (5,780) | | | | -26.0% | |
| | | | | | | | | | | |
Insurance Brokerage | | | 6,848 | | | | 5,465 | | | | 1,383 | | | | 25.3% | | | | 6,334 | | | | 514 | | | | 8.1% | | | | 17,806 | | | | 17,882 | | | | (76) | | | | -0.4% | |
| | | | | | | | | | | |
Financial Advisory & Other fees | | | 10,141 | | | | 4,685 | | | | 5,456 | | | | 116.5% | | | | 7,966 | | | | 2,175 | | | | 27.3% | | | | 17,558 | | | | 32,942 | | | | (15,384) | | | | -46.7% | |
Total Net Fee and Comission Income | | | 34,580 | | | | 33,354 | | | | 1,226 | | | | 3.7% | | | | 39,753 | | | | (5,173) | | | | -13.0% | | | | 99,108 | | | | 124,880 | | | | (25,771) | | | | -20.6% | |
In the third quarter of 2016, commissions and fees amounted to Ch$34.580 million, an increase of 3.7% from the previous quarter. Compared to the third quarter of 2015, these revenues decreased 13.0%, mainly driven by lower fees from structuring project financing and syndicated loans.
For the year, commissions and fees reached Ch$99,108 million, a 20.6% decrease from the same period of the previous year, mainly driven by lower investment banking and corporate credit structuring fees due to the economic slowdown.
In the third quarter of 2016, recovery of fees from structuring and / or restructuring loans (up in 116.5%), combined with a 25.3% increase in insurance brokerage were the drivers for this quarter increase compared to previous quarter.
Total Financial Transactions, net
| | | | | | | | | | | | | | | | | | | | | | | | | | | | | | | | | | | | | | | | | | | | |
| In Ch$ million | | 3Q16 | | | 2Q16 | | | change | | | 3Q15 | | | change | | | 9M16 | | | 9M15 | | | change | |
| Trading and investment income: | | | | | | | | | | | | | | | | | | | | | | | | | | | | | | | | | | | | | | | | | | | | |
| | | | | | | | | | | |
Trading investments | | | 7,186 | | | | 900 | | | | 6,286 | | | | 698.4% | | | | 2,331 | | | | 4,855 | | | | 208.3% | | | | 9,657 | | | | 2,939 | | | | 6,717 | | | | 228.5% | |
| | | | | | | | | | | |
Trading financial derivatives contracts | | | 1,747 | | | | 3,775 | | | | (2,028) | | | | -53.7% | | | | 54,713 | | | | (52,966) | | | | -96.8% | | | | (45,671) | | | | 116,914 | | | | (162,585) | | | | -139.1% | |
| | | | | | | | | | | |
Other | | | 1,843 | | | | 1,784 | | | | 59 | | | | 3.3% | | | | 22,587 | | | | (20,744) | | | | -91.8% | | | | 4,567 | | | | 29,352 | | | | (24,785) | | | | -84.4% | |
| | | | | | | | | | | |
Net income from financial operations | | | 10,776 | | | | 6,459 | | | | 4,317 | | | | 66.8% | | | | 79,631 | | | | (68,855) | | | | -86.5% | | | | (31,447) | | | | 149,205 | | | | (180,653) | | | | -121.1% | |
| | | | | | | | | | | |
| Foreign exchange transactions: | | | | | | | | | | | | | | | | | | | | | | | | | | | | | | | | | | | | | | | | | | | | |
| | | | | | | | | | | |
Net results from foreign exchange transactions | | | 3,280 | | | | 2,612 | | | | 668 | | | | 25.6% | | | | (51,198) | | | | 54,478 | | | | - | | | | 70,665 | | | | (79,474) | | | | 150,139 | | | | -188.9% | |
| | | | | | | | | | | |
Revaluations of assets and liabilities denominated in foreign currencies | | | (32) | | | | (217) | | | | 185 | | | | -85.3% | | | | 1,226 | | | | (1,258) | | | | - | | | | (744) | | | | 2,149 | | | | (2,893) | | | | -134.6% | |
| | | | | | | | | | | |
Net results from accounting hedge derivatives | | | 8,234 | | | | (1,714) | | | | 9,948 | | | | - | | | | 3,634 | | | | 4,600 | | | | 126.6% | | | | (4,277) | | | | (4,150) | | | | (127) | | | | 3.1% | |
| | | | | | | | | | | |
Foreign exchange profit (loss), net | | | 11,482 | | | | 681 | | | | 10,801 | | | | 1585.7% | | | | (46,338) | | | | 57,820 | | | | - | | | | 65,644 | | | | (81,475) | | | | 147,119 | | | | -180.6% | |
Total financial transactions, net | | | 22,258 | | | | 7,140 | | | | 15,118 | | | | 211.7% | | | | 33,292 | | | | (11,034) | | | | -33.1% | | | | 34,197 | | | | 67,730 | | | | (33,533) | | | | -49.5% | |
In the third quarter of 2016, total financial transactions and foreign exchange profits amounted to Ch$22,258 million, a 3.1x increase from the previous quarter. Compared to the third quarter of 2015, these revenues decreased 33.1%.
This quarter increase compared with the same period of the previous year is explained by the increase in revenues from hedge accounting derivatives and the derivatives commercial activity with customers.
For the year, total financial transactions and foreign exchange profits reached Ch$34,197 million, a 49.5% decrease from the same period of the previous year since the third quarter of 2015 benefited from higher revenues driven by loan portfolio sales.

Operating Expenses
| | | | | | | | | | | | | | | | | | | | | | | | | | | | |
| In Ch$ million | | 3Q16 | | | 2Q16 | | | change | | | 3Q15 | | | change | |
| Personnel Expenses | | | (48,916) | | | | (50,389) | | | | 1,474 | | | | -2.9% | | | | (51,596) | | | | 2,680 | | | | -5.2% | |
| | | | | | | |
| Administrative Expenses | | | (37,844) | | | | (33,329) | | | | (4,515) | | | | 13.5% | | | | (33,666) | | | | (4,178) | | | | 12.4% | |
| | | | | | | |
| Personnel and Administrative Expenses | | | (86,760) | | | | (83,719) | | | | (3,041) | | | | 3.6% | | | | (85,262) | | | | (1,497) | | | | 1.8% | |
| | | | | | | |
Depreciation, amortization and Impairment | | | (12,521) | | | | (11,476) | | | | (1,045) | | | | 9.1% | | | | (6,346) | | | | (6,175) | | | | 97.3% | |
Total Operating Expenses | | | (99,280) | | | | (95,194) | | | | (4,086) | | | | 4.3% | | | | (91,608) | | | | (7,672) | | | | 8.4% | |
Operating expenses totaled Ch$99,280 million in the third quarter of 2016, increasing 4.3% from the second quarter of 2016. This increase is mostly explained by an increase in the amortization of certain intangible assets and an increase in certain administrative expenses such as advertising and promotion and financial system services. During the quarter, we have made some reclassifications of expenses between line, which affected the breakdown between personnel and administrative expenses. When excluding the effects of this reclassifications, personnel expenses remained virtually stable during the quarter.
When compared to the third quarter of 2015, personnel and administrative expenses have increased 1.8%.
Personnel Expenses
Personnel expenses totaled Ch$48,916 million in the third quarter of 2016, a 2.9% decrease when compared to the second quarter. This decrease is mainly explained by a reclassification of some expense lines between personnel and administrative Expenses. Without this effect, expenses remained stable in the quarter.
Number of Employees
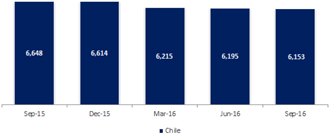
The total number of employees was 6,153 at the end of the third quarter of 2016 compared to 6,195 in the second quarter and 6,648 at the end of the third quarter of 2015, a 7.4% reduction in headcount in a year.
Administrative Expenses
Administrative expenses amounted to Ch$ 37,844 million in the third quarter of 2016, a 13.5% increase when compared to the previous quarter. As previously mentioned, this increase was influenced by reclassifications of expense lines from personnel expenses during the quarter. Also, we have increased advertising and promotion expenses in the quarter.
Depreciation and Amortization
Depreciation and amortization expenses totaled Ch$12,521 million in the third quarter of 2016, a 9.1% increase when compared to the second quarter of the year. This is explained by the increase of amortization of some intangibles assets. When compared to the third quarter of 2015, there was a 97.3% increase that is due to the larger base of intangible assets on the balance sheet since the merger on april 1, 2016.

Efficiency Ratio and Risk-Adjusted Efficiency Ratio Chile
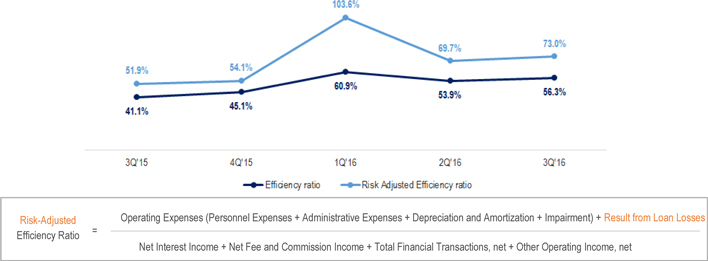
We present the efficiency ratio and the risk-adjusted efficiency ratio, which includes the result from loan losses.
Efficiency Ratio
In the third quarter of 2016, efficiency ratio reached 56.3%, an increase of 240 basis points compared to the second quarter of 2016. This increase was mainly due to the increase of depreciation and amortization, of 9.1%.
When compared to the third quarter of 2015 the efficiency ratio increased 15.2 percentage points, mostly due to the reduction in net operating profit during the period of 20.9%.
Risk – Adjusted Efficiency Ratio
The risk-adjusted efficiency ratio, which also includes the result from loan losses, reached 73.0% in the third quarter of 2016, an increase of 330 basis points compared to the previous quarter, mainly as a result of the increase in amortization.
When compared to the third quarter of 2015, the risk-adjusted efficiency ratio increased 21.1 percentage points mainly due to the decrease of net operating profit before loan losses.
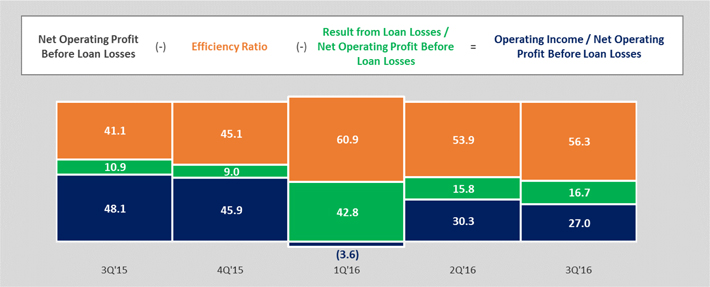
Net Operating Profit Before Loan Losses Distribution
The chart below shows the portions of net operating profit before loan losses used to cover operating expenses and result from loan losses.

Points of Service Chile
Our distribution network provides integrated financial services and products to our customers through diverse channels, including ATMs, traditional branches, internet banking and telephone banking.
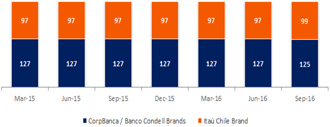
Branches
As part of our merger process, during third quarter of 2016 we started the branch network migration with a pilot test of two offices. As a result, the Brand composition has change.
As of September 30, 2016 we had 400 branches, including Chile and abroad.
In Chile we operate 68 branch offices under “CorpBanca” brand, 99 under the “Itaú” brand and 56 branches under “Banco Condell” brand -our consumer finance division-. Additionally we have one branch in New York.
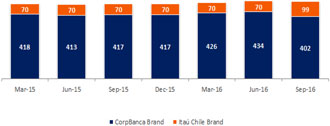
Automated Teller Machines (ATMs)
At the end of the third quarter of 2016, the number of ATMs totaled 680, an increase of 82 units compared to the third quarter of 2015. This increase in the number of ATMs is in third party establishments. Additionally, our customers had access to over 7,900 ATMs in Chile through our agreement with Redbanc.

Managerial results - Breakdown for Colombia
Net Income analysis for Colombia presented below is based of the Managerial Income Statement with the adjustments shown on page 16:
| | | | | | | | | | | | | | | | | | | | | | | | | | | | | | | | | | | | | | | | | | |
| | | 3Q’16 | | | 2Q’16 | | | % | | | 3Q’15 | | % | |
| In Ch$ million | | Nominal Currency | | | Exchange Rate Effect¹ | | | Constant Currency | | | Nominal Currency | | | Exchange Rate Effect¹ | | | Constant Currency | | | Change in Constant Currency | | | Nominal Currency | | | Exchan- ge Rate Effect¹ | | | Constant Currency | | Change in Cons- tant Currency | |
Net interest income | | | 55,043 | | | | -1,222 | | | | 56,265 | | | | 55,726 | | | | -294 | | | | 56,020 | | | | 0.4% | | | | 69,084 | | | | 356 | | | 68,728 | | | -18.1% | |
Net fee and commission income | | | 10,755 | | | | -230 | | | | 10,985 | | | | 13,403 | | | | -106 | | | | 13,509 | | | | -18.7% | | | | 12,302 | | | | 54 | | | 12,248 | | | -10.3% | |
Total financial transactions, net | | | 9,899 | | | | 68 | | | | 9,831 | | | | 16,819 | | | | -141 | | | | 16,960 | | | | -42.0% | | | | 17,766 | | | | 206 | | | 17,560 | | | -44.0% | |
Other operating income, net | | | -2,856 | | | | 78 | | | | -2,934 | | | | -1,082 | | | | 16 | | | | -1,098 | | | | 167.3% | | | | 847 | | | | 17 | | | 830 | | | -453.5% | |
Net operating profit before loan losses | | | 72,841 | | | | -1,305 | | | | 74,146 | | | | 84,866 | | | | -526 | | | | 85,392 | | | | -13.2% | | | | 99,999 | | | | 633 | | | 99,366 | | | -25.4% | |
Provision for loan losses | | | -34,833 | | | | 602 | | | | -35,435 | | | | -28,834 | | | | 274 | | | | -29,108 | | | | 21.7% | | | | -29,806 | | | | -30 | | | -29,776 | | | 19.0% | |
Net operating profit | | | 38,008 | | | | -703 | | | | 38,711 | | | | 56,032 | | | | -252 | | | | 56,284 | | | | -31.2% | | | | 70,193 | | | | 603 | | | 69,590 | | | -44.4% | |
Operating expenses | | | -55,571 | | | | 988 | | | | -56,559 | | | | -49,759 | | | | 310 | | | | -50,069 | | | | 13.0% | | | | -52,315 | | | | -261 | | | -52,054 | | | 8.7% | |
| Operating income | | | -17,563 | | | | 285 | | | | -17,848 | | | | 6,273 | | | | 58 | | | | 6,215 | | | | -387.2. | | | | 17,879 | | | | 342 | | | 17,536 | | | -201.8% | |
Income from investments in other companies | | | 7 | | | | 0 | | | | 7 | | | | 129 | | | | 0 | | | | 129 | | | | -94.6% | | | | 0 | | | | 0 | | | 0 | | | - | |
Income before taxes | | | -17,556 | | | | 285 | | | | -17,842 | | | | 6,402 | | | | 58 | | | | 6,344 | | | | -381.2. | | | | 17,879 | | | | 342 | | | 17,536 | | | -201.7% | |
Income tax expense | | | -3,693 | | | | 140 | | | | -3,833 | | | | -5,439 | | | | 2 | | | | -5,441 | | | | -29.6% | | | | -7,901 | | | | -204 | | | -7,697 | | | -50.2% | |
| Net income | | | -21,249 | | | | 425 | | | | -21,675 | | | | 963 | | | | 60 | | | | 903 | | | | - | | | | 9,977 | | | | 138 | | | 9,840 | | | - | |
| | | | | | | | | | | | |
Net income attributable to shareholders | | | -15,776 | | | | 313 | | | | -16,089 | | | | -1,083 | | | | 43 | | | | -1,126 | | | | - | | | | 5,374 | | | | 92 | | | 5,282 | | | - | |
| | | | | | | | | | | | | | | | | | | | | | | | | | | | | | |
Note: Consists of the elimination of foreign Exchange variation, which is obtained by the application of the foreign Exchange rate of September, 30 2016 to all periods analyzed.

Net Interest Income
In the third quarter of 2016, the Net Interest Income totaled Ch$56,265 million, a 0.4% increase compared to the previous quarter.
Compared to the same period of the previous year, the Net Interest Income decreased 18.1%.
| | | | | | | | | | | | | | | | | | | | | | | | | | | | |
In Ch$ million, end of period | | 3Q16 | | | 2Q16 | | | change | | | 3Q15 | | | change | |
Net Interest Income | | | 56,265 | | | | 56,020 | | | | 244 | | | | 0.4% | | | | 68,728 | | | | -12,463 | | | | -18.1% | |
| | | | | | | |
Interest Income | | | 166,607 | | | | 155,191 | | | | 11,416 | | | | 7.4% | | | | 131,479 | | | | 35,128 | | | | 26.7% | |
| | | | | | | |
Interest Expense | | | -110,342 | | | | -99,170 | | | | -11,172 | | | | 11.3% | | | | -62,751 | | | | -47,591 | | | | 75.8% | |
| | | | | | | |
Average Interest-Earning Assets | | | 6,905,591 | | | | 7,010,180 | | | | -104,588 | | | | -1.5% | | | | 6,569,853 | | | | 335,738 | | | | 5.1% | |
| | | | | | | |
Net Interest Margin | | | 3.2% | | | | 3.2% | | | | | | | | 3 bp | | | | 4.2% | | | | | | | | (94 bp) | |
Note: Managerial results for Colombia are expressed in constant currency, consisting on the elimination of foreign Exchange variation, which is obtained by the application of the foreign Exchange rate of September, 30 2016 to all periods analyzed.
3Q16 versus 2Q16
Our Net Interest Income in the third quarter of 2016 remained stable when compared to the second quarter of 2016, with an increase of Ch$244 million, or 0.4%. The average monetary policy rate was up 64 basis points when compared to previous quarter, impacting our cost of funding. This was offset by an increase in the yield of our loans as the repricing of our assets, that have a longer duration than our liabilities, starts to show some results, and by a more favorable composition of our interest earning assets and interest earning liabilities.
As a result, our Net Interest Margin remained stable in the quarter, with a 3 basis point increase.
3Q16 versus 3Q15
When compared to the third quarter of 2015, our Net Interest Income declined Ch$ 12,463 million, or 18.1%. This is explained by an increase in our cost of funding due to the 307 basis points increase in the average monetary policy rate. As previously mentioned, this increase has an impact in our cost of funding that is faster than the repricing cycle of our assets, which are mostly fixed rate, leading to a 94 basis points compression of our Net Interest Margin when compared to the third quarter of 2015.
Quarterly change of the Net Interest Margin (Ch$ Billion)
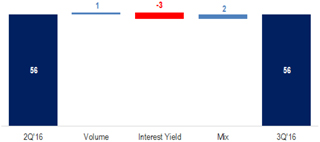
Yearly change of the Net Interest Margin (Ch$ Billion)
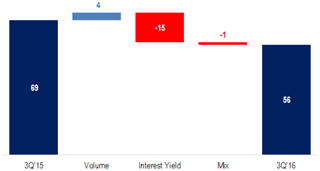

Credit Portfolio by Products
In the table below, the loan portfolio is split into two groups: wholesale lending and retail lending. For a better understanding of the performance of these portfolios, the main product groups of each segment are presented below.
| | | | | | | | | | | | | | | | | | | | |
In Ch$ million, end of period | | 3Q16 | | | 2Q16 | | | change | | | 3Q15 | | | change | |
| | | | | |
| Wholesale lending - Colombia | | | 3,586,565 | | | | 3,595,649 | | | | -0.3% | | | | 3,600,744 | | | | -0.4% | |
| | | | | |
Commercial loans | | | 3,002,622 | | | | 3,010,129 | | | | -0.2% | | | | 3,033,475 | | | | -1.0% | |
| | | | | |
Current account overdrafts | | | 28,048 | | | | 18,495 | | | | 51.7% | | | | 30,692 | | | | -8.6% | |
| | | | | |
Leasing & Factoring | | | 542,047 | | | | 553,075 | | | | -2.0% | | | | 520,499 | | | | 4.1% | |
| | | | | |
Other loans and receivables | | | 13,848 | | | | 13,950 | | | | -0.7% | | | | 16,078 | | | | -13.9% | |
| | | | | |
| | | - | | | | - | | | | | | | | - | | | | | |
| | | | | |
| Retail lending - Colombia | | | 1,673,521 | | | | 1,663,462 | | | | 0.6% | | | | 1,646,564 | | | | 1.6% | |
| | | | | |
Residential Mortgage loans | | | 525,021 | | | | 516,033 | | | | 1.7% | | | | 496,395 | | | | 5.8% | |
| | | | | |
Housing leasing | | | 288,997 | | | | 286,377 | | | | 0.9% | | | | 276,778 | | | | 4.4% | |
| | | | | |
Consumer loans | | | 1,148,500 | | | | 1,147,428 | | | | 0.1% | | | | 1,150,169 | | | | -0.1% | |
| | | | | |
Consumer loans payments | | | 911,490 | | | | 900,266 | | | | 1.2% | | | | 872,051 | | | | 4.5% | |
| | | | | |
Current account overdrafts | | | 4,114 | | | | 4,132 | | | | -0.4% | | | | 4,508 | | | | -8.7% | |
| | | | | |
Credit card debtors | | | 131,260 | | | | 136,082 | | | | -3.5% | | | | 155,079 | | | | -15.4% | |
| | | | | |
Leasing consumer | | | 16,851 | | | | 17,908 | | | | -5.9% | | | | 18,644 | | | | -9.6% | |
| | | | | |
Other loans and receivables | | | 84,785 | | | | 89,040 | | | | -4.8% | | | | 99,888 | | | | -15.1% | |
| | | | | |
| | | - | | | | - | | | | | | | | - | | | | | |
| TOTAL LOANS | | | 5,260,086 | | | | 5,259,111 | | | | 0.0% | | | | 5,247,309 | | | | 0.2% | |
Note: Loan portfolio for Colombia is expressed in constant currency, consisting on the elimination of foreign exchange variation, which is obtained by the application of the foreign exchange rate of September, 30 2016 to all periods analyzed.
Excluding the effect of the foreign exchange variation, at the end of the third quarter of 2016, the Colombian portfolio was stable and reached Ch$5,260 billion, when compared to the previous quarter and increased 0.2% during the 12-month period.
Retail loan portfolio reached Ch$1,674 billion at the end of the third quarter of 2016, an increase of 0.6% compared to the previous quarter. Consumer loans reached Ch$1,148 billion, up 0.1% compared the previous quarter. Residential mortgage loans reached Ch$525 million at the end of the third quarter, and increase of 1.7% compared to the previous quarter.
On the other hand, wholesale loan portfolio trend reflects the impact of a significantly lower pace of growth driven by the economic slowdown. Commercial loans decreased 0.3% in the third quarter of 2016, totaling Ch$3,587 billion and 0.4% compared in the 12-month period.

Net provision for Loan Losses - Breakdown for Colombia
| | | | | | | | | | | | | | | | | | | | | | | | | | | | | | | | | | | | | | | | | | | | |
In Ch$ million | | 3Q16 | | | 2Q16 | | | change | | | 3Q15 | | | change | | | 9M16 | | | 9M15 | | | change | |
| | | | | | | | | | | |
Provision for Loan Losses | | | -37,500 | | | | -31,252 | | | | -6,247 | | | | 20.0% | | | | -31,867 | | | | -5,633 | | | | 17.7% | | | | -112,794 | | | | -90,533 | | | | -22,261 | | | | 24.6% | |
| | | | | | | | | | | |
Recoveries of loans written-off as losses | | | 2,064 | | | | 2,145 | | | | -80 | | | | -3.7% | | | | 2,091 | | | | -26 | | | | -1.3% | | | | 5,706 | | | | 5,699 | | | | 7 | | | | 0.1% | |
Net provision for Loan Losses | | | -35,435 | | | | -29,108 | | | | -6,328 | | | | 21.7% | | | | -29,776 | | | | -5,659 | | | | 19.0% | | | | -107,088 | | | | -84,834 | | | | -22,254 | | | | 26.2% | |
Note: Managerial results for Colombia are expressed in constant currency, consisting on the elimination of foreign exchange variation, which is obtained by the application of the foreign exchange rate of September, 30 2016 to all periods analyzed.
In the third quarter of 2016, net provision for loan losses (provision for loan losses, net of recovery of loans written off as losses) totaled Ch$35,435 million, a 21.7% increase from the previous quarter, mainly due to the increase in the provision for loan losses.
Provision for loan losses increased 20.0% compared to the previous quarter mainly due to downgrades of corporate clients. The recovery of loans written off as losses decreased 3.7% from the second quarter of 2016.
Net provision for loan losses totaled Ch$107,088 million in the 9M’16, an increase of 26.2% from the same period of 2015. This increase was driven by higher provision for loan losses, which totaled Ch$112,794 million in the period. During 2016, there has been an increase due to downgrades of corporate clients from different sectors. Additionally, income from recovery of loans written off as losses remained flat compared to the same period of the previous year, and reached Ch$5,706 million in the 9M’16.
Provision for Loan Losses and Loan Portfolio
At the end of the third quarter of 2016, our provision for loan losses over loan portfolio was 2.7%, an increase of 0.5 percentage points compared to the previous quarter and off 0.4 percentage points compared to the third quarter of last year reflecting the slowdown in economic growth.
Net Provision for Loan Losses and Loan Portfolio
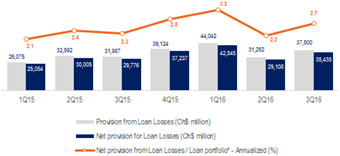
Note: Managerial results for Colombia are expressed in constant currency, consisting on the elimination of foreign exchange variation, which is obtained by the application of the foreign exchange rate of September, 30 2016 to all periods analyzed.
Allowance for Loan Losses and Loan Portfolio
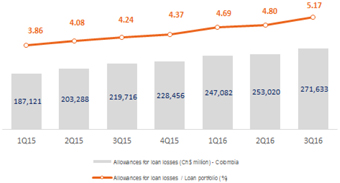
Note: Managerial results for Colombia are expressed in constant currency, consisting on the elimination of foreign exchange variation, which is obtained by the application of the foreign exchange rate of September, 30 2016 to all periods
As of September 30, 2016, the loan portfolio was stable from June 30, 2016, reaching Ch$5,260 million, whereas the allowance for loan losses increased 7.3% in the quarter, totaling Ch$271,633 million. The ratio of allowance for loan losses to loan portfolio went from 4.80% as of June 30, 2016 to 5.17% as of September 30, 2016, an increase of 37 basis points in the period.

Delinquency Ratios Colombia
Non performing Loans
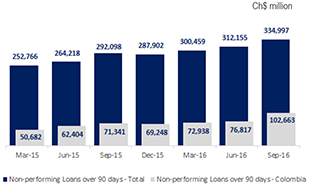
The portfolio of credits overdue for over 90 days increased 33.6% from September 30, 2016 and increased 43.9% from the same period of the previous year, driven by an increase in the comercial and mortgage segments.
NPL Ratio (%) |over 90 days
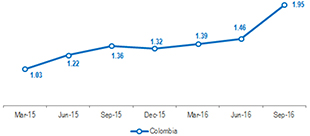
The NPL ratio of credits overdue for over 90 days increased 48 basis points compared to the previous quarter, and reached 1.95% in the end of September 2016. Compared to the same period of 2015, the ratio increased 58 basis points, mainly due to the increased delinquency rates for companies.
NPL Ratio (%) by Segments|over 90 days
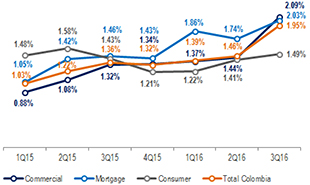
In September 2016, the NPL ratio over 90 days for consumer loans increased from 1.41% to 1.49%. The NPL ratio for mortgage loans increased by 29 basis points (from 1.74% to 2.03%) from the previous quarter mainly driven by the economic slowdown.
The NPL ratio also increased by 65 basis points for commercial loans from 1.44% to 2.09% compared to June 2016.
Coverage Ratio (%) |90 days
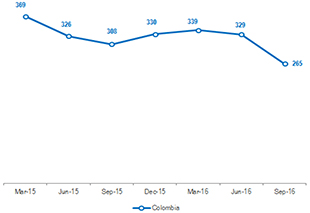
As of September 30, 2016, the 90-days coverage ratio reached 265%, a decrease of 64 percentage points from the previous quarter.
Compared to September 30, 2015, the total 90-days coverage ratio decreased 43 percentage points, mainly due to the increase in the provision for specific clients from the Oil&Gas sector.
It is important to note that the regulatory criteria that we have to follow for the Colombian loan portfolio -for consolidation purposes only- is to apply the most conservative provisioning rule between Chile and Colombia.

Loan Portfolio Write-Off
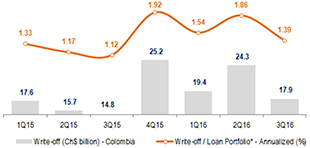
* Loan portfolio average balance of the two previous quarters.
In the third quarter of 2016, the loan portfolio write-off totaled Ch$17.9 billion, a 26.3% decrease compared to the previous quarter. The ratio of written-off operations to loan portfolio average balance reached 1.39%, a decrease compared with the second quarter of 2016.
Recovery of Loans Written-off as Losses
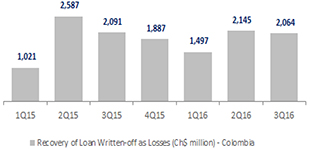
In this quarter, income from recovery of loans written-off as losses decreased Ch$81 million, or 3.8%, from the previous quarter.
In the 9M’16, the income from recovery of loans written-off as losses was stable at Ch$5.706 million compared to the same period of the previous year.
NPL Creation
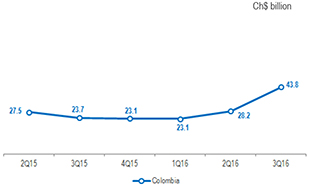
In the third quarter of 2016, the NPL Creation, reached Ch$43.8 billion up 55.3% compared to the previous period, mainly driven by the challenging economic scenario.
NPL Creation Coverage
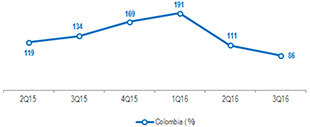
In the third quarter of 2016, the total NPL Creation coverage reached 86%.

Commissions and Fees Colombia
| | | | | | | | | | | | | | | | | | | | | | | | | | | | | | | | | | | | | | | | | | | | |
In Ch$ million | | 3Q16 | | | 2Q16 | | | change | | | 3Q15 | | | change | | | 9M16 | | | 9M15 | | | change | |
Credit & account fees | | | 7,224 | | | | 10,394 | | | | (3,170) | | | | -30.5% | | | | 9,230 | | | | (2,006) | | | | -21.7% | | | | 26,325 | | | | 26,134 | | | | 192 | | | | 0.7% | |
| | | | | | | | | | | |
Asset Management & Brokerage fees | | | 3,452 | | | | 3,582 | | | | (130) | | | | -3.6% | | | | 2,650 | | | | 803 | | | | 30.3% | | | | 11,891 | | | | 10,590 | | | | 1,300 | | | | 12.3% | |
| | | | | | | | | | | |
Insurance Brokerage | | | - | | | | - | | | | - | | | | n.a. | | | | - | | | | - | | | | n.a. | | | | - | | | | - | | | | - | | | | n.a. | |
| | | | | | | | | | | |
Financial Advisory & Other fees | | | 309 | | | | (468) | | | | 776 | | | | -166.0% | | | | 368 | | | | (60) | | | | -16.2% | | | | (349) | | | | (379) | | | | 31 | | | | -8.1% | |
| | | | | | | | | | | | | | | | | | | | | | | | | | | | | | | | | | | | | | | | | | | | |
Total Net Fee and Commission Income | | | 10,985 | | | | 13,509 | | | | (2,524) | | | | -18.7% | | | | 12,248 | | | | (1,263) | | | | -10.3% | | | | 37,868 | | | | 36,345 | | | | 1,523 | | | | 4.2% | |
Note: Managerial results for Colombia are expressed in constant currency, consisting on the elimination of foreign exchange variation, which is obtained by the application of the foreign exchange rate of September, 30 2016 to all periods analyzed.
In the third quarter of 2016, commissions and fees amounted to Ch$10,985 million, a decrease of 18.7% from the previous quarter. Compared to the third quarter of 2015, these revenues decreased 10.3%, mainly driven by credit and account fees. For the year, commissions and fees reached Ch$37,868 million, a 4.2% an increase from the same period of the previous year, mainly driven by higher asset management and brokerage fees.
Total Financial Transactions, net
| | | | | | | | | | | | | | | | | | | | | | | | | | | | | | | | | | | | | | | | | | | | |
| In Ch$ million | | 3Q16 | | | 2Q16 | | | change | | | 3Q15 | | | change | | | 9M16 | | | 9M15 | | | change | |
Trading and investment income: | | | | | | | | | | | | | | | | | | | | | | | | | | | | | | | | | | | | | | | | | | | | |
| | | | | | | | | | | |
Trading investments | | | 9,517 | | | | 12,106 | | | | (2,589) | | | | -21.4% | | | | (5,835) | | | | 15,352 | | | | - | | | | 34,375 | | | | 4,498 | | | | 29,877 | | | | 664.2% | |
| | | | | | | | | | | |
Trading financial derivatives contracts | | | 12,264 | | | | 16,628 | | | | (4,364) | | | | -26.2% | | | | 10,013 | | | | 2,252 | | | | 22.5% | | | | 27,929 | | | | 37,482 | | | | (9,552) | | | | -25.5% | |
| | | | | | | | | | | |
Other | | | 2,939 | | | | 1,196 | | | | 1,743 | | | | 145.7% | | | | 46 | | | | 2,893 | | | | 6254.4% | | | | 3,718 | | | | 4,692 | | | | (974) | | | | -20.8% | |
| | | | | | | | | | | |
Net income from financial operations | | | 24,721 | | | | 29,930 | | | | (5,210) | | | | -17.4% | | | | 4,224 | | | | 20,497 | | | | 485.3% | | | | 66,023 | | | | 46,671 | | | | 19,351 | | | | 41.5% | |
| | | | | | | | | | | |
Foreign exchange transactions: | | | | | | | | | | | | | | | | | | | | | | | | | | | | | | | | | | | | | | | | | | | | |
| | | | | | | | | | | |
Net results from foreign exchange transactions | | | (8,135) | | | | (8,944) | | | | 809 | | | | -9.0% | | | | 16,493 | | | | (24,628) | | | | - | | | | (11,440) | | | | 26,080 | | | | (37,520) | | | | -143.9% | |
| | | | | | | | | | | |
Revaluations of assets and liabilities denominated in foreign currencies | | | - | | | | - | | | | - | | | | - | | | | - | | | | - | | | | - | | | | - | | | | - | | | | - | | | | - | |
| | | | | | | | | | | |
Net results from accounting hedge derivatives | | | (6,632) | | | | (3,978) | | | | (2,654) | | | | 66.7% | | | | (3,146) | | | | (3,486) | | | | 110.8% | | | | (14,438) | | | | (6,626) | | | | (7,813) | | | | 117.9% | |
| | | | | | | | | | | |
Foreign exchange profit (loss), net | | | (14,767) | | | | (12,922) | | | | (1,845) | | | | 14.3% | | | | 13,347 | | | | (28,114) | | | | - | | | | (25,879) | | | | 19,454 | | | | (45,333) | | | | -233.0% | |
Total financial transactions, net | | | 9,954 | | | | 17,009 | | | | (7,055) | | | | -41.5% | | | | 17,571 | | | | (7,617) | | | | -43.4% | | | | 40,144 | | | | 66,126 | | | | (25,982) | | | | -39.3% | |
Note: Managerial results for Colombia are expressed in constant currency, consisting on the elimination of foreign exchange variation, which is obtained by the application of the foreign exchange rate of September, 30 2016 to all periods analyzed.
In the third quarter of 2016, total financial transactions and foreign exchange profits amounted to Ch$9,954 million, a decrease of 41.5% from the previous quarter explained by the contraction of the derivatives commercial activity with customers. Compared to the third quarter of 2015, these revenues decreased 43.4%.
For the year, total financial transactions and foreign exchange profits reached Ch$40,144 million, a 39.3% decrease from the same period of the previous year.

Operating Expenses
| | | | | | | | | | | | | | | | | | | | | | | | | | | | | | | | | | | | | | | | |
In Ch$ million | | 3Q16 | | | | | | 2Q16 | | | | | | change | | | | | | | | | 3Q15 | | | change | | | | |
Personnel Expenses | | | (20,345) | | | | | | | | (18,117) | | | | | | | | (2,227) | | | | 12.3% | | | | | | | | (19,862) | | | | (483) | | | | 2.4% | |
| | | | | | | | | | |
Administrative Expenses | | | (27,012) | | | | | | | | (25,976) | | | | | | | | (1,036) | | | | 4.0% | | | | | | | | (25,158) | | | | (1,854) | | | | 7.4% | |
| | | | | | | | | | |
Personnel and Administrative Expenses | | | (47,357) | | | | | | | | (44,093) | | | | | | | | (3,264) | | | | 7.4% | | | | | | | | (45,019) | | | | (2,337) | | | | 5.2% | |
| | | | | | | | | | |
Depreciation, amortization and Impairment | | | (9,203) | | | | | | | | (5,976) | | | | | | | | (3,227) | | | | 54.0% | | | | | | | | (7,034) | | | | (2,168) | | | | 30.8% | |
Total Operating Expenses | | | (56,559) | | | | | | | | (50,069) | | | | | | | | (6,491) | | | | 13.0% | | | | | | | | (52,054) | | | | (4,506) | | | | 8.7% | |
Note: Managerial results for Colombia are expressed in constant currency, consisting on the elimination of foreign exchange variation, which is obtained by the application of the foreign exchange rate of September, 30 2016 to all periods analyzed.
Operating expenses totaled Ch$56,559 million in the third quarter of 2016, increasing 13.0% from the second quarter of 2016. This increase is mostly explained by a revision of the year-to-date amortization of intangibles, a reversal of bonus provisions in the second quarter of 2016 and a revision of our pension benefit obligation. Excluding these effects total operating expenses would have grown 2.7% in the quarter.
When compared to the third quarter of 2015, operating expenses increased 8.7%. When adjusting for the effects previously mentioned expenses would have increased 2.0%, compared to a 7.3% inflation in the same period.
Personnel Expenses
Personnel expenses totaled Ch$20,345 million in the third quarter of 2016, a 12.3% increase when compared to the second quarter. This increase was mainly due to a reversal of bonus provisions in the second quarter of 2016 that represented for the majority of the increase in profit sharing expenses and a revision of pension benefit liabilities. Excluding these effects personnel expenses would have increased 2.1%
When compared to the third quarter of 2015, personnel expenses increased 2.4% due the revision of pension benefits previously mentioned. Adjusting for this effect personnel expenses would have decreased 1.0% in the period due to lower profit sharing expenses and lower compensation expense growth.
Number of Employees
The total number of employees was 3,669 at the end of the third quarter of 2016 compared to 3,664 in the second quarter and 3,760 at the end of the third quarter of 2015, a 2.4% reduction in headcount in a year.
Administrative Expenses
Administrative expenses amounted to Ch$ 27,012 million in the third quarter of 2016, a 4.0% increase when compared to the previous quarter. This decrease was mainly driven by higher third-party services expenses from audit and consultancy services.
When compared to the third quarter of 2015, the 7.4% increase is basically explained by the factors mentioned above. Excluding these effects, administrative expenses would have grown 5.0% compared to a 7.3% inflation in the same period.
Depreciation and Amortization
Depreciation and amortization expenses totaled Ch$9,203 million in the third quarter of 2016, a 54.0% increase when compared to the second quarter of the year and a 30.8% increase when compared to the third quarter of 2015. These increases are explained by a revision of monthly amortization of intangibles for the nine months of 2016 that was expensed in the quarter.
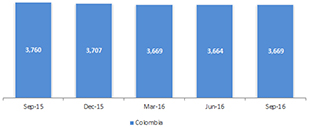

Efficiency Ratio and Risk-Adjusted Efficiency Ratio Colombia
We present the efficiency ratio and the risk-adjusted efficiency ratio, which includes the result from loan losses.
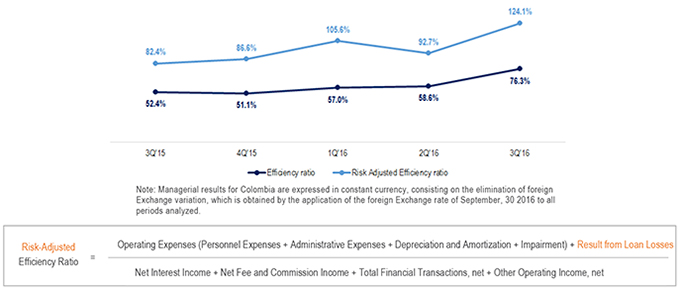
Efficiency Ratio
In the third quarter of 2016, the efficiency ratio reached 76.3%, an increase of 17.7 percentage points compared to the second quarter of 2016. This increase was mainly due to the decrease of net operating profit before loan losses, of 13.2%.
When compared to the third quarter of 2015 the efficiency ratio increased 23.9 percentage points, mostly due to the reduction in net operating profit during the period of 25.4%.
Risk – Adjusted Efficiency Ratio
The risk-adjusted efficiency ratio, which also includes the result from loan losses, reached 124.1% in the third quarter of 2016, an increase of 31.4 percentage points compared to the previous quarter, mainly as a result of the increase in provisions for loan losses in the quarter.
When compared to the third quarter of 2015, the risk-adjusted efficiency ratio increased 42 percentage points mainly due to the decrease of net operating profit before loan losses.
Net Operating Profit Before Loan Losses Distribution
The chart below shows the portions of net operating profit before loan losses used to cover operating expenses and result from loan losses.
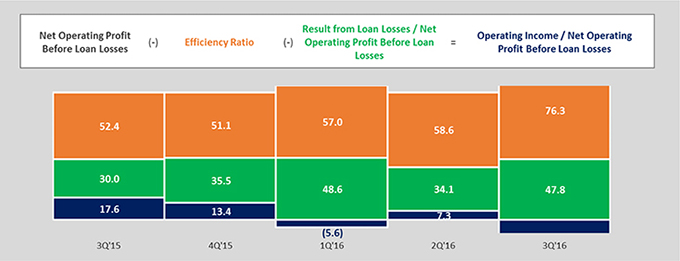

Points of Service Colombia
Our distribution network provides integrated financial services and products to our customers through diverse channels, including ATMs, traditional branches, internet banking and telephone banking.
Branches
As of September 30, 2016, we have 176 branches, in both Colombia and Panama, under the brands CorpBanca and Helm.
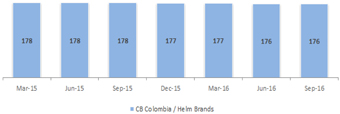
Automated Teller Machines (ATMs)
At the end of the third quarter of 2016, the number of ATMs totaled 179. Additionally, our customers had access to over 14,810 ATMs in Colombia through Colombia’s financial institutions.


Assets
As of September 30, 2016, total assets amounted to Ch$30.1 trillion, down 1.8% compared to the end of the previous quarter and with an increase of 3.0% in 12 months.
The chart below shows the contribution of Chile and Colombia to the total consolidated assets.
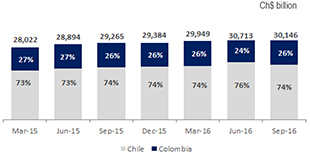
Assets breakdown| September 30, 2016
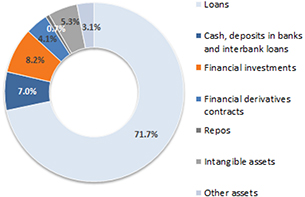
Funding
| | | | | | | | | | | | | | | | | | | | | | | | | | | | |
In Ch$ million, end of period | | 3Q16 | | | | | | 2Q16 | | | change | | | | | | 3Q15 | | | change | |
Demand deposits | | | 4,285,401 | | | | | | | | 5,054,222 | | | | -15.2% | | | | | | | | 4,954,373 | | | | -13.5% | |
| | | | | | | |
Time deposits and saving accounts | | | 12,066,937 | | | | | | | | 12,095,024 | | | | -0.2% | | | | | | | | 12,360,975 | | | | -2.4% | |
| | | | | | | |
Investments sold under repurchase agreements | | | 699,898 | | | | | | | | 332,494 | | | | 110.5% | | | | | | | | 756,754 | | | | -7.5% | |
| | | | | | | |
Mortgage finance bonds | | | 86,687 | | | | | | | | 92,202 | | | | -6.0% | | | | | | | | 111,680 | | | | -22.4% | |
| | | | | | | |
Bonds | | | 4,121,554 | | | | | | | | 3,925,311 | | | | 5.0% | | | | | | | | 3,515,165 | | | | 17.3% | |
| | | | | | | |
Subordinated bonds | | | 1,073,451 | | | | | | | | 1,078,362 | | | | -0.5% | | | | | | | | 1,009,434 | | | | 6.3% | |
| | | | | | | |
Interbank borrowings | | | 2,299,507 | | | | | | | | 2,259,906 | | | | 1.8% | | | | | | | | 1,849,291 | | | | 24.3% | |
| | | | | | | |
Other financial liabilities | | | 20,944 | | | | | | | | 28,537 | | | | -26.6% | | | | | | | | 31,100 | | | | -32.7% | |
Total funding, including interbank deposits, amounted to Ch$22.4 trillion at the end of the third quarter of 2016, a decrease of Ch$248.3 billion compared with the previous quarter. This decrease is driven by the US$553 million capital increase injected in Itaú Chile prior to the merger and by a lower growth pace. This has allowed us to reduce our liabilities.
Our funding strategy is to optimize all sources of funding in accordance with their costs, their availability and our general asset and liability management strategy. The funding structure in the period of time analyzed in this report changed seeking for a longer tenor maturity.
In this context, Itaú CorpBanca successfully placed senior bonds in the local market in the second and third quarters of 2016 for a total of US$884 million approximately (US$524 million in the third quarter). The terms of these bonds are set forth below:


Assets | September 30, 2016
| | | | | | | | | | | | | | | | | | | | | | | | |
| In Ch$ million, end of period | | Consolidated* | | | Business in
Chile | | | Ch$ | | | UF | | | FX | | | Business in
Colombia | |
| | | | | | | | | | | | | | | | | | | | | | | | | |
Cash and deposits in banks | | | 1,816,907 | | | | 1,130,558 | | | | 286,992 | | | | 0 | | | | 843,566 | | | | 686,349 | |
| | | | | | |
Unsettled transactions | | | 470,531 | | | | 466,009 | | | | 292,664 | | | | 0 | | | | 173,345 | | | | 4,522 | |
| | | | | | |
Trading investments | | | 647,641 | | | | 80,940 | | | | 59,798 | | | | 21,095 | | | | 47 | | | | 566,701 | |
| | | | | | |
Available-for-sale investments | | | 1,550,740 | | | | 963,327 | | | | 574,552 | | | | 349,257 | | | | 39,518 | | | | 587,413 | |
| | | | | | |
Held-to-maturity investments | | | 277,475 | | | | 145,232 | | | | 0 | | | | 3,553 | | | | 141,679 | | | | 132,243 | |
| | | | | | |
Investments under resale agreements | | | 209,068 | | | | 29,439 | | | | 29,449 | | | | 0 | | | | -10 | | | | 179,629 | |
| | | | | | |
Financial derivatives contracts | | | 1,221,874 | | | | 1,106,529 | | | | 936,858 | | | | 71,356 | | | | 98,315 | | | | 115,345 | |
| | | | | | |
Interbank loans, net | | | 281,835 | | | | 245,227 | | | | 111,016 | | | | 0 | | | | 134,211 | | | | 36,608 | |
| | | | | | |
Loans and accounts receivable from customers | | | 21,600,243 | | | | 16,340,157 | | | | 6,093,143 | | | | 7,679,602 | | | | 2,567,412 | | | | 5,260,086 | |
| | | | | | |
Loan loss allowances | | | -581,355 | | | | -309,722 | | | | -265,966 | | | | 0 | | | | -43,756 | | | | -271,633 | |
| | | | | | |
Investments in other companies | | | 17,036 | | | | 12,477 | | | | 12,477 | | | | 0 | | | | 0 | | | | 4,559 | |
| | | | | | |
Intangible assets | | | 1,593,612 | | | | 1,375,631 | | | | 1,375,562 | | | | 0 | | | | 69 | | | | 217,981 | |
| | | | | | |
Property, plant and equipment | | | 124,587 | | | | 76,333 | | | | 75,118 | | | | 0 | | | | 1,215 | | | | 48,254 | |
| | | | | | |
Current taxes | | | 122,745 | | | | 105,128 | | | | 101,744 | | | | 0 | | | | 3,384 | | | | 17,617 | |
| | | | | | |
Deferred taxes | | | 235,486 | | | | 193,614 | | | | 175,864 | | | | 0 | | | | 17,750 | | | | 41,872 | |
| | | | | | |
Other assets | | | 557,550 | | | | 482,195 | | | | 242,193 | | | | 2,148 | | | | 237,854 | | | | 75,355 | |
Total Assets | | | 30,145,975 | | | | 22,443,074 | | | | 10,101,464 | | | | 8,127,011 | | | | 4,214,599 | | | | 7,702,901 | |
| | | | | | |
Liabilities | September 30, 2016 | | | | | | | | | | | | | | | | | | | | | | | | |
| In Ch$ million, end of period | | Consolidated* | | | Business in
Chile | | | Ch$ | | | UF | | | FX | | | Business in
Colombia | |
| | | | | | | | | | | | | | | | | | | | | | | | | |
Deposits and other demand liabilities | | | 4,285,401 | | | | 2,138,317 | | | | 1,718,677 | | | | 8,013 | | | | 411,627 | | | | 2,147,084 | |
| | | | | | |
Unsettled transactions | | | 382,922 | | | | 382,922 | | | | 170,413 | | | | 0 | | | | 212,509 | | | | 0 | |
| | | | | | |
Investments sold under repurchase agreements | | | 699,898 | | | | 154,798 | | | | 115,211 | | | | 0 | | | | 39,587 | | | | 545,100 | |
| | | | | | |
Time deposits and other time liabilities | | | 12,066,937 | | | | 9,171,159 | | | | 6,352,078 | | | | 1,608,732 | | | | 1,210,349 | | | | 2,895,778 | |
| | | | | | |
Financial derivatives contracts | | | 1,002,115 | | | | 938,783 | | | | 762,118 | | | | 100,528 | | | | 76,137 | | | | 63,332 | |
| | | | | | |
Interbank borrowings | | | 2,299,507 | | | | 1,710,208 | | | | -6,708 | | | | 0 | | | | 1,716,916 | | | | 589,299 | |
| | | | | | |
Issued debt instruments | | | 5,281,692 | | | | 4,776,969 | | | | 196,564 | | | | 3,591,862 | | | | 988,543 | | | | 504,723 | |
| | | | | | |
Other financial liabilities | | | 20,944 | | | | 19,441 | | | | 19,441 | | | | 0 | | | | 0 | | | | 1,503 | |
| | | | | | |
Current taxes | | | 0 | | | | 0 | | | | 0 | | | | 0 | | | | 0 | | | | 0 | |
| | | | | | |
Deferred taxes | | | 237,643 | | | | 121,043 | | | | 120,941 | | | | 0 | | | | 102 | | | | 116,600 | |
| | | | | | |
Provisions | | | 172,383 | | | | 99,434 | | | | 94,283 | | | | 0 | | | | 5,151 | | | | 72,949 | |
| | | | | | |
Other liabilities | | | 267,728 | | | | 207,174 | | | | 178,245 | | | | 0 | | | | 28,929 | | | | 60,554 | |
| | | | | | |
Total Liabilities | | | 26,717,170 | | | | 19,720,248 | | | | 9,721,263 | | | | 5,309,135 | | | | 4,689,850 | | | | 6,996,922 | |
| | | | | | |
Capital | | | 1,862,826 | | | | 1,772,377 | | | | 1,772,377 | | | | 0 | | | | 0 | | | | 90,449 | |
| | | | | | |
Reserves | | | 1,294,108 | | | | 676,586 | | | | 676,586 | | | | 0 | | | | 0 | | | | 617,522 | |
| | | | | | |
Valuation adjustment | | | 6,083 | | | | 38 | | | | 38 | | | | 0 | | | | 0 | | | | 6,045 | |
| | | | | | |
Retained Earnings: | | | | | | | | | | | | | | | | | | | | | | | | |
| | | | | | |
Retained earnings or prior periods | | | 0 | | | | -3,251 | | | | -3,251 | | | | 0 | | | | 0 | | | | 3,251 | |
| | | | | | |
Income for the period | | | 53,921 | | | | 66,193 | | | | -11,838 | | | | 68,552 | | | | 9,479 | | | | -12,272 | |
| | | | | | |
Minus: Provision for mandatory dividend | | | -26,960 | | | | -26,960 | | | | -26,960 | | | | 0 | | | | 0 | | | | 0 | |
| | | | | | |
Attributable to bank shareholders | | | 3,189,978 | | | | 2,484,983 | | | | 2,406,952 | | | | 68,552 | | | | 9,479 | | | | 704,995 | |
| | | | | | |
Non-controlling interest | | | 238,827 | | | | 237,843 | | | | 237,843 | | | | 0 | | | | 0 | | | | 984 | |
| | | | | | |
Total Equity | | | 3,428,805 | | | | 2,722,826 | | | | 2,644,795 | | | | 68,552 | | | | 9,479 | | | | 705,979 | |
Total equity and liabilities | | | 30,145,975 | | | | 22,443,074 | | | | 12,366,058 | | | | 5,377,687 | | | | 4,699,329 | | | | 7,702,901 | |
* Consolidated data not only considers Chile and Colombia but also adjustments related to intercompany and minority shareholders.

Solvency Ratios1

Note:(1) According to SBIF BIS I definitions.(2) Tier I = Basic Capital, according to SBIF BIS I definitions.(3) BIS Ratio= Regulatory capital / RWA, according to SBIF BIS I definitions.
Minimum Capital Requirement
Our minimum capital requirements follow the set of rules disclosed by the SBIF, which implement the Basel I capital requirements standards in Chile. These requirements are expressed as ratios of available capital - stated by the Referential Equity, or of Total Capital, composed of Tier I Capital and Tier II Capital - and the risk-weighted assets, or RWA. Minimum total capital requirement corresponds to 10.0%.
Itaú CorpBanca will target a capital ratio based on the greater of 120% of the minimum regulatory capital requirement of the average regulatory capital ratio of the three largest private banks in Chile and Colombia.
As of august 31, 2016, the last public information published by the SBIF, the average regulatory capital ratio of the three largest private banks in Chile was 13.3%.
Quarterly evolution of the Regulatory Capital Ratio
At the end of third quarter of 2016 our Regulatory Capital Ratio reached 13.7%, a 45 basis point increase when compared to the second quarter.
This increase is mainly explained by a decrease of 2.3% in our risk weighted assets and by an increase in our subordinated bonds, due to accrual.
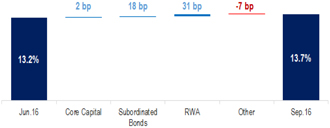

(This page was intentionally left blank)


Ownership Structure
Itaú CorpBanca capital stock is comprised of 512,406,760,091 common shares traded on the Santiago Stock Exchange. Shares are also traded as depositary receipts on the New York Stock Exchange as ADRs.
After the merger was completed on April 1, 2016, Itaú CorpBanca is being controlled by Itaú Unibanco. On October 26, 2016 Itaú Unibanco indirectly acquired 2.13% share capital of Itaú CorpBanca from the Saieh Family. As a result of this acquisition current shareholders structure is as follows:
Shareholders - % Total share capital
October 26, 2016
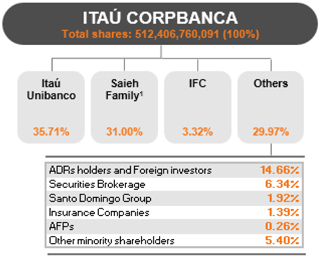
1- Includes 52,125,023 shares owned by Saga that are under custody.
Stock Market Performance | 3Q16
Average daily traded volumes 12 months ended
September 30, 2016
(US$ million)
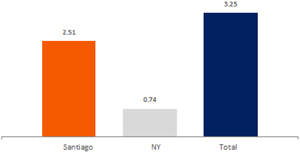
Itaú CorpBanca ADR (ITCB)
ITAUCORP vs IPSA Index
Dividends
The following table shows dividends per share distributed during the past five years.
| | | | | | | | | | |
Charge to Fiscal Year | | Year
paid | | Net Income
(Ch$mn) | | % Distributed | | Distributed
Income
(Ch$mn) | | Peso per Share (Ch$ of each
year) |
| | | | | | | | | | | |
2011 | | 2012 | | 122,849 | | 100% | | 122,849 | | 0.4906940357 |
2012 | | 2013 | | 120,080 | | 50% | | 60,040 | | 0.1764023878 |
2013 | | 2014 | | 155,093 | | 57% | | 88,403 | | 0.2597360038 |
2014 | | 2015 | | 226,093 | | 50% | | 113,047 | | 0.3321397925 |
Retained Earnings | | 2015 | | 239,860 | | 100% | | 239,860 | | 0.7047281480 |
2015 | | 2016 | | 201,771 | | 50% | | 100,886 | | 0.2964098300 |
2015 | | 2016 | | 201,771 | | UF 124,105 | | 3,197 | | 0.0093918800 |
| | | | | | | | | | | |
Itaú CorpBanca (former CorpBanca) paid its annual dividend of Ch$0.30580171/share in Chile on March 11, 2016. The dividend included (i) 50% of 2015 Net Income (Ch$0.2964093/share) and pending UF 124,105 of the special dividend distribution partly paid on June 2015 (Ch$0.00939188). Both equivalent to a dividend yield of 5.3%, as well as a 8.0% decrease compared to the annual dividend paid in 2015.
For purposes of capital requirements, annual dividends are provisioned at 50%. Dividend policy approved by shareholders in March 2016 in the Annual Shareholders Meeting is to distribute a final dividend of 100% of the annual net income net from the necessary reserves to comply with capital ratios defined as “ Optimum Regulatory Capital ” in the Shareholders Agreement whose terms are part of “ Transaction Agreement ” executed on January 29, 2014.

Credit Risk Ratings
International credit risk rating
On a global scale, Itaú CorpBanca is rated by two world-wide recognized agencies: Moody´s Investors Service and Standard & Poor´s Global Ratings.
On April 28, 2016,Moody´s Investors Service (Moody’s) upgraded to ‘A3’ from ‘Baa3’ following the merger of Banco Itaú Chile with and into CorpBanca on April 1, 2016.
| | |
| Moody´s | | Rating |
Long-term foreign currency deposits | | A3 |
Long-term foreign currency debt | | A3 |
Short-term foreign currency deposits | | Prime-2 |
Outlook | | Stable |
On June 13, 2016,Standard & Poor´s Global Ratings (S&P) upgraded Itaú CorpBanca from ‘BBB’ to ‘BBB+’ following the completion of the merger. The outlook is ‘Stable’.
| | |
| Standard & Poor´s | | Rating |
Long-term issuer credit rating | | BBB+ |
Short-term issuer credit rating | | A-2 |
Outlook | | Stable |
Local credit risk rating
On a national scale, Itaú CorpBanca is rated by Feller Rate and Humphreys.
On April 1, 2016,Feller Rate Affirmed local ratings in ‘AA’ following the completion of the merger. Outlook was confirmed as ‘Stable’.
| | |
Feller Rate | | Rating |
Long-term issuer credit rating | | AA |
Senior unsecured bonds | | AA |
Subordinated bonds | | AA- |
Short-term issuer credit rating | | Nivel 1+ |
Shares | | 1ª Clase Nivel 1 |
Outlook | | Stable |
On April 24, 2016,Humphreys affirmed local ratings in ‘AA’ following the completion of the merger. Outlook was confirmed as ‘Stable’.
| | |
Humphreys | | Rating |
Long-term issuer credit rating | | AA |
Senior unsecured bonds | | AA |
Subordinated bonds | | AA- |
Short-term issuer credit rating | | Nivel 1+ |
Shares | | 1ª Clase Nivel 1 |
Outlook | | Stable |

(This page was intentionally left blank)
| | | | |
| | | |  |
| | |
CAUTION REGARDING FORWARD-LOOKING STATEMENTS Certain statements in this Report may be considered as forward-looking statements. Forward-looking information is often, but not always, identified by the use of words such as “anticipate”, “believe”, “expect”, “plan”, “intend”, “forecast”, “target”, “project”, “may”, “will”, “should”, “could”, “estimate”, “predict” or similar words suggesting future outcomes or language suggesting an outlook. These forward-looking statements include, but are not limited to, statements regarding expected benefits and synergies from the recent merger of Banco Itaú Chile with and into CorpBanca, the integration process of both banks, the expected timing of completion of the transaction, anticipated future financial and operating performance and results, including estimates for growth, as well as risks and benefits of changes in the laws of the countries we operate, including the Tax Reform in Chile. These statements are based on the current expectations of Itaú CorpBanca’s management. There are risks and uncertainties that could cause actual results to differ materially from the forward-looking statements included in this communication. For example, (1) problems that may arise in successfully integrating the businesses of Banco Itaú Chile and CorpBanca, which may result in the combined company not operating as effectively and efficiently as expected; (2) the combined company may be unable to achieve cost-cutting synergies or it may take longer than expected to achieve those synergies; (3) the credit ratings of the combined company or its subsidiaries may be different from what Itaú CorpBanca or its controlling shareholders expect; (4) the business of Itaú CorpBanca may suffer as a result of uncertainty surrounding the merger; (5) the industry may be subject to future regulatory or legislative actions that could adversely affect Itaú CorpBanca; and (6) Itaú CorpBanca may be adversely affected by other economic, business, and/or competitive factors. Forward-looking statements and information are based on current beliefs as well as assumptions made by and information currently available to Itaú CorpBanca’s management. Although management considers these assumptions to be reasonable based on information currently available to it, they may prove to be incorrect. By their very nature, forward-looking statements involve inherent risks and uncertainties, both general and specific, and risks that predictions, forecasts, projections and other forward-looking statements will not be achieved. We caution readers not to place undue reliance on these statements as a number of important factors could cause the actual results to differ materially from the beliefs, plans, objectives, expectations and anticipations, estimates and intentions expressed in such forward-looking statements. More information on potential factors that could affect Itaú CorpBanca’s financial results is included from time to time in the “Risk Factors” section of Itaú CorpBanca’s (formerly CorpBanca) Annual Report on Form 20-F for the fiscal year ended December 31, 2015, filed with the SEC. Furthermore, any forward-looking statement contained in this Report speaks only as of the date hereof and Itaú CorpBanca does not undertake any obligation to update publicly or to revise any of the included forward-looking statements, whether as a result of new information, future events or otherwise. The forward-looking statements contained in this Press Release are expressly qualified by this cautionary statement. | | |
CONTACT INFORMATION:
Gabriel Moura
CFO. Itaú CorpBanca
Santiago. Chile
Phone: (562) 2686-0558
IR@corpbanca.cl
Claudia Labbé
Head of Investor Relations. Itaú CorpBanca
Santiago. Chile
Phone: (562) 2660-2555
claudia.labbe@itau.cl
Nicolas Bornozis
President. Capital Link
New York. USA
Phone: (212) 661-7566
nbornozis@capitallink.com


