Exhibit 99.1
| Itaú Corpbanca Investor Relations |

Itaú Corpbanca Announces Fourth Quarter 2019 Management Discussion & Analysis Report
Santiago, Chile, February 28, 2020.ITAÚ CORPBANCA (NYSE: ITCB; SSE: ITAUCORP) announced today its Management Discussion & Analysis Report (“MD&A Report”) for the fourth quarter ended December 31, 2019.
The financial information included in the MD&A Report is based on our managerial model that we adjust fornon-recurring events and for additional reclassifications of P&L lines in order to provide a better understanding of our performance.
For the full MD&A Report, please refer to the following link:
https://wcc.on24.com/webcast/report?e=2152667&k=C19F454E4FB558825A735D9A77C36118
OnMonday, March 2, 2020, at 11:00 A.M. Santiago time (09:00 AM ET), the Company’s management team will host a conference call to discuss the financial results. The call will be hosted by Gabriel Moura, Itaú Corpbanca’s Chief Executive Officer, and Claudia Labbé, Itaú Corpbanca’s Head of Investor Relations.
Conference Call Details:
Participants should dial into the call 10 minutes before the scheduled time using the following numbers: +1 (877)790-7811 (US Toll Free Dial In), or +1 (647)689-5643 (Standard InternationalDial-In). Conference ID: 1292377# or quote “Itaú Corpbanca” to the operator.
A telephonic replay of the conference call will be available Monday, March 9, 2020, by dialing +1(800)585-8367 or +1 (416)621-4642 (Encore Dial In). Access Code: 1292377#
Slides and Audio Webcast:
There will also be a live, and then archived, webcast of the conference call, available through the Company’s website. Participants in the live webcast should register on the website approximately 10 minutes prior to the start of the webcast. The webcast can be found at:
https://event.on24.com/wcc/r/2152667/3A587E60865168C5C80D794FB6FFCF18
About Itaú Corpbanca
|
ITAÚ CORPBANCA (NYSE: ITCB; SSE: ITAUCORP)is the entity resulting from the merger of Banco Itaú Chile with and into Corpbanca on April 1, 2016. The current ownership structure is: 38.14% owned by Itaú Unibanco, 28.57% owned by the Saieh Family and 33.29% owned by minority shareholders. Itaú Unibanco is the sole controlling shareholder of the merged bank. Within this context and without limiting the above, Itaú Unibanco and CorpGroup have signed a shareholders’ agreement relating to corporate
governance, dividend policy (based on performance and capital metrics), transfer of shares, liquidity and other matters.
The bank is the fifth largest private bank in Chile and as per its mandate is the banking platform for future expansion in Latin America, specifically in Chile, Colombia and Peru. Itaú Corpbanca is a commercial bank based in Chile with additional operations in Colombia and Panama. In addition, Itaú Corpbanca has a branch in New York and a representative office in Lima. Focused on large and medium sized companies and individuals, Itaú Corpbanca offers universal banking products. In 2012, the bank initiated a regionalization process and as of the date hereof has acquired two banks in Colombia –Banco Corpbanca Colombia and Helm Bank– becoming the first Chilean bank with banking subsidiaries abroad. The merger with Banco Itaú Chile and the business combination of our two banks in Colombia, represent the continued success of our regionalization process.
As of December 31, 2019, according to the Chilean Financial Market Commission, Itaú Corpbanca was the fifth largest private bank in Chile in terms of the overall size of its customer loan portfolio, equivalent to 10.1% market share. As of November 30, 2019, according to the Colombian Superintendency of Finance, Itaú Corpbanca Colombia was the seventh largest bank in Colombia in terms of total loans and the eighth largest bank in Colombia in terms of total deposits, as reported under local regulatory and accounting principles. As of the same date, its market share by loans reached 4.3%.
Investor Relations – Itaú Corpbanca
+56 (2) 2660-1701 /IR@corpbanca.cl

Management
Discussion & Analysis
4Q19
ir.itau.cl
/Itaú Chile
facebook.com/itauchile
@itauchile

(This page was intentionally left blank)
Table of Contents Management Discussion & Analysis Page 5 7 Executive Summary 17 Income Statement and Balance Sheet Analysis Managerial results—Breakdown by country 19 Managerial results—Breakdown for Chile 21 43 Managerial results—Breakdown for Colombia 32 Balance Sheet 49 Risk and Capital Management 51 Additional Information Complete Financial Statements Access here 55 Report of Independent Auditors

4 (This page was intentionally left blank) Itaú Corpbanca
Management Discussion & Analysis Management Discussion & Analysis
6 This report is based on Itaú CorpBanca reviewed financial statements for 4Q19, 3Q19 and 4Q18 prepared in accordance with the Compendium of Accounting Standards issued by the Financial Market Commission (Comisión para el Mercado Financiero, or “CMF”) pursuant to Chilean Generally Accepted Accounting Principles (Chilean GAAP), which conform with the international standards of accounting and financial reporting issued by the International Accounting Standards Board (IASB) to the extent that there are not specific instructions or regulations to the contrary issued by the CMF. Solely for the convenience of the reader, U.S. dollar amounts (US$) in this report have been translated from Chilean nominal peso (Ch$) at our own exchange rate as of December 31, 2019 of Ch$748.77 per U.S. dollar. Industry data contained herein has been obtained from the information provided either by the CMF or the Colombian Superintendency of Finance (Superintendencia Financiera de Colombia, or SF). Certain figures included in this Quarterly Report for the three months ended December 31, 2019 and 2018, for the three months ended September 30, 2019 and as of and for the twelve-month periods ended December 31, 2019 and 2018 have been rounded for ease of presentation. Percentage figures included in this Quarterly Report have in all cases not been calculated on the basis of such rounded figures but on the basis of such amounts prior to rounding. For this reason, percentage amounts in this Quarterly Report may vary slightly from those obtained by performing the same calculations using the figures in our consolidated financial statements and our managerial information. Certain other amounts that appear in this Quarterly Report may similarly not sum due to rounding. As used in this MD&A Report, the term “billion” means one thousand million (1,000,000,000) and the term “trillion” means one million million (1,000,000,000,000).
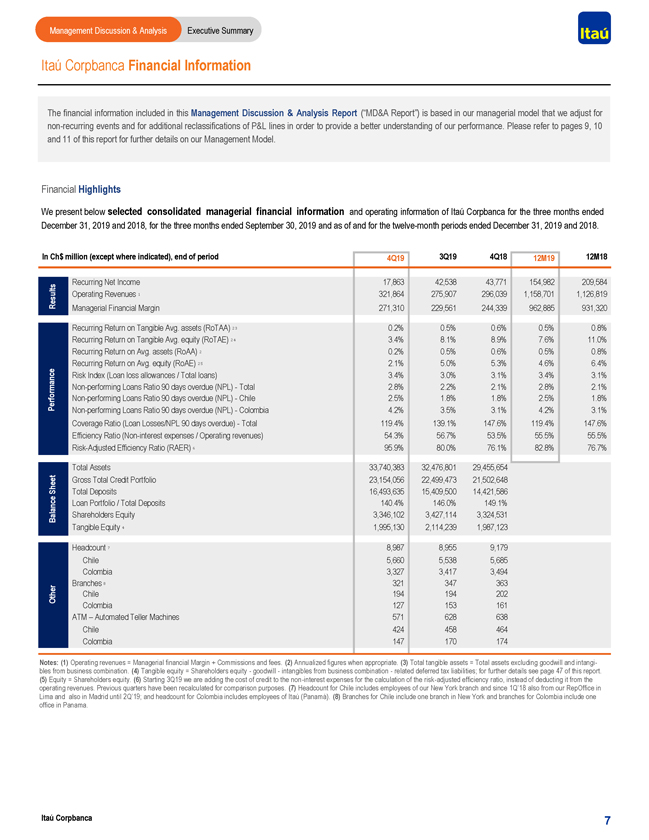
Management Discussion & Analysis Executive Summary Itaú Corpbanca Financial Information The financial information included in this Management Discussion & Analysis Report (“MD&A Report”) is based in our managerial model that we adjust fornon-recurring events and for additional reclassifications of P&L lines in order to provide a better understanding of our performance. Please refer to pages 9, 10 and 11 of this report for further details on our Management Model. Financial Highlights We present below selected consolidated managerial financial information and operating information of Itaú Corpbanca for the three months ended December 31, 2019 and 2018, for the three months ended September 30, 2019 and as of and for the twelve-month periods ended December 31, 2019 and 2018. In Ch$ million (except where indicated), end of period 4Q19 3Q19 4Q18 12M19 12M18 Recurring Net Income 17,863 42,538 43,771 154,982 209,584 Results Operating Revenues 1 321,864 275,907 296,039 1,158,701 1,126,819 Managerial Financial Margin 271,310 229,561 244,339 962,885 931,320 Recurring Return on Tangible Avg. assets (RoTAA) 2 3 0.2% 0.5% 0.6% 0.5% 0.8% Recurring Return on Tangible Avg. equity (RoTAE) 2 4 3.4% 8.1% 8.9% 7.6% 11.0% Recurring Return on Avg. assets (RoAA) 2 0.2% 0.5% 0.6% 0.5% 0.8% Recurring Return on Avg. equity (RoAE) 2 5 2.1% 5.0% 5.3% 4.6% 6.4% Risk Index (Loan loss allowances / Total loans) 3.4% 3.0% 3.1% 3.4% 3.1%Non-performing Loans Ratio 90 days overdue (NPL)—Total 2.8% 2.2% 2.1% 2.8% 2.1% PerformanceNon-performing Loans Ratio 90 days overdue (NPL)—Chile 2.5% 1.8% 1.8% 2.5% 1.8%Non-performing Loans Ratio 90 days overdue (NPL)—Colombia 4.2% 3.5% 3.1% 4.2% 3.1% Coverage Ratio (Loan Losses/NPL 90 days overdue)—Total 119.4% 139.1% 147.6% 119.4% 147.6% Efficiency Ratio(Non-interest expenses / Operating revenues) 54.3% 56.7% 53.5% 55.5% 55.5% Risk-Adjusted Efficiency Ratio (RAER) 6 95.9% 80.0% 76.1% 82.8% 76.7% Total Assets 33,740,383 32,476,801 29,455,654 Sheet Gross Total Credit Portfolio 23,154,056 22,499,473 21,502,648 Total Deposits 16,493,635 15,409,500 14,421,586 Loan Portfolio / Total Deposits 140.4% 146.0% 149.1% Balance Shareholders Equity 3,346,102 3,427,114 3,324,531 Tangible Equity 4 1,995,130 2,114,239 1,987,123 7 Headcount 8,987 8,955 9,179 Chile 5,660 5,538 5,685 Colombia 3,327 3,417 3,494 Branches 8 321 347 363 Other Chile 194 194 202 Colombia 127 153 161 ATM – Automated Teller Machines 571 628 638 Chile 424 458 464 Colombia 147 170 174 Notes: (1) Operating revenues = Managerial financial Margin + Commissions and fees. (2) Annualized figures when appropriate. (3) Total tangible assets = Total assets excluding goodwill and intangibles from business combination. (4) Tangible equity = Shareholders equity—goodwill—intangibles from business combination—related deferred tax liabilities; for further details see page 47 of this report. (5) Equity = Shareholders equity. (6) Starting 3Q19 we are adding the cost of credit to thenon-interest expenses for the calculation of the risk-adjusted efficiency ratio, instead of deducting it from the operating revenues. Previous quarters have been recalculated for comparison purposes. (7) Headcount for Chile includes employees of our New York branch and since 1Q’18 also from our RepOffice in Lima and also in Madrid until 2Q’19; and headcount for Colombia includes employees of Itaú (Panamá). (8) Branches for Chile include one branch in New York and branches for Colombia include one office in Panama. Itaú Corpbanca 7
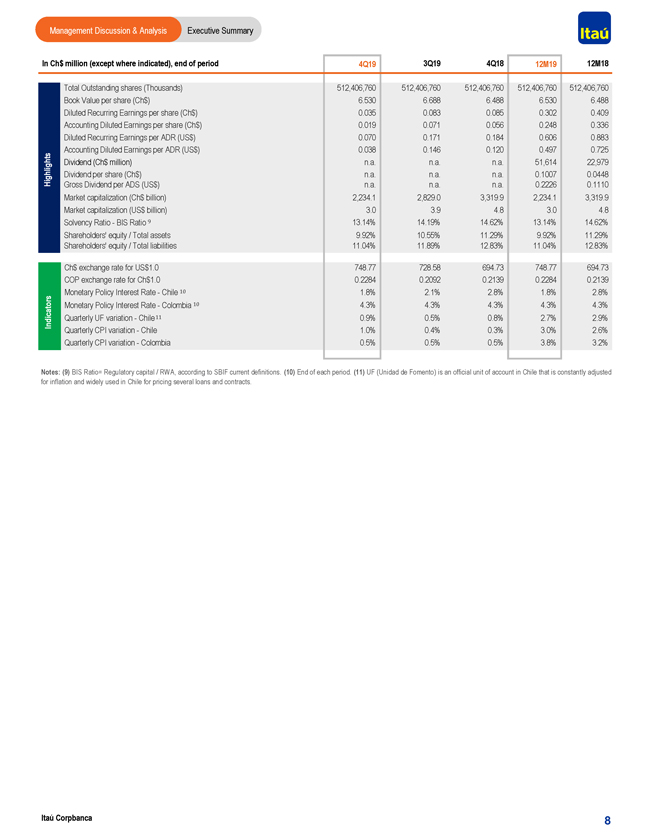
Management Discussion & Analysis Executive Summary In Ch$ million (except where indicated), end of period 4Q19 3Q19 4Q18 12M19 12M18 Total Outstanding shares (Thousands) 512,406,760 512,406,760 512,406,760 512,406,760 512,406,760 Book Value per share (Ch$) 6.530 6.688 6.488 6.530 6.488 Diluted Recurring Earnings per share (Ch$) 0.035 0.083 0.085 0.302 0.409 Accounting Diluted Earnings per share (Ch$) 0.019 0.071 0.056 0.248 0.336 Diluted Recurring Earnings per ADR (US$) 0.070 0.171 0.184 0.606 0.883 Accounting Diluted Earnings per ADR (US$) 0.038 0.146 0.120 0.497 0.725 Dividend (Ch$ million) n.a. n.a. n.a. 51,614 22,979 Highlights Dividend per share (Ch$) n.a. n.a. n.a. 0.1007 0.0448 Gross Dividend per ADS (US$) n.a. n.a. n.a. 0.2226 0.1110 Market capitalization (Ch$ billion) 2,234.1 2,829.0 3,319.9 2,234.1 3,319.9 Market capitalization (US$ billion) 3.0 3.9 4.8 3.0 4.8 Solvency Ratio—BIS Ratio 9 13.14% 14.19% 14.62% 13.14% 14.62% Shareholders’ equity / Total assets 9.92% 10.55% 11.29% 9.92% 11.29% Shareholders’ equity / Total liabilities 11.04% 11.89% 12.83% 11.04% 12.83% Ch$ exchange rate for US$1.0 748.77 728.58 694.73 748.77 694.73 COP exchange rate for Ch$1.0 0.2284 0.2092 0.2139 0.2284 0.2139 Monetary Policy Interest Rate—Chile 10 1.8% 2.1% 2.8% 1.8% 2.8% Monetary Policy Interest Rate—Colombia 10 4.3% 4.3% 4.3% 4.3% 4.3% Indicators Quarterly UF variation—Chile 11 0.9% 0.5% 0.8% 2.7% 2.9% Quarterly CPI variation—Chile 1.0% 0.4% 0.3% 3.0% 2.6% Quarterly CPI variation—Colombia 0.5% 0.5% 0.5% 3.8% 3.2% Notes: (9) BIS Ratio= Regulatory capital / RWA, according to SBIF current definitions. (10) End of each period. (11) UF (Unidad de Fomento) is an official unit of account in Chile that is constantly adjusted for inflation and widely used in Chile for pricing several loans and contracts. Itaú Corpbanca 8
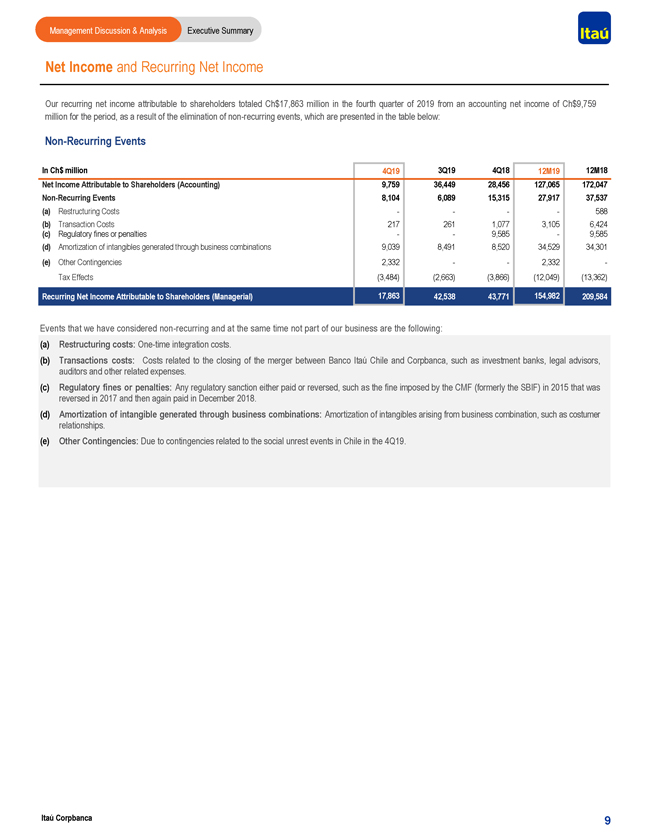
Management Discussion & Analysis Executive Summary Net Income and Recurring Net Income Our recurring net income attributable to shareholders totaled Ch$17,863 million in the fourth quarter of 2019 from an accounting net income of Ch$9,759 million for the period, as a result of the elimination ofnon-recurring events, which are presented in the table below:Non-Recurring Events In Ch$ million 4Q19 3Q19 4Q18 12M19 12M18 Net Income Attributable to Shareholders (Accounting) 9,759 36,449 28,456 127,065 172,047Non-Recurring Events 8,104 6,089 15,315 27,917 37,537 (a) Restructuring Costs — — 588 (b) Transaction Costs 217 261 1,077 3,105 6,424 (c) Regulatory fines or penalties — 9,585—9,585 (d) Amortization of intangibles generated through business combinations 9,039 8,491 8,520 34,529 34,301 (e) Other Contingencies 2,332 — 2,332— Tax Effects (3,484) (2,663) (3,866) (12,049) (13,362) Recurring Net Income Attributable to Shareholders (Managerial) 17,863 42,538 43,771 154,982 209,584 Events that we have considerednon-recurring and at the same time not part of our business are the following: (a) Restructuring costs:One-time integration costs. (b) Transactions costs: Costs related to the closing of the merger between Banco Itaú Chile and Corpbanca, such as investment banks, legal advisors, auditors and other related expenses. (c) Regulatory fines or penalties: Any regulatory sanction either paid or reversed, such as the fine imposed by the CMF (formerly the SBIF) in 2015 that was reversed in 2017 and then again paid in December 2018. (d) Amortization of intangible generated through business combinations: Amortization of intangibles arising from business combination, such as costumer relationships. (e) Other Contingencies: Due to contingencies related to the social unrest events in Chile in the 4Q19. Itaú Corpbanca 9
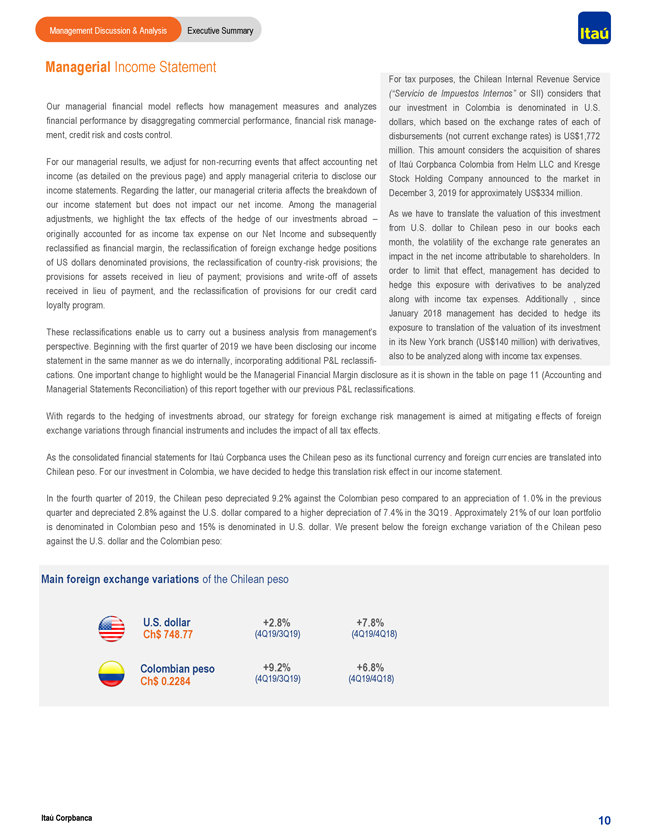
Itaú Corpbanca Executive Summary Management Discussion & Analysis 10 Managerial Income Statement U.S. dollar Colombian peso Ch$ 748.77 Ch$ 0.2284 +2.8% (4Q19/4Q18) +7.8% +9.2% (4Q19/3Q19) (4Q19/4Q18) +6.8% Our managerial financial model reflects how management measures and analyzes financial performance by disaggregating commercial performance, financial risk manage-ment, credit risk and costs control. For our managerial results, we adjust fornon-recurring events that affect accounting net income (as detailed on the previous page) and apply managerial criteria to disclose our income statements. Regarding the latter, our managerial criteria affects the breakdown of our income statement but does not impact our net income. Among the managerial adjustments, we highlight the tax effects of the hedge of our investments abroad – originally accounted for as income tax expense on our Net Income and subsequently reclassified as financial margin, the reclassification of foreign exchange hedge positions of US dollars denominated provisions, the reclassification of country-risk provisions; the provisions for assets received in lieu of payment; provisions andwrite-off of assets received in lieu of payment, and the reclassification of provisions for our credit card loyalty program. These reclassifications enable us to carry out a business analysis from management’s perspective. Beginning with the first quarter of 2019 we have been disclosing our income statement in the same manner as we do internally, incorporating additional P&L reclassifi-cations. One important change to highlight would be the Managerial Financial Margin disclosure as it is shown in the table on page 11 (Accounting and Managerial Statements Reconciliation) of this report together with our previous P&L reclassifications. With regards to the hedging of investments abroad, our strategy for foreign exchange risk management is aimed at mitigating e ffects of foreign exchange variations through financial instruments and includes the impact of all tax effects. As the consolidated financial statements for Itaú Corpbanca uses the Chilean peso as its functional currency and foreign curr encies are translated into Chilean peso. For our investment in Colombia, we have decided to hedge this translation risk effect in our income statement. In the fourth quarter of 2019, the Chilean peso depreciated 9.2% against the Colombian peso compared to an appreciation of 1. 0% in the previous quarter and depreciated 2.8% against the U.S. dollar compared to a higher depreciation of 7.4% in the 3Q19 .. Approximately 21% of our loan portfolio is denominated in Colombian peso and 15% is denominated in U.S. dollar. We present below the foreign exchange variation of th e Chilean peso against the U.S. dollar and the Colombian peso: For tax purposes, the Chilean Internal Revenue Service (“Servicio de Impuestos Internos” or SII) considers that our investment in Colombia is denominated in U.S. dollars, which based on the exchange rates of each of disbursements (not current exchange rates) is US$1,772 million. This amount considers the acquisition of shares of Itaú Corpbanca Colombia from Helm LLC and Kresge Stock Holding Company announced to the market in December 3, 2019 for approximately US$334 million. As we have to translate the valuation of this investment from U.S. dollar to Chilean peso in our books each month, the volatility of the exchange rate generates an impact in the net income attributable to shareholders. In order to limit that effect, management has decided to hedge this exposure with derivatives to be analyzed along with income tax expenses. Additionally , since January 2018 management has decided to hedge its exposure to translation of the valuation of its investment in its New York branch (US$140 million) with derivatives, also to be analyzed along with income tax expenses. (4Q19/3Q19) Main foreign exchange variations of the Chilean peso
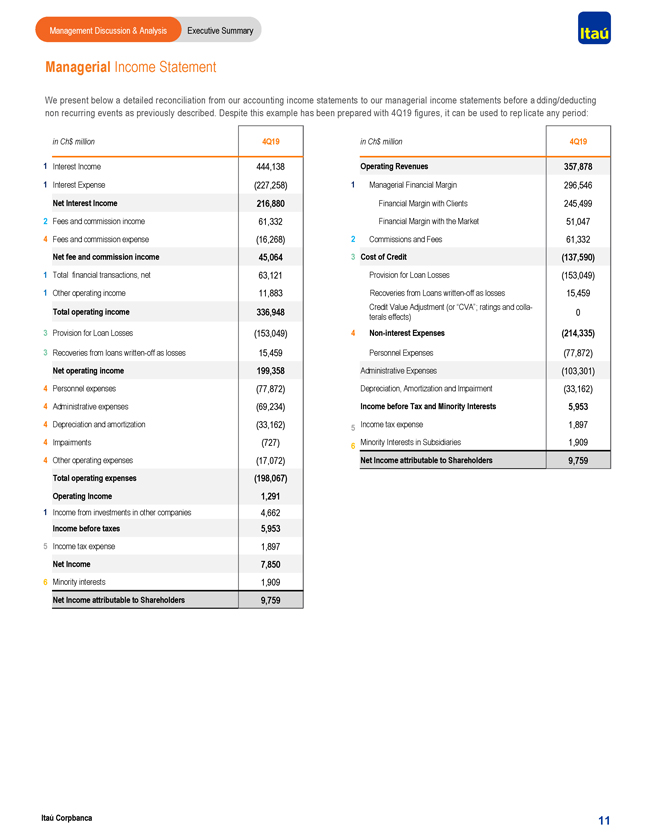
Management Discussion & Analysis Executive Summary Managerial Income Statement We present below a detailed reconciliation from our accounting income statements to our managerial income statements before a dding/deducting non recurring events as previously described. Despite this example has been prepared with 4Q19 figures, it can be used to rep licate any period: in Ch$ million 4Q19 in Ch$ million 4Q19 1 Interest Income 444,138 Operating Revenues 357,878 1 Interest Expense (227,258) 1 Managerial Financial Margin 296,546 Net Interest Income 216,880 Financial Margin with Clients 245,499 2 Fees and commission income 61,332 Financial Margin with the Market 51,047 4 Fees and commission expense (16,268) 2 Commissions and Fees 61,332 Net fee and commission income 45,064 3 Cost of Credit (137,590) 1 Total financial transactions, net 63,121 Provision for Loan Losses (153,049) 1 Other operating income 11,883 Recoveries from Loanswritten-off as losses 15,459 Credit Value Adjustment (or “CVA”; ratings and colla- Total operating income 336,948 0 terals effects) 3 Provision for Loan Losses (153,049) 4Non-interest Expenses (214,335) 3 Recoveries from loanswritten-off as losses 15,459 Personnel Expenses (77,872) Net operating income 199,358 Administrative Expenses (103,301) 4 Personnel expenses (77,872) Depreciation, Amortization and Impairment (33,162) 4 Administrative expenses (69,234) Income before Tax and Minority Interests 5,953 4 Depreciation and amortization (33,162) 5 Income tax expense 1,897 4 Impairments (727) 6 Minority Interests in Subsidiaries 1,909 4 Other operating expenses (17,072) Net Income attributable to Shareholders 9,759 Total operating expenses (198,067) Operating Income 1,291 1 Income from investments in other companies 4,662 Income before taxes 5,953 5 Income tax expense 1,897 Net Income 7,850 6 Minority interests 1,909 Net Income attributable to Shareholders 9,759 Itaú Corpbanca 11
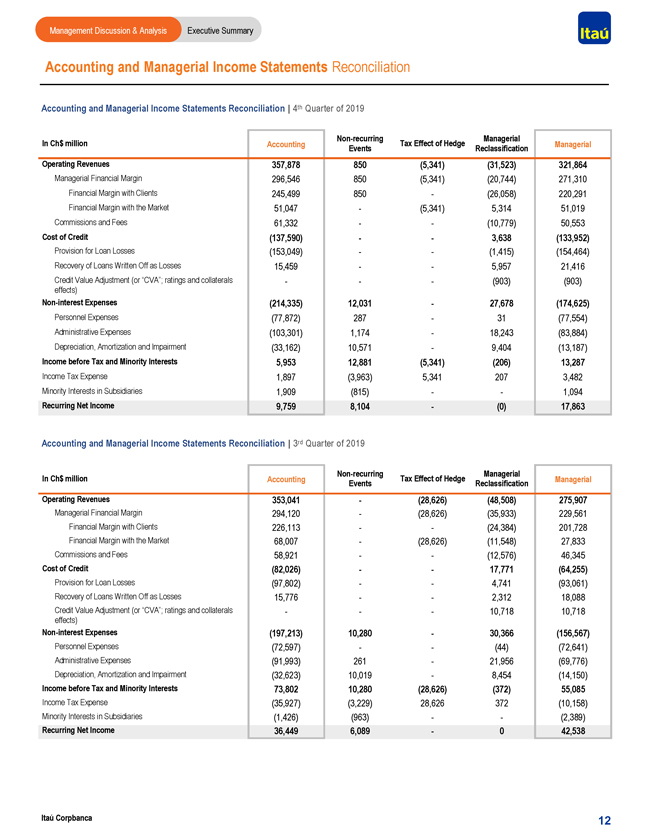
Management Discussion & Analysis Executive Summary Accounting and Managerial Income Statements Reconciliation Accounting and Managerial Income Statements Reconciliation | 4th Quarter of 2019Non-recurring Managerial In Ch$ million Accounting Tax Effect of Hedge Managerial Events Reclassification Operating Revenues 357,878 850 (5,341) (31,523) 321,864 Managerial Financial Margin 296,546 850 (5,341) (20,744) 271,310 Financial Margin with Clients 245,499 850—(26,058) 220,291 Financial Margin with the Market 51,047—(5,341) 5,314 51,019 Commissions and Fees 61,332 — (10,779) 50,553 Cost of Credit (137,590) — 3,638 (133,952) Provision for Loan Losses (153,049) — (1,415) (154,464) Recovery of Loans Written Off as Losses 15,459 — 5,957 21,416 Credit Value Adjustment (or “CVA”; ratings and collaterals ——(903) (903) effects)Non-interest Expenses (214,335) 12,031—27,678 (174,625) Personnel Expenses (77,872) 287—31 (77,554) Administrative Expenses (103,301) 1,174—18,243 (83,884) Depreciation, Amortization and Impairment (33,162) 10,571—9,404 (13,187) Income before Tax and Minority Interests 5,953 12,881 (5,341) (206) 13,287 Income Tax Expense 1,897 (3,963) 5,341 207 3,482 Minority Interests in Subsidiaries 1,909 (815) — 1,094 Recurring Net Income 9,759 8,104—(0) 17,863 Accounting and Managerial Income Statements Reconciliation | 3rd Quarter of 2019Non-recurring Managerial In Ch$ million Accounting Tax Effect of Hedge Managerial Events Reclassification Operating Revenues 353,041—(28,626) (48,508) 275,907 Managerial Financial Margin 294,120—(28,626) (35,933) 229,561 Financial Margin with Clients 226,113 — (24,384) 201,728 Financial Margin with the Market 68,007—(28,626) (11,548) 27,833 Commissions and Fees 58,921 — (12,576) 46,345 Cost of Credit (82,026) — 17,771 (64,255) Provision for Loan Losses (97,802) — 4,741 (93,061) Recovery of Loans Written Off as Losses 15,776 — 2,312 18,088 Credit Value Adjustment (or “CVA”; ratings and collaterals ——10,718 10,718 effects)Non-interest Expenses (197,213) 10,280—30,366 (156,567) Personnel Expenses (72,597) — (44) (72,641) Administrative Expenses (91,993) 261—21,956 (69,776) Depreciation, Amortization and Impairment (32,623) 10,019—8,454 (14,150) Income before Tax and Minority Interests 73,802 10,280 (28,626) (372) 55,085 Income Tax Expense (35,927) (3,229) 28,626 372 (10,158) Minority Interests in Subsidiaries (1,426) (963) — (2,389) Recurring Net Income 36,449 6,089—0 42,538 Itaú Corpbanca 12
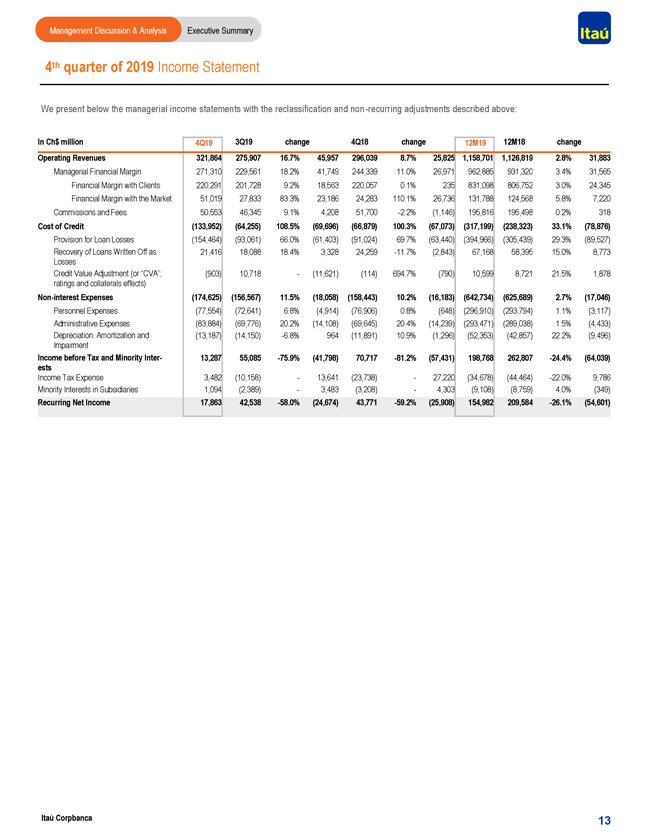
Management Discussion & Analysis Executive Summary 4th quarter of 2019 Income Statement We present below the managerial income statements with the reclassification and non -recurring adjustments described above: In Ch$ million 4Q19 3Q19 change 4Q18 change 12M19 12M18 change Operating Revenues 321,864 275,907 16.7% 45,957 296,039 8.7% 25,825 1,158,701 1,126,819 2.8% 31,883 Managerial Financial Margin 271,310 229,561 18.2% 41,749 244,339 11.0% 26,971 962,885 931,320 3.4% 31,565 Financial Margin with Clients 220,291 201,728 9.2% 18,563 220,057 0.1% 235 831,098 806,752 3.0% 24,345 Financial Margin with the Market 51,019 27,833 83.3% 23,186 24,283 110.1% 26,736 131,788 124,568 5.8% 7,220 Commissions and Fees 50,553 46,345 9.1% 4,208 51,700-2.2% (1,146) 195,816 195,498 0.2% 318 Cost of Credit (133,952) (64,255) 108.5% (69,696) (66,879) 100.3% (67,073) (317,199) (238,323) 33.1% (78,876) Provision for Loan Losses (154,464) (93,061) 66.0% (61,403) (91,024) 69.7% (63,440) (394,966) (305,439) 29.3% (89,527) Recovery of Loans Written Off as 21,416 18,088 18.4% 3,328 24,259-11.7% (2,843) 67,168 58,395 15.0% 8,773 Losses Credit Value Adjustment (or “CVA”; (903) 10,718—(11,621) (114) 694.7% (790) 10,599 8,721 21.5% 1,878 ratings and collaterals effects)Non-interest Expenses (174,625) (156,567) 11.5% (18,058) (158,443) 10.2% (16,183) (642,734) (625,689) 2.7% (17,046) Personnel Expenses (77,554) (72,641) 6.8% (4,914) (76,906) 0.8% (648) (296,910) (293,794) 1.1% (3,117) Administrative Expenses (83,884) (69,776) 20.2% (14,108) (69,645) 20.4% (14,239) (293,471) (289,038) 1.5% (4,433) Depreciation. Amortization and (13,187) (14,150)-6.8% 964 (11,891) 10.9% (1,296) (52,353) (42,857) 22.2% (9,496) Impairment Income before Tax and Minority Inter- 13,287 55,085-75.9% (41,798) 70,717-81.2% (57,431) 198,768 262,807-24.4% (64,039) ests Income Tax Expense 3,482 (10,158)—13,641 (23,738)—27,220 (34,678) (44,464)-22.0% 9,786 Minority Interests in Subsidiaries 1,094 (2,389)—3,483 (3,208)—4,303 (9,108) (8,759) 4.0% (349) Recurring Net Income 17,863 42,538-58.0% (24,674) 43,771-59.2% (25,908) 154,982 209,584-26.1% (54,601) Itaú Corpbanca 13
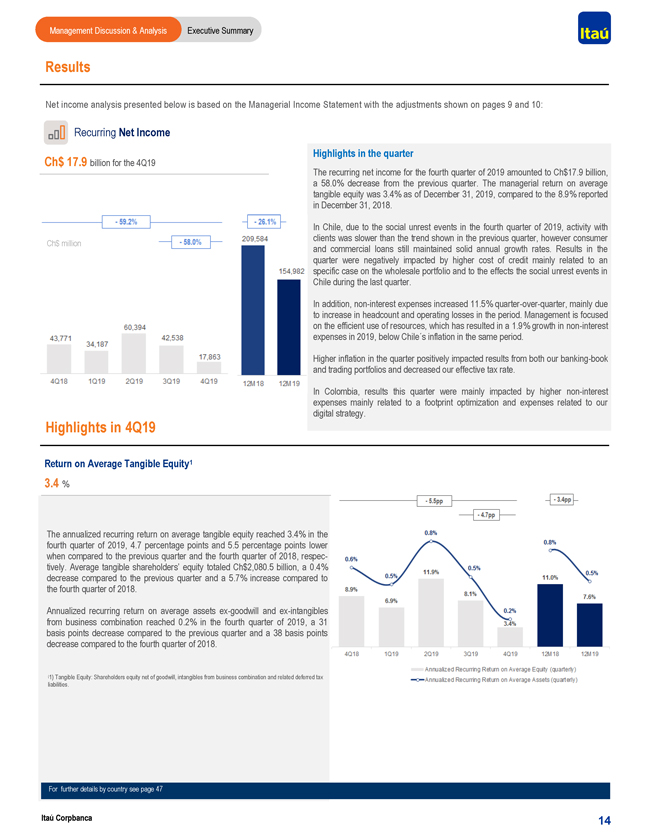
Management Discussion & Analysis Executive Summary Results Net income analysis presented below is based on the Managerial Income Statement with the adjustments shown on pages 9 and 10: Recurring Net Income Highlights in the quarter Ch$ 17.9 billion for the 4Q19 The recurring net income for the fourth quarter of 2019 amounted to Ch$17.9 billion, a 58.0% decrease from the previous quarter. The managerial return on average tangible equity was 3.4% as of December 31, 2019, compared to the 8.9% reported in December 31, 2018. In Chile, due to the social unrest events in the fourth quarter of 2019, activity with clients was slower than the trend shown in the previous quarter, however consumer Ch$ million and commercial loans still maintained solid annual growth rates. Results in the quarter were negatively impacted by higher cost of credit mainly related to an specific case on the wholesale portfolio and to the effects the social unrest events in Chile during the last quarter. In addition,non-interest expenses increased 11.5% quarter-over-quarter, mainly due to increase in headcount and operating losses in the period. Management is focused on the efficient use of resources, which has resulted in a 1.9% growth innon-interest expenses in 2019, below Chile´s inflation in the same period. Higher inflation in the quarter positively impacted results from both our banking-book and trading portfolios and decreased our effective tax rate. In Colombia, results this quarter were mainly impacted by highernon-interest expenses mainly related to a footprint optimization and expenses related to our digital strategy. Highlights in 4Q19 Return on Average Tangible Equity1 3.4 % The annualized recurring return on average tangible equity reached 3.4% in the fourth quarter of 2019, 4.7 percentage points and 5.5 percentage points lower when compared to the previous quarter and the fourth quarter of 2018, respectively. Average tangible shareholders’ equity totaled Ch$2,080.5 billion, a 0.4% decrease compared to the previous quarter and a 5.7% increase compared to the fourth quarter of 2018. Annualized recurring return on average assetsex-goodwill andex-intangibles from business combination reached 0.2% in the fourth quarter of 2019, a 31 basis points decrease compared to the previous quarter and a 38 basis points decrease compared to the fourth quarter of 2018. (1) Tangible Equity: Shareholders equity net of goodwill, intangibles from business combination and related deferred tax liabilities. For further details by country see page 47 Itaú Corpbanca 14
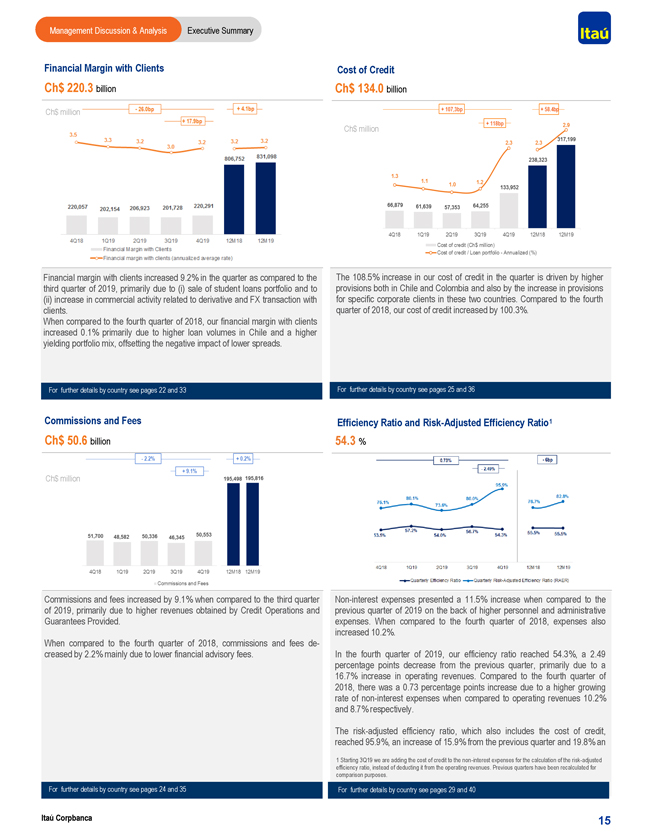
Management Discussion & Analysis Executive Summary Financial Margin with Clients Cost of Credit Ch$ 220.3 billion Ch$ 134.0 billion Ch$ million Ch$ million Financial margin with clients increased 9.2% in the quarter as compared to the The 108.5% increase in our cost of credit in the quarter is driven by higher third quarter of 2019, primarily due to (i) sale of student loans portfolio and to provisions both in Chile and Colombia and also by the increase in provisions (ii) increase in commercial activity related to derivative and FX transaction with for specific corporate clients in these two countries. Compared to the fourth clients. quarter of 2018, our cost of credit increased by 100.3%. When compared to the fourth quarter of 2018, our financial margin with clients increased 0.1% primarily due to higher loan volumes in Chile and a higher yielding portfolio mix, offsetting the negative impact of lower spreads. For further details by country see pages 22 and 33 For further details by country see pages 25 and 36 Commissions and Fees Efficiency Ratio and Risk-Adjusted Efficiency Ratio1 Ch$ 50.6 billion 54.3 % Ch$ million Commissions and fees increased by 9.1% when compared to the third quarterNon-interest expenses presented a 11.5% increase when compared to the of 2019, primarily due to higher revenues obtained by Credit Operations and previous quarter of 2019 on the back of higher personnel and administrative Guarantees Provided. expenses. When compared to the fourth quarter of 2018, expenses also increased 10.2%. When compared to the fourth quarter of 2018, commissions and feesde- creased by 2.2% mainly due to lower financial advisory fees. In the fourth quarter of 2019, our efficiency ratio reached 54.3%, a 2.49 percentage points decrease from the previous quarter, primarily due to a 16.7% increase in operating revenues. Compared to the fourth quarter of 2018, there was a 0.73 percentage points increase due to a higher growing rate ofnon-interest expenses when compared to operating revenues 10.2% and 8.7% respectively. The risk-adjusted efficiency ratio, which also includes the cost of credit, reached 95.9%, an increase of 15.9% from the previous quarter and 19.8% an 1 Starting 3Q19 we are adding the cost of credit to thenon-interest expenses for the calculation of the risk-adjusted efficiency ratio, instead of deducting it from the operating revenues. Previous quarters have been recalculated for comparison purposes. For further details by country see pages 24 and 35 For further details by country see pages 29 and 40 Itaú Corpbanca 15
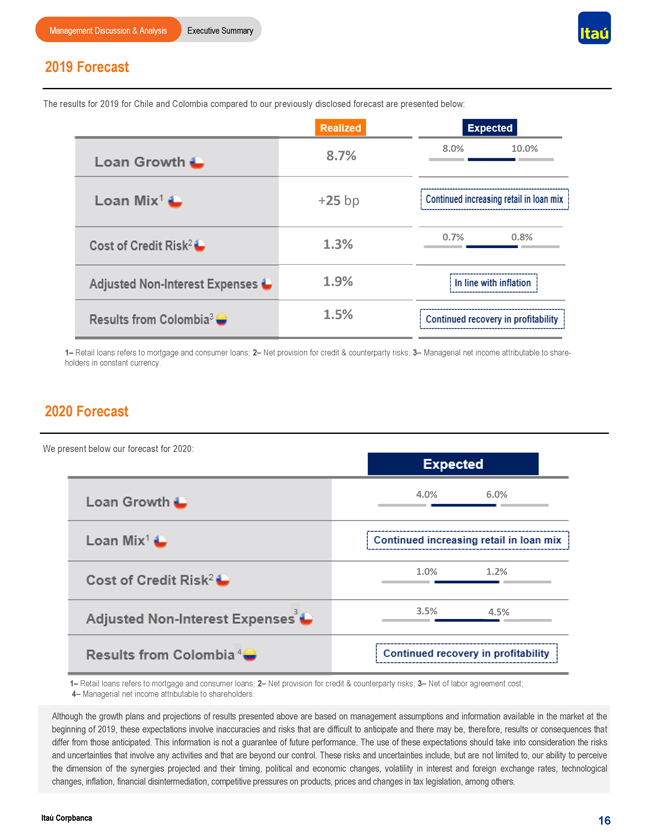
Management Discussion & Analysis Executive Summary 2019 Forecast The results for 2019 for Chile and Colombia compared to our previously disclosed forecast are presented below: 8.0% 10.0% 8.7% +25 bp 0.7% 0.8% 1.3% 1.9% 1.5% 1– Retail loans refers to mortgage and consumer loans; 2– Net provision for credit & counterparty risks; 3– Managerial net income attributable to shareholders in constant currency. 2020 Forecast We present below our forecast for 2020: 4.0% 6.0% 1.0% 1.2% 3 3.5% 4.5% 4 1– Retail loans refers to mortgage and consumer loans; 2– Net provision for credit & counterparty risks; 3– Net of labor agreement cost; 4– Managerial net income attributable to shareholders. Although the growth plans and projections of results presented above are based on management assumptions and information available in the market at the beginning of 2019, these expectations involve inaccuracies and risks that are difficult to anticipate and there may be, therefore, results or consequences that differ from those anticipated. This information is not a guarantee of future performance. The use of these expectations should take into consideration the risks and uncertainties that involve any activities and that are beyond our control. These risks and uncertainties include, but are not limited to, our ability to perceive the dimension of the synergies projected and their timing, political and economic changes, volatility in interest and foreign exchange rates, technological changes, inflation, financial disintermediation, competitive pressures on products, prices and changes in tax legislation, among others. Itaú Corpbanca 16

18
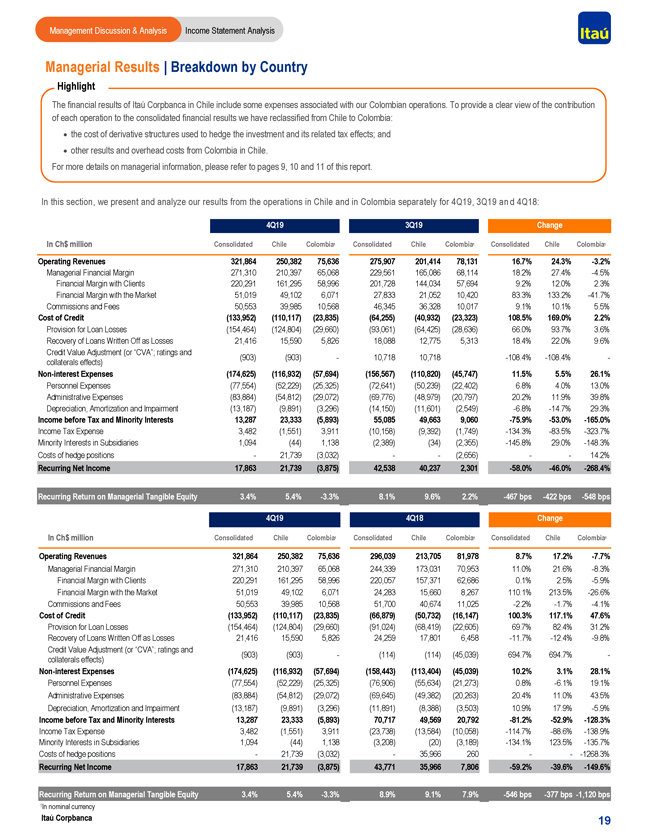
Management Discussion & Analysis Income Statement Analysis Managerial Results | Breakdown by Country Highlight The financial results of Itaú Corpbanca in Chile include some expenses associated with our Colombian operations. To provide a clear view of the contribution of each operation to the consolidated financial results we have reclassified from Chile to Colombia: · the cost of derivative structures used to hedge the investment and its related tax effects; and · other results and overhead costs from Colombia in Chile. For more details on managerial information, please refer to pages 9, 10 and 11 of this report. In this section, we present and analyze our results from the operations in Chile and in Colombia separately for 4Q19, 3Q19 an d 4Q18: 4Q19 3Q19 Change In Ch$ million Consolidated Chile Colombia1 Consolidated Chile Colombia1 Consolidated Chile Colombia1 Operating Revenues 321,864 250,382 75,636 275,907 201,414 78,131 16.7% 24.3%-3.2% Managerial Financial Margin 271,310 210,397 65,068 229,561 165,086 68,114 18.2% 27.4%-4.5% Financial Margin with Clients 220,291 161,295 58,996 201,728 144,034 57,694 9.2% 12.0% 2.3% Financial Margin with the Market 51,019 49,102 6,071 27,833 21,052 10,420 83.3% 133.2%-41.7% Commissions and Fees 50,553 39,985 10,568 46,345 36,328 10,017 9.1% 10.1% 5.5% Cost of Credit (133,952) (110,117) (23,835) (64,255) (40,932) (23,323) 108.5% 169.0% 2.2% Provision for Loan Losses (154,464) (124,804) (29,660) (93,061) (64,425) (28,636) 66.0% 93.7% 3.6% Recovery of Loans Written Off as Losses 21,416 15,590 5,826 18,088 12,775 5,313 18.4% 22.0% 9.6% Credit Value Adjustment (or “CVA”; ratings and (903) (903)— 10,718 10,718-108.4%-108.4%—collaterals effects)Non-interest Expenses (174,625) (116,932) (57,694) (156,567) (110,820) (45,747) 11.5% 5.5% 26.1% Personnel Expenses (77,554) (52,229) (25,325) (72,641) (50,239) (22,402) 6.8% 4.0% 13.0% Administrative Expenses (83,884) (54,812) (29,072) (69,776) (48,979) (20,797) 20.2% 11.9% 39.8% Depreciation, Amortization and Impairment (13,187) (9,891) (3,296) (14,150) (11,601) (2,549)-6.8%-14.7% 29.3% Income before Tax and Minority Interests 13,287 23,333 (5,893) 55,085 49,663 9,060-75.9%-53.0%-165.0% Income Tax Expense 3,482 (1,551) 3,911 (10,158) (9,392) (1,749)-134.3%-83.5%-323.7% Minority Interests in Subsidiaries 1,094 (44) 1,138 (2,389) (34) (2,355)-145.8% 29.0%-148.3% Costs of hedge positions —21,739 (3,032) — (2,656) — 14.2% Recurring Net Income 17,863 21,739 (3,875) 42,538 40,237 2,301-58.0%-46.0%-268.4% Recurring Return on Managerial Tangible Equity 3.4% 5.4%-3.3% 8.1% 9.6% 2.2%-467 bps-422 bps-548 bps 4Q19 4Q18 Change In Ch$ million Consolidated Chile Colombia1 Consolidated Chile Colombia1 Consolidated Chile Colombia1 Operating Revenues 321,864 250,382 75,636 296,039 213,705 81,978 8.7% 17.2%-7.7% Managerial Financial Margin 271,310 210,397 65,068 244,339 173,031 70,953 11.0% 21.6%-8.3% Financial Margin with Clients 220,291 161,295 58,996 220,057 157,371 62,686 0.1% 2.5%-5.9% Financial Margin with the Market 51,019 49,102 6,071 24,283 15,660 8,267 110.1% 213.5%-26.6% Commissions and Fees 50,553 39,985 10,568 51,700 40,674 11,025-2.2%-1.7%-4.1% Cost of Credit (133,952) (110,117) (23,835) (66,879) (50,732) (16,147) 100.3% 117.1% 47.6% Provision for Loan Losses (154,464) (124,804) (29,660) (91,024) (68,419) (22,605) 69.7% 82.4% 31.2% Recovery of Loans Written Off as Losses 21,416 15,590 5,826 24,259 17,801 6,458-11.7%-12.4%-9.8% Credit Value Adjustment (or “CVA”; ratings and (903) (903)— (114) (114) (45,039) 694.7% 694.7%—collaterals effects)Non-interest Expenses (174,625) (116,932) (57,694) (158,443) (113,404) (45,039) 10.2% 3.1% 28.1% Personnel Expenses (77,554) (52,229) (25,325) (76,906) (55,634) (21,273) 0.8%-6.1% 19.1% Administrative Expenses (83,884) (54,812) (29,072) (69,645) (49,382) (20,263) 20.4% 11.0% 43.5% Depreciation, Amortization and Impairment (13,187) (9,891) (3,296) (11,891) (8,388) (3,503) 10.9% 17.9%-5.9% Income before Tax and Minority Interests 13,287 23,333 (5,893) 70,717 49,569 20,792-81.2%-52.9%-128.3% Income Tax Expense 3,482 (1,551) 3,911 (23,738) (13,584) (10,058)-114.7%-88.6%-138.9% Minority Interests in Subsidiaries 1,094 (44) 1,138 (3,208) (20) (3,189)-134.1% 123.5%-135.7% Costs of hedge positions —21,739 (3,032) —35,966 260 — -1268.3% Recurring Net Income 17,863 21,739 (3,875) 43,771 35,966 7,806-59.2%-39.6%-149.6% Recurring Return on Managerial Tangible Equity 3.4% 5.4%-3.3% 8.9% 9.1% 7.9%-546 bps-377 bps-1,120 bps 1 In nominal currency Itaú Corpbanca 19
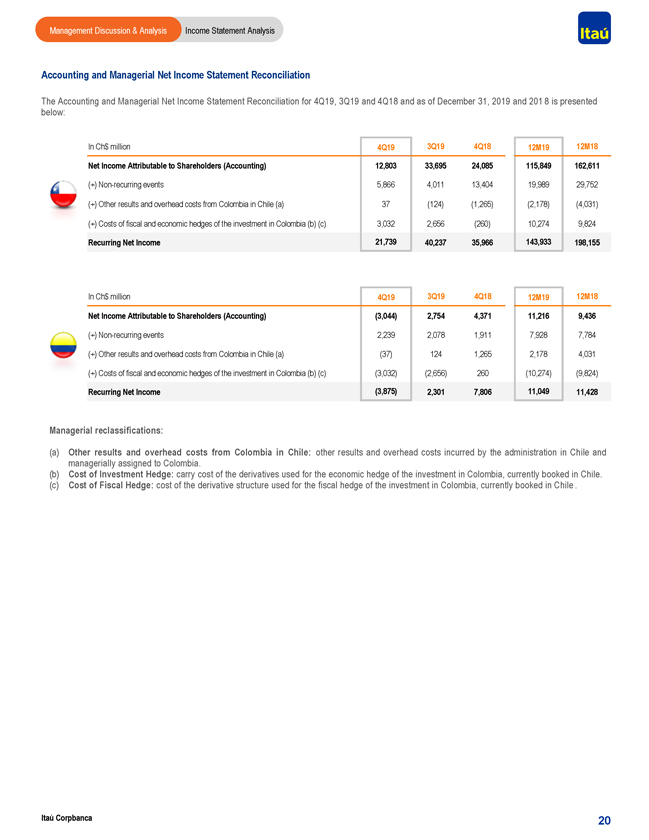
Management Discussion & Analysis Income Statement Analysis Accounting and Managerial Net Income Statement Reconciliation The Accounting and Managerial Net Income Statement Reconciliation for 4Q19, 3Q19 and 4Q18 and as of December 31, 2019 and 201 8 is presented below: In Ch$ million 4Q19 3Q19 4Q18 12M19 12M18 Net Income Attributable to Shareholders (Accounting) 12,803 33,695 24,085 115,849 162,611 (+)Non-recurring events 5,866 4,011 13,404 19,989 29,752 (+) Other results and overhead costs from Colombia in Chile (a) 37 (124) (1,265) (2,178) (4,031) (+) Costs of fiscal and economic hedges of the investment in Colombia (b) (c) 3,032 2,656 (260) 10,274 9,824 Recurring Net Income 21,739 40,237 35,966 143,933 198,155 In Ch$ million 4Q19 3Q19 4Q18 12M19 12M18 Net Income Attributable to Shareholders (Accounting) (3,044) 2,754 4,371 11,216 9,436 (+)Non-recurring events 2,239 2,078 1,911 7,928 7,784 (+) Other results and overhead costs from Colombia in Chile (a) (37) 124 1,265 2,178 4,031 (+) Costs of fiscal and economic hedges of the investment in Colombia (b) (c) (3,032) (2,656) 260 (10,274) (9,824) Recurring Net Income (3,875) 2,301 7,806 11,049 11,428 Managerial reclassifications: (a) Other results and overhead costs from Colombia in Chile: other results and overhead costs incurred by the administration in Chile and managerially assigned to Colombia. (b) Cost of Investment Hedge: carry cost of the derivatives used for the economic hedge of the investment in Colombia, currently booked in Chile. (c) Cost of Fiscal Hedge: cost of the derivative structure used for the fiscal hedge of the investment in Colombia, currently booked in Chile . Itaú Corpbanca 20
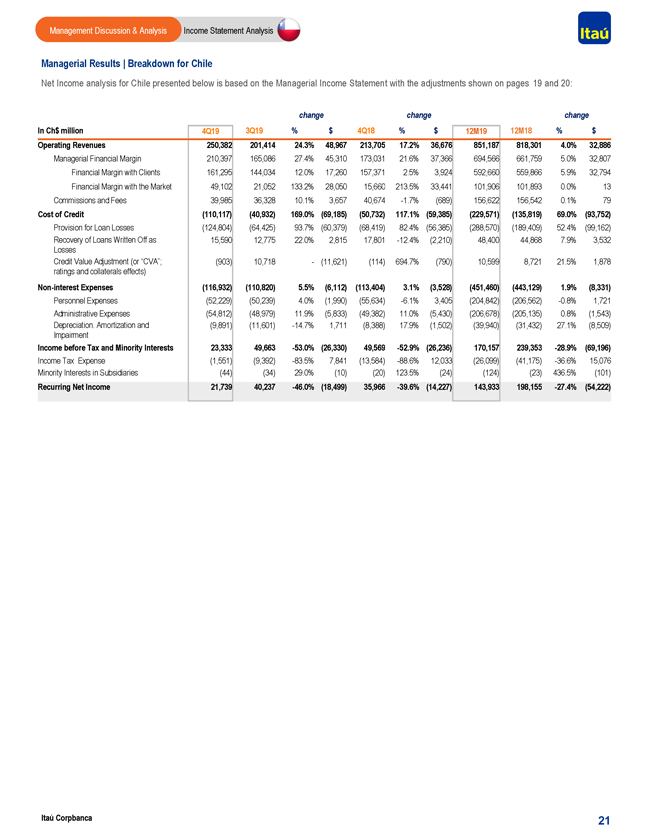
Management Discussion & Analysis Income Statement Analysis Managerial Results | Breakdown for Chile Net Income analysis for Chile presented below is based on the Managerial Income Statement with the adjustments shown on pages 19 and 20: change change change In Ch$ million 4Q19 3Q19 % $ 4Q18 % $ 12M19 12M18 % $ Operating Revenues 250,382 201,414 24.3% 48,967 213,705 17.2% 36,676 851,187 818,301 4.0% 32,886 Managerial Financial Margin 210,397 165,086 27.4% 45,310 173,031 21.6% 37,366 694,566 661,759 5.0% 32,807 Financial Margin with Clients 161,295 144,034 12.0% 17,260 157,371 2.5% 3,924 592,660 559,866 5.9% 32,794 Financial Margin with the Market 49,102 21,052 133.2% 28,050 15,660 213.5% 33,441 101,906 101,893 0.0% 13 Commissions and Fees 39,985 36,328 10.1% 3,657 40,674-1.7% (689) 156,622 156,542 0.1% 79 Cost of Credit (110,117) (40,932) 169.0% (69,185) (50,732) 117.1% (59,385) (229,571) (135,819) 69.0% (93,752) Provision for Loan Losses (124,804) (64,425) 93.7% (60,379) (68,419) 82.4% (56,385) (288,570) (189,409) 52.4% (99,162) Recovery of Loans Written Off as 15,590 12,775 22.0% 2,815 17,801-12.4% (2,210) 48,400 44,868 7.9% 3,532 Losses Credit Value Adjustment (or “CVA”; (903) 10,718— (11,621) (114) 694.7% (790) 10,599 8,721 21.5% 1,878 ratings and collaterals effects)Non-interest Expenses (116,932) (110,820) 5.5% (6,112) (113,404) 3.1% (3,528) (451,460) (443,129) 1.9% (8,331) Personnel Expenses (52,229) (50,239) 4.0% (1,990) (55,634)-6.1% 3,405 (204,842) (206,562)-0.8% 1,721 Administrative Expenses (54,812) (48,979) 11.9% (5,833) (49,382) 11.0% (5,430) (206,678) (205,135) 0.8% (1,543) Depreciation. Amortization and (9,891) (11,601)-14.7% 1,711 (8,388) 17.9% (1,502) (39,940) (31,432) 27.1% (8,509) Impairment Income before Tax and Minority Interests 23,333 49,663-53.0% (26,330) 49,569-52.9% (26,236) 170,157 239,353-28.9% (69,196) Income Tax Expense (1,551) (9,392)-83.5% 7,841 (13,584)-88.6% 12,033 (26,099) (41,175)-36.6% 15,076 Minority Interests in Subsidiaries (44) (34) 29.0% (10) (20) 123.5% (24) (124) (23) 436.5% (101) Recurring Net Income 21,739 40,237-46.0% (18,499) 35,966-39.6% (14,227) 143,933 198,155-27.4% (54,222) Itaú Corpbanca 21
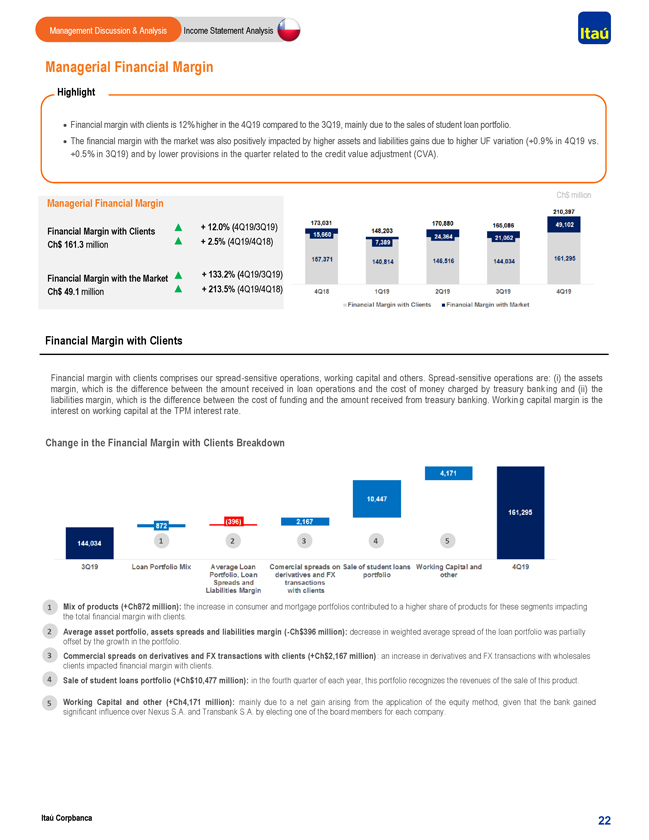
Management Discussion & Analysis Income Statement Analysis Managerial Financial Margin Highlight · Financial margin with clients is 12% higher in the 4Q19 compared to the 3Q19, mainly due to the sales of student loan portfolio. · The financial margin with the market was also positively impacted by higher assets and liabilities gains due to higher UF variation (+0.9% in 4Q19 vs. +0.5% in 3Q19) and by lower provisions in the quarter related to the credit value adjustment (CVA). Ch$ million Managerial Financial Margin + 12.0% (4Q19/3Q19) Financial Margin with Clients Ch$ 161.3 million + 2.5% (4Q19/4Q18) Financial Margin with the Market + 133.2% (4Q19/3Q19) Ch$ 49.1 million + 213.5% (4Q19/4Q18) Financial Margin with Clients Financial margin with clients comprises our spread -sensitive operations, working capital and others. Spread -sensitive operations are: (i) the assets margin, which is the difference between the amount received in loan operations and the cost of money charged by treasury bank ing and (ii) the liabilities margin, which is the difference between the cost of funding and the amount received from treasury banking. Workin g capital margin is the interest on working capital at the TPM interest rate. Change in the Financial Margin with Clients Breakdown 1 2 3 4 5 1 Mix of products (+Ch872 million): the increase in consumer and mortgage portfolios contributed to a higher share of products for these segments impacting the total financial margin with clients. 2 Average asset portfolio, assets spreads and liabilities margin(-Ch$396 million): decrease in weighted average spread of the loan portfolio was partially offset by the growth in the portfolio. 3 Commercial spreads on derivatives and FX transactions with clients (+Ch$2,167 million) : an increase in derivatives and FX transactions with wholesales clients impacted financial margin with clients. 4 Sale of student loans portfolio (+Ch$10,477 million): in the fourth quarter of each year, this portfolio recognizes the revenues of the sale of this product. 5 Working Capital and other (+Ch4,171 million): mainly due to a net gain arising from the application of the equity method, given that the bank gained significant influence over Nexus S.A. and Transbank S.A. by electing one of the board members for each company. Itaú Corpbanca 22
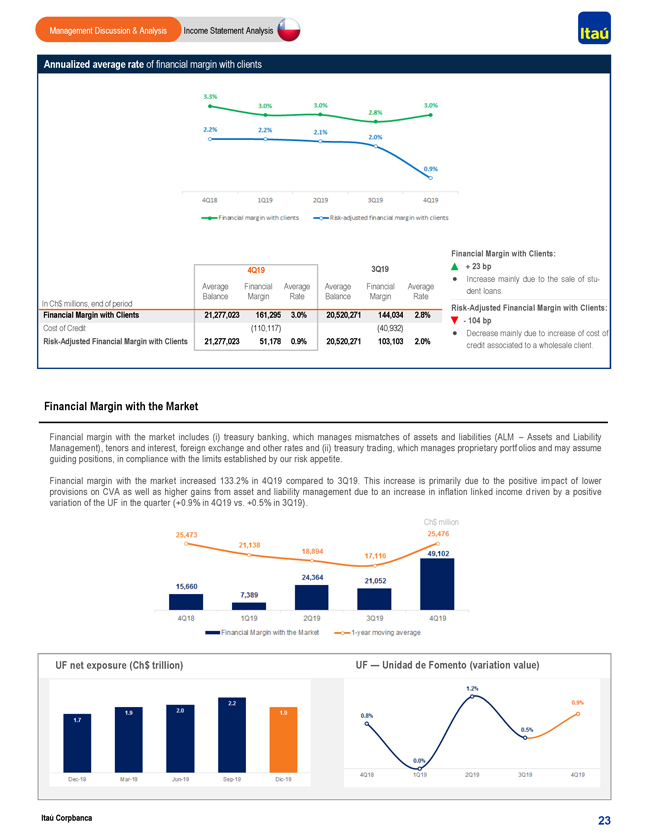
Management Discussion & Analysis Income Statement Analysis Annualized average rate of financial margin with clients Financial Margin with Clients: 4Q19 3Q19 + 23 bp · Increase mainly due to the sale ofstu-Average Financial Average Average Financial Average dent loans. Balance Margin Rate Balance Margin Rate In Ch$ millions, end of period Risk-Adjusted Financial Margin with Clients: Financial Margin with Clients 21,277,023 161,295 3.0% 20,520,271 144,034 2.8% Cost of Credit (110,117) (40,932) —104 bp Risk-Adjusted Financial Margin with Clients 21,277,023 51,178 0.9% 20,520,271 103,103 2.0% · Decrease mainly due to increase of cost of credit associated to a wholesale client. Financial Margin with the Market Financial margin with the market includes (i) treasury banking, which manages mismatches of assets and liabilities (ALM – Assets and Liability Management), tenors and interest, foreign exchange and other rates and (ii) treasury trading, which manages proprietary portf olios and may assume guiding positions, in compliance with the limits established by our risk appetite. Financial margin with the market increased 133.2% in 4Q19 compared to 3Q19. This increase is primarily due to the positive im pact of lower provisions on CVA as well as higher gains from asset and liability management due to an increase in inflation linked income d riven by a positive variation of the UF in the quarter (+0.9% in 4Q19 vs. +0.5% in 3Q19). Ch$ million UF net exposure (Ch$ trillion) UF — Unidad de Fomento (variation value) Itaú Corpbanca 23
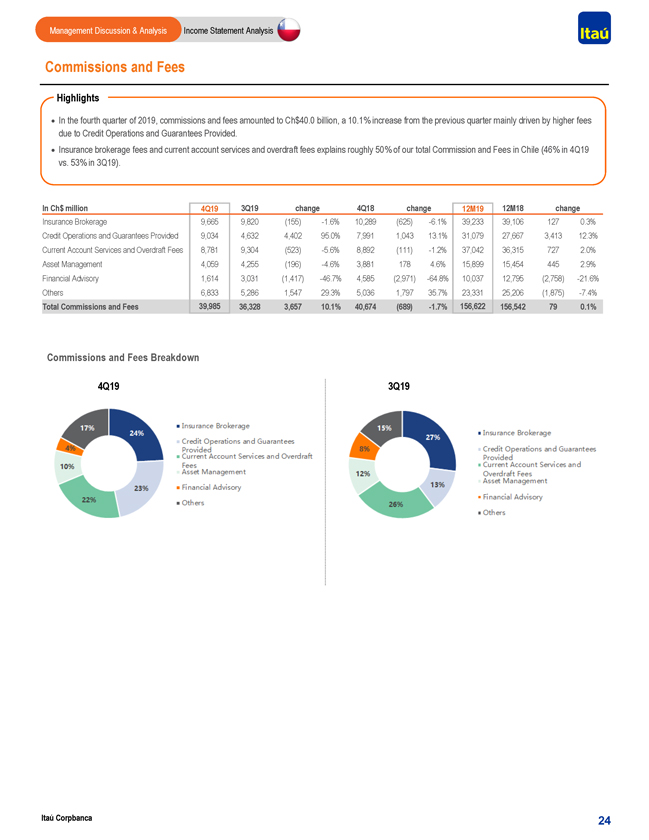
Management Discussion & Analysis Income Statement Analysis Commissions and Fees Highlights · In the fourth quarter of 2019, commissions and fees amounted to Ch$40.0 billion, a 10.1% increase from the previous quarter mainly driven by higher fees due to Credit Operations and Guarantees Provided. · Insurance brokerage fees and current account services and overdraft fees explains roughly 50% of our total Commission and Fees in Chile (46% in 4Q19 vs. 53% in 3Q19). In Ch$ million 4Q19 3Q19 change 4Q18 change 12M19 12M18 change Insurance Brokerage 9,665 9,820 (155)-1.6% 10,289 (625)-6.1% 39,233 39,106 127 0.3% Credit Operations and Guarantees Provided 9,034 4,632 4,402 95.0% 7,991 1,043 13.1% 31,079 27,667 3,413 12.3% Current Account Services and Overdraft Fees 8,781 9,304 (523)-5.6% 8,892 (111)-1.2% 37,042 36,315 727 2.0% Asset Management 4,059 4,255 (196)-4.6% 3,881 178 4.6% 15,899 15,454 445 2.9% Financial Advisory 1,614 3,031 (1,417)-46.7% 4,585 (2,971)-64.8% 10,037 12,795 (2,758)-21.6% Others 6,833 5,286 1,547 29.3% 5,036 1,797 35.7% 23,331 25,206 (1,875)-7.4% Total Commissions and Fees 39,985 36,328 3,657 10.1% 40,674 (689)-1.7% 156,622 156,542 79 0.1% Commissions and Fees Breakdown 4Q19 3Q19 Itaú Corpbanca 24
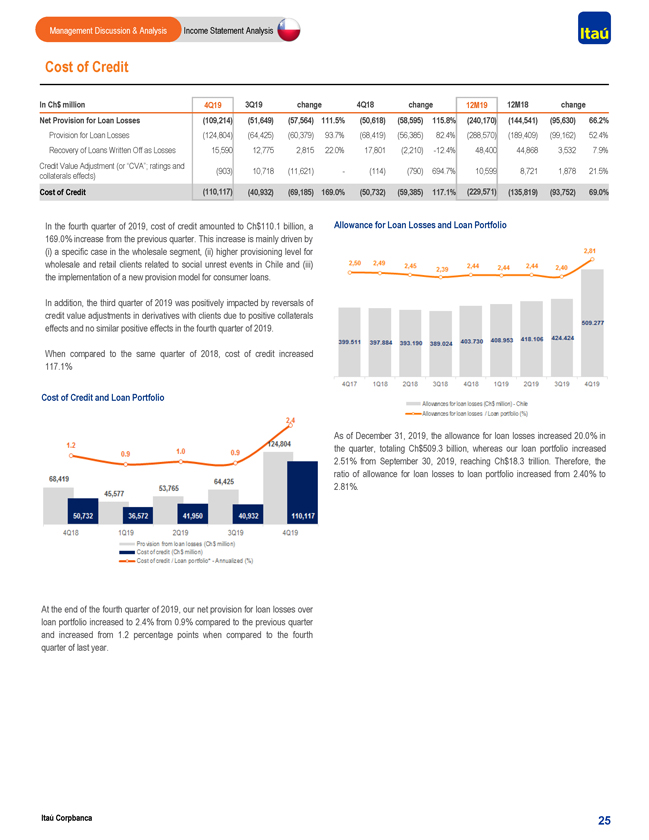
Management Discussion & Analysis Income Statement Analysis Cost of Credit In Ch$ million 4Q19 3Q19 change 4Q18 change 12M19 12M18 change Net Provision for Loan Losses (109,214) (51,649) (57,564) 111.5% (50,618) (58,595) 115.8% (240,170) (144,541) (95,630) 66.2% Provision for Loan Losses (124,804) (64,425) (60,379) 93.7% (68,419) (56,385) 82.4% (288,570) (189,409) (99,162) 52.4% Recovery of Loans Written Off as Losses 15,590 12,775 2,815 22.0% 17,801 (2,210)-12.4% 48,400 44,868 3,532 7.9% Credit Value Adjustment (or “CVA”; ratings and (903) 10,718 (11,621)—(114) (790) 694.7% 10,599 8,721 1,878 21.5% collaterals effects) Cost of Credit (110,117) (40,932) (69,185) 169.0% (50,732) (59,385) 117.1% (229,571) (135,819) (93,752) 69.0% In the fourth quarter of 2019, cost of credit amounted to Ch$110.1 billion, a Allowance for Loan Losses and Loan Portfolio 169.0% increase from the previous quarter. This increase is mainly driven by (i) a specific case in the wholesale segment, (ii) higher provisioning level for wholesale and retail clients related to social unrest events in Chile and (iii) the implementation of a new provision model for consumer loans. In addition, the third quarter of 2019 was positively impacted by reversals of credit value adjustments in derivatives with clients due to positive collaterals effects and no similar positive effects in the fourth quarter of 2019. When compared to the same quarter of 2018, cost of credit increased 117.1% Cost of Credit and Loan Portfolio As of December 31, 2019, the allowance for loan losses increased 20.0% in the quarter, totaling Ch$509.3 billion, whereas our loan portfolio increased 2.51% from September 30, 2019, reaching Ch$18.3 trillion. Therefore, the ratio of allowance for loan losses to loan portfolio increased from 2.40% to 2.81%. At the end of the fourth quarter of 2019, our net provision for loan losses over loan portfolio increased to 2.4% from 0.9% compared to the previous quarter and increased from 1.2 percentage points when compared to the fourth quarter of last year. Itaú Corpbanca 25
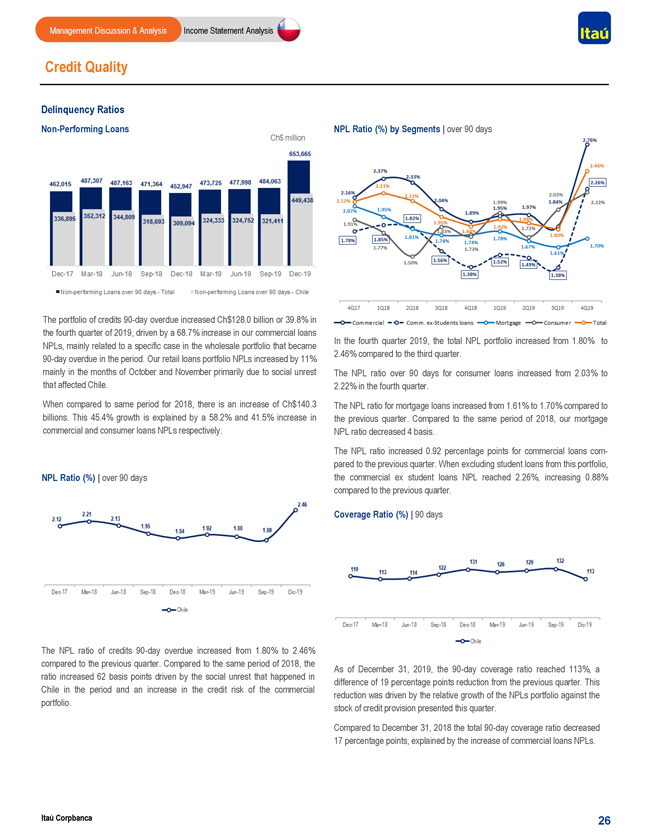
Management Discussion & Analysis Income Statement Analysis Credit Quality Delinquency RatiosNon-Performing Loans Ch$ million NPL Ratio (%) by Segments | over 90 days The portfolio of credits90-day overdue increased Ch$128.0 billion or 39.8% in the fourth quarter of 2019, driven by a 68.7% increase in our commercial loans In the fourth quarter 2019, the total NPL portfolio increased from 1.80% to NPLs, mainly related to a specific case in the wholesale portfolio that became 2.46% compared to the third quarter.90-day overdue in the period. Our retail loans portfolio NPLs increased by 11% mainly in the months of October and November primarily due to social unrest The NPL ratio over 90 days for consumer loans increased from 2.03% to that affected Chile. 2.22% in the fourth quarter. When compared to same period for 2018, there is an increase of Ch$140.3 The NPL ratio for mortgage loans increased from 1.61% to 1.70% compared to billions. This 45.4% growth is explained by a 58.2% and 41.5% increase in the previous quarter. Compared to the same period of 2018, our mortgage commercial and consumer loans NPLs respectively. NPL ratio decreased 4 basis. The NPL ratio increased 0.92 percentage points for commercial loans compared to the previous quarter. When excluding student loans from this portfolio, NPL Ratio (%) | over 90 days the commercial ex student loans NPL reached 2.26%, increasing 0.88% compared to the previous quarter. Coverage Ratio (%) | 90 days The NPL ratio of credits90-day overdue increased from 1.80% to 2.46% compared to the previous quarter. Compared to the same period of 2018, the As of December 31, 2019, the90-day coverage ratio reached 113%, a ratio increased 62 basis points driven by the social unrest that happened in difference of 19 percentage points reduction from the previous quarter. This Chile in the period and an increase in the credit risk of the commercial reduction was driven by the relative growth of the NPLs portfolio against the portfolio. stock of credit provision presented this quarter. Compared to December 31, 2018 the total90-day coverage ratio decreased 17 percentage points, explained by the increase of commercial loans NPLs. Corpbanca Itaú 26
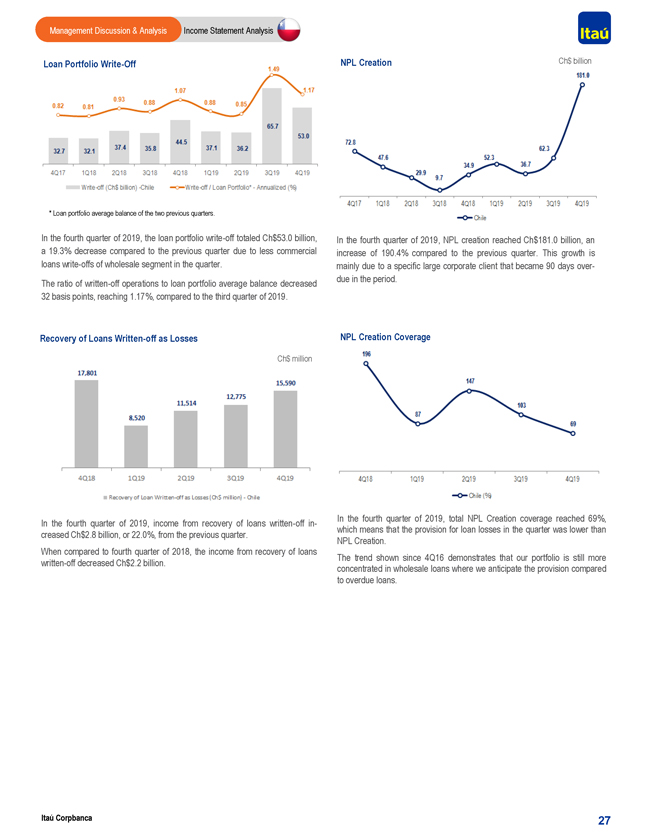
Management Discussion & Analysis Income Statement Analysis Loan PortfolioWrite-Off NPL Creation Ch$ billion * Loan portfolio average balance of the two previous quarters. In the fourth quarter of 2019, the loan portfoliowrite-off totaled Ch$53.0 billion, In the fourth quarter of 2019, NPL creation reached Ch$181.0 billion, an a 19.3% decrease compared to the previous quarter due to less commercial increase of 190.4% compared to the previous quarter. This growth is loans write-offs of wholesale segment in the quarter. mainly due to a specific large corporate client that became 90 days overdue in the period. The ratio ofwritten-off operations to loan portfolio average balance decreased 32 basis points, reaching 1.17%, compared to the third quarter of 2019. Recovery of LoansWritten-off as Losses NPL Creation Coverage Ch$ million In the fourth quarter of 2019, total NPL Creation coverage reached 69%, In the fourth quarter of 2019, income from recovery of loanswritten-offin-which means that the provision for loan losses in the quarter was lower than creased Ch$2.8 billion, or 22.0%, from the previous quarter. NPL Creation. When compared to fourth quarter of 2018, the income from recovery of loans The trend shown since 4Q16 demonstrates that our portfolio is still morewritten-off decreased Ch$2.2 billion. concentrated in wholesale loans where we anticipate the provision compared to overdue loans. Itaú Corpbanca 27
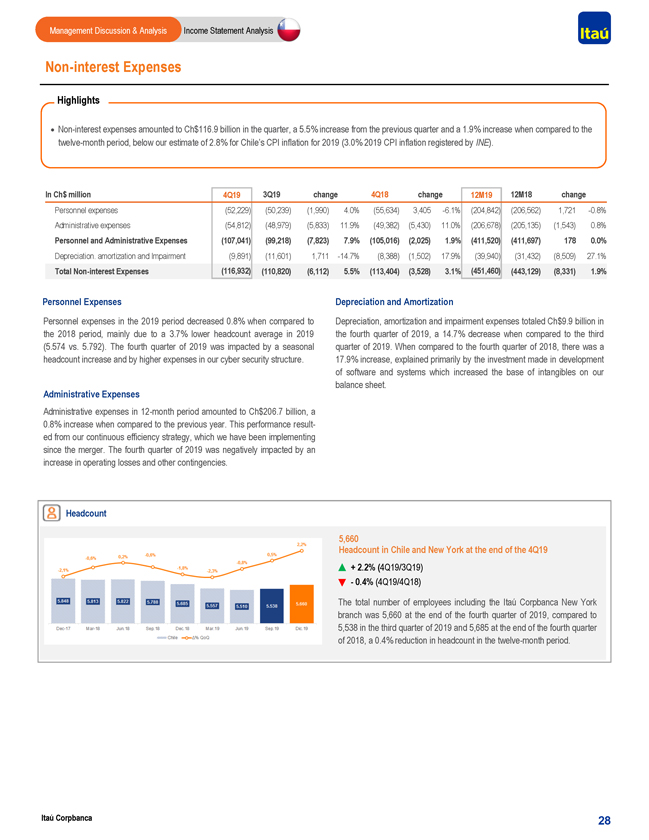
Management Discussion & Analysis Income Statement AnalysisNon-interest Expenses Highlights ·Non-interest expenses amounted to Ch$116.9 billion in the quarter, a 5.5% increase from the previous quarter and a 1.9% increase when compared to the twelve-month period, below our estimate of 2.8% for Chile’s CPI inflation for 2019 (3.0% 2019 CPI inflation registered by INE). In Ch$ million 4Q19 3Q19 change 4Q18 change 12M19 12M18 change Personnel expenses (52,229) (50,239) (1,990) 4.0% (55,634) 3,405-6.1% (204,842) (206,562) 1,721-0.8% Administrative expenses (54,812) (48,979) (5,833) 11.9% (49,382) (5,430) 11.0% (206,678) (205,135) (1,543) 0.8% Personnel and Administrative Expenses (107,041) (99,218) (7,823) 7.9% (105,016) (2,025) 1.9% (411,520) (411,697) 178 0.0% Depreciation. amortization and Impairment (9,891) (11,601) 1,711-14.7% (8,388) (1,502) 17.9% (39,940) (31,432) (8,509) 27.1% TotalNon-interest Expenses (116,932) (110,820) (6,112) 5.5% (113,404) (3,528) 3.1% (451,460) (443,129) (8,331) 1.9% Personnel Expenses Depreciation and Amortization Personnel expenses in the 2019 period decreased 0.8% when compared to Depreciation, amortization and impairment expenses totaled Ch$9.9 billion in the 2018 period, mainly due to a 3.7% lower headcount average in 2019 the fourth quarter of 2019, a 14.7% decrease when compared to the third (5.574 vs. 5.792). The fourth quarter of 2019 was impacted by a seasonal quarter of 2019. When compared to the fourth quarter of 2018, there was a headcount increase and by higher expenses in our cyber security structure. 17.9% increase, explained primarily by the investment made in development of software and systems which increased the base of intangibles on our balance sheet. Administrative Expenses Administrative expenses in12-month period amounted to Ch$206.7 billion, a 0.8% increase when compared to the previous year. This performance resulted from our continuous efficiency strategy, which we have been implementing since the merger. The fourth quarter of 2019 was negatively impacted by an increase in operating losses and other contingencies. Headcount 5,660 Headcount in Chile and New York at the end of the 4Q19 + 2.2% (4Q19/3Q19) —0.4% (4Q19/4Q18) The total number of employees including the Itaú Corpbanca New York branch was 5,660 at the end of the fourth quarter of 2019, compared to 5,538 in the third quarter of 2019 and 5,685 at the end of the fourth quarter of 2018, a 0.4% reduction in headcount in the twelve-month period. Itaú Corpbanca 28
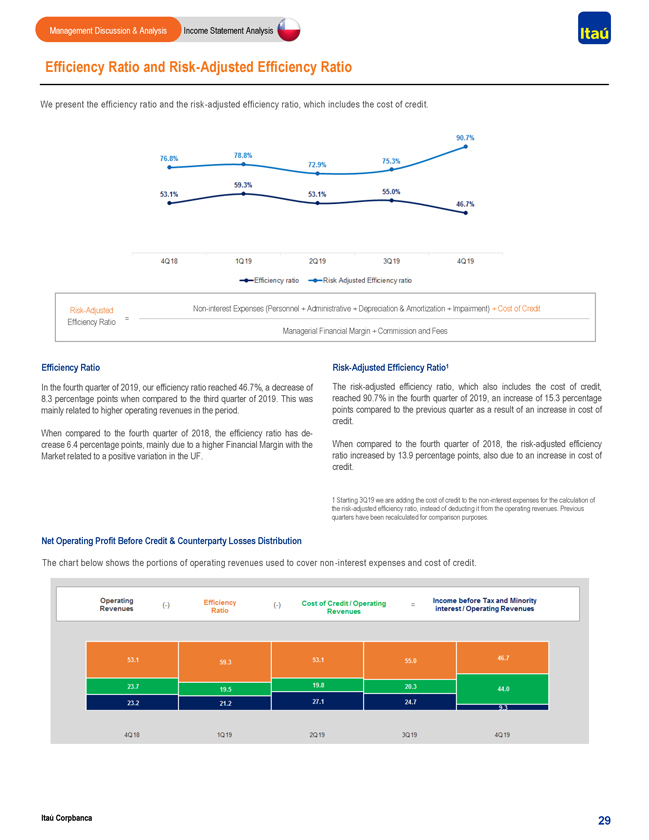
Management Discussion & Analysis Income Statement Analysis Efficiency Ratio and Risk-Adjusted Efficiency Ratio We present the efficiency ratio and the risk-adjusted efficiency ratio, which includes the cost of credit. Risk-AdjustedNon-interest Expenses (Personnel + Administrative + Depreciation & Amortization + Impairment) + Cost of Credit Efficiency Ratio = Managerial Financial Margin + Commission and Fees Efficiency Ratio Risk-Adjusted Efficiency Ratio1 In the fourth quarter of 2019, our efficiency ratio reached 46.7%, a decrease of The risk-adjusted efficiency ratio, which also includes the cost of credit, 8.3 percentage points when compared to the third quarter of 2019. This was reached 90.7% in the fourth quarter of 2019, an increase of 15.3 percentage mainly related to higher operating revenues in the period. points compared to the previous quarter as a result of an increase in cost of credit. When compared to the fourth quarter of 2018, the efficiency ratio hasde- crease 6.4 percentage points, mainly due to a higher Financial Margin with the When compared to the fourth quarter of 2018, the risk-adjusted efficiency Market related to a positive variation in the UF. ratio increased by 13.9 percentage points, also due to an increase in cost of credit. 1 Starting 3Q19 we are adding the cost of credit to thenon-interest expenses for the calculation of the risk-adjusted efficiency ratio, instead of deducting it from the operating revenues. Previous quarters have been recalculated for comparison purposes. Net Operating Profit Before Credit & Counterparty Losses Distribution The chart below shows the portions of operating revenues used to cover non -interest expenses and cost of credit. Itaú Corpbanca 29
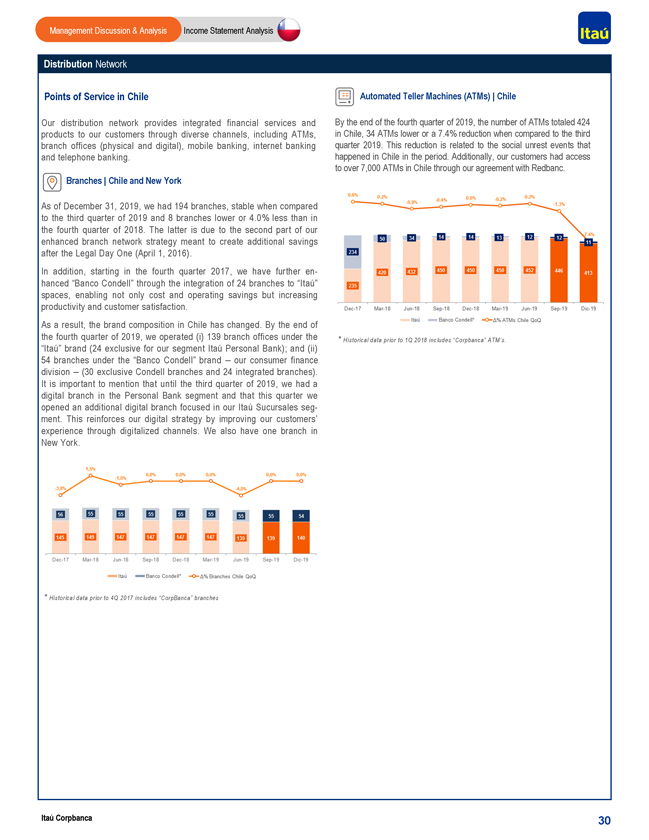
Management Discussion & Analysis Income Statement Analysis Distribution Network Points of Service in Chile Automated Teller Machines (ATMs) | Chile Our distribution network provides integrated financial services and By the end of the fourth quarter of 2019, the number of ATMs totaled 424 products to our customers through diverse channels, including ATMs, in Chile, 34 ATMs lower or a 7.4% reduction when compared to the third branch offices (physical and digital), mobile banking, internet banking quarter 2019. This reduction is related to the social unrest events that and telephone banking. happened in Chile in the period. Additionally, our customers had access to over 7,000 ATMs in Chile through our agreement with Redbanc. Branches | Chile and New York As of December 31, 2019, we had 194 branches, stable when compared to the third quarter of 2019 and 8 branches lower or 4.0% less than in the fourth quarter of 2018. The latter is due to the second part of our enhanced branch network strategy meant to create additional savings after the Legal Day One (April 1, 2016). In addition, starting in the fourth quarter 2017, we have further enhanced “Banco Condell” through the integration of 24 branches to “Itaú” spaces, enabling not only cost and operating savings but increasing productivity and customer satisfaction. As a result, the brand composition in Chile has changed. By the end of the fourth quarter of 2019, we operated (i) 139 branch offices under the * Historical data prior to 1Q 2018 includes “Corpbanca” ATM’s. “Itaú” brand (24 exclusive for our segment Itaú Personal Bank); and (ii) 54 branches under the “Banco Condell” brand – our consumer finance division – (30 exclusive Condell branches and 24 integrated branches). It is important to mention that until the third quarter of 2019, we had a digital branch in the Personal Bank segment and that this quarter we opened an additional digital branch focused in our Itaú Sucursales segment. This reinforces our digital strategy by improving our customers’ experience through digitalized channels. We also have one branch in New York. * Historical data prior to 4Q 2017 includes “CorpBanca” branches Itaú Corpbanca 30
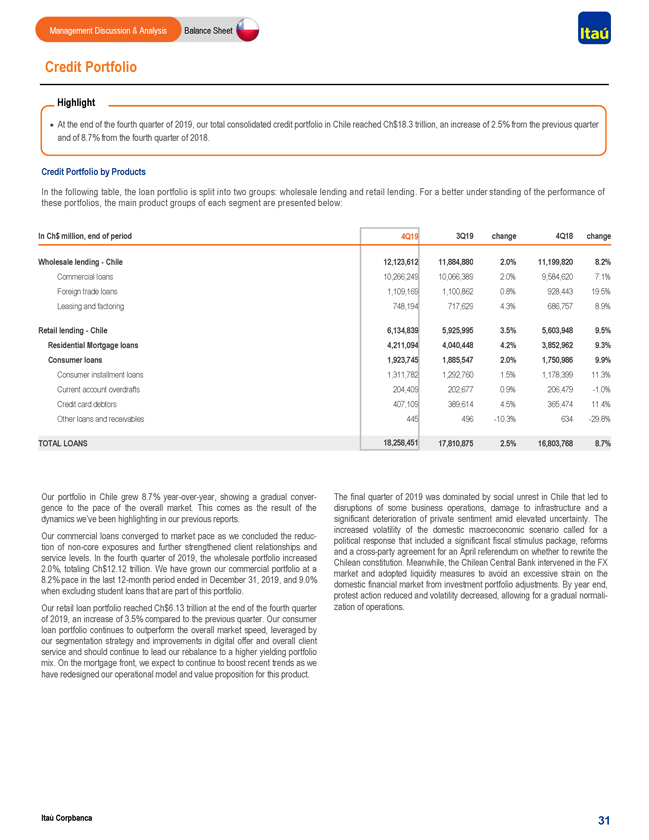
Management Discussion & Analysis Balance Sheet Credit Portfolio Highlight · At the end of the fourth quarter of 2019, our total consolidated credit portfolio in Chile reached Ch$18.3 trillion, an increase of 2.5% from the previous quarter and of 8.7% from the fourth quarter of 2018. Credit Portfolio by Products In the following table, the loan portfolio is split into two groups: wholesale lending and retail lending. For a better under standing of the performance of these portfolios, the main product groups of each segment are presented below: In Ch$ million, end of period 4Q19 3Q19 change 4Q18 change Wholesale lending—Chile 12,123,612 11,884,880 2.0% 11,199,820 8.2% Commercial loans 10,266,249 10,066,389 2.0% 9,584,620 7.1% Foreign trade loans 1,109,169 1,100,862 0.8% 928,443 19.5% Leasing and factoring 748,194 717,629 4.3% 686,757 8.9% Retail lending—Chile 6,134,839 5,925,995 3.5% 5,603,948 9.5% Residential Mortgage loans 4,211,094 4,040,448 4.2% 3,852,962 9.3% Consumer loans 1,923,745 1,885,547 2.0% 1,750,986 9.9% Consumer installment loans 1,311,782 1,292,760 1.5% 1,178,399 11.3% Current account overdrafts 204,409 202,677 0.9% 206,479-1.0% Credit card debtors 407,109 389,614 4.5% 365,474 11.4% Other loans and receivables 445 496-10.3% 634-29.8% TOTAL LOANS 18,258,451 17,810,875 2.5% 16,803,768 8.7% Our portfolio in Chile grew 8.7% year-over-year, showing a gradual conver- The final quarter of 2019 was dominated by social unrest in Chile that led to gence to the pace of the overall market. This comes as the result of the disruptions of some business operations, damage to infrastructure and a dynamics we’ve been highlighting in our previous reports. significant deterioration of private sentiment amid elevated uncertainty. The increased volatility of the domestic macroeconomic scenario called for a Our commercial loans converged to market pace as we concluded the reduc-political response that included a significant fiscal stimulus package, reforms tion ofnon-core exposures and further strengthened client relationships and and a cross-party agreement for an April referendum on whether to rewrite the service levels. In the fourth quarter of 2019, the wholesale portfolio increased Chilean constitution. Meanwhile, the Chilean Central Bank intervened in the FX 2.0%, totaling Ch$12.12 trillion. We have grown our commercial portfolio at a market and adopted liquidity measures to avoid an excessive strain on the 8.2% pace in the last12-month period ended in December 31, 2019, and 9.0% domestic financial market from investment portfolio adjustments. By year end, when excluding student loans that are part of this portfolio. protest action reduced and volatility decreased, allowing for a gradualnormali-Our retail loan portfolio reached Ch$6.13 trillion at the end of the fourth quarter zation of operations. of 2019, an increase of 3.5% compared to the previous quarter. Our consumer loan portfolio continues to outperform the overall market speed, leveraged by our segmentation strategy and improvements in digital offer and overall client service and should continue to lead our rebalance to a higher yielding portfolio mix. On the mortgage front, we expect to continue to boost recent trends as we have redesigned our operational model and value proposition for this product. Itaú Corpbanca 31
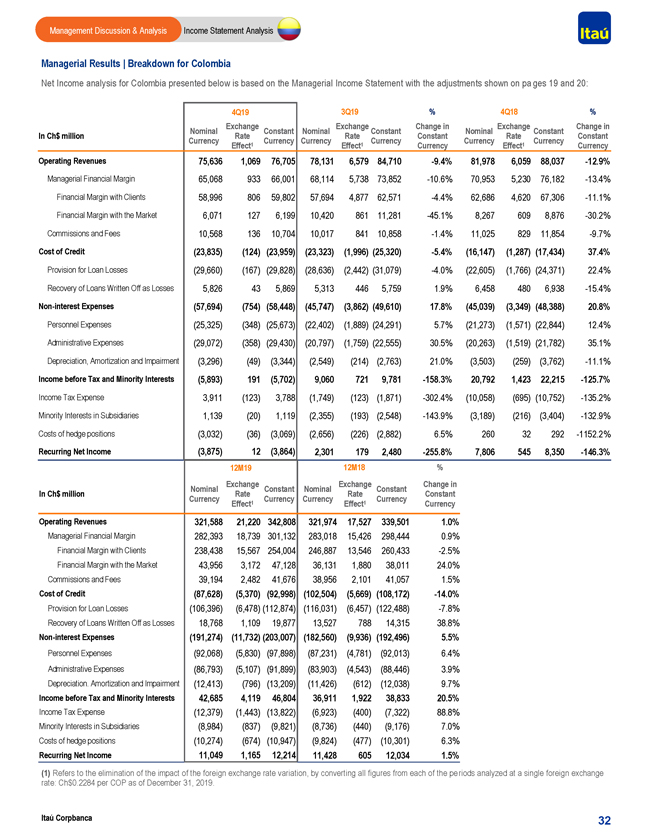
Management Discussion & Analysis Income Statement Analysis Managerial Results | Breakdown for Colombia Net Income analysis for Colombia presented below is based on the Managerial Income Statement with the adjustments shown on pa ges 19 and 20: 4Q19 3Q19 % 4Q18 % Exchange Exchange Change in Exchange Change in Nominal Constant Nominal Constant Nominal Constant In Ch$ million Rate Rate Constant Rate Constant Currency Currency Currency Currency Currency Currency Effect1 Effect1 Currency Effect1 Currency Operating Revenues 75,636 1,069 76,705 78,131 6,579 84,710-9.4% 81,978 6,059 88,037-12.9% Managerial Financial Margin 65,068 933 66,001 68,114 5,738 73,852-10.6% 70,953 5,230 76,182-13.4% Financial Margin with Clients 58,996 806 59,802 57,694 4,877 62,571-4.4% 62,686 4,620 67,306-11.1% Financial Margin with the Market 6,071 127 6,199 10,420 861 11,281-45.1% 8,267 609 8,876-30.2% Commissions and Fees 10,568 136 10,704 10,017 841 10,858-1.4% 11,025 829 11,854-9.7% Cost of Credit (23,835) (124) (23,959) (23,323) (1,996) (25,320)-5.4% (16,147) (1,287) (17,434) 37.4% Provision for Loan Losses (29,660) (167) (29,828) (28,636) (2,442) (31,079)-4.0% (22,605) (1,766) (24,371) 22.4% Recovery of Loans Written Off as Losses 5,826 43 5,869 5,313 446 5,759 1.9% 6,458 480 6,938-15.4%Non-interest Expenses (57,694) (754) (58,448) (45,747) (3,862) (49,610) 17.8% (45,039) (3,349) (48,388) 20.8% Personnel Expenses (25,325) (348) (25,673) (22,402) (1,889) (24,291) 5.7% (21,273) (1,571) (22,844) 12.4% Administrative Expenses (29,072) (358) (29,430) (20,797) (1,759) (22,555) 30.5% (20,263) (1,519) (21,782) 35.1% Depreciation, Amortization and Impairment (3,296) (49) (3,344) (2,549) (214) (2,763) 21.0% (3,503) (259) (3,762)-11.1% Income before Tax and Minority Interests (5,893) 191 (5,702) 9,060 721 9,781-158.3% 20,792 1,423 22,215-125.7% Income Tax Expense 3,911 (123) 3,788 (1,749) (123) (1,871)-302.4% (10,058) (695) (10,752)-135.2% Minority Interests in Subsidiaries 1,139 (20) 1,119 (2,355) (193) (2,548)-143.9% (3,189) (216) (3,404)-132.9% Costs of hedge positions (3,032) (36) (3,069) (2,656) (226) (2,882) 6.5% 260 32 292 -1152.2% Recurring Net Income (3,875) 12 (3,864) 2,301 179 2,480-255.8% 7,806 545 8,350-146.3% 12M19 12M18 % Exchange Exchange Change in Nominal Constant Nominal Constant In Ch$ million Rate Rate Constant Currency Currency Currency Currency Effect1 Effect1 Currency Operating Revenues 321,588 21,220 342,808 321,974 17,527 339,501 1.0% Managerial Financial Margin 282,393 18,739 301,132 283,018 15,426 298,444 0.9% Financial Margin with Clients 238,438 15,567 254,004 246,887 13,546 260,433-2.5% Financial Margin with the Market 43,956 3,172 47,128 36,131 1,880 38,011 24.0% Commissions and Fees 39,194 2,482 41,676 38,956 2,101 41,057 1.5% Cost of Credit (87,628) (5,370) (92,998) (102,504) (5,669) (108,172)-14.0% Provision for Loan Losses (106,396) (6,478) (112,874) (116,031) (6,457) (122,488)-7.8% Recovery of Loans Written Off as Losses 18,768 1,109 19,877 13,527 788 14,315 38.8%Non-interest Expenses (191,274) (11,732) (203,007) (182,560) (9,936) (192,496) 5.5% Personnel Expenses (92,068) (5,830) (97,898) (87,231) (4,781) (92,013) 6.4% Administrative Expenses (86,793) (5,107) (91,899) (83,903) (4,543) (88,446) 3.9% Depreciation. Amortization and Impairment (12,413) (796) (13,209) (11,426) (612) (12,038) 9.7% Income before Tax and Minority Interests 42,685 4,119 46,804 36,911 1,922 38,833 20.5% Income Tax Expense (12,379) (1,443) (13,822) (6,923) (400) (7,322) 88.8% Minority Interests in Subsidiaries (8,984) (837) (9,821) (8,736) (440) (9,176) 7.0% Costs of hedge positions (10,274) (674) (10,947) (9,824) (477) (10,301) 6.3% Recurring Net Income 11,049 1,165 12,214 11,428 605 12,034 1.5% (1) Refers to the elimination of the impact of the foreign exchange rate variation, by converting all figures from each of the pe riods analyzed at a single foreign exchange rate: Ch$0.2284 per COP as of December 31, 2019. Itaú Corpbanca 32
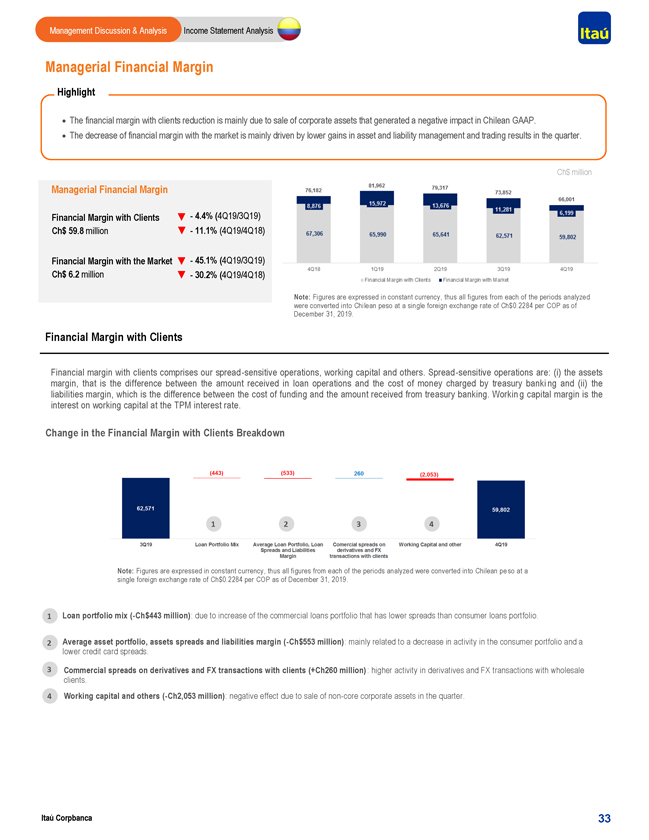
Management Discussion & Analysis Income Statement Analysis Managerial Financial Margin Highlight · The financial margin with clients reduction is mainly due to sale of corporate assets that generated a negative impact in Chilean GAAP. · The decrease of financial margin with the market is mainly driven by lower gains in asset and liability management and trading results in the quarter. Ch$ million Managerial Financial Margin Financial Margin with Clients —4.4% (4Q19/3Q19) Ch$ 59.8 million —11.1% (4Q19/4Q18) Financial Margin with the Market —45.1% (4Q19/3Q19) Ch$ 6.2 million —30.2% (4Q19/4Q18) Note: Figures are expressed in constant currency, thus all figures from each of the periods analyzed were converted into Chilean peso at a single foreign exchange rate of Ch$0.2284 per COP as of December 31, 2019. Financial Margin with Clients Financial margin with clients comprises our spread -sensitive operations, working capital and others. Spread -sensitive operations are: (i) the assets margin, that is the difference between the amount received in loan operations and the cost of money charged by treasury banki ng and (ii) the liabilities margin, which is the difference between the cost of funding and the amount received from treasury banking. Workin g capital margin is the interest on working capital at the TPM interest rate. Change in the Financial Margin with Clients Breakdown 1 2 3 4 Note: Figures are expressed in constant currency, thus all figures from each of the periods analyzed were converted into Chilean pe so at a single foreign exchange rate of Ch$0.2284 per COP as of December 31, 2019. 1 Loan portfolio mix(-Ch$443 million): due to increase of the commercial loans portfolio that has lower spreads than consumer loans portfolio. 2 Average asset portfolio, assets spreads and liabilities margin(-Ch$553 million): mainly related to a decrease in activity in the consumer portfolio and a lower credit card spreads. 3 Commercial spreads on derivatives and FX transactions with clients (+Ch260 million) : higher activity in derivatives and FX transactions with wholesale clients. 4 Working capital and others(-Ch2,053 million): negative effect due to sale ofnon-core corporate assets in the quarter. Itaú Corpbanca 33
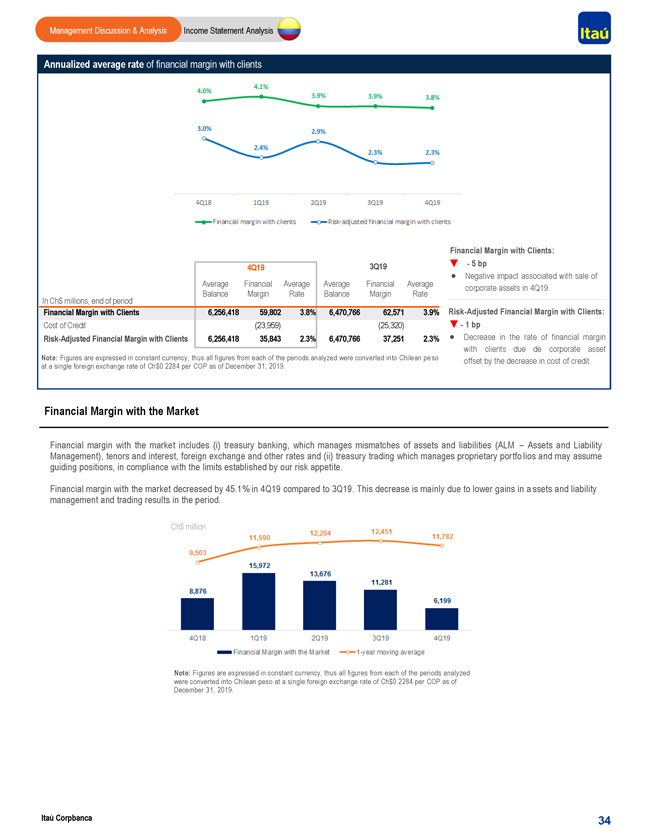
Management Discussion & Analysis Income Statement Analysis Annualized average rate of financial margin with clients Financial Margin with Clients: 3Q19 —5 bp 4Q19 · Negative impact associated with sale of Average Financial Average Average Financial Average corporate assets in 4Q19. Balance Margin Rate Balance Margin Rate In Ch$ millions, end of period Financial Margin with Clients 6,256,418 59,802 3.8% 6,470,766 62,571 3.9% Risk-Adjusted Financial Margin with Clients: Cost of Credit (23,959) (25,320) —1 bp Risk-Adjusted Financial Margin with Clients 6,256,418 35,843 2.3% 6,470,766 37,251 2.3% · Decrease in the rate of financial margin with clients due de corporate asset Note: Figures are expressed in constant currency, thus all figures from each of the periods analyzed were converted into Chilean pe so offset by the decrease in cost of credit. at a single foreign exchange rate of Ch$0.2284 per COP as of December 31, 2019. Financial Margin with the Market Financial margin with the market includes (i) treasury banking, which manages mismatches of assets and liabilities (ALM – Assets and Liability Management), tenors and interest, foreign exchange and other rates and (ii) treasury trading which manages proprietary portfo lios and may assume guiding positions, in compliance with the limits established by our risk appetite. Financial margin with the market decreased by 45.1% in 4Q19 compared to 3Q19. This decrease is mainly due to lower gains in a ssets and liability management and trading results in the period. Ch$ million Note: Figures are expressed in constant currency, thus all figures from each of the periods analyzed were converted into Chilean peso at a single foreign exchange rate of Ch$0.2284 per COP as of December 31, 2019. Itaú Corpbanca 34
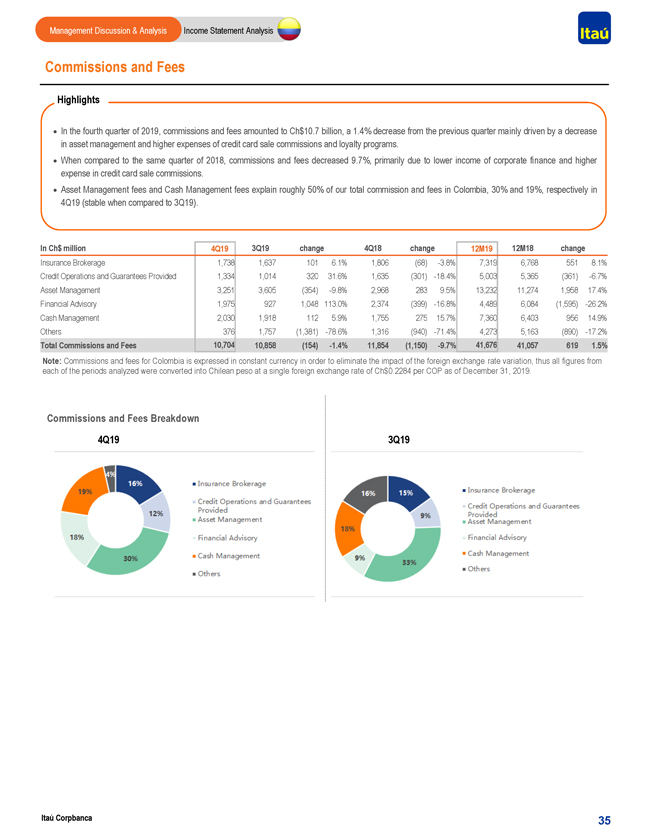
Management Discussion & Analysis Income Statement Analysis Commissions and Fees Highlights · In the fourth quarter of 2019, commissions and fees amounted to Ch$10.7 billion, a 1.4% decrease from the previous quarter mainly driven by a decrease in asset management and higher expenses of credit card sale commissions and loyalty programs. · When compared to the same quarter of 2018, commissions and fees decreased 9.7%, primarily due to lower income of corporate finance and higher expense in credit card sale commissions. · Asset Management fees and Cash Management fees explain roughly 50% of our total commission and fees in Colombia, 30% and 19%, respectively in 4Q19 (stable when compared to 3Q19). In Ch$ million 4Q19 3Q19 change 4Q18 change 12M19 12M18 change Insurance Brokerage 1,738 1,637 101 6.1% 1,806 (68)-3.8% 7,319 6,768 551 8.1% Credit Operations and Guarantees Provided 1,334 1,014 320 31.6% 1,635 (301)-18.4% 5,003 5,365 (361)-6.7% Asset Management 3,251 3,605 (354)-9.8% 2,968 283 9.5% 13,232 11,274 1,958 17.4% Financial Advisory 1,975 927 1,048 113.0% 2,374 (399)-16.8% 4,489 6,084 (1,595)-26.2% Cash Management 2,030 1,918 112 5.9% 1,755 275 15.7% 7,360 6,403 956 14.9% Others 376 1,757 (1,381)-78.6% 1,316 (940)-71.4% 4,273 5,163 (890)-17.2% Total Commissions and Fees 10,704 10,858 (154)-1.4% 11,854 (1,150)-9.7% 41,676 41,057 619 1.5% Note: Commissions and fees for Colombia is expressed in constant currency in order to eliminate the impact of the foreign exchange rate variation, thus all figures from each of the periods analyzed were converted into Chilean peso at a single foreign exchange rate of Ch$0.2284 per COP as of De cember 31, 2019. Commissions and Fees Breakdown 4Q19 3Q19 Itaú Corpbanca 35
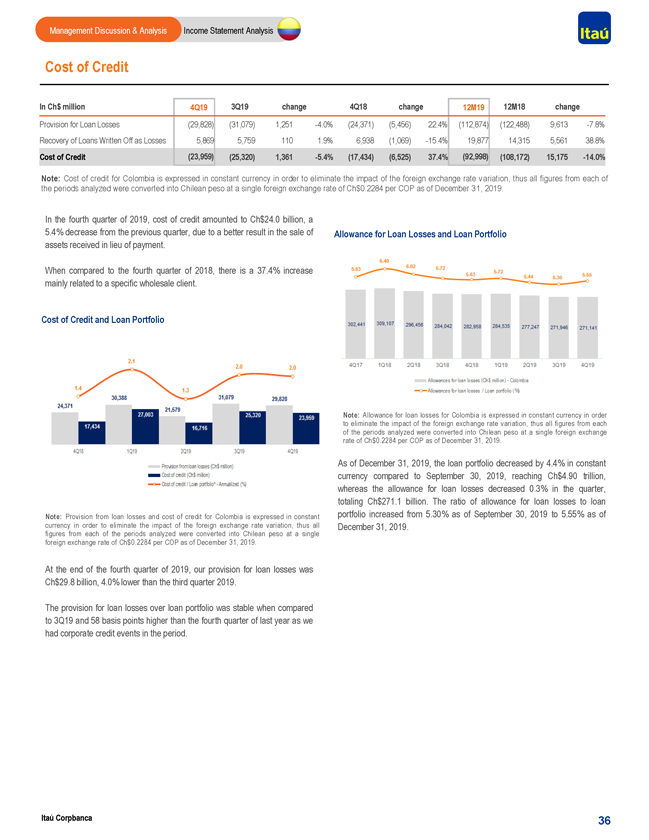
Management Discussion & Analysis Income Statement Analysis Cost of Credit In Ch$ million 4Q19 3Q19 change 4Q18 change 12M19 12M18 change Provision for Loan Losses (29,828) (31,079) 1,251-4.0% (24,371) (5,456) 22.4% (112,874) (122,488) 9,613-7.8% Recovery of Loans Written Off as Losses 5,869 5,759 110 1.9% 6,938 (1,069)-15.4% 19,877 14,315 5,561 38.8% Cost of Credit (23,959) (25,320) 1,361-5.4% (17,434) (6,525) 37.4% (92,998) (108,172) 15,175-14.0% Note: Cost of credit for Colombia is expressed in constant currency in order to eliminate the impact of the foreign exchange rate v ariation, thus all figures from each of the periods analyzed were converted into Chilean peso at a single foreign exchange rate of Ch$0.2284 per COP as of December 3 1, 2019. In the fourth quarter of 2019, cost of credit amounted to Ch$24.0 billion, a 5.4% decrease from the previous quarter, due to a better result in the sale of Allowance for Loan Losses and Loan Portfolio assets received in lieu of payment. When compared to the fourth quarter of 2018, there is a 37.4% increase mainly related to a specific wholesale client. Cost of Credit and Loan Portfolio Note: Allowance for loan losses for Colombia is expressed in constant currency in order to eliminate the impact of the foreign exchange rate variation, thus all figures from each of the periods analyzed were converted into Chilean peso at a single foreign exchange rate of Ch$0.2284 per COP as of December 31, 2019. As of December 31, 2019, the loan portfolio decreased by 4.4% in constant currency compared to September 30, 2019, reaching Ch$4.90 trillion, whereas the allowance for loan losses decreased 0.3% in the quarter, totaling Ch$271.1 billion. The ratio of allowance for loan losses to loan Note: Provision from loan losses and cost of credit for Colombia is expressed in constant portfolio increased from 5.30% as of September 30, 2019 to 5.55% as of currency in order to eliminate the impact of the foreign exchange rate variation, thus all December 31, 2019. figures from each of the periods analyzed were converted into Chilean peso at a single foreign exchange rate of Ch$0.2284 per COP as of December 31, 2019. At the end of the fourth quarter of 2019, our provision for loan losses was Ch$29.8 billion, 4.0% lower than the third quarter 2019. The provision for loan losses over loan portfolio was stable when compared to 3Q19 and 58 basis points higher than the fourth quarter of last year as we had corporate credit events in the period. Itaú Corpbanca 36
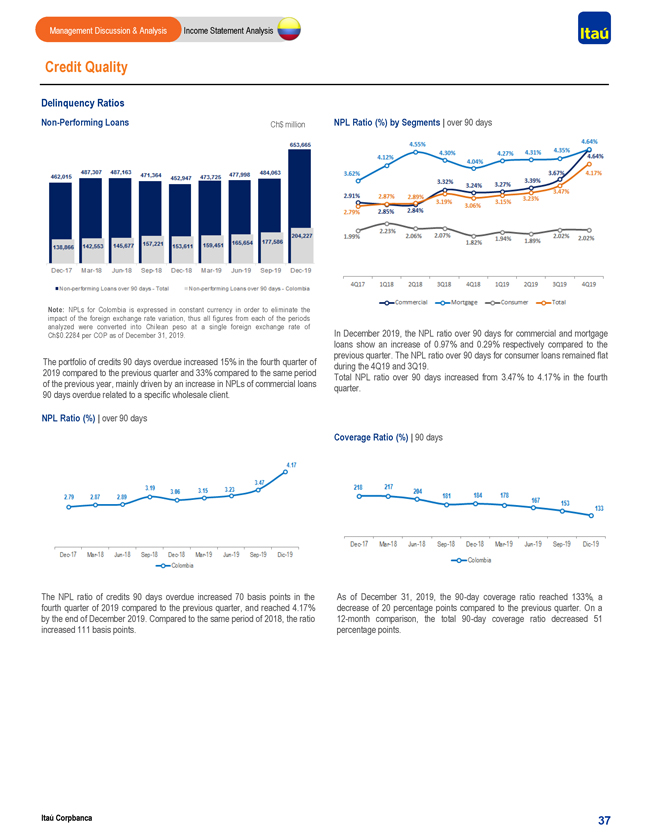
Itaú Corpbanca Income Statement Analysis Management Discussion & Analysis 37 Delinquency Ratios NPL Ratio (%) | over 90 days Non-Performing Loans NPL Ratio (%) by Segments | over 90 days Coverage Ratio (%) | 90 days The portfolio of credits 90 days overdue increased 15% in the fourth quarter of 2019 compared to the previous quarter and 33% compared to the same period of the previous year, mainly driven by an increase in NPLs of commercial loans 90 days overdue related to a specific wholesale client. In December 2019, the NPL ratio over 90 days for commercial and mortgage loans show an increase of 0.97% and 0.29% respectively compared to the previous quarter. The NPL ratio over 90 days for consumer loans remained flat during the 4Q19 and 3Q19. Total NPL ratio over 90 days increased from 3.47% to 4.17% in the fourth quarter. The NPL ratio of credits 90 days overdue increased 70 basis points in the fourth quarter of 2019 compared to the previous quarter, and reached 4.17% by the end of December 2019. Compared to the same period of 2018, the ratio increased 111 basis points. As of December 31, 2019, the 90-day coverage ratio reached 133%, a decrease of 20 percentage points compared to the previous quarter. On a 12-month comparison, the total 90-day coverage ratio decreased 51 percentage points. Note: NPLs for Colombia is expressed in constant currency in order to eliminate the impact of the foreign exchange rate variation, thus all figures from each of the periods analyzed were converted into Chilean peso at a single foreign exchange rate of Ch$0.2284 per COP as of December 31, 2019. Credit Quality Ch$ million
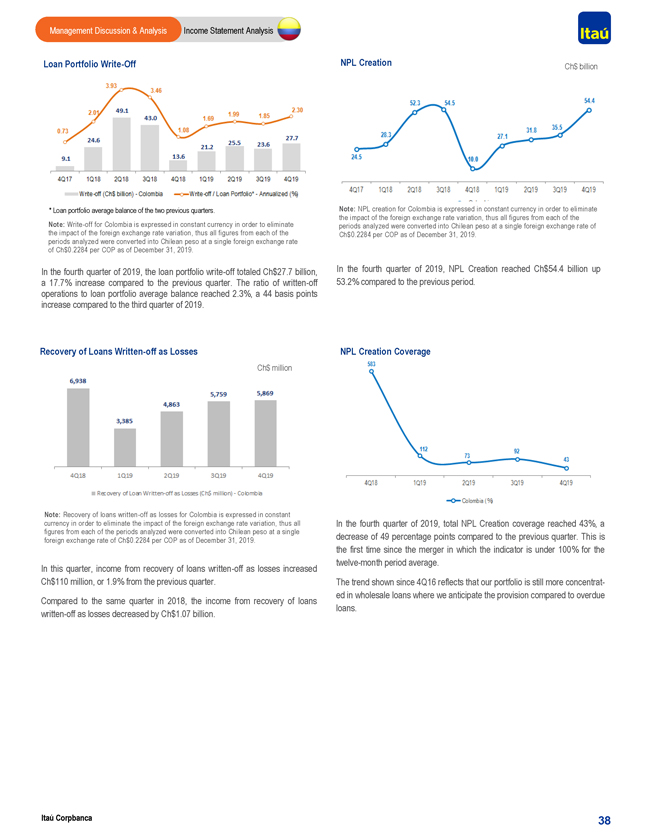
Itaú Corpbanca Income Statement Analysis Management Discussion & Analysis 38 In the fourth quarter of 2019, NPL Creation reached Ch$54.4 billion up 53.2% compared to the previous period. NPL Creation In this quarter, income from recovery of loans written-off as losses increased Ch$110 million, or 1.9% from the previous quarter. Compared to the same quarter in 2018, the income from recovery of loans written-off as losses decreased by Ch$1.07 billion. In the fourth quarter of 2019, total NPL Creation coverage reached 43%, a decrease of 49 percentage points compared to the previous quarter. This is the first time since the merger in which the indicator is under 100% for the twelve-month period average. The trend shown since 4Q16 reflects that our portfolio is still more concentrat-ed in wholesale loans where we anticipate the provision compared to overdue loans. Note: NPL creation for Colombia is expressed in constant currency in order to eliminate the impact of the foreign exchange rate variation, thus all figures from each of the periods analyzed were converted into Chilean peso at a single foreign exchange rate of Ch$0.2284 per COP as of December 31, 2019. Note: Recovery of loans written-off as losses for Colombia is expressed in constant currency in order to eliminate the impact of the foreign exchange rate variation, thus all figures from each of the periods analyzed were converted into Chilean peso at a single foreign exchange rate of Ch$0.2284 per COP as of December 31, 2019. Ch$ billion * Loan portfolio average balance of the two previous quarters. Note: Write-off for Colombia is expressed in constant currency in order to eliminate the impact of the foreign exchange rate variation, thus all figures from each of the periods analyzed were converted into Chilean peso at a single foreign exchange rate of Ch$0.2284 per COP as of December 31, 2019. In the fourth quarter of 2019, the loan portfolio write-off totaled Ch$27.7 billion, a 17.7% increase compared to the previous quarter. The ratio of written-off operations to loan portfolio average balance reached 2.3%, a 44 basis points increase compared to the third quarter of 2019. Ch$ million Recovery of Loans Written-off as Losses NPL Creation Coverage Loan Portfolio Write-Off
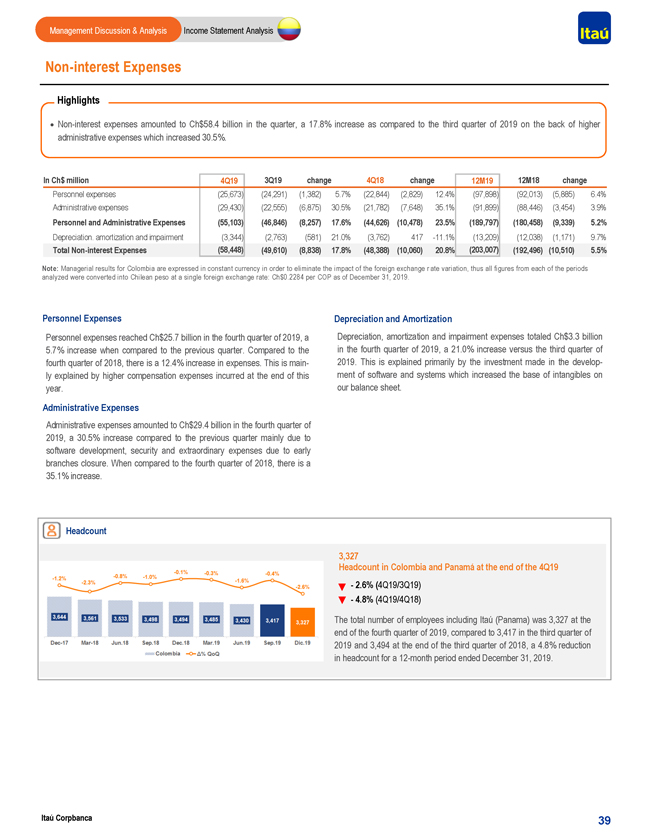
Management Discussion & Analysis Income Statement AnalysisNon-interest Expenses Highlights ·Non-interest expenses amounted to Ch$58.4 billion in the quarter, a 17.8% increase as compared to the third quarter of 2019 on the back of higher administrative expenses which increased 30.5%. In Ch$ million 4Q19 3Q19 change 4Q18 change 12M19 12M18 change Personnel expenses (25,673) (24,291) (1,382) 5.7% (22,844) (2,829) 12.4% (97,898) (92,013) (5,885) 6.4% Administrative expenses (29,430) (22,555) (6,875) 30.5% (21,782) (7,648) 35.1% (91,899) (88,446) (3,454) 3.9% Personnel and Administrative Expenses (55,103) (46,846) (8,257) 17.6% (44,626) (10,478) 23.5% (189,797) (180,458) (9,339) 5.2% Depreciation. amortization and impairment (3,344) (2,763) (581) 21.0% (3,762) 417-11.1% (13,209) (12,038) (1,171) 9.7% TotalNon-interest Expenses (58,448) (49,610) (8,838) 17.8% (48,388) (10,060) 20.8% (203,007) (192,496) (10,510) 5.5% Note: Managerial results for Colombia are expressed in constant currency in order to eliminate the impact of the foreign exchange r ate variation, thus all figures from each of the periods analyzed were converted into Chilean peso at a single foreign exchange rate: Ch$0.2284 per COP as of December 31, 2019. Personnel Expenses Depreciation and Amortization Personnel expenses reached Ch$25.7 billion in the fourth quarter of 2019, a Depreciation, amortization and impairment expenses totaled Ch$3.3 billion 5.7% increase when compared to the previous quarter. Compared to the in the fourth quarter of 2019, a 21.0% increase versus the third quarter of fourth quarter of 2018, there is a 12.4% increase in expenses. This is main- 2019. This is explained primarily by the investment made in thedevelop-ly explained by higher compensation expenses incurred at the end of this ment of software and systems which increased the base of intangibles on year. our balance sheet. Administrative Expenses Administrative expenses amounted to Ch$29.4 billion in the fourth quarter of 2019, a 30.5% increase compared to the previous quarter mainly due to software development, security and extraordinary expenses due to early branches closure. When compared to the fourth quarter of 2018, there is a 35.1% increase. Headcount 3,327 Headcount in Colombia and Panamá at the end of the 4Q19 —2.6% (4Q19/3Q19) —4.8% (4Q19/4Q18) The total number of employees including Itaú (Panama) was 3,327 at the end of the fourth quarter of 2019, compared to 3,417 in the third quarter of 2019 and 3,494 at the end of the third quarter of 2018, a 4.8% reduction in headcount for a12-month period ended December 31, 2019. Itaú Corpbanca 39
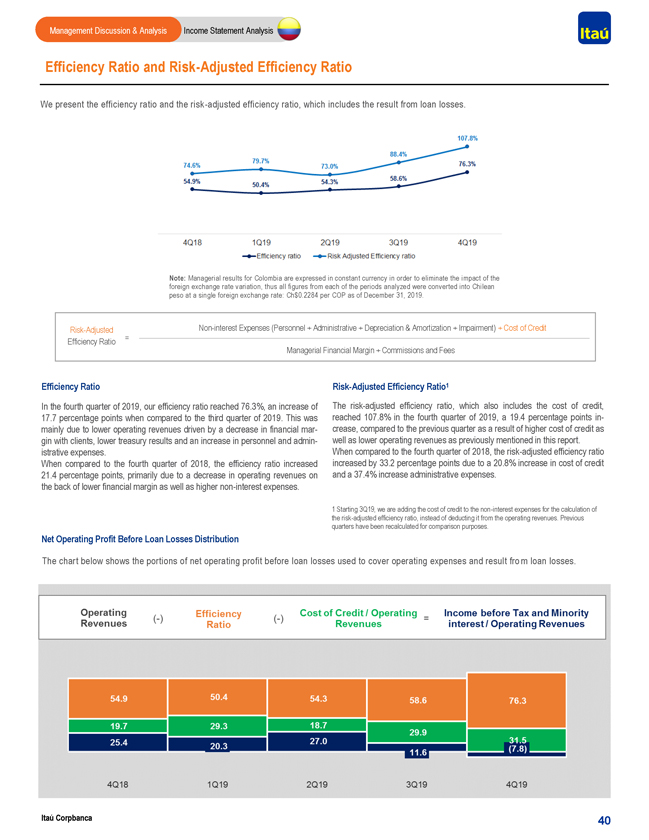
Management Discussion & Analysis Income Statement Analysis Efficiency Ratio and Risk-Adjusted Efficiency Ratio We present the efficiency ratio and the risk-adjusted efficiency ratio, which includes the result from loan losses. Note: Managerial results for Colombia are expressed in constant currency in order to eliminate the impact of the foreign exchange rate variation, thus all figures from each of the periods analyzed were converted into Chilean peso at a single foreign exchange rate: Ch$0.2284 per COP as of December 31, 2019. Risk-AdjustedNon-interest Expenses (Personnel + Administrative + Depreciation & Amortization + Impairment) + Cost of Credit Efficiency Ratio = Managerial Financial Margin + Commissions and Fees Efficiency Ratio Risk-Adjusted Efficiency Ratio1 In the fourth quarter of 2019, our efficiency ratio reached 76.3%, an increase of The risk-adjusted efficiency ratio, which also includes the cost of credit, 17.7 percentage points when compared to the third quarter of 2019. This was reached 107.8% in the fourth quarter of 2019, a 19.4 percentage pointsin-mainly due to lower operating revenues driven by a decrease in financialmar- crease, compared to the previous quarter as a result of higher cost of credit as gin with clients, lower treasury results and an increase in personnel and admin- well as lower operating revenues as previously mentioned in this report. istrative expenses. When compared to the fourth quarter of 2018, the risk-adjusted efficiency ratio When compared to the fourth quarter of 2018, the efficiency ratio increased increased by 33.2 percentage points due to a 20.8% increase in cost of credit 21.4 percentage points, primarily due to a decrease in operating revenues on and a 37.4% increase administrative expenses. the back of lower financial margin as well as highernon-interest expenses. 1 Starting 3Q19, we are adding the cost of credit to thenon-interest expenses for the calculation of the risk-adjusted efficiency ratio, instead of deducting it from the operating revenues. Previous quarters have been recalculated for comparison purposes. Net Operating Profit Before Loan Losses Distribution The chart below shows the portions of net operating profit before loan losses used to cover operating expenses and result fro m loan losses. Itaú Corpbanca 40
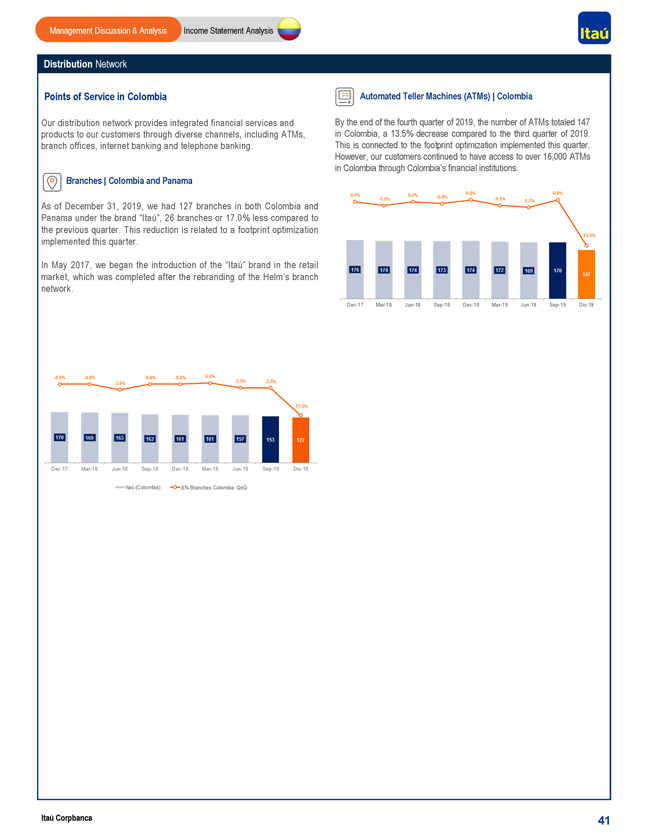
Management Discussion & Analysis Income Statement Analysis Distribution Network Points of Service in Colombia Automated Teller Machines (ATMs) | Colombia Our distribution network provides integrated financial services and By the end of the fourth quarter of 2019, the number of ATMs totaled 147 products to our customers through diverse channels, including ATMs, in Colombia, a 13.5% decrease compared to the third quarter of 2019. branch offices, internet banking and telephone banking . This is connected to the footprint optimization implemented this quarter. However, our customers continued to have access to over 16,000 ATMs in Colombia through Colombia’s financial institutions. Branches | Colombia and Panama As of December 31, 2019, we had 127 branches in both Colombia and Panama under the brand “Itaú”, 26 branches or 17.0% less compared to the previous quarter. This reduction is related to a footprint optimization implemented this quarter. In May 2017, we began the introduction of the “Itaú” brand in the retail market, which was completed after the rebranding of the Helm’s branch network. Itaú Corpbanca 41
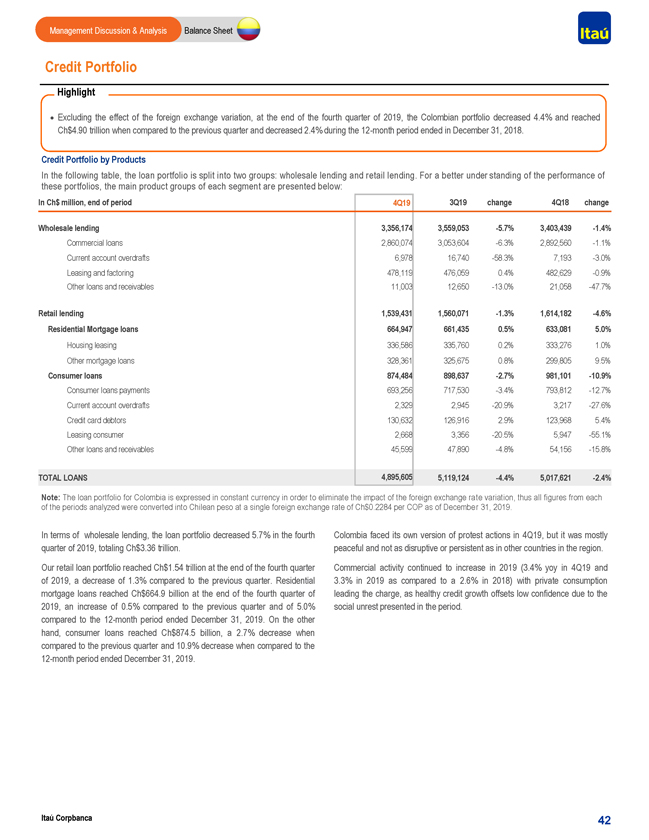
Management Discussion & Analysis Balance Sheet Credit Portfolio Highlight · Excluding the effect of the foreign exchange variation, at the end of the fourth quarter of 2019, the Colombian portfolio decreased 4.4% and reached Ch$4.90 trillion when compared to the previous quarter and decreased 2.4% during the12-month period ended in December 31, 2018. Credit Portfolio by Products In the following table, the loan portfolio is split into two groups: wholesale lending and retail lending. For a better under standing of the performance of these portfolios, the main product groups of each segment are presented below: In Ch$ million, end of period 4Q19 3Q19 change 4Q18 change Wholesale lending 3,356,174 3,559,053-5.7% 3,403,439-1.4% Commercial loans 2,860,074 3,053,604-6.3% 2,892,560-1.1% Current account overdrafts 6,978 16,740-58.3% 7,193-3.0% Leasing and factoring 478,119 476,059 0.4% 482,629-0.9% Other loans and receivables 11,003 12,650-13.0% 21,058-47.7% Retail lending 1,539,431 1,560,071-1.3% 1,614,182-4.6% Residential Mortgage loans 664,947 661,435 0.5% 633,081 5.0% Housing leasing 336,586 335,760 0.2% 333,276 1.0% Other mortgage loans 328,361 325,675 0.8% 299,805 9.5% Consumer loans 874,484 898,637-2.7% 981,101-10.9% Consumer loans payments 693,256 717,530-3.4% 793,812-12.7% Current account overdrafts 2,329 2,945-20.9% 3,217-27.6% Credit card debtors 130,632 126,916 2.9% 123,968 5.4% Leasing consumer 2,668 3,356-20.5% 5,947-55.1% Other loans and receivables 45,599 47,890-4.8% 54,156-15.8% TOTAL LOANS 4,895,605 5,119,124-4.4% 5,017,621-2.4% Note: The loan portfolio for Colombia is expressed in constant currency in order to eliminate the impact of the foreign exchange ra te variation, thus all figures from each of the periods analyzed were converted into Chilean peso at a single foreign exchange rate of Ch$0.2284 per COP as of Decembe r 31, 2019. In terms of wholesale lending, the loan portfolio decreased 5.7% in the fourth Colombia faced its own version of protest actions in 4Q19, but it was mostly quarter of 2019, totaling Ch$3.36 trillion. peaceful and not as disruptive or persistent as in other countries in the region. Our retail loan portfolio reached Ch$1.54 trillion at the end of the fourth quarter Commercial activity continued to increase in 2019 (3.4% yoy in 4Q19 and of 2019, a decrease of 1.3% compared to the previous quarter. Residential 3.3% in 2019 as compared to a 2.6% in 2018) with private consumption mortgage loans reached Ch$664.9 billion at the end of the fourth quarter of leading the charge, as healthy credit growth offsets low confidence due to the 2019, an increase of 0.5% compared to the previous quarter and of 5.0% social unrest presented in the period. compared to the12-month period ended December 31, 2019. On the other hand, consumer loans reached Ch$874.5 billion, a 2.7% decrease when compared to the previous quarter and 10.9% decrease when compared to the12-month period ended December 31, 2019. Itaú Corpbanca 42
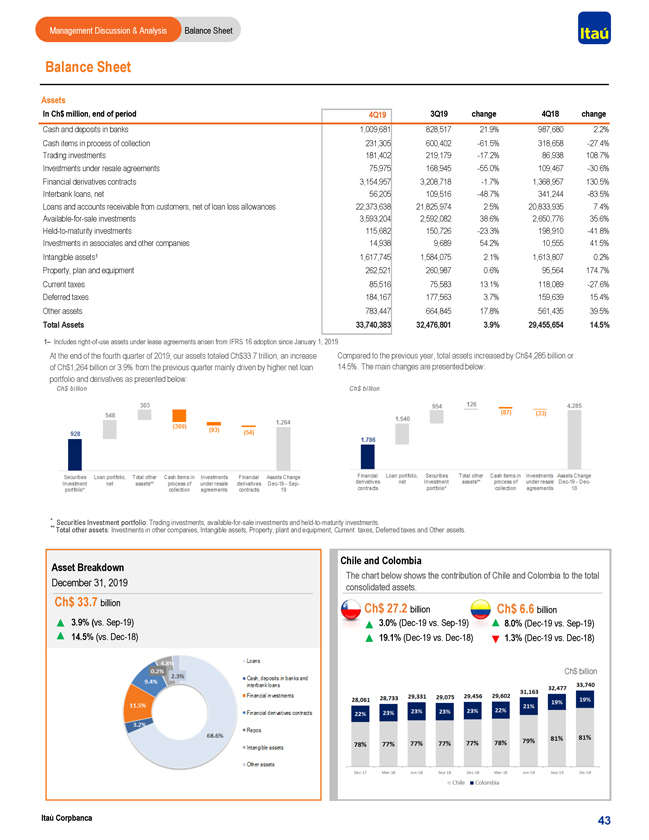
Management Discussion & Analysis Balance Sheet Balance Sheet Assets In Ch$ million, end of period 4Q19 3Q19 change 4Q18 change Cash and deposits in banks 1,009,681 828,517 21.9% 987,680 2.2% Cash items in process of collection 231,305 600,402-61.5% 318,658-27.4% Trading investments 181,402 219,179-17.2% 86,938 108.7% Investments under resale agreements 75,975 168,945-55.0% 109,467-30.6% Financial derivatives contracts 3,154,957 3,208,718-1.7% 1,368,957 130.5% Interbank loans, net 56,205 109,516-48.7% 341,244-83.5% Loans and accounts receivable from customers, net of loan loss allowances 22,373,638 21,825,974 2.5% 20,833,935 7.4%Available-for-sale investments 3,593,204 2,592,082 38.6% 2,650,776 35.6%Held-to-maturity investments 115,682 150,726-23.3% 198,910-41.8% Investments in associates and other companies 14,938 9,689 54.2% 10,555 41.5% Intangible assets1 1,617,745 1,584,075 2.1% 1,613,807 0.2% Property, plan and equipment 262,521 260,987 0.6% 95,564 174.7% Current taxes 85,516 75,583 13.1% 118,089-27.6% Deferred taxes 184,167 177,563 3.7% 159,639 15.4% Other assets 783,447 664,845 17.8% 561,435 39.5% Total Assets 33,740,383 32,476,801 3.9% 29,455,654 14.5% 1– Includesright-of-use assets under lease agreements arisen from IFRS 16 adoption since January 1, 2019. At the end of the fourth quarter of 2019, our assets totaled Ch$33.7 trillion, an increase Compared to the previous year, total assets increased by Ch$4,285 billion or of Ch$1,264 billion or 3.9% from the previous quarter mainly driven by higher net loan 14.5%. The main changes are presented below: portfolio and derivatives as presented below: Ch$ billion Ch$ billion * Securities Investment portfolio: Trading investments,available-for-sale investments andheld-to-maturity investments. ** Total other assets: Investments in other companies, Intangible assets, Property, plant and equipment, Current taxes, Deferred taxes and Other assets. Chile and Colombia Asset Breakdown December 31, 2019 The chart below shows the contribution of Chile and Colombia to the total consolidated assets. Ch$ 33.7 billion Ch$ 27.2 billion Ch$ 6.6 billion 3.9% (vs.Sep-19) 3.0%(Dec-19 vs.Sep-19) 8.0%(Dec-19 vs.Sep-19) 14.5% (vs.Dec-18) 19.1%(Dec-19 vs.Dec-18) 1.3%(Dec-19 vs.Dec-18) Ch$ billion Itaú Corpbanca 43
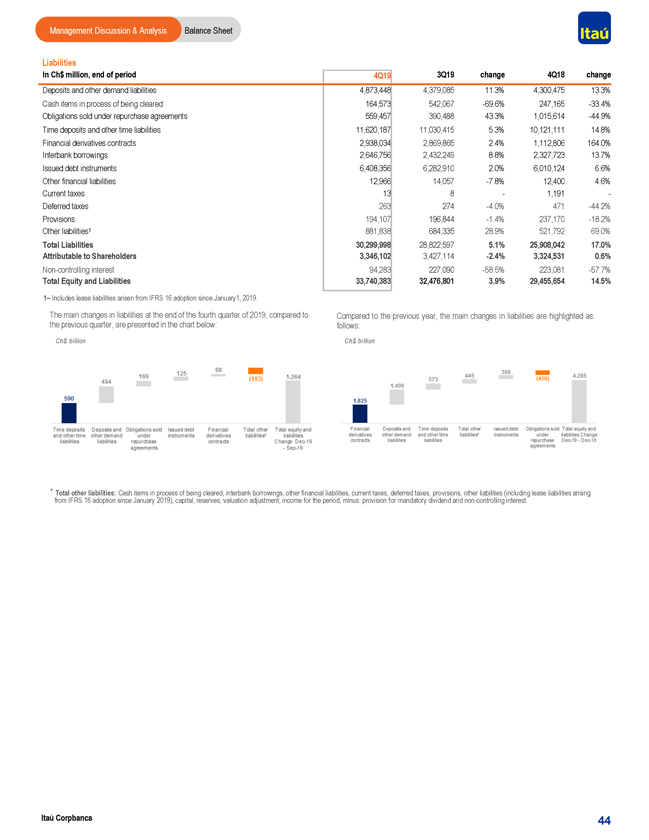
Management Discussion & Analysis Balance Sheet Liabilities In Ch$ million, end of period 4Q19 3Q19 change 4Q18 change Deposits and other demand liabilities 4,873,448 4,379,085 11.3% 4,300,475 13.3% Cash items in process of being cleared 164,573 542,067-69.6% 247,165-33.4% Obligations sold under repurchase agreements 559,457 390,488 43.3% 1,015,614-44.9% Time deposits and other time liabilities 11,620,187 11,030,415 5.3% 10,121,111 14.8% Financial derivatives contracts 2,938,034 2,869,865 2.4% 1,112,806 164.0% Interbank borrowings 2,646,756 2,432,249 8.8% 2,327,723 13.7% Issued debt instruments 6,408,356 6,282,910 2.0% 6,010,124 6.6% Other financial liabilities 12,966 14,057-7.8% 12,400 4.6% Current taxes 13 8—1,191—Deferred taxes 263 274-4.0% 471-44.2% Provisions 194,107 196,844-1.4% 237,170-18.2% Other liabilities1 881,838 684,335 28.9% 521,792 69.0% Total Liabilities 30,299,998 28,822,597 5.1% 25,908,042 17.0% Attributable to Shareholders 3,346,102 3,427,114-2.4% 3,324,531 0.6%Non-controlling interest 94,283 227,090-58.5% 223,081-57.7% Total Equity and Liabilities 33,740,383 32,476,801 3.9% 29,455,654 14.5% 1– Includes lease liabilities arisen from IFRS 16 adoption since January1, 2019. The main changes in liabilities at the end of the fourth quarter of 2019, compared to Compared to the previous year, the main changes in liabilities are highlighted as: the previous quarter, are presented in the chart below: follows: Ch$ billion Ch$ billion * Total other liabilities: Cash items in process of being cleared, interbank borrowings, other financial liabilities, current taxes, deferred taxes, provisions, other liabilities (including lease liabilities arising from IFRS 16 adoption since January 2019), capital, reserves, valuation adjustment, income for the period, minus: provision for mandatory dividend andnon-controlling interest. Itaú Corpbanca 44
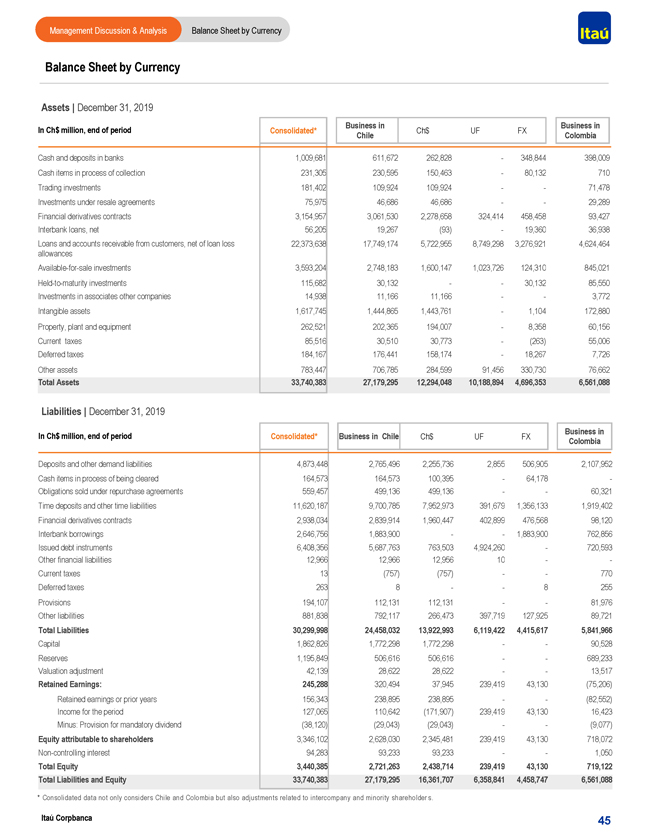
Management Discussion & Analysis Balance Sheet by Currency Balance Sheet by Currency Assets | December 31, 2019 Business in Business in In Ch$ million, end of period Consolidated* Ch$ UF FX Chile Colombia Cash and deposits in banks 1,009,681 611,672 262,828—348,844 398,009 Cash items in process of collection 231,305 230,595 150,463—80,132 710 Trading investments 181,402 109,924 109,924 — 71,478 Investments under resale agreements 75,975 46,686 46,686 — 29,289 Financial derivatives contracts 3,154,957 3,061,530 2,278,658 324,414 458,458 93,427 Interbank loans, net 56,205 19,267 (93)—19,360 36,938 Loans and accounts receivable from customers, net of loan loss 22,373,638 17,749,174 5,722,955 8,749,298 3,276,921 4,624,464 allowancesAvailable-for-sale investments 3,593,204 2,748,183 1,600,147 1,023,726 124,310 845,021Held-to-maturity investments 115,682 30,132 — 30,132 85,550 Investments in associates other companies 14,938 11,166 11,166 — 3,772 Intangible assets 1,617,745 1,444,865 1,443,761—1,104 172,880 Property, plant and equipment 262,521 202,365 194,007—8,358 60,156 Current taxes 85,516 30,510 30,773—(263) 55,006 Deferred taxes 184,167 176,441 158,174—18,267 7,726 Other assets 783,447 706,785 284,599 91,456 330,730 76,662 Total Assets 33,740,383 27,179,295 12,294,048 10,188,894 4,696,353 6,561,088 Liabilities | December 31, 2019 Business in In Ch$ million, end of period Consolidated* Business in Chile Ch$ UF FX Colombia Deposits and other demand liabilities 4,873,448 2,765,496 2,255,736 2,855 506,905 2,107,952 Cash items in process of being cleared 164,573 164,573 100,395—64,178 —Obligations sold under repurchase agreements 559,457 499,136 499,136 — 60,321 Time deposits and other time liabilities 11,620,187 9,700,785 7,952,973 391,679 1,356,133 1,919,402 Financial derivatives contracts 2,938,034 2,839,914 1,960,447 402,899 476,568 98,120 Interbank borrowings 2,646,756 1,883,900 — 1,883,900 762,856 Issued debt instruments 6,408,356 5,687,763 763,503 4,924,260— 720,593 Other financial liabilities 12,966 12,966 12,956 10——Current taxes 13 (757) (757) — 770 Deferred taxes 263 8 — 8 255 Provisions 194,107 112,131 112,131 — 81,976 Other liabilities 881,838 792,117 266,473 397,719 127,925 89,721 Total Liabilities 30,299,998 24,458,032 13,922,993 6,119,422 4,415,617 5,841,966 Capital 1,862,826 1,772,298 1,772,298 — 90,528 Reserves 1,195,849 506,616 506,616 — 689,233 Valuation adjustment 42,139 28,622 28,622 — 13,517 Retained Earnings: 245,288 320,494 37,945 239,419 43,130 (75,206) Retained earnings or prior years 156,343 238,895 238,895 — (82,552) Income for the period 127,065 110,642 (171,907) 239,419 43,130 16,423 Minus: Provision for mandatory dividend (38,120) (29,043) (29,043) — (9,077) Equity attributable to shareholders 3,346,102 2,628,030 2,345,481 239,419 43,130 718,072Non-controlling interest 94,283 93,233 93,233 — 1,050 Total Equity 3,440,385 2,721,263 2,438,714 239,419 43,130 719,122 Total Liabilities and Equity 33,740,383 27,179,295 16,361,707 6,358,841 4,458,747 6,561,088 * Consolidated data not only considers Chile and Colombia but also adjustments related to intercompany and minority shareholder s. Itaú Corpbanca 45
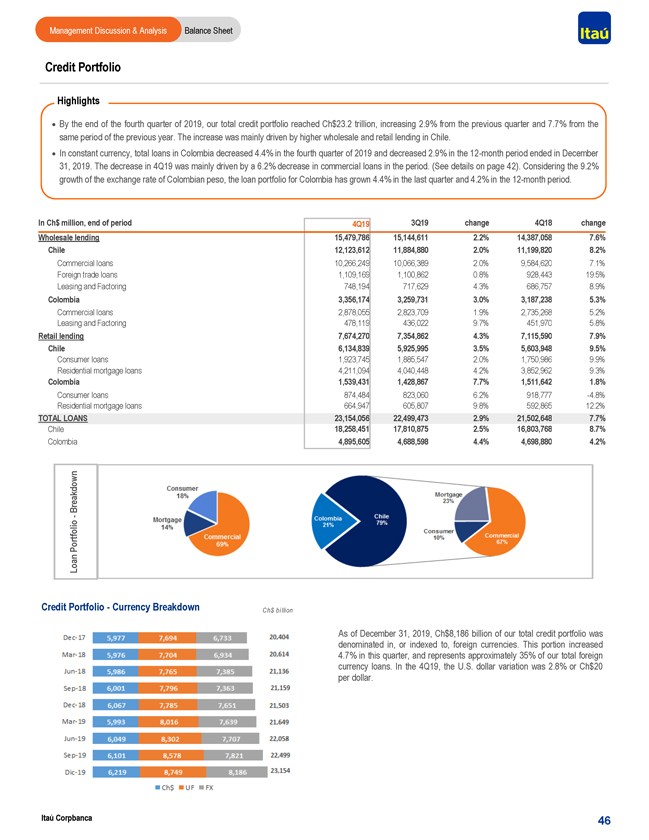
Management Discussion & Analysis Balance Sheet Credit Portfolio Highlights · By the end of the fourth quarter of 2019, our total credit portfolio reached Ch$23.2 trillion, increasing 2.9% from the previous quarter and 7.7% from the same period of the previous year. The increase was mainly driven by higher wholesale and retail lending in Chile. · In constant currency, total loans in Colombia decreased 4.4% in the fourth quarter of 2019 and decreased 2.9% in the12-month period ended in December 31, 2019. The decrease in 4Q19 was mainly driven by a 6.2% decrease in commercial loans in the period. (See details on page 42). Considering the 9.2% growth of the exchange rate of Colombian peso, the loan portfolio for Colombia has grown 4.4% in the last quarter and 4.2% in the12-month period. In Ch$ million, end of period 4Q19 3Q19 change 4Q18 change Wholesale lending 15,479,786 15,144,611 2.2% 14,387,058 7.6% Chile 12,123,612 11,884,880 2.0% 11,199,820 8.2% Commercial loans 10,266,249 10,066,389 2.0% 9,584,620 7.1% Foreign trade loans 1,109,169 1,100,862 0.8% 928,443 19.5% Leasing and Factoring 748,194 717,629 4.3% 686,757 8.9% Colombia 3,356,174 3,259,731 3.0% 3,187,238 5.3% Commercial loans 2,878,055 2,823,709 1.9% 2,735,268 5.2% Leasing and Factoring 478,119 436,022 9.7% 451,970 5.8% Retail lending 7,674,270 7,354,862 4.3% 7,115,590 7.9% Chile 6,134,839 5,925,995 3.5% 5,603,948 9.5% Consumer loans 1,923,745 1,885,547 2.0% 1,750,986 9.9% Residential mortgage loans 4,211,094 4,040,448 4.2% 3,852,962 9.3% Colombia 1,539,431 1,428,867 7.7% 1,511,642 1.8% Consumer loans 874,484 823,060 6.2% 918,777-4.8% Residential mortgage loans 664,947 605,807 9.8% 592,865 12.2% TOTAL LOANS 23,154,056 22,499,473 2.9% 21,502,648 7.7% Chile 18,258,451 17,810,875 2.5% 16,803,768 8.7% Colombia 4,895,605 4,688,598 4.4% 4,698,880 4.2% Breakdown — Portfolio Loan Credit Portfolio—Currency Breakdown Ch$ billion As of December 31, 2019, Ch$8,186 billion of our total credit portfolio was denominated in, or indexed to, foreign currencies. This portion increased 4.7% in this quarter, and represents approximately 35% of our total foreign currency loans. In the 4Q19, the U.S. dollar variation was 2.8% or Ch$20 per dollar. Itaú Corpbanca 46
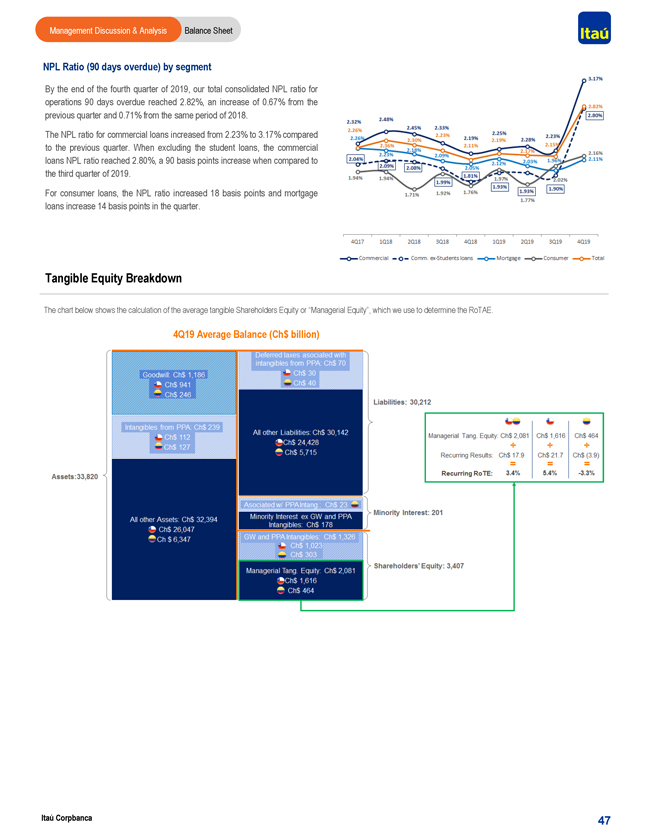
Management Discussion & Analysis Balance Sheet NPL Ratio (90 days overdue) by segment By the end of the fourth quarter of 2019, our total consolidated NPL ratio for operations 90 days overdue reached 2.82%, an increase of 0.67% from the previous quarter and 0.71% from the same period of 2018. The NPL ratio for commercial loans increased from 2.23% to 3.17% compared to the previous quarter. When excluding the student loans, the commercial loans NPL ratio reached 2.80%, a 90 basis points increase when compared to the third quarter of 2019. For consumer loans, the NPL ratio increased 18 basis points and mortgage loans increase 14 basis points in the quarter. Tangible Equity Breakdown The chart below shows the calculation of the average tangible Shareholders Equity or “Managerial Equity”, which we use to determine the RoTAE. 4Q19 Average Balance (Ch$ billion) Itaú Corpbanca 47
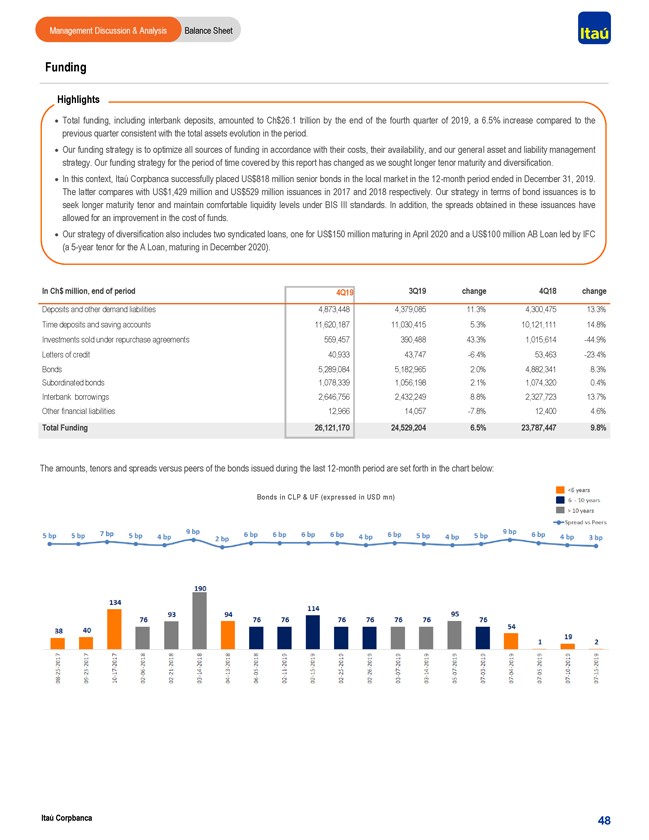
Management Discussion & Analysis Balance Sheet Funding Highlights · Total funding, including interbank deposits, amounted to Ch$26.1 trillion by the end of the fourth quarter of 2019, a 6.5% increase compared to the previous quarter consistent with the total assets evolution in the period. · Our funding strategy is to optimize all sources of funding in accordance with their costs, their availability, and our general asset and liability management strategy. Our funding strategy for the period of time covered by this report has changed as we sought longer tenor maturity and diversification. · In this context, Itaú Corpbanca successfully placed US$818 million senior bonds in the local market in the12-month period ended in December 31, 2019. The latter compares with US$1,429 million and US$529 million issuances in 2017 and 2018 respectively. Our strategy in terms of bond issuances is to seek longer maturity tenor and maintain comfortable liquidity levels under BIS III standards. In addition, the spreads obtained in these issuances have allowed for an improvement in the cost of funds. · Our strategy of diversification also includes two syndicated loans, one for US$150 million maturing in April 2020 and a US$100 million AB Loan led by IFC (a5-year tenor for the A Loan, maturing in December 2020). In Ch$ million, end of period 4Q19 3Q19 change 4Q18 change Deposits and other demand liabilities 4,873,448 4,379,085 11.3% 4,300,475 13.3% Time deposits and saving accounts 11,620,187 11,030,415 5.3% 10,121,111 14.8% Investments sold under repurchase agreements 559,457 390,488 43.3% 1,015,614-44.9% Letters of credit 40,933 43,747-6.4% 53,463-23.4% Bonds 5,289,084 5,182,965 2.0% 4,882,341 8.3% Subordinated bonds 1,078,339 1,056,198 2.1% 1,074,320 0.4% Interbank borrowings 2,646,756 2,432,249 8.8% 2,327,723 13.7% Other financial liabilities 12,966 14,057-7.8% 12,400 4.6% Total Funding 26,121,170 24,529,204 6.5% 23,787,447 9.8% The amounts, tenors and spreads versus peers of the bonds issued during the last12-month period are set forth in the chart below: Bonds in CLP & UF (expressed in USD mn) Itaú Corpbanca 48
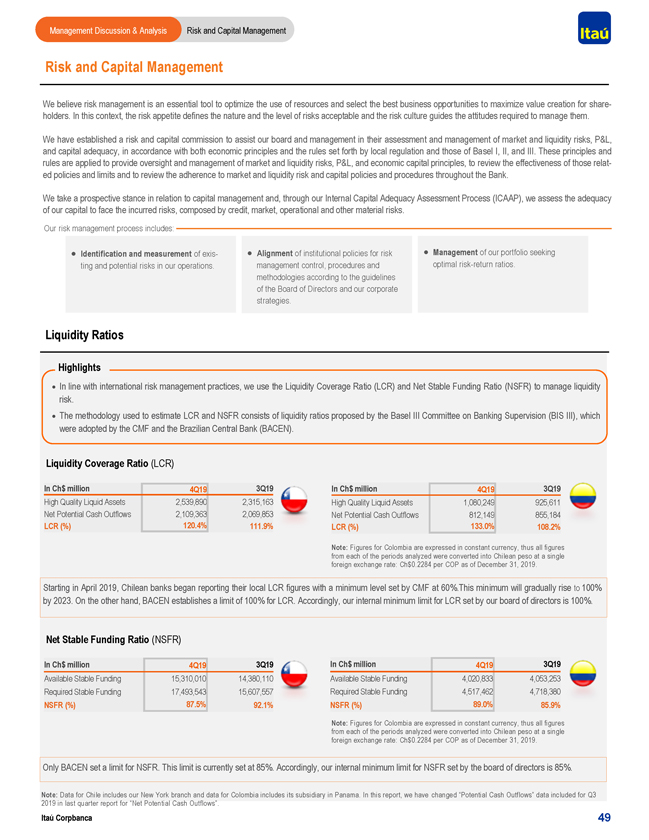
Management Discussion & Analysis Risk and Capital Management Risk and Capital Management We believe risk management is an essential tool to optimize the use of resources and select the best business opportunities to maximize value creation for shareholders. In this context, the risk appetite defines the nature and the level of risks acceptable and the risk culture guides the attitudes required to manage them. We have established a risk and capital commission to assist our board and management in their assessment and management of market and liquidity risks, P&L, and capital adequacy, in accordance with both economic principles and the rules set forth by local regulation and those of Basel I, II, and III. These principles and rules are applied to provide oversight and management of market and liquidity risks, P&L, and economic capital principles, to review the effectiveness of those related policies and limits and to review the adherence to market and liquidity risk and capital policies and procedures throughout the Bank. We take a prospective stance in relation to capital management and, through our Internal Capital Adequacy Assessment Process (ICAAP), we assess the adequacy of our capital to face the incurred risks, composed by credit, market, operational and other material risks. Our risk management process includes: · Identification and measurement of exis-· Alignment of institutional policies for risk · Management of our portfolio seeking ting and potential risks in our operations. management control, procedures and optimal risk-return ratios. methodologies according to the guidelines of the Board of Directors and our corporate strategies. Liquidity Ratios Highlights · In line with international risk management practices, we use the Liquidity Coverage Ratio (LCR) and Net Stable Funding Ratio (NSFR) to manage liquidity risk. · The methodology used to estimate LCR and NSFR consists of liquidity ratios proposed by the Basel III Committee on Banking Supervision (BIS III), which were adopted by the CMF and the Brazilian Central Bank (BACEN). Liquidity Coverage Ratio (LCR) In Ch$ million 4Q19 3Q19 In Ch$ million 4Q19 3Q19 High Quality Liquid Assets 2,539,890 2,315,163 High Quality Liquid Assets 1,080,249 925,611 Net Potential Cash Outflows 2,109,363 2,069,853 Net Potential Cash Outflows 812,149 855,184 LCR (%) 120.4% 111.9% LCR (%) 133.0% 108.2% Note: Figures for Colombia are expressed in constant currency, thus all figures from each of the periods analyzed were converted into Chilean peso at a single foreign exchange rate: Ch$0.2284 per COP as of December 31, 2019. Starting in April 2019, Chilean banks began reporting their local LCR figures with a minimum level set by CMF at 60%.This minimum will gradually rise to 100% by 2023. On the other hand, BACEN establishes a limit of 100% for LCR. Accordingly, our internal minimum limit for LCR set by our board of directors is 100%. Net Stable Funding Ratio (NSFR) In Ch$ million 4Q19 3Q1 In Ch$ million 4Q19 3Q1 Available Stable Funding 15,310,010 14,380,11 Available Stable Funding 4,020,833 4,053,25 Required Stable Funding 17,493,543 15,607,55 Required Stable Funding 4,517,462 4,718,38 NSFR (%) 87.5% 92.1 NSFR (%) 89.0% 85.9% Note: Figures for Colombia are expressed in constant currency, thus all figures from each of the periods analyzed were converted into Chilean peso at a single foreign exchange rate: Ch$0.2284 per COP as of December 31, 2019. Only BACEN set a limit for NSFR. This limit is currently set at 85%. Accordingly, our internal minimum limit for NSFR set by the board of directors is 85%. Note: Data for Chile includes our New York branch and data for Colombia includes its subsidiary in Panama. In this report, we have changed “Potential Cash Outflows” data included for Q3 2019 in last quarter report for “Net Potential Cash Outflows”. Itaú Corpbanca 49
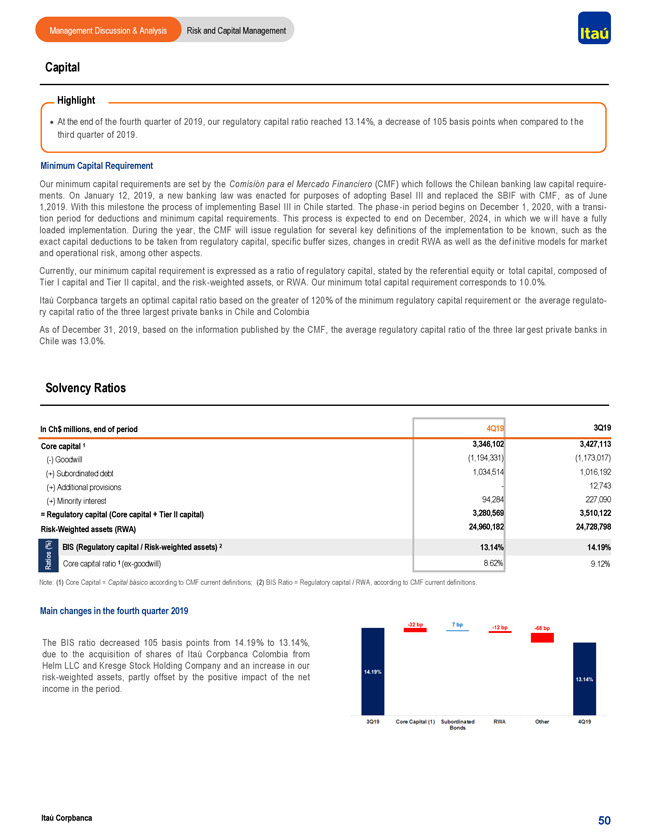
Management Discussion & Analysis Risk and Capital Management Capital Highlight · At the end of the fourth quarter of 2019, our regulatory capital ratio reached 13.14%, a decrease of 105 basis points when compared to t he third quarter of 2019. Minimum Capital Requirement Our minimum capital requirements are set by the Comisión para el Mercado Financiero (CMF) which follows the Chilean banking law capital requirements. On January 12, 2019, a new banking law was enacted for purposes of adopting Basel III and replaced the SBIF with CMF, as of June 1,2019. With this milestone the process of implementing Basel III in Chile started. The phase-in period begins on December 1, 2020, with a transition period for deductions and minimum capital requirements. This process is expected to end on December, 2024, in which we w ill have a fully loaded implementation. During the year, the CMF will issue regulation for several key definitions of the implementation to be known, such as the exact capital deductions to be taken from regulatory capital, specific buffer sizes, changes in credit RWA as well as the def initive models for market and operational risk, among other aspects. Currently, our minimum capital requirement is expressed as a ratio of regulatory capital, stated by the referential equity or total capital, composed of Tier I capital and Tier II capital, and the risk-weighted assets, or RWA. Our minimum total capital requirement corresponds to 1 0.0%. Itaú Corpbanca targets an optimal capital ratio based on the greater of 120% of the minimum regulatory capital requirement or the average regulatory capital ratio of the three largest private banks in Chile and Colombia As of December 31, 2019, based on the information published by the CMF, the average regulatory capital ratio of the three lar gest private banks in Chile was 13.0%. Solvency Ratios In Ch$ millions, end of period 4Q19 3Q19 3,346,102 3,427,113 Core capital 1 (-) Goodwill (1,194,331) (1,173,017) (+) Subordinated debt 1,034,514 1,016,192 (+) Additional provisions—12,743 (+) Minority interest 94,284 227,090 = Regulatory capital (Core capital + Tier II capital) 3,280,569 3,510,122 Risk-Weighted assets (RWA) 24,960,182 24,728,798 (%) BIS (Regulatory capital / Risk-weighted assets) 2 13.14% 14.19% Ratios Core capital ratio 1(ex-goodwill) 8.62% 9.12% Note: (1) Core Capital = Capital básico according to CMF current definitions; (2) BIS Ratio = Regulatory capital / RWA, according to CMF current definitions . Main changes in the fourth quarter 2019 The BIS ratio decreased 105 basis points from 14.19% to 13.14%, due to the acquisition of shares of Itaú Corpbanca Colombia from Helm LLC and Kresge Stock Holding Company and an increase in our risk-weighted assets, partly offset by the positive impact of the net income in the period. Itaú Corpbanca 50
Additional
Information
Management Discussion & Analysis

(This page was intentionally left blank)
Itaú Corpbanca
52
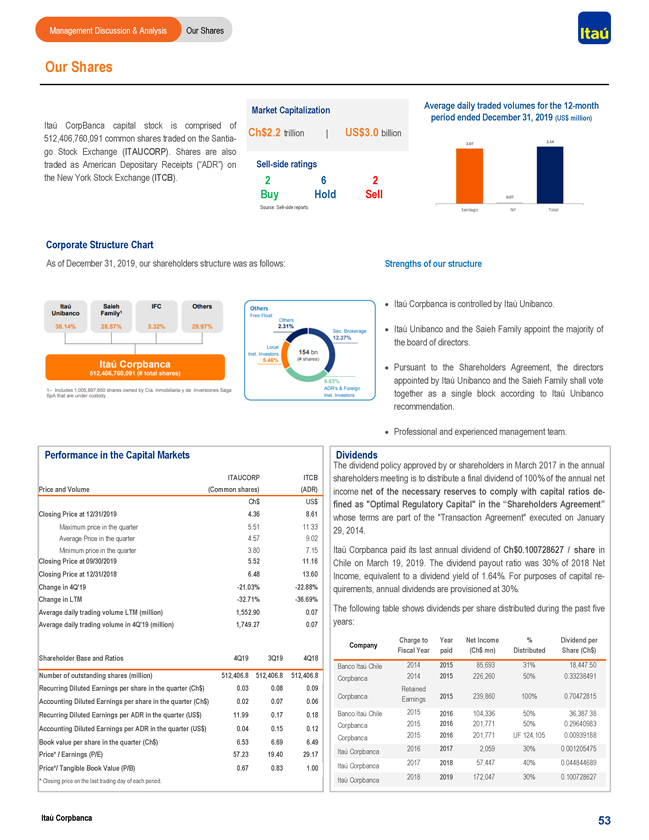
Management Discussion & Analysis Our Shares Our Shares Average daily traded volumes for the12-month Market Capitalization (US$ period ended December 31, 2019 million) Itaú CorpBanca capital stock is comprised of Ch$2.2 trillion | US$3.0 billion 512,406,760,091 common shares traded on theSantia-go Stock Exchange (ITAUCORP). Shares are also traded as American Depositary Receipts (“ADR”) on Sell-side ratings the New York Stock Exchange (ITCB). 2 6 2 Buy Hold Sell Source: Sell-side reports. Corporate Structure Chart As of December 31, 2019, our shareholders structure was as follows: Strengths of our structure · Itaú Corpbanca is controlled by Itaú Unibanco. · Itaú Unibanco and the Saieh Family appoint the majority of the board of directors. · Pursuant to the Shareholders Agreement, the directors appointed by Itaú Unibanco and the Saieh Family shall vote together as a single block according to Itaú Unibanco recommendation. · Professional and experienced management team. Performance in the Capital Markets Dividends The dividend policy approved by or shareholders in March 2017 in the annual ITAUCORP ITCB shareholders meeting is to distribute a final dividend of 100% of the annual net Price and Volume (Common shares) (ADR) income net of the necessary reserves to comply with capital ratiosde- Ch$ US$ fined as “Optimal Regulatory Capital” in the “Shareholders Agreement” Closing Price at 12/31/2019 4.36 8.61 whose terms are part of the “Transaction Agreement” executed on January Maximum price in the quarter 5.51 11.33 29, 2014. Average Price in the quarter 4.57 9.02 Minimum price in the quarter 3.80 7.15 Itaú Corpbanca paid its last annual dividend of Ch$0.100728627 / share in Closing Price at 09/30/2019 5.52 11.16 Chile on March 19, 2019. The dividend payout ratio was 30% of 2018 Net Closing Price at 12/31/2018 6.48 13.60 Income, equivalent to a dividend yield of 1.64%. For purposes of capitalre-Change in 4Q’19-21.03%-22.88% quirements, annual dividends are provisioned at 30%. Change in LTM-32.71%-36.69% Average daily trading volume LTM (million) 1,552.90 0.07 The following table shows dividends per share distributed during the past five Average daily trading volume in 4Q’19 (million) 1,749.27 0.07 years: Charge to Year Net Income % Dividend per Company Fiscal Year paid (Ch$ mn) Distributed Share (Ch$) Shareholder Base and Ratios 4Q19 3Q19 4Q18 2014 2015 85,693 31% 18,447.50 Banco Itaú Chile Number of outstanding shares (million) 512,406.8 512,406.8 512,406.8 Corpbanca 2014 2015 226,260 50% 0.33238491 Recurring Diluted Earnings per share in the quarter (Ch$) 0.03 0.08 0.09 Retained Corpbanca Earnings 2015 239,860 100% 0.70472815 Accounting Diluted Earnings per share in the quarter (Ch$) 0.02 0.07 0.06 Recurring Diluted Earnings per ADR in the quarter (US$) 11.99 0.17 0.18 Banco Itaú Chile 2015 2016 104,336 50% 36,387.38 Corpbanca 2015 2016 201,771 50% 0.29640983 Accounting Diluted Earnings per ADR in the quarter (US$) 0.04 0.15 0.12 2015 2016 201,771 UF 124,105 0.00939188 Corpbanca Book value per share in the quarter (Ch$) 6.53 6.69 6.49 2016 2017 2,059 30% 0.001205475 Price* / Earnings (P/E) 57.23 19.40 29.17 Itaú Corpbanca Itaú Corpbanca 2017 2018 57,447 40% 0.044844689 Price*/ Tangible Book Value (P/B) 0.67 0.83 1.00 Itaú Corpbanca 2018 2019 172,047 30% 0.100728627 * Closing price on the last trading day of each period. Itaú Corpbanca 53
Management Discussion & Analysis Ratings Credit Risk Ratings International Credit Risk Rating Local Credit Risk Rating On a global scale, Itaú Corpbanca is rated by two worldwide recognized agen- The outlook is ‘Stable’ reflecting the bank’s conservative risk management. cies: Moody´s Investors Service (‘Moody’s’) and Standard & Poor´s Global On a national scale, Itaú Corpbanca is rated by Feller Rate Clasificadora de Ratings (‘Standard & Poor’s’ or ‘S&P’). Riesgo Ltda. (‘Feller Rate’) and by Clasificadora de Riesgo Humphreys Ltda. On January 22, 2020, Moody’s affirmed‘A3/Prime-2’ ratings reflecting the (‘Humphreys’). bank’s baa3 standalone baseline credit assessment (BCA), which remains On March 29, 2019, Feller Rate affirmed local ratings in ‘AA’ and outlook as constrained by low capitalization and could face downward pressure if our ‘Positive’. Itaú Corpbanca’s ratings reflect a strong business profile, a strong ongoing retail strategy implementation does not lead to higher profitability and risk profile, an adequate capital and liquidity position and a moderate genera-lower dependence on wholesale funding. Moody’s expects our profitability to tion capacity. The ‘Positive’ outlook reflects the sound trend on generation benefit from loan growth and lower funding costs. Itaú Corpbanca’s funding capacity, with growing results derived from a greater commercial activity and strategy, however, may take time to materialize. controlled provisions for loan losses. To the extent that the implementation of Itaú Corpbanca’s ‘A3’ ratings result from Moody’s assessment of support from the strategy, the completion of the merger process and higher levels ofactivi-Itaú Unibanco Holding S.A.’s (Itaú Unibanco, ‘Ba3/Stable’) and the Government ty allow the bank to consolidate profitability –and consistently achieving of Chile (‘A1/Stable’), which together result in a three notch uplift from its results in line with the average of the banking industry– with a healthy credit standalone baseline credit assessment of baa3. quality, ratings should be upgraded. Moody´s Rating Feller Rate Rating Long term Counterparty Risk Rating (CRR) A2 Long-term issuer credit rating AA Long-term foreign currency deposits A3 Senior unsecured bonds AA Long-term foreign currency debt A3 Letter of credit AA Short-term foreign currency depositsPrime-2 Long-term deposits AA Outlook Stable Subordinated bondsAA- On May 28, 2019, Standard & Poor´s affirmed our‘BBB+/A-2’ ratings. The Short-term deposits Nivel 1+ outlook is ‘Stable’ reflecting the reduction ofnon-recurring events and credit Shares 1ª Clase Nivel 1 provision expenses that reinforce our expectation of improving financial results Outlook Positive in the next 24 months. On the other hand, further industry consolidation in Chile, low inflation, and choppy economic activity are the main barriers to On May 30, 2019, Humphreys assigned a ‘AA/Nivel 1+’ rating to our long-higher profitability. S&P expects the our capital indicators to remain the major term and short term debt, respectively, and a ‘Positive’ outlook reflecting weakness given the high goodwill burden following the merger between Humphreys expectation that our strategy is positively impacting credit quality Corpbanca and Itaú Chile. and will benefit profitability levels. Our ratings continue to overhaul our business model by expanding the plat- Our ratings mainly reflect our capacity to develop a business model and an forms, products, and segmentation of Itaú Unibanco in the retail segment; organizational structure based on solid formal control to monitor credit,mar-while focusing on the core portfolio in the wholesale segment and increase ket and operational risks. The strength of the control environment lies in ournon-interest related revenue (such as cash management). Although we have internal policies, its organizational culture, regulatory requirements and in the lost some market share in the last few years as a result of readjusting itscom-know-how of its parent company, Itaú Unibanco. Likewise, ratings positively mercial portfolio, loan origination started to grow in 2018. This growth, togeth- reflects our listing in the Santiago Exchange (2002) and in the NYSE (2004). er with the stabilization of thenon-recurring effects and the decrease in provi- As anSEC-compliance company, Itaú Corpbanca benefits from high corpo-sion expenses, has generated in 2018 the strongest profit in the last three rate governance practices and, broad market disclosure. Likewise, ratings years (return to assets of around 0.9% excluding the amortization of intangi- incorporate that current controlling shareholder is a large and experienced bles). financial group within the Latin American with a leading position in theBrazili-an market. Additionally, Itaú Corpbanca maintains a solid level of regulatory capital of 14.3%, which is above the industry average. Furthermore, we have wideac- Humphreys Rating cess to funding and maintains adequate levels of liquidity. Since the merger, Long-term issuer credit rating AA our assets and liabilities management strategy has been adjusting funding Senior unsecured bonds AA costs, while seeking to extend its maturity dates, and diversifying the funding Letter of credit AA structure. Long-term deposits AA Subordinated bondsAA- Standard & Poor´s Rating Long-term issuer credit rating BBB+ Short-term deposits Nivel 1+ Shares 1ª Clase Nivel 1 Senior unsecured bonds BBB+ Outlook Positive Short-term issuer credit ratingA-2 Outlook Stable Itaú Corpbanca 54
pwc REPORT OF INDEPENDENT AUDITORS ON SUPPLEMENTARY INFORMATION Santiago, Chile, February 28, 2020 To the Shareholders and Directors of Ltaú CorpBanca and its subsidiaries Introduction In connection with ourour audit of the consolidated financial statements of Itau CorpBanca and its Subsidiaries (the “Bank’’) as of December 31, 2019 and for the year then ended, on which we issued a report without exceptions dated February 27, 2020, we performed a review of the accounting information contained in the supplementary information included in the Management Discussion and Analysis Report of Itau Corpbanca and its subsidiaries at December 31, 2019. Scope of the Review We conducted our review in accordance with the International Auditing Standard 720, “The auditor’s responsibility relating to other information in documents containing financial statements”. This standard establishes the procedures to be performed in the engagements of this nature. Those procedures are primarily comprised by: (a) inquiry of, and discussion with, management responsible for the accounting, financial and operational areas of the Bank with regard to the main criteria adopted for the preparation of the accounting information presented in the supplementary information and (b) review of the significant information and of the subsequent events which have, or could have, significant effects on the financial position and the operations of the Bank and its subsidiaries. The supplementary information included in the Management Discussion and Analysis report is presented to allow additional analysis. Notwithstanding, management is responsible for the accounting information contained in the supplementary’ information included in the Management Discussion and Analysis report and this information should not be considered an integral part of the financial statements, therefore, our conclusion on the consolidated financial statements does not cover such information. Conclusion Based on our review, we are not aware of any material modifications that should be made to the accounting information contained in this supplementary information, in order for it to be adequately presented, in all material respects, in relation to the financial statements as of December 31, 2019 and for the year then ended, taken as a whole, prepared in accordance with the accounting standards and instructions issued by the Commission for the Financial Market. Firmado digitalmente por Luis Fernando Orihuela Bertin RUT: 22.216.857· 0. El certificado correspondiente puede visualizarse en Ia versi6n electr6nica de este documento. r 1 1 pwc Chile, Av. Andres Bello 2711- piso 5, Las Condes - Santiago, Chile RUT: 81.513.400-1 I Telefono: (56 2) 2940 0000 I www.pwc.cl

(This page was intentionally left blank) Itaú Corpbanca 56
Itaú Corpbanca 57 CAUTION REGARDING FORWARD-LOOKING STATEMENTS Certain statements in this Report may be considered as forward-looking statements. Forward-looking information is often, but not always, identified by the use of words such as “anticipate”, “believe”, “expect”, “plan”, “intend”, “forecast”, “target”, “project”, “may”, “will”, “should”, “could”, “estimate”, “predict” or similar words suggesting future outcomes or language suggesting an outlook. These forward-looking statements include, but are not limited to, statements regarding expected benefits and synergies from the recent merger of Banco Itaú Chile with and into Corpbanca, the integration process of both banks, the expected timing of completion of the transaction, anticipated future financial and operating performance and results, including estimates for growth, as well as risks and benefits of changes in the laws of the countries we operate, including the Tax Reform in Chile. These statements are based on the current expectations of Itaú Corpbanca’ s management. There are risks and uncertainties that could cause actual results to differ mate-rially from the forward-looking statements included in this communication. For example, (1) problems that may arise in successfully integrating the businesses of Banco Itaú Chile and Corpbanca, which may result in the combined company not operating as effectively and efficiently as expected; (2) the combined company may be unable to achieve cost-cutting synergies or it may take longer than expected to achieve those synergies; (3) the credit ratings of the combined company or its subsidiaries may be different from what Itaú Corpbanca or its controlling shareholders expect; (4) the business of Itaú Corpbanca may suffer as a result of uncertainty surrounding the merger; (5) the industry may be subject to future regulatory or legislative actions that could adversely affect Itaú Corpbanca; and (6) Itaú Corpbanca may be adversely affected by other economic, business, and/or competitive factors. Forward-looking statements and information are based on current beliefs as well as assumptions made by and information currently available to Itaú Corpbanca’ sma-nagement. Although management considers these assumptions to be reasonable based on information currently available to it, they may prove to be incorrect. By their very nature, forward-looking statements involve inherent risks and uncertainties, both general and specific, and risks that predictions, forecasts, projections and other forward-looking statements will not be achieved. We caution readers not to place undue reliance on these statements as a number of important factors could cause the actual results to differ materially from the beliefs, plans, objectives, expectations and anticipations, estimates and intentions expressed in such forward-looking statements. More information on potential factors that could affect Itaú Corpbanca’ s financial results is included from time to time in the “Risk Factors” section of Itaú Corpbanca’ s Annual Report on Form20-F for the fiscal year ended December 31, 2018, filed with the SEC. Furthermore, any forward-looking statement contained in this Report speaks only as of the date hereof and Itaú Corpbanca does not undertake any obligation to update publicly or to revise any of the included forward-looking statements, whether as a result of new information, future events or otherwise. The forward-looking statements contained in this Report are expressly qualified by this cautionary statement. CONTACT INFORMATION: Gabriel Moura CEO. Itaú Corpbanca Santiago. Chile Phone: (562) 2686-0558 IR@corpbanca.cl Claudia Labbé Head of Investor Relations. Itaú Corpbanca Santiago. Chile Phone: (562) 2660-1751 claudia.labbe@itau.cl

Itaú Corpbanca Executive Summary