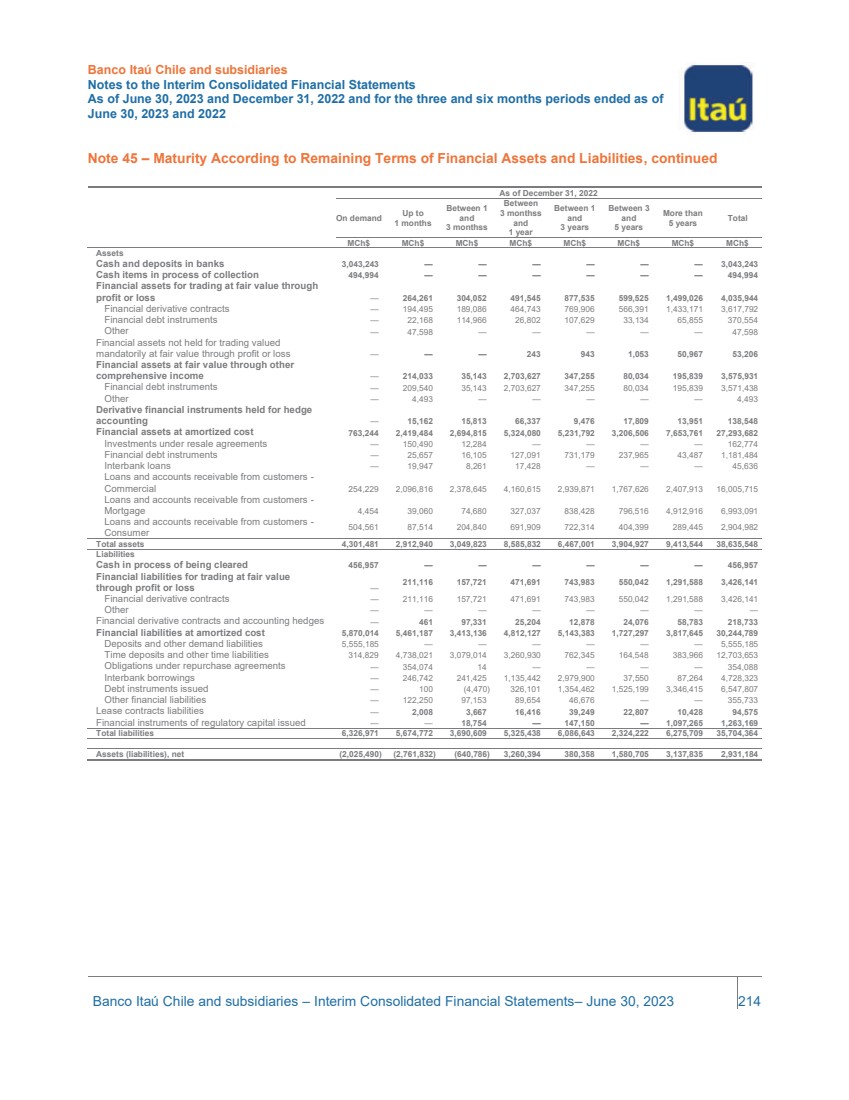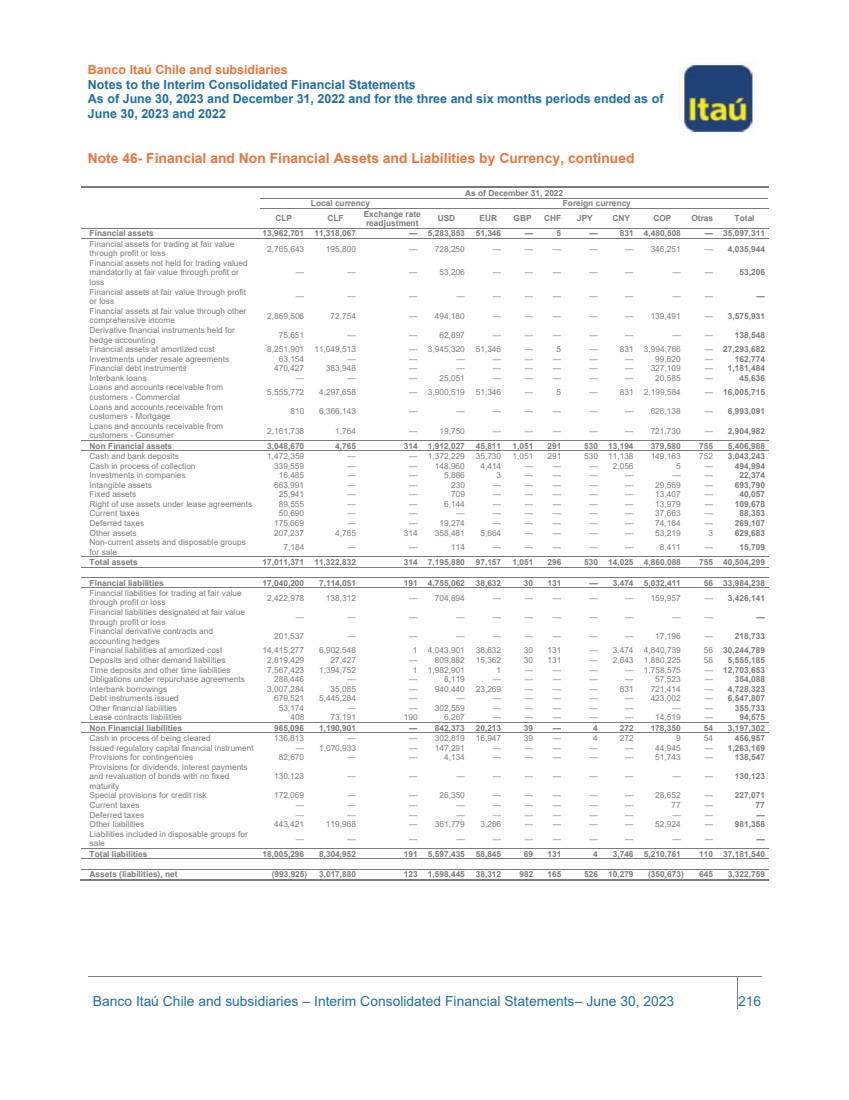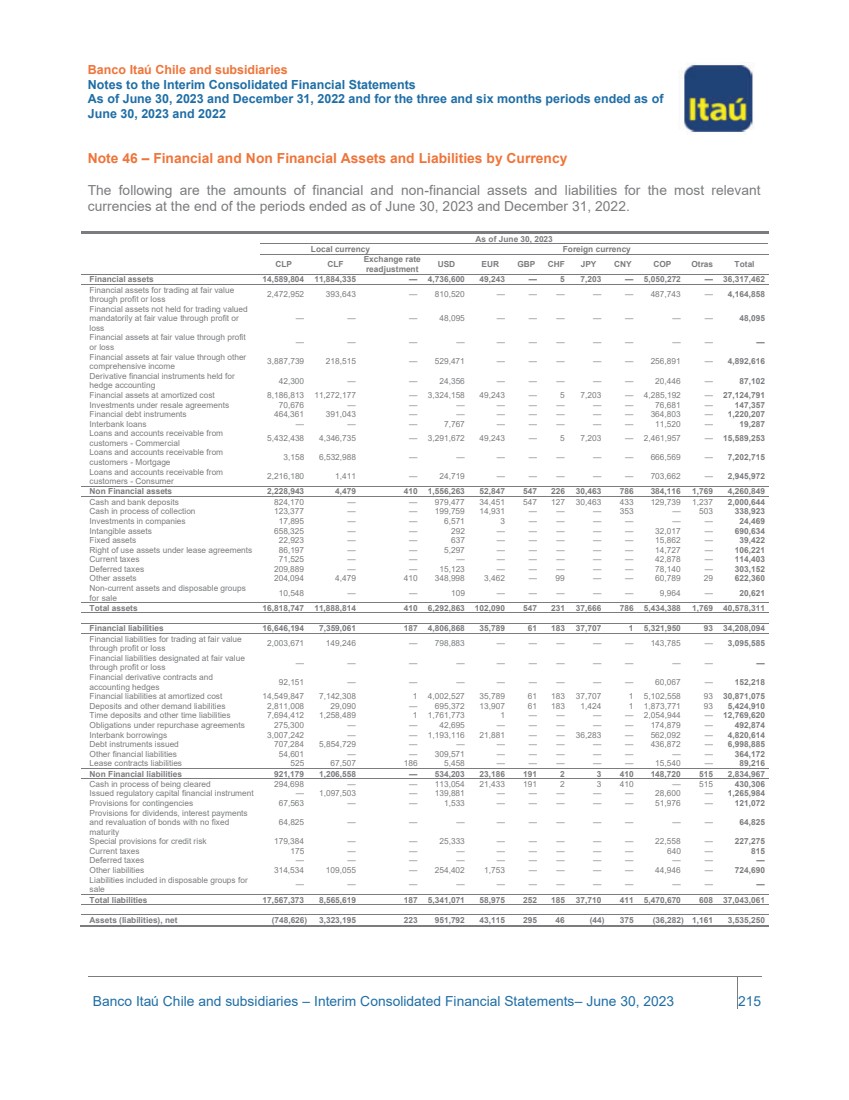
| Banco Itaú Chile and subsidiaries Notes to the Interim Consolidated Financial Statements As of June 30, 2023 and December 31, 2022 and for the three and six months periods ended as of June 30, 2023 and 2022 Banco Itaú Chile and subsidiaries – Interim Consolidated Financial Statements– June 30, 2023 215 Note 46 – Financial and Non Financial Assets and Liabilities by Currency The following are the amounts of financial and non-financial assets and liabilities for the most relevant currencies at the end of the periods ended as of June 30, 2023 and December 31, 2022. As of June 30, 2023 Local currency Foreign currency CLP CLF Exchange rate readjustment USD EUR GBP CHF JPY CNY COP Otras Total Financial assets 14,589,804 11,884,335 — 4,736,600 49,243 — 5 7,203 — 5,050,272 — 36,317,462 Financial assets for trading at fair value through profit or loss 2,472,952 393,643 — 810,520 — — — — — 487,743 — 4,164,858 Financial assets not held for trading valued mandatorily at fair value through profit or loss — — — 48,095 — — — — — — — 48,095 Financial assets at fair value through profit or loss — — — — — — — — — — — — Financial assets at fair value through other comprehensive income 3,887,739 218,515 — 529,471 — — — — — 256,891 — 4,892,616 Derivative financial instruments held for hedge accounting 42,300 — — 24,356 — — — — — 20,446 — 87,102 Financial assets at amortized cost 8,186,813 11,272,177 — 3,324,158 49,243 — 5 7,203 — 4,285,192 — 27,124,791 Investments under resale agreements 70,676 — — — — — — — — 76,681 — 147,357 Financial debt instruments 464,361 391,043 — — — — — — — 364,803 — 1,220,207 Interbank loans — — — 7,767 — — — — — 11,520 — 19,287 Loans and accounts receivable from customers - Commercial 5,432,438 4,346,735 — 3,291,672 49,243 — 5 7,203 — 2,461,957 — 15,589,253 Loans and accounts receivable from customers - Mortgage 3,158 6,532,988 — — — — — — — 666,569 — 7,202,715 Loans and accounts receivable from customers - Consumer 2,216,180 1,411 — 24,719 — — — — — 703,662 — 2,945,972 Non Financial assets 2,228,943 4,479 410 1,556,263 52,847 547 226 30,463 786 384,116 1,769 4,260,849 Cash and bank deposits 824,170 — — 979,477 34,451 547 127 30,463 433 129,739 1,237 2,000,644 Cash in process of collection 123,377 — — 199,759 14,931 — — — 353 — 503 338,923 Investments in companies 17,895 — — 6,571 3 — — — — — — 24,469 Intangible assets 658,325 — — 292 — — — — — 32,017 — 690,634 Fixed assets 22,923 — — 637 — — — — — 15,862 — 39,422 Right of use assets under lease agreements 86,197 — — 5,297 — — — — — 14,727 — 106,221 Current taxes 71,525 — — — — — — — — 42,878 — 114,403 Deferred taxes 209,889 — — 15,123 — — — — — 78,140 — 303,152 Other assets 204,094 4,479 410 348,998 3,462 — 99 — — 60,789 29 622,360 Non-current assets and disposable groups for sale 10,548 — — 109 — — — — — 9,964 — 20,621 Total assets 16,818,747 11,888,814 410 6,292,863 102,090 547 231 37,666 786 5,434,388 1,769 40,578,311 Financial liabilities 16,646,194 7,359,061 187 4,806,868 35,789 61 183 37,707 1 5,321,950 93 34,208,094 Financial liabilities for trading at fair value through profit or loss 2,003,671 149,246 — 798,883 — — — — — 143,785 — 3,095,585 Financial liabilities designated at fair value through profit or loss — — — — — — — — — — — — Financial derivative contracts and accounting hedges 92,151 — — — — — — — — 60,067 — 152,218 Financial liabilities at amortized cost 14,549,847 7,142,308 1 4,002,527 35,789 61 183 37,707 1 5,102,558 93 30,871,075 Deposits and other demand liabilities 2,811,008 29,090 — 695,372 13,907 61 183 1,424 1 1,873,771 93 5,424,910 Time deposits and other time liabilities 7,694,412 1,258,489 1 1,761,773 1 — — — — 2,054,944 — 12,769,620 Obligations under repurchase agreements 275,300 — — 42,695 — — — — — 174,879 — 492,874 Interbank borrowings 3,007,242 — — 1,193,116 21,881 — — 36,283 — 562,092 — 4,820,614 Debt instruments issued 707,284 5,854,729 — — — — — — — 436,872 — 6,998,885 Other financial liabilities 54,601 — — 309,571 — — — — — — — 364,172 Lease contracts liabilities 525 67,507 186 5,458 — — — — — 15,540 — 89,216 Non Financial liabilities 921,179 1,206,558 — 534,203 23,186 191 2 3 410 148,720 515 2,834,967 Cash in process of being cleared 294,698 — — 113,054 21,433 191 2 3 410 — 515 430,306 Issued regulatory capital financial instrument — 1,097,503 — 139,881 — — — — — 28,600 — 1,265,984 Provisions for contingencies 67,563 — — 1,533 — — — — — 51,976 — 121,072 Provisions for dividends, interest payments and revaluation of bonds with no fixed maturity 64,825 — — — — — — — — — — 64,825 Special provisions for credit risk 179,384 — — 25,333 — — — — — 22,558 — 227,275 Current taxes 175 — — — — — — — — 640 — 815 Deferred taxes — — — — — — — — — — — — Other liabilities 314,534 109,055 — 254,402 1,753 — — — — 44,946 — 724,690 Liabilities included in disposable groups for sale — — — — — — — — — — — — Total liabilities 17,567,373 8,565,619 187 5,341,071 58,975 252 185 37,710 411 5,470,670 608 37,043,061 Assets (liabilities), net (748,626) 3,323,195 223 951,792 43,115 295 46 (44) 375 (36,282) 1,161 3,535,250 |