Exhibit 99.4

| MANAGEMENT’S DISCUSSION AND ANALYSIS |
| FOR THE YEAR ENDED DECEMBER 31, 2013 |
| |
This Management’s Discussion and Analysis (“MD&A”) should be read in conjunction with the consolidated financial statements of Endeavour Silver Corp. (“Endeavour” or “the Company”) for the year ended December 31, 2013 and 2012 and the related notes contained therein, which are prepared in accordance with International Financial Reporting Standards (“IFRS”) as issued by the International Accounting Standards Board (“IASB”). Additional information relating to the Company, including the most recent Annual Information Form, is available on SEDAR at www.sedar.com, and the Company’s most recent annual report on Form 40-F has been filed with the US Securities and Exchange Commission (the “SEC”). This MD&A contains “forward-looking statements” that are subject to risk factors set out in a cautionary note contained herein. All dollar amounts are expressed in United States (“US”) dollars and tabular amounts are expressed in thousands of dollars unless otherwise indicated. This MD&A is dated as of March 5, 2014 and all-information contained is current as of March 5, 2014 unless otherwise stated.
Cautionary Note to US Investors concerning Estimates of Reserves and Measured, Indicated and Inferred Resources:
This MD&A has been prepared in accordance with the requirements of the securities laws in effect in Canada, which differ from the requirements of US securities laws. The terms “mineral reserve”, “proven mineral reserve” and “probable mineral reserve” are Canadian mining terms as defined in accordance with Canadian National Instrument 43-101 – Standards of Disclosure for Mineral Projects (“NI 43-101”) and the Canadian Institute of Mining, Metallurgy and Petroleum (the “CIM”) - CIM Definition Standards on Mineral Resources and Mineral Reserves, adopted by the CIM Council, as amended. These definitions differ from the definitions in SEC Industry Guide 7 under the US Securities Act of 1933, as amended (the “Securities Act”).
Under SEC Industry Guide 7 standards, a “final” or “bankable” feasibility study is required to report reserves, the three-year historical average price is used in any reserve or cash flow analysis to designate reserves and the primary environmental analysis or report must be filed with the appropriate governmental authority.
In addition, the terms “mineral resource”, “measured mineral resource”, “indicated mineral resource” and “inferred mineral resource” are defined in and required to be disclosed by NI 43-101; however, these terms are not defined terms under SEC Industry Guide 7 and are normally not permitted to be used in reports and registration statements filed with the SEC. Investors are cautioned not to assume that any part or all of mineral deposits in these categories will ever be converted into reserves. “Inferred mineral resources” have a great amount of uncertainty as to their existence, and great uncertainty as to their economic and legal feasibility. It cannot be assumed that all or any part of an inferred mineral resource will ever be upgraded to a higher category. Under Canadian rules, estimates of inferred mineral resources may not form the basis of feasibility or pre-feasibility studies, except in rare cases. Investors are cautioned not to assume that all or any part of an inferred mineral resource exists or is economically or legally mineable. Disclosure of “contained ounces” in a resource is permitted disclosure under Canadian regulations; however, the SEC normally only permits issuers to report mineralization that does not constitute “reserves” by SEC Industry Guide 7 standards as in place tonnage and grade without reference to unit measures.
Accordingly, information contained in this MD&A contains descriptions of Endeavour’s mineral deposits that may not be comparable to similar information made public by US companies subject to the reporting and disclosure requirements under the US federal securities laws and the rules and regulations thereunder.
| |
| |
| 700 West Pender Street, Suite 301, Vancouver, B.C., Canada V6C 1G8 |
| Phone: 604.685.9775 | Fax: 604.685.9744| Toll Free: 1.877.685.9775| Email: info@edrsilver.com |
| www.edrsilver.com |
| MANAGEMENT’S DISCUSSION AND ANALYSIS |
| FOR THE YEAR ENDED DECEMBER 31, 2013 |
| |
Forward-Looking Statements
This MD&A contains “forward-looking statements” within the meaning of the United States Private Securities Litigation Reform Act of 1995 and “forward-looking information” within the meaning of applicable Canadian securities legislation.Such forward-looking statements and information herein include, but are not limited to, statements regarding Endeavour’s anticipated performance in 2014, including silver and gold production, timing and expenditures to develop new silver mines and mineralized zones, silver and gold grades and recoveries, cash costs per ounce, capital expenditures and sustaining capital.Forward-looking statements are frequently characterized by words such as “plan”, “expect”, “forecast”, “project”, ”intend”, ”believe”, ”anticipate”, “outlook” and other similar words, or statements that certain events or conditions “may” or “will” occur. Forward- looking statements are based on the opinions and estimates of management at the dates the statements are made, and are subject to a variety of risks and uncertainties and other factors that could cause actual events or results to differ materially from those projected in the forward-looking statements.
The Company does not intend to, and does not assume any obligation to update such forward-looking statements or information, other than as required by applicable law. Forward-looking statements or information involve known and unknown risks, uncertainties and other factors that may cause the actual results, level of activity, performance or achievements of the Company and its operations to be materially different from those expressed or implied by such statements. Such factors include, among others: fluctuations in the prices of silver and gold, fluctuations in the currency markets (particularly the Mexican peso, Canadian dollar and U.S. dollar); changes in national and local governments, legislation, taxation, controls, regulations and political or economic developments in Canada and Mexico; operating or technical difficulties in mineral exploration, development and mining activities; risks and hazards of mineral exploration, development and mining (including, but not limited to environmental hazards, industrial accidents, unusual or unexpected geological conditions, pressures, cave-ins and flooding); inadequate insurance, or inability to obtain insurance; availability of and costs associated with mining inputs and labour; the speculative nature of mineral exploration and development, diminishing quantities or grades of mineral reserves as properties are mined; the ability to successfully integrate acquisitions; risks in obtaining necessary licenses and permits, and challenges to the Company’s title to properties; as well as those factors described in the section “risk factors” contained in the Company’s Annual Information Form filed with the Canadian securities regulatory authorities and as filed with the SEC in our Annual Report on Form 40-F. Although the Company has attempted to identify important factors that could cause actual results to differ materially from those contained in forward-looking statements or information, there may be other factors that cause results to be materially different from those anticipated, described, estimated, assessed or intended. There can be no assurance that any forward-looking statements or information will prove to be accurate as actual results and future events could differ materially from those anticipated in such statements or information. Accordingly, readers shouldnot place undue reliance on forward-looking statements or information.
Table of Contents
| Operating Highlights | Page 3 | Financial Results | Page 16 |
| History and Strategy | Page 4 | Non IFRS Measures | Page 20 |
| Consolidated Operations | Page 5 | Quarterly Results and Trends | Page 26 |
| Guanacevi Operations | Page 7 | Annual Outlook | Page 31 |
| Bolañitos Operations | Page 9 | Liquidity and Capital Resources | Page 32 |
| El Cubo Operations | Page 11 | Changes in Accounting Policies | Page 40 |
| Exploration Results | Page 13 | Risks and Uncertainties | Page 43 |
| Reserves and Resources | Page 14 | Controls and Procedures | Page 51 |
| MANAGEMENT’S DISCUSSION AND ANALYSIS |
| FOR THE YEAR ENDED DECEMBER 31, 2013 |
| |
| Three Months Ended Dec. 31 | 2013 Highlights | Year Ended Dec. 31 |
| 2013 | 2012 | % Change | | 2013 | 2012 | % Change |
| | | | Production | | | |
| 1,931,717 | 1,235,026 | 56% | Silver ounces produced | 6,813,069 | 4,485,476 | 52% |
| 17,686 | 12,917 | 37% | Gold ounces produced | 75,578 | 38,687 | 95% |
| 1,855,108 | 1,222,705 | 52% | Payable silver ounces produced | 6,593,805 | 4,440,619 | 48% |
| 16,612 | 12,800 | 30% | Payable gold ounces produced | 72,562 | 38,311 | 89% |
| 2,992,877 | 2,010,046 | 49% | Silver equivalent ounces produced(1) | 11,347,749 | 6,806,696 | 67% |
| 7.46 | 12.25 | -39% | Cash costs per silver ounce(2)(3) | 7.92 | 7.33 | 8% |
| 14.59 | 18.88 | -23% | Total production costs per ounce(2)(4) | 15.69 | 13.80 | 14% |
| 14.24 | 28.06 | -49% | All-in sustaining costs per ounce(2)(5) | 18.31 | 23.06 | -21% |
| 379,480 | 362,779 | 5% | Processed tonnes | 1,148,894 | 1,065,689 | 8% |
| 90.72 | 90.39 | 0% | Direct production costs per tonne(2)(6) | 97.00 | 92.74 | 5% |
| 11.45 | 18.82 | -39% | Silver co-product cash costs(7) | 13.19 | 14.87 | -11% |
| 695.47 | 987.70 | -30% | Gold co-product cash costs(7) | 785.01 | 807.67 | -3% |
| | | | Financial | | | |
| 67.9 | 66.7 | 2% | Revenue ($ millions) | 276.8 | 208.1 | 33% |
| 2,155,326 | 1,345,832 | 60% | Silver ounces sold | 7,151,963 | 4,815,073 | 49% |
| 18,960 | 13,037 | 45% | Gold ounces sold | 81,119 | 35,167 | 131% |
| 20.52 | 32.87 | -38% | Realized silver price per ounce | 23.10 | 30.99 | -25% |
| 1,246 | 1,725 | -28% | Realized gold price per ounce | 1,375 | 1,674 | -18% |
| (115.8) | 14.8 | -881% | Net earnings (loss) ($ millions) | (89.5) | 42.1 | -312% |
| (12.1) | 12.9 | -194% | Adjusted net earnings(8)($ millions) | 11.1 | 40.2 | -72% |
| 9.9 | 17.9 | -45% | Mine operating earnings ($ millions) | 56.9 | 78.0 | -27% |
| 26.4 | 34.8 | -24% | Mine operating cash flow(9)($ millions) | 116.9 | 114.4 | 2% |
| 18.0 | 20.4 | -12% | Operating cash flow before working capital changes(10) | 81.6 | 82.9 | -2% |
| 23.0 | 28.2 | -18% | Earnings before ITDA(11) | 100.0 | 90.5 | 10% |
| 32.2 | 50.9 | -37% | Working capital ($ millions) | 32.2 | 50.9 | -37% |
| Shareholders | | | | | | |
| (1.16) | 0.15 | -100% | Earnings (loss) per share – basic | (0.90) | 0.45 | -300% |
| (0.12) | 0.13 | -193% | Adjusted earnings per share – basic(8) | 0.11 | 0.43 | -74% |
| 0.18 | 0.20 | -12% | Operating cash flow before working capital changes per share(10) | 0.82 | 0.89 | -8% |
| 99,720,704 | 99,539,282 | 0% | Weighted average shares outstanding | 99,770,293 | 93,266,038 | 7% |
| (1) | Silver equivalents are calculated using a 60:1 ratio. |
| (2) | The Company reports non-IFRS measures which include cash costs net of by-products on a payable silver basis, total production costs per ounce, all-in sustaining costs per ounce and direct production costs per tonne, in order to manage and evaluate operating performance at each of the Company’s mines. These measures, some established by the Silver Institute (Production Cost Standards, June 2011), are widely used in the silver mining industry as a benchmark for performance, but do not have a standardized meaning. These measures are reported on a production basis. See Reconciliation to IFRS on page 20. |
| (3) | Cash costs net of by-products per payable silver ounce include mining, processing (including smelting, refining, transportation and selling costs), and direct overhead, net of gold credits. See Reconciliation to IFRS on page 22. |
| (4) | Total production costs per ounce include mining, processing (including smelting, refining, transportation and selling costs), direct overhead, amortization, depletion and amortization at the operation sites. See Reconciliation to IFRS on page 22. |
| (5) | All-in sustaining cost per ounce include mining, processing (including smelting, refining, transportation and selling costs), direct overhead, corporate general and administration, on-site exploration, share-based compensation, reclamation and sustaining capital net of gold credits. |
| (6) | Direct production costs per tonne include mining, processing (including smelting, refining, transportation and selling costs) and direct overhead at the operation sites. See Reconciliation to IFRS on page 22. |
| (7) | Silver co-product cash cost and gold co-product cash cost include mining, processing (including smelting, refining, transportation and selling costs), and direct overhead allocated on pro-rated basis of realized metal value. See Reconciliation to IFRS on page 25. |
| MANAGEMENT’S DISCUSSION AND ANALYSIS |
| FOR THE YEAR ENDED DECEMBER 31, 2013 |
| |
| (8) | Adjusted earnings are calculated by adding back the mark-to-market impact of derivative equities held as a liability on the Company’s balance sheet and impairment charges net of tax. See Reconciliation to IFRS on page 20. |
| (9) | Mine operating cash flow is calculated by adding back amortization, depletion, inventory write downs and share-based compensation to mine operating earnings. Mine operating earnings and mine operating cash flow are before taxes. See Reconciliation to IFRS on page 21. |
| (10) | See Reconciliation to IFRS on page 21 for the reconciliation of operating cash flow before working capital changes, operating cash flow before working capital changes per share. |
| (11) | See Reconciliation of Earnings before interest, taxes, depreciation and amortization on page 22 |
Management’s highlights are key measures used by management, however they should not be the sole measures used in determining the performance of the Company’s operations.
HISTORY AND STRATEGY
The Company is engaged in silver mining in Mexico and related activities including property acquisition, exploration, development, mineral extraction, processing, refining and reclamation. The Company is also engaged in exploration activities in Chile.
Historically, the business philosophy was to acquire and explore early-stage mineral prospects in Canada and the US. In 2002 the Company was re-organized, a new management team was appointed, and the business strategy was revised to focus on acquiring advanced-stage silver mining properties in Mexico. Mexico, despite its long and prolific history of metal production, appeared to be relatively un-explored using modern exploration techniques and offered promising geological potential for precious metals exploration and production.
After evaluating several mineral properties in Mexico in 2003, the Company negotiated an option to purchase the Guanaceví silver mines and process plant located in Durango, Mexico in May 2004. Management recognized that even though the mines had run out of ore, little modern exploration had been carried out to discover new silver ore-bodies. Exploration drilling commenced in June 2004 and quickly met with encouraging results. By September 2004, sufficient high-grade silver mineralization had been outlined to justify the development of an access ramp into the newly discovered North Porvenir ore-body. In December 2004, the Company commenced the mining and processing of ore from the new North Porvenir mine to produce silver doré bars.
In 2007, the Company replicated the success of Guanaceví with the acquisition of the Bolañitos (formerly described as “Guanajuato”) mines project in Guanajuato State. Bolañitos was very similar in that there was a fully built and permitted processing plant, and the mines were running out of ore, so the operation was for sale. The acquisition was finalized in May 2007 and as a result of the successful mine rehabilitation and subsequent exploration work, silver production, reserves and resources are growing rapidly and Bolañitos is now an integral part of the Company’s asset base.
Both Guanaceví and Bolañitos are good examples of Endeavour’s business model of acquiring fully built and permitted silver mines that were about to close for lack of ore. By bringing the money and expertise needed to find new silver ore-bodies, Endeavour has successfully re-opened and expanded these mines to develop their full potential. The benefit of acquiring fully built and permitted mining and milling infrastructure is that if new exploration efforts are successful, the mine development cycle from discovery to production only takes a matter of months instead of the several years normally required in the traditional mining business model.
In 2012, the Company acquired the El Cubo silver-gold mine located in Guanajuato, Mexico. El Cubo has similar challenges to Endeavour’s past acquisitions, but with two significant exceptions; the property came with substantial reserves and resources, and the mine was already operating at 1,100 tonnes per day. After acquisition, the Company is focused on improving the mining methods, increasing brown-fields exploration, while completely refurbishing the existing infrastructure to maximize the potential of El Cubo.
The Company historically funded its exploration and development activities through equity financings and convertible debentures. Equity financings also facilitated the acquisition and development of the Guanaceví and Bolañitos mines projects. However, since 2004, the Company has been able to finance more and more of its acquisition, exploration, development and operating activities from production cash flows. In 2012 the Company obtained a credit facility to help support its acquisition, exploration and capital investment programs. The Company may choose to engage in equity, debt, convertible debt or other financings, on an as-needed basis, in order to facilitate its growth.
| MANAGEMENT’S DISCUSSION AND ANALYSIS |
| FOR THE YEAR ENDED DECEMBER 31, 2013 |
| |
REVIEW OF OPERATING RESULTS
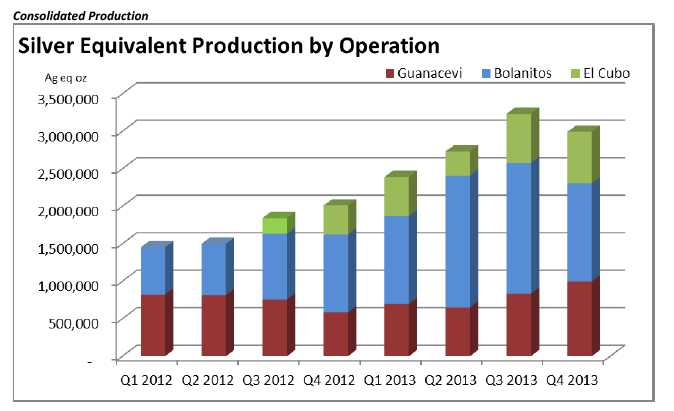
Consolidated Production Results for the Three Months and Years Ended December 31, 2013 and 2012
| Three Months Ended Dec. 31 | CONSOLIDATED | Year Ended Dec. 31 |
| 2013 | 2012 | % Change | | 2013 | 2012 | % Change |
| 379,480 | 362,779 | 5% | Ore tonnes processed | 1,537,984 | 1,065,689 | 44% |
| 181 | 151 | 20% | Average silver grade (gpt) | 168 | 179 | -6% |
| 87.3 | 70.1 | 25% | Silver recovery (%) | 81.6 | 73.2 | 11% |
| 1,931,717 | 1,235,026 | 56% | Total silver ounces produced | 6,813,069 | 4,485,476 | 52% |
| 1,855,108 | 1,222,705 | 52% | Payable silver ounces produced | 6,593,805 | 4,440,619 | 48% |
| 1.78 | 1.55 | 15% | Average gold grade (gpt) | 1.78 | 1.48 | 21% |
| 82.1 | 71.17 | 15% | Gold recovery (%) | 85.6 | 76.5 | 12% |
| 17,686 | 12,917 | 37% | Total gold ounces produced | 75,578 | 38,687 | 95% |
| 16,612 | 12,800 | 30% | Payable gold ounces produced | 72,562 | 38,311 | 89% |
| 2,992,877 | 2,010,046 | 49% | Silver equivalent ounces produced(1) | 11,347,749 | 6,806,696 | 67% |
| 7.46 | 12.25 | -39% | Cash costs per silver ounce(2)(3) | 7.92 | 7.33 | 8% |
| 14.59 | 18.88 | -23% | Total production costs per ounce(2)(4) | 15.69 | 13.80 | 14% |
| 14.24 | 28.06 | -49% | All in sustaining cost per ounce(2)(5) | 18.31 | 23.06 | -21% |
| 90.72 | 90.39 | 0% | Direct production costs per tonne(2)(6) | 97.00 | 92.74 | 5% |
| $11.45 | $18.82 | -39% | Silver co-product cash costs(7) | $13.19 | $14.87 | -11% |
| $695.47 | $987.70 | -30% | Gold co-product cash costs(7) | $785.01 | $807.67 | -3% |
| (1) | Silver equivalents are calculated using a 60:1 ratio . |
| (2) | The Company reports non-IFRS measures which include cash costs net of by-product on a payable silver basis, total production costs per ounce, all-in sustaining costs per ounce and direct production costs per tonne, in order to manage and evaluate operating performance at each of the Company’s mines. These measures, some established by the Silver Institute (Production Cost Standards, June 2011), are widely used in the silver mining industry as a benchmark for performance, but do not have a standardized meaning. These measures are reported on a production basis. See Reconciliation to IFRS on page 20. |
| (3) | Cash costs net of by-products per payable silver ounce include mining, processing (including smelting, refining, transportation and selling costs), and direct overhead, net of gold credits. See Reconciliation to IFRS on page 22. |
| (4) | Total production costs per ounce include mining, processing (including smelting, refining, transportation and selling costs), direct overhead, amortization, depletion and amortization at the operation sites. See Reconciliation to IFRS on page 22. |
| (5) | All-in sustaining costs per ounce include mining, processing (including smelting, refining, transportation and selling costs), direct overhead, corporate general and administration, on-site exploration, share -based compensation, reclamation and sustaining capital net of gold credits. |
| (6) | Direct production costs per tonne include mining, processing (including smelting, refining, transportation and selling costs) and direct overhead at the operation sites. See Reconciliation to IFRS on page 22. |
| (7) | Silver co-product cash cost and gold co-product cash cost include mining, processing (including smelting, refining, transportation and selling costs), and direct overhead allocated on pro -rated basis of realized metal value. See Reconciliation to IFRS on page 25. |
| MANAGEMENT’S DISCUSSION AND ANALYSIS |
| FOR THE YEAR ENDED DECEMBER 31, 2013 |
| |
Three months ended December 31, 2013 (compared to the three months ended December 31, 2012)
Consolidated silver production during Q4, 2013 was 1,931,717 oz, an increase of 56% compared to 1,235,026 oz in Q4, 2012, and gold production was 17,686 oz, an increase of 37% compared to 12,917 oz in Q4, 2012. Plant throughput was 379,480 tonnes at average grades of 181 gpt silver and 1.78 gpt gold compared to 362,779 tonnes grading 151 gpt silver and 1.55 gpt gold. Metal production was significantly higher due to higher tonnage throughput at Guanacevi and El Cubo, higher silver grades and recoveries at all three mines, higher gold grades at Bolanitos and El Cubo and higher gold recoveries at Guanacevi and El Cubo. The higher gold grade was due to the increasing significance of the Bolañitos and El Cubo operations, which have higher gold grades compared to Guanaceví. The higher silver grades were a function of geological variation of the ore bodies at Guanacevi and the improvement of the El Cubo operation in Q4, 2013.
The increased recoveries were partly a function of selling concentrate as opposed to processing the concentrate at the Company’s leach facilities at Guanaceví and El Cubo to produce doré bars. Selling concentrate at current metal prices resulted in higher payable metal production albeit at higher refining charges, resulting in a financial benefit compared to doré production.
Year ended December 31, 2013 (compared to the year ended December 31, 2012)
Consolidated silver production during 2013 was 6,813,069 oz, an increase of 52% compared to 4,485,476 oz in 2012, and gold production was 75,578 oz, an increase of 95% compared to 38,687 oz in 2012. Plant throughput was 1,537,984 tonnes at average grades of 168 gpt silver and 1.78 gpt gold compared to 1,065,689 tonnes grading 179 gpt silver and 1.48 gpt gold. Metal production was significantly higher due to the expansion of the Bolañitos mine, the processing of the extra Bolañitos mine production at the El Cubo facilities, and an entire year of improved operations from the El Cubo mine which was acquired in Q3, 2012. Tonnage throughput, silver grades and silver and gold recoveries were higher at all three mines and gold grades improved at Bolanitos and El Cubo but fell at Guanacevi. The higher grades were due to the increasing significance of the Bolañitos and El Cubo operations, which have higher gold grades compared to Guanaceví. The higher silver grades were a function of geological variation of the ore bodies at Guanacevi and the improved El Cubo operations in 2013.
| MANAGEMENT’S DISCUSSION AND ANALYSIS |
| FOR THE YEAR ENDED DECEMBER 31, 2013 |
| |
The increased recoveries were partly a function of selling concentrate as opposed to processing the concentrate at the Company’s leach facilities at Guanaceví and El Cubo to produce doré bars. Selling concentrate at current metal prices resulted in higher payable metal production albeit at higher refining charges, resulting in a financial benefit compared to doré production.
Consolidated Operating Costs
Three months ended December 31, 2013 (compared to the three months ended December 31, 2012)
Per tonne costs remained relatively consistent year over year as wage pressures, use of contractors and higher refining costs were offset by achieving additional economies of scale with the higher output. Cash costs per ounce net of by-product credits, which is a non-IFRS measure and a standard of the Silver Institute, fell 39% to $7.46 per ounce of payable silver compared to $12.25 per ounce in the same period in 2012. The higher grades and recoveries along with improved performance of the El Cubo operations drove cash costs down which was partially offset by the reduced by-product credit because of the lower gold price. All-in sustaining costs fell as mine development and exploration expenditures were curtailed and spread over higher silver production.
Year ended December 31, 2013 (compared to the year ended December 31, 2012)
Per tonne costs increased 5% due to wage pressures, significant restructuring costs, additional use of contractors and higher refining costs offset by achieving additional economies of scale with the higher output. Cash costs per ounce net of by-product credits, which is a non-IFRS measure and a standard of the Silver Institute, rose 8% to $7.92 per ounce of payable silver compared to $7.33 per ounce in 2012. The lower by-product credit because of the lower gold price was the primary contributor to the higher costs, offset by higher consolidated grades and recoveries. All-in sustaining costs fell 21% as mine development and exploration expenditures were curtailed and spread over higher silver production.
Guanaceví Operations
Production Results for the Three Month and Years Ended December 31, 2013 and 2012
| Three Months Ended Dec. 31 | GUANACEV¥ | Year Ended December 31 |
| 2013 | 2012 | % Change | | 2013 | 2012 | % Change |
| 121,008 | 110,763 | 9% | Ore tonnes processed | 435,922 | 418,277 | 4% |
| 272 | 215 | 26% | Average silver grade (g/t) | 253 | 249 | 2% |
| 81.5 | 67.7 | 20% | Silver recovery (%) | 78.0 | 74.6 | 5% |
| 861,495 | 518,207 | 66% | Total silver ounces produced | 2,772,227 | 2,512,943 | 10% |
| 852,880 | 513,025 | 66% | Payable silver ounces produced | 2,744,505 | 2,487,813 | 10% |
| 0.69 | 0.69 | -1% | Average gold grade (g/t) | 0.60 | 0.76 | -21% |
| 85.2 | 44.3 | 92% | Gold recovery (%) | 80.5 | 76.1 | 6% |
| 2,275 | 1,088 | 109% | Total gold ounces produced | 6,784 | 7,874 | -14% |
| 2,244 | 1,077 | 108% | Payable gold ounces produced | 6,708 | 7,795 | -14% |
| 997,995 | 583,487 | 71% | Silver equivalent ounces produced(1) | 3,179,267 | 2,985,383 | 6% |
| 13.09 | 18.20 | -28% | Cash costs per silver ounce(2)(3) | 14.32 | 12.25 | 17% |
| 18.51 | 23.89 | -22% | Total production costs per ounce(2)(4) | 20.10 | 17.45 | 15% |
| 17.43 | 31.51 | -45% | All in sustaining cost per ounce(2)(5) | 22.55 | 23.99 | -6% |
| 114.55 | 99.70 | 15% | Direct production costs per tonne(2)(6) | 110.93 | 103.83 | 7% |
| $13.87 | $19.20 | -28% | Silver co-product cash costs(7) | $15.22 | $14.77 | 3% |
| $841.96 | $1,007.35 | -16% | Gold co-product cash costs(7) | $906.25 | $801.62 | 13% |
| (1) | Silver equivalents are calculated using a 60:1 ratio . |
| (2) | The Company reports non-IFRS measures which include cash costs net of by-product on a payable silver basis, total production costs per ounce, all-in sustaining costs per ounce and direct production costs per tonne, in order to manage and evaluate operating performance at each of the Company’s mines. These measures, some established by the Silver Institute (Production Cost Standards, June 2011), are widely used in the silver mining industry as a benchmark for performance, but do not have a standardized meaning. These measures are reported on a production basis. See Reconciliation to IFRS on page 20. |
| MANAGEMENT’S DISCUSSION AND ANALYSIS |
| FOR THE YEAR ENDED DECEMBER 31, 2013 |
| |
| (3) | Cash costs net of by-product per payable silver ounce include mining, processing (including smelting, refining, transportation and selling costs), and direct overhead, net of gold credits. See Reconciliation to IFRS on page 22. |
| (4) | Total production costs per ounce include mining, processing (including smelting, refining, transportation and selling costs), direct overhead, amortization, depletion and amortization at the operation sites. See Reconciliation to IFRS on page 22. |
| (5) | All-in sustaining cost per ounce include mining, processing (including smelting, refining, transportation and selling costs), direct overhead, corporate general and administration, on-site exploration, share-based compensation, reclamation and sustaining capital net of gold credits |
| (6) | Direct production costs per tonne include mining, processing (including smelting, refining, transportation and selling costs) and direct overhead at the operation sites. See Reconciliation to IFRS on page 22. |
| (7) | Silver co-product cash cost and gold co-product cash cost include mining, processing (including smelting, refining, transportation and selling costs), and direct overhead allocated on pro-rated basis of realized metal value. See Reconciliation to IFRS on page 25. |
The acquisition of Endeavour’s first silver mine, at Guanaceví in 2004, continues to reap rewards for all stakeholders. The mine has since produced more than 15 million ounces of silver and 38,000 ounces of gold, revitalized the local community, and helped establish Endeavour’s successful business model. Although the historic mine was closed and the plant was struggling to process 100 tonnes per day of old tailings in 2004, Guanaceví is now producing 1,200 tonnes of high-grade ore per day. The Company found five high-grade silver-gold ore bodies along a five kilometre length of the prolific Santa Cruz vein and developed four new mines, one of which is now mined out. The Guanaceví operation currently includes three underground silver-gold mines, a cyanidation leach plant, mining camp, and administration and housing facilities. It provides steady employment for more than 450 people and engages over 200 contractors.
Guanaceví Production Results
Three months ended December 31, 2013 (compared to the three months ended December 31, 2012)
Silver production at the Guanaceví mine during Q4, 2013 was 861,495 oz, an increase of 66% compared to 518,207 oz in Q4, 2012, and gold production was 2,275 oz, an increase of 109% compared to 1,088 oz in Q4, 2012. Plant throughput was 121,008 tonnes at average grades of 272 gpt silver and 0.69 gpt gold compared to 110,763 tonnes grading 215 gpt silver and 0.69 gpt gold. Silver production increased due to higher silver grades and recoveries, while higher gold recoveries contributed to higher gold production. Q4, 2012 included adjustments to appropriately allocate processed ounces on behalf of the Bolañitos mine resulting in lower reported recoveries. The change in grades and recoveries were a function of geological variation of the ore bodies in Q4, 2013, with the higher grade Porvenir Cuatro mine contributing a higher tonnage resulting in improved throughput grades.
Year ended December 31, 2013 (compared to the year ended December 31, 2012)
Silver production at the Guanaceví mine during 2013 was 2,772,227 oz, an increase of 10% compared to 2,512,943 oz in 2012, and gold production was 6,784 oz, a decrease of 14% compared to 7,874 oz in 2012. Plant throughput was 435,922 tonnes at average grades of 253 gpt silver and 0.60 gpt gold in 2013 compared to 418,277 tonnes grading 249 gpt silver and 0.76 gpt gold in 2012. Metal production varied due to ore grades fluctuations, with better recoveries in 2013. The lower gold grades were attributable to the lower grade ores being mined at depth at North Porvenir, and increased tonnage in the lower grade Santa Cruz ore-body.
Guanaceví Operating Costs
Three months ended December 31, 2013 (compared to the three months ended December 31, 2012)
Wage increases and mining to greater depths have driven the rise in costs per tonne 15% compared to Q4, 2012. However, cash costs per ounce net of by-product credits, which is a non-IFRS measure and a standard of the Silver Institute, fell 28% to $13.09 per ounce of payable silver compared to $18.20 in 2012. Improved grades and recoveries offset the higher costs per tonne. Decreased mine development and exploration expenditures reduced the all-in sustaining costs compared to prior year.
Year ended December 31, 2013 (compared to the year ended December 31, 2012)
Wage increases and mining to greater depths have driven the rise in costs per tonne of 7% compared to 2012. Cash costs per ounce net of by-product credits, which is a non-IFRS measure and a standard of the Silver Institute, increased 17% to $14.32 per ounce of payable silver compared due to lower gold grades and gold prices. Reduced mine development and exploration expenditures year over year resulted in a 6% lower all-in sustaining costs per silver ounce.
| MANAGEMENT’S DISCUSSION AND ANALYSIS |
| FOR THE YEAR ENDED DECEMBER 31, 2013 |
| |
Bolañitos Operations
Production Results for the Three Months and Years Ended December 31, 2013 and 2012
| Three Months Ended Dec. 31 | BOLAÑITOS | Year Ended December 31 |
| 2013 | 2012 | % Change | | 2013 | 2012 | % Change |
| 159,294 | 161,841 | -2% | Ore tonnes processed | 710,708 | 476,687 | 49% |
| 152 | 140 | 9% | Average silver grade (g/t) | 149 | 148 | 1% |
| 89.5 | 71.3 | 26% | Silver recovery (%) | 84.6 | 73.4 | 15% |
| 698,098 | 518,674 | 35% | Total silver ounces produced | 2,881,816 | 1,668,128 | 73% |
| 660,113 | 513,487 | 29% | Payable silver ounces produced | 2,742,499 | 1,651,446 | 66% |
| 2.61 | 2.20 | 19% | Average gold grade (g/t) | 2.63 | 2.19 | 20% |
| 75.8 | 75.8 | 0% | Gold recovery (%) | 85.6 | 77.0 | 11% |
| 10,142 | 8,660 | 17% | Total gold ounces produced | 51,652 | 25,920 | 99% |
| 9,611 | 8,586 | 12% | Payable gold ounces produced | 49,572 | 25,673 | 93% |
| 1,306,618 | 1,038,274 | 26% | Silver equivalent ounces produced(1) | 5,980,936 | 3,223,328 | 86% |
| 0.60 | (3.73) | 116% | Cash costs per silver ounce(2)(3) | (2.87) | (5.20) | 45% |
| 4.35 | 1.59 | -174% | Total production costs per ounce(2)(4) | 1.30 | 0.31 | -319% |
| 7.68 | 11.67 | -34% | All in sustaining cost per ounce(2)(5) | 7.39 | 12.10 | -39% |
| 72.78 | 75.66 | -4% | Direct production costs per tonne(2)(6) | 79.47 | 74.25 | 7% |
| $8.82 | $12.58 | -30% | Silver co-product cash costs(7) | $9.48 | $11.51 | -18% |
| $535.80 | $660.34 | -19% | Gold co-product cash costs(7) | $564.43 | $624.72 | -10% |
| (1) | Silver equivalents are calculated using a 60:1 ratio . |
| (2) | The Company reports non-IFRS measures which include cash costs net of by-products on a payable silver basis, total production costs per ounce, all-in sustaining costs per ounce and direct production costs per tonne, in order to manage and evaluate operating performance at each of the Company’s mines. These measures, some established by the Silver Institute (Production Cost Standards, June 2011), are widely used in the silver mining industry as a benchmark for performance, but do not have a standardized meaning. These measures are reported on a production basis. See Reconciliation to IFRS on page 20. |
| (3) | Cash costs net of by-product per payable silver ounce include mining, processing (including smelting, refining, transportation and selling costs), and direct overhead, net of gold credits. See Reconciliation to IFRS on page 22. |
| (4) | Total production costs per ounce include mining, processing (including smelting, refining, transportation and selling costs), direct overhead, amortization, depletion and amortization at the operation sites. See Reconciliation to IFRS on page 22. |
| (5) | All-in sustaining cost per ounce include mining, processing (including smelting, refining, transportation and selling costs), direct overhead, corporate general and administration, on-site exploration, share-based compensation, reclamation and sustaining capital net of gold credits |
| (6) | Direct production costs per tonne include mining, processing (including smelting, refining, transportation and selling costs) and direct overhead at the operation sites. See Reconciliation to IFRS on page 22. |
| (7) | Silver co-product cash cost and gold co-product cash cost include mining, processing (including smelting, refining, transportation and selling costs), and direct overhead allocated on pro-rated basis of realized metal value. See Reconciliation to IFRS on page 25. |
Endeavour's second mine acquisition, at Bolañitos in 2007, encompasses three operating silver and gold mines and a floatation plant, located 10 kilometres from the city of Guanajuato in the state of Guanajuato. Following the acquisition, the cash costs of production were as high as $32 per ounce and the operation was struggling to produce 300,000 ounces of silver per year. Following the execution of management’s business strategy, the cash costs of production fell to negative due to economies of scale and the rising gold credits as production grew. Bolañitos’ processing plant was expanded in phases from 500 tonnes per day in 2007 to 1,600 tonnes per day in 2012. In 2013 additional mine output was processed at the El Cubo facilities allowing production to exceed plant capacity.
Bolañitos Production Results
Three months ended December 31, 2013 (compared to the three months ended December 31, 2012)
Silver production at the Bolañitos mine was 698,098 ounces during Q4, 2013, an increase of 35% compared to 518,674 oz in Q4, 2012, and gold production was 10,142 oz, an increase of 17% compared to 8,660 oz in Q4, 2012. Plant throughput in Q4, 2013 was 159,294 tonnes at average grades of 152 gpt silver and 2.61 gpt gold, compared to 161,841 tonnes grading 140 gpt silver and 2.20 gpt gold in Q4, 2012.
| MANAGEMENT’S DISCUSSION AND ANALYSIS |
| FOR THE YEAR ENDED DECEMBER 31, 2013 |
| |
Metal production was up due to higher grades and recoveries. The Bolañitos mine averaged 1,731 tonnes per day (tpd), well above the mine plan due to increased contract mining and more long-hole mining. The Bolañitos plant operated at its 1,600 tpd capacity, and the extra mine tonnage was processed at the leased Las Torres facility near El Cubo until July 22, 2013. Subsequent to July 22, 2013, the mine production in excess of Bolañitos’ plant capacity was processed at the newly refurbished El Cubo plant.
Ore grades were significantly higher than both the prior year and the 2013 mine plan, as mining accessed better ore grades than the planned reserve grades, specifically in the Daniela vein. Mine grades are expected to remain above reserve grades for the foreseeable future. The increased recoveries were partly a function of selling concentrate as opposed to processing the concentrate at the Company’s leach facilities at Guanaceví and El Cubo to produce doré bars. Selling concentrate at current metal prices resulted in higher payable metal production albeit at higher refining charges, resulting in a financial benefit compared to doré production.
Year ended December 31, 2013 (compared to the year ended December 31, 2012)
Silver production at the Bolañitos mine was 2,881,816 ounces in 2013, an increase of 73% compared to 1,668,128 oz, and gold production was 51,652 oz, an increase of 99% compared to 25,920 oz in 2012. Plant throughput in 2013 was 710,708 tonnes at average grades of 149 gpt silver and 2.63 gpt gold, compared to 476,687 tonnes grading 148 gpt silver and 2.19 gpt gold in 2012. Metal production was up due to higher throughput, recoveries and gold grade. In 2012, the Bolañitos plant capacity was expanded from 1,000 tpd to 1,600 tpd, and the mine was expanded to the plant capacity by Q4, 2012. In 2013, the Bolañitos plant operated at its 1,600 tpd capacity, and the extra tonnes were processed at the leased Las Torres facility near the El Cubo operations. The leased Las Torres facility was scheduled to be returned in May; however the counterparty requested a later return date allowing continued access until July 22, 2013. This additional access allowed Bolañitos production to significantly exceed plan. Subsequent to July 22, 2013, mine production in excess of the Bolañitos’ plant capacity was processed at the newly refurbished El Cubo plant.
Ore grades were also significantly higher than both the prior year and the 2013 mine plan, as mining accessed better ore grades than the planned reserve grades, specifically in the Daniela vein. Mine grades are expected to remain above reserve grades in the foreseeable future. The increased recoveries were partly a function of selling concentrate as opposed to processing the concentrate at the Company’s leach facilities at Guanaceví and El Cubo to produce doré bars. Selling concentrate at current metal prices resulted in higher payable metal production albeit at higher refining charges, resulting in a financial benefit compared to doré production.
Bolañitos Operating Costs
Three months ended December 31, 2013 (compared to the three months ended December 31, 2012)
Per tonne costs remained relatively consistent year over year as wage pressures, use of contractors and higher refining costs were offset by achieving additional economies of scale with the higher output. Cash costs per ounce net of by-product credits, which is a non-IFRS measure and a standard of the Silver Institute, rose 116% to $0.60 per ounce of payable silver compared to negative $3.73 per ounce in the same period in 2012. The lower by-product credit because of the lower gold price was the primary contributor to the higher cash costs, offset by higher grades and recoveries. All-in sustaining costs fell as mine development and exploration expenditures were curtailed and spread over higher silver production.
Year ended December 31, 2013 (compared to the year ended December 31, 2012)
Per tonne costs remained relatively consistent year over year as wage pressures, use of contractors and higher refining costs were offset by achieving additional economies of scale with the higher output. Cash costs per ounce net of by-product credits, which is a non-IFRS measure and a standard of the Silver Institute, rose 45% to negative $2.87 per ounce of payable silver compared to negative $5.20 in the same period in 2012. The lower byproduct credit because of the lower gold price was the primary contributor to the higher cash costs, offset by higher grades and recoveries. All-in sustaining costs fell as mine development and exploration expenditures were curtailed and spread over higher silver production.
| MANAGEMENT’S DISCUSSION AND ANALYSIS |
| FOR THE YEAR ENDED DECEMBER 31, 2013 |
| |
El Cubo Operations
Production Results for the Three Months and Years Ended December 31, 2013 and 2012
| Three Months Ended Dec. 31 | EL CUBO | Year Ended December 31 |
| 2013 | 2012 | % Change | | 2013 | 2012 | % Change |
| 99,178 | 90,175 | 10% | Ore tonnes processed | 391,354 | 170,725 | 129% |
| 118 | 96 | 23% | Average silver grade (g/t) | 107 | 94 | 14% |
| 99.1 | 71.2 | 39% | Silver recovery (%) | 85.0 | 58.9 | 44% |
| 372,124 | 198,145 | 88% | Total silver ounces produced | 1,159,026 | 304,405 | 281% |
| 342,115 | 196,193 | 74% | Payable silver ounces produced | 1,106,801 | 301,360 | 267% |
| 1.77 | 1.42 | 25% | Average gold grade (g/t) | 1.57 | 1.42 | 11% |
| 93.2 | 77.0 | 21% | Gold recovery (%) | 93.2 | 62.8 | 48% |
| 5,269 | 3,169 | 66% | Total gold ounces produced | 17,142 | 4,893 | 250% |
| 4,757 | 3,137 | 52% | Payable gold ounces produced | 16,282 | 4,843 | 236% |
| 688,264 | 388,285 | 77% | Silver equivalent ounces produced(1) | 2,187,546 | 597,985 | 266% |
| 6.65 | 38.52 | -83% | Cash costs per silver ounce(2)(3) | 18.77 | 35.27 | -47% |
| 24.58 | 51.04 | -52% | Total production costs per ounce(2)(4) | 40.43 | 57.50 | -30% |
| 18.95 | 61.93 | -69% | All in sustaining cost per ounce(2)(5) | 34.84 | 75.53 | -54% |
| 90.44 | 105.30 | -14% | Direct production costs per tonne(2)(6) | 113.31 | 117.17 | -3% |
| $12.96 | $34.89 | -63% | Silver co-product cash costs(7) | $20.35 | $32.76 | -38% |
| $787.02 | $1,830.76 | -57% | Gold co-product cash costs(7) | $1,211.19 | $1,866.99 | -35% |
| (1) | Silver equivalents are calculated using a 60:1 ratio . |
| (2) | The Company reports non-IFRS measures which include cash costs net of by-products on a payable silver basis, total production costs per ounce, all-in sustaining costs per ounce and direct production costs per tonne, in order to manage and evaluate operating performance at each of the Company’s mines. These measures, some established by the Silver Institute (Production Cost Standards, June 2011), are widely used in the silver mining industry as a benchmark for performance, but do not have a standardized meaning. These measures are reported on a production basis. See Reconciliation to IFRS on page 20. |
| (3) | Cash costs net of by-products per payable silver ounce include mining, processing (including smelting, refining, transportation and selling costs), and direct overhead, net of gold credits. See Reconciliation to IFRS on page 22. |
| (4) | Total production costs per ounce include mining, processing (including smelting, refining, transportation and selling costs), direct overhead, amortization, depletion and amortization at the operation sites. See Reconciliation to IFRS on page 22. |
| (5) | All-in sustaining cost per ounce include mining, processing (including smelting, refining, transportation and selling costs), direct overhead, corporate general and administration, on-site exploration, share-based compensation, reclamation and sustaining capital net of gold credits. |
| (6) | Direct production costs per tonne include mining, processing (including smelting, refining, transportation and selling costs) and direct overhead at the operation sites. See Reconciliation to IFRS on page 22. |
| (7) | Silver co-product cash cost and gold co-product cash cost include mining, processing (including smelting, refining, transportation and selling costs), and direct overhead allocated on pro-rated basis of realized metal value. See Reconciliation to IFRS on page 25. |
The acquisition of Endeavour’s third mine, the El Cubo mine in July 2012, was a good fit with Endeavour's business strategy of buying and rejuvenating struggling old mines in historic mining districts. However, unlike Guanaceví and Bolañitos, which had low throughputs and no reserves, El Cubo offered the potential to quickly become a core asset for Endeavour, already having a 1,100-tonne-per-day output and a reasonable reserve/resource mine life. Located in the southeastern part of the historic Guanajuato mining district, this producing silver and gold mine is only 15 kilometres from Endeavour’s Bolañitos project, and includes many mine adits, ramps, and shafts, as well as a 400-tonne-per-day leach plant. It also held a lease (until July 2013) on the adjacent Las Torres mine and 1,800-tonne-per-day flotation plant owned by Fresnillo PLC. Subsequent to the acquisition in Q3, 2012, Endeavour launched a $67-million, 18-month capital investment program at El Cubo to explore and develop the mine and to rebuild and expand the plant, tailings facility, water supply, electrical supply, surface buildings, and surface infrastructure. This program was substantially completed in Q2 2013 on time and within budget.
| MANAGEMENT’S DISCUSSION AND ANALYSIS |
| FOR THE YEAR ENDED DECEMBER 31, 2013 |
| |
El Cubo Production Results
Endeavour's new mine plan is focused on maintaining the current tonnage throughput at El Cubo of approximately 1,100-1,200 tpd while progressively increasing the production grades by reducing ore dilution. The Company has reorganized the mine operations team, improved supervision and operating efficiencies, improved safety policies, programs and training to reduce lost time accidents and created a Mine Rescue Team for a safer environment. The Company acquired new mining equipment,accelerated mine development and commenced underground drilling. The plant and surface infrastructure reconstruction program was completed on time and budget in Q2, 2013.
During Q2, 2013 the Company announced that the newly rebuilt plant at El Cubo was successfully re-commissioned on May 31st, reaching phase 1 operating capacity of 1,100-1,200 tpd. Work to bring the plant capacity of up to 1,500 – 1,600 tpd was completed in early Q3, 2013, allowing management to facilitate the processing up to 350 tpd of additional ore from the Bolañitos mine. More than 600,000 hours of work were completed on the plant and infrastructure with no lost time accidents, an accomplishment of which the Company is particularly proud. Due to the successful re-commissioning of the El Cubo plant, Endeavour returned the nearby leased Las Torres plant to its owner, Fresnillo PLC, on July 22, 2013.
Three months ended December 31, 2013 (compared to the three months ended December 31, 2012)
Silver production at the El Cubo mine was 372,124 oz in Q4, 2013, an increase of 88% compared to 198,145 oz in Q4, 2012 and gold production was 5,269 oz in Q4, 2013, an increase of 66% compared to 3,169 oz in Q4, 2012. Plant throughput in Q4, 2013 was 99,178 tonnes at average grades of 118 gpt silver and 1.77 gpt gold, compared to 90,175 tonnes grading 96 gpt silver and 1.42 gpt gold in Q4, 2012. The rise year over year was due to the successful implementation of Endeavour’s turn around initiatives. In Q3, 2013, metal production jumped as management turned its focus from the re-construction of the site infrastructure to the optimization of the operations, which continued in Q4, 2013. The Company continues to focus on ensuring that safe, sustainable mining methods will become part of the culture which will lead to improved operating efficiencies. Silver and gold recoveries were both anomalously higher quarter over quarter with additional material flushed from the leach circuit in Q4, 2013 and solely selling a concentrate in Q4 2013. Selling concentrate as opposed to producing doré at the El Cubo plant will increase recoveries going forward. Selling concentrate results in higher payable metal production and higher refining charges, resulting in a net financial benefit. Management expects recoveries to return to be approximately 90% going forward.
Year ended December 31, 2013 (compared to the year ended December 31, 2012)
Silver production at the El Cubo mine was 1,159,026 oz in 2013, an increase of 281% compared to 304,405 oz in 2012 and gold production was 17,142 oz in 2013, an increase of 250% compared to 4,893 oz in 2012. Plant throughput in 2013 was 391,354 tonnes at average grades of 107 gpt silver and 1.57 gpt gold and was 170,725 tonnes grading 94 gpt silver and 1.42 gpt gold in 2012 (not comparable because 2012 production started in July 2012, post-acquisition). The rise year over year was due to owning the assets for the entire fiscal year along with the successful implementation of Endeavour’s turn around initiatives. The Company continues to focus on ensuring that safe, sustainable mining methods will become part of the culture which over time leads to improved operating efficiencies. Metal grades and recoveries have both trended higher since acquisition. Selling concentrate as opposed to producing doré at the El Cubo plant will increase recoveries going forward. Selling concentrate results in higher payable metal production and higher refining charges, resulting in a net financial benefit. Management expects recoveries to return to be approximately 90% going forward.
El Cubo Operating Costs
Three months ended December 31, 2013 (compared to the three months ended December 31, 2012)
Per tonne costs fell 15% quarter over quarter as reorganization plans have taken effect. The Company significantly cut head count in Q2 and Q3 2013, while increasing mined tonnes. Cash costs per ounce net of by-product credits, which is a non-IFRS measure and a standard of the Silver Institute, dropped sharply to $6.65 per ounce of payable silver compared to $38.52 in the same period in 2012. The lower cost per tonne, improved grades and recoveries significantly improved the cash costs on a by-product basis offset by the lower gold price. All-in sustaining costs fell as mine development and exploration expenditures were allocated to significantly higher production. The Company continues to invest in mine development and exploration at El Cubo in order to improve the long term viability of the operation.
| MANAGEMENT’S DISCUSSION AND ANALYSIS |
| FOR THE YEAR ENDED DECEMBER 31, 2013 |
| |
Year ended December 31, 2013 (compared to the year ended December 31, 2012)
Per tonne costs remained relatively consistent year over year. Significant severance costs, training and safety initiatives spending and costs related to the implementation of new processes and procedures were offset by the additional production. Cash costs per ounce net of by-product credits, which is a non-IFRS measure and a standard of the Silver Institute, fell to $18.77 per ounce of payable silver compared to $35.27. Improved grades and recoveries significantly improved the cash costs on a by-product basis. All-in sustaining costs fell as mine development and exploration expenditures were allocated to higher production. The Company continues to invest in mine development and exploration at El Cubo in order to improve the long term viability of the operation.
Exploration Results
In January 2013, Endeavour commenced an aggressive $16.3 million surface exploration drill program to test multiple exploration targets at its three mining districts and five district scale exploration properties. A total of 78,500 metres of surface drilling was planned to test approximately 24 exploration targets. During Q2, 2013, the sharp drop in precious metal prices prompted management to reduce the size of the remaining 2013 exploration program by 25%. Endeavour ended up drilling 178 holes totaling 62,000 metres in 2013 for total expenditures of $12.8 million.
At Bolañitos, the Company drilled 15,337 metres in 51 holes to discover high-grade, gold-silver vein mineralization in the historic La Luz, LL-Asuncion and Plateros veins. Each of the three new mineralized zones is about 200 m long by 100 m deep. The La Luz and Asuncion mineralized zones appear to lie along strike from each other about 900 m apart, suggesting that significant exploration potential remains to be tested in between them. Both mineralized zones are readily accessible for mining from nearby historic workings and underground development is now underway to provide access to these two areas via the operating Asuncion shaft. In 2014, Bolañitos exploration will focus on drilling five high priority brownfields targets northwest and southeast of the mine.
At Guanaceví, the Company drilled 9,910 metres in 19 holes testing the Milache property six kilometres northwest of the plant to more fully delineate the high-grade, silver-gold mineralization over a 300 metre by 300 metre area discovered in the Santa Cruz vein. Management is currently evaluating alternatives for underground development at Milache to commence in 2014 so that production can commence in 2015. In 2014, Guanaceví exploration will focus on drilling a high priority brownfields target southeast of the mine.
At El Cubo, the Company drilled 18,450 metres in 47 holes to discover new high-grade, gold-silver vein mineralization in the historic Villalpando, V-Asuncion and Dolores veins. Drilling at Dolores helped to extend and define the hanging-wall and footwall vein ore-bodies that are currently in production. Drilling in the Villalpando and V-Asuncion veins, discovered in late 2012 and fast-tracked to production last year, successfully extended this newly discovered mineralized zone over 900 m in strike length, still open for expansion. In 2014, exploration will focus on five high-priority brownfield targets northwest and southeast of the mine.
At San Sebastián, the Company released an initial mineral resource estimate for the San Sebastián property that included an indicated resource totaling 1,835,000 tonnes with grades of 193 gpt silver and 1.17 gpt gold containing 11.4 million oz silver and 69,300 oz gold, and an inferred resource totaling 3,095,000 tonnes with grades of 196 gpt silver and 1.39 gpt gold containing 19.5 million oz silver and 138,100 oz gold. During 2013, the Company drilled 8,574 m in 30 holes at San Sebastián to infill and extend the recently discovered, thick, high-grade silver-gold mineralization in the Terronera vein over a 900 m long by 300 m deep portion of the four kilometre long Terronera vein, which is still open for expansion.In 2014, exploration will focus on drilling two high priority target areas to extend the high-grade silver-gold mineralization along strike to the northwest and southeast of the current resource area in the Terronera vein.
At the Panuco-Laberinto property in Durango State, Mexico, drilling intersected geologically interesting but sub-economic results. The Panuco property is sandwiched between the La Preciosa property of Orko Silver to the southeast and the San Lucas property of Oremex Silver to the northwest, which was optioned in 2012. The Panuco property has exploration potential both for bulk tonnage, open pit and high-grade, underground silver-gold deposits. The Company is currently assessing the remaining exploration potential of this area.
| MANAGEMENT’S DISCUSSION AND ANALYSIS |
| FOR THE YEAR ENDED DECEMBER 31, 2013 |
| |
At the El Inca-San Julian properties in northern Chile, surface mapping and target identification were completed and drilling commenced in 2013. The El Inca-San Julian properties have exploration potential for both bulk tonnage, open pit silver-lead-zinc mines like San Cristobal, high-grade, underground silver-gold mines like El Penon (south of El Inca in Chile) and open pit, porphyry copper mines like Chuquicamata. The drilling confirmed the geological potential for a bulk tonnage target, but did no intersect economic mineralization during the first phase of drilling. The Company is currently assessing the remaining exploration potential of this area.
Reserves and Resources
The updated NI 43-101 reserve and resource estimates to December 31, 2013 include the Guanacevi Mine in Durango state, the Bolañitos Mine in Guanajuato state, the El Cubo Mines in Guanajuato state, the Parral project in Chihuahua state, the Arroyo Seco project in the Michoacan state, the Guadelupe y Calvo project in Chihuahua state and the San Sebastián project in Jalisco State.
The Company completed an updated internal estimate of the reserves and resources as of December 31, 2013 for the Guanacevi, Bolañitos, the El Cubo Mines and the San Sebastián project. The Qualified Person for reporting for the four updated estimates is Mike Munroe, MSc, SME Registered Member 4151306RM, an employee of the Company. The Guanacevi, Bolañitos, El Cubo and San Sebastián technical reports will be filed on or before March 31, 2014.
The Company previously retained Micon, to audit the resources to December 15, 2012 for the Guadelupe y Calvo project. The Qualified Persons for reporting for this project are Charley Z. Murahwi, M.Sc., P.Geo, FAusIMM and Alan J. San Martin MAusIMM(CP).
The Company retained Micon, to audit the updated resources to December 31, 2010, based on the then current metal prices for the Parral Project (El Cometa Property). The Qualified Persons for reporting the Parral resources are William J. Lewis, B.Sc., P.Geo, Charley Z. Murahwi, M.Sc., P.Geo, FAusIMM and Dibya Kanti Mukhopadhyay, M.Sc., MAusIMM., who are Micon employees.
The Qualified Persons for reporting the Arroyo Seco resources as of December 31, 2010 are David St Clair Dunn, P.Geo, who is a geological consultant and Barry Devlin, P.Geo who was the Company’s Vice President of Exploration at the time of the report’s preparation.
The reserve and resource statements for the Guanacevi, Bolañitos, El Cubo, Parral, Guadalupe y Calvo, San Sebastián and Arroyo Seco Projects were classified using the definitions and guidelines of the Canadian Institute of Mining, Metallurgy and Petroleum CIM standards on Mineral Resources and Reserves (CIM Standards) and the guidelines of NI 43-101.
| MANAGEMENT’S DISCUSSION AND ANALYSIS |
| FOR THE YEAR ENDED DECEMBER 31, 2013 |
| |
| Silver-Gold Reserves & Resources (as of December 31, 2013) |
| Reserves | Tonnes | Ag g/t | Au g/t | Ag oz | Au oz |
| Guanacevi | 327,800 | 281 | 0.51 | 2,961,900 | 5,300 |
| Bolanitos | 380,530 | 156 | 2.50 | 1,910,300 | 30,500 |
| El Cubo | 752,500 | 138 | 2.16 | 3,330,300 | 52,200 |
| Total Proven | 1,460,830 | 175 | 1.87 | 8,202,500 | 88,000 |
| Guanacevi | 34,600 | 342 | 0.46 | 380,800 | 500 |
| Bolanitos | 98,300 | 134 | 2.17 | 424,200 | 6,800 |
| El Cubo | 615,400 | 131 | 2.23 | 2,595,700 | 44,100 |
| Total Probable | 748,300 | 141 | 2.14 | 3,400,700 | 51,400 |
| Total Proven & Probable | 2,209,130 | 163 | 1.96 | 11,603,200 | 139,400 |
| | | | | | |
| Resources | Tonnes | Ag g/t | Au g/t | Ag oz | Au oz |
| Guanacevi | 132,000 | 163 | 0.29 | 11,603,200 | 139,400 |
| Bolanitos | 75,900 | 132 | 1.39 | 322,800 | 3,400 |
| El Cubo | 660,100 | 158 | 2.87 | 3,357,800 | 60,800 |
| Total Measured | 868,000 | 183 | 2.35 | 777,200 | 203,600 |
| Guanacevi | 1,701,200 | 242 | 0.57 | 13,221,400 | 31,500 |
| Bolanitos | 1,191,800 | 111 | 1.95 | 4,263,300 | 74,700 |
| El Cubo | 1,570,500 | 144 | 2.06 | 7,263,100 | 104,200 |
| San Sebastian | 2,476,000 | 229 | 1.08 | 18,216,200 | 86,300 |
| Guadalupe y calvo | 1,861,000 | 119 | 2.38 | 7,147,300 | 142,500 |
| Total Indicated | 8,800,500 | 177 | 1.55 | 50,111,300 | 439,200 |
| Total Measured & Indicated | 9,668,500 | 176 | 1.62 | 54,569,100 | 504,700 |
| | | | | | |
| Guanacevi | 1,155,100 | 253 | 0.46 | 9,384,300 | 17,100 |
| Bolanitos | 2,145,150 | 140 | 1.62 | 9,642,100 | 111,720 |
| El Cubo | 1,477,900 | 163 | 3.40 | 7,729,500 | 130,100 |
| San Sebastian | 2,376,000 | 175 | 1.66 | 13,390,600 | 126,800 |
| Guadalupe y calvo | 154,000 | 94 | 2.14 | 464,600 | 10,600 |
| Total Inferred | 7,308,150 | 173 | 1.69 | 40,611,100 | 396,320 |
| Silver-Lead-Zinc Reserves & Resources (as of September 30, 2013) |
| Resources | Tonnes | Ag g/t | Au g/t | Ag oz | Au oz |
| Guanacevi | 655,000 | 166 | 0.21 | 3,495,700 | 4,400 |
| Parral | 1,631,000 | 49 | 0.90 | 2,589,900 | 47,200 |
| Total Indicated | 2,286,000 | 83 | 0.70 | 6,085,600 | 51,600 |
| Guanacevi | 646,000 | 129 | 0.15 | 2,687,300 | 3,100 |
| Bolanitos | 1,303,000 | 63 | 0.88 | 2,658,900 | 36,900 |
| El Cubo | 738,000 | 220 | 0.07 | 5,220,000 | 1,700 |
| Total Inferred | 2,687,000 | 122 | 0.48 | 10,566,200 | 41,700 |
| MANAGEMENT’S DISCUSSION AND ANALYSIS |
| FOR THE YEAR ENDED DECEMBER 31, 2013 |
| |
Key
| | 1. | Reserve cut-off at Guanacevi is 217 g/t Silver equivalents |
| | 2. | Reserve cut-off at Bolañitos is 155 g/t Silver equivalents |
| | 3. | Reserve cut off at El Cubo is 130 g/t Silver equivalents |
| | 4. | Mining width is 1.8 metres at Guanacevi |
| | 5. | Mining width of 2.0 metres at Bolañitos |
| | 6. | Mining width of 0.8 metres at El Cubo |
| | 7. | At Guanacevi dilution is 15% after it has been diluted to a minimum mining width if required |
| | 8. | At Bolañitos dilution is 15% on cut and fill and 25% on long-hole mining methods after it has been diluted to a minimum width if required |
| | 9. | At El Cubo, inclusive of dilution to minimum mining width is 75%. |
| | 10. | Resource cut-off for operations are 100 g/t Ag equivalent |
| | 11. | Reserve and Resource Silver equivalent is 60:1 for Silver to Gold |
| | 12. | Resource cut off for the San Sebastián property is 100 g/t Ag equivalent |
| | 13. | Resource cut off for the Guadalupe y Calvo property is 100 g/t Ag equivalent |
| | 14. | At the Parral project a cut-off using NSR of $40 is used with the prices listed below |
| | 15. | The cut-off used for Arroyo Seco was 100 g/t Ag |
Net Smelter Return (NSR) Cut-off Parameters for the Parral Project
| Description | Parameter | Description | Parameter |
| Gold Price | US $1,000/oz | Gold Recovery (Overall) | 75% |
| Silver Price | US $16/oz | Silver Recovery (Overall) | 71% |
| Lead Price | US $0.65/lb | Lead Recovery (Overall) | 80% |
| Zinc Price | US $0.65/lb | Zinc Recovery (Overall) | 74% |
| Smelter Terms | Generic Contract | | |
Consolidated Financial Results
Three months ended December 31, 2013 (compared to the three months ended December 31, 2012)
For the three-month period ended December 31, 2013, the Company’s mine operating earnings were $9.9 million (Q4, 2012: $17.9 million) on sales of $67.9 million (Q4, 2012: $66.7 million) with cost of sales of $58.0 million (Q4, 2012: $48.8 million).
The operating loss in Q4, 2013 was $129.6 million (Q4, 2012:operating earnings of $10.5 million) after exploration costs of $2.1 million (Q4, 2012: $3.8 million), general and administrative costs of $2.2 million (Q4, 2012: $3.6 million) and an impairment of non-current assets and goodwill of $135.1 million (Q4, 2012: nil)
The loss before taxes in Q4, 2013 was $133.8 million (Q4, 2012: earnings before taxes of $17.3 million) after mark-to-market gain on derivative liabilities (see adjusted earnings comment on page 20) of $0.6 million (Q4, 2012: $1.7 million), a foreign exchange loss of $0.4 million (Q4, 2012: gain of $0.5 million), a mark-to-market gain on contingent liabilities of $0.6 million (Q4, 2012: $4.4 million), investment and other loss of $4.7 million (Q4, 2012: income of $0.3 million) and finance costs of $0.4 million (Q4, 2012: $0.3 million). As at December 31, 2013, the Company determined there were several indicators of potential impairment of its producing mineral properties which include the sustained decline in precious metal prices, the Mexican tax reform (see page 30) and a reduction of the Guanacevi estimated reserves and resources. The total impairment charge for the year ended December 31, 2013 is $104.3 million net of tax ($135.1 million before tax) (see page 19). The Company realized a net loss for the period of $115.8 million (Q4, 2012: net income of $19.8 million) after an income tax recovery of $18.1 million (Q4, 2012: recovery of $2.5 million).
| MANAGEMENT’S DISCUSSION AND ANALYSIS |
| FOR THE YEAR ENDED DECEMBER 31, 2013 |
| |
Sales of $67.9 million in Q4, 2013 represent a 2% increase over the $66.7 million for the same period in 2012. There was a 60% increase in silver ounces sold offset by a 38% decrease in the realized silver price resulting in flat silver sales, and there was a 45% increase in gold ounces sold with a 28% decrease in realized gold prices resulting in 5% increase in gold sales. During the period, the Company sold 2,155,326 oz silver and 18,960 oz gold, for realized prices of $20.52 and $1,246 per oz respectively, compared to sales of 1,345,832 oz silver and 13,037 oz gold, for realized prices of $32.87 and $1,725 per oz respectively, in the same period of 2012. The realized prices of silver and gold during the period were within 2% of the average silver spot price during the period of $20.82 and the average gold spot price during the period of $1,275, with differences due to the timing of sales and the mark-to-market adjustments for the concentrate sales that are pending finalization.
The Company depleted its finished goods to 51,000 oz silver and 198 oz gold at December 31, 2013 compared to 385,126 oz silver and 2,473 oz gold at September 30, 2013. The cost allocated to these finished goods was $1.0 million, compared to $10.2 million at September 30, 2013.
Cost of sales for Q4, 2013 was $58.0 million, an increase of 19% over the cost of sales of $48.8 million for the same period of 2012. The 19% increase was a result of a number of factors. The 19% increase was a result of the Company selling 38% more silver ounces, a 50% increase in amortization and depletion due to a higher depletion cost base, and various additional cost pressures at its operations, including labour.
Exploration expenses decreased in Q4, 2013 to $2.1 million from $3.8 million in the same period of 2012 based on both the timing of the exploration activities and the reduction of exploration activities in the current year. During Q2, 2013, the sharp drop in precious metal prices prompted management to reduce the size of the 2013 exploration program by 25%. General and administrative expenses decreased to $2.5 million for the period as compared to $3.6 million in the same period of 2012 primarily due to decreased corporate development costs, legal and human resource costs.
A significant number of the Company’s share purchase warrants are classified and accounted for as a financial liability at fair value with adjustments recognized through net earnings because these warrants have an exercise price denominated in a currency which is different from the functional currency of the Company. During the period, there was a mark-to-market gain on derivative liabilities (see adjusted earnings comment on page 20) of $0.6 million compared to $1.9 million gain in the same period in 2012. The gain in the current period was a reflection of the Company’s share price decreasing from CAN$4.42 at September 30, 2013 to CAN$3.84 at December 31, 2013.
The mark-to-market loss on the contingent liability was a result of a revaluation, based on the Monte Carlo model, of the contingent consideration related to the acquisition of Mexgold (El Cubo). The decrease in the gold price and movement in the forward curve resulted in a $0.6 million mark-to-market gain during Q4, 2013 while the same period in 2012 had a mark-to-market loss on the contingent liability of $4.4 million.
The Company experienced a foreign exchange loss of $0.4 million during the period compared to a gain of $0.5 million for the same period of 2012. The $0.4 million gain was primarily due to the weakening of the Mexican peso against the US dollar during the period, which resulted in lower valuations on the Mexican peso cash and receivable amounts and the Mexican peso denominated inventory amounts.
There was an income tax recovery of $18.1 million during the period compared to $2.5 million recovery for the same period of 2012. In December 2013, the Mexican President passed tax reform legislation that will be effective January 1, 2014. The tax reform includes, among other items, an increase of the Mexican corporate tax rate from 28% to 30%, removal of the flat tax regime, a Special Mining Duty of 7.5% on taxable revenues, less allowable deductions excluding interest and capital depreciation and an 0.5% Environmental Tax on gold and silver revenues. On enactment of the Special Mining Duty, the Company recognized an $18.7 million deferred income tax expense offset by the recognition of loss carry forwards that would be available with the removal of the flat tax regime for the year ended December 31, 2013. Furthermore, a result of the impairment of non-current assets the Company recognized $30.8 million deferred income tax recovery during the period.
| MANAGEMENT’S DISCUSSION AND ANALYSIS |
| FOR THE YEAR ENDED DECEMBER 31, 2013 |
| |
Year ended December 31, 2013 (compared to the year ended December 31, 2012)
For the year ended December 31, 2013, the Company’s mine operating earnings were $56.9 million (2012: $78.0 million) on sales of $276.8 million (2012: $208.1 million) with cost of sales of $219.9 million (2012: $130.1 million).
Operating loss was $102.9 million (2012: operating income of $53.6 million) after exploration costs of $13.2 million (2012: $11.2 million), general and administrative costs of $11.6 million (2012: $13.1 million) and an impairment of non-current assets and goodwill of $135.1 million (Q4, 2012: nil)
The loss before taxes was $96.0 million (2012: earnings before taxes of $60.1 million) after mark-to-market gain on derivative liabilities (see adjusted earnings comment on page 20) of $3.8 million (2012: $1.9 million), a foreign exchange expense of $2.6 million (2012: gain of $3.5 million), a mark-to-market gain on contingent liabilities of $8.4 million (2012: mark-to-market loss of $0.6 million), investment and other loss of $1.1 million (2012: income of $2.1 million) and finance costs of $1.5 million (2012: $0.5 million). As at December 31, 2013, the Company determined there were several indicators of potential impairment of its producing mineral properties which include the sustained decline in precious metal prices, the Mexican tax reform (see page XX) and a reduction of the Guanacevi estimated reserves and resources. The total impairment charge for the year ended December 31, 2013 is $104.3 million net of tax ($135.1 million before tax) (see page 19). The Company realized a net loss for the period of $89.5 million (2012: net earnings of $42.1 million) after an income tax recovery of $6.5 million (2012: provision of $18.0 million).
Sales of $276.8 million for the year represented a 33% increase over the $208.1 million for 2012. There was a 49% increase in silver ounces sold offset by a 25% decrease in the realized silver price resulting in a 11% increase in silver sales, and there was a 131% increase in gold ounces sold with 18% decrease in realized gold prices resulting in a 89% increase in gold sales. During the year, the Company sold 7,151,963 oz silver and 81,119 oz gold, for realized prices of $23.10 and $1,375 per oz respectively, compared to sales of 4,815,073 oz silver and 35,167 oz gold, for realized prices of $23.10 and $1,674 per oz respectively, in 2012. The realized prices of silver and gold during the year were within 3% of the 2013 average silver spot price of $23.79 and average gold spot price of $1,411, with differences due to the timing of sales and the mark-to-market for the concentrate sales that are pending finalization.
The Company accumulated 51,000 oz silver and 198 oz gold finished goods at December 31, 2013 compared to 611,661 oz silver and 8,934 oz gold at December 31, 2012. The cost allocated to these finished goods is $1.0 million compared to $18.7 million, net of a $1.5 million write-down of the El Cubo finished goods, at December 31, 2012.
Cost of sales for the year was $219.9 million, an increase of 69% over the cost of sales of $130.1 million for 2012. The 69% increase in the cost of sales was due to a number of factors. The Company sold 49% more silver ounces and experienced an 80% increase in amortization and depletion as the Company had higher accumulated cost bases. In addition, the Company experienced additional labour cost pressures at its operations, including severance costs during the year. Furthermore, the Company acquired the El Cubo mine in Q3, 2012, a high cost operation which had been operating at a loss in the early part of the year, resulting in a reduced gross margin on a consolidated basis. During the year the Company took inventory write downs to net realizable value (“NRV”) of $4.9 million at the El Cubo mine and $1.0 million at the Guanaceví mine. The write down for El Cubo was comprised of write downs of both finished goods and work in process inventories, while the write down for Guanaceví was comprised of finished goods at the end of reporting quarters.
Exploration expenses in 2013 increased to $13.2 million from $11.2 million in 2012 based on the timing of the exploration activities, the addition of exploration activities at the El Cubo mine and a more aggressive exploration program in early 2013. General and administrative expenses decreased to $11.6 million in 2013 compared to $13.1 million in 2012 primarily due to slightly decreased corporate development costs, legal and insurance fees and human resource costs.
A significant number of the Company’s share purchase warrants are classified and accounted for as a financial liability at fair value with adjustments recognized through net earnings because these warrants have an exercise price denominated in a currency which is different from the functional currency of the Company. During the year, there was a mark-to-market gain on derivative liabilities (see adjusted earnings comment on page 16) of $3.8 million, while the same period in 2012 had a mark-to-market gain on derivative liabilities of $1.9 million. The gain was a reflection of the Company’s share price decreasing from CAN$7.84 at December 31, 2012 to CAN$3.84 at December 31, 2013.
| MANAGEMENT’S DISCUSSION AND ANALYSIS |
| FOR THE YEAR ENDED DECEMBER 31, 2013 |
| |
The mark-to-market gain on the contingent liability was a result of a revaluation, based on the Monte Carlo model, of the contingent consideration related to the acquisition of Mexgold (El Cubo). A decrease in the gold price and movement in the forward curve resulted in an $8.4 million mark-to-market gain during 2013, while 2012 had a mark-to-market loss on the contingent liability of $0.6 million.
The Company experienced a foreign exchange loss of $2.6 million during the year compared to a gain of $3.5 million for 2012. The $2.6 million loss was primarily due to the weakening of the Mexican peso against the US dollar during the period, which resulted in lower valuations on the Mexican peso cash and receivable amounts.
There was an income tax recovery of $6.5 million in 2013 compared to an income tax expense of $18.0 million in 2012. In December 2013, the Mexican President passed tax reform legislation that will be effective January 1, 2014. The tax reform includes, among other items, an increase of the Mexican corporate tax rate from 28% to 30%, removal of the flat tax regime, a Special Mining Duty of 7.5% on taxable revenues, less allowable deductions excluding interest and capital depreciation and an 0.5% Environmental Tax on gold and silver revenues. On enactment of the Special Mining Duty, the Company recognized an $18.7 million deferred income tax expense offset by the recognition of loss carry forwards that would be available with the removal of the flat tax regime for the year ended December 31, 2013. Furthermore, a result of the impairment of non-current assets the Company recognized $30.8 million deferred income tax recovery during the period.
Impairment charge
The recoverable amounts of the Company’s cash generating units (“CGU”), which include mining properties, plant and equipment and allocated goodwill, are determined on an annual basis and circumstances result in impairment indicators. As at December 31, 2013, the Company determined there were several indicators of potential impairment of its producing mineral properties which include the sustained decline in precious metal prices, the Mexican tax reform (see page 30) and a reduction of the Guanacevi estimated reserves and resources. The recoverable amounts are based on each CGUs future cash flows expected to be derived from the Company’s mining properties and represents each CGUs fair value in use. The cash flows are determined based on the life-of-mine after tax cash flow forecast which incorporate management’s best estimates of future metal prices, production based on current estimates of recoverable reserves and resources, exploration potential, future operating costs and non-expansionary capital expenditures.
At December 31, 2013 the Company tested the recoverability of its operating assets, resulting in a detailed review of the Guanacevi and El Cubo operations. The Company forecast future operating and capital costs, analysts’ consensus pricing for the first five years of its economic model and then used a long term silver price of $22 per ounce, a long term gold price of $1,300 per ounce and a risk adjusted project specific discount rate of 8% based on the CGUs weighted average cost of capital. Due to the sensitivity of the recoverable amounts to the various factors mentioned and specifically long term metal prices as well as unforeseen factors, any significant change in the key assumptions and inputs could result in additional impairment charges in future periods.
At December 31, 2013 the carrying value related to the Guanacevi CGU was $74.8 million and net of associated deferred income tax liabilities of $15.4 million, was greater than its estimated recoverable amount of $23.1 million, calculated on a discounted cash flow basis. The Company considers use of its internal discounted cash flow economic models as a proxy for the calculation of fair value in use. Based on the above assessment, at December 31, 2013, the Company recorded an impairment charge related to the Guanacevi mine of $36.3 million, net of tax ($51.4 million before tax).
At December 31, 2013 the carrying value related to the El Cubo mine was $270.9 million, including goodwill of $39.2 million and net of associated deferred income tax liabilities of $67.5 million was greater than its estimated recoverable amount of $135.4 million, calculated on a discounted cash flow basis. The Company considers use of its internal discounted cash flow economic models as a proxy for the calculation of fair value in use. Based on the above assessment at December 31, 2013, the Company recorded an impairment charge related to the El Cubo mine of $68.0 million, net of tax, comprised of goodwill $39.2 million and non-current assets of $28.8 million ($44.4 million before tax).
| MANAGEMENT’S DISCUSSION AND ANALYSIS |
| FOR THE YEAR ENDED DECEMBER 31, 2013 |
| |
The impairment charge on mineral property plant and equipment for the year ended December 31, 2013 is $65.0 million net of tax ($95.8 million before tax) and has been recognized in the statement of Comprehensive Income (Loss) (December 31, 2012 – nil). The impairment charge on goodwill for the year ended December 31, 2013 is $39.2 million and has been recognized in the statement of Comprehensive Income (Loss) (December 31, 2012 – nil).
The Company reviewed the Bolanitos CGU for impairment, which resulted in the estimated value in use being significantly greater than its carrying value.
Selected Annual Information
| Expressed in thousands US dollars | Year ended December 31 |
| | 2013 | 2012 | 2011 |
| Revenue | $276,783 | $208,079 | $127,997 |
| Net earnings (Loss) | (89,465) | 42,117 | 18,755 |
| Basic earnings per share | (0.90) | 0.45 | 0.22 |
| Diluted earnings per share | (0.90) | 0.42 | 0.22 |
| Dividends per share | - | - | - |
| Total assets | 366,923 | 477,527 | 249,021 |
| Total long-term liabilities | 55,804 | 89,846 | 36,665 |
NON-IFRS MEASURES
Adjusted earnings and adjusted EPS are non-IFRS measures that do not have standardized meanings prescribed by IFRS and therefore may not be comparable to similar measures presented by other issuers. The Company previously issued share purchase warrants that have an exercise price denominated in a currency which is different from the functional currency of the Company. Under IFRS, the warrants are classified and accounted for as a financial liability at fair value with adjustments recognized through net earnings. These adjustments fluctuate significantly quarter to quarter primarily based on the change in the Company’s quoted share price and have a significant effect on reported earnings, while the dilutive impact remains unchanged. The Company incurred impairments on non-current assets that have a significant one time effect on reported earnings. Adjusted earnings and adjusted EPS are measures used by management to assess the performance of the operations as whole without one-time charges to appropriately compare to past performance and provided to investors as a measure of the Company’s operating performance.
| Expressed in thousands US dollars | Three months ended Dec. 31 | Year ended Dec. 31 |
| | 2013 | 2012 | 2013 | 2012 |
| Net earnings (loss) for the period | ($115,758) | $14,821 | ($89,465) | $42,117 |
| Impairment of non-current assets, net of tax | 104,283 | - | 104,283 | - |
| Mark-to-market loss/(gain) on derivative liabilities | (591) | (1,881) | (3,750) | (1,928) |
| Adjusted net earnings (loss) | ($12,066) | $12,940 | $11,068 | $40,189 |
| Basic weighted average share outstanding | 99,720,704 | 99,539,282 | 99,770,293 | 93,266,038 |
| Adjusted net earnings (loss) per share | ($0.12) | $0.13 | $0.11 | $0.43 |
Mine operating cash flow is a non-IFRS measure that does not have a standardized meaning prescribed by IFRS and therefore may not be comparable to similar measures presented by other issuers. Mine operating cash flow is calculated as revenues minus direct production costs and royalties. Mine operating cash flow is used by management to assess the performance of the mine operations, excluding corporate and exploration activities and provided to investors as a measure of the Company’s operating performance.
| MANAGEMENT’S DISCUSSION AND ANALYSIS |
| FOR THE YEAR ENDED DECEMBER 31, 2013 |
| |
| Expressed in thousands US dollars | Three months ended Dec. 31 | Year ended Dec. 31 |
| | 2013 | 2012 | 2013 | 2012 |
| Mine operating earnings operating earnings | $9,861 | $17,919 | $56,915 | $77,953 |
| Share-based compensation | 107 | 124 | 515 | 545 |
| Amortization and depletion | 15,780 | 10,517 | 53,569 | 29,694 |
| Write down (recovery) of inventory to net realizable value | 664 | 6,221 | 5,874 | 6,221 |
| Mine operating cash flow before taxes | $26,412 | $34,781 | $116,873 | $114,413 |
Operating cash flow before working capital adjustment is a non-IFRS measure that does not have a standardized meaning prescribed by IFRS and therefore may not be comparable to similar measures presented by other issuers. Operating cash flow before working capital (“WC”) adjustments is calculated as operating cash flow minus working capital adjustment. Operating cash flow before working capital adjustments is used by management to assess operating performance irrespective of working capital changes and provided to investors as a measure of the Company’s operating performance.
| Expressed in thousands US dollars | Three months ended Dec. 31 | Year ended Dec. 31 |
| | 2013 | 2012 | 2013 | 2012 |
| Cash from operating activities | $25,298 | $19,688 | $76,544 | $76,021 |
| Net changes in non-cash working capital | 7,348 | (663) | (5,041) | (6,907) |
| Operating cash flow before working capital adjustments | $17,950 | $20,351 | $81,585 | $82,928 |
Operating cash flow per share is a non-IFRS measure that does not have a standardized meaning prescribed by IFRS and therefore may not be comparable to similar measures presented by other issuers. Operating cash flow per share is calculated by dividing cash from operating activities by the weighted average shares outstanding. Operating cash flow per share is used by management and provided to investors as a measure of the Company’s operating performance.
| Expressed in thousands US dollars | Three months ended Dec. 31 | Year ended Dec. 31 |
| | 2013 | 2012 | 2013 | 2012 |
| Operating cash flow before working capital adjustments | $17,950 | $20,351 | $81,585 | $82,928 |
| Weighted average shares outstanding | 99,720,704 | 99,539,282 | 99,770,293 | 93,266,038 |
| Operating cash flow before WC changes per share | $0.18 | $0.20 | $0.82 | $0.89 |
EBITDA is a non-IFRS financial measure, which excludes the following from net earnings:
- Income tax expense;
- Finance costs;
- Amortization and depletion
Management believes EBITDA is a valuable indicator of the Company’s ability to generate liquidity by producing operating cash flow to fund working capital needs, service debt obligations, and fund capital expenditures. Management uses EBITDA for this purpose. EBITDA is also frequently used by investors and analysts for valuation purposes whereby EBITDA is multiplied by a factor or “EBITDA multiple” based on an observed or inferred relationship between EBITDA and market values to determine the approximate total enterprise value of a Company.
EBITDA is intended to provide additional information to investors and analysts and does not have any standardized definition under IFRS and should not be considered in isolation or as a substitute for measures of performance prepared in accordance with IFRS. EBITDA excludes the impact of cash costs of financing activities and taxes, and the effects of changes in operating working capital balances, and therefore is not necessarily indicative of operating profit or cash flow from operations as determined by IFRS. Other companies may calculate EBITDA differently.
| MANAGEMENT’S DISCUSSION AND ANALYSIS |
| FOR THE YEAR ENDED DECEMBER 31, 2013 |
| |
| Expressed in thousands US dollars | Three months ended Dec. 31 | Year ended Dec. 31 |
| | 2013 | 2012 | 2013 | 2012 |
| Net earnings (loss) for the period | ($115,758) | $14,821 | ($89,465) | $42,117 |
| Amortization and depletion – cost of sales | 15,780 | 10,517 | 53,569 | 29,694 |
| Amortization and depletion – exploration | 37 | 30 | 138 | 121 |
| Amortization and depletion – general & admin | 57 | 52 | 191 | 138 |
| Finance costs | 422 | 293 | 1,513 | 484 |
| Current income tax expense | 5,042 | 5,931 | 13,970 | 15,834 |
| Deferred income tax expense (recovery) | (23,100) | (3,460) | (20,464) | 2,135 |
| Impairment of non-current assets and goodwill | 140,541 | - | 140,541 | - |
| Earnings before interest, taxes and amortization | $23,021 | $28,184 | $99,993 | $90,523 |
Cash costs per ounce, total production costs per ounce and direct production costs per tonne are measures developed by precious metals companies in an effort to provide a comparable standard; however, there can be no assurance that Endeavour’s reporting of these non-IFRS measures are similar to those reported by other mining companies. Cash costs per ounce, production costs per ounce and direct production costs per tonne are measures used by the Company to manage and evaluate operating performance at each of the Company’s operating mining units, and are widely reported in the silver mining industry as a benchmark for performance, but do not have a standardized meaning and are disclosed in addition to IFRS measures. The following tables provide a detailed reconciliation of these measures to Endeavour’s cost of sales, as reported in the Company’s consolidated financial statements.
| Expressed in thousands US dollars | Three Months Ended December 31, 2013 | Three Months Ended December 31, 2012 |
| | Guanacevi | Bolanitos | El Cubo | Total | Guanacevi | Bolanitos | El Cubo | Total |
| Direct production costs | $17,627 | $12,183 | $11,401 | $41,211 | $12,839 | $9,986 | $11,989 | $34,814 |
| Royalties | 235 | - | - | 235 | 469 | - | - | 469 |
| Opening finished goods | (4,651) | (589) | (2,057) | (7,297) | (3,891) | (8,183) | (3,971) | (16,045) |
| NRV cost adjustment | - | - | (434) | (434) | - | - | - | - |
| Closing finished goods | 650 | - | 60 | 710 | 1,626 | 10,442 | 4,696 | 16,764 |
| Direct production costs | 13,861 | 11,594 | 8,970 | 34,425 | 11,043 | 12,245 | 12,714 | 36,002 |
| By-product gold sales | (3,628) | (11,887) | (8,117) | (23,632) | (2,922) | (14,442) | (5,125) | (22,489) |
| Opening gold inventory fair market value | 1,025 | 689 | 1,565 | 3,279 | 1,669 | 13,070 | 1,527 | 16,266 |
| Closing gold inventory fair market value | (94) | - | (144) | (238) | (455) | (12,789) | (1,560) | (14,804) |
| Cash costs net of by-product | 11,164 | 396 | 2,274 | 13,834 | 9,335 | (1,916) | 7,556 | 14,975 |
| Amortization and depletion | 5,917 | 2,603 | 7,230 | 15,750 | 4,170 | 1,796 | 4,552 | 10,518 |
| Stock-based compensation | 35 | 35 | 35 | 105 | 7 | 6 | 111 | 124 |
| Opening finished goods depletion | (1,545) | (162) | (1,222) | (2,929) | (1,700) | (1,771) | (3,381) | (6,852) |
| NRV cost adjustment | - | - | - | - | - | - | - | - |
| Closing finished goods depletion | 220 | - | 92 | 312 | 444 | 2,699 | 1,176 | 4,319 |
| Total production costs | $15,791 | $2,872 | $8,409 | $27,072 | $12,256 | $814 | $10,014 | $23,084 |
| | | | | | | | | |
| Throughput tonnes | 121,008 | 159,294 | 99,178 | 379,480 | 110,763 | 161,841 | 90,175 | 362,779 |
| Payable silver ounces | 852,880 | 660,113 | 342,115 | 1,855,108 | 513,025 | 513,487 | 196,193 | 1,222,705 |
| | | | | | | | | |
| Cash costs per ounce | $13.09 | $0.60 | $6.65 | $7.46 | $18.20 | ($3.73) | $38.52 | $12.25 |
| Total production costs per oz | $18.51 | $4.35 | $24.58 | $14.59 | $23.89 | $1.59 | $51.04 | $18.88 |
| Direct production costs per tonne | $114.55 | $72.78 | $90.44 | $90.72 | $99.70 | $75.66 | $105.30 | $90.39 |
| MANAGEMENT’S DISCUSSION AND ANALYSIS |
| FOR THE YEAR ENDED DECEMBER 31, 2013 |
| |
| Expressed in thousands US dollars | Year Ended December 31, 2013 | Year Ended December 31, 2012 |
| | Guanacevi | Bolanitos | El Cubo | Total | Guanacevi | Bolanitos | El Cubo | Total |
| Direct production costs | $48,003 | $66,923 | $43,657 | $158,583 | $47,802 | $29,588 | $14,410 | $91,800 |
| Royalties | 1,328 | - | - | 1,328 | 1,866 | - | - | 1,866 |
| Opening finished goods | (1,626) | (10,442) | (2,305) | (14,373) | (7,865) | (4,636) | - | (12,501) |
| NRV cost adjustment | - | - | 2,934 | 2,934 | - | - | - | - |
| Closing finished goods | 650 | - | 60 | 710 | 1,626 | 10,442 | 4,696 | 16,764 |
| Direct production costs | 48,355 | 56,481 | 44,346 | 149,182 | 43,429 | 35,394 | 19,106 | 97,929 |
| By-product gold sales | (9,419) | (77,152) | (24,987) | (111,558) | (14,064) | (37,884) | (6,917) | (58,865) |
| Opening gold inventory fair market value | 455 | 12,789 | 1,560 | 14,804 | 1,577 | 6,701 | NA | 8,278 |
| Closing gold inventory fair market value | (94) | 0 | (144) | (238) | (455) | (12,789) | (1,560) | (14,804) |
| Cash costs net of by-product | 39,297 | (7,882) | 20,775 | 52,190 | 30,487 | (8,578) | 10,629 | 32,538 |
| Amortization and depletion | 15,929 | 13,962 | 23,648 | 53,539 | 14,112 | 10,172 | 5,411 | 29,695 |
| Stock-based compensation | 172 | 172 | 171 | 515 | 211 | 223 | 111 | 545 |
| NRV cost adjustment | - | - | 1,237 | 1,237 | - | - | - | - |
| Opening finished goods depletion | (444) | (2,698) | (1,176) | (4,318) | (1,830) | (4,005) | - | (5,835) |
| Closing finished goods depletion | 220 | - | 92 | 312 | 444 | 2,699 | 1,176 | 4,319 |
| Total production costs | $55,174 | $3,554 | $44,747 | $103,475 | $43,424 | $511 | $17,327 | $61,262 |
| | | | | | | | | |
| Throughput tonnes | 435,922 | 710,708 | 391,354 | 1,537,984 | 418,277 | 476,687 | 170,725 | 1,065,689 |
| Payable silver ounces | 2,744,505 | 2,742,499 | 1,106,801 | 6,593,805 | 2,487,813 | 1,651,446 | 301,360 | 4,440,619 |
| | | | | | | | | |
| Cash costs per ounce | $14.32 | ($2.87) | $18.77 | $7.92 | $12.25 | ($5.20) | $35.27 | $7.33 |
| Total production costs per oz | $20.10 | $1.30 | $40.43 | $15.69 | $17.45 | $0.31 | $57.50 | $13.80 |
| Direct production costs per tonne | $110.93 | $79.47 | $113.31 | $97.00 | $103.83 | $74.25 | $117.17 | $92.74 |
All-in sustaining costs per ounce and all-in costs per ounces are measures developed by the World Gold Council in an effort to provide a comparable standard within the precious metal industry; however, there can be no assurance that Endeavour’s reporting of these non-IFRS measures are similar to those reported by other mining companies. These measures are used by the Company to manage and evaluate operating performance at each of the Company’s operating mining units and consolidated group, and are widely reported in the silver mining industry as a benchmark for performance, but do not have a standardized meaning and are disclosed in addition to IFRS measures. The following tables provide a detailed reconciliation of these measures to Endeavour’s cost of sales, as reported in the Company’s consolidated financial statements.
| MANAGEMENT’S DISCUSSION AND ANALYSIS |
| FOR THE YEAR ENDED DECEMBER 31, 2013 |
| |
| Expressed in thousands US dollars | Three Months Ended December 31, 2013 | Three Months Ended December 31, 2012 |
| | Guanacevi | Bolanitos | El Cubo | Total | Guanacevi | Bolanitos | El Cubo | Total |
| Cash costs | $11,164 | $396 | $2,274 | $13,834 | $9,335 | ($1,916) | $7,556 | $14,975 |
| Operations stock based compensation | 35 | 35 | 35 | 105 | 7 | 6 | 111 | 124 |
| Corporate general and administrative | 732 | 567 | 294 | 1,593 | 1,110 | 1,111 | 425 | 2,646 |
| Corporate stock based compensation | 264 | 204 | 106 | 574 | 367 | 367 | 140 | 874 |
| Reclamation - amortization/accretion | 4 | 1 | 4 | 9 | 5 | 2 | 6 | 13 |
| Mine site expensed exploration | 149 | 423 | 940 | 1,512 | 666 | 1,631 | 102 | 2,399 |
| Capital expenditures sustaining | 2,514 | 3,441 | 2,831 | 8,786 | 4,674 | 4,789 | 3,811 | 13,274 |
| All In Sustaining Costs | $14,862 | $5,067 | $6,484 | $26,413 | $16,164 | $5,990 | $12,151 | $34,305 |
| Growth exploration | | | | 159 | | | | 989 |
| Growth capital expenditures | | | | 3,385 | | | | 4,975 |
| All In Costs | | | | $29,957 | | | | $40,269 |
| Throughput tonnes | 121,008 | 159,294 | 99,178 | 379,480 | 110,763 | 161,841 | 90,175 | 362,779 |
| Payable silver ounces | 852,880 | 660,113 | 342,115 | 1,855,108 | 513,025 | 513,487 | 196,193 | 1,222,705 |
| Sustaining cost per ounce | $17.43 | $7.68 | $18.95 | $14.24 | $31.51 | $11.67 | $61.93 | $28.06 |
| All In costs per ounce | | | | $16.15 | | | | $32.93 |
| Expressed in thousands US dollars | Year Ended December 31, 2013 | Year Ended December 31, 2012 |
| | Guanacevi | Bolanitos | El Cubo | Total | Guanacevi | Bolanitos | El Cubo | Total |
| Cash costs | $39,297 | ($7,882) | $20,775 | $52,190 | $30,487 | ($8,578) | $10,629 | $32,538 |
| Operations stock based compensation | 172 | 172 | 171 | 515 | 211 | 223 | 111 | 545 |
| Corporate general and administrative | 3,552 | 2,887 | 1,165 | 7,604 | 5,108 | 3,391 | 619 | 9,117 |
| Corporate stock based compensation | 1,198 | 1,197 | 483 | 2,879 | 2,174 | 1,443 | 263 | 3,881 |
| Reclamation - amortization/accretion | 16 | 4 | 19 | 39 | 15 | 5 | 12 | 32 |
| Mine site expensed exploration | 1,779 | 2,505 | 2,222 | 6,506 | 2,346 | 1,761 | 730 | 4,837 |
| Capital expenditures sustaining | 15,866 | 21,397 | 13,727 | 50,990 | 19,330 | 21,732 | 10,397 | 51,459 |
| All In Sustaining Costs | $61,881 | $20,280 | $38,562 | $120,723 | $59,671 | $19,977 | $22,761 | $102,409 |
| Growth exploration | | | | 4,404 | | | | 6,227 |
| Growth capital expenditures | | | | 27,946 | | | | 14,777 |
| All In Costs | | | | $153,073 | | | | $123,413 |
| Throughput tonnes | 435,922 | 710,708 | 391,354 | 1,537,984 | 418,277 | 476,687 | 170,725 | 1,065,689 |
| Payable silver ounces | 2,744,505 | 2,742,499 | 1,106,801 | 6,593,805 | 2,487,813 | 1,651,446 | 301,360 | 4,440,619 |
| Sustaining cost per ounce | $22.55 | $7.39 | $34.84 | $18.31 | $23.99 | $12.10 | $75.53 | $23.06 |
| All In costs per ounce | | | | $23.21 | | | | $27.79 |
Silver co-product cash costs and gold co-product cash costs are measures used by the Company to manage and evaluate operating performance at each of the Company’s operating mining units and consolidated group , but do not have a standardized meaning and are disclosed in addition to IFRS measures. The following tables provide a detailed reconciliation of these measures to Endeavour’s cost of sales, as reported in the Company’s consolidated financial statements.
| MANAGEMENT’S DISCUSSION AND ANALYSIS |
| FOR THE YEAR ENDED DECEMBER 31, 2013 |
| |
| Expressed in thousands US dollars | Three Months Ended December 31, 2013 | Three Months Ended December 31, 2012 |
| | Guanacevi | Bolanitos | El Cubo | Total | Guanacevi | Bolanitos | El Cubo | Total |
| Direct production costs | $17,627 | $12,183 | $11,401 | $41,211 | $12,839 | $9,986 | $11,989 | $34,814 |
| Royalties | 235 | - | - | 235 | 469 | - | - | 469 |
| Opening finished goods | (4,651) | (589) | (2,057) | (7,297) | (3,891) | (8,183) | (3,971) | (16,045) |
| NRV cost adjustment | - | - | (434) | (434) | - | - | - | - |
| Closing finished goods | 650 | - | 60 | 710 | 1,626 | 10,442 | 4,696 | 16,764 |
| Direct production costs | 13,861 | 11,594 | 8,970 | 34,425 | 11,043 | 12,245 | 12,714 | 36,002 |
| | | | | | | | | |
| Silver production | 861,495 | 698,098 | 372,124 | 1,931,717 | 518,207 | 518,674 | 198,145 | 1,235,026 |
| Average realized silver price | 20.52 | 20.52 | 20.52 | 20.52 | 32.87 | 32.87 | 32.87 | 32.87 |
| Silver value | 17,677,877 | 14,324,971 | 7,635,984 | 39,638,833 | 17,033,464 | 17,048,814 | 6,513,026 | 40,595,305 |
| | | | | | | | | |
| Gold production | 2,275 | 10,142 | 5,269 | 17,686 | 1,088 | 8,660 | 3,169 | 12,917 |
| Average realized gold price | 1,246 | 1,246 | 1,246 | 1,246 | 1,725 | 1,725 | 1,725 | 1,725 |
| Gold value | 2,834,650 | 12,636,932 | 6,565,174 | 22,036,756 | 1,876,800 | 14,938,500 | 5,466,525 | 22,281,825 |
| | | | | | | | | |
| Total metal value | 20,512,527 | 26,961,903 | 14,201,158 | 61,675,589 | 18,910,264 | 31,987,314 | 11,979,551 | 62,877,130 |
| Pro-rated silver costs | 86% | 53% | 54% | 64% | 90% | 53% | 54% | 65% |
| Pro-rated gold costs | 14% | 47% | 46% | 36% | 10% | 47% | 46% | 35% |
| | | | | | | | | |
| Silver co-product cash costs | $13.87 | $8.82 | $12.96 | $11.45 | $19.20 | $12.58 | $34.89 | $18.82 |
| Gold co-product cash costs | $842 | $536 | $787 | $695 | $1,007 | $660 | $1,831 | $988 |
| Expressed in thousands US dollars | Year Ended December 31, 2013 | Year Ended December 31, 2012 |
| | Guanacevi | Bolanitos | El Cubo | Total | Guanacevi | Bolanitos | El Cubo | Total |
| Direct production costs | $48,003 | $66,923 | $43,657 | $158,583 | $47,802 | $29,588 | $14,410 | $91,800 |
| Royalties | 1,328 | - | - | 1,328 | 1,866 | - | - | 1,866 |
| Opening finished goods | (1,626) | (10,442) | (2,305) | (14,373) | (7,865) | (4,636) | - | (12,501) |
| NRV cost adjustment | - | - | 2,934 | 2,934 | - | - | - | - |
| Closing finished goods | 650 | - | 60 | 710 | 1,626 | 10,442 | 4,696 | 16,764 |
| Direct production costs | 48,355 | 56,481 | 44,346 | 149,182 | 43,429 | 35,394 | 19,106 | 97,929 |
| | | | | | | | | |
| Silver production | 2,772,227 | 2,881,816 | 1,159,026 | 6,813,069 | 2,512,943 | 1,668,128 | 304,405 | 4,485,476 |
| Average realized silver price | 23.10 | 23.10 | 23.10 | 23.10 | 30.31 | 30.31 | 28.72 | 30.26 |
| Silver value | 64,038,444 | 66,569,950 | 26,773,501 | 157,381,894 | 76,167,302 | 50,560,960 | 8,742,512 | 135,730,504 |
| | | | | | | | | |
| Gold production | 6,784 | 51,652 | 17,142 | 75,578 | 7,874 | 25,920 | 4,893 | 38,687 |
| Average realized gold price | 1,375 | 1,375 | 1,375 | 1,375 | 1,645 | 1,645 | 1,637 | 1,644 |
| Gold value | 9,328,000 | 71,021,500 | 23,570,250 | 103,919,750 | 12,952,730 | 42,638,400 | 8,009,841 | 63,601,428 |
| | | | | | | | | |
| Total metal value | 73,366,444 | 137,591,450 | 50,343,751 | 261,301,644 | 89,120,032 | 93,199,360 | 16,752,353 | 199,331,932 |
| Pro-rated silver costs | 87% | 48% | 53% | 60% | 85% | 54% | 52% | 68% |
| Pro-rated gold costs | 13% | 52% | 47% | 40% | 15% | 46% | 48% | 32% |
| | | | | | | | | |
| Silver co-product cash costs | $15.22 | $9.48 | $20.35 | $13.19 | $14.77 | $11.51 | $32.76 | $14.87 |
| Gold co-product cash costs | $906 | $564 | $1,211 | $785 | $802 | $625 | $1,867 | $808 |
| MANAGEMENT’S DISCUSSION AND ANALYSIS |
| FOR THE YEAR ENDED DECEMBER 31, 2013 |
| |
SUMMARY OF QUARTERLY RESULTS AND TRENDS
The following table presents selected financial information for each of the most recent eight quarters:
(tables in thousands of US dollars except per share amounts)
| | | 2013 | | | 2012 | |
| Quarterly Results | Q4 | Q3 | Q2 | Q1 | Q4 | Q3 | Q2 | Q1 |
| Revenue | $67,857 | $67,803 | $71,250 | $69,873 | $66,719 | $51,880 | $40,434 | $49,046 |
| Direct cost | 41,210 | 35,739 | 44,746 | 36,887 | 34,814 | 24,485 | 15,890 | 16,611 |
| Royalties | 235 | 287 | 356 | 450 | 469 | 454 | 482 | 461 |
| Mine operating cash flow | 26,412 | 31,777 | 26,148 | 32,536 | 31,436 | 26,941 | 24,062 | 31,974 |
| Share-based compensation | 107 | 131 | 202 | 75 | 124 | 146 | 216 | 59 |
| Amortization and depletion | 15,780 | 12,566 | 13,149 | 12,074 | 10,517 | 6,353 | 4,328 | 8,496 |
| Write down on inventory | 664 | (2,668) | 6,383 | 1,495 | 2,876 | 3,345 | - | - |
| Mine operating earnings | $9,861 | $21,748 | $6,414 | $18,892 | $17,919 | $17,097 | $19,518 | $23,419 |
| | | | | | | | | |
| Net earnings (loss) | ($115,758) | $12,297 | ($361) | $14,357 | $14,821 | $16 | $7,505 | $19,775 |
| Impairment charge, net of tax | 104,283 | - | - | - | - | - | - | - |
| (Gain) Loss on derivative liability | (591) | 679 | (2,386) | (1,452) | (1,881) | 1,728 | 1,632 | (143) |
| Adjusted earnings (loss) | ($12,066) | $12,976 | ($2,747) | $12,905 | $12,940 | $1,744 | $5,873 | $19,632 |
| | | | | | | | | |
| Basic earnings (loss) per share | ($1.16) | $0.12 | $0.00 | $0.14 | $0.15 | $0.00 | $0.09 | $0.23 |
| Diluted earnings (loss) per share | ($1.17) | $0.12 | $0.00 | $0.13 | $0.13 | $0.00 | $0.06 | $0.22 |
| Adjusted earnings (loss) per share | ($0.35) | $0.13 | ($0.03) | $0.13 | $0.13 | $0.02 | $0.06 | $0.22 |
| Weighted shares outstanding | 99,720,704 | 99,741,010 | 99,710,933 | 99,660,016 | 99,539,282 | 97,666,618 | 87,999,495 | 87,728,391 |
| | | | | | | | | |
| Net earnings (loss) | ($115,758) | $12,297 | ($361) | $14,357 | $14,821 | $16 | $7,505 | $19,775 |
| Amortization and depletion | 15,875 | 12,648 | 13,228 | 12,148 | 10,599 | 6,426 | 4,386 | 8,541 |
| Finance costs | 422 | 313 | 531 | 247 | 293 | 181 | 5 | 5 |
| Current income tax | 5,042 | 2,729 | 4,363 | 1,836 | 5,932 | 3,419 | 1,713 | 4,769 |
| Deferred income tax | (23,100) | 1,341 | (1,158) | 2,453 | (3,460) | 2,185 | 2,788 | 623 |
| Impairment charges | 135,060 | - | - | - | - | - | - | - |
| EBITDA | $17,541 | $29,328 | $16,603 | $31,041 | $28,185 | $12,227 | $16,397 | $33,713 |
| MANAGEMENT’S DISCUSSION AND ANALYSIS |
| FOR THE YEAR ENDED DECEMBER 31, 2013 |
| |
The following table presents selected production information for each of the most recent eight quarters:
| Highlights | | 2013 | | | 2012 | |
| | Q4 | Q3 | Q2 | Q1 | Q4 | Q3 | Q2 | Q1 |
| Processed tonnes | 379,480 | 389,090 | 393,070 | 376,344 | 362,779 | 306,164 | 202,987 | 193,759 |
| Guanaceví | 121,008 | 107,480 | 100,781 | 106,653 | 110,763 | 108,343 | 100,208 | 98,963 |
| Bolañitos | 159,294 | 181,442 | 202,472 | 167,500 | 161,841 | 117,271 | 102,779 | 94,796 |
| El Cubo | 99,178 | 100,168 | 89,817 | 102,191 | 90,175 | 80,550 | NA | NA |
| Silver ounces | 1,931,717 | 1,855,846 | 1,535,873 | 1,489,746 | 1,235,026 | 1,137,933 | 1,040,026 | 1,072,491 |
| Guanaceví | 861,495 | 715,080 | 555,036 | 640,616 | 518,207 | 598,285 | 669,754 | 726,697 |
| Bolañitos | 698,098 | 794,734 | 810,414 | 578,654 | 518,674 | 433,388 | 370,272 | 345,794 |
| El Cubo | 372,124 | 346,032 | 170,423 | 270,446 | 198,145 | 106,260 | NA | NA |
| Silver grade | 181 | 171 | 165 | 154 | 151 | 161 | 208 | 229 |
| Guanaceví | 271.7 | 265 | 240 | 233 | 215 | 227 | 269 | 292 |
| Bolañitos | 152 | 147 | 160 | 135 | 140 | 148 | 149 | 163 |
| El Cubo | 118 | 112 | 93 | 103 | 96 | 92 | NA | NA |
| Silver recovery | 87.3 | 86.7 | 73.6 | 79.9 | 70.1 | 71.8 | 76.5 | 75.2 |
| Guanaceví | 81.5 | 78.0 | 71.3 | 80.2 | 67.7 | 75.7 | 77.4 | 78.2 |
| Bolañitos | 89.5 | 92.5 | 77.8 | 79.8 | 71.3 | 77.7 | 75.2 | 69.5 |
| El Cubo | 99.1 | 95.6 | 63.5 | 79.9 | 71.2 | 44.6 | NA | NA |
| Gold ounces | 17,686 | 22,947 | 19,914 | 15,032 | 12,917 | 11,754 | 7,695 | 6,321 |
| Guanaceví | 2,275 | 1,977 | 1,590 | 942 | 1,088 | 2,667 | 2,499 | 1,620 |
| Bolañitos | 10,142 | 15,869 | 15,751 | 9,891 | 8,660 | 7,363 | 5,196 | 4,701 |
| El Cubo | 5,269 | 5,101 | 2,574 | 4,199 | 3,169 | 1,724 | NA | NA |
| Gold grade | 1.78 | 1.89 | 1.96 | 1.51 | 1.55 | 1.49 | 1.47 | 1.33 |
| Guanaceví | 0.69 | 0.70 | 0.68 | 0.34 | 0.69 | 0.87 | 0.87 | 0.6 |
| Bolañitos | 2.61 | 2.75 | 2.84 | 2.27 | 2.2 | 2.39 | 2.05 | 2.1 |
| El Cubo | 1.77 | 1.62 | 1.41 | 1.48 | 1.42 | 1.42 | NA | NA |
| Gold recovery | 82.1 | 96.9 | 80.4 | 82.3 | 71.7 | 80.1 | 80.3 | 76.2 |
| Guanaceví | 85.2 | 82.1 | 72.6 | 80.8 | 44.3 | 88 | 89.2 | 85.3 |
| Bolañitos | 75.8 | 98.9 | 85.2 | 81 | 75.8 | 81.7 | 76.6 | 73.6 |
| El Cubo | 93.2 | 97.8 | 63.2 | 86.4 | 77 | 46.9 | NA | NA |
| Cash costs per oz | $7.46 | $5.14 | $10.53 | $10.04 | $12.25 | $4.70 | $5.46 | $6.26 |
| Guanaceví | $13.09 | $12.98 | $16.59 | $16.70 | $18.20 | $10.99 | $8.64 | $12.38 |
| Bolañitos | $0.60 | ($8.10) | ($2.74) | ($0.06) | ($3.73) | ($9.98) | ($0.31) | ($6.63) |
| El Cubo | $6.65 | $18.61 | $52.41 | $15.30 | $38.52 | $29.21 | NA | NA |
| Total cost per oz(1) | $14.59 | $13.17 | $18.18 | $18.24 | $20.84 | $13.18 | $9.98 | $12.27 |
| Guanaceví | $18.51 | $18.76 | $23.34 | $22.56 | $23.89 | $16.54 | $13.01 | $17.73 |
| Bolañitos | $4.35 | ($3.66) | $1.28 | $4.45 | $1.59 | ($5.20) | $4.50 | $0.10 |
| El Cubo | $24.58 | $39.54 | $80.16 | $35.71 | $49.30 | $69.20 | NA | NA |
| Costs per tonne | $90.72 | $104.06 | $96.45 | $99.63 | $92.86 | $97.04 | $86.32 | $92.44 |
| Guanaceví | $114.55 | $111.06 | $111.21 | $113.61 | $99.70 | $101.82 | $100.81 | $113.69 |
| Bolañitos | $72.78 | $84.57 | $75.50 | $85.10 | $75.66 | $77.34 | $72.18 | $70.26 |
| El Cubo | $90.44 | $131.83 | $127.11 | $108.85 | $115.25 | $119.32 | NA | NA |
| (1) | Total Production Cost per ounce |
| MANAGEMENT’S DISCUSSION AND ANALYSIS |
| FOR THE YEAR ENDED DECEMBER 31, 2013 |
| |
KEY ECONOMIC TRENDS
Metal Price Trends
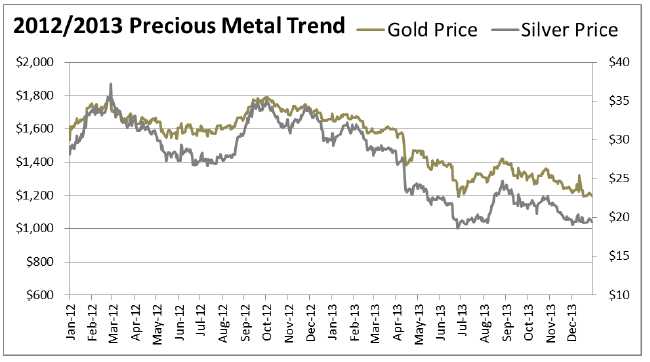
The prices of silver and gold are the largest single factor in determining profitability and cash flow from operations, therefore, the financial performance of the Company has been, and is expected to continue to be, closely linked to the prices of silver and gold. During Q4, 2013, the average price of silver was $20.82 per ounce, with silver trading between a range of $19.05 and $22.74 per ounce based on the London Fix silver price. This compares to an average of $32.61 per ounce during Q4, 2012, with a low of $29.75 and a high of $34.96 per ounce. During Q4, 2013, the Company realized an average price of $20.52 per ounce compared with $32.87 for the corresponding period in 2012.
During Q4, 2013, the average price of gold was $1,275 per ounce, with gold trading between a range of $1,195 and $1,361 per ounce based on the London Fix PM gold price. This compares to an average of $1,718 per ounce during Q4, 2012, with a low of $1,650 and a high of $1,792 per ounce. During Q4, 2013, the Company realized an average price of $1,246 per ounce compared with $1,725 for the corresponding period in 2012.
During 2013, the average price of silver was $23.79 per ounce, with silver trading between a range of $19.05 and $32.23 per ounce based on the London Fix silver price. This compares to an average of $31.15 per ounce during 2012, with a low of $26.67 and a high of $37.23 per ounce. During 2013, the Company realized an average price of $23.10 per ounce compared with $30.99 for the corresponding period in 2012.
During 2013, the average price of gold was $1,411 per ounce, with gold trading between a range of $1,192 and $1,694 per ounce based on the London Fix PM gold price. This compares to an average of $1,669 per ounce during 2012, with a low of $1,540 and a high of $1,792 per ounce. During 2013, the Company realized an average price of $1,375 per ounce compared with $1,674 for the corresponding period in 2012.
The major influences on the precious metals prices during 2013 included weaker investment demand, selling from precious metal exchange traded funds, as well as strong US equity and bond markets that pulled investments from other asset classes, including precious metals. In addition, the precious metal prices were also affected by an expectation of improving economic conditions, which lead to the reduction of the US Federal Reserve’s quantitative easing program. A sustained period at current metal prices will have a significant impact on the Company’s financial position, performance and liquidity, as well as on the carrying value of the Company’s cash generating units. See impairment of non-current assets on page 19).
| MANAGEMENT’S DISCUSSION AND ANALYSIS |
| FOR THE YEAR ENDED DECEMBER 31, 2013 |
| |
Currency Fluctuations
The Company’s operations are located in Mexico and therefore a significant portion of operating costs and capital expenditures are denominated Mexican pesos. The corporate activities are based in Vancouver, Canada with the significant portion of these expenditures being denominated in Canadian dollars. Generally, as the US dollar strengthens, these currencies weaken, and as the US dollar weakens, these foreign currencies strengthen.
During Q2, 2013, the Mexican peso reversed its appreciation trend and depreciated relative to the US dollar. During Q4, 2013, the average foreign exchange rate was $13.01 Mexican Pesos per U.S. dollar, with the peso trading between a range of $13.22 and $12.79. This compares to an average of $12.94 during Q4, 2012, with a range of $13.25 and $12.72 Mexican peso per US dollar.
During 2013, the average foreign exchange rate was $12.75 Mexican Pesos per U.S. dollar, with the peso trading between a range of $13.37 and $11.97. This compares to an average of $13.15 during 2012, with a range of $14.41 and $12.60 Mexican peso per US dollar.
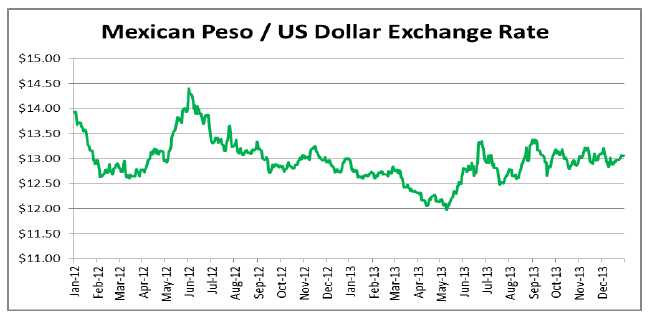
During Q4, 2013, the Canadian dollar continued to depreciate relative to the US dollar. During Q4, 2013, the average foreign exchange rate was $1.0495 Canadian dollar per U.S. dollar, with the Canadian dollar trading between a range of $1.0643 and $1.0328. This compares to an average of $0.9911 during Q4, 2012, between a range of $0.9785 and $1.0011 US dollar per Canadian dollar.
During 2013, the Canadian dollar continued to depreciate relative to the US dollar. During 2013, the average foreign exchange rate was $1.0303 Canadian dollar per U.S. dollar, with the Canadian dollar trading between a range of $1.0643 and $0.9856. This compares to an average of par during 2012, with a range of $0.9740 and $1.0339 US dollar per Canadian dollar.
| MANAGEMENT’S DISCUSSION AND ANALYSIS |
| FOR THE YEAR ENDED DECEMBER 31, 2013 |
| |
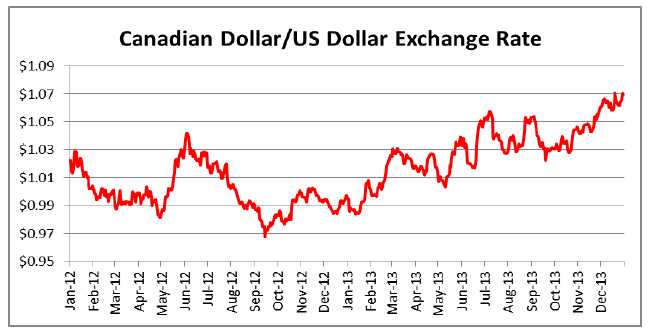
Cost Trends
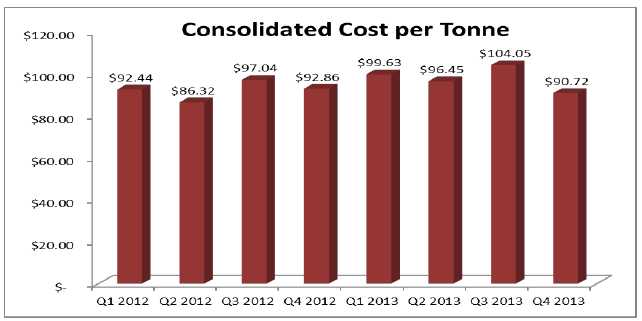
The Company’s profitability is subject to industry wide cost pressures on development and operating costs with respect to labour, energy, consumables and capital expenditures. Underground mining is labour intensive and 33% of Endeavour’s production costs are directly tied to labour. In order to mitigate the impact of higher labour and consumable costs, the Company focuses on continuous improvement, both by promoting more efficient use of materials and supplies, and by pursuing more advantageous pricing, while increasing performance and without compromising operational integrity.
In December 2013, the Mexican President passed tax reform legislation that will be effective January 1, 2014. The tax reform includes, among other items, an increase of the Mexican corporate tax rate from 28% to 30%, removal of the flat tax regime, a Special Mining Duty of 7.5% on taxable revenues, less allowable deductions excluding interest and capital depreciation and an 0.5% Environmental Tax on gold and silver revenues. The tax reform is expected to have a material impact on the Company’s future earnings and cash flows.
| MANAGEMENT’S DISCUSSION AND ANALYSIS |
| FOR THE YEAR ENDED DECEMBER 31, 2013 |
| |
ANNUAL OUTLOOK
Production Outlook
Endeavour plans to hold its silver production relatively steady in the range of 6.5 -6.9 million ounces (oz) compared to the 6.8 million oz silver it produced in 2013. Gold production is expected to be in the 65,000-69,000 oz range and silver equivalent production is anticipated to be 10.4 -11.0 million oz (at a silver:gold ratio of 60:1) as shown in the table below.
| Mine | | Ag Prod. (M oz) | | | Au Prod. (K oz) | | | Ag Eq. Prod. (K oz) | | | Tonnes/Day (tpd) | |
| Guanaceví | | 2.6-2.7 | | | 7.0-8.0 | | | 3.0-3.2 | | | 1,200-1,300 | |
| Bolañitos | | 2.2-2.4 | | | 36.0-38.0 | | | 4.4-4.7 | | | 1,450-1,600 | |
| El Cubo | | 1.7-1.8 | | | 22.0-23.0 | | | 3.0-3.1 | | | 1,200-1,550 | |
| Total | | 6.5-6.9 | | | 65.0-69.0 | | | 10.4-11.0 | | | 3,850-4,450 | |
In 2014, Bolañitos production will contract as management has elected not to continue extra mine production for processing at the El Cubo plant as it did in 2013. The Bolañitos operation will operate at its existing capacity of 1,600 tonnes per day (tpd). At Bolañitos, production will continue primarily from the Daniela, Karina, Lana and Bolañitos veins and mine development will open up the La Luz- Asunción deposit.
In 2013, El Cubo production will expand to fill the 1,550 tpd plant to capacity through a steady ramp-up of mine output as mine development opens up the new Villalpando-Asunción deposit. At El Cubo, the remaining 2014 production will continue to come primarily from the Dolores, Villalpando, San Nicolas and Santa Cecilia veins.
Bolañitos and El Cubo are both producing silver-gold concentrate for sale under one year contracts to smelters because their attractive terms offer lower costs and higher profit margins compared to producing doré bars from the El Cubo leach plant at the current low metal prices.
At Guanaceví, production will continue primarily from the Porvenir Norte, Porvenir Cuatro and Santa Cruz veins. Underground development of the new Milache discovery is awaiting permitting for development to start in 2014 and production to start in 2015.
Operating Costs
Direct operating costs are estimated to be in the $95 per tonne driving the expectation that the consolidated byproduct cash costs of silver production (net of gold credits) to be in the $9-$10 range in 2014. The increase from 2013 is primarily driven by the lower gold price and reduced gold production. Consolidated co-product cash costs of silver and gold production are anticipated to be around $13-14 and $800-850 per oz respectively.
All-in by-product sustaining costs of production (including sustaining capex, exploration and G&A costs) are forecasted to be approximately $19 per oz of silver produced.
Capital Budget
Endeavour plans to invest $43.9 million on capital projects in 2014, including $34.6 million on mine development, infrastructure, equipment and exploration plus $9.3 million on plant upgrades, infrastructure, equipment and buildings. The Company has budgeted $20.9 million at El Cubo, $9.9 million at Bolañitos, $11.7 million at Guanaceví and $1.4 million for general capital, all of which should be funded by the Company’s anticipated 2014 operating cash-flow.
Exploration Expenditures
In 2013, Endeavour plans to spend $10.3 million on exploration. A total of 54,000 metres of drilling in about 120 holes are budgeted to test multiple exploration targets in addition to the underground mine exploration drilling.
The Company will focus on brownfields exploration around the three operating mines in order to replenish reserves and grow resources and mine-lives, as well as expanding and permitting the emerging new high grade silver-gold discovery in the Terronera vein on the San Sebastián property in Jalisco State.
| MANAGEMENT’S DISCUSSION AND ANALYSIS |
| FOR THE YEAR ENDED DECEMBER 31, 2013 |
| |
LIQUIDITY AND CAPITAL RESOURCES
Cash and cash equivalents have increased from $18.6 million at December 31, 2012 to $35.0 million at December 31, 2013. The Company had working capital of $32.2 million at December 31, 2013 (December 31, 2012 - $50.9 million). The $18.7 million decrease in working capital is primarily a result of an increase in the revolving credit facility of $24.0 million, which was used towards expenditures on property, plant and equipment offset by contributions from operations.
Operating activities provided cash of $76.5 million during 2013 compared to providing $76.0 million during the same in 2012. The significant non-cash adjustments to net earnings were for the impairment of non-current assets and goodwill totaling $135.1 million, amortization and depletion of $53.9 million, share-based compensation of $3.5 million, a loss on the sale of marketable securities of $3.1 million, a deferred income tax recovery of $20.5 million, a mark-to-market gain on contingent liabilities of $8.4 million, a mark-to-market gain on derivative liabilities of $3.7 million, the write down of inventory to net realizable value of $5.9 million, finance costs of $1.5 million and a change in non-cash working capital of $5.0 million. The change in non-cash working capital was primarily due to an increase in accounts receivable due to third party sales of the Bolañitos and El Cubo concentrate and a reduction in accounts payable and income tax payable, offset by a reduction in inventories and prepaid expenses.
Investing activities during the period used $83.4 million as compared to $144.3 million in the same period of 2012, with $100 million in cash used towards the purchase of Mexgold in 2012. Investments in property, plant and equipment totaling $88.6 million compared to $66.2 million, primarily due to increased development and plant expansion expenditures at El Cubo. There was also $5.2 million in net receipts from short term investments compared to net receipts in short term investments of $22.1 million in 2012.
The Company invested a total of $88.6 million in property, plant and equipment during 2013. $15.9 million was invested at Guanaceví, with $10.3 million spent on mine development, $2.7 million spent on the tailings and refining facilities and $2.9 million on mine equipment. Guanaceví mine development included 5.4 kilometres of underground development, and the refining facilities expenditures included $0.7 million on new agitator and $1.7 million on the tailing dam expansion.
During 2013 the Company invested $21.4 million at Bolañitos. The Company spent $12.3 million on 7.6 kilometres of underground development, including two ventilation raises and infill drilling. The 7.6 kilometres was within 96% of the original plan, while incurring $2.8 million less than the original plan. The Company spent $3.8 million on plant projects completing the 2012 expansion, expansion of the tailings dam and spent $5.3 million on mine equipment to help facilitate the significant increase in mine output. In total the Company invested $21.4 million at Bolañitos in 2013.
During 2013 the Company invested $48.5 million at El Cubo. The plant re-build was complete, with $28.6 million spent. The Company spent $13.8 million on 10.6 kilometres of underground development, 14% more development than planned for 6% higher than budget. An additional $6.0 million was spent on equipment and surrounding infrastructure to improve operating efficiencies.
The Company spent $2.4 million on exploration property costs, including $2.0 million on the final San Sebastián property payment. An additional $0.3 million was invested office equipment and software for the exploration and corporate offices.
As at December 31, 2013, the Company held no short-term investments and $1.5 million in available for sale investments consisting of marketable securities.
Financing activities during 2013 generated $23.3 million, compared to $10.3 million during 2012. During 2013 the Company drew $24.0 million in net proceeds from its revolving line of credit, incurring $1.1 million of interest and $0.5 million was realized from the exercise of stock options. During 2012 the Company drew $9.0 million in proceeds from its revolving line of credit, incurring $0.4 million of interest, issuance costs of $0.7 million and $2.4 million was realized from the exercise of stock options and warrants.
| MANAGEMENT’S DISCUSSION AND ANALYSIS |
| FOR THE YEAR ENDED DECEMBER 31, 2013 |
| |
As at December 31, 2013, the Company’s issued share capital was $358.4 million, representing 99,784,409 common shares, compared to $357.3 million, representing 99,541,522 common shares, at December 31, 2012. All of the 199,488 common shares issued during the period were issued upon stock option or warrant exercises.
As at December 31, 2013, the Company had options outstanding to purchase 5,695,550 common shares with a weighted average exercise price of CAN $5.26 and had share purchase warrants outstanding to purchase 1,196,967 common shares with a weighted average exercise price of CAN $1.94. Subsequent to December 31, 2013 all of the warrants were exercised.
On July 24, 2012, the Company entered into a $75 million revolving credit facility (“the Facility”) reducing over three years with Scotia Capital. The purpose of the Facility is for general corporate purposes and is principally secured by a pledge of the Company’s equity interests in its material operating subsidiaries, including Refinadora Plata Guanaceví S.A de C.V., Minas Bolañitos S.A. de C.V. and Compania Minera del Cubo S.A. de C.V. The interest rate margin on the Facility ranges from 2.75% to 4.25% over LIBOR based on the Company’s net debt to EBITDA ratio, where EBITDA is adjusted for gains or losses on derivative liabilities and any extraordinary items. The Company agreed to pay a commitment fee of between 0.69% and 1.05% on undrawn amounts under the facility based on the Company’s net debt to EBITDA ratio. The Facility is subject to various qualitative and quantitative covenants, including EBITDA leverage ratio, interest service coverage ratio and tangible net worth calculation; the Company is in compliance with all such debt covenants as at December 31, 2013. As part of the credit agreement the capacity of the credit facility was reduced to $50.0 million on July 24, 2013. As of December 31, 2013, the Company had drawn $33.0 million on this facility. With the completion of the El Cubo re-construction, the Company expects to reduce the outstanding balance dependent on the metal price environment. During 2013, the Company extended the Facility until July 24, 2016, reducing from $50 million to $25 million July 24, 2015.
In December 2013, the Mexican President passed tax reform legislation that will be effective January 1, 2014. The tax reform includes, among other items, an increase of the Mexican corporate tax rate from 28% to 30%, removal of the flat tax regime, a Special Mining Duty of 7.5% on taxable revenues, less allowable deductions excluding interest and capital depreciation and an 0.5% Environmental Tax on gold and silver revenues. On enactment of the Special Mining Duty, the Company recognized an $18.7 million deferred income tax expense for the year ended December 31, 2013. The tax reform is expected to have a material impact on the Company’s future earnings and cash flows.
Contingencies
On February 18, 2013, the Mexican tax administration published temporary regulations on the tax amnesty program enacted in December 2012. Under the tax amnesty, available until May 31, 2013, taxpayers were able to settle tax liabilities for years 2006 and prior with forgiveness of up to 80% of the omitted tax and inflation adjustments and up to 100% of interest and penalties. Further, interest and penalties on qualified liabilities arising after 2007 will be eligible for a 100% forgiveness of penalties and interest.
Refinadora Plata Guanaceví SA de CV, a subsidiary of the Company, received a MXN$63 million (US$4.8 million) assessment on May 7, 2011 by Mexican fiscal authorities for failure to provide the appropriate support for certain expense deductions taken in the entity’s 2006 tax return. During the audit process, the Company retained an international accounting firm and external counsel to expedite the audit process and to ensure the delivery of the appropriate documentation. Based on the advice of tax advisors and legal counsel, it was the Company’s view that it provided the appropriate documentation and support for the expenses however, the Company estimated a potential tax exposure of $425,000, plus additional interest and penalties of $460,000. On May 30, 2013, under the tax amnesty program the Company paid $561,000 to settle the dispute.
Metales Interamericanos S.A. de C.V., a subsidiary of Endeavour, acquired in the El Cubo transaction received a MXN$68 million (US$5.2 million) assessment on August 24, 2010 by Mexican fiscal authorities for failure to provide the appropriate support for certain expense deductions in the 2006 tax return. Based on the advice of legal counsel, it was the Company’s view the tax assessment has no legal merit and an appeals process was initiated in 2010. On May 30, 2013, under the tax amnesty program the Company paid $682,000 to settle the dispute.
| MANAGEMENT’S DISCUSSION AND ANALYSIS |
| FOR THE YEAR ENDED DECEMBER 31, 2013 |
| |
Minera Santa Cruz y Garibaldi SA de CV, a subsidiary of the Company, received a MXN$238 million (US$18.3 million) assessment on October 12, 2010 by Mexican fiscal authorities for failure to provide the appropriate support for certain expense deductions taken in the entity’s 2006 tax return. During the audit process, the Company retained an international accounting firm and external counsel to expedite the audit process and to ensure the delivery of the appropriate documentation. Based on the advice of tax advisors and legal counsel, it is the Company’s view that it provided the appropriate documentation and support for the expenses and the tax assessment has no legal merit, however as a result of a detailed review by the Company of its accounting records and available information to support the deductions taken, the Company has estimated a potential tax exposure of $40,000, plus additional interest and penalties of $40,000, for which the Company has made a provision in the consolidated financial statements. The Company did not elect to use the tax amnesty and will continue the appeal process.
Capital Requirements
At the beginning of 2013 the Company planned to invest $44.9 million at El Cubo, $21.4 million at Bolañitos and $19.5 million at Guanaceví for a total of $85.8 million on capital projects in 2013, all which were anticipated to be covered by the Company’s 2013 cash flow and credit facility. During Q2, 2013, the precious metal prices dropped significantly, prompting management to defer $16.3 million in capital expenditures across the three operations. The capital deferrals did not impact forecasted production in 2013 and as management assessed the market conditions re-instituted additional mine development in Q4, 2013.
The original $44.8 million capital budget at El Cubo was primarily for rebuilding the El Cubo plant, mine development and to purchase new underground mining equipment. The revised capital plan includes halting the construction of new administrative buildings and modifying other buildings to accommodate administration, delaying certain equipment purchases and reducing mine exploration for a total cost reduction of $4.0 million. As of December 31, 2013, the plant re-build was complete, with $28.6 million spent. The Company spent $13.8 million on 10.6 kilometres of underground development, 14% more development than planned for 6% higher than budget. An additional $6.0 million was spent on equipment and surrounding infrastructure for operations. In total the Company invested $48.5 million at El Cubo in 2013. In 2014, the Company has budgeted US$20.9 million. The capital program includes $13.3 million for underground development and exploration, $2.3 million for additional mobile equipment and $5.3 for various infrastructure projects.
The original $21.4 million capital budget at Bolañitos was for the continued mine development of the veins discovered in 2011 and 2012. The increased production also requires an additional investment in the tailings dam, totaling $4.2 million. The revised capital plan decelerates mine development and mine exploration by $3.5 million and defers equipment purchases by $2.7 million. During 2013, the Company had spent $12.3 million on 7.6 kilometres of underground development, including two ventilation raises and infill drilling. The 7.6 kilometres was within 96% of the original plan, while incurring $2.8 million less than the original plan. The Company spent $3.8 million on plant projects completing the 2012 expansion, expansion of the tailings dam and spent $5.3 million on mine equipment to help facilitate the significant increase in mine output. In total the Company invested $21.4 million at Bolañitos in 2013. In 2014, the Company has budgeted US$9.9 million for Bolañitos capital program. The capital program includes $8.2 million for underground development and exploration and $1.7 for various infrastructure projects.
The original $19.5 million capital budget at Guanaceví included $12.2 million for underground development, while $2.4 million will be spent on the tailings dam to ensure there is sufficient capacity into the future. The remaining investment was for various equipment purchases and upgrades. The revised capital plan decelerates mine development and mine exploration by $5.6 million. In 2013, 5.4 kilometres of underground development was completed costing $10.3 million, primarily due to infrastructure costs for pumping water from the Santa Cruz ore zone. The 5.4 kilometres was within 60% of the original plan, while incurring 85% of the original plan costs. Demobilization of contractors and higher underground infrastructure costs results in higher costs spent than the revised plan. Additionally the mine spent $2.7 million related to the plant and tailings and $2.9 million on various mine equipment. In 2014, the Company has budgeted US$11.7 million for Guanaceví capital program. The capital program includes $9.3 million for underground development and exploration and $1.4 for various infrastructure projects.
| MANAGEMENT’S DISCUSSION AND ANALYSIS |
| FOR THE YEAR ENDED DECEMBER 31, 2013 |
| |
Contractual Obligations
The Company had the following contractual obligations at December 31, 2013:
| Payments due by period (in thousands of dollars) | |
| Contractual Obligations | | Total | | | Less than 1 year | | | 1 – 3 years | | | 3 – 5 years | | | More than 5 years | |
| Capital Asset purchases | $ | 940 | | $ | 940 | | $ | - | | $ | - | | $ | - | |
| Operating Lease | | 962 | | | 266 | | | 539 | | | 157 | | | - | |
| Other Long-Term Liabilities | | 6,652 | | | - | | | 6,652 | | | - | | | - | |
| Total | $ | 8,554 | | $ | 1,206 | | $ | 7,191 | | $ | 157 | | $ | - | |
Transactions with Related Parties
The Company shares common administrative services and office space with Canarc Resource Corp., Caza Gold Corp., and Aztec Metals Corp. (“Aztec”), who are related party companies by virtue of having Bradford Cooke as a common director. From time to time, Endeavour incurs third-party costs on behalf of the related parties which are charged on a full cost recovery basis. The Company had $248,000 receivable related to administration costs outstanding as at December 31, 2013 (December 31, 2012 – $136,000). Subsequent to year end Mr. Cooke resigned from the Caza Gold Corp. board of directors.
During the year ended December 31, 2013, the Company was charged $129,000 (December 31, 2012 - $527,000) for legal services by Koffman Kalef LLP, a firm in which the Company’s Corporate Secretary is a partner. As of December 31, 2013, the Company had a payable outstanding of $8,000 relating to these legal services (December 31, 2012 - $10,000).
Financial Assets and Liabilities
As at December 31, 2013, the carrying and fair values of Endeavour’s financial instruments by category were as follows:
| | | As at December 31, 2013 | | | As at December 31, 2012 | |
| | | Carrying | | | Estimated Fair | | | Carrying | | | Estimated Fair | |
| | | value | | | value | | | value | | | value | |
| | | $ | | | $ | | | $ | | | $ | |
| | | | | | | | | | | | | |
| Financial assets: | | | | | | | | | | | | |
| Cash and cash equivalents | | 35,004 | | | 35,004 | | | 18,617 | | | 18,617 | |
| Available for sale securities | | 1,463 | | | 1,463 | | | 8,520 | | �� | 8,520 | |
| Trade receivables | | 10,263 | | | 10,263 | | | - | | | - | |
| Other receivables | | 13,486 | | | 13,486 | | | 20,526 | | | 20,526 | |
| Total financial assets | | 60,216 | | | 60,216 | | | 47,663 | | | 47,663 | |
| | | | | | | | | | | | | |
| Financial liabilities: | | | | | | | | | | | | |
| Accounts payable and accrued liabilities | | 17,221 | | | 17,221 | | | 38,485 | | | 38,485 | |
| Revolving credit facility | | 33,000 | | | 33,000 | | | 9,000 | | | 9,000 | |
| Contingent liabilities | | 99 | | | 99 | | | 8,497 | | | 8,497 | |
| Derivative liabilities | | 1,491 | | | 1,491 | | | 5,336 | | | 5,336 | |
| Total financial liabilities | | 51,811 | | | 51,811 | | | 61,318 | | | 61,318 | |
| MANAGEMENT’S DISCUSSION AND ANALYSIS |
| FOR THE YEAR ENDED DECEMBER 31, 2013 |
| |
Fair value hierarchy:
Fair value is the price that would be received to sell an asset or paid to transfer a liability in an orderly transaction between market participants at the measurement date. The fair value hierarchy establishes three levels to classify the inputs to valuation techniques used to measure fair value. Level 1 inputs are quoted prices (unadjusted) in active markets for identical assets or liabilities. Level 2 inputs are quoted prices in markets that are not active, quoted prices for similar assets or liabilities in active markets, inputs other than quoted prices that are observable for the asset or liability (for example, interest rate and yield curves observable at commonly quoted intervals, forward pricing curves used to value currency and commodity contracts and volatility measurements used to value option contracts), or inputs that are derived principally from or corroborated by observable market data or other means. Level 3 inputs are unobservable (supported by no or little market activity). The fair value hierarchy gives the highest priority to Level 1 inputs and the lowest priority to Level 3 inputs.
Financial assets and liabilities measured at fair value on a recurring basis include:
| | | Total | | | Level 1 | | | Level 2 | | | Level 3 | |
| As at December 31, 2013 | | $ | | | $ | | | $ | | | $ | |
| | | | | | | | | | | | | |
| Financial assets: | | | | | | | | | | | | |
| Available for sale securities | | 1,463 | | | 2,295 | | | - | | | - | |
| Trade receivables | | 10,263 | | | 10,263 | | | - | | | - | |
| Total financial assets | | 11,726 | | | 12,558 | | | - | | | - | |
| | | | | | | | | | | | | |
| Financial liabilities: | | | | | | | | | | | | |
| Contingent liabilities | | 99 | | | - | | | 99 | | | - | |
| Derivative liabilities | | 1,491 | | | - | | | 1,491 | | | - | |
| Total financial liabilities | | 1,590 | | | - | | | 1,590 | | | - | |
Available for sale securities
The Company holds marketable securities classified as Level 1 in the fair value hierarchy and as available for sale financial assets. The fair value of available for sale investments are determined based on a market approach reflecting the closing price of each particular security at the reporting date. The closing price is a quoted market price obtained from the exchange that is the principal active market for the particular security, being the market with the greatest volume and level of activity for the assets.
Trade receivables
The trade receivables consist of receivables from provisional silver and gold sales from the Bolañitos and El Cubo mine. The fair value of receivables arising from concentrate sales contracts that contain provisional pricing mechanisms is determined using the appropriate quoted closing price on the measurement date from the exchange that is the principal active market for the particular metal. As such, these receivables, which meet the definition of an embedded derivative, are classified within Level 1 of the fair value hierarchy.
| MANAGEMENT’S DISCUSSION AND ANALYSIS |
| FOR THE YEAR ENDED DECEMBER 31, 2013 |
| |
Contingent liability
On July 13, 2012 the Company completed the acquisition of 100% of the issued and outstanding shares of Mexgold Resources Inc. (“Mexgold”), thereby acquiring the El Cubo mine. The seller is entitled to receive up to an additional $50 million in cash payments from the Company upon the occurrence of certain events as follows:
| | i) | $20 million if at any time during the three years following the acquisition date the Company renews or extends the Las Torres lease, other than a one-time three month extension after the current lease expires; |
| | | |
| | ii) | $10 million upon the simple average of the daily London Metals Exchange closing prices for gold exceeding $1,900.00 per ounce for a period of 12 consecutive months at any time during the three-year period immediately following the acquisition date; |
| | | |
| | iii) | $10 million upon the simple average of the daily London Metals Exchange closing prices for gold exceeding $2,000.00 per ounce for a period of 12 consecutive months at any time during the three-year period immediately following the acquisition date; and |
| | | |
| | iv) | $10 million upon the simple average of the daily London Metals Exchange closing prices for gold exceeding $2,100.00 per ounce for a period of 12 consecutive months at any time during the three-year period immediately following the acquisition date. |
The contingent consideration related to the Las Torres lease was valued based on factoring the probability of the Company negotiating a lease extension. Management determined the probability of extending the lease to be highly unlikely, resulting in a nil value assigned to the liability at acquisition. During the quarter ended September 30, 2013, the Las Torres lease was terminated resulting in no further liability.
The contingent consideration related to metal price targets is considered a derivative, is recognized at fair value at period end and is classified as Level 2 in the fair value hierarchy. The contingent consideration based on the performance of gold prices was valued using a Monte Carlo simulation. Monte Carlo simulation approaches are a class of computational algorithms that rely on repeated random sampling to compute their results. Gold price paths were developed using a mathematical formula based on a stochastic process with mean reversion to a long term trend line. As of December 31, 2013, the fair value of the contingent consideration was estimated to be $99,000 (December 31, 2012 - $8,497,000).
Under the terms of the Las Torres lease, the Company was required to provide financial guarantees to the owner of the Las Torres Facility as security against any environmental damages. As at December 31, 2013, there was $1 million in letters of credit provided by the Company as security to the owner of the Las Torres facility.
Derivative liability
Equity offerings were completed in previous periods whereby warrants were issued with exercise prices denominated in Canadian dollars. As the warrants have an exercise price denominated in a currency which is different from the functional currency of the Company (US dollar), the warrants are treated as a financial liability. The Company’s share purchase warrants are classified and accounted for as a financial liability at fair value with changes in fair value recognized in net earnings. The warrant derivative liability is classified as Level 2 in the fair value hierarchy. The publicly traded warrants and warrants with similar characteristics were valued using the quoted market price as of exercise or at period end, from the market with the greatest volume and level of activity. For the non-publicly traded warrants, the Company uses the Black-Scholes option pricing model to estimate the fair value of the Canadian dollar denominated warrants. All warrants outstanding at December 31, 2013 were exercised subsequent to year end.
| MANAGEMENT’S DISCUSSION AND ANALYSIS |
| FOR THE YEAR ENDED DECEMBER 31, 2013 |
| |
| Expressed in thousands US dollars | | | |
| Balance at December 31, 2011 | $ | 13,130 | |
| Exercise of financial liability | | (5,866 | ) |
| Mark to market loss (gain) | | (1,928 | ) |
| Balance at December 31, 2012 | $ | 5,336 | |
| Exercise of financial liability | | (95 | ) |
| Mark to market loss (gain) | | (3,750 | ) |
| Balance at December 31, 2013 | $ | 1,491 | |
| Assumptions used for Black-Scholes estimate for warrant derivative liability | | Year ended Dec. 31 | |
| | | 2013 | | | 2012 | |
| Outstanding warrants | | 849,468 | | | 902,098 | |
| Weighted average fair value of warrants at period end | $ | 1.75 | | $ | 5.92 | |
| Risk-free interest rate | | 0.88% | | | 1.12% | |
| Expected dividend yield | | 0% | | | 0% | |
| Expected stock price volatility | | 45% | | | 46% | |
| Expected warrant life in years | | 0.2 | | | 1.2 | |
Black-Scholes pricing models require the input of highly subjective assumptions. Volatility was estimated based on average daily volatility based on historical share price observations over the expected term of the warrant grant
Financial Instrument Risk Exposure and Risk Management
The Company is exposed in varying degrees to a variety of financial instrument related risks. The Board approves and monitors the risk management process. The types of risk exposure and the way in which such exposure is managed is provided as follows:
Credit Risk
The Company is exposed to credit risk on its bank accounts, investments and accounts receivable. Credit risk exposure on bank accounts and short term investments is limited through maintaining the Company’s balances with high-credit quality financial institutions, maintaining investment policies, assessing institutional exposure and continual discussion with external advisors. Value added tax (“IVA”) receivables are generated on the purchase of supplies and services to produce silver which are refundable from the Mexican government. Trade receivables are generated on the sale of concentrate inventory to reputable metal traders.
Liquidity Risk
The Company ensures that there is sufficient capital in order to meet short term business requirements. The Company’s policy is to invest cash at floating rates of interest, while cash reserves are to be maintained in cash equivalents in order to maintain liquidity after taking into account the Company’s holdings of cash equivalents, money market investments, marketable securities, receivables and available cash under the revolving credit facility. The Company believes that these sources, operating cash flow and its policies will be sufficient to cover the likely short term cash requirements and commitments.
Market Risk
The significant market risk exposures to which the Company is exposed are foreign currency risk, interest rate risk, and commodity price risk.
| MANAGEMENT’S DISCUSSION AND ANALYSIS |
| FOR THE YEAR ENDED DECEMBER 31, 2013 |
| |
Foreign Currency Risk – The Company’s operations in Mexico and Canada make it subject to foreign currency fluctuations. Certain of the Company’s operating expenses are incurred in Mexican pesos and Canadian dollars; therefore the fluctuation of the US dollar in relation to these currencies will consequently have an impact upon the profitability of the Company and may also affect the value of the Company’s assets and the amount of shareholders’ equity. The Company has not entered into any agreements or purchased any instruments to hedge possible currency risks.
Interest Rate Risk – In respect of financial assets, the Company’s policy is to invest cash at floating rates of interest and cash reserves are to be maintained in cash equivalents in order to maintain liquidity. Fluctuations in interest rates impact the value of cash equivalents. The revolving credit facility is subject to interest rate risk as amounts outstanding are subject to charges at a LIBOR-based rate (plus 2.75% to 4.25% depending on financial and operating measures) payable according to the quoted rate term. The interest rate charge for the year was approximately 3.3% . As at December 31, 2013, with other variables unchanged, a 10% increase in the LIBOR rate would be result in additional interest expense of $330,000.
Commodity Price Risk – Gold and silver prices have historically fluctuated significantly and are affected by numerous factors outside of the Company’s control, including, but not limited to , industrial and retail demand, central bank lending, forward sales by producers and speculators, levels of worldwide production, short-term changes in supply and demand because of speculative hedging activities and certain other factors. The Company has not engaged in any hedging activities, other than short term metal derivative transactions less than 90 days, to reduce its exposure to commodity price risk. Furthermore the Company carries a contingent liability linked to the price of gold. A significant rise in the gold price above $1900.00 could significantly affect the Company’s future earnings (see Contingent Liability on page 37)
Equity Price Risk – Fair values in the Company’s derivative liabilities related to the outstanding share purchase warrants denominated in Canadian dollars are subject to equity price risk. Changes in the market value of the Company’s common shares may have a material effect on the fair value of the Company’s warrants and on net income.
Outstanding Share Data
As of March 5, 2014, the Company had the following securities issued and outstanding:
- 101,140,314 common shares
- 5,495,550 stock options with a weighted average exercise price of CAN$5.35 per share expiring between June 22, 2014 and May 22, 2018.
The Company considers the items included in the consolidated statement of shareholders’ equity as capital. The Company’s objective when managing capital is to safeguard its ability to continue as a going concern so that it can continue to provide returns for shareholders and benefits for other stakeholders. The Company manages the capital structure and makes adjustments to it in light of changes in economic conditions and the risk characteristics of the underlying assets. In order to maintain or adjust the capital structure, the Company may issue new shares through private placements, prospectus offerings, convertible debentures, asset acquisitions or return capital to shareholders. The Company is not subject to externally imposed capital requirements.
| MANAGEMENT’S DISCUSSION AND ANALYSIS |
| FOR THE YEAR ENDED DECEMBER 31, 2013 |
| |
CHANGES IN ACCOUNTING POLICIES & CRITICAL ACCOUNTING ESTIMATES
Changes in Accounting Policies
The Company has adopted the following new standards, along with any consequential amendments, effective January 1, 2013. These changes were made in accordance with the applicable transitional provisions.
Several other new standards and amendments came into effect on January 1, 2013; however, they do not impact the condensed consolidated interim financial statements and are not anticipated to impact the Company’s annual consolidated financial statements.
The nature and impact of each new standard and amendment applicable to the Company are described below:
IAS 1Presentation of Items of Other Comprehensive Income (Amendment)
The amendments to IAS 1 introduce a grouping of items presented in other comprehensive income (OCI). Items that could be reclassified to profit or loss at a future point in time (e.g. net gain or loss on available-for-sale financial assets) shall be presented separately from items that will never be reclassified. This amendment has no impact on the Company’s presentation as the components of OCI pertain only to net gains or losses on marketable securities classified as available-for-sale financial assets.
IFRS 10 Consolidated Financial Statements
In May 2011, the IASB issued IFRS 10 Consolidated Financial Statements to replace IAS 27 Consolidated and Separate Financial Statements and SIC 12 Consolidation – Special Purpose Entities. The new consolidation standard changes the definition of control so that the same criteria apply to all entities, both operating and special purpose entities, to determine control. The revised definition focuses on the need to have both power and variable returns before control is present. The adoption of IFRS 10 did not result in any change in the consolidation status of any of the Company’s subsidiaries or investees.
IFRS 11 Joint Arrangements
In May 2011, the IASB issued IFRS 11 Joint Arrangements to replace IAS 31, Interests in Joint Ventures. The new standard defines two types of arrangements: Joint Operations and Joint Ventures. The focus of the standard is to reflect the rights and obligations of the parties involved in the joint arrangement, regardless of whether the joint arrangement operates through a separate legal entity. Joint arrangements that are classified as joint ventures are accounted for using the equity method of accounting. Joint arrangements that are classified as joint operations require the venturers to recognize the individual assets, liabilities, revenues and expenses to which they have legal rights or are responsible. The adoption of IFRS 11 did not result in any changes to the Company’s condensed consolidated interim financial statements.
IFRS 12 Disclosure of Interests in Other Entities
In May 2011, the IASB issued IFRS 12 Disclosure of Interests in Other Entities to create a comprehensive disclosure standard to address the requirements for subsidiaries, joint arrangements and associates including the reporting entity’s involvement with other entities. It also includes the requirements for unconsolidated structured entities (i.e. special purpose entities). Endeavour has adopted IFRS 12 effective January 1, 2013. The adoption of IFRS 12 did not result in any changes to the Company’s consolidated financial statements.
IFRS 13 Fair Value Measurement
In May 2011, the IASB issued IFRS 13 Fair Value Measurement as a single source of guidance for all fair value measurements required by IFRS to reduce the complexity and improve consistency across its application. The standard provides a definition of fair value and guidance on how to measure fair value as well as a requirement for enhanced disclosures. Endeavour has adopted IFRS 13 on a prospective basis.
| MANAGEMENT’S DISCUSSION AND ANALYSIS |
| FOR THE YEAR ENDED DECEMBER 31, 2013 |
| |
IFRS 13 also requires specific disclosures on fair values, some of which replace existing disclosure requirements in other standards, including IFRS 7Financial Instruments: Disclosures. Some of these disclosures are specifically required by IAS 34 for financial instruments, thereby affecting the condensed consolidated interim financial statements.
Recently released IFRS accounting standards
Changes in Accounting Standards
A number of new standards, amendments to standards and interpretations, are not yet effective for the year ending December 31, 2013, and have not been applied in preparing these consolidated financial statements. The following pronouncements are those that the Company considers most significant and are not intended to be a complete list of new pronouncements that may affect the financial statements.
IFRS 9 Financial Instruments
In November 2009, the IASB issued IFRS 9 Financial Instruments as the first step in its project to replace IAS 39 Financial Instruments: Recognition and Measurement. IFRS 9 retains but simplifies the mixed measurement model and establishes two primary measurement categories for financial assets: amortized cost and fair value. The basis of classification depends on an entity’s business model and the contractual cash flows of the financial asset. Classification is made at the time the financial asset is initially recognized, namely when the entity becomes a party to the contractual provisions of the instrument.
IFRS 9 amends some of the requirements of IFRS 7 Financial Instruments: Disclosures, including added disclosures about investments in equity instruments measured at fair value in OCI, and guidance on the measurement of financial liabilities and de-recognition of financial instruments. In December 2011, the IASB issued an amendment that adjusted the mandatory effective date of IFRS 9 from January 1, 2013 to January 1, 2018. Endeavour is currently assessing the impact of adopting IFRS 9 on Endeavour’s consolidated financial statements, including the applicability of early adoption.
Critical Accounting Estimates
The preparation of financial statements requires the Company to make estimates that affect the reported amounts of assets and liabilities and disclosure of contingent assets and liabilities at the date of the financial statements and the reported amounts of revenues and expenses during the reporting period. Significant areas requiring the use of management judgement relate to the determination of mineralized reserves, plant and equipment lives, estimating the fair values of financial instruments and derivatives, estimating the fair value of convertible debenture components, impairment of long-lived assets, reclamation and rehabilitation provisions, recognition of deferred tax assets, and assumptions used in determining the fair value of non-cash share-based compensation.
Mineralized Reserves and Impairment of Long Lived Assets
Management periodically reviews the carrying value of its mineral properties with internal and external mining related professionals. A decision to abandon, reduce or expand a specific project is based upon many factors including general and specific assessments of reserves, anticipated future prices, anticipated future costs of exploring, developing and operating a producing mine, expiration term and ongoing expense of maintaining leased mineral properties and the period for properties with unproven reserves. However, properties which have not demonstrated suitable mineral concentrations at the conclusion of each phase of an exploration program are re-evaluated to determine if future exploration is warranted and their carrying values are appropriate.
The recoverable amounts of the Company’s CGUs, which include mining properties, plant and equipment and allocated goodwill, are determined on an annual basis and circumstances result in impairment indicators. As at December 31, 2013, the Company determined there were several indicators of potential impairment of its producing mineral properties which include the sustained decline in precious metal prices, the Mexican tax reform (see page 30) and a reduction of the estimated reserves and resources. The recoverable amounts are based on each CGUs future cash flows expected to be derived from the Company’s mining properties and represents each CGUs fair value in use. The cash flows are determined based on the life-of-mine after tax cash flow forecast which incorporate management’s best estimates of future metal prices, production based on current estimates of recoverable reserves and resources, exploration potential, future operating costs and non-expansionary capital expenditures.
| MANAGEMENT’S DISCUSSION AND ANALYSIS |
| FOR THE YEAR ENDED DECEMBER 31, 2013 |
| |
If an area of interest is abandoned or it is determined that its carrying value cannot be supported by future production or sale, the related costs are charged against operations in the period of abandonment or determination that the carrying value exceeds its fair value. The amounts recorded as mineral properties represent costs incurred to date and do not necessarily reflect present or future values.
Provision for Reclamation and Rehabilitation
Reclamation and closure costs have been estimated based on the Company’s interpretation of current regulatory requirements, however changes in regulatory requirements and new information may result in revisions to estimates. The Company recognized the present value of liabilities for reclamation and closure costs in the period in which they are incurred. These obligations are measured initially at fair value and the resulting costs capitalized to the carrying value of the related asset. In subsequent periods, the liability is adjusted for any changes in the amount or timing and for the accretion of discounted underlying future cash flows. The capitalized asset retirement cost is amortized to operations over the life of the asset.
Deferred Income Taxes
The Company follows the asset and liability method of accounting for income taxes. Under this method, future tax assets and liabilities are recognized for the future tax consequences attributable to differences between the financial statement carrying amounts of existing assets and liabilities and their respective tax bases, and losses carried forward. Future tax assets and liabilities are measured using substantively enacted or enacted tax rates expected to apply to taxable income in the years in which those temporary differences are expected to be recovered or settled. The effect on future tax assets and liabilities of a change in tax rates is recognized in income in the period that includes the substantive enactment date. Future tax assets are recognized to the extent that they are considered more likely than not to be realized.
The future income tax provision also incorporates management’s estimates regarding the utilization of tax loss carry forwards, which are dependent on future operating performance and transactions.
Share-based Compensation
The Company has a share option plan and records all share-based compensation for options using the fair value method. The fair value of each option award is estimated on the date of the grant using the Black-Scholes option pricing model, with expected volatility based on historical volatility of Endeavour’s stock. The Company uses historical data to estimate the term of the option and the risk free rate for the expected term of the option is based on the Government of Canada yield curve in effect at the time of the grant.
Warrant Derivative Liability
Equity offerings were completed in previous periods whereby warrants were issued with exercise prices denominated in Canadian dollars. As the warrants have an exercise price denominated in a currency which is different to the functional currency of the Company (US dollar), the warrants are treated as a financial liability. The Company’s share purchase warrants are classified and accounted for as a financial liability at fair value with adjustments recognized through net earnings. The publicly traded warrants and warrants with similar characteristics were valued using the quoted market price as of exercise or at period end. For the non-publicly traded warrants, the Company uses Black-Scholes option pricing model to determine the fair value of the Canadian dollar denominated warrants.
Business Combinations
On the acquisition of a business, the acquisition method of accounting is used, whereby the purchase consideration is allocated to the identifiable assets, liabilities and contingent liabilities (identifiable net assets) on the basis of fair value at the date of acquisition. When the cost of acquisition exceeds the fair values attributable to the Company’s share of identifiable net assets, the difference is treated as purchased goodwill, which is not amortized but is reviewed for impairment annually or more frequently where there is an indication of impairment. If the fair value attributable to the Company’s share of the identifiable net assets exceeds the cost of acquisition, the difference is immediately recognized in the income statement. Incremental costs related to acquisitions are expensed as incurred.
| MANAGEMENT’S DISCUSSION AND ANALYSIS |
| FOR THE YEAR ENDED DECEMBER 31, 2013 |
| |
Determination of the fair value of assets acquired and liabilities assumed and the resulting goodwill, if any, requires that management make estimates based on the information provided by the acquiree. Changes to the provisional values of assets acquired and liabilities assumed, deferred income taxes and resulting goodwill, if any, will be adjusted when the final measurements are determined (within one year of acquisition date).
When purchase consideration is contingent on future events, the initial cost of the acquisition recorded includes an estimate of the fair value of the contingent amounts expected to be payable in the future. When the fair value of contingent consideration as at the date of acquisition is finalized, before the end of the 12 month measurement period, the adjustment is allocated to the identifiable assets acquired and liabilities assumed. Changes to the estimated fair value of contingent consideration subsequent to the acquisition date are recorded in the consolidated statement of comprehensive income.
RISKS AND UNCERTAINTIES
Precious and Base Metal Price Fluctuations
The profitability of the precious metals operations in which the Company has an interest will be significantly affected by changes in the market prices of precious metals. Prices for precious metals fluctuate on a daily basis, have historically been subject to wide fluctuations and are affected by numerous factors beyond the control of the Company such as the level of interest rates, the rate of inflation, central bank transactions, world supply of the precious metals, foreign currency exchange rates, international investments, monetary systems, speculative activities, international economic conditions and political developments. The exact effect of these factors cannot be accurately predicted, but the combination of these factors may result in the Company not receiving adequate returns on invested capital or the investments retaining their respective values. Declining market prices for these metals could materially adversely affect the Company’s operations and profitability.
Fluctuations in the price of consumed commodities
Prices and availability of commodities consumed or used in connection with exploration, development and mining, such as natural gas, diesel, oil, electricity, cyanide and other re-agents fluctuate affecting the costs of production at our operations. These fluctuations can be unpredictable, can occur over short periods of time and may have a materially adverse impact on our operating costs or the timing and costs of various projects. Our general policy is not to hedge our exposure to changes in prices of the commodities that we use in our business.
Foreign Exchange Rate Fluctuations
Operations in Mexico and Canada are subject to foreign currency exchange fluctuations. The Company raises its funds through equity issuances which are priced in Canadian dollars, and the majority of the exploration costs of the Company are denominated in United States dollars and Mexican pesos. The Company may suffer losses due to adverse foreign currency fluctuations.
Competitive Conditions
Significant competition exists for natural resource acquisition opportunities. As a result of this competition, some of which is with large, well established mining companies with substantial capabilities and significant financial and technical resources, the Company may be unable to either compete for or acquire rights to exploit additional attractive mining properties on terms it considers acceptable. Accordingly, there can be no assurance that the Company will be able to acquire any interest in additional projects that would yield reserves or results for commercial mining operations.
Operating Hazards and Risks
Mining operations generally involve a high degree of risk, which even a combination of experience, knowledge and careful evaluation may not be able to overcome. These risks include, but are not limited to, the following: environmental hazards, industrial accidents, third party accidents, unusual or unexpected geological structures or formations, fires, power outages, labour disruptions, floods, explosions, cave-ins, land-slides, acts of God, periodic interruptions due to inclement or hazardous weather conditions, earthquakes, war, rebellion, revolution, delays in transportation, inaccessibility to property, restrictions of courts and/or government authorities, other restrictive matters beyond the reasonable control of the Company, and the inability to obtain suitable or adequate machinery, equipment or labour and other risks involved in the operation of mines.
| MANAGEMENT’S DISCUSSION AND ANALYSIS |
| FOR THE YEAR ENDED DECEMBER 31, 2013 |
| |
Operations in which the Company has a direct or indirect interest will be subject to all the hazards and risks normally incidental to exploration, development and production of precious and base metals, any of which could result in work stoppages, delayed production and resultant losses, increased production costs, asset write downs, damage to or destruction of mines and other producing facilities, damage to life and property, environmental damage and possible legal liability for any or all damages. The Company may become subject to liability for pollution, cave-ins or hazards against which it cannot insure or against which it may elect not to insure. Any compensation for such liabilities may have a material, adverse effect on the Company’s financial position.
Our property, business interruption and liability insurance may not provide sufficient coverage for losses related to these or other hazards. Insurance against certain risks, including certain liabilities for environmental pollution, may not be available to us or to other companies within the industry at reasonable terms or at all. In addition, our insurance coverage may not continue to be available at economically feasible premiums, or at all. Any such event could have a material adverse effect on our business.
Mining Operations
The capital costs required by the Company’s projects may be significantly higher than anticipated. Capital and operating costs, production and economic returns, and other estimates contained in the Company’s current technical reports, may differ significantly from those provided for in future studies and estimates and from management guidance, and there can be no assurance that the Company’s actual capital and operating costs will not be higher than currently anticipated. In addition, delays to construction and exploration schedules may negatively impact the net present value and internal rates of return of the Company’s mineral properties as set forth in the applicable technical report. Similarly, there can be no assurance that historical rates of production, grades of ore processed, rates of recoveries or mining cash costs will not experience fluctuations or differ significantly from current levels over the course of the mining operations conducted by the Company.
In addition, there can be no assurance that the Company will be able to continue to extend the production from its current operations through exploration and drilling programs.
Infrastructure
Mining, processing, development and exploration activities depend, to one degree or another, on adequate infrastructure. Reliable roads, bridges, power sources and water supply are important determinants, which affect capital and operating costs. The lack of availability on acceptable terms or the delay in the availability of any one or more of these items could prevent or delay exploitation or development of the Company’s projects. If adequate infrastructure is not available in a timely manner, there can be no assurance that the exploitation or development of the Company’s projects will be commenced or completed on a timely basis, if at all; the resulting operations will achieve the anticipated production volume, or the construction costs and ongoing operating costs associated with the exploitation and/or development of the Company’s advanced projects will not be higher than anticipated. In addition, unusual or infrequent weather phenomena, sabotage, government or other interference in the maintenance or provision of such infrastructure could adversely affect the Company’s operations and profitability.
Exploration and Development
There is no assurance given by the Company that its exploration and development programs and properties will result in the discovery, development or production of a commercially viable ore body or yield new reserves to replace or expand current reserves.
The business of exploration for minerals and mining involves a high degree of risk. Few properties that are explored are ultimately developed into producing mines. At this time, apart from the mineral reserves on the Company’s Guanacevi Mines, Bolañitos Mines and El Cubo Mines none of the Company’s properties have any defined ore-bodies with proven reserves.
| MANAGEMENT’S DISCUSSION AND ANALYSIS |
| FOR THE YEAR ENDED DECEMBER 31, 2013 |
| |
The economics of developing silver, gold and other mineral properties are affected by many factors including capital and operating costs, variations of the tonnage and grade of ore mined, fluctuating mineral markets, and such other factors as government regulations, including regulations relating to royalties, allowable production, importing and exporting of minerals and environmental protection. Depending on the prices of silver, gold or other minerals produced, the Company may determine that it is impractical to commence or continue commercial production. Substantial expenditures are required to discover an ore-body, to establish reserves, to identify the appropriate metallurgical processes to extract metal from ore, and to develop the mining and processing facilities and infrastructure. The marketability of any minerals acquired or discovered may be affected by numerous factors which are beyond the Company’s control and which cannot be accurately foreseen or predicted, such as market fluctuations, conditions for precious and base metals, the proximity and capacity of milling and smelting facilities, and such other factors as government regulations, including regulations relating to royalties, allowable production, importing and exporting minerals and environmental protection. In order to commence exploitation of certain properties presently held under exploration concessions, it is necessary for the Company to apply for an exploitation concession. There can be no guarantee that such a concession will be granted. Unsuccessful exploration or development programs could have a material adverse impact on the Company’s operations and profitability.
Calculation of Reserves and Resources and Precious Metal Recoveries
There is a degree of uncertainty attributable to the calculation and estimation of reserves and resources and their corresponding metal grades to be mined and recovered. Until reserves or resources are actually mined and processed, the quantities of mineralization and metal grades must be considered as estimates only. Any material change in the quantity of mineral reserves, mineral resources, grades and recoveries may affect the economic viability of the Company’s properties.
Replacement of Reserves and Resources
The Guanacevi, Bolañitos and El Cubo mines are the Company’s current sources of production. Current life-of-mine plans provide for a defined production life for mining at the Company’s mines. If the Company’s mineral reserves and resources are not replaced either by the development or discovery of additional reserves and/or extension of the life-of-mine at its current operating mines or through the acquisition or development of an additional producing mine, this could have an adverse impact on the Company’s future cash flows, earnings, financial performance and financial condition, including as a result of requirements to expend funds for reclamation and decommissioning.
Acquisition Strategy
As part of the Company’s business strategy, it has sought and will continue to seek new mining and development opportunities in the mining industry. In pursuit of such opportunities, it may fail to select appropriate acquisition candidates, negotiate appropriate acquisition terms, conduct sufficient due diligence to determine all related liabilities or to negotiate favourable financing terms. The Company may encounter difficulties in transitioning the business, including issues with the integration of the acquired businesses or its personnel into the Company. The Company cannot assure that it can complete any acquisition or business arrangement that it pursues, or is pursuing, on favourable terms, or that any acquisitions or business arrangements completed will ultimately benefit its business.
Integration of New Acquisitions
The Company’s success at completing any acquisitions will depend on a number of factors, including, but not limited to: identifying acquisitions which fit the Company’s strategy; negotiating acceptable terms with the seller of the business or property to be acquired; and obtaining approval from regulatory authorities in the jurisdictions of the business or property to be acquired.
The positive effect on the Company’s results arising from past and future acquisitions will depend on a variety of factors, including, but not limited to: assimilating the operations of an acquired business or property in a timely and efficient manner including the existing work force, union arrangements and existing contracts; maintaining the Company’s financial and strategic focus while integrating the acquired business or property; implementing uniform standards, controls, procedures and policies at the acquired business, as appropriate; and to the extent that the Company makes an acquisition outside of markets in which it has previously operated, conducting and managing operations in a new operating environment and under a new regulatory regime where it has no direct experience.
| MANAGEMENT’S DISCUSSION AND ANALYSIS |
| FOR THE YEAR ENDED DECEMBER 31, 2013 |
| |
Past and future business or property acquisitions could place increased pressure on the Company’s cash flow if such acquisitions involve cash consideration or the assumption of obligations requiring cash payments. The integration of the Company’s existing operations with any acquired business will require significant expenditures of time, attention and funds. Achievement of the benefits expected from consolidation would require the Company to incur significant costs in connection with, among other things, implementing financial and planning systems.
The Company may not be able to integrate the operations of a recently acquired business or restructure the Company’s previously existing business operations without encountering difficulties and delays. In addition, this integration may require significant attention from the Company’s management team, which may detract attention from the Company’s day-to-day operations. Over the short-term, difficulties associated with integration could have a material adverse effect on the Company’s business, operating results, financial condition and the price of the Company’s common shares. In addition, the acquisition of mineral properties may subject the Company to unforeseen liabilities, including environmental liabilities.
Foreign Operations
The Company’s operations are currently conducted through subsidiaries principally in Mexico and, as such, its operations are exposed to various levels of political, economic and other risks and uncertainties which could result in work stoppages, blockades of the Company’s mining operations and appropriation of assets. Some of the Company’s operations are located in areas where Mexican drug cartels operate. These risks and uncertainties vary from region to region and include, but are not limited to, terrorism; hostage taking; local drug gang activities; military repression; expropriation; extreme fluctuations in currency exchange rates; high rates of inflation; labour unrest; the risks of war or civil unrest; renegotiation or nullification of existing concessions, licenses, permits and contracts; illegal mining; changes in taxation policies; restrictions on foreign exchange and repatriation; and changing political conditions, currency controls and governmental regulations that favour or require the awarding of contracts to local contractors or require foreign contractors to employ citizens of, or purchase supplies from, a particular jurisdiction.
Local opposition to mine development projects could arise in Mexico, and such opposition could be violent. There can be no assurance that such local opposition will not arise with respect to the Company’s Mexican operations. If the Company were to experience resistance or unrest in connection with its Mexican operations, it could have a material adverse effect on its operations and profitability.
To the extent the Company acquires mineral properties in jurisdictions other than Mexico; it may be subject to similar and additional risks with respect to its operations in those jurisdictions.
Government Regulation
The Company’s operations, exploration and development activities are subject to extensive foreign federal, state and local laws and regulations governing such matters as environmental protection, management and use of toxic substances and explosives, management of natural resources, health, exploration and development of mines, production and post-closure reclamation, safety and labour, mining law reform, price controls import and export laws, taxation, maintenance of claims, tenure, government royalties and expropriation of property. There is no assurance that future changes in such regulation, if any, will not adversely affect the Company’s operations. The activities of the Company require licenses and permits from various governmental authorities.
The costs associated with compliance with these laws and regulations are substantial and possible future laws and regulations, changes to existing laws and regulations and more stringent enforcement of current laws and regulations by governmental authorities, could cause additional expenses, capital expenditures, restrictions on or suspensions of the Company’s operations and delays in the development of its properties. Moreover, these laws and regulations may allow governmental authorities and private parties to bring lawsuits based upon damages to property and injury to persons resulting from the environmental, health and safety practices of the Company’s past and current operations, or possibly even those actions of parties from whom the Company acquired its mines or properties, and could lead to the imposition of substantial fines, penalties or other civil or criminal sanctions. The Company retains competent and well trained individuals and consultants in jurisdictions in which it does business, however, even with the application of considerable skill the Company may inadvertently fail to comply with certain laws. Such events can lead to financial restatements, fines, penalties, and other material negative impacts on the Company.
| MANAGEMENT’S DISCUSSION AND ANALYSIS |
| FOR THE YEAR ENDED DECEMBER 31, 2013 |
| |
Mexican Tax Assessments
As disclosed under “Contingencies”, one subsidiary of the Company in Mexico has received a tax assessment from Mexican fiscal authorities. While the Company is of the view that the tax assessment has no legal merit and is contesting it, there is no assurance that the Company will be successful or that the Company will not have to pay the full amount of the assessment plus interest and penalties. In the event the Company is unsuccessful, this could negatively impact the Company’s financial position and create difficulties for the Company in the future in dealing with Mexican fiscal authorities. As a result of a detailed review of the Company’s financial information and delivery of appropriate requested documents to the Mexican fiscal authorities, the Company has estimated that there is no material potential tax exposure arising under the assessment.
Obtaining and Renewing of Government Permits
In the ordinary course of business, the Company is required to obtain and renew government permits for the operation and expansion of existing operations or for the development, construction and commencement of new operations. Obtaining or renewing the necessary governmental permits is a complex and time-consuming process involving numerous jurisdictions and possibly involving public hearings and costly undertakings on the Company’s part. The duration and success of the Company’s efforts to obtain and renew permits are contingent upon many variables not within its control including the interpretation of applicable requirements implemented by the permitting authority. The Company may not be able to obtain or renew permits that are necessary to its operations, or the cost to obtain or renew permits may exceed what the Company believes it can recover from a given property once in production. Any unexpected delays or costs associated with the permitting process could delay the development or impede the operation of a mine, which could adversely impact the Company’s operations and profitability.
Environmental Factors
All phases of the Company’s operations are subject to environmental regulation in the various jurisdictions in which it operates. Environmental legislation is evolving in a manner which will require stricter standards and enforcement, increased fines and penalties for non-compliance, more stringent environmental assessments of proposed projects and a heightened degree of responsibility for companies and their officers, directors and employees. There is no assurance that any future changes in environmental regulation will not adversely affect the Company’s operations. The costs of compliance with changes in government regulations have the potential to reduce the profitability of future operations. Environmental hazards that may have been caused by previous or existing owners or operators may exist on the Company’s mineral properties, but are unknown to the Company at present.
Title to Assets
Although the Company has or will receive title opinions for any properties in which it has a material interest, there is no guarantee that title to such properties will not be challenged or impugned. The Company has not conducted surveys of the claims in which it holds direct or indirect interests and, therefore, the precise area and location of such claims may be in doubt. The Company’s claims may be subject to prior unregistered agreements or transfers or native land claims and title may be affected by unidentified or unknown defects. The Company has conducted as thorough an investigation as possible on the title of properties that it has acquired or will be acquiring to be certain that there are no other claims or agreements that could affect its title to the concessions or claims. If title to the Company’s properties is disputed it may result in the Company paying substantial costs to settle the dispute or clear title and could result in the loss of the property, which events may affect the economic viability of the Company.
Employee Recruitment and Retention
Recruiting and retaining qualified personnel is critical to the Company’s success. The Company is dependent on the services of key executives including the Company’s President and Chief Executive Officer and other highly skilled and experienced executives and personnel focused on managing the Company’s interests. The number of persons skilled in acquisition, exploration, development and operation of mining properties are limited and competition for such persons is intense. As the Company’s business activity grows, the Company will require additional key financial, administrative and mining personnel as well as additional operations staff. We could experience increases in our recruiting and training costs and decreases in our operating efficiency, productivity and profit margins. If we are not able to attract, hire and retain qualified personnel, the efficiency of our operations could be impaired, which could have an adverse impact on the Company’s future cash flows, earnings, financial performance and financial condition.
| MANAGEMENT’S DISCUSSION AND ANALYSIS |
| FOR THE YEAR ENDED DECEMBER 31, 2013 |
| |
Potential Conflicts of Interest
The directors and officers of the Company may serve as directors and/or officers of other public and private companies, and may devote a portion of their time to manage other business interests. This may result in certain conflicts of interest. To the extent that such other companies may participate in ventures in which the Company is also participating, such directors and officers of the Company may have a conflict of interest in negotiating and reaching an agreement with respect to the extent of each company’s participation. The laws of British Columbia, Canada, require the directors and officers to act honestly, in good faith, and in the best interests of the Company and its shareholders. However, in conflict of interest situations, directors and officers of the Company may owe the same duty to another company and will need to balance the competing obligations and liabilities of their actions.
There is no assurance that the needs of the Company will receive priority in all cases. From time to time, several companies may participate together in the acquisition, exploration and development of natural resource properties, thereby allowing these companies to: (i) participate in larger properties and programs; (ii) acquire an interest in a greater number of properties and programs; and (iii) reduce their financial exposure to any one property or program. A particular company may assign, at its cost, all or a portion of its interests in a particular program to another affiliated company due to the financial position of the company making the assignment. In determining whether or not the Company will participate in a particular program and the interest therein to be acquired by it, it is expected that the directors and officers of the Company will primarily consider the degree of risk to which the Company may be exposed and its financial position at that time.
Third Party Reliance
The Company’s rights to acquire interests in certain mineral properties have been granted by third parties who themselves may hold only an option to acquire such properties. As a result, the Company may have no direct contractual relationship with the underlying property holder.
Absolute Assurance on Financial Statements
We prepare our financial reports in accordance with accounting policies and methods prescribed by International Financial Reporting Standards. In the preparation of financial reports, management may need to rely upon assumptions, make estimates or use their best judgment in determining the financial condition of the Company. Significant accounting policies and practices are described in more detail in the notes to our annual consolidated financial statements for the year ended December 31, 2013. In order to have a reasonable level of assurance that financial transactions are properly authorized, assets are safeguarded against unauthorized or improper use and transactions are properly recorded and reported, we have implemented and continue to analyze our internal control systems for financial reporting. Although we believe our financial reporting and financial statements are prepared with reasonable safeguards to ensure reliability, we cannot provide absolute assurance in that regard.
General Economic Conditions
The unprecedented events in global financial markets during the last few years have had a profound effect on the global economy. Many industries, including the gold and silver mining industry, are affected by these market conditions. Some of the key effects of the current financial market turmoil include contraction in credit markets resulting in a widening of credit risk, devaluations and high volatility in global equity, commodity, foreign exchange and precious metal markets, and a lack of market liquidity. A continued or worsened slowdown in the financial markets or other economic conditions, including but not limited to, consumer spending, employment rates, business conditions, inflation, fuel and energy costs, consumer debt levels, lack of available credit, the state of the financial markets, interest rates, and tax rates may adversely affect the Company’s growth and profitability.
Specifically:
•the global credit/liquidity crisis could affect the cost and availability of financing and our overall liquidity;
•the volatility of gold and silver prices affects our revenues, profits and cash flow;
•volatile energy prices, commodity and consumables prices and currency exchange rates affect our production costs;
•the devaluation and volatility of global stock markets affects the valuation of our equity securities.
These factors could have a material adverse effect on the Company’s financial condition and financial performance.
| MANAGEMENT’S DISCUSSION AND ANALYSIS |
| FOR THE YEAR ENDED DECEMBER 31, 2013 |
| |
Substantial Volatility of Share Price
In recent years, the securities markets in the United States and Canada have experienced a high level of price and volume volatility, and the securities of many mineral exploration companies have experienced wide fluctuations in price which have not necessarily been related to the operating performance, underlying asset values or prospects of such companies. The price of the Company’s common shares is also likely to be significantly affected by short-term changes in mineral prices or in the Company’s financial condition or financial performance as reflected in its quarterly financial reports. Other factors unrelated to the Company’s performance that may have an effect on the price of its common shares include the following: the extent of analytical coverage available to investors concerning the Company’s business may be limited if investment banks with research capabilities do not follow the Company’s securities; lessening in trading volume and general market interest in the Company’s securities may affect an investor’s ability to trade significant numbers of the Company’s common shares; the size of the Company’s public float may limit the ability of some institutions to invest in the Company’s securities; and a substantial decline in the price of the Company’s common shares that persists for a significant period of time could cause the Company’s securities to be delisted from the Toronto Stock Exchange and New York Stock Exchange, further reducing market liquidity.
Differences in U.S. and Canadian reporting of reserves and resources
The Company’s reserve and resource estimates are not directly comparable to those made in filings subject to SEC reporting and disclosure requirements as the Company generally reports reserves and resources in accordance with Canadian practices. These practices are different from those used to report reserve and resource estimates in reports and other materials filed with the SEC. It is Canadian practice to report measured, indicated and inferred resources, which are not permitted in disclosure filed with the SEC by United States issuers. In the United States, mineralization may not be classified as a "reserve" unless the determination has been made that the mineralization could be economically and legally produced or extracted at the time the reserve determination is made. United States investors are cautioned not to assume that all or any part of measured or indicated resources will ever be converted into reserves.
Further, "inferred resources" have a great amount of uncertainty as to their existence and as to whether they can be mined legally or economically. Disclosure of "contained ounces" is permitted disclosure under Canadian regulations; however, the SEC permits issuers to report "resources" only as in-place tonnage and grade without reference to unit of metal measures.
Accordingly, information concerning descriptions of mineralization, reserves and resources contained in this MD&A, or in the documents incorporated herein by reference, may not be comparable to information made public by United States companies subject to the reporting and disclosure requirements of the SEC.
Adequacy of internal control over financial reporting as per the requirements of the U.S. Sarbanes-Oxley Act
The Company documented and tested, during its most recent fiscal year, its internal control procedures in order to satisfy the requirements of Section 404 of the U.S. Sarbanes-Oxley Act ("SOX"). SOX requires an annual assessment by management of the effectiveness of the Company’s internal control over financial reporting and an attestation report by the Company’s independent auditor addressing this assessment. The Company may fail to achieve and maintain the adequacy of its internal control over financial reporting as such standards are modified, supplemented, or amended from time to time, and the Company may not be able to ensure that it can conclude on an ongoing basis that it has effective internal control over financial reporting in accordance with Section 404 of SOX. The Company’s failure to satisfy the requirements of Section 404 of SOX on an ongoing, timely basis could result in the loss of investor confidence in the reliability of its financial statements, which in turn could harm the Company’s business and negatively affect the trading price of its common shares or market value of its other securities.
In addition, any failure to implement required new or improved controls, or difficulties encountered in their implementation, could harm the Company’s operating results or cause it to fail to meet its reporting obligations. Future acquisitions of companies may provide the Company with challenges in implementing the required processes, procedures and controls in its acquired operations. Acquired companies may not have disclosure controls and procedures or internal control over financial reporting that are as thorough or effective as those required by securities laws currently applicable to the Company.
| MANAGEMENT’S DISCUSSION AND ANALYSIS |
| FOR THE YEAR ENDED DECEMBER 31, 2013 |
| |
No evaluation can provide complete assurance that the Company’s internal control over financial reporting will detect or uncover all failures of persons within the Company to disclose material information required to be reported. The effectiveness of the Company’s control and procedures could also be limited by simple errors or faulty judgments. In addition, as the Company continues to expand, the challenges involved in implementing appropriate internal control over financial reporting will increase and will require that the Company continue to improve its internal control over financial reporting. Although the Company intends to devote substantial time and incur substantial costs, as necessary, to ensure ongoing compliance, the Company cannot be certain that it will be successful in complying with Section 404 of SOX.
Potential dilution of present and prospective shareholdings
In order to finance future operations and development efforts, the Company may raise funds through the issue of common shares or the issue of securities convertible into common shares. The Company cannot predict the size of future issues of common shares or the issue of securities convertible into common shares or the effect, if any, that future issues and sales of the Company’s common shares will have on the market price of its common shares. Any transaction involving the issue of shares, or securities convertible into shares, could result in dilution, possibly substantial, to present and prospective holders of shares.
Lack of Dividends
No dividends on the Company’s common shares have been paid to date. The Company currently plans to retain all future earnings and other cash resources, if any, for the future operation and development of its business. Payment of any future dividends, if any, will be at the discretion of the Board of Directors after taking into account many factors, including the Company’s operating results, financial condition, and current and anticipated cash needs.
Future Sales of Common Shares by Existing Shareholders
Sales of a large number of the Company’s common shares in the public markets, or the potential for such sales, could decrease the trading price of the common shares and could impair the Company’s ability to raise capital through future sales of common shares.
Claims Under U.S. Securities Laws
The enforcement by investors of civil liabilities under the federal securities laws of the United States may be affected adversely by the fact that the Company is incorporated under the laws of British Columbia, Canada, that the independent registered chartered accountants who have audited the Company’s financial statements and some or all of the Company’s directors and officers may be residents of Canada or elsewhere, and that all or a substantial portion of the Company’s assets and said persons are located outside the United States. As a result, it may be difficult for holders of the Company’s common shares to effect service of process within the United States upon people who are not residents of the United States or to realize in the United States upon judgments of courts of the United States predicated upon civil liabilities under the federal securities laws of the United States
From time to time, the Company may use certain financial instruments to manage the risks associated with changes in silver prices, interest rates and foreign currency exchange rates. The use of financial instruments involves certain inherent risks including, among other things: (i) credit risk, the risk of default on amounts owing to the Company by the counterparties with which Company has entered into such transaction; (ii) market liquidity risk, the risk that the Company has entered into a position that cannot be closed out quickly, either by liquidating such financial instrument or by establishing an offsetting position; (iii) unrealized mark-to-market risk, the risk that, in respect of certain financial instruments, an adverse change in market prices for commodities, currencies or interest rates will result in the Company incurring an unrealized mark-to-market loss in respect of such derivative products.
Financial Instruments
From time to time, the Company may use certain financial instruments to manage the risks associated with changes in silver prices, interest rates and foreign currency exchange rates. The use of financial instruments involves certain inherent risks including, among other things: (i) credit risk, the risk of default on amounts owing to the Company by the counterparties with which Company has entered into such transaction; (ii) market liquidity risk, the risk that the Company has entered into a position that cannot be closed out quickly, either by liquidating such financial instrument or by establishing an offsetting position; (iii) unrealized mark-to-market risk, the risk that, in respect of certain financial instruments, an adverse change in market prices for commodities, currencies or interest rates will result in the Company incurring an unrealized mark-to-market loss in respect of such derivative products.
| MANAGEMENT’S DISCUSSION AND ANALYSIS |
| FOR THE YEAR ENDED DECEMBER 31, 2013 |
| |
Financial Reporting Standards
The Company prepares its financial reports in accordance with IFRS applicable to publicly accountable enterprises effective January 1, 2011. In preparation of financial reports, management may need to rely upon assumptions, make estimates or use their best judgment in determining the financial condition of the Company. Significant accounting policies are described in more detail in the Company’s audited financial statements. In order to have a reasonable level of assurance that financial transactions are properly authorized, assets are safeguarded against unauthorized or improper use, transactions are properly recorded and reported and the Company has implemented and continues to analyze its internal control systems for financial reporting. Although the Company believes its financial reporting and financial statements are prepared with reasonable safeguards to ensure reliability, the Company cannot provide absolute assurance.
CONTROLS AND PROCEDURES
The Company’s officers and management are responsible for establishing and maintaining disclosure controls and procedures for the Company. Disclosure controls and procedures are designed to provide reasonable assurance that material information required to be disclosed by the Company under securities legislation is recorded, processed, summarized and reported within the applicable time periods and to ensure that required information is gathered and communicated to the Company’s management, including the Chief Executive Officer (CEO) and Chief Financial Officer (CFO) as is appropriate to permit timely decisions regarding public disclosure. There are inherent limitations to the effectiveness of any system of disclosure controls and procedures. Accordingly, even effective disclosure controls and procedures can only provide reasonable assurance of achieving their control objectives.
At the end of the period covered by this MD&A management, including the CEO and CFO, conducted an evaluation of the effectiveness of the Company’s disclosure controls and procedures pursuant to National Instrument 52-109 “Certification of Disclosure in Issuers Annual and Interim Filings” (“NI 52-109”) and Rule 13a -15(b) of the U.S. Securities Exchange Act of 1934, as amended (the “U.S. Exchange Act”). Based upon that evaluation, the Company’s Chief Executive Officer and Chief Financial Officer have concluded that as of the end of the period covered by this MD&A the Company’s disclosure controls and procedures were effective to give reasonable assurance that the information required to be disclosed by the Company in reports that it files or submits is (i) recorded, processed, summarized and reported, within the time periods specified under applicable securities legislation in Canada and in the U.S. Securities and Exchange Commission’s rules and forms, and (ii) accumulated and communicated to management, including its principal executive and principal financial officers, or persons performing similar functions, as appropriate to allow timely decisions regarding required disclosure.
Management’s Report on Internal Controls over Financial Reporting
Management is responsible for establishing and maintaining adequate internal control over financial reporting (as defined in NI 52-109 and in Rules 13a-15(b) of the U.S. Exchange Act). A company’s internal control over financial reporting is a process designed to provide reasonable assurance regarding the reliability of financial reporting and the preparation of financial statements for external purposes in accordance with applicable generally accepted accounting principles.
A company’s internal control over financial reporting includes those policies and procedures that (i) pertain to the maintenance of records that, in reasonable detail, accurately and fairly reflect the transactions and dispositions of the assets of the company; (ii) provide reasonable assurance that transactions are recorded as necessary to permit preparation of financial statements in accordance with generally accepted accounting principles, and that receipts and expenditures of the company are being made only in accordance with authorizations of management and directors of the company; and (iii) provide reasonable assurance regarding prevention or timely detection of unauthorized acquisition, use, or disposition of the company’s assets that could have a material effect on the financial statements. It should be noted that a control system, no matter how well conceived or operated, can only provide reasonable assurance, not absolute assurance, that the objectives of the control system are met. Also, projections of any evaluation of effectiveness to future periods are subject to the risk that controls may become inadequate because of changes in conditions, or that the degree of compliance with policies and procedures may deteriorate.
| MANAGEMENT’S DISCUSSION AND ANALYSIS |
| FOR THE YEAR ENDED DECEMBER 31, 2013 |
| |
Management, including our Chief Executive Officer and Chief Financial Officer, assessed the effectiveness of our internal control over financial reporting as of December 31, 2013. In making this assessment, management used the criteria set forth in the Internal Control Integrated Framework issued by the Committee of Sponsoring Organizations of the Treadway Commission (COSO). Based on its assessment, management has concluded that, as of December 31, 2013, the Company’s internal control over financial reporting is effective. Also, management determined that there were no material weaknesses in the Company’s internal control over financial reporting as at December 31, 2013.
Changes in Internal Control over Financial Reporting
There have been no changes that occurred during the period covered by this report that have materially affected, or are reasonably likely to materially affect, our internal control over financial reporting.