
| MANAGEMENT’S DISCUSSION AND ANALYSIS |
| FOR THE PERIOD ENDED SEPTEMBER 30, 2014 |
This Management’s Discussion and Analysis (“MD&A”) should be read in conjunction with the condensed consolidated interim financial statements of Endeavour Silver Corp. (“Endeavour” or “the Company”) for the three and nine months ended September 30, 2014 and 2013 and the related notes contained therein, which are prepared in accordance with International Financial Reporting Standards (“IFRS”) as issued by the International Accounting Standards Board (“IASB”). In addition, the following should be read in conjunction with the audited consolidated financial statements for the year ended December 31, 2013 and the related MD&A. Additional information relating to the Company, including the most recent Annual Information Form, is available on SEDAR at www.sedar.com, and the Company’s most recent annual report on Form 40-F has been filed with the US Securities and Exchange Commission (the “SEC”). This MD&A contains “forward-looking statements” that are subject to risk factors set out in a cautionary note contained herein. All dollar amounts are expressed in United States (“US”) dollars and tabular amounts are expressed in thousands of dollars unless otherwise indicated. This MD&A is dated as of November 4, 2014 and all information contained is current as of November 4, 2014 unless otherwise stated.
Cautionary Note to US Investors concerning Estimates of Reserves and Measured, Indicated and Inferred Resources:
This MD&A has been prepared in accordance with the requirements of the securities laws in effect in Canada, which differ from the requirements of USsecurities laws. The terms “mineral reserve”, “proven mineral reserve” and “probable mineral reserve” are Canadian mining terms as defined in accordance with Canadian NationalInstrument 43-101–Standards of Disclosure for Mineral Projects (“NI 43-101”) and the Canadian Institute of Mining, Metallurgy and Petroleum (the “CIM”)- CIM Definition Standards on Mineral Resources and Mineral Reserves, adopted by the CIM Council, as amended. These definitions differ from the definitions in SEC Industry Guide 7 under the US Securities Act of 1933, as amended (the “Securities Act”).
Under SEC Industry Guide 7 standards, a “final” or “bankable” feasibility study is required to report reserves, thethree-year historical average price is used in any reserve or cash flow analysis to designate reserves and the primary environmental analysis or report must be filed with the appropriate governmental authority.
In addition, the terms “mineral resource”, “measured mineral resource”, “indicated mineral resource” and “inferredmineral resource” are defined in and required to be disclosed by NI 43-101; however, these terms are not defined terms under SEC Industry Guide 7 and are normally not permitted to be used in reports and registration statements filed with the SEC. Investors are cautioned not to assume that any part or all of mineral deposits in these categorieswill ever be converted into reserves. “Inferred mineral resources” have a great amount of uncertainty as to theirexistence, and great uncertainty as to their economic and legal feasibility. It cannot be assumed that all or any part of an inferred mineral resource will ever be upgraded to a higher category. Under Canadian rules, estimates of inferred mineral resources may not form the basis of feasibility or pre-feasibility studies, except in rare cases. Investors are cautioned not to assume that all or any part of an inferred mineral resource exists or is economicallyor legally mineable. Disclosure of “contained ounces” in a resource is permitted disclosure under Canadian regulations; however, the SEC normally only permits issuers to report mineralization that does not constitute“reserves” by SEC Industry Guide 7 standards as in place tonnage and grade without reference to unit measures.
Accordingly, information contained in this MD&A contains descriptions ofEndeavour’s mineral deposits that may not be comparable to similar information made public by US companies subject to the reporting and disclosure requirements under the US federal securities laws and the rules and regulations thereunder.
| 700 West Pender Street, Suite 301, Vancouver, B.C., Canada V6C 1G8 |
| Phone: 604.685.9775 | Fax: 604.685.9744| Toll Free: 1.877.685.9775| Email: info@edrsilver.com |
| www.edrsilver.com |
| MANAGEMENT’S DISCUSSION AND ANALYSIS |
| FOR THE PERIOD ENDED SEPTEMBER 30, 2014 |
Forward-Looking Statements
This MD&A contains “forward-looking statements” within the meaning of the United States Private Securities Litigation Reform Act of 1995 and “forward-lookinginformation” within the meaning of applicable Canadiansecurities legislation.Such forward-looking statements and information herein include, but are not limited to,statements regarding Endeavour’s anticipated performance in 2014, including silver and gold production, timing and expenditures to develop new silver mines and mineralized zones, silver and gold grades and recoveries, cash costs per ounce, capital expenditures and sustaining capital.Forward-looking statements are frequently characterized by words such as“plan”,“expect”,“forecast”,“project”,”intend”,”believe”,”anticipate”, “outlook” and other similar words, or statements that certain events or conditions“may” or“will” occur. Forward- looking statements are based on the opinions and estimates of management at the dates the statements are made, and are subject to a variety of risks and uncertainties and other factors that could cause actual events or results to differ materially from those projected in the forward-looking statements.
The Company does not intend to, and does not assume any obligation to update such forward-looking statements or information, other than as required by applicable law. Forward-looking statements or information involve known and unknown risks, uncertainties and other factors that may cause the actual results, level of activity, performance or achievements of the Company and its operations to be materially different from those expressed or implied by such statements. Such factors include, among others: fluctuations in the prices of silver and gold, fluctuations in the currency markets (particularly the Mexican peso, Canadian dollar and U.S. dollar); changes in national and local governments, legislation, taxation, controls, regulations and political or economic developments in Canada and Mexico; operating or technical difficulties in mineral exploration, development and mining activities; risks and hazards of mineral exploration, development and mining (including, but not limited to environmental hazards, industrial accidents, unusual or unexpected geological conditions, pressures, cave-ins and flooding); inadequate insurance, or inability to obtain insurance; availability of and costs associated with mining inputs and labour; the speculative nature of mineral exploration and development, diminishing quantities or grades of mineral reserves as properties are mined; the ability to successfully integrate acquisitions; risks in obtaining necessary licenses andpermits, and challenges to the Company’s title to properties; as well as those factors described in the section “risk factors” contained in the Company’s Annual Information Form filed with the Canadian securities regulatoryauthorities and as filed with the SEC in our Annual Report on Form 40-F. Although the Company has attempted to identify important factors that could cause actual results to differ materially from those contained in forward-looking statements or information, there may be other factors that cause results to be materially different from those anticipated, described, estimated, assessed or intended. There can be no assurance that any forward-looking statements or information will prove to be accurate as actual results and future events could differ materially from those anticipated in such statements or information. Accordingly, readers shouldnot place undue reliance on forward-looking statements or information.
Table of Contents
| 2 |
| Three Months Ended Sept 30 | Q3 2014 Highlights | Nine Months Ended Sept 30 | ||||
| 2014 | 2013 | % Change | 2014 | 2013 | % Change | |
| Production | ||||||
| 1,634,294 | 1,855,845 | (12%) | Silver ounces produced | 5,202,902 | 4,881,435 | 7% |
| 14,118 | 22,947 | (38%) | Gold ounces produced | 47,768 | 57,894 | (17%) |
| 1,582,525 | 1,799,695 | (12%) | Payable silver ounces produced | 5,046,879 | 4,739,228 | 6% |
| 13,558 | 22,108 | (39%) | Payable gold ounces produced | 45,961 | 55,658 | (17%) |
| 2,481,374 | 3,232,665 | (23%) | Silver equivalent ounces produced(1) | 8,068,982 | 8,355,075 | (3%) |
| 10.70 | 5.14 | 108% | Cash costs per silver ounce(2)(3) | 8.30 | 8.09 | 3% |
| 19.86 | 13.17 | 51% | Total production costs per ounce(2)(4) | 17.15 | 15.91 | 8% |
| 20.18 | 12.14 | 66% | All-in sustaining costs per ounce(2)(5) | 17.34 | 20.29 | (15%) |
| 344,393 | 389,090 | (11%) | Processed tonnes | 1,030,194 | 1,158,504 | (11%) |
| 99.02 | 104.06 | (5%) | Direct production costs per tonne(2)(6) | 98.47 | 99.06 | (1%) |
| 13.14 | 12.32 | 7% | Silver co-product cash costs(7) | 12.19 | 14.07 | (13%) |
| 894 | 768 | 16% | Gold co-product cash costs(7) | 796 | 796 | 0% |
| Financial | ||||||
| 40.5 | 67.8 | (40%) | Revenue ($ millions) | 148.3 | 208.9 | (29%) |
| 1,227,466 | 1,693,989 | (28%) | Silver ounces sold | 4,539,433 | 4,996,637 | (9%) |
| 13,631 | 20,958 | (35%) | Gold ounces sold | 44,688 | 62,159 | (28%) |
| 18.78 | 22.60 | (17%) | Realized silver price per ounce | 19.88 | 25.05 | (21%) |
| 1,278 | 1,409 | (9%) | Realized gold price per ounce | 1,298 | 1,417 | (8%) |
| (11.4) | 12.3 | (193%) | Net earnings (loss) ($ millions) | (7.6) | 26.3 | (129%) |
| (11.4) | 13.0 | (188%) | Adjusted net earnings(8)($ millions) | (6.2) | 23.1 | (127%) |
| (3.6) | 21.7 | (117%) | Mine operating earnings ($ millions) | 12.1 | 47.1 | (74%) |
| 11.5 | 31.8 | (64%) | Mine operating cash flow(9)($ millions) | 56.6 | 90.5 | (37%) |
| 4.4 | 25.9 | (83%) | Operating cash flow before working capital changes(10) | 34.6 | 63.6 | (46%) |
| 2.2 | 29.3 | (92%) | Earnings before ITDA(11) | 34.9 | 77.0 | (55%) |
| 39.8 | 16.9 | 136% | Working capital ($ millions) | 39.8 | 16.9 | 136% |
| Shareholders | ||||||
| (0.11) | 0.12 | (192%) | Earnings (loss) per share – basic | (0.06) | 0.26 | (124%) |
| (0.11) | 0.13 | (186%) | Adjusted earnings per share – basic(8) | (0.06) | 0.23 | (126%) |
| 0.04 | 0.26 | (83%) | Operating cash flow before working capital changes per share(10) | 0.34 | 0.64 | (46%) |
| 101,527,951 | 99,741,010 | 2% | Weighted average shares outstanding | 101,123,404 | 99,704,100 | 1% |
| (1) | Silver equivalents are calculated using a 60:1 ratio. |
| (2) | The Company reports non-IFRS measures which include cash costs net of by-products on a payable silver basis, total production costs per ounce, all-in sustaining costs per ounce and direct production costs per tonne, in order to manage and evaluate operating performance at each of the Company’s mines. These measures, some established by the Silver Institute (Production Cost Standards, June 2011), are widely used in the silver mining industry as a benchmark for performance, but do not have a standardized meaning. These measures are reported on a production basis. See Reconciliation to IFRS on page 16. |
| (3) | Cash costs net of by-products per payable silver ounce include mining, processing (including smelting, refining, transportation and selling costs), and direct overhead, net of gold credits. See Reconciliation to IFRS on page 18. |
| (4) | Total production costs per ounce include mining, processing (including smelting, refining, transportation and selling costs), direct overhead, amortization, depletion and amortization at the operation sites. See Reconciliation to IFRS on page 18. |
| (5) | All-in sustaining cost per ounce include mining, processing (including smelting, refining, transportation and selling costs), direct overhead, corporate general and administration, on-site exploration, share-based compensation, reclamation and sustaining capital net of gold credits. See Reconciliation to IFRS on page 20. |
| (6) | Direct production costs per tonne include mining, processing (including smelting, refining, transportation and selling costs) and direct overhead at the operation sites. See Reconciliation to IFRS on page 18. |
| 3 |
| (7) | Silver co-product cash cost and gold co-product cash cost include mining, processing (including smelting, refining, transportation and selling costs), and direct overhead allocated on pro-rated basis of realized metal value. See Reconciliation to IFRS on page 21 |
| (8) | Adjusted earnings are calculated by adding back the mark-to-market impact of derivative equities held as a liability on the Company’s balance sheet and impairment charges net of tax. See Reconciliation to IFRS on page 16. |
| (9) | Mine operating cash flow is calculated by adding back amortization, depletion, inventory write downs and share-based compensation to mine operating earnings. Mine operating earnings and mine operating cash flow are before taxes. See Reconciliation to IFRS on page 17. |
| (10) | See Reconciliation to IFRS on page 17 for the reconciliation of operating cash flow before working capital changes, operating cash flow before working capital changes per share. |
| (11) | See Reconciliation of Earnings before interest, taxes, depreciation and amortization on page 18. |
Management’s highlights are key measures used by management, however they should not be the sole measures used in determining the performance of the Company’s operations.
HISTORY AND STRATEGY
The Company is engaged in silver mining in Mexico and related activities including property acquisition, exploration, development, mineral extraction, processing, refining and reclamation. The Company is also engaged in exploration activities in Chile.
Historically, the business philosophy was to acquire and explore early-stage mineral prospects in Canada and the US. In 2002 the Company was re-organized, a new management team was appointed, and the business strategy was revised to focus on acquiring advanced-stage silver mining properties in Mexico. Mexico, despite its long and prolific history of metal production, appeared to be relatively under-explored using modern exploration techniques and offered promising geological potential for precious metals exploration and production.
After evaluating several mineral properties in Mexico in 2003, the Company negotiated an option to purchase the Guanaceví silver mines and process plant located in Durango, Mexico in May 2004. Management recognized that even though the mines had run out of ore, little modern exploration had been carried out to discover new silver ore-bodies. Exploration drilling commenced in June 2004 and quickly met with encouraging results. By September 2004, sufficient high-grade silver mineralization had been outlined to justify the development of an access ramp into the newly discovered North Porvenir ore-body. In December 2004, the Company commenced the mining and processing of ore from the new North Porvenir mine to produce silver doré bars.
In 2007, the Company replicated the success of Guanaceví with the acquisition of the Bolañitos (formerly described as “Guanajuato”) mines project in Guanajuato State. Bolañitos was very similar in that there was a fully built and permitted processing plant, and the mines were running out of ore, so the operation was for sale. The acquisition was finalized in May 2007 and as a result of the successful mine rehabilitation and subsequent exploration work, silver production, reserves and resources are growing rapidly and Bolañitos is now an integral part of the Company’s asset base.
Both Guanaceví and Bolañitos are good examples of Endeavour’s business model of acquiring fully built and permitted silver mines that were about to close for lack of ore. By bringing the money and expertise needed to find new silver ore-bodies, Endeavour has successfully re-opened and expanded these mines to develop their full potential. The benefit of acquiring fully built and permitted mining and milling infrastructure is that if new exploration efforts are successful, the mine development cycle from discovery to production only takes a matter of months instead of the several years normally required in the traditional mining business model.
In 2012, the Company acquired the El Cubo silver-gold mine located in Guanajuato, Mexico. El Cubo had similar challenges to Endeavour’s past acquisitions, but with two significant exceptions; the property came with substantial reserves and resources, and the mine was already operating at 1,100 tonnes per day. After acquisition, Endeavour initiated a two year operational turn-around program aimed at increasing throughput, grade and productivity in order to reduce operating costs and return the operation to profitability. Endeavour also completed a capital reconstruction program of the plant and surface infrastructure, and invested in accelerated mine exploration and development to unfold the full potential of El Cubo.
| 4 |
The Company historically funded its exploration and development activities through equity financings and convertible debentures. Equity financings also facilitated the acquisition and development of the Guanaceví and Bolañitos mines projects. However, since 2004, the Company has been able to finance more and more of its acquisition, exploration, development and operating activities from production cash flows. In 2012 the Company obtained a credit facility to help support its acquisition, exploration and capital investment programs. The Company may choose to engage in equity, debt, convertible debt or other financings, on an as-needed basis, in order to facilitate its growth.
REVIEW OF OPERATING RESULTS
Consolidated Production Results for the Three Months and Nine Months Ended September 30, 2014 and 2013
| Three Months Ended Sept 30 | CONSOLIDATED | Nine Months Ended Sept 30 | ||||
| 2014 | 2013 | % Change | 2014 | 2013 | % Change | |
| 344,393 | 389,090 | (11%) | Ore tonnes processed | 1,030,194 | 1,158,504 | (11%) |
| 175 | 171 | 2% | Average silver grade (gpt) | 183 | 164 | 12% |
| 84.5 | 86.7 | (2%) | Silver recovery (%) | 85.7 | 80.1 | 7% |
| 1,634,294 | 1,855,845 | (12%) | Total silver ounces produced | 5,202,902 | 4,881,435 | 7% |
| 1,582,525 | 1,799,695 | (12%) | Payable silver ounces produced | 5,046,879 | 4,739,228 | 6% |
| 1.48 | 1.89 | (22%) | Average gold grade (gpt) | 1.66 | 1.79 | (7%) |
| 86.3 | 96.9 | (11%) | Gold recovery (%) | 86.7 | 86.8 | (0%) |
| 14,118 | 22,947 | (38%) | Total gold ounces produced | 47,768 | 57,894 | (17%) |
| 13,558 | 22,108 | (39%) | Payable gold ounces produced | 45,961 | 55,658 | (17%) |
| 2,481,374 | 3,232,665 | (23%) | Silver equivalent ounces produced(1) | 8,068,982 | 8,355,075 | (3%) |
| 10.70 | 5.14 | 108% | Cash costs per silver ounce(2)(3) | 8.30 | 8.09 | 3% |
| 19.86 | 13.17 | 51% | Total production costs per ounce(2)(4) | 17.15 | 15.91 | 8% |
| 20.18 | 12.14 | 66% | All in sustaining cost per ounce(2)(5) | 17.34 | 20.29 | (15%) |
| 99.02 | 104.06 | (5%) | Direct production costs per tonne(2)(6) | 98.47 | 99.06 | (1%) |
| 13.14 | 12.32 | 7% | Silver co-product cash costs(7) | 12.19 | 14.07 | (13%) |
| 894.25 | 768.05 | 16% | Gold co-product cash costs(7) | 795.91 | 795.89 | 0% |
| (1) | Silver equivalents are calculated using a 60:1 ratio. |
| (2) | The Company reports non-IFRS measures which include cash costs net of by-product on a payable silver basis, total production costs per ounce, all-in sustaining costs per ounce and direct production costs per tonne, in order to manage and evaluate operating performance at each of the Company’s mines. These measures, some established by the Silver Institute (Production Cost Standards, June 2011), are widely used in the silver mining industry as a benchmark for performance, but do not have a standardized meaning. These measures are reported on a production basis. See Reconciliation to IFRS on page 16. |
| (3) | Cash costs net of by-products per payable silver ounce include mining, processing (including smelting, refining, transportation and selling costs), and direct overhead, net of gold credits. See Reconciliation to IFRS on page 18. |
| (4) | Total production costs per ounce include mining, processing (including smelting, refining, transportation and selling costs), direct overhead, amortization, depletion and amortization at the operation sites. See Reconciliation to IFRS on page 18. |
| (5) | All-in sustaining costs per ounce include mining, processing (including smelting, refining, transportation and selling costs), direct overhead, corporate general and administration, on-site exploration, share-based compensation, reclamation and sustaining capital net of gold credits. See Reconciliation to IFRS on page 20. |
| (6) | Direct production costs per tonne include mining, processing (including smelting, refining, transportation and selling costs) and direct overhead at the operation sites. See Reconciliation to IFRS on page 18. |
| (7) | Silver co-product cash cost and gold co-product cash cost include mining, processing (including smelting, refining, transportation and selling costs), and direct overhead allocated on pro-rated basis of realized metal value. See Reconciliation to IFRS on page 21. |
| 5 |
Three months ended September 30, 2014 (compared to the three months ended September 30, 2013)
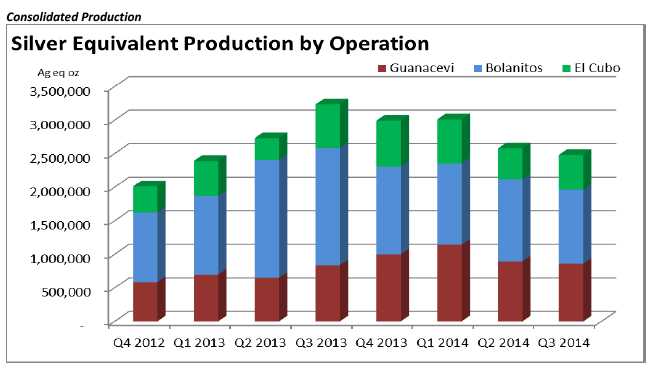
Consolidated silver production during Q3, 2014 was 1,634,294 ounces (oz), an decrease of 12% compared to 1,855,846 oz in Q3, 2013, and gold production was 14,118 oz, a decrease of 38% compared to 22,947 oz in Q3, 2013. Plant throughput was 344,393 tonnes at average grades of 175 grams per tonne (gpt) silver and 1.48 gpt gold compared to 389,090 tonnes grading 171 gpt silver and 1.89 gpt gold. Silver production fell due to lower throughput, while gold production fell due to lower throughput, grades and recoveries. In 2013, additional ore was mined at Bolanitos and processed at the El Cubo plant which is why 2014 throughputs are lower..
Nine months ended September 30, 2014 (compared to the nine months ended September 30, 2013)
Consolidated silver production during 2014 was 5,202,902 ounces (oz), an increase of 7% compared to 4,881,435 oz in 2013, and gold production was 47,768 oz, a decrease of 17% compared to 57,894 oz in 2013. Plant throughput was 1,030,194 tonnes at average grades of 183 grams per tonne (gpt) silver and 1.66 gpt gold compared to 1,158,504 tonnes grading 164 gpt silver and 1.79 gpt gold. Silver production increased due to higher grades and recoveries, offset by the lower throughput. Gold production was lower due to lower grades and throughput. In 2013, additional ore was mined at Bolanitos and processed at the El Cubo plant which is why 2014 throughputs are lower.The El Cubo mine output was forecasted to rise throughout 2014 in order to fill the El Cubo plant to its 1,550 tpd capacity.
Consolidated Operating Costs
Three months ended September 30, 2014 (compared to the three months ended September 30, 2013)
Cost cutting initiatives that commenced in Q2, 2013 have been partly offset by lower throughput and the implementation of Mexican mining taxes. The lower cost per tonne was partly offset by lower gold grades resulting in rising cash costs per ounce net of by-product credits, a non-IFRS measure and a standard of the Silver Institute, which increased 108% to $10.70 per ounce of payable silver compared to $5.14 in Q3, 2013. Similarly the lower gold grades with additional exploration expenditures resulted in all-in-sustaining costs per ounce, also a non-IFRS measure, increasing 66% to $20.18 compared to Q3, 2013.
Nine months ended September 30, 2014 (compared to the nine months ended September 30, 2013)
Cost cutting initiatives that commenced in Q2, 2013 have been offset by lower throughput and the implementation of Mexican mining taxes. The higher silver grades, improved recoveries and lower gold grades resulted in relatively flat cash costs per ounce net of by-product, a non-IFRS measure and a standard of the Silver Institute, which increased 3% to $8.30 per ounce of payable silver compared to $8.09 in 2013. All-in-sustaining costs per ounce, also a non-IFRS measure, fell 15% to $17.34 due to lower exploration and mine development expenditures compared to 2013.
| 6 |
Guanaceví Operations
Production Results for the Three Months and Nine Months Ended September 30, 2014 and 2013
| Three Months Ended Sept 30 | GUANACEV¥ | Nine Months Ended Sept 30 | ||||
| 2014 | 2013 | % Change | 2014 | 2013 | % Change | |
| 105,241 | 107,480 | (2%) | Ore tonnes processed | 320,876 | 314,914 | 2% |
| 278 | 265 | 5% | Average silver grade (g/t) | 300 | 246 | 22% |
| 81.0 | 78.0 | 4% | Silver recovery (%) | 82.9 | 76.6 | 8% |
| 761,272 | 715,079 | 6% | Total silver ounces produced | 2,562,877 | 1,910,732 | 34% |
| 753,660 | 707,929 | 6% | Payable silver ounces produced | 2,537,249 | 1,891,625 | 34% |
| 0.59 | 0.70 | (16%) | Average gold grade (g/t) | 0.63 | 0.57 | 11% |
| 82.1 | 82.1 | 0% | Gold recovery (%) | 86.3 | 78.6 | 10% |
| 1,627 | 1,977 | (18%) | Total gold ounces produced | 5,556 | 4,510 | 23% |
| 1,611 | 1,958 | (18%) | Payable gold ounces produced | 5,501 | 4,465 | 23% |
| 858,892 | 833,700 | 3% | Silver equivalent ounces produced(1) | 2,896,237 | 2,181,332 | 33% |
| 11.99 | 12.98 | (8%) | Cash costs per silver ounce(2)(3) | 10.70 | 14.87 | (28%) |
| 13.22 | 18.76 | (30%) | Total production costs per ounce(2)(4) | 12.51 | 20.82 | (40%) |
| 16.62 | 19.18 | (13%) | All in sustaining cost per ounce(2)(5) | 15.56 | 24.82 | (37%) |
| 105.23 | 111.06 | (5%) | Direct production costs per tonne(2)(6) | 106.35 | 109.53 | (3%) |
| 12.70 | 14.24 | (11%) | Silver co-product cash costs(7) | 11.66 | 15.93 | (27%) |
| 864 | 888 | (3%) | Gold co-product cash costs(7) | 762 | 901 | (15%) |
| (1) | Silver equivalents are calculated using a 60:1 ratio. |
| (2) | The Company reports non-IFRS measures which include cash costs net of by-product on a payable silver basis, total production costs per ounce, all-in sustaining costs per ounce and direct production costs per tonne, in order to manage and evaluate operating performance at each of the Company’s mines. These measures, some established by the Silver Institute (Production Cost Standards, June 2011), are widely used in the silver mining industry as a benchmark for performance, but do not have a standardized meaning. These measures are reported on a production basis. See Reconciliation to IFRS on page 16. |
| (3) | Cash costs net of by-product per payable silver ounce include mining, processing (including smelting, refining, transportation and selling costs), and direct overhead, net of gold credits. See Reconciliation to IFRS on page 18. |
| (4) | Total production costs per ounce include mining, processing (including smelting, refining, transportation and selling costs), direct overhead, amortization, depletion and amortization at the operation sites. See Reconciliation to IFRS on page 18. |
| (5) | All-in sustaining cost per ounce include mining, processing (including smelting, refining, transportation and selling costs), direct overhead, corporate general and administration, on-site exploration, share-based compensation, reclamation and sustaining capital net of gold credits. See Reconciliation to IFRS on page 20. |
| (6) | Direct production costs per tonne include mining, processing (including smelting, refining, transportation and selling costs) and direct overhead at the operation sites. See Reconciliation to IFRS on page 18. |
| (7) | Silver co-product cash cost and gold co-product cash cost include mining, processing (including smelting, refining, transportation and selling costs), and direct overhead allocated on pro-rated basis of realized metal value. See Reconciliation to IFRS on page 21. |
The acquisition of Endeavour’s first silver mine, at Guanaceví in 2004, continues to benefit all stakeholders. The mine has since produced more than 20 million ounces of silver and 50,000 ounces of gold, revitalized the local community, and helped establish Endeavour’s successful business model. Although the historic mine was closed and the plant was struggling to process 100 tonnes per day of old tailings in 2004, Guanaceví is now producing 1,200 tonnes of high-grade ore per day. The Company found five high-grade silver-gold ore bodies along a five kilometre length of the prolific Santa Cruz vein and developed four new mines, one of which is now mined out. The Guanaceví operation currently includes three underground silver-gold mines, a cyanidation leach plant, mining camp, and administration and housing facilities. Guanaceví provides steady employment for more than 450 people and engages over 200 contractors.
| 7 |
Guanaceví Production Results
Three months ended September 30, 2014 (compared to the three months ended September 30, 2013)
Silver production at the Guanaceví mine during Q3, 2014 was 761,272 oz, an increase of 6% compared to 715,079 oz in Q3, 2013, and gold production was 1,627 oz, a decrease of 18% compared to 1,977 oz in Q3, 2013. Plant throughput was 105,241 tonnes at average grades of 278 gpt silver and 0.59 gpt gold compared to 107,480 tonnes grading 265 gpt silver and 0.70 gpt gold. The fluctuations in silver and gold grades were a result of variations within the different ore bodies, resulting in the fluctuation of silver and gold production.
Nine months ended September 30, 2014 (compared to the nine months ended September 30, 2013)
Silver production at the Guanaceví mine during the first three quarters of 2014 was 2,562,877 oz, an increase of 34% compared to 1,910,732 oz over the same period in 2013, and gold production was 5,556 oz, an increase of 23% compared to 4,510 oz over the same period in 2013. Plant throughput was 320,876 tonnes at average grades of 300 gpt silver and 0.63 gpt gold compared to 314,914 tonnes grading 246 gpt silver and 0.57 gpt gold. Metal production increased due to mining of the higher grade and higher recoveries. The higher grades were a result of variations within the different ore bodies.
Guanaceví Operating Costs
Three months ended September 30, 2014 (compared to the three months ended September 30, 2013)
The higher silver grades and improved silver recoveries improved cash costs per ounce net of by-product credits, a non-IFRS measure and a standard of the Silver Institute, which fell 8% to $11.99 per ounce of payable silver compared to $12.98 in Q3, 2013. All-in-sustaining costs per ounce, also a non-IFRS measure, fell 13% to $16.62 due to higher production and less mine development expenditures compared to Q3, 2013. Exploration and mine development is a function of the maturity of the individual mines at the Guanaceví operation and can fluctuate quarter to quarterdeclining in the mature mines but increasing when new mines are developed.
Nine months ended September 30, 2014 (compared to the nine months ended September 30, 2013)
The lower cost per tonne, significantly higher metal grades and improved recoveries significantly improved cash costs per ounce net of by-product credits, a non-IFRS measure and a standard of the Silver Institute, which fell 28% to $10.70 per ounce of payable silver compared to $14.87 over the same period in 2013. All-in-sustaining costs per ounce, also a non-IFRS measure, fell 37% to $15.55 due to higher production, and lower exploration and mine development expenditures compared to 2013.
| 8 |
Bolañitos Operations
Production Results for the Three Months and Nine Months Ended September 30, 2014 and 2013
| Three Months Ended Sept 30 | BOLAÑITOS | Nine Months Ended Sept 30 | ||||
| 2014 | 2013 | % Change | 2014 | 2013 | % Change | |
| 137,683 | 181,442 | (24%) | Ore tonnes processed | 422,465 | 551,414 | (23%) |
| 149 | 147 | 1% | Average silver grade (g/t) | 148 | 148 | 0% |
| 89.2 | 92.5 | (4%) | Silver recovery (%) | 88.6 | 83.2 | 6% |
| 588,159 | 794,734 | (26%) | Total silver ounces produced | 1,784,908 | 2,183,802 | (18%) |
| 557,913 | 758,239 | (26%) | Payable silver ounces produced | 1,695,634 | 2,082,918 | (19%) |
| 2.20 | 2.75 | (20%) | Average gold grade (g/t) | 2.47 | 2.64 | (6%) |
| 88.2 | 98.9 | (11%) | Gold recovery (%) | 87.1 | 88.4 | (1%) |
| 8,588 | 15,869 | (46%) | Total gold ounces produced | 29,208 | 41,510 | (30%) |
| 8,202 | 15,245 | (46%) | Payable gold ounces produced | 27,960 | 39,668 | (30%) |
| 1,103,439 | 1,746,874 | (37%) | Silver equivalent ounces produced(1) | 3,537,388 | 4,674,402 | (24%) |
| 2.93 | (8.10) | 136% | Cash costs per silver ounce(2)(3) | 0.68 | (3.97) | 117% |
| 18.36 | (3.66) | 601% | Total production costs per ounce(2)(4) | 14.50 | 0.33 | (4,327%) |
| 11.75 | (3.29) | 457% | All in sustaining cost per ounce(2)(5) | 8.47 | 7.66 | 10% |
| 87.98 | 84.57 | 4% | Direct production costs per tonne(2)(6) | 88.77 | 81.41 | 9% |
| 10.33 | 8.60 | 20% | Silver co-product cash costs(7) | 10.16 | 9.90 | 3% |
| 703 | 536 | 31% | Gold co-product cash costs(7) | 663 | 560 | 18% |
| (1) | Silver equivalents are calculated using a 60:1 ratio. |
| (2) | The Company reports non-IFRS measures which include cash costs net of by-products on a payable silver basis, total production costs per ounce, all-in sustaining costs per ounce and direct production costs per tonne, in order to manage and evaluate operating performance at each of the Company’s mines. These measures, some established by the Silver Institute (Production Cost Standards, June 2011), are widely used in the silver mining industry as a benchmark for performance, but do not have a standardized meaning. These measures are reported on a production basis. See Reconciliation to IFRS on page 16. |
| (3) | Cash costs net of by-product per payable silver ounce include mining, processing (including smelting, refining, transportation and selling costs), and direct overhead, net of gold credits. See Reconciliation to IFRS on page 18. |
| (4) | Total production costs per ounce include mining, processing (including smelting, refining, transportation and selling costs), direct overhead, amortization, depletion and amortization at the operation sites. See Reconciliation to IFRS on page 18. |
| (5) | All-in sustaining cost per ounce include mining, processing (including smelting, refining, transportation and selling costs), direct overhead, corporate general and administration, on-site exploration, share-based compensation, reclamation and sustaining capital net of gold credits. See Reconciliation to IFRS on page 20. |
| (6) | Direct production costs per tonne include mining, processing (including smelting, refining, transportation and selling costs) and direct overhead at the operation sites. See Reconciliation to IFRS on page 18. |
| (7) | Silver co-product cash cost and gold co-product cash cost include mining, processing (including smelting, refining, transportation and selling costs), and direct overhead allocated on pro-rated basis of realized metal value. See Reconciliation to IFRS on page 21. |
Endeavour's second acquisition, was the Bolañitos mine in 2007, which encompasses three operating silver-gold mines and a floatation plant, located 10 kilometres from the city of Guanajuato in the state of Guanajuato. Following the acquisition, the cash costs of production were as high as $32 per ounce and the operation was struggling to produce 300,000 ounces of silver per year. Following the execution of management’s business strategy, the cash costs of production became negative due to economies of scale and the rising gold credits as production grew. Bolañitos’ processing plant was expanded in phases from 500 tonnes per day in 2007 to 1,600 tonnes per day in 2012. In 2013 additional mine output was processed at the El Cubo facilities allowing production to exceed plant capacity, whereas in 2014, production reverted to the 1600 tpd Bolanitos plant capacity.
| 9 |
Bolañitos Production Results
Three months ended September 30, 2014 (compared to the three months ended September 30, 2013)
Silver production at the Bolañitos mine was 588,159 ounces during Q3, 2014, a decrease of 26% compared to 794,734 oz in Q3, 2013, and gold production was 8,588 oz, a decrease of 46% compared to 15,869 oz in Q3, 2013. Plant throughput in Q3, 2014 was 137,683 tonnes at average grades of 149 gpt silver and 2.20 gpt gold, compared to 181,442 tonnes grading 147 gpt silver and 2.75 gpt gold in Q3, 2013. Metal production was down due to lower throughput and lower gold grades. In the same period of 2013, the Bolañitos plant operated at its 1,600 tpd capacity, and extra mine tonnage was processed at the El Cubo plant.In Q4, 2013, Bolañitos ceased the excess mine output to use as feed for the El Cubo plant, as the El Cubo mine output is scheduled to rise throughout 2014 to fill its plant to capacity.
Nine months ended September 30, 2014 (compared to the nine months ended September 30, 2013)
Silver production at the Bolañitos mine was 1,784,908 ounces during 2014, a decrease of 18% compared to 2,183,802 oz in the first three quarters of 2013, and gold production was 29,208 oz, a decrease of 30% compared to 41,510 oz for the same period in 2013. Plant throughput in the first three quarteres of 2014 was 422,465 tonnes at average grades of 148 gpt silver and 2.47 gpt gold, compared to 551,414 tonnes grading 148 gpt silver and 2.64 gpt gold in the first three quarteres of 2013. Metal production was down due to lower throughput and lower gold grades, offset by higher silver recoveries. In the same period in 2013, the Bolañitos plant operated at its 1,600 tpd capacity, and extra mine tonnage was processed at the El Cubo plant.In Q4, 2013, Bolañitos ceased the excess mine output to use as feed for the El Cubo plant, as the El Cubo mine output is scheduled to rise throughout 2014 to fill its plant to capacity.
Ore grades at Bolañitos, especially gold in the Daniela vein, have been significantly higher than the reserve grades, but in 2014, gold grades started declining towards reserve grades.
Bolañitos Operating Costs
Three months ended September 30, 2014 (compared to the three months ended September 30, 2013)
Per tonne costs have risen due to lower throughput and the inclusion of the new Mexican mining duties. Cash costs per ounce net of by-product credits, which is a non-IFRS measure and a standard of the Silver Institute rose to $2.93 per ounce of payable silver compared to negative $8.10 per ounce in the same period in 2013. The higher costs per tonne, lower gold production and lower gold value were the primary contributors to the higher cash costs. Similarly all-in sustaining costs rose for the same reasons as well as increased mine development and exploration expenditures in Q3, 2014 compared to Q3, 2013.
Nine months ended September 30, 2014 (compared to the nine months ended September 30, 2013)
Per tonne costs have risen due to lower throughput and the inclusion of the new Mexican mining duties. As a result cash costs per ounce net of by-product credits, which is a non-IFRS measure and a standard of the Silver Institute rose to $0.68 per ounce of payable silver compared to negative $3.97 per ounce in the same period in 2013. Similarly, all-in sustaining costs rose, however less mine development reduced the comparative increase from the same period in 2013.
| 10 |
El Cubo Operations
Production Results for the Three Months and Nine Months Ended September 30, 2014 and 2013
| Three Months Ended Sept 30 | EL CUBO | Nine Months Ended Sept 30 | ||||
| 2014 | 2013 | % Change | 2014 | 2013 | % Change | |
| 101,469 | 100,168 | 1% | Ore tonnes processed | 286,853 | 292,176 | (2%) |
| 102 | 112 | (9%) | Average silver grade (g/t) | 105 | 103 | 2% |
| 85.6 | 95.6 | (10%) | Silver recovery (%) | 88.3 | 80.3 | 10% |
| 284,863 | 346,032 | (18%) | Total silver ounces produced | 855,117 | 786,901 | 9% |
| 270,952 | 333,527 | (19%) | Payable silver ounces produced | 813,996 | 764,685 | 6% |
| 1.42 | 1.62 | (12%) | Average gold grade (g/t) | 1.63 | 1.51 | 8% |
| 84.3 | 97.8 | (14%) | Gold recovery (%) | 86.5 | 83.2 | 4% |
| 3,903 | 5,101 | (23%) | Total gold ounces produced | 13,004 | 11,874 | 10% |
| 3,745 | 4,905 | (24%) | Payable gold ounces produced | 12,500 | 11,525 | 8% |
| 519,043 | 652,092 | (20%) | Silver equivalent ounces produced(1) | 1,635,357 | 1,499,341 | 9% |
| 23.10 | 18.61 | 24% | Cash costs per silver ounce(2)(3) | 16.69 | 24.19 | (31%) |
| 41.38 | 39.54 | 5% | Total production costs per ounce(2)(4) | 37.15 | 46.24 | (20%) |
| 47.46 | 32.27 | 47% | All in sustaining cost per ounce(2)(5) | 41.41 | 43.50 | (5%) |
| 107.56 | 131.83 | (18%) | Direct production costs per tonne(2)(6) | 103.94 | 121.08 | (14%) |
| 19.83 | 19.89 | (0%) | Silver co-product cash costs(7) | 17.50 | 24.25 | (28%) |
| 1349 | 1,240 | 9% | Gold co-product cash costs(7) | 1142.34 | 1,372 | (17%) |
| (1) | Silver equivalents are calculated using a 60:1 ratio. |
| (2) | The Company reports non-IFRS measures which include cash costs net of by-products on a payable silver basis, total production costs per ounce, all-in sustaining costs per ounce and direct production costs per tonne, in order to manage and evaluate operating performance at each of the Company’s mines. These measures, some established by the Silver Institute (Production Cost Standards, June 2011), are widely used in the silver mining industry as a benchmark for performance, but do not have a standardized meaning. These measures are reported on a production basis. See Reconciliation to IFRS on page 16. |
| (3) | Cash costs net of by-products per payable silver ounce include mining, processing (including smelting, refining, transportation and selling costs), and direct overhead, net of gold credits. See Reconciliation to IFRS on page 18. |
| (4) | Total production costs per ounce include mining, processing (including smelting, refining, transportation and selling costs), direct overhead, amortization, depletion and amortization at the operation sites. See Reconciliation to IFRS on page 18. |
| (5) | All-in sustaining cost per ounce include mining, processing (including smelting, refining, transportation and selling costs), direct overhead, corporate general and administration, on-site exploration, share-based compensation, reclamation and sustaining capital net of gold credits. See Reconciliation to IFRS on page 20. |
| (6) | Direct production costs per tonne include mining, processing (including smelting, refining, transportation and selling costs) and direct overhead at the operation sites. See Reconciliation to IFRS on page 18. |
| (7) | Silver co-product cash cost and gold co-product cash cost include mining, processing (including smelting, refining, transportation and selling costs), and direct overhead allocated on pro-rated basis of realized metal value. See Reconciliation to IFRS on page 21. |
Endeavour’s third mine, was acquired in July 2012. El Cubo was a good fit with Endeavour's business strategy of buying and rejuvenating struggling old mines in historic mining districts. However, unlike Guanaceví and Bolañitos, which had low throughputs and no reserves, El Cubo offered the potential to quickly become a core asset for Endeavour, already having a 1,100-tonne-per-day output and a reasonable reserve/resource mine life. Located in the southeastern part of the historic Guanajuato mining district, this producing silver and gold mine is only 15 kilometres from Endeavour’s Bolañitos project, and included many mine adits, ramps, and shafts, as well as a 400-tonne-per-day leach plant. It also held a lease (until July 2013) on the adjacent Las Torres mine and 1,800-tonne-per-day flotation plant owned by Fresnillo PLC. Subsequent to the acquisition in Q3, 2012, Endeavour launched a $67-million, 18-month capital investment program at El Cubo to explore and develop the mine and to rebuild and expand the plant, tailings facility, water supply, electrical supply, surface buildings, and surface infrastructure. The plant and surface infrastructure program was completed in Q2 2013 on time and within budget.
| 11 |
El Cubo Production Results
Endeavour's mine plan is focused on increasing throughput at El Cubo of to 1,550 tpd by year end while progressively increasing the production grades by opening up new higher grade areas and reducing ore dilution. The Company has reorganized the mine operations team, improved supervision and operating efficiencies, improved safety policies, programs and training and created a Mine Rescue Team for a safer environment. The Company has also acquired new mining equipment,accelerated mine development and commenced underground drilling.
Three months ended September 30, 2014 (compared to the three months ended September 30, 2013)
Silver production at the El Cubo mine was 284,863 oz in Q3, 2014, an decrease of 18% compared to 346,032 oz in Q3, 2013 and gold production was 3,903 oz in Q3, 2014, a decrease of 23% compared to 5,101 oz in Q3, 2013. Plant throughput in Q3, 2014 was 101,469 tonnes at average grades of 102 gpt silver and 1.42 gpt gold, compared to 100,168 tonnes grading 112 gpt silver and 1.62 gpt gold in Q3, 2013. Management has focused on increasing mine development to gain better access to the V-Ascuncion discovery in 2014 in order to facilitate increased mine output up to the 1,550 tpd plant capacity by the end of 2014. In June 2013, the Company completed the refurbishment of the El Cubo plant which resulted in artificially lower recoveries during the second quarter and artificially higher recoveries during the third quarter due to timing of completing work in process metal inventory.
Nine months ended September 30, 2014 (compared to the nine months ended September 30, 2013)
Silver production at the El Cubo mine was 855,117 oz in the first three quarters of 2014, an increase of 9% compared to 786,901 oz in the first three quarters of 2013 and gold production was 13,004 oz in 2014, an increase of 10% compared to 11,874 oz in the first three quarters of 2013. Plant throughput in the first three quarters of 2014 was 286,853 tonnes at average grades of 105 gpt silver and 1.63 gpt gold, compared to 292,176 tonnes grading 103 gpt silver and 1.51 gpt gold in the first three quarters of 2013. Management has focused on increasing mine development to gain better access to the Ascuncion discovery in 2014 in order to facilitate increased mine output up to the 1,550 tpd plant capacity by the end of 2014.
El Cubo Operating Costs
Three months ended September 30, 2014 (compared to the three months ended September 30, 2013)
Per tonne costs fell 18% quarter over quarter as the Company’s operational turn-around strategies took effect. Cash costs per ounce net of by-product credits, which is a non-IFRS measure and a standard of the Silver Institute, rose to $23.10 per ounce of payable silver compared to $18.61 in the same period in 2013 as lower grade material was mined. The lower cost per tonne significantly offset the lower grade ore being processed. All-in sustaining costs increased by 47% to $47.38 due to increased mine development and exploration expenditures related to Endeavour’s operations turn around program. During Q3, 2014, El Cubo spent $3.8 million on three kilometres of mine development primarily to gain better access to the Villapando-Asunción discovery and meet production expectations later this year.
Nine months ended September 30, 2014 (compared to the nine months ended September 30, 2013)
Per tonne costs fell 14% compared to the prior year’s first three quarters as the Company’s operational turn-around strategies have taken effect, although 2013 included significant labour termination costs. The Company significantly reduced its work force in Q2 and Q3 2013, while maintaining production levels. Cash costs per ounce net of byproduct credits, which is a non-IFRS measure and a standard of the Silver Institute, fell to $16.69 per ounce of payable silver compared to $24.19 in the same period in 2013. The lower cost per tonne and improved recoveries significantly improved the cash costs on a by-product basis, although partly offset by the lower gold price. All-in sustaining costs were relatively flat as the Company continues to invest in accelerated mine development to increase mine output to 1,550 tpd by the end of 2014. In 2014, El Cubo has spent $11.2 million to date on nine kilometres of mine development primarily to gain better access to the Villalpando-Asunción discovery and meet production expectations later this year.
| 12 |
Exploration Results
In 2014, Endeavour set a $10.3 million budget for exploration with the provision to spend more based on free cash flow and positive drill results quarter by quarter. A total of 54,000 metres of drilling in about 120 holes were planned to test multiple exploration targets in addition to the underground mine exploration drilling. Year-to-date Endeavour has completed 59,000 meters of drilling while remaining under budget, strong evidence of the exploration teams efforts to reduce costs and boost productivity. Due to the exploration successes at El Cubo , Bolañitos and San Sebastián the Company will exceed the number of planned drill metres for 2014.
The Company is focused on brownfields exploration around the three operating mines in order to replenish reserves and grow resources and mine-lives, as well as greenfields exploration to expand and permit the emerging new high grade silver-gold discovery in the Terronera vein on the San Sebastián property in Jalisco State. Endeavour currently has nine drill rigs working in Mexico: two at Guanaceví, two at Bolañitos, four at El Cubo and one at San Sebastián.
At Guanaceví, the Company planned 4,500 metres of drilling to test one high priority target southeast of the Santa Cruz mine. As of September 30, 2014, 5,200 metres of drilling were completed and the drill program is expected to wrap up in Q4, 2014. The Company is currently drilling a new mineralized zone discovered off the main access ramp in Porvenir Central and a new mineralized zone discovered south of the Santa Cruz mine with assays expected in the fourth quarter.
At Bolañitos, the Company planned 21,500 metres of drilling to test five high priority brownfield targets northwest and southeast of the mine at La Luz Norte, La Luz-Asunción, Deep Daniela, La Joya Sur and Siglo XX. As of September 30, 2014, 21,700 metres were completed intersecting high grade, silver-gold mineralization in the Asuncion area of the La Luz vein system (L-Asuncion) forming three discrete zones over an 800 metre length, still open to some extent at depth and towards surface. The Company is currently drilling the Puertocito, La Joya Sur and Margarita targets and plans to drill Siglo XX before year-end.
At El Cubo, the Company planned 22,000 metres of drilling to test five high priority brownfield targets northwest and southeast of the mine at Villapando-Asunción, Villapando Sur, San Nicolas, Cabrestantes and El Nayal. As of September 30, 2014, 23,000 metres were drilled primarily on the Villapando-Asunción target with significant success. Drilling has extended the recently discovered high grade, silver-gold mineralized zone in the Asuncion area of the Villalpando vein system (V-Asuncion) to over 1,200 metres long, 450 vertical metres and still open at depth and to the southeast for expansion. Drilling will continue along the V-Asuncion target and El Nayal to year-end.
In February 2014, the Company published the San Sebastián mineral resource estimate that included an indicated resource totaling 18.2 million silver ounces and 86,300 gold ounces and inferred resources totaling 13.4 million silver ounces and 126,000 gold ounces. In 2014, 6,000 metres of planned drilling commenced in the second quarter to focus on extending the high-grade silver-gold mineralization along strike to the northwest and southeast of the current resource area in the Terronera vein. As of September 30, 2014, the Company has drilled 11,000 metres extending the discovery over 1,400 metres, still open along strike. The Terronera vein is a large structure more than 20 metres wide that has been traced on surface for more than 2.8 kilometres. In the mineralized zone, it often forms two parallel splays, the main vein and the hanging-wall vein. Endeavour completed its environmental baseline studies at San Sebastian and received its mine permit subsequent to quarter end. Management is now working on the individual change of soil use permits, an updated resource estimate, initial mine plan and in-house economic scoping study. Infill drilling continues with one drill rig while waiting for receipt of additional drill permits.
| 13 |
Consolidated Financial Results
Three months ended September 30, 2014 (compared to the three months ended September 30, 2013)
For the three-month period ended September 30, 2014, the Company’s mine operating loss was $3.6 million (Q3, 2013: mine operating earnings $21.7 million) on sales of $40.5 million (Q3, 2013: $67.8 million) with cost of sales of $44.1 million (Q3, 2013: $46.1 million).
Operating losses were $10.7 million (Q3, 2013: earnings of $17.4 million) after exploration costs of $4.9 million (Q3, 2013: $1.8 million) and general and administrative costs of $2.2 million (Q3, 2013: $2.5 million).
The loss before taxes in Q3, 2014 was $12.6 million (Q3, 2013: earnings before taxes of $16.4 million) after mark-to-market loss on derivative liabilities (see adjusted earnings comment on page 16) of $Nil (Q3, 2013: mark-to-market loss of $0.7 million), a foreign exchange loss of $1.3 million (Q3, 2013: $1.2 million), a mark-to-market gain on contingent liabilities of $0.1 million (Q3, 2013: loss of $0.1 million), investment and other income of $27 thousand (Q3, 2013: $1.2 million), a write off of exploration property of $0.4 million (Q3, 2013: $Nil) and finance costs of $0.3 million (Q3, 2013: $0.3 million). The Company realized a loss for the period of $11.4 million (Q3, 2013: earnings of $12.3 million) after an income tax recovery of $1.2 million (Q3, 2013: expense of $4.1 million).
Sales of $40.5 million in Q3, 2014 represented a 40% decrease over the $67.8 million for the same period in 2013. There was a 28% decrease in silver ounces sold and a 17% decrease in the realized silver price resulting in a 40% decrease in silver sales, and there was a 35% decrease in gold ounces sold and a 9% decrease in realized gold prices resulting in a 41% decrease in gold sales. During the period, the Company sold 1,227,466 oz silver and 13,631 oz gold, for realized prices of $18.78 and $1,278 per oz respectively, compared to sales of 1,693,989 oz silver and 20,958 oz gold, for realized prices of $22.60 and $1,409 per oz respectively, in the same period of 2013. The realized price of silver was 5% less than the average silver spot price of $19.76 during the period and the realized price of gold was consistent with the average gold spot price during the period of $1,282 per ounce, with the difference in realized silver price due to the timing of sales and mark-to-market adjustments for concentrate sales that are pending finalization.
The Company increased its finished goods silver inventory to 557,294 oz and decreased its finished goods gold inventory to 1,454 oz at September 30, 2014 compared to 206,590 oz silver and 1,538 oz gold at June 30, 2014. The cost allocated to these finished goods was $8.9 million, compared to $4.9 million at June 30, 2014. The finished goods inventory fair market value was $11.3 million as of September 30, 2014, compared to the carrying value of $8.8 million.
Cost of sales for Q3, 2014 was $44.1 million, a decrease of 4% over the cost of sales of $46.1 million for the same period of 2013. The 4% decrease in cost of sales is due to the reduced number of ounces sold, thereby increasing the costs in finished goods inventory and cost cutting initiatives implemented in 2013 with the fall in prices, offset by increased depreciation and depletion. Depreciation and depletion were higher primarily due to a lower reserve base offset by the lower depletion cost base from asset impairments recognized in 2013.
Exploration expenses increased in Q3, 2014 to $4.9 million from $1.8 million in the same period of 2013 based on the timing of the exploration activities. After cutting exploration budgets in 2013, management re-focused on brown fields exploration to increase mine lives at all three operations. General and administrative expenses decreased to $2.2 million for the period compared to $2.5 million in the same period of 2013 primarily due to decreased corporate development costs, legal and human resource costs.
A significant number of the Company’s share purchase warrants were classified and accounted for as a financial liability at fair value with adjustments recognized through net earnings because these warrants had an exercise price denominated in a currency which is different from the functional currency of the Company. During Q3 2013, there was a mark-to-market loss of $0.6 million. All of the outstanding share purchase warrants at the beginning of the year were exercised during Q1 2014; therefore, there were no share purchase warrants outstanding at September 30, 2014.
| 14 |
The mark-to-market gain on the contingent liability was a result of a revaluation, based on the Monte Carlo model, of the contingent consideration related to the acquisition of Mexgold (El Cubo). The decrease in the gold price and movement in the forward curve resulted in a $0.1 million mark-to-market gain during Q3, 2014 while the same period in 2013 had a mark-to-market loss on the contingent liability of $0.1 million.
The Company experienced a foreign exchange loss of $1.3 million during the period compared to a loss of $1.2 million for the same period of 2013. The $1.3 million loss was primarily due to the weakening of the Canadian dollar and Mexican peso against the US dollar during the period, which resulted in lower valuations on the Canadian dollar and Mexican peso cash and receivable amounts.
There was an income tax recovery of $1.2 million during the period compared to a $4.1 million income tax expense for the same period of 2013. This was primarily a result of decreased profitability offset by an increase in Mexican tax rates. On January 1, 2014 the 2013 tax reforms came into effect. The tax reform included a Special Mining Duty of 7.5% on taxable revenue, less allowable deductions excluding interest and capital depreciation and an 0.5% Environmental Tax on gold and silver revenue. During Q3, 2014 the Company incurred $0.5 million special mining duty expense included as current income tax and incurred $0.2 million royalty expense corresponding to the Environmental Tax.
Nine months ended September 30, 2014 (compared to the nine months ended September 30, 2013)
For the nine-month period ended September 30, 2014, the Company’s mine operating earnings were $12.1 million (Q3, 2013: $47.0 million) on sales of $148.3 million (Q3, 2013: $208.9 million) with cost of sales of $136.2 million (Q3, 2013: $161.9 million).
Operating loss was $5.9 million (Q3, 2013: operating earnings $26.6 million) after exploration costs of $9.9 million (Q3, 2013: $11.0 million) and general and administrative costs of $8.1 million (Q3, 2013: $9.4 million).
Loss before taxes in the nine months ended September 30, 2014 was $9.6 million (Q3, 2013: earnings before taxes $37.9 million) after mark-to-market loss on derivative liabilities (see adjusted earnings comment on page 16) of $1.4 million (Q3, 2013: mark-to-market gain of $3.2 million), a foreign exchange loss of $1.2 million (Q3, 2013: f $2.2 million), a mark-to-market gain on contingent liabilities of $0.1 million (Q3, 2013: $7.8 million), investment and other income of $0.3 million (Q3, 2013: $3.6 million), a write off of exploration property of $0.4 million (Q3, 2013: $Nil) and finance costs of $1.1 million (Q3, 2013: $1.1 million).
Sales of $148.3 million in the nine months ended September 30, 2014 represented a 29% decrease over the sales of $208.9 million for the same period in 2013. There was a 9% decrease in silver ounces sold and an 18% decrease in the realized silver price resulting in a 25% decrease silver sales, and there was a 28% decrease in gold ounces sold with an 8% decrease in realized gold prices resulting in a 34% decrease in gold sales. During the period, the Company sold 4,539,433 oz silver and 44,688 oz gold, for realized prices of $19.88 and $1,298 per oz respectively, compared to sales of 4,996,637 oz silver and 62,159 oz gold, for realized prices of $24.22 and $1,415 per oz respectively, in the same period of 2013. The realized prices of silver and gold during the period were within 1% of the average silver spot price during the period of $19.95 per ounce and the average gold spot price during the period of $1,288 per ounce, with differences due to the timing of sales and the mark-to-market adjustments for the concentrate sales that are pending finalization.
The Company increased its finished goods inventory to 557,240 oz silver and 1,454 oz gold at September 30, 2014 compared to 51,000 oz silver and 198 oz gold at December 31, 2013. The cost allocated to these finished goods was $8.9 million, compared to $1.0 million at December 31, 2013. The finished goods inventory fair market value was $11.3 million as of September 30, 2014, compared to the carrying value of $8.8 million.
Cost of sales for the nine months ended September 30, 2014 was $136.2 million, a decrease of 16% over the cost of sales of $161.9 million for the same period of 2013. The 16% decrease was due to the reduced number of ounces sold, thereby increasing the costs in finished goods inventory, cost cutting initiatives implemented in 2013 with the fall in silver and gold prices offset by increased depreciation and depletion. Depreciation and depletion were higher primarily due to a lower reserve base offset by the lower depletion cost base from asset impairments recognized in 2013.
| 15 |
Exploration expenses decreased in the nine months ended September 30, 2014 to $9.9 million from $11.0 million in the same period of 2013 based on both the timing of the exploration activities and the reduction of exploration activities in the current year. The sharp drop in precious metal prices in April 2013 prompted management to reduce exploration expenditures. General and administrative expenses decreased to $8.1 million for the period as compared to $9.4 million in the same period of 2013 primarily due to decreased corporate development costs, legal and human resource costs.
A significant number of the Company’s share purchase warrants were classified and accounted for as a financial liability at fair value with adjustments recognized through net earnings because these warrants had an exercise price denominated in a currency which is different from the functional currency of the Company. During the period, there was a mark-to-market loss on derivative liabilities (see adjusted earnings comment on page 16) of $1.4 million compared to $3.2 million gain in the same period in 2013. All of the outstanding share purchase warrants at the beginning of the period were exercised during the period. The loss in the current period was a reflection of the Company’s share price increasing from CAN$3.84 at December 31, 2013 to share prices between CAN$4.43 and CAN$6.07 at the various exercise dates during the period.
The mark-to-market gain on the contingent liability was a result of a revaluation, based on the Monte Carlo model, of the contingent consideration related to the acquisition of Mexgold (El Cubo). The decrease in the gold price and movement in the forward curve resulted in a $0.1 million mark-to-market gain during the period while the same period in 2013 had a mark-to-market gain on the contingent liability of $7.8 million.
The Company experienced a foreign exchange loss of $1.2 million during the period compared to a loss of $2.2 million for the same period of 2013. The $1.2 million loss was primarily due to the weakening of the Canadian dollar and Mexican peso against the US dollar during the period, which resulted in lower valuations on the Canadian dollar and Mexican peso cash and receivable amounts.
There was an income tax recovery of $2.0 million during the period compared to an income tax expense of $11.6 million for the same period of 2013. This was primarily a result of decreased profitability offset by an increase in Mexican tax rates. On January 1, 2014 the 2013 tax reforms came into effect. The tax reform included a Special Mining Duty of 7.5% on taxable revenues, less allowable deductions excluding interest and capital depreciation and an 0.5% Environmental Tax on gold and silver revenues. During the nine months ended September 30, 2014 the Company incurred $2.1 million special mining duty expense included as current income tax and incurred $0.7 million royalty expense corresponding to the Environmental Tax.
Non-IFRS Measures
Adjusted earnings and adjusted EPS are non-IFRS measures that do not have standardized meanings prescribed by IFRS and therefore may not be comparable to similar measures presented by other issuers. The Company previously issued share purchase warrants that have an exercise price denominated in a currency which is different from the functional currency of the Company. Under IFRS, the warrants are classified and accounted for as a financial liability at fair value with adjustments recognized through net earnings. These adjustments fluctuate significantly quarter to quarter primarily based on the change in the Company’s quoted share price and have a significant effect on reported earnings, while the dilutive impact remains unchanged. The Company incurred impairments on non-current assets that have a significant one time effect on reported earnings. Adjusted earnings and adjusted EPS are measures used by management to assess the performance of the operations prior to the impact of the mark-to-market changes and impairment amounts to appropriately compare to past performance and provided to investors as a measure of the Company’s operating performance.
| Expressed in thousands US dollars | Three Months Ended Sept 30 | Nine Months Ended Sept 30 | ||
| 2014 | 2013 | 2014 | 2013 | |
| Net earnings (loss) for the period | ($11,386) | $12,297 | ($7,638) | $26,293 |
| Mark-to-market loss/(gain) on derivative liabilities | 0 | 679 | 1,434 | (3,159) |
| Adjusted net earnings (loss) | ($11,386) | $12,976 | ($6,204) | $23,134 |
| Basic weighted average share outstanding | 101,527,951 | 99,741,010 | 101,123,404 | 99,704,100 |
| Adjusted net earnings (loss) per share | ($0.11) | $0.13 | ($0.06) | $0.23 |
| 16 |
Mine operating cash flow is a non-IFRS measure that does not have a standardized meaning prescribed by IFRS and therefore may not be comparable to similar measures presented by other issuers.
Mine operating cash flow is calculated as revenues minus direct production costs and royalties. Mine operating cash flow is used by management to assess the performance of the mine operations, excluding corporate and exploration activities and provided to investors as a measure of the Company’s operating performance.
| Expressed in thousands US dollars | Three Months Ended Sept 30 | Nine Months Ended Sept 30 | ||
| 2014 | 2013 | 2014 | 2013 | |
| Mine operating earnings (loss) | ($3,591) | $21,748 | $12,068 | $47,054 |
| Share-based compensation | 140 | 131 | 427 | 408 |
| Amortization and depletion | 14,386 | 12,566 | 43,168 | 37,789 |
| Write down (recovery) of inventory to net realizable value | 527 | (2,668) | 892 | 5,210 |
| Mine operating cash flow before taxes | $11,462 | $31,777 | $56,555 | $90,461 |
Operating cash flow before working capital adjustment is a non-IFRS measure that does not have a standardized meaning prescribed by IFRS and therefore may not be comparable to similar measures presented by other issuers. Operating cash flow before working capital (“WC”) adjustments is calculated as operating cash flow minus working capital adjustment. Operating cash flow before working capital adjustments is used by management to assess operating performance irrespective of working capital changes and provided to investors as a measure of the
Company’s operating performance.
| Expressed in thousands US dollars | Three Months Ended Sept 30 | Nine Months Ended Sept 30 | ||
| 2014 | 2013 | 2014 | 2013 | |
| Cash from operating activities | ($2,516) | $22,030 | $28,001 | $51,246 |
| Net changes in non-cash working capital | (6,908) | (3,881) | (6,589) | (12,389) |
| Operating cash flow before working capital adjustments | $4,392 | $25,911 | $34,590 | $63,635 |
Operating cash flow per share is a non-IFRS measure that does not have a standardized meaning prescribed by IFRS and therefore may not be comparable to similar measures presented by other issuers. Operating cash flow per share is calculated by dividing cash from operating activities by the weighted average shares outstanding. Operating cash flow per share is used by management and provided to investors as a measure of the Company’s operating performance.
| Expressed in thousands US dollars | Three Months Ended Sept 30 | Nine Months Ended Sept 30 | ||
| 2014 | 2013 | 2014 | 2013 | |
| Operating cash flow before working capital adjustments | $4,392 | $25,911 | $34,590 | $63,635 |
| Weighted average shares outstanding | 101,527,951 | 99,741,010 | 101,123,404 | 99,704,100 |
| Operating cash flow before WC changes per share | $0.04 | $0.26 | $0.34 | $0.64 |
EBITDA is a non-IFRS financial measure, which excludes the following from net earnings:
- Income tax expense;
- Finance costs;
- Amortization and depletion
Management believes EBITDA is a valuable indicator of the Company’s ability to generate liquidity by producing operating cash flow to fund working capital needs, service debt obligations, and fund capital expenditures. Management uses EBITDA for this purpose. EBITDA is also frequently used by investors and analysts for valuation purposes whereby EBITDA is multiplied by a factor or “EBITDA multiple” based on an observed or inferred relationship between EBITDA and market values to determine the approximate total enterprise value of a Company.
EBITDA is intended to provide additional information to investors and analysts and does not have any standardized definition under IFRS and should not be considered in isolation or as a substitute for measures of performance prepared in accordance with IFRS. EBITDA excludes the impact of cash costs of financing activities and taxes, and the effects of changes in operating working capital balances, and therefore is not necessarily indicative of operating profit or cash flow from operations as determined by IFRS. Other companies may calculate EBITDA differently.
| 17 |
| Expressed in thousands US dollars | Three Months Ended Sept 30 | Nine Months Ended Sept 30 | ||
| 2014 | 2013 | 2014 | 2013 | |
| Net earnings (loss) for the period | ($11,386) | $12,297 | ($7,638) | $26,293 |
| Amortization and depletion – cost of sales | 14,386 | 12,566 | 43,168 | 37,789 |
| Amortization and depletion – exploration | 30 | 34 | 97 | 101 |
| Amortization and depletion – general & admin | 55 | 48 | 137 | 134 |
| Finance costs | 359 | 313 | 1,061 | 1,091 |
| Current income tax expense | (171) | 2,729 | 6,021 | 8,928 |
| Deferred income tax expense (recovery) | (1,039) | 1,341 | (7,957) | 2,636 |
| Earnings before interest, taxes, depletion and amortization | $2,234 | $29,328 | $34,889 | $76,972 |
Cash costs per ounce, total production costs per ounce and direct production costs per tonne are measures developed by precious metals companies in an effort to provide a comparable standard; however, there can be no assurance that Endeavour’s reporting of these non-IFRS measures are similar to those reported by other mining companies. Cash costs per ounce, production costs per ounce and direct production costs per tonne are measures used by the Company to manage and evaluate operating performance at each of the Company’s operating mining units, and are widely reported in the silver mining industry as a benchmark for performance, but do not have a standardized meaning and are disclosed in addition to IFRS measures. The following tables provide a detailed reconciliation of these measures to Endeavour’s cost of sales, as reported in the Company’s consolidated financial statements.
| Expressed in thousands US dollars | Three Months Ended September 30, 2014 | Three Months Ended September 30, 2013 | ||||||
| Guanacevi | Bolanitos | El Cubo | Total | Guanacevi | Bolanitos | El Cubo | Total | |
| Direct production costs | $5,888 | $12,173 | $10,779 | $28,840 | $10,159 | $15,509 | $10,070 | $35,738 |
| Royalties | 25 | 105 | 45 | 175 | 287 | - | - | 287 |
| Special mining duty(1) | (106) | 610 | 0 | 504 | - | - | - | - |
| Opening finished goods | (1,717) | (775) | (1,046) | (3,538) | (3,160) | (753) | (344) | (4,257) |
| NRV cost adjustment | - | - | 345 | 345 | - | - | 1,422 | 1,422 |
| Closing finished goods | 6,984 | - | 791 | 7,775 | 4,651 | 589 | 2,057 | 7,297 |
| Direct production costs | 11,074 | 12,113 | 10,914 | 34,101 | 11,937 | 15,345 | 13,205 | 40,487 |
| By-product gold sales | (1,258) | (11,384) | (4,787) | (17,429) | (2,178) | (21,696) | (5,650) | (29,524) |
| Opening gold inventory fair market value | 358 | 905 | 760 | 2,023 | 457 | 899 | 218 | 1,574 |
| Closing gold inventory fair market value | (1,140) | - | (629) | (1,769) | (1,025) | (689) | (1,565) | (3,279) |
| Cash costs net of by-product | 9,034 | 1,634 | 6,258 | 16,926 | 9,191 | (6,141) | 6,208 | 9,258 |
| Amortization and depletion | 489 | 8,565 | 5,332 | 14,386 | 3,618 | 3,356 | 5,592 | 12,566 |
| Stock-based compensation | 47 | 46 | 47 | 140 | 43 | 44 | 44 | 131 |
| Opening finished goods depletion | (265) | - | (1,024) | (1,289) | (1,113) | (198) | (137) | (1,448) |
| NRV cost adjustment | - | - | 182 | 182 | 0 | - | 257 | 257 |
| Closing finished goods depletion | 661 | - | 416 | 1,077 | 1,545 | 162 | 1,222 | 2,929 |
| Total production costs | $9,966 | $10,245 | $11,211 | $31,422 | $13,284 | ($2,777) | $13,186 | $23,693 |
| Throughput tonnes | 105,241 | 137,683 | 101,469 | 344,393 | 107,480 | 181,442 | 100,168 | 389,090 |
| Payable silver ounces | 753,660 | 557,913 | 270,952 | 1,582,525 | 707,929 | 758,239 | 333,527 | 1,799,695 |
| Cash costs per ounce | $11.99 | $2.93 | $23.10 | $10.70 | $12.98 | ($8.10) | $18.61 | $5.14 |
| Total production costs per oz | $13.22 | $18.36 | $41.38 | $19.86 | $18.76 | ($3.66) | $39.54 | $13.17 |
| Direct production costs per tonne | $105.23 | $87.98 | $107.56 | $99.02 | $111.06 | $84.57 | $131.83 | $104.06 |
| 18 |
| Expressed in thousands US dollars | Nine Months Ended September 30, 2014 | Nine Months Ended September 30, 2013 | ||||||
| Guanacevi | Bolanitos | El Cubo | Total | Guanacevi | Bolanitos | El Cubo | Total | |
| Direct production costs | $26,751 | $35,803 | $28,355 | $90,909 | $30,376 | $54,741 | $32,256 | $117,373 |
| Royalties | 311 | 328 | 148 | 787 | 1,093 | - | - | 1,093 |
| Special mining duty(1) | 728 | 1,372 | 0 | 2,100 | - | - | - | - |
| Opening finished goods | (650) | - | (60) | (710) | (1,626) | (10,442) | (2,305) | (14,373) |
| NRV cost adjustment | - | - | 582 | 582 | - | - | 3,368 | 3,368 |
| Closing finished goods | 6,984 | - | 791 | 7,775 | 4,651 | 589 | 2,057 | 7,297 |
| Direct production costs | 34,124 | 37,503 | 29,816 | 101,443 | 34,494 | 44,888 | 35,376 | 114,758 |
| By-product gold sales | (5,921) | (36,358) | (15,744) | (58,023) | (5,790) | (65,264) | (16,871) | (87,925) |
| Opening gold inventory fair market value | 94 | - | 144 | 238 | 455 | 12,789 | 1,560 | 14,804 |
| Closing gold inventory fair market value | (1,140) | - | (629) | (1,769) | (1,025) | (689) | (1,565) | (3,279) |
| Cash costs net of by-product | 27,157 | 1,145 | 13,587 | 41,889 | 28,134 | (8,276) | 18,500 | 38,358 |
| Amortization and depletion | 3,998 | 23,294 | 15,876 | 43,168 | 10,012 | 11,358 | 16,419 | 37,789 |
| Stock-based compensation | 143 | 142 | 142 | 427 | 136 | 136 | 136 | 408 |
| Opening finished goods depletion | (220) | 0 | (92) | (312) | (444) | (2,698) | (1,176) | (4,318) |
| NRV cost adjustment | - | - | 310 | 310 | - | - | 257 | 257 |
| Closing finished goods depletion | 661 | - | 416 | 1,077 | 1,545 | 162 | 1,222 | 2,929 |
| Total production costs | $31,739 | $24,581 | $30,239 | $86,559 | $39,383 | $682 | $35,358 | $75,423 |
| Throughput tonnes | 320,876 | 422,465 | 286,853 | 1,030,194 | 314,914 | 551,414 | 292,176 | 1,158,504 |
| Payable silver ounces | 2,537,249 | 1,695,634 | 813,996 | 5,046,879 | 1,891,625 | 2,082,918 | 764,685 | 4,739,228 |
| Cash costs per ounce | $10.70 | $0.68 | $16.69 | $8.30 | $14.87 | ($3.97) | $24.19 | $8.09 |
| Total production costs per oz | $12.51 | $14.50 | $37.15 | $17.15 | $20.82 | $0.33 | $46.24 | $15.91 |
| Direct production costs per tonne | $106.35 | $88.77 | $103.94 | $98.47 | $109.53 | $81.41 | $121.08 | $99.06 |
(1) Special mining duty is an EBITDA royalty tax presented as a current income tax in accordance with IFRS
All-in sustaining costs per ounce and all-in costs per ounce are measures developed by the World Gold Council in an effort to provide a comparable standard within the precious metal industry; however, there can be no assurance that Endeavour’s reporting of these non-IFRS measures are similar to those reported by other mining companies. These measures are used by the Company to manage and evaluate operating performance at each of the Company’s operating mining units and consolidated group, and are widely reported in the silver mining industry as a benchmark for performance, but do not have a standardized meaning and are disclosed in addition to IFRS measures. The following tables provide a detailed reconciliation of these measures to Endeavour’s cost of sales, as reported in the Company’s consolidated financial statements.
| 19 |
| Expressed in thousands US dollars | Three Months Ended September 30, 2014 | Three Months Ended September 30, 2013 | ||||||
| Guanacevi | Bolanitos | El Cubo | Total | Guanacevi | Bolanitos | El Cubo | Total | |
| Cash costs net of by-product | $9,034 | $1,634 | $6,258 | $16,926 | $9,191 | ($6,141) | $6,208 | $9,258 |
| Operations stock based compensation | 47 | 46 | 47 | 140 | 43 | 44 | 44 | 131 |
| Corporate general and administrative | 495 | 366 | 178 | 1,040 | 671 | 719 | 316 | 1,707 |
| Corporate stock based compensation | 345 | 256 | 124 | 725 | 279 | 299 | 131 | 709 |
| Reclamation - amortization/accretion | 4 | 1 | 4 | 9 | 4 | 1 | 5 | 10 |
| Mine site expensed exploration | 430 | 1,762 | 1,146 | 3,338 | 229 | 135 | 469 | 833 |
| Capital expenditures sustaining | 2,171 | 2,492 | 5,101 | 9,764 | 3,158 | 2,449 | 3,589 | 9,196 |
| All In Sustaining Costs | $12,526 | $6,557 | $12,858 | $31,942 | $13,575 | ($2,494) | $10,763 | $21,844 |
| Growth exploration | 1,562 | 987 | ||||||
| Growth capital expenditures | 925 | 9,383 | ||||||
| All In Costs | $34,429 | $32,214 | ||||||
| Throughput tonnes | 105,241 | 137,683 | 101,469 | 344,393 | 107,480 | 181,442 | 100,168 | 389,090 |
| Payable silver ounces | 753,660 | 557,913 | 270,952 | 1,582,525 | 707,929 | 758,239 | 333,527 | 1,799,695 |
| Sustaining cost per ounce | $16.62 | $11.75 | $47.46 | $20.18 | $19.18 | ($3.29) | $32.27 | $12.14 |
| All In costs per ounce | $21.76 | $17.90 | ||||||
| Expressed in thousands US dollars | Nine Months Ended September 30, 2014 | Nine Months Ended September 30, 2013 | ||||||
| Guanacevi | Bolanitos | El Cubo | Total | Guanacevi | Bolanitos | El Cubo | Total | |
| Cash costs net of by-product | $27,157 | $1,145 | $13,587 | $41,889 | $28,134 | ($8,276) | $18,500 | $38,358 |
| Operations stock based compensation | 143 | 142 | 142 | 427 | 136 | 136 | 136 | 408 |
| Corporate general and administrative | 2,957 | 1,976 | 949 | 5,882 | 2,770 | 3,051 | 1,120 | 6,941 |
| Corporate stock based compensation | 1,125 | 752 | 361 | 2,238 | 920 | 1,013 | 372 | 2,305 |
| Reclamation - amortization/accretion | 12 | 3 | 14 | 29 | 12 | 3 | 15 | 30 |
| Mine site expensed exploration | 915 | 3,279 | 3,270 | 7,464 | 1,630 | 2,082 | 2,222 | 5,934 |
| Capital expenditures sustaining | 7,158 | 7,061 | 15,382 | 29,601 | 13,352 | 17,956 | 10,896 | 42,204 |
| All In Sustaining Costs | $39,467 | $14,358 | $33,704 | $87,530 | $46,954 | $15,965 | $33,261 | $96,180 |
| Growth exploration | 2,410 | 4,976 | ||||||
| Growth capital expenditures | 1,093 | 36,732 | ||||||
| All In Costs | $91,033 | $137,888 | ||||||
| Throughput tonnes | 320,876 | 422,465 | 286,853 | 1,030,194 | 314,914 | 551,414 | 292,176 | 1,158,504 |
| Payable silver ounces | 2,537,249 | 1,695,634 | 813,996 | 5,046,879 | 1,891,625 | 2,082,918 | 764,685 | 4,739,228 |
| Sustaining cost per ounce | $15.56 | $8.47 | $41.41 | $17.34 | $24.82 | $7.66 | $43.50 | $20.29 |
| All In costs per ounce | $18.04 | $29.10 | ||||||
Silver co-product cash costs and gold co-product cash costs are measures used by the Company to manage and evaluate operating performance at each of the Company’s operating mining units and consolidated group, but do not have a standardized meaning and are disclosed in addition to IFRS measures. The following tables provide a detailed reconciliation of these measures to Endeavour’s cost of sales, as reported in the Company’s consolidated financial statements.
| 20 |
| Expressed in thousands US dollars | Three Months Ended September 30, 2014 | Three Months Ended September 30, 2013 | ||||||
| Guanacevi | Bolanitos | El Cubo | Total | Guanacevi | Bolanitos | El Cubo | Total | |
| Direct production costs | $5,888 | $12,173 | $10,779 | $28,840 | $10,159 | $15,509 | $10,070 | $35,738 |
| Royalties | 25 | 105 | 45 | 175 | 287 | - | - | 287 |
| Special mining duty(1) | (106) | 610 | 0 | 504 | - | - | - | - |
| Opening finished goods | (1,717) | (775) | (1,046) | (3,538) | (3,160) | (753) | (344) | (4,257) |
| NRV cost adjustment | - | - | 345 | 345 | - | - | 1,422 | 1,422 |
| Closing finished goods | 6,984 | - | 791 | 7,775 | 4,651 | 589 | 2,057 | 7,297 |
| Direct production costs | 11,074 | 12,113 | 10,914 | 34,101 | 11,937 | 15,345 | 13,205 | 40,487 |
| Silver production | 761,272 | 588,159 | 284,863 | 1,634,294 | 715,079 | 794,734 | 346,032 | 1,855,845 |
| Average realized silver price | 18.78 | 18.78 | 18.78 | 18.78 | 22.60 | 22.60 | 22.60 | 22.60 |
| Silver value | 14,296,688 | 11,045,626 | 5,349,727 | 30,692,041 | 16,160,785 | 17,960,988 | 7,820,323 | 41,942,097 |
| Gold production | 1,627 | 8,588 | 3,903 | 14,118 | 1,977 | 15,869 | 5,101 | 22,947 |
| Average realized gold price | 1,278 | 1,278 | 1,278 | 1,278 | 1,409 | 1,409 | 1,409 | 1,409 |
| Gold value | 2,079,306 | 10,975,464 | 4,988,034 | 18,042,804 | 2,785,593 | 22,359,421 | 7,187,309 | 32,332,323 |
| Total metal value | 16,375,994 | 22,021,090 | 10,337,761 | 48,734,845 | 18,946,378 | 40,320,409 | 15,007,632 | 74,274,420 |
| Pro-rated silver costs | 87% | 50% | 52% | 63% | 85% | 45% | 52% | 56% |
| Pro-rated gold costs | 13% | 50% | 48% | 37% | 15% | 55% | 48% | 44% |
| Silver co-product cash costs | $12.70 | $10.33 | $19.83 | $13.14 | $14.24 | $8.60 | $19.89 | $12.32 |
| Gold co-product cash costs | $864 | $703 | $1,349 | $894 | $888 | $536 | $1,240 | $768 |
| Expressed in thousands US dollars | Nine Months Ended September 30, 2014 | Nine Months Ended September 30, 2013 | ||||||
| Guanacevi | Bolanitos | El Cubo | Total | Guanacevi | Bolanitos | El Cubo | Total | |
| Direct production costs | $26,751 | $35,803 | $28,355 | $90,909 | $30,376 | $54,741 | $32,256 | $117,373 |
| Royalties | 311 | 328 | 148 | 787 | 1,093 | - | - | 1,093 |
| Special mining duty(1) | 728 | 1,372 | 0 | 2,100 | - | - | - | - |
| Opening finished goods | (650) | - | (60) | (710) | (1,626) | (10,442) | (2,305) | (14,373) |
| NRV cost adjustment | - | - | 582 | 582 | - | - | 3,368 | 3,368 |
| Closing finished goods | 6,984 | - | 791 | 7,775 | 4,651 | 589 | 2,057 | 7,297 |
| Direct production costs | 34,124 | 37,503 | 29,816 | 101,443 | 34,494 | 44,888 | 35,376 | 114,758 |
| Silver production | 2,562,877 | 1,784,908 | 855,117 | 5,202,902 | 1,910,732 | 2,183,802 | 786,901 | 4,881,435 |
| Average realized silver price | 19.88 | 19.88 | 19.88 | 19.88 | 25.05 | 25.05 | 25.05 | 25.05 |
| Silver value | 50,949,995 | 35,483,971 | 16,999,726 | 103,433,692 | 47,863,837 | 54,704,240 | 19,711,870 | 122,279,947 |
| Gold production | 5,556 | 29,208 | 13,004 | 47,768 | 4,510 | 41,510 | 11,874 | 57,894 |
| Average realized gold price | 1,298 | 1,298 | 1,298 | 1,298 | 1,417 | 1,417 | 1,417 | 1,417 |
| Gold value | 7,211,688 | 37,911,984 | 16,879,192 | 62,002,864 | 6,390,670 | 58,819,670 | 16,825,458 | 82,035,798 |
| Total metal value | 58,161,683 | 73,395,955 | 33,878,918 | 165,436,556 | 54,254,507 | 113,523,910 | 36,537,328 | 204,315,745 |
| Pro-rated silver costs | 88% | 48% | 50% | 63% | 88% | 48% | 54% | 60% |
| Pro-rated gold costs | 12% | 52% | 50% | 37% | 12% | 52% | 46% | 40% |
| Silver co-product cash costs | $11.66 | $10.16 | $17.50 | $12.19 | $15.93 | $9.90 | $24.25 | $14.07 |
| Gold co-product cash costs | $762 | $663 | $1,142 | $796 | $901 | $560 | $1,372 | $796 |
(1) Special mining duty is an EBITDA royalty tax presented as a current income tax in accordance with IFRS
| 21 |
Quarterly Results and Trends
The following table presents selected financial information for each of the most recent eight quarters:
(tables in thousands of US dollars except per share amounts)
| 2014 | 2013 | 2012 | ||||||
| Quarterly Results | Q3 | Q2 | Q1 | Q4 | Q3 | Q2 | Q1 | Q4 |
| Revenue | $40,477 | $54,774 | $53,000 | $67,857 | $67,803 | $71,250 | $69,873 | $66,719 |
| Direct cost | 28,840 | 34,849 | 27,220 | 41,210 | 35,739 | 44,746 | 36,887 | 34,814 |
| Royalties | 175 | 278 | 334 | 235 | 287 | 356 | 450 | 469 |
| Mine operating cash flow | 11,462 | 19,647 | 25,446 | 26,412 | 31,777 | 26,148 | 32,536 | 31,436 |
| Share-based compensation | 140 | 219 | 68 | 107 | 131 | 202 | 75 | 124 |
| Amortization and depletion | 14,386 | 14,709 | 14,073 | 15,780 | 12,566 | 13,149 | 12,074 | 10,517 |
| Write down on inventory | 527 | 365 | - | 664 | (2,668) | 6,383 | 1,495 | 2,876 |
| Mine operating earnings | ($3,591) | $4,354 | $11,305 | $9,861 | $21,748 | $6,414 | $18,892 | $17,919 |
| Net earnings (loss) | ($11,386) | ($289) | $4,037 | ($115,758) | $12,297 | ($361) | $14,357 | $14,821 |
| Impairment charge, net of tax | - | - | - | 104,283 | - | - | - | - |
| (Gain) Loss on derivative liability | - | - | 1,434 | (591) | 679 | (2,386) | (1,452) | (1,881) |
| Adjusted earnings (loss) | ($11,386) | ($289) | $5,471 | ($12,066) | $12,976 | ($2,747) | $12,905 | $12,940 |
| Basic earnings (loss) per share | ($0.11) | $0.00 | $0.04 | ($1.16) | $0.12 | $0.00 | $0.14 | $0.15 |
| Diluted earnings (loss) per share | ($0.11) | $0.00 | $0.04 | ($1.17) | $0.12 | $0.00 | $0.13 | $0.13 |
| Adjusted earnings (loss) per share | ($0.11) | $0.00 | $0.05 | ($0.35) | $0.13 | ($0.03) | $0.13 | $0.13 |
| Weighted shares outstanding | 101,527,951 | 101,336,743 | 100,494,157 | 99,720,704 | 99,741,010 | 99,710,933 | 99,660,016 | 99,539,282 |
| Net earnings (loss) | ($11,386) | ($289) | $4,037 | ($115,758) | $12,297 | ($361) | $14,357 | $14,821 |
| Amortization and depletion | 14,471 | 14,785 | 14,146 | 15,875 | 12,648 | 13,228 | 12,148 | 10,599 |
| Finance costs | 359 | 256 | 446 | 422 | 313 | 531 | 247 | 293 |
| Current income tax | (171) | 3,250 | 2,942 | 5,042 | 2,729 | 4,363 | 1,836 | 5,932 |
| Deferred income tax | (1,039) | (4,644) | (2,274) | (23,100) | 1,341 | (1,158) | 2,453 | (3,460) |
| Impairment charges | - | - | - | 135,060 | - | - | - | - |
| EBITDA | $2,234 | $13,358 | $19,297 | $17,541 | $29,328 | $16,603 | $31,041 | $28,185 |
| 22 |
The following table presents selected production information for each of the most recent eight quarters:
| Highlights | 2014 | 2013 | 2012 | |||||
| Q3 | Q2 | Q1 | Q4 | Q3 | Q2 | Q1 | Q4 | |
| Processed tonnes | 344,393 | 339,276 | 346,255 | 379,480 | 389,090 | 393,070 | 376,344 | 362,779 |
| Guanaceví | 105,241 | 108,822 | 106,813 | 121,008 | 107,480 | 100,781 | 106,653 | 110,763 |
| Bolañitos | 137,683 | 142,370 | 142,142 | 159,294 | 181,442 | 202,472 | 167,500 | 161,841 |
| El Cubo | 101,469 | 88,084 | 97,300 | 99,178 | 100,168 | 89,817 | 102,191 | 90,175 |
| Silver ounces | 1,634,294 | 1,669,609 | 1,898,999 | 1,931,717 | 1,855,846 | 1,535,873 | 1,489,746 | 1,235,026 |
| Guanaceví | 761,272 | 795,824 | 1,005,781 | 861,495 | 715,080 | 555,036 | 640,616 | 518,207 |
| Bolañitos | 588,159 | 623,898 | 572,851 | 698,098 | 794,734 | 810,414 | 578,654 | 518,674 |
| El Cubo | 284,863 | 249,887 | 320,367 | 372,124 | 346,032 | 170,423 | 270,446 | 198,145 |
| Silver grade | 175 | 178 | 198 | 181 | 171 | 165 | 154 | 151 |
| Guanaceví | 278 | 272 | 350 | 272 | 265 | 240 | 233 | 215 |
| Bolañitos | 149 | 152 | 144 | 152 | 147 | 160 | 135 | 140 |
| El Cubo | 102 | 103 | 110 | 118 | 112 | 93 | 103 | 96 |
| Silver recovery | 84.5 | 86.1 | 86.1 | 87.3 | 86.7 | 73.6 | 79.9 | 70.1 |
| Guanaceví | 81.0 | 83.6 | 83.7 | 81.5 | 78.0 | 71.3 | 80.2 | 67.7 |
| Bolañitos | 89.2 | 83.1 | 87.1 | 89.5 | 92.5 | 77.8 | 79.8 | 71.3 |
| El Cubo | 85.6 | 85.7 | 92.7 | 99.1 | 95.6 | 63.5 | 79.9 | 71.2 |
| Gold ounces | 14,118 | 15,131 | 18,519 | 17,686 | 22,947 | 19,914 | 15,032 | 12,917 |
| Guanaceví | 1,627 | 1,656 | 2,273 | 2,275 | 1,977 | 1,590 | 942 | 1,088 |
| Bolañitos | 8,588 | 9,980 | 10,640 | 10,142 | 15,869 | 15,751 | 9,891 | 8,660 |
| El Cubo | 3,903 | 3,495 | 5,606 | 5,269 | 5,101 | 2,574 | 4,199 | 3,169 |
| Gold grade | 1.48 | 1.59 | 1.92 | 1.78 | 1.89 | 1.96 | 1.51 | 1.55 |
| Guanaceví | 0.59 | 0.55 | 0.77 | 0.69 | 0.70 | 0.68 | 0.34 | 0.69 |
| Bolañitos | 2.20 | 2.47 | 2.72 | 2.61 | 2.75 | 2.84 | 2.27 | 2.2 |
| El Cubo | 1.42 | 1.44 | 2.01 | 1.77 | 1.62 | 1.41 | 1.48 | 1.42 |
| Gold recovery | 86.3 | 87.4 | 86.6 | 82.1 | 96.9 | 80.4 | 82.3 | 71.7 |
| Guanaceví | 82.1 | 86.1 | 86.0 | 85.2 | 82.1 | 72.6 | 80.8 | 44.3 |
| Bolañitos | 88.2 | 82.5 | 85.4 | 75.8 | 98.9 | 85.2 | 81 | 75.8 |
| El Cubo | 84.3 | 85.7 | 89.0 | 93.2 | 97.8 | 63.2 | 86.4 | 77 |
| Cash costs per oz | $10.70 | $9.87 | $4.87 | $7.46 | $5.14 | $10.53 | $10.04 | $12.25 |
| Guanaceví | $11.99 | $12.51 | $8.30 | $13.09 | $12.98 | $16.59 | $16.70 | $18.20 |
| Bolañitos | $2.93 | $1.20 | ($2.21) | $0.60 | ($8.10) | ($2.74) | ($0.06) | ($3.73) |
| El Cubo | $23.10 | $22.71 | $6.27 | $6.65 | $18.61 | $52.41 | $15.30 | $38.52 |
| Total cost per oz(1) | $19.86 | $19.19 | $13.07 | $14.59 | $13.17 | $18.18 | $18.24 | $20.84 |
| Guanaceví | $13.22 | $13.95 | $10.72 | $18.51 | $18.76 | $23.34 | $22.56 | $23.89 |
| Bolañitos | $18.36 | $16.57 | $9.39 | $4.35 | ($3.66) | $1.28 | $4.45 | $1.59 |
| El Cubo | $41.38 | $43.00 | $27.30 | $24.58 | $39.54 | $80.16 | $35.71 | $49.30 |
| Costs per tonne | $99.02 | $103.58 | $92.93 | $90.72 | $104.06 | $96.45 | $99.63 | $92.86 |
| Guanaceví | $105.23 | $109.83 | $103.90 | $114.55 | $111.06 | $111.21 | $113.61 | $99.70 |
| Bolañitos | $87.98 | $93.04 | $85.27 | $72.78 | $84.57 | $75.50 | $85.10 | $75.66 |
| El Cubo | $107.56 | $112.88 | $92.08 | $90.44 | $131.83 | $127.11 | $108.85 | $115.25 |
(1) Total Production Cost per ounce
| 23 |
Key Economic Trends
Precious Metal Price Trends
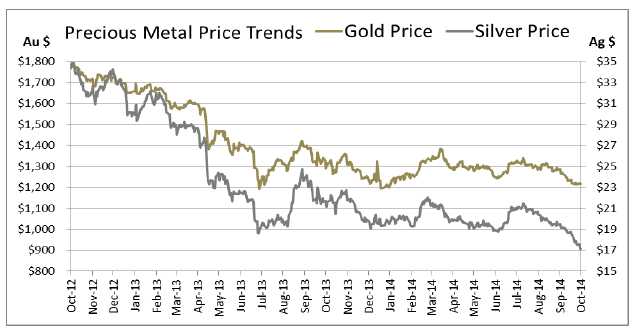
The prices of silver and gold are the largest single factor in determining profitability and cash flow from operations, therefore, the financial performance of the Company has been, and is expected to continue to be, closely linked to the prices of silver and gold. During Q3, 2014, the average price of silver was $19.76 per ounce, with silver trading between a range of $17.11 and $20.92 per ounce based on the London Fix silver price. This compares to an average of $21.37 per ounce during Q3, 2013, with a low of $19.10 and a high of $24.74 per ounce. During Q3, 2014, the Company realized an average price of $18.78 per silver ounce compared with $22.60 for the corresponding period in 2013.
During Q3, 2014, the average price of gold was $1,282 per ounce, with gold trading between a range of $1,213 and $1,340 per ounce based on the London Fix PM gold price. This compares to an average of $1,328 per ounce during Q3, 2013, with a low of $1,213 and a high of $1,419 per ounce. During Q3, 2014, the Company realized an average price of $1,278 per ounce compared with $1,238 for the corresponding period in 2013.
The major influences on the precious metals prices the past eight quarters included weaker investment demand, selling from precious metal exchange traded funds, as well as strong US equity and bond markets that pulled investments from other asset classes, including precious metals. In addition, the precious metal prices were also affected by an expectation of improving economic conditions, which lead to the reduction of the US Federal Reserve’s quantitative easing program.
| 24 |
Currency Fluctuations
The Company’s operations are located in Mexico and therefore a significant portion of operating costs and capital expenditures are denominated in Mexican pesos. The corporate activities are based in Vancouver, Canada with the significant portion of these expenditures being denominated in Canadian dollars. Generally, as the U.S. dollar strengthens, these currencies weaken, and as the US dollar weakens, these foreign currencies strengthen.
During Q3, 2014 the Mexican Peso depreciated against the U.S. dollar with volatility increasing at the end of the quarter. During Q3, 2014, the average foreign exchange rate was $13.11 Mexican Pesos per U.S. dollar, with the peso trading between a range of $12.93 and $13.48. This compares to an average of $12.90 during Q3, 2013, with a range of $12.48 and $13.37 Mexican pesos per U.S. dollar.

During Q3, 2014, the Canadian dollar continued to depreciate relative to the U.S. dollar. During Q3, 2014, the average foreign exchange rate was $1.088 Canadian dollar per U.S. dollar, with the Canadian dollar trading between a range of $1.064 and $1.1156. This compares to an average of $1.0391 during Q3, 2013, between a range of $1.0295 and $1.0531 Canadian dollar per U.S. dollar.

| 25 |
Cost Trends
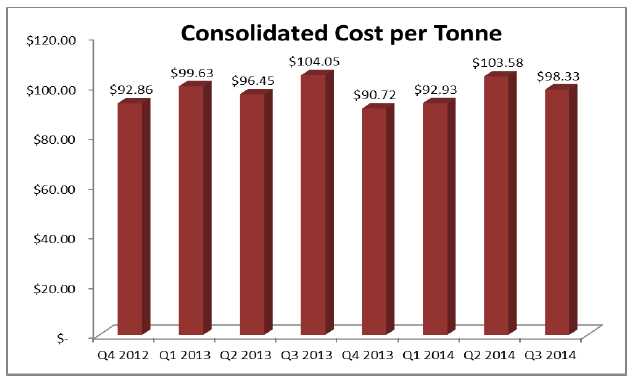
The Company’s profitability is subject to industry wide cost pressures on development and operating costs with respect to labour, energy, consumables and capital expenditures. Underground mining is labour intensive and 33% of Endeavour’s production costs are directly tied to labour. In order to mitigate the impact of higher labour and consumable costs, the Company focuses on continuous improvement, both by promoting more efficient use of materials and supplies, and by pursuing more advantageous pricing, while increasing performance and without compromising operational integrity.
In December 2013, the Mexican President passed tax reform legislation that was effective January 1, 2014. The tax reform includes, among other items, an increase of the Mexican corporate tax rate from 28% to 30%, removal of the flat tax regime, a Special Mining Duty of 7.5% on taxable revenues, less allowable deductions excluding interest and capital depreciation and an 0.5% Environmental Tax on gold and silver revenues. As of September 30, 2014 the Company incurred $2.1 million special mining duty expense included as current income tax and incurred $0.8 million royalty expense corresponding to the Environmental Tax.
| 26 |
Quarterly Outlook
Production
Endeavour planned to hold its silver production relatively steady in the range of 6.5 -6.9 million ounces (oz) in fiscal 2014 compared to the 6.8 million oz silver it produced in 2013. Gold production is expected to be in the 65,000-69,000 oz range and silver equivalent production is anticipated to be 10.4 -11.0 million oz (at a silver:gold ratio of 60:1). As of September 30, 2014, the Company is on track to meet the high end of its silver production guidance and the low end of its gold production guidance, as well as its cash cost and all-in-sustaining-cost targets.
At Guanaceví, production continues primarily from the Porvenir Norte, Porvenir Cuatro and Santa Cruz veins. Underground development of the new Milache discovery is awaiting permitting for development to start in Q4, 2014 and production to start in Q4, 2015 or early in 2016 depending on updated mine plans with current metal prices. Higher than planned grades has resulted in higher silver equivalent production compared to guidance through the nine months of 2014. Going forward, management expects mined grades to revert lower towards the reported reserve grades.
At Bolanitos, management elected to operate at the 1600 tpd plant capacity and not continue extra mine production for processing at the El Cubo plant as it did in 2013. The Daniela, Karina, Lana and Bolañitos veins are the primary ore sources for mill feed. The Company continues to explore and develop the La Luz-Asunción deposit to provide additional mining areas. As of September 30, 2014, Bolañitos silver equivalent production was consistent with the high end of management’s annual guidance.
At El Cubo, management forecasted production would expand to fill the 1,550 tpd plant to capacity by year-end through a ramp-up of mine output as mine development opens up better access to the new Villalpando-Asunción deposit. At El Cubo, production continues to be sourced primarily from the Dolores, Villalpando, San Nicolas and Santa Cecilia veins. Mine output has been lower than expected due to development initiatives, partial closure of the mine subsequent to the fatality reported in April and the Company initiatives to re-implement safety programs and re-train the entire workforce. Management continues to focus on accelerated mine development and operational training needed to make improvements sustainable over the longer term. As of September 30, 2014 the El Cubo silver equivalent production was significantly behind management’s annual guidance and will likely be short in 2014.
Consolidated silver equivalent production remains within management’s January guidance.
Operating Costs
Direct operating costs were estimated to be in the $95 per tonne range driving the expectation that the consolidated by-product cash costs of silver production (net of gold credits) to be in the $9-$10 range for fiscal 2014. The estimated cash cost increase from 2013 is primarily driven by the lower gold price and reduced gold production. Consolidated co-product cash costs of silver and gold production are anticipated to be around $13-14 and $800-850 per oz respectively. All-in by-product sustaining costs of production (including sustaining capex, exploration and G&A costs) were forecasted to be approximately $19 per oz of silver produced.
Year to date, Endeavour within expectations on metal production, while operating costs on a per tonne basis are slightly higher than plan, partly offset by the higher grade material being mined and processed.
Capital Investments
Endeavour announced a $43.9 million capital projects budget for 2014, including $34.6 million on mine development, infrastructure, equipment and exploration plus $9.3 million on plant upgrades, infrastructure, equipment and buildings. The Company budgeted $20.9 million at El Cubo, $9.9 million at Bolañitos, $11.7 million at Guanaceví and $1.4 million for general capital, all of which should be funded by the Company’s anticipated 2014 operating cash-flow. As of September 30, 2014, capital investments totaled $30.1 million and the capital programs remain on plan for the year, for further detail see Liquidity and Capital Resources section.
Exploration Expenditures
In 2014, the Company will exceed its target to spend $10.3 million on exploration. A total of 54,000 metres of drilling in about 120 holes were planned to test multiple exploration targets in addition to the underground mine exploration drilling. In the 2nd quarter, the Company elected to accelerate its exploration drilling programs based on the higher free cash flow generated in the first half of 2013 and positive drill results received to date. As a result, 59,000 meters of drilling were completed by the end of Q3 and expects to invest $12.0 million in exploration expenditures for 2014.
| 27 |
The Company is focused on brownfields exploration around the three operating mines in order to replenish reserves and grow resources and mine-lives, as well as expanding and permitting the emerging new high grade silver-gold discovery in the Terronera vein on the San Sebastián property in Jalisco State. See Exploration Results on page 13 for more detail.
Management evaluates its mine plan alternatives during the fourth quarter of each year in order to finalize the following year’s production targets and provide public guidance in January. With the recent drop in precious metal prices, management is now reviewing various mine plans for each operation in 2015 that include the possibility of reducing annual production to optimize their short and long term viability. Bolanitos’ production rate is expected to taper in 2015 from 1,600 tpd to 1,200 tpd until the ramp access for L-Asuncion ore bodies is established in late 2015.
Liquidity and Capital Resources
Cash and cash equivalents have decreased from $35.0 million at December 31, 2013 to $29.1 million at September 30, 2014. The revolving bank line of credit was reduced to $27 million by the end of Q3, 2014 compared to $33 million at the end of 2013. The Company had working capital of $39.8 million at September 30, 2014 (December 31, 2013 - $32.2 million). The $7.6 million increase in working capital is primarily a result of free cash flow from the mines.
Operating activities provided cash of $28.0 million during the first three quarters of 2014 compared to $51.2 million during the same period in 2013. The significant non-cash adjustments to net earnings were for amortization and depletion of $43.4 million, share-based compensation of $2.9 million, a deferred income tax recovery of $8.0 million, a mark-to-market loss on derivative liabilities of $1.4 million, finance costs of $1.1 million and a change in non-cash working capital of $6.6 million. The change in non-cash working capital was primarily due to management carrying 557,294 ounces of silver and 1,454 ounces of gold at quarter end. Prior to quarter end, management elected not to sell produced metal into a falling precious metals environment. This resulted in carrying metal with a market value of $11.3 million in inventory at quarter end.
Investing activities during the period used $30.2 million as compared to $74.4 million in the same period of 2013. Investments in property, plant and equipment totaled $30.1 million compared to $78.9 million, primarily due to significant development at each operation in 2014. In 2013, the Company invested into significant infrastructure at the El Cubo operations. There was also $4.7 million in net receipts from short term investments in 2013 that didn’t occur in 2014.
The Company invested a total of $30.1 million in property, plant and equipment during 2014. $7.2 million was invested at Guanaceví, with $5.2 million spent on 2.3 kilometres of mine development, $0.6 million spent on the tailings dam and $1.3 million on various equipment. At Bolañitos, the Company invested $7.1 million primarily on underground development. The mine developed 4.7 kilometres for $5.9 million, incurred $0.4 million on tailings expansion and spent $0.8 million on various mine equipment. At El Cubo, the Company invested $15.4 million. The mine incurred $11.1 million developing 8.6 kilometres and spent $4.3 million on various equipment as the mine ramps up to 1,550 tpd. The Company spent $0.4 million on exploration properties and corporate office equipment.
As at September 30, 2014, the Company held $0.8 million in available for sale investments consisting of marketable securities (December 31, 2013 - $1.5 million).
Financing activities during 2014 reduced cash by $3.4 million, compared to generating cash of $29.9 million during the same period in 2013. During 2014 the Company paid $6.0 million to reduce its revolving line of credit, incurring $0.8 million of interest, while $3.4 million was realized from the exercise of stock options and warrants. During 2013 the Company drew $30.0 million in net proceeds from its revolving line of credit, incurring $0.6 million of interest and $0.4 million was realized from the exercise of stock options.
| 28 |
As at September 30, 2014, the Company’s issued share capital was $365.8 million, representing 101,535,514 common shares, compared to $358.4 million, representing 99,784,409 common shares, at December 31, 2013. All of the 1,751,105 common shares issued during the period were issued upon stock option or warrant exercises.
As at September 30, 2014, the Company had options outstanding to purchase 7,007,350 common shares with a weighted average exercise price of CAN $5.32.
On July 24, 2012, the Company entered into a $75 million revolving credit facility (“the Facility”) that was reduced to $50 million in July 2013 and will reduce to $25 million in July 2015. The purpose of the Facility is for general corporate purposes and is principally secured by a pledge of the Company’s equity interests in its material operating subsidiaries, including Refinadora Plata Guanaceví S.A de C.V., Minas Bolañitos S.A. de C.V. and Compania Minera del Cubo S.A. de C.V. The interest rate margin on the Facility ranges from 2.75% to 4.25% over LIBOR based on the
Company’s net debt to EBITDA ratio, where EBITDA is adjusted for gains or losses on derivative liabilities and any extraordinary items. The Company agreed to pay a commitment fee of between 0.69% and 1.05% on undrawn amounts under the facility based on the Company’s net debt to EBITDA ratio. The Facility is subject to various qualitative and quantitative covenants, including EBITDA leverage ratio, interest service coverage ratio and tangible net worth calculation; the Company is in compliance with all such debt covenants as at September 30, 2014. As of September 30, 2014, the Company had drawn $27.0 million on this facility. With the completion of the El Cubo reconstruction, the Company expects to reduce the outstanding balance dependent on the metal price environment. During 2013, the Company extended the Facility until July 24, 2016, reducing from $50 million to $25 million July 24, 2015.
In December 2013, the Mexican President passed tax reform legislation that became effective January 1, 2014. The tax reform includes a Special Mining Duty of 7.5% on taxable revenues, less allowable deductions excluding interest and capital depreciation and an 0.5% Environmental Tax on gold and silver revenues. In Q3, 2014 the Company recognized a Special Mining Duty of $2.1 million as a current tax expense and $0.8 Environmental Tax as royalty expense in accordance with IFRS.
Contingencies
Minera Santa Cruz y Garibaldi SA de CV, a subsidiary of the Company, received a MXN$238 million (US$18.3 million) assessment on October 12, 2010 by Mexican fiscal authorities for failure to provide the appropriate support for certain expense deductions taken in the entity’s 2006 tax return. During the audit process, the Company retained an international accounting firm and external counsel to expedite the audit process and to ensure the delivery of the appropriate documentation. Based on the advice of tax advisors and legal counsel, it is the Company’s view that it provided the appropriate documentation and support for the expenses and the tax assessment has no legal merit, however as a result of a detailed review by the Company of its accounting records and available information to support the deductions taken, the Company has estimated a potential tax exposure of $40,000, plus additional interest and penalties of $40,000, for which the Company has made a provision in the consolidated financial statements. The Company has appealed the assessment and expects a favorable resolution.
Capital Requirements
The Company planned to invest $11.7 million at Guanaceví, $9.9 million at Bolañitos and $20.9 million at El Cubo for a total of $42.5 million on capital projects at its operations, all which are anticipated to be covered by the Company’s 2014 cash flow. Additionally the Company budgeted $1.4 million for property payments and software at its Corporate office. The $42.5 million primarily consists of $34.6 million for mine development to convert resources to reserves at the mine sites.
The $11.7 million capital budget at Guanaceví includes $9.3 million for underground development, while $0.9 million will be spent on the tailings dam to ensure there is sufficient capacity into the future and $1.5 million on various mine and plant equipment. As of September 30, 2014, 2.3 kilometres of underground development was completed costing $5.2 million, primarily due to infrastructure costs for pumping water from the Santa Cruz ore zone. Additionally the mine spent $0.6 million related to tailings and $1.3 million on various mine and support equipment.
| 29 |
The $9.9 million capital budget at Bolañitos includes $8.1 million to develop the La Luz and Plateros veins discovered in 2013, $1.0 million of additional investment in the tailings dam and $0.7 million for various equipment replacements. As of September 30, 2014, the Company had spent $5.8 million on 4.7 kilometres of underground development and $0.4 million on the tailings dam and $0.9 million on various mine equipment.
The $20.9 million capital budget at El Cubo includes $13.3 million for 11.0 kilometres of mine development, $2.0 million for tailing dam expansion, $3.5 million for mine equipment all to facilitate the increase in production from 1,200 tpd to 1,550 tpd in 2014. Additionally $2.1 million is budgeted to improve existing infrastructure to support the operations. As of September 30, 2014, 8.6 kilometres were developed underground for $11.1 million, $1.5 million on plant and tailings infrastructure and $2.7 million of mine equipment was purchased, including two additional scoops.
Contractual Obligations
The Company had the following contractual obligations at September 30, 2014:
| Payments due by period (in thousands of dollars) | |||||||||||||||
| Contractual Obligations | Total | Less than 1 year | 1 – 3 years | 3 – 5 years | More than 5 years | ||||||||||
| Capital Asset purchases | $ | 383 | $ | 383 | $ | - | $ | - | $ | - | |||||
| Operating Lease | 732 | 258 | 474 | - | - | ||||||||||
| Other Long-Term Liabilities | 6,681 | - | 6,681 | - | - | ||||||||||
| Total | $ | 7,796 | $ | 641 | $ | 7,155 | $ | - | $ | - | |||||
Transactions with Related Parties
The Company shares common administrative services and office space with Canarc Resource Corp. and Aztec Metals
Corp. (“Aztec”), who are related party companies by virtue of having Bradford Cooke as a common director. From time to time, Endeavour incurs third-party costs on behalf of the related parties which are charged on a full cost recovery basis. The Company had $190,000 net receivable related to administration costs outstanding as at September 30, 2014 (December 31, 2013 – $248,000).
During the period ended September 30, 2014, the Company was charged $129,000 (September 30, 2013 - $106,000) for legal services by Koffman Kalef LLP, a firm in which the Company’s Corporate Secretary is a partner. As of September 30, 2014, the Company had $10,000 relating to these legal services (December 31, 2013 - $8,000).
Financial Assets and Liabilities
As at September 30, 2014, the carrying and fair values of Endeavour’s financial instruments by category were as follows:
| As at September 30, 2014 | As at December 31, 2013 | |||||||||||
| Carrying | Estimated Fair | Carrying | Estimated Fair | |||||||||
| value | value | value | value | |||||||||
| $ | $ | $ | $ | |||||||||
| Financial assets: | ||||||||||||
| Cash and cash equivalents | 29,137 | 29,137 | 35,004 | 35,004 | ||||||||
| Available for sale securities | 817 | 817 | 1,463 | 1,463 | ||||||||
| Trade receivables | 10,651 | 10,651 | 10,263 | 10,263 | ||||||||
| Other receivables | 19,294 | 19,294 | 13,486 | 13,486 | ||||||||
| Total financial assets | 59,899 | 59,899 | 60,216 | 60,216 | ||||||||
| Financial liabilities: | ||||||||||||
| Accounts payable and accrued liabilities | 19,520 | 19,520 | 17,221 | 17,221 | ||||||||
| Revolving credit facility | 27,000 | 27,000 | 33,000 | 33,000 | ||||||||
| Contingent liabilities | - | - | 99 | 99 | ||||||||
| Derivative liabilities | - | - | 1,491 | 1,491 | ||||||||
| Total financial liabilities | 46,520 | 46,520 | 51,811 | 51,811 | ||||||||
| 30 |
Fair value hierarchy:
Fair value is the price that would be received to sell an asset or paid to transfer a liability in an orderly transaction between market participants at the measurement date. The fair value hierarchy establishes three levels to classify the inputs to valuation techniques used to measure fair value. Level 1 inputs are quoted prices (unadjusted) in active markets for identical assets or liabilities. Level 2 inputs are quoted prices in markets that are not active, quoted prices for similar assets or liabilities in active markets, inputs other than quoted prices that are observable for the asset or liability (for example, interest rate and yield curves observable at commonly quoted intervals, forward pricing curves used to value currency and commodity contracts and volatility measurements used to value option contracts), or inputs that are derived principally from or corroborated by observable market data or other means. Level 3 inputs are unobservable (supported by no or little market activity). The fair value hierarchy gives the highest priority to Level 1 inputs and the lowest priority to Level 3 inputs.
Financial assets and liabilities measured at fair value on a recurring basis include:
| Total | Level 1 | Level 2 | Level 3 | |||||||||
| As at September 30, 2014 | $ | $ | $ | $ | ||||||||
| Financial assets: | ||||||||||||
| Available for sale securities | 817 | 817 | - | - | ||||||||
| Trade receivables | 10,651 | 10,651 | - | - | ||||||||
| Total financial assets | 11,468 | 11,468 | - | - | ||||||||
| Financial liabilities: | ||||||||||||
| Contingent liabilities | - | - | - | - | ||||||||
| Total financial liabilities | - | - | - | - |
Available for sale securities
The Company holds marketable securities classified as Level 1 in the fair value hierarchy and as available for sale financial assets. The fair value of available for sale investments are determined based on a market approach reflecting the closing price of each particular security at the reporting date. The closing price is a quoted market price obtained from the exchange that is the principal active market for the particular security, being the market with the greatest volume and level of activity for the assets.
Trade receivables
The trade receivables consist of receivables from provisional silver and gold sales from the Bolañitos and El Cubo mine. The fair value of receivables arising from concentrate sales contracts that contain provisional pricing mechanisms is determined using the appropriate quoted closing price on the measurement date from the exchange that is the principal active market for the particular metal. As such, these receivables, which meet the definition of an embedded derivative, are classified within Level 1 of the fair value hierarchy.
| 31 |
Contingent liability
On July 13, 2012 the Company completed the acquisition of 100% of the issued and outstanding shares of Mexgold Resources Inc. (“Mexgold”), thereby acquiring the El Cubo mine. The seller is entitled to receive up to an additional $50 million in cash payments from the Company upon the occurrence of certain events as follows:
| i) | $20 million if at any time during the three years following the acquisition date the Company renews or extends the Las Torres lease, other than a one-time three month extension after the current lease expires; | |
| ii) | $10 million upon the simple average of the daily London Metals Exchange closing prices for gold exceeding $1,900.00 per ounce for a period of 12 consecutive months at any time during the three-year period immediately following the acquisition date; | |
| iii) | $10 million upon the simple average of the daily London Metals Exchange closing prices for gold exceeding $2,000.00 per ounce for a period of 12 consecutive months at any time during the three-year period immediately following the acquisition date; and | |
| iv) | $10 million upon the simple average of the daily London Metals Exchange closing prices for gold exceeding $2,100.00 per ounce for a period of 12 consecutive months at any time during the three-year period immediately following the acquisition date. |
The contingent consideration related to the Las Torres lease was valued based on factoring the probability of the Company negotiating a lease extension. Management determined the probability of extending the lease to be highly unlikely, resulting in a nil value assigned to the liability at acquisition. During the quarter ended September 30, 2013, the Las Torres lease was terminated resulting in no further liability.
The contingent consideration related to metal price targets is considered a derivative, is recognized at fair value at period end and is classified as Level 2 in the fair value hierarchy. The contingent consideration based on the performance of gold prices was valued using a Monte Carlo simulation. Monte Carlo simulation approaches are a class of computational algorithms that rely on repeated random sampling to compute their results. Gold price paths were developed using a mathematical formula based on a stochastic process with mean reversion to a long term trend line. As of September 30, 2014, the fair value of the contingent consideration was estimated to be $nil (December 31, 2013 - $99,000).
Under the terms of the Las Torres lease, the Company was required to provide financial guarantees to the owner of the Las Torres Facility as security against any environmental damages. As at September 30, 2014, there was $1 million in letters of credit provided by the Company as security to the owner of the Las Torres facility.
Financial Instrument Risk Exposure and Risk Management
The Company is exposed in varying degrees to a variety of financial instrument related risks. The Board approves and monitors the risk management process. The types of risk exposure and the way in which such exposure is managed is provided as follows:
Credit Risk
The Company is exposed to credit risk on its bank accounts, investments and accounts receivable. Credit risk exposure on bank accounts and short term investments is limited through maintaining the Company’s balances with high-credit quality financial institutions, maintaining investment policies, assessing institutional exposure and continual discussion with external advisors. Value added tax (“IVA”) receivables are generated on the purchase of supplies and services to produce silver which are refundable from the Mexican government. Trade receivables are generated on the sale of concentrate inventory to reputable metal traders.
| 32 |
Liquidity Risk
The Company ensures that there is sufficient capital in order to meet short term business requirements. The Company’s policy is to invest cash at floating rates of interest, while cash reserves are to be maintained in cash equivalents in order to maintain liquidity after taking into account the Company’s holdings of cash equivalents, money market investments, marketable securities, receivables and available cash under the revolving credit facility. The Company believes that these sources, operating cash flow and its policies will be sufficient to cover the likely short term cash requirements and commitments.
Market Risk
The significant market risk exposures to which the Company is exposed are foreign currency risk, interest rate risk, and commodity price risk.
Foreign Currency Risk – The Company’s operations in Mexico and Canada make it subject to foreign currency fluctuations. Certain of the Company’s operating expenses are incurred in Mexican pesos and Canadian dollars; therefore the fluctuation of the US dollar in relation to these currencies will consequently have an impact upon the profitability of the Company and may also affect the value of the Company’s assets and the amount of shareholders’ equity. The Company has not entered into any agreements or purchased any instruments to hedge possible currency risks.
Interest Rate Risk – In respect of financial assets, the Company’s policy is to invest cash at floating rates of interest and cash reserves are to be maintained in cash equivalents in order to maintain liquidity. Fluctuations in interest rates impact the value of cash equivalents. The revolving credit facility is subject to interest rate risk as amounts outstanding are subject to charges at a LIBOR-based rate (plus 2.75% to 4.25% depending on financial and operating measures) payable according to the quoted rate term. The interest rate charge for the year was approximately 3.3% . As at December 31, 2013, with other variables unchanged, a 10% increase in the LIBOR rate would be result in additional interest expense of $330,000.
Commodity Price Risk – Gold and silver prices have historically fluctuated significantly and are affected by numerous factors outside of the Company’s control, including, but not limited to , industrial and retail demand, central bank lending, forward sales by producers and speculators, levels of worldwide production, short-term changes in supply and demand because of speculative hedging activities and certain other factors. The Company has not engaged in any hedging activities, other than short term metal derivative transactions less than 90 days, to reduce its exposure to commodity price risk. Furthermore the Company carries a contingent liability linked to the price of gold. A significant rise in the gold price above $1900.00 could significantly affect the Company’s future earnings (see Contingent Liability on page 32)
Equity Price Risk – Fair values in the Company’s derivative liabilities related to the outstanding share purchase warrants denominated in Canadian dollars are subject to equity price risk. Changes in the market value of the Company’s common shares may have a material effect on the fair value of the Company’s warrants and on net income.
Outstanding Share Data
As of November 4, 2014, the Company had the following securities issued and outstanding:
- 101,976,901 common shares
- 6,649,550 stock options with a weighted average exercise price of CAN$5.43 per share expiring between November 12, 2014 and May 23, 2019.
The Company considers the items included in the consolidated statement of shareholders’ equity as capital. The Company’s objective when managing capital is to safeguard its ability to continue as a going concern so that it can continue to provide returns for shareholders and benefits for other stakeholders. The Company manages the capital structure and makes adjustments to it in light of changes in economic conditions and the risk characteristics of the underlying assets. In order to maintain or adjust the capital structure, the Company may issue new shares through private placements, prospectus offerings, convertible debentures, asset acquisitions or return capital to shareholders. The Company is not subject to externally imposed capital requirements.
| 33 |
Changes in Accounting Policies and Critical Accounting Estimates
Changes in Accounting Policies
The Company has adopted the following new standards, along with any consequential amendments, effective January 1, 2014. These changes were made in accordance with the applicable transitional provisions.
IFRIC 21, Levies
In May 2013, the IASB issued IFRIC 21,Levies,which provides guidance on accounting for levies in accordance with the requirements of IAS 37,Provisions, Contingent Liabilities and Contingent Assets. The interpretation defines a levy as an outflow from an entity imposed by a government in accordance with legislation. It also notes that levies do not arise from executor contracts or other contractual arrangements. The interpretation also confirms that an entity recognized a liability for a levy only when the triggering event specified in the legislation occurs. IFRIC 21 was applied retrospectively with no material impact on the financial statements.
New standards and amendments have been proposed; however, they do not impact the condensed consolidated interim financial statements and are not anticipated to impact the Company’s annual consolidated financial statements. The nature and impact of each new standard and amendment applicable to the Company are described below:
IFRS 9, Financial Instruments
In November 2009, the IASB issued IFRS 9,Financial Instruments, as the first step in its project to replace IAS 39Financial Instruments: Recognition and Measurement. On July 24, 20144 the IASB issued the complete IFRS 9. IFRS 9 retains but simplifies the mixed measurement model and establishes two primary measurement categories for financial assets: amortized cost and fair value. The basis of classification depends on an entity’s business model and the contractual cash flows of the financial asset. Classification is made at the time the financial asset is initially recognized, namely when the entity becomes a party to the contractual provisions of the instrument.
IFRS 9 amends some of the requirements of IFRS 7,Financial Instruments: Disclosures, including added disclosures about investments in equity instruments measured at fair value in OCI, and guidance on the measurement of financial liabilities and derecognition of financial instruments. The mandatory effective date of IFRS 9 is for annual periods beginning on or after January 1, 2018 with early adoption permitted. The Company is currently assessing the impact of adopting IFRS 9 on its consolidated financial statements, including the applicability of early adoption.
IFRS 15,Revenue from Contracts with Customers
On May 28, 2014, the IASB issued IFRS 15. The new standard is effective for annual periods beginning on or after January 1, 2017 with early adoption permitted. IFRS 15 will replace IAS 11Construction Contracts, IAS 18Revenue, IFRIC 13Customer Loyalty Programmes, IFRIC 15Agreements for the Construction of Real Estate, IFRIC 18Transfer of Assets from Customers and SIC 31Revenue –Barter Transactions Involving Advertising Services.
The standard contains a single model that applies to contracts with customers and two approaches to recognizing revenue: at a point in time or over time. The model features a contract-based five-step analysis of transactions to determine whether, how much and when revenue is recognized. New estimates and judgmental thresholds have also been introduced, which may affect the amount and/or timing of revenue recognized.
The Company intends to adopt IFRS 15 in its consolidated financial statements for the annual period beginning on January 1, 2017. The extent of the impact of adoption of the standard has not yet been determined.
The Company has not early adopted any other standard, interpretation or amendment in the condensed consolidated interim financial statements that have been issued, but not yet effective.
Critical Accounting Estimates
The preparation of financial statements requires the Company to make estimates that affect the reported amounts of assets and liabilities and disclosure of contingent assets and liabilities at the date of the financial statements and the reported amounts of revenues and expenses during the reporting period. Significant areas requiring the use of management judgement relate to the determination of mineralized reserves, plant and equipment lives, estimating the fair values of financial instruments and derivatives, estimating the fair value of convertible debenture components, impairment of long-lived assets, reclamation and rehabilitation provisions, recognition of deferred tax assets, and assumptions used in determining the fair value of non-cash share-based compensation.
| 34 |
See“Critical Accounting Estimates”in the Company’s annual MD&A for a detailed discussion of the areas in which critical accounting estimates are made.
Controls and Procedures
Endeavour’s management, including the Chief Executive Officer and Chief Financial Officer, has reviewed the Company’s internal controls over financial reporting to determine whether any changes occurred during the period that have materially affected, or are reasonably likely to materially affect, the Company’s internal controls over financial reporting. During the nine months ended September 30, 2014 there have been no changes that occurred that have materially affected, or are reasonably likely to materially affect, Endeavour’s internal controls over financial reporting.
| 35 |