
| MANAGEMENT’S DISCUSSION AND ANALYSIS |
| FOR THE YEAR ENDED DECEMBER 31, 2018 |
| |
This Management Discussion and Analysis (“MD&A”) should be read in conjunction with the consolidated financial statements of Endeavour Silver Corp. (“Endeavour” or “the Company”) for the year ended December 31, 2018 and the related notes contained therein, which were prepared in accordance with International Financial Reporting Standards (“IFRS”) as issued by the International Accounting Standards Board (“IASB”). The Company uses certain non-IFRS financial measures in this MD&A as described under “Non-IFRS Measures”. Additional information relating to the Company, including the most recent Annual Information Form (the “Annual Information Form”), is available on SEDAR at www.sedar.com, and the Company’s most recent annual report on Form 40-F has been filed with the U.S. Securities and Exchange Commission (the “SEC”). This MD&A contains “forward-looking statements” that are subject to risk factors set out in a cautionary note contained herein. All dollar amounts are expressed in United States (“U.S.”) dollars and tabular amounts are expressed in thousands of U.S. dollars unless otherwise indicated. This MD&A is dated as of February 22, 2019 and all information contained is current as of February 22, 2019 unless otherwise stated.
Cautionary Note to U.S. Investors concerning Estimates of Mineral Reserves and Measured, Indicated and Inferred Mineral Resources:
This MD&A has been prepared in accordance with the requirements of the securities laws in effect in Canada, which differ from the requirements of U.S. securities laws. The terms “mineral reserve”, “proven mineral reserve” and “probable mineral reserve” are Canadian mining terms as defined in accordance with Canadian National Instrument 43-101 – Standards of Disclosure for Mineral Projects (“NI 43-101”) and the Canadian Institute of Mining, Metallurgy and Petroleum (the “CIM”) - CIM Definition Standards on Mineral Resources and Mineral Reserves, adopted by the CIM Council, as amended. These definitions differ materially from the definitions in SEC Industry Guide 7 under the U.S. Securities Act of 1933, as amended.
Under SEC Industry Guide 7 standards, a “final” or “bankable” feasibility study is required to report reserves, the three-year historical average price is used in any reserve or cash flow analysis to designate reserves and the primary environmental analysis or report must be filed with the appropriate governmental authority.
In addition, the terms “mineral resource”, “measured mineral resource”, “indicated mineral resource” and “inferred mineral resource” are defined in and required to be disclosed by NI 43-101; however, these terms are not defined terms under SEC Industry Guide 7 and are normally not permitted to be used in reports and registration statements filed with the SEC. Investors are cautioned not to assume that any part or all of mineral deposits in these categories will ever be converted into SEC Industry Guide 7 reserves. “Inferred mineral resources” have a great amount of uncertainty as to their existence, and great uncertainty as to their economic and legal feasibility. It cannot be assumed that all or any part of an inferred mineral resource will ever be upgraded to a higher category. Under Canadian rules, estimates of inferred mineral resources may not form the basis of feasibility or pre-feasibility studies, except in rare cases. Investors are cautioned not to assume that all or any part of an inferred mineral resource exists or is economically or legally mineable. Disclosure of “contained ounces” in a resource is permitted disclosure under Canadian regulations; however, the SEC normally only permits issuers to report mineralization that does not constitute “reserves” by SEC Industry Guide 7 standards as in place tonnage and grade without reference to unit measures.
Accordingly, information contained in this MD&A contains descriptions of the Company’s mineral deposits that may not be comparable to similar information made public by U.S. companies subject to the reporting and disclosure requirements under the U.S. federal securities laws and the rules and regulations thereunder, including SEC Industry Guide 7.
| |
609 Granville Street, Suite 1130, PO Box #10328, Vancouver, B.C., Canada V7Y 1G5
Phone: 604.685.9775 | Fax: 604.685.9744 | Toll Free: 1.877.685.9775 Email: info@edrsilver.com
www.edrsilver.com
|
Forward-Looking Statements
This MD&A contains “forward-looking statements” within the meaning of the U.S. Securities Litigation Reform Act of 1995, as amended and “forward-looking information” within the meaning of applicable Canadian securities legislation. Such forward-looking statements and information include, but are not limited to, statements regarding Endeavour’s anticipated performance in 2019, including silver and gold production, financial results, timing and expenditures to develop new silver mines and mineralized zones, silver and gold grades and recoveries, cash costs per ounce, capital expenditures and sustaining capital. Forward-looking statements are frequently characterized by words such as “plan”, “expect”, “forecast”, “project”, ”intend”, ”believe”, ”anticipate”, “outlook” and other similar words, or statements that certain events or conditions “may” or “will” occur. Forward- looking statements are based on the opinions and estimates of management at the dates the statements are made, and are subject to a variety of risks and uncertainties and other factors that could cause actual events or results to differ materially from those projected in the forward-looking statements.
The Company does not intend to, and does not assume any obligation to, update such forward-looking statements or information, other than as required by applicable law. Forward-looking statements or information involve known and unknown risks, uncertainties and other factors and are based on assumptions that may cause the actual results, level of activity, performance or achievements of the Company and its operations to be materially different from those expressed or implied by such statements. Such factors and assumptions include, among others: fluctuations in the prices of silver and gold, fluctuations in the currency markets (particularly the Mexican peso, Chilean peso, Canadian dollar and U.S. dollar); changes in national and local governments, legislation, taxation, controls, regulations and political or economic developments in Canada and Mexico; operating or technical difficulties in mineral exploration, development and mining activities; risks and hazards of mineral exploration, development and mining (including, but not limited to environmental hazards, industrial accidents, unusual or unexpected geological conditions, pressures, cave-ins and flooding); inadequate insurance, or inability to obtain insurance; availability of and costs associated with mining inputs and labour; the speculative nature of mineral exploration and development, diminishing quantities or grades of mineral reserves as properties are mined; the ability to successfully integrate acquisitions; risks in obtaining necessary licenses and permits, and challenges to the Company’s title to properties; as well as those factors described under “Risk Factors” in the Company’s Annual Information Form. Although the Company has attempted to identify important factors that could cause actual results to differ materially from those contained in forward-looking statements or information, there may be other factors that cause results to be materially different from those anticipated, described, estimated, assessed or intended. There can be no assurance that any forward-looking statements or information will prove to be accurate as actual results and future events could differ materially from those anticipated in such statements or information. Accordingly, readers should not place undue reliance on forward-looking statements or information.
Qualified Person
The scientific and technical information contained in this MD&A relating to the Company’s mines and mineral projects has been reviewed and approved by Godfrey Walton, M.Sc., P.Geo., President and Chief Operating Officer of Endeavour, a Qualified Person within the meaning of NI 43-101.
TABLE OF CONTENTS
| ENDEAVOUR SILVER CORP. | MANAGEMENT’S DISCUSSION & ANALYSIS | PAGE2 |
| | |
| Three Months Ended December 31 | 2018 Highlights | Year Ended December 31 |
| 20 18 | 20 17 | % Change | | 20 18 | 20 17 | % Change |
| | | | Production | | | |
| 1,386,505 | 1,436,962 | (4%) | Silver ounces produced | 5,522,068 | 4,919,788 | 12% |
| 13,117 | 14,577 | (10 %) | Gold ounces produced | 52,967 | 53,007 | (0%) |
| 1,359,256 | 1,400,705 | (3%) | Payable silver ounces produced | 5,417,633 | 4,803,589 | 13% |
| 12,821 | 14,245 | (10 %) | Payable gold ounces produced | 51,826 | 51,797 | 0% |
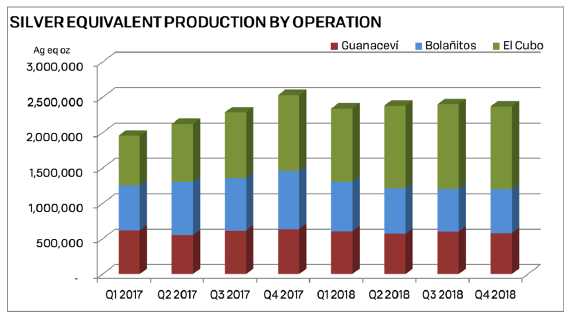
| 2,370,280 | 2,530,237 | (6%) | Silver equivalent ounces produced(1) | 9,494,593 | 8,895,313 | 7% |
| 9.22 | 7.97 | 16% | Cash costs per silver ounce(2)(3) | 8.06 | 8.06 | 0% |
| 14.30 | 11.38 | 26% | Total production costs per ounce(2)(4) | 15.21 | 11.68 | 30% |
| 14.20 | 12.70 | 12% | All-in sustaining costs per ounce(2)(5) | 15.45 | 16.96 | (9%) |
| 309,036 | 349,924 | (12%) | Processed tonnes | 1,266,831 | 1,279,873 | (1%) |
| 93.52 | 84.38 | 11% | Direct production costs per tonne(2)(6) | 86.32 | 82.36 | 5% |
| 11.53 | 11.57 | (0%) | Silver co-product cash costs(7) | 11.15 | 11.88 | (6%) |
| 984 | 885 | 11% | Gold co-product cash costs(7) | 902 | 886 | 2% |
| | | | Financial | | | |
| 33.8 | 41.6 | (19%) | Revenue ($ millions) | 150 .5 | 150 .5 | 0% |
| 1,264,340 | 1,392,518 | (9%) | Silver ounces sold | 5,461,197 | 4,892,855 | 12% |
| 11,819 | 14,117 | (16%) | Gold ounces sold | 51,318 | 51,460 | (0%) |
| 14.88 | 16.84 | (12%) | Realized silver price per ounce | 15.65 | 17.24 | (9%) |
| 1,270 | 1,288 | (1%) | Realized gold price per ounce | 1,267 | 1,285 | (1%) |
| (3.7) | 2.7 | (237%) | Net earnings (loss) ($ millions) | (12.4) | 9.7 | (228%) |
| 0.4 | 7.9 | (95%) | Mine operating earnings ($ millions) | 3.5 | 28.5 | (88%) |
| 8.5 | 12.7 | (33%) | Mine operating cash flow(8)($ millions) | 43.9 | 45.4 | (3%) |
| 0.1 | 4.6 | (99%) | Operating cash flow before working capital changes(9) | 22.2 | 23.6 | (6%) |
| 2.2 | 6.9 | (68%) | Earnings before ITDA(10)($ millions) | 21.9 | 25.6 | (14%) |
| 54.5 | 66.2 | (18%) | Working capital ($ millions) | 54.5 | 66.2 | (18%) |
| | | | Shareholders | | | |
| (0.03) | 0.02 | (250%) | Earnings (loss) per share – basic | (0.10) | 0.08 | (225%) |
| 0.00 | 0.04 | (100%) | Operating cash flow before working capital changes per share(9) | 0.17 | 0.19 | 11% |
| 130,511,679 | 127,486,671 | 2% | Weighted average shares outstanding | 128,600,421 | 127,340,834 | 1% |
| (1) | Silver equivalents are calculated using a 75:1 ratio. 2017 Silver equivalents have been restated from 70:1 to 75:1 for comparative purposes. |
| (2) | The Company reports non-IFRS measures which include cash costs net of by-products on a payable silver basis, total production costs per ounce, all-in sustaining costs per ounce and direct production costs per tonne, in order to manage and evaluate operating performance at each of the Company’s mines. These measures, some established by the Silver Institute (Production Cost Standards, June 2011), are widely used in the silver mining industry as a benchmark for performance, but do not have a standardized meaning. These measures are reported on a production basis. See Reconciliations to IFRS beginning on page 20. |
| (3) | Cash costs net of by-products per payable silver ounce include mining, processing (including smelting, refining, transportation and selling costs), and direct overhead, net of gold credits. See Reconciliation to IFRS on pages 22 & 23. |
| (4) | Total production costs per ounce include mining, processing (including smelting, refining, transportation and selling costs), direct overhead, amortization, depletion and amortization at the operation sites. See Reconciliation to IFRS on pages 22 & 23. |
| (5) | All-in sustaining cost per ounce include mining, processing (including smelting, refining, transportation and selling costs), direct overhead, corporate general and administration, on-site exploration, share-based compensation, reclamation and sustaining capital net of gold credits. See Reconciliation to IFRS on page 24. |
| (6) | Direct production costs per tonne include mining, processing (including smelting, refining, transportation and selling costs) and direct overhead at the operation sites. See Reconciliation to IFRS on pages 22 & 23. |
| (7) | Silver co-product cash cost and gold co-product cash cost include mining, processing (including smelting, refining, transportation and selling costs), and direct overhead allocated on pro-rated basis of realized metal value. See Reconciliation to IFRS on pages 25 & 26. |
| (8) | Mine operating cash flow is calculated by adding back amortization, depletion, inventory write-downs and share-based compensation to mine operating earnings. Mine operating earnings and mine operating cash flow are before taxes. See Reconciliation to IFRS on page 20. |
| (9) | See Reconciliation to IFRS on page 20 for the reconciliation of operating cash flow before working capital changes and for the operating cash flow before working capital changes per share. |
| (10) | See Reconciliation of Earnings before interest, taxes, depreciation and amortization on page 21. |
The above highlights are key measures used by management, however they should not be the sole measures used in determining the performance of the Company’s operations.
| ENDEAVOUR SILVER CORP. | MANAGEMENT’S DISCUSSION & ANALYSIS | PAGE3 |
| | |
HISTORY AND STRATEGY
The Company is engaged in silver mining in Mexico and related activities including property acquisition, exploration, development, mineral extraction, processing, refining and reclamation. The Company is also engaged in exploration activities in Chile.
Since 2002, the Company’s business strategy has been to focus on acquiring advanced-stage silver mining properties in Mexico. Mexico, despite its long and prolific history of metal production, appears to be relatively under-explored using modern exploration techniques and offers promising geological potential for precious metals exploration and production.
The Company’s Guanaceví and Bolañitos mines acquired in 2004 and 2007, respectively, demonstrate its business model of acquiring fully built and permitted silver mines that were about to close for lack of ore. By bringing the money and expertise needed to find new silver ore-bodies, the Company successfully re-opened and expanded these mines to develop their full potential. The benefit of acquiring fully built and permitted mining and milling infrastructure is that, if new exploration efforts are successful, the mine development cycle from discovery to production only takes a matter of months instead of the several years normally required in the traditional mining business model.
In 2012, the Company acquired the El Cubo silver-gold mine located in Guanajuato, Mexico. The El Cubo property came with substantial reserves and resources and the mine was already operating at 1,100 tonnes per day (tpd). After acquisition, the Company initiated a two-year operational turn-around and capital investment program aimed at increasing throughput, grade and productivity in order to reduce operating costs and return the operation to profitability.
In addition to operating the Guanaceví, Bolañitos and El Cubo mines, the Company is currently commissioning the El Compas mine for commercial production in Q1, 2019. The Company is advancing the Terronera development project and several exploration projects in order to achieve its goal to become a premier senior producer in the silver mining sector.
The Company has historically funded its acquisition, exploration and development activities through equity financings, debt facilities and convertible debentures. In recent years, the Company has financed most of its acquisition, exploration, development and operating activities from production cash flows, treasury and equity financings. The Company may choose to undertake equity, debt, convertible debt or other financings, on an as-needed basis, in order to facilitate its growth.
| ENDEAVOUR SILVER CORP. | MANAGEMENT’S DISCUSSION & ANALYSIS | PAGE4 |
| | |
REVIEW OF OPERATING RESULTS
The Company operates the Guanaceví, Bolañitos and El Cubo mines in Mexico. In addition, the Company is currently commissioning the fully built and permitted El Compas project anticipating commercial production in Q1, 2019.
Consolidated Production Results for the Three Months and Years Ended December 31, 2018 and 2017
| Three Months Ended December 31 | CONSOLIDATED | Year Ended December 31 |
| 2018 | 2017 | % Change | | 2018 | 2017 | % Change |
| 309,036 | 349,924 | (12%) | Ore tonnes processed | 1,266,831 | 1,279,873 | (1%) |
| 157 | 152 | 3% | Average silver grade (gpt) | 156 | 140 | 11% |
| 88.8 | 84.1 | 6% | Silver recovery (%) | 86.9 | 85.4 | 2% |
| 1,386,505 | 1,436,962 | (4%) | Total silver ounces produced | 5,522,068 | 4,919,788 | 12% |
| 1,359,256 | 1,400,705 | (3%) | Payable silver ounces produced | 5,417,633 | 4,803,589 | 13% |
| 1.55 | 1.56 | (1%) | Average gold grade (gpt) | 1.53 | 1.54 | (1%) |
| 85.4 | 83.3 | 3% | Gold recovery (%) | 84.9 | 83.9 | 1% |
| 13,117 | 14,577 | (10%) | Total gold ounces produced | 52,967 | 53,007 | (0%) |
| 12,821 | 14,245 | (10%) | Payable gold ounces produced | 51,826 | 51,797 | 0% |
| 2,370,280 | 2,530,237 | (6%) | Silver equivalent ounces produced(1) | 9,494,593 | 8,895,313 | 7% |
| 9.22 | 7.97 | 16% | Cash costs per silver ounce(2)(3) | 8.06 | 8.06 | 0% |
| 14.30 | 11.38 | 26% | Total production costs per ounce(2)(4) | 15.21 | 11.68 | 30% |
| 14.20 | 12.70 | 12% | All in sustaining cost per ounce(2)(5) | 15.45 | 16.96 | (9%) |
| 93.52 | 84.38 | 11% | Direct production costs per tonne(2)(6) | 86.32 | 82.36 | 5% |
| 11.53 | 11.57 | (0%) | Silver co-product cash costs(7) | 11.15 | 11.88 | (6%) |
| 984 | 885 | 11% | Gold co-product cash costs(7) | 902 | 886 | 2% |
| (1) | Silver equivalents are calculated using a 75:1 ratio. 2017 Silver equivalents have been restated from 70:1 to 75:1 for comparative purposes. |
| (2) | The Company reports non-IFRS measures which include cash costs net of by-products on a payable silver basis, total production costs per ounce, all-in sustaining costs per ounce and direct production costs per tonne, in order to manage and evaluate operating performance at each of the Company’s mines. These measures, some established by the Silver Institute (Production Cost Standards, June 2011), are widely used in the silver mining industry as a benchmark for performance, but do not have a standardized meaning. These measures are reported on a production basis. See Reconciliations to IFRS on page 20. |
| (3) | Cash costs net of by-products per payable silver ounce include mining, processing (including smelting, refining, transportation and selling costs), and direct overhead, net of gold credits. See Reconciliation to IFRS on pages 22 & 23. |
| (4) | Total production costs per ounce include mining, processing (including smelting, refining, transportation and selling costs), direct overhead, amortization, depletion and amortization at the operation sites. See Reconciliation to IFRS on pages 22 & 23. |
| (5) | All-in sustaining costs per ounce include mining, processing (including smelting, refining, transportation and selling costs), direct overhead, corporate general and administration, on-site exploration, share-based compensation, reclamation and sustaining capital net of gold credits. See Reconciliation to IFRS on page 24. |
| (6) | Direct production costs per tonne include mining, processing (including smelting, refining, transportation and selling costs) and direct overhead at the operation sites. See Reconciliation to IFRS on pages 22 & 23. |
| (7) | Silver co-product cash cost and gold co-product cash cost include mining, processing (including smelting, refining, transportation and selling costs), and direct overhead allocated on pro-rated basis of realized metal value. See Reconciliation to IFRS on pages 25 & 26. |
| ENDEAVOUR SILVER CORP. | MANAGEMENT’S DISCUSSION & ANALYSIS | PAGE5 |
| | |
Consolidated Production
Three months ended December 31, 2018 (compared to the three months ended December 31, 2017)
Consolidated silver production during Q4, 2018 was 1,386,505 ounces (oz), a decrease of 4% compared to 1,436,962 oz in Q4, 2017, and gold production was 13,117 oz, a decrease of 10% compared to 14,577 oz in Q4, 2017. Plant throughput was 309,036 tonnes at average grades of 157 grams per tonne (gpt) silver and 1.55 gpt gold, compared to 349,924 tonnes grading 152 gpt silver and 1.56 gpt gold in Q4, 2017. Silver production was lower in Q4, 2018 compared to Q4, 2017, due to decreased throughput at each operation. The lower throughput was offset by improved recoveries as a result of increased residency time.
Year ended December 31, 2018 (compared to the year ended December 31, 2017)
Consolidated silver production during 2018 was 5,522,068 ounces, an increase of 12% compared to 4,919,788 oz in 2017, and gold production was 52,967 oz, nearly flat compared to 53,007 oz over the same period in 2017. Plant throughput was 1,266,831 tonnes at average grades of 156 grams per tonne (gpt) silver and 1.53 gpt gold, compared to 1,279,873 tonnes grading 140 gpt silver and 1.54 gpt gold in 2017. Silver production was higher in 2018 compared to 2017 due to higher mine output and silver grades at El Cubo and Bolañitos, partially offset by lower throughput and silver grades at Guanaceví. Higher gold production in 2018 compared to 2017 was primarily due to higher gold grades at El Cubo and higher recoveries from all operations. Gold production was offset by lower gold production from Bolañitos where gold grades dipped 20%.
In 2018, Company’s performance resulted in a 7% production shortfall compared to the 2018 consolidated production guidance, due to the delayed commercial production at El Compas, lower gold grades mined at Bolañitos and lower mine output and silver grades at Guanaceví.
Consolidated Operating Costs
Three months ended December 31, 2018 (compared to the three months ended December 31, 2017)
Direct production costs per tonne in Q4, 2018 increased 11% compared with Q4, 2017 a 12% drop in throughput on a consolidated basis.
Consolidated cash costs per oz, net of by-product credits (a non-IFRS measure and a standard of the Silver Institute) increased 16% primarily due to the lower productivity and increased profit sharing compared to the prior year. Similarly, all-in sustaining costs (also a non-IFRS measure) which, compared to Q4, 2017, increased 12% to $14.20 per oz in Q4, 2018. This increase in all-in sustaining costs was also a result of lower productivity in Q4, 2018 compared to Q4, 2017.
| ENDEAVOUR SILVER CORP. | MANAGEMENT’S DISCUSSION & ANALYSIS | PAGE6 |
| | |
Year ended December 31, 2018 (compared to the year ended December 31, 2017)
Direct production costs per tonne in 2018 increased 5% compared to 2017. The higher production costs per tonne were driven mainly from Guanaceví, which included costs related to the implementation of a productivity optimization program and slightly higher labour and contractor costs within the operations. Improved efficiencies at El Cubo and Bolañitos partially offset the higher costs incurred at Guanaceví.
The higher direct costs per tonne was offset by 11% higher silver grades and improved silver and gold recoveries resulting in flat consolidated cash costs per oz, net of by-product credits (a non-IFRS measure and a standard of the Silver Institute). All-in sustaining costs (a non-IFRS measure) which, compared to 2017, decreased 9% to $15.45 per oz in 2018. This decrease in all-in sustaining costs is attributable to the lower capital expenditures, lower stock based compensation and slightly lower exploration expenditures in 2018 compared to 2017, partially offset by higher general and administration charges at the corporate level.
For the year ended December 31, 2018, direct production costs were $86.32 per tonne compared to the guided range of $80-$85 per tonne. The lower throughput and higher costs than planned at Guanaceví drove the higher consolidated direct costs per tonne than guided.
Consolidated cash costs, net of gold by-product credits, were guided to be $6.00 -$7.00 per oz of silver in 2018 and consolidated cash costs expressed on a co-product basis were guided to be $10.00 -$11.00 per oz silver and $750-$800 per oz gold. For the year ended December 31, 2018, cash costs, net of gold by-product credits, were $8.06 per oz and cash costs expressed on a co-product basis were $11.15 per oz silver and $902 per gold oz. The lower than planned throughput resulted in higher than guided costs per tonne and costs per ounce.
All-in sustaining costs (AISC), net of gold by-product credits, in accordance with the World Gold Council standard, were guided to be $15.00 -$16.00 per oz of silver produced in 2018 reflecting new investments in sustaining exploration and development programs. For the year ended December 31, 2018 AISC, net of gold by-product credits, is $15.45 as the Company spent less on sustaining capital expenditures than guided. The lower capital expenditures were offset by higher operating costs on a per ounce basis.
Management assumed a $17 per oz silver price, $1,275 per oz gold price, and 19:1 Mexican peso per US dollar exchange rate for its 2018 cost guidance.
| ENDEAVOUR SILVER CORP. | MANAGEMENT’S DISCUSSION & ANALYSIS | PAGE 7 |
| | |
Guanaceví Operations
The Guanaceví operation is currently producing from three underground silver-gold mines along a five kilometre (km) length of the prolific Santa Cruz vein. Guanaceví provides steady employment for over 500 people and engages 482 contractors. Guanaceví mine production was below plant capacity due to the operational issues mentioned under “Guanaceví Production Results”. The development of two new orebodies, Milache and SCS, is expected to provide sufficient ore and plan flexibility to meet the designed capacity of the plant. Initial production at Milache commenced in October 2018 with 300 tpd expected in 2019 and the SCS portal was collared in late 2018 with 200-300 tpd production expected in H2, 2019.
Production Results for the Three Months and Years Ended December 31, 2018 and 2017
| Three Months Ended December 31 | GUANACEVÍ | Year Ended December 31 |
| 2018 | 2017 | % Change | | 2018 | 2017 | % Change |
| 75,528 | 83,881 | (10 %) | Ore tonnes processed | 307,042 | 321,113 | (4%) |
| 222 | 241 | (8%) | Average silver grade (g/ t) | 222 | 230 | (3%) |
| 89.8 | 83.7 | 7% | Silver recovery (%) | 89.6 | 87.0 | 3% |
| 484,197 | 544,117 | (11%) | Total silver ounces produced | 1,963,773 | 2,066,448 | (5%) |
| 483,713 | 543,573 | (11%) | Payable silver ounces produced | 1,961,788 | 2,064,382 | (5%) |
| 0.58 | 0.54 | 7% | Average gold grade (g/ t) | 0 .59 | 0 .53 | 11% |
| 88.0 | 85.5 | 3% | Gold recovery (%) | 89.7 | 86.6 | 4% |
| 1,240 | 1,245 | (0%) | Total gold ounces produced | 5,224 | 4,740 | 10% |
| 1,238 | 1,245 | (1%) | Payable gold ounces produced | 5,218 | 4,736 | 10% |
| 577,197 | 637,492 | (9%) | Silver equivalent ounces produced(1) | 2,355,573 | 2,421,948 | (3%) |
| 19.38 | 12.39 | 56% | Cash costs per silver ounce(2)(3) | 17.57 | 13.41 | 31% |
| 27.24 | 19.92 | 37% | Total production costs per ounce(2)(4) | 29.42 | 20 .20 | 46% |
| 27.49 | 17.57 | 56% | All in sustaining cost per ounce(2)(5) | 27.01 | 22.87 | 18% |
| 144.57 | 99.39 | 45% | Direct production costs per tonne(2)(6) | 133.78 | 105.13 | 27% |
| 18.51 | 13.04 | 42% | Silver co-product cash costs(7) | 17.21 | 13.95 | 23% |
| 1,579 | 997 | 58% | Gold co-product cash costs(7) | 1,393 | 1,040 | 34% |
| (1) | Silver equivalents are calculated using a 75:1 ratio. 2017 Silver equivalents have been restated from 70:1 to 75:1 for comparative purposes. |
| (2) | The Company reports non-IFRS measures which include cash costs net of by-product on a payable silver basis, total production costs per ounce, all-in sustaining costs per ounce and direct production costs per tonne, in order to manage and evaluate operating performance at each of the Company’s mines. These measures, some established by the Silver Institute (Production Cost Standards, June 2011), are widely used in the silver mining industry as a benchmark for performance, but do not have a standardized meaning. These measures are reported on a production basis. See Reconciliation to IFRS on page 20. |
| (3) | Cash costs net of by-product per payable silver ounce include mining, processing (including smelting, refining, transportation and selling costs), and direct overhead, net of gold credits. See Reconciliation to IFRS on pages 22 & 23. |
| (4) | Total production costs per ounce include mining, processing (including smelting, refining, transportation and selling costs), direct overhead, amortization, depletion and amortization at the operation sites. See Reconciliation to IFRS on pages 22 & 23. |
| (5) | All-in sustaining cost per ounce include mining, processing (including smelting, refining, transportation and selling costs), direct overhead, corporate general and administration, on-site exploration, share-based compensation, reclamation and sustaining capital net of gold credits. See Reconciliation to IFRS on page 24. |
| (6) | Direct production costs per tonne include mining, processing (including smelting, refining, transportation and selling costs) and direct overhead at the operation sites. See Reconciliation to IFRS on pages 22 & 23. |
| (7) | Silver co-product cash cost and gold co-product cash cost include mining, processing (including smelting, refining, transportation and selling costs), and direct overhead allocated on pro-rated basis of realized metal value. See Reconciliation to IFRS on pages 25 & 26. |
| ENDEAVOUR SILVER CORP. | MANAGEMENT’S DISCUSSION & ANALYSIS | PAGE8 |
| | |
Guanaceví Production Results
Three months ended December 31, 2018 (compared to the three months ended December 31, 2017)
Silver production at the Guanaceví mine during Q4, 2018 was 484,197 oz, a decrease of 11% compared to 544,177 oz in Q4, 2017, and gold production was 1,240 oz, flat compared to 1,245 oz in Q4, 2017. Plant throughput was 75,528 tonnes at average grades of 222 gpt silver and 0.58 gpt gold, compared to 83,881 tonnes grading 241 gpt silver and 0.54 gpt gold in Q4, 2017. The Q4, 2018 throughput and silver grade decreased compared to Q4, 2017 as electrical brown outs and pump failures impacted daily volume output and dilution reduced ore grade from the Santa Cruz zone.
Year ended December 31, 2018 (compared to the year ended December 31, 2017)
Silver production at the Guanaceví mine during 2018 was 1,963,773 oz, a decrease of 5% compared to 2,066,448 oz in 2017, and gold production was 5,224 oz, an increase of 10% compared to 4,740 oz in 2017. Plant throughput was 307,042 tonnes at average grades of 222 gpt silver and 0.59 gpt gold, compared to 321,113 tonnes grading 230 gpt silver and 0.53 gpt gold in 2017. Guanaceví silver production was lower due to the slightly lower throughput and silver grade partly offset by higher silver recoveries. Higher gold grades due to variations in the ore deposit resulted higher gold production and higher gold recoveries in 2018 compared to previous year.
Management guided 2018 production at Guanaceví to range from 2.2 to 2.5 million oz silver and 5,000 to 5,500 oz gold. In 2018, Guanaceví continued to face operational challenges and fell short of guidance. The remaining reserves at the two operating mines, Porvenir Norte and Santa Cruz, are now deeper, narrower and lower grade compared to prior years, resulting in lower production from these areas than anticipated. The permitting and development of two new shallower, wider, higher grade orebodies, Milache and SCS, suffered delays which resulted in a shortfall of both tonnes and grades to the plant. At year-end, the Milache orebody had three underground levels open and advancing in lower grade ore with grades increasing with depth as, modeled. A new ramp was collared late in the year to develop the SCS orebody. Management expects both new orebodies will reach their planned production rates during 2019.
Guanaceví Operating Costs
Three months ended December 31, 2018 (compared to the three months ended December 31, 2017)
Direct production costs per tonne in Q4, 2018 rose 45% compared with Q4, 2017, as a result of the lower mine output, pump failures and maintenance costs. The higher costs per tonne, with lower silver and gold grade ore, resulted in 56% higher cash costs per oz, net of byproduct credits (a non-IFRS measure and a standard of the Silver Institute). Water pumping issues and the impact on productivity attributed to the higher costs per tonne year over year, while productivity gains are expected as the mine enters new ore bodies. All-in sustaining costs (a non-IFRS measure) which, compared to Q4, 2017, rose 56% to $27.49 per oz in Q4, 2018. The rise in cash costs and the slightly higher capital both contributed the rise in costs compared to Q4, 2017.
Year ended December 31, 2018 (compared to the year ended December 31, 2017)
As a result of a 4% decrease in throughput, an investment in an optimization program and continued water pumping issues, direct production costs per tonne in 2018 rose 27% compared to 2017. The higher costs per tonne was partially offset with higher gold grade and improved recoveries resulting in 31% higher cash costs per oz, net of by-product credits (a non-IFRS measure and a standard of the Silver Institute). All-in sustaining costs (also a non-IFRS measure) which, compared to 2017 increased 18%.
At Guanaceví, the two operating mines, Porvenir Norte and Santa Cruz, are now deeper, narrower, lower grade and higher cost than in prior years. In 2018, Endeavour completed the permitting and initial development of two new shallower, wider, higher grade, lower cost orebodies, Milache and Santa Cruz Sur (SCS) with expenditures classified as sustaining capital. As of December 31, 2018, $5.5 million was invested at Milache developing three levels of the ore body. A new mine access ramp was collared at SCS in late 2018 to facilitate development of the orebody in 2019. The Milache and SCS production rates are expected to climb each quarter to their respective 200-300 tpd capacities by mid-year, first to fill the plant to its 1,200 tpd capacity and then to steadily displace the higher cost production at Porvenir Norte and Santa Cruz.
| ENDEAVOUR SILVER CORP. | MANAGEMENT’S DISCUSSION & ANALYSIS | PAGE9 |
| | |
Bolañitos Operations
The Bolañitos operation encompasses three undergound silver-gold mines and a flotation plant. Bolañitos provides steady employment for over 350 people and engages 205 contractors.
Production Results for the Three Months and Years Ended December 31, 2018 and 2017
| Three Months Ended December 31 | BOLAÑITOS | Year Ended December 31 |
| 2018 | 2017 | % Change | | 2018 | 2017 | % Change |
| 105,768 | 124,172 | (15%) | Ore tonnes processed | 439,005 | 446,924 | (2%) |
| 82 | 86 | (5%) | Average silver grade (g/ t) | 86 | 80 | 8% |
| 84.4 | 81.8 | 3% | Silver recovery (%) | 80.4 | 81.3 | (1%) |
| 235,326 | 280,712 | (16%) | Total silver ounces produced | 975,555 | 934,238 | 4% |
| 228,184 | 269,484 | (15%) | Payable silver ounces produced | 946,995 | 896,869 | 6% |
| 1.77 | 2.18 | (19%) | Average gold grade (g/ t) | 1.79 | 2.24 | (20%) |
| 85.8 | 82.8 | 4% | Gold recovery (%) | 83.6 | 83.6 | 0% |
| 5,166 | 7,204 | (28%) | Total gold ounces produced | 21,127 | 26,910 | (21%) |
| 5,037 | 7,025 | (28%) | Payable gold ounces produced | 20,621 | 26,238 | (21%) |
| 622,776 | 821,012 | (24%) | Silver equivalent ounces produced(1) | 2,560,080 | 2,952,488 | (13%) |
| 2.59 | (2.73) | 195% | Cash costs per silver ounce(2)(3) | 2.14 | (4.00) | 154% |
| 2.25 | (1.47) | (253%) | Total production costs per ounce(2)(4) | 3.08 | (1.80) | 271% |
| 5.12 | 1.01 | 407% | All in sustaining cost per ounce(2)(5) | 9.00 | 1.62 | 454% |
| 66.43 | 67.04 | (1%) | Direct production costs per tonne(2)(6) | 64.20 | 67.68 | (5%) |
| 10.39 | 10.01 | 4% | Silver co-product cash costs(7) | 10.49 | 10.29 | 2% |
| 887 | 765 | 16% | Gold co-product cash costs(7) | 849 | 767 | 11% |
| (1) | Silver equivalents are calculated using a 75:1 ratio. 2017. Silver equivalents have been restated from 70:1 to 75:1 for comparative purposes. |
| (2) | The Company reports non-IFRS measures which include cash costs net of by-products on a payable silver basis, total production costs per ounce, all-in sustaining costs per ounce and direct production costs per tonne, in order to manage and evaluate operating performance at each of the Company’s mines. These measures, some established by the Silver Institute (Production Cost Standards, September 2011), are widely used in the silver mining industry as a benchmark for performance, but do not have a standardized meaning. These measures are reported on a production basis. See Reconciliation to IFRS on page 20. |
| (3) | Cash costs net of by-product per payable silver ounce include mining, processing (including smelting, refining, transportation and selling costs), and direct overhead, net of gold credits. See Reconciliation to IFRS on pages 22 & 23. |
| (4) | Total production costs per ounce include mining, processing (including smelting, refining, transportation and selling costs), direct overhead, amortization, depletion and amortization at the operation sites. See Reconciliation to IFRS on pages 22 & 23. |
| (5) | All-in sustaining cost per ounce include mining, processing (including smelting, refining, transportation and selling costs), direct overhead, corporate general and administration, on-site exploration, share-based compensation, reclamation and sustaining capital net of gold credits. See Reconciliation to IFRS on page 24. |
| (6) | Direct production costs per tonne include mining, processing (including smelting, refining, transportation and selling costs) and direct overhead at the operation sites. See Reconciliation to IFRS on pages 22 & 23. |
| (7) | Silver co-product cash cost and gold co-product cash cost include mining, processing (including smelting, refining, transportation and selling costs), and direct overhead allocated on pro-rated basis of realized metal value. See Reconciliation to IFRS on pages 25 & 26. |
| ENDEAVOUR SILVER CORP. | MANAGEMENT’S DISCUSSION & ANALYSIS | PAGE10 |
| | |
Bolañitos Production Results
Management guided 2018 production at Bolañitos to range from 1.0 to 1.1 million oz silver and 23,500 to 25,500 oz gold. In 2018, Bolañitos throughput exceeded plan however grades were below the mine plan, which was modified to include new but lower grade resources along the margins of the LL-Asuncion and Plateros veins to extend the mine life, resulting in lower production grades and metal production compared to guidance.
Three months ended December 31, 2018 (compared to the three months ended December 31, 2017)
Silver production at the Bolañitos mine was 235,326 oz in Q4, 2018, a decrease of 16% compared to 280,712 oz in Q4, 2017, and gold production was 5,166 oz in Q4, 2018, a decrease of 28% compared to 7,204 oz in Q4, 2017. Plant throughput in Q4, 2018 was 105,768 tonnes at average grades of 82 gpt silver and 1.77 gpt gold, compared to 124,172 tonnes grading 86 gpt silver and 2.18 gpt gold in Q4, 2017. Silver production decreased due to the combination of slightly lower silver grades and lower throughput partly offset by slightly higher recoveries, while gold production decreased 28% due to the lower throughput and lower gold grades partly offset by slightly higher recoveries. Gold grades were planned to be lower in 2018 compared to 2017 but gold grades were lower than plan as the lower grade resources along the margins of the LL-Asuncion and Plateros veins were mined to extend the mine life.
Year ended December 31, 2018 (compared to the year ended December 31, 2017)
Silver production at the Bolañitos mine was 975,555 oz in 2018, an increase of 4% compared to 934,238 oz in 2017, and gold production was 21,127 oz in 2018, a decrease of 21% compared to 26,910 oz in 2017. Plant throughput in 2018 was 439,005 tonnes at average grades of 86 gpt silver and 1.79 gpt gold, compared to 446,924 tonnes grading 80 gpt silver and 2.24 gpt gold in 2017. Silver production increased due to higher silver grades partly offset by lower throughput and recoveries, while gold production decreased 21% due to the lower throughput and gold grades. Gold grades were planned to be lower in 2018 compared to 2017.
Bolañitos Operating Costs
Three months ended December 31, 2018 (compared to the three months ended December 31, 2017)
Direct production costs per tonne in Q4, 2018 decreased 1% to $66.43 per tonne due to normal variations in productivity, supplies and labour. Lower gold grades resulted in higher cash costs per ounce, net of by-product credits (which is a non-IFRS measure and a standard of the Silver Institute), of $2.59 per oz of payable silver in Q4, 2018 compared to negative $2.73 per oz in Q4, 2017. Similarly, all-in sustaining costs (also a non-IFRS measure) increased in Q4, 2018 to $5.12 per oz compared to $1.01 per oz in Q4, 2017 primarily attributed to the lower gold credit and lower capital and exploration expenditures.
Year ended December 31, 2018 (compared to the year ended December 31, 2017)
Direct production costs per tonne in 2018 decreased 5% to $64.20 per tonne due to normal variations in productivity, supplies and labour. The lower cost per tonne was offset by lower gold grades resulting in higher cash costs per ounce, net of by-product credits (which is a non-IFRS measure and a standard of the Silver Institute), of $2.14 oz of payable silver in 2018 compared to negative $4.00 per oz in 2017. Similarly, all-in sustaining costs (a non-IFRS measure) increased in 2018 to $9.00 per oz compared to $1.62 per oz in the same period of 2017 primarily attributed to the lower gold credit and higher capital expenditures. The Company is investing into the LL-Asuncsion and Plateros ore bodies to extend the life of the operations.
| ENDEAVOUR SILVER CORP. | MANAGEMENT’S DISCUSSION & ANALYSIS | PAGE11 |
| | |
El Cubo Operations
The El Cubo operation includes two operating underground silver-gold mines and a flotation plant. El Cubo currently employs over 500 people and engages 252 contractors.
Production Results for the Three Months and Years Ended December 31, 2018 and 2017
| Three M onths Ended December 31 | EL CUBO | Year Ended December 31 |
| 20 18 | 20 17 | % Change | | 20 18 | 20 17 | % Change |
| 127,740 | 141,871 | (10%) | Ore tonnes processed | 520,784 | 511,836 | 2% |
| 181 | 157 | 15% | Average silver grade (g/ t) | 176 | 136 | 29% |
| 89.7 | 85.5 | 5% | Silver recovery (%) | 87.6 | 85.8 | 2% |
| 666,982 | 612,133 | 9% | Total silver ounces produced | 2,582,740 | 1,919,102 | 35% |
| 647,359 | 587,648 | 10% | Payable silver ounces produced | 2,508,850 | 1,842,338 | 36% |
| 1.93 | 1.61 | 20% | Average gold grade (g/ t) | 1.87 | 1.55 | 21% |
| 84.7 | 83.4 | 1% | Gold recovery (%) | 85.0 | 83.7 | 2% |
| 6,711 | 6,128 | 10% | Total gold ounces produced | 26,616 | 21,357 | 25% |
| 6,546 | 5,975 | 10% | Payable gold ounces produced | 25,987 | 20,823 | 25% |
| 1,170,307 | 1,071,733 | 9% | Silver equivalent ounces produced(1) | 4,578,940 | 3,520,877 | 30% |
| 3.97 | 8.78 | (55%) | Cash costs per silver ounce(2)(3) | 2.87 | 7.93 | (64%) |
| 8.89 | 9.38 | (5%) | Total production costs per ounce(2)(4) | 8.68 | 8.69 | (0%) |
| 7.48 | 13.56 | (45%) | All in sustaining cost per ounce(2)(5) | 8.86 | 17.80 | (50%) |
| 85.77 | 90.69 | (5%) | Direct production costs per tonne(2)(6) | 77.00 | 80.90 | (5%) |
| 8.84 | 11.90 | (26%) | Silver co-product cash costs(7) | 8.46 | 11.79 | (28%) |
| 754 | 910 | (17%) | Gold co-product cash costs(7) | 685 | 879 | (22%) |
| (1) | Silver equivalents are calculated using a 75:1 ratio. Silver equivalents have been restated from 70:1 to 75:1 for comparative purposes. |
| (2) | The Company reports non-IFRS measures which include cash costs net of by-products on a payable silver basis, total production costs per ounce, all-in sustaining costs per ounce and direct production costs per tonne, in order to manage and evaluate operating performance at each of the Company’s mines. These measures, some established by the Silver Institute (Production Cost Standards, June 2011), are widely used in the silver mining industry as a benchmark for performance, but do not have a standardized meaning. These measures are reported on a production basis. See Reconciliation to IFRS on page 20. |
| (3) | Cash costs net of by-products per payable silver ounce include mining, processing (including smelting, refining, transportation and selling costs), and direct overhead, net of gold credits. See Reconciliation to IFRS on pages 22 & 23. |
| (4) | Total production costs per ounce include mining, processing (including smelting, refining, transportation and selling costs), direct overhead, amortization, depletion and amortization at the operation sites. See Reconciliation to IFRS on page 22 & 23. |
| (5) | All-in sustaining cost per ounce include mining, processing (including smelting, refining, transportation and selling costs), direct overhead, corporate general and administration, on-site exploration, share-based compensation, reclamation and sustaining capital net of gold credits. See Reconciliation to IFRS on page 24. |
| (6) | Direct production costs per tonne include mining, processing (including smelting, refining, transportation and selling costs) and direct overhead at the operation sites. See Reconciliation to IFRS on pages 22 & 23. |
| (7) | Silver co-product cash cost and gold co-product cash cost include mining, processing (including smelting, refining, transportation and selling costs), and direct overhead allocated on pro-rated basis of realized metal value. See Reconciliation to IFRS on pages 25 & 26. |
El Cubo Production Results
Management guided 2018 production at El Cubo to range from 2.5 to 2.7 million oz silver and 22,500 to 24,500 oz gold. In 2018, El Cubo had a good year, with both throughput and grades coming in above the mine plan. Variations in the V-Asuncion orebody resulted in higher gold grades, but also lower silver grades than planned. The higher throughput resulted in silver production meeting guidance and gold production exceeding guidance. However, exploration was not able to replace the depleted resources, so the Company plans to reduce the production rate in 2019 to approximately one-half its 1500 tonne per day capacity, which will result in higher operating costs compared to 2018, while continuing to explore for new resources to extend the mine life.
Three months ended December 31, 2018 (compared to the three months ended December 31, 2017)
Silver production at the El Cubo mine was 666,982 oz in Q4, 2018, an increase of 9% compared to 612,133 oz in Q4, 2017, and gold production was 6,711 oz in Q4, 2018, an increase of 10% compared to 6,128 oz in Q4, 2017. Plant throughput in Q4, 2018 was 127,740 tonnes at average grades of 181 gpt silver and 1.93 gpt gold, compared to 141,871 tonnes grading 157 gpt silver and 1.61 gpt gold in Q4, 2017. The higher metal production is a result of higher grades and recoveries, partly offset by lower throughput.
| ENDEAVOUR SILVER CORP. | MANAGEMENT’S DISCUSSION & ANALYSIS | PAGE12 |
| | |
Year ended December 31, 2018 (compared to the year ended December 31, 2017)
Silver production at the El Cubo mine was 2,582,740 oz in 2018, an increase of 35% compared to 1,919,102 oz in 2017, and gold production was 26,616 oz in 2018, an increase of 25% compared to 21,357 oz in 2017. Plant throughput in 2018 was 520,784 tonnes at average grades of 176 gpt silver and 1.87 gpt gold, compared to 511,836 tonnes grading 136 gpt silver and 1.55 gpt gold in 2017. The higher metal production is primarily a result of significantly improved ore grades being mined from the center of the Villalpando-Asuncion orebody and slightly higher throughput and recoveries.
El Cubo Operating Costs
Three months ended December 31, 2018 (compared to the three months ended December 31, 2017)
Direct production costs fell to $85.77 per tonne in Q4, 2018 a slight decrease from Q4, 2017 due to normal variations in supplies and labour. The substantial increase in metal grades resulted in 55% reduced cash costs per ounce, net of by-product credits (a non-IFRS measure and a standard of the Silver Institute), decreasing in Q4, 2018 to $3.97 per oz of payable silver compared to $8.78 per oz in Q4, 2017. Similarly, all-in sustaining costs decreased 45% at $7.48 per oz in Q4, 2018 compared to $13.56 per oz in Q4, 2017. The decrease in all-in sustaining costs was a result of the lower operating costs per unit and reduced capital expenditures on the development of the Villalpando ore body.
Year ended December 31, 2018 (compared to the year ended December 31, 2017)
Higher throughput was partially offset by higher contractor costs and labour costs resulting in a 5% decrease in direct production costs to $77.00 per tonne. The substantial increase in metal grades resulted in 64% reduced cash costs per ounce, net of by-product credits (a non-IFRS measure and a standard of the Silver Institute), decreasing in 2018 to $2.87 per oz of payable silver compared to $7.93 per oz over the same period in 2017. Similarly, all-in sustaining costs decreased 50% at $8.86 per oz in 2018 compared to $17.80 per oz over the same period in 2017. The decrease in all-in sustaining costs was a result of the lower operating costs per unit and reduced capital expenditures on the development of the Villalpando ore body.
Development Activities
El Compas Project
The El Compas project is a small but high grade, permitted gold-silver mine and a small leased flotation plant in the historic silver mining district of Zacatecas, with good exploration potential to expand resources and scale up production. There is also potential for the Company to acquire other properties in the area to consolidate resources and exploration targets in the district.
El Compas currently employs over 120 people and engages 141 contractors
A NI 43-101 Technical Report Preliminary Economic Assessment for the El Compas Project, Zacatecas State, Mexico (“El Compas PEA”) dated May 11, 2017 was filed by the Company. Due to the positive economics, low initial capital requirements, and management’s experience in having successfully developed similar mines in Mexico, a decision was made to proceed with development in Q3, 2017. The Company initiated the installation of project infrastructure, collaring the mine access ramp and refurbishing the plant. As previously announced, the development of the main access ramp proceeded using a form of low impact gunpowder and in March 2018 El Compas received its explosives permit, which allowed the mine to accelerate the development of the main access ramp. As of December 31, 2018, a total of 2.6 kilometres has been developed underground.
Since publishing the El Compas PEA, the Company continued to optimize mining methods, the crushing circuit and grinding alternatives and has been successful on a number of fronts in improving the operating metrics. The work index of the ore and the size on the motor allows the capacity of the milling circuit to increase to 325 tpd, which allows for the mining method to be changed to mechanized cut and fill from captive cut and fill. Mechanized cut and fill increases the mining rate but has the same cost profile as captive cut and fill previously disclosed in the El Compas PEA.
Additionally, the modified plant flow sheet will allow the Company to increase the ore grind size and produce a single concentrate, while still achieving recoveries similar to those outlined in the El Compas PEA, lowering overall power costs and improving the long-term stability of the tailings facility.
| ENDEAVOUR SILVER CORP. | MANAGEMENT’S DISCUSSION & ANALYSIS | PAGE13 |
| | |
As a result of the modified mine plan and plant design and the delay in receiving the explosives permit, the total start up CAPEX was revised upwards to $11.3 million compared to the previous $10.0 million cost estimated in the El Compas PEA. However, the operational benefits of the modified plant design and increased mining rate should improve the overall economics of the project. As of December 31, 2018, the Company had incurred $15.5 million in capital expenditures to date. The additional costs included $2.2 million in additional mine development, an additional $1.3 million on the plant refurbishment and tailings dam and $0.7 million on site infrastructure. The delay in commercial production increased pre-production costs capitalized to the projects.
Mining and stockpiling of ore and commissioning of the El Compas plant was initiated in Q2, 2018 using low grade ore. In the middle of August 2018, based on an independent engineering review, commissioning of the plant was temporarily halted to allow the tailings area to be dewatered and excess clay removed for improved drainage. A second fine tailings area was excavated in September 2018 to improve overall settling of the fine tailings and allow the coarse tailings storage area to form a solid beach. The plant commissioning re-commenced in mid-October 2018, however in late December, the ball mill pinion failed which brought plant operations to a halt. From mid-October to mid -December the plant processed 11,300 tonnes grading 4.59 g/t gold and 69 g/t silver, producing 1,096 gold ounces and 13,382 silver ounces during the commissioning process.
Management re-commenced plant operations after a new pinion was installed in February 2019 and expected to attain commercial production in Q1, 2019. During these delays, the mine continued to operate and stockpiled over 13,500 ore tonnes.
Terronera Project
The Terronera project features a newly discovered high grade silver-gold mineralized zone in the Terronera vein, which is now over 1,400 metres long, 400 metres deep, 3 to 16 metres thick, and still open along strike to the southeast and down dip. In April 2017, the Company updated its NI 43-101 Mineral Resource and Reserve Estimates and completed an initial Pre-Feasibility Study (“2017 PFS”) for the Terronera mine project located 40 kilometres northeast of Puerto Vallarta in the state of Jalisco, Mexico.
In August 2018, the Company completed an updated Pre-Feasibility Study (“2018 PFS”) for its Terronera mine project, including an updated Mineral Resource and Reserve Estimate. The updated Terronera Mineral Resource and Reserve Estimates that formed the basis for the updated 2018 PFS reflect significantly higher tonnes, grades and contained silver, gold and silver equivalent ounces in each category due to positive exploration drill results in 2017 and the inclusion of the high grade La Luz vein, compared to the previous estimates that were the basis for the 2017 PFS. As a result, the 2018 PFS shows significantly higher revenues, EBITDA, free cash flow, mine life and NPV with significantly lower cash costs and all-in sustaining costs per silver oz. The 2018 PFS projects higher annual gold production and slightly lower annual silver production for the same annual silver equivalent production, generating a higher internal rate of return at a moderately lower daily throughput, slightly higher capital investment and lower silver price compared to the 2017 PFS.
Initial capital expenditures are estimated to be $75.8 million, comprised of $44.3 million for plant and site infrastructure, $13.7 million for mine development, mine infrastructure and equipment, $9.7 million for owner’s costs, construction camp, engineering, procurement and construction management (“EPCM”), and $8.1 million for contingencies.
The capital for the Phase 2 expansion from 750 tpd to 1,500 tpd is estimated to be $39.2 million. The expansion consists of $14.9 million to provide sufficient power from the state power grid, $12.0 million for underground mine development, $6.1 million for plant expansion, $2.0 million for owner’s costs, construction camp, and EPCM and $4.2 million in contingencies. An estimated $25.8 million will be required for sustaining capital after commissioning the mine, primarily for mine development and tailings expansion. The total Life of Mine (“LOM”) capital requirements are estimated to be $140.7 million.
| ENDEAVOUR SILVER CORP. | MANAGEMENT’S DISCUSSION & ANALYSIS | PAGE14 |
| | |
LOM average operating costs are estimated to be $46 per tonne for mining, $20 per tonne for processing, $8 per tonne for general and administration, and $4 in royalties for a total cost of $78 per tonne. Using Base Case metal prices of $17 per oz silver and $1,275 per oz gold (compared to $18 silver and $1260 gold in 2017), total cash costs are estimated to be $0.15 per Ag oz net of the gold by-product credit, and all-in-sustaining costs at site are estimated to be $1.36 per Ag oz over the life of the mine.
The mine is expected to generate LOM revenue of $815.8 million, EBITDA of $447.7 million and total free cash flow of $193.2 million. Using a discount rate of 5%, the expected discounted net present value (NPV) is $117.8 million, the expected after tax internal rate of return (IRR) is 23.5% and payback of capital is 5.4 years.
Management is currently awaiting a number of catalysts to advance the Terronera to mine development. Engineering trade-off studies and economic modeling are being continued. All required documents have been filed with Mexican government agencies for the final environmental permits (tailings facilities), receipt of which is anticipated in the coming months.
Subject to receiving the remaining government permit, finalizing appropriate financing, and completing certain additional optimization work on the 2018 PFS, management intends to seek approval from the Company’s board of directors to commence development of the Terronera mine and related facilities.
There are a number of recommended activities in the 2018 PFS that Endeavour plans to pursue in order to further optimize the project and improve the economics, including:
- Continue exploration drilling on the Terronera vein and other nearby veins to expand resources and extend mine life
- Revising the mine plan to incorporate new Mineral Reserves
- Continue investigating crushing alternatives to provide the lowest cost energy requirement
- Optimizing the grinding circuits to produce an increased particle size
- Continue evaluating power alternatives to reduce capital costs
- Expand the tailings storage facility to incorporate a longer mine life
Management continues to advance the recommended activities including incorporating the 2018 drill results into the mineral reserves and resources and mine plan. The 2018 drilling resulted in upgrading 850,000 tonnes of inferred resources to reserves that will extend the mine life and should improve the overall economics of the project.
Exploration Results
In 2018, the Company planned to drill 64,000 metres and spend $14.1 million on brownfields and greenfields exploration, development engineering, and land payments across its portfolio of properties. At the three existing mines, 17,000 metres of core drilling were planned at a cost of $2.8 million. At the exploration and development projects, expenditures of $8.3 million were planned to drill 47,300 metres, to advance engineering studies and meet property holding obligations. In 2018, the Company incurred $11.8 million to drill 55,319 metres across its portfolio, publish the 2018 Terronera PFS and advance Terronera to a development decision.
In 2018 at the operating mines, 5,854 metres were drilled at the El Cubo operation testing the north part of the Cubo district and an extension of the Villalpando vein, 11,272 metres were drilled at the Bolañitos operations testing the depth of the La Luz and Plateros veins to extend the known mineralization and discovering the San Miguel vein and 5,691 metres were drilled at the Guanaceví operation to test extensions of the Santa Cruz ore body.
At Terronera, $4.7 million was initially budgeted to complete an updated PFS and a 25,400 metre drill program. $1.7 million was spent on the completion of the PFS and continued advancement of the project to a development decision. See Development Activities – Terronera project on Page 14 for detailed discussion).
The 2018 drilling focused on extending mineralization in the Terronera vein to the southeast of the current resource, plus testing other known mineralized veins. The Company incurred $3.4 million primarily drilling 19,654 metres of in-fill holes to upgrade approximately 850,000 tonnes of inferred resources to indicated resources and to expand the inferred resources at depth. The 2018 drilling continued to intersect high grade mineralization and has resulted in the deepest mineralized hole drilled to date, intersecting 618 gpt silver and 3.2 gpt gold over 21.2 metres true width in hole TR11-4 at 430 metres vertical depth, and remains open at depth. The Terronera mine plan will be modified to accommodate the newly defined resources, extending the mine life and should improve the overall economics of the project. Additionally, the exploration team discovered multiple new mineralized veins south of the Terronera veins, staking an additional 2,200 hectares along the southern property boundary to cover possible extension of the Real Alto vein system.
| ENDEAVOUR SILVER CORP. | MANAGEMENT’S DISCUSSION & ANALYSIS | PAGE15 |
| | |
At El Compas, 6,600 drill metres were planned for $1.0 million primarily on the Calicanto concessions. The 2018 drilling was to further test the new zones of high grade mineralization within the Misie-Karla-Karla HW and Calicanto veins discovered in 2017. As of December 31, 2018, $0.7 million has been spent drilling 4,700 metres testing extensions of the Compas ore body and targeting the Calicanto veins. Drill results were positive as the holes continued to intersect high grade silver-gold mineralization along strike and down dip. Drill results should have a positive impact on the Company’s resources for the Calicanto property, part of the El Compas mine. The high silver and gold grades, good continuity of mineralization and significant exploration upside to expand the resources reinforce our view that El Compas is a scalable asset. Positive drill results incurred by a partner on the Calicanto property and the adjacent property will be further in tested in 2019.
At Parral, $2.2 million was budgeted for drilling 12,000 metres to extend historic and new resource areas. As of December 31, 2018, the Company drilled 8,171 metres for $1.7 million resulting in continued intersection of mineralized veins. Since acquisition three mineralized areas have been intersected, of which the largest and central zone now measures 600 metres long by 250 metres vertical (starting 150 m deep) by 1-3 metres true thickness, still open to the south and at depth. Additionally, metallurgical testing of drill core samples from the Veta Colorada (Sierra Plata, El Verde and Remedios-Argentina zones), Palmilla and Cometa veins on the Parral property indicates excellent metal recoveries by flotation and leaching. Cometa is the only vein with significant lead and zinc best suited for floatation, the other veins contain primarily silver and minor gold best suited to leaching. A preliminary economic assessment was initiated and is expected to be completed in Q2 2019.
In Chile, the Company budgeted for a 3,000 metre drill program on one property to explore for bulk tonnage silver-lead-zinc manto mineralization. The Company deferred the drill program to 2019, but incurred $0.8 million in prospecting, legal and administrative fees.
The Company has entered into separate agreements to acquire three separate exploration projects in northern Chile (Aida, Paloma and Cerro Marquez), each of which has excellent potential for large, new discoveries. The projects cover major alteration systems that can be seen on satellite imagery, yet each project has had no significant previous exploration data due to a historic lack of access. The Company developed road access to the Aida and Cerro Marquez projects and completed several phases of early stage exploration work to identify high priority targets for drilling. The Paloma project returned encouraging early stage rock sample results to also establish high priority targets from exploration work for drilling in 2019.
For the Aida project, the Company can purchase 100% interest in three historic concessions, subject to a 2% NSR, for $3.2 million payable over five years with the final payment due in 2023. The 2% NSR can be purchased at any time for $2.0 million per concession
For the Paloma project, the Company can acquire up to a 70% interest from Compania Minera del Pacifico, S.A. (CMP), a large Chilean iron ore mining company. The Company can acquire its initial 51% interest by paying $0.75 million and spending $5.0 million on exploration over five years with the final option payment due in 2023, followed by a second option to acquire 70% by completing a preliminary economic assessment and a prefeasibility study by 2025.
For the Cerro Marquez project, the Company entered an agreement to purchase a 100% interest in seven concessions that covers 7,800 hectares, subject to a 2% NSR. The Company can acquire the concessions by spending $1.53 million on exploration and paying $2.5 million over four years with the final payment due in 2020. Each 1% NSR can be purchased for $1.25 million. The Company has staked 20 concessions surrounding the seven historic concessions.
Reserves and Resources
Proven and Probable silver and gold Mineral Reserves increased year on year by 38% and 35% respectively to 46.3 million oz silver and 426,700 oz gold. On a silver equivalent basis, Mineral Reserves now total 80.4 million oz (at a silver to gold ratio of 80:1). The increased Mineral Reserves are mainly due to in-fill drilling and a robust economic assessment at Terronera, which expanded the Indicated Mineral Resources and converted them to Probable Mineral Reserves, and development of the Milache orebody at Guanaceví, where Indicated Mineral Resources were converted to Probable Mineral Reserves. Excluding the Terronera Mineral Reserves, silver and gold Mineral Reserves at the operating mines increased by 46% and decreased by 2% respectively, notwithstanding significantly reduced Mineral Reserves at El Cubo.
Measured and Indicated silver and gold Mineral Resources declined by 25% and 20% respectively to 27.3 million oz silver and 290,400 oz gold. The decrease in Measured and Indicated Mineral Resources was mainly the result of conversion to Mineral Reserves at the existing operations. Total Inferred silver Mineral Resources increased by 9% due to the success of the 2018 drilling at Parral, where Inferred Mineral Resource Estimates for silver and gold increased 55% and 49% respectively.
| ENDEAVOUR SILVER CORP. | MANAGEMENT’S DISCUSSION & ANALYSIS | PAGE16 |
| | |
2018 Mineral Reserve and Resource Estimate Highlights (Compared to December 31, 2017)
- Silver Proven and Probable Mineral Reserves increased 40% to 47.0 million ounces (oz)
- Gold Proven and Probable Mineral Reserves increased 51% to 477,000 oz
- Silver equivalent Proven and Probable Mineral Reserves of 85.1 million oz (80:1 silver:gold ratio)
- Silver Measured and Indicated Mineral Resources decreased 25% to 27.3 million oz
- Gold Measured and Indicated Mineral Resources decreased 20% to 290,400 oz
- Silver equivalent Measured and Indicated Mineral Resources of 50.5 million oz (80:1 silver:gold ratio)
- Silver Inferred Mineral Resources increased 10% to 58.3 million oz
- Gold Inferred Mineral Resources increased 8% to 324,400 oz
- Silver equivalent Inferred Mineral Resources 84.2 million oz (80:1 silver:gold ratio)
Mineral Reserve and Resource estimates are based on pricing assumptions of $17.26 per ounce of silver and $1,232 per ounce of gold at Guanaceví, Bolañitos and El Cubo, $18.00 per ounce of silver and $1,250 per ounce of gold at Terronera and $18.00 per ounce of silver and $1,225 per ounce of gold at El Compas.
Note to U.S Investors: Mineral reserve and resources are as defined by Canadian securities laws. See “Cautionary Note to U.S. Investors concerning Estimates of Mineral Reserves and Measured, Indicated and Inferred Mineral Resources”.
Consolidated Financial Results
Three months ended December 31, 2018 (compared to the three months ended December 31, 2017)
In Q4, 2018, the Company’s mine operating earnings was $0.4 million (Q4, 2017: $7.9 million) on sales of $33.8 million (Q4, 2017: $41.6 million) with cost of sales of $33.4 million (Q4, 2017: $33.7 million).
In Q4, 2018, the Company had an operating loss of $3.4 million (Q4, 2017: operating earnings of $3.6 million) after exploration costs of $2.0 million (Q4, 2017: $2.4 million) and general and administrative costs of $1.8 million (Q4, 2017: $1.9 million).
The loss before taxes in Q4, 2018 was $4.7 million (Q4, 2017: earnings before taxes $1.9 million) after finance costs of $0.1 million (Q4, 2017: $0.1 million), a foreign exchange loss of $1.1 million (Q4, 2017: $2.0 million), and investment and other income of $0.6 million (Q4, 2017: $0.4 million), a write off of IVA receivable of $0.2 million (Q4, 2017: Nil) and a write down to net realizable value of inventory held at El Compas of $0.6 million (Q4, 2017: Nil). The Company realized a net loss for the period of $3.6 million (Q4, 2017: net earnings of $2.7 million) after an income tax recovery of $1.1 million (Q3, 2017: $0.8 million).
Sales of $33.8 million in Q4, 2018 represented a 19% decrease over the $41.6 million for the same period in 2017. There was a 9% decrease in silver ounces sold and a 12% decrease in the realized silver price resulting in a 20% decrease in silver sales. There was a 16% decrease in gold ounces sold and a 1% decrease in realized gold prices resulting in an 18% decrease in gold sales. During the period, the Company sold 1,264,340 oz silver and 11,819 oz gold, for realized prices of $14.88 and $1,270 per oz respectively, compared to sales of 1,392,518 oz silver and 14,117 oz gold, for realized prices of $16.84 and $1,288 per oz, respectively, in the same period of 2017. The realized price of silver and gold were within 4% of average silver and gold spot prices during the period of $14.54 and $1,228, with the differences due to the timing of sales and the mark-to-market adjustments for the concentrate sales that are pending finalization.
The Company increased its finished goods silver and gold inventory to 199,897 oz and 1,956 oz, respectively at December 31, 2018 compared to 102,775 oz silver and 733 oz gold at September 30, 2018. The cost allocated to these finished goods was $4.4 million at December 31, 2018 compared to $2.0 million at September 30, 2018. At December 31, 2018, the finished goods inventory fair market value was $5.6 million compared to the fair value of $2.3 million at September 30, 2018.
Cost of sales for Q4, 2018 was $33.4 million, an increase of 1% over the cost of sales of $33.7 million for the same period of 2017. The 1% increase in cost of sales was primarily due to increased depletion at the Guanaceví and El Cubo mines.
| ENDEAVOUR SILVER CORP. | MANAGEMENT’S DISCUSSION & ANALYSIS | PAGE17 |
| | |
Exploration expenses decreased in Q4, 2018 to $2.0 million from $2.4 million in the same period of 2017 primarily due to planned timing of drilling activities for 2018. General and administrative expenses decreased by 5% to $1.8 million in Q4, 2018 compared to $1.9 million in the same period of 2017 due to a weaker Canadian dollar during Q4, 2018 compared to Q4, 2017 and due to decreased costs for director’s deferred share units, which are marked to market at each period end. In Q4, 2018 there was a related recovery of $0.1 million due to a decrease in the company’s share price during Q4 2018 compared to an expense of $29 thousand due to a moderate increase in the Company’s share price during Q4 2017.
The Company experienced a foreign exchange loss of $1.1 million in Q4, 2018 compared to a loss of $2.0 million in Q4, 2017. The $1.1 million loss was primarily due to the weakening of the Mexican peso against the U.S. Dollar from September 30, 2018 to December 31, 2018, which resulted in lower valuations on the peso denominated cash and receivable amounts.
There was an income tax recovery of $1.1 million in Q4, 2018 compared to a recovery of $0.8 million in Q4, 2017. The $1.1 million tax recovery is comprised of $1.5 million in current income tax expense (Q4, 2017: $3.0 million) and $2.6 million in deferred income tax recovery (Q4, 2017: deferred income tax recovery $3.8 million). The deferred income tax recovery of $2.6 million is a result of the amortization of temporary tax differences related to Guanaceví’s mine development, the recognition of deferred tax assets related to the El Compas mine and the depreciation of the Mexican peso and its monetary impact on loss carryforwards related to the Guanaceví mine.
Year ended December 31, 2018 (compared to the year ended December 31, 2017)
For the year ended December 31, 2018, the Company’s mine operating earnings were $3.5 million (2017: $28.5 million) on sales of $150.5 million (2017: $150.5 million) with cost of sales of $147.0 million (2017: $122.0 million).
The Company had an operating loss of $17.5 million (2017: operating earnings of $7.7 million) after exploration costs of $12.4 million (2017: $12.9 million) and general and administrative costs of $8.6 million (2017: $7.9 million).
The loss before taxes was $17.7 million (2017: earnings before tax $7.9 million) after finance costs of $0.2 million (2017: $0.7 million), a foreign exchange loss of $0.1 million (2017: foreign exchange gain of $0.4 million), investment and other income of $0.9 million (2017: $0.5 million) a write off of IVA receivable of $0.2 million (Q4, 2017: Nil) and a write down to net realizable value of inventory held at El Compas of $0.6 million (Q4, 2017: Nil).. The Company realized a net loss for the period of $12.4 million (2017: net earnings $9.7 million) after an income tax recovery of $5.3 million (2017: $1.8 million).
Sales of $150.5 million for 2018 were flat compared to $150.5 million in 2017. There was a 12% increase in silver ounces sold, offset by a 9% decrease in the realized silver price resulting in a 1% increase in silver sales. Gold ounces sold were relatively flat compared with 2017 with a 1% decrease in realized gold prices resulting in a 2% decrease in gold sales. During the period, the Company sold 5,461,197 oz silver and 51,318 oz gold, for realized prices of $15.65 and $1,267 per oz respectively, compared to sales of 4,892,855 oz silver and 51,460 oz gold, for realized prices of $17.24 and $1,285 per oz, respectively, in 2017. The realized price of silver and gold were within 1% of average silver and gold spot prices during the period of $15.71 and $1,269, with the differences due to the timing of sales and the mark-to-market adjustments for the concentrate sales that are pending finalization.
The Company decreased its finished goods silver inventory to 199,897 oz and decreased its finished goods gold inventory to 1,956 oz, respectively at December 31, 2018 compared to 241,321 oz silver and 1,226 oz gold at December 31, 2017. The cost allocated to these finished goods was $4.4 million at December 31, 2018 compared to $4.8 million at December 31, 2017. At December 31, 2018, the finished goods inventory fair market value was $5.6 million compared to the fair value of $5.7 million at December 31, 2017.
Cost of sales for 2018 was $147.0 million, an increase of 20% over the cost of sales of $122.0 million for 2017. The 20% increase in cost of sales was primarily due to increased depletion at the Guanaceví and El Cubo mines.
Exploration expenses decreased to $12.4 million from $12.9 million in 2017 due to a slight reduction of planned drilling activities for 2018. General and administrative expenses increased by 9% to $8.6 million compared to $7.9 million in 2017 primarily due to increased costs for director’s deferred share units, which are marked to market at each period end. During 2018 there was a related expense of $0.1 million due to an increase in the company’s share price during the period compared to a recovery of $0.5 million due to a decrease in the Company’s share price during 2017.
The Company experienced a foreign exchange loss of $0.1 million compared to a gain of $0.4 million in 2017. The $0.1 million loss was primarily due to the weakening of the Mexican peso against the U.S. Dollar from December 31, 2017 to December 31, 2018, which resulted in lower valuations on the peso denominated cash and receivable amounts.
| ENDEAVOUR SILVER CORP. | MANAGEMENT’S DISCUSSION & ANALYSIS | PAGE18 |
| | |
There was an income tax recovery of $5.3 million compared to a recovery of $1.8 million in 2017. The $5.3 million tax recovery is comprised of $4.4 million in current income tax expense (2017: $4.7 million) and $9.7 million in deferred income tax recovery (2017: $6.5 million). The deferred income tax recovery of $9.7 million is a result of the amortization of temporary tax differences related to Guanaceví’s mine development, the recognition of deferred tax assets related to the El Compas mine and the depreciation of the Mexican peso and its monetary impact on loss carryforwards related to the Guanaceví mine.
The recoverable amounts of the Company’s CGUs, which include mining properties, plant and equipment are determined at the end of each reporting period, if impairment indicators are identified. In previous years, commodity price declines led the Company to determine there were impairment indicators and assessed the recoverable amounts of its CGUs. The recoverable amounts were based on each CGUs future cash flows expected to be derived from the Company’s mining properties and represent each CGU’s value in use. The cash flows were determined based on the life-of-mine after-tax cash flow forecast which incorporates management’s best estimates of future metal prices, production based on current estimates of recoverable reserves and resources, exploration potential, future operating costs and non-expansionary capital expenditures discounted at risk adjusted rates based on the CGUs weighted average cost of capital.
In previous years, the carrying values of the Guanaceví, El Cubo and Bolañitos CGUs, including associated deferred income tax estimates, were greater than their estimated recoverable amounts calculated on a discount cash flow basis and impairments charges were recorded.
For the previously impaired CGU’s any modest decrease in any one key assumption in isolation could cause the estimated recoverable amount to be less than or equal to the net carrying value. Other than timing of production based on the revised mine plans and associated changes in per-unit costs, Management’s long-term estimates have not significantly changed from the previous years.
As at December 31, 2018, the Company tested the recoverability of the Guanaceví CGU due to 2018 operational challenges and determined that no additional impairment was required.
Selected Annual Information
| Expressed in thousands US dollars | Year ended December 31 |
| except per share amounts | 2018 | 2017 | 2016 |
| Revenue | $150,509 | $150,499 | $156,767 |
| Net earnings (loss) | (12,439) | 9,684 | 3,910 |
| Basic earnings (loss) per share | (0.10) | 0.08 | 0.03 |
| Diluted earnings (loss) per share | (0.10) | 0.08 | 0.03 |
| Dividends per share | - | - | - |
| Total assets | 177,047 | 178,580 | 180,510 |
| Total long-term liabilities | 8,747 | 9,810 | 15,691 |
| ENDEAVOUR SILVER CORP. | MANAGEMENT’S DISCUSSION & ANALYSIS | PAGE19 |
| | |
Non-IFRS Measures
Mine operating cash flow is a non-IFRS measure that does not have a standardized meaning prescribed by IFRS and therefore may not be comparable to similar measures presented by other issuers. Mine operating cash flow is calculated as revenue minus direct production costs and royalties. Mine operating cash flow is used by management to assess the performance of the mine operations, excluding corporate and exploration activities and is provided to investors as a measure of the Company’s operating performance.
| Expressed in thousands US dollars | Three Months Ended December 31 | Year Ended December 31 |
| | 2018 | 2017 | 2018 | 2017 |
| Mine operating earnings | $397 | $7,887 | $3,508 | $28,479 |
| Share-based compensation | - | 47 | (93) | 202 |
| Amortization and depletion | 6,110 | 4,804 | 38,412 | 16,582 |
| Write down of inventory to net realizable value | 2,026 | - | 2,026 | 166 |
| Mine operating cash flow before taxes | $8,533 | $12,738 | $43,853 | $45,429 |
Operating cash flow before working capital adjustment is a non-IFRS measure that does not have a standardized meaning prescribed by IFRS and therefore may not be comparable to similar measures presented by other issuers. Operating cash flow before working capital adjustments is calculated as operating cash flow minus working capital adjustments. Operating cash flow before working capital adjustments is used by management to assess operating performance irrespective of working capital changes and is provided to investors as a measure of the Company’s operating performance.
| Expressed in thousands US dollars | Three Months Ended December 31 | Year Ended December 31 |
| | 20 18 | 20 17 | 20 18 | 20 17 |
| Cash from operating activities | $9,964 | $5,601 | $26,648 | $15,590 |
| Net changes in non-cash working capital | 9,907 | 964 | 4,492 | (7,993) |
| Operating cash flow before working capital adjustments | $57 | $4,637 | $22,156 | $23,583 |
Operating cash flow per share is a non-IFRS measure that does not have a standardized meaning prescribed by IFRS and therefore may not be comparable to similar measures presented by other issuers. Operating cash flow per share is calculated by dividing cash from operating activities by the weighted average shares outstanding. Operating cash flow per share is used by management to assess operating performance irrespective of working capital changes and is provided to investors as a measure of the Company’s operating performance.
| Expressed in thousands US dollars | Three Months Ended December 31 | Year Ended December 31 |
| except for share numbers and per share amounts | 20 18 | 20 17 | 20 18 | 20 17 |
| Operating cash flow before working capital adjustments | $57 | $4,637 | $22,156 | $23,583 |
| Basic weighted average shares outstanding | 130,511,679 | 127,486,671 | 128,600,421 | 127,340,834 |
| Operating cash flow before working capital changes per share | $0.00 | $0.04 | $0.17 | $0.19 |
| ENDEAVOUR SILVER CORP. | MANAGEMENT’S DISCUSSION & ANALYSIS | PAGE20 |
| | |
EBITDA is a non-IFRS financial measure, which excludes the following from net earnings:
- Income tax expense;
- Finance costs;
- Amortization and depletion
Adjusted EBITDA excludes the following additional items from EBITDA
- Share based compensation;
- Non-recurring write offs
Management believes EBITDA is a valuable indicator of the Company’s ability to generate liquidity by producing operating cash flow to fund working capital needs, service debt obligations, and fund capital expenditures. Management uses EBITDA for this purpose. EBITDA is also frequently used by investors and analysts for valuation purposes whereby EBITDA is multiplied by a factor or “EBITDA multiple” based on an observed or inferred relationship between EBITDA and market values to determine the approximate total enterprise value of a Company.
EBITDA is intended to provide additional information to investors and analysts. It does not have any standardized definition under IFRS and should not be considered in isolation or as a substitute for measures of operating performance prepared in accordance with IFRS. EBITDA excludes the impact of cash costs of financing activities and taxes, and the effects of changes in operating working capital balances, and therefore is not necessarily indicative of operating profit or cash flow from operations as determined by IFRS. Other companies may calculate EBITDA and Adjusted EBITDA differently.
| Expressed in thousands US dollars | Three Months Ended December 31 | Year Ended December 31 |
| | 2018 | 2017 | 2018 | 2017 |
| Net earnings (loss) for the period | ($3,661) | $2,669 | ($12,439) | $9,684 |
| Depreciation and depletion – cost of sales | 6,110 | 4,804 | 38,412 | 16,582 |
| Depreciation and depletion – exploration | 35 | 24 | 111 | 126 |
| Depreciation and depletion – general & administration | 72 | 107 | 254 | 282 |
| Depreciation and depletion – write down of inventory to net realizable value | 668 | - | 668 | - |
| Finance costs | 51 | 105 | 211 | 715 |
| Current income tax expense | 1,533 | 2,924 | 4,477 | 4,650 |
| Deferred income tax expense (recovery) | (2,591) | (3,737) | (9,749) | (6,447) |
| Earnings before interest, taxes, depletion and amortization | $2,217 | $6,896 | $21,945 | $25,592 |
| Share based compensation | 532 | 620 | 2,426 | 2,861 |
| Adjusted earnings before interest, taxes depletion and amortization | $2,749 | $7,516 | $24,371 | $28,453 |
| ENDEAVOUR SILVER CORP. | MANAGEMENT’S DISCUSSION & ANALYSIS | PAGE21 |
| | |
Cash costs per ounce, total production costs per ounce and direct production costs per tonne are measures developed by precious metals companies in an effort to provide a comparable standard; however, there can be no assurance that the Company’s reporting of these non-IFRS measures are similar to those reported by other mining companies. Cash costs per ounce, production costs per ounce and direct production costs per tonne are measures used by the Company to manage and evaluate operating performance at each of the Company’s operating mining units. They are widely reported in the silver mining industry as a benchmark for performance, but do not have a standardized meaning and are disclosed in addition to IFRS measures. The following tables provide a detailed reconciliation of these measures to the Company’s cost of sales, as reported in its consolidated financial statements.
| Expressed in thousands US dollars | Three Months Ended December 31, 20 18 | Three Months Ended December 31, 20 17 |
| Guanaceví | Bolañitos | El Cubo | Total | Guanaceví | Bolañitos | El Cubo | Total |
| Direct production costs per financial statements | $8,721 | $5,526 | $10,697 | $24,944 | $7,805 | $7,707 | $12,887 | $28,399 |
| Royalties | 236 | 36 | 85 | 357 | 353 | 65 | 85 | 503 |
| Special mining duty(1) | - | 94 | 237 | 331 | - | 492 | - | 492 |
| Opening finished goods | (643) | (87) | (565) | (1,295) | (2,763) | (325) | (493) | (3,581) |
| Finished goods NRV adjustment | 1,358 | - | - | 1,358 | - | - | - | - |
| Closing finished goods | 1,247 | 1,457 | 502 | 3,206 | 2,942 | 385 | 387 | 3,714 |
| Direct production costs | 10,919 | 7,026 | 10,956 | 28,901 | 8,337 | 8,324 | 12,866 | 29,527 |
| By-product gold sales | (1,422) | (5,189) | (8,402) | (15,013) | (1,569) | (8,831) | (7,789) | (18,189) |
| Opening gold inventory fair market value | 154 | 96 | 620 | 870 | 598 | 453 | 359 | 1,410 |
| Closing gold inventory fair market value | (279) | (1,341) | (604) | (2,224) | (631) | (681) | (278) | (1,590) |
| Cash costs net of by-product | 9,372 | 592 | 2,570 | 12,534 | 6,735 | (735) | 5,158 | 11,158 |
| Amortization and depletion | 2,891 | (140) | 3,358 | 6,109 | 4,123 | 337 | 344 | 4,804 |
| Share-based compensation | - | - | - | - | 17 | 15 | 15 | 47 |
| Opening finished goods depletion | (354) | (3) | (361) | (718) | (1,141) | (22) | (13) | (1,176) |
| NRV cost adjustment | 668 | - | - | 668 | - | - | - | - |
| Closing finished goods depletion | 597 | 64 | 186 | 847 | 1,096 | 8 | 8 | 1,112 |
| Total production costs | $13,174 | $513 | $5,753 | $19,440 | $10,830 | ($397) | $5,512 | $15,945 |
| | Three Months Ended December 31, 2018 | Three Months Ended December 31, 2017 |
| | Guanaceví | Bolañitos | El Cubo | Total | Guanaceví | Bolañitos | El Cubo | Total |
| Throughput tonnes | 75,528 | 105,768 | 127,740 | 309,036 | 83,881 | 124,172 | 141,871 | 349,924 |
| Payable silver ounces | 483,713 | 228,184 | 647,359 | 1,359,256 | 543,573 | 269,484 | 587,648 | 1,400,705 |
| | | | | | | | | |
| Cash costs per ounce | $19.38 | $2.59 | $3.97 | $9.22 | $12.39 | ($2.73) | $8.78 | $7.97 |
| Total production costs per oz | $27.24 | $2.25 | $8.89 | $14.30 | $19.92 | ($1.47) | $9.38 | $11.38 |
| Direct production costs per tonne | $144.57 | $66.43 | $85.77 | $93.52 | $99.39 | $67.04 | $90.69 | $84.38 |
| ENDEAVOUR SILVER CORP. | MANAGEMENT’S DISCUSSION & ANALYSIS | PAGE22 |
| | |
| Expressed in thousands US dollars | Year Ended December 31, 2018 | Year Ended December 31, 2017 |
| Guanaceví | Bolañitos | El Cubo | Total | Guanaceví | Bolañitos | El Cubo | Total |
| Direct production costs per financial statements | $40,290 | $26,305 | $38,408 | $105,003 | $33,408 | $28,693 | $41,229 | $103,330 |
| Royalties | 1,123 | 190 | 340 | 1,653 | 1,239 | 228 | 273 | 1,740 |
| Special mining duty(1) | - | 615 | 1,235 | 1,850 | - | 943 | (99) | 844 |
| Opening finished goods | (2,942) | (385) | (387) | (3,714) | (3,948) | - | (385) | (4,333) |
| Finished goods NRV adjustment | 1,358 | - | - | 1,358 | 117 | - | - | 117 |
| Closing finished goods | 1,247 | 1,457 | 502 | 3,206 | 2,942 | 385 | 387 | 3,714 |
| Direct production costs | 41,076 | 28,182 | 40,098 | 109,356 | 33,758 | 30,249 | 41,405 | 105,412 |
| By-product gold sales | (6,962) | (25,495) | (32,572) | (65,029) | (6,210) | (33,154) | (26,775) | (66,139) |
| Opening gold inventory fair market value | 631 | 681 | 278 | 1,590 | 771 | - | 253 | 1,024 |
| Closing gold inventory fair market value | (279) | (1,341) | (604) | (2,224) | (631) | (681) | (278) | (1,590) |
| Cash costs net of by-product | 34,466 | 2,027 | 7,200 | 43,693 | 27,688 | (3,586) | 14,605 | 38,707 |
| Amortization and depletion | 23,117 | 861 | 14,434 | 38,412 | 13,365 | 1,894 | 1,323 | 16,582 |
| Share-based compensation | (31) | (31) | (31) | (93) | 68 | 67 | 67 | 202 |
| Opening finished goods depletion | (1,096) | (8) | (8) | (1,112) | (567) | - | (1) | (568) |
| NRV cost adjustment | 668 | - | - | 668 | 49 | - | - | 49 |
| Closing finished goods depletion | 597 | 64 | 186 | 847 | 1,096 | 8 | 8 | 1,112 |
| Total production costs | $57,721 | $2,913 | $21,781 | $82,415 | $41,699 | ($1,617) | $16,002 | $56,084 |
| | Year Ended December 31, 2018 | Year Ended December 31, 2017 |
| | Guanaceví | Bolañitos | El Cubo | Total | Guanaceví | Bolañitos | El Cubo | Total |
| Throughput tonnes | 307,042 | 439,005 | 520,784 | 1,266,831 | 321,113 | 446,924 | 511,836 | 1,279,873 |
| Payable silver ounces | 1,961,788 | 946,995 | 2,508,850 | 5,417,633 | 2,064,382 | 896,869 | 1,842,338 | 4,803,589 |
| | | | | | | | | |
| Cash costs per ounce | $17.57 | $2.14 | $2.87 | $8.06 | $13.41 | ($4.00) | $7.93 | $8.06 |
| Total production costs per oz | $29.42 | $3.08 | $8.68 | $15.21 | $20.20 | ($1.80) | $8.69 | $11.68 |
| Direct production costs per tonne | $133.78 | $64.20 | $77.00 | $86.32 | $105.13 | $67.68 | $80.90 | $82.36 |
| Expressed in thousands US dollars | Year Ended December 31, 2018 | Year Ended December 31, 2017 |
| Guanaceví | Bolañitos | El Cubo | Total | Guanaceví | Bolañitos | El Cubo | Total |
| Closing finished goods | 1,247 | 1,457 | 502 | 3,206 | 2,942 | 385 | 387 | 3,714 |
| Closing finished goods depletion | 597 | 64 | 186 | 847 | 1,096 | 8 | 8 | 1,112 |
| Finished goods inventory | $1,844 | $1,521 | $688 | $4,053 | $4,038 | $393 | $395 | $4,826 |
(1) Special mining duty is an EBITDA royalty tax presented as a current income tax in accordance with IFRS.
| ENDEAVOUR SILVER CORP. | MANAGEMENT’S DISCUSSION & ANALYSIS | PAGE23 |
| | |
All-in sustaining costs per ounce and all-in costs per ounce are measures developed by the World Gold Council (and used as a standard of the Silver Institute) in an effort to provide a comparable standard within the precious metal industry; however, there can be no assurance that the Company’s reporting of these non-IFRS measures are similar to those reported by other mining companies. These measures are used by the Company to manage and evaluate operating performance at each of the Company’s operating mining units and consolidated group, and are widely reported in the silver mining industry as a benchmark for performance, but do not have a standardized meaning and are disclosed in addition to IFRS measures. The following tables provide a detailed reconciliation of these measures to the Company’s cost of sales, as reported in the Company’s consolidated financial statements.
| Expressed in thousands US dollars | Three Months Ended December 31, 2018 | Three Months Ended December 31, 20 17 |
| | Guanaceví | Bolañitos | El Cubo | Total | Guanaceví | Bolañitos | El Cubo | Total |
| Cash costs net of by-product | $9,372 | $592 | $2,570 | $12,534 | $6,735 | ($735) | $5,158 | $11,158 |
| Operations stock based compensation | - | - | - | - | 17 | 15 | 15 | 47 |
| Corporate general and administrative | 307 | 332 | 632 | 1,271 | 299 | 441 | 558 | 1,298 |
| Corporate stock based compensation | 106 | 115 | 218 | 438 | 114 | 177 | 227 | 518 |
| Reclamation - amortization/ accretion | 10 | 8 | 18 | 36 | 7 | 4 | 11 | 22 |
| Mine site expensed exploration | (65) | 68 | 195 | 198 | (77) | - | 348 | 271 |
| Capital expenditures sustaining | 3,568 | 54 | 1,208 | 4,830 | 2,456 | 370 | 1,652 | 4,478 |
| All In Sustaining Costs | $13,298 | $1,168 | $4,841 | $19,307 | $9,551 | $272 | $7,969 | $17,792 |
| Growth exploration | | | | 1,638 | | | | 2,015 |
| Growth capital expenditures | | | | 2,811 | | | | 3,782 |
| All In Costs | | | | $23,756 | | | | $23,589 |
| | Three Months Ended December 31, 2018 | Three Months Ended December 31, 2017 |
| | Guanaceví | Bolañitos | El Cubo | Total | Guanaceví | Bolañitos | El Cubo | Total |
| Throughput tonnes | 75,528 | 105,768 | 127,740 | 309,036 | 83,881 | 124,172 | 141,871 | 349,924 |
| Payable silver ounces | 483,713 | 228,184 | 647,359 | 1,359,256 | 543,573 | 269,484 | 587,648 | 1,400,705 |
| Silver equivalent production (ounces) | 577,197 | 622,776 | 1,170,307 | 2,370,280 | 637,492 | 821,012 | 1,071,733 | 2,530,237 |
| | | | | | | | | |
| Sustaining cost per ounce | $27.49 | $5.12 | $7.48 | $14.20 | $17.57 | $1.01 | $13.56 | $12.70 |
| All In costs per ounce | | | | $17.48 | | | | $16.84 |
| Expressed in thousands US dollars | Year Ended December 31, 2018 | Year Ended December 31, 2017 |
| | Guanaceví | Bolañitos | El Cubo | Total | Guanaceví | Bolañitos | El Cubo | Total |
| Cash costs net of by-product | $34,466 | $2,027 | $7,200 | $43,693 | $27,688 | ($3,586) | $14,605 | $38,707 |
| Operations stock based compensation | (31) | (31) | (31) | (93) | 68 | 67 | 67 | 202 |
| Corporate general and administrative | 1,536 | 1,670 | 2,987 | 6,193 | 1,423 | 1,734 | 2,068 | 5,225 |
| Corporate stock based compensation | 541 | 588 | 1,051 | 2,179 | 655 | 799 | 953 | 2,407 |
| Reclamation - amortization/ accretion | 43 | 32 | 74 | 149 | 28 | 17 | 41 | 86 |
| Mine site expensed exploration | 711 | 741 | 963 | 2,415 | 272 | 778 | 1,150 | 2,200 |
| Capital expenditures sustaining | 15,717 | 3,497 | 9,979 | 29,193 | 17,080 | 1,647 | 13,909 | 32,636 |
| All In Sustaining Costs | $52,983 | $8,523 | $22,223 | $83,729 | $47,214 | $1,456 | $32,793 | $81,463 |
| Growth exploration | | | | 9,517 | | | | 10,320 |
| Growth capital expenditures | | | | 11,205 | | | | 7,199 |
| All In Costs | | | | $104,451 | | | | $98,982 |
| | Year Ended December 31, 2018 | Year Ended December 31, 2017 |
| | Guanaceví | Bolañitos | El Cubo | Total | Guanaceví | Bolañitos | El Cubo | Total |
| Throughput tonnes | 307,042 | 439,005 | 520,784 | 1,266,831 | 321,113 | 446,924 | 511,836 | 1,279,873 |
| Payable silver ounces | 1,961,788 | 946,995 | 2,508,850 | 5,417,633 | 2,064,382 | 896,869 | 1,842,338 | 4,803,589 |
| Silver equivalent production (ounces) | 2,355,573 | 2,560,080 | 4,578,940 | 9,494,593 | 2,421,948 | 2,952,488 | 3,520,877 | 8,895,313 |
| | | | | | | | | |
| Sustaining cost per ounce | $27.01 | $9.00 | $8.86 | $15.45 | $22.87 | $1.62 | $17.80 | $16.96 |
| All In costs per ounce | | | | $19.28 | | | | $20.61 |
| ENDEAVOUR SILVER CORP. | MANAGEMENT’S DISCUSSION & ANALYSIS | PAGE24 |
| | |
| Expressed in thousands US dollars | Three Months Ended December 31 | Year Ended December 31 |
| | 2018 | 2017 | 2018 | 2017 |
| Capital expenditures sustaining | $4,830 | $4,478 | $29,193 | $32,636 |
| Growth capital expenditures | 2,811 | 3,782 | 11,205 | 7,199 |
| Property, plant and equipment expenditures | $7,641 | $8,260 | $40,398 | $39,835 |
| Expressed in thousands US dollars | Three Months Ended December 31 | Year Ended December 31 |
| | 2018 | 2017 | 2018 | 2017 |
| Mine site expensed exploration | $198 | $271 | $2,415 | $2,200 |
| Growth exploration | 1,638 | 2,015 | 9,517 | 10,320 |
| Exploration expenditures | $1,836 | $2,286 | $11,932 | $12,520 |
| Exploration depreciation and depletion | 35 | 34 | 111 | 102 |
| Exploration share-based compensation | 94 | 59 | 340 | 197 |
| Exploration expense | $1,965 | $2,379 | $12,383 | $12,819 |
Silver co-product cash costs and gold co-product cash costs are measures used by the Company to manage and evaluate operating performance at each of the Company’s operating mining units and consolidated group, but do not have a standardized meaning and are disclosed in addition to IFRS measures. The following tables provide a detailed reconciliation of these measures to the Company’s cost of sales, as reported in its consolidated financial statements.
| Expressed in thousands US dollars | Three Months Ended December 31, 2018 | Three Months Ended December 31, 2017 |
| | Guanaceví | Bolañitos | El Cubo | Total | Guanaceví | Bolañitos | El Cubo | Total |
| Direct production costs per financial statements | $8,721 | $5,526 | $10,697 | $24,944 | $7,805 | $7,707 | $12,887 | $28,399 |
| Royalties | 236 | 36 | 85 | 357 | 353 | 65 | 85 | 503 |
| Special mining duty(1) | - | 94 | 237 | 331 | - | 492 | - | 492 |
| Opening finished goods | (643) | (87) | (565) | (1,295) | (2,763) | (325) | (493) | (3,581) |
| Closing finished goods | 1,247 | 1,457 | 502 | 3,206 | 2,942 | 385 | 387 | 3,714 |
| Direct production costs | 10,919 | 7,026 | 10,956 | 28,901 | 8,337 | 8,324 | 12,866 | 29,527 |
| | Three Months Ended December 31, 2018 | Three Months Ended December 31, 2017 |
| | Guanaceví | Bolañitos | El Cubo | Total | Guanaceví | Bolañitos | El Cubo | Total |
| Silver production (ounces) | 484,197 | 235,326 | 666,982 | 1,386,505 | 544,117 | 280,712 | 612,133 | 1,436,962 |
| Average realized silver price ($) | 14.88 | 14.88 | 14.88 | 14.88 | 16.84 | 16.84 | 16.84 | 16.84 |
| Silver value ($) | 7,204,851 | 3,501,651 | 9,924,692 | 20,631,194 | 9,162,930 | 4,727,190 | 10,308,320 | 24,198,440 |
| | | | | | | | | |
| Gold production (ounces) | 1,240 | 5,166 | 6,711 | 13,117 | 1,245 | 7,204 | 6,128 | 14,577 |
| Average realized gold price ($) | 1,270 | 1,270 | 1,270 | 1,270 | 1,288 | 1,288 | 1,288 | 1,288 |
| Gold value ($) | 1,574,800 | 6,560,820 | 8,522,970 | 16,658,590 | 1,603,560 | 9,278,752 | 7,892,864 | 18,775,176 |
| | | | | | | | | |
| Total metal value ($) | 8,779,651 | 10,062,471 | 18,447,662 | 37,289,784 | 10,766,490 | 14,005,942 | 18,201,184 | 42,973,616 |
| Pro-rated silver costs | 82% | 35% | 54% | 55% | 85% | 34% | 57% | 56% |
| Pro-rated gold costs | 18% | 65% | 46% | 45% | 15% | 66% | 43% | 44% |
| | | | | | | | | |
| Silver co-product cash costs | $18.51 | $10.39 | $8.84 | $11.53 | $13.04 | $10.01 | $11.90 | $11.57 |
| Gold co-product cash costs | $1,579 | $887 | $754 | $984 | $997 | $765 | $910 | $885 |
| ENDEAVOUR SILVER CORP. | MANAGEMENT’S DISCUSSION & ANALYSIS | PAGE25 |
| | |
| Expressed in thousands US dollars | Year Ended December 31, 2018 | Year Ended December 31, 2017 |
| | Guanaceví | Bolañitos | El Cubo | Total | Guanaceví | Bolañitos | El Cubo | Total |
| Direct production costs per financial statements | $40,290 | $26,305 | $38,408 | $105,003 | $33,408 | $28,693 | $41,229 | $103,330 |
| Royalties | 1,123 | 190 | 340 | 1,653 | 1,239 | 228 | 273 | 1,740 |
| Special mining duty(1) | - | 615 | 1,235 | 1,850 | - | 943 | (99) | 844 |
| Opening finished goods | (2,942) | (385) | (387) | (3,714) | (3,948) | - | (385) | (4,333) |
| Finished goods NRV adjustment | 1,358 | - | - | 1,358 | 117 | - | - | 117 |
| Closing finished goods | 1,247 | 1,457 | 502 | 3,206 | 2,942 | 385 | 387 | 3,714 |
| Direct production costs | 41,076 | 28,182 | 40,098 | 109,356 | 33,758 | 30,249 | 41,405 | 105,412 |
| | Year Ended December 31, 2018 | Year Ended December 31, 2017 |
| | Guanaceví | Bolañitos | El Cubo | Total | Guanaceví | Bolañitos | El Cubo | Total |
| Silver production (ounces) | 1,963,773 | 975,555 | 2,582,740 | 5,522,068 | 2,066,448 | 934,238 | 1,919,102 | 4,919,788 |
| Average realized silver price ($) | 15.65 | 15.65 | 15.65 | 15.65 | 17.24 | 17.24 | 17.24 | 17.24 |
| Silver value ($) | 30,733,047 | 15,267,436 | 40,419,881 | 86,420,364 | 35,625,564 | 16,106,263 | 33,085,318 | 84,817,145 |
| | | | | | | | | |
| Gold production (ounces) | 5,224 | 21,127 | 26,616 | 52,967 | 4,740 | 26,910 | 21,357 | 53,007 |
| Average realized gold price ($) | 1,267 | 1,267 | 1,267 | 1,267 | 1,285 | 1,285 | 1,285 | 1,285 |
| Gold value ($) | 6,618,808 | 26,767,909 | 33,722,472 | 67,109,189 | 6,090,900 | 34,579,350 | 27,443,745 | 68,113,995 |
| | | | | | | | | |
| Total metal value ($) | 37,351,855 | 42,035,345 | 74,142,353 | 153,529,553 | 41,716,464 | 50,685,613 | 60,529,063 | 152,931,140 |
| Pro-rated silver costs | 82% | 36% | 55% | 56% | 85% | 32% | 55% | 55% |
| Pro-rated gold costs | 18% | 64% | 45% | 44% | 15% | 68% | 45% | 45% |
| | | | | | | | | |
| Silver co-product cash costs | $17.21 | $10.49 | $8.46 | $11.15 | $13.95 | $10.29 | $11.79 | $11.88 |
| Gold co-product cash costs | $1,393 | $849 | $685 | $902 | $1,040 | $767 | $879 | $886 |
(1) Special mining duty is an EBITDA royalty tax presented as a current income tax in accordance with IFRS.
Quarterly Results and Trends
The following table presents selected financial information for each of the most recent eight quarters:
| Table in thousands of U.S. dollars except for | | 2018 | | | 2017 | |
| share numbers and per share amounts | Q4 | Q3 | Q2 | Q1 | Q4 | Q3 | Q2 | Q1 |
| Revenue | $33,833 | $37,581 | $38,765 | $40,330 | $41,640 | $39,782 | $32,636 | $36,441 |
| Direct cost | 24,943 | 28,378 | 25,413 | 26,269 | 28,399 | 27,400 | 23,483 | 24,048 |
| Royalties | 357 | 421 | 177 | 698 | 503 | 457 | 340 | 440 |
| Mine operating cash flow | 8,533 | 8,782 | 13,175 | 13,363 | 12,738 | 11,925 | 8,813 | 11,953 |
| Share-based compensation | - | - | (130) | 37 | 47 | 63 | 92 | - |
| Amortization and depletion | 6,110 | 13,562 | 8,689 | 10,051 | 4,804 | 4,394 | 3,271 | 4,113 |
| Write down on inventory | 2,026 | - | - | - | - | 166 | - | - |
| Mine operating earnings (loss) | $397 | ($4,780) | $4,616 | $3,275 | $7,887 | $7,302 | $5,450 | $7,840 |
| | | | | | | | | |
| Basic earnings (loss) per share | ($0.03) | ($0.04) | ($0.04) | $0.02 | $0.02 | $0.01 | $0.00 | $0.05 |
| Diluted earnings (loss) per share | ($0.03) | ($0.04) | ($0.04) | $0.02 | $0.02 | $0.01 | $0.00 | $0.05 |
| Weighted shares outstanding | 130,511,679 | 128,805,441 | 127,570,254 | 127,488,410 | 127,486,671 | 127,456,410 | 127,318,926 | 127,095,764 |
| | | | | | | | | |
| Net earnings (loss) | ($3,661) | ($5,452) | ($5,651) | $2,325 | $2,669 | $996 | ($16) | $6,035 |
| Amortization and depletion | 6,217 | 13,199 | 7,939 | 9,837 | 4,935 | 4,540 | 3,333 | 4,182 |
| Finance costs | 51 | 62 | 49 | 49 | 105 | 166 | 208 | 236 |
| Current income tax | 1,533 | 291 | 1,965 | 688 | 2,924 | 882 | 545 | 299 |
| Deferred income tax | (2,591) | (2,957) | (2,415) | (1,786) | (3,737) | (510) | (403) | (1,797) |
| NRV cost adjustment | 668 | 458 | 835 | 292 | - | - | - | - |
| EBITDA | $2,217 | $5,601 | $2,722 | $11,405 | $6,896 | $6,074 | $3,667 | $8,955 |
| ENDEAVOUR SILVER CORP. | MANAGEMENT’S DISCUSSION & ANALYSIS | PAGE26 |
| | |
The following table presents selected production information for each of the most recent eight quarters:
| Highlights | | 2018 | | | 2017 | |
| | Q4 | Q3 | Q2 | Q1 | Q4 | Q3 | Q2 | Q1 |
| Processed tonnes | 309,036 | 317,821 | 314,305 | 325,669 | 349,924 | 322,784 | 303,943 | 303,222 |
| Guanaceví | 75,528 | 81,268 | 71,275 | 78,971 | 83,881 | 74,649 | 74,984 | 87,599 |
| Bolañitos | 105,768 | 109,728 | 108,495 | 115,014 | 124,172 | 114,526 | 113,875 | 94,351 |
| El Cubo | 127,740 | 126,825 | 134,535 | 131,684 | 141,871 | 133,609 | 115,084 | 121,272 |
| Silver ounces | 1,386,505 | 1,428,828 | 1,355,895 | 1,350,840 | 1,436,962 | 1,262,064 | 1,143,788 | 1,076,974 |
| Guanaceví | 484,197 | 518,318 | 464,929 | 496,329 | 544,117 | 522,907 | 468,741 | 530,683 |
| Bolañitos | 235,326 | 236,197 | 248,591 | 255,441 | 280,712 | 253,787 | 231,016 | 168,723 |
| El Cubo | 666,982 | 674,313 | 642,375 | 599,070 | 612,133 | 485,370 | 444,031 | 377,568 |
| Silver grade | 157 | 160 | 156 | 151 | 152 | 144 | 135 | 126 |
| Guanaceví | 222 | 218 | 225 | 224 | 241 | 250 | 219 | 213 |
| Bolañitos | 82 | 84 | 91 | 86 | 86 | 85 | 78 | 66 |
| El Cubo | 181 | 188 | 171 | 164 | 157 | 135 | 137 | 111 |
| Silver recovery | 88.8 | 87.5 | 86.2 | 85.4 | 84.1 | 84.5 | 86.6 | 87.4 |
| Guanaceví | 89.8 | 91.0 | 90.2 | 87.3 | 83.7 | 87.2 | 88.8 | 88.5 |
| Bolañitos | 84.4 | 79.7 | 78.3 | 80.3 | 81.8 | 81.1 | 80.9 | 84.3 |
| El Cubo | 89.7 | 88.0 | 86.8 | 86.3 | 85.5 | 83.7 | 87.6 | 87.2 |
| Gold ounces | 13,117 | 12,968 | 13,674 | 13,208 | 14,577 | 13,648 | 13,058 | 11,724 |
| Guanaceví | 1,240 | 1,114 | 1,423 | 1,447 | 1,245 | 1,224 | 1,079 | 1,192 |
| Bolañitos | 5,166 | 4,832 | 5,222 | 5,907 | 7,204 | 6,523 | 6,965 | 6,218 |
| El Cubo | 6,711 | 7,022 | 7,029 | 5,854 | 6,128 | 5,901 | 5,014 | 4,314 |
| Gold grade | 1.55 | 1.50 | 1.60 | 1.49 | 1.56 | 1.58 | 1.58 | 1.41 |
| Guanaceví | 0.58 | 0.48 | 0.67 | 0.64 | 0.54 | 0.57 | 0.50 | 0.49 |
| Bolañitos | 1.77 | 1.67 | 1.82 | 1.91 | 2.18 | 2.15 | 2.27 | 2.40 |
| El Cubo | 1.93 | 2.00 | 1.92 | 1.64 | 1.61 | 1.65 | 1.60 | 1.31 |
| Gold recovery | 85.4 | 84.8 | 84.5 | 84.5 | 83.3 | 83.4 | 84.6 | 85.2 |
| Guanaceví | 88.0 | 88.8 | 92.7 | 89.0 | 85.5 | 89.5 | 89.5 | 86.4 |
| Bolañitos | 85.8 | 82.0 | 82.3 | 83.6 | 82.8 | 82.4 | 83.8 | 85.4 |
| El Cubo | 84.7 | 86.1 | 84.6 | 84.3 | 83.4 | 83.3 | 84.7 | 84.5 |
| Cash costs per oz | $9.22 | $8.86 | $7.61 | $6.50 | $7.97 | $8.11 | $8.36 | $7.81 |
| Guanaceví | $19.38 | $18.14 | $17.46 | $15.31 | $12.39 | $13.68 | $14.94 | $12.85 |
| Bolañitos | $2.59 | $6.22 | $2.87 | ($2.77) | ($2.73) | ($0.52) | ($4.78) | ($10.28) |
| El Cubo | $3.97 | $2.47 | $2.09 | $2.93 | $8.78 | $6.37 | $7.95 | $8.52 |
| Total cost per oz(1) | $14.30 | $18.16 | $14.10 | $13.70 | $11.38 | $11.74 | $12.02 | $11.62 |
| Guanaceví | $27.24 | $31.99 | $29.03 | $28.06 | $19.92 | $20.48 | $21.63 | $18.94 |
| Bolañitos | $2.25 | $7.68 | $4.09 | ($1.42) | ($1.47) | $1.81 | ($2.07) | ($7.43) |
| El Cubo | $8.89 | $10.91 | $6.85 | $7.90 | $9.38 | $7.13 | $8.78 | $9.44 |
| AISC per oz | $14.20 | $16.14 | $17.28 | $14.18 | $12.70 | $11.74 | $20.46 | $18.24 |
| Guanaceví | $27.49 | $28.75 | $29.24 | $22.62 | $17.57 | $23.47 | $27.40 | $23.78 |
| Bolañitos | $5.12 | $14.00 | $12.84 | $4.20 | $1.01 | $3.96 | $3.61 | ($3.82) |
| El Cubo | $7.48 | $6.96 | $10.08 | $11.22 | $13.56 | $17.95 | $21.60 | $20.00 |
| Costs per tonne | $93.52 | $86.33 | $86.43 | $79.38 | $84.38 | $84.81 | $84.01 | $75.77 |
| Guanaceví | $144.57 | $131.75 | $139.24 | $120.63 | $99.39 | $117.15 | $111.42 | $94.99 |
| Bolañitos | $66.43 | $64.00 | $65.74 | $60.87 | $67.04 | $71.52 | $66.60 | $65.18 |
| El Cubo | $85.77 | $76.55 | $75.13 | $70.81 | $90.69 | $78.13 | $83.38 | $70.12 |
| (1) | Total Production Cost per ounce |
| ENDEAVOUR SILVER CORP. | MANAGEMENT’S DISCUSSION & ANALYSIS | PAGE27 |
| | |
Key Economic Trends
Precious Metal Price Trends
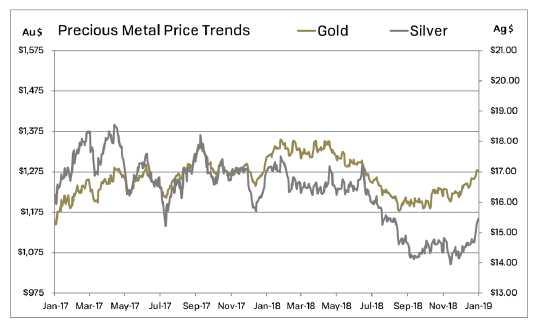
The prices of silver and gold are the largest single factor in determining profitability and cash flow from operations. The financial performance of the Company has been, and is expected to continue to be, closely linked to the prices of silver and gold. During 2018, the average price of silver was $15.71 per ounce, with silver trading between $13.97 and $17.52 per ounce based on the London Fix silver price. This compares to an average of $17.05 per ounce during 2017, with a low of $15.22 and a high of $18.56 per ounce. During 2018, the Company realized an average price of $15.65 per silver ounce compared with $17.24 for 2017.
During 2018, the average price of gold was $1,269 per ounce, with gold trading between $1,178 and $1,355 per ounce based on the London Fix PM gold price. This compares to an average of $1,257 per ounce during 2017, with a low of $1,146 and a high of $1,346 per ounce. During 2018, the Company realized an average price of $1,267 per ounce compared with $1,285 for 2017.
During 2017, the average price of silver was $17.05 per ounce, with silver trading between a range of $15.22 and $18.56 per ounce based on the London Fix silver price. This compares to an average of $17.14 per ounce during 2016, with a low of $13.58 and a high of $20.71 per ounce. During 2017, the Company realized an average price of $17.24 per ounce compared with $16.84 for 2016.
During 2017, the average price of gold was $1,257 per ounce, with gold trading between a range of $1,146 and $1,346 per ounce based on the London Fix PM gold price. This compares to an average of $1,251 per ounce during 2016, with a low of $1,077 and a high of $1,366 per ounce. During 2017, the Company realized an average price of $1,285 per ounce compared with $1,253 for 2016.
The major influences on precious metals prices from the start of 2016 included weaker investment demand, selling from precious metal exchange traded funds, as well as strong U.S. equity and bond markets that pulled investments from other asset classes, including precious metals. In addition, precious metal prices were also affected by an expectation of improving economic conditions, which led to the reduction of the U.S. Federal Reserve’s quantitative easing program in 2014 and the rising of borrowing rates and the anticipation of further increases until Q4, 2018. Management believes that investor uncertainty surrounding the effect of the U.S. administration’s policies, particularly implementation of tariffs, led to renewed interest in precious metals stabilizing prices during 2017, the robust economic growth in early 2018 resulted in weaker investment in the sector. In the fourth quarter, renewed uncertainty surrounding trade discussions, the results of the US mid-term elections and signals of US economic slow down has renewed interest in the precious metals that continued into Q1, 2019.
| ENDEAVOUR SILVER CORP. | MANAGEMENT’S DISCUSSION & ANALYSIS | PAGE28 |
| | |
Currency Fluctuations
The Company’s mining operations are located in Mexico and therefore a significant portion of operating costs and capital expenditures are denominated in Mexican pesos. The Company’s corporate activities are based in Vancouver, Canada with the significant portion of these expenditures being denominated in Canadian dollars. Generally, as the U.S. dollar strengthens, these currencies weaken, and as the U.S. dollar weakens, these currencies strengthen.
During 2018, the Mexican peso initially appreciated against the U.S. dollar, however discussions of U.S. imposed tariffs and the expectation of the election of Andres Manuel Lopez Obrador as the next Mexico president drove the Mexican peso to depreciate against the U.S. dollar at the end of the second quarter. After the election, the Mexican Peso regained its losses and stabilized with an agreement on trade with the US. During 2018, the average foreign exchange rate was $19.22 Mexican pesos per U.S. dollar, with the peso trading within a range of $18.00 to $20.77. This compares to an average of $18.91 during 2017, with a range of $17.50 to $21.92 Mexican pesos per U.S. dollar.
During the year ended December 31, 2017, the Mexican peso reversed a long negative trend and significantly appreciated against the U.S. dollar until the fourth quarter. During 2017, the average foreign exchange rate was $18.91 Mexican pesos per U.S. dollar, with the peso trading within a range of $17.50 to $21.92. This compares to an average of $18.68 during the year ended December 31, 2016, with a range of $17.17 to $20.82 Mexican pesos per U.S. dollar. The reversal of the trend in the earlier periods of 2017 is attributed to the correction from the sharp fall during the U.S. election and from rising oil prices.
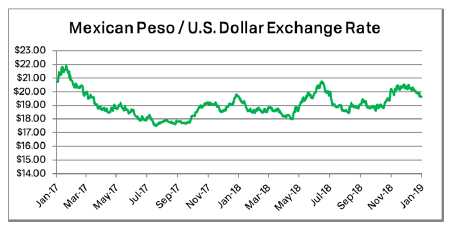
During 2018, the Canadian dollar gradually depreciated against the U.S. dollar. During 2018, the average foreign exchange rate was $1.296 Canadian dollar per U.S. dollar, with the Canadian dollar trading within a range of $1.230 and $1.336. This compares to an average of $1.298 during 2017, within a range of $1.211 and $1.374 Canadian dollar per U.S. dollar.
During 2017, the Canadian dollar appreciated relative to the U.S. dollar, with significant appreciation in the third quarter. During 2017, the average foreign exchange rate was $1.298 Canadian dollar per U.S. dollar, with the Canadian dollar trading within a range of $1.211 and $1.374. This compares to an average of $1.3251 during 2016, with a range of $1.2533 and $1.4602 U.S. dollar per Canadian dollar.

| ENDEAVOUR SILVER CORP. | MANAGEMENT’S DISCUSSION & ANALYSIS | PAGE29 |
| | |
Cost Trends

The Company’s profitability is subject to industry wide cost pressures on development and operating costs with respect to labour, energy, consumables and capital expenditures. Underground mining is labour intensive and approximately 33% of the Company’s production costs are directly tied to labour. In order to mitigate the impact of higher labour and consumable costs, the Company focuses on continuous improvement by promoting more efficient use of materials and supplies and by pursuing more advantageous pricing while increasing performance and without compromising operational integrity.
2019 Outlook
Production
In 2019, consolidated silver and gold production is estimated to be about 10% lower than 2018. Silver production is expected to range from 4.4 to 5.2 million ounces and gold production is anticipated be in the 46,200-52,200 oz range. Silver equivalent production should approximate 8.1 -9.4 million oz using a 80:1 silver:gold ratio. Endeavour estimates its consolidated cash cost will be slightly higher year-on-year at $8.50 -9.50 per oz silver and the all-in sustaining cost will be equal to or slightly lower than 2018 at $15-16 per oz silver, both net of the gold byproduct credit.
Cash costs are expected to increase slightly in 2019 compared to 2018, primarily at El Cubo, whereas reduced capital expenditures in 2019 should result in lower all-in sustaining costs year-on-year, based on lower 2019 precious metal production and using lower estimated metal prices of $15.50 per oz silver and $1,240 per oz gold. The 2019 sustaining capital budget is lower than 2018 due to lower sustaining capital expenditures at El Cubo. The 2019 exploration budget for the operating mines is also lower as the focus shifts towards growth projects such as Parral.
At Guanaceví, the two operating mines, Porvenir Norte and Santa Cruz, are now deeper, narrower, lower grade and higher cost than prior years. In 2018, Endeavour completed the permitting and initial development of two new shallower, wider, higher grade, lower cost orebodies, Milache and Santa Cruz Sur (SCS). By year-end, three mine levels were being developed in mineralization at Milache, with development ore being trucked to the plant. A new mine access ramp was collared at SCS in late 2018 to facilitate development of the orebody in 2019. The Milache and SCS production rates are expected to climb each quarter to their respective 200-300 tpd capacities by mid-year, first to fill the plant to its 1200 tpd capacity and then to steadily displace the higher cost production at Porvenir Norte and Santa Cruz.
| ENDEAVOUR SILVER CORP. | MANAGEMENT’S DISCUSSION & ANALYSIS | PAGE30 |
| | |
At Bolañitos, mine production and plant throughput are forecast slightly below 1,200 tpd, similar to the two previous years with production coming from six working areas, with the bulk of production coming from the LL-Asunción and Plateros vein orebodies. Ore grades are expected to be slightly lower than 2018, offset by improved recoveries.
At El Cubo, exploration in 2018 did not replace the depleted reserves, so the Company plans to reduce the production rate in 2019 to approximately half its 1,500 tonne per day capacity. The lower production rate will result in higher operating costs. Accordingly, the Company has initiated layoffs to reflect the lower production rate in 2019. The mine will continue to run at three shifts per day, but the plant will move to one shift per day. Some idled mining equipment at El Cubo was transferred to the El Compas mine in Zacatecas to facilitate their mine plan in 2019. Grades are expected to be 10% lower than 2018, while recoveries are expected to remain consistent with 2018.
At El Compas, the ball mill pinion failed in late December, which brought plant commissioning to a halt. However, mining operations continued and the ore stockpile now exceeds 19,000 tonnes. Management re-commenced plant operations after a new pinion was installed in February 2019 and expects to attain commercial production in Q1, 2019.
Operating Costs
Cash costs, net of gold by-product credits, are expected to be $8.50 -$9.50 per oz of silver produced in 2019. Consolidated cash costs on a co-product basis are anticipated to be $11.50 -$12.50 per oz silver and $900-$1,000 per oz gold.
All-in sustaining costs, net of gold by-product credits, in accordance with the World Gold Council standard, are estimated to be $15.00 -$16.00 per oz of silver produced. When non-cash items such as stock-based compensation are excluded, AISC are forecast to be in the $14.50 -$15.50 range.
Direct operating costs are estimated to be in the range of $85-$90 per tonne.
Management has assumed a $15.50 per oz silver price, $1,240 per oz gold price, and 20:1 Mexican peso per US dollar exchange rate for its 2019 cost forecasts.
Capital Investments
In 2019, Endeavour plans to invest $20.6 million on capital projects primarily on sustaining capital at the four operating mines, and $1.8 million in growth capital to maintain the exploration concessions and cover corporate infrastructure. At current metal prices, the sustaining capital investments will be covered by operating cash flow and current cash.
At Guanaceví, a capital budget of $10.6 million is planned for 2019, to primarily advance 7.0 kilometres of mine access at the North Porvenir, Santa Cruz, Milache and SCS mines.
At Bolañitos, a capital budget of $4.2 million is planned for 2019, including $3.4 million on mine development to access reserves and resources in six working veins. An additional $0.8 million will be invested to support site infrastructure, raise the tailings dam, and fund office equipment and building improvements.
At El Compas, a capital budget of $4.0 million is planned for 2019, including $2.7 million on mine development to further advance the Compas vein and access the Orito vein. An additional $1.3 million is planned for supporting site infrastructure, including plant and mine improvements.
At El Cubo, no capital budget was allocated as all underground development is now included in the operating expenditures until further reserves are defined.
The Company is still awaiting receipt of the final dumps and tailings permit needed to advance the Terronera project to a development decision. Upon receipt of these final permits, and assuming a positive board production decision and appropriate debt financing, management will release the anticipated 2019 growth capital budget for Terronera.
| ENDEAVOUR SILVER CORP. | MANAGEMENT’S DISCUSSION & ANALYSIS | PAGE31 |
| | |
| Mine | Mine
Development | Other
Capital | Sustaining
Capital | Growth
Capital | Total
Capital |
| Guanaceví | $9.7 million | $0.9 million | $10.6 million | - | $10.6 million |
| Bolañitos | $3.4 million | $0.8 million | $4.2 million | - | $4.2 million |
| El Cubo | - | - | - | - | - |
| El Compas | $2.7 million | $1.3 million | $4.0 million | - | $4.0 million |
| Corporate | - | - | - | $1.8 million | - |
| Total | $15.8 million | $3.0 million | $18.8 million | $1.8 million | $20.6 million |
Exploration Expenditures
In 2019, the Company plans to drill 30,000 metres and spend $9.8 million on brownfields and greenfields exploration and development engineering across its portfolio of properties. At the four existing mines, 18,500 metres of core drilling are planned at a cost of $3.1 million. For the exploration and development projects, expenditures of $5.7 million are planned to fund 11,500 metres of core drilling and advance engineering studies at Terronera and Parral, for which the Company recently published updated NI 43-101 resource estimates, and drilling of three new projects in Chile. Another $1 million will be allocated to projects on an as needed basis during the year.
| Project | 2019 Activity | Drill Metres | Expenditures |
| Guanaceví | Drilling | 6,000 | $1.2 million |
| Bolañitos | Drilling | 5,000 | $0.8 million |
| El Cubo | Drilling | 2,000 | $0.3 million |
| El Compas | Drilling | 5,500 | $0.8 million |
| Terronera | Economic Study | - | $0.8 million |
| Parral | Drilling/ Economic Study | 6,000 | $2.3 million |
| Guadalupe y Calvo | Mapping/ Sampling | - | $0.1million |
| Chile | Drilling | - | $2.5 million |
| Unallocated | - | - | $1.0 million |
| Total | | 24,500 | $9.8 million |
Liquidity and Capital Resources
Cash and cash equivalents (including restricted cash) decreased from $39.3 million at December 31, 2017 to $33.4 million at December 31, 2018. The Company had working capital of $54.5 million at December 31, 2018 (December 31, 2017 - $66.2 million). The $15.8 million decrease in working capital is due to investing $40.4 million into property, plant and equipment and offset by cash generated from operating activities and $7.9 million raised through equity sales.
Operating activities generated cash of $26.6 million during 2018 compared to $15.6 million of cash during 2017. The significant non-cash adjustments to the net loss of $12.4 million were depreciation and depletion of $38.8 million, share-based compensation of $2.4 million, a deferred income tax recovery of $9.7 million, a write down of inventory to net realizable value of $2.6 million and a change in working capital of $4.5 million. The change working capital was primarily due to a collection of trade and IVA receivables and an increase of production inventories with normal fluctuations in other working capital items. Inventories have increased due to the stockpiling of ore at the El Compas project during the commissioning of the plant.
| ENDEAVOUR SILVER CORP. | MANAGEMENT’S DISCUSSION & ANALYSIS | PAGE32 |
| | |
The Company’s Mexican subsidiaries pay value added tax, Impuesto al Valor Agregado (“IVA”), on the purchase and sale of goods and services. The net amount paid is recoverable but is subject to review and assessment by the tax authorities. The Company regularly files the required IVA returns and all supporting documentation with the tax authorities, however, the Company has been advised that certain IVA amounts receivable from the tax authorities were being withheld pending completion of the authorities’ audit of certain of the Company’s third-party suppliers. Under Mexican law the Company has legal rights to those IVA refunds and the results of the third party audits should have no impact on refunds. A smaller portion of IVA refund requests are from time to time improperly denied based on the alleged lack of compliance of certain formal requirements and information returns by the Company’s third-party suppliers. The Company takes necessary legal action on the delayed refunds as well as any improperly denied refunds.
Mangement believes that historical delays and denials with respect to IVA refunds for Compania Minera del Cubo (“El Cubo”) and Refinadora Plata Adelante S.A. de C.V. (“Guanaceví,”) were improper. At December 31, 2018, El Cubo held $4.9 million and Guanaceví held $7.0 million in IVA receivables which the Company and its advisors deem to be recoverable from tax authorities (December 31, 2017 – $10.4 million and $8.8 million respectively).
During Q4, 2018, on a consolidated basis, the Company received MXN 183.5 million ($9.7 million) of IVA refunds, of which MXN 81.9 million ($4.3 million) and MXN 34.6 million ($1.8 million) pertained to El Cubo and Guaancevi, respectively. Subsequent to year end, MXN 45.6 million ($2.3 million) of IVA refunds have been collected.
The Company is in regular contact with the tax authorities in respect of its IVA filings and believes that the full amount of its IVA receivables will ultimately be received; however, the timing of recovery of these amounts and the nature and extent of any adjustments to the Company’s IVA receivables remains uncertain. See “Financial Instrument Risk Exposure and Risk Management-Liquidity Risk”.
Investing activities during the period used $40.4 million compared to $39.7 million in 2017. The investments in 2018 primarily relate sustaining capital at the existing operations and the construction of the El Compas operation.
Capital spending totaled $40.4 million in property, plant and equipment during 2018. At Guanaceví, the Company invested $15.7 million, with $13.6 million spent on 9.0 kilometres of mine development, $1.5 million on underground infrastructure, $0.3 million on plant improvements and $0.3 million various support items.
At El Cubo, the Company invested $9.9 million, including $8.2 million on 6.7 kilometres of mine development, $1.1 million on refurbishment of underground mobile equipment, $0.2 million on the tailings dam, and $0.4 million on other site equipment.
At Bolañitos, the Company invested $3.5 million, including $2.6 million on 3.3 kilometres of mine development and $0.3 on mine infrastructure and $0.6 million on various site equipment and support vehicles.
At El Compas, the Company has spent a total of $10.5 million in developing the El Compas ore body and refurbishment of the plant. $3.7 million was incurred in 2018 on the plant, $5.8 million was incurred on development of the main ore ramp and $1.0 million on various other equipment. See further discussion under Development Activities.
Exploration incurred net $0.6 million in holding costs and Corporate expenditures totaled $0.2 million in 2018.
Financing activities during 2018 increased cash by $8.9 million, compared to decreasing cash by $10.3 million during 2017. During 2018, the Company received gross proceeds through an at-the-market financing of $8.3 million, proceeds of $0.2 million received from exercised stock options, paid $0.6 million in share issue costs and had a release of restricted cash of $1.0 million. By comparison, during 2017, the Company paid $10.0 million to reduce its credit facility and $0.5 million in interest, offset by proceeds of $0.1 million received from exercised stock options.
In April 2018, the Company filed a short form base shelf prospectus (the “Base Shelf”) that qualifies the distribution of up to CDN$150 million of common shares, warrants or units of the Company comprising any combination of common shares and warrants (“Securities”). The distribution of Securities may be effected from time to time in one or more transactions at a fixed price or prices, which may vary with market prices prevailing at the time of sale, or at prices related to such prevailing market prices to be negotiated with purchasers and as set forth in an accompanying prospectus supplement, including transactions that are deemed to be at the market distributions. The Base Shelf also provides the Company with the ability to conduct an “At-The-Market” offering through an “At-The-Market” facility (“ATM”) equity distribution agreement.
| ENDEAVOUR SILVER CORP. | MANAGEMENT’S DISCUSSION & ANALYSIS | PAGE33 |
| | |
On June 13, 2018, the Company entered into an ATM equity facility with BMO Capital Markets (the lead agent), CIBC Capital Markets, H.C. Wainwright & Co., HSBC and TD Securities (together, the “Agents”). Under the terms of this ATM facility, the Company may, from time to time, sell common stock having an aggregate offering value of up to $35.7 million on the New York Stock Exchange. The Company determines, at its sole discretion, the timing and number of shares to be sold under the ATM facility. During 2018, the Company issued 3,165,642 common shares under the ATM facility at an average price of $2.61 per share for gross proceeds of $8.3 million, less commission of $186,000.
The principal business objective that the Company expects to accomplish using the net proceeds from the ATM facility are to advance the exploration and development of the Terronera Project and to add to the Company’s working capital.
| Use of proceeds as at December 31, 2018 | |
| Net proceeds received | $8,087 |
| Advancement of Terronera Project | (3,285) |
| Remaining proceeds | $4,802 |
Subsequent to December 31, 2018, the Company issued an additional 635,171 shares under the ATM facility at an average price of $2.23 per share for gross proceeds of $1.4 million, less commission of $32 thousand.
Management of the Company believes that operating cash flow, existing working capital and proceeds from the ATM will be sufficient to cover 2019 capital requirements and commitments. The Company is assessing financing alternatives, including equity or debt or a combination of both to fund future growth, including the development of the Terronera project.
As at December 31, 2018, the Company’s issued share capital was $459.1 million, representing 130,781,052 common shares, and the Company had options outstanding to purchase 5,987,800 common shares with a weighted average exercise price of CAD$3.96.
Contingencies
Minera Santa Cruz y Garibaldi SA de CV (“MSCG”), a subsidiary of the Company, received a MXN 238 million assessment on October 12, 2010 by Mexican fiscal authorities for failure to provide the appropriate support for certain expense deductions taken in MSCG’s 2006 tax return, failure to provide appropriate support for loans made to MSCG from affiliated companies, and deemed an unrecorded distribution of dividends to shareholders, among other individually immaterial items. MSCG immediately initiated a Nullity action and filed an administrative attachment to dispute the assessment.
In June 2015, the Superior Court ruled in favour of MSCG on a number of the matters under appeal; however, the Superior Court ruled against MSCG for failure to provide appropriate support for certain deductions taken in MSCG’s 2006 tax return. In June 2016, the Company received a MXN 122.9 million ($6.2 million) tax assessment based on the June 2015 ruling. The 2016 tax assessment comprised of MXN 41.8 million in taxes owed ($2.1 million), MXN 17.7 million ($0.9 million) in inflationary charges, MXN 40.4 million ($2.0 million) in interest and MXN 23.0 million ($1.2 million) in penalties. The 2016 tax assessment was issued for failure to provide the appropriate support for certain expense deductions taken in MSCG’s 2006 tax return, failure to provide appropriate support for loans made to MSCG from affiliated companies. If MSCG agrees to pay the tax assessment, or a lesser settled amount, it is eligible to apply for forgiveness of 100% of the penalties and 50% of the interest.
The Company filed an appeal against the June 2016 tax assessment on the basis that certain items rejected by the courts were included in the new tax assessment and a number of deficiencies exist within the assessment. Since issuance of the assessment interest charges of MXN 6.3 million ($0.3 million) and inflationary charges of MXN 9. million ($0.5 million) has accumulated.
Included in the Company’s consolidated financial statements, are net assets of $595,000, including $42,000 in cash, held by MSCG. Following the Tax Court’s rulings, MSCG has been in discussions with the tax authorities with regards to the shortfall of assets within MSCG to settle its estimated tax liability. An alternative settlement option would be to transfer the shares and assets of MSCG to the tax authorities. As of December 31, 2018, the Company recognized an allowance for transferring the shares and assets of MSCG amounting to $595,000. The Company is currently assessing MSCG’s settlement options based on ongoing court proceedings and discussion with the tax authorities.
| ENDEAVOUR SILVER CORP. | MANAGEMENT’S DISCUSSION & ANALYSIS | PAGE34 |
| | |
Capital Requirements
See 2019 Outlook on page 30 for discussion on planned capital and exploration expenditures.
Contractual Obligations
The Company had the following contractual obligations at December 31, 2018:
| Payments due by period (in thousands of dollars) | | | | | | | | | | | | | | | |
| Contractual Obligations | | Total | | | Less than 1
year | | | 1- 3 years | | | 3 - 5 years | | | More than
5 years | |
| Capital Assets purchases | $ | 140 | | $ | 140 | | $ | - | | $ | - | | $ | - | |
| Operating leases | | 2,840 | | | 394 | | | 720 | | | 542 | | | 1,184 | |
| Other Long-Term Liabilities | | 8,195 | | | - | | | 6,066 | | | 2,129 | | | - | |
| Total | $ | 11,175 | | $ | 534 | | $ | 6,786 | | $ | 2,671 | | $ | 1,184 | |
Transactions with Related Parties
The Company shares common administrative services and office space with Aztec Metals Corp., which is considered a related party company by virtue of Bradford Cooke being a common director. During 2017, the Company also shared common administrative services and office space with Canarc Resource Corp., which is considered a related party company by virtue of Bradford Cooke being a common director. From time to time, Endeavour incurs third-party costs on behalf of the related parties, which are charged on a full cost recovery basis. The charges for these costs totaled $2,000 and $16,000 for the three months and year ended December 31, 2018 (December 31, 2017 - $5,000 and $24,000 respectively). The Company had a $1,000 net receivable related to administration costs outstanding as at December 31, 2018 (December 31, 2017 – $2,000).
The Company was charged $27,000 and $189,000 for legal services for the three months and year ended December 31, 2018 respectively, by a firm in which the Company’s corporate secretary is a partner (December 31, 2017 - $8,000 and $60,000 respectively). The Company has $5,000 payable to the legal firm as at December 31, 2018 (December 31, 2017 - $Nil).
Financial Instruments and fair value measurements
As at December 31, 2018, the carrying and fair values of Endeavour’s financial instruments by category were as follows:
| | | As at December 31, 2018 | | | As at December 31, 2017 | |
| Expressed in thousands US dollars | | Carrying
value | | | Estimated
Fair value | | | Carrying
value | | | Estimated
Fair value | |
| Financial assets: | | | | | | | | | | | | |
| Cash and cash equivalents | $ | 33,376 | | $ | 33,376 | | $ | 39,277 | | $ | 39,277 | |
| Other investments | | 88 | | | 88 | | | 168 | | | 168 | |
| Trade receivables | | 5,627 | | | 5,627 | | | 8,114 | | | 8,114 | |
| Other receivables | | 380 | | | 380 | | | 360 | | | 360 | |
| Total financial assets | $ | 39,471 | | $ | 39,471 | | $ | 47,919 | | $ | 47,919 | |
| | | | | | | | | | | | | |
| Financial liabilities: | | | | | | | | | | | | |
| Accounts payable and accrued liabilities | $ | 19,470 | | $ | 19,470 | | $ | 19,068 | | $ | 19,068 | |
| Total financial liabilities | $ | 19,470 | | $ | 19,470 | | $ | 19,068 | | $ | 19,068 | |
| ENDEAVOUR SILVER CORP. | MANAGEMENT’S DISCUSSION & ANALYSIS | PAGE35 |
| | |
Fair value measurements
Fair value hierarchy:
Fair value is the price that would be received to sell an asset or paid to transfer a liability in an orderly transaction between market participants at the measurement date. The fair value hierarchy establishes three levels to classify the inputs to valuation techniques used to measure fair value. Level 1 inputs are quoted prices (unadjusted) in active markets for identical assets or liabilities. Level 2 inputs are quoted prices in markets that are not active, quoted prices for similar assets or liabilities in active markets, inputs other than quoted prices that are observable for the asset or liability (for example, interest rate and yield curves observable at commonly quoted intervals, forward pricing curves used to value currency and commodity contracts and volatility measurements used to value option contracts), or inputs that are derived principally from or corroborated by observable market data or other means. Level 3 inputs are unobservable (supported by no or little market activity). The fair value hierarchy gives the highest priority to Level 1 inputs and the lowest priority to Level 3 inputs.
Assets and liabilities measured at fair value on a recurring basis include:
| As at December 31, 2018 | | | | | | | | | | | | |
| Expressed in thousands US dollars | | Total | | | Level 1 | | | Level 2 | | | Level 3 | |
| Assets: | | | | | | | | | | | | |
| Other investments | $ | 88 | | $ | 88 | | $ | - | | $ | - | |
| Trade receivables | | 5,627 | | | - | | | 5,627 | | | - | |
| Total financial assets | $ | 5,715 | | $ | 88 | | $ | 5,627 | | $ | - | |
| | | | | | | | | | | | | |
| Liabilities: | | | | | | | | | | | | |
| Deferred share units | $ | 1,407 | | $ | 1,407 | | $ | - | | $ | - | |
| Share appreciation rights | | 72 | | | - | | | 72 | | | - | |
| Total financial liabilities | $ | 1,479 | | $ | 1,407 | | $ | 72 | | $ | - | |
Other investments
The Company holds marketable securities classified as Level 1 in the fair value hierarchy. The fair values of these other investments are determined based on a market approach reflecting the closing price of each particular security at the reporting date. The closing price is a quoted market price obtained from the stock exchange that is the principal active market for the particular security, being the market with the greatest volume and level of activity for the assets. Changes in fair value on available for sale marketable securities are recognized in income or loss.
Trade receivables
The trade receivables consist of receivables from provisional silver and gold sales from the Bolañitos, El Cubo and El Compas mine. The fair value of receivables arising from concentrate sales contracts that contain provisional pricing mechanisms is determined using the appropriate quoted closing price on the measurement date from the exchange that is the principal active market for the particular metal. As such, these receivables, which meet the definition of an embedded derivative, are classified within Level 2 of the fair value hierarchy.
Deferred share units
The Company has a Deferred Share Unit (“DSU”) plan whereby deferred share units may be granted to independent directors of the Company in lieu of compensation in cash or stock options. The DSUs vest immediately and are redeemable for cash based on the market value of the units at the time of a director’s retirement. The DSUs are classified as Level 1 in the fair value hierarchy. The liability is determined based on a market approach reflecting the closing price of the Company’s common shares at the reporting date. Changes in fair value are recognized in general and administrative salaries, wages and benefits.
Share appreciation rights
As part of the Company’s bonus program, the Company grants share appreciation rights (“SARs”) to its employees in Mexico and Chile. The SARs are subject to vesting conditions and, when exercised, constitute a cash bonus based on the value of the appreciation of the Company’s common shares between the SARS grant date and the exercise date.
The SARs are classified as Level 2 in the fair value hierarchy. The liability is valued using a Black-scholes option pricing model. Changes in fair value are recognized in salaries, wages and benefits.
| ENDEAVOUR SILVER CORP. | MANAGEMENT’S DISCUSSION & ANALYSIS | PAGE36 |
| | |
Financial Instrument Risk Exposure and Risk Management
The Company is exposed in varying degrees to a variety of financial instrument related risks. The Board approves and monitors the risk management process. The types of risk exposure and the way in which such exposure is managed is provided as follows:
Credit Risk
The Company is exposed to credit risk on its bank accounts, investments and accounts receivable. Credit risk exposure on bank accounts and short-term investments is limited through maintaining the Company’s balances with high-credit quality financial institutions, maintaining investment policies, assessing institutional exposure and continual discussion with external advisors. Value added tax receivables are generated on the purchase of supplies and services to produce silver, which are refundable from the Mexican government. Trade receivables are generated on the sale of concentrate inventory to reputable metal traders.
Liquidity Risk
The Company ensures that there is sufficient capital in order to meet short-term business requirements. The Company’s policy is to invest cash at floating rates of interest, while cash reserves are to be maintained in cash equivalents in order to maintain liquidity after taking into account the Company’s holdings of cash equivalents, money market investments, marketable securities and receivables. The Company believes that these sources, operating cash flow and its policies will be sufficient to cover expected short-term cash requirements and commitments.
The Company’s Mexican subsidiaries pay value added tax, IVA, on the purchase and sale of goods and services. The net amount paid is recoverable but is subject to review and assessment by the tax authorities. The Company regularly files the required IVA returns and all supporting documentation with the tax authorities, however, the Company has been advised that certain IVA amounts receivable from the tax authorities are being withheld pending completion of the authorities’ audit of certain of the Company’s third-party suppliers. Under Mexican law the Company has legal rights to those IVA refunds and the results of the third party audits should have no impact on refunds. A smaller portion of IVA refund requests are from time to time improperly denied based on the alleged lack of compliance of certain formal requirements and information returns by the Company’s third-party suppliers. The Company takes necessary legal action on the delayed refunds as well as any improperly denied refunds.
Management believes that delays and denials with respect to IVA refunds for El Cubo and Guanaceví are improper. At December 31, 2018, El Cubo holds $4.9 million (2017 - $10.4 million) and Guanaceví holds $7.0 million (2017 - $8.8 million) in IVA receivables which the Company and its advisors deem to be recoverable from tax authorities. The Company is in regular contact with the tax authorities in respect of its IVA filings and believes that the full amount of its IVA receivables will ultimately be received; however the timing of recovery of these amounts and the nature and extent of any adjustments to the Company’s IVA receivables remains uncertain.
Market Risk
The significant market risk exposures to which the Company is exposed are foreign currency risk, interest rate risk, and commodity price risk.
Foreign Currency Risk – The Company’s operations in Mexico and Canada make it subject to foreign currency fluctuations. Certain of the Company’s operating expenses are incurred in Mexican pesos and Canadian dollars; therefore, the fluctuation of the U.S. dollar in relation to these currencies will consequently have an impact upon the profitability of the Company and may also affect the value of the Company’s assets and the amount of shareholders’ equity. The Company has not entered into any agreements or purchased any instruments to hedge possible currency risks.
Interest Rate Risk – In respect of financial assets, the Company’s policy is to invest cash at floating rates of interest and cash reserves are to be maintained in cash equivalents in order to maintain liquidity. Fluctuations in interest rates impact the value of cash equivalents.
Commodity Price Risk – Gold and silver prices have historically fluctuated significantly and are affected by numerous factors outside of the Company’s control, including, but not limited to, industrial and retail demand, central bank lending, forward sales by producers and speculators, levels of worldwide production, short-term changes in supply and demand because of speculative hedging activities and certain other factors. The Company has not engaged in any hedging activities, other than short-term metal derivative transactions less than 90 days, to reduce its exposure to commodity price risk. At December 31, 2018, there are 274,033 oz of silver and 3,770 oz of gold, which do not have a final settlement price and the estimated revenues have been recognized at current market prices. As at December 31, 2018, with other variables unchanged, a 10% decrease in the market value of silver and gold would result in a reduction of revenue of $0.9 million.
| ENDEAVOUR SILVER CORP. | MANAGEMENT’S DISCUSSION & ANALYSIS | PAGE37 |
| | |
Outstanding Share Data
As of February 22, 2019 the Company had the following securities issued and outstanding:
- 131,416,223 common shares
- 5,987,800 common shares issuable under stock options with a weighted average exercise price of CAD$3.96 per share expiring between May 13, 2019 and August 31, 2023.
The Company considers the items included in the consolidated statement of shareholders’ equity as capital. The Company’s objective when managing capital is to safeguard its ability to continue as a going concern so that it can continue to provide returns for shareholders and benefits for other stakeholders. The Company manages the capital structure and makes adjustments to it in light of changes in economic conditions and the risk characteristics of the underlying assets. In order to maintain or adjust the capital structure, the Company may issue new shares through private placements, prospectus offerings, convertible debentures, asset acquisitions or return capital to shareholders. The Company is not subject to externally imposed capital requirements.
Changes in Accounting Policies and Critical Accounting Estimates
Accounting standards adopted during the year:
Amendments to IFRS 2, Share-based Payment (“IFRS 2”)
On June 20, 2016, the IASB issued amendments to IFRS 2 clarifying how to account for certain types of share-based payment transactions. The amendments provide requirements on the accounting for: the effects of vesting and non-vesting conditions on the measurement of cash-settled share-based payments; share-based transactions with a net settlement feature for withholding tax obligations; and a modification to the terms and conditions of a share-based payment that changes the classification of a transaction from cash-settled to equity settled.
The amendments apply for annual periods beginning on or after January 1, 2018. As a practical simplification, the amendments can be applied prospectively. Retrospective, or early, application is permitted if information is available without the use of hindsight. The Company has adopted the amendments to IFRS 2 in its financial statements for the annual period beginning on January 1, 2018 on a prospective basis with no material impact on the consolidated financial statements.
The Company has Performance Share Units (“PSU”) outstanding with a net settlement feature, which permits cash settlement for withholding tax obligations. The expense for the PSUs has previously been bifurcated with the cash settlement portion of the expense recognized as a liability until settlement, and the remaining expense allocated to Contributed Surplus. Upon adoption of the amendments to IFRS 2, the PSU liability at January 1, 2018 for the liability classified portion of $38,000 was reallocated to Contributed Surplus.
IFRS 9 Financial Instruments (“IFRS 9”)
In November 2009, the IASB issued IFRS 9 as the first step in its project to replace IAS 39,Financial Instruments: Recognition and Measurement. On July 24, 2014 the IASB issued the complete IFRS 9. IFRS 9 retains but simplifies the mixed measurement model and establishes two primary measurement categories for financial assets: amortized cost and fair value. The basis of classification depends on an entity’s business model and the contractual cash flows of the financial asset.
Classification is made at the time the financial asset is initially recognized, namely when the entity becomes a party to the contractual provisions of the instrument.
IFRS 9 amends some of the requirements of IFRS 7,Financial Instruments: Disclosures, including added disclosures about investments in equity instruments measured at fair value in other comprehensive income, and guidance on the measurement of financial liabilities and de-recognition of financial instruments. The mandatory effective date of IFRS 9 is for annual periods beginning on or after January 1, 2018 with early adoption permitted, and must be applied retrospectively with some exemptions permitted.
As a result of the adoption of IFRS 9, the Company has changed its accounting policy for financial instruments retrospectively. The change did not result in a change in carrying value of any of the Company’s financial instruments on transition date. IFRS 9 introduced a single expected credit loss impairment model, which is based on changes in credit quality since initial recognition. The adoption of the expected credit loss impairment model did not have a significant impact on the Company’s financial statements.
| ENDEAVOUR SILVER CORP. | MANAGEMENT’S DISCUSSION & ANALYSIS | PAGE38 |
| | |
The Company’s financial instruments are accounted for as follows under IFRS 9 as compared to the Company’s previous policy in accordance with IAS 39.
| | January 1, 2018 |
| | IAS 39 | IFRS 9 |
| | | |
| Assets | | |
| Cash and cash equivalents | Amortized cost | Amortized cost |
| Restricted cash | Amortized cost | Amortized cost |
| Trade and other receivables (other than derivatives) | Amortized cost | Amortized cost |
| Trade receivables (derivative component) | Fair value through profit or loss | Fair value through profit or loss |
| Marketable securities | Fair value through other comprehensive income | Fair value through profit or loss |
| Liabilities | | |
| Accounts payable and accrued liabilities | Amortized cost | Amortized cost |
| Performance share units and Deferred share units | Fair value through profit or loss | Fair value through profit or loss |
Under IFRS 9, the Company’s equity marketable securities are designated as financial assets at fair value through profit or loss. For equity instruments not held for trading, the Company may make an irrevocable election at initial recognition to recognize changes in fair value through other comprehensive income rather than profit or loss. The Company did not make any such election.
IFRS 9 does not require restatement of comparative periods. Accordingly, the Company has reflected the retrospective impact of the adoption of IFRS 9 due to the change in accounting policy for marketable securities as an adjustment to opening components of equity as at January 1, 2018.
The fair value of marketable securities is $168,000 under both IAS 39 and IFRS 9 as at January 1, 2018, the date of initial application of IFRS 9, and is presented in Other Investments in the consolidated balance sheet. On adoption, the unrealized gain in fair value of $127,000, previously recognized in accumulated other comprehensive income has been reallocated to retained earnings.
As a result of the adoption of IFRS 9, the Company’s accounting policy for financial instruments has been updated as follows:
Financial Instruments
The Company recognizes financial assets and financial liabilities on the date the Company becomes party to the contractual provisions of the instruments. A financial asset is derecognized either when the Company has transferred substantially all the risks and rewards of ownership of the financial assets or when cash flows expire. A financial liability is derecognized when the obligation specified in the contract is discharged, cancelled or expired.
The Company classify and measure financial assets (excluding derivatives) on initial recognition as described below:
- Cash and equivalents and restricted cash include cash and term deposits with original maturities of less than 90 days are classified as financial assets at fair value through profit and loss and are measured at fair value. Unrealized gains and losses related to changes in fair value are reported in income;
- Trade and other receivables are classified as and measured at amortized cost using the effective interest method, less impairment allowance, in any;
- Investments in equity instruments are designated at financial assets through profit or loss and are recorded at fair value on settlement date, net of transaction costs. Subsequent to initial recognition, changes in fair value are recognized in income.
Derivative financial instruments, including embedded derivatives in trade receivables measured at amortized cost, are recorded in the consolidated balance sheets at fair value. Subsequent to initial recognition, changes in estimated fair value at each reporting date are recognized through profit or loss.
A financial liability is derecognized when the obligation specified in the contract is discharged, cancelled or expired. For financial liabilities, IFRS 9 retains most of the IAS 39 requirements and since the Company did not have any financial liabilities designated at fair value through profit or loss, the adoption of IFRS 9 did not impact our accounting policies for financial liabilities.
| ENDEAVOUR SILVER CORP. | MANAGEMENT’S DISCUSSION & ANALYSIS | PAGE39 |
| | |
IFRS 15,Revenue from Contracts with Customers (“IFRS 15”)
On May 28, 2014, the IASB issued IFRS 15. The new standard is effective for annual periods beginning on or after January 1, 2018 with early adoption permitted. IFRS 15 will replace IAS 11Construction Contracts, IAS 18Revenue, IFRIC 13Customer Loyalty Programmes, IFRIC 15Agreements for the Construction of Real Estate, IFRIC 18Transfer of Assets from Customersand SIC 31Revenue – Barter Transactions Involving Advertising Services.
The standard contains a single model that applies to contracts with customers and two approaches to recognizing revenue: at a point in time or over time. The model features a contract-based five-step analysis of transactions to determine whether, how much and when revenue is recognized. New estimates and judgmental thresholds have also been introduced, which may affect the amount and/or timing of revenue recognized.
On April 12, 2016 the IASBissued Clarifications to IFRS 15, Revenue from Contracts with Customers, which is effective at the same time as IFRS 15. The clarifications to IFRS 15 provide additional guidance with respect to the five-step analysis, transition, and the application of the standard to licenses of intellectual property.
The Company adopted IFRS 15 and the clarifications effective January 1, 2018 with no impact on measurement of revenue in the consolidated financial statements.
Dore sales
IFRS 15 requires that revenue from contracts with customers be recognized upon the transfer of control over goods or services to the customer. The recognition of revenue upon transfer of control to the customer is consistent with the Company’s revenue recognition policy as set out in Note 3(j) of the 2017 Annual Financial Statements, as the condition is generally satisfied when title transfers to the customer. As such, upon adoption, this requirement under IFRS 15 resulted in no impact to the Company’s financial statements as the timing of revenue recognition on dore sales is unchanged.
Concentrate sales
The Company assessed all of its existing concentrate sales agreements and determined that there is no change in the timing of revenue recognition, as control transfers to the smelting companies at the time of delivery, consistent with the Company’s current accounting policy as set out in Note 3(j) of the 2017 Annual Financial Statements.
Changes in IFRS not yet adopted:
New standards and amendments have been proposed; however, they do not impact the condensed consolidated interim financial statements and are not anticipated to impact the Company’s annual consolidated financial statements. The nature and impact of each new standard and amendment applicable to the Company are described below:
IFRS 16, Leases (“IFRS 16”)
On January 13, 2016, the IASB published a new standard, IFRS 16,Leases, which replaces IAS 17 –Leases and its associated interpretive guidance. IFRS 16 applies a control model to the identification of leases, distinguishing between a lease and a service contract based on whether the customer controls the asset. For those assets determined to meet the definition of a lease, IFRS 16 introduces significant changes to the accounting by lessees, introducing a single, on-balance sheet accounting model that is similar to the current finance lease accounting, with limited exceptions for short-term leases or leases of low value assets. Lessor accounting remains similar to current accounting practice. The standard is effective for annual periods beginning on or after January 1, 2019, with early application permitted for entities that apply IFRS 15. A lessee can choose to apply IFRS 16 using either a full retrospective or a modified retrospective approach. The Company plans to apply IFRS 16 effective January 1, 2019 and has selected the modified retrospective transition approach which does not require restatement of comparative periods, instead the cumulative impact of applying IFRS 16 will be accounted for as an adjustment to equity at the start of the accounting period in which it is first applied.
Upon the adoption of IFRS 16, the Company anticipates it will record a material balance of lease assets and associated lease liabilities related to leases with a term of 12 months or more on the Consolidated Balance Sheet at January 1, 2019. Due to the recognition of additional lease assets and liabilities, a higher amount of depreciation expense and interest on lease liabilities will be recognized under IFRS 16 as compared to the current standard. Additionally, a reduction in production and/or corporate administration costs is expected. Lastly, the Company expects a reduction in operating cash outflows with a corresponding increase in financing cash outflows under IFRS 16.
| ENDEAVOUR SILVER CORP. | MANAGEMENT’S DISCUSSION & ANALYSIS | PAGE40 |
| | |
The Company is currently quantifying the effect of this standard on our financial statements. During the fourth quarter, management has continued the scoping of contracts across our operations, has continued a detailed review of contracts and commenced quantification of the qualifying leases. At this time, the quantitative estimate of the effects of the new standard range between $2,000 and $3,000. The Company expects the time frame to complete the implementation of the accounting policies, estimates and processes will continue into the early part of 2019.
IFRIC 23, Uncertainty over Income Tax Treatments (“IFRIC 23”)
On June 7, 2017, the IASB issued IFRIC Interpretation 23Uncertainty over Income Tax Treatments. The Interpretation provides guidance on the accounting for current and deferred tax liabilities and assets in circumstances in which there is uncertainty over income tax treatments. The Interpretation is applicable for annual periods beginning on or after January 1, 2019.
The Interpretation requires an entity to contemplate whether uncertain tax treatments should be considered separately, or together as a group, based on which approach provides better predictions of the resolution and if it is probable that the tax authorities will accept the uncertain tax treatment. If estimated that it is not probable that the uncertain tax treatment will be accepted by authorities, the tax uncertainty would be measured based on the most likely amount or expected value, depending on whichever method better predicts the resolution of the uncertainty.
The Company intends to adopt the Interpretation in its financial statements for the annual period beginning on January 1, 2019. The Company does not expect the adoption of the Interpretation to have a material impact on the financial statements.
Critical Accounting Estimates
The preparation of financial statements requires the Company to make estimates that affect the reported amounts of assets and liabilities and disclosure of contingent assets and liabilities at the date of the financial statements and the reported amounts of revenues and expenses during the reporting period. Significant areas requiring the use of management judgment relate to the determination of mineralized reserves, plant and equipment lives, estimating the fair values of financial instruments and derivatives, impairment of non-current assets, reclamation and rehabilitation provisions, recognition of deferred tax assets, and assumptions used in determining the fair value of share-based compensation.
Determination of ore reserves and resources
Judgments about the amount of product that can be economically and legally extracted from the Company’s properties are made by management using a range of geological, technical and economic factors, history of conversion of mineral deposits to proven and probable reserves as well as data regarding quantities, grades, production techniques, recovery rates, production costs, commodity prices and exchange rates. This process may require complex and difficult geological judgments to interpret the data. The Company uses qualified persons (as defined by the Canadian Securities Administrator’s National Instrument 43-101) to compile this data.
Changes in the judgments surrounding proven and probable reserves may impact the carrying value of mineral properties, plant and equipment, reclamation and rehabilitation provisions, recognition of deferred income tax amounts, and depreciation and depletion.
Reserves are estimates of the amount of product that can be economically and legally extracted from the Company’s properties. Estimating the quantity and /or grade of reserves requires the size, shape and depth of ore bodies or fields to be determined by analyzing geological data such as drilling samples. Following this, the quantity of ore that can be extracted in an economical manner is calculated using data regarding the life of mine plans and forecast sales prices (based on current and long-term historical average price trends). Changes in estimates can be the result of actual future production differing from current forecasts of future production, expansion of mineral reserves through exploration activities, differences between estimated and actual costs of mining and differences in the commodity price used in the estimation of mineral reserves
Impairment of Non-Current Assets
Management periodically reviews the carrying value of its mineral properties with internal and external mining related professionals. A decision to abandon, reduce or expand a specific project is based upon many factors including general and specific assessments of reserves, anticipated future prices, anticipated future costs of exploring, developing and operating a producing mine, expiration term and ongoing expense of maintaining leased mineral properties and the period for properties with unproven reserves. However, properties which have not demonstrated suitable mineral concentrations at the conclusion of each phase of an exploration program are re-evaluated to determine if future exploration is warranted and their carrying values are appropriate.
| ENDEAVOUR SILVER CORP. | MANAGEMENT’S DISCUSSION & ANALYSIS | PAGE41 |
| | |
The recoverable amounts of the Company’s CGUs, which include mining properties, plant and equipment and allocated goodwill, if any, are determined on an annual basis and circumstances result in impairment indicators. As at December 31, 2015, the Company determined there were several indicators of potential impairment of its producing mineral properties which included the sustained decline in precious metal prices and updates of the estimated reserves and resources. The recoverable amounts were based on each CGUs future cash flows expected to be derived from the Company’s mining properties and represent each CGUs fair value in use. The cash flows were determined based on the life-of-mine after tax cash flow estimate which incorporate management’s best estimates of future metal prices, production based on estimates of recoverable reserves and resources, exploration potential, future operating costs and non-expansionary capital expenditures.
As a result of the operational challenges during the past two years and a revised mine plan, the Company tested the recoverability of the Guanaceví CGU as at December 31, 2018, determining that no additional impairment was required. For previously impaired CGU’s any modest decrease in any one key assumption in isolation could cause the estimated recoverable amount to be less than or equal to the net carrying value. Other than timing of production based on the revised mine plans and associated increase in per-unit costs, Management’s long- term estimates have not significantly changed from the previous years.
If an area of interest is abandoned or it is determined that its carrying value cannot be supported by future production or sale, the related costs are charged against operations in the period of abandonment or determination that the carrying value exceeds its fair value. The amounts recorded as mineral properties represent costs incurred to date and do not necessarily reflect present or future values.
Achievement of commercial production
Once a mine reaches the operating levels intended by management, deprecation of capitalized costs begins. Significant judgement is required to determine when certain of the Company’s assets reach this level. Management considers several factors including: completion of a reasonable period of commissioning; consistent operating results achieved at a pre-determined level of design capacity and indications exist that his level will continue; mineral recoveries at or near expected levels; and the transfer of operations from development personnel to operational personnel has been completed.
Estimation of the amount and timing of reclamation and rehabilitation costs
Accounting for restoration requires management to make estimates of the future costs the Company will incur to complete the reclamation and rehabilitation work required to comply with existing laws, regulations and agreements in place at each mining operation and any environmental and social principles the Company is in compliance with. The calculation of the present value of these costs also includes assumptions regarding the timing of reclamation and rehabilitation work, applicable risk-free interest rate for discounting those future cash flows, inflation and foreign exchange rates and assumptions relating to probabilities of alternative estimates of future cash flows. Actual costs incurred may differ from those amounts estimated. Also, future changes to environmental laws and regulations could increase the extent of reclamation and rehabilitation work required to be performed by the Company. Increase in future costs could materially impact the amounts charged to operations for reclamation and rehabilitation.
Deferred Income Taxes
The Company follows the asset and liability method of accounting for income taxes. Under this method, future tax assets and liabilities are recognized for the future tax consequences attributable to differences between the financial statement carrying amounts of existing assets and liabilities and their respective tax bases, and losses carried forward. Future tax assets and liabilities are measured using substantively enacted or enacted tax rates expected to apply to taxable income in the years in which those temporary differences are expected to be recovered or settled. The effect on future tax assets and liabilities of a change in tax rates is recognized in income in the period that includes the substantive enactment date. Future tax assets are recognized to the extent that they are considered more likely than not to be realized.
| ENDEAVOUR SILVER CORP. | MANAGEMENT’S DISCUSSION & ANALYSIS | PAGE42 |
| | |
Judgement is required in determining the recognition and measurement of deferred income tax assets and liabilities on the balance sheet. In the normal course of business, the Company is subject to assessment by taxation authorities in various jurisdictions. These authorities may have different interpretations of tax legislation or tax agreements than those applied by the Company in computing current and deferred income taxes. These different interpretations may alter the timing or amounts of taxable income or deductions.
Final taxes payable and receivable are dependent on many factors, including outcomes of tax litigation and resolution of disputes. The resolution of these uncertainties may result in adjustments to the Company’s tax assets and liabilities.
Management assesses the likelihood and timing of taxable earnings in future periods in recognizing deferred income tax assets. Estimates of future taxable income is based on forecasted cash flows using life of mine projections and the application of existing tax laws in each jurisdiction.
To the extent that future cash flows and taxable income differ significantly from estimates, the ability of the Company to realize the net deferred income tax assets recorded at the balance sheet date could be impacted. In addition, future changes to tax laws could limit the ability of the Company to obtain tax deductions in future periods from deferred income tax assets.
Inventory
In valuing inventories at the lower of cost and net realizable value, the Company makes estimates in determining the net realizable price and in quantifying the contained metal in finished goods and work in progress.
Share-based Compensation
The Company has a stock option plan and records all share-based compensation for options using the fair value method. The fair value of each option award is estimated on the date of the grant using the Black-Scholes option pricing model, with expected volatility based on historical volatility of the Endeavour common shares. The Company uses historical data to estimate the term of the option and the risk free rate for the expected term of the option is based on the Government of Canada yield curve in effect at the time of the grant.
As part of the Company’s bonus program, the Company grants share appreciation rights (“SARs”) to its employees in Mexico and Chile. The SARs are subject to vesting conditions and, when vested, constitute a cash bonus based on the value of the appreciation of the Company’s common shares between the SARs grant date and vesting. The fair value of each SAR award is estimated on the grant date using the Black-Scholes option pricing model, with expected volatility based on historical volatility of the Endeavour common shares. The Company uses historical data to estimate the term of the option and the risk free rate for the expected term of the option is based on the Government of Canada yield curve in effect at the time of the grant.
The Company has a Performance Share Unit (“PSU”) plan whereby performance share units may be granted to employees of the Company. Once performance conditions (as determined by the board of directors of the Company) for a grant of PSUs have been met within the specified performance period, a PSU is then vested and redeemable into one common share for no additional consideration. The Company estimates the probability of attainment of the PSU performance conditions, which may vary for each grant of PSUs in the board of directors’ sole discretion.
Business Combinations
On the acquisition of a business, the acquisition method of accounting is used, whereby the purchase consideration is allocated to the identifiable assets, liabilities and contingent liabilities (identifiable net assets) on the basis of fair value at the date of acquisition. When the cost of acquisition exceeds the fair values attributable to the Company’s share of identifiable net assets, the difference is treated as purchased goodwill, which is not amortized but is reviewed for impairment annually or more frequently where there is an indication of impairment. If the fair value attributable to the Company’s share of the identifiable net assets exceeds the cost of acquisition, the difference is immediately recognized in the income statement. Incremental costs related to acquisitions are expensed as incurred.
Determination of the fair value of assets acquired and liabilities assumed and the resulting goodwill, if any, requires that management make estimates based on the information provided by the acquiree. Changes to the provisional values of assets acquired and liabilities assumed, deferred income taxes and resulting goodwill, if any, will be adjusted when the final measurements are determined (within one year of acquisition date).
| ENDEAVOUR SILVER CORP. | MANAGEMENT’S DISCUSSION & ANALYSIS | PAGE43 |
| | |
When purchase consideration is contingent on future events, the initial cost of the acquisition recorded includes an estimate of the fair value of the contingent amounts expected to be payable in the future. When the fair value of contingent consideration as at the date of acquisition is finalized, before the end of the 12 month measurement period, the adjustment is allocated to the identifiable assets acquired and liabilities assumed. Changes to the estimated fair value of contingent consideration subsequent to the acquisition date are recorded in the consolidated statement of comprehensive income.
Risks and Uncertainties
Besides the risks discussed elsewhere in this MD&A, the following are risks and uncertainties that have affected the Company’s financial statements or future performance or that may affect them in the future. See “Risk Factors” in the Company’s Annual Information Form for other risks affecting the Company generally.
Precious and Base Metal Price Fluctuations
The profitability of the precious metals operations in which the Company has an interest is significantly affected by changes in the market prices of precious metals. Prices for precious metals fluctuate on a daily basis, have historically been subject to wide fluctuations and are affected by numerous factors beyond the control of the Company such as the level of interest rates, the rate of inflation, central bank transactions, world supply of the precious metals, foreign currency exchange rates, international investments, monetary systems, speculative activities, international economic conditions and political developments. The exact effect of these factors cannot be accurately predicted, but the combination of these factors may result in the Company not receiving adequate returns on invested capital or the investments retaining their respective values. Declining market prices for these metals could materially adversely affect the Company’s operations and profitability.
Fluctuations in the price of consumed commodities
Prices and availability of commodities consumed or used in connection with exploration, development and mining, such as natural gas, diesel, oil, electricity, cyanide and other re-agents fluctuate affecting the costs of production at the Company’s operations. These fluctuations can be unpredictable, can occur over short periods of time and may have a materially adverse impact on the Company’s operating costs or the timing and costs of various projects. The Company’s general policy is not to hedge its exposure to changes in prices of the commodities used in its business.
Foreign Exchange Rate Fluctuations
Operations in Mexico, Chile and Canada are subject to foreign currency exchange fluctuations. The Company raises its funds through equity issuances which are generally priced in Canadian dollars or U.S. dollars, and the majority of the exploration costs of the Company are denominated in U.S. dollars, Chilean pesos and Mexican pesos. The Company may suffer losses due to adverse foreign currency fluctuations.
Operating Hazards and Risks
Mining operations generally involve a high degree of risk, which even a combination of experience, knowledge and careful evaluation may not be able to overcome. Operations in which the Company has a direct or indirect interest will be subject to all the hazards and risks normally incidental to exploration, development and production of precious and base metals, any of which could result in work stoppages, delayed production and resultant losses, increased production costs, asset write downs, damage to or destruction of mines and other producing facilities, damage to life and property, environmental damage and possible legal liability for any or all damages. The Company may become subject to liability for pollution, cave-ins or hazards against which it cannot insure or against which it may elect not to insure. Any compensation for such liabilities may have a material, adverse effect on the Company’s financial position. The Company’s property, business interruption and liability insurance may not provide sufficient coverage for losses related to these or other hazards. Insurance against certain risks, including certain liabilities for environmental pollution, may not be available to us or to other companies within the industry at reasonable terms or at all. In addition, the Company’s insurance coverage may not continue to be available at economically feasible premiums, or at all. Any such event could have a material adverse effect on the Company’s business.
| ENDEAVOUR SILVER CORP. | MANAGEMENT’S DISCUSSION & ANALYSIS | PAGE44 |
| | |
Mining Operations
The capital costs required by the Company’s projects may be significantly higher than anticipated. Capital and operating costs, production and economic returns, and other estimates contained in the Company’s current technical reports, may differ significantly from those provided for in future studies and estimates and from management guidance, and there can be no assurance that the Company’s actual capital and operating costs will not be higher than currently anticipated. In addition, delays to construction and exploration schedules may negatively impact the net present value and internal rates of return of the Company’s mineral properties as set forth in the applicable technical report. Similarly, there can be no assurance that historical rates of production, grades of ore processed, rates of recoveries or mining cash costs will not experience fluctuations or differ significantly from current levels over the course of the mining operations conducted by the Company. In addition, there can be no assurance that the Company will be able to continue to extend the production from its current operations through exploration and drilling programs.
Infrastructure
Mining, processing, development and exploration activities depend, to one degree or another, on adequate infrastructure. Reliable roads, bridges, power sources and water supply are important determinants, which affect capital and operating costs. The lack of availability on acceptable terms or the delay in the availability of any one or more of these items could prevent or delay exploitation or development of the Company’s projects. If adequate infrastructure is not available in a timely manner, there can be no assurance that the exploitation or development of the Company’s projects will be commenced or completed on a timely basis, if at all; the resulting operations will achieve the anticipated production volume, or the construction costs and ongoing operating costs associated with the exploitation and/or development of the Company’s advanced projects will not be higher than anticipated. In addition, unusual or infrequent weather phenomena, sabotage, government or other interference in the maintenance or provision of such infrastructure could adversely affect the Company’s operations and profitability.
Exploration and Development
There is no assurance that the Company’s exploration and development programs and properties will result in the discovery, development or production of a commercially viable ore body or yield new reserves to replace or expand current reserves. The economics of developing silver, gold and other mineral properties are affected by many factors, including capital and operating costs, variations of the tonnage and grade of ore mined, fluctuating mineral markets, and such other factors as government regulations, including regulations relating to royalties, allowable production, importing and exporting of minerals and environmental protection. Depending on the prices of silver, gold or other minerals produced, the Company may determine that it is impractical to commence or continue commercial production.
The marketability of any minerals acquired or discovered may be affected by numerous factors which are beyond the Company’s control and which cannot be accurately foreseen or predicted, such as market fluctuations, conditions for precious and base metals, the proximity and capacity of milling and smelting facilities, and such other factors as government regulations, including regulations relating to royalties, allowable production, importing and exporting minerals and environmental protection. In order to commence exploitation of certain properties presently held under exploration concessions, it is necessary for the Company to apply for an exploitation concession.
There can be no guarantee that such a concession will be granted. Unsuccessful exploration or development programs could have a material adverse impact on the Company’s operations and profitability.
Calculation of Reserves and Resources and Precious Metal Recoveries
There is a degree of uncertainty attributable to the calculation and estimation of reserves and resources and their corresponding metal grades to be mined and recovered. Until reserves or resources are actually mined and processed, the quantities of mineralization and metal grades must be considered as estimates only. Any material change in the quantity of mineral reserves, mineral resources, grades and recoveries may affect the economic viability of the Company’s properties.
Replacement of Reserves and Resources
The Guanaceví, Bolañitos and El Cubo mines are the Company’s current sources of production. Current life-of-mine plans provide for a defined production life for mining at the Company’s mines. The mines have expected lives of one to four years based on current proven and probable reserves and production levels. If the Company’s mineral reserves and resources are not replaced either by the development or discovery of additional reserves and/or extension of the life-of-mine at its current operating mines or through the acquisition or development of an additional producing mine, this could have an adverse impact on the Company’s future cash flows, earnings, financial performance and financial condition, including as a result of requirements to expend funds for reclamation and decommissioning.
| ENDEAVOUR SILVER CORP. | MANAGEMENT’S DISCUSSION & ANALYSIS | PAGE45 |
| | |
Economic Conditions for Mining
A decline in the market price for precious metal commodities has been experienced since 2013. These macro-economic events negatively affected the mining and minerals sectors in general, and the Company’s market capitalization has been significantly reduced over this period. Any sudden or rapid destabilization of global economic conditions could impact the Company's ability to obtain equity or debt financing in the future on terms favorable to the Company or at all. In such an event, the Company's operations and financial condition could be adversely impacted.
The Company assesses on a quarterly basis the carrying values of its mineral properties. Should market conditions and commodity prices worsen and persist in a worsened state for a prolonged period of time, an impairment of the Company’s mineral properties may be required.
Integration of New Acquisitions
The positive effect on the Company’s results arising from past and future acquisitions depends on a variety of factors, including, but not limited to: assimilating the operations of an acquired business or property in a timely and efficient manner including the existing work force, union arrangements and existing contracts; maintaining the Company’s financial and strategic focus while integrating the acquired business or property; implementing uniform standards, controls, procedures and policies at the acquired business, as appropriate; and to the extent that the Company makes an acquisition outside of markets in which it has previously operated, conducting and managing operations in a new operating environment and under a new regulatory regime where it has no direct experience.
Past and future business or property acquisitions could place increased pressure on the Company’s cash flow if such acquisitions involve cash consideration or the assumption of obligations requiring cash payments. The integration of the Company’s existing operations with any acquired business will require significant expenditures of time, attention and funds. Achievement of the benefits expected from consolidation would require the Company to incur significant costs in connection with, among other things, implementing financial and planning systems.
The Company may not be able to integrate the operations of a recently acquired business or restructure the Company’s previously existing business operations without encountering difficulties and delays. In addition, this integration may require significant attention from the Company’s management team, which may detract attention from the Company’s day-to-day operations. Over the short-term, difficulties associated with integration could have a material adverse effect on the Company’s business, operating results, financial condition and the price of the Company’s common shares. In addition, the acquisition of mineral properties may subject the Company to unforeseen liabilities, including environmental liabilities.
Foreign Operations
The Company’s operations are currently conducted through subsidiaries principally in Mexico and secondarily in Chile and, as such, its operations are exposed to various levels of political, economic and other risks and uncertainties which could result in work stoppages, blockades of the Company’s mining operations and appropriation of assets. Some of the Company’s operations are located in areas where Mexican drug cartels operate. These risks and uncertainties vary from region to region and include, but are not limited to, terrorism; hostage taking; local drug gang activities; military repression; expropriation; extreme fluctuations in currency exchange rates; high rates of inflation; labour unrest; the risks of war or civil unrest; renegotiation or nullification of existing concessions, licenses, permits and contracts; illegal mining; changes in taxation policies; restrictions on foreign exchange and repatriation; and changing political conditions arising from changes in government and otherwise, currency controls and governmental regulations that favour or require the awarding of contracts to local contractors or require foreign contractors to employ citizens of, or purchase supplies from, a particular jurisdiction.
Local opposition to mine development projects could arise in Mexico, and such opposition could be violent. There can be no assurance that such local opposition will not arise with respect to the Company’s Mexican operations. If the Company were to experience resistance or unrest in connection with its Mexican operations, it could have a material adverse effect on its operations and profitability. To the extent the Company acquires mineral properties in other jurisdictions; it may be subject to similar and additional risks with respect to its operations in those jurisdictions.
| ENDEAVOUR SILVER CORP. | MANAGEMENT’S DISCUSSION & ANALYSIS | PAGE46 |
| | |
Government Regulation
The Company’s operations, exploration and development activities are subject to extensive foreign federal, state and local laws and regulations governing such matters as environmental protection, management and use of toxic substances and explosives, management of natural resources, health, exploration and development of mines, production and post-closure reclamation, safety and labour, mining law reform, price controls import and export laws, taxation, maintenance of claims, tenure, government royalties and expropriation of property. The activities of the Company require licenses and permits from various governmental authorities. The costs associated with compliance with these laws and regulations are substantial and possible future laws and regulations, changes to existing laws and regulations and more stringent enforcement of current laws and regulations by governmental authorities, could cause additional expenses, capital expenditures, restrictions on or suspensions of the Company’s operations and delays in the development of its properties. Moreover, these laws and regulations may allow governmental authorities and private parties to bring lawsuits based upon damages to property and injury to persons resulting from the environmental, health and safety practices of the Company’s past and current operations, or possibly even those actions of parties from whom the Company acquired its mines or properties, and could lead to the imposition of substantial fines, penalties or other civil or criminal sanctions. The Company retains competent and well trained individuals and consultants in jurisdictions in which it does business, however, even with the application of considerable skill the Company may inadvertently fail to comply with certain laws. Such events can lead to financial restatements, fines, penalties, and other material negative impacts on the Company.
Mexican Tax Assessments
As disclosed under “Contingencies”, one subsidiary of the Company in Mexico has received a tax assessment from Mexican fiscal authorities. The Company filed an appeal against the June 2016 tax assessment on the basis certain items rejected by the courts were included in the new tax assessment, while a number of deficiencies exist within the assessment. If the Company is unsuccessful this could negatively impact the Company’s financial position and create difficulties for the Company in dealing with Mexican fiscal authorities in the future.
Included in the Company’s consolidated financial statements, are net assets of $595,000, including $42,000 in cash, held by MSCG. Following the Tax Court’s rulings, MSCG is in discussions with the tax authorities with regards to the shortfall of assets within MSCG to settle its estimated tax liability. An alternative settlement option would be to transfer the shares and assets of MSCG to the tax authorities. As of December 31, 2017, the Company recognized an allowance for transferring the shares and assets of MSCG amounting to $595,000. The Company is currently assessing MSCG’s settlement options based on on-going court proceedings and discussion with the tax authorities.
Obtaining and Renewing of Government Permits
In the ordinary course of business, the Company is required to obtain and renew government permits for the operation and expansion of existing operations or for the development, construction and commencement of new operations. Obtaining or renewing the necessary governmental permits is a complex and time-consuming process involving numerous jurisdictions and possibly involving public hearings and costly undertakings on the Company’s part. Any unexpected delays or costs associated with the permitting process could delay the development or impede the operation of a mine, which could adversely impact the Company’s operations and profitability.
Environmental Factors
All phases of the Company’s operations are subject to environmental regulation in the various jurisdictions in which it operates. Environmental legislation is evolving in a manner which will require stricter standards and enforcement, increased fines and penalties for non-compliance, more stringent environmental assessments of proposed projects and a heightened degree of responsibility for companies and their officers, directors and employees. The costs of compliance with changes in government regulations have the potential to reduce the profitability of future operations. Environmental hazards that may have been caused by previous or existing owners or operators may exist on the Company’s mineral properties, but are unknown to the Company at present.
Title to Assets
Although the Company obtains title opinions for material properties in which it has a material interest, there is no guarantee that title to such properties will not be challenged or impugned. If title to the Company’s properties is disputed, it may result in the Company paying substantial costs to settle the dispute or clear title and could result in the loss of the property, which events may affect the economic viability of the Company.
| ENDEAVOUR SILVER CORP. | MANAGEMENT’S DISCUSSION & ANALYSIS | PAGE47 |
| | |
Employee Recruitment and Retention
Recruiting and retaining qualified personnel is critical to the Company’s success. As the Company’s business activity grows, the Company will require additional key financial, administrative and mining personnel as well as additional operations staff. The Company could experience increases in recruiting and training costs and decreases in operating efficiency, productivity and profit margins. If the Company is not able to attract, hire and retain qualified personnel, the efficiency of the operations could be impaired, which could have an adverse impact on the Company’s future cash flows, earnings, financial performance and financial condition.
Assurance on Financial Statements
The Company prepares the financial reports in accordance with accounting policies and methods prescribed by IFRS. In the preparation of financial reports, management may need to rely upon assumptions, make estimates or use their best judgment in determining the financial condition of the Company. Significant accounting policies and practices are described in more detail in the notes to the annual consolidated financial statements for the year ended December 31, 2018. In order to have a reasonable level of assurance that financial transactions are properly authorized, assets are safeguarded against unauthorized or improper use and transactions are properly recorded and reported, the Company has implemented and continues to analyze the internal control systems for financial reporting.
Changes in Climate Conditions
A number of governments have introduced or are moving to introduce climate change legislation and treaties at the international, national, state/provincial and local levels. Regulation relating to emission levels (such as carbon taxes) and energy efficiency is becoming more stringent. If the current regulatory trend continues, this may result in increased costs at some or all of the Company’s operations. In addition, the physical risks of climate change may also have an adverse effect on the Company’s operations. Extreme weather events have the potential to disrupt operations at the Company’s mines and may require the Company to make additional expenditures to mitigate the impact of such events. Extended disruptions to supply lines could result in interruption to production.
Anti-Corruption and Anti-Bribery Laws
The Company’s operations are governed by, and involve interactions with, various levels of government in foreign countries. The Company is required to comply with anti-corruption and anti-bribery laws, including theCorruption of Foreign Public Officials Act(Canada) and theForeign Corrupt Practices Act(US) and similar laws in México. In recent years, there has been a general increase in both the frequency of enforcement and the severity of penalties under such laws, resulting in greater scrutiny and punishment to companies convicted of violating anti-corruption and anti-bribery laws. A company may be found liable for violations by not only its employees, but also by its contractors and third party agents. The Company’s internal procedures and programs may not always be effective in ensuring that it, its employees, contractors or third party agents will comply strictly with all such applicable laws. If the Company becomes subject to an enforcement action or is found to be in violation of such laws, this may have a material adverse effect on the Company’s reputation, result in significant penalties or sanctions, and have a material adverse effect on the Company’s operations.
Compliance with Canada’s Extractive Sector Transparency Measures Act
TheExtractive Sector Transparency Measures Act(Canada) (“ESTMA”) requires public disclosure of certain payments to governments by companies engaged in the commercial development of minerals which are publicly listed in Canada . Mandatory annual reporting is required for extractive companies with respect to payments made to foreign and domestic governments, including aboriginal groups. ESTMA requiresreporting on the payments of any taxes, royalties, fees, production entitlements, bonuses, dividends, infrastructure reporting or structuring payments to avoid reporting. If the Company becomes subject to an enforcement action or is in violation of ESTMA, this may result in significant penalties or sanctions which may also have a material adverse effect on the Company’s reputation.
Claims under U.S. Securities Laws
The enforcement by investors of civil liabilities under the federal securities laws of the United States may be affected adversely by the fact that the Company is incorporated under the laws of British Columbia, Canada, that the independent registered chartered professional accountants who have audited the Company’s financial statements and some or all of the Company’s directors and officers may be residents of Canada or elsewhere, and that all or a substantial portion of the Company’s assets and said persons are located outside the United States. As a result, it may be difficult for holders of the Company’s common shares to effect service of process within the United States upon people who are not residents of the United States or to realize in the United States upon judgments of courts of the United States predicated upon civil liabilities under the federal securities laws of the United States.
| ENDEAVOUR SILVER CORP. | MANAGEMENT’S DISCUSSION & ANALYSIS | PAGE48 |
| | |
Information Systems and Cyber Security
The Company’s operations depend, in part, upon information technology systems. The Company’s information technology systems are subject to disruption, damage or failure from a number of sources, including, but not limited to, hacking, computer viruses, security breaches, natural disasters, power loss, vandalism, theft and defects in design. Any of these and other events could result in information technology systems failures, operational delays, production downtimes, destruction or corruption of data, security breaches or other manipulation or improper use of our data, systems and networks, any of which could have adverse effects on the Company’s reputation, business, results of operations, financial condition and share price.
The Company’s risk and exposure to these matters cannot be fully mitigated because of, among other things, the evolving nature of these threats. As a result, cyber security and the continued development and enhancement of controls, processes and practices designed to protect the Company’s systems, computers, software, data and networks from attack, damage or unauthorized access remain a priority. As cyber threats continue to evolve, the Company may be required to expend additional resources to continue to modify or enhance protective measures or to investigate and remediate any security vulnerabilities.
Controls and Procedures
The Company’s officers and management are responsible for establishing and maintaining disclosure controls and procedures for the Company. Disclosure controls and procedures are designed to provide reasonable assurance that material information required to be disclosed by the Company under securities legislation is recorded, processed, summarized and reported within the applicable time periods and to ensure that required information is gathered and communicated to the Company’s management, including the Chief Executive Officer (CEO) and Chief Financial Officer (CFO) as is appropriate to permit timely decisions regarding public disclosure. There are inherent limitations to the effectiveness of any system of disclosure controls and procedures. Accordingly, even effective disclosure controls and procedures can only provide reasonable assurance of achieving their control objectives.
At the end of the period covered by this MD&A, management, including the CEO and CFO, conducted an evaluation of the effectiveness of the Company’s disclosure controls and procedures pursuant to National Instrument 52-109 “Certification of Disclosure in Issuers Annual and Interim Filings” (“NI 52-109”) and Rule 13a -15(b) of the U.S. Securities Exchange Act of 1934, as amended (the “U.S. Exchange Act”). Based upon that evaluation, the Company’s CEO and CFO have concluded that, as of the end of the period covered by this MD&A, the Company’s disclosure controls and procedures were effective to give reasonable assurance that the information required to be disclosed by the Company in reports that it files or submits is (i) recorded, processed, summarized and reported, within the time periods specified under applicable securities legislation in Canada and in the U.S. Securities and Exchange Commission’s rules and forms, and (ii) accumulated and communicated to management, including its principal executive and principal financial officers, or persons performing similar functions, as appropriate to allow timely decisions regarding required disclosure.
Management’s Report on Internal Controls over Financial Reporting
Management is responsible for establishing and maintaining adequate internal control over financial reporting (as defined in NI 52-109 and in Rules 13a-15(b) of the U.S. Exchange Act). A company’s internal control over financial reporting is a process designed to provide reasonable assurance regarding the reliability of financial reporting and the preparation of financial statements for external purposes in accordance with applicable generally accepted accounting principles.
A company’s internal control over financial reporting includes those policies and procedures that (i) pertain to the maintenance of records that, in reasonable detail, accurately and fairly reflect the transactions and dispositions of the assets of the company; (ii) provide reasonable assurance that transactions are recorded as necessary to permit preparation of financial statements in accordance with generally accepted accounting principles, and that receipts and expenditures of the company are being made only in accordance with authorizations of management and directors of the company; and (iii) provide reasonable assurance regarding prevention or timely detection of unauthorized acquisition, use, or disposition of the company’s assets that could have a material effect on the financial statements. It should be noted that a control system, no matter how well conceived or operated, can only provide reasonable assurance, not absolute assurance, that the objectives of the control system are met. Also, projections of any evaluation of effectiveness to future periods are subject to the risk that controls may become inadequate because of changes in conditions, or that the degree of compliance with policies and procedures may deteriorate.
| ENDEAVOUR SILVER CORP. | MANAGEMENT’S DISCUSSION & ANALYSIS | PAGE49 |
| | |
Management of the Company, including the CEO and CFO, assessed the effectiveness of the Company’s internal control over financial reporting as of December 31, 2018. In making this assessment, management used the criteria set forth in the Internal Control Integrated Framework (2013) issued by the Committee of Sponsoring Organizations of the Treadway Commission (COSO). Based on its assessment, management has concluded that, as of December 31, 2018, the Company’s internal control over financial reporting is effective. Also, management determined that there were no material weaknesses in the Company’s internal control over financial reporting as at December 31, 2018.
Changes in Internal Control over Financial Reporting
Management, including the CEO and CFO, have evaluated the Company’s internal controls over financial reporting to determine whether any changes occurred during the period that have materially affected, or are reasonably likely to materially affect, the Company’s internal controls over financial reporting.
There have been no changes in internal control over financial reporting that occurred during the fiscal year ended December 31, 2018 that have materially affected, or are reasonably likely to materially affect, the Company’s internal control over financial reporting.
| ENDEAVOUR SILVER CORP. | MANAGEMENT’S DISCUSSION & ANALYSIS | PAGE50 |
| | |