INVESTOR PRESENTATION Q 2 U P D A T E M V B – F 1 : S U C C E S S L O V E S S P E E D
2 MVB Financial Corp. (“MVB” or the “Company”) has made forward-looking statements, within the meaning of Section 27A of the Securities Act of 1933, as amended, and Section 21E of the Securities Exchange Act of 1934, as amended, in this presentation that are intended to be covered by the protections provided under the Private Securities Litigation Reform Act of 1995. These forward-looking statements are based on current expectations about the future and subject to risks and uncertainties. Forward-looking statements include, without limitation, information concerning possible or assumed future results of operations of the Company and its subsidiaries. Forward-looking statements can be identified by the use of words such as “may,” “could,” “should,”, “would,” “will,” “plans,” “believes,” “estimates,” “expects,” “anticipates,” “intends,” “continues,” or the negative of those terms or similar expressions. Note that many factors could affect the future financial results of the Company and its subsidiaries, both individually and collectively, and could cause those results to differ materially from those expressed in forward-looking statements. Those factors include but are not limited to: market, economic, operational, liquidity, credit, and interest rate risk; changes in interest rates; inability to successfully execute business plans, including strategies related to investments in financial technology companies; competition; length and severity of the COVID-19 pandemic and its impact on the Company’s business and financial condition; changes in economic, business and political conditions; changes in demand for loan products and deposit flow; operational risks and risk management failures; and government regulation and supervision. Further, we urge you to carefully review and consider the cautionary statements and disclosures, specifically those made in Part I, Item 1A, Risk Factors, of our Annual Report on Form 10-K for the year ended December 31, 2021 (the “2021 Form 10-K”), filed with the Securities and Exchange Commission ("SEC") on March 10, 2022, and from time to time, in our other filings with the SEC. Readers are cautioned not to place undue reliance on these forward-looking statements, which speak only as of the date of the stated report. Except to the extent required by law, we undertake no obligation to update any forward-looking statements in order to reflect any event or circumstance occurring after the date of this report or currently unknown facts or conditions or the occurrence of unanticipated events. All forward-looking statements are qualified in their entirety by this cautionary statement. Accounting standards require the consideration of subsequent events occurring after the balance sheet date for matters that require adjustment to, or disclosure in, the consolidated financial statements. The review period for subsequent events extends up to and including the filing date of a public company’s financial statements when filed with the SEC. Accordingly, the consolidated financial information in this announcement is subject to change. The Company uses certain non-GAAP financial measures, such as tangible book value per share and tangible common equity to tangible assets, to provide information useful to investors in understanding the Company’s operating performance and trends and to facilitate comparisons with the performance of the Company’s peers. The non-GAAP financial measures used may differ from the non-GAAP financial measures other financial institutions use to measure their results of operations. Non-GAAP financial measures should be viewed in addition to, and not as an alternative for, the Company’s reported results prepared in accordance with U.S. GAAP. Reconciliations of these non-GAAP financial measures to the most directly comparable U.S. GAAP financial measures are provided in the Appendix to this Presentation. Forward-Looking Statements

3 GAINING THE WET TRACK ADVANTAGE DRIVING ON A WET TRACK WITH THE CAUTION FLAG OUT

4 “Driving in the wet really isn’t scary if you know how to approach it. It can prove to be a great advantage once you get it down.” - Ayrton Senna “You cannot overtake 15 cars in sunny weather... but you can when it’s raining.”
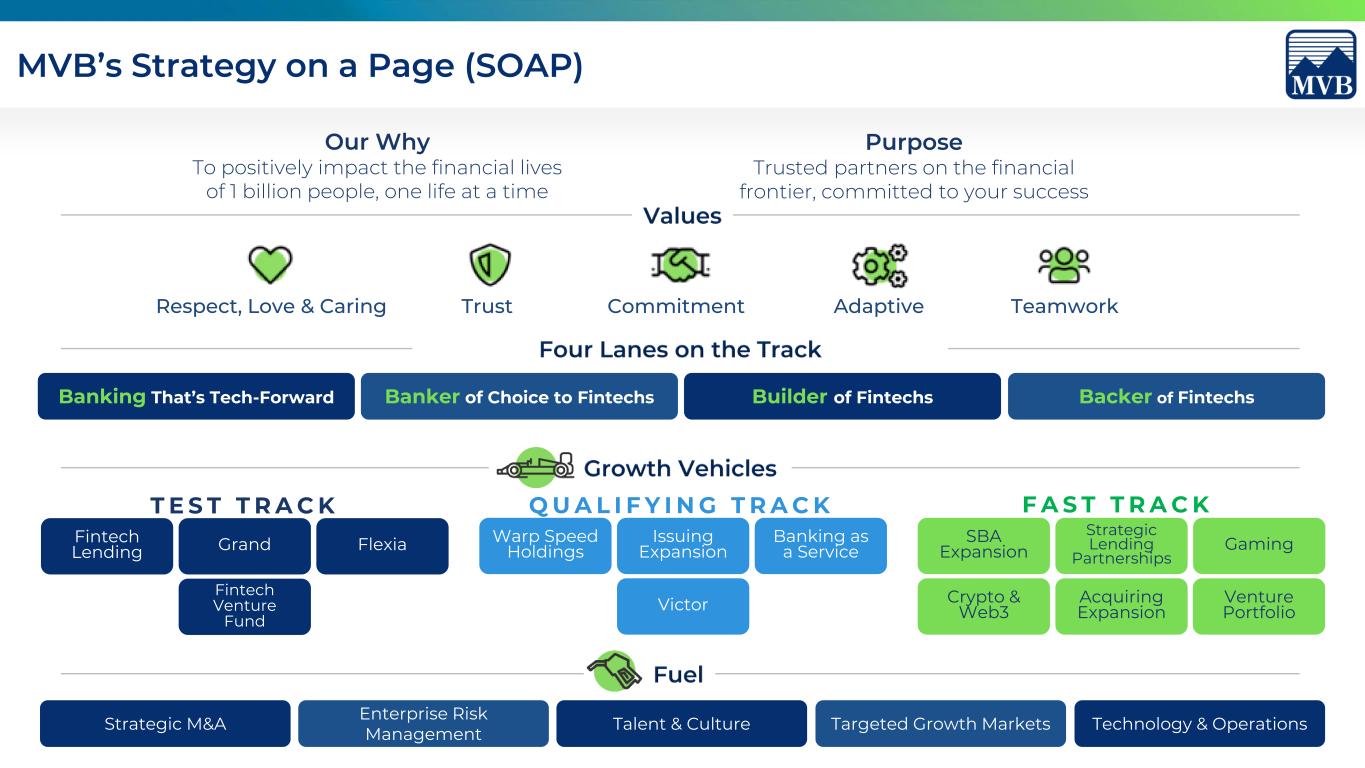
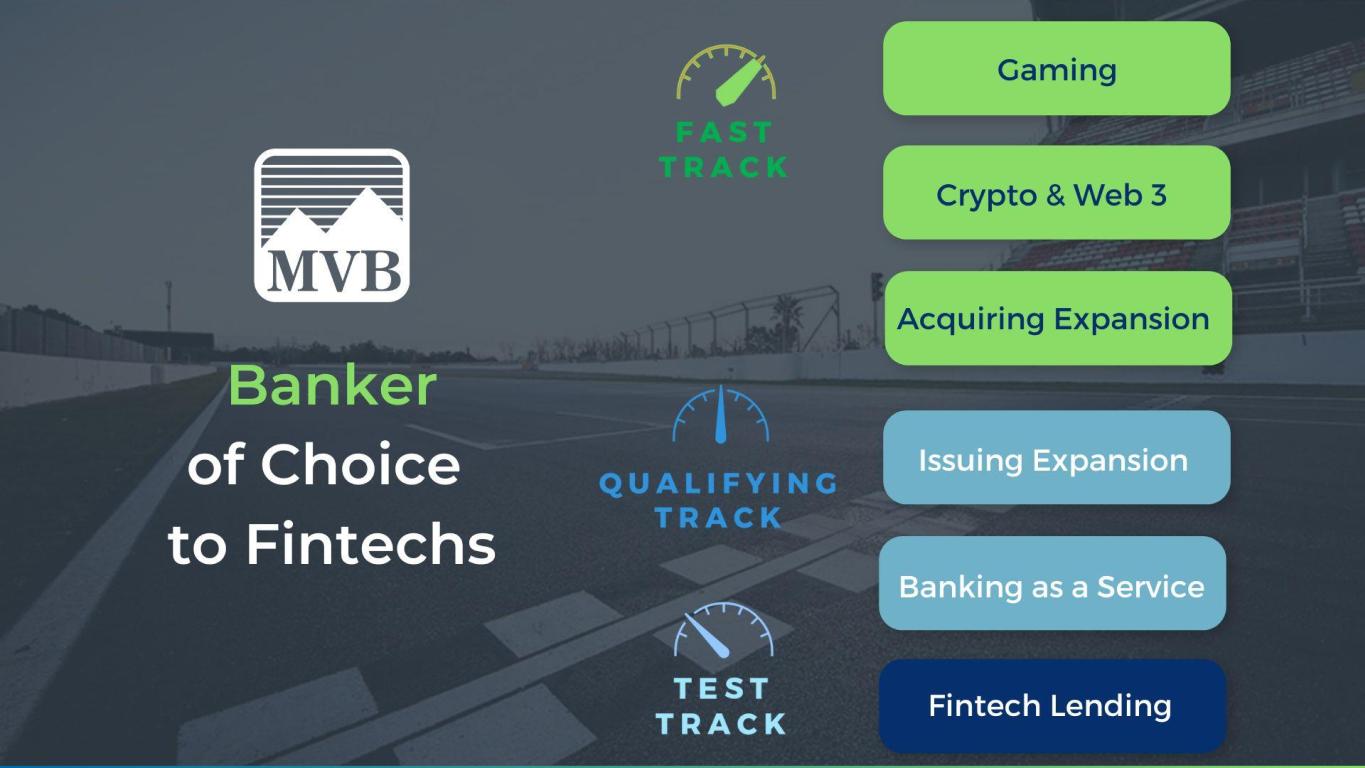
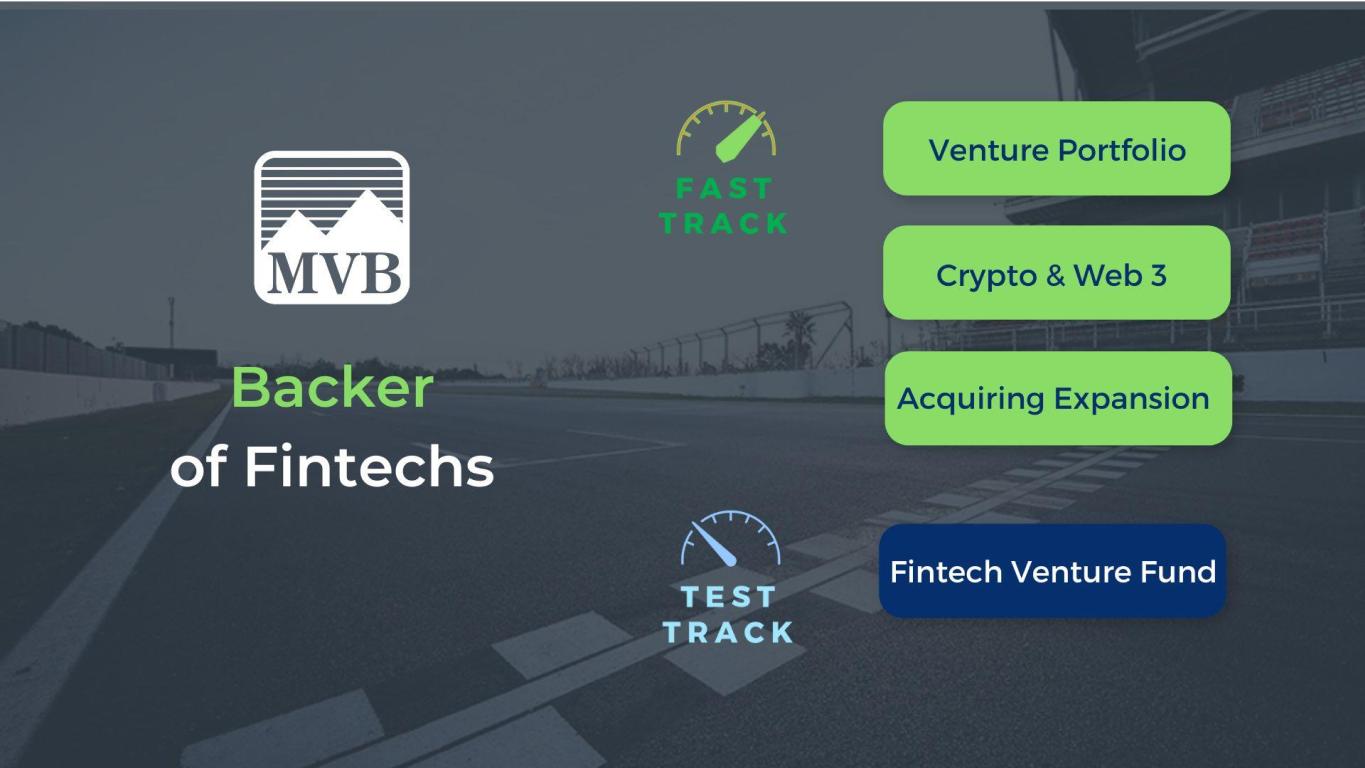
5 Trust Commitment TeamworkRespect, Love & Caring Adaptive Our Why To positively impact the financial lives of 1 billion people, one life at a time Purpose Trusted partners on the financial frontier, committed to your success Fintech Lending Grand Flexia Fintech Venture Fund Strategic M&A Enterprise Risk Management Talent & Culture Targeted Growth Markets Technology & Operations T E S T T R A C K F A S T T R A C K SBA Expansion Strategic Lending Partnerships Gaming Acquiring Expansion Crypto & Web3 Venture Portfolio Warp Speed Holdings Issuing Expansion Banking as a Service Victor Q U A L I F Y I N G T R A C K MVB’s Strategy on a Page (SOAP) Banking That’s Tech-Forward Banker of Choice to Fintechs Builder of Fintechs Backer of Fintechs
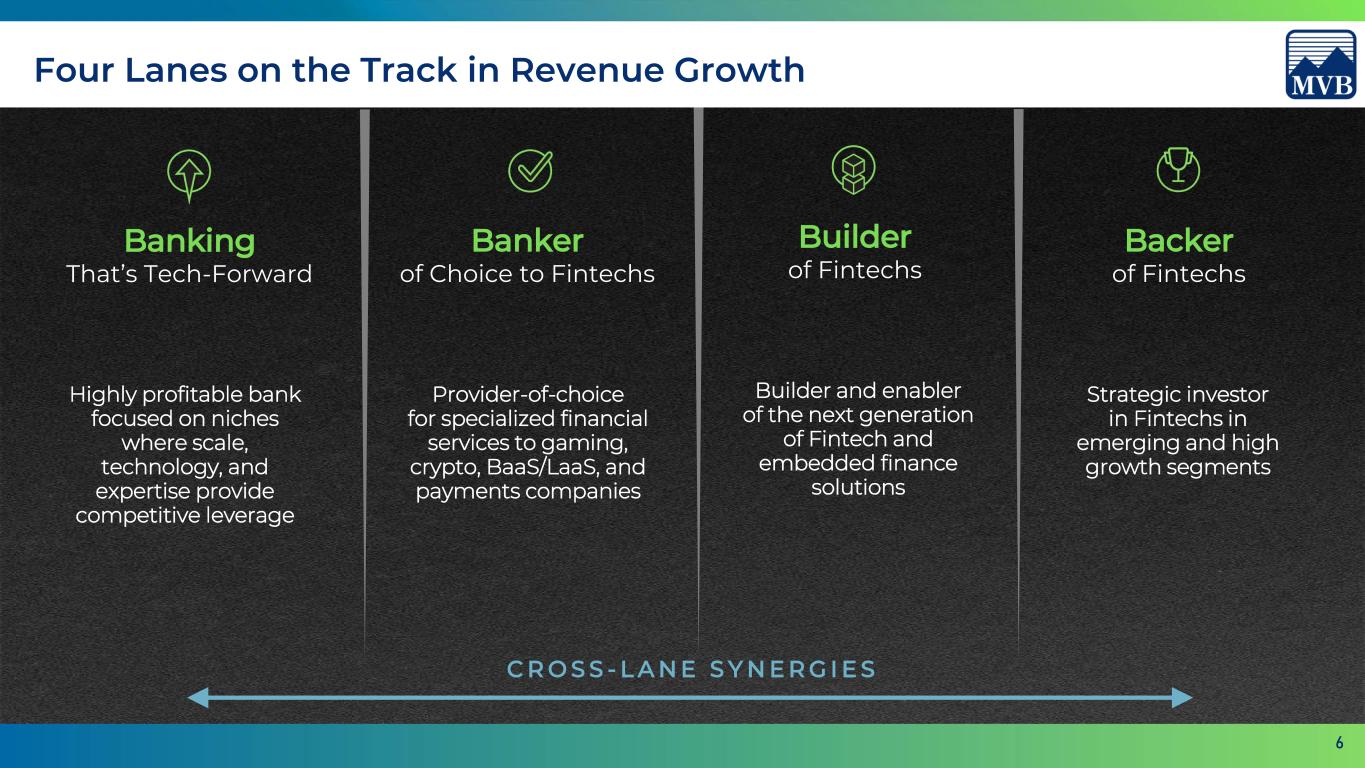
6 Four Lanes on the Track in Revenue Growth Provider-of-choice for specialized financial services to gaming, crypto, BaaS/LaaS, and payments companies Banker of Choice to Fintechs Builder and enabler of the next generation of Fintech and embedded finance solutions Builder of Fintechs Strategic investor in Fintechs in emerging and high growth segments Backer of Fintechs Highly profitable bank focused on niches where scale, technology, and expertise provide competitive leverage Banking That’s Tech-Forward C R O S S - L A N E S Y N E R G I E S
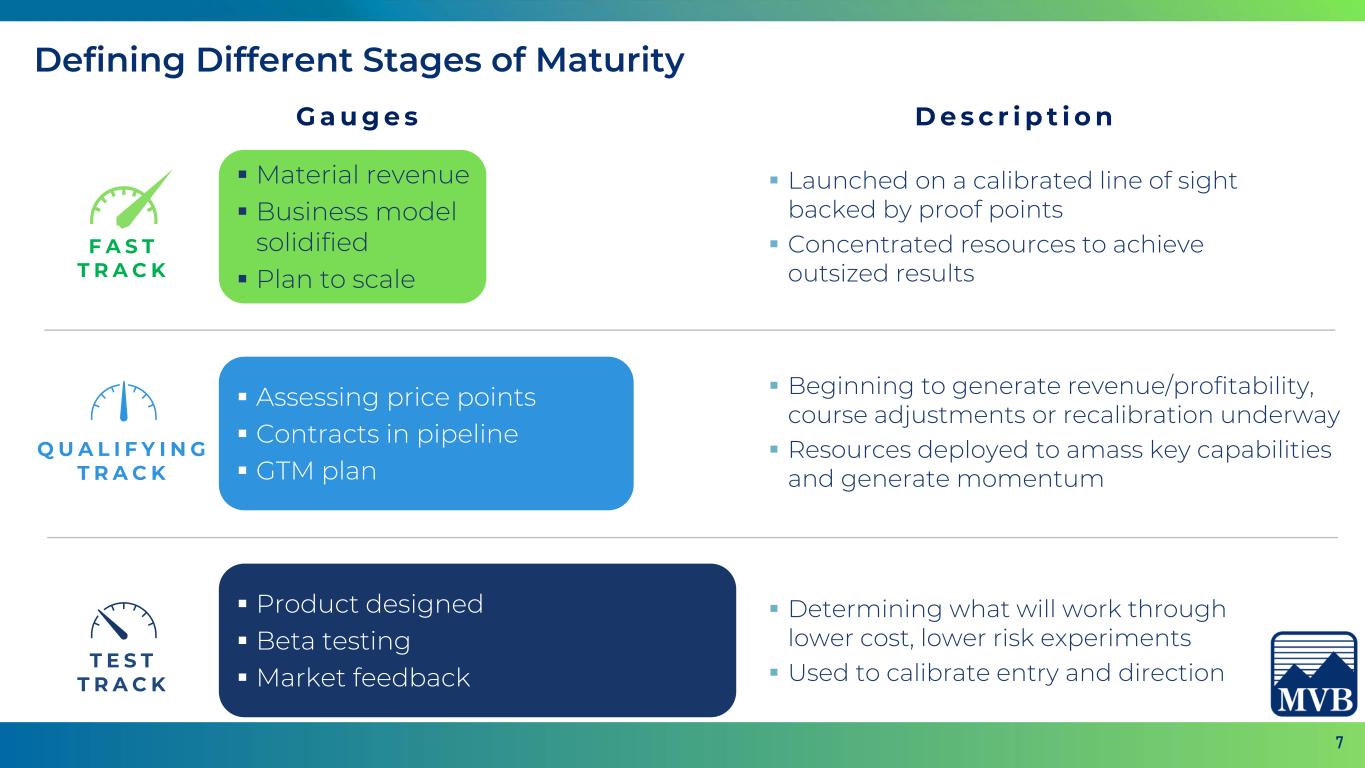
7 Defining Different Stages of Maturity D e s c r i p t i o nG a u g e s ▪ Launched on a calibrated line of sight backed by proof points ▪ Concentrated resources to achieve outsized results ▪ Beginning to generate revenue/profitability, course adjustments or recalibration underway ▪ Resources deployed to amass key capabilities and generate momentum ▪ Determining what will work through lower cost, lower risk experiments ▪ Used to calibrate entry and direction ▪ Product designed ▪ Beta testing ▪ Market feedback ▪ Assessing price points ▪ Contracts in pipeline ▪ GTM plan ▪ Material revenue ▪ Business model solidified ▪ Plan to scale F A S T T R A C K Q U A L I F Y I N G T R A C K T E S T T R A C K
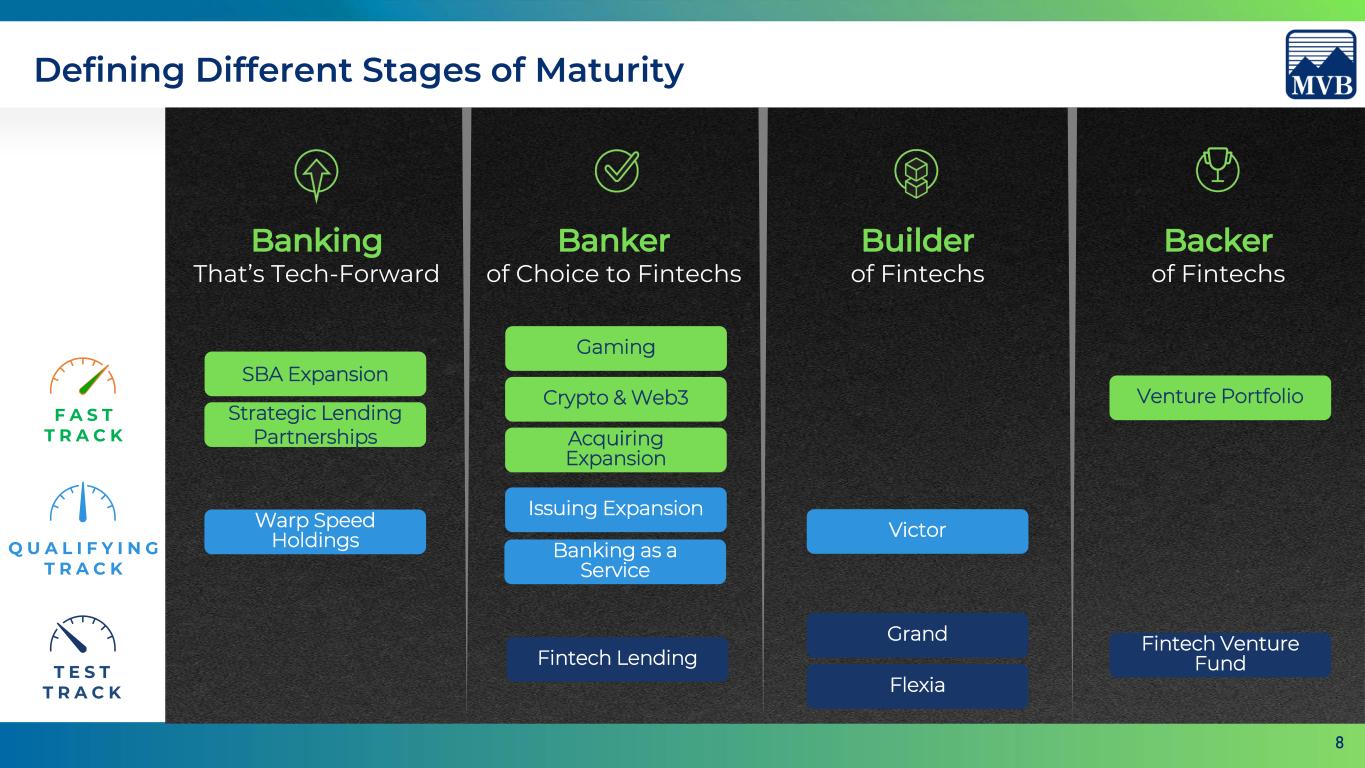
8 SBA Expansion Strategic Lending Partnerships Gaming Crypto & Web3 Acquiring Expansion Venture Portfolio Warp Speed Holdings Issuing Expansion Banking as a Service Victor Fintech Lending Grand Flexia Fintech Venture Fund Banker of Choice to Fintechs Builder of Fintechs Backer of Fintechs T E S T T R A C K Q U A L I F Y I N G T R A C K F A S T T R A C K Defining Different Stages of Maturity Banking That’s Tech-Forward
9
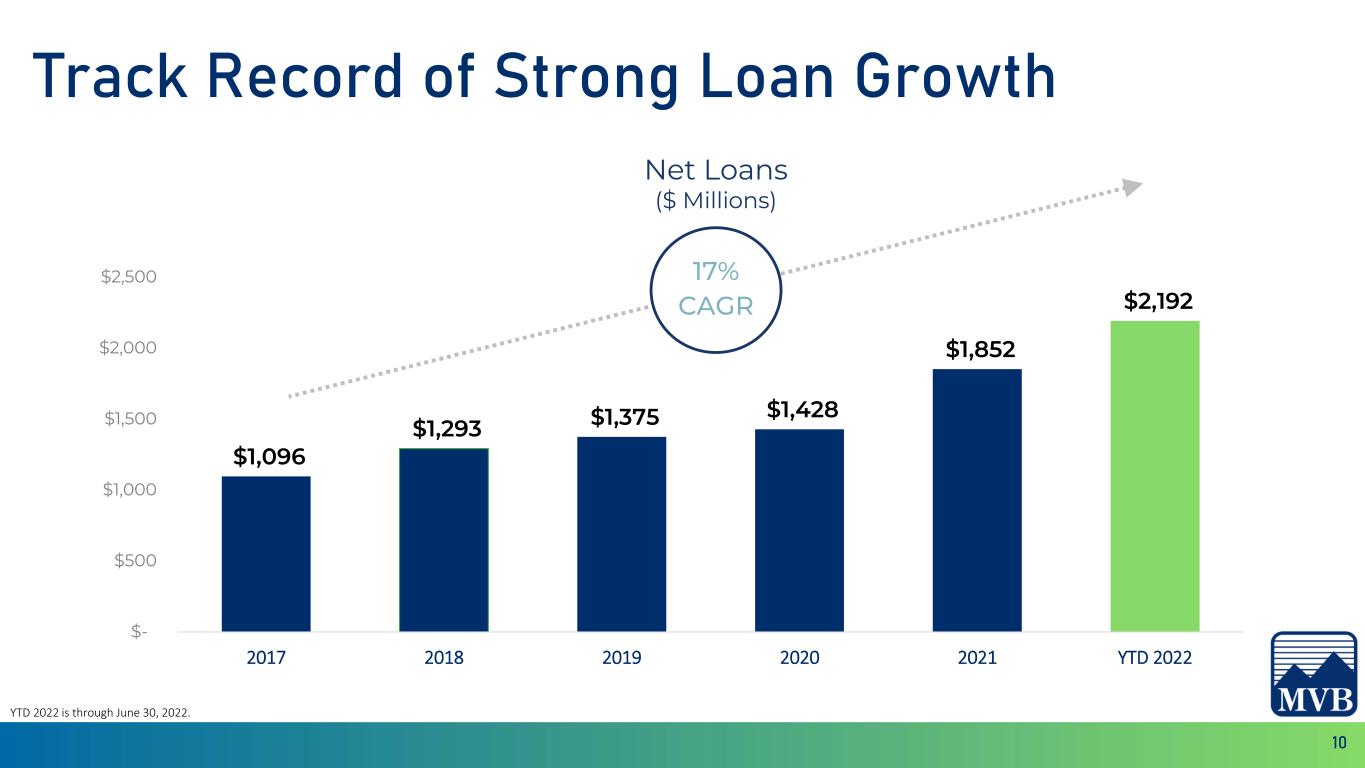
10 Track Record of Strong Loan Growth YTD 2022 is through June 30, 2022. $1,096 $1,293 $1,375 $1,428 $1,852 $2,192 $- $500 $1,000 $1,500 $2,000 $2,500 2017 2018 2019 2020 2021 YTD 2022 Net Loans ($ Millions) 17% CAGR
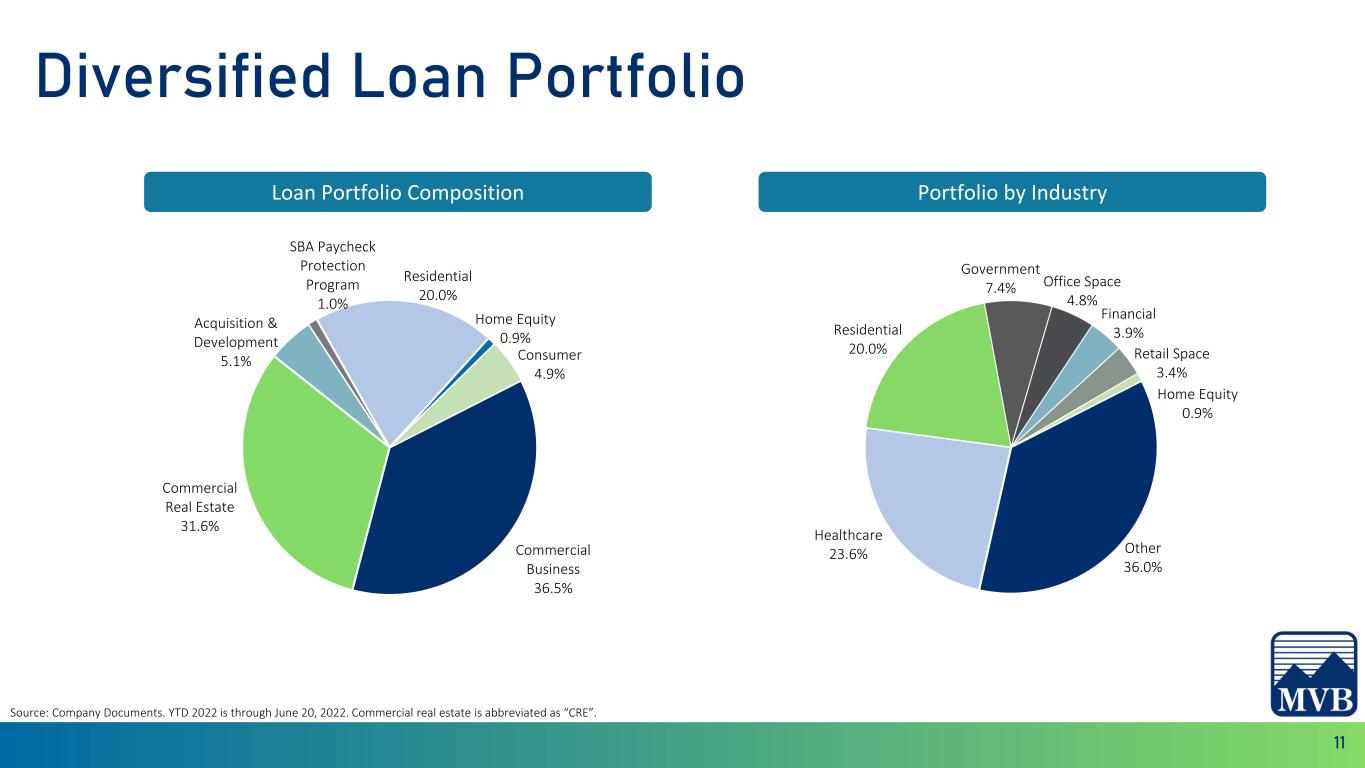
11 Loan Portfolio Composition Portfolio by Industry Diversified Loan Portfolio Source: Company Documents. YTD 2022 is through June 20, 2022. Commercial real estate is abbreviated as “CRE”. Commercial Business 36.5% Commercial Real Estate 31.6% Acquisition & Development 5.1% SBA Paycheck Protection Program 1.0% Residential 20.0% Home Equity 0.9% Consumer 4.9% Other 36.0% Healthcare 23.6% Residential 20.0% Government 7.4% Office Space 4.8% Financial 3.9% Retail Space 3.4% Home Equity 0.9%
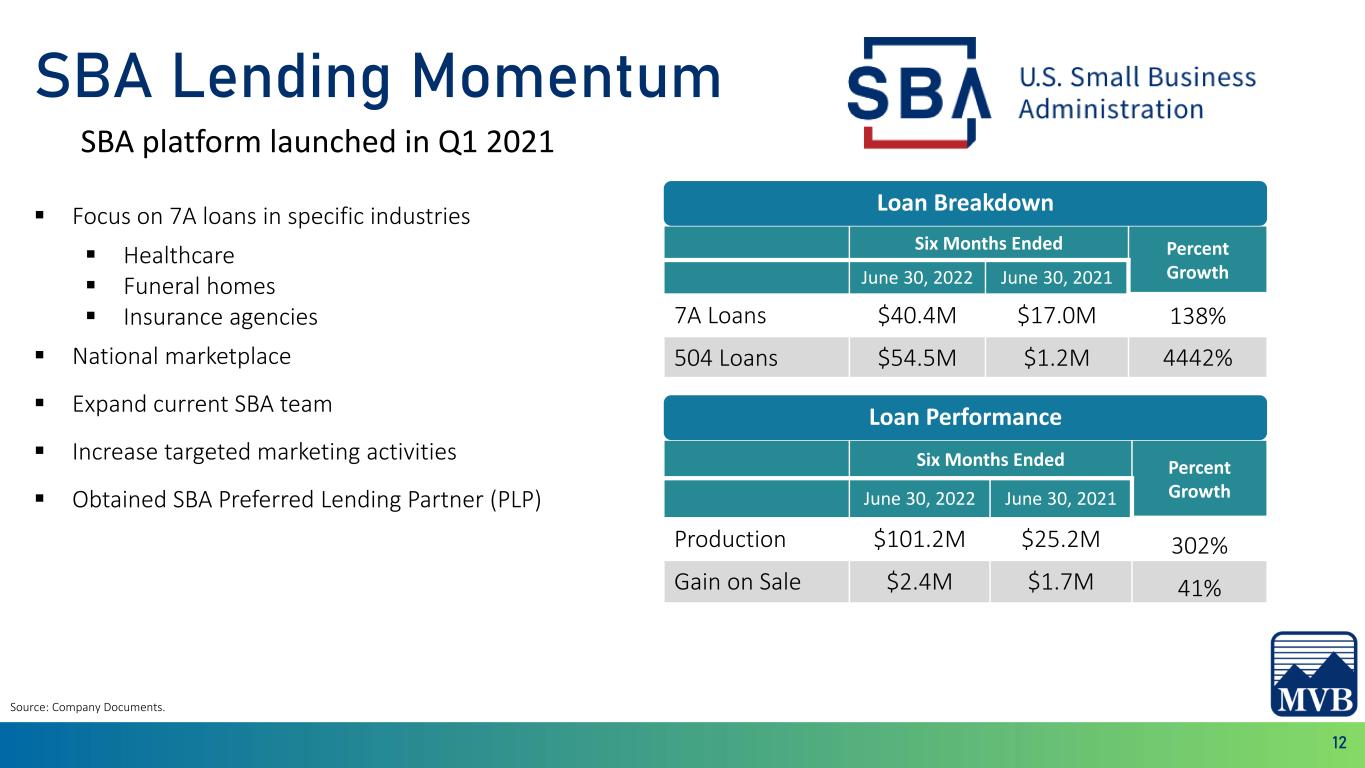
12 SBA Lending Momentum SBA platform launched in Q1 2021 Source: Company Documents. ▪ Focus on 7A loans in specific industries ▪ Healthcare ▪ Funeral homes ▪ Insurance agencies ▪ National marketplace ▪ Expand current SBA team ▪ Increase targeted marketing activities ▪ Obtained SBA Preferred Lending Partner (PLP) Six Months Ended Percent Growth June 30, 2022 June 30, 2021 Production $101.2M $25.2M 302% Gain on Sale $2.4M $1.7M 41% Six Months Ended Percent Growth June 30, 2022 June 30, 2021 7A Loans $40.4M $17.0M 138% 504 Loans $54.5M $1.2M 4442% Loan Breakdown Loan Performance
13
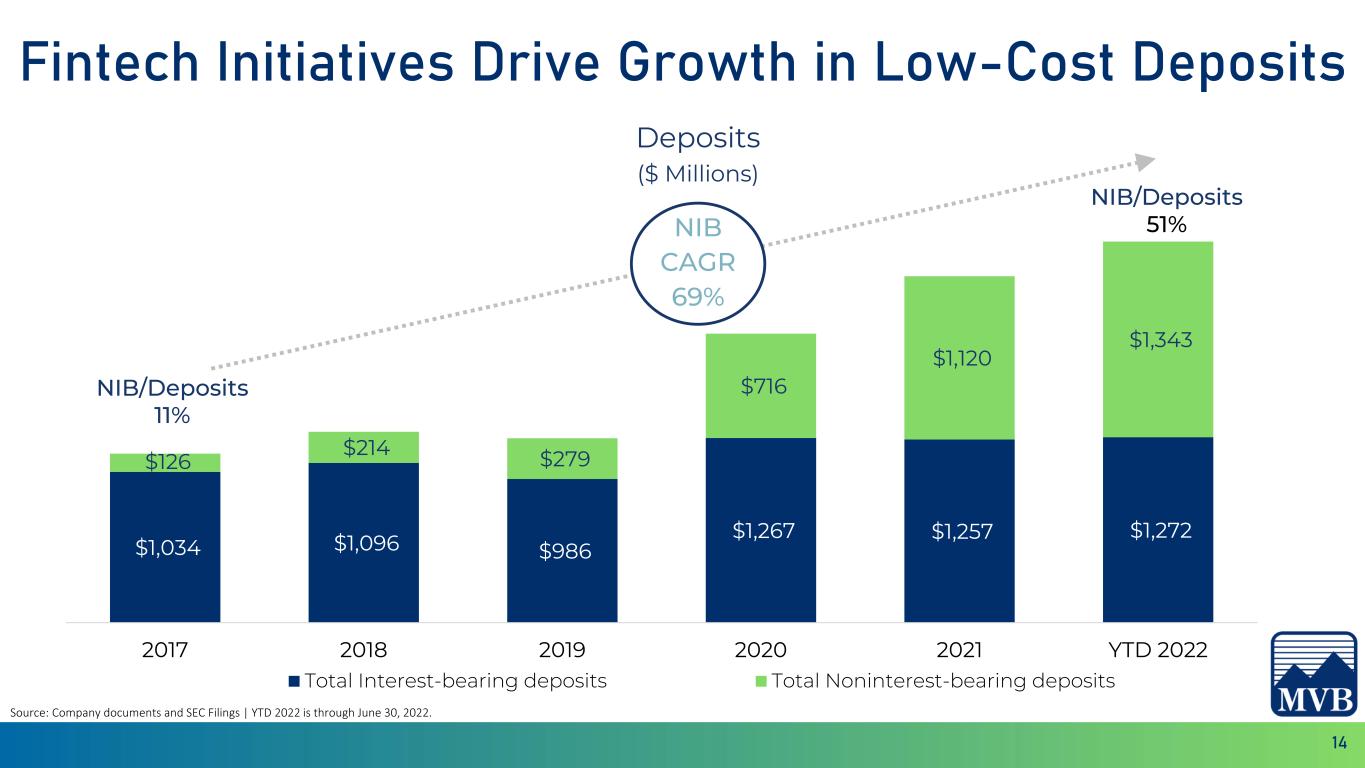
14 Fintech Initiatives Drive Growth in Low-Cost Deposits Source: Company documents and SEC Filings | YTD 2022 is through June 30, 2022. $1,034 $1,096 $986 $1,267 $1,257 $1,272 $126 $214 $279 $716 $1,120 $1,343 2017 2018 2019 2020 2021 YTD 2022 Total Interest-bearing deposits Total Noninterest-bearing deposits NIB/Deposits 11% NIB/Deposits 51% Deposits ($ Millions) NIB CAGR 69%
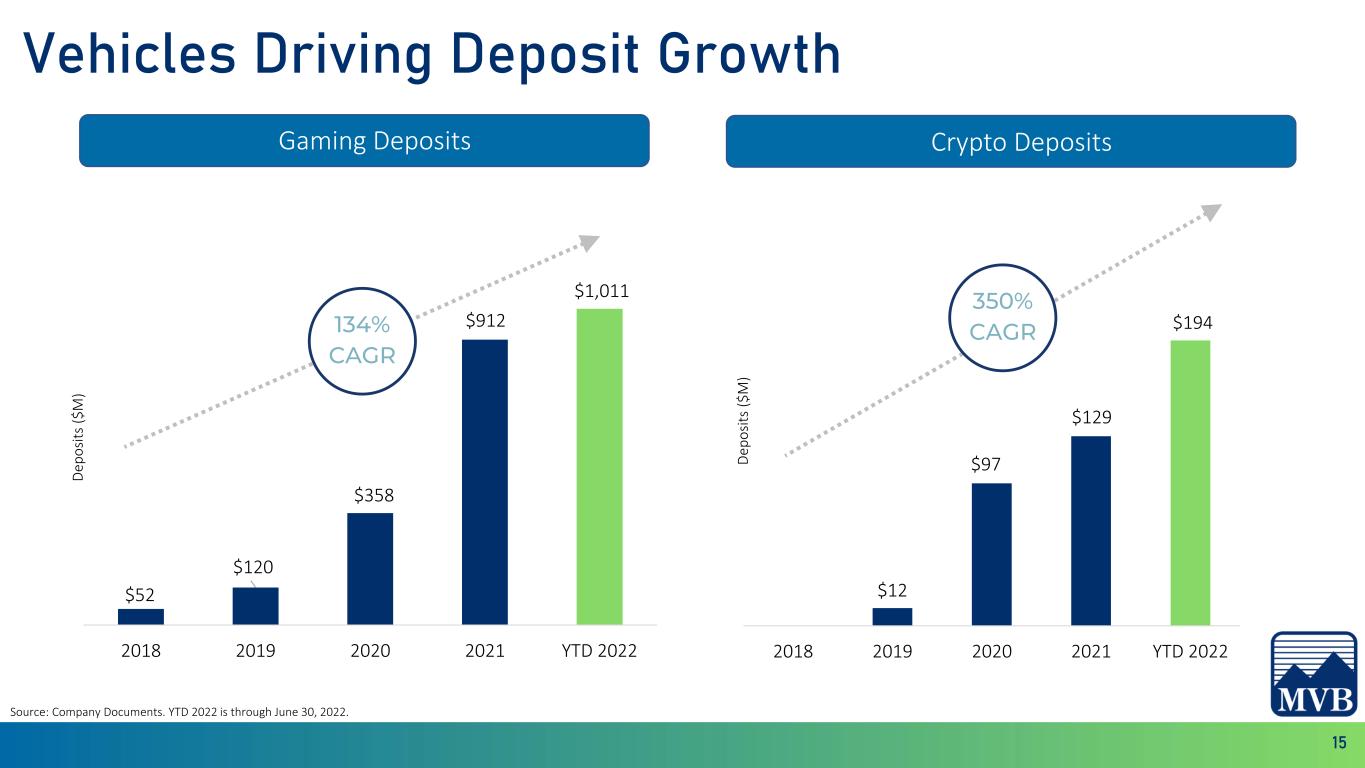
15 Gaming Deposits Crypto Deposits Vehicles Driving Deposit Growth Source: Company Documents. YTD 2022 is through June 30, 2022. $52 $120 $358 $912 $1,011 2018 2019 2020 2021 YTD 2022 D ep o si ts ( $ M ) $12 $97 $129 $194 2018 2019 2020 2021 YTD 2022 D ep o si ts ( $ M ) 134% CAGR 350% CAGR
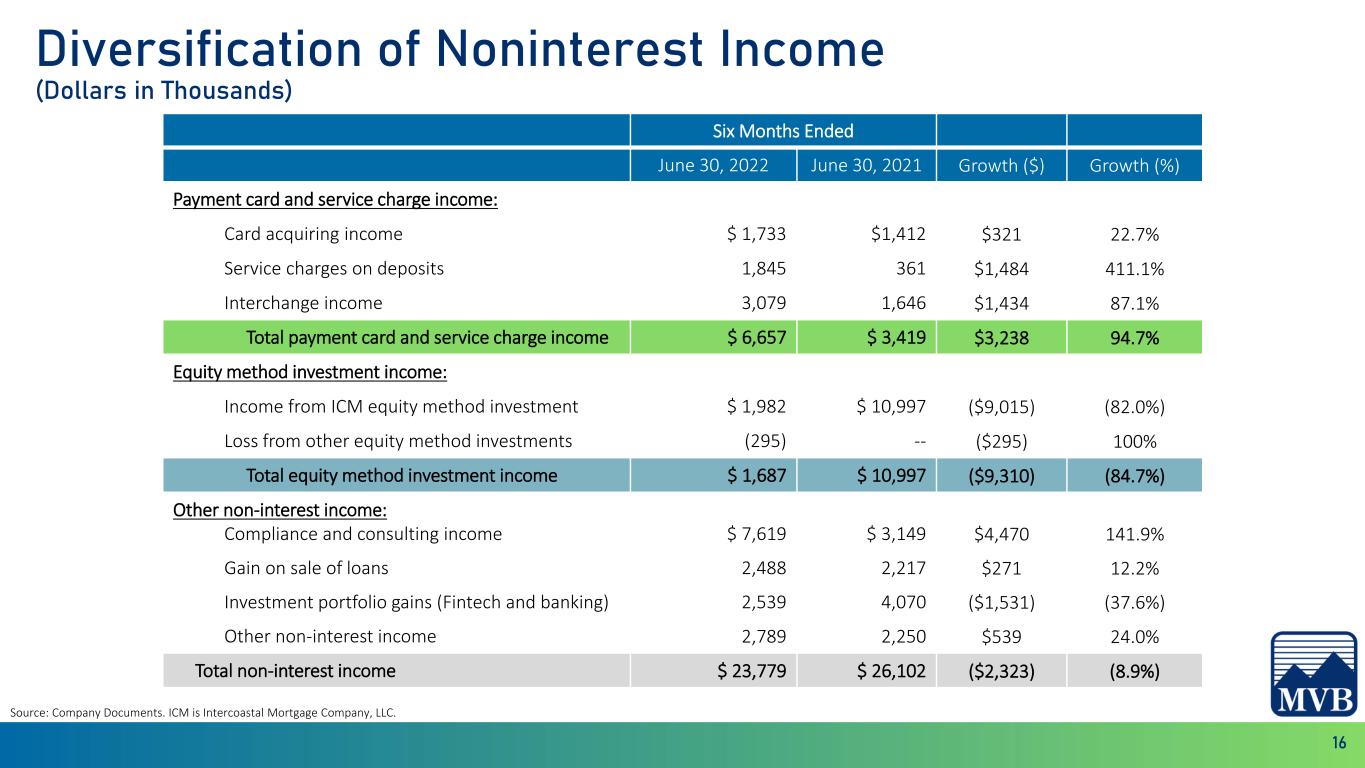
16 Diversification of Noninterest Income (Dollars in Thousands) Source: Company Documents. ICM is Intercoastal Mortgage Company, LLC. Six Months Ended June 30, 2022 June 30, 2021 Growth ($) Growth (%) Payment card and service charge income: Card acquiring income $ 1,733 $1,412 $321 22.7% Service charges on deposits 1,845 361 $1,484 411.1% Interchange income 3,079 1,646 $1,434 87.1% Total payment card and service charge income $ 6,657 $ 3,419 $3,238 94.7% Equity method investment income: Income from ICM equity method investment $ 1,982 $ 10,997 ($9,015) (82.0%) Loss from other equity method investments (295) -- ($295) 100% Total equity method investment income $ 1,687 $ 10,997 ($9,310) (84.7%) Other non-interest income: Compliance and consulting income $ 7,619 $ 3,149 $4,470 141.9% Gain on sale of loans 2,488 2,217 $271 12.2% Investment portfolio gains (Fintech and banking) 2,539 4,070 ($1,531) (37.6%) Other non-interest income 2,789 2,250 $539 24.0% Total non-interest income $ 23,779 $ 26,102 ($2,323) (8.9%)

17 MVB’s Card Acquiring Strategy Source: Company documents Opportunity Scope Path to Success Key Partners The MVB Moat • Top tier risk-adjusted returns from industries we know • Furthering opportunities with Crypto Wallets and Gaming platforms, balanced with low-risk categories • Existing partnerships with top providers worldwide, with a strong pipeline • Partnered with proven acquirers and scaling ISOs with top business models • Expand relationships with card brands by leveraging niche vertical expertise • Driving economies of scale • Fewer partners, deeper relationships • Leader in niche and emerging industries • Ability for faster fund settlement
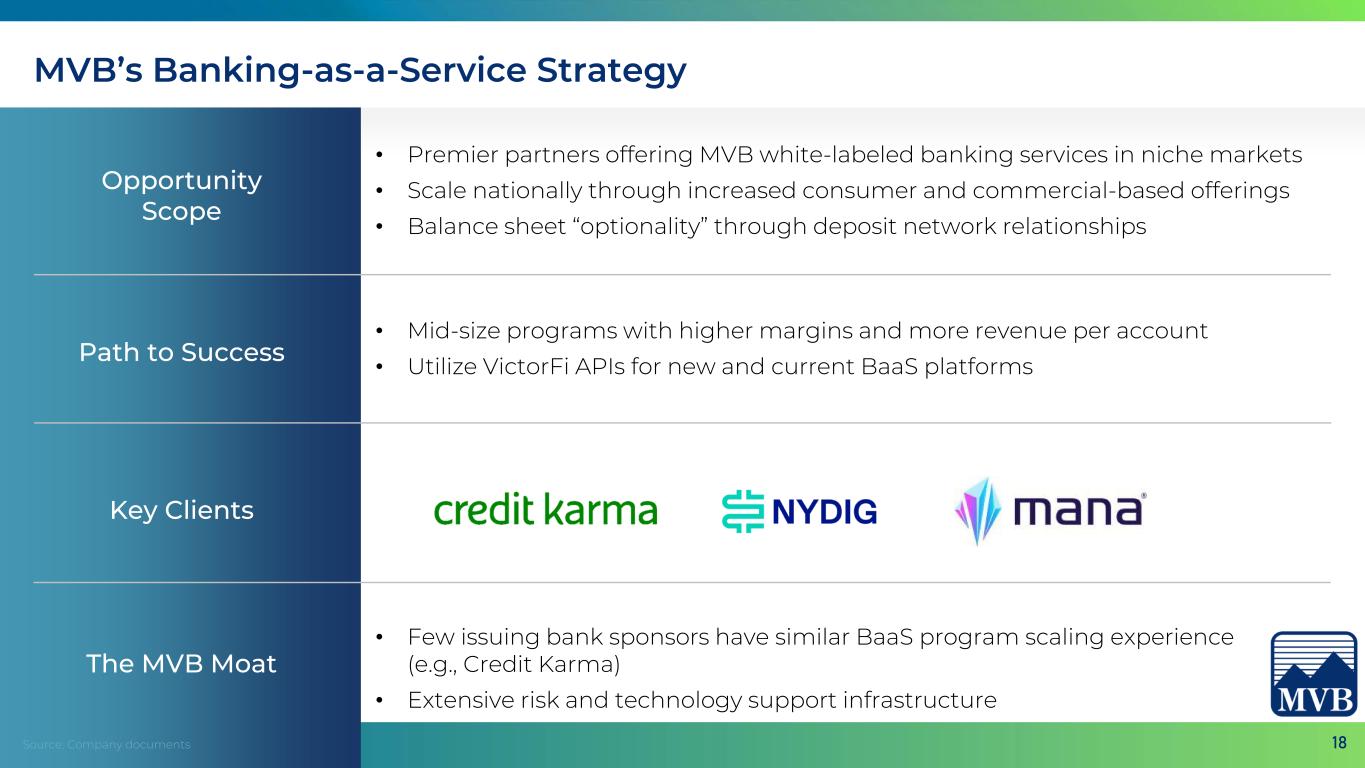
18 MVB’s Banking-as-a-Service Strategy Source: Company documents Opportunity Scope Path to Success Key Clients The MVB Moat • Premier partners offering MVB white-labeled banking services in niche markets • Scale nationally through increased consumer and commercial-based offerings • Balance sheet “optionality” through deposit network relationships • Mid-size programs with higher margins and more revenue per account • Utilize VictorFi APIs for new and current BaaS platforms • Few issuing bank sponsors have similar BaaS program scaling experience (e.g., Credit Karma) • Extensive risk and technology support infrastructure

19
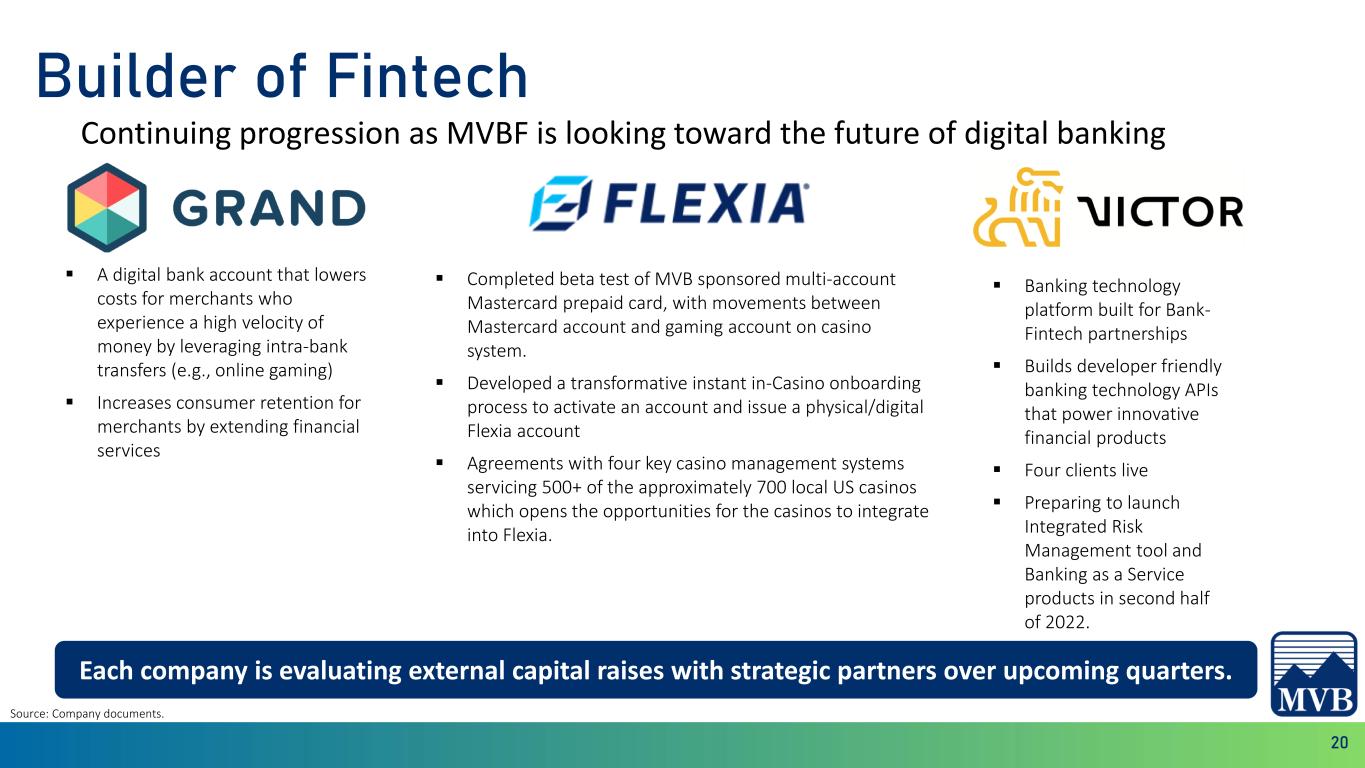
20 Builder of Fintech Continuing progression as MVBF is looking toward the future of digital banking Source: Company documents. ▪ A digital bank account that lowers costs for merchants who experience a high velocity of money by leveraging intra-bank transfers (e.g., online gaming) ▪ Increases consumer retention for merchants by extending financial services ▪ Completed beta test of MVB sponsored multi-account Mastercard prepaid card, with movements between Mastercard account and gaming account on casino system. ▪ Developed a transformative instant in-Casino onboarding process to activate an account and issue a physical/digital Flexia account ▪ Agreements with four key casino management systems servicing 500+ of the approximately 700 local US casinos which opens the opportunities for the casinos to integrate into Flexia. ▪ Banking technology platform built for Bank- Fintech partnerships ▪ Builds developer friendly banking technology APIs that power innovative financial products ▪ Four clients live ▪ Preparing to launch Integrated Risk Management tool and Banking as a Service products in second half of 2022. Each company is evaluating external capital raises with strategic partners over upcoming quarters.
21
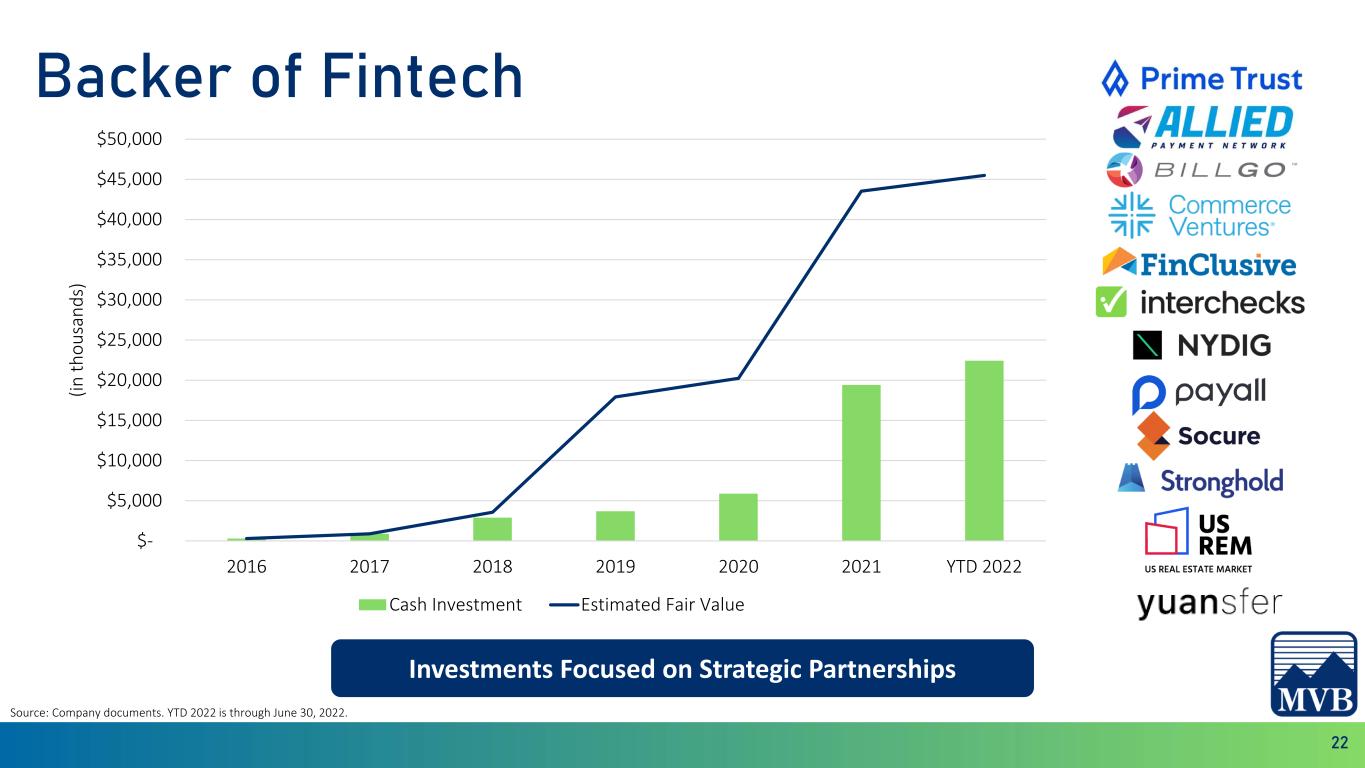
22 $- $5,000 $10,000 $15,000 $20,000 $25,000 $30,000 $35,000 $40,000 $45,000 $50,000 2016 2017 2018 2019 2020 2021 YTD 2022 (i n t h o u sa n d s) Cash Investment Estimated Fair Value Investments Focused on Strategic Partnerships Backer of Fintech Source: Company documents. YTD 2022 is through June 30, 2022.

23 Strength, Safety and Soundness

24 0.37% 0.94% 0.95% 0.87%0.87% 0.94% 0.64% 0.60% -0.40% 0.30% 1.00% 1.70% 2019 2020 2021 YTD 2022 MVBF 2022 Peers Non-Performing Loans / Total Loans 0.07% 0.14% 0.08% 0.10%0.08% 0.08% 0.04% 0.03%0.01% 0.11% 0.21% 0.31% 2019 2020 2021 YTD 2022 MVBF 2022 Peers NCOs / Average Loans Consistent, Top Tier Asset Quality Through Cycles Source: Company documents, SEC filings and S&P Global Market Intelligence. 2022 peers are defined in the 2022 Proxy Statement. Peer data reflects the most recent data publicly available. YTD 2022 is through June 30, 2022. 0.86% 1.88% 1.05% 1.04% 1.41% 0.76% 1.16% 1.07% 0.40% 0.80% 1.20% 1.60% 2.00% 2019 2020 2021 YTD 2022 MVBF 2022 Peers ALLL / Total Loans (Excluding PPP)
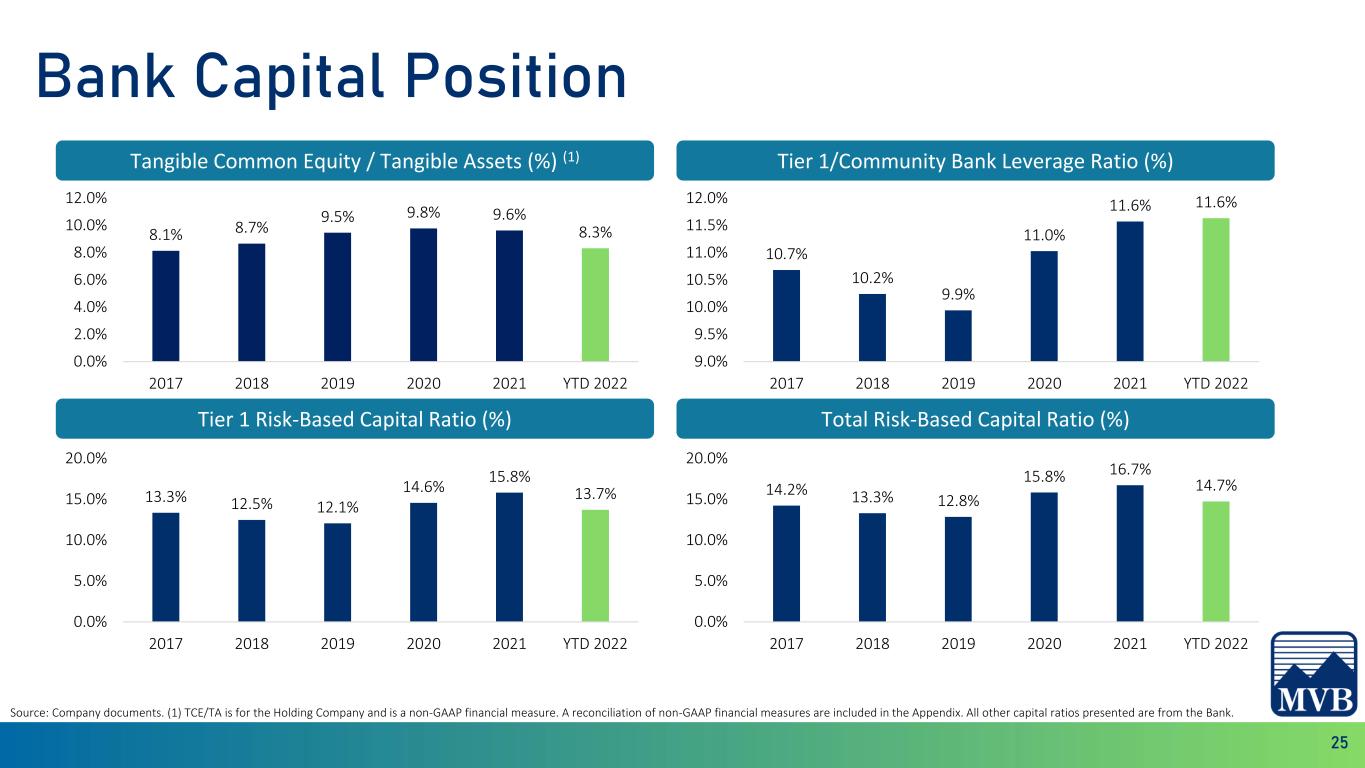
25 8.1% 8.7% 9.5% 9.8% 9.6% 8.3% 0.0% 2.0% 4.0% 6.0% 8.0% 10.0% 12.0% 2017 2018 2019 2020 2021 YTD 2022 Tangible Common Equity / Tangible Assets (%) (1) 10.7% 10.2% 9.9% 11.0% 11.6% 11.6% 9.0% 9.5% 10.0% 10.5% 11.0% 11.5% 12.0% 2017 2018 2019 2020 2021 YTD 2022 Tier 1/Community Bank Leverage Ratio (%) Tier 1 Risk-Based Capital Ratio (%) Total Risk-Based Capital Ratio (%) 13.3% 12.5% 12.1% 14.6% 15.8% 13.7% 0.0% 5.0% 10.0% 15.0% 20.0% 2017 2018 2019 2020 2021 YTD 2022 14.2% 13.3% 12.8% 15.8% 16.7% 14.7% 0.0% 5.0% 10.0% 15.0% 20.0% 2017 2018 2019 2020 2021 YTD 2022 Bank Capital Position Source: Company documents. (1) TCE/TA is for the Holding Company and is a non-GAAP financial measure. A reconciliation of non-GAAP financial measures are included in the Appendix. All other capital ratios presented are from the Bank.

26 Caution Flags – Mitigating Risks Caution Flag Mitigation Asset Quality Risk • Long history of strong asset quality • Proactive portfolio management • Disciplined and staged approach to new areas of lending Compliance/ Regulatory Risk • Investment in team through Chartwell and Paladin acquisitions • Technical expertise and experienced FinTech industry partners • Investing in regulatory technology enhancing compliance monitoring systems Retention of Payment and Fintech Deposits • Extensive diligence for both parties increasing switching costs • Strong client relationship model, connections w/ exec. mgmt • Industry knowledge, insight, and first-mover advantage Startup Execution Risk • Entrepreneurial management team • Capacity to pivot as necessary • Ability to recruit strong talent Fintech Investment Risk • Low initial investment • Working relationship with portfolio companies • Diversified portfolio Geopolitical Risk • Adaptive culture • Willingness to adjust the pace • Flexibility to recognize new opportunities based on risk analysis The best is still in front of us!
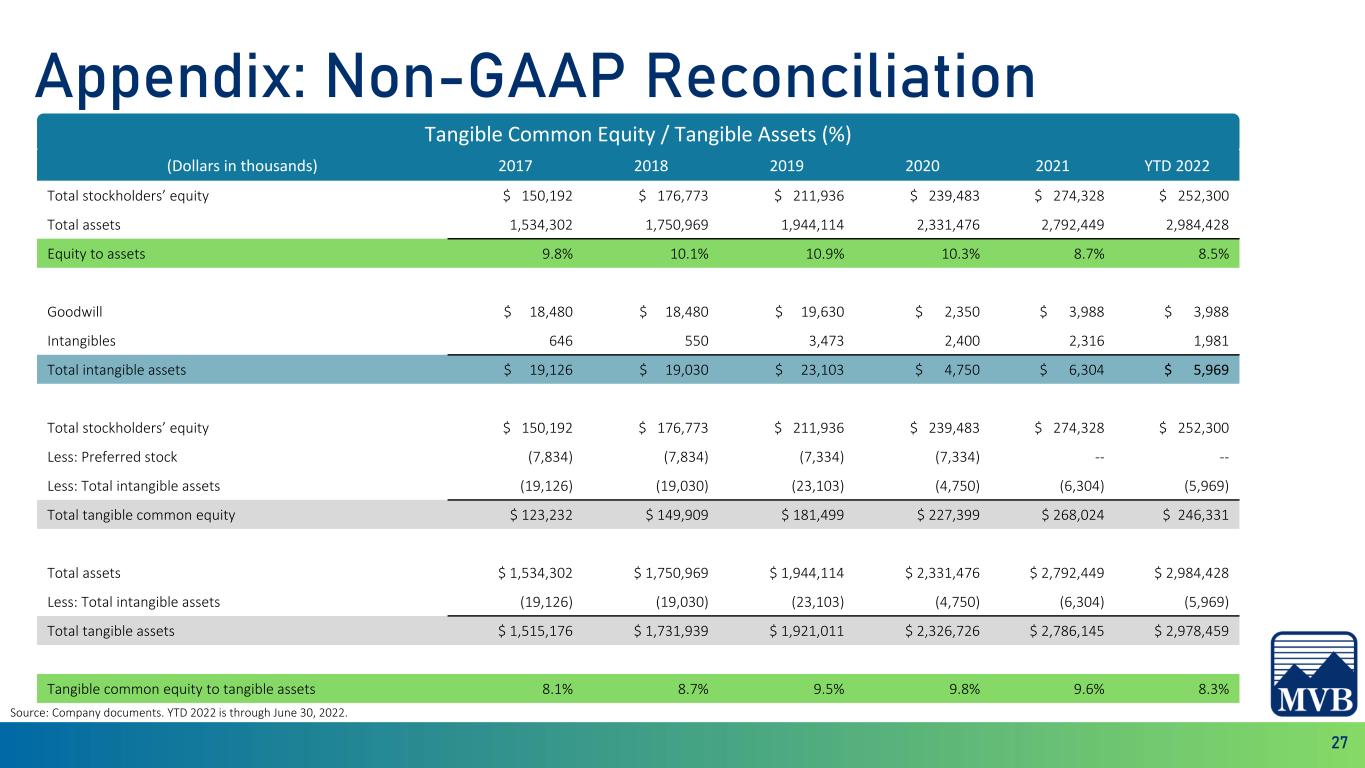
27 Appendix: Non-GAAP Reconciliation Source: Company documents. YTD 2022 is through June 30, 2022. Tangible Common Equity / Tangible Assets (%) (Dollars in thousands) 2017 2018 2019 2020 2021 YTD 2022 Total stockholders’ equity $ 150,192 $ 176,773 $ 211,936 $ 239,483 $ 274,328 $ 252,300 Total assets 1,534,302 1,750,969 1,944,114 2,331,476 2,792,449 2,984,428 Equity to assets 9.8% 10.1% 10.9% 10.3% 8.7% 8.5% Goodwill $ 18,480 $ 18,480 $ 19,630 $ 2,350 $ 3,988 $ 3,988 Intangibles 646 550 3,473 2,400 2,316 1,981 Total intangible assets $ 19,126 $ 19,030 $ 23,103 $ 4,750 $ 6,304 $ 5,969 Total stockholders’ equity $ 150,192 $ 176,773 $ 211,936 $ 239,483 $ 274,328 $ 252,300 Less: Preferred stock (7,834) (7,834) (7,334) (7,334) -- -- Less: Total intangible assets (19,126) (19,030) (23,103) (4,750) (6,304) (5,969) Total tangible common equity $ 123,232 $ 149,909 $ 181,499 $ 227,399 $ 268,024 $ 246,331 Total assets $ 1,534,302 $ 1,750,969 $ 1,944,114 $ 2,331,476 $ 2,792,449 $ 2,984,428 Less: Total intangible assets (19,126) (19,030) (23,103) (4,750) (6,304) (5,969) Total tangible assets $ 1,515,176 $ 1,731,939 $ 1,921,011 $ 2,326,726 $ 2,786,145 $ 2,978,459 Tangible common equity to tangible assets 8.1% 8.7% 9.5% 9.8% 9.6% 8.3%


