INVESTOR PRESENTATION Q 1 2 0 2 3 M V B – F 1 : S U C C E S S L O V E S S P E E D
MVB Financial Corp. (“MVB” or the “Company”) has made forward-looking statements, within the meaning of Section 27A of the Securities Act of 1933, as amended, and Section 21E of the Securities Exchange Act of 1934, as amended, in this presentation that are intended to be covered by the protections provided under the Private Securities Litigation Reform Act of 1995. These forward-looking statements are based on current expectations about the future and subject to risks and uncertainties. Forward-looking statements include, without limitation, information concerning possible or assumed future results of operations of the Company and its subsidiaries. Forward-looking statements can be identified by the use of words such as “may,” “could,” “should,”, “would,” “will,” “plans,” “believes,” “estimates,” “expects,” “anticipates,” “intends,” “continues,” or the negative of those terms or similar expressions. Note that many factors could affect the future financial results of the Company and its subsidiaries, both individually and collectively, and could cause those results to differ materially from those expressed in forward-looking statements. Those factors include but are not limited to: market, economic, operational, liquidity, credit, and interest rate risk; changes in interest rates; inability to successfully execute business plans, including strategies related to investments in financial technology companies; competition; length and severity of the COVID-19 pandemic and its impact on the Company’s business and financial condition; changes in economic, business and political conditions; changes in demand for loan products and deposit flow; operational risks and risk management failures; and government regulation and supervision. Further, we urge you to carefully review and consider the cautionary statements and disclosures, specifically those made in Part I, Item 1A, Risk Factors, of our Annual Report on Form 10-K for the year ended December 31, 2022 (the “2022 Form 10-K”), filed with the Securities and Exchange Commission ("SEC") on March 16, 2023, and from time to time, in our other filings with the SEC. Readers are cautioned not to place undue reliance on these forward-looking statements, which speak only as of the date of the stated report. Except to the extent required by law, we undertake no obligation to update any forward-looking statements in order to reflect any event or circumstance occurring after the date of this report or currently unknown facts or conditions or the occurrence of unanticipated events. All forward-looking statements are qualified in their entirety by this cautionary statement. Accounting standards require the consideration of subsequent events occurring after the balance sheet date for matters that require adjustment to, or disclosure in, the consolidated financial statements. The review period for subsequent events extends up to and including the filing date of a public company’s financial statements when filed with the SEC. Accordingly, the consolidated financial information in this announcement is subject to change. The Company uses certain non-GAAP financial measures, such as tangible book value per share and tangible common equity to tangible assets, to provide information useful to investors in understanding the Company’s operating performance and trends and to facilitate comparisons with the performance of the Company’s peers. The non-GAAP financial measures used may differ from the non-GAAP financial measures other financial institutions use to measure their results of operations. Non-GAAP financial measures should be viewed in addition to, and not as an alternative for, the Company’s reported results prepared in accordance with U.S. GAAP. Reconciliations of these non-GAAP financial measures to the most directly comparable U.S. GAAP financial measures are provided in the Appendix to this Presentation. Forward-Looking Statements

3 Driving on a Wet Track with the Caution Flag Out: Adapting to the Wet Track
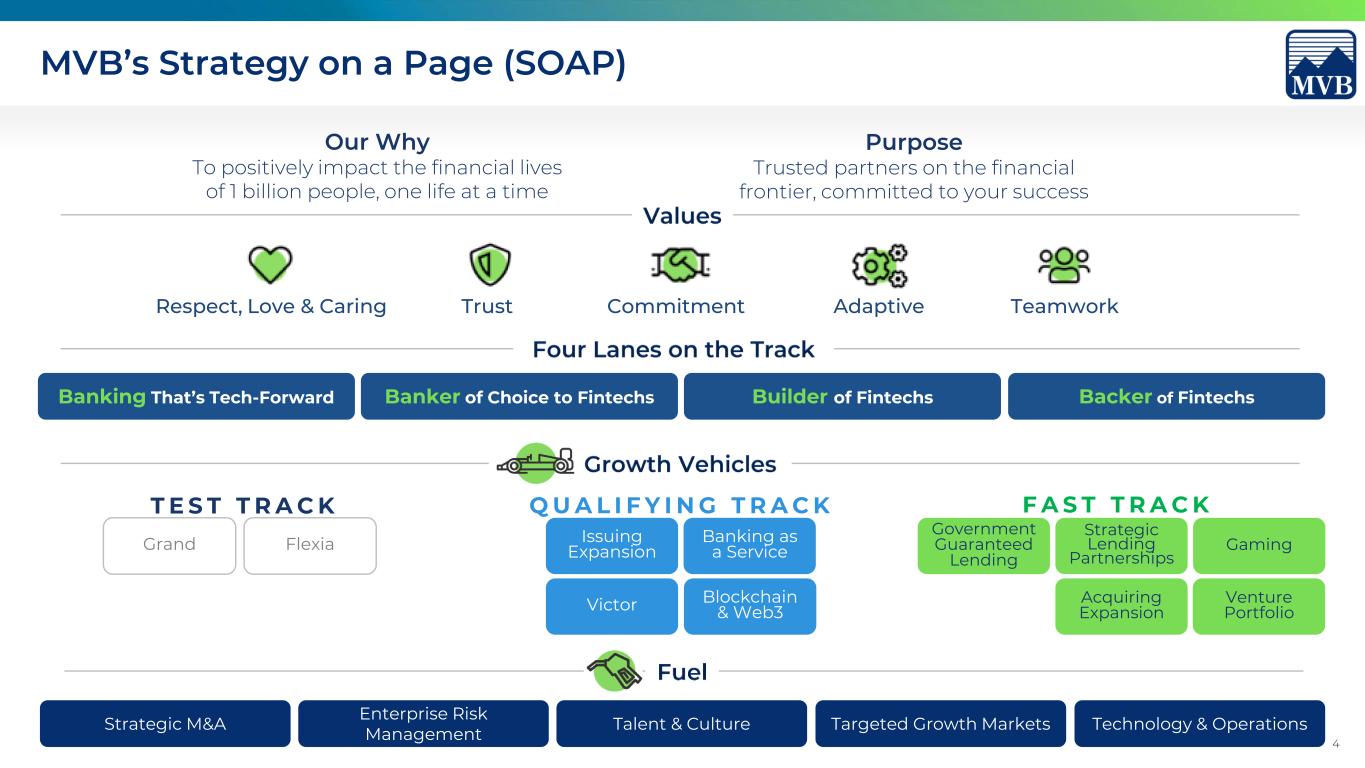
4 Trust Commitment TeamworkRespect, Love & Caring Adaptive Our Why To positively impact the financial lives of 1 billion people, one life at a time Purpose Trusted partners on the financial frontier, committed to your success Grand Flexia Strategic M&A Enterprise Risk Management Talent & Culture Targeted Growth Markets Technology & Operations F A S T T R A C K Government Guaranteed Lending Strategic Lending Partnerships Gaming Acquiring Expansion Blockchain & Web3 Venture Portfolio Issuing Expansion Banking as a Service Banking That’s Tech-Forward Banker of Choice to Fintechs Builder of Fintechs Backer of Fintechs T E S T T R A C K Q U A L I F Y I N G T R A C K Victor MVB’s Strategy on a Page (SOAP)

5Source: Company documents and SEC Filings $986 $1,267 $1,257 $1,339 $2,017 $279 $716 $1,120 $1,232 $1,134 $92 $295 $483 $724 $1,037 2019 2020 2021 2022 YTD 2023 Total Interest-bearing deposits Total Noninterest-bearing deposits Off Balance Sheet On Balance Sheet: NIB/Total Deposits 22% On Balance Sheet: NIB/ Total Deposits 36%Deposits ($ Millions) Continued Growth of Deposit Base Deposit growth in Q1 due to tax refunds received by Credit Karma Money TM accountholders Interest-bearing accounts increased in Q1 driven by CD growth for additional liquidity

6 Deposit Composition Source of Deposits CoRe* 56% Fintech 44% Digital Assets (F) 9.7% Payments (F) 6.4% BaaS (F) 9.1% Gaming (F) 18.8% Title 4.2% Speciality 5.2% Retail 11.1% Commercial 27.9% Public Funds 7.6% Deposits Breakdown Source: Company documents and SEC Filings. *Commercial and Retail. (F) – Fintech deposits.
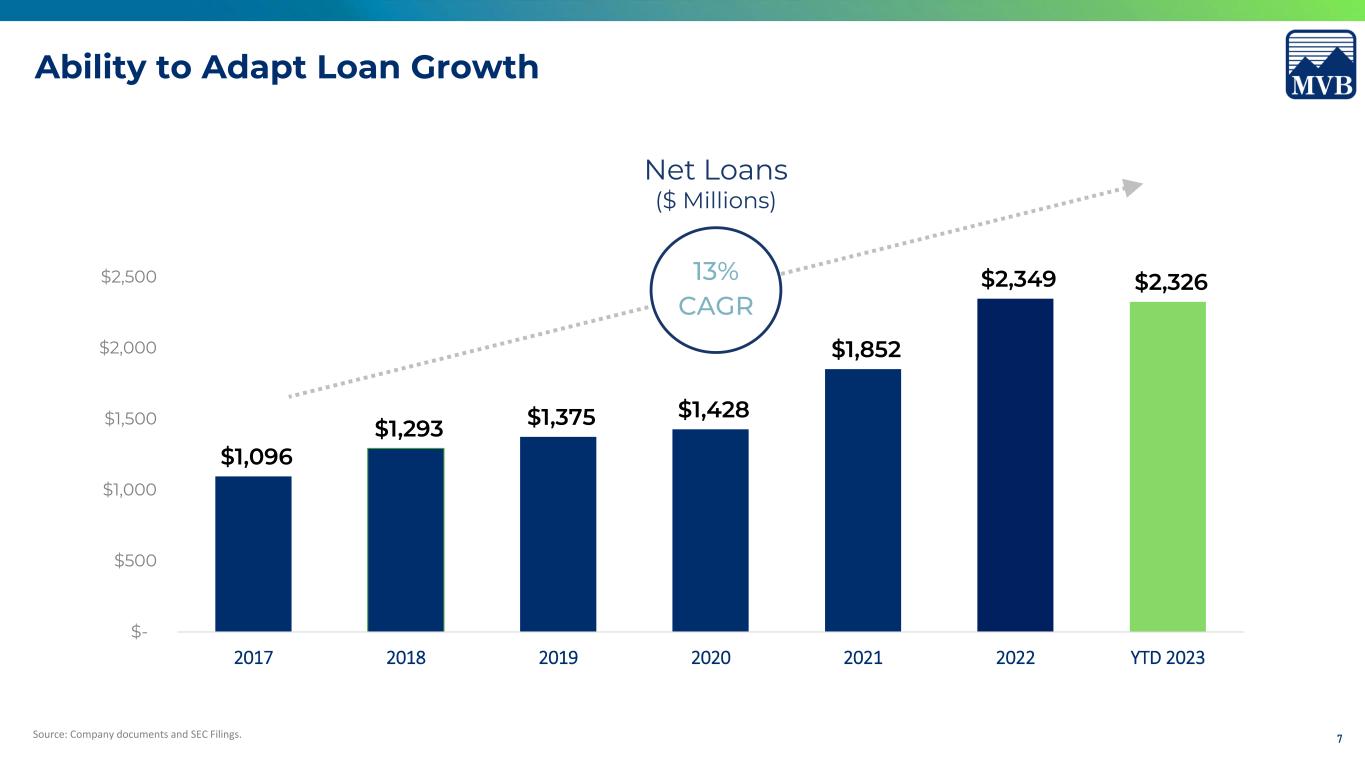
7 Ability to Adapt Loan Growth $1,096 $1,293 $1,375 $1,428 $1,852 $2,349 $2,326 $- $500 $1,000 $1,500 $2,000 $2,500 2017 2018 2019 2020 2021 2022 YTD 2023 Net Loans ($ Millions) 13% CAGR Source: Company documents and SEC Filings.

8 Loan Portfolio Composition Portfolio by Industry Source: Company Documents. *2.76% of MVB’s total loans were non-owner-occupied office space. Commercial Business 35.9% Commercial Real Estate 25.9% Acquisition & Development 4.2% Home Equity 0.7% Residential 30.0% Consumer 3.3% Other 24.8% Office Space* 4.3% Healthcare 21.3% Auto Equipment 4.8% Residential 30.0% Government 4.9% Energy 1.9% Financial 3.3% Retail Space 4.7% Diversified Loan Portfolio

9 Credit Quality
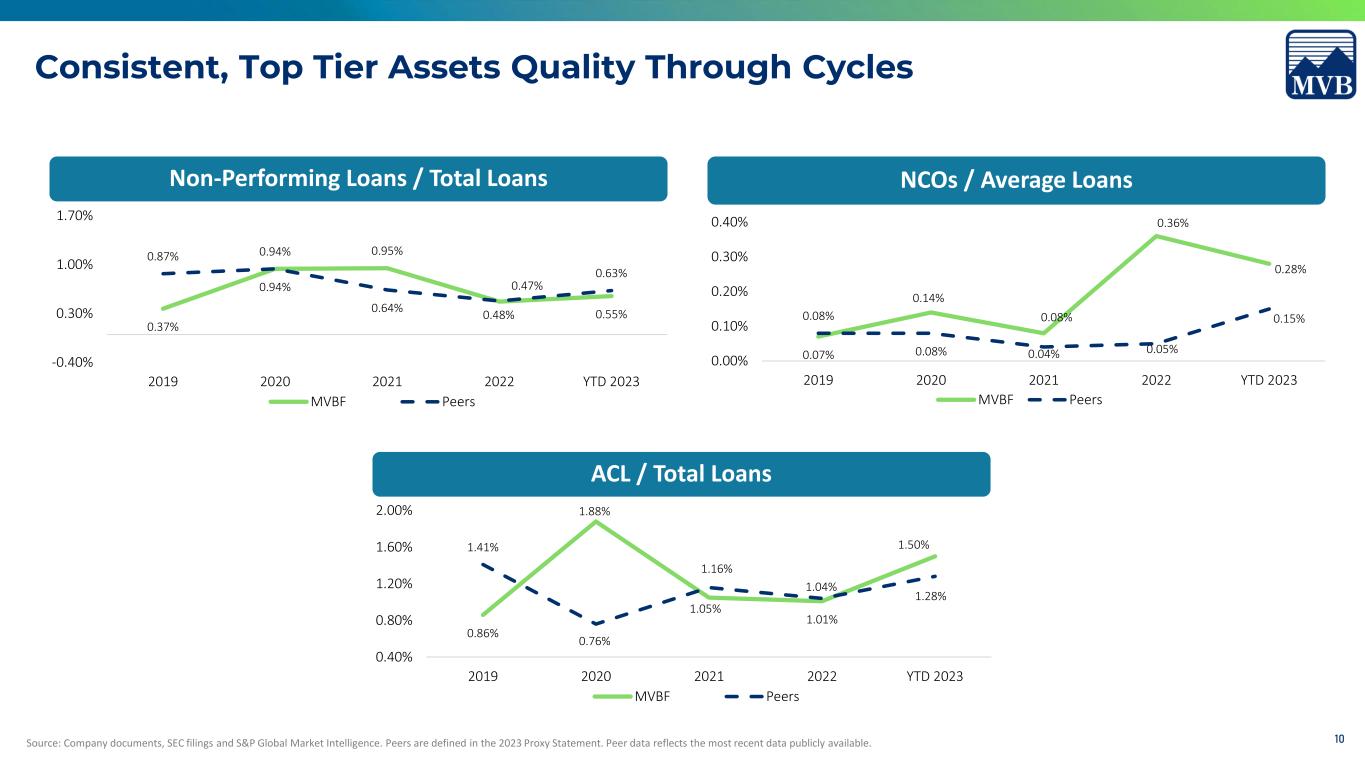
10 0.37% 0.94% 0.95% 0.47% 0.55% 0.87% 0.94% 0.64% 0.48% 0.63% -0.40% 0.30% 1.00% 1.70% 2019 2020 2021 2022 YTD 2023 MVBF Peers Non-Performing Loans / Total Loans 0.07% 0.14% 0.08% 0.36% 0.28% 0.08% 0.08% 0.04% 0.05% 0.15% 0.00% 0.10% 0.20% 0.30% 0.40% 2019 2020 2021 2022 YTD 2023 MVBF Peers NCOs / Average Loans Source: Company documents, SEC filings and S&P Global Market Intelligence. Peers are defined in the 2023 Proxy Statement. Peer data reflects the most recent data publicly available. 0.86% 1.88% 1.05% 1.01% 1.50%1.41% 0.76% 1.16% 1.04% 1.28% 0.40% 0.80% 1.20% 1.60% 2.00% 2019 2020 2021 2022 YTD 2023 MVBF Peers ACL / Total Loans Consistent, Top Tier Assets Quality Through Cycles

11 Non-Performing Loans Source: Company Documents. All data as of March 31, 2023. By Loan Type – YTD 2023 Commercial NPLs – by Industry Energy $ 4,892,766 Office $ 1,537,685 Government $ 1,692,976 Other $ 1,060,869 Consumer Auto 7.5% HELOC 1.4% Commercial 70.2% Residential Mtg 20.9% Total Non-Performing Loans: $13.0M
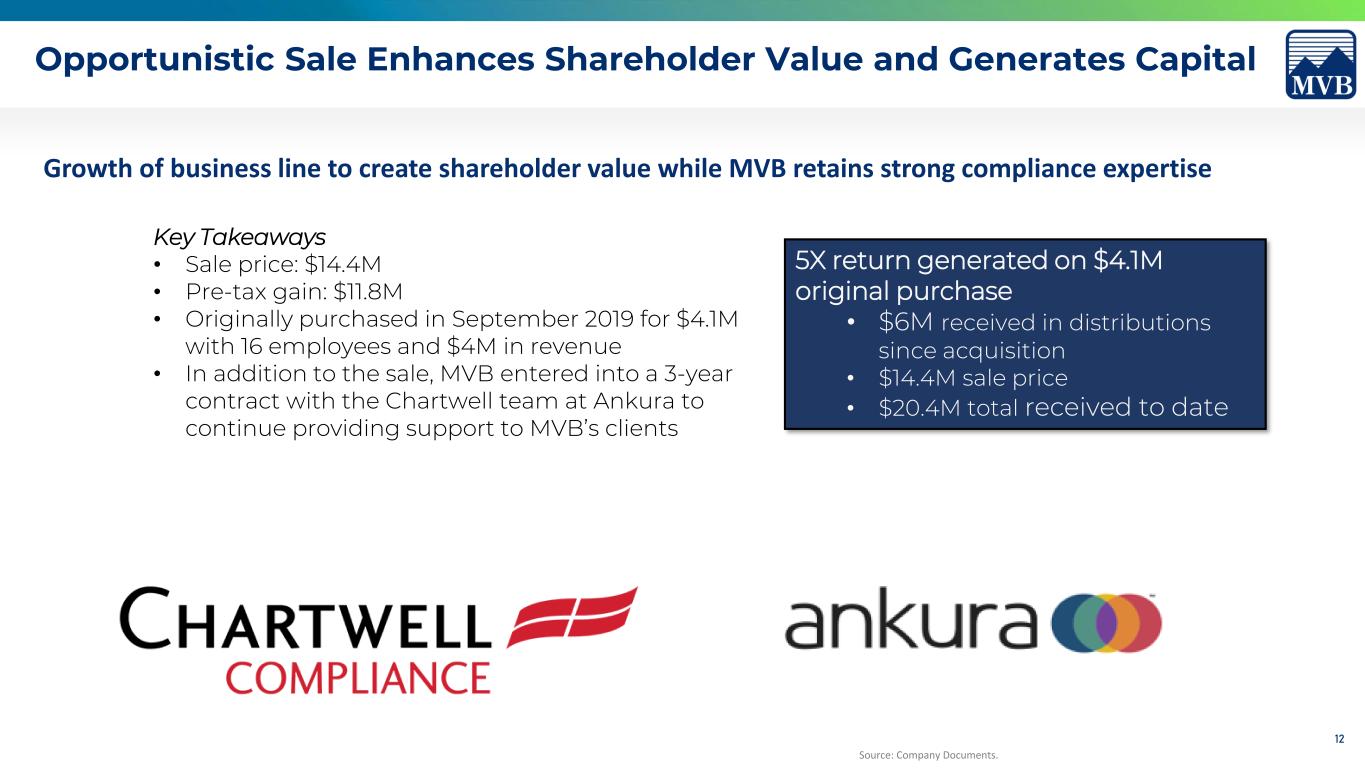
12 Opportunistic Sale Enhances Shareholder Value and Generates Capital Key Takeaways • Sale price: $14.4M • Pre-tax gain: $11.8M • Originally purchased in September 2019 for $4.1M with 16 employees and $4M in revenue • In addition to the sale, MVB entered into a 3-year contract with the Chartwell team at Ankura to continue providing support to MVB’s clients Source: Company Documents. Growth of business line to create shareholder value while MVB retains strong compliance expertise 5X return generated on $4.1M original purchase • $6M received in distributions since acquisition • $14.4M sale price • $20.4M total received to date

13 Gaming Industry Overview

14 Sports Betting Anticipated Market Adoption Waves Source: 1- EKG – US Sports Betting Policy Monitor | January 2023; 2 – EKG’s U.S Sports Betting Market Monitor | February 2023 An anticipated 88% of the U.S. adult population will have access to regulated sports betting by 2026(1), expanding the potential for the market that produced $7.6B in 2022 GGR(2).
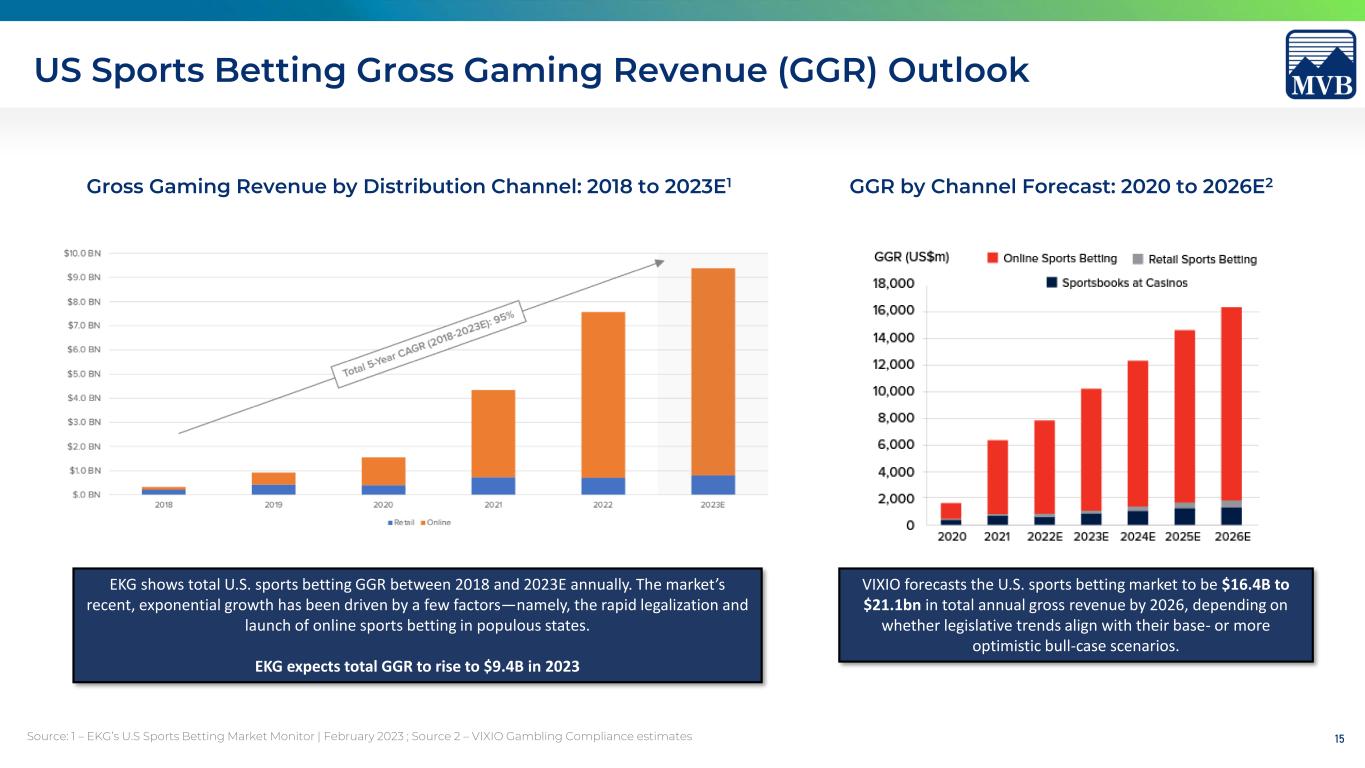
15 US Sports Betting Gross Gaming Revenue (GGR) Outlook Source: 1 – EKG’s U.S Sports Betting Market Monitor | February 2023 ; Source 2 – VIXIO Gambling Compliance estimates EKG shows total U.S. sports betting GGR between 2018 and 2023E annually. The market’s recent, exponential growth has been driven by a few factors—namely, the rapid legalization and launch of online sports betting in populous states. EKG expects total GGR to rise to $9.4B in 2023 Gross Gaming Revenue by Distribution Channel: 2018 to 2023E1 GGR by Channel Forecast: 2020 to 2026E2 VIXIO forecasts the U.S. sports betting market to be $16.4B to $21.1bn in total annual gross revenue by 2026, depending on whether legislative trends align with their base- or more optimistic bull-case scenarios.
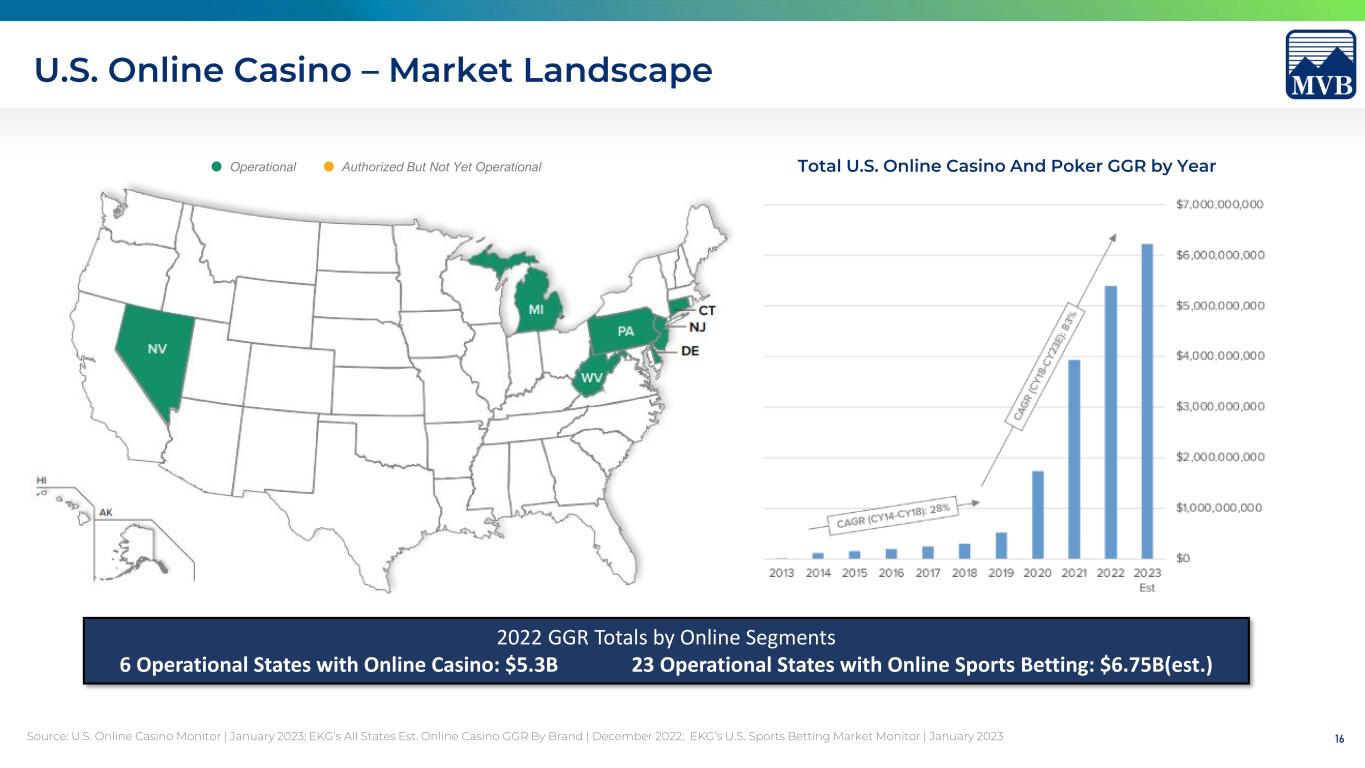
16 U.S. Online Casino – Market Landscape Source: U.S. Online Casino Monitor | January 2023; EKG’s All States Est. Online Casino GGR By Brand | December 2022; EKG’s U.S. Sports Betting Market Monitor | January 2023 Operational Authorized But Not Yet Operational 2022 GGR Totals by Online Segments 6 Operational States with Online Casino: $5.3B 23 Operational States with Online Sports Betting: $6.75B(est.) Total U.S. Online Casino And Poker GGR by Year
17 Growth of Payment Income
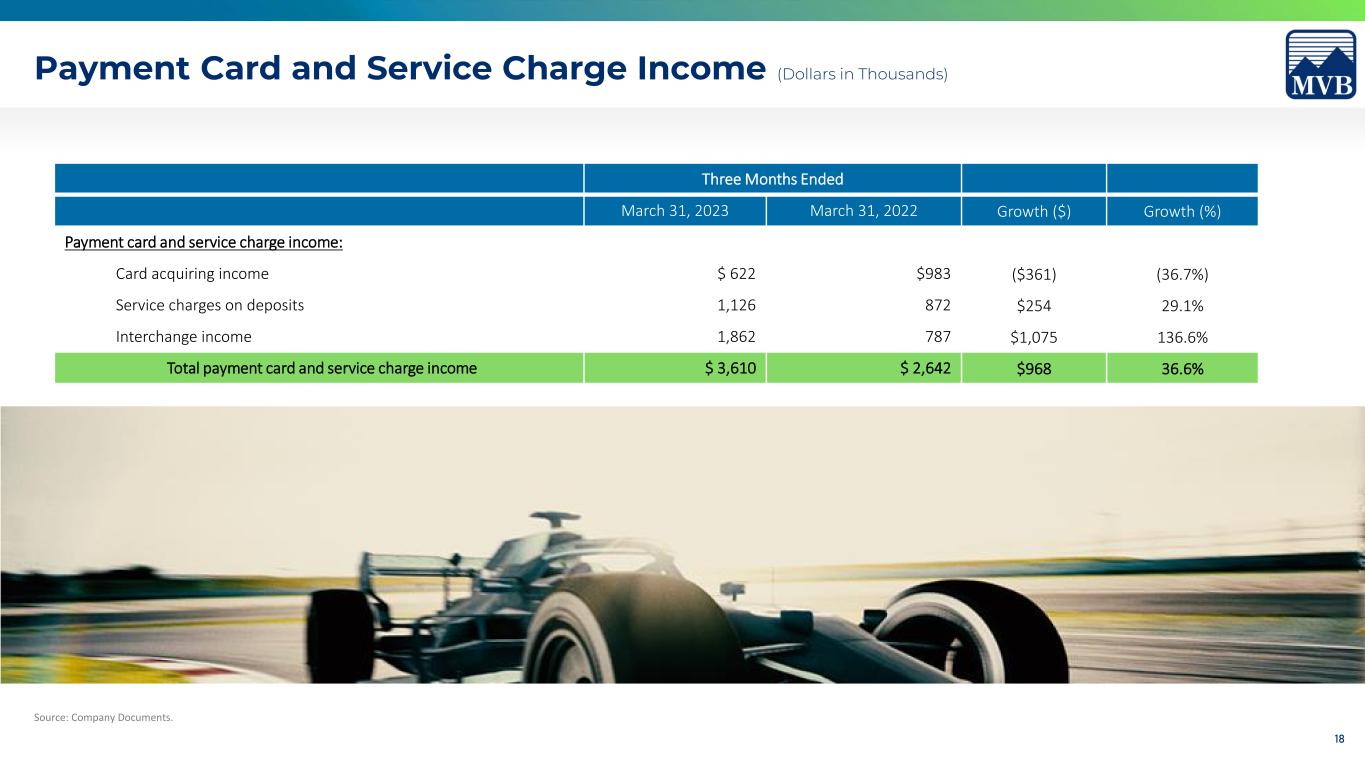
18 Source: Company Documents. Three Months Ended March 31, 2023 March 31, 2022 Growth ($) Growth (%) Payment card and service charge income: Card acquiring income $ 622 $983 ($361) (36.7%) Service charges on deposits 1,126 872 $254 29.1% Interchange income 1,862 787 $1,075 136.6% Total payment card and service charge income $ 3,610 $ 2,642 $968 36.6% Payment Card and Service Charge Income (Dollars in Thousands)

19 Backer of Fintech

20 $- $5,000 $10,000 $15,000 $20,000 $25,000 $30,000 $35,000 $40,000 $45,000 $50,000 2016 2017 2018 2019 2020 2021 2022 YTD 2023 (i n t h o u sa n d s) Cash Investment Estimated Fair Value Investments Focused on Strategic Partnerships Source: Company documents. Backer of Fintech • Realized gains of $2.5M since 2021 • Cash return of $2.75M since 2021
21 Capital Strength
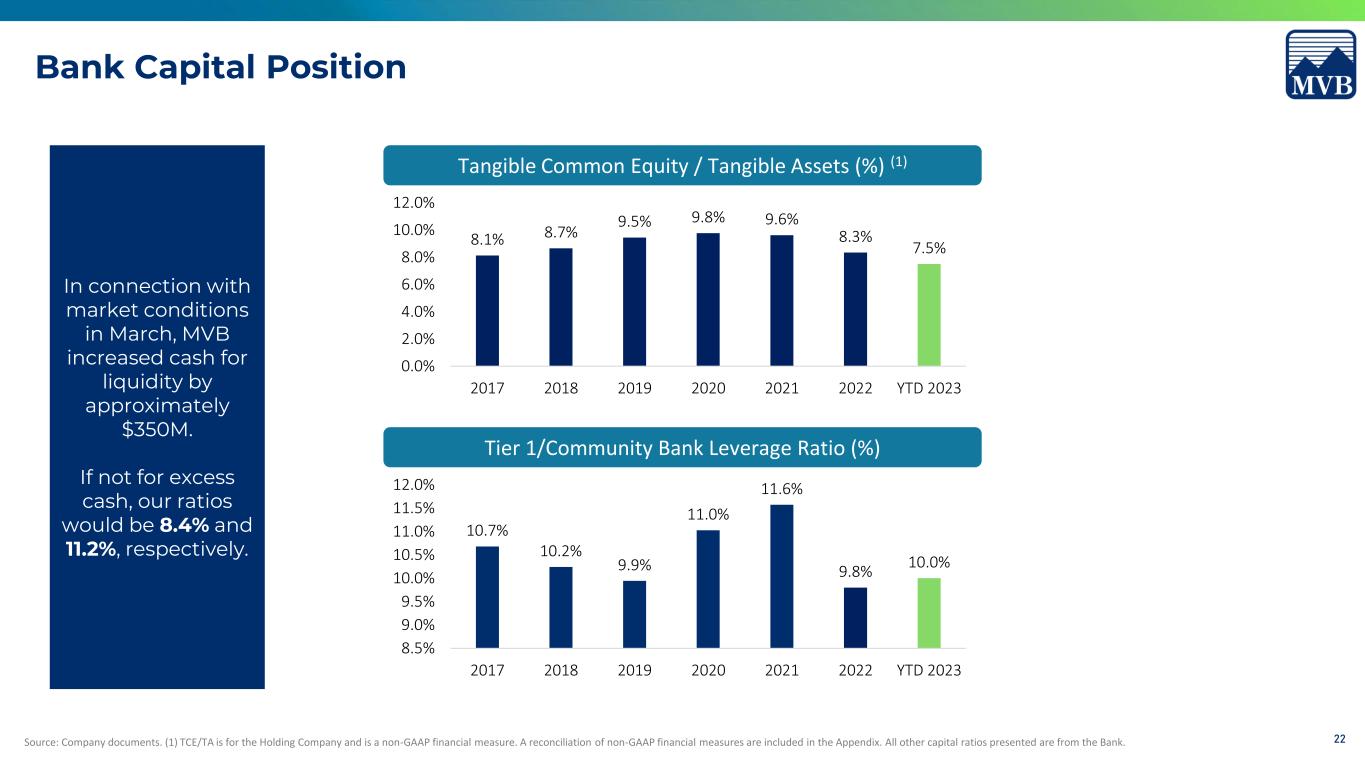
22 8.1% 8.7% 9.5% 9.8% 9.6% 8.3% 7.5% 0.0% 2.0% 4.0% 6.0% 8.0% 10.0% 12.0% 2017 2018 2019 2020 2021 2022 YTD 2023 Tangible Common Equity / Tangible Assets (%) (1) 10.7% 10.2% 9.9% 11.0% 11.6% 9.8% 10.0% 8.5% 9.0% 9.5% 10.0% 10.5% 11.0% 11.5% 12.0% 2017 2018 2019 2020 2021 2022 YTD 2023 Tier 1/Community Bank Leverage Ratio (%) Source: Company documents. (1) TCE/TA is for the Holding Company and is a non-GAAP financial measure. A reconciliation of non-GAAP financial measures are included in the Appendix. All other capital ratios presented are from the Bank. Bank Capital Position In connection with market conditions in March, MVB increased cash for liquidity by approximately $350M. If not for excess cash, our ratios would be 8.4% and 11.2%, respectively.

23 Our Awards & Accolades
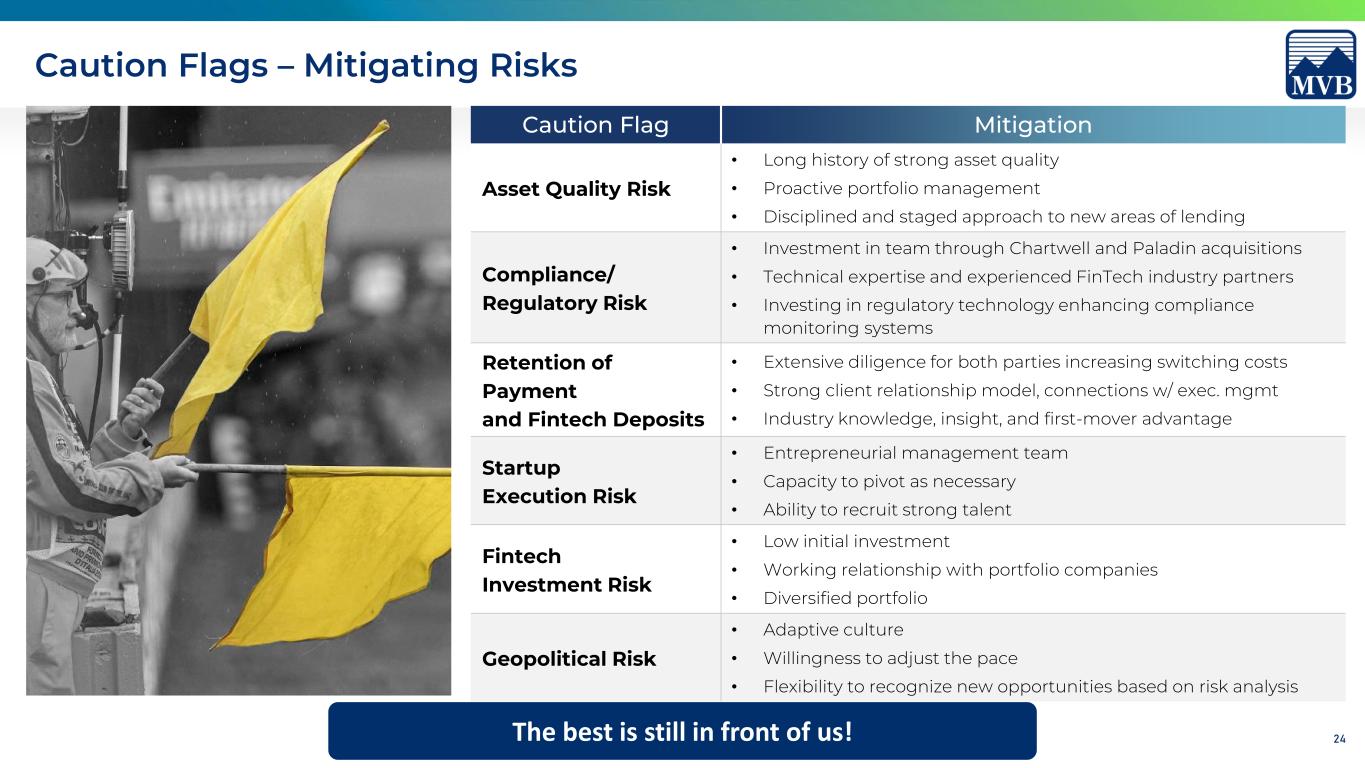
24 Caution Flag Mitigation Asset Quality Risk • Long history of strong asset quality • Proactive portfolio management • Disciplined and staged approach to new areas of lending Compliance/ Regulatory Risk • Investment in team through Chartwell and Paladin acquisitions • Technical expertise and experienced FinTech industry partners • Investing in regulatory technology enhancing compliance monitoring systems Retention of Payment and Fintech Deposits • Extensive diligence for both parties increasing switching costs • Strong client relationship model, connections w/ exec. mgmt • Industry knowledge, insight, and first-mover advantage Startup Execution Risk • Entrepreneurial management team • Capacity to pivot as necessary • Ability to recruit strong talent Fintech Investment Risk • Low initial investment • Working relationship with portfolio companies • Diversified portfolio Geopolitical Risk • Adaptive culture • Willingness to adjust the pace • Flexibility to recognize new opportunities based on risk analysis The best is still in front of us! Caution Flags – Mitigating Risks

25Source: Company documents. Tangible Common Equity / Tangible Assets (%) (Dollars in thousands) 2017 2018 2019 2020 2021 2022 YTD 2023 Total stockholders’ equity $ 150,192 $ 176,773 $ 211,936 $ 239,483 $ 274,328 $ 261,084 $ 271,131 Total assets 1,534,302 1,750,969 1,944,114 2,331,476 2,792,449 3,068,860 3,551,876 Equity to assets 9.8% 10.1% 10.9% 10.3% 8.7% 8.5% 7.6% Goodwill $ 18,480 $ 18,480 $ 19,630 $ 2,350 $ 3,988 $ 3,988 $ 2,838 Intangibles 646 550 3,473 2,400 2,316 1,631 420 Total intangible assets $ 19,126 $ 19,030 $ 23,103 $ 4,750 $ 6,304 $ 5,619 $ 3,258 Total stockholders’ equity $ 150,192 $ 176,773 $ 211,936 $ 239,483 $ 274,328 $ 261,084 $ 271,131 Less: Preferred stock (7,834) (7,834) (7,334) (7,334) -- -- -- Less: Total intangible assets (19,126) (19,030) (23,103) (4,750) (6,304) (5,619) (3,258) Total tangible common equity $ 123,232 $ 149,909 $ 181,499 $ 227,399 $ 268,024 $ 255,465 $ 267,873 Total assets $ 1,534,302 $ 1,750,969 $ 1,944,114 $ 2,331,476 $ 2,792,449 $ 3,068,860 3,551,876 Less: Total intangible assets (19,126) (19,030) (23,103) (4,750) (6,304) (5,619) (3,258) Total tangible assets $ 1,515,176 $ 1,731,939 $ 1,921,011 $ 2,326,726 $ 2,786,145 $ 3,063,241 $ 3,548,618 Tangible common equity to tangible assets 8.1% 8.7% 9.5% 9.8% 9.6% 8.3% 7.5% Appendix: Non-GAAP Reconciliation


