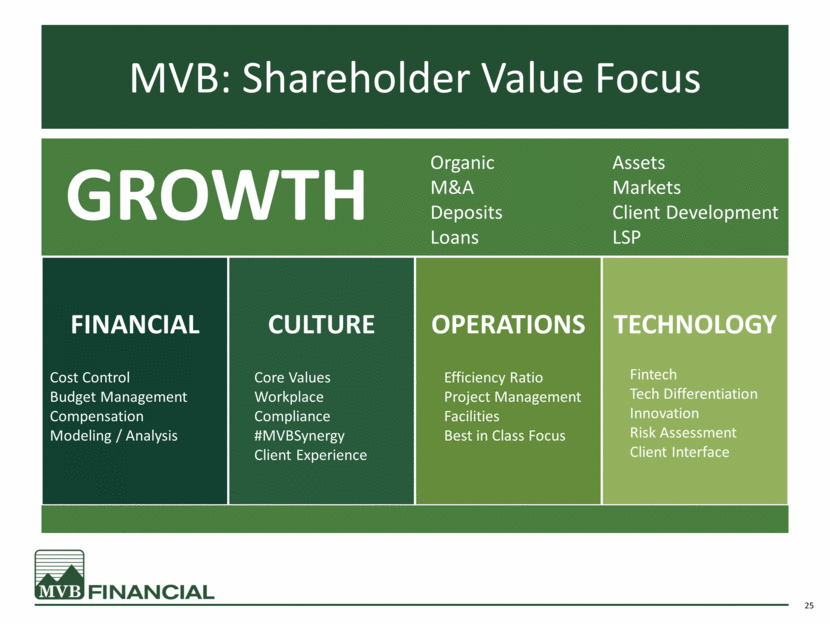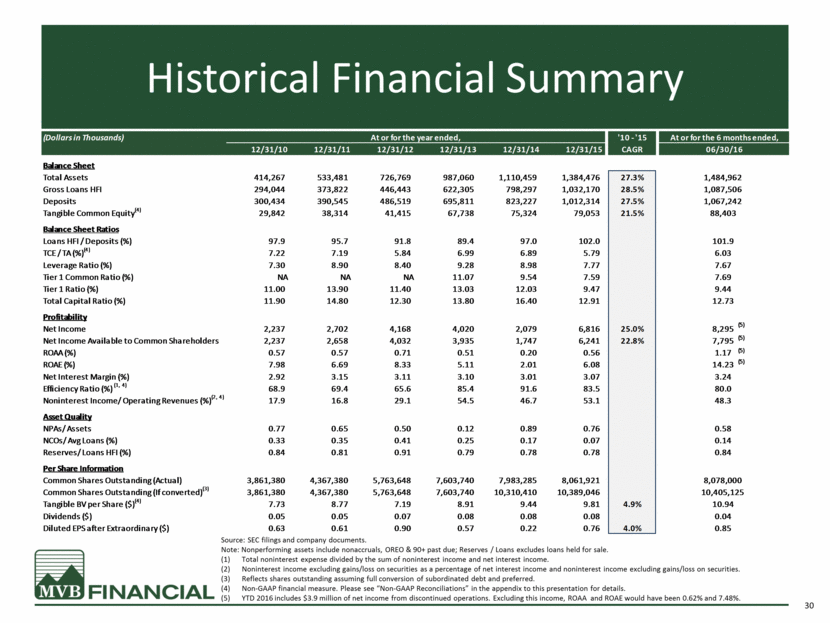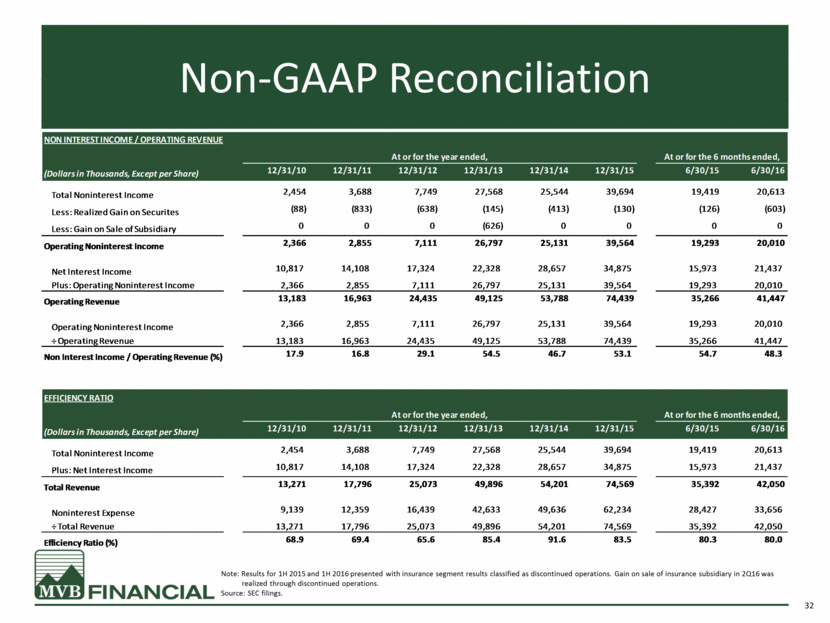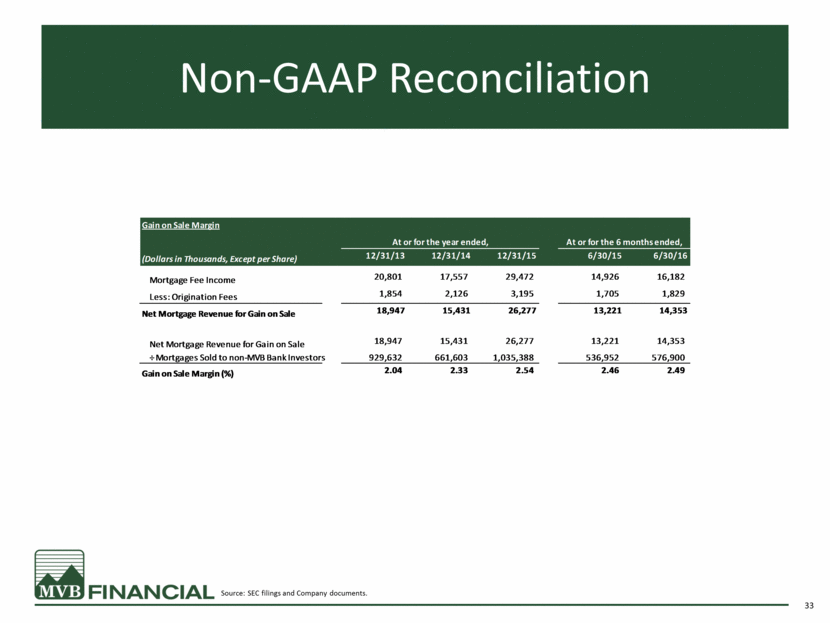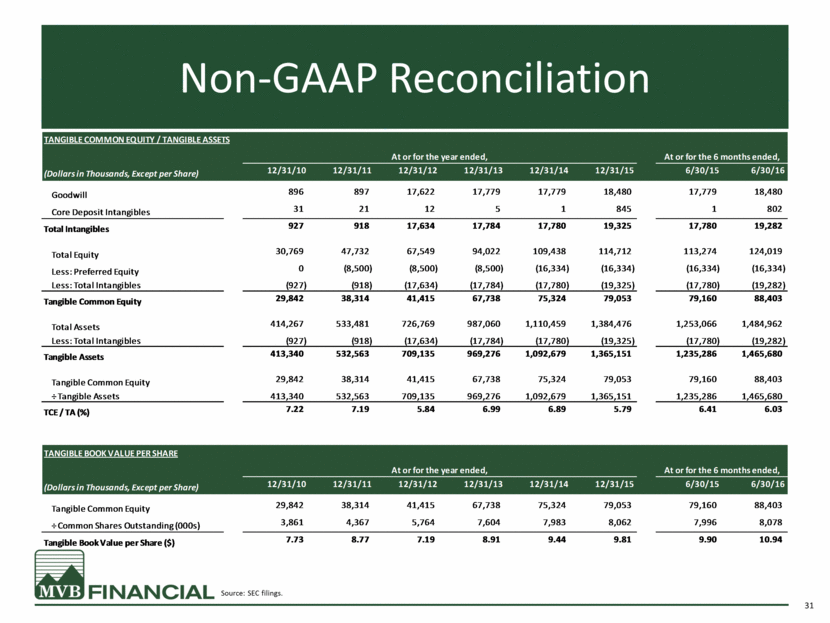
| Non-GAAP Reconciliation 31 Source: SEC filings. TANGIBLE COMMON EQUITY / TANGIBLE ASSETS At or for the year ended, At or for the 6 months ended, (Dollars in Thousands, Except per Share) 12/31/10 12/31/11 12/31/12 12/31/13 12/31/14 12/31/15 6/30/15 6/30/16 Goodwill 896 897 17,622 17,779 17,779 18,480 17,779 18,480 Core Deposit Intangibles 31 21 12 5 1 845 1 802 Total Intangibles 927 918 17,634 17,784 17,780 19,325 17,780 19,282 Total Equity 30,769 47,732 67,549 94,022 109,438 114,712 113,274 124,019 Less: Preferred Equity 0 (8,500) (8,500) (8,500) (16,334) (16,334) (16,334) (16,334) Less: Total Intangibles (927) (918) (17,634) (17,784) (17,780) (19,325) (17,780) (19,282) Tangible Common Equity 29,842 38,314 41,415 67,738 75,324 79,053 79,160 88,403 Total Assets 414,267 533,481 726,769 987,060 1,110,459 1,384,476 1,253,066 1,484,962 Less: Total Intangibles (927) (918) (17,634) (17,784) (17,780) (19,325) (17,780) (19,282) Tangible Assets 413,340 532,563 709,135 969,276 1,092,679 1,365,151 1,235,286 1,465,680 Tangible Common Equity 29,842 38,314 41,415 67,738 75,324 79,053 79,160 88,403 ÷ Tangible Assets 413,340 532,563 709,135 969,276 1,092,679 1,365,151 1,235,286 1,465,680 TCE / TA (%) 7.22 7.19 5.84 6.99 6.89 5.79 6.41 6.03 TANGIBLE BOOK VALUE PER SHARE At or for the year ended, At or for the 6 months ended, (Dollars in Thousands, Except per Share) 12/31/10 12/31/11 12/31/12 12/31/13 12/31/14 12/31/15 6/30/15 6/30/16 Tangible Common Equity 29,842 38,314 41,415 67,738 75,324 79,053 79,160 88,403 ÷ Common Shares Outstanding (000s) 3,861 4,367 5,764 7,604 7,983 8,062 7,996 8,078 Tangible Book Value per Share ($) 7.73 8.77 7.19 8.91 9.44 9.81 9.90 10.94 |