Exhibit 99.2
B&G Foods, Inc. Lenders’ Presentation February 5, 2007 |
Forward-Looking Statements Statements in this presentation that are not statements of historical or current fact constitute “forward-looking statements.” The forward-looking statements contained in this presentation include without limitation statements related to the planned acquisition of Cream of Wheat and Cream of Rice and the timing and financing thereof; and the expected impact of the planned acquisition, including without limitation the expected impact on B&G Foods’ margins, growth and free cash flow potential. Such forward-looking statements involve known and unknown risks, uncertainties and other unknown factors that could cause the actual results of B&G Foods to be materially different from the historical results or from any future results expressed or implied by such forward-looking statements. In addition to statements that explicitly describe such risks and uncertainties readers are urged to consider statements labeled with the terms “believes,” “belief,” “expects,” “intends,” “anticipates” or “plans” to be uncertain and forward-looking. The forward-looking statements contained herein are also subject generally to other risks and uncertainties that are described from time to time in B&G Foods’ filings with the Securities and Exchange Commission. Preliminary Financial Information The financial information included in this presentation for B&G Foods is preliminary and unaudited and is subject to change based upon the completion of fiscal 2006 financial statements for B&G Foods and the audit thereof. The financial data included in this presentation for the Cream of Wheat and Cream of Rice brands for fiscal 2005 and fiscal 2006 are preliminary and unaudited and are subject to change based upon the completion of fiscal 2005 and fiscal 2006 financial statements for the Cream of Wheat and Cream of Rice brands and the audits thereof. About Non-GAAP Financial Measures Certain disclosures in this presentation include “non-GAAP (Generally Accepted Accounting Principles) financial measures.” A non-GAAP financial measure is defined as a numerical measure of B&G Foods’ financial performance that excludes or includes amounts so as to be different than the most directly comparable measure calculated and presented in accordance with GAAP in B&G Foods’ consolidated balance sheets and related consolidated statements of operations, changes in stockholders’ equity and comprehensive income and cash flows. B&G Foods presents EBITDA (net income before net interest expense, income taxes, depreciation and amortization) and adjusted EBITDA (EBITDA as adjusted for transaction related compensation expenses incurred in fiscal 2004 in connection with its initial public offering, the concurrent offerings and the related transactions and restructuring charges incurred in fiscal 2005) because B&G Foods believes they are useful indicators of its historical debt capacity and ability to service debt. B&G Foods also presents this discussion of EBITDA and adjusted EBITDA because covenants in the indenture governing its senior notes, its credit facility and the indenture governing its senior subordinated notes contain ratios based on these measures. A reconciliation of EBITDA and adjusted EBITDA with the most directly comparable GAAP measure for the fifty-two weeks ended December 31, 2005 and January 1, 2005 along with the components of EBITDA and adjusted EBITDA is included in B&G Foods’ Annual Report on Form 10-K for the fiscal year ended December 31, 2005 filed with the Securities and Exchange Commission on March 7, 2006. A copy of the 2005 Annual Report may be viewed at B&G Foods’ website at www.bgfoods.com under “Investor Relations—SEC Filings.” A reconciliation of EBITDA with the most directly comparable GAAP measure for the fifty-two weeks ended December 30, 2006 along with the components of EBITDA will be included with B&G Foods’ fourth quarter and fiscal 2006 financial results press release expected to be issued on March 8, 2007. |
Management Attendees David L. Wenner B&G Foods, Inc. President and Chief Executive Officer Robert C. Cantwell B&G Foods, Inc. Executive Vice President and Chief Financial Officer |
Agenda Welcome and Introduction Evan Rothenberg, Lehman Brothers Transaction Overview David Wenner / Robert Cantwell Company Overview David Wenner Business Update David Wenner Key Credit Strengths David Wenner Financial Review Robert Cantwell Overview of Credit Facilities Chip Heflin, Lehman Brothers Summary and Q&A David Wenner |
B&G Foods, Inc. Transaction Overview David Wenner / Robert Cantwell |
Transaction Summary B&G Foods is expanding its portfolio of leading brands through the acquisition of Cream of Wheat from Kraft On January 22, 2007 B&G Foods agreed to acquire Cream of Wheat from Kraft The total purchase price for the transaction, excluding fees and expenses, will be $200 million, subject to a post-closing inventory adjustment (approximately 5.6x 2006 EBITDA of $35.5 (1) million) Introduced in 1893, Cream of Wheat is the #2 hot cereal brand in the U.S. and the leading wheat hot cereal Cook-on-stove and Instant hot cereal products for the U.S. Retail, Foodservice and several International markets Attractive profit margins and cash flow generation Complementary to B&G Foods’ operating model and sales and distribution network As part of the transaction, B&G Foods will also: Refinance $25 million of existing term loan, and Amend the company’s existing revolving credit facility The acquisition is expected to close by February 24, 2007 and fund on February 26, 2007 (2) ___________________________ Represents EBITDA for Cream of Wheat business on historical basis. This is not intended to be a projection of Cream of Wheat’s expected EBITDA going forward. See page 15 for factors that may affect EBITDA going forward. The closing of the acquisition is subject to regulatory approval and the satisfaction of customary closing conditions. No assurance can be given that the acquisition or the financing contemplated by these slides will be completed and, if completed, that they will be completed on the terms or within the timeframe described in these slides. |
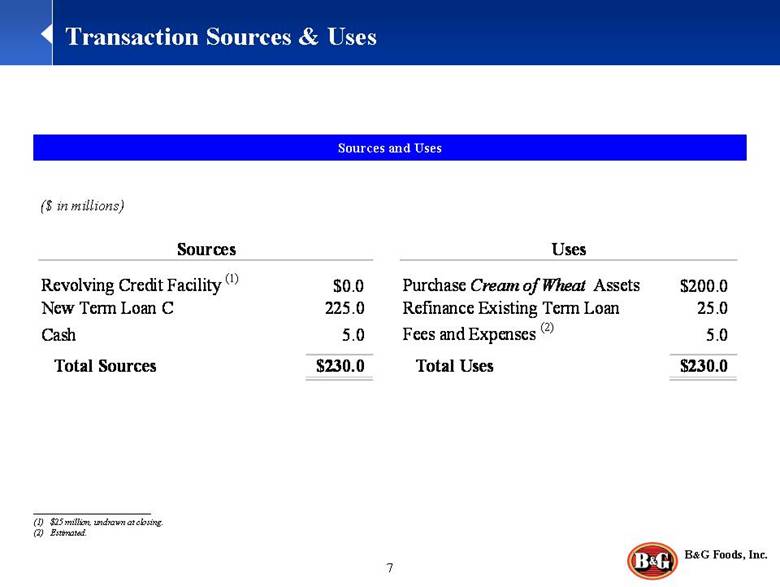
Transaction Sources & Uses Sources and Uses ___________________________ (1) $25 million, undrawn at closing. (2) Estimated. ($ in millions) Sources Uses Revolving Credit Facility (1) $0.0 Purchase Cream of Wheat Assets $200.0 New Term Loan C 225.0 Refinance Existing Term Loan 25.0 Cash 5.0 Fees and Expenses (2) 5.0 Total Sources $230.0 Total Uses $230.0 |
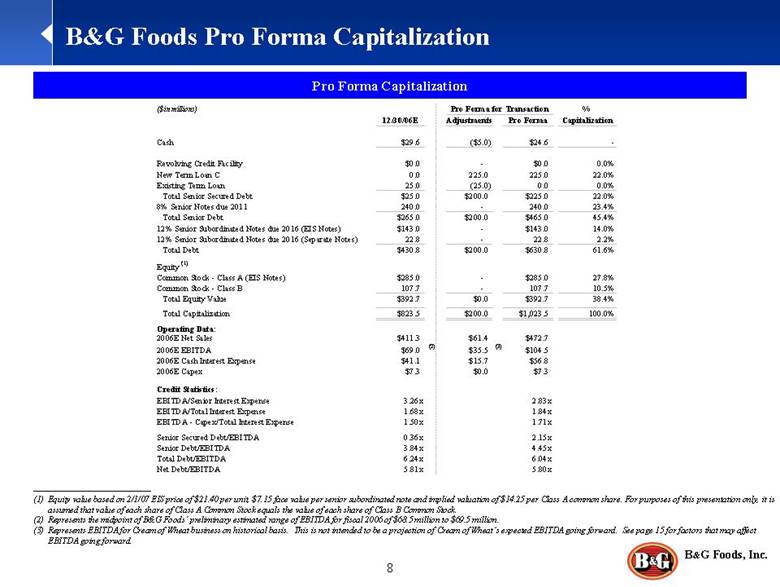
(1) Equity value based on 2/1/07 EIS price of $21.40 per unit, $7.15 face value per senior subordinated note and implied valuation of $14.25 per Class A common share. For purposes of this presentation only, it is assumed that value of each share of Class A Common Stock equals the value of each share of Class B Common Stock. (2) Represents the midpoint of B&G Foods’ preliminary estimated range of EBITDA for fiscal 2006 of $68.5 million to $69.5 million. (3) Represents EBITDA for Cream of Wheat business on historical basis. This is not intended to be a projection of Cream of Wheat’s expected EBITDA going forward. See page 15 for factors that may affect EBITDA going forward. B&G Foods Pro Forma Capitalization Pro Forma Capitalization 8 ($ in millions) Pro Forma for Transaction % 12/30/06E Adjustments Pro Forma Capitalization Cash $29.6 ($5.0) $24.6 - Revolving Credit Facility $0.0 - $0.0 0.0% New Term Loan C 0.0 225.0 225.0 22.0% Existing Term Loan 25.0 (25.0) 0.0 0.0% Total Senior Secured Debt $25.0 $200.0 $225.0 22.0% 8% Senior Notes due 2011 240.0 - 240.0 23.4% Total Senior Debt $265.0 $200.0 $465.0 45.4% 12% Senior Subordinated Notes due 2016 (EIS Notes) $143.0 - $143.0 14.0% 12% Senior Subordinated Notes due 2016 (Separate Notes) 22.8 - 22.8 2.2% Total Debt $430.8 $200.0 $630.8 61.6% Equity (1) Common Stock - Class A (EIS Notes) $285.0 - $285.0 27.8% Common Stock - Class B 107.7 - 107.7 10.5% Total Equity Value $392.7 $0.0 $392.7 38.4% Total Capitalization $823.5 $200.0 $1,023.5 100.0% Operating Data: 2006E Net Sales $411.3 $61.4 $472.7 2006E EBITDA $69.0 (2) $35.5 (3) $104.5 2006E Cash Interest Expense $41.1 $15.7 $56.8 2006E Capex $7.3 $0.0 $7.3 Credit Statistics: EBITDA/Senior Interest Expense 3.26x 2.83x EBITDA/Total Interest Expense 1.68x 1.84x EBITDA - Capex/Total Interest Expense 1.50x 1.71x Senior Secured Debt/EBITDA 0.36x 2.15x Senior Debt/EBITDA 3.84x 4.45x Total Debt/EBITDA 6.24x 6.04x Net Debt/EBITDA 5.81x 5.80x |
B&G Foods, Inc. Company Overview David Wenner |
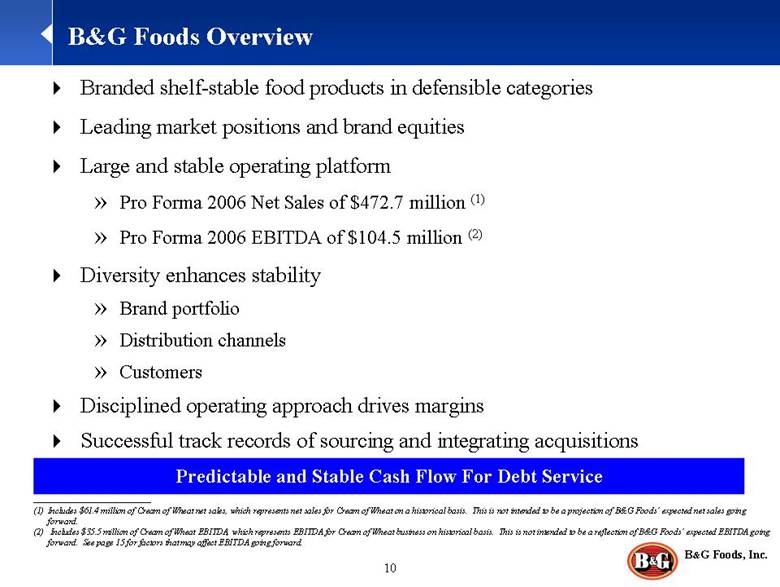
B&G Foods Overview Branded shelf-stable food products in defensible categories Leading market positions and brand equities Large and stable operating platform Pro Forma 2006 Net Sales of $472.7 million (1) Pro Forma 2006 EBITDA of $104.5 million (2) Diversity enhances stability Brand portfolio Distribution channels Customers Disciplined operating approach drives margins Successful track records of sourcing and integrating acquisitions Predictable and Stable Cash Flow For Debt Service ___________________________ (1) Includes $61.4 million of Cream of Wheat net sales, which represents net sales for Cream of Wheat on a historical basis. This is not intended to be a projection of B&G Foods’ expected net sales going forward. (2) Includes $35.5 million of Cream of Wheat EBITDA, which represents EBITDA for Cream of Wheat business on historical basis. This is not intended to be a reflection of B&G Foods’ expected EBITDA going forward. See page 15 for factors that may affect EBITDA going forward. |
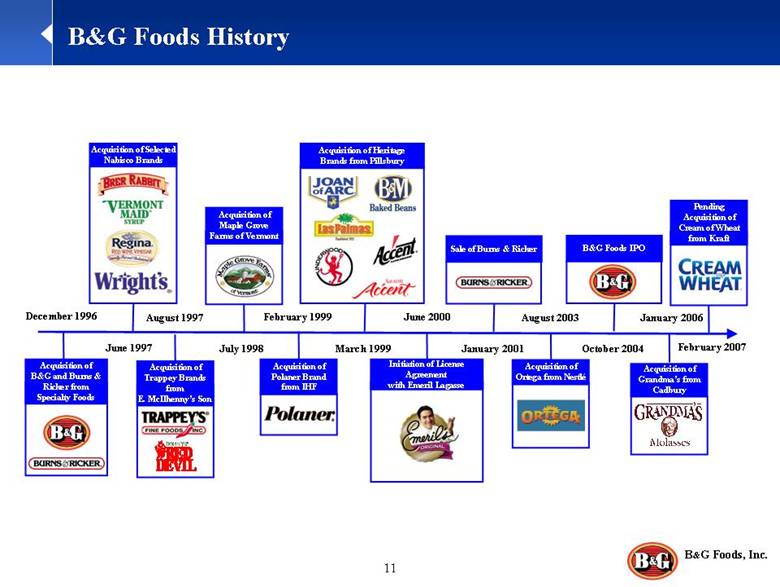
B&G Foods History December 1996 Acquisition of B&G and Burns & Ricker from Specialty Foods January 2006 Acquisition of Grandma’s from Cadbury February 1999 Acquisition of Polaner Brand from IHF July 1998 Acquisition of Maple Grove Farms of Vermont August 2003 Acquisition of Ortega from Nestlé June 1997 Acquisition of Selected Nabisco Brands March 1999 Acquisition of Heritage Brands from Pillsbury June 2000 Initiation of License Agreement with Emeril Lagasse August 1997 Acquisition of Trappey Brands from E. McIlhenny’s Son January 2001 Sale of Burns & Ricker October 2004 B&G Foods IPO Pending Acquisition of Cream of Wheat from Kraft February 2007 ® |
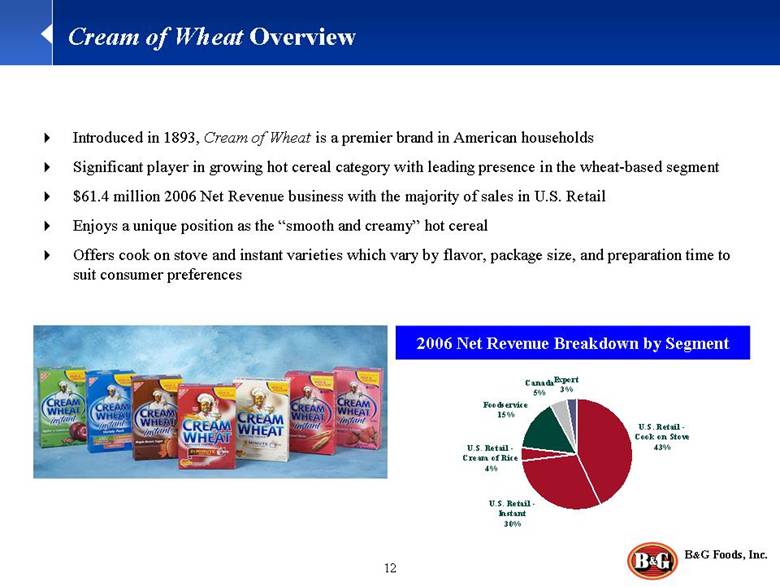
Cream of Wheat Overview Introduced in 1893, Cream of Wheat is a premier brand in American households Significant player in growing hot cereal category with leading presence in the wheat-based segment $61.4 million 2006 Net Revenue business with the majority of sales in U.S. Retail Enjoys a unique position as the “smooth and creamy” hot cereal Offers cook on stove and instant varieties which vary by flavor, package size, and preparation time to suit consumer preferences 2006 Net Revenue Breakdown by Segment U.S. Retail - Cook on Stove 43% Canada 5% Export 3% U.S. Retail - Instant 30% U.S. Retail - Cream of Rice 4% Foodservice 15% |
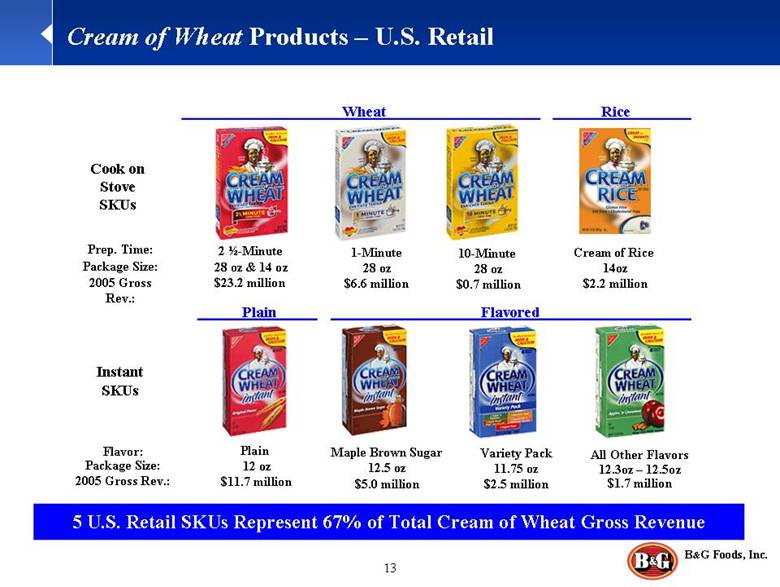
Cream of Wheat Products – U.S. Retail 10-Minute 28 oz $0.7 million 2 ½-Minute 28 oz & 14 oz $23.2 million Cream of Rice 14oz $2.2 million 1-Minute 28 oz $6.6 million Plain 12 oz $11.7 million Maple Brown Sugar 12.5 oz $5.0 million All Other Flavors 12.3oz – 12.5oz $1.7 million Variety Pack 11.75 oz $2.5 million Cook on Stove SKUs Prep. Time: Package Size: 2005 Gross Rev.: Instant SKUs Flavor: Package Size: 2005 Gross Rev.: Flavored Plain Wheat Rice 5 U.S. Retail SKUs Represent 67% of Total Cream of Wheat Gross Revenue |
Unique, leading position in an attractive category Hot cereal category growth is driven by consumer focus on health and wellness Cream of Wheat is leading wheat hot cereal, with unique positioning versus oatmeal The brand has a long operating history and enjoys high brand awareness Attractive profit margins and cash flow generation EBITDA margins exceed 50% Business has minimal maintenance capital expenditure and working capital needs on an ongoing basis Significant tax benefit of the asset step-up from the acquisition increases already strong cash flow profile Orphan brand within a large parent Opportunities exist to improve performance of the brand through increased focus and resources Cream of Wheat was not a significant contributor to Kraft performance or focus of their direct sales force Complementary to B&G Foods’ products and sales channels B&G Foods has extensive expertise in managing the production and distribution of shelf stable food brands in the U.S. and abroad Cream of Wheat distribution fits well with B&G Foods’ established channel network Cream of Wheat Transaction Rationale |
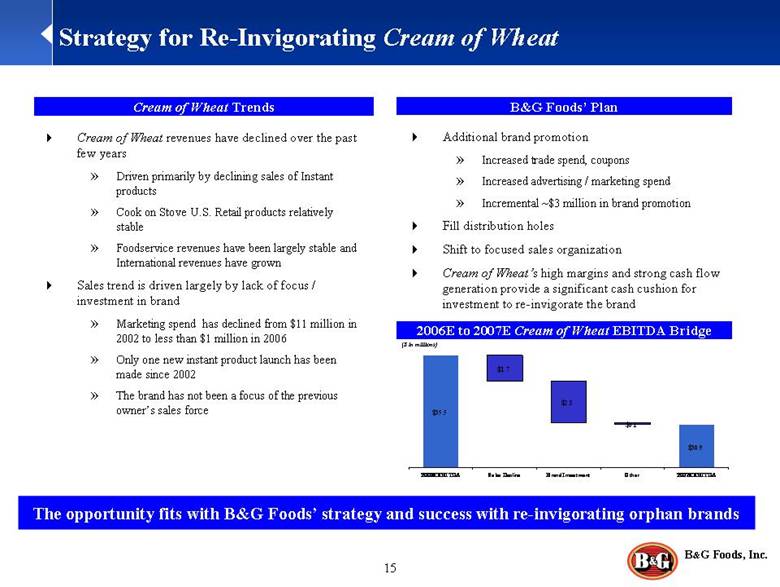
Strategy for Re-Invigorating Cream of Wheat Cream of Wheat Trends B&G Foods’ Plan Additional brand promotion Increased trade spend, coupons Increased advertising / marketing spend Incremental ~$3 million in brand promotion Fill distribution holes Shift to focused sales organization Cream of Wheat’s high margins and strong cash flow generation provide a significant cash cushion for investment to re-invigorate the brand The opportunity fits with B&G Foods’ strategy and success with re-invigorating orphan brands Cream of Wheat revenues have declined over the past few years Driven primarily by declining sales of Instant products Cook on Stove U.S. Retail products relatively stable Foodservice revenues have been largely stable and International revenues have grown Sales trend is driven largely by lack of focus / investment in brand Marketing spend has declined from $11 million in 2002 to less than $1 million in 2006 Only one new instant product launch has been made since 2002 The brand has not been a focus of the previous owner’s sales force 2006E to 2007E Cream of Wheat EBITDA Bridge ($ in millions) $35.5 $30.9 $1.7 $2.8 $0.1 2006E EBITDA Sales Decline Brand Investment Other 2007E EBITDA |
B&G Foods, Inc. Business Update David Wenner |
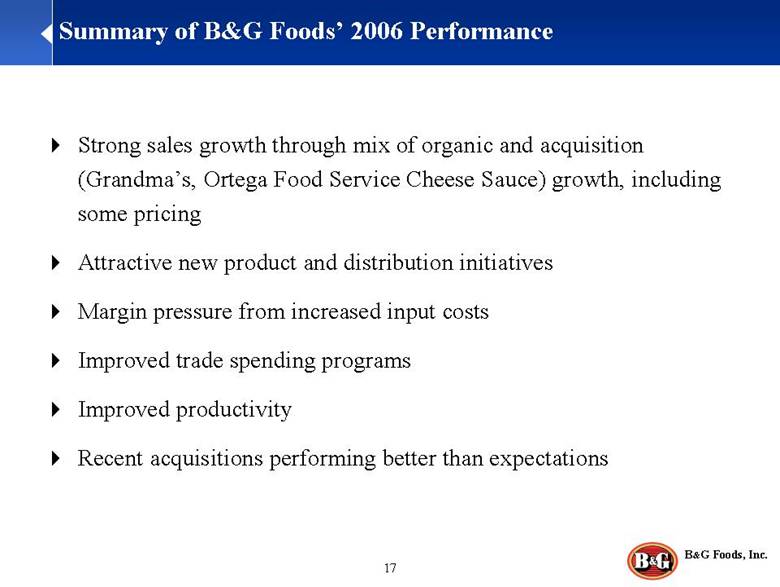
Summary of B&G Foods’ 2006 Performance Strong sales growth through mix of organic and acquisition (Grandma’s, Ortega Food Service Cheese Sauce) growth, including some pricing Attractive new product and distribution initiatives Margin pressure from increased input costs Improved trade spending programs Improved productivity Recent acquisitions performing better than expectations |
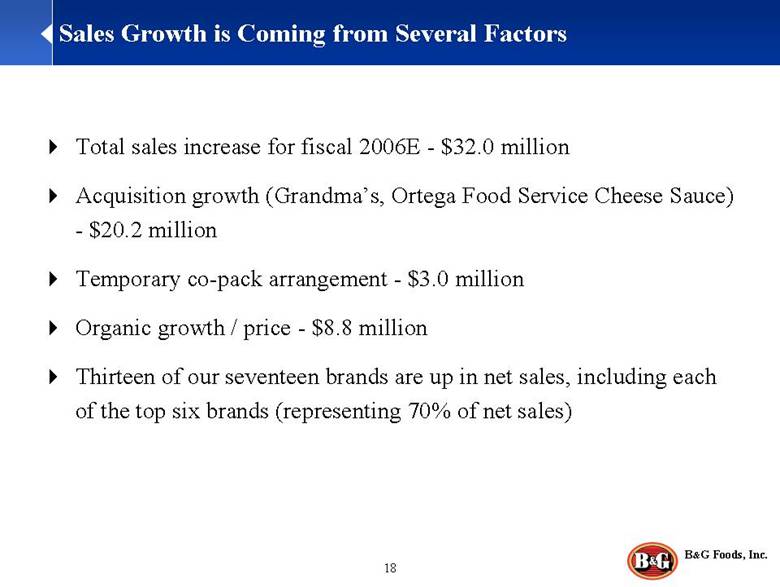
Sales Growth is Coming from Several Factors Total sales increase for fiscal 2006E - $32.0 million Acquisition growth (Grandma’s, Ortega Food Service Cheese Sauce) - $20.2 million Temporary co-pack arrangement - $3.0 million Organic growth / price - $8.8 million Thirteen of our seventeen brands are up in net sales, including each of the top six brands (representing 70% of net sales) |
Attractive New Product & Distribution Initiatives 2005 / 2006 New Products Have Driven Growth $4.0 million (2006E) $8.5 million (2006E) $2.0 million (2006E) |
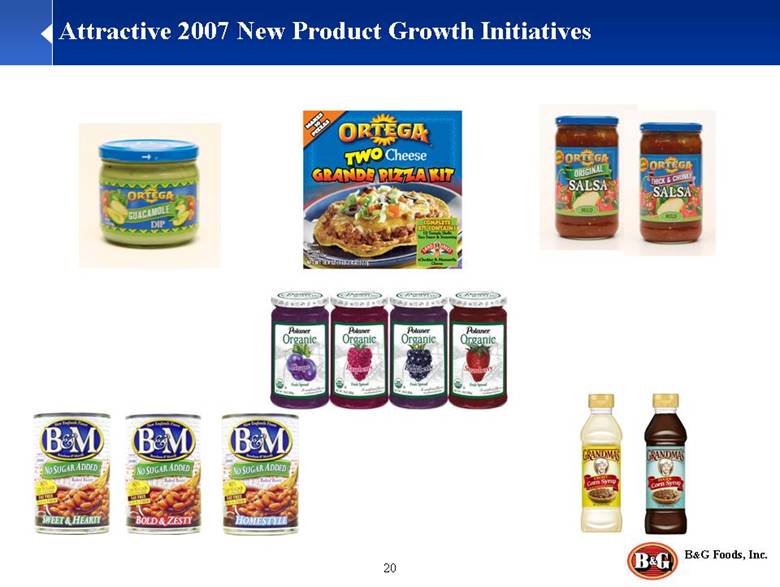
Attractive 2007 New Product Growth Initiatives |
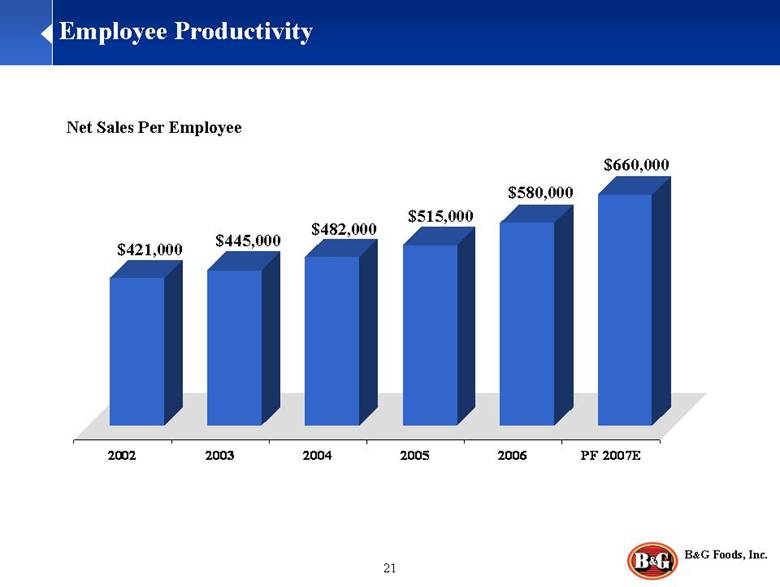
Employee Productivity Net Sales Per Employee $421,000 $445,000 $482,000 $515,000 $580,000 $660,000 2002 2003 2004 2005 2006 PF 2007E |
B&G Foods has Achieved Price Increases & Cost Reductions Price increases of approximately $6.5 million Pay-for-performance trade initiative Trade spending down 1.1% of gross sales Plant consolidation Full year of Hurlock / Trappey combination Grandma’s molasses production in-house Out-sourced DSO sales function to broker 2006: |
Recent Acquisition Status B&G Foods has made two successful acquisitions in the past fourteen months: Ortega Food Service Cheese Sauce Business from Nestlé Grandma’s Molasses Brand from Cadbury Schweppes Both acquisitions are performing better than expected Sales ahead of prior owners’ performance Cost reductions and margin improvements achieved Grandma’s manufacturing integrated into B&G Foods Roseland facility |
B&G Foods, Inc. Key Credit Strengths David Wenner |
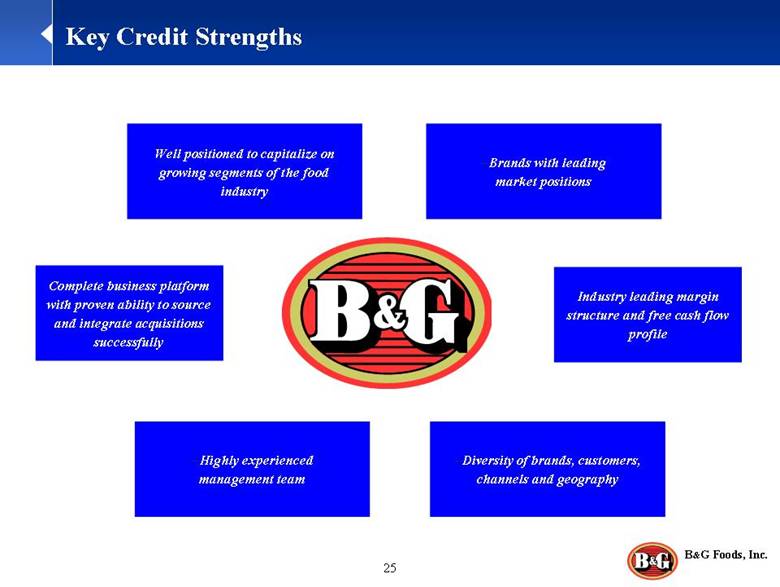
Key Credit Strengths Well positioned to capitalize on growing segments of the food industry Brands with leading market positions Industry leading margin structure and free cash flow profile Highly experienced management team Diversity of brands, customers, channels and geography Complete business platform with proven ability to source and integrate acquisitions successfully |
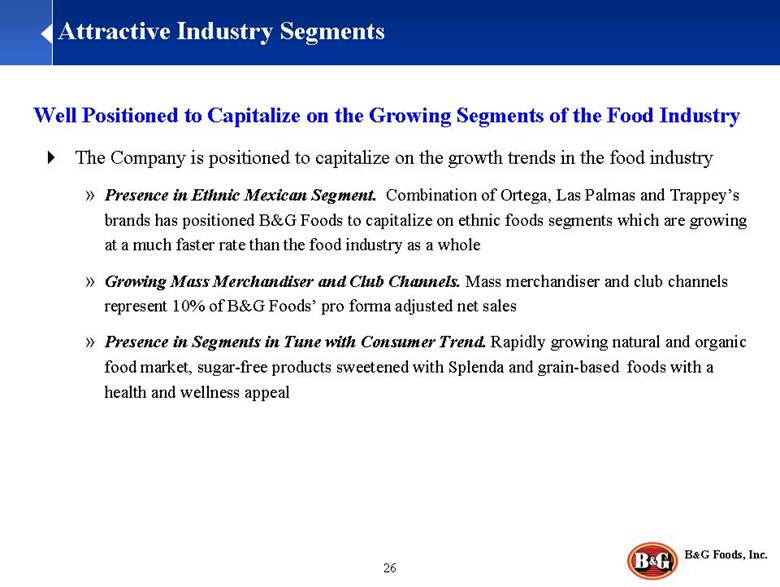
Well Positioned to Capitalize on the Growing Segments of the Food Industry The Company is positioned to capitalize on the growth trends in the food industry Presence in Ethnic Mexican Segment. Combination of Ortega, Las Palmas and Trappey’s brands has positioned B&G Foods to capitalize on ethnic foods segments which are growing at a much faster rate than the food industry as a whole Growing Mass Merchandiser and Club Channels. Mass merchandiser and club channels represent 10% of B&G Foods’ pro forma adjusted net sales Presence in Segments in Tune with Consumer Trend. Rapidly growing natural and organic food market, sugar-free products sweetened with Splenda and grain-based foods with a health and wellness appeal Attractive Industry Segments |
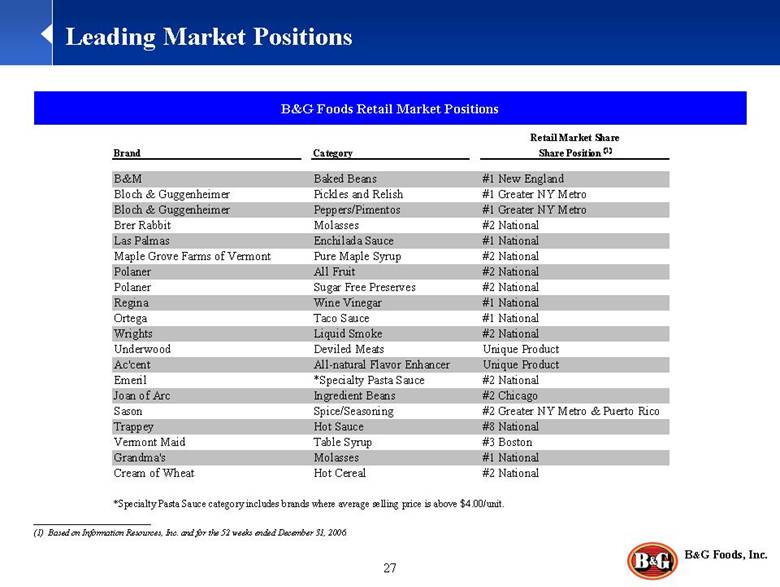
Leading Market Positions B&G Foods Retail Market Positions ___________________________ (1) Based on Information Resources, Inc. and for the 52 weeks ended December 31, 2006. Retail Market Share Brand Category Share Position (1) B&M Baked Beans #1 New England Bloch & Guggenheimer Pickles and Relish #1 Greater NY Metro Bloch & Guggenheimer Peppers/Pimentos #1 Greater NY Metro Brer Rabbit Molasses #2 National Las Palmas Enchilada Sauce #1 National Maple Grove Farms of Vermont Pure Maple Syrup #2 National Polaner All Fruit #2 National Polaner Sugar Free Preserves #2 National Regina Wine Vinegar #1 National Ortega Taco Sauce #1 National Wrights Liquid Smoke #2 National Underwood Deviled Meats Unique Product Ac'cent All-natural Flavor Enhancer Unique Product Emeril *Specialty Pasta Sauce #2 National Joan of Arc Ingredient Beans #2 Chicago Sason Spice/Seasoning #2 Greater NY Metro & Puerto Rico Trappey Hot Sauce #8 National Vermont Maid Table Syrup #3 Boston Grandma's Molasses #1 National Cream of Wheat Hot Cereal #2 National *Specialty Pasta Sauce category includes brands where average selling price is above $4.00/unit. |
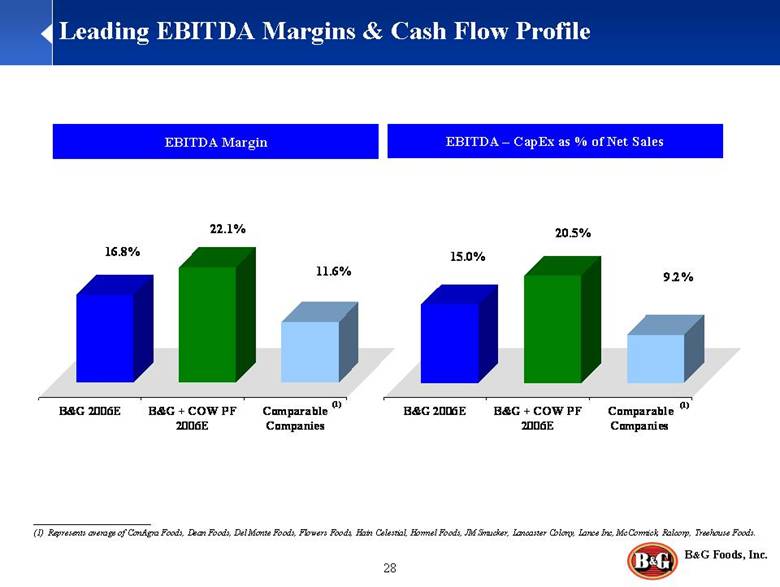
Leading EBITDA Margins & Cash Flow Profile EBITDA Margin EBITDA – CapEx as % of Net Sales (1) (1) ___________________________ (1) Represents average of ConAgra Foods, Dean Foods, Del Monte Foods, Flowers Foods, Hain Celestial, Hormel Foods, JM Smucker, Lancaster Colony, Lance Inc, McCormick, Ralcorp, Treehouse Foods. 16.8% 22.1% 11.6% B&G 2006E B&G + COW PF 2006E Comparable Companies 15.0% 20.5% 9.2% B&G 2006E B&G + COW PF 2006E Comparable Companies |
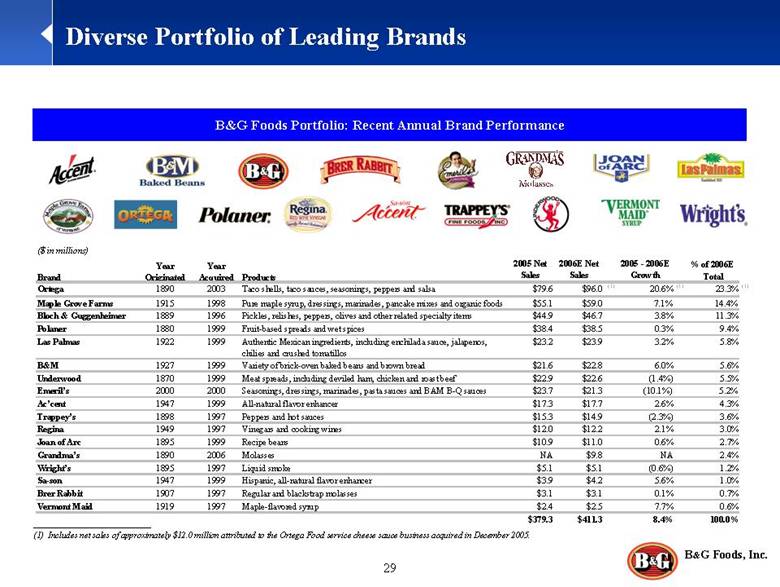
Diverse Portfolio of Leading Brands B&G Foods Portfolio: Recent Annual Brand Performance ($ in millions) ___________________________ (1) Includes net sales of approximately $12.0 million attributed to the Ortega Food service cheese sauce business acquired in December 2005. 2005 Net 2006E Net 2005 - 2006E % of 2006E Sales Sales Growth Total Ortega 1890 2003 Taco shells, taco sauces, seasonings, peppers and salsa $79.6 $96.0 (1) 20.6% (1) 23.3% (1) Maple Grove Farms 1915 1998 Pure maple syrup, dressings, marinades, pancake mixes and organic foods $55.1 $59.0 7.1% 14.4% Bloch & Guggenheimer 1889 1996 Pickles, relishes, peppers, olives and other related specialty items $44.9 $46.7 3.8% 11.3% Polaner 1880 1999 Fruit-based spreads and wet spices $38.4 $38.5 0.3% 9.4% Las Palmas 1922 1999 Authentic Mexican ingredients, including enchilada sauce, jalapenos, chilies and crushed tomatillos $23.2 $23.9 3.2% 5.8% B&M 1927 1999 Variety of brick-oven baked beans and brown bread $21.6 $22.8 6.0% 5.6% Underwood 1870 1999 Meat spreads, including deviled ham, chicken and roast beef $22.9 $22.6 (1.4%) 5.5% Emeril’s 2000 2000 Seasonings, dressings, marinades, pasta sauces and BAM B-Q sauces $23.7 $21.3 (10.1%) 5.2% Ac’cent 1947 1999 All-natural flavor enhancer $17.3 $17.7 2.6% 4.3% Trappey’s 1898 1997 Peppers and hot sauces $15.3 $14.9 (2.3%) 3.6% Regina 1949 1997 Vinegars and cooking wines $12.0 $12.2 2.1% 3.0% Joan of Arc 1895 1999 Recipe beans $10.9 $11.0 0.6% 2.7% Grandma’s 1890 2006 Molasses NA $9.8 NA 2.4% Wright’s 1895 1997 Liquid smoke $5.1 $5.1 (0.6%) 1.2% Sa-son 1947 1999 Hispanic, all-natural flavor enhancer $3.9 $4.2 5.6% 1.0% Brer Rabbit 1907 1997 Regular and blackstrap molasses $3.1 $3.1 0.1% 0.7% Vermont Maid 1919 1997 Maple-flavored syrup $2.4 $2.5 7.7% 0.6% $379.3 $411.3 8.4% 100.0% Brand Year Originated Year Acquired Products |
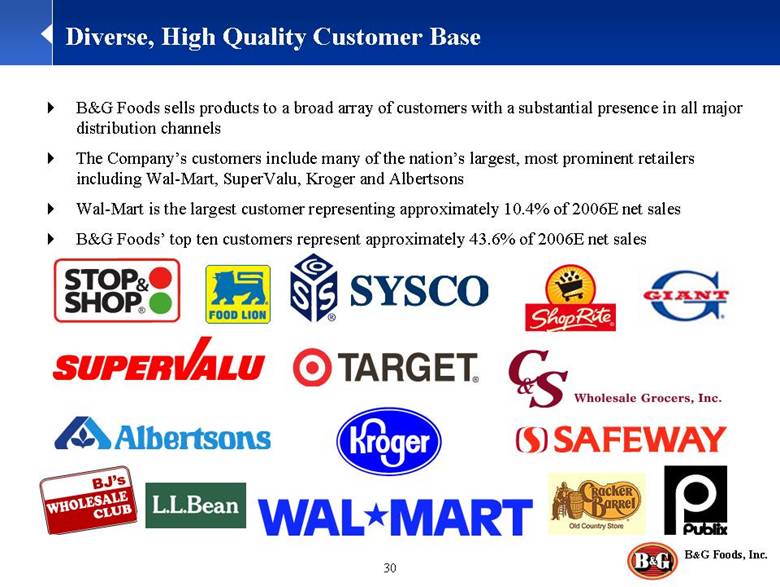
Diverse, High Quality Customer Base B&G Foods sells products to a broad array of customers with a substantial presence in all major distribution channels The Company’s customers include many of the nation’s largest, most prominent retailers including Wal-Mart, SuperValu, Kroger and Albertsons Wal-Mart is the largest customer representing approximately 10.4% of 2006E net sales B&G Foods’ top ten customers represent approximately 43.6% of 2006E net sales |
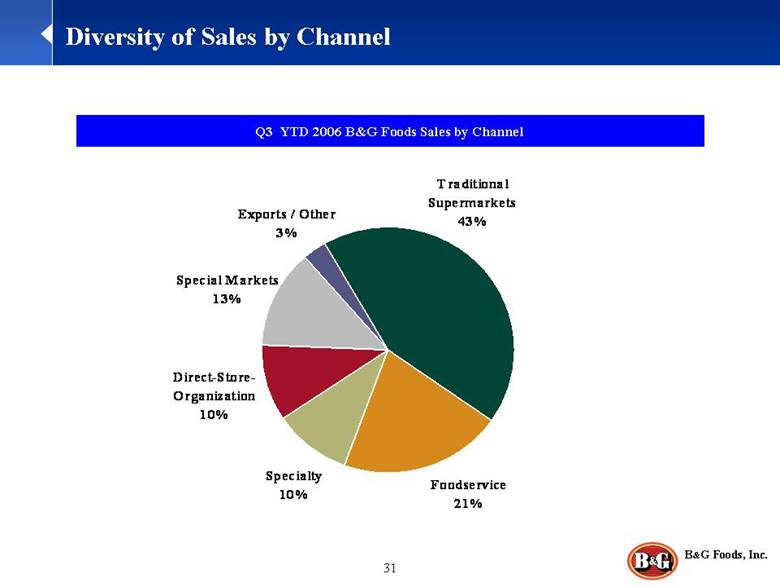
Diversity of Sales by Channel Q3 YTD 2006 B&G Foods Sales by Channel Foodservice 21% Special Markets 13% Exports / Other 3% Direct-Store- Organization 10% Traditional Supermarkets 43% Specialty 10% |
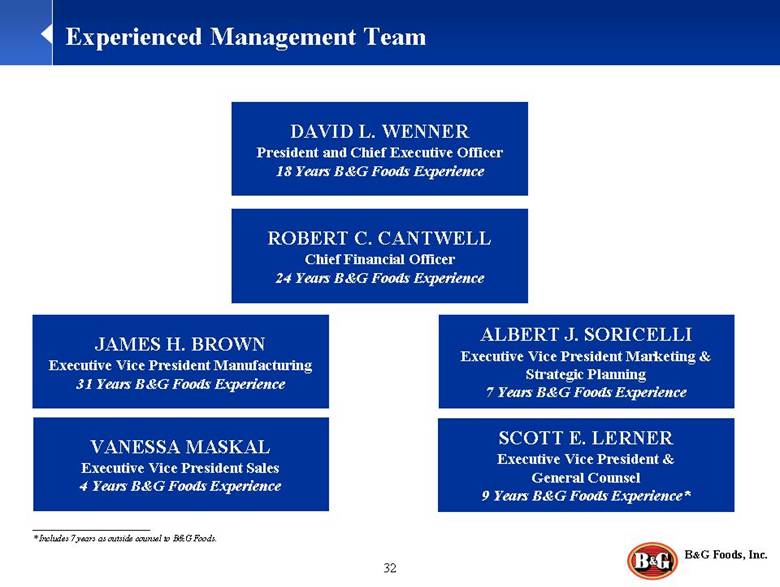
Experienced Management Team DAVID L. WENNER President and Chief Executive Officer 18 Years B&G Foods Experience VANESSA MASKAL Executive Vice President Sales 4 Years B&G Foods Experience ROBERT C. CANTWELL Chief Financial Officer 24 Years B&G Foods Experience JAMES H. BROWN Executive Vice President Manufacturing 31 Years B&G Foods Experience ALBERT J. SORICELLI Executive Vice President Marketing & Strategic Planning 7 Years B&G Foods Experience SCOTT E. LERNER Executive Vice President & General Counsel 9 Years B&G Foods Experience* ___________________________ * Includes 7 years as outside counsel to B&G Foods. |
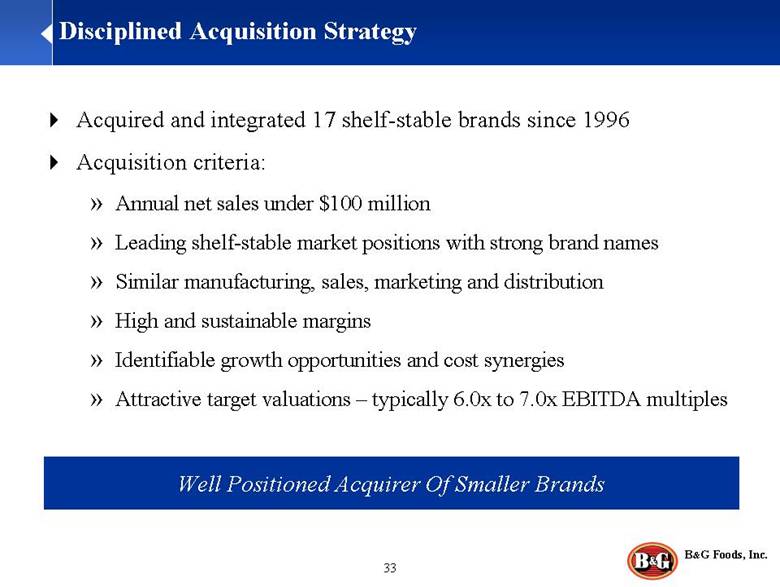
Disciplined Acquisition Strategy Acquired and integrated 17 shelf-stable brands since 1996 Acquisition criteria: Annual net sales under $100 million Leading shelf-stable market positions with strong brand names Similar manufacturing, sales, marketing and distribution High and sustainable margins Identifiable growth opportunities and cost synergies Attractive target valuations – typically 6.0x to 7.0x EBITDA multiples Well Positioned Acquirer Of Smaller Brands |
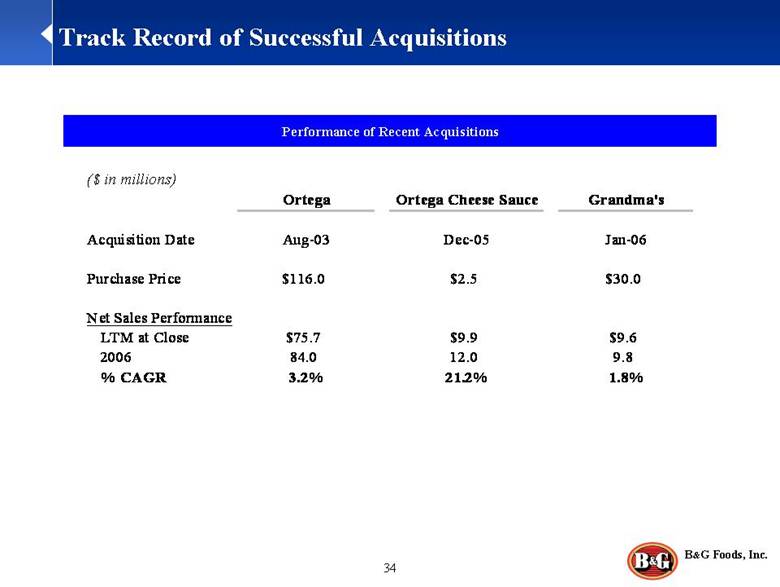
Track Record of Successful Acquisitions Performance of Recent Acquisitions ($ in millions) Ortega Ortega Cheese Sauce Grandma's Acquisition Date Aug-03 Dec-05 Jan-06 Purchase Price $116.0 $2.5 $30.0 Net Sales Performance LTM at Close $75.7 $9.9 $9.6 2006 84.0 12.0 9.8 % CAGR 3.2% 21.2% 1.8% |
B&G Foods, Inc. Financial Review Robert Cantwell |
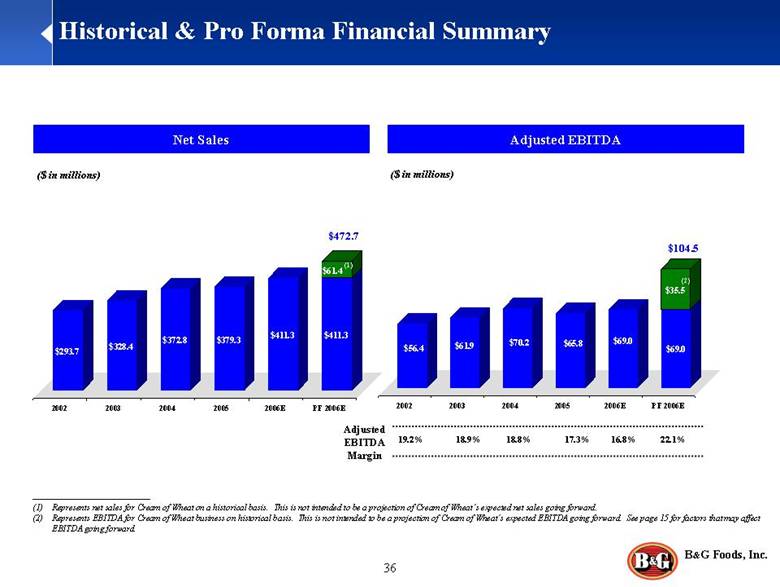
Historical & Pro Forma Financial Summary ($ in millions) ($ in millions) Adjusted EBITDA Margin 19.2% 18.9% 18.8% 17.3% 16.8% 22.1% Net Sales Adjusted EBITDA $472.7 $104.5 ___________________________ Represents net sales for Cream of Wheat on a historical basis. This is not intended to be a projection of Cream of Wheat’s expected net sales going forward. Represents EBITDA for Cream of Wheat business on historical basis. This is not intended to be a projection of Cream of Wheat’s expected EBITDA going forward. See page 15 for factors that may affect EBITDA going forward. (2) (1) $56.4 $61.9 $70.2 $65.8 $69.0 $69.0 $35.5 2002 2003 2004 2005 2006E PF 2006E $293.7 $328.4 $372.8 $379.3 $411.3 $411.3 $61.4 2002 2003 2004 2005 2006E PF 2006E |
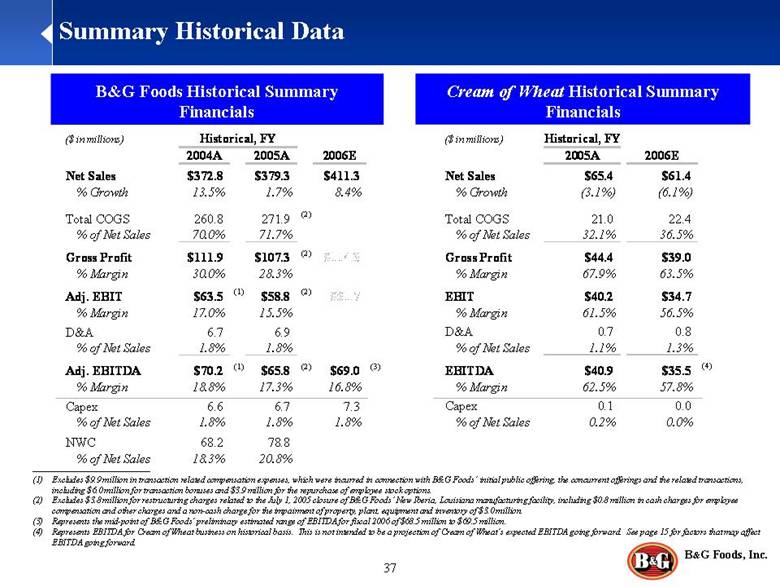
Summary Historical Data B&G Foods Historical Summary Financials ($ in millions) Historical, FY 2004A 2005A 2006E Net Sales $372.8 $379.3 $411.3 % Growth 13.5% 1.7% 8.4% Total COGS 260.8 271.9 (2) % of Net Sales 70.0% 71.7% Gross Profit $111.9 $107.3 (2) % Margin 30.0% 28.3% Adj. EBIT $63.5 (1) $58.8 (2) $61.7 % Margin 17.0% 15.5% 15.0% D&A 6.7 6.9 7.3 % of Net Sales 1.8% 1.8% 1.8% Adj. EBITDA $70.2 (1) $65.8 (2) $69.0 (3) % Margin 18.8% 17.3% 16.8% Capex 6.6 6.7 7.3 % of Net Sales 1.8% 1.8% 1.8% NWC 68.2 78.8 74.7 % of Net Sales 18.3% 20.8% Cream of Wheat Historical Summary Financials ($ in millions) Historical, FY 2005A 2006E Net Sales $65.4 $61.4 % Growth (3.1%) (6.1%) Total COGS 21.0 22.4 % of Net Sales 32.1% 36.5% Gross Profit $44.4 $39.0 % Margin 67.9% 63.5% EBIT $40.2 $34.7 % Margin 61.5% 56.5% D&A 0.7 0.8 % of Net Sales 1.1% 1.3% EBITDA $40.9 $35.5 (4) % Margin 62.5% 57.8% Capex 0.1 0.0 % of Net Sales 0.2% 0.0% ___________________________ (1) Excludes $9.9 million in transaction related compensation expenses, which were incurred in connection with B&G Foods’ initial public offering, the concurrent offerings and the related transactions, including $6.0 million for transaction bonuses and $3.9 million for the repurchase of employee stock options. (2) Excludes $3.8 million for restructuring charges related to the July 1, 2005 closure of B&G Foods’ New Iberia, Louisiana manufacturing facility, including $0.8 million in cash charges for employee compensation and other charges and a non-cash charge for the impairment of property, plant, equipment and inventory of $3.0 million. (3) Represents the mid-point of B&G Foods’ preliminary estimated range of EBITDA for fiscal 2006 of $68.5 million to $69.5 million. (4) Represents EBITDA for Cream of Wheat business on historical basis. This is not intended to be a projection of Cream of Wheat’s expected EBITDA going forward. See page 15 for factors that may affect EBITDA going forward. |
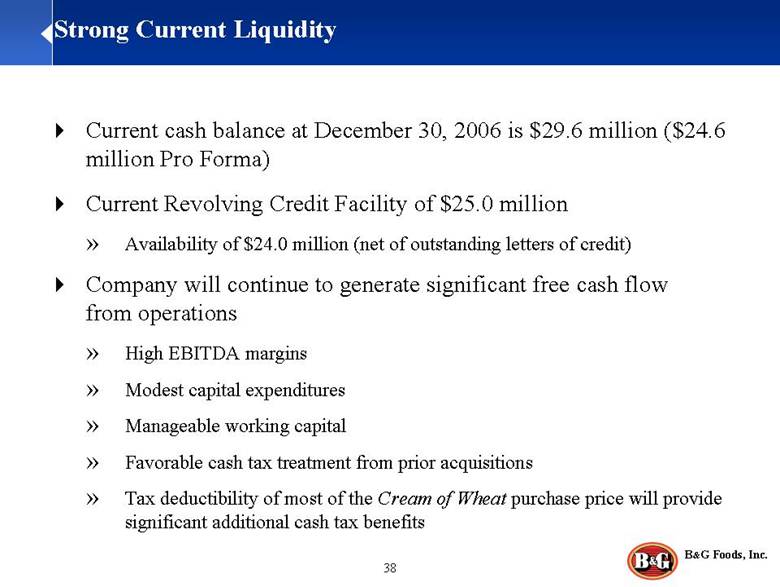
Current cash balance at December 30, 2006 is $29.6 million ($24.6 million Pro Forma) Current Revolving Credit Facility of $25.0 million Availability of $24.0 million (net of outstanding letters of credit) Company will continue to generate significant free cash flow from operations High EBITDA margins Modest capital expenditures Manageable working capital Favorable cash tax treatment from prior acquisitions Tax deductibility of most of the Cream of Wheat purchase price will provide significant additional cash tax benefits Strong Current Liquidity |
B&G Foods, Inc. Overview of Credit Facilities Chip Heflin |
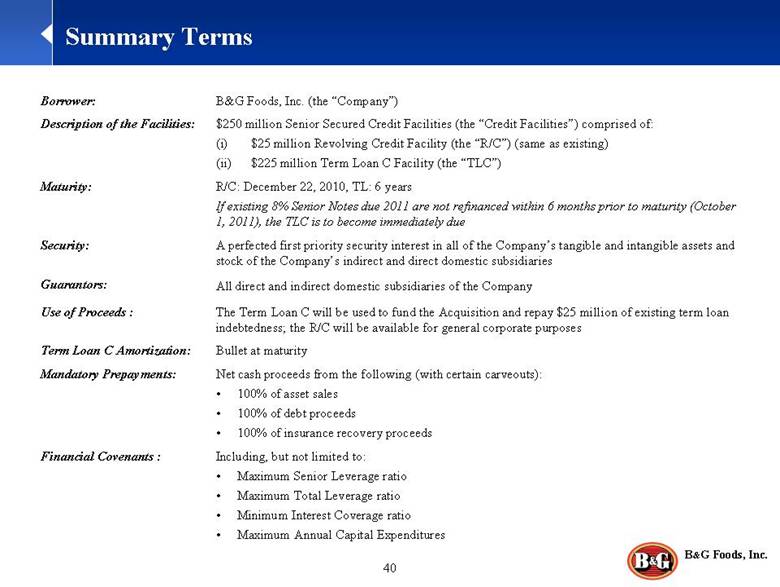
Summary Terms R/C: December 22, 2010, TL: 6 years If existing 8% Senior Notes due 2011 are not refinanced within 6 months prior to maturity (October 1, 2011), the TLC is to become immediately due Maturity: A perfected first priority security interest in all of the Company’s tangible and intangible assets and stock of the Company’s indirect and direct domestic subsidiaries Security: All direct and indirect domestic subsidiaries of the Company Guarantors: Bullet at maturity Term Loan C Amortization: The Term Loan C will be used to fund the Acquisition and repay $25 million of existing term loan indebtedness; the R/C will be available for general corporate purposes Use of Proceeds : $250 million Senior Secured Credit Facilities (the “Credit Facilities”) comprised of: (i) $25 million Revolving Credit Facility (the “R/C”) (same as existing) (ii) $225 million Term Loan C Facility (the “TLC”) Description of the Facilities: Including, but not limited to: • Maximum Senior Leverage ratio • Maximum Total Leverage ratio • Minimum Interest Coverage ratio • Maximum Annual Capital Expenditures Financial Covenants : Net cash proceeds from the following (with certain carveouts): • 100% of asset sales • 100% of debt proceeds • 100% of insurance recovery proceeds Mandatory Prepayments: B&G Foods, Inc. (the “Company”) Borrower: |
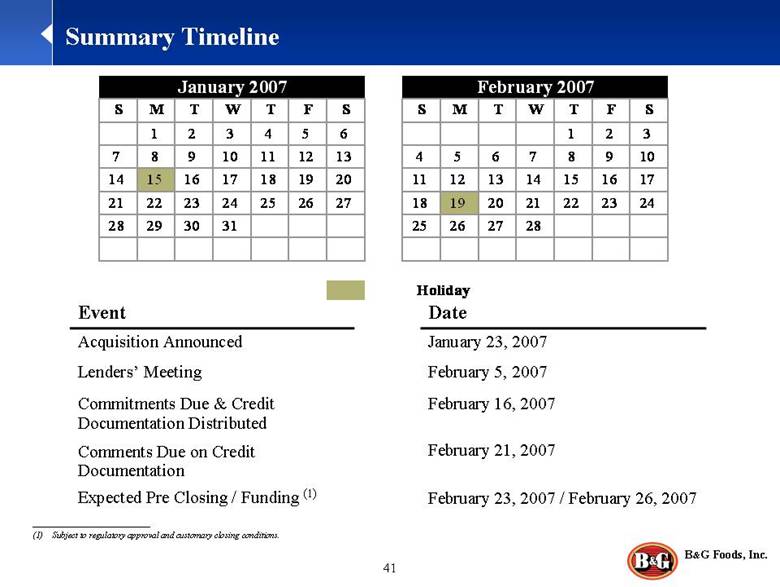
Summary Timeline February 5, 2007 Lenders’ Meeting January 23, 2007 Acquisition Announced February 23, 2007 / February 26, 2007 Expected Pre Closing / Funding (1) February 16, 2007 February 21, 2007 Commitments Due & Credit Documentation Distributed Comments Due on Credit Documentation Date Event ___________________________ (1) Subject to regulatory approval and customary closing conditions. S M T W T F S S M T W T F S 1 2 3 4 5 6 1 2 3 7 8 9 10 11 12 13 4 5 6 7 8 9 10 14 15 16 17 18 19 20 11 12 13 14 15 16 17 21 22 23 24 25 26 27 18 19 20 21 22 23 24 28 29 30 31 25 26 27 28 Holiday January 2007 February 2007 |
B&G Foods, Inc. Summary and Q&A David Wenner |
Key Credit Strengths Well positioned to capitalize on growing segments of the food industry Brands with leading market positions Industry leading margin structure and free cash flow profile Highly experienced management team Diversity of brands, customers, channels and geography Complete business platform with proven ability to source and integrate acquisitions successfully |
B&G Foods, Inc. Appendix |
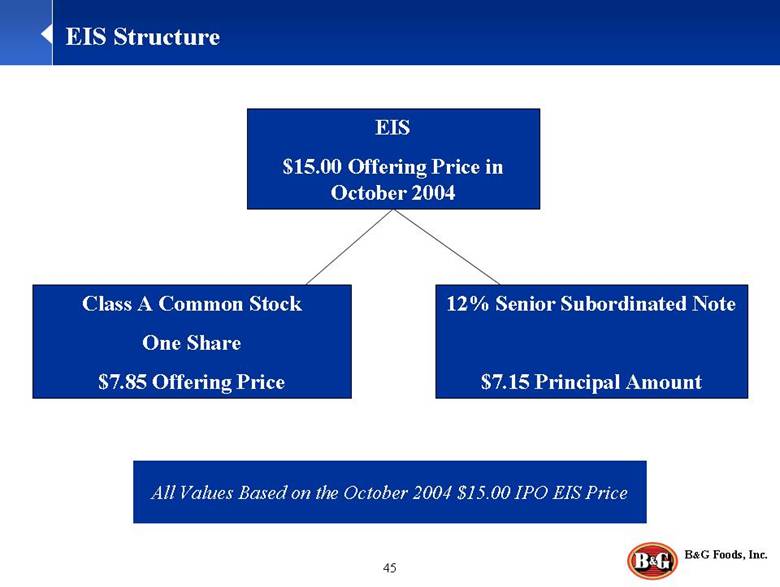
EIS Structure EIS $15.00 Offering Price in October 2004 Class A Common Stock One Share $7.85 Offering Price 12% Senior Subordinated Note $7.15 Principal Amount All Values Based on the October 2004 $15.00 IPO EIS Price |
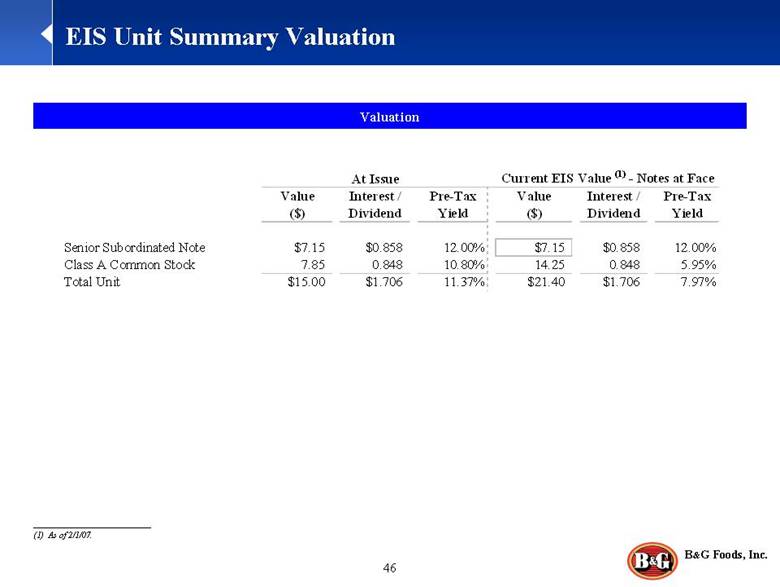
EIS Unit Summary Valuation Valuation As of 2/1/07. 46 At Issue Current EIS Value (1) - Notes at Face Value Interest / Pre-Tax Value Interest / Pre-Tax ($) Dividend Yield ($) Dividend Yield Senior Subordinated Note $7.15 $0.858 12.00% $7.15 $0.858 12.00% Class A Common Stock 7.85 0.848 10.80% 14.25 0.848 5.95% Total Unit $15.00 $1.706 11.37% $21.40 $1.706 7.97% |
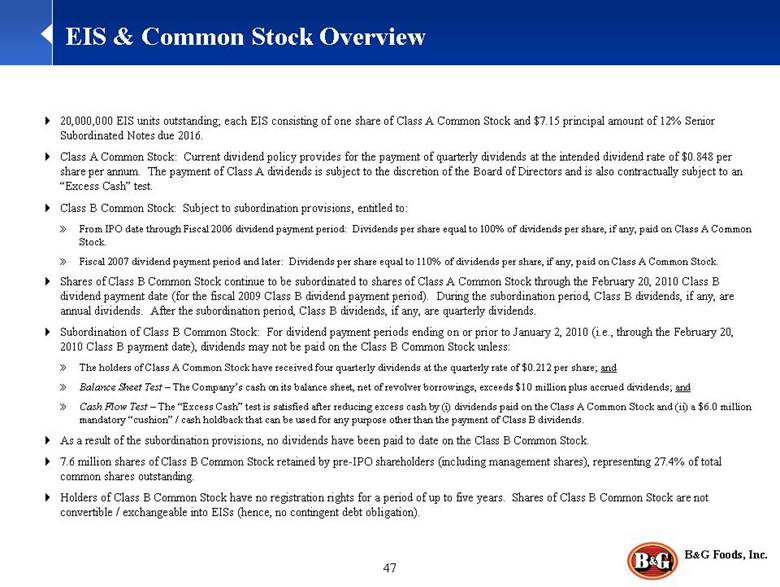
EIS & Common Stock Overview 20,000,000 EIS units outstanding; each EIS consisting of one share of Class A Common Stock and $7.15 principal amount of 12% Senior Subordinated Notes due 2016. Class A Common Stock: Current dividend policy provides for the payment of quarterly dividends at the intended dividend rate of $0.848 per share per annum. The payment of Class A dividends is subject to the discretion of the Board of Directors and is also contractually subject to an “Excess Cash” test. Class B Common Stock: Subject to subordination provisions, entitled to: From IPO date through Fiscal 2006 dividend payment period: Dividends per share equal to 100% of dividends per share, if any, paid on Class A Common Stock. Fiscal 2007 dividend payment period and later: Dividends per share equal to 110% of dividends per share, if any, paid on Class A Common Stock. Shares of Class B Common Stock continue to be subordinated to shares of Class A Common Stock through the February 20, 2010 Class B dividend payment date (for the fiscal 2009 Class B dividend payment period). During the subordination period, Class B dividends, if any, are annual dividends. After the subordination period, Class B dividends, if any, are quarterly dividends. Subordination of Class B Common Stock: For dividend payment periods ending on or prior to January 2, 2010 (i.e., through the February 20, 2010 Class B payment date), dividends may not be paid on the Class B Common Stock unless: The holders of Class A Common Stock have received four quarterly dividends at the quarterly rate of $0.212 per share; and Balance Sheet Test – The Company’s cash on its balance sheet, net of revolver borrowings, exceeds $10 million plus accrued dividends; and Cash Flow Test – The “Excess Cash” test is satisfied after reducing excess cash by (i) dividends paid on the Class A Common Stock and (ii) a $6.0 million mandatory “cushion” / cash holdback that can be used for any purpose other than the payment of Class B dividends. As a result of the subordination provisions, no dividends have been paid to date on the Class B Common Stock. 7.6 million shares of Class B Common Stock retained by pre-IPO shareholders (including management shares), representing 27.4% of total common shares outstanding. Holders of Class B Common Stock have no registration rights for a period of up to five years. Shares of Class B Common Stock are not convertible / exchangeable into EISs (hence, no contingent debt obligation). |
B&G Foods, Inc. |