Exhibit 99.1
| Piper Jaffray Consumer Conference June 10, 2009 |
| 1 Forward-Looking Statements Statements in this presentation that are not statements of historical or current fact constitute “forward-looking statements.” The forward-looking statements contained in this presentation include, without limitation, statements related to our expectations regarding costs, including commodity and packaging costs, and our ability to potentially offset cost increases with sales price increases and cost reductions; the level of free cash flow available for dividend payments and deleveraging; and our projections regarding EBITDA, net sales, margin, cash taxes, cash interest expense, capital expenditures and excess cash flow before dividends for 2009. Such forward-looking statements involve known and unknown risks, uncertainties and other unknown factors that could cause the actual results of B&G Foods to be materially different from the historical results or from any future results expressed or implied by such forward-looking statements. In addition to statements that explicitly describe such risks and uncertainties readers are urged to consider statements labeled with the terms “believes,” “belief,” “expects,” “intends,” “anticipates,” “projects” or “plans” to be uncertain and forward-looking. The forward-looking statements contained in this presentation are also subject generally to other risks and uncertainties that are described from time to time in B&G Foods’ filings with the Securities and Exchange Commission, including under Item 1A, “Risk Factors” in our Annual Report on Form 10-K for fiscal 2008 filed on March 5, 2009. We undertake no obligation to publicly update or revise any forward-looking statement, whether as a result of new information, future events or otherwise. |
| 2 About Non-GAAP Financial Measures Certain disclosures in this presentation include “non-GAAP (Generally Accepted Accounting Principles) financial measures.” A non-GAAP financial measure is defined as a numerical measure of financial performance that excludes or includes amounts so as to be different than the most directly comparable measure calculated and presented in accordance with GAAP in B&G Foods’ consolidated balance sheets and related consolidated statements of operations, changes in stockholders’ equity and comprehensive income and cash flows. EBITDA is a measure used by management to measure operating performance. B&G Foods presents EBITDA (net income before net interest expense, income taxes, depreciation and amortization) because management believes that it is useful to eliminate net interest expense, income taxes, depreciation and amortization because it allows management to focus on what it deems to be a more reliable indicator of ongoing operating performance and our ability to generate cash flow from operations. We also present EBITDA because we believe it is a useful indicator of our historical debt capacity and ability to service debt and because covenants in our credit facility, our senior notes indenture and our senior subordinated notes indenture contain ratios based on this measure. As a result, internal management reports used during monthly operating reviews feature the EBITDA metric. However, management uses this metric in conjunction with traditional GAAP operating performance and liquidity measures as part of its overall assessment of company performance and liquidity and therefore does not place undue reliance on this measure as its only measure of operating performance and liquidity. EBITDA is not a recognized term under GAAP and does not purport to be an alternative to operating income or net income as an indicator of operating performance or any other GAAP measure. EBITDA is not a complete net cash flow measure because EBITDA is a measure of liquidity that does not include reductions for cash payments for an entity’s obligation to service its debt, fund its working capital, capital expenditures and acquisitions, if any, and pay its income taxes and dividends, if any. Rather, EBITDA ia a potential indicator of an entity’s ability to fund these cash requirements. EBITDA is also not a complete measure of an entity’s profitability because it does not include costs and expenses for depreciation and amortization, interest and related expenses and income taxes. Because not all companies use identical calculations, this presentation of EBITDA may not be comparable to other similarly titled measures of other companies. However, EBITDA can still be useful in evaluating our performance against our peer companies because management believes this measure provides users with valuable insight into key components of GAAP amounts. Reconciliations of EBITDA with the most directly comparable GAAP measure are included in B&G Foods’ Annual Report on Form 10-K for the fiscal year ended January 3, 2009 filed with the SEC on March 5, 2009, B&G Foods’ Annual Report on Form 10-K for the fiscal year ended December 29, 2007 filed with the SEC on March 6, 2008, and B&G Foods’ Quarterly Report on Form 10-Q for the Quarterly Period ended April 4, 2009 filed with the SEC on April 28, 2009. A copy of these filings may be viewed at B&G Foods’ website at www.bgfoods.com under “Investor Relations—SEC Filings.” |
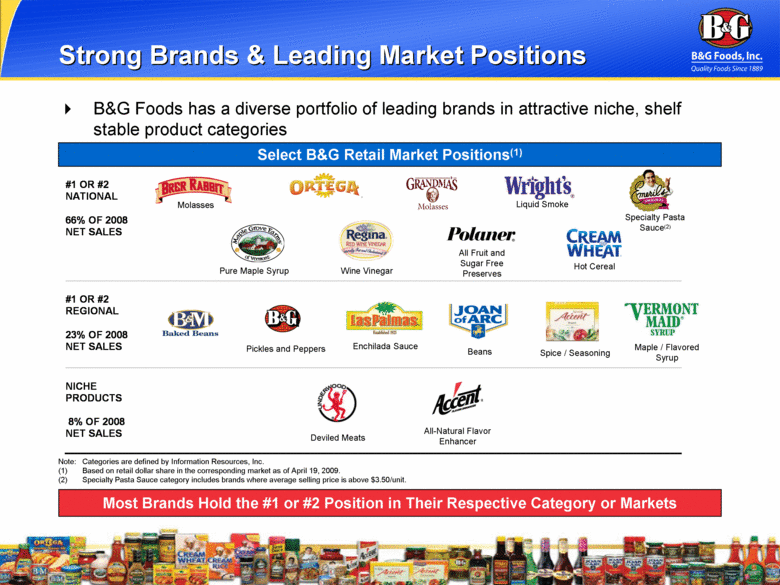
| 3 Strong Brands & Leading Market Positions Most Brands Hold the #1 or #2 Position in Their Respective Category or Markets Select B&G Retail Market Positions(1) B&G Foods has a diverse portfolio of leading brands in attractive niche, shelf stable product categories Note: Categories are defined by Information Resources, Inc. (1) Based on retail dollar share in the corresponding market as of April 19, 2009. (2) Specialty Pasta Sauce category includes brands where average selling price is above $3.50/unit. Molasses Liquid Smoke Specialty Pasta Sauce(2) Pure Maple Syrup Wine Vinegar All Fruit and Sugar Free Preserves Hot Cereal Pickles and Peppers Enchilada Sauce Beans Spice / Seasoning Maple / Flavored Syrup Deviled Meats All-Natural Flavor Enhancer #1 OR #2 NATIONAL 66% OF 2008 NET SALES #1 OR #2 REGIONAL 23% OF 2008 NET SALES NICHE PRODUCTS 8% OF 2008 NET SALES |
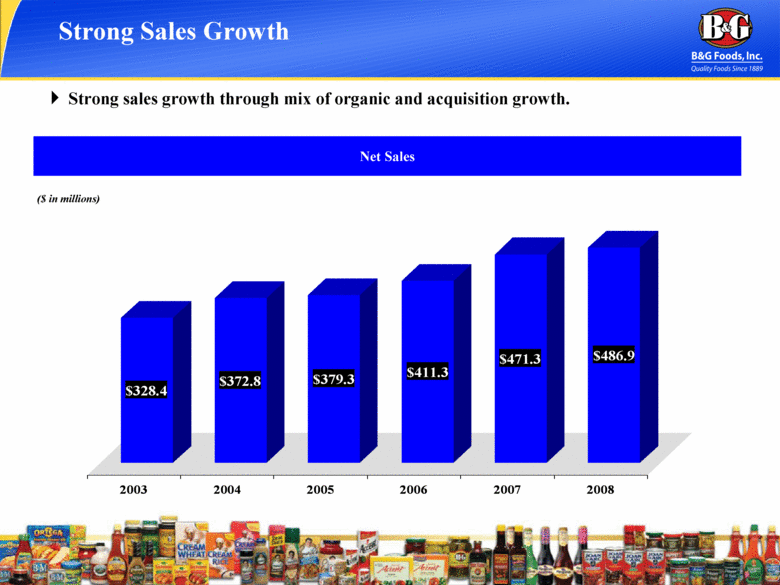
| 4 Strong Sales Growth ($ in millions) Net Sales (2) (1) Strong sales growth through mix of organic and acquisition growth. $328.4 $372.8 $379.3 $411.3 $471.3 $486.9 2003 2004 2005 2006 2007 2008 |
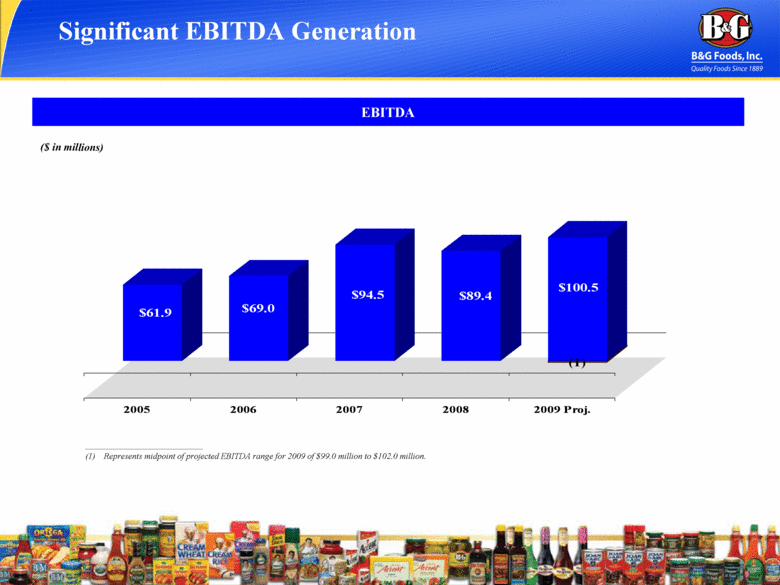
| 5 Significant EBITDA Generation ($ in millions) EBITDA (1) Represents midpoint of projected EBITDA range for 2009 of $99.0 million to $102.0 million. (2) $61.9 $69.0 $94.5 $89.4 $100.5 (1) 2005 2006 2007 2008 2009 Proj. |
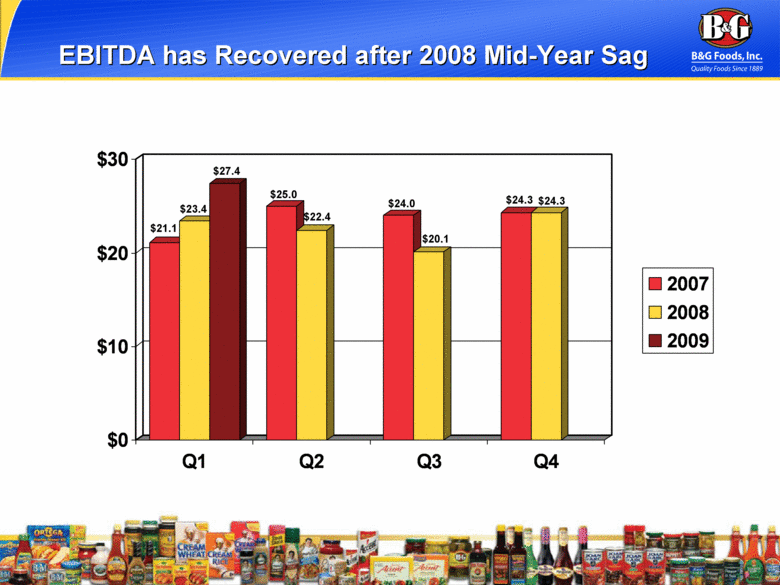
| 6 EBITDA has Recovered after 2008 Mid-Year Sag $21.1 $23.4 $27.4 $25.0 $22.4 $24.0 $20.1 $24.3 $24.3 $0 $10 $20 $30 Q1 Q2 Q3 Q4 2007 2008 2009 |
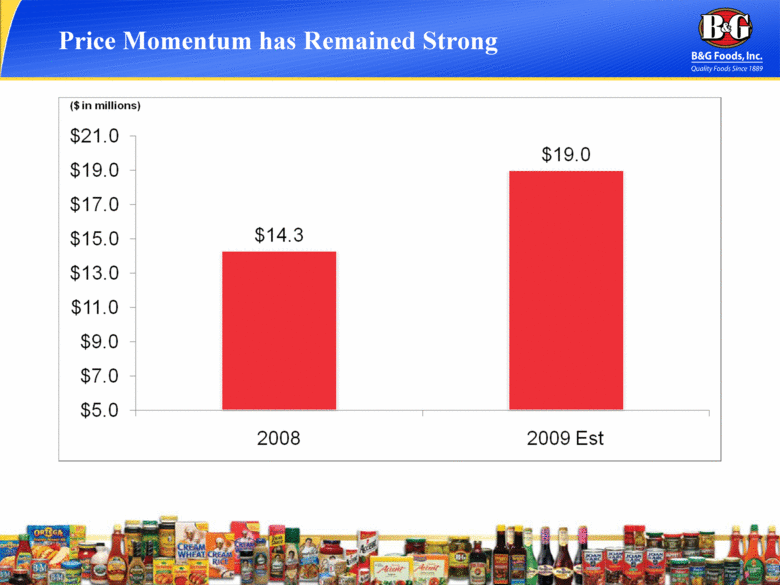
| 7 Price Momentum has Remained Strong (2) (1) |
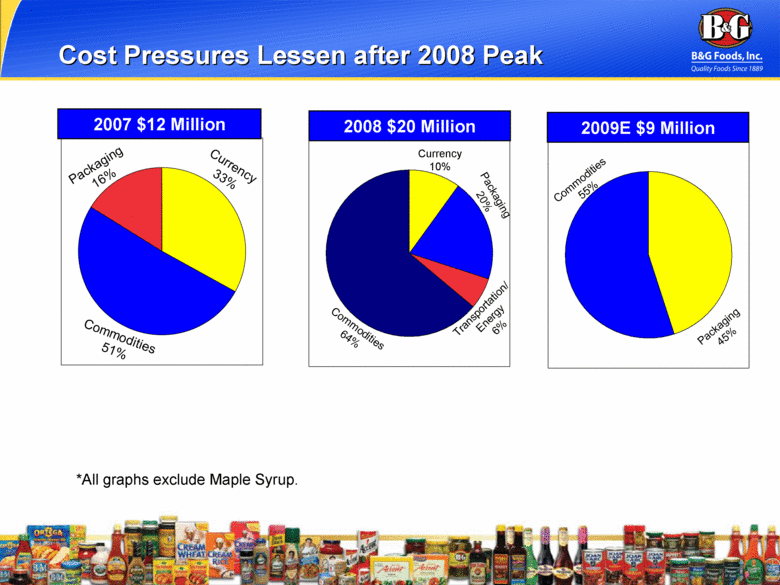
| 8 Cost Pressures Lessen after 2008 Peak Packaging 16% Commodities 51% Currency 33% 2007 $12 Million 2008 $20 Million Packaging 20% Commodities 64% Currency 10% Transportation/ Energy 6% *All graphs exclude Maple Syrup. 2009E $9 Million Packaging 45% Commodities 55% |
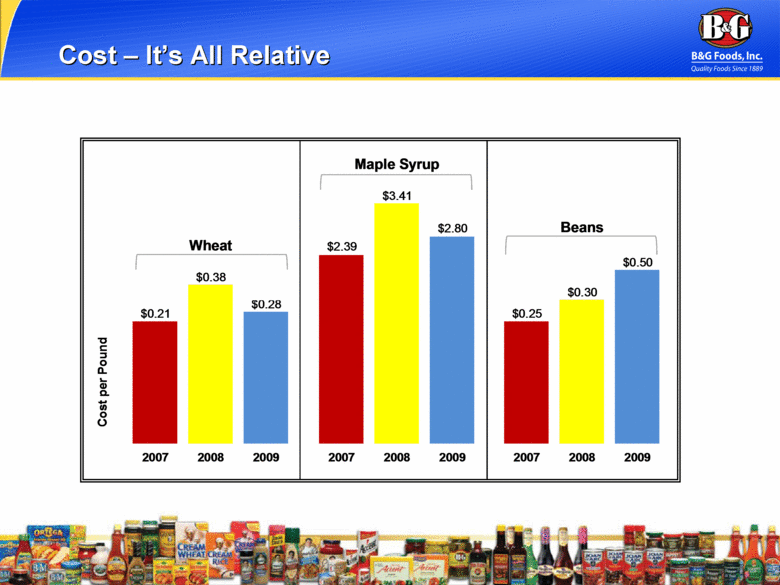
| Cost – It’s All Relative 9 $3.41 $2.80 $2.39 $0.50 $0.38 $0.30 $0.28 Cost per Pound 2007 2008 2009 2007 2008 2009 2007 2008 2009 Wheat Maple Syrup Beans $0.21 $0.25 |
| 10 Attractive New Product Growth Initiatives New Products Focused on Health and At Home Meal Trends |
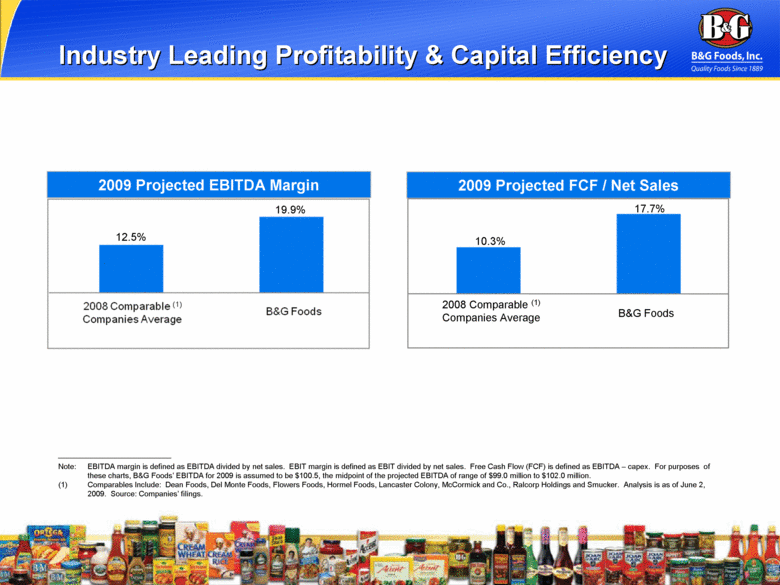
| 11 2009 Projected EBITDA Margin 12.5% 19.9% 2009 Projected FCF / Net Sales 10.3% 17.7% 2008 Comparable (1) Companies Average B&G Foods Note: EBITDA margin is defined as EBITDA divided by net sales. EBIT margin is defined as EBIT divided by net sales. Free Cash Flow (FCF) is defined as EBITDA – capex. For purposes of these charts, B&G Foods’ EBITDA for 2009 is assumed to be $100.5, the midpoint of the projected EBITDA of range of $99.0 million to $102.0 million. (1) Comparables Include: Dean Foods, Del Monte Foods, Flowers Foods, Hormel Foods, Lancaster Colony, McCormick and Co., Ralcorp Holdings and Smucker. Analysis is as of June 2, 2009. Source: Companies’ filings. Industry Leading Profitability & Capital Efficiency 2008 Comparable (1) Companies Average B&G Foods |
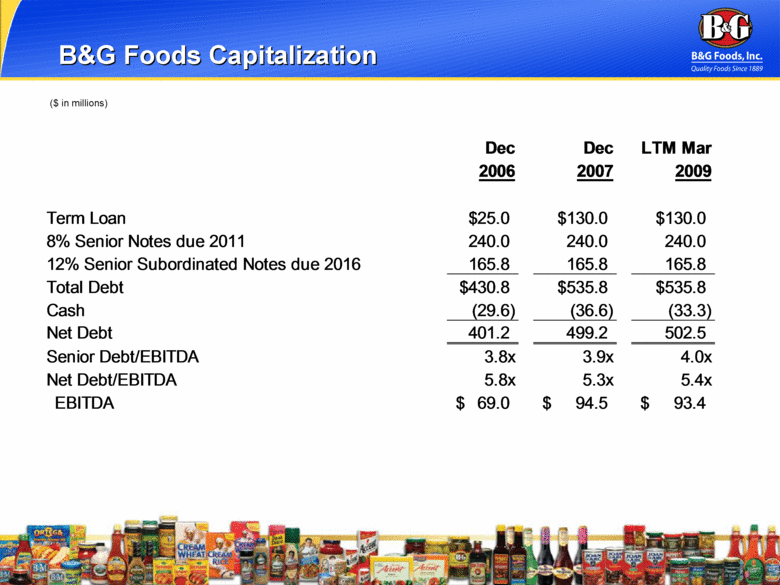
| 12 B&G Foods Capitalization ($ in millions) 2006 2007 2009 Term Loan $25.0 $130.0 $130.0 8% Senior Notes due 2011 240.0 240.0 240.0 12% Senior Subordinated Notes due 2016 165.8 165.8 165.8 Total Debt $430.8 $535.8 $535.8 Cash (29.6) (36.6) (33.3) Net Debt 401.2 499.2 502.5 Senior Debt/EBITDA 3.8x 3.9x 4.0x Net Debt/EBITDA 5.8x 5.3x 5.4x EBITDA $69.0 $94.5 $93.4 |
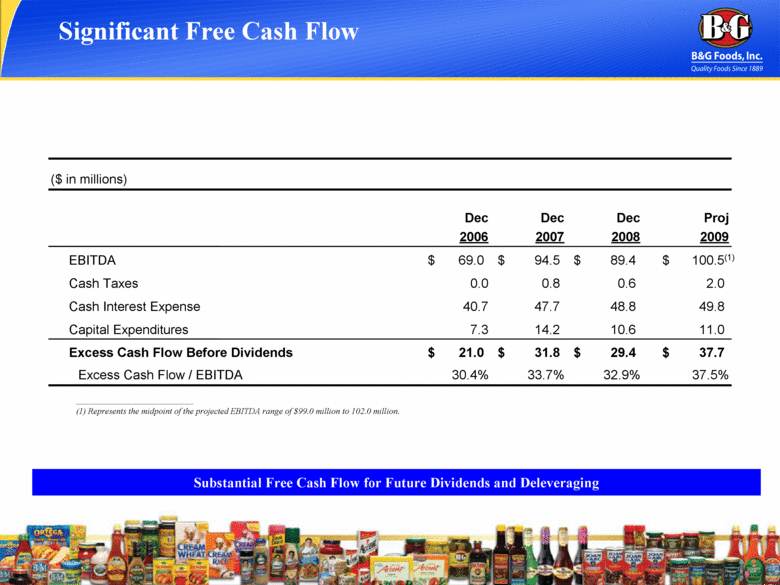
| 13 Significant Free Cash Flow (1) Represents the midpoint of the projected EBITDA range of $99.0 million to 102.0 million. (2) (1) Substantial Free Cash Flow for Future Dividends and Deleveraging ($ in millions) Dec Dec Dec Proj 2006 2007 2008 2009 EBITDA 69.0 $ 94.5 $ 89.4 $ 100.5(1) $ Cash Taxes 0.0 0.8 0.6 2.0 Cash Interest Expense 40.7 47.7 48.8 49.8 Capital Expenditures 7.3 14.2 10.6 11.0 Excess Cash Flow Before Dividends 21.0 $ 31.8 $ 29.4 $ 37.7 $ Excess Cash Flow / EBITDA 30.4% 33.7% 32.9% 37.5% |
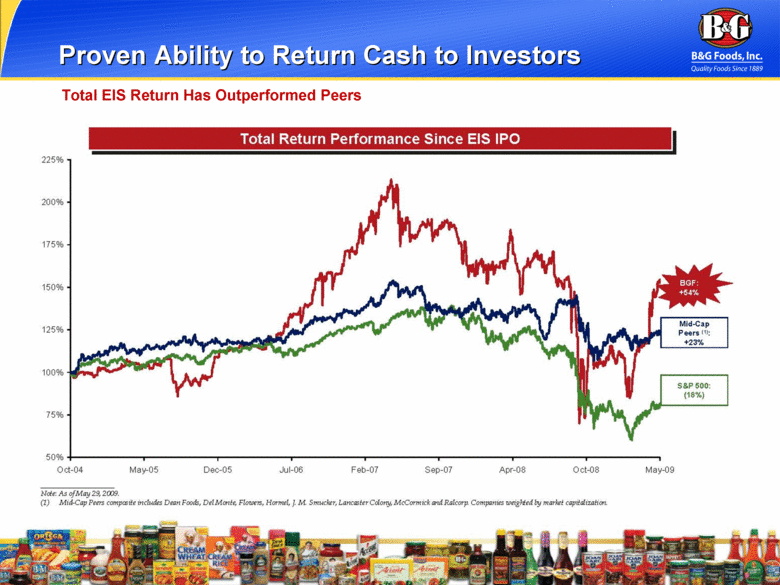
| Proven Ability to Return Cash to Investors 14 Total EIS Return Has Outperformed Peers |
| Piper Jaffray Consumer Conference June 10, 2009 |
