financial products and services for institutions and individuals worldwide; Canon Inc., a Japanese manufacturer and distributor of network digital multifunction devices, copying machines, printers and cameras; and Total SA, a French energy supplier that explores for, produces, refines, transports, and markets oil and natural gas.
Companies held in the global equity portfolio are all based in developed-market regions around the world. As of June 30, 2011, 50.0% of these stocks were based in North America, 22.0% were based in Continental Europe (not including the United Kingdom), 15.0% were from the United Kingdom, 6.9% were from Japan, and 6.1% were from the rest of Asia (not including Japan). The global equity portfolio is similarly well-diversified across a number of industry sectors. The top two sectors, by weight, at June 30, 2011, were information technology (19.8%), which includes computer software, technology hardware, semiconductors, and services companies, and health care (18.3%), which includes health care equipment & services and pharmaceuticals biotechnology & life sciences companies. Other sectors in the portfolio include consumer discretionary, consumer staples, energy, industrials, materials, financials, and telecommunication services. The average dividend yield on the securities held in the global equity portfolio was approximately 3.0% as of June 30, 2011.
Global Equity Markets Review
A number of positive and negative factors moved markets during the quarter. Positive factors included strong corporate earnings, low developed-world interest rates, and abundant liquidity. Negative factors centered around sovereign debt concerns, softening economic growth, the Japanese earthquake aftermath, and Middle East and North African turmoil.
Sovereign debt concerns were once again front and center in investors’ minds, as Greece faced internal protests over the austerity measures required to receive the next tranche in foreign assistance. Meanwhile, the unrest in the Middle East and North Africa continued with Syria also cracking down violently on protests. In the United States, a string of negative readings on housing, employment, and manufacturing, as well as the expected ending of the Fed’s quantitative easing, led investors to question whether growth expectations
for the U.S. economy were too high. European markets performed well despite contagion concerns from the sovereign crisis. Germany contributed to the strong performance, as the nation continues to benefit from exports and low unemployment that is beginning to spur domestic consumer spending. In Asia, markets declined slightly on concerns over slowing growth prospects following weaker manufacturing numbers from China and continuing inflation fears in the region. Japan was an exception, as it edged higher in the quarter in anticipation of a recovery beyond the current slowdown from the earthquake. Emerging markets declined during the quarter on the aforementioned slowing growth and inflation concerns.
Sector leadership was mixed with a defensive bias, as consumer staples and health care, two traditionally defensive sectors were joined by consumer discretionary, a traditionally cyclical sector, to lead markets higher. Among the worst performers were the energy and financials sectors. The energy sector declined, driven by a falling oil price, while financials declined on sovereign debt concerns and tightening regulatory capital requirements. Commodities declined on weakening economic data.
In currency markets, the U.S. dollar weakened relative to most major currencies. The euro gained on the dollar, as investors reacted positively to recent European Central Bank interest rate policy, which signaled a widening yield differential between the U.S. dollar and the euro.
What Helped and What Hurt LGI
Among the areas of positive stock selection were the health care and information technology sectors, as well as U.S. stocks. Within the U.S., pharmaceutical company Johnson & Johnson and information technology companies IBM and Intel were notable performers. Johnson & Johnson performed well following discussions to purchase Synthes, a medical products manufacturer. Meanwhile, IBM and Intel performed well following results that displayed renewed corporate demand. In health care, French pharmaceutical company Sanofi also performed strongly.
In contrast, the Fund was negatively impacted by low exposure and stock selection in the consumer discretionary and utilities sectors. Within consumer discretionary, the Fund was hurt by not holding the best
|
| |
Lazard Global Total Return and Income Fund, Inc. |
Investment Overview (continued) |
|
| |
performing securities in the sector such as automobile stocks. In utilities, GDF Suez declined following the French prime minister’s announcement that natural gas prices would be frozen for a year and that regulated power price increases will be limited.
Emerging Market Currency and Debt Portfolio
(32.5% of total leveraged assets)
The Fund also seeks enhanced income through investing in primarily high-yielding, short-duration emerging market forward currency contracts and local currency debt instruments. As of June 30, 2011, this portfolio consisted of forward currency contracts (66.8%) and sovereign debt obligations (33.2%). The average duration of the emerging market currency and debt portfolio decreased from approximately 9 months to approximately 8 months during the second quarter with an average yield of 6.4%2 as of June 30, 2011.
Emerging Market Currency and Debt Market Review
Many emerging market (EM) local currency and debt markets ended the quarter broadly flat. However, investor concerns regarding the lack of policy coordination to address the rising Eurozone debt strains created a significant level of volatility throughout the quarter. Debates continued over whether soft global economic data in the period was a temporary phenomenon, due to the oil price spike and Japanese earthquake-related supply disruption earlier this year, or a longer term issue. Emerging nations continued to tighten monetary policy in conjunction with the withdrawal by developed nations of their extraordinary post-crisis stimulus, which called into question whether potential growth in highly levered developed market economies and in China will be sustainable. The quarter closed on strong footing, as fears receded over the risk of a near-term disorderly Greek restructuring, and the available macro data in China eased worries over a potential “hard landing.”
Many EM nations continued to sustain favorable relative growth and historically low levels of real interest
rates, as the monetary normalization cycle continued through June. Central banks delivered interest rate hikes in such geographically diverse countries as Poland, India, South Korea, China, Taiwan, Brazil, Chile, Colombia, and Uruguay during the period.
What Helped and What Hurt LGI
Latin American exposure contributed strongly to performance, led by Mexico and Brazil, where security selection was particularly helpful as bond holdings rallied, while active foreign currency exchange management in Brazil and Colombia added incremental value.
European exposure also contributed to performance, mostly due to a sizable exposure to Serbia’s top-performing money market and favorable Polish returns. We reduced our exposure to Serbia in May in an effort to protect gains in the Fund.
In Asia, South Korea and India contributed to performance, primarily due to strong economic growth, continued interest rate hikes, and ample inflows which supported the won and rupee. Israel contributed as well, due to active FX management and strong quarterly results from currency and inflation-linked bond holdings. Fundamental economic strength, resilient exports, above-target inflation, record-high central bank FX reserves and continued monetary tightening supported performance in Israel. Uncorrelated attribution from frontier markets such as Ghana, Uruguay, Ukraine, and Nigeria also contributed to returns during the quarter.
The Ugandan shilling detracted from performance, driven primarily by rising inflation, high imports, and central bank policy inconsistencies prior to their June 30, 2011 fiscal year-end.
Turkey also detracted from returns, primarily due to lira weakness, which overwhelmed our inflation-linked bond returns. Other detractors included weakness in the Thai baht on pre-election uncertainties, and our positions in Zambia, Kenya, and Romania.
4
|
| |
Lazard Global Total Return and Income Fund, Inc. |
Investment Overview (continued) |
|
| |
| | |
| | |
Notes to Investment Overview: |
1 | A measure of the average cash weighted term-to-maturity of the investment holdings. Duration is a measure of the price sensitivity of a bond to interest rate movements. Duration for a forward currency contract is equal to its term-to-maturity. |
2 | The quoted yield does not account for the implicit cost of borrowing on the forward currency contracts, which would reduce the yield shown. |
All returns reflect reinvestment of all dividends and distributions. Past performance is not indicative, or a guarantee, of future results.
The performance data of the Index and other market data have been prepared from sources and data that the Investment Manager believes to be reliable, but no representation is made as to their accuracy. The Index is a free float-adjusted market capitalization weighted index that is designed to measure the equity market performance of developed markets. The Index is unmanaged, has no fees or costs and is not available for investment.
The views of the Fund’s Investment Manager and the securities described in this report are as of June 30, 2011; these views and portfolio holdings may have changed subsequent to this date. Nothing herein should be construed as a recommendation to buy, sell, or hold a particular security. There is no assurance that the securities discussed herein will remain in the Fund at the time you receive this report, or that securities sold will not have been repurchased. The specific securities discussed may, in aggregate, represent only a small percentage of the Fund’s holdings. It should not be assumed that securities identified and discussed were, or will be, profitable, or that the investment decisions made in the future will be profitable, or equal the investment performance of the securities discussed herein.
The views and opinions expressed are provided for general information only, and do not constitute specific tax, legal, or investment advice to, or recommendations for, any person. There can be no guarantee as to the accuracy of the outlooks for markets, sectors and securities as discussed herein.
5
|
| |
Lazard Global Total Return and Income Fund, Inc. |
Investment Overview (continued) |
|
| |
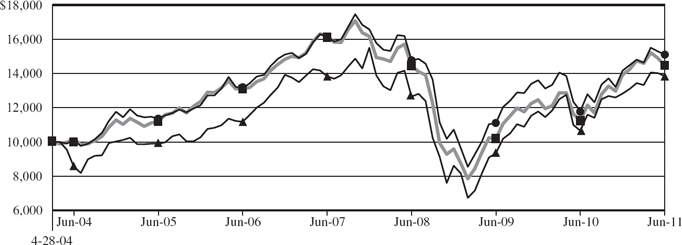
Comparison of Changes in Value of $10,000 Investment in
LGI and MSCI World Index*
| | | | | |
| | | | Value at
6/30/11 | |
| | | | |

| LGI at Market Price | | | $13,846 | |

| LGI at Net Asset Value | | | 15,100 | |

| MSCI World Index | | | 14,447 | |
| | | | | |
| | | | | | | |
Average Annual Total Returns*
Periods Ended June 30, 2011
(unaudited) | | | | | | | |
| | | | | | | |
| | One
Year | | Five
Years | | Since
Inception** | |
| | | | | | | |
Market Price | | 29.95% | | 4.37% | | 4.64% | |
Net Asset Value | | 27.95% | | 2.84% | | 5.91% | |
MSCI World Index | | 30.51% | | 2.28% | | 5.26% | |
| | |
| | |
* | All returns reflect reinvestment of all dividends and distributions. The performance quoted represents past performance. Current performance may be lower or higher than the performance quoted. Past performance is not indicative, or a guarantee, of future results; the investment return, market price and net asset value of the Fund will fluctuate, so that an investor’s shares in the Fund, when sold, may be worth more or less than their original cost. The returns do not reflect the deduction of taxes that a stockholder would pay on the Fund’s distributions or on the sale of Fund shares. |
| |
| The performance data of the Index has been prepared from sources and data that the Investment Manager believes to be reliable, but no representation is made as to its accuracy. The Index is a free float-adjusted market capitalization weighted index that is designed to measure the equity market performance of developed markets. The Index is unmanaged, has no fees or costs and is not available for investment. |
| |
** | The Fund’s inception date was April 28, 2004. |
6
|
| |
Lazard Global Total Return and Income Fund, Inc. |
Investment Overview (concluded) |
|
| |
| | | | | | | | | | |
| Ten Largest Equity Holdings | | | | | | | |
| June 30, 2011 (unaudited) | | | | | | | |
| | | | | | | | | | |
| Security | | | Value | | Percentage of
Net Assets | |
| | | | | | | |
| Johnson & Johnson | | $ | 6,938,036 | | | 4.2 | % | |
| The Home Depot, Inc. | | | 5,994,410 | | | 3.6 | | |
| Microsoft Corp. | | | 5,891,600 | | | 3.5 | | |
| HSBC Holdings PLC Sponsored ADR | | | 5,635,294 | | | 3.4 | | |
| Singapore Telecommunications, Ltd. ADR | | | 5,578,484 | | | 3.3 | | |
| International Business Machines Corp. | | | 5,180,810 | | | 3.1 | | |
| Mitsubishi UFJ Financial Group, Inc. ADR | | | 5,075,847 | | | 3.0 | | |
| United Technologies Corp. | | | 5,053,921 | | | 3.0 | | |
| Oracle Corp. | | | 4,848,959 | | | 2.9 | | |
| Novartis AG ADR | | | 4,821,579 | | | 2.9 | | |
|
| | | | | | | | | | |
| Portfolio Holdings Presented by Sector | | | | | | | | |
| June 30, 2011 (unaudited) | | | | | | | | |
| | | | | | | |
| Sector | | | | | | Percentage of
Total Investments | |
| | | | | | | | |
| Consumer Discretionary | | | | | | 5.6 | % | |
| Consumer Staples | | | | | | 8.8 | | |
| Emerging Markets Debt Obligations | | | | | | 14.6 | | |
| Energy | | | | | | 11.1 | | |
| Financials | | | | | | 13.8 | | |
| Health Care | | | | | | 15.6 | | |
| Industrials | | | | | | 7.1 | | |
| Information Technology | | | | | | 17.0 | | |
| Materials | | | | | | 3.3 | | |
| Telecommunication Services | | | | | | 3.1 | | |
| | | | | | | | | |
| Total Investments | | | | | | 100.0 | % | |
| | | | | | | | | |
| | | | | | | | | |
7
|
| |
Lazard Global Total Return and Income Fund, Inc. |
Portfolio of Investments |
June 30, 2011 (unaudited) |
| |
| | | | | | | |
Description | | Shares | | Value | |
| | | | | | |
|
Common Stocks—90.9% | | | | | | | |
|
Australia—2.2% | | | | | | | |
BHP Billiton, Ltd. Sponsored ADR | | | 38,500 | | $ | 3,643,255 | |
| | | | | | | |
|
Finland—1.1% | | | | | | | |
Sampo Oyj, A Shares ADR | | | 109,500 | | | 1,773,900 | |
| | | | | | | |
|
France—6.4% | | | | | | | |
GDF Suez Sponsored ADR | | | 75,981 | | | 2,792,302 | |
Sanofi SA ADR | | | 105,200 | | | 4,225,884 | |
Total SA Sponsored ADR | | | 64,000 | | | 3,701,760 | |
| | | | | | | |
| | | | | | 10,719,946 | |
| | | | | | | |
|
Germany—2.2% | | | | | | | |
SAP AG Sponsored ADR | | | 59,300 | | | 3,596,545 | |
| | | | | | | |
|
Ireland—1.3% | | | | | | | |
CRH PLC Sponsored ADR | | | 98,300 | | | 2,213,716 | |
| | | | | | | |
|
Italy—1.0% | | | | | | | |
Eni SpA Sponsored ADR | | | 36,350 | | | 1,728,443 | |
| | | | | | | |
|
Japan—6.9% | | | | | | | |
Canon, Inc. Sponsored ADR | | | 44,700 | | | 2,127,273 | |
Hoya Corp. Sponsored ADR (c) | | | 73,500 | | | 1,634,640 | |
Mitsubishi UFJ Financial Group, | | | | | | | |
Inc. ADR | | | 1,050,900 | | | 5,075,847 | |
Nomura Holdings, Inc. ADR (c) | | | 332,600 | | | 1,639,718 | |
Sumitomo Mitsui Financial Group, Inc. | | | | | | | |
Sponsored ADR | | | 160,600 | | | 987,690 | |
| | | | | | | |
| | | | | | 11,465,168 | |
| | | | | | | |
|
Singapore—3.3% | | | | | | | |
Singapore Telecommunications, | | | | | | | |
Ltd. ADR (c) | | | 217,400 | | | 5,578,484 | |
| | | | | | | |
|
Spain—1.5% | | | | | | | |
Banco Santander SA Sponsored ADR | | | 220,693 | | | 2,540,176 | |
| | | | | | | |
|
|
Switzerland—7.8% | | | | | | | |
Novartis AG ADR | | | 78,900 | | | 4,821,579 | |
Roche Holding AG Sponsored ADR | | | 92,400 | | | 3,877,104 | |
UBS AG (a) | | | 107,587 | | | 1,964,539 | |
Zurich Financial Services AG ADR | | | 92,500 | | | 2,343,950 | |
| | | | | | | |
| | | | | | 13,007,172 | |
| | | | | | | |
| | | | | | | |
Description | | Shares | | Value | |
| | | | | | |
|
United Kingdom—13.7% | | | | | | | |
BP PLC Sponsored ADR (c) | | | 98,908 | | $ | 4,380,635 | |
British American Tobacco PLC | | | | | | | |
Sponsored ADR | | | 37,700 | | | 3,317,600 | |
GlaxoSmithKline PLC | | | | | | | |
Sponsored ADR (c) | | | 80,200 | | | 3,440,580 | |
HSBC Holdings PLC | | | | | | | |
Sponsored ADR (c) | | | 113,569 | | | 5,635,294 | |
Unilever PLC Sponsored ADR | | | 99,100 | | | 3,209,849 | |
Wm Morrison Supermarkets | | | | | | | |
PLC ADR | | | 120,300 | | | 2,876,373 | |
| | | | | | | |
| | | | | | 22,860,331 | |
| | | | | | | |
|
United States—43.5% | | | | | | | |
Cisco Systems, Inc. (c) | | | 220,400 | | | 3,440,444 | |
Comcast Corp., Class A | | | 160,900 | | | 3,898,607 | |
ConocoPhillips | | | 32,900 | | | 2,473,751 | |
Emerson Electric Co. | | | 67,600 | | | 3,802,500 | |
Halliburton Co. | | | 89,900 | | | 4,584,900 | |
Honeywell International, Inc. (c) | | | 64,700 | | | 3,855,473 | |
Intel Corp. | | | 155,400 | | | 3,443,664 | |
International Business Machines | | | | | | | |
Corp. (c) | | | 30,200 | | | 5,180,810 | |
Johnson & Johnson (c) | | | 104,300 | | | 6,938,036 | |
Merck & Co., Inc. | | | 75,300 | | | 2,657,337 | |
Microsoft Corp. (c) | | | 226,600 | | | 5,891,600 | |
Oracle Corp. | | | 147,340 | | | 4,848,959 | |
PepsiCo, Inc. | | | 41,100 | | | 2,894,673 | |
Pfizer, Inc. (c) | | | 87,566 | | | 1,803,860 | |
The Bank of New York Mellon | | | | | | | |
Corp. (c) | | | 103,600 | | | 2,654,232 | |
The Home Depot, Inc. (c) | | | 165,500 | | | 5,994,410 | |
United Technologies Corp. | | | 57,100 | | | 5,053,921 | |
Wal-Mart Stores, Inc. | | | 62,800 | | | 3,337,192 | |
| | | | | | | |
| | | | | | 72,754,369 | |
| | | | | | | |
Total Common Stocks | | | | | | | |
(Identified cost $152,582,488) | | | | | | 151,881,505 | |
| | | | | | | |
The accompanying notes are an integral part of these financial statements.
8
|
| |
Lazard Global Total Return and Income Fund, Inc. |
Portfolio of Investments (continued) |
June 30, 2011 (unaudited) |
| |
| | | | | | | |
Description | | Principal
Amount
(000) (d) | | Value | |
| | | | | | |
|
Foreign Government | | | | | | | |
Obligations—15.5% | | | | | | | |
|
Brazil—3.9% | | | | | | | |
Brazil NTN-F: | | | | | | | |
10.00%, 01/01/12 | | | 4,500 | | $ | 2,988,670 | |
10.00%, 01/01/13 | | | 5,795 | | | 3,587,401 | |
| | | | | | | |
| | | | | | 6,576,071 | |
| | | | | | | |
|
Colombia—0.1% | | | | | | | |
Republic of Colombia, | | | | | | | |
12.00%, 10/22/15 | | | 305,000 | | | 218,724 | |
| | | | | | | |
|
Ghana—0.5% | | | | | | | |
Ghana Government Bonds: | | | | | | | |
13.67%, 06/11/12 | | | 790 | | | 529,197 | |
15.00%, 12/10/12 | | | 320 | | | 219,019 | |
| | | | | | | |
| | | | | | 748,216 | |
| | | | | | | |
|
Israel—1.0% | | | | | | | |
Israel Consumer Price Index-Linked | | | | | | | |
Bond, | | | | | | | |
3.00%, 10/31/19 | | | 4,869 | | | 1,618,992 | |
| | | | | | | |
|
Malaysia—1.0% | | | | | | | |
Bank Negara Monetary Note, | | | | | | | |
0.00%, 07/14/11 | | | 5,040 | | | 1,667,231 | |
| | | | | | | |
|
Mexico—2.3% | | | | | | | |
Mexican Bonos, | | | | | | | |
7.75%, 12/14/17 | | | 7,000 | | | 638,618 | |
Mexican Cetes, | | | | | | | |
0.00%, 12/15/11 | | | 104,000 | | | 869,857 | |
Mexican Udibonos: | | | | | | | |
4.50%, 12/18/14 | | | 3,890 | | | 1,656,435 | |
5.00%, 06/16/16 | | | 1,480 | | | 654,166 | |
| | | | | | | |
| | | | | | 3,819,076 | |
| | | | | | | |
|
Poland—1.2% | | | | | | | |
Poland Government Bonds: | | | | | | | |
0.00%, 07/25/12 | | | 4,421 | | | 1,535,002 | |
3.00%, 08/24/16 | | | 1,433 | | | 540,437 | |
| | | | | | | |
| | | | | | 2,075,439 | |
| | | | | | | |
| | | | | | | |
Description | | Principal
Amount
(000) (d) | | Value | |
| | | | | | |
|
Romania—2.0% | | | | | | | |
Romania Government Bonds: | | | | | | | |
6.25%, 10/25/14 | | | 1,290 | | $ | 428,318 | |
6.00%, 04/30/15 | | | 560 | | | 183,764 | |
6.00%, 04/30/16 | | | 530 | | | 171,386 | |
6.75%, 06/11/17 | | | 600 | | | 198,729 | |
Romania Treasury Bills: | | | | | | | |
0.00%, 08/17/11 | | | 4,520 | | | 1,536,514 | |
0.00%, 02/08/12 | | | 610 | | | 201,324 | |
0.00%, 06/06/12 | | | 1,930 | | | 622,768 | |
| | | | | | | |
| | | | | | 3,342,803 | |
| | | | | | | |
|
South Africa—0.4% | | | | | | | |
Eskom Holdings, Ltd., | | | | | | | |
9.25%, 04/20/18 | | | 4,000 | | | 607,227 | |
| | | | | | | |
|
Turkey—3.1% | | | | | | | |
Turkey Government Bonds: | | | | | | | |
0.00%, 08/03/11 | | | 3,156 | | | 1,930,877 | |
0.00%, 11/16/11 | | | 2,156 | | | 1,287,702 | |
4.50%, 02/11/15 | | | 1,535 | | | 1,015,463 | |
4.00%, 04/29/15 | | | 1,449 | | | 946,871 | |
| | | | | | | |
| | | | | | 5,180,913 | |
| | | | | | | |
Total Foreign Government | | | | | | | |
Obligations | | | | | | | |
(Identified cost $24,364,516) | | | | | | 25,854,692 | |
| | | | | | | |
| | | | | | | |
Description | | Shares | | Value | |
| | | | | | |
Short-Term Investment—1.1% | | | | | | | |
State Street Institutional Treasury | | | | | | | |
Money Market Fund | | | | | | | |
(Identified cost $1,882,367) | | | 1,882,367 | | $ | 1,882,367 | |
| | | | | | | |
|
Total Investments—107.5% | | | | | | | |
(Identified cost $178,829,371) (b) | | | | | $ | 179,618,564 | |
|
Liabilities in Excess of Cash | | | | | | | |
and Other Assets—(7.5)% | | | | | | (12,456,349 | ) |
| | | | | | | |
Net Assets—100.0% | | | | | $ | 167,162,215 | |
| | | | | | | |
The accompanying notes are an integral part of these financial statements.
9
|
| |
Lazard Global Total Return and Income Fund, Inc. |
Portfolio of Investments (continued) |
June 30, 2011 (unaudited) |
| |
Forward Currency Purchase Contracts open at June 30, 2011:
| | | | | | | | | | | | | | | | | | | |
Forward Currency
Purchase Contracts | | Counterparty | | Expiration
Date | | Foreign
Currency | | U.S. $ Cost
on Origination
Date | | U.S. $
Current
Value | | Unrealized
Appreciation | | Unrealized
Depreciation | |
| | | | | | | | | | | | | | | | |
ARS | | UBS | | 07/18/11 | | 2,486,400 | | $ | 600,000 | | $ | 603,613 | | $ | 3,613 | | $ | — | |
ARS | | UBS | | 07/25/11 | | 3,528,875 | | | 850,741 | | | 855,494 | | | 4,753 | | | — | |
ARS | | BNP | | 08/08/11 | | 1,676,340 | | | 402,000 | | | 405,245 | | | 3,245 | | | — | |
ARS | | CIT | | 08/31/11 | | 1,609,493 | | | 385,000 | | | 387,218 | | | 2,218 | | | — | |
BRL | | JPM | | 07/05/11 | | 1,332,392 | | | 808,000 | | | 853,741 | | | 45,741 | | | — | |
BRL | | JPM | | 07/05/11 | | 5,842,063 | | | 3,667,334 | | | 3,743,352 | | | 76,018 | | | — | |
BRL | | HSB | | 08/02/11 | | 2,054,901 | | | 1,263,000 | | | 1,308,027 | | | 45,027 | | | — | |
CLP | | BNP | | 07/15/11 | | 189,153,360 | | | 396,000 | | | 404,219 | | | 8,219 | | | — | |
CLP | | BNP | | 07/18/11 | | 208,835,100 | | | 438,177 | | | 446,109 | | | 7,932 | | | — | |
CLP | | CIT | | 08/30/11 | | 250,818,750 | | | 525,000 | | | 533,102 | | | 8,102 | | | — | |
CLP | | CSF | | 09/26/11 | | 392,229,000 | | | 796,000 | | | 830,711 | | | 34,711 | | | — | |
CLP | | BNP | | 02/13/12 | | 476,500,200 | | | 989,000 | | | 993,640 | | | 4,640 | | | — | |
CNY | | BRC | | 07/29/11 | | 254,486 | | | 38,000 | | | 39,365 | | | 1,365 | | | — | |
CNY | | BRC | | 07/29/11 | | 1,097,824 | | | 169,000 | | | 169,819 | | | 819 | | | — | |
CNY | | BRC | | 07/29/11 | | 5,434,092 | | | 813,000 | | | 840,584 | | | 27,584 | | | — | |
CNY | | JPM | | 07/29/11 | | 1,460,246 | | | 222,074 | | | 225,882 | | | 3,808 | | | — | |
CNY | | JPM | | 07/29/11 | | 4,071,165 | | | 609,000 | | | 629,757 | | | 20,757 | | | — | |
CNY | | JPM | | 06/13/12 | | 10,364,580 | | | 1,622,000 | | | 1,624,785 | | | 2,785 | | | — | |
COP | | BNP | | 07/22/11 | | 964,634,000 | | | 538,000 | | | 545,045 | | | 7,045 | | | — | |
COP | | CIT | | 08/18/11 | | 1,551,718,000 | | | 854,000 | | | 875,726 | | | 21,726 | | | — | |
CZK | | ING | | 07/07/11 | | 6,765,269 | | | 396,340 | | | 403,390 | | | 7,050 | | | — | |
CZK | | ING | | 07/07/11 | | 14,056,342 | | | 822,533 | | | 838,132 | | | 15,599 | | | — | |
CZK | | ING | | 07/25/11 | | 14,295,910 | | | 837,676 | | | 852,337 | | | 14,661 | | | — | |
EUR | | BRC | | 07/05/11 | | 154,172 | | | 217,513 | | | 223,572 | | | 6,059 | | | — | |
EUR | | BRC | | 07/05/11 | | 175,401 | | | 247,955 | | | 254,357 | | | 6,402 | | | — | |
EUR | | BRC | | 07/05/11 | | 613,138 | | | 869,046 | | | 889,141 | | | 20,095 | | | — | |
EUR | | CIT | | 07/05/11 | | 407,204 | | | 587,615 | | | 590,506 | | | 2,891 | | | — | |
EUR | | CIT | | 07/05/11 | | 919,907 | | | 1,309,000 | | | 1,334,003 | | | 25,003 | | | — | |
EUR | | ING | | 07/05/11 | | 978,106 | | | 1,399,473 | | | 1,418,400 | | | 18,927 | | | — | |
EUR | | ING | | 07/07/11 | | 324,000 | | | 464,422 | | | 469,823 | | | 5,401 | | | — | |
EUR | | CIT | | 07/18/11 | | 235,845 | | | 348,000 | | | 341,886 | | | — | | | 6,114 | |
EUR | | CIT | | 07/18/11 | | 1,258,052 | | | 1,783,000 | | | 1,823,705 | | | 40,705 | | | — | |
EUR | | CIT | | 07/18/11 | | 1,571,000 | | | 2,267,079 | | | 2,277,362 | | | 10,283 | | | — | |
EUR | | JPM | | 07/18/11 | | 1,232,302 | | | 1,745,654 | | | 1,786,376 | | | 40,722 | | | — | |
EUR | | ING | | 07/20/11 | | 391,838 | | | 565,441 | | | 567,986 | | | 2,545 | | | — | |
GHS | | BRC | | 07/05/11 | | 246,480 | | | 158,000 | | | 162,361 | | | 4,361 | | | — | |
GHS | | JPM | | 07/05/11 | | 269,004 | | | 174,000 | | | 177,198 | | | 3,198 | | | — | |
GHS | | JPM | | 07/11/11 | | 291,653 | | | 190,935 | | | 191,761 | | | 826 | | | — | |
GHS | | SCB | | 07/12/11 | | 972,024 | | | 635,310 | | | 638,905 | | | 3,595 | | | — | |
GHS | | SCB | | 07/18/11 | | 503,304 | | | 329,000 | | | 330,207 | | | 1,207 | | | — | |
GHS | | CIT | | 07/27/11 | | 1,077,120 | | | 704,000 | | | 704,719 | | | 719 | | | — | |
GHS | | BRC | | 08/05/11 | | 246,480 | | | 161,404 | | | 160,845 | | | — | | | 559 | |
GHS | | CIT | | 08/09/11 | | 82,000 | | | 53,074 | | | 53,451 | | | 377 | | | — | |
GHS | | SCB | | 08/09/11 | | 277,000 | | | 180,750 | | | 180,560 | | | — | | | 190 | |
GHS | | SCB | | 08/16/11 | | 507,318 | | | 329,000 | | | 330,048 | | | 1,048 | | | — | |
GHS | | JPM | | 09/06/11 | | 269,004 | | | 174,395 | | | 173,957 | | | — | | | 438 | |
GHS | | CIT | | 09/22/11 | | 117,000 | | | 75,875 | | | 75,296 | | | — | | | 579 | |
GHS | | BRC | | 10/11/11 | | 237,330 | | | 109,369 | | | 151,900 | | | 42,531 | | | — | |
The accompanying notes are an integral part of these financial statements.
10
|
| |
Lazard Global Total Return and Income Fund, Inc. |
Portfolio of Investments (continued) |
June 30, 2011 (unaudited) |
| |
Forward Currency Purchase Contracts open at June 30, 2011 (continued):
| | | | | | | | | | | | | | | | | | | |
Forward Currency
Purchase Contracts | | Counterparty | | Expiration
Date | | Foreign
Currency | | U.S. $ Cost
on Origination
Date | | U.S. $
Current
Value | | Unrealized
Appreciation | | Unrealized
Depreciation | |
| | | | | | | | | | | | | | | | |
GHS | | SCB | | 10/11/11 | | 391,000 | | $ | 246,036 | | $ | 250,254 | | $ | 4,218 | | $ | — | |
IDR | | JPM | | 11/18/11 | | 7,099,422,000 | | | 811,363 | | | 809,848 | | | — | | | 1,515 | |
ILS | | JPM | | 07/18/11 | | 2,844,722 | | | 835,405 | | | 835,583 | | | 178 | | | — | |
INR | | SCB | | 07/15/11 | | 18,207,540 | | | 405,965 | | | 406,681 | | | 716 | | | — | |
INR | | SCB | | 07/21/11 | | 23,782,000 | | | 506,000 | | | 530,650 | | | 24,650 | | | — | |
INR | | JPM | | 07/25/11 | | 19,153,440 | | | 423,000 | | | 427,083 | | | 4,083 | | | — | |
INR | | SCB | | 10/13/11 | | 43,926,800 | | | 965,000 | | | 965,172 | | | 172 | | | — | |
INR | | BRC | | 11/14/11 | | 43,376,800 | | | 944,000 | | | 947,907 | | | 3,907 | | | — | |
INR | | BNP | | 05/21/12 | | 18,207,540 | | | 379,838 | | | 387,433 | | | 7,595 | | | — | |
INR | | BRC | | 05/21/12 | | 42,264,610 | | | 884,567 | | | 899,337 | | | 14,770 | | | — | |
INR | | JPM | | 05/25/12 | | 18,698,400 | | | 392,000 | | | 397,693 | | | 5,693 | | | — | |
INR | | UBS | | 05/25/12 | | 42,064,980 | | | 878,000 | | | 894,672 | | | 16,672 | | | — | |
KES | | CIT | | 07/06/11 | | 32,902,000 | | | 382,004 | | | 368,340 | | | — | | | 13,664 | |
KES | | SCB | | 07/28/11 | | 18,684,200 | | | 206,000 | | | 209,163 | | | 3,163 | | | — | |
KES | | CIT | | 08/08/11 | | 33,998,000 | | | 376,584 | | | 380,585 | | | 4,001 | | | — | |
KRW | | HSB | | 07/28/11 | | 954,700,500 | | | 876,515 | | | 892,935 | | | 16,420 | | | — | |
KRW | | SCB | | 08/11/11 | | 486,080,000 | | | 434,000 | | | 454,245 | | | 20,245 | | | — | |
KRW | | SCB | | 08/11/11 | | 1,154,792,400 | | | 1,061,000 | | | 1,079,160 | | | 18,160 | | | — | |
KRW | | BRC | | 11/23/11 | | 1,019,284,400 | | | 927,170 | | | 947,223 | | | 20,053 | | | — | |
KZT | | BNP | | 07/05/11 | | 54,115,000 | | | 372,719 | | | 370,905 | | | — | | | 1,814 | |
KZT | | BRC | | 07/05/11 | | 61,316,600 | | | 422,000 | | | 420,265 | | | — | | | 1,735 | |
KZT | | CIT | | 07/18/11 | | 49,299,000 | | | 335,025 | | | 337,929 | | | 2,904 | | | — | |
KZT | | BRC | | 08/02/11 | | 66,555,000 | | | 452,447 | | | 456,267 | | | 3,820 | | | — | |
KZT | | BRC | | 08/10/11 | | 17,687,000 | | | 121,694 | | | 121,270 | | | — | | | 424 | |
KZT | | BRC | | 08/10/11 | | 26,490,000 | | | 180,155 | | | 181,627 | | | 1,472 | | | — | |
KZT | | CIT | | 08/10/11 | | 31,412,000 | | | 215,964 | | | 215,374 | | | — | | | 590 | |
KZT | | HSB | | 10/11/11 | | 73,593,000 | | | 507,888 | | | 505,165 | | | — | | | 2,723 | |
KZT | | BRC | | 11/04/11 | | 17,133,600 | | | 118,065 | | | 117,648 | | | — | | | 417 | |
KZT | | BRC | | 12/15/11 | | 17,612,000 | | | 121,074 | | | 120,999 | | | — | | | 75 | |
MXN | | BRC | | 07/11/11 | | 1,919,261 | | | 162,525 | | | 163,835 | | | 1,310 | | | — | |
MXN | | JPM | | 07/11/11 | | 6,762,346 | | | 573,250 | | | 577,258 | | | 4,008 | | | — | |
MXN | | JPM | | 07/11/11 | | 19,316,285 | | | 1,657,979 | | | 1,648,907 | | | — | | | 9,072 | |
MYR | | BRC | | 07/05/11 | | 2,599,740 | | | 858,000 | | | 860,984 | | | 2,984 | | | — | |
MYR | | BRC | | 07/29/11 | | 10,008,918 | | | 3,291,000 | | | 3,308,779 | | | 17,779 | | | — | |
NGN | | JPM | | 07/29/11 | | 57,736,440 | | | 367,000 | | | 378,747 | | | 11,747 | | | — | |
NGN | | JPM | | 08/29/11 | | 36,957,600 | | | 236,000 | | | 237,029 | | | 1,029 | | | — | |
NGN | | CIT | | 09/09/11 | | 36,738,000 | | | 234,000 | | | 235,621 | | | 1,621 | | | — | |
NGN | | JPM | | 09/12/11 | | 37,111,000 | | | 236,000 | | | 238,013 | | | 2,013 | | | — | |
NGN | | SCB | | 09/16/11 | | 35,504,000 | | | 224,000 | | | 227,707 | | | 3,707 | | | — | |
NGN | | HSB | | 09/28/11 | | 52,000,100 | | | 331,000 | | | 331,021 | | | 21 | | | — | |
PHP | | BRC | | 07/27/11 | | 28,605,780 | | | 657,000 | | | 658,786 | | | 1,786 | | | — | |
PHP | | BRC | | 08/19/11 | | 41,620,600 | | | 959,000 | | | 956,648 | | | — | | | 2,352 | |
PLN | | CIT | | 07/05/11 | | 2,346,323 | | | 883,006 | | | 855,448 | | | — | | | 27,558 | |
PLN | | ING | | 07/05/11 | | 1,541,354 | | | 558,259 | | | 561,963 | | | 3,704 | | | — | |
PLN | | JPM | | 07/18/11 | | 4,130,892 | | | 1,513,591 | | | 1,504,051 | | | — | | | 9,540 | |
PLN | | BRC | | 07/20/11 | | 1,569,115 | | | 574,936 | | | 571,193 | | | — | | | 3,743 | |
RON | | CIT | | 07/05/11 | | 1,721,658 | | | 597,341 | | | 589,558 | | | — | | | 7,783 | |
RON | | CIT | | 07/12/11 | | 1,651,000 | | | 564,889 | | | 564,880 | | | — | | | 9 | |
The accompanying notes are an integral part of these financial statements.
11
|
| |
Lazard Global Total Return and Income Fund, Inc. |
Portfolio of Investments (continued) |
June 30, 2011 (unaudited) |
| |
Forward Currency Purchase Contracts open at June 30, 2011 (continued):
| | | | | | | | | | | | | | | | | | | |
Forward Currency
Purchase Contracts | | Counterparty | | Expiration
Date | | Foreign
Currency | | U.S. $ Cost
on Origination
Date | | U.S. $
Current
Value | | Unrealized
Appreciation | | Unrealized
Depreciation | |
| | | | | | | | | | | | | | | | |
RON | | ING | | 07/15/11 | | 1,349,000 | | $ | 470,789 | | $ | 461,383 | | $ | — | | $ | 9,406 | |
RON | | BRC | | 07/18/11 | | 2,644,659 | | | 931,202 | | | 904,192 | | | — | | | 27,010 | |
RSD | | BRC | | 07/05/11 | | 10,882,300 | | | 158,369 | | | 156,753 | | | — | | | 1,616 | |
RSD | | BRC | | 07/05/11 | | 21,624,000 | | | 296,138 | | | 311,480 | | | 15,342 | | | — | |
RSD | | BRC | | 07/14/11 | | 21,890,000 | | | 312,068 | | | 314,348 | | | 2,280 | | | — | |
RSD | | CIT | | 07/15/11 | | 15,200,717 | | | 219,188 | | | 218,213 | | | — | | | 975 | |
RSD | | BRC | | 07/21/11 | | 26,469,000 | | | 376,408 | | | 379,201 | | | 2,793 | | | — | |
RSD | | CIT | | 07/27/11 | | 24,427,470 | | | 352,235 | | | 349,244 | | | — | | | 2,991 | |
RSD | | CIT | | 08/01/11 | | 23,839,200 | | | 335,480 | | | 340,241 | | | 4,761 | | | — | |
RSD | | CIT | | 08/08/11 | | 17,410,000 | | | 260,590 | | | 247,854 | | | — | | | 12,736 | |
RSD | | BRC | | 08/10/11 | | 55,737,450 | | | 729,678 | | | 792,923 | | | 63,245 | | | — | |
RSD | | CIT | | 08/10/11 | | 19,880,000 | | | 262,235 | | | 282,814 | | | 20,579 | | | — | |
RSD | | CIT | | 09/09/11 | | 17,966,080 | | | 264,091 | | | 252,840 | | | — | | | 11,251 | |
RUB | | HSB | | 08/24/11 | | 22,925,256 | | | 807,000 | | | 816,847 | | | 9,847 | | | — | |
SGD | | SCB | | 07/28/11 | | 1,030,307 | | | 835,000 | | | 838,817 | | | 3,817 | | | — | |
SGD | | HSB | | 08/29/11 | | 962,315 | | | 777,000 | | | 783,489 | | | 6,489 | | | — | |
THB | | JPM | | 07/06/11 | | 13,787,160 | | | 459,610 | | | 448,727 | | | — | | | 10,883 | |
THB | | SCB | | 07/25/11 | | 10,844,768 | | | 357,000 | | | 352,516 | | | — | | | 4,484 | |
THB | | SCB | | 08/09/11 | | 15,845,280 | | | 528,000 | | | 514,543 | | | — | | | 13,457 | |
THB | | JPM | | 08/24/11 | | 8,147,580 | | | 266,000 | | | 264,271 | | | — | | | 1,729 | |
THB | | HSB | | 09/06/11 | | 24,660,440 | | | 811,252 | | | 799,075 | | | — | | | 12,177 | |
THB | | JPM | | 09/06/11 | | 15,939,110 | | | 517,000 | | | 516,476 | | | — | | | 524 | |
THB | | HSB | | 11/14/11 | | 25,220,160 | | | 834,000 | | | 813,316 | | | — | | | 20,684 | |
UAH | | CIT | | 07/01/11 | | 2,143,000 | | | 265,223 | | | 268,373 | | | 3,150 | | | — | |
UAH | | CIT | | 07/18/11 | | 1,173,050 | | | 142,968 | | | 146,075 | | | 3,107 | | | — | |
UAH | | HSB | | 07/25/11 | | 1,799,600 | | | 220,000 | | | 223,576 | | | 3,576 | | | — | |
UAH | | BRC | | 08/10/11 | | 1,443,000 | | | 169,765 | | | 178,409 | | | 8,644 | | | — | |
UAH | | BRC | | 08/10/11 | | 1,798,500 | | | 218,000 | | | 222,362 | | | 4,362 | | | — | |
UAH | | ING | | 08/16/11 | | 1,148,000 | | | 139,135 | | | 141,691 | | | 2,556 | | | — | |
UAH | | ING | | 08/16/11 | | 1,849,000 | | | 224,211 | | | 228,211 | | | 4,000 | | | — | |
UAH | | ING | | 08/16/11 | | 2,297,000 | | | 284,212 | | | 283,505 | | | — | | | 707 | |
UAH | | BRC | | 08/17/11 | | 1,137,120 | | | 138,000 | | | 140,307 | | | 2,307 | | | — | |
UAH | | ING | | 08/18/11 | | 1,386,810 | | | 168,296 | | | 171,067 | | | 2,771 | | | — | |
UAH | | CIT | | 08/22/11 | | 1,752,818 | | | 212,979 | | | 215,966 | | | 2,987 | | | — | |
UAH | | ING | | 08/22/11 | | 3,200,107 | | | 394,000 | | | 394,288 | | | 288 | | | — | |
UAH | | ING | | 08/25/11 | | 1,625,830 | | | 199,000 | | | 200,147 | | | 1,147 | | | — | |
UAH | | CSF | | 08/31/11 | | 1,568,640 | | | 192,000 | | | 192,759 | | | 759 | | | — | |
UAH | | CIT | | 09/01/11 | | 1,074,000 | | | 132,839 | | | 132,839 | | | — | | | — | |
UAH | | ING | | 09/02/11 | | 1,138,900 | | | 140,000 | | | 139,860 | | | — | | | 140 | |
UAH | | HSB | | 09/06/11 | | 1,680,960 | | | 206,000 | | | 206,156 | | | 156 | | | — | |
UAH | | ING | | 09/07/11 | | 2,117,000 | | | 248,930 | | | 259,548 | | | 10,618 | | | — | |
UAH | | CIT | | 09/08/11 | | 1,069,000 | | | 132,027 | | | 132,027 | | | — | | | — | |
UAH | | BRC | | 09/12/11 | | 1,761,570 | | | 207,000 | | | 215,619 | | | 8,619 | | | — | |
UGX | | SCB | | 07/08/11 | | 476,784,000 | | | 198,000 | | | 185,461 | | | — | | | 12,539 | |
UGX | | BRC | | 07/18/11 | | 843,050,000 | | | 347,649 | | | 327,008 | | | — | | | 20,641 | |
UGX | | CIT | | 07/26/11 | | 1,179,600,000 | | | 486,433 | | | 456,523 | | | — | | | 29,910 | |
UGX | | CIT | | 07/28/11 | | 149,890,000 | | | 59,836 | | | 57,977 | | | — | | | 1,859 | |
UGX | | CIT | | 08/16/11 | | 268,772,000 | | | 110,017 | | | 103,404 | | | — | | | 6,613 | |
The accompanying notes are an integral part of these financial statements.
12
|
| |
Lazard Global Total Return and Income Fund, Inc. |
Portfolio of Investments (continued) |
June 30, 2011 (unaudited) |
| |
Forward Currency Purchase Contracts open at June 30, 2011 (concluded):
| | | | | | | | | | | | | | | | | | | |
Forward Currency
Purchase Contracts | | Counterparty | | Expiration
Date | | Foreign
Currency | | U.S. $ Cost
on Origination
Date | | U.S. $
Current
Value | | Unrealized
Appreciation | | Unrealized
Depreciation | |
| | | | | | | | | | | | | | | | |
UGX | | CIT | | 08/22/11 | | 1,199,696,000 | | $ | 480,263 | | $ | 460,776 | | $ | — | | $ | 19,487 | |
UGX | | SCB | | 09/30/11 | | 1,000,176,000 | | | 402,000 | | | 379,993 | | | — | | | 22,007 | |
UGX | | CIT | | 10/04/11 | | 279,675,000 | | | 113,000 | | | 106,120 | | | — | | | 6,880 | |
UGX | | CIT | | 10/05/11 | | 486,590,000 | | | 197,000 | | | 184,573 | | | — | | | 12,427 | |
UGX | | CIT | | 10/07/11 | | 517,020,000 | | | 210,000 | | | 195,991 | | | — | | | 14,009 | |
UGX | | SCB | | 06/25/12 | | 294,000,000 | | | 107,182 | | | 103,731 | | | — | | | 3,451 | |
UYU | | CIT | | 07/08/11 | | 6,892,160 | | | 356,000 | | | 374,032 | | | 18,032 | | | — | |
UYU | | CIT | | 07/29/11 | | 2,339,235 | | | 121,835 | | | 126,468 | | | 4,633 | | | — | |
UYU | | JPM | | 08/08/11 | | 3,397,370 | | | 181,000 | | | 183,344 | | | 2,344 | | | — | |
UYU | | JPM | | 08/08/11 | | 3,858,480 | | | 207,000 | | | 208,229 | | | 1,229 | | | — | |
UYU | | CIT | | 08/31/11 | | 2,370,375 | | | 122,563 | | | 127,394 | | | 4,831 | | | — | |
UYU | | JPM | | 09/08/11 | | 3,881,250 | | | 207,000 | | | 208,296 | | | 1,296 | | | — | |
UYU | | CIT | | 10/06/11 | | 2,364,060 | | | 123,000 | | | 126,240 | | | 3,240 | | | — | |
UYU | | CIT | | 10/19/11 | | 3,717,648 | | | 198,000 | | | 198,063 | | | 63 | | | — | |
UYU | | CIT | | 11/16/11 | | 3,731,508 | | | 198,000 | | | 197,818 | | | — | | | 182 | |
UYU | | CIT | | 11/30/11 | | 2,370,375 | | | 121,061 | | | 125,350 | | | 4,289 | | | — | |
UYU | | CIT | | 12/02/11 | | 2,382,510 | | | 123,000 | | | 125,948 | | | 2,948 | | | — | |
UYU | | JPM | | 12/08/11 | | 3,945,420 | | | 207,000 | | | 208,348 | | | 1,348 | | | — | |
UYU | | CIT | | 12/20/11 | | 2,339,235 | | | 124,032 | | | 123,269 | | | — | | | 763 | |
UYU | | CIT | | 12/20/11 | | 3,743,388 | | | 198,000 | | | 197,263 | | | — | | | 737 | |
UYU | | CIT | | 12/30/11 | | 7,053,090 | | | 363,000 | | | 370,997 | | | 7,997 | | | — | |
ZAR | | CIT | | 09/14/11 | | 2,231,620 | | | 325,432 | | | 326,657 | | | 1,225 | | | — | |
ZAR | | JPM | | 09/14/11 | | 706,636 | | | 102,000 | | | 103,435 | | | 1,435 | | | — | |
ZAR | | JPM | | 09/14/11 | | 3,826,078 | | | 556,035 | | | 560,050 | | | 4,015 | | | — | |
ZAR | | JPM | | 09/14/11 | | 5,466,911 | | | 793,802 | | | 800,231 | | | 6,429 | | | — | |
ZMK | | BRC | | 07/11/11 | | 3,086,224,000 | | | 642,027 | | | 637,591 | | | — | | | 4,436 | |
ZMK | | CIT | | 07/28/11 | | 1,502,034,729 | | | 313,000 | | | 309,771 | | | — | | | 3,229 | |
ZMK | | SCB | | 11/25/11 | | 1,746,525,000 | | | 354,265 | | | 351,256 | | | — | | | 3,009 | |
ZMK | | SCB | | 12/19/11 | | 320,101,000 | | | 63,969 | | | 63,985 | | | 16 | | | — | |
ZMK | | SCB | | 12/20/11 | | 650,940,000 | | | 129,515 | | | 130,083 | | | 568 | | | — | |
| | | | | | | | | | | | | | | | | | | |
Total Forward Currency Purchase Contracts | | $ | 86,418,273 | | $ | 87,117,482 | | $ | 1,083,052 | | $ | 383,843 | |
| | | | | | | | | | | | | |
The accompanying notes are an integral part of these financial statements.
13
|
| |
Lazard Global Total Return and Income Fund, Inc. |
Portfolio of Investments (continued) |
June 30, 2011 (unaudited) |
| |
Forward Currency Sale Contracts open at June 30, 2011:
| | | | | | | | | | | | | | | | | | | |
Forward Currency
Sale Contracts | | Counterparty | | Expiration
Date | | Foreign
Currency | | U.S. $ Cost
on Origination
Date | | U.S. $
Current
Value | | Unrealized
Appreciation | | Unrealized
Depreciation | |
| | | | | | | | | | | | | | | | |
ARS | | BNP | | 07/25/11 | | 1,085,927 | | $ | 263,258 | | $ | 263,000 | | $ | — | | $ | 258 | |
BRL | | HSB | | 07/05/11 | | 7,174,455 | | | 4,597,094 | | | 4,391,000 | | | — | | | 206,094 | |
BRL | | JPM | | 08/02/11 | | 6,331,777 | | | 4,030,433 | | | 3,947,000 | | | — | | | 83,433 | |
CLP | | BNP | | 07/15/11 | | 344,448,000 | | | 736,084 | | | 736,000 | | | — | | | 84 | |
CNY | | JPM | | 07/29/11 | | 12,317,813 | | | 1,905,408 | | | 1,875,000 | | | — | | | 30,408 | |
CZK | | ING | | 07/07/11 | | 7,825,896 | | | 466,631 | | | 464,421 | | | — | | | 2,210 | |
EUR | | BRC | | 07/05/11 | | 110,000 | | | 159,516 | | | 158,368 | | | — | | | 1,148 | |
EUR | | BRC | | 07/05/11 | | 204,000 | | | 295,831 | | | 296,139 | | | 308 | | | — | |
EUR | | CIT | | 07/05/11 | | 593,000 | | | 859,939 | | | 883,006 | | | 23,067 | | | — | |
EUR | | CIT | | 07/05/11 | | 416,000 | | | 603,262 | | | 597,341 | | | — | | | 5,921 | |
EUR | | CIT | | 07/05/11 | | 1,533,045 | | | 2,223,144 | | | 2,213,103 | | | — | | | 10,041 | |
EUR | | ING | | 07/05/11 | | 385,339 | | | 558,799 | | | 558,260 | | | — | | | 539 | |
EUR | | ING | | 07/07/11 | | 278,000 | | | 403,119 | | | 396,340 | | | — | | | 6,779 | |
EUR | | ING | | 07/07/11 | | 574,000 | | | 832,340 | | | 822,533 | | | — | | | 9,807 | |
EUR | | CIT | | 07/12/11 | | 390,483 | | | 566,148 | | | 564,889 | | | — | | | 1,259 | |
EUR | | BRC | | 07/14/11 | | 210,988 | | | 305,887 | | | 312,067 | | | 6,180 | | | — | |
EUR | | CIT | | 07/15/11 | | 151,000 | | | 218,912 | | | 219,189 | | | 277 | | | — | |
EUR | | ING | | 07/15/11 | | 323,509 | | | 469,006 | | | 470,790 | | | 1,784 | | | — | |
EUR | | BRC | | 07/18/11 | | 643,250 | | | 932,472 | | | 931,202 | | | — | | | 1,270 | |
EUR | | CIT | | 07/18/11 | | 141,832 | | | 205,603 | | | 201,559 | | | — | | | 4,044 | |
EUR | | CIT | | 07/18/11 | | 470,000 | | | 681,324 | | | 678,119 | | | — | | | 3,205 | |
EUR | | JPM | | 07/18/11 | | 1,047,811 | | | 1,518,934 | | | 1,513,591 | | | — | | | 5,343 | |
EUR | | BRC | | 07/20/11 | | 398,000 | | | 576,919 | | | 574,936 | | | — | | | 1,983 | |
EUR | | BRC | | 07/21/11 | | 254,265 | | | 368,558 | | | 376,407 | | | 7,849 | | | — | |
EUR | | ING | | 07/25/11 | | 586,000 | | | 849,315 | | | 837,677 | | | — | | | 11,638 | |
EUR | | BNP | | 07/27/11 | | 349,000 | | | 505,793 | | | 493,989 | | | — | | | 11,804 | |
EUR | | BRC | | 07/27/11 | | 2,987,686 | | | 4,329,940 | | | 4,355,013 | | | 25,073 | | | — | |
EUR | | CIT | | 07/27/11 | | 240,641 | | | 348,752 | | | 352,235 | | | 3,483 | | | — | |
EUR | | CIT | | 08/01/11 | | 231,000 | | | 334,733 | | | 335,480 | | | 747 | | | — | |
EUR | | CIT | | 08/08/11 | | 171,696 | | | 248,750 | | | 260,590 | | | 11,840 | | | — | |
EUR | | BRC | | 08/10/11 | | 513,000 | | | 743,180 | | | 729,677 | | | — | | | 13,503 | |
EUR | | CIT | | 08/10/11 | | 183,226 | | | 265,438 | | | 262,234 | | | — | | | 3,204 | |
EUR | | HSB | | 08/23/11 | | 1,525,259 | | | 2,208,824 | | | 2,172,000 | | | — | | | 36,824 | |
EUR | | HSB | | 09/07/11 | | 1,805,682 | | | 2,613,811 | | | 2,622,500 | | | 8,689 | | | — | |
EUR | | CIT | | 09/09/11 | | 176,000 | | | 254,754 | | | 264,091 | | | 9,337 | | | — | |
EUR | | ING | | 09/28/11 | | 1,875,023 | | | 2,712,542 | | | 2,650,345 | | | — | | | 62,197 | |
GHS | | BRC | | 07/05/11 | | 246,480 | | | 162,361 | | | 162,693 | | | 332 | | | — | |
GHS | | JPM | | 07/05/11 | | 269,004 | | | 177,198 | | | 177,210 | | | 12 | | | — | |
INR | | BNP | | 07/15/11 | | 18,207,540 | | | 406,681 | | | 399,375 | | | — | | | 7,306 | |
INR | | SCB | | 07/21/11 | | 12,876,300 | | | 287,310 | | | 285,000 | | | — | | | 2,310 | |
JPY | | BRC | | 07/21/11 | | 76,150,854 | | | 945,988 | | | 924,157 | | | — | | | 21,831 | |
JPY | | JPM | | 08/31/11 | | 45,296,487 | | | 562,822 | | | 558,000 | | | — | | | 4,822 | |
JPY | | SCB | | 09/21/11 | | 120,873,990 | | | 1,502,103 | | | 1,510,000 | | | 7,897 | | | — | |
JPY | | HSB | | 11/10/11 | | 5,866,864 | | | 72,941 | | | 73,000 | | | 59 | | | — | |
KES | | CIT | | 07/06/11 | | 32,902,000 | | | 368,340 | | | 367,620 | | | — | | | 720 | |
KRW | | SCB | | 08/11/11 | | 133,774,800 | | | 125,013 | | | 123,000 | | | — | | | 2,013 | |
MXN | | JPM | | 07/11/11 | | 3,289,375 | | | 280,793 | | | 277,000 | | | — | | | 3,793 | |
MXN | | JPM | | 07/11/11 | | 4,914,748 | | | 419,541 | | | 412,000 | | | — | | | 7,541 | |
The accompanying notes are an integral part of these financial statements.
14
|
| |
Lazard Global Total Return and Income Fund, Inc. |
Portfolio of Investments (concluded) |
June 30, 2011 (unaudited) |
| |
Forward Currency Sale Contracts open at June 30, 2011 (concluded):
| | | | | | | | | | | | | | | | | | | |
Forward Currency
Sale Contracts | | Counterparty | | Expiration
Date | | Foreign
Currency | | U.S. $ Cost
on Origination
Date | | U.S. $
Current
Value | | Unrealized
Appreciation | | Unrealized
Depreciation |
| | | | | | | | | | | | | | | |
MXN | | HSB | | 07/28/11 | | 15,072,019 | | $ | 1,284,707 | | $ | 1,289,000 | | $ | 4,293 | | $ | — | |
MYR | | JPM | | 07/05/11 | | 2,599,740 | | | 860,984 | | | 862,841 | | | 1,857 | | | — | |
MYR | | BRC | | 07/29/11 | | 610,600 | | | 201,854 | | | 200,000 | | | — | | | 1,854 | |
PLN | | ING | | 07/05/11 | | 3,887,677 | | | 1,417,412 | | | 1,399,474 | | | — | | | 17,938 | |
PLN | | ING | | 07/20/11 | | 1,569,115 | | | 571,193 | | | 565,441 | | | — | | | 5,752 | |
RON | | CIT | | 07/05/11 | | 1,721,658 | | | 589,558 | | | 587,615 | | | — | | | 1,943 | |
RSD | | BRC | | 07/05/11 | | 15,253,000 | | | 219,710 | | | 217,514 | | | — | | | 2,196 | |
RSD | | BRC | | 07/05/11 | | 17,253,300 | | | 248,523 | | | 247,955 | | | — | | | 568 | |
THB | | JPM | | 07/06/11 | | 13,787,160 | | | 448,728 | | | 449,093 | | | 365 | | | — | |
UAH | | CIT | | 07/01/11 | | 2,143,000 | | | 268,373 | | | 268,547 | | | 174 | | | — | |
ZAR | | CIT | | 09/14/11 | | 4,845,897 | | | 709,328 | | | 706,667 | | | — | | | 2,661 | |
ZAR | | JPM | | 09/14/11 | | 11,065,383 | | | 1,619,718 | | | 1,552,056 | | | — | | | 67,662 | |
| | | | | | | | | | | | | | | | | | | |
Total Forward Currency Sale Contracts | | $ | 52,945,632 | | $ | 52,395,349 | | | 113,623 | | | 663,906 | |
| | | | | | | | | | | | | |
Gross unrealized appreciation/depreciation on Forward Currency Purchase and Sale Contracts | | | | | | | | $ | 1,196,675 | | $ | 1,047,749 | |
| | | | | | | | | | | | | |
| | | | | |
Currency Abbreviations: | | | | |
| | | | | |
ARS | — Argentine Peso | | MXN | — Mexican New Peso |
BRL | — Brazilian Real | | MYR | — Malaysian Ringgit |
CLP | — Chilean Peso | | NGN | — Nigerian Naira |
CNY | — Chinese Renminbi | | PHP | — Philippine Peso |
COP | — Colombian Peso | | PLN | — Polish Zloty |
CZK | — Czech Koruna | | RON | — New Romanian Leu |
EUR | — Euro | | RSD | — Serbian Dinar |
GHS | — Ghanaian Cedi | | RUB | — Russian Ruble |
IDR | — Indonesian Rupiah | | SGD | — Singapore Dollar |
ILS | — Israeli Shekel | | THB | — Thai Baht |
INR | — Indian Rupee | | UAH | — Ukranian Hryvnia |
JPY | — Japanese Yen | | UGX | — Ugandan Shilling |
KES | — Kenyan Shilling | | UYU | — Uruguayan Peso |
KRW | — South Korean Won | | ZAR | — South African Rand |
KZT | — Kazakhstani Tenge | | ZMK | — Zambian Kwacha |
| | |
Counterparty Abbreviations: | |
| | |
BNP | — BNP Paribas SA |
BRC | — Barclays Bank PLC |
CIT | — Citibank NA |
CSF | — Credit Suisse First Boston |
HSB | — HSBC Bank USA |
ING | — ING Bank NV |
JPM | — JPMorgan Chase Bank |
SCB | — Standard Chartered Bank |
UBS | — UBS AG |
The accompanying notes are an integral part of these financial statements.
15
|
| |
Lazard Global Total Return and Income Fund, Inc. |
Notes to Portfolio of Investments |
June 30, 2011 (unaudited) |
| |
| |
(a) | Non-income producing security. |
(b) | For federal income tax purposes, the aggregate cost was $178,829,371, aggregate gross unrealized appreciation was $22,651,679, aggregate gross unrealized depreciation was $21,862,486 and the net unrealized appreciation was $789,193. |
(c) | Segregated security for forward currency contracts. |
(d) | Principal amount denominated in respective country’s currency. |
| | |
Security Abbreviations: | |
| | |
ADR | — American Depositary Receipt |
NTN-F | — Brazil Sovereign “Nota do Tesouro Nacional” Series F |
| | | | |
Portfolio holdings by industry (as percentage of net assets): | | | | |
| | | | | |
Alcohol & Tobacco | | 2.0 | % |
Banking | | 8.5 | |
Cable Television | | 2.3 | |
Computer Software | | 8.6 | |
Energy Integrated | | 7.4 | |
Energy Services | | 2.7 | |
Financial Services | | 3.7 | |
Food & Beverages | | 3.7 | |
Gas Utilities | | 1.7 | |
Housing | | 1.3 | |
Insurance | | 2.5 | |
Manufacturing | | 7.6 | |
Metals & Mining | | 2.2 | |
Pharmaceutical & Biotechnology | | 16.6 | |
Retail | | 7.3 | |
Semiconductor & Components | | 4.3 | |
Technology Hardware | | 5.2 | |
Telecommunications | | 3.3 | |
| | | |
Subtotal | | 90.9 | |
Foreign Government Obligations | | 15.5 | |
Short-Term Investment | | 1.1 | |
| | | |
Total Investments | | 107.5 | % |
| | | |
The accompanying notes are an integral part of these financial statements.
16
|
| |
Lazard Global Total Return and Income Fund, Inc. |
Statement of Assets and Liabilities |
June 30, 2011 (unaudited) |
| |
| | | | |
ASSETS | | | | |
Investments in securities, at value (cost $178,829,371) | | $ | 179,618,564 | |
Cash | | | 121,786 | |
Foreign currency, at value (cost $270,057) | | | 271,433 | |
Dividends and interest receivable | | | 632,633 | |
Gross unrealized appreciation on forward currency contracts | | | 1,196,675 | |
| | | | |
Total assets | | | 181,841,091 | |
| | | | |
| | | | |
LIABILITIES | | | | |
Payables for: | | | | |
Management fees | | | 147,413 | |
Investments purchased | | | 114,576 | |
Line of credit outstanding | | | 13,260,000 | |
Gross unrealized depreciation on forward currency contracts | | | 1,047,749 | |
Other accrued expenses and payables | | | 109,138 | |
| | | | |
Total liabilities | | | 14,678,876 | |
| | | | |
Net assets | | $ | 167,162,215 | |
| | | | |
| | | | |
NET ASSETS | | | | |
Paid in capital (Note 2(g)) | | $ | 167,758,935 | |
Distributions in excess of net investment income (Note 2(g)) | | | (2,719,628 | ) |
Accumulated net realized gain | | | 1,168,549 | |
Net unrealized appreciation on: | | | | |
Investments | | | 789,193 | |
Foreign currency and forward currency contracts | | | 165,166 | |
| | | | |
Net assets | | $ | 167,162,215 | |
| | | | |
| | | | |
Shares of common stock outstanding* | | | 9,605,237 | |
Net asset value per share | | $ | 17.40 | |
Market value per share | | $ | 15.72 | |
* $0.001 par value, 500,000,000 shares authorized for the Fund.
The accompanying notes are an integral part of these financial statements.
17
|
| |
Lazard Global Total Return and Income Fund, Inc. |
Statement of Operations |
For the Six Months Ended June 30, 2011 (unaudited) |
| |
| | | | |
INVESTMENT INCOME | | | | |
| | | | |
Income: | | | | |
Dividends (net of foreign withholding taxes of $148,513) | | $ | 2,549,651 | |
Interest | | | 944,663 | |
| | | | |
Total investment income | | | 3,494,314 | |
| | | | |
| | | | |
Expenses: | | | | |
Management fees (Note 3) | | | 874,370 | |
Professional services | | | 70,675 | |
Shareholders’ reports | | | 55,752 | |
Custodian fees | | | 54,099 | |
Administration fees | | | 37,492 | |
Shareholders’ services | | | 21,235 | |
Shareholders’ meeting | | | 18,304 | |
Directors’ fees and expenses | | | 4,125 | |
Other | | | 41,385 | |
| | | | |
Total expenses before interest expense | | | 1,177,437 | |
Interest expense | | | 46,326 | |
| | | | |
Total expenses | | | 1,223,763 | |
| | | | |
Net investment income | | | 2,270,551 | |
| | | | |
| | | | |
NET REALIZED AND UNREALIZED GAIN (LOSS) ON INVESTMENTS, FOREIGN CURRENCY AND FORWARD CURRENCY CONTRACTS | | | | |
Net realized gain on: | | | | |
Investments (net of foreign capital gains taxes of $26,847) | | | 3,074,555 | |
Foreign currency and forward currency contracts | | | 726,786 | |
| | | | |
Total net realized gain on investments, foreign currency and forward currency contracts | | | 3,801,341 | |
| | | | |
Net change in unrealized appreciation (depreciation) on: | | | | |
Investments | | | 4,559,906 | |
Foreign currency and forward currency contracts | | | (69,651 | ) |
| | | | |
Total net change in unrealized appreciation on investments, foreign currency and forward currency contracts | | | 4,490,255 | |
| | | | |
Net realized and unrealized gain on investments, foreign currency and forward currency contracts | | | 8,291,596 | |
| | | | |
Net increase in net assets resulting from operations | | $ | 10,562,147 | |
| | | | |
The accompanying notes are an integral part of these financial statements.
18
|
| |
Lazard Global Total Return and Income Fund, Inc. |
Statements of Changes in Net Assets |
|
| |
| | | | | | | | | |
| | Six Months Ended
June 30, 2011
(unaudited) | | Year Ended
December 31,
2010 | |
| | | | | |
INCREASE (DECREASE) IN NET ASSETS | | | | | | | | | |
| | | | | | | | | |
Operations: | | | | | | | | | |
Net investment income | | | $ | 2,270,551 | | | $ | 3,711,236 | |
Net realized gain on investments, foreign currency and forward currency contracts | | | | 3,801,341 | | | | 3,348,737 | |
Net change in unrealized appreciation (depreciation) on investments, foreign currency and forward currency contracts | | | | 4,490,255 | | | | (938,139 | ) |
| | | | | | | | | |
Net increase in net assets resulting from operations | | | | 10,562,147 | | | | 6,121,834 | |
| | | | | | | | | |
| | | | | | | | | |
Distributions to Stockholders (Note 2(g)): | | | | | | | | | |
From net investment income | | | | (5,051,970 | ) | | | (6,474,272 | ) |
Return of capital | | | | — | | | | (3,893,621 | ) |
| | | | | | | | | |
Net decrease in net assets resulting from distributions | | | | (5,051,970 | ) | | | (10,367,893 | ) |
| | | | | | | | | |
Total increase (decrease) in net assets | | | | 5,510,177 | | | | (4,246,059 | ) |
Net assets at beginning of period | | | | 161,652,038 | | | | 165,898,097 | |
| | | | | | | | | |
Net assets at end of period* | | | $ | 167,162,215 | | | $ | 161,652,038 | |
| | | | | | | | | |
* Includes undistributed (distributions in excess of) net investment income of (Note 2(g)) | | | $ | (2,719,628 | ) | | $ | 61,791 | |
| | | | | | | | | |
| | | | | | | | | |
Transactions in Capital Shares: | | | | | | | | | |
Common shares outstanding at beginning of period | | | | 9,605,237 | | | | 9,605,237 | |
| | | | | | | | | |
Common shares outstanding at end of period | | | | 9,605,237 | | | | 9,605,237 | |
| | | | | | | | | |
The accompanying notes are an integral part of these financial statements.
19
|
| |
Lazard Global Total Return and Income Fund, Inc. |
Statement of Cash Flows |
For the Six Months Ended June 30, 2011 (unaudited) |
| |
| | | | |
INCREASE (DECREASE) IN CASH AND FOREIGN CURRENCY | | | | |
| |
Cash flows from operating activities: | | | | |
Net increase in net assets from operations | | $ | 10,562,147 | |
Adjustments to reconcile net increase in net assets from operations to net cash provided in operating activities
Decrease in interest and dividends receivable | | | 220,222 | |
Accretion of bond discount and amortization of bond premium | | | (226,793 | ) |
Inflation index adjustment | | | (29,064 | ) |
Decrease in other accrued expenses and payables | | | (26,773 | ) |
Net realized gain on investments, foreign currency and forward currency contracts | | | (3,801,341 | ) |
Net change in unrealized appreciation on investments, foreign currency and forward currency contracts | | | (4,490,255 | ) |
Purchase of long-term investments | | | (34,943,876 | ) |
Proceeds from disposition of long-term investments | | | 26,634,918 | |
Proceeds from disposition of short-term investments, net | | | 861,816 | |
| | | | |
Net cash provided in operating activities | | | (5,238,999 | ) |
| | | | |
| | | | |
Cash flows from financing activities: | | | | |
Cash distribution paid (Note 2(g)) | | | (5,051,970 | ) |
Gross drawdowns in line of credit balance | | | 13,260,000 | |
Gross paydowns in line of credit balance | | | (3,790,000 | ) |
| | | | |
Net cash used in financing activities | | | 4,418,030 | |
| | | | |
| | | | |
Effect of exchange rate changes on cash | | | 726,603 | |
| | | | |
Net decrease in cash and foreign currency | | | (94,366 | ) |
| | | | |
Cash and foreign currency: | | | | |
Beginning balance | | | 487,585 | |
| | | | |
Ending balance | | $ | 393,219 | |
| | | | |
| | | | |
Supplemental disclosure of cash flow information: | | | | |
Cash paid during the period for interest | | $ | (46,326 | ) |
| | | | |
The accompanying notes are an integral part of these financial statements.
20
|
| |
Lazard Global Total Return and Income Fund, Inc. |
Financial Highlights |
Selected data for a share of common stock outstanding throughout each period |
| |
| | | | | | | | | | | | | | | | | | | |
| | Six Months
Ended
6/30/11† | | Year Ended | |
| | | | |
| | | 12/31/10 | | 12/31/09 | | 12/31/08 | | 12/31/07 | | 12/31/06 | |
| | | | | | | | | | | | | |
Net asset value, beginning of period | | $ | 16.83 | | $ | 17.27 | | $ | 14.58 | | $ | 24.37 | | $ | 23.77 | | $ | 21.10 | |
| | | | | | | | | | | | | | | | | | | |
Income (loss) from investment operations: | | | | | | | | | | | | | | | | | | | |
Net investment income | | | 0.25 | | | 0.39 | | | 0.48 | | | 0.66 | | | 0.42 | | | 0.40 | |
Net realized and unrealized gain (loss) | | | 0.85 | | | 0.25 | | | 3.21 | | | (9.02 | ) | | 1.84 | | | 4.61 | |
| | | | | | | | | | | | | | | | | | | |
Total from investment operations | | | 1.10 | | | 0.64 | | | 3.69 | | | (8.36 | ) | | 2.26 | | | 5.01 | |
| | | | | | | | | | | | | | | | | | | |
Less distributions from (Note 2(g)): | | | | | | | | | | | | | | | | | | | |
Net investment income | | | (0.53 | ) | | (0.67 | ) | | (0.08 | ) | | (1.03 | ) | | (1.15 | ) | | (1.12 | ) |
Net realized gains | | | — | | | — | | | — | | | (0.33 | ) | | (0.51 | ) | | (1.22 | ) |
Return of capital | | | — | | | (0.41 | ) | | (0.92 | ) | | (0.07 | ) | | — | | | — | |
| | | | | | | | | | | | | | | | | | | |
Total distributions | | | (0.53 | ) | | (1.08 | ) | | (1.00 | ) | | (1.43 | ) | | (1.66 | ) | | (2.34 | ) |
| | | | | | | | | | | | | | | | | | | |
Net asset value, end of period | | $ | 17.40 | | $ | 16.83 | | $ | 17.27 | | $ | 14.58 | | $ | 24.37 | | $ | 23.77 | |
| | | | | | | | | | | | | | | | | | | |
| | | | | | | | | | | | | | | | | | | |
Market value, end of period | | $ | 15.72 | | $ | 15.06 | | $ | 14.89 | | $ | 11.83 | | $ | 23.34 | | $ | 22.58 | |
| | | | | | | | | | | | | | | | | | | |
| | | | | | | | | | | | | | | | | | | |
Total Return based upon: | | | | | | | | | | | | | | | | | | | |
Net asset value (a) | | | 6.60 | % | | 4.14 | % | | 26.90 | % | | –35.33 | % | | 9.74 | % | | 24.46 | % |
Market value (a) | | | 7.96 | % | | 8.90 | % | | 36.72 | % | | –44.43 | % | | 11.35 | % | | 35.64 | % |
| | | | | | | | | | | | | | | | | | | |
Ratios and Supplemental Data: | | | | | | | | | | | | | | | | | | | |
Net assets, end of period (in thousands) | | $ | 167,162 | | $ | 161,652 | | $ | 165,898 | | $ | 140,026 | | $ | 234,125 | | $ | 228,274 | |
Ratios to average net assets: | | | | | | | | | | | | | | | | | | | |
Net expenses (b) | | | 1.49 | % | | 1.59 | % | | 1.61 | % | | 1.83 | % | | 1.58 | % | | 1.50 | % |
Gross expenses (b) | | | 1.49 | % | | 1.59 | % | | 1.61 | % | | 1.83 | % | | 1.58 | % | | 1.51 | % |
Gross expenses excluding interest expense (b) | | | 1.43 | % | | 1.47 | % | | 1.42 | % | | 1.45 | % | | 1.42 | % | | 1.43 | % |
Net investment income (b) | | | 2.77 | % | | 2.37 | % | | 3.28 | % | | 3.26 | % | | 1.71 | % | | 1.76 | % |
Portfolio turnover rate | | | 15 | % | | 32 | % | | 25 | % | | 25 | % | | 28 | % | | 38 | % |
| |
† | Unaudited. |
(a) | Total return based on per share market price assumes the purchase of common shares at the closing market price on the business day immediately preceding the first day, and sales of common shares at the closing market price on the last day, of each period indicated; dividends and distributions are assumed to be reinvested in accordance with the Fund’s Dividend Reinvestment Plan. The total return based on net asset value, or NAV, assumes the purchase of common shares at the “net asset value, beginning of period” and sales of common shares at the “net asset value, end of period”, for each of the periods indicated; distributions are assumed to be reinvested at NAV. Past performance is not indicative, or a guarantee, of future results; the investment return, market price and net asset value of the Fund will fluctuate, so that an investor’s shares in the Fund, when sold, may be worth more or less than their original cost. The returns do not reflect the deduction of taxes that a stockholder would pay on the Fund’s distributions or on the sale of Fund shares. A Period of less than one year is not annualized. |
(b) | Annualized for a period of less than one year. |
The accompanying notes are an integral part of these financial statements.
21
|
| |
Lazard Global Total Return and Income Fund, Inc. |
Notes to Financial Statements |
June 30, 2011 (unaudited) |
| |
1. Organization
Lazard Global Total Return and Income Fund, Inc. (the “Fund”) was incorporated in Maryland on January 27, 2004 and is registered under the Investment Company Act of 1940, as amended (the “Act”), as a diversified, closed-end management investment company. The Fund trades on the NYSE under the ticker symbol LGI and commenced operations on April 28, 2004. The Fund’s investment objective is total return, consisting of capital appreciation and income.
2. Significant Accounting Policies
The accompanying financial statements are presented in conformity with accounting principles generally accepted in the United States of America (“GAAP”). The following is a summary of significant accounting policies:
(a) Valuation of Investments—Market values for securities are generally based on the last reported sales price on the principal exchange or market on which the security is traded, generally as of the close of regular trading on the NYSE (normally 4:00 p.m. Eastern time) on each valuation date. Any securities not listed, for which current over-the-counter market quotations or bids are readily available, are valued at the last quoted bid price or, if available, the mean of two such prices. Securities listed on foreign exchanges are valued at the last reported sales price except as described below; securities listed on foreign exchanges that are not traded on the valuation date are valued at the last quoted bid price. Forward currency contracts are valued at the current cost of offsetting the contracts. Investments in money market funds are valued at the fund’s net asset value.
Bonds and other fixed-income securities that are not exchange-traded are valued on the basis of prices provided by pricing services which are based primarily on institutional trading in similar groups of securities, or by using brokers’ quotations.
If a significant event materially affecting the value of securities occurs between the close of the exchange or market on which the security is principally traded and the time when the Fund’s net asset value is calculated, or when current market quotations otherwise are determined not to be readily available or reliable (including restricted or other illiquid securities such as derivative instruments), such securities will be valued at their fair values as determined by, or in accordance with procedures approved by, the Board of Directors (the “Board”). The Valuation Committee of the Investment Manager may evaluate a variety of factors to determine the fair value of securities for which market quotations are determined not to be readily available
or reliable. These factors include, but are not limited to, the type of security, the value of comparable securities, observations from financial institutions and relevant news events. Input from the Investment Manager’s analysts also will be considered.
(b) Portfolio Securities Transactions and Investment Income—Portfolio securities transactions are accounted for on trade date. Realized gain (loss) on sales of investments are recorded on a specific identification basis. Dividend income is recorded on the ex-dividend date and interest income is accrued daily. The Fund amortizes premiums and accretes discounts on fixed-income securities using the effective yield method.
The Fund may be subject to taxes imposed by foreign countries in which it invests. Such taxes are generally based upon income earned or capital gains (realized or unrealized). The Fund accrues and applies such taxes to net investment income, net realized gains and net unrealized gains concurrent with the recognition of income or capital gains (realized and unrealized) from the applicable portfolio securities.
(c) Leveraging—The Fund uses leverage to invest Fund assets in currency investments, primarily using forward currency contracts and by borrowing under a credit facility with State Street Bank and Trust Company (“State Street”), up to a maximum of 33⅓% of the Fund’s total leveraged assets. If the assets of the Fund decline due to market conditions such that this 33⅓% threshold will be exceeded, leverage risk will increase.
If the Fund is able to realize a higher return on the leveraged portion of its investment portfolio than the cost of such leverage together with other related expenses, the effect of the leverage will be to cause the Fund to realize a higher net return than if the Fund were not so leveraged. There is no assurance that any leveraging strategy the Fund employs will be successful.
Using leverage is a speculative investment technique and involves certain risks. These include higher volatility of net asset value, the likelihood of more volatility in the market value of the Fund’s common stock and, with respect to borrowings, the possibility either that the Fund’s return will fall if the interest rate on any borrowings rises, or that income will fluctuate because the interest rate of borrowings varies.
If the market value of the Fund’s leveraged currency investments declines, the leverage will result in a greater decrease in net asset value, or less of an increase in net asset value, than if the Fund were not leveraged. Such results also will tend to have a similar effect on the market price of the
22
|
| |
Lazard Global Total Return and Income Fund, Inc. |
Notes to Financial Statements (continued) |
June 30, 2011 (unaudited) |
| |
Fund’s common stock. To the extent that the Fund is required or elects to prepay any borrowings, the Fund may need to liquidate investments to fund such prepayments. Liquidation at times of adverse economic conditions may result in capital losses and may reduce returns.
(d) Foreign Currency Translation and Forward Currency Contracts—The accounting records of the Fund are maintained in U.S. dollars. Portfolio securities and other assets and liabilities denominated in a foreign currency are translated daily into U.S. dollars at the prevailing rates of exchange. Purchases and sales of securities, income receipts and expense payments are translated into U.S. dollars at the prevailing exchange rates on the respective transaction dates.
The Fund does not isolate the portion of operations resulting from changes in foreign exchange rates on investments from the fluctuations arising from changes in their market prices. Such fluctuations are included in net realized and unrealized gain (loss) on investments. Net realized gain (loss) on foreign currency and forward currency contracts represents net foreign currency gain (loss) from forward currency contracts, disposition of foreign currencies, currency gain (loss) realized between the trade and settlement dates on securities transactions, and the difference between the amount of dividends, interest and foreign withholding taxes recorded on the Fund’s accounting records and the U.S. dollar equivalent amounts actually received or paid. Net change in unrealized appreciation (depreciation) on foreign currency reflects the impact of changes in exchange rates on the value of assets and liabilities, other than investments in securities, during the period.
A forward currency contract is an agreement between two parties to buy or sell currency at a set price on a future date. Upon entering into these contracts, risks may arise from the potential inability of counterparties to meet the terms of their contracts and from unanticipated movements in the value of the foreign currency relative to the U.S. dollar.
The U.S. dollar value of forward currency contracts is determined using forward exchange rates provided by quotation services. Daily fluctuations in the value of such contracts are recorded as unrealized appreciation (depreciation) on forward currency contracts. When the contract is closed, the Fund records a realized gain (loss) equal to the difference between the value at the time it was opened and the value at the time it was closed.
(e) Structured Investments—The Fund may invest in structured investments, whose values are linked either directly or inversely to changes in foreign currencies, interest rates,
commodities, indices, or other underlying instruments. The Fund may use these investments to increase or decrease its exposure to different underlying instruments, to gain exposure to markets that might be difficult to invest in through conventional securities or for other purposes. Structured investments may be more volatile than their underlying instruments, but any loss is limited to the amount of the original investment.
(f) Federal Income Tax Policy—It is the Fund’s policy to comply with the requirements of Subchapter M of the Internal Revenue Code applicable to regulated investment companies and to distribute substantially all of its taxable income to its stockholders. Therefore, no provision for federal income taxes is required. The Fund files tax returns with the U.S. Internal Revenue Service and various states.
At December 31, 2010, the Fund had $2,622,804 of unused realized capital loss carryforwards, expiring in 2017.
Under current tax law, certain capital and net foreign currency losses realized after October 31 within the taxable year may be deferred and treated as occurring on the first day of the following tax year. For the tax year ended December 31, 2010, the Fund had no net capital and foreign currency losses arising between November 1, 2010 and December 31, 2010.
On December 22, 2010, the Regulated Investment Company Modernization Act of 2010 (the “RIC Modernization Act”) was signed into law. The RIC Modernization Act includes numerous provisions that generally become effective for taxable years beginning after the date of enactment. Among the new provisions, net capital losses may be carried forward indefinitely, and their character is retained as short-term and/or long-term losses. Previously, net capital losses were carried forward for eight years and treated as short-term losses. The RIC Modernization Act also requires that post-enactment net capital losses be used before pre-enactment net capital losses. As a result, pre-enactment capital loss carryforwards may now expire unused.
Management has analyzed the Fund’s tax positions, and has concluded that no liability for unrecognized tax benefits should be recorded related to uncertain tax positions taken on returns filed for open tax years (2007-2009), or expected to be taken in the Fund’s 2010 tax returns.
(g) Dividends and Distributions—The Fund intends to declare and to pay dividends monthly from net investment income. Distributions to stockholders are recorded on the ex-dividend date. During any particular year, net realized gains from investment transactions in excess of available capital loss carryforwards would be taxable to the Fund, if
23
|
| |
Lazard Global Total Return and Income Fund, Inc. |
Notes to Financial Statements (continued) |
June 30, 2011 (unaudited) |
| |
not distributed. The Fund intends to declare and distribute these amounts, at least annually, to stockholders; however, to avoid taxation, a second distribution may be required.
Income dividends and capital gains distributions are determined in accordance with federal income tax regulations which may differ from GAAP. These book/tax differences, which may result in distribution reclassifications, are primarily due to differing treatments of foreign currency transactions and wash sales. The book/tax differences relating to stockholder distributions may result in reclassifications among certain capital accounts.
The Fund has implemented a level distribution policy to seek to maintain a stable monthly distribution, subject to oversight of the Fund’s Board. Under the Fund’s level distribution policy, the Fund intends to make regular monthly distributions at a fixed rate per share. If for any monthly distribution, net investment income and net realized short-term capital gain were less than the amount of the distribution, the difference would generally be distributed from the Fund’s assets. In addition, in order to make such distributions, the Fund might have to sell a portion of its investment portfolio at a time when independent investment judgment might not dictate such actions.
In July 2010, the Investment Manager, on behalf of itself and the Fund, received an exemptive order from the Securities and Exchange Commission (the “SEC”) facilitating the implementation of a distribution policy that may include multiple long-term capital gains distributions (“Managed Distribution Policy”). As a result, the Fund may, subject to the determination of its Board, implement a Managed Distribution Policy.
Concurrent with the monthly distributions paid from February 2011 through June 2011, the Fund issued notices pursuant to Section 19(a) of the Act (the “Section 19(a) Notices”) stating that the Fund currently estimates that it has distributed more than its net investment income and realized capital gains. Based on these estimates, it is possible that some or all of the amounts distributed may represent a return of capital. The Section 19(a) Notices may also be viewed at www.LazardNet.com.
The amounts and sources of distributions shown on the Section 19(a) Notices are only estimates and are not provided for tax reporting purposes. The actual amounts and sources of the cumulative distributions for tax reporting purposes will depend upon the Fund’s investment experience during the year and may be subject to changes based on tax regulations. The Fund will send stockholders a Form 1099-DIV for the calendar year explaining how to report these distributions for federal income tax purposes.
(h) Estimates—The preparation of financial statements in conformity with GAAP requires the Fund to make estimates and assumptions that affect the reported amounts of assets and liabilities and disclosure of contingent assets and liabilities at the date of the financial statements and the reported amounts of increases and decreases in net assets from operations during the reporting period. Actual results could differ from those estimates.
(i) Subsequent Events—Management has performed its evaluation of subsequent events and has determined that there were no subsequent events requiring adjustment or disclosure in the financial statements.
3. Investment Management Agreement
The Fund has entered into an investment management agreement (the “Management Agreement”) with the Investment Manager. Pursuant to the Management Agreement, the Investment Manager regularly provides the Fund with investment research, advice and supervision and furnishes continuously an investment program for the Fund consistent with its investment objective and policies, including the purchase, retention and disposition of securities.
The Fund has agreed to pay the Investment Manager an annual investment management fee of 0.85% of the Fund’s average daily “Total Leveraged Assets” (the Fund’s total assets including Financial Leverage (defined below)) for the services and facilities provided by the Investment Manager, payable on a monthly basis. The fee paid to the Investment Manager will be higher when the Investment Manager uses Currency Commitments and Borrowings (“Financial Leverage”) to make Currency Investments, rather than by reducing the percentage of “Net Assets” (the Fund’s assets without taking into account Financial Leverage) invested in Global Equity Investments for the purposes of making Currency Investments. “Global Equity Investments” refers to investments in the Fund’s global equity strategy consisting of equity securities of companies with market capitalizations of $5 billion or greater domiciled in those countries that comprise the Morgan Stanley Capital International (MSCI®) World® Index. “Currency Investments” refers to investments in the Fund’s emerging income strategy, consisting of emerging market currencies (primarily by entering into forward currency contracts), or instruments whose value is derived from the performance of an underlying emerging market currency, but also may invest in debt obligations, including government, government agency and corporate obligations and structured notes denominated in emerging market currencies. “Currency Commitments” are the aggregate financial exposures created by forward currency contracts in excess of that represented in the Fund’s
24
|
| |
Lazard Global Total Return and Income Fund, Inc. |
Notes to Financial Statements (continued) |
June 30, 2011 (unaudited) |
| |
Net Assets, and “Borrowings” refers to the borrowings under the Fund’s credit facility. Assuming Financial Leverage in the amount of 33⅓% of the Fund’s Total Leveraged Assets, the annual fee payable to the Investment Manager would be 1.28% of Net Assets (i.e., not including amounts attributable to Financial Leverage).
The following is an example of this calculation of the Investment Manager’s fee, using very simple illustrations. If the Fund had assets of $1,000, it could invest $1,000 in Global Equity Investments and enter into $500 in forward currency contracts (because the Fund would not have to pay money at the time it enters into the currency contracts). Similarly, the Fund could invest $1,000 in Global Equity Investments, borrow $500 and invest the $500 in foreign currency denominated bonds. In either case, the Investment Manager’s fee would be calculated based on $1,500 of assets, because the fee is calculated based on Total Leveraged Assets (Net Assets plus Financial Leverage). In our example, the Financial Leverage is in the form of either the forward currency contracts (Currency Commitments) or investments from Borrowings. The amount of the Financial Leverage outstanding, and therefore the amount of Total Leveraged Assets on which the Investment Manager’s fee is based, fluctuates daily based on changes in value of the Fund’s portfolio holdings, including changes in value of the currency involved in the forward currency contracts and foreign currency denominated bonds acquired with the proceeds of Borrowings. However, the Investment Manager’s fee will be the same regardless of whether Currency Investments are made with Currency Commitments or with Borrowings (without taking into account the cost of Borrowings).
This method of calculating the Investment Manager’s fee is different than the way closed-end investment companies typically calculate management fees. Traditionally, closed-end investment companies calculate management fees based on Net Assets plus Borrowings (excluding Financial Leverage obtained through Currency Commitments). The Investment Manager’s fee is different because the Fund’s leverage strategy is different than the leverage strategy employed by many other closed-end investment companies. Although the Fund may employ Borrowings in making Currency Investments, the Fund’s leverage strategy relies primarily on Currency Commitments, rather than relying exclusively on borrowing money and/or issuing preferred stock, as is the strategy employed by most closed-end investment companies. The Investment Manager’s fee would be lower if its fee were calculated only on Net Assets plus Borrowings, because the Investment Manager would not earn fees on Currency Investments made with Currency Commitments (forward
currency contracts). Using the example above, where the Fund has assets of $1,000 and invests $1,000 in Global Equity Investments and $500 in forward currency contracts, the following table illustrates how the Investment Manager’s fee would be different if it did not earn management fees on these types of Currency Investments. A discussion of the most recent review and approval by the Fund’s Board of the Management Agreement (including the method of calculating the Investment Manager’s fee) is included under “Other Information—Board Consideration of Management Agreement.”
| | | | | | | | | | | |
Beginning assets of $1,000 | | Fund’s management
fee based on
Total Leveraged
Assets (includes
Currency
Commitments) | | Typical
management
fee formula,
calculated excluding
Currency
Commitments | |
Global Equity Investments
(Net Assets) | | | $ | 1,000 | | | | $ | 1,000 | | |
Currency Commitments | | | $ | 500 | | | | $ | 500 | | |
Assets used to calculate
management fee | | | $ | 1,500 | | | | $ | 1,000 | | |
Management fee (0.85%) | | | $ | 12.75 | | | | $ | 8.50 | | |
Investment Manager Fee Conflict Risk—The fee paid to the Investment Manager for investment management services will be higher when the Fund uses Financial Leverage, whether through forward currency contracts or Borrowings, because the fee paid will be calculated on the basis of the Fund’s assets including this Financial Leverage. Consequently, the Investment Manager may have a financial interest for the Fund to utilize such Financial Leverage, which may create a conflict of interest between the Investment Manager and the stockholders of the Fund.
The Fund has implemented procedures to monitor this potential conflict.
4. Administration Agreement
The Fund has entered into an administration agreement with State Street to provide certain administrative services. The Fund bears the cost of such services at a fixed annual rate of $42,500, plus 0.02% of average daily net assets up to $1 billion and 0.01% of average daily net assets over $1 billion.
5. Directors’ Compensation
Certain Directors of the Fund are officers of the Investment Manager. Each Director who is not an affiliated person of the Investment Manager or any of its affiliates is paid by the Fund, The Lazard Funds, Inc., Lazard Retirement Series, Inc. and Lazard World Dividend & Income Fund, Inc. (collectively with the Fund, the “Lazard Funds”), each
25
|
| |
Lazard Global Total Return and Income Fund, Inc. |
Notes to Financial Statements (continued) |
June 30, 2011 (unaudited) |
| |
a registered management investment company advised by the Investment Manager: (1) an annual retainer of $80,000, (2) a per meeting in person regular or special meeting fee of $5,000 ($1,500 for telephonic participation), including Board, committee, subcommittee or other special meetings specifically authorized by the Board and held in connection with delegated Fund business, and (3) a telephone Audit Committee or special Board meeting fee of $1,500, with an additional annual fee for the Audit Committee Chairman of $5,000. The Independent Directors also are reimbursed for travel and other out-of-pocket expenses for attending Board and committee meetings. No additional compensation is provided in respect of committee meetings held in conjunction with a meeting of the Board. Compensation is divided among the Lazard Funds based on relative net assets. The Directors do not receive benefits from the Fund pursuant to any pension, retirement or similar arrangement.
6. Securities Transactions and Transactions with Affiliates
Purchases and sales of portfolio securities (excluding short-term investments) for the period ended June 30, 2011 were $35,090,905 and $26,296,145, respectively.
For the period ended June 30, 2011, no brokerage commissions were paid to affiliates of the Investment Manager or other affiliates of the Fund for portfolio transactions executed on behalf of the Fund.
7. Line of Credit
The Fund has a $30 million Line of Credit Agreement (the “Agreement”) with State Street primarily to borrow to invest Fund assets in Currency Investments. The Fund may borrow the lesser of $30 million or 33⅓% of its Total Leveraged Assets. Interest on borrowings is payable at the higher of the Federal Funds rate or Overnight LIBOR rate plus 1.25% from January 1, 2011 to April 20, 2011 and plus 0.75% from April 21, 2011 to June 30, 2011, on an annualized basis. Under the Agreement, the Fund has also agreed to pay a 0.15% per annum fee on the unused portion of the commitment, payable quarterly in arrears. During the period ended June 30, 2011, the Fund had borrowings under the Agreement as follows:
| | | | | | | |
Average Daily
Loan Balance* | | Maximum Daily
Loan Outstanding | | Weighted Average
Interest Rate | |
| | | | | | |
$ 9,328,370 | | | $ 13,260,000 | | | 1.14 % | |
*For 181 days borrowings were outstanding.
8. Foreign Securities Investment Risks
The Fund invests in securities of foreign entities and in instruments denominated in foreign currencies which involve risks
not typically associated with investments in domestic securities. Non-domestic securities carry special risks, such as exposure to currency fluctuations, less developed or less efficient trading markets, political instability, a lack of company information, differing auditing and legal standards, and, potentially, less liquidity. The Fund’s investments in emerging market countries are exposed to additional risks. The Fund’s performance will be influenced by political, social and economic factors affecting companies in emerging market countries. Emerging market countries generally have economic structures that are less diverse and mature, and political systems that are less stable, than those of developed countries.
9. Contractual Obligations
The Fund enters into contracts in the normal course of business that contain a variety of indemnifications. The Fund’s maximum exposure under these arrangements is unknown. Management has reviewed the Fund’s existing contracts and expects the risk of loss to be remote.
10. Fair Value Measurements
Fair value is defined as the price that the Fund would receive to sell an asset, or would pay to transfer a liability, in an orderly transaction between market participants at the date of measurement. The Fair Value Measurements and Disclosures provisions of GAAP also establish a framework for measuring fair value, and a three-level hierarchy for fair value measurement that is based upon the transparency of inputs to the valuation of an asset or liability. Inputs may be observable or unobservable and refer, broadly, to the assumptions that market participants would use in pricing the asset or liability. Observable inputs reflect the assumptions that market participants would use in pricing the asset or liability based on market data obtained from sources independent of the Fund. Unobservable inputs reflect the Fund’s own assumptions about the assumptions that market participants would use in pricing the asset or liability, developed based on the best information available in the circumstances. Each investment’s fair value measurement level within the fair value hierarchy is based on the lowest level of any input that is significant to the overall fair value measurement. The three-level hierarchy of inputs is summarized below.
| |
• | Level 1—unadjusted quoted prices in active markets for identical investments |
| |
• | Level 2—other significant observable inputs (including unadjusted quoted prices for similar investments, interest rates, prepayment speeds, credit risk, etc.) |
| |
• | Level 3—significant unobservable inputs (including the Fund’s own assumptions in determining the fair value of investments) |
26
|
| |
Lazard Global Total Return and Income Fund, Inc. |
Notes to Financial Statements (continued) |
June 30, 2011 (unaudited) |
| |
The inputs or methodology used for valuing securities are not necessarily an indication of the risks associated with investing in these securities.
The following table summarizes the valuation of the Fund’s investments by each fair value hierarchy level as of June 30, 2011:
| | | | | | | | | | | | | | | | | | | | |
Description | | | Unadjusted
Quoted Prices in
Active Markets
for Identical
Investments
(Level 1) | | Significant
Other
Observable
Inputs
(Level 2) | | Significant
Unobservable
Inputs
(Level 3) | | Balance as of
June 30, 2011 | |
| | | | | | | | | | | |
| | | | | | | | | | | | | |
Assets: | | | | | | | | | | | | | |
Common Stocks* | | | $ | 151,881,505 | | | $ | — | | | $ | — | | | | $ | 151,881,505 | | |
Foreign Government Obligations* | | | | — | | | | 25,854,692 | | | | — | | | | | 25,854,692 | | |
Short-Term Investment | | | | — | | | | 1,882,367 | | | | — | | | | | 1,882,367 | | |
Other Financial Instruments** | | | | | | | | | | | | | | | | | | | |
Forward Currency Contracts | | | | — | | | | 1,196,675 | | | | — | | | | | 1,196,675 | | |
| | | | | | | | | | | | | | | | | | | |
Total | | | $ | 151,881,505 | | | $ | 28,933,734 | | | $ | — | | | | $ | 180,815,239 | | |
| | | | | | | | | | | | | | | | | | | |
| | | | | | | | | | | | | | | | | | | |
Liabilities: | | | | | | | | | | | | | | | | | | | |
Other Financial Instruments** | | | | | | | | | | | | | | | | | | | |
Forward Currency Contracts | | | $ | — | | | $ | (1,047,749 | ) | | $ | — | | | | $ | (1,047,749 | ) | |
| | | | | | | | | | | | | | | | | | | |
| |
* | Please refer to Portfolio of Investments and Notes to Portfolio of Investments, on pages 8 to 9 and 16, for portfolio holdings by country and industry. |
** | Other financial instruments are derivative instruments which are valued at the unrealized appreciation/depreciation. |
Following is a reconciliation of investments in which significant unobservable inputs (Level 3) were used in determining fair value during the period ended June 30, 2011:
| | | | | | | | | | | | | | | | | | | | | | | | | | | | | | | | | | | | | | | | |
Description | | | Balance as of
December 31,
2010 | | Accrued
Discounts | | Realized
Loss | | Change in
Unrealized
Appreciation | | Purchases | | Sales | | Net
Transfer
Into
Level 3 | | Net
Transfers
Out of
Level 3 | | Balance
as of
June 30,
2011 | | Net Change in
Unrealized
Appreciation
from Investments
Still Held at
June 30, 2011 | |
| | | | | | | | | | | | | | | | | | | | | | | |
|
Foreign Government Obligations | | | $ | 899,155 | | | | $ | 7,591 | | | $ | (137,180 | ) | | $ | 112,111 | | | $ | — | | $ | (657,354 | ) | $ | — | | $ | (224,323 | ) | $ | — | | | $ | — | | |
| | | | | | | | | | | | | | | | | | | | | | | | | | | | | | | | | | | | | | | |
There were no significant transfers into and out of Levels 1, 2 or 3 during the period ended June 30, 2011.
11. Derivative Instruments
The Fund may use derivative instruments, including forward currency contracts, to gain exposure to the local currency and interest rates of emerging markets or to hedge certain types of currency exposure.
For the period ended June 30, 2011, the cost of purchases and the proceeds from sales of forward currency contracts were $382,129,379 and $375,196,443, respectively.
The following table summarizes the fair value of derivative instruments on the Statement of Assets and Liabilities as of June 30, 2011:
| | | | |
| | Fair Value | |
| | | |
Asset Derivatives | | | | |
Foreign Exchange Risk: | | | | |
Gross unrealized appreciation on | | | | |
forward currency contracts | | $ | 1,196,675 | |
| | | | |
| |
Liability Derivatives | | | | |
Foreign Exchange Risk: | | | | |
Gross unrealized depreciation on | | | | |
forward currency contracts | | $ | 1,047,749 | |
| | | | |
27
|
| |
Lazard Global Total Return and Income Fund, Inc. |
Notes to Financial Statements (concluded) |
June 30, 2011 (unaudited) |
| |
The effect of derivative instruments on the Statement of Operations for the period ended June 30, 2011 was:
| | | | |
| | Amount | |
Realized Gain (Loss) on Derivatives Recognized
in Income | | | | |
Foreign Exchange Risk: | | | | |
Net realized gain on forward currency contracts | | $ | 726,786 | |
| | | | |
Net Change in Unrealized Appreciation (Depreciation)
on Derivatives Recognized in Income | | | | |
Foreign Exchange Risk: | | | | |
Net change in unrealized depreciation on
forward currency contracts | | $ | (69,461 | ) |
| | | | |
28
|
| |
Lazard Global Total Return and Income Fund, Inc. |
Proxy Voting Results |
(unaudited) |
| |
The Annual Meeting of Stockholders was held on April 29, 2011, to vote on the following proposal. The proposal received the required number of votes of stockholders and was adopted.
Election of the following Directors:
| |
• | Two Class III Directors (Ashish Bhutani and Richard Reiss, Jr.), each to serve for a three-year term expiring at the 2014 Annual Meeting and/or until his successor is duly elected and qualified. |
| | | | | | | |
| Director | | | For | | Withhold Authority | |
| | | | | | | |
| Ashish Bhutani | | 8,154,734 | | 146,899 | |
| Richard Reiss, Jr. | | 7,938,112 | | 363,521 | |
29
|
| |
Lazard Global Total Return and Income Fund, Inc. |
Dividend Reinvestment Plan |
(unaudited) |
| |
Unless you elect to receive distributions in cash (i.e., opt-out), all dividends, including any capital gain distributions, on your common stock will be automatically reinvested by Computershare, Inc., as dividend disbursing agent (the “Plan Agent”), in additional common stock under the Fund’s Dividend Reinvestment Plan (the “Plan”). You may elect not to participate in the Plan by contacting the Plan Agent. If you do not participate, you will receive all distributions in cash, paid by check mailed directly to you by the Plan Agent.
Under the Plan, the number of shares of common stock you will receive will be determined on the dividend or distribution payment date, as follows:
| |
(1) | If the common stock is trading at or above net asset value at the time of valuation, the Fund will issue new shares at a price equal to the greater of (i) net asset value per common share on that date or (ii) 95% of the common stock’s market price on that date. |
| |
(2) | If the common stock is trading below net asset value at the time of valuation, the Plan Agent will receive the dividend or distribution in cash and will purchase common stock in the open market, on the NYSE or elsewhere, for the participants’ accounts. It is possible that the market price for the common stock may increase before the Plan Agent has completed its purchases. Therefore, the average purchase price per share paid by the Plan Agent may exceed the market price at the time of valuation, resulting in the purchase of fewer shares than if the dividend or distribution had been paid in common stock issued by the Fund. The Plan Agent will use all dividends and distributions received in cash to purchase common stock in the open market within 30 days of the valuation date. Interest will not be paid on any uninvested cash payments. |
You may withdraw from the Plan at any time by giving written notice to the Plan Agent. If you withdraw or the
Plan is terminated, you will receive whole shares in your account under the Plan and you will receive a cash payment for any fraction of a share in your account. If you wish, the Plan Agent will sell your shares and send you the proceeds, minus an initial $15 service fee plus $0.12 per share being liquidated (for processing and brokerage expenses).
The Plan Agent maintains all stockholders’ accounts in the Plan and gives written confirmation of all transactions in the accounts, including information you may need for tax records. Shares of common stock in your account will be held by the Plan Agent in non-certificated form. Any proxy you receive will include all common stock you have received under the Plan.
There is no brokerage charge for reinvestment of your dividends or distributions in newly-issued shares of common stock. However, all participants will pay a pro rata share of brokerage commissions incurred by the Plan Agent when it makes open market purchases.
Automatically reinvesting dividends and distributions does not mean that you do not have to pay income taxes due upon receiving dividends and distributions.
If you hold your common stock with a brokerage firm that does not participate in the Plan, you will not be able to participate in the Plan and any dividend reinvestment may be effected on different terms than those described above. Consult your financial advisor for more information.
The Fund reserves the right to amend or terminate the Plan if, in the judgment of the Board, the change is warranted. There is no direct service charge to participants in the Plan (other than the service charge when you direct the Plan Agent to sell your common stock held in a dividend reinvestment account); however, the Fund reserves the right to amend the Plan to include a service charge payable by the participants. Additional information about the Plan may be obtained from the Plan Agent at P.O. Box 43010, Providence, Rhode Island 02940-3010.
30
|
| |
Lazard Global Total Return and Income Fund, Inc. |
Board of Directors and Officers Information |
(unaudited) |
| |
| | | | |
Name (Age)
Address(1) | | Position(s) with the Fund
(Since) and Term(2) | | Principal Occupation(s) and Other Public Company
Directorships Held During the Past Five Years(2) |
| | | | | |
| | | | |
Board of Directors: | | | | |
| | | | |
Class I — Directors with Term Expiring in 2012 | |
| | | | |
Independent Directors: | | | | |
| | | | |
Leon M. Pollack (70) | | Director
(August 2006) | | Private Investor |
| | | | |
Robert M. Solmson (63) | | Director
(September 2004) | | Fairwood Capital, LLC, a private investment corporation engaged primarily in real estate and hotel investments, President (2008 - present) |
| | | | |
Interested Director(3): | | | | |
| | | | |
Charles L. Carroll (50) | | Chief Executive Officer,
President and Director
(June 2004) | | Investment Manager, Deputy Chairman and Head of Global Marketing (2004 - present) |
| | | | |
Class II — Directors with Term Expiring in 2013 | |
| | | | |
Independent Directors: | | | | |
| | | | |
Kenneth S. Davidson (66)(4) | | Director
(February 2004) | | Davidson Capital Management Corporation, an investment manager, President (1978 - present) |
| | | | |
| | | | Aquiline Holdings LLC, an investment manager, Partner (2006 - present) |
| | | | |
Nancy A. Eckl (48) | | Director
(February 2007) | | American Beacon Advisors, Inc. (“American Beacon”) and certain funds advised by American Beacon, Vice President (1990 - 2006) |
| | | | |
| | | | College Retirement Equities Fund (eight accounts), Trustee (2007 - present) |
| | | | |
| | | | TIAA-CREF Funds (51 funds) and TIAA-CREF Life Funds (10 funds), Trustee (2007 - present) |
| | | | |
| | | | TIAA Separate Account VA-1, Member of the Management Committee (2007 - present) |
| | | | |
Lester Z. Lieberman (81) | | Director
(February 2004) | | Private Investor |
| | | | |
Class III — Directors with Term Expiring in 2014 | | |
| | | | |
Independent Director: | | | | |
| | | | |
Richard Reiss, Jr. (67) | | Director
(February 2004) | | Georgica Advisors LLC, an investment manager, Chairman (1997 - present) |
| | | | |
| | | | O’Charley’s, Inc., a restaurant chain, Director (1984 - present) |
| | | | |
Interested Director(3): | | | | |
| | | | |
Ashish Bhutani (51) | | Director
(July 2005) | | Investment Manager, Chief Executive Officer (2004 - present)
Lazard Ltd, Vice Chairman and Director (2010 - present) |
| |
(1) | The address of each Director is Lazard Asset Management LLC, 30 Rockefeller Plaza, New York, New York 10112-6300. |
(2) | Each Director also serves as a Director for each of the Lazard Funds (comprised of, as of July 31, 2011, 23 active investment portfolios). All of the Independent Directors, except Mr. Lieberman, are also board members of Lazard Alternative Strategies Fund, L.L.C., a privately-offered fund registered under the Act and advised by an affiliate of the Investment Manager. |
(3) | Messrs. Bhutani and Carroll are “interested persons” (as defined in the Act) of the Fund because of their positions with the Investment Manager. |
(4) | It is possible that Mr. Davidson could be deemed to be an affiliate of a company that has an indirect ownership interest in a broker-dealer that the Investment Manager may use to execute portfolio transactions for clients other than the Fund, and thus an “interested person” (as defined in the Act) of the Fund. However, due to the structure of Mr. Davidson’s relationship with the company and the remote nature of any deemed affiliation with the broker-dealer, Mr. Davidson is not identified as an “interested person” (as defined in the Act) of the Fund. Mr. Davidson participates in Fund Board meetings as if his status were that of an “interested person” (as defined in the Act). |
31
|
| |
Lazard Global Total Return and Income Fund, Inc. |
Board of Directors and Officers Information (concluded) |
(unaudited) |
| |
| | | | |
Name (Age)
Address(1) | | Position(s) with the Fund
(Since) and Term(2) | | Principal Occupation(s) During the Past Five Years |
| | | | | |
| | | | |
Officers(3): | | | | |
| | | | |
Nathan A. Paul (38) | | Vice President
and Secretary
(February 2004) | | Managing Director and General Counsel of the Investment Manager |
| | | | |
Stephen St. Clair (52) | | Treasurer
(February 2004) | | Vice President of the Investment Manager |
| | | | |
Brian D. Simon (49) | | Chief Compliance Officer
(January 2009) and
Assistant Secretary
(February 2004) | | Managing Director (since February 2011, previously Director) of the Investment Manager and Chief Compliance Officer (since January 2009) of the Investment Manager and the Fund. |
| | | | |
Tamar Goldstein (36) | | Assistant Secretary
(February 2009) | | Vice President (since March 2009) and previously Counsel (November 2006 to February 2009) of the Investment Manager; Associate at Schulte Roth & Zabel LLP, a law firm, from May 2004 to October 2006 |
| | | | |
Cesar A. Trelles (36) | | Assistant Treasurer
(December 2004) | | Vice President (since February 2011, previously Fund Administration Manager) of the Investment Manager |
| |
(1) | The address of each officer is Lazard Asset Management LLC, 30 Rockefeller Plaza, New York, New York 10112-6300. |
(2) | Each officer serves for an indefinite term, until his or her successor is elected and qualifies or until his or her earlier resignation or removal. Each officer serves in the same capacity for the other Lazard Funds. |
(3) | In addition to Charles L. Carroll, President, whose information is included in the Class I Interested Director section. |
32
|
| |
Lazard Global Total Return and Income Fund, Inc. |
Other Information |
(unaudited) |
| |
Proxy Voting
A description of the policies and procedures used to determine how proxies relating to Fund portfolio securities are voted is available (1) without charge, upon request, by calling (800) 823-6300 or (2) on the SEC’s website at http://www.sec.gov.
The Fund’s proxy voting record for the most recent 12-month period ended June 30 is available (1) without charge, upon request, by calling (800) 823-6300 or (2) on the SEC’s website at http://www.sec.gov. Information as of June 30 each year will generally be available by the following August 31.
Form N-Q
The Fund files a complete schedule of its portfolio holdings for the first and third quarters of its fiscal year with the SEC on Form N-Q. The Fund’s Forms N-Q are available on the SEC’s website at http://www.sec.gov and may be reviewed and copied at the SEC’s Public Reference Room in Washington, D.C. Information on the operation of the SEC’s Public Reference Room may be obtained by calling 1-800-SEC-0330.
Board Consideration of Management Agreement
At the meeting of the Fund’s Board held on May 31 and June 1, 2011, the Board considered the approval, for an additional annual period, of the Management Agreement between the Fund and the Investment Manager. The Independent Directors were assisted in their review by independent legal counsel and met with counsel in executive session separate from representatives of the Investment Manager.
|
Services Provided |
Representatives of the Investment Manager discussed with the Board the Investment Manager’s written presentation provided in advance of the meeting addressing, among other matters, the nature, extent and quality of services that the Investment Manager provides the Fund, including a discussion of the Investment Manager and its clients (of which the Lazard Funds complex of 23 active funds comprises approximately $21.7 billion, and the Fund and the other publicly-traded closed-end fund managed by the Investment Manager comprises approximately $260.6 million, of the nearly $145 billion of total assets under the management of the Investment Manager and its global affiliates as of March 31, 2011). The representatives of the Investment Manager noted that the Investment Manager believes that the Fund continues to benefit significantly from the infrastructure and services provided by the Investment Manager’s global investment management platform and technology, operational and legal and compliance support. The Directors also considered information |
provided by the Investment Manager regarding its personnel, resources, financial condition and experience. The Directors were provided with the Fund’s market price performance and market discounts to net asset value and distributions.
The Directors considered the various services provided by the Investment Manager including the Investment Manager’s research and portfolio management capabilities and oversight of day-to-day operations, including supervision of fund accounting and administration-related services and assistance in meeting legal and regulatory requirements. The Directors also considered the Investment Manager’s infrastructure and agreed that the Fund benefits from the services and infrastructure provided by the Investment Manager. The Directors accepted management’s assertion that such services and infrastructure are greater than those typically provided to a fund complex not managed by a large, global firm such as the Investment Manager.
|
Comparative Management Fee, Expense Ratio and Performance Information |
The Directors reviewed comparative management fee, expense ratio and performance (through March 31, 2011) information prepared by Lipper, Inc. (“Lipper”) noting the limitations of the Lipper comparison group (the “Group”). Lipper’s materials stated that Lipper’s reports are specifically designed to provide boards of directors the necessary fee, expense and investment performance information to help fulfill their advisory contract renewal responsibilities under Section 15(c) of the Act. |
The Directors also discussed the management fees and expense ratios (leveraged and unleveraged) for the Fund. They noted the methodology and assumptions used by Lipper, including that management fee comparisons include administrative fees (which, for the Fund, are paid to the Fund’s third party administrator that is not affiliated with the Investment Manager) and that the quintile rankings used therein (referred to below) did not include fixed dollar amounts paid to administrators. It was noted that such fixed fees were not material relative to the Fund’s management fees, but could affect management fee quintile rankings if included in Lipper’s analysis.
In reviewing Lipper’s analysis, it was noted that, as calculated by Lipper, the management fee was slightly above the Group median and the expense ratios were below the Lipper universe (“Universe”) medians.
The Directors noted that total return performance (based on net asset value) ranked second, third or fourth of the four funds in the Fund’s Group over various measurement
33
|
| |
Lazard Global Total Return and Income Fund, Inc. |
Other Information (continued) |
(unaudited) |
| |
periods ended March 31, 2011. The Directors, however, noted that no funds in the Group or Universe pursued a strategy similar to that of the Fund’s strategy of investing in global equity securities and in forward currency contracts. The Lipper analysis also included a comparison of the Fund’s performance to that of its benchmark index. The Directors were advised that the Investment Manager did not manage any separately managed accounts with similar investment objectives, policies and strategies using the Fund’s investment strategies.
|
Fee Calculation |
The Board considered that the method of calculating management fees is based on the Fund’s Total Leveraged Assets, pursuant to which the management fee borne by stockholders will increase to the extent the Investment Manager makes Currency Investments by incurring Financial Leverage rather than reducing the percentage of Net Assets invested in Global Equity Investments, for the purposes of making Currency Investments, and considered the advantages of increased investment exposure through Financial Leverage. The Board considered the economic equivalence, and the similarities, from an investment management perspective, of Currency Investments (1) made with Currency Commitments and (2) made with the proceeds of Borrowings. |
The Board considered that (1) this method of calculating management fees is different than the way closed-end investment companies typically calculate management fees, (2) traditionally closed-end funds calculate management fees based on Net Assets plus Borrowings (excluding Financial Leverage obtained through Currency Commitments) and (3) the Investment Manager’s fee would be lower if its fee were calculated only on Net Assets plus Borrowings, because the Investment Manager would not earn fees on Currency Investments made with Currency Commitments (forward currency contracts or other derivative instruments whose value is derived from the performance of an underlying emerging market currency). The Board considered that the Investment Manager’s fee is different because the Fund’s leverage strategy is different than the strategy employed by many other leveraged closed-end investment companies—that although the Fund may employ Borrowings in making Currency Investments, the Fund’s leverage strategy relies primarily on Currency Commitments rather than relying exclusively on borrowing money and/or issuing preferred stock. The Board considered the Fund’s use of Currency Commitments for leverage (rather than relying exclusively on borrowing money and/or issuing preferred stock) and the Investment Manager’s belief that forward currency contracts, or other derivative instruments whose value is derived from the per-
formance of an underlying emerging market currency, often offer a more attractive way to gain exposure to emerging market interest rate opportunities and currencies than investments in debt obligations and the fact that there might not be a viable debt market in certain emerging market countries. The Board also considered the Investment Manager’s view that foreign currency contracts present less counterparty and custody risks and the Investment Manager’s extensive expertise with these instruments, as discussed in detail in previous Board meetings.
Procedures adopted by the Investment Manager to evaluate possible conflicts of interest that may arise from the fee calculation methodology, include the following: (1) no less frequently than monthly, decisions regarding the amount of the Fund’s allocation to Currency Investments must be reviewed by a Managing Director of the Investment Manager not involved in the decision-making process and the Fund’s Chief Compliance Officer, and that such review be documented to include the basis therefor, documentation to be retained for six years, the first two years in an easily accessible place, (2) the Investment Manager must provide the Board with a quarterly report regarding these decisions and the reasons therefor and (3) the Investment Manager must deliver a quarterly certification to the Board, signed by a Managing Director of the Investment Manager and the Fund’s or the Investment Manager’s Chief Compliance Officer (as applicable), that the procedures had been complied with during the previous quarter. The Investment Manager’s representatives stated that such procedures had been followed and that the Investment Manager would continue to follow those procedures.
|
Investment Manager Profitability and Economies of Scale |
The Directors reviewed for the Fund information prepared by the Investment Manager concerning profits realized by the Investment Manager and its affiliates resulting from the Fund’s Management Agreement, calculated using the actual revenues received for the calendar year ended December 31, 2010 and the Investment Manager’s cost allocation methodology to compute an estimate of the Fund’s expenses. The representatives of the Investment Manager stated that neither the Investment Manager nor its affiliates receive any significant indirect benefits from the Investment Manager acting as investment adviser to the Fund. The Investment Manager’s representatives stated that the broker-dealer that is treated as an affiliate of the Investment Manager did not effect trades for the Fund during the period under review. The Investment Manager’s representatives reviewed with the Board information provided on the Investment Manager’s brokerage practices and the Fund’s brokerage allocation, commission payments and soft dollar commissions and benefits. |
34
|
| |
Lazard Global Total Return and Income Fund, Inc. |
Other Information (concluded) |
(unaudited) |
| |
The profitability percentages were within ranges determined by relevant court cases not to be so disproportionately large that they bore no reasonable relationship to the services rendered. Representatives of the Investment Manager stated that the Investment Manager believed the profits are not unreasonable in light of the services provided and other factors. The Directors considered the Investment Manager’s estimated profitability with respect to the Fund as part of their evaluation of whether the Fund’s fee under its Management Agreement bears a reasonable relationship to the mix of services provided by the Investment Manager, including the nature, extent and quality of such services, and evaluated profitability in light of the relevant circumstances for the Fund. It was noted that, because the Fund is a closed-end fund without daily inflows and outflows of capital, there were not at this time significant economies of scale to be realized by the Investment Manager in managing the Fund’s assets.
At the conclusion of these discussions, each of the Directors expressed the opinion that he or she had been furnished with sufficient information to make an informed business decision with respect to the renewal of the Fund’s Management Agreement. Based on its discussions and considerations as described above, the Board made the following conclusions and determinations.
| |
• | The Board concluded that the nature, extent and quality of the services provided by the Investment Manager are adequate and appropriate, noting the benefits of advisory and research services and other services and infrastructure (as discussed above) associated with a nearly $145 billion global asset management business. |
| |
• | The Board was generally satisfied with the Fund’s overall performance, in light of the considerations described above. |
| |
• | The Board concluded that the Fund’s fee paid to the Investment Manager was reasonable in light of the considerations discussed above. |
| |
• | The Board determined that because the Fund is a closed-end fund without daily inflows and outflows of capital the Fund’s fee schedule is reasonable in light of current economies of scale considerations and that there were not at this time significant economies of scale to be realized by the Investment Manager. |
The Board considered these conclusions and determinations in their totality and, without any one factor being dispositive, determined that approval of the Fund’s Management Agreement was in the best interests of the Fund and its stockholders.
35
[This page intentionally left blank]
|
Lazard Global Total Return and Income Fund, Inc. |
30 Rockefeller Plaza |
New York, New York 10112-6300
Telephone: 800-823-6300
http://www.LazardNet.com |
|
Investment Manager |
Lazard Asset Management LLC
30 Rockefeller Plaza
New York, New York 10112-6300
Telephone: 800-823-6300 |
|
Custodian |
State Street Bank and Trust Company
One Lincoln Street
Boston, Massachusetts 02111 |
|
Transfer Agent and Registrar |
Computershare Trust Company, N.A.
P.O. Box 43010
Providence, Rhode Island 02940-3010 |
|
Dividend Disbursing Agent |
Computershare, Inc.
P.O. Box 43010 |
Providence, Rhode Island 02940-3010 |
|
Independent Registered Public Accounting Firm |
Deloitte & Touche LLP
Two World Financial Center
New York, New York 10281-1414 |
|
Legal Counsel |
Stroock & Stroock & Lavan LLP
180 Maiden Lane
New York, New York 10038-4982
http://www.stroock.com |

This report is intended only for the information of stockholders of common stock of Lazard Global Total Return and Income Fund, Inc.
LAZARD
Lazard Asset Management LLC 30 Rockefeller Plaza www.LazardNet.com
New York, NY 10112-6300
ITEM 2. CODE OF ETHICS.
Not applicable.
ITEM 3. AUDIT COMMITTEE FINANCIAL EXPERT.
Not applicable.
ITEM 4. PRINCIPAL ACCOUNTANT FEES AND SERVICES.
Not applicable.
ITEM 5. AUDIT COMMITTEE OF LISTED REGISTRANTS.
Not applicable.
ITEM 6. INVESTMENTS
Not applicable.
ITEM 7. DISCLOSURE OF PROXY VOTING POLICIES AND PROCEDURES FOR CLOSED END MANAGEMENT INVESTMENT COMPANIES.
Not applicable.
ITEM 8. PORTFOLIO MANAGERS OF CLOSED-END MANAGEMENT INVESTMENT COMPANIES.
Not applicable.
ITEM 9. PURCHASES OF EQUITY SECURITIES BY CLOSED-END MANAGEMENT INVESTMENT COMPANY AND AFFILIATED PURCHASERS.
Not applicable.
ITEM 10. SUBMISSION OF MATTERS TO A VOTE OF SECURITY HOLDERS.
There were no material changes to the procedures by which shareholders may recommend nominees to the Registrant’s Board of Directors during the period covered by this report.
ITEM 11. CONTROLS AND PROCEDURES.
(a) The Registrant’s principal executive and principal financial officers have concluded, based on their evaluation of the Registrant’s disclosure controls and procedures as of a date within 90 days of the filing date of this report, that the Registrant’s disclosure controls and procedures are reasonably designed to ensure that information required to be disclosed by the Registrant on Form N-CSR is recorded, processed, summarized and reported within the required time periods and that information required to be disclosed by the Registrant in the reports that it files or submits on Form N-CSR is accumulated and communicated to the Registrant’s management, including its principal executive and principal financial officers, as appropriate to allow timely decisions regarding required disclosure.
(b) There were no changes to the Registrant’s internal control over financial reporting that occurred during the second fiscal quarter of the period covered by this report that have materially affected, or are reasonably likely to materially affect, the Registrant’s internal control over financial reporting.
ITEM 12. EXHIBITS.
(a)(1) Not applicable.
(a)(2) Certifications of principal executive and principal financial officers as required by Rule 30a-2(a) under the Investment Company Act of 1940.
(a)(3) Not applicable.
(b) Certifications of principal executive and principal financial officers as required by Rule 30a-2(b) under the Investment Company Act of 1940.
SIGNATURES
Pursuant to the requirements of the Securities Exchange Act of 1934 and the Investment Company Act of 1940, the registrant has duly caused this report to be signed on its behalf by the undersigned, thereunto duly authorized.
Lazard Global Total Return and Income Fund, Inc.
| | |
By | /s/ Charles L. Carroll | |
| | |
| Charles L. Carroll |
| Chief Executive Officer |
Date
|
September 2, 2011
|
Pursuant to the requirements of the Securities Exchange Act of 1934 and the Investment Company Act of 1940, this report has been signed below by the following persons on behalf of the registrant and in the capacities and on the dates indicated.
| | |
By | /s/ Charles L. Carroll | |
| | |
| Charles L. Carroll |
| Chief Executive Officer |
Date
|
September 2, 2011
|
| | |
By | /s/ Stephen St. Clair | |
| | |
| Stephen St. Clair |
| Chief Financial Officer |
Date
|
September 2, 2011
|