UNITED STATES SECURITIES AND EXCHANGE COMMISSION
Washington, D.C. 20549
FORM N-CSR
CERTIFIED SHAREHOLDER REPORT OF REGISTERED MANAGEMENT INVESTMENT COMPANIES
Investment Company Act file number 811-21511
Lazard Global Total Return and Income Fund, Inc.
(Exact name of registrant as specified in charter)
30 Rockefeller Plaza
New York, New York 10112
(Address of principal executive offices) (Zip code)
Mark R. Anderson, Esq.
Lazard Asset Management LLC
30 Rockefeller Plaza
New York, New York 10112
(Name and address of agent for service)
Registrant’s telephone number, including area code: (212) 632-6000
Date of fiscal year end: 12/31
Date of reporting period: 12/31/19
ITEM 1. REPORTS TO STOCKHOLDERS.

Lazard Global Total Return
and Income Fund, Inc.
Annual Report
December 31, 2019
Important Information on Paperless Delivery
Beginning on January 1, 2021, as permitted by regulations adopted by the Securities and Exchange Commission, paper copies of the Fund’s shareholder reports like this one will no longer be sent by mail, unless you specifically request paper copies of the reports from the Fund or from your financial intermediary, such as a broker-dealer or bank. Instead, the reports will be made available on a website, and you will be notified by mail each time a report is posted and provided with a website link to access the report.
If you already elected to receive shareholder reports electronically, you will not be affected by this change and you need not take any action. Shareholders who hold accounts directly with the Fund may elect to receive shareholder reports and other communications from the Fund electronically by signing up for paperless delivery at www.icsdelivery.com/lazardassetmanagement. If you own these shares through a financial intermediary, you may contact your financial intermediary.
You may elect to receive all future reports in paper free of charge. You can inform the Fund that you wish to continue receiving paper copies of your shareholder reports by following the instructions included with this disclosure and visiting www.fundreports.com. If you own these shares through a financial intermediary, you may contact your financial intermediary or follow instructions included with this disclosure to elect to continue to receive paper copies of your shareholder reports. Your election to receive reports in paper will apply to all funds held with the fund complex or your financial intermediary.
PRIVACY NOTICE
WHAT DOES LAZARD DO WITH YOUR PERSONAL INFORMATION?
Financial companies choose how they share your personal information. U.S. federal law gives our clients the right to limit some but not all sharing. U.S. federal and other applicable law also requires us to tell you how we collect, share, and protect your personal information. Please read this notice carefully to understand what we do.
We do not disclose nonpublic personal information about our clients or former clients to third parties other than as described below.
Personal information we collect.We collect personal information about you in connection with our providing advisory services to you. The legal basis for our collection of your personal information is our contract with you and our legitimate business interest to provide contractual services to you. The collection of this information is necessary for us to be able to provide advisory services to you and the failure to provide such information will result in our inability to provide our services. This information includes your social security number (for U.S. persons) and may include other information such as your:
| | • | Assets and income; |
| | | |
| | • | Investment experience; |
| | | |
| | • | Transaction history; |
| | | |
| | • | Credit history; and |
| | | |
| | • | Wire transfer instructions. |
How we collect this information.We collect this information from you through various means. For example, when you give us your contact information, enter into an investment advisory contract with us, buy securities (i.e., interests in a fund) from us, direct us to buy or sell securities for your account, tell us where to send money, or make a wire transfer. We also may collect your personal information from other sources, such as our affiliates1 or other non-affiliated companies (such as credit bureaus).
| | 1 | Our affiliates are companiesrelated to us by common ownership or control and can include both financial and nonfinancial companies. Non-affiliates are companies notrelated to us by common ownership or control and can include both financial and nonfinancial companies. |
How we use this information.All financial companies need to share customers’ personal information to run their everyday business and we use the personal information we collect from you for our everyday business purposes. These purposes may include for example:
| | • | To provide advisory services to you; |
| | | |
| | • | To open an account for you; |
| | | |
| | • | To process a transaction for your account; |
| | | |
| | • | To market products and services to you; and/or |
| | | |
| | • | To respond to court orders and legal investigations. |
If you are an investor located within a European Union country, please note that personal information may be collected, shared and/or stored outside of the European Union.
Disclosure to others.We may provide your personal information to our affiliates and to firms that assist us in servicing your account and have a need for such information, such as a broker, counterparty, fund administrator or third party service provider that aggregates data in a central repository for access by a broker, counterparty or fund administrator to provide its services. We may also disclose such information to service providers and financial institutions with which we have a formal agreement to provide services relating to our arrangements with you. We require third party service providers and financial institutions with which we have a formal agreement to provide services relating to our arrangements with you to protect the confidentiality of your information and to use the information only for the purposes for which we disclose the information to them. These sharing practices are consistent with applicable privacy and related laws, and in general, you may not limit our use of your personal information for these purposes under such laws. We note that the U.S. federal privacy laws only give you the right to limit the certain types of information sharing that we do not engage in (e.g., sharing with our affiliates certain information relating to your transaction history or creditworthiness for their use in marketing to you, or sharing any personal information with nonaffiliates for them to market to you). We may also share your personal information with non-affiliates (such as a government agency or regulatory authority) as required by applicable law.
How we protect your personal information.To protect your personal information from unauthorized access and use, we use security measures that comply with applicable law. These measures include computer safeguards and secured files and buildings.
How long we keep your personal information.We retain your personal information for the duration of your advisory relationship with us and for a period of time thereafter as required by applicable law.
Your rights with respect to this information.If you are an investor located within a European Union country, you have the following rights with respect to your personal information:
| | • | The right to request and obtain a copy of your personal information that we maintain; |
| | | |
| | • | The right to correct your personal information that we maintain; |
| | | |
| | • | The right to request the erasure of your personal information from our systems, subject to applicable recordkeeping requirements applicable to us; and |
| | | |
| | • | The right to lodge a complaint with a supervisory authority. |
Who is providing this Privacy Notice.This Privacy Notice relates to the following entities:
| | • | Lazard Asset Management LLC |
| | | |
| | • | Lazard Asset Management (Canada), Inc.2 |
| | | |
| | • | Lazard Asset Management Securities LLC |
Who to contact with questions.If you have any questions about this Privacy Notice, please call (800) 823-6300 or visit our website at http://www.lazardassetmanagement.com.
| | 2 | Lazard Asset Management (Canada), Inc. does not disclose any non-public personal information about its customers to any third party, except as permitted by or required by any applicable law, including the laws of the United States and Canada. |
Lazard Global Total Return and Income Fund, Inc.
Lazard Global Total Return and Income Fund, Inc.
Investment Overview
(unaudited)
Dear Stockholders,
We are pleased to present this report for Lazard Global Total Return and Income Fund, Inc. (“LGI” or the “Fund”), for the year ended December 31, 2019. LGI is a diversified, closed-end management investment company that began trading on the New York Stock Exchange (“NYSE”) on April 28, 2004. Its ticker symbol is “LGI.”
We believe that the Fund has provided investors with an attractive distribution return and diversification, backed by the extensive experience, commitment, and professional management of Lazard Asset Management LLC (the “Investment Manager” or “Lazard”).
Portfolio Update (as of December 31, 2019)
For the year ended December 31, 2019, the Fund’s net asset value (“NAV”) returned 27.5%, outperforming the 26.6% return of its benchmark, a linked index comprised of the MSCI World® Index, from inception through August 31, 2016, and the MSCI All Country World® Index (the “MSCI ACWI”) for all periods after August 31, 2016 (the “MSCI World/ACWI Linked Index”). The three-year performance is also outperforming the benchmark. However, due to weaker performance during the years 2013 through 2015, the Fund’s NAV performance over longer time periods has underperformed the benchmark. The since inception annualized return through December 31, 2019 was 7.2%, slightly behind the 7.3% return for the MSCI World/ACWI Linked Index for the same period. Shares of LGI ended 2019 with a market price of $16.55, representing a 9.3% discount to the Fund’s NAV per share of $18.24.
The Fund’s net assets were $237.3 million as of December 31, 2019, with total leveraged assets (net assets plus line of credit outstanding and net notional value of forward currency contracts) of $327.0 million, representing a 27.4% leverage rate. This leverage rate was lower than that at the end of 2018, and in line with the maximum permitted leverage rate of 33⅓%.
As previously announced in a press release dated December 3, 2019, the merger of Lazard World Dividend & Income Fund, Inc. (“LOR”) with and into LGI, pursuant to an Agreement and Plan of Merger (the “Merger”), was consummated as of the close of business on December 3, 2019 (the “Closing Date”). In the Merger, shares of LOR common stock were converted into shares of LGI common stock, based on the net asset value of each fund as of the close of business on the Closing Date. The exchange ratio at which shares of LOR common stock
2
Lazard Global Total Return and Income Fund, Inc.
Investment Overview(continued)
(unaudited)
were converted into shares of LGI common stock was approximately 0.61852. The combined fund has retained the name “Lazard Global Total Return and Income Fund, Inc.” and the “LGI” ticker symbol. LOR ceased trading as of the close of business on the Closing Date.
Within the global equity portfolio, stock selection in the industrials and health care sectors and within the United States contributed positively to the year’s performance. An underweight position in the energy sector also added value. Conversely, stock selection within the financials and communication services sectors and within France and India detracted from performance.
The smaller, short duration1emerging markets currency and debt portion of the Fund was a positive contributor to performance for 2019.
As of December 31, 2019, 70.5% of the Fund’s total leveraged assets consisted of global equities, 28.6% consisted of emerging markets currency and debt instruments, and 0.9% consisted of cash and other assets.
Declaration of Distributions
Pursuant to LGI’s Level Distribution Policy, the Fund declares a monthly distribution equal to 7.0% (on an annualized basis) of the Fund’s published NAV per share on the last business day of the previous year. This published NAV per share may differ from the NAV per share as of year-end shown elsewhere in this shareholder report, generally as the result of post year-end accounting and tax adjustments to the published NAV per share. Throughout 2019, the monthly distribution rate per share was $0.08879, representing a distribution rate of 6.4% based on the Fund’s market price of $16.55 as of the close of trading on the NYSE on December 31, 2019 (inclusive of returns of capital). Of the $1.06548 per share distributed in 2019, which is inclusive of the Fund’s spillback and annual distribution, approximately $0.82935 was a return of capital. The 2020 monthly distribution rate is set at $0.10646, representing a distribution yield of 7.7% based on the Fund’s year-end market price.
Additional Information
Please note that available on www.lazardassetmanagement.com are frequent updates on the Fund’s performance, press releases, distribution information, and a monthly fact sheet that provides information about the Fund’s major holdings, sector weightings, regional exposures, and other characteristics, including the notices regarding the composition of monthly (and any additional) distributions
3
Lazard Global Total Return and Income Fund, Inc.
Investment Overview(continued)
(unaudited)
required by Section 19(a) of the Investment Company Act of 1940, as amended (the “1940 Act”). You may also reach Lazard by phone at 1-800-823-6300.
On behalf of Lazard, we thank you for your investment in Lazard Global Total Return and Income Fund, Inc. and look forward to continuing to serve your investment needs in the future.
4
Lazard Global Total Return and Income Fund, Inc.
Investment Overview(continued)
(unaudited)
Message from the Portfolio Managers
Global Equity Portfolio
(70.5% of total leveraged assets)
The Fund’s global equity portfolio is invested in approximately 60 to 80 US and non-US equity securities of companies (including those in emerging markets) with market capitalizations greater than $2 billion. Examples include Microsoft, a US-based multinational technology company; Wolters Kluwer, a global information services company headquartered in the Netherlands; and Aon, a global professional services firm that provides risk, retirement, and health consulting services.
The companies held in the global equity portfolio are based in developed and emerging market regions around the world. As of December 31, 2019, 52.4% of the portfolio’s stocks were based in North America, 15.6% were based in continental Europe (not including the United Kingdom), 14.7% were from the United Kingdom, 8.4% were from Asia (not including Japan) and Australia, 6.0% were from Japan, and 2.9% were from Africa and the Middle East.
The global equity portfolio is similarly invested across a number of industry sectors. The top two sectors, by weight, as of December 31, 2019, were information technology (18.9% of the portfolio), which includes companies that produce software, hardware or semiconductor equipment, or companies that provide internet or related services; and industrials (18.4% of the portfolio), which include commercial equipment and services, transportation, and distribution operations, construction and farming machinery, and airlines, railroads, and waste management companies. Other sectors in the portfolio included financials, health care, consumer staples, consumer discretionary, communication services, materials and real estate. The average dividend yield on the securities held in the global equity portfolio was approximately 1.7% as of December 31, 2019.
Global Equity Markets Review
Global equity markets recorded strong gains in 2019, with US stocks, in particular, continuing their winning streak to end the year at record highs on a combination of solid earnings, encouraging economic data, with dovish monetary policies across the globe. Despite slowing global growth and periodic risk aversion throughout the year, stocks and bonds rallied together in 2019 on globally synchronized monetary stimulus and continued share buybacks in the United States. Central bank activity to increase worldwide liquidity played an outsize role in calming markets in the face of growing anxiety about a global economic slowdown, trade wars, and Brexit. The world’s central banks, both in developed
5
Lazard Global Total Return and Income Fund, Inc.
Investment Overview(continued)
(unaudited)
and developing countries, resumed a coordinated monetary response. In addition to the Federal Reserve’s three interest rate cuts, the European Central Bank further reduced negative rates, while the Bank of England indicated that it was ready to reduce rates to offset the impact of a possible Brexit. Meanwhile, in Asia, the Bank of Japan announced that it would expand its balance sheet through further purchases of financial instruments. Near the end of the year, world equity markets were lifted by improved investor confidence in the global economic outlook. The most significant news coming out of the period was that the United States and China had reached an initial deal in their protracted trade war. Although investors were still awaiting the details of the “Phase 1” agreement as of the end of December, optimism about a truce between the world’s two largest economies eased fears of a global recession and led to a rally in global stock markets.
What Helped and What Hurt LGI
Stock selection in the industrials sector contributed to performance. Shares of engineering recruiter Technopro Holdings rose after the company reported strong results, driven by solid organic growth. An underweight position in energy also helped returns. The sector was among the year’s worst performers in the MSCI ACWI index. Stock selection within the healthcare sector and within the US also added value.
In contrast, stock selection in the financials sector and within India detracted from performance. Shares of lender Indiabulls Housing Finance, a mortgage lender based in India, fell amid questions concerning the company’s funding capabilities, as liquidity remained scarce. We sold our position in August, as our thesis was broken. Stock selection in the communication services sector and within France also hurt returns. Shares of videogame maker Ubisoft fell after management issued disappointing 2019 guidance in May, as well as a profit warning for its third quarter. We sold our position in November, as our thesis was broken.
Emerging Markets Currency and Debt Portfolio
(28.6% of total leveraged assets)
The Fund also seeks income through investing in primarily high-yielding, short-duration emerging markets forward currency contracts and local currency debt instruments. As of December 31, 2019, this portfolio consisted of forward currency contracts (65.8%) and sovereign debt obligations (34.2%). The average duration of the emerging markets currency and debt portfolio as of December 31, 2019 was approximately 12 months, similar to the level at the end of 2018.
6
Lazard Global Total Return and Income Fund, Inc.
Investment Overview(continued)
(unaudited)
Emerging Markets Currency and Debt Markets Review
Emerging local money markets were characterized by generally favorable performance in the context of a stable broad US dollar, relative emerging markets yield advantage, and fixed income yield compression. The dramatic deceleration in global trade, global growth angst, and US-China trade tensions failed to deter emerging markets currencies’ positively skewed returns, seen in a wide range of generally +/- 10%. Factoring in the yield component of returns, the majority of emerging money markets delivered positive results for the full year.
What Helped and What Hurt LGI
Attribution from Egypt, Russia, Indonesia, Brazil, and Mexico delivered two-thirds of the full year result from diversified return sources. Egyptian Treasury bills remained the strategy’s largest exposure throughout 2019 and finished as the leading contributor. Egypt’s steadily strengthening currency, high carry, and yield curve rally, which was driven by disinflation and improving fundamentals, contributed to realized return. This return was further helped by the country’s diverse sources of US dollar inflows and interbank market development. Importantly, and as we anticipated, Egypt exhibited a low correlation to the rest of the broader emerging markets universe during the course of the past few years, resulting in high country alpha. In Russia, the ruble and domestic government bond market benefitted from the country’s fiscal and current account surpluses, positive real interest rate, disinflation, monetary easing, and a local yield curve rally. As a result, both country and security selection added value. Elsewhere, high carry and positive real yields in Indonesia and Mexico (supported by a new USMCA trade deal at year-end) buoyed local markets there, while security selection in Brazil greatly enhanced the money market’s outturn, benefiting from the pension reform’s passage and historic interest rate cuts. Elsewhere, diversified positions in the local markets of South Africa, Kazakhstan, Thailand, Peru, the Philippines, and India each contributed.
Detracting markets for the year included Hungary, Uruguay, Argentina, and Chile. Hungarian attribution detracted due to disappointing euro zone demand indicators, a rapidly diminishing Hungarian current account surplus, and the central bank’s loose monetary stance of the country’s central bank, which combined to weaken the forint. In Latin America, political and economic risks evidenced some contagion, dampening results there. Uruguay detracted after the peso declined 15% while local rates failed to fully cushion its fall. While we avoided Argentina debt, the strategy’s light non-deliverable forward exposure detracted in 2019. The year proved to be a turbulent one characterized by a mixture of rising debt, spiraling inflation, and policy and political risks that com-
7
Lazard Global Total Return and Income Fund, Inc.
Investment Overview(concluded)
(unaudited)
bined to weaken the peso sharply in nominal terms. However, high domestic interest rate carry largely compensated for the currency’s decline. Chile’s civil unrest in the fourth quarter resulted in a sharp peso selloff before the central bank intervened forcefully at year-end, which propelled its December rebound. The strategy held minimal to no exposure to other 2019 down markets including Romania and South Korea.
Notes to Investment Overview:
| 1 | A measure of the average cash weighted term-to-maturity of the investment holdings. Duration is a measure of the price sensitivity of a bond to interest rate movements. Duration for a forward currency contract is equal to its term-to-maturity. |
Total returns reflect reinvestment of all dividends and distributions. Past performance is not indicative, or a guarantee, of future results.
The views of the Fund’s Investment Manager and the securities described in this report are as of December 31, 2019; these views and portfolio holdings may have changed subsequent to this date. Nothing herein should be construed as a recommendation to buy, sell, or hold a particular security. There is no assurance that the securities discussed herein will remain in the Fund at the time you receive this report, or that securities sold will not have been repurchased. The specific securities discussed may, in aggregate, represent only a small percentage of the Fund’s holdings. It should not be assumed that securities identified and discussed were, or will be, profitable, or that the investment decisions made in the future will be profitable, or equal the investment performance of the securities discussed herein.
The views and opinions expressed are provided for general information only, and do not constitute specific tax, legal, or investment advice to, or recommendations for, any person. There can be no guarantee as to the accuracy of any outlooks for markets, sectors and securities as discussed herein.
8
Lazard Global Total Return and Income Fund, Inc.
Performance Overview
(unaudited)
Comparison of Changes in Value of $10,000 Investment in
LGI, MSCI ACWI and MSCI World/ACWI Linked Index*
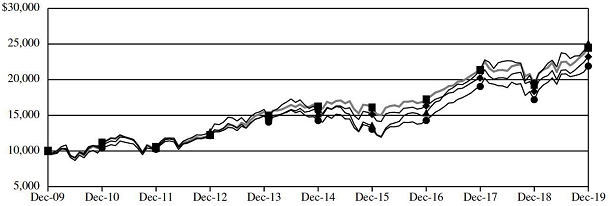
| | | | | Value at |
| | | | | 12/31/19 |
 | | LGI at Market Price | | $ | 25,111 | |
 | | LGI at Net Asset Value | | | 21,906 | |
 | | MSCI ACWI | | | 23,221 | |
 | | MSCI World/ACWI Linked Index | | | 24,487 | |
| Average Annual Total Returns* |
| Periods Ended December 31, 2019 |
| | | One | | Five | | Ten |
| | | Year | | Years | | Years |
| Market Price | | | 30.09 | % | | | 10.49 | % | | | 9.64 | % |
| Net Asset Value | | | 27.51 | % | | | 8.96 | % | | | 8.16 | % |
| MSCI ACWI | | | 26.60 | % | | | 8.41 | % | | | 8.79 | % |
| MSCI World/ACWI Linked Index | | | 26.60 | % | | | 8.54 | % | | | 9.37 | % |
| * | Total returns reflect reinvestment of all dividends and distributions. The performance quoted represents past performance. Current performance may be lower or higher than the performance quoted. Past performance is not indicative, or a guarantee, of future results; the investment return, market price and net asset value of Lazard Global Total Return and Income Fund, Inc. (the “Fund” or “LGI”) will fluctuate, so that Fund shares, when sold, may be worth more or less than their original cost. The returns do not reflect the deduction of taxes that a stockholder would pay on the Fund’s distributions or on the sale of Fund shares. |
| | |
| | Performance results do not include adjustments made for financial reporting purposes in accordance with US Generally Accepted Accounting Principles, if any, and also exclude one-time adjustments related to reimbursed custodian out-of-pocket expenses (Note 4 in the Notes to Financial Statements), and may differ from amounts reported in the financial highlights. |
9
Lazard Global Total Return and Income Fund, Inc.
Performance Overview(concluded)
(unaudited)
The performance data of the indices have been prepared from sources and data that Lazard Asset Management LLC, the Fund’s investment manager (the “Investment Manager”) believes to be reliable, but no representation is made as to their accuracy. The MSCI ACWI is a free-float-adjusted market capitalization weighted index that is designed to measure the equity market performance of developed and emerging markets. The MSCI ACWI consists of 49 country indices comprising 23 developed and 26 emerging markets country indices. The MSCI World/ACWI Linked Index is an unmanaged index created by the Investment Manager, which links the performance of the MSCI World Index for all periods through August 31, 2016 (when the Fund changed the investment strategy in its Global Equity Strategy) and the MSCI ACWI for all periods thereafter. The MSCI World Index is a free-float-adjusted market capitalization index that is designed to measure global developed markets equity performance. The MSCI World Index consists of 23 developed markets country indices. The indices are unmanaged, have no fees or costs and are not available for investment.
| Ten Largest Equity Holdings | | | | | | |
| December 31, 2019 | | | | | | |
| | | Fair | | | Percentage of |
| Security | | Value | | | Net Assets |
| Microsoft Corp. | | $ | 8,266,634 | | | | 3.5 | % |
| Thermo Fisher Scientific, Inc. | | | 7,307,951 | | | | 3.1 | |
| Alphabet, Inc., Class A | | | 7,082,694 | | | | 3.0 | |
| Zoetis, Inc. | | | 6,363,388 | | | | 2.7 | |
| Aon PLC | | | 6,286,192 | | | | 2.6 | |
| Wolters Kluwer NV | | | 5,994,444 | | | | 2.5 | |
| The Coca-Cola Co. | | | 5,913,594 | | | | 2.5 | |
| IQVIA Holdings, Inc. | | | 5,895,329 | | | | 2.5 | |
| Unilever PLC | | | 5,858,202 | | | | 2.5 | |
| Johnson & Johnson | | | 5,512,573 | | | | 2.3 | |
| Portfolio Holdings Presented by Sector | | | | | |
| December 31, 2019 | | | | | |
| | | | | | Percentage of |
| Sector | | | | | Total Investments |
| Communication Services | | | | | | 5.2 | % | |
| Consumer Discretionary | | | | | | 7.4 | | |
| Consumer Staples | | | | | | 12.7 | | |
| Financials | | | | | | 14.7 | | |
| Health Care | | | | | | 13.4 | | |
| Industrials | | | | | | 15.0 | | |
| Information Technology | | | | | | 16.4 | | |
| Materials | | | | | | 1.9 | | |
| Real Estate | | | | | | 0.1 | | |
| Sovereign Debt | | | | | | 12.8 | | |
| Short-Term Investments | | | | | | 0.4 | | |
| Total Investments | | | | | | 100.0 | % | |
10
Lazard Global Total Return and Income Fund, Inc.
Portfolio of Investments
December 31, 2019
| Description | | Shares | | | Fair
Value | |
| Common Stocks—97.2% | | | | | | |
| Belgium—0.8% | | | | | | | | |
| Anheuser-Busch InBev SA/NV | | | 22,195 | | | $ | 1,820,023 | |
| Canada—5.3% | | | | | | | | |
| CAE, Inc. | | | 97,515 | | | | 2,581,776 | |
| Canadian National Railway Co. | | | 42,255 | | | | 3,822,490 | |
| Dollarama, Inc. | | | 75,515 | | | | 2,595,383 | |
| National Bank of Canada | | | 62,820 | | | | 3,487,017 | |
| | | | | | | | 12,486,666 | |
| China—2.7% | | | | | | | | |
| Alibaba Group Holding, Ltd. Sponsored ADR (*) | | | 10,215 | | | | 2,166,601 | |
| Tencent Holdings, Ltd. | | | 86,200 | | | | 4,158,163 | |
| | | | | | | | 6,324,764 | |
| Germany—1.2% | | | | | | | | |
| Symrise AG | | | 26,948 | | | | 2,835,031 | |
| Hong Kong—2.8% | | | | | | | | |
| AIA Group, Ltd. | | | 402,400 | | | | 4,233,914 | |
| Hang Seng Bank, Ltd. | | | 121,000 | | | | 2,503,947 | |
| | | | | | | | 6,737,861 | |
| Israel—1.2% | | | | | | | | |
| Bank Leumi Le-Israel BM | | | 401,201 | | | | 2,923,872 | |
| Japan—5.8% | | | | | | | | |
| Daiwa House Industry Co., Ltd. | | | 7,000 | | | | 216,871 | |
| Kansai Paint Co., Ltd. | | | 86,500 | | | | 2,114,106 | |
| Kao Corp. | | | 32,700 | | | | 2,697,030 | |
| Nintendo Co., Ltd. | | | 6,400 | | | | 2,583,336 | |
| TechnoPro Holdings, Inc. | | | 46,300 | | | | 3,249,825 | |
| Yamaha Corp. | | | 52,900 | | | | 2,916,048 | |
| | | | | | | | 13,777,216 | |
| Netherlands—3.6% | | | | | | | | |
| NXP Semiconductors NV | | | 21,050 | | | | 2,678,823 | |
| Wolters Kluwer NV | | | 82,011 | | | | 5,994,444 | |
| | | | | | | | 8,673,267 | |
| Singapore—1.4% | | | | | | | | |
| Oversea-Chinese Banking Corp., Ltd. | | | 398,700 | | | | 3,260,056 | |
The accompanying notes are an integral part of these financial statements.
11
Lazard Global Total Return and Income Fund, Inc.
Portfolio of Investments(continued)
December 31, 2019
| Description | | Shares | | | Fair
Value | |
| South Africa—1.5% | | | | | | |
| Distell Group Holdings, Ltd. | | | 220,541 | | | $ | 2,090,582 | |
| Sanlam, Ltd. | | | 264,553 | | | | 1,495,804 | |
| | | | | | | | 3,586,386 | |
| Sweden—3.2% | | | | | | | | |
| Assa Abloy AB, Class B | | | 76,084 | | | | 1,777,919 | |
| Epiroc AB, Class A | | | 256,193 | | | | 3,130,957 | |
| Hexagon AB, B Shares | | | 46,440 | | | | 2,601,967 | |
| | | | | | | | 7,510,843 | |
| Switzerland—4.3% | | | | | | | | |
| ABB, Ltd. | | | 120,543 | | | | 2,910,015 | |
| Alcon, Inc. (*) | | | 23,732 | | | | 1,344,411 | |
| Novartis AG | | | 35,063 | | | | 3,321,951 | |
| Partners Group Holding AG | | | 3,021 | | | | 2,768,651 | |
| | | | | | | | 10,345,028 | |
| Taiwan—1.3% | | | | | | | | |
| Taiwan Semiconductor Manufacturing Co., Ltd. Sponsored ADR (*) | | | 52,695 | | | | 3,061,580 | |
| United Kingdom—11.6% | | | | | | | | |
| Bunzl PLC | | | 55,428 | | | | 1,516,538 | |
| Coca-Cola European Partners PLC | | | 60,230 | | | | 3,064,503 | |
| Compass Group PLC | | | 122,719 | | | | 3,074,216 | |
| Diageo PLC | | | 121,265 | | | | 5,110,067 | |
| Prudential PLC | | | 157,197 | | | | 3,024,696 | |
| RELX PLC | | | 182,380 | | | | 4,604,638 | |
| The Weir Group PLC | | | 65,872 | | | | 1,318,098 | |
| Unilever PLC | | | 102,328 | | | | 5,858,202 | |
| | | | | | | | 27,570,958 | |
| United States—50.5% | | | | | | | | |
| Accenture PLC, Class A | | | 23,134 | | | | 4,871,326 | |
| Alphabet, Inc., Class A (*) | | | 5,288 | | | | 7,082,694 | |
| Aon PLC | | | 30,180 | | | | 6,286,192 | |
| Boston Scientific Corp. (*) | | | 82,685 | | | | 3,739,016 | |
| Cisco Systems, Inc. | | | 56,485 | | | | 2,709,021 | |
| Dollar General Corp. | | | 18,710 | | | | 2,918,386 | |
| Envista Holdings Corp. | | | 78,385 | | | | 2,323,331 | |
| Honeywell International, Inc. | | | 25,755 | | | | 4,558,635 | |
| Intercontinental Exchange, Inc. | | | 48,120 | | | | 4,453,506 | |
| IQVIA Holdings, Inc. (*) | | | 38,155 | | | | 5,895,329 | |
| Johnson & Johnson | | | 37,791 | | | | 5,512,573 | |
The accompanying notes are an integral part of these financial statements.
12
Lazard Global Total Return and Income Fund, Inc.
Portfolio of Investments(continued)
December 31, 2019
| Description | | Shares | | | Fair
Value | |
| Kimberly-Clark Corp. | | | 23,134 | | | $ | 3,182,082 | |
| Lowe’s Cos., Inc. | | | 19,396 | | | | 2,322,865 | |
| McDonald’s Corp. | | | 19,265 | | | | 3,806,957 | |
| Microsoft Corp. | | | 52,420 | | | | 8,266,634 | |
| Motorola Solutions, Inc. | | | 26,095 | | | | 4,204,948 | |
| Palo Alto Networks, Inc. (*) | | | 9,835 | | | | 2,274,344 | |
| PTC, Inc. (*) | | | 53,730 | | | | 4,023,840 | |
| Rockwell Automation, Inc. | | | 21,735 | | | | 4,405,032 | |
| S&P Global, Inc. | | | 16,600 | | | | 4,532,630 | |
| Texas Instruments, Inc. | | | 27,723 | | | | 3,556,584 | |
| The Coca-Cola Co. | | | 106,840 | | | | 5,913,594 | |
| The Procter & Gamble Co. | | | 31,385 | | | | 3,919,987 | |
| Thermo Fisher Scientific, Inc. | | | 22,495 | | | | 7,307,951 | |
| Visa, Inc., Class A | | | 28,455 | | | | 5,346,694 | |
| Zoetis, Inc. | | | 48,080 | | | | 6,363,388 | |
| | | | | | | | 119,777,539 | |
Total Common Stocks
(Cost $176,580,774) | | | | | | | 230,691,090 | |
| | | | | | | | | |
| Description | | Principal
Amount
(000) («) | | | Fair
Value | |
| Foreign Government Obligations—14.3% | | | | | | | | |
| Brazil—2.8% | | | | | | | | |
| Brazil NTN-B: | | | | | | | | |
| 6.00%, 05/15/21 | | | 1,260 | | | $ | 1,105,325 | |
| 6.00%, 05/15/23 | | | 3,690 | | | | 3,407,958 | |
Brazil NTN-F,
10.00%, 01/01/27 | | | 7,396 | | | | 2,168,005 | |
| | | | | | | | 6,681,288 | |
| Dominican Republic—2.2% | | | | | | | | |
| Dominican Republic Bonds: | | | | | | | | |
| 15.95%, 06/04/21 (#) | | | 33,300 | | | | 679,254 | |
| 16.95%, 02/04/22 (#) | | | 43,800 | | | | 933,705 | |
| 8.90%, 02/15/23 (#) | | | 130,000 | | | | 2,435,520 | |
| 10.50%, 04/07/23 (#) | | | 65,400 | | | | 1,253,214 | |
| | | | | | | | 5,301,693 | |
The accompanying notes are an integral part of these financial statements.
13
Lazard Global Total Return and Income Fund, Inc.
Portfolio of Investments(continued)
December 31, 2019
| Description | | Principal
Amount
(000) («) | | | Fair
Value | |
| Egypt—3.8% | | | | | | | | |
| Egypt Treasury Bills: | | | | | | | | |
| 0.00%, 05/12/20 | | | 137,250 | | | $ | 8,011,466 | |
| 0.00%, 05/26/20 | | | 16,225 | | | | 953,252 | |
| | | | | | | | 8,964,718 | |
| Indonesia—0.6% | | | | | | | | |
Indonesia Government Bonds,
8.375%, 09/15/26 | | | 20,166,000 | | | | 1,558,603 | |
| Malaysia—3.1% | | | | | | | | |
Malaysia Government Bonds,
3.62%, 11/30/21 | | | 29,340 | | | | 7,254,687 | |
| Russia—1.8% | | | | | | | | |
| Russia Government Bonds - OFZ: | | | | | | | | |
| 7.95%, 10/07/26 | | | 72,920 | | | | 1,292,596 | |
| 7.05%, 01/19/28 | | | 174,100 | | | | 2,962,572 | |
| | | | | | | | 4,255,168 | |
Total Foreign Government Obligations
(Cost $34,225,731) | | | | | | | 34,016,157 | |
| Short-Term Investments—0.5% | | | | | | | | |
State Street Institutional Treasury Money Market Fund, Premier Class, 1.52% (7 day yield)
(Cost $1,083,740) | | | 1,083,740 | | | $ | 1,083,740 | |
Total Investments—112.0%
(Cost $211,890,245) (») | | | | | | $ | 265,790,987 | |
| Liabilities in Excess of Cash and Other Assets—(12.0)% | | | | | | | (28,509,563 | ) |
| Net Assets—100.0% | | | | | | $ | 237,281,424 | |
The accompanying notes are an integral part of these financial statements.
14
Lazard Global Total Return and Income Fund, Inc.
Portfolio of Investments(continued)
December 31, 2019
Forward Currency Contracts open at December 31, 2019:
Currency
Purchased | | Quantity | | Currency
Sold | | Quantity | | Counterparty | | Settlement
Date | | Unrealized
Appreciation | | Unrealized
Depreciation |
| AUD | | 1,246,000 | | USD | | 856,500 | | BNP | | 07/20/20 | | | $ | 21,813 | | | | $ | — | |
| AUD | | 3,632,000 | | USD | | 2,496,637 | | BNP | | 07/20/20 | | | | 63,584 | | | | | — | |
| BRL | | 146,500 | | USD | | 35,627 | | BNP | | 05/18/20 | | | | 570 | | | | | — | |
| BRL | | 731,224 | | USD | | 181,607 | | CIT | | 05/18/20 | | | | — | | | | | 941 | |
| BRL | | 2,255,292 | | USD | | 560,126 | | CIT | | 05/18/20 | | | | — | | | | | 2,903 | |
| CLP | | 1,960,816,700 | | USD | | 2,555,143 | | CIT | | 02/18/20 | | | | 53,899 | | | | | — | |
| CNY | | 9,398,225 | | USD | | 1,325,000 | | HSB | | 09/04/20 | | | | 15,562 | | | | | — | |
| CNY | | 26,953,400 | | USD | | 3,800,000 | | HSB | | 09/04/20 | | | | 44,631 | | | | | — | |
| COP | | 14,545,200,000 | | USD | | 4,224,817 | | SCB | | 03/12/20 | | | | 186,246 | | | | | — | |
| CZK | | 15,339,000 | | USD | | 674,320 | | CIT | | 06/08/20 | | | | 2,419 | | | | | — | |
| CZK | | 34,730,000 | | USD | | 1,526,770 | | CIT | | 06/08/20 | | | | 5,478 | | | | | — | |
| CZK | | 17,042,000 | | USD | | 748,981 | | SCB | | 06/08/20 | | | | 2,892 | | | | | — | |
| CZK | | 38,286,000 | | USD | | 1,682,637 | | SCB | | 06/08/20 | | | | 6,498 | | | | | — | |
| GHS | | 3,111,175 | | USD | | 557,808 | | CIT | | 01/02/20 | | | | — | | | | | 11,988 | |
| GHS | | 9,237,800 | | USD | | 1,656,262 | | CIT | | 01/02/20 | | | | — | | | | | 35,595 | |
| HUF | | 250,053,000 | | USD | | 828,868 | | CIT | | 03/27/20 | | | | 22,152 | | | | | — | |
| HUF | | 756,088,000 | | USD | | 2,506,258 | | CIT | | 03/27/20 | | | | 66,981 | | | | | — | |
| IDR | | 3,932,600,000 | | USD | | 273,382 | | JPM | | 05/14/20 | | | | 7,454 | | | | | — | |
| IDR | | 10,263,503,000 | | USD | | 713,486 | | JPM | | 05/14/20 | | | | 19,454 | | | | | — | |
| IDR | | 11,025,325,000 | | USD | | 766,446 | | JPM | | 05/14/20 | | | | 20,898 | | | | | — | |
| IDR | | 36,435,720,000 | | USD | | 2,532,897 | | JPM | | 05/14/20 | | | | 69,064 | | | | | — | |
| ILS | | 1,033,000 | | USD | | 293,008 | | SCB | | 01/24/20 | | | | 6,430 | | | | | — | |
| ILS | | 2,941,000 | | USD | | 834,208 | | SCB | | 01/24/20 | | | | 18,307 | | | | | — | |
| INR | | 29,244,275 | | USD | | 410,000 | | CIT | | 02/06/20 | | | | — | | | | | 684 | |
| INR | | 72,611,395 | | USD | | 1,018,000 | | CIT | | 02/06/20 | | | | — | | | | | 1,699 | |
| INR | | 94,465,942 | | USD | | 1,321,942 | | CIT | | 02/06/20 | | | | 246 | | | | | — | |
| INR | | 289,484,876 | | USD | | 4,051,006 | | CIT | | 02/06/20 | | | | 753 | | | | | — | |
| KES | | 30,681,670 | | USD | | 288,769 | | CIT | | 04/27/20 | | | | 8,276 | | | | | — | |
| KES | | 86,909,530 | | USD | | 817,972 | | CIT | | 04/27/20 | | | | 23,443 | | | | | — | |
| KZT | | 230,308,400 | | USD | | 581,000 | | HSB | | 01/15/20 | | | | 19,929 | | | | | — | |
| KZT | | 533,158,000 | | USD | | 1,345,000 | | HSB | | 01/15/20 | | | | 46,136 | | | | | — | |
| KZT | | 107,845,900 | | USD | | 273,097 | | SCB | | 01/15/20 | | | | 8,299 | | | | | — | |
| KZT | | 430,802,500 | | USD | | 1,090,915 | | SCB | | 01/15/20 | | | | 33,150 | | | | | — | |
| MXN | | 7,573,400 | | USD | | 380,000 | | HSB | | 04/30/20 | | | | 13,651 | | | | | — | |
| MXN | | 14,141,000 | | USD | | 723,436 | | HSB | | 04/30/20 | | | | 11,587 | | | | | — | |
| MXN | | 19,431,750 | | USD | | 975,000 | | HSB | | 04/30/20 | | | | 35,026 | | | | | — | |
| MXN | | 40,501,000 | | USD | | 2,071,980 | | HSB | | 04/30/20 | | | | 33,186 | | | | | — | |
| PEN | | 4,994,578 | | USD | | 1,488,475 | | JPM | | 05/06/20 | | | | 12,749 | | | | | — | |
| PEN | | 14,761,541 | | USD | | 4,399,207 | | JPM | | 05/06/20 | | | | 37,680 | | | | | — | |
| PHP | | 28,944,020 | | USD | | 550,162 | | JPM | | 03/31/20 | | | | 19,096 | | | | | — | |
| PHP | | 85,157,180 | | USD | | 1,618,650 | | JPM | | 03/31/20 | | | | 56,182 | | | | | — | |
| PLN | | 4,665,096 | | USD | | 1,200,000 | | CIT | | 03/04/20 | | | | 29,824 | | | | | — | |
| PLN | | 13,023,393 | | USD | | 3,350,000 | | CIT | | 03/04/20 | | | | 83,260 | | | | | — | |
| RUB | | 9,322,247 | | USD | | 141,891 | | HSB | | 02/11/20 | | | | 7,713 | | | | | — | |
| RUB | | 98,905,891 | | USD | | 1,505,417 | | HSB | | 02/11/20 | | | | 81,837 | | | | | — | |
| SGD | | 1,393,000 | | USD | | 1,018,535 | | SCB | | 04/17/20 | | | | 18,346 | | | | | — | |
| SGD | | 4,066,000 | | USD | | 2,972,983 | | SCB | | 04/17/20 | | | | 53,550 | | | | | — | |
| THB | | 24,625,960 | | USD | | 816,240 | | HSB | | 05/21/20 | | | | 8,462 | | | | | — | |
| THB | | 70,164,200 | | USD | | 2,325,628 | | HSB | | 05/21/20 | | | | 24,109 | | | | | — | |
The accompanying notes are an integral part of these financial statements.
15
Lazard Global Total Return and Income Fund, Inc.
Portfolio of Investments(concluded)
December 31, 2019
Forward Currency Contracts open at December 31, 2019 (concluded):
Currency
Purchased | | Quantity | | Currency
Sold | | Quantity | | Counterparty | | Settlement
Date | | Unrealized
Appreciation | | Unrealized
Depreciation |
| TRY | | 2,416,000 | | USD | | 366,460 | | HSB | | 07/02/20 | | | $ | 21,305 | | | | $ | — | |
| TRY | | 5,605,000 | | USD | | 850,168 | | HSB | | 07/02/20 | | | | 49,426 | | | | | — | |
| UGX | | 1,658,228,000 | | USD | | 444,029 | | CIT | | 01/21/20 | | | | 6,703 | | | | | — | |
| UGX | | 4,688,398,000 | | USD | | 1,255,429 | | CIT | | 01/21/20 | | | | 18,951 | | | | | — | |
| USD | | 1,693,513 | | AUD | | 2,492,000 | | BNP | | 07/20/20 | | | | — | | | | | 63,114 | |
| USD | | 4,936,469 | | AUD | | 7,264,000 | | BNP | | 07/20/20 | | | | — | | | | | 183,972 | |
| USD | | 238,000 | | BRL | | 979,013 | | CIT | | 05/18/20 | | | | — | | | | | 3,888 | |
| USD | | 301,000 | | BRL | | 1,238,164 | | CIT | | 05/18/20 | | | | — | | | | | 4,918 | |
| USD | | 1,300,000 | | CLP | | 975,910,000 | | CIT | | 02/18/20 | | | | 1,465 | | | | | — | |
| USD | | 1,600,000 | | COP | | 5,340,800,000 | | CIT | | 03/12/20 | | | | — | | | | | 19,683 | |
| USD | | 86,072 | | CZK | | 1,992,000 | | CIT | | 06/08/20 | | | | — | | | | | 1,813 | |
| USD | | 318,307 | | CZK | | 7,340,000 | | CIT | | 06/08/20 | | | | — | | | | | 5,525 | |
| USD | | 424,000 | | CZK | | 9,787,616 | | CIT | | 06/08/20 | | | | — | | | | | 7,819 | |
| USD | | 721,785 | | CZK | | 16,644,000 | | CIT | | 06/08/20 | | | | — | | | | | 12,529 | |
| USD | | 961,000 | | CZK | | 22,183,724 | | CIT | | 06/08/20 | | | | — | | | | | 17,721 | |
| USD | | 295,771 | | CZK | | 6,708,000 | | SCB | | 06/08/20 | | | | — | | | | | 178 | |
| USD | | 638,809 | | CZK | | 14,488,000 | | SCB | | 06/08/20 | | | | — | | | | | 385 | |
| USD | | 2,170,600 | | GHS | | 12,348,975 | | CIT | | 01/02/20 | | | | 4,113 | | | | | — | |
| USD | | 377,428 | | TRY | | 2,416,000 | | SCB | | 07/02/20 | | | | — | | | | | 10,336 | |
| USD | | 875,614 | | TRY | | 5,605,000 | | SCB | | 07/02/20 | | | | — | | | | | 23,979 | |
| UYU | | 27,946,342 | | USD | | 731,388 | | CIT | | 02/04/20 | | | | 15,940 | | | | | — | |
| UYU | | 90,912,178 | | USD | | 2,379,277 | | CIT | | 02/04/20 | | | | 51,855 | | | | | — | |
| UYU | | 13,447,544 | | USD | | 356,000 | | HSB | | 05/29/20 | | | | — | | | | | 4,828 | |
| UYU | | 31,616,838 | | USD | | 837,000 | | HSB | | 05/29/20 | | | | — | | | | | 11,351 | |
| ZAR | | 4,100,000 | | USD | | 272,962 | | HSB | | 03/06/20 | | | | 17,351 | | | | | — | |
| ZAR | | 12,061,000 | | USD | | 802,975 | | HSB | | 03/06/20 | | | | 51,042 | | | | | — | |
| Total gross unrealized appreciation/depreciation on Forward Currency Contracts | | $ | 1,538,973 | | | | $ | 425,849 | |
Currency Abbreviations:
| AUD | — | Australian Dollar | | ILS | — | Israeli Shekel | | SGD | — | Singapore Dollar |
| BRL | — | Brazilian Real | | INR | — | Indian Rupee | | THB | — | Thai Baht |
| CLP | — | Chilean Peso | | KES | — | Kenyan Shilling | | TRY | — | New Turkish Lira |
| CNY | — | Chinese Renminbi | | KZT | — | Kazakhstan Tenge | | UGX | — | Ugandan Shilling |
| COP | — | Colombian Peso | | MXN | — | Mexican New Peso | | USD | — | United States Dollar |
| CZK | — | Czech Koruna | | PEN | — | Peruvian New Sol | | UYU | — | Uruguayan Peso |
| GHS | — | Ghanaian Cedi | | PHP | — | Philippine Peso | | ZAR | — | South African Rand |
| HUF | — | Hungarian Forint | | PLN | — | Polish Zloty | | | | |
| IDR | — | Indonesian Rupiah | | RUB | — | Russian Ruble | | | | |
Counterparty Abbreviations:
| BNP | — | BNP Paribas SA |
| CIT | — | Citibank NA |
| HSB | — | HSBC Bank USA NA |
| JPM | — | JPMorgan Chase Bank NA |
| SCB | — | Standard Chartered Bank |
The accompanying notes are an integral part of these financial statements.
16
Lazard Global Total Return and Income Fund, Inc.
Notes to Portfolio of Investments
December 31, 2019
| (*) | Non-income producing security. |
| («) | Principal amount denominated in respective country’s currency. |
| (#) | Pursuant to Rule 144A under the Securities Act of 1933, these securities may only be traded among “qualified institutional buyers.” At December 31, 2019 these securities amounted to 2.2% of net assets. |
| (») | The Fund, at all times, maintains portfolio securities in sufficient amount to cover its obligations related to investments in forward currency contracts. |
Security Abbreviations:
| ADR | — | American Depositary Receipt |
| NTN-B | — | Brazil Sovereign “Nota do Tesouro Nacional” Series B |
| NTN-F | — | Brazil Sovereign “Nota do Tesouro Nacional” Series F |
Portfolio holdings by industry† (as a percentage of net assets):
| Aerospace & Defense | | | 1.1 | % | |
| Banks | | | 5.1 | | |
| Beverages | | | 7.6 | | |
| Building Products | | | 0.8 | | |
| Capital Markets | | | 5.0 | | |
| Chemicals | | | 2.1 | | |
| Communications Equipment | | | 2.9 | | |
| Electrical Equipment | | | 3.1 | | |
| Electronic Equipment, Instruments & Components | | | 1.1 | | |
| Entertainment | | | 1.1 | | |
| Health Care Equipment & Supplies | | | 3.1 | | |
| Hotels, Restaurants & Leisure | | | 2.9 | | |
| Household Products | | | 3.0 | | |
| Industrial Conglomerates | | | 1.9 | | |
| Insurance | | | 6.3 | | |
| Interactive Media & Services | | | 4.7 | | |
| Internet & Direct Marketing Retail | | | 0.9 | | |
| IT Services | | | 4.3 | | |
| Leisure Products | | | 1.2 | | |
| Life Sciences Tools & Services | | | 5.6 | | |
| Machinery | | | 1.9 | | |
| Multiline Retail | | | 2.3 | | |
| Personal Products | | | 3.6 | | |
| Pharmaceuticals | | | 6.4 | | |
| Professional Services | | | 5.8 | | |
| Real Estate Management & Development | | | 0.1 | | |
| Road & Rail | | | 1.6 | | |
| Semiconductors & Semiconductor Equipment | | | 3.9 | | |
| Software | | | 6.2 | | |
| Specialty Retail | | | 1.0 | | |
| Trading Companies & Distributors | | | 0.6 | | |
| Subtotal | | | 97.2 | | |
| Foreign Government Obligations | | | 14.3 | | |
| Short-Term Investments | | | 0.5 | | |
| Total Investments | | | 112.0 | % | |
| † | Industry classifications may be different than those used for compliance monitoring purposes. |
The accompanying notes are an integral part of these financial statements.
17
Lazard Global Total Return and Income Fund, Inc.
Statement of Assets and Liabilities
December 31, 2019
| ASSETS | | | | |
| Investments in securities, at fair value (cost $211,890,245) | | $ | 265,790,987 | |
| Foreign currency, at fair value (cost $356,018) | | | 363,407 | |
| Receivables for: | | | | |
| Dividends and interest | | | 728,948 | |
| Investments sold | | | 25,147 | |
| Gross unrealized appreciation on forward currency contracts | | | 1,538,973 | |
| Total assets | | $ | 268,447,462 | |
| | | | | |
| LIABILITIES | | | | |
| Due to Custodian | | | 308,372 | |
| Management fees payable | | | 235,110 | |
| Line of credit outstanding | | | 29,986,000 | |
| Gross unrealized depreciation on forward currency contracts | | | 425,849 | |
| Other accrued expenses and payables | | | 210,707 | |
| Total liabilities | | $ | 31,166,038 | |
| Net assets | | $ | 237,281,424 | |
| | | | | |
| NET ASSETS | | | | |
| Paid in capital (Note 2(f)) | | $ | 183,463,185 | |
| Distributable earnings (Accumulated loss) | | | 53,818,239 | |
| Net assets | | $ | 237,281,424 | |
| | | | | |
| Shares of common stock outstanding* | | | 13,009,661 | |
| Net asset value per share | | $ | 18.24 | |
| Market value per share | | $ | 16.55 | |
| * | $0.001 par value, 500,000,000 shares authorized for the Fund. |
The accompanying notes are an integral part of these financial statements.
18
Lazard Global Total Return and Income Fund, Inc.
Statement of Operations
For the Year Ended December 31, 2019
| INVESTMENT INCOME (LOSS) | | | | |
| | | | | |
| Income: | | | | |
| Dividends (net of foreign withholding taxes of $218,893) | | $ | 3,065,540 | |
| Interest (net of foreign withholding taxes of $9,109) | | | 2,209,587 | |
| Total investment income | | | 5,275,127 | |
| | | | | |
| Expenses: | | | | |
| Management fees (Note 3) | | | 2,038,673 | |
| Professional services | | | 328,689 | |
| Custodian fees | | | 89,715 | |
| Reorganization (Note 13) | | | 80,360 | |
| Stockholders’ reports | | | 65,275 | |
| Stockholders’ services | | | 34,912 | |
| Administration fees | | | 33,085 | |
| Stockholders’ meeting | | | 29,225 | |
| Directors’ fees and expenses | | | 12,022 | |
| Registration fees | | | 7,343 | |
| Other | | | 62,757 | |
| Total expenses before interest expense | | | 2,782,056 | |
| Interest expense | | | 691,899 | |
| Total expenses | | | 3,473,955 | |
| Net investment income (loss) | | | 1,801,172 | |
| | | | | |
| NET REALIZED AND UNREALIZED GAIN (LOSS) ON INVESTMENTS, FOREIGN CURRENCY TRANSACTIONS AND FORWARD CURRENCY CONTRACTS | | | | |
| Net realized gain (loss) on: | | | | |
| Investments | | | (540,980 | ) |
| Foreign currency transactions | | | (97,262 | ) |
| Forward currency contracts | | | 697,136 | |
| Total net realized gain (loss) on investments, foreign currency transactions and forward currency contracts | | | 58,894 | |
| Net change in unrealized appreciation (depreciation) on: | | | | |
| Investments | | | 39,895,005 | * |
| Foreign currency translations | | | 12,127 | |
| Forward currency contracts | | | 571,996 | |
| Total net change in unrealized appreciation (depreciation) on investments, foreign currency translations and forward currency contracts | | | 40,479,128 | |
| Net realized and unrealized gain (loss) on investments, foreign currency transactions and forward currency contracts | | | 40,538,022 | |
| Net increase (decrease) in net assets resulting from operations | | $ | 42,339,194 | |
| * | Excludes net unrealized gain of $971,018 from the acquisition of Lazard World Dividend & Income Fund, Inc. Refer to Note 13 in the Notes to Financial Statements. |
The accompanying notes are an integral part of these financial statements.
19
Lazard Global Total Return and Income Fund, Inc.
Statements of Changes in Net Assets
| | | | | | | |
| | | Year Ended | | Year Ended |
| | | December 31, | | December 31, |
| | | 2019 | | 2018 |
| | | | | | | | | | | |
| INCREASE (DECREASE) IN NET ASSETS | | | | | | | | | | |
| | | | | | | | | | | |
| Operations: | | | | | | | | | | |
| Net investment income (loss) | | | $ | 1,801,172 | | | | $ | 2,407,480 | |
| Net realized gain (loss) on investments, foreign currency transactions and forward currency contracts | | | | 58,894 | | | | | 6,401,671 | |
| Net change in unrealized appreciation (depreciation) on investments, foreign currency translations and forward currency contracts | | | | 40,479,128 | | | | | (26,900,551 | ) |
| Net increase (decrease) in net assets resulting from operations | | | | 42,339,194 | | | | | (18,091,400 | ) |
| | | | | | | | | | | |
| Distributions to Stockholders (Note 2(f)): | | | | | | | | | | |
| Net investment income and net realized gains | | | | (2,335,077 | ) | | | | (15,174,618 | ) |
| Return of capital | | | | (8,201,474 | ) | | | | (10,837,997 | ) |
| Net decrease in net assets resulting from distributions | | | | (10,536,551 | ) | | | | (26,012,615 | ) |
| | | | | | | | | | | |
| Capital Stock Transactions: | | | | | | | | | | |
| Net assets of shares issued in connection with Reorganization (Note 13) | | | | 59,278,874 | | | | | — | |
| Net increase (decrease) in net assets from capital stock transactions | | | | 59,278,874 | | | | | — | |
| Total increase (decrease) in net assets | | | | 91,081,517 | | | | | (44,104,015 | ) |
| Net assets at beginning of period | | | | 146,199,907 | | | | | 190,303,922 | |
| Net assets at end of period | | | $ | 237,281,424 | | | | $ | 146,199,907 | |
| | | | | | | | | | | |
| Transactions in Capital Shares: | | | | | | | | | | |
| Common shares outstanding at beginning of period | | | | 9,605,237 | | | | | 9,605,237 | |
| Shares issued in connection with Reorganization (Note 13) | | | | 3,404,424 | | | | | — | |
| Net increase (decrease) | | | | 3,404,424 | | | | | — | |
| Common shares outstanding at end of period | | | | 13,009,661 | | | | | 9,605,237 | |
The accompanying notes are an integral part of these financial statements.
20
Lazard Global Total Return and Income Fund, Inc.
Statement of Cash Flows
For the Year Ended December 31, 2019
| INCREASE (DECREASE) IN CASH AND FOREIGN CURRENCY | | | | |
| | | | | |
| Cash flows from operating activities: | | | | |
| Net increase (decrease) in net assets resulting from operations | | $ | 42,339,194 | |
| Adjustments to reconcile net increase (decrease) in net assets resulting from operations to net cash provided by (used in) operating activities | | | | |
| (Increase) Decrease in dividends and interest receivable | | | (195,078 | ) |
| Accretion of bond discount and amortization of bond premium, net | | | (1,011,013 | ) |
| Increase (Decrease) in due to custodian | | | 308,372 | |
| Increase (Decrease) in other accrued expenses and payables | | | 136,688 | |
| Net realized (gain) loss on investments, foreign currency transactions and forward currency contracts | | | (58,894 | ) |
| Net change in unrealized (appreciation) depreciation on investments, foreign currency translations and forward currency contracts* | | | (40,479,128 | ) |
| Net settlement of foreign currency contracts | | | 697,136 | |
| Purchases of long-term investments* | | | (111,592,661 | ) |
| Proceeds from disposition of long-term investments | | | 66,636,525 | |
| Proceeds from disposition of short-term investments, net | | | 4,861,455 | |
| Net cash provided by (used in) operating activities | | | (38,357,404 | ) |
| | | | | |
| Cash flows from financing activities: | | | | |
| Cash distributions paid (Note 2(f)) | | | (10,536,551 | ) |
| Cash received in connection with Reorganization (Note 13) | | | 43,802,837 | |
| Gross drawdowns in line of credit balance | | | 12,928,000 | |
| Gross paydowns in line of credit balance | | | (8,000,000 | ) |
| Net cash provided by (used in) financing activities | | | 38,194,286 | |
| | | | | |
| Effect of exchange rate changes on cash | | | (85,135 | ) |
| Net increase (decrease) in cash and foreign currency | | | (248,253 | ) |
| | | | | |
| Cash, restricted cash and foreign currency:** | | | | |
| Beginning balance | | | 611,660 | |
| Ending balance | | $ | 363,407 | |
| | | | | |
| Supplemental disclosure of cash flow information: | | | | |
| Cash paid during the period for interest expense | | $ | (660,863 | ) |
| * | Excludes net unrealized gain of $971,018 and cost of $14,505,019, respectively, of long-term investments transferred in-kind from the acquisition of Lazard World Dividend & Income Fund, Inc. Refer to Note 13 in the Notes to Financial Statements. |
| ** | Includes cash of $0 and $161,309, cash collateral due from broker on forward currency contracts of $0 and $10,000, and foreign currency of $363,407 and $440,351 as of December 31, 2019 and December 31, 2018, respectively. |
The accompanying notes are an integral part of these financial statements.
21
Lazard Global Total Return and Income Fund, Inc.
Financial Highlights
Selected data for a share of common stock outstanding throughout each period
| | | Year Ended |
| | | 12/31/19 | | | 12/31/18 | | | 12/31/17 | | | 12/31/16 | | | 12/31/15 | |
| Net asset value, beginning of period | | $ | 15.22 | | | $ | 19.81 | | | $ | 15.72 | | | $ | 15.26 | | | $ | 17.82 | |
| Income (loss) from investment operations: | | | | | | | | | | | | | | | | | | | | |
| Net investment income (loss) | | | 0.41 | | | | 0.25 | | | | 0.21 | | | | 0.40 | ^ | | | 0.39 | |
| Net realized and unrealized gain (loss) | | | 3.68 | | | | (2.13 | ) | | | 4.86 | | | | 1.01 | | | | (1.84 | ) |
| Total from investment operations | | | 4.09 | | | | (1.88 | ) | | | 5.07 | | | | 1.41 | | | | (1.45 | ) |
| Less distributions from (Note 2(f)): | | | | | | | | | | | | | | | | | | | | |
| Net investment income | | | (0.24 | ) | | | (0.26 | ) | | | (0.98 | ) | | | (0.77 | ) | | | — | |
| Net realized gains | | | — | | | | (1.32 | ) | | | — | | | | — | | | | — | |
| Return of capital | | | (0.83 | ) | | | (1.13 | ) | | | — | | | | (0.18 | ) | | | (1.11 | ) |
| Total distributions | | | (1.07 | ) | | | (2.71 | ) | | | (0.98 | ) | | | (0.95 | ) | | | (1.11 | ) |
| Net asset value, end of period | | $ | 18.24 | | | $ | 15.22 | | | $ | 19.81 | | | $ | 15.72 | | | $ | 15.26 | |
| Market value, end of period | | $ | 16.55 | | | $ | 13.62 | | | $ | 18.00 | | | $ | 13.74 | | | $ | 13.08 | |
| Total Return based upon (a): | | | | | | | | | | | | | | | | | | | | |
| Net asset value | | | 27.44% | | | | –9.80% | | | | 33.07% | | | | 9.75% | ^ | | | –8.58% | |
| Market value | | | 30.09% | | | | –9.81% | | | | 39.20% | | | | 13.02% | | | | –10.78% | |
| Ratios and Supplemental Data: | | | | | | | | | | | | | | | | | | | | |
| Net assets, end of period (in thousands) | | $ | 237,281 | | | $ | 146,200 | | | $ | 190,304 | | | $ | 150,958 | | | $ | 146,592 | |
| Ratios to average net assets: | | | | | | | | | | | | | | | | | | | | |
| Net expenses | | | 2.05% | * | | | 1.82% | | | | 1.72% | | | | 1.72% | ^ | | | 1.46% | |
| Total expenses | | | 2.05% | * | | | 1.82% | | | | 1.72% | | | | 1.73% | | | | 1.46% | |
| Net investment income (loss) | | | 1.06% | | | | 1.32% | | | | 1.15% | | | | 2.69% | ^ | | | 2.30% | |
| Portfolio turnover rate | | | 29% | ** | | | 35% | | | | 42% | | | | 103% | | | | 16% | |
| Asset coverage per $1,000 of loan outstanding (b) | | $ | 8,913 | | | $ | 6,834 | | | $ | 9,323 | | | $ | 7,162 | | | $ | 11,180 | |
| Bank borrowing outstanding (in thousands) . | | $ | 29,986 | | | $ | 25,058 | | | $ | 22,865 | | | $ | 24,500 | | | $ | 14,400 | |
| ^ | Refer to Note 4 in the Notes to Financial Statements for discussion of prior period custodian out-of-pocket expenses that were reimbursed to the Fund in the period. The amount of the reimbursement was less than $0.005 per share. There was a 0.07% impact on the total return of the Fund. There was a 0.01% impact on the net expenses and net investment income (loss) ratios of the Fund. |
| (a) | Total return based on per share market price assumes the purchase of common shares at the closing market price on the business day immediately preceding the first day, and sale of common shares at the closing market price on the last day, of each period indicated; dividends and distributions are assumed to be reinvested in accordance with the Fund’s Dividend Reinvestment Plan. The total return based on net asset value, or NAV, assumes the purchase of common shares at the “net asset value, beginning of period” and sale of common shares at the “net asset value, end of period”, for each of the periods indicated; distributions are assumed to be reinvested at NAV. Past performance is not indicative, or a guarantee, of future results; the investment return, market price and net asset value of the Fund will fluctuate, so that an investor’s shares in the Fund, when sold, may be worth more or less than their original cost. The returns do not reflect the deduction of taxes that a stockholder would pay on the Fund’s distributions or on the sale of Fund shares. Returns for a period of less than one year are not annualized. |
| (b) | Calculated as the sum of the Fund’s Net Assets and line of credit outstanding, as both figures are shown on the Fund’s Statement of Assets and Liabilities, then dividing that sum by the line of credit outstanding and multiplying the result by 1,000. |
| * | Includes reorganization costs associated with the Fund’s reorganization. Without these costs, net expenses and total expenses would have been 2.00% and 2.00%, respectively. Refer to Note 13 in the Notes to Financial Statements. |
| ** | Portfolio turnover rate excludes from purchases the cost of long-term investments transferred in-kind from the reorganization. There was no impact to the portfolio turnover rate. Refer to Note 13 in the Notes to Financial Statements. |
The accompanying notes are an integral part of these financial statements.
22
Lazard Global Total Return and Income Fund, Inc.
Notes to Financial Statements
December 31, 2019
1. Organization
Lazard Global Total Return and Income Fund, Inc. was incorporated in Maryland on January 27, 2004 and is registered under the 1940 Act, as a diversified, closed-end management investment company. The Fund trades on the NYSE under the ticker symbol LGI and commenced operations on April 28, 2004. The Fund’s investment objective is total return, consisting of capital appreciation and income.
2. Significant Accounting Policies
The accompanying financial statements are presented in conformity with US Generally Accepted Accounting Principles (“GAAP”). The Fund is an investment company and therefore applies specialized accounting guidance in accordance with Accounting Standards Codification Topic 946. The following is a summary of significant accounting policies consistently followed by the Fund in the preparation of the financial statements:
(a) Valuation of Investments—Equity securities traded on a securities exchange or market, including exchange-traded option contracts, rights and warrants, are valued at the last reported sales price (for domestic equity securities) or the closing price (for foreign equity securities) on the exchange or market on which the security is principally traded or, for securities trading on the NASDAQ National Market System (“NASDAQ”), the NASDAQ Official Closing Price. If there is no available closing price for a foreign equity security, the last reported sales price is used. If there are no reported sales of a security on the valuation date, the security is valued at the most recent quoted bid price on such date reported by such principal exchange or market. Forward currency contracts generally are valued using quotations from an independent pricing service. Investments in money market funds are valued at the fund’s NAV per share.
Bonds and other fixed-income securities that are not exchange-traded are valued on the basis of prices provided by independent pricing services which are based on, among other things, trading in securities with similar characteristics, brokers’ quotations and/or a matrix system which considers such factors as other security prices, yields and maturities.
Calculation of the Fund’s NAV may not take place contemporaneously with the determination of the prices of portfolio assets used in such calculation. Trading on non-US securities exchanges and in over-the-counter markets may be completed before or after the close of business on each business day in New York (i.e., a day on which the NYSE is open). In addition, non-US securities trading generally, or in a particular country or countries, may not take place on all business days in New York and on which the NAV of the Fund is calculated.
The Valuation Committee of the Investment Manager, which meets periodically under the direction of the Board of Directors (the “Board”), may evaluate a variety of factors to determine the fair value of securities for which market quotations are determined not to be readily available or reliable. These factors include, but are not limited to, the
23
Lazard Global Total Return and Income Fund, Inc.
Notes to Financial Statements(continued)
December 31, 2019
type of security, the value of comparable securities, observations from financial institutions and relevant news events. Input from the Investment Manager’s portfolio managers/analysts also will be considered.
If a significant event materially affecting the value of securities occurs between the close of the exchange or market on which the security is principally traded and the time when the Fund’s NAV is calculated, or when current market quotations otherwise are determined not to be readily available or reliable (including restricted or other illiquid securities such as certain derivative instruments), such securities will be valued at their fair value as determined by, or in accordance with procedures approved by, the Board. The fair value of non-US securities may be determined with the assistance of an independent pricing service using correlations between the movement of prices of such securities and indices of US securities and other appropriate indicators, such as closing market prices of relevant American Depositary Receipts (“ADRs”) or futures contracts. Non-US securities may trade on days when the Fund is not open for business, thus affecting the value of the Fund’s assets on days when Fund stockholders may not be able to buy or sell Fund shares.
The effect of using fair value pricing is that the NAV of the Fund will reflect the affected securities’ values as determined in the judgment of the Board or its designee instead of being determined by the market. Using a fair value pricing methodology to price securities may result in a value that is different from the most recent closing price of a security and from the prices used by other investment companies to calculate their portfolios’ NAVs.
(b) Portfolio Securities Transactions and Investment Income—Portfolio securities transactions are accounted for on trade date. Realized gain (loss) on sales of investments are recorded on a specific identification basis. Dividend income is recorded on the ex-dividend date except for certain dividends from non-US securities where the dividend rate is not available. In such cases, the dividend is recorded as soon as the information is received by the Fund. Interest income is accrued daily. The Fund amortizes premiums and accretes discounts on fixed-income securities using the effective yield method.
The Fund may be subject to taxes imposed by non-US countries in which it invests. Such taxes are generally based upon income earned or capital gains (realized and/or unrealized). The Fund accrues and applies such taxes to net investment income, net realized gains and net unrealized gains concurrent with the recognition of income earned or capital gains (realized and/or unrealized) from the applicable portfolio securities.
As a result of several court cases in certain countries across the European Union, the Fund has filed tax reclaims for previously withheld taxes on dividends earned in certain European Union countries. These filings are subject to various administrative proceedings by the local jurisdictions’ tax authorities within the European Union, as well as a number of related judicial proceedings. Uncertainty exists as to the ultimate resolution of these proceedings, the likelihood of receipt of these claims, and the potential timing of payment, and accordingly no amounts are reflected in the financial state-
24
Lazard Global Total Return and Income Fund, Inc.
Notes to Financial Statements(continued)
December 31, 2019
ments. Such amounts, if and when recorded, could result in an increase in the Fund’s NAV per share.
(c) Leverage—The Fund uses leverage to invest Fund assets in currency investments, primarily using forward currency contracts and by borrowing under a credit facility with State Street Bank and Trust Company (“State Street”), up to a maximum of 33⅓% of the Fund’s total leveraged assets. If the assets of the Fund decline due to market conditions such that this 33⅓% threshold will be exceeded, leverage risk will increase.
If the Fund is able to realize a higher return on the leveraged portion of its investment portfolio than the cost of such leverage together with other related expenses, the effect of the leverage will be to cause the Fund to realize a higher net return than if the Fund were not so leveraged. There is no assurance that any leveraging strategy the Fund employs will be successful.
Using leverage is a speculative investment technique and involves certain risks. These include higher volatility of NAV, the likelihood of more volatility in the market value of the Fund’s common stocks and, with respect to borrowings, the possibility either that the Fund’s return will fall if the interest rate on any borrowings rises, or that income will fluctuate because the interest rate of borrowings varies.
If the market value of the Fund’s leveraged currency investments declines, the leverage will result in a greater decrease in NAV, or less of an increase in NAV, than if the Fund were not leveraged. To the extent that the Fund is required or elects to prepay any borrowings, the Fund may need to liquidate investments to fund such prepayments. Liquidation at times of adverse economic conditions may result in capital losses and may reduce returns.
(d) Foreign Currency Translation and Forward Currency Contracts—The accounting records of the Fund are maintained in US dollars. Portfolio securities and other assets and liabilities denominated in a foreign currency are translated daily into US dollars at the prevailing rates of exchange. Purchases and sales of securities, income receipts and expense payments are translated into US dollars at the prevailing exchange rates on the respective transaction dates.
The Fund does not isolate the portion of operations resulting from changes in foreign exchange rates on investments from the fluctuations arising from changes in their market prices. Such fluctuations are included in net realized and unrealized gain (loss) on investments. Net realized gain (loss) on foreign currency transactions and forward currency contracts represent net foreign currency gain (loss) from forward currency contracts, disposition of foreign currencies, currency gain (loss) realized between the trade and settlement dates on securities transactions, and the difference between the amount of dividends, interest and foreign withholding taxes recorded on the Fund’s accounting records and the US dollar equivalent amounts actually received or paid. Net change in unrealized appreciation (depreciation) on foreign currency translations reflects the
25
Lazard Global Total Return and Income Fund, Inc.
Notes to Financial Statements(continued)
December 31, 2019
impact of changes in exchange rates on the value of assets and liabilities, other than investments in securities, during the period.
A forward currency contract is an agreement between two parties to buy or sell currency at a set price on a future date. Upon entering into these contracts, risks may arise from the potential inability of counterparties to meet the terms of their contracts and from unanticipated movements in the value of the foreign currency relative to the US dollar.
The US dollar value of forward currency contracts is determined using quotations provided by an independent pricing service. Daily fluctuations in the value of such contracts are recorded as unrealized appreciation (depreciation) on forward currency contracts. When the contract is closed, the Fund records a realized gain (loss) equal to the difference between the value at the time it was opened and the value at the time it was closed.
(e) Federal Income Taxes—The Fund’s policy is to qualify as a regulated investment company under Subchapter M of the Internal Revenue Code (the “Code”) and to distribute all of its taxable income, including any net realized capital gains, to stockholders. Therefore, no federal income tax provision is required.
At December 31, 2019, the Fund had unused realized capital loss carryovers which, for federal income tax purposes, could be used to offset future realized capital gains with no expiration date as follows:
| Short-Term | | Long-Term |
| $7,376,693 | | $8,603,948 |
The unused realized capital loss carryovers above include amounts acquired from Lazard World Dividend & Income Fund, Inc. (“LOR”) and may be subject to future limitations.
Under current tax law, post-October capital losses or certain late-year ordinary losses, as defined by the Code, within the taxable year may be deferred and treated as occurring on the first day of the following tax year. For the tax year ended December 31, 2019, the Fund had no such losses to defer.
For federal income tax purposes, the aggregate cost, aggregate gross unrealized appreciation, aggregate gross unrealized depreciation and the net unrealized appreciation (depreciation) were as follows:
Aggregate
Cost | | Aggregate
Gross
Unrealized
Appreciation | | Aggregate
Gross
Unrealized
Depreciation | | Net
Unrealized
Appreciation
(Depreciation) |
| $211,920,514 | | $56,214,403 | | $2,041,283 | | $54,173,120 |
Management has analyzed the Fund’s tax positions, and has concluded that no liability for unrecognized tax benefits should be recorded related to uncertain tax positions taken on tax returns filed for any open tax years (or expected to be taken on future tax
26
Lazard Global Total Return and Income Fund, Inc.
Notes to Financial Statements(continued)
December 31, 2019
returns). Open tax years are those that remain subject to examination and are based on each tax jurisdiction’s statute of limitations. The Fund files a US federal income tax return annually after its fiscal year-end, which is subject to examination by the Internal Revenue Service for a period of three years from the date of filing.
(f) Dividends and Distributions—The Fund intends to declare and to pay dividends monthly. Distributions to stockholders are recorded on the ex-dividend date. During any particular year, net realized gains from investment transactions in excess of available capital loss carryforwards would be taxable to the Fund, if not distributed. The Fund intends to declare and distribute these amounts, at least annually, to stockholders; however, to avoid taxation, a second distribution may be required.
Income and capital gains distributions are determined in accordance with federal income tax regulations which may differ from GAAP. These book/tax differences, which may result in distribution reclassifications, are primarily due to differing treatments of foreign currency and fixed-income transactions, currency straddles, adjustments in relation to merger, return of capital distributions, and wash sales. The book/tax differences relating to stockholder distributions resulted in reclassifications among certain capital accounts as follows:
| Paid in Capital | | Total
Distributable
Earnings
(Accumulated
Loss) |
| $ (8,125,561) | | $8,125,561 |
The Fund has implemented a Level Distribution Policy to seek to maintain a stable monthly distribution, subject to oversight of the Fund’s Board. Under the Fund’s Level Distribution Policy, the Fund intends to make regular monthly distributions at a fixed rate per share. If for any monthly distribution, net investment income and net realized short-term capital gain were less than the amount of the distribution, the difference would generally be distributed from the Fund’s assets. In addition, in order to make such distributions, the Fund might have to sell a portion of its investment portfolio at a time when independent investment judgment might not dictate such actions.
In July 2010, the Investment Manager, on behalf of itself and the Fund, received an exemptive order from the U.S. Securities and Exchange Commission (the “SEC”) facilitating the implementation of a distribution policy that may include multiple long-term capital gains distributions (“Managed Distribution Policy”). As a result, the Fund may, subject to the determination of its Board, implement a Managed Distribution Policy.
Concurrent with the monthly distributions paid throughout the year, the Fund issues any required notices pursuant to Section 19(a) of the 1940 Act (the “Section 19(a) Notices”), each stating that the Fund has distributed more than its then-current net investment income. For 2019, $0.82935 of the $1.06548 per share distributed
27
Lazard Global Total Return and Income Fund, Inc.
Notes to Financial Statements(continued)
December 31, 2019
was a return of capital. The Section 19(a) Notices may also be viewed at www.lazardassetmanagement.com.
The amounts and sources of distributions shown on the Section 19(a) Notices are only estimates and are not provided for tax reporting purposes. The actual amounts and sources of the cumulative distributions for tax reporting purposes will depend upon the Fund’s investments during the year and may be subject to changes based on tax regulations. The Fund will send stockholders a Form 1099-DIV for the calendar year explaining how to report these distributions for federal income tax purposes.
The tax character of dividends and distributions paid during the years ended December 31, were as follows:
| | | 2019 | | | 2018 | |
| Ordinary Income | | $ | 2,335,077 | | | $ | 925,966 | |
| Long-Term Capital Gain | | | — | | | | 14,248,652 | |
| Return of Capital | | | 8,201,474 | | | | 10,837,997 | |
| Total | | $ | 10,536,551 | | | $ | 26,012,615 | |
At December 31, 2019,the components of distributable earnings (accumulated loss) and unrealized appreciation (depreciation), on a tax basis, were as follows:
Undistributed Ordinary
Income (Deferred
Ordinary Losses) | | Undistributed Long-Term
Capital Gain (Deferred
Capital Losses) | | Net Unrealized Appreciation
(Depreciation) Including
Foreign Currency |
| $ — | | $(365,123) | | $54,183,362 |
(g) Allocation of Expenses—Expenses common to the Fund, The Lazard Funds, Inc. and Lazard Retirement Series, Inc. (each a “Lazard Fund” and collectively, the “Lazard Fund Complex”), each a registered management investment company advised by the Investment Manager, not directly chargeable to one or more specific Lazard Funds are allocated to the Fund primarily on the basis of relative net assets.
(h) Estimates—The preparation of financial statements in conformity with GAAP requires management to make estimates and assumptions that affect the reported amounts of assets and liabilities and disclosure of contingent assets and liabilities at the date of the financial statements and the reported amounts of increases and decreases in net assets resulting from operations during the reporting period. Actual results could differ from those estimates.
(i) Net Asset Value—NAV per share for the Fund is determined each day the NYSE is open for trading as of the close of regular trading on the NYSE (generally 4:00 p.m. Eastern time). The Fund will not treat an intraday unscheduled disruption in NYSE trading as a closure of the NYSE, and will price its shares as of 4:00 p.m., if the particular disruption directly affects only the NYSE. NAV per share is determined by dividing the value of the total assets of the Fund, less all liabilities, by the total number of Fund shares outstanding.
28
Lazard Global Total Return and Income Fund, Inc.
Notes to Financial Statements(continued)
December 31, 2019
3. Investment Management Agreement
The Fund has entered into a management agreement (the “Management Agreement”) with the Investment Manager. Pursuant to the Management Agreement, the Investment Manager regularly provides the Fund with investment research, advice and supervision and furnishes continuously an investment program for the Fund consistent with its investment objective and policies, including the purchase, retention and disposition of securities, and provides the Fund with administrative, operational and compliance assistance services.
The Fund has agreed to pay the Investment Manager an annual investment management fee of 0.85% of the Fund’s average daily “Total Leveraged Assets” (the Fund’s total assets including Financial Leverage (defined below)) for the services and facilities provided by the Investment Manager, payable on a monthly basis. For the year ended December 31, 2019, the effective annualized management fee, as a percentage of the Fund’s average net assets, was 1.20%.
The fee paid to the Investment Manager will be higher when the Investment Manager uses Currency Commitments (defined below) and Borrowings (defined below) collectively (“Financial Leverage”) to make Currency Investments (defined below), rather than by reducing the percentage of “Net Assets” (the Fund’s assets without taking into account Financial Leverage) invested in Global Equity Investments for the purposes of making Currency Investments. Global Equity Investments refers to investments in the Fund’s global equity strategy generally consisting of approximately 60 to 80 US and non-US equity securities, including ADRs, generally of companies with market capitalizations greater than $2 billion, and may include investments in emerging markets. “Currency Investments” are investments in emerging market currencies (primarily by entry into forward currency contracts), or instruments whose value is derived from the performance of an underlying emerging market currency, and also may include debt obligations, including government, government agency and corporate obligations and structured notes denominated in emerging market currencies. “Currency Commitments” are the aggregate financial exposures created by forward currency contracts in excess of the financial exposure represented in the Fund’s Net Assets, and “Borrowings” refers to the borrowings under the Fund’s credit facility. Assuming Financial Leverage in the amount of 33⅓% of the Fund’s Total Leveraged Assets, the annual fee payable to the Investment Manager would be 1.28% of Net Assets (i.e., not including amounts attributable to Financial Leverage).
The following is an example of this calculation of the Investment Manager’s fee, using very simple illustrations. If the Fund had assets of $1,000, it could invest $1,000 in Global Equity Investments and enter into $500 in forward currency contracts (because the Fund would not have to pay money at the time it enters into the currency contracts). Similarly, the Fund could invest $1,000 in Global Equity Investments, borrow $500 and invest the $500 in foreign currency denominated bonds. In either case, the Investment Manager’s fee would be calculated based on $1,500 of assets, because the
29
Lazard Global Total Return and Income Fund, Inc.
Notes to Financial Statements(continued)
December 31, 2019
fee is calculated based on Total Leveraged Assets (Net Assets plus Financial Leverage). In our example, the Financial Leverage is in the form of either the forward currency contracts (Currency Commitments) or investments from Borrowings. The amount of the Financial Leverage outstanding, and therefore the amount of Total Leveraged Assets on which the Investment Manager’s fee is based, fluctuates daily based on changes in value of the Fund’s portfolio holdings, including changes in value of the currency involved in the forward currency contracts and foreign currency denominated bonds acquired with the proceeds of Borrowings. However, the Investment Manager’s fee will be the same regardless of whether Currency Investments are made with Currency Commitments or with Borrowings (without taking into account the cost of Borrowings).
This method of calculating the Investment Manager’s fee is different than the way closed-end investment companies typically calculate management fees.Traditionally, closed-end investment companies calculate management fees based on Net Assets plus Borrowings (excluding Financial Leverage obtained through Currency Commitments). The Investment Manager’s fee is different because the Fund’s leverage strategy is different than the leverage strategy employed by many other closed-end investment companies. Although the Fund may employ Borrowings in making Currency Investments, the Fund’s leverage strategy relies primarily on Currency Commitments, rather than relying exclusively on borrowing money and/or issuing preferred stock, as is the strategy employed by most closed-end investment companies. The Investment Manager’s fee would be lower if its fee were calculated only on Net Assets plus Borrowings, because the Investment Manager would not earn fees on Currency Investments made with Currency Commitments (forward currency contracts). Using the example above, where the Fund has assets of $1,000 and invests $1,000 in Global Equity Investments and $500 in forward currency contracts, the following table illustrates how the Investment Manager’s fee would be different if it did not earn management fees on these types of Currency Investments.
| Beginning assets of $1,000 | | Fund’s management
fee based on Total
Leveraged Assets (includes
Currency Commitments) | | Typical management
fee formula,
calculated excluding
Currency Commitments |
| Global Equity Investments (Net Assets) | | | $ | 1,000 | | | | $ | 1,000 | |
| Currency Commitments | | | $ | 500 | | | | $ | 500 | |
| Assets used to calculate management fee | | | $ | 1,500 | | | | $ | 1,000 | |
| Management fee (0.85%) | | | $ | 12.75 | | | | $ | 8.50 | |
Investment Manager Fee Conflict Risk—The fee paid to the Investment Manager for investment management services will be higher when the Fund uses Financial Leverage, whether through forward currency contracts or Borrowings, because the fee paid will be calculated on the basis of the Fund’s assets including this Financial Leverage. Consequently, the Investment Manager may have a financial interest for the Fund to utilize such Financial Leverage, which may create a conflict of interest between the Investment Manager and the stockholders of the Fund.
The Fund has implemented procedures to monitor this potential conflict.
30
Lazard Global Total Return and Income Fund, Inc.
Notes to Financial Statements(continued)
December 31, 2019
4. Administration and Custody Agreements
State Street provides the Fund with custody and certain fund administration and accounting services.
In December 2015, State Street announced that it had identified inconsistencies in the way in which clients were invoiced for custody out-of-pocket expenses from 1998 until 2015. The difference between what was charged and what should have been charged, plus interest, was recorded as a reimbursement when determined in 2016.
5. Directors’ Compensation
Certain Directors of the Fund are officers of the Investment Manager. For the year ended December 31, 2019, each Director who is not an affiliated person of the Investment Manager or any of its affiliates was paid by all of the funds in the Lazard Fund Complex: (1) an annual retainer of $232,000, (2) an additional annual fee of $33,000 to the lead Independent Director (an “Independent Director” is a Director who is not an “interested person” (as defined in the 1940 Act) of the Fund), and (3) an additional annual fee of $23,000 to the Audit Committee Chair. Effective January 1, 2020, the aggregate compensation for Independent Directors for the Lazard Fund Complex is comprised of: (1) an annual retainer of $237,000, (2) an additional annual fee of $33,700 to the lead Independent Director, and (3) an additional annual fee of $23,500 to the Audit Committee Chair. The Independent Directors may be paid additional compensation for participation on ad hoc committees or other work performed on behalf of the Board. The Independent Directors also are reimbursed for travel and other out-of-pocket expenses for attending Board and committee meetings. The Directors do not receive benefits from the Fund pursuant to any pension, retirement or similar arrangement. Independent Directors’ fees are allocated among the active Portfolios in the Lazard Fund Complex at a rate of $5,000 per active Portfolio with the remainder allocated based upon each fund’s proportionate share of combined net assets. The Statement of Operations shows the Independent Directors’ fees and expenses paid by the Fund.
6. Securities Transactions and Transactions with Affiliates
Purchases and sales of portfolio securities (excluding short-term investments) for the year ended December 31, 2019 were $97,483,754 and $52,894,686, respectively.
For the year ended December 31, 2019, the Fund did not engage in any cross-trades in accordance with Rule 17a-7 under the 1940 Act, and no brokerage commissions were paid to affiliates of the Investment Manager or other affiliates of the Fund for portfolio transactions executed on behalf of the Fund.
7. Line of Credit
The Fund has a $50 million Line of Credit Agreement (the “Credit Agreement”) with State Street primarily to borrow to invest Fund assets in Currency Investments. From January 1, 2019 through December 3, 2019, the Credit Agreement provided for a $30
31
Lazard Global Total Return and Income Fund, Inc.
Notes to Financial Statements(continued)
December 31, 2019
million commitment; effective December 4, 2019, the commitment was increased to $50 million. The Fund may borrow the lesser of $50 million or 33⅓% of its Total Leveraged Assets. Interest on borrowings is payable at the higher of the Federal Funds rate or the reserve adjusted LIBOR rate plus 0.95%, on an annualized basis. Under the Credit Agreement, the Fund has agreed to pay a 0.15% per annum fee on the unused portion of the commitment (0.25% per annum if the unused portion is equal to or exceeds 25% of the committed line amount), payable quarterly in arrears. During the year ended December 31, 2019, the Fund had borrowings under the Credit Agreement as follows:
| | Average Daily
Loan Balance* | | Maximum Daily
Loan Outstanding | | Weighted Average
Interest Rate | |
| | $21,935,422 | | $29,986,000 | | 3.12% | |
| * | For the 365 days borrowings were outstanding. |
Management believes that the fair value of the liabilities under the line of credit is equivalent to the recorded amount based on its short-term maturity and interest rate, which fluctuates with the Federal Funds rate and the LIBOR rate. The line of credit outstanding balance as of December 31, 2019 is categorized as Level 2.
8. Investment Risks
(a) Non-US Securities Risk—The Fund’s performance will be influenced by political, social and economic factors affecting the non-US countries and companies in which the Fund invests. Non-US securities carry special risks, such as less developed or less efficient trading markets, political instability, a lack of company information, differing auditing and legal standards, and, potentially, less liquidity.
(b) Emerging Market Risk—Emerging market countries generally have economic structures that are less diverse and mature, and political systems that are less stable, than those of developed countries. The economies of countries with emerging markets may be based predominantly on only a few industries, may be highly vulnerable to changes in local or global trade conditions, and may suffer from extreme debt burdens or volatile inflation rates. The securities markets of emerging market countries have historically been extremely volatile. These market conditions may continue or worsen. Investments in these countries may be subject to political, economic, legal, market and currency risks. The risks may include less protection of property rights and uncertain political and economic policies, the imposition of capital controls and/or foreign investment limitations by a country, nationalization of businesses and the imposition of sanctions by other countries, such as the US. Significant devaluation of emerging market currencies against the US dollar may occur subsequent to acquisition of investments denominated in emerging market currencies.
(c) Foreign Currency Risk—Investments denominated in currencies other than US dollars may experience a decline in value, in US dollar terms, due solely to fluctuations in currency exchange rates. The Fund’s currency investments could be adversely affected
32
Lazard Global Total Return and Income Fund, Inc.
Notes to Financial Statements(continued)
December 31, 2019
by delays in, or a refusal to grant, repatriation of funds or conversion of emerging market currencies. The Investment Manager generally does not intend to actively hedge the Funds’ foreign currency exposure.
(d) Fixed-Income and Debt Securities Risk—The market value of a debt security may decline due to general market conditions that are not specifically related to a particular company, such as real or perceived adverse economic conditions, changes in the outlook for corporate earnings, changes in interest or currency rates or adverse investor sentiment generally. The debt securities market can be susceptible to increases in volatility and decreases in liquidity. Liquidity can decline unpredictably in response to overall economic conditions or credit tightening.
Prices of bonds and other debt securities tend to move inversely with changes in interest rates. Typically, a rise in rates will adversely affect debt securities and, accordingly, will cause the value of the Fund’s investments in these securities to decline. Interest rate risk is usually greater for fixed-income securities with longer maturities or durations. A rise in interest rates (or the expectation of a rise in interest rates) may result in periods of volatility, decreased liquidity and, as a result, the Fund may have to liquidate portfolio securities at disadvantageous prices. During periods of reduced market liquidity, the Fund may not be able to readily sell debt securities at prices at or near their perceived value. Economic and other developments can adversely affect debt securities markets.
The Fund’s investments in lower-rated, higher-yielding securities (“junk bonds”) are subject to greater credit risk than its higher-rated investments. Credit risk is the risk that the issuer will not make interest or principal payments, or will not make payments on a timely basis. Non-investment grade securities tend to be more volatile, less liquid and are considered speculative. If there is a decline, or perceived decline, in the credit quality of a debt security (or any guarantor of payment on such security), the security’s value could fall, potentially lowering the Fund’s share price. The prices of non-investment grade securities, unlike investment grade debt securities, may fluctuate unpredictably and not necessarily inversely with changes in interest rates. The prices of high yield securities can fall in response to negative news about the issuer or its industry, or the economy in general to a greater extent than those of higher-rated securities. The market for these securities may be less liquid and therefore these securities may be harder to value or sell at an acceptable price, especially during times of market volatility or decline.
Some fixed-income securities may give the issuer the option to call, or redeem, the securities before their maturity. If securities held by the Fund are called during a time of declining interest rates (which is typically the case when issuers exercise options to call outstanding securities), the Fund may have to reinvest the proceeds in an investment offering a lower yield (and the Fund may not fully benefit from any increase in the value of its portfolio holdings as a result of declining interest rates).
(e)Forward Currency Contracts Risk—Forward currency contracts may increase volatility or reduce returns, perhaps substantially, particularly since most derivatives
33
Lazard Global Total Return and Income Fund, Inc.
Notes to Financial Statements(continued)
December 31, 2019
have a leverage component that provides investment exposure in excess of the amount invested. Forward currency contracts are subject to the risk of default by the counterparty to the contracts and can be illiquid. These contracts are subject to many of the risks of, and can be highly sensitive to changes in the value of, the related currency. As such, a small investment could have a potentially large impact on the Portfolio’s performance. Derivatives transactions incur costs, either explicitly or implicitly, which reduce return. Successful use of derivatives is subject to the Investment Manager’s ability to predict correctly movements in the direction of the relevant reference asset or market. Use of forward currency contracts, even when entered into for hedging purposes, may cause the Portfolio to experience losses greater than if the Portfolio had not engaged in such transactions.
9. Contractual Obligations
The Fund enters into contracts in the normal course of business that contain a variety of indemnification provisions. The Fund’s maximum exposure under these arrangements is unknown. Management has reviewed the Fund’s existing contracts and expects the risk of loss to be remote.
10. Fair Value Measurements
Fair value is defined as the price that the Fund would receive to sell an asset, or would pay to transfer a liability, in an orderly transaction between market participants at the date of measurement. The Fair Value Measurements and Disclosures provisions of GAAP also establish a framework for measuring fair value, and a three-level hierarchy for fair value measurement that is based upon the transparency of inputs to the valuation of an asset or liability. Inputs may be observable or unobservable and refer, broadly, to the assumptions that market participants would use in pricing the asset or liability. Observable inputs reflect the assumptions that market participants would use in pricing the asset or liability based on market data obtained from sources independent of the Fund. Unobservable inputs reflect the Fund’s own assumptions about the assumptions that market participants would use in pricing the asset or liability, developed based on the best information available in the circumstances. The fair value measurement level within the fair value hierarchy for the assets and liabilities of the Fund is based on the lowest level of any input that is significant to the overall fair value measurement. The three-level hierarchy of inputs is summarized below:
| • | Level 1—unadjusted quoted prices in active markets for identical assets and liabilities |
| | |
| • | Level 2—other significant observable inputs (including unadjusted quoted prices for similar assets and liabilities, interest rates, prepayment speeds, credit risk, etc.) |
| | |
| • | Level 3—significant unobservable inputs (including the Fund’s own assumptions in determining the fair value of assets and liabilities) |
Changes in valuation technique may result in transfers into or out of the current assigned level within the hierarchy.
34
Lazard Global Total Return and Income Fund, Inc.
Notes to Financial Statements(continued)
December 31, 2019
The inputs or methodology used for valuing securities are not necessarily an indication of the risks associated with investing in these securities.
The following table summarizes the valuation of the Fund’s assets and liabilities by each fair value hierarchy level as of December 31, 2019:
| Description | | Unadjusted
Quoted Prices in
Active Markets
for Identical
Assets and Liabilities
(Level 1) | | Significant
Other
Observable
Inputs
(Level 2) | | Significant
Unobservable
Inputs
(Level 3) | | Balance as of
December 31, 2019 |
| Assets: | | | | | | | | | | | | | | | | | | | | |
| Common Stocks* | | | | | | | | | | | | | | | | | | | | |
| Belgium | | | $ | — | | | | $ | 1,820,023 | | | | $ | — | | | | $ | 1,820,023 | |
| Canada | | | | 12,486,666 | | | | | — | | | | | — | | | | | 12,486,666 | |
| China | | | | 2,166,601 | | | | | 4,158,163 | | | | | — | | | | | 6,324,764 | |
| Germany | | | | — | | | | | 2,835,031 | | | | | — | | | | | 2,835,031 | |
| Hong Kong | | | | — | | | | | 6,737,861 | | | | | — | | | | | 6,737,861 | |
| Israel | | | | — | | | | | 2,923,872 | | | | | — | | | | | 2,923,872 | |
| Japan | | | | — | | | | | 13,777,216 | | | | | — | | | | | 13,777,216 | |
| Netherlands | | | | 2,678,823 | | | | | 5,994,444 | | | | | — | | | | | 8,673,267 | |
| Singapore | | | | — | | | | | 3,260,056 | | | | | — | | | | | 3,260,056 | |
| South Africa | | | | — | | | | | 3,586,386 | | | | | — | | | | | 3,586,386 | |
| Sweden | | | | — | | | | | 7,510,843 | | | | | — | | | | | 7,510,843 | |
| Switzerland | | | | — | | | | | 10,345,028 | | | | | — | | | | | 10,345,028 | |
| Taiwan | | | | 3,061,580 | | | | | — | | | | | — | | | | | 3,061,580 | |
| United Kingdom | | | | 3,064,503 | | | | | 24,506,455 | | | | | — | | | | | 27,570,958 | |
| United States | | | | 119,777,539 | | | | | — | | | | | — | | | | | 119,777,539 | |
| Foreign Government Obligations* | | | | — | | | | | 34,016,157 | | | | | — | | | | | 34,016,157 | |
| Short-Term Investments | | | | 1,083,740 | | | | | — | | | | | — | | | | | 1,083,740 | |
| Other Financial Instruments† | | | | | | | | | | | | | | | | | | | | |
| Forward Currency Contracts | | | | — | | | | | 1,538,973 | | | | | — | | | | | 1,538,973 | |
| Total | | | $ | 144,319,452 | | | | $ | 123,010,508 | | | | $ | — | | | | $ | 267,329,960 | |
| Liabilities: | | | | | | | | | | | | | | | | | | | | |
| Other Financial Instruments† | | | | | | | | | | | | | | | | | | | | |
| Forward Currency Contracts | | | $ | — | | | | $ | (425,849 | ) | | | $ | — | | | | $ | (425,849 | ) |
| * | Please refer to Portfolio of Investments and Notes to Portfolio of Investments for portfolio holdings by country and industry. |
| † | Other financial instruments are derivative instruments which are valued at their respective unrealized appreciation (depreciation). |
11. Derivative Instruments
The Fund may use derivative instruments, including forward currency contracts, to gain exposure to the local currency and interest rates of emerging markets or to hedge certain types of currency exposure.
35
Lazard Global Total Return and Income Fund, Inc.
Notes to Financial Statements(continued)
December 31, 2019
During the year ended December 31, 2019, the approximate average monthly notional exposure for derivative instruments was as follows:
| Forward currency contracts: | |
| Average amounts purchased | $62,700,000 |
| Average amounts sold | $16,600,000 |
The following table summarizes the fair value of derivative instruments on the Statement of Assets and Liabilities as of December 31, 2019:
| Assets – Derivative Financial Instruments | | Total | |
| Forward currency contracts | | Unrealized appreciation on forward currency contracts | | $ | 1,538,973 | |
| | | | | | | |
| Liabilities – Derivative Financial Instruments | | Total | |
| Forward currency contracts | | Unrealized depreciation on forward currency contracts | | $ | 425,849 | |
The effect of derivative instruments on the Statement of Operations for the year ended December 31, 2019 was:
| Net Realized Gain (Loss) from: | | Total | |
| Forward currency contracts | | $ | 697,136 | |
| | | | | |
| Net Change in Unrealized Appreciation (Depreciation) on: | | Total | |
| Forward currency contracts | | $ | 571,996 | |
As of December 31, 2019, the Fund held derivative instruments that are eligible for offset in the Statement of Assets and Liabilities and are subject to master netting arrangements. A master netting arrangement is an agreement between two counterparties who have multiple contracts with each other that provides for the net settlement of all contracts, as well as any cash collateral, through a single payment in the event of default on, or termination of, any one contract.
The required information for the Fund is presented in the below table, as of December 31, 2019:
| Description | | Gross Amounts
of Recognized Assets | | Gross Amounts Offset
in the Statement of
Assets and Liabilities | | Net Amounts of
Assets Presented
in the Statement of
Assets and Liabilities |
| Forward Currency Contracts | | $1,538,973 | | $— | | $1,538,973 |
36
Lazard Global Total Return and Income Fund, Inc.
Notes to Financial Statements(continued)
December 31, 2019
| | | | | | | Amounts Not Offset
in the Statement of
Assets and Liabilities | | | |
| Counterparty | | Net Amounts
of Assets
Presented in
the Statement of
Assets and Liabilities | | Financial
Instruments | | Collateral
Received | | Net Amounts of
Derivative Assets |
| BNP Paribas SA | | | $ | 85,967 | | | $ | (85,967 | ) | | $ | — | | | $ | — | |
| Citibank NA | | | | 395,758 | | | | (127,706 | ) | | | — | | | | 268,052 | |
| HSBC Bank USA NA | | | | 480,953 | | | | (16,179 | ) | | | — | | | | 464,774 | |
| JPMorgan Chase Bank NA | | | | 242,577 | | | | — | | | | — | | | | 242,577 | |
| Standard Chartered Bank | | | | 333,718 | | | | (34,878 | ) | | | — | | | | 298,840 | |
| Total | | | $ | 1,538,973 | | | $ | (264,730 | ) | | $ | — | | | $ | 1,274,243 | |
| Description | | Gross Amounts
of Recognized Liabilities | | Gross Amounts Offset
in the Statement of
Assets and Liabilities | | Net Amounts of
Liabilities Presented
in the Statement of
Assets and Liabilities |
| Forward Currency Contracts | | $425,849 | | $ — | | $425,849 |
| | | | | Amounts Not Offset
in the Statement of
Assets and Liabilities | | |
| Counterparty | | Net Amounts
of Liabilities
Presented in
the Statement of
Assets and Liabilities | | Financial
Instruments | | Collateral
Pledged | | Net Amounts of
Derivative Liabilities |
| BNP Paribas SA | | | $ | 247,086 | | | $ | (85,967 | ) | | $ | — | | | $ | 161,119 | |
| Citibank NA | | | | 127,706 | | | | (127,706 | ) | | | — | | | | — | |
| HSBC Bank USA NA | | | | 16,179 | | | | (16,179 | ) | | | — | | | | — | |
| Standard Chartered Bank | | | | 34,878 | | | | (34,878 | ) | | | — | | | | — | |
| Total | | | $ | 425,849 | | | $ | (264,730 | ) | | $ | — | | | $ | 161,119 | |
12. Common Stock
The Fund may repurchase shares of its common stock in the future, at such times and in such amounts as is deemed advisable and in accordance with applicable law, subject to various factors, including the limitations imposed by the federal securities laws governing the repurchase of an issuer’s stock by the issuer, the ability of the Fund to raise cash to repurchase shares of its common stock in a tax efficient manner and general market conditions.
37
Lazard Global Total Return and Income Fund, Inc.
Notes to Financial Statements(continued)
December 31, 2019
13. Reorganization
At a meeting held on January 31,2019, the Board approved merging LOR with and into the Fund pursuant to an Agreement and Plan of Merger (the “Reorganization”). The Reorganization was approved by the stockholders of both the Fund and LOR and was consummated as of the close of business on December 3, 2019.
The chart below shows a summary of net assets, shares outstanding, net unrealized appreciation/(depreciation), accumulated net investment income/(loss) and accumulated net realized gains/(losses), immediately before and immediately after the consummation of the Reorganization.
| | | Before Reorganization | | | After Reorganization | |
| | | World Dividend &
Income Fund, Inc. | | Global Total Return
and Income Fund, Inc. | | Global Total Return
and Income Fund, Inc. |
| Net Assets | | $59,278,874 | | | $167,934,875 | | | $227,213,749 | |
| Shares Outstanding | | 5,504,147 | | | 9,605,237 | | | 13,009,661 | |
| Net unrealized appreciation | | 971,018 | | | 43,951,901 | | | 44,922,919 | |
| Accumulated Net Investment Income/(Loss) | | (1,070,650 | ) | | (7,982,265 | ) | | (7,982,265 | ) |
| Accumulated net realized loss | | (429,330 | ) | | (224,374 | ) | | (224,374 | ) |
Assuming the acquisition of LOR had been consummated on January 1, 2019, the beginning of the annual reporting period, LGI’s pro forma results of operations for the year ended December 31, 2019 would have been as follows:
| Net investment income | | $ | 3,555,572 | |
| Net loss on investments | | $ | (1,319,592 | ) |
| Net increase in net assets resulting from operations | | $ | 2,235,980 | |
Because the combined fund has been managed as a single integrated fund since the Reorganization was consummated, it is not practicable to separate the amounts of revenue and earnings of LOR that have been included in LGI’s Statement of Operations since December 3, 2019.
For financial reporting purposes, assets received—$43,802,837 of which was in the form of cash and $15,476,037 of which was in the form of securities—and shares issued by LGI, were recorded at fair value; however, the cost basis of the investments received from LOR, in the amount of $14,505,019 was carried forward to align ongoing reporting of LGI’s realized and unrealized gains and losses with amounts distributable to stockholders for tax purposes. LGI acquired capital loss carryovers of $15,701,763 from LOR in the Reorganization, of which $7,152,990 are short-term and $8,548,773 are long-term. These capital loss carryovers are not subject to expiration, but they may be subject to future annual limitations.
38
Lazard Global Total Return and Income Fund, Inc.
Notes to Financial Statements(concluded)
December 31, 2019
14. Accounting Pronouncements
In March 2017, the Financial Accounting Standards Board (“FASB”) issued Accounting Standards Update (“ASU”) 2017-08,Nonrefundable Fees and Other Costs (Subtopic 310-20): Premium Amortization on Purchased Callable Debt Securities,which amends the amortization period for certain purchased callable debt securities. Management has adopted the amendment and incorporated the changes in the current financial statements and related disclosures. For public business entities, the amendments in this ASU are effective for fiscal years, and interim periods within those fiscal years, beginning after December 15, 2018.
15. Subsequent Events
Management has evaluated subsequent events affecting the Fund through the issuance of the financial statements and has determined that there were no subsequent events that required adjustment or disclosure.
39
Lazard Global Total Return and Income Fund, Inc.
Report of Independent Registered Public Accounting Firm
To the Board of Directors and the Stockholders of the Lazard Global Total Return and Income Fund, Inc.:
Opinion on the Financial Statements and Financial Highlights
We have audited the accompanying statement of assets and liabilities of Lazard Global Total Return and Income Fund, Inc. (the “Fund”), including the portfolio of investments, as of December 31, 2019, the related statements of operations and cash flows for the year then ended, the statements of changes in net assets for each of the two years in the period then ended, the financial highlights for each of the five years in the period then ended, and the related notes to the financial statements. In our opinion, the financial statements and financial highlights present fairly, in all material respects, the financial position of the Fund as of December 31, 2019, and the results of its operations and its cash flows for the year then ended, the changes in its net assets for each of the two years in the period then ended, and the financial highlights for each of the five years in the period then ended, in conformity with accounting principles generally accepted in the United States of America.
Basis for Opinion
These financial statements and financial highlights are the responsibility of the Fund’s management. Our responsibility is to express an opinion on the Fund’s financial statements and financial highlights based on our audits. We are a public accounting firm registered with the Public Company Accounting Oversight Board (United States) (PCAOB) and are required to be independent with respect to the Fund in accordance with the U.S. federal securities laws and the applicable rules and regulations of the Securities and Exchange Commission and the PCAOB.
We conducted our audits in accordance with the standards of the PCAOB. Those standards require that we plan and perform the audit to obtain reasonable assurance about whether the financial statements and financial highlights are free of material misstatement, whether due to error or fraud. The Fund is not required to have, nor were we engaged to perform, an audit of its internal control over financial reporting. As part of our audits we are required to obtain an understanding of internal control over financial reporting but not for the purpose of expressing an opinion on the effectiveness of the Fund’s internal control over financial reporting. Accordingly, we express no such opinion.
Our audits included performing procedures to assess the risks of material misstatement of the financial statements and financial highlights, whether due to error or fraud, and performing procedures that respond to those risks. Such procedures included examining, on a test basis, evidence regarding the amounts and disclosures in the financial statements and financial highlights. Our audits also included evaluating the accounting principles used and significant estimates made by management, as well as evaluating the overall presentation of the financial statements and financial highlights. Our procedures included confirmation of securities owned as of December 31, 2019,
40
Lazard Global Total Return and Income Fund, Inc.
Report of Independent Registered Public Accounting Firm(concluded)
by correspondence with the custodian and brokers; when replies were not received from brokers, we performed other auditing procedures. We believe that our audits provide a reasonable basis for our opinion.
/s/ DELOITTE & TOUCHE LLP
New York, New York
February 25, 2020
We have served as the auditor of one or more of the investment companies in the Lazard Fund Complex since 2004.
41
Lazard Global Total Return and Income Fund, Inc.
Proxy Voting Results
(unaudited)
The Annual Meeting of Stockholders was held on October 18, 2019, to vote on the following proposals. On October 18, 2019, the proposal for the election of directors received the required number of votes of stockholders and was adopted. With respect to the proposal to merge LOR with and into LGI pursuant to an Agreement and Plan of Merger, the Fund adjourned its Annual Meeting of Stockholders until November 15, 2019 in order to allow stockholders additional time to vote on the proposal. On November 15, 2019, the proposal to merge LOR with and into LGI pursuant to an Agreement and Plan of Merger received the required number of votes of stockholders and was adopted.
Approval of the Merger of LOR with and into LGI, Pursuant to an Agreement and Plan of Merger between LOR and LGI:
| For | | Against | | Abstain |
| 4,890,152 | | 151,536 | | 4,098,073 |
Election of the following Directors:
| • | three Class II Directors, each to serve for a three-year term expiring at the 2022 Annual Meeting and until his successor is duly elected and qualified. |
| Director | | For | | Withhold Authority |
| Kenneth S. Davidson | | 8,939,037 | | 175,007 |
| Nancy A. Eckl | | 8,944,847 | | 169,197 |
| Trevor W. Morrison | | 8,935,879 | | 178,165 |
42
Lazard Global Total Return and Income Fund, Inc.
Dividend Reinvestment Plan
(unaudited)
Unless you elect to receive distributions in cash (i.e., opt-out), all dividends, including any capital gain distributions, on your common stock will be automatically reinvested by Computershare, Inc., as dividend disbursing agent (the “Plan Agent”), in additional common stock under the Fund’s Dividend Reinvestment Plan (the “Plan”). You may elect not to participate in the Plan by contacting the Plan Agent. If you do not participate, you will receive all distributions in cash, paid by check mailed directly to you by the Plan Agent.
Under the Plan, the number of shares of common stock you will receive will be determined on the dividend or distribution payment date, as follows:
| (1) | If the common stock is trading at or above net asset value at the time of valuation, the Fund will issue new shares at a price equal to the greater of (i) net asset value per common share on that date or (ii) 95% of the common stock’s market price on that date. |
| (2) | If the common stock is trading below net asset value at the time of valuation, the Plan Agent will receive the dividend or distribution in cash and will purchase common stock in the open market, on the NYSE or elsewhere, for the participants’ accounts. It is possible that the market price for the common stock may increase before the Plan Agent has completed its purchases. Therefore, the average purchase price per share paid by the Plan Agent may exceed the market price at the time of valuation, resulting in the purchase of fewer shares than if the dividend or distribution had been paid in common stock issued by the Fund. The Plan Agent will use all dividends and distributions received in cash to purchase common stock in the open market within 30 days of the valuation date. Interest will not be paid on any uninvested cash payments. |
You may withdraw from the Plan at any time by giving written notice to the Plan Agent. If you withdraw or the Plan is terminated, you will receive whole shares in your account under the Plan and you will receive a cash payment for any fraction of a share in your account. If you wish, the Plan Agent will sell your shares and send you the proceeds, minus an initial $15 service fee plus $0.12 per share being liquidated (for processing and brokerage expenses).
The Plan Agent maintains all stockholders’ accounts in the Plan and gives written confirmation of all transactions in the accounts, including information you may need for tax records. Shares of common stock in your account will be held by the Plan Agent in non-certificated form. Any proxy you receive will include all common stock you have received under the Plan.
There is no brokerage charge for reinvestment of your dividends or distributions in newly-issued shares of common stock. However, all participants will pay a pro rata share of brokerage commissions incurred by the Plan Agent when it makes open market purchases.
43
Lazard Global Total Return and Income Fund, Inc.
Dividend Reinvestment Plan(concluded)
(unaudited)
Automatically reinvesting dividends and distributions does not mean that you do not have to pay income taxes due upon receiving dividends and distributions.
If you hold your common stock with a brokerage firm that does not participate in the Plan, you will not be able to participate in the Plan and any dividend reinvestment may be effected on different terms than those described above. Consult your financial advisor for more information.
The Fund reserves the right to amend or terminate the Plan if, in the judgment of the Board, the change is warranted. There is no direct service charge to participants in the Plan (other than the service charge when you direct the Plan Agent to sell your common stock held in a dividend reinvestment account); however, the Fund reserves the right to amend the Plan to include a service charge payable by the participants. Additional information about the Plan may be obtained from the Plan Agent at P.O. Box 30170, College Station, Texas 77842-3170.
44
Lazard Global Total Return and Income Fund, Inc.
Board of Directors and Officers Information
(unaudited)
Name (Year of Birth)
Address(1) | | Position(s) with the Fund
(Since) and Term(2) | | Principal Occupation(s) and Other
Public Company Directorships Held
During the Past Five Years(2) |
| | | | | |
| Board of Directors: | | | | |
| | | |
| Class I – Directors with Term Expiring in 2021 | | |
| | | | | |
| Independent Director(2): | | | | |
| | | | | |
| Robert M. Solmson (1947) | | Director (September 2004) | | Fairwood Capital, LLC, a private investment corporation engaged primarily in real estate and hotel investments,Co-Managing Partner and Managing Director(2008 - present) |
| | | | | |
| Interested Director(3): | | | | |
| | | | | |
| Nathan A. Paul (1973) | | Director (April 2017), Chief Executive Officer and President (February 2017; previously, Vice President and Secretary since February 2004) | | Investment Manager,Chief Business Officer (April 2017 - present) andManaging Director (2003 - present) |
| | | | | Investment Manager,General Counsel (2002 - April 2017) |
| | | |
| Class II – Directors with Term Expiring in 2022 | | |
| | | | | |
| Independent Directors(2): | | | | |
| | | | | |
| Kenneth S. Davidson (1945) | | Director (February 2004) | | Davidson Capital Management Corporation, an investment manager,President(1978 - present) |
| | | | | |
| Nancy A. Eckl (1962) | | Director (February 2007) | | College Retirement Equities Fund (eight accounts),Trustee(2007 - present) |
| | | | | |
| | | | | TIAA-CREF Funds (69 funds) and TIAA-CREF Life Funds (11 funds),Trustee(2007 - present) |
| | | | | |
| | | | | TIAA Separate Account VA-1,Member of the Management Committee(2007 - present) |
| | | | | |
| Trevor W. Morrison (1971) | | Director (April 2014) | | New York University School of Law,DeanandEric M. and Laurie B. Roth Professor of Law (2013 - present) |
45
Lazard Global Total Return and Income Fund, Inc.
Board of Directors and Officers Information
(unaudited) (continued)
Name (Year of Birth)
Address(1) | | Position(s) with the Fund
(Since) and Term(2) | | Principal Occupation(s) and Other
Public Company Directorships Held
During the Past Five Years(2) |
| | | |
| Class III – Directors with Term Expiring in 2020 | | |
| | | | | |
| Independent Directors(2): | | | | |
| | | | | |
| Franci J. Blassberg (1953) | | Director (August 2014) | | Debevoise & Plimpton LLP, a law firm,Of Counsel(2013 - present) |
| | | | | |
| | | | | Cornell Law School,Adjunct Professor (2013 - present) |
| | | | | |
| | | | | The Buchmann Faculty of Law, Tel Aviv University,Visiting Professor(2019) |
| | | | | |
| | | | | University of California, Berkeley School of Law,Adjunct Professor(Spring 2017) |
| | | | | |
| Richard Reiss, Jr. (1944) | | Director (February 2004) | | Georgica Advisors LLC, an investment manager,Chairman(1997 - present) |
| | | | | |
| | | | | Osprey Technology Acquisition Corp, a special purpose acquisition company,Director(2019 - present) |
| | | | | |
| | | | | Resource America, Inc., a real estate asset management company,Director (2016 - 2018) |
| | | | | |
| Interested Director(3): | | | | |
| | | | | |
| Ashish Bhutani (1960) | | Director (July 2005) | | Investment Manager,Chief Executive Officer (2004 - present) |
| | | | | |
| | | | | Lazard Ltd,Vice Chairman and Director (2010 - present) |
| (1) | The address of each Director of the Fund is Lazard Asset Management LLC, 30 Rockefeller Plaza, New York, New York 10112-6300. |
| (2) | “Independent Directors” are not “interested persons” (as defined in the 1940 Act) of the Fund. |
| (3) | Messrs. Bhutani and Paul are “interested persons” (as defined in the 1940 Act) of the Fund because of their positions with the Investment Manager. |
46
Lazard Global Total Return and Income Fund, Inc.
Board of Directors and Officers Information
(unaudited) (concluded)
Name (Year of Birth)
Address(1) | | Position(s) with the Fund
(Since) and Term(2) | | Principal Occupation(s)
During the Past Five Years |
| | | | | |
| Officers(2): | | | | |
| | | | | |
| Mark R. Anderson (1970) | | Chief Compliance Officer (September 2014), Vice President and Secretary (February 2017) | | Managing Director (since February 2017, previously Director), Chief Compliance Officer (since September 2014) and General Counsel (since April 2017) of the Investment Manager |
| | | | | |
| Christopher Snively (1984) | | Chief Financial Officer (March 2016) and Treasurer (September 2019) | | Senior Vice President of the Investment Manager (since November 2015) Assurance Manager at PricewaterhouseCoopers LLP (2008 - November 2015) |
| | | | | |
| Shari L. Soloway (1981) | | Assistant Secretary (November 2015) | | Head of Legal, North America (since January 2019, previously Senior Vice President, Legal and Compliance (since September 2015)), of the Investment Manager Vice President and Associate General Counsel of GE Asset Management (July 2011 - September 2015) |
| | | | | |
| Jessica A. Falzone (1989) | | Assistant Secretary (January 2019) | | Vice President, Legal and Compliance, of the Investment Manager (since March 2018) Associate at Schulte Roth & Zabel LLP (2014 - March 2018) |
| | | | | |
| Cesar A. Trelles (1975) | | Assistant Treasurer (December 2004) | | Vice President of the Investment Manager |
| (1) | The address of each officer of the Fund is Lazard Asset Management LLC, 30 Rockefeller Plaza, New York, New York 10112-6300. |
| (2) | In addition to Nathan A. Paul, Chief Executive Officer and President (since February 2017; previously, Vice President and Secretary since February 2004), whose information is included in the Class I Interested Director section above. |
47
Lazard Global Total Return and Income Fund, Inc.
Tax and Other Information
(unaudited)
Tax Information
Year Ended December 31, 2019
The following tax information represents year end disclosures of the tax benefits passed through to stockholders for 2019:
Of the dividends paid by the Fund, 100% of the dividends are qualified dividend income.
Of the dividends paid by the Fund, 39.35% of the dividends qualify for the dividends received deduction available to corporate shareholders.
The Fund intends to pass through to shareholders foreign source income of $2,310,032 and foreign taxes paid of $226,878, or up to the maximum amount allowable, as a foreign tax credit.
Pursuant to Section 871 of the Code, the Fund has no designated qualified short-term gains for purposes of exempting withholding of tax on such distributions to US non-resident shareholders.
Proxy Voting
A description of the policies and procedures used to determine how proxies relating to Fund portfolio securities are voted is available (1) without charge, upon request, by calling (800) 823-6300 or (2) on the SEC’s website at https://www.sec.gov.
The Fund’s proxy voting record for the most recent 12-month period ended June 30 is available (1) without charge, upon request, by calling (800) 823-6300 or (2) on the SEC’s website at https://www.sec.gov. Information as of June 30 each year will generally be available by the following August 31.
Schedule of Portfolio Holdings
The Fund files its complete schedule of its portfolio holdings with the SEC for the first and third quarters of each fiscal year as an exhibit to its reports on Form N-PORT. The Fund’s Form N-PORT reports are available on the SEC’s website at https://www.sec.gov.
48
Lazard Global Total Return and Income Fund, Inc.
30 Rockefeller Plaza
New York, New York 10112-6300
Telephone: 800-823-6300
https://www.lazardassetmanagement.com
Investment Manager
Lazard Asset Management LLC
30 Rockefeller Plaza
New York, New York 10112-6300
Telephone: 800-823-6300
Custodian
State Street Bank and Trust Company
One Iron Street
Boston, Massachusetts 02210
Transfer Agent and Registrar
Computershare Trust Company, N.A.
P.O. Box 43010
Providence, Rhode Island 02940-3010
Dividend Disbursing Agent
Computershare, Inc.
P.O. Box 30170
College Station, Texas 77842-3170
Independent Registered Public Accounting Firm
Deloitte & Touche LLP
30 Rockefeller Plaza
New York, New York 10112-0015
Legal Counsel
Proskauer Rose LLP
Eleven Times Square
New York, New York 10036-8299
http://www.proskauer.com

 | |
| | |
Lazard Asset Management LLC•30 Rockefeller Plaza•New York, NY 10112•www.lazardassetmanagement.com This report is intended only for the information of stockholders of Lazard Global Total Return and Income Fund, Inc. Performance information as of the most recent month end is available online at www.lazardassetmanagement.com. |  |
ITEM 2. CODE OF ETHICS.
The Registrant has adopted a code of ethics that applies to the Registrant’s principal executive officer, principal financial officer, principal accounting officer or controller, or persons performing similar functions.
ITEM 3. AUDIT COMMITTEE FINANCIAL EXPERT.
The Registrant’s Board of Directors (the “Board”) has determined that Robert M. Solmson and Nancy A. Eckl, members of the Audit Committee of the Board, are audit committee financial experts as defined by the Securities and Exchange Commission (the “SEC”). Mr. Solmson and Ms. Eckl are “independent” as defined by the SEC for purposes of audit committee financial expert determinations.
ITEM 4. PRINCIPAL ACCOUNTANT FEES AND SERVICES.
(a) Audit Fees. The aggregate fees billed for each of the last two fiscal years (the “Reporting Periods”) for professional services rendered by the Registrant’s principal accountant (the “Auditor”) for the audit of the Registrant’s annual financial statements, or services that are normally provided by the Auditor in connection with the statutory and regulatory filings or engagements for the Reporting Periods, were $36,500 in 2018 and $39,000 in 2019 (plus expenses in each case).
(b) Audit-Related Fees. There were no fees billed in the Reporting Periods by the Auditor to the Registrant for assurance and related services that are reasonably related to the performance of the audit of the Registrant’s financial statements and are not reported under paragraph (a) of this Item 4.
The aggregate fees billed in the Reporting Periods for non-audit assurance and related services provided by the Auditor to Lazard Asset Management LLC, the Registrant’s investment manager (“Lazard”) and any entity controlling, controlled by or under common control with Lazard that provides ongoing services to the Registrant (“Service Affiliates”) that were reasonably related to the performance of the annual audit of the Service Affiliate which required pre-approval by the Audit Committee were $267,330 in 2018 and $267,330 in 2019.
(c) Tax Fees. The aggregate fees billed in the Reporting Periods by the Auditor to the Registrant for professional services rendered by the Auditor for tax compliance, tax advice and tax planning (“Tax Services”) were $7,300 in 2018 and $7,370 in 2019. These Tax Services consisted of (i) review or preparation of U.S. federal, state, local and excise tax returns; (ii) U.S. federal, state and local tax planning, advice and assistance regarding statutory, regulatory or administrative developments; and (iii) tax advice regarding tax qualification matters and/or treatment of various financial instruments held or proposed to be acquired or held. Additionally, the aggregate fees billed related to European Union tax reclaim filing services rendered by the Auditor were $0 in 2018 and $0 in 2019.
The aggregate fees billed in the Reporting Periods for Tax Services provided by the Auditor to Service Affiliates which required pre-approval by the Audit Committee were $0 in 2018 and $0 in 2019.
(d) All Other Fees. There were no fees billed in the Reporting Periods for products and services provided by the Auditor, other than the services reported in paragraphs (a) through (c) above.
There were no fees billed in the Reporting Periods for products and services provided by the Auditor, other than the services reported in paragraphs (a) through (c) above, which required pre-approval by the Audit Committee.
(e) Audit Committee Pre-Approval Policies and Procedures. The Registrant’s Audit Committee has established policies and procedures (the “Policy”) for pre-approval of the Auditor’s engagements for services to the Registrant and Service Affiliates. The Policy states that the Registrant’s Audit Committee or the Chair of the Audit Committee (pursuant to delegated authority from the Audit Committee) pre-approves the Auditor’s engagements for audit and non-audit services to the Registrant and, as required, non-audit services to Service Affiliates on a case by-case basis. Pre-approval considerations include whether the proposed services are compatible with maintaining the Auditor’s independence. The Audit Committee Chair must report any pre-approval decisions he or she makes at the next scheduled Audit Committee meeting. There were no services provided by the Auditor to either the Registrant or Service Affiliates that were approved pursuant to paragraph (c)(7)(i)(C) of Rule 2-01 of Regulation S-X during the Reporting Periods.
(f) None.
(g) Non-Audit Fees. The aggregate non-audit fees billed by the Auditor for services rendered to the Registrant and Service Affiliates for the Reporting Periods were $1,234,762 in 2018 and $1,128,439 in 2019.
(h) Auditor Independence. The Audit Committee considered whether provision of non-audit services to Service Affiliates that were not required to be pre-approved is compatible with maintaining the Auditor’s independence.
ITEM 5. AUDIT COMMITTEE OF LISTED REGISTRANTS.
The Registrant has a separately-designated standing Audit Committee established in accordance with Section 3(a)(58)(A) of the Securities Exchange Act of 1934, as amended. It is composed of the following Directors, each of whom is not an “interested person” (as defined in the Investment Company Act of 1940) of the Registrant (“Independent Directors”):
Nancy A. Eckl, Audit Committee Chair
Franci J. Blassberg
Kenneth S. Davidson
Trevor W. Morrison
Richard Reiss, Jr.
Robert M. Solmson
ITEM 6. INVESTMENTS
Not applicable.
ITEM 7. DISCLOSURE OF PROXY VOTING POLICIES AND PROCEDURES FOR CLOSED END MANAGEMENT INVESTMENT COMPANIES.
The Registrant has delegated voting of proxies in respect of portfolio holdings to Lazard, to vote the Registrant’s proxies in accordance with Lazard’s proxy voting policy and guidelines (the “Voting Guidelines”) that provide as follows:
• Lazard votes proxies in the best interests of its clients.
• Unless Lazard’s Proxy Committee otherwise determines, Lazard votes proxies in a manner consistent with the Voting Guidelines.
• To avoid conflicts of interest, Lazard votes proxies where a material conflict has been deemed to exist in accordance with specific proxy voting guidelines regarding various standard proxy proposals (“Approved Guidelines”) or, if the Approved Guideline is to
vote case-by-case, in accordance with the majority recommendation of the independent proxy services to which Lazard subscribes.
• Lazard also may determine not to vote proxies in respect of securities of any issuer if it determines that it would be in the client’s overall best interests not to vote.
The Voting Guidelines address how it will vote proxies on particular types of matters such as the election for directors, adoption of option plans and anti-takeover proposals. For example, Lazard generally will:
• vote as recommended by management in routine election or re-election of directors;
• favor programs intended to reward management and employees for positive, long-term performance, evaluating whether Lazard believes, under the circumstances, that the level of compensation is appropriate or excessive; and
• vote against anti-takeover measures, such as adopting supermajority voting requirements, shareholder rights plans and fair price provision.
ITEM 8. PORTFOLIO MANAGERS OF CLOSED-END MANAGEMENT INVESTMENT COMPANIES.
Principal Portfolio Managers
As of the date of the filing of this Report on Form N-CSR, the following persons are responsible for the management of the Registrant’s portfolio:
James Donald is responsible for allocation of the Registrant’s assets between Global Equity Investments and Currency Investments (each, as defined in the notes to the Registrant’s annual report to shareholders contained in Item 1) and overall management of the Registrant’s portfolio.
Global Equity Investments and Currency Investments are each managed on a team basis, with each member of the team involved at all levels of the investment process.
Mr. Donald, a Managing Director of Lazard, is a portfolio manager/analyst on Lazard’s Emerging Markets Equity team and Head of the Emerging Markets Group. Prior to joining Lazard in 1996, Mr. Donald was a portfolio manager with Mercury Asset Management. Mr. Donald is a CFA Charterholder.
Global Equity Investments.Louis Florentin-Lee and Barnaby Wilson are jointly responsible for investing the Registrant’s assets allocated to Global Equity Investments, with Ronald Temple in an oversight capacity.
Mr. Florentin-Lee, a Managing Director of Lazard, is a portfolio manager/analyst on various of Lazard’s Global Equity teams. Mr. Florentin-Lee joined Lazard in 2004, and has been working in the investment field since 1996.
Ronald Temple, a Managing Director of Lazard, is responsible for oversight of Lazard’s US Equity and Multi-Asset strategies. Mr. Temple joined Lazard in 2001 and has been working in the investment field since 1991.
Mr. Wilson, a Managing Director of Lazard, is a portfolio manager/analyst on various of Lazard’s Global Equity teams. Prior to joining Lazard in 1999, Mr. Wilson worked for Orbitex Investments. He began working in the investment field in 1998, and is a CFA Charterholder.
Currency Investments.Ardra Belitz and Ganesh Ramachandran are jointly responsible for investment of the Registrant’s assets allocated to Currency Investments.
Ms. Belitz, a Managing Director of Lazard, is a portfolio manager/analyst on Lazard’s Emerging Markets Income team, joined the team in 1998. Prior to joining Lazard in 1996, Ms. Belitz was with Bankers Trust Company. She began working in the investment industry in 1994.
Mr. Ramachandran, a Managing Director of Lazard, is a portfolio manager/analyst on Lazard’s Emerging Markets Income team, joined the team in 2001. Mr. Ramachandran began working in the investment field in 1997 when he joined Lazard.
Portfolio Management
Team Management. Portfolio managers at Lazard manage multiple accounts for a diverse client base, including private clients, institutions and investment funds. Lazard manages all portfolios on a team basis. The team is involved at all levels of the investment process. This team approach allows for every portfolio manager to benefit from his/her peers, and for clients to
receive the firm’s best thinking, not that of a single portfolio manager. Lazard manages all like investment mandates against a model portfolio. Specific client objectives, guidelines or limitations then are applied against the model, and any necessary adjustments are made.
Material Conflicts Related to Management of Similar Accounts. Although the potential for conflicts of interest exist when an investment adviser and portfolio managers manage other accounts that invest in securities in which the Registrant may invest or that may pursue a strategy similar to the Registrant’s component strategies (collectively, “Similar Accounts”), Lazard has procedures in place that are designed to ensure that all accounts are treated fairly and that the Registrant is not disadvantaged, including procedures regarding trade allocations and “conflicting trades” (e.g., long and short positions in the same or similar securities, as described below). In addition, the Registrant, as a registered investment company, is subject to different regulations than certain of the Similar Accounts, and, consequently, may not be permitted to engage in all the investment techniques or transactions, or to engage in such techniques or transactions to the same degree, as the Similar Accounts.
Potential conflicts of interest may arise because of Lazard’s management of the Registrant and Similar Accounts, including the following:
1. Similar Accounts may have investment objectives, strategies and risks that differ from those of the Registrant. In addition, the Registrant, as a registered investment company, is subject to different regulations than certain of the Similar Accounts and, consequently, may not be permitted to invest in the same securities, exercise rights to exchange or convert securities or engage in all the investment techniques or transactions, or to invest, exercise or engage to the same degree, as the Similar Accounts. For these or other reasons, the portfolio managers may purchase different securities for the Registrant and the corresponding Similar Accounts, and the performance of securities purchased for the Registrant may vary from the performance of securities purchased for Similar Accounts, perhaps materially.
2. Conflicts of interest may arise with both the aggregation and allocation of securities transactions and allocation of limited investment opportunities, as Lazard may be perceived as causing accounts it manages to participate in an offering to increase Lazard’s overall allocation of securities in that offering, or to increase Lazard’s ability to participate in future offerings by the same underwriter or issuer. Allocations of bunched trades, particularly trade orders that were only partially filled due to limited availability, and allocation of investment opportunities generally, could raise a potential conflict of interest, as Lazard may have an incentive to allocate securities that are expected to increase in value to preferred accounts. Initial public offerings, in particular, are frequently of very limited availability. A potential conflict of interest may be perceived to arise if transactions in one account closely follow related transactions in a different account, such as when a purchase increases the value of securities previously purchased by
the other account, or when a sale in one account lowers the sale price received in a sale by a second account.
3. Portfolio managers may be perceived to have a conflict of interest because of the large number of Similar Accounts, in addition to the Registrant, that they are managing on behalf of Lazard. Although Lazard does not track each individual portfolio manager’s time dedicated to each account, Lazard periodically reviews each portfolio manager’s overall responsibilities to ensure that he or she is able to allocate the necessary time and resources to effectively manage the Registrant. As illustrated in the table below, most of the portfolio managers manage a significant number of Similar Accounts (10 or more) in addition to the Registrant.
4. Generally, Lazard and/or some or all of the Registrant’s portfolio managers have investments in Similar Accounts. This could be viewed as creating a potential conflict of interest, since certain of the portfolio managers do not invest in the Registrant or may invest more significantly in a Similar Account.
5. The portfolio managers noted in footnote (#) to the table below manage Similar Accounts with respect to which the advisory fee is based on the performance of the account, which could give the portfolio managers and Lazard an incentive to favor such Similar Accounts over the Registrant.
6. The Registrant’s portfolio managers may place transactions on behalf of Similar Accounts that are directly or indirectly contrary to investment decisions made for the Registrant, which could have the potential to adversely impact the Registrant, depending on market conditions. In addition, if the Registrant’s investment in an issuer is at a different level of the issuer’s capital structure than an investment in the issuer by Similar Accounts, in the event of credit deterioration of the issuer, there may be a conflict of interest between the Registrant’s and such Similar Accounts’ investments in the issuer. If Lazard sells securities short, including on behalf of a registered investment company, it may be seen as harmful to the performance of any Similar Accounts or other client accounts investing “long” in the same or similar securities whose market values fall as a result of short-selling activities.
7. Investment decisions for the Registrant are made independently from those of Similar Accounts. If, however, Similar Accounts desire to invest in, or dispose of, the same securities as the Registrant, available investments or opportunities for sales will be allocated equitably to each. In some cases, this procedure may adversely affect the size of the position obtained for or disposed of by the Registrant or the price paid or received by the Registrant.
8. Under Lazard’s trade allocation procedures applicable to domestic and foreign initial and secondary public offerings and Rule 144A transactions (collectively herein a “Limited Offering”), Lazard will generally allocate Limited Offering shares among client accounts, including the Registrant, pro rata based upon the aggregate asset size (excluding leverage) of the account. Lazard may also allocate Limited Offering shares on a random basis, as selected electronically, or other basis. It is often difficult for Lazard to obtain a sufficient number of Limited Offering shares to provide a full allocation to each account. Lazard’s allocation procedures are designed to allocate Limited Offering securities in a fair and equitable manner.
In some cases, Lazard may seek to limit the number of overlapping investments by the Registrant and Similar Accounts (securities of an issuer held in more than one Similar Account) or may choose different securities for the Registrant and Similar Accounts that employ similar investment strategies so that shareholders invested in the Registrant and such Similar Accounts may achieve a more diverse investment experience. In such cases, the Registrant may be disadvantaged by Lazard’s decision to purchase or maintain an investment in the Registrant to the exclusion of one or more Similar Accounts (including a decision to sell the investment in the Registrant so that it may be purchased by a Similar Account).
Lazard and its affiliates and others involved in the management, investment activities, business operations or distribution of the Registrant or its shares, as applicable, are engaged in businesses and have interests other than that of managing the Registrant. These activities and interests include potential multiple advisory, transactional, financial and other interests in securities, instruments and companies that may be directly or indirectly purchased or sold by the Registrant or the Registrant’s service providers, which may cause conflicts that could disadvantage the Registrant.
Accounts Managed by the Portfolio Managers. The chart below includes information regarding the members of the portfolio management team responsible for managing the Registrant. Specifically, it shows the number of portfolios and assets managed by management teams of which each of the Registrant’s portfolio managers is a member. Regardless of the number of accounts, the portfolio management team still manages each account based on a model portfolio as described above.
| | | Registered Investment | | Other Pooled Investment | | |
| Portfolio Manager | | Companies ($*)# | | Vehicles ($*)# | | Other Accounts($*)#,+ |
| Ardra Belitz | | 3 (220.2 million) | | 2 (105.8 million) | | 2 (6 thousand) |
| Louis Florentin-Lee | | 9 (21.0 billion) | | 9 (2.2 billion) | | 111 (5.5 billion) |
| Ronald Temple | | 9 (21.1 billion) | | 13 (3.4 billion) | | 113 (5.7 billion) |
| James M. Donald | | 14 (14.6 billion) | | 14 (6.5 billion) | | 126 (16.0 billion) |
| Ganesh Ramachandran | | 3 (220.2 million) | | 2 (105.8 million) | | 2 (6 thousand) |
| Barnaby Wilson | | 6 (226.8 million) | | 9 (1.7 billion) | | 35 (3.6 billion) |
* Total assets in accounts as of December 31, 2019.
# The following portfolio managers manage accounts with respect to which the advisory fee is based on the performance of the account:
(1) Mr. Donald manages one other account and one registered investment company with assets under management of approximately $610.3 million and $4.2 billion, respectively.
(2) Mr. Florentin-Lee manages two registered investment companies with assets under management of approximately $18.0 billion.
(3) Mr. Temple manages two registered investment companies and two other pooled investment vehicles with assets under management of approximately $18.0 billion and $1.0 billion, respectively.
(4) Mr. Wilson manages one other account with assets under management of approximately $320.5 million.
+ Includes an aggregation of any Similar Accounts within managed account programs where the third party program sponsor is responsible for applying specific client objectives, guidelines and limitations against the model portfolio managed by the portfolio management team.
Compensation for Portfolio Managers
Lazard’s portfolio managers are generally responsible for managing multiple types of accounts that may, or may not, invest in securities in which the Registrant may invest or pursue a strategy similar to one of the Registrant’s component strategies. Portfolio managers responsible for managing the Registrant may also manage sub-advised registered investment companies,
collective investment trusts, unregistered funds and/or other pooled investment vehicles, separate accounts, separately managed account programs (often referred to as “wrap accounts”) and model portfolios.
During the fiscal year covered by this Report on Form N-CSR, Lazard compensates portfolio managers by a competitive salary and bonus structure, which is determined both quantitatively and qualitatively. Salary and bonus are paid in cash, stock and restricted fund interests. Portfolio managers are compensated on the performance of the aggregate group of portfolios managed by the teams of which they are a member rather than for a specific fund or account. Various factors are considered in the determination of a portfolio manager’s compensation. All
of the portfolios managed by a portfolio manager are comprehensively evaluated to determine his or her positive and consistent performance contribution over time. Further factors include the amount of assets in the portfolios as well as qualitative aspects that reinforce Lazard’s investment philosophy.
Total compensation is generally not fixed, but rather is based on the following factors: (i) leadership, teamwork and commitment, (ii) maintenance of current knowledge and opinions on companies owned in the portfolio; (iii) generation and development of new investment ideas, including the quality of security analysis and identification of appreciation catalysts; (iv) ability and willingness to develop and share ideas on a team basis; and (v) the performance results of the portfolios managed by the investment teams of which the portfolio manager is a member.
Variable bonus is based on the portfolio manager’s quantitative performance as measured by his or her ability to make investment decisions that contribute to the pre-tax absolute and relative returns of the accounts managed by the teams of which the portfolio manager is a member, by comparison of each account to a predetermined benchmark generally as set forth in the prospectus or other governing document over the current fiscal year and the longer-term performance of such account, as well as performance of the account relative to peers. The portfolio manager’s bonus also can be influenced by subjective measurement of the manager’s ability to help others make investment decisions. A portion of a portfolio manager’s variable bonus is awarded under a deferred compensation arrangement pursuant to which the portfolio manager may allocate certain amounts awarded among certain accounts, in shares that vest in two to three years. Certain portfolio managers’ bonus compensation may be tied to a fixed percentage of revenue or assets generated by the accounts managed by such portfolio management teams.
Ownership of Registrant Securities
As of December 31, 2019, the portfolio managers of the Registrant owned the following shares of Common Stock of the Registrant.
| Portfolio Manager | Market Value of Shares |
| Ardra Belitz | None |
| James M. Donald | $100,001-$500,000 |
| Ganesh Ramachandran | $10,001-$50,000 |
| Louis Florentin-Lee | None |
| Barnaby Wilson | None |
| Ronald Temple | $10,001-$50,000 |
ITEM 9. PURCHASES OF EQUITY SECURITIES BY CLOSED-END MANAGEMENT INVESTMENT COMPANY AND AFFILIATED PURCHASERS.
Not applicable.
ITEM 10. SUBMISSION OF MATTERS TO A VOTE OF SECURITY HOLDERS.
There were no material changes to the procedures by which shareholders may recommend nominees to the Registrant’s Board during the period covered by this report. A description of these procedures can be found in the proxy statement for the Registrant’s most recent shareholder meeting, which is available at www.sec.gov.
ITEM 11. CONTROLS AND PROCEDURES.
(a) The Registrant’s principal executive and principal financial officers have concluded, based on their evaluation of the Registrant’s disclosure controls and procedures as of a date within 90 days of the filing date of this report, that the Registrant’s disclosure controls and procedures are reasonably designed to ensure that information required to be disclosed by the Registrant
on Form N-CSR is recorded, processed, summarized and reported within the required time periods and that information required to be disclosed by the Registrant in the reports that it files or submits on Form N-CSR is accumulated and communicated to the Registrant’s management, including its principal executive and principal financial officers, as appropriate to allow timely decisions regarding required disclosure.
(b) There were no changes to the Registrant’s internal control over financial reporting that occurred during the period covered by this report that have materially affected, or are reasonably likely to materially affect, the Registrant’s internal control over financial reporting.
ITEM 12. DISCLOSURE OF SECURITIES LENDING ACTIVITIES FOR CLOSED-END MANAGEMENT INVESTMENT COMPANIES.
Not applicable.
ITEM 13. EXHIBITS.
(a)(1) Code of Ethics referred to in Item 2.
(a)(2) Certifications of principal executive and principal financial officers as required by Rule 30a-2(a) under the Investment Company Act of 1940.
(a)(3) Not applicable.
(b) Certifications of principal executive and principal financial officers as required by Rule 30a-2(b) under the Investment Company Act of 1940.
SIGNATURES
Pursuant to the requirements of the Securities Exchange Act of 1934 and the Investment Company Act of 1940, the registrant has duly caused this report to be signed on its behalf by the undersigned, thereunto duly authorized.
Lazard Global Total Return and Income Fund, Inc.
By /s/ Nathan A. Paul
Nathan A. Paul
Chief Executive Officer
Date March 3, 2020
Pursuant to the requirements of the Securities Exchange Act of 1934 and the Investment Company Act of 1940, this report has been signed below by the following persons on behalf of the registrant and in the capacities and on the dates indicated.
By /s/ Nathan A. Paul
Nathan A. Paul
Chief Executive Officer
Date March 3, 2020
By /s/ Christopher Snively
Christopher Snively
Chief Financial Officer
Date March 3, 2020