UNITED STATES
SECURITIES AND EXCHANGE COMMISSION
Washington, D.C. 20549
FORM N-CSR
CERTIFIED SHAREHOLDER REPORT OF REGISTERED MANAGEMENT INVESTMENT COMPANIES
Investment Company Act file number 811-21504
Advent/Claymore Enhanced Growth & Income Fund
(Exact name of registrant as specified in charter)
1065 Avenue of the Americas, New York, NY 10018
(Address of principal executive offices) (Zip code)
Robert White, Treasurer
1065 Avenue of the Americas, New York, NY 10018
(Name and address of agent for service)
Registrant's telephone number, including area code: (212) 479-0675
Date of fiscal year end: October 31
Date of reporting period: April 30, 2010
Form N-CSR is to be used by management investment companies to file reports with the Commission not later than 10 days after the transmission to stockholders of any report that is required to be transmitted to stockholders under Rule 30e-1 under the Investment Company Act of 1940 (17 CFR 270.30e-1). The Commission may use the information provided on Form N-CSR in its regulatory, disclosure review, inspection, and policymaking roles.
A registrant is required to disclose the information specified by Form N-CSR, and the Commission will make this information public. A registrant is not required to respond to the collection of information contained in Form N-CSR unless the Form displays a currently valid Office of Management and Budget ("OMB") control number. Please direct comments concerning the accuracy of the information collection burden estimate and any suggestions for reducing the burden to Secretary, Securities and Exchange Commission, 450 Fifth Street, NW, Washington, DC 20549-0609. The OMB has reviewed this collection of information under the clearance requirements of 44 U.S.C. § 3507.
Item 1. Reports to Stockholders.
The registrant's semi-annual report transmitted to shareholders pursuant to Rule 30e-1 under the Investment Company Act of 1940, as amended (the “Investment Company Act”) is as follows:
Semiannual Report April 30, 2010 (Unaudited) | Advent/Claymore Enhanced Growth & Income Fund | LCM |

 |  |
www.claymore.com/lcm ... your bridge to the LATEST, most up-to-date INFORMATION about the Advent/Claymore Enhanced Growth & Income Fund |

The shareholder report you are reading right now is just the beginning of the story. Online at www.claymore.com/lcm, you will find:
| • | Daily, weekly and monthly data on share prices, net asset values, distributions, and more |
| • | Portfolio overviews and performance analyses |
| • | Announcements, press releases and special notices |
| • | Fund and adviser contact information |
Advent Capital Management and Claymore are continually updating and expanding shareholder information services on the Fund’s website in an ongoing effort to provide you with the most current information about how your Fund’s assets are managed, and the results of our efforts. It is just one more small way we are working to keep you better informed about your investment in the Fund.
2 | Semiannual Report| April 30, 2010
LCM | Advent/Claymore Enhanced Growth & Income Fund
Dear Shareholder | |||
 Tracy V. Maitland President and Chief Executive Officer | We thank you for your investment in the Advent/Claymore Enhanced Growth & Income Fund (the “Fund”). This report covers the Fund’s performance for the semiannual period ended April 30, 2010. Advent Capital Management, LLC serves as the Fund’s Investment Manager. Based in New York, New York, with additional investment personnel in London, England, Advent is a credit-oriented firm specializing in the management of global convertible, high-yield and equity securities across three lines of business—long-only strategies, hedge funds and closed-end funds. As of April 30, 2010, Advent managed approximately $5.25 billion in assets. Claymore Advisors, LLC (“Claymore”) serves as the Investment Adviser to the Fund. Claymore Securities, Inc. is an affiliate of Claymore Advisors, LLC. Claymore and its associated entities are wholly-owned subsidiaries of Guggenheim Partners, LLC (“Guggenheim Partners”), a global, diversified financial services firm with more than $100 billion in assets under supervision. At its reconvened special meeting of shareholders held on March 12, 2010, shareholders of the Fund approved a new investment advisory agreement between the Fund and Claymore. Shareholder approval of the investment advisory agreement was needed because the October 2009 acquisition of Claymore by Guggenheim Partners resulted in the automatic termination of the previous investment advisory agreement between the Fund and Claymore. Claymore Securities, Inc. offers strategic investment solutions for financial advisors and their clients. In total, Claymore entities provide supervision, management, or servicing on approximately $15.9 billion in assets as of March 31, 2010. The Fund’s primary investment objective is to seek current income and current gains from trading securities, with a secondary objective of long-term capital appreciation. Under normal market conditions, the Fund invests at least 70% of its managed assets in a diversified portfolio of equity securities and convertible securities of U.S. and non-U.S. issuers and up to 30% of assets in non-convertible high yield securities. Additionally, the Fund intends to engage in a strategy of writing (selling) covered call options on at least 50% of the securities held in the portfolio of the Fund, thus generating option writing premiums. Advent seeks international investment opportunities in each asset class, with an emphasis on large multinational companies. Appreciation potential is provided by investments in convertibles and common stock, while the allocation to high-yield securities is primarily a source of income. The balance between convertible securities, equities and high-yield securities and the degree to which the Fund engages in a covered call strategy will vary from time to time based on security valuations, interest rates, equity market volatility and other economic and market factors. This ability to move among the three asset classes is quite beneficial to the Fund’s ability to balance return and risk. An important new strategy for the Fund is the use of leverage (borrowing), which is being utilized to finance the purchase of additional securities that provide increased income and potentially greater appreciation potential for common shareholders than could be achieved from an unleveraged portfolio. All Fund returns cited—whether based on net asset value (“NAV”) or market price—assume the reinvestment of all distributions. For the six-month period ending April 30, 2010, the Fund generated a total return based on market price of 20.10% and a return of 12.48% based on NAV. As of April 30, 2010, the Fund’s market price of $12.01 represented a discount of 4.76% to NAV of $12.61. As of October 31, 2009, the Fund’s market price of $10.48 repre- | ||
Semiannual Report| April 30, 2010 | 3
LCM | Advent/Claymore Enhanced Growth & Income Fund | Dear Shareholder continued
sented a discount of 10.58% to NAV of $11.72. The market value of the Fund’s shares fluctuates from time to time, and it may be higher or lower than the Fund’s NAV. The Fund paid quarterly dividends of $0.264 in November 2009 and February 2010. The most recent dividend represents an annualized distribution rate of 8.79% based on the Fund’s closing market price of $12.01 on April 30, 2010. There is no guarantee of any future distributions or that the current returns and distribution rate will be maintained. We encourage shareholders to consider the opportunity to reinvest their distributions from the Fund through the Dividend Reinvestment Plan (“DRIP”), which is described in detail on page 30 of the Fund’s semiannual report. When shares trade at a discount to NAV, the DRIP takes advantage of the discount by reinvesting the quarterly dividend distribution in common shares of the Fund purchased in the market at a price less than NAV. Conversely, when the market price of the Fund’s common shares is at a premium above NAV, the DRIP reinvests participants’ dividends in newly-issued common shares at NAV, subject to an IRS limitation that the purchase price cannot be more than 5% below the market price per share. The DRIP provides a cost-effective means to accumulate additional shares and enjoy the benefits of compounding returns over time. The DRIP plan effectively provides an income averaging technique, which causes shareholders to accumulate a larger number of Fund shares when the market price is depressed than when the price is higher. The Fund is managed by a team of experienced and seasoned professionals led by myself in my capacity as Chief Investment Officer (as well as President and Founder) of Advent Capital Management, LLC. We encourage you to read the following Questions & Answers section, which provides more information about the factors that impacted the Fund’s performance. We thank you for your investment in the Fund and we are honored that you have chosen the Advent/Claymore Enhanced Growth & Income Fund as part of your investment portfolio. For the most up-to-date information on your investment, please visit the Fund’s website at www.claymore.com/lcm. |
| Sincerely, |
 |
| Tracy V. Maitland |
| President and Chief Executive Officer of the Advent/Claymore Enhanced Growth & Income Fund |
| May 31, 2010 |
4 | Semiannual Report | April 30, 2010
LCM | Advent/Claymore Enhanced Growth & Income Fund
Questions & Answers |
Advent/Claymore Enhanced Growth & Income Fund (the “Fund”) is managed by a team of seasoned professionals at Advent Capital Management, LLC, led by Tracy V. Maitland, Advent’s President and Chief Investment Officer. In the following interview, the management team discusses the equity, convertible securities and high-yield markets and the performance of the Fund during the six-month period ended April 30, 2010.
1. Please remind us of this Fund’s objectives and how you seek to achieve them.
The Fund’s primary investment objective is to provide current income and current gains from trading in securities, with a secondary objective of long-term capital appreciation. Under normal market conditions, the Fund invests at least 70% of its assets in a diversified portfolio of equity securities and convertible securities of U.S. and non-U.S. issuers and up to 30% of its managed assets in non-convertible high yield securities. Additionally, the Fund engages in an option strategy of writing (selling) covered call options on at least 50% of the securities held in the portfolio of the Fund, thus generating option writing premiums. Advent seeks international investment opportunities in each asset class, with an emphasis on large multinational companies. Capital appreciation potential is provided by investments in convertibles and common stock, while the allocation to high-yield securities is primarily a source of income.
An important new strategy for the Fund is the use of leverage (borrowing), which is being utilized to finance the purchase of additional securities that provide increased income and potentially greater appreciation potential for common shareholders than could be achieved from an unleveraged portfolio. Seeing an opportunity to take advantage of the spread between historically low financing rates and significantly higher yields on income-producing securities such as convertible and high-yield securities, Advent requested and received from the Fund’s Board of Trustees authorization to engage in a leverage strategy. In order to undertake this strategy, the Fund entered into a credit facility with BNP Paribas, a major European bank, to opportunistically introduce leverage to enhance the total return potential via the Fund’s investment strategies. Initially, the Fund borrowed $50 million, or approximately 23% of its total assets, under this credit facility.
Although the use of financial leverage by the Fund may create an opportunity for increased return for common shareholders, it also results in additional risks and can magnify the effect of any losses. If the income and gains earned on securities purchased with the financial leverage proceeds are greater than the cost of the financial leverage, the common shareholders’ return will be greater than if financial leverage had not been used. Conversely, if the income or gains from the securities purchased with the proceeds of financial leverage are less than the cost of the financial leverage, common shareholders’ return will be less than if financial leverage had not been used. There is no assurance that a financial leverage strategy will be successful.
2. Please tell us about the economic and market environment over the last six months.
The economic recovery that began in the second half of 2009 appeared to solidify and strengthen in the first few months of 2010. The early stages of the recovery were driven mainly by monetary and fiscal stimulus and an upturn in the inventory cycle. More recently, activity in the U.S. economy appears to be more sustainable, with improving conditions in the labor market, firming aggregate demand and reviving confidence.
The North American economies appear to be generally stronger than most other world economies. The recovery is still in an early stage in Europe, and European economies were affected by a range of problems including travel disruptions due to volcanic ash from Iceland and concerns about sovereign debt of some countries in the spring of 2010. In Asia, the Chinese government has demonstrated its intention to rein in a potentially overheating economy, while the Japanese economy is reasonably strong.
During the six months from October 31, 2009 through April 30, 2010, equity markets, credit markets and the markets for convertible securities continued the recovery that began in the first quarter of 2009. Most of the indices used by the Fund’s managers to gauge market performance were up more than 10% for the six months ended April 30, 2010; the exception was the Morgan Stanley Capital International Europe-Australasia-Far East (MSCI EAFE) Index, which returned 2.75% for the six-month period. Return of the Merrill Lynch All U.S. Convertibles Index for the six-month period ended April 30, 2010, was 16.28%. The Standard & Poor’s 500 Index, which is generally regarded as a good indicator of the broad U.S. stock market, returned 15.66% for the same period. Return of the Merrill Lynch High Yield Master II Index, which measures performance of the high-yield bond market, was 11.65% for the six months ended April 30, 2010.
3. How did the Fund perform in this environment?
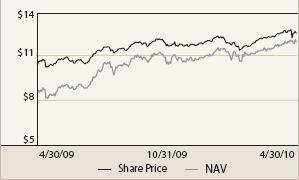
Benefiting from strength in equity, credit and convertible markets, as well as favorable investment decisions made by the Investment Manager, the Fund performed very well. For the six-month period ending April 30, 2010, the Fund generated a total return based on market price of 20.10% and a return of 12.48% based on NAV. As of April 30, 2010, the Fund’s market price of $12.01 represented a discount of 4.76% to NAV of $12.61. All Fund returns cited—whether based on net asset value (“NAV”) or market price—assume the reinvestment of all distributions.
For comparison, the CBOE S&P 500 2% OTM BuyWrite Index (BXY), an index that measures performance of 2% out-of-the-money S&P 500 Index call options, returned 12.36% over the same period.
Semiannual Report | April 30, 2010 | 5
LCM | Advent/Claymore Enhanced Growth & Income Fund | Questions and Answers continued
The market value and NAV of the Fund’s shares fluctuate from time to time, and the Fund’s market value may be higher or lower than its NAV. The current discount to NAV provides an opportunity for investors to purchase shares of the Fund below the market value of the securities in the underlying portfolio. The Adviser believes that, over the long term, the progress of the NAV will be reflected in the market price return to shareholders.
4. How was the Fund’s portfolio allocated among asset classes over the last six months?
The Fund was designed to be diversified among asset classes but to also have the flexibility to reallocate assets, as appropriate. Investments are allocated globally among stocks, convertible securities and high-yield bonds.
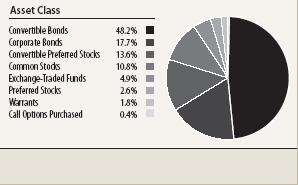
At the end of the previous fiscal year, October 31, 2009, 82.1% of the Fund’s assets were in convertible securities; of this 61.4% was in convertible bonds and 20.7% in convertible preferreds. At that time, 8.6% of the Fund’s assets were invested in equities and 7.4% in high yield bonds. As of April 30, 2010, the total exposure to convertibles was 61.8%, including both convertible bonds and preferreds. As of April 30, 2010, 10.8% of the Fund’s portfolio was invested in common stocks, 2.6% in preferred stocks, and 4.9% in ETFs.
Seeing a more normalized credit market but still a steep yield curve, with low short term rates and relatively high long term rates, as discussed above, the Fund’s Adviser secured a credit line. The Fund borrowed $50 million at very low interest rates and invested in higher yielding investments with longer maturities to take advantage of the steep yield curve. (The yield curve is a graph with a left-to-right line that shows how high or low yields are, from the shortest to the longest maturities. Typically, the line rises from left to right as investors who are willing to tie up their money for a longer period are rewarded with higher yields.) Over half of the borrowed money was invested in high yield bonds which subsequently appreciated in value, resulting in a significant increase in percentage of the Fund’s assets allocated to high-yield bonds, which represented 17.7% of the portfolio as of April 30, 2010.
In terms of industry representation, the emphasis has been shifted to more economically sensitive sectors such as industrials, financials and consumer discretionary, with a corresponding reduction in more stable sectors such as health care. Many of the Fund’s health care holdings had performed quite well, providing an opportunity to realize gains by selling some holdings such as Human Genome Sciences, Inc.(0.4% of long-term investments), a commercially focused biopharmaceutical company. The exposure to the basic materials sector has been reduced, despite the desire to increase exposure to economically sensitive sectors, because many holdings in this sector had moved up sharply. A position in Freeport-McMoRan Copper & Gold, Inc. (0.1% of long-term investments), a mining company that performed very well in 2009, was reduced, with the proceeds invested in other securities that had not yet recovered significantly but whose growth prospects looked favorable.
The Fund’s foreign exposure was not changed significantly. As of April 30, 2010, 22.0% of the portfolio was in securities of companies headquartered outside the U.S.; international investments represented 24.3% of the portfolio as of October 31, 2009.
5. Which investment decisions had the greatest effect on the Fund’s performance?
The decision to begin using leverage was an important contributor, and the timing of the implementation of leverage was highly advantageous. The new line of credit became available in January 2010 at a time the high yield market was experiencing a setback. The Adviser was able to take advantage of this market correction to invest in high yield bonds, which performed very well through the end of the period.
One of the top performing issues was a mandatory convertible preferred stock issued in late 2009 by Citigroup, Inc. (1.6% of long-term investments).The Investment Manager took advantage of this issue from a large money center bank that is believed to be in the early stages of recovering from financial problems experienced in 2008 and early 2009. Also highly positive was a large position in warrants of Bank of America Corp. (1.2% of long-term investments). Valuation analysis indicated that the price of these warrants sold at auction was cheap, and it seems likely that there will be high demand for these longer-term warrants if the underlying stock continues to recover. Also positive was an investment in warrants of JPMorgan Chase & Co. (0.6% of long-term investments), a financial holding company. Warrants provide a means of gaining exposure to the equities of these financial institutions without actually owning the stock. Also, warrants typically have an asymmetry that is somewhat akin to convertibles in that they
6 | Semiannual Report | April 30, 2010
LCM | Advent/Claymore Enhanced Growth & Income Fund | Questions and Answers continued
tend to capture more of the upside than the downside, especially when they have a few years to run.
As the portfolio has been adjusted to include more economically sensitive names, some industrial companies made significant contributions to performance. Among these were auto manufacturer Ford Motor Co. (1.4% of long-term investments), which has experienced a strong comeback after being down sharply in 2008. The Fund held two Ford bonds and a preferred issue, and all contributed to performance over the six-month period. Other industrial names that contributed include Navistar International Corp. (0.6% of long-term investments), which manufactures trucks, engines and parts; Danaher Corp. (0.6% of long-term investments), a diversified industrial company; and Kansas City Southern (not held in portfolio at period end), a railroad company. And while the energy sector as a whole did not perform well, one holding that stood out is Whiting Petroleum Corporation (0.7% of long-term investments), an independent oil and gas company.
In the interest of balance, it is appropriate to comment on holdings that detracted from performance, but actually there were not many, and the losses they generated were relatively small. One position that detracted from performance was Actelion Finance SCA (0.6% of long-term investments), a Swiss biopharmaceutical Company that focuses on the discovery, development and commercialization of treatments. Its main drug, Tracleer, has been proven effective for certain types of lung ailments, but the stock dropped when trials for using this drug for other conditions were not successful. The Fund held an Actelion convertible bond that was purchased at a price approximately 10% above its value at maturity in two years. This bond provided the opportunity to participate in a high volatility scenario in a conservative way, since Actelion is a financially sound company with a considerable cash position. While the equity participation did not work out as hoped, the bond was down much less than the stock.
Some of the Fund’s natural gas holdings were laggards, reflecting weak natural gas prices. A bond of Goodrich Petroleum Corp. (0.7% of long-term investments), an independent oil and gas company, provided income, but the stock and the bond were down. Other energy names that detracted were natural gas producer Chesapeake Energy Corp. (0.7% of long-term investments) and Frontier Oil Corporation (not held in portfolio at period end), a refiner that had suffered from industry-wide weakness in refining margins.
6. What was the impact of the Fund’s covered call strategy?
Early in the period, in the fall of 2009, there was considerable market volatility, and the covered call options written on the Fund’s holdings generated attractive premiums, providing additional income. As the period progressed, market volatility declined and the premiums available for writing calls were less, even though there was considerable volatility in individual stocks. So, although the strategy was continued as expected, the risk-reward attractiveness for this strategy was lessened. Therefore, fewer call contracts were written, and they did not provide as much income as this strategy historically has. Going forward, during periods when overall volatility expands, Advent intends to increase the call writing activity accordingly, with the beneficial impact on income accruing to the Fund.
The Fund intends to write covered call options on at least 50% of the securities held in the portfolio, generally 10% to 15% out of the money. As of April 30, 2010, options were written against approximately 55% of the total securities in the Fund.
The Fund’s covered call overlay serves mainly to help meet distribution goals and, to a lesser extent, to help maintain the Fund’s NAV during market setbacks. Option premiums, dividends, interest and capital appreciation are all part of the total return. Most of the covered call writing centers on the Fund’s U.S. equity and convertible investments, because the U.S. has a broad and deep options market, while many international companies that we find attractive lack listed options.
Although the Fund has the ability to write calls on the entire portfolio, covered calls are generally written on no more than 60–65% of the total portfolio. Calls are usually written on just a portion of a position so that if the price of the security rises substantially and the call is exercised, a portion of the position is still maintained. Calls with varying maturities and strike prices are typically tiered so that not all expire at the same time or are exercised at the same price.
| What is a covered call? |
| A call is an option (or contract) that gives its holder the right, but not the obligation, to buy shares of the underlying security at a specified price on or before a pre-determined expiration date. After this predeter- mined date, the option and its corresponding rights expire. A covered call is when the seller of the call option also owns the security on which the call is written. Covered call strategies are generally used as a hedge—to limit losses by obtaining premium income from the sale of calls, while still maintaining upside potential. |
Semiannual Report | April 30, 2010 | 7
LCM | Advent/Claymore Enhanced Growth & Income Fund | Questions and Answers continued
7. What is the current outlook for the markets and the Fund?
The Fund’s management team continues to see opportunities in convertible securities and high yield bonds. There is also further potential in equities as economies around the world continue to recover. Continued strength in equities is likely to lead to rewarding returns from convertible securities.
A major advantage of this Fund is its ability to invest in multiple asset classes, adjusting the asset mix according to the opportunities available in various markets around the world. As the equity market rises, as it has in recent months, the equity sensitivity of a portfolio of convertible securities increases. When the equity market is weak, convertibles’ declining sensitivity, combined with interest income, mitigates the downside.
Advent believes that, over the long term, careful security selection and asset allocation will help the Fund’s performance by providing favorable returns in rising markets and a level of income that can help provide some protection for overall returns during down markets.
Index Definitions
Indices are unmanaged and it is not possible to invest directly in an index.
The MSCI EAFE Index is a free float-adjusted market capitalization weighted index designed to reflect the movements of stock markets in developed countries of Europe and the Pacific Basin. The index is calculated in U.S. dollars and is constructed to represent about 60% of market capitalization in each country.
The Merrill Lynch All U.S. Convertibles Index is comprised of approximately 500 issues of convertible bonds and preferred stock of all qualities.
S&P 500 Index is a capitalization-weighted index of 500 stocks. The index is designed to measure performance of the broad domestic economy through changes in the aggregate market value of 500 stocks representing all major industries.
Merrill Lynch High Yield Master II Index is a commonly used benchmark index for high yield corporate bonds. It is a measure of the broad high yield market.
The CBOE S&P 500 2% OTM BuyWrite Index (BXY) uses the same methodology as the widely accepted CBOE S&P 500 BuyWrite Index (BXM), but the BXY Index is calculated using out-of-the-money S&P 500 Index (SPX) call options, rather than at-the-money SPX call options. The BXY strategy diversifies the buy-write opportunities currently provided by the BXM. The BXY Index yields lower monthly premiums in return for a greater participation in the upside moves of the S&P 500.
LCM Additional Risks and Disclosure
The views expressed in his report reflect those of the Portfolio Managers and Claymore only through the report period as stated on the cover. These views are subject to change at any time, based on market and other conditions and should not be construed as a recommendation of any kind. The material may also contain forward-looking statements that involve risk and uncertainty, and there is no guarantee they will come to pass. There can be no assurance that the Fund will achieve its investment objectives. The value of the fund will fluctuate with the value of the underlying securities. Historically, closed-end funds often trade at a discount to their net asset value. The Fund is subject to investment risk, including the possible loss of the entire amount that you invest. Past performance does not guarantee future results.
Convertible Securities. The Fund is not limited in the percentage of its assets that may be invested in convertible securities. Convertible securities generally offer lower interest or dividend yields than non-convertible securities of similar quality. The market values of convertible securities tend to decline as interest rates increase and, conversely, to increase as interest rates decline. However, the convertible security’s market value tends to reflect the market price of the common stock of the issuing company when that stock price is greater than the convertible’s “conversion price,” which is the predetermined price at which the convertible security could be exchanged for the associated stock.
Synthetic Convertible Securities. The value of a synthetic convertible security will respond differently to market fluctuations than a convertible security because a synthetic convertible security is composed of two or more separate securities, each with its own market value. In addition, if the value of the underlying common stock or the level of the index involved in the convertible component falls below the exercise price of the warrant or option, the warrant or option may lose all value.
Equity Securities Risk. Equity risk is the risk that securities held by the Fund will fall due to general market or economic conditions, perceptions regarding the industries in which the issuers of securities held by the Fund participate, and the particular circumstances and performance of particular companies whose securities the Fund holds.
Risks Associated with Options on Securities. There are significant differences between the securities and options markets that could result in an imperfect correlation between these markets, causing a given transaction not to achieve its objectives. A decision as to whether, when and how to use options involves the exercise of skill and judgment, and even a well-conceived transaction may be unsuccessful to some degree because of market behavior or unexpected events. As the writer of a covered call option, the Fund forgoes, during the option’s
8 | Semiannual Report | April 30, 2010
LCM | Advent/Claymore Enhanced Growth & Income Fund | Questions and Answers continued
life, the opportunity to profit from increases in the market value of the security covering the call option above the sum of the premium and the strike price of the call, but has retained the risk of loss should the price of the underlying security decline. The writer of an option has no control over the time when it may be required to fulfill its obligation as a writer of the option. Once an option writer has received an exercise notice, it cannot effect a closing purchase transaction in order to terminate its obligation under the option and must deliver the underlying security at the exercise price.
Lower Grade Securities. The Fund may invest an unlimited amount in lower grade securities. Investing in lower grade securities (commonly known as “junk bonds”) involves additional risks, including credit risk. Credit risk is the risk that one or more securities in the Fund’s portfolio will decline in price, or fail to pay interest or principal when due, because the issuer of the security experiences a decline in its financial status.
Leverage Risk. Certain risks are associated with the leveraging of common stock. Both the net asset value and the market value of shares of common stock may be subject to higher volatility and a decline in value.
Foreign Securities and Emerging Markets Risk. Investing in non-U.S. issuers may involve unique risks, such as currency, political, economic and market risk. In addition, investing in emerging markets entails additional risk including, but not limited to (1) news and events unique to a country or region (2) smaller market size, resulting in lack of liquidity and price volatility (3) certain national policies which may restrict the Fund’s investment opportunities.
Illiquid Investments. The Fund may invest without limit in illiquid securities. The Fund may also invest without limit in Rule 144A Securities. Although many of the Rule 144A Securities in which the Fund invests may be, in the view of the Investment Manager, liquid, if qualified institutional buyers are unwilling to purchase these Rule 144A Securities, they may become illiquid. Illiquid securities may be difficult to dispose of at a fair price at the times when the Fund believes it is desirable to do so. The market price of illiquid securities generally is more volatile than that of more liquid securities, which may adversely affect the price that the Fund pays for or recovers upon the sale of illiquid securities.
In addition to the risks described above, the Fund is also subject to: Interest Rate Risk, Credit Risk, Call Risk, Currency Risks, Management Risk, Strategic Transactions, Anti-Takeover Provisions, and Market Disruption Risk. Please see www.claymore.com/lcm for a more detailed discussion about Fund risks and considerations.
Semiannual Report | April 30, 2010 | 9
LCM | Advent/Claymore Enhanced Growth & Income Fund
Fund Summary | As of April 30, 2010 (unaudited) |
| Fund Statistics | ||
| Share Price | $12.01 | |
| Common Share Net Asset Value | $12.61 | |
| Premium/Discount to NAV | -4.76% | |
| Net Assets ($000) | $171,498 |
| Total Returns | ||
| (Inception 1/31/05) | Market | NAV |
| Six- Month non-annualized | 20.10% | 12.48% |
| One Year | 56.83% | 32.34% |
| Three Year - average annual | -5.59% | -6.21% |
| Five Year - average annual | 2.58% | 2.04% |
| Since Inception - average annual | -0.01% | 0.75% |
| % of Long Term | ||
| Top Ten Industries | Investments | |
| Telecommunications | 6.9% | |
| Banks | 5.9% | |
| Pharmaceuticals | 5.8% | |
| Oil & Gas | 5.7% | |
| Insurance | 5.6% | |
| Exchange-Traded Funds | 4.9% | |
| Biotechnology | 4.1% | |
| Healthcare-Products | 3.7% | |
| Mining | 3.5% | |
| Computers | 3.4% |
| % of Long Term | ||
| Top Ten Issuers | Investments | |
| Citigroup, Inc. | 2.5% | |
| EMC Corp. | 2.2% | |
| Bank of America Corp. | 2.0% | |
| International Game Technology | 1.9% | |
| Lucent Technologies Capital Trust I | 1.8% | |
| Wells Fargo & Co. | 1.6% | |
| Apria Healthcare Group, Inc. | 1.5% | |
| JPMorgan Chase & Co. | 1.5% | |
| Beckman Coulter, Inc. | 1.5% | |
| Clear Channel Worldwide Holdings, Inc. | 1.5% |
Past performance does not guarantee future results. All portfolio data is subject to change daily. For more current information, please visit www.claymore.com/lcm. The above summaries are provided for informational purposes only and should not be viewed as recommendations.
Share Price & NAV Performance
Portfolio Composition (% of Total Investments)
10 | Semiannual Report | April 30, 2010
LCM | Advent/Claymore Enhanced Growth & Income Fund
Portfolio of Investments | As of April 30, 2010 (unaudited) |
| Principal | |||
| Amount | Value |
| Long-Term Investments — 125.2% | |||||
| Convertible Bonds — 60.6% | |||||
| Agriculture – 1.3% | |||||
| CNY | 15,000,000 | China Green Holdings Ltd., Ser. CGHL, NR | |||
| 0.00%, 10/29/10 (Bermuda) (c ) | $ | 2,265,356 | |||
| Airlines – 0.6% | |||||
| $ | 1,000,000 | UAL Corp., CCC | |||
| 4.50%, 6/30/21 (a) | 1,011,200 | ||||
| Apparel – 1.2% | |||||
| HK$ | 13,000,000 | Yue Yuen Industrial Holdings Ltd., NR | |||
| 0.00%, 11/17/11 (Bermuda) | 2,007,181 | ||||
| Auto Manufacturers – 1.6% | |||||
| $ | 900,000 | Ford Motor Co., CCC | |||
| 4.25%, 11/15/16 (a) | 1,400,625 | ||||
| $ | 1,100,000 | Navistar International Corp., B | |||
| 3.00%, 10/15/14 (a) | 1,289,750 | ||||
| 2,690,375 | |||||
| Biotechnology – 4.6% | |||||
| $ | 1,075,000 | American Oriental Bioengineering, Inc., NR | |||
| 5.00%, 7/15/15 (e) | 874,781 | ||||
| $ | 1,000,000 | Amgen, Inc., A+ | |||
| 0.375%, 2/1/13 | 1,006,250 | ||||
| $ | 2,500,000 | Amylin Pharmaceuticals, Inc., NR | |||
| 3.00%, 6/15/14 (a) | 2,200,000 | ||||
| $ | 450,000 | Human Genome Sciences, Inc., NR | |||
| 2.25%, 10/15/11 | 830,812 | ||||
| $ | 2,450,000 | Life Technologies Corp., BBB- | |||
| 3.25%, 6/15/25 | 2,958,375 | ||||
| 7,870,218 | |||||
| Building Materials – 1.3% | |||||
| $ | 1,996,000 | Cemex SAB de CV, NR | |||
| 4.875%, 3/15/15 (Mexico) (a)(e) | 2,290,410 | ||||
| Chemicals – 0.4% | |||||
| HK$ | 4,450,000 | Sinofert Holdings Ltd., NR | |||
| 0.00%, 8/7/11 (Bermuda) | 770,611 | ||||
| Coal – 1.0% | |||||
| $ | 1,000,000 | Massey Energy Co., BB- | |||
| 3.25%, 8/1/15 (a) | 841,250 | ||||
| $ | 800,000 | Peabody Energy Corp., B+ | |||
| 4.75%, 12/15/41 (a) | 875,000 | ||||
| 1,716,250 | |||||
| Computers – 2.3% | |||||
| $ | 2,000,000 | EMC Corp., A- | |||
| 1.75%, 12/1/11 (a) | 2,522,500 | ||||
| $ | 700,000 | EMC Corp., A- | |||
| 1.75%, 12/1/13 (a) | 911,750 | ||||
| $ | 400,000 | Maxtor Corp./Seagate Technology, B | |||
| 2.375%, 8/15/12 (Cayman Islands) (a) | 466,000 | ||||
| 3,900,250 |
| Electrical Components & Equipment – 1.6% | |||||
| CNY | 15,900,000 | China High Speed Transmission Equipment Group Co., Ltd., Ser. CHIS, NR | |||
| 0.00%, 5/14/11 (Cayman Islands) (c ) | 2,789,990 | ||||
| Electronics – 1.5% | |||||
| JPY | 220,000,000 | Toshiba Corp., BBB | |||
| 0.00%, 7/21/11 (Japan) | 2,587,037 | ||||
| Engineering & Construction – 1.1% | |||||
| $ | 1,400,000 | Jaiprakash Associates Ltd., NR | |||
| 0.00%, 9/12/12 (India) | 1,830,500 | ||||
| Entertainment – 2.3% | |||||
| $ | 3,150,000 | International Game Technology, BBB | |||
| 3.25%, 5/1/14 (a)(e) | 4,012,312 | ||||
| Forest Products & Paper – 1.2% | |||||
| $ | 1,925,000 | Sino-Forest Corp., BB | |||
| 4.25%, 12/15/16 (Canada) (e) | 2,054,938 | ||||
| Healthcare – Products – 3.7% | |||||
| $ | 2,900,000 | Beckman Coulter, Inc., BBB | |||
| 2.50%, 12/15/36 | 3,240,750 | ||||
| $ | 1,950,000 | Hologic, Inc., BB- | |||
| 2.00%, 12/15/37 (f) | 1,755,000 | ||||
| $ | 1,130,000 | NuVasive, Inc., NR | |||
| 2.25%, 3/15/13 | 1,269,838 | ||||
| 6,265,588 | |||||
| Holdings Companies – Diversified – 0.9% | |||||
€ | 1,000,000 | Industrivarden AB, Ser. INDU, A | |||
| 2.50%, 2/27/15 (Sweden) | 1,524,447 | ||||
| Insurance – 1.1% | |||||
| $ | 1,625,000 | MGIC Investment Corp., CCC+ | |||
| 5.00%, 5/1/17 (a) | 1,807,813 | ||||
| Internet – 0.8% | |||||
| $ | 1,225,000 | Symantec Corp., NR | |||
| 1.00%, 6/15/13 (a) | 1,310,750 | ||||
| Iron/Steel – 0.8% | |||||
| $ | 1,200,000 | Steel Dynamics, Inc., BB+ | |||
| 5.125%, 6/15/14 (a) | 1,378,500 | ||||
| Lodging – 3.2% | |||||
| HK$ | 18,100,000 | Champion Path Holdings Ltd., NR | |||
| 0.00%, 10/28/15 (Hong Kong) | 2,590,338 | ||||
| $ | 2,611,000 | MGM Mirage, CCC+ | |||
| 4.25%, 4/15/15 (a)(e) | 2,842,727 | ||||
| 5,433,065 | |||||
| Media – 0.6% | |||||
| $ | 1,050,000 | XM Satellite Radio, Inc., CCC+ | |||
| 7.00%, 12/1/14 (e) | 1,119,563 | ||||
| Mining – 4.0% | |||||
| $ | 2,200,000 | Enercoal Resources Pte Ltd., NR | |||
| 9.25%, 8/5/14 (Indonesia) | 2,240,049 | ||||
| $ | 1,325,000 | Goldcorp, Inc., BBB+ | |||
| 2.00%, 8/1/14 (Canada) (a)(e) | 1,578,406 | ||||
| $ | 1,600,000 | Jaguar Mining, Inc., NR | |||
| 4.50%, 11/1/14 (Canada) (e) | 1,782,000 |
See notes to financial statements.
Semiannual Report | April 30, 2010 | 11
LCM | Advent/Claymore Enhanced Growth & Income Fund | Portfolio of Investments (unaudited) continued
| Principal | |||
| Amount | Value |
| Mining (continued) | |||||
| $ | 1,000,000 | Newmont Mining Corp., BBB+ | |||
| 1.25%, 7/15/14 | $ | 1,342,500 | |||
| 6,942,955 | |||||
| Miscellaneous Manufacturing – 2.4% | |||||
| $ | 1,000,000 | Danaher Corp., A+ | |||
| 0.00%, 1/22/21 (a) | 1,217,500 | ||||
| $ | 1,100,000 | Textron, Inc., Ser. TXT, Ser. BBB- | |||
| 4.50%, 5/1/13 (a) | 2,037,750 | ||||
| $ | 1,025,000 | Trinity Industries, Inc., BB- | |||
| 3.875%, 6/1/36 (a) | 876,375 | ||||
| 4,131,625 | |||||
| Oil and Gas – 3.8% | |||||
| $ | 2,000,000 | Carrizo Oil & Gas, Inc., NR | |||
| 4.375%, 6/1/28 (a) | 1,790,000 | ||||
| $ | 1,150,000 | Chesapeake Energy Corp., BB | |||
| 2.25%, 12/15/38 (a) | 849,562 | ||||
| $ | 1,700,000 | Goodrich Petroleum Corp., NR | |||
| 5.00%, 10/1/29 (a) | 1,538,500 | ||||
| $ | 2,300,000 | PetroBakken Energy Ltd., Ser. REGS, NR | |||
| 3.125%, 2/8/16 (Canada) | 2,286,478 | ||||
| 6,464,540 | |||||
| Oil and Gas Services – 1.3% | |||||
| $ | 1,050,000 | Cameron International Corp., BBB+ | |||
| 2.50%, 6/15/26 (a) | 1,324,312 | ||||
| $ | 560,000 | Core Laboratories LP, NR | |||
| 0.25%, 10/31/11 (Netherlands) (a) | 905,800 | ||||
| 2,230,112 | |||||
| Pharmaceuticals – 5.7% | |||||
| CHF | 1,265,000 | Actelion Finance SCA, NR | |||
| 0.00%, 11/22/11 (Switzerland) | 1,194,742 | ||||
| $ | 1,350,000 | Allergan, Inc., NR | |||
| 1.50%, 4/1/26 | 1,528,875 | ||||
| $ | 2,750,000 | Cephalon, Inc., NR | |||
| 2.50%, 5/1/14 (a) | 3,076,562 | ||||
| $ | 2,000,000 | Mylan, Inc., BB- | |||
| 1.25%, 3/15/12 (a) | 2,215,000 | ||||
| $ | 1,400,000 | Teva Pharmaceutical Finance Co. LLC, Ser. C, A- | |||
| 0.25%, 2/1/26 (Israel) (a) | 1,762,250 | ||||
| 9,777,429 | |||||
| Real Estate – 1.9% | |||||
| $ | 1,617,000 | Forest City Enterprises, Inc., B- | |||
| 5.00%, 10/15/16 (a)(e) | 2,150,610 | ||||
| HK$ | 8,900,000 | Soho China Ltd., NR | |||
| 3.75%, 7/2/14 (Cayman Islands) | 1,163,079 | ||||
| 3,313,689 | |||||
| Retail – 1.1% | |||||
| $ | 500,000 | Saks, Inc., B- | |||
| 2.00%, 3/15/24 (a) | 500,625 | ||||
| $ | 1,250,000 | Sonic Automotive, Inc., B- | |||
| 5.00%, 10/1/29 (a) | 1,389,063 | ||||
| 1,889,688 |
| Semiconductors – 2.6% | |||||
| $ | 750,000 | Intel Corp., A- | |||
| 3.25%, 8/1/39 (a)(e) | 917,812 | ||||
| $ | 2,000,000 | ON Semiconductor Corp., B+ | |||
| 2.625%, 12/15/26 (a) | 2,057,500 | ||||
| $ | 1,500,000 | Xilinx, Inc., BB | |||
| 3.125%, 3/15/37 (a) | 1,410,000 | ||||
| 4,385,312 | |||||
| Telecommunications – 3.9% | |||||
| $ | 2,500,000 | ADC Telecommunications, Inc., NR | |||
| 0.8308%, 6/15/13 (a)(d) | 2,212,500 | ||||
| $ | 1,000,000 | Arris Group, Inc., NR | |||
| 2.00%, 11/15/26 | 1,012,500 | ||||
| $ | 1,000,000 | CommScope, Inc., B | |||
| 3.25%, 7/1/15 (a) | 1,357,500 | ||||
| JPY | 68,000,000 | Softbank Corp., BB+ | |||
| 1.75%, 3/31/14 (Japan) | 892,033 | ||||
| $ | 1,000,000 | Virgin Media, Inc., B | |||
| 6.50%, 11/15/16 (a) | 1,246,250 | ||||
| 6,720,783 | |||||
| Utility – 0.8% | |||||
€ | 1,000,000 | International Power Jersey II Ltd., BB | |||
| 3.25%, 7/20/13 (United Kingdom) | 1,411,423 | ||||
| Total Convertible Bonds – 60.6% | |||||
| (Cost $95,028,492) | 103,903,910 | ||||
| Corporate Bonds – 22.2% | |||||
| Beverage – 1.8% | |||||
| $ | 3,000,000 | Constellation Brands, Inc., BB | |||
| 7.25%, 9/1/16 | 3,078,750 | ||||
| Chemicals – 1.2% | |||||
| $ | 2,000,000 | LBI Escrow Corp., BB | |||
| 8.00%, 11/1/17 (e) | 2,072,500 | ||||
| Diversified Financial Services – 1.9% | |||||
| $ | 1,350,000 | Capital One Capital V, BB | |||
| 10.25%, 8/15/39 | 1,620,000 | ||||
| $ | 1,500,000 | CIT Group Funding Co. of Delaware LLC, B+ | |||
| 10.25%, 5/1/14 | 1,560,000 | ||||
| 3,180,000 | |||||
| Electric – 1.5% | |||||
| $ | 2,500,000 | NRG Energy, Inc., BB- | |||
| 7.25%, 2/1/14 | 2,534,375 | ||||
| Food – 1.2% | |||||
| $ | 1,000,000 | Smithfield Foods, Inc., B- | |||
| 7.00%, 8/1/11 | 1,025,000 | ||||
| $ | 1,000,000 | Smithfield Foods, Inc., B+ | |||
| 10.00%, 7/15/14, Senior Secured Notes (e) | 1,122,500 | ||||
| 2,147,500 | |||||
| Healthcare-Products – 1.0% | |||||
| $ | 1,500,000 | Biomet, Inc., B- | |||
| 10.00%, 10/15/17 | 1,650,000 |
See notes to financial statements.
12 | Semiannual Report | April 30, 2010
LCM | Advent/Claymore Enhanced Growth & Income Fund | Portfolio of Investments (unaudited) continued
| Principal | |||
| Amount | Value |
| Healthcare – Services – 2.9% | |||||
| $ | 3,000,000 | Apria Healthcare Group, Inc., BB+ | |||
| 11.25%, 11/1/14 (e) | $ | 3,296,250 | |||
| $ | 1,500,000 | HCA, Inc., BB- | |||
| 9.25%, 11/15/16 | 1,621,875 | ||||
| 4,918,125 | |||||
| Insurance – 2.5% | |||||
| $ | 1,000,000 | AXA SA, BBB | |||
| 6.379%, 12/14/36 (France) (d)(e) | 890,000 | ||||
| $ | 1,850,000 | Liberty Mutual Group, Inc., BB | |||
| 10.75%, 6/15/58 (d)(e) | 2,155,250 | ||||
| $ | 1,000,000 | Metlife, Inc., BBB | |||
| 10.75%, 8/1/39 | 1,288,353 | ||||
| 4,333,603 | |||||
| Machinery-Diversified – 1.5% | |||||
| $ | 2,500,000 | Case New Holland, Inc., BB+ | |||
| 7.75%, 9/1/13 (e) | 2,631,250 | ||||
| Media – 2.8% | |||||
| $ | 3,000,000 | Clear Channel Worldwide Holdings, Inc., B | |||
| 9.25%, 12/15/17 (e) | 3,213,750 | ||||
| 500,000 | Univision Communications, Inc., B- | ||||
| 12.00%, 7/1/14 (e) | 552,500 | ||||
| $ | 1,000,000 | UPC Holding BV, B- | |||
| 9.875%, 4/15/18 (Netherlands) (e) | 1,055,000 | ||||
| 4,821,250 | |||||
| Pharmaceuticals – 1.0% | |||||
| $ | 1,665,000 | Axcan Intermediate Holdings, Inc., B | |||
| 12.75%, 3/1/16 | 1,748,250 | ||||
| Retail – 1.5% | |||||
| $ | 2,450,000 | Toys R Us Property Co. LLC, B+ | |||
| 8.50%, 12/1/17 (e) | 2,590,875 | ||||
| Telecommunications – 1.4% | |||||
| $ | 1,873,000 | iPCS, Inc., BB- | |||
| 2.37%, 5/1/13 (d) | 1,769,985 | ||||
| $ | 500,000 | NII Capital Corp., BB- | |||
| 10.00%, 8/15/16 (e) | 555,000 | ||||
| 2,324,985 | |||||
| Total Corporate Bonds – 22.2% | |||||
| (Cost $35,772,627) | 38,031,463 |
| Number | |||
| of Shares | Value |
| Convertible Preferred Stocks – 17.0% | |||||
| Agriculture – 1.1% | |||||
| 46,850 | Archer-Daniels-Midland Co., 6.25%, 2011 (a) | 1,855,260 | |||
| Auto Manufacturers – 0.9% | |||||
| 31,200 | Ford Motor Co. Capital Trust II, 6.50%, 2032 (a) | 1,525,680 | |||
| Banks – 5.9% | |||||
| 1,650 | Bank of America Corp., Ser. L, 7.25%, 2049 (a) | 1,620,283 | |||
| 26,070 | Citigroup, Inc., 7.50%, 2012 | 3,436,547 |
| 15,626 | Keycorp, Ser. A, 7.75%, 2049 (a) | 1,640,730 | ||
| 3,565 | Wells Fargo & Co., Ser. L, 7.50%, 2049 (a) | 3,515,090 | ||
| 10,212,650 | ||||
| Electric – 1.2% | ||||
| 31,050 | Great Plains Energy, Inc., 12.00%, 2012 | 2,035,327 | ||
| Food Products – 1.1% | ||||
| 155,600 | 2009 Dole Food Automatic Common Exchange Security Trust, | |||
| 7.00%, 2012 (e) | 1,830,727 | |||
| Insurance – 3.2% | ||||
| 103,049 | Hartford Financial Services Group, Inc., 7.25%, 2013 (a) | 2,733,890 | ||
| 103,775 | XL Capital Ltd., 10.75%, 2011 (Cayman Islands) (a) | 2,782,208 | ||
| 5,516,098 | ||||
| Oil & Gas – 0.9% | ||||
| 6,888 | Whiting Petroleum Corp., 6.25%, 2049 (a) | 1,517,771 | ||
| Real Estate – 0.5% | ||||
| 14,996 | Forest City Enterprises, Inc., Ser. A, 7.00%, 2049 (a) | 932,564 | ||
| Telecommunications – 2.2% | ||||
| 4,617 | Lucent Technologies Capital Trust I, 7.75%, 2017 (France) | 3,829,802 | ||
| Total Convertible Preferred Stocks – 17.0% | ||||
| (Cost $24,868,868) | 29,255,879 | |||
| Common Stocks — 13.6% | ||||
| Agriculture – 1.0% | ||||
| 21,000 | Lorillard, Inc. (a) | 1,645,770 | ||
| Banks – 0.4% | ||||
| 5,000 | Bank of America Corp. (a) | 89,150 | ||
| 20,000 | Sumitomo Mitsui Financial Group, Inc. (Japan) | 663,759 | ||
| 752,909 | ||||
| Biotechnology – 0.5% | ||||
| 30,000 | American Oriental Bioengineering, Inc. (b) | 121,500 | ||
| 35,000 | Amylin Pharmaceuticals, Inc. (a)(b) | 722,400 | ||
| 843,900 | ||||
| Computers – 1.9% | ||||
| 8,000 | Apple, Inc. (b) | 2,088,960 | ||
| 64,000 | EMC Corp. (a)(b) | 1,216,640 | ||
| 3,305,600 | ||||
| Electrical Components & Equipment – 0.2% | ||||
| 110,000 | China High Speed Transmission Equipment Co. Ltd. (Cayman Islands) | 264,374 | ||
| Engineering & Construction – 0.4% | ||||
| 12,500 | Fluor Corp. (a) | 660,500 | ||
| Entertainment – 0.0% | ||||
| 1,000 | International Game Technology (a) | 21,080 | ||
| Food – 0.5% | ||||
| 44,710 | Smithfield Foods, Inc. (a)(b) | 837,865 | ||
| Insurance – 0.1% | ||||
| 25,000 | MGIC Investment Corp. (a)(b) | 260,750 | ||
| Iron/Steel – 0.1% | ||||
| 2,700 | ArcelorMittal (Luxembourg) (a) | 104,841 |
See notes to financial statements.
Semiannual Report | April 30, 2010 | 13
LCM | Advent/Claymore Enhanced Growth & Income Fund | Portfolio of Investments (unaudited) continued
| Number | |||
| of Shares | Value |
| Lodging – 0.1% | ||||
| 30,820 | Morgans Hotel Group Co. (b) | $ | 261,045 | |
| Mining – 0.4% | ||||
| 2,000 | Freeport-McMoRan Copper & Gold, Inc. (a) | 151,060 | ||
| 30,000 | Xstrata PLC (United Kingdom) | 498,916 | ||
| 649,976 | ||||
| Miscellaneous Manufacturing – 1.6% | ||||
| 54,100 | Honeywell International, Inc. (a) | 2,568,127 | ||
| 7,000 | Textron, Inc. (a) | 159,880 | ||
| 2,000 | Trinity Industries, Inc. (a) | 49,780 | ||
| 2,777,787 | ||||
| Oil & Gas – 2.4% | ||||
| 27,500 | Chesapeake Energy Corp. (a) | 654,500 | ||
| 20,000 | Exxon Mobil Corp. (a) | 1,357,000 | ||
| 5,000 | Goodrich Petroleum Corp. (a)(b) | 84,650 | ||
| 25,900 | PetroBakken Energy Ltd. (Canada) | 705,515 | ||
| 65,000 | Valero Energy Corp. (a) | 1,351,350 | ||
| 4,153,015 | ||||
| Pharmaceuticals – 0.5% | ||||
| 1,000 | Cephalon, Inc. (a)(b) | 64,200 | ||
| 100,000 | Somaxon Pharmaceuticals, Inc. (b) | 719,000 | ||
| 1,000 | Teva Pharmaceutical Industries Ltd., ADR (Israel) (a) | 58,730 | ||
| 841,930 | ||||
| Retail – 0.9% | ||||
| 69,637 | RadioShack Corp. (a) | 1,500,677 | ||
| Semiconductors – 1.4% | ||||
| 80,000 | Intel Corp. (a) | 1,826,400 | ||
| 75,000 | ON Semiconductor Corp. (a)(b) | 595,500 | ||
| 2,000 | Xilinx, Inc. (a) | 51,560 | ||
| 2,473,460 | ||||
| Telecommunications – 1.2% | ||||
| 3,400 | ADC Telecommunications, Inc. (a)(b) | 27,234 | ||
| 5,000 | CommScope, Inc. (a)(b) | 162,900 | ||
| 10,000 | QUALCOMM, Inc. (a) | 387,400 | ||
| 49,000 | Verizon Communications, Inc. (a) | 1,415,610 | ||
| 1,993,144 | ||||
| Total Common Stocks – 13.6% | ||||
| (Cost $22,598,432) | 23,348,623 | |||
| Exchange-Traded Funds – 6.2% | ||||
| 132,000 | Financial Select Sector SPDR Fund (a) | 2,131,800 | ||
| 94,300 | Industrial Select Sector SPDR Fund (a) | 3,077,009 | ||
| 40,000 | iPATH S&P 500 VIX Short-Term Futures ETN (b) | 847,200 | ||
| 85,000 | PowerShares DB US Dollar Index Bullish Fund (b) | 2,035,750 | ||
| 40,100 | ProShares UltraShort Basic Materials (a) | 1,384,653 | ||
| 28,000 | ProShares UltraShort FTSE/Xinhua China 25 (a) | 1,146,040 | ||
| (Cost $10,224,931) | 10,622,452 |
| Preferred Stock – 3.3% | ||||||
| Banks – 1.0% | ||||||
| 2,000 | Ally Financial, 7.00%, (e) | 1,698,688 | ||||
| Diversified Financial Services – 2.3% | ||||||
| 75,000 | Citigroup Capital XII, 8.50% | 1,953,750 | ||||
| 80,000 | JPMorgan Chase Capital XXIX, 6.70% | 1,940,000 | ||||
| 3,893,750 | ||||||
| Total Preferred Stock – 3.3% | ||||||
| (Cost $5,654,000) | 5,592,438 | |||||
| Warrants – 2.3% | ||||||
| 676,513 | Bank of America Corp. (a) | 2,557,219 | ||||
| 96,659 | JPMorgan Chase & Co. (a) | 1,342,594 | ||||
| (Cost $2,913,758) | 3,899,813 | |||||
| Total Long-Term Investments – 125.2% | ||||||
| (Cost $197,061,108) | 214,654,578 | |||||
| Contracts | ||||||
| (100 shares | Expiration | Exercise | ||||
| per contract) | Options Purchased(b) | Date | Price | Value | ||
| Call Options Purchased – 0.5% | ||||||
| 1,000 | General Electric Co. | May 2010 | 20.00 | 16,000 | ||
| 1,000 | Exxon Mobil Corp. (a) | July 2010 | 60.00 | 830,000 | ||
| (Cost $850,460) | 846,000 | |||||
| Total Investments – 125.7% | ||||||
| (Cost $197,911,568) | 215,500,578 | |||||
| Other Assets in excess of Liabilities – 3.6% | 6,115,264 | |||||
| Total Options Written (Premiums received $104,950) – (0.1%) | (117,878) | |||||
| Borrowings – (29.2%) | (50,000,000) | |||||
| Net Assets – 100.0% | $ | 171,497,964 |
AB – Stock Company
ADR – American Depositary Receipt
BV – Limited Liability Company
LLC – Limited Liability Corp.
LP – Limited Partnership
PLC – Public Limited Company
Pte – Public Trading Enterprise
SA – Corporation
SAB de CV – Publicly Traded Company
SCA – Limited Partnership
| (a) | All or a portion of this security position represents cover (directly or through conversion rights) for outstanding options written. |
| (b) | Non-income producing security. |
| (c) | The reference entity is denominated in Chinese Yuan, but traded in U.S. dollars. |
| (d) | Variable rate or floating rate security. The rate shown is as of April 30, 2010. |
| (e) | Securities are exempt from registration under Rule 144A of the Securities Act of 1933. These securities may be resold in transactions exempt from registration, normally to qualified institutional buyers. At April 30, 2010, these securities amounted to 25.2% of net assets. |
| (f) | Security becomes a 0% coupon, accreting bond after December 15, 2013 with a 2.0% principal accretion rate. Ratings shown are per Standard & Poor’s. Securities classified as NR are not rated by Standard & Poors. |
See notes to financial statements.
14 | Semiannual Report | April 30, 2010
LCM | Advent/Claymore Enhanced Growth & Income Fund | Portfolio of Investments (unaudited) continued
| Contracts | |||||||||
| (100 shares | Expiration | Exercise | Market | ||||||
| per contract) | Call Options Written(a) | Date | Price | Value | |||||
| 49 | ADC Telecommunications, Inc. | May 2010 | $ | 7.50 | $ | 3,553 | |||
| 50 | Amylin Pharmaceuticals, Inc. | June 2010 | 24.00 | 3,250 | |||||
| 27 | ArcelorMittal | June 2010 | 46.00 | 1,080 | |||||
| 10 | Archer-Daniels-Midland Co. | May 2010 | 31.00 | 75 | |||||
| 50 | Bank of America Corp. | May 2010 | 20.00 | 300 | |||||
| 40 | Cameron International Corp. | May 2010 | 50.00 | 400 | |||||
| 10 | Carrizo Oil & Gas, Inc. | May 2010 | 30.00 | 50 | |||||
| 3 | Cemex SAB de CV | June 2010 | 14.00 | 45 | |||||
| 10 | Cephalon, Inc. | May 2010 | 70.00 | 400 | |||||
| 50 | Chesapeake Energy Corp. | May 2010 | 25.00 | 2,100 | |||||
| 50 | CommScope, Inc. | May 2010 | 30.00 | 16,000 | |||||
| 10 | CommScope, Inc. | May 2010 | 35.00 | 350 | |||||
| 10 | Core Laboratories LP | June 2010 | 155.00 | 3,300 | |||||
| 10 | Danaher Corp. | May 2010 | 85.00 | 1,550 | |||||
| 100 | EMC Corp. | May 2010 | 21.00 | 400 | |||||
| 20 | Exxon Mobil Corp. | June 2010 | 75.00 | 400 | |||||
| 100 | Financial Select Sector SPDR Fund | May 2010 | 18.00 | 200 | |||||
| 50 | Fluor Corp. | May 2010 | 50.00 | 19,500 | |||||
| 20 | Ford Motor Co. | May 2010 | 15.00 | 140 | |||||
| 20 | Forest City Enterprises, Inc. | June 2010 | 17.50 | 450 | |||||
| 20 | Freeport-McMoRan Copper & Gold, Inc. | August 2010 | 90.00 | 3,900 | |||||
| 25 | Goldcorp, Inc. | May 2010 | 42.00 | 5,475 | |||||
| 25 | Goodrich Petroleum Corp. | May 2010 | 20.00 | 375 | |||||
| 10 | Hartford Financial Services Group, Inc. | June 2010 | 35.00 | 150 | |||||
| 50 | Honeywell International, Inc. | May 2010 | 48.00 | 4,000 | |||||
| 100 | Industrial Select Sector SPDR Fund | June 2010 | 34.00 | 4,200 | |||||
| 100 | Intel Corp. | May 2010 | 25.00 | 500 | |||||
| 10 | International Game Technology | May 2010 | 20.00 | 1,490 | |||||
| 10 | JPMorgan Chase & Co. | May 2010 | 50.00 | 30 | |||||
| 20 | KeyCorp | May 2010 | 9.00 | 1,000 | |||||
| 50 | Lorillard, Inc. | May 2010 | 85.00 | 625 | |||||
| 20 | Massey Energy Co. | May 2010 | 46.00 | 500 | |||||
| 50 | MGIC Investment Corp. | June 2010 | 12.50 | 1,850 | |||||
| 20 | MGM Mirage | May 2010 | 17.00 | 1,120 | |||||
| 25 | Mylan, Inc. | May 2010 | 24.00 | 150 | |||||
| 10 | Navistar International Corp. | May 2010 | 55.00 | 175 | |||||
| 100 | ON Semiconductor Corp. | June 2010 | 10.00 | 1,000 | |||||
| 20 | Peabody Energy Corp. | May 2010 | 49.00 | 1,740 | |||||
| 10 | ProShares UltraShort Basic Materials | May 2010 | 49.00 | 300 | |||||
| 40 | ProShares UltraShort FTSE/Xinhua China 25 | May 2010 | 50.00 | 2,000 | |||||
| 100 | QUALCOMM, Inc. | May 2010 | 40.00 | 4,100 | |||||
| 75 | RadioShack Corp. | May 2010 | 26.00 | 750 | |||||
| 20 | Saks, Inc. | May 2010 | 10.00 | 1,000 | |||||
| 10 | Maxtor Corp./Seagate Technology | May 2010 | 20.00 | 200 | |||||
| 25 | Smithfield Foods, Inc. | May 2010 | 22.50 | 125 | |||||
| 25 | Sonic Automotive, Inc. | May 2010 | 12.50 | 500 |
| 20 | Steel Dynamics, Inc. | June 2010 | 19.00 | 250 | |||
| 10 | Symantec Corp. | May 2010 | 19.00 | 150 | |||
| 10 | Teva Pharmaceutical Industries Ltd. | June 2010 | 65.00 | 320 | |||
| 100 | Textron, Inc. | May 2010 | 25.00 | 3,000 | |||
| 20 | Trinity Industries, Inc. | May 2010 | 22.50 | 5,400 | |||
| 10 | UAL Corp. | May 2010 | 25.00 | 310 | |||
| 50 | Valero Energy Corp. | May 2010 | 20.00 | 6,100 | |||
| 10 | Verizon Communications, Inc. | May 2010 | 31.00 | 30 | |||
| 10 | Virgin Media, Inc. | May 2010 | 20.00 | 150 | |||
| 10 | Wells Fargo & Co. | May 2010 | 34.00 | 570 | |||
| 10 | Whiting Petroleum Corp. | June 2010 | 95.00 | 2,600 | |||
| 20 | Xilinx, Inc. | May 2010 | 29.00 | 150 | |||
| 10 | XL Capital Ltd. | May 2010 | 22.00 | 50 |
| Total Call Options Written | |||||||
| (Premiums received $82,180) | 109,878 |
Put Options Written(a) | |||||||
| 1,000 | General Electric Co. | May 2010 | 17.00 | 8,000 | |||
| (Premiums received $22,770) |
| Total Options Written | ||||||||
| (Premiums received $104,950) | $ | 117,878 |
(a) Non-income producing security.
See notes to financial statements.
Semiannual Report | April 30, 2010 | 15
LCM | Advent/Claymore Enhanced Growth & Income Fund
Statement of Assets and Liabilities | April 30, 2010 (unaudited) |
| Assets | ||||
| Investments, at value (cost $197,911,568) | $ | 215,500,578 | ||
| Cash & Cash Equivalents | 7,414,208 | |||
| Receivable for securities sold | 2,340,646 | |||
| Dividends and interest receivable | 1,676,918 | |||
| Foreign currency, at value (cost $487,813) | 488,311 | |||
| Unrealized appreciation on foreign exchange currency contracts | 251,946 | |||
| Tax Reclaims receivable | 56,281 | |||
| Other assets | 23,645 | |||
| Total assets | 227,752,533 | |||
| Liabilities | ||||
| Borrowings | 50,000,000 | |||
| Payable for securities purchased | 5,797,474 | |||
| Options written, at value (premiums received of $104,950) | 117,878 | |||
| Investment Management fee payable | 93,016 | |||
| Investment Advisory fee payable | 89,368 | |||
| Administrative fee payable | 4,805 | |||
| Interest due on borrowings | 3,715 | |||
| Unrealized depreciation on foreign exchange currency contracts | 100 | |||
| Accrued expenses and other liabilities | 148,213 | |||
| Total liabilities | 56,254,569 | |||
| Net Assets | $ | 171,497,964 | ||
| Composition of Net Assets | ||||
| Common stock, $0.001 par value per share; unlimited number of shares authorized, 13,603,025 shares issued and outstanding | $ | 13,603 | ||
| Additional paid-in capital | 243,316,208 | |||
| Accumulated net realized loss on investments, options, swaps and foreign currency transactions | (84,725,492 | ) | ||
| Accumulated net unrealized appreciation on investments, options and foreign currency translation | 17,828,836 | |||
| Distributions in excess of net investment income | (4,935,191 | ) | ||
| Net Assets | $ | 171,497,964 | ||
| Net Asset Value | ||||
| (based on 13,603,025 common shares outstanding) | $ | 12.61 | ||
See notes to financial statements.
16 | Semiannual Report | April 30, 2010
LCM | Advent/Claymore Enhanced Growth & Income Fund
Statement of Operations | For the six months ended April 30, 2010 (unaudited) |
| Investment Income | ||||||||
| Interest | $ | 2,432,894 | ||||||
| Dividends (net of foreign withholding taxes of $1,071) | 1,319,702 | |||||||
| Total income | $ | 3,752,596 | ||||||
| Expenses | ||||||||
| Investment Management fee | 462,789 | |||||||
| Investment Advisory fee | 444,641 | |||||||
| Line of credit fee | 144,479 | |||||||
| Professional fees | 92,461 | |||||||
| Trustees’ fees and expenses | 74,352 | |||||||
| Fund accounting | 32,782 | |||||||
| Printing expense | 31,471 | |||||||
| Administration fee | 24,758 | |||||||
| Custodian fee | 20,368 | |||||||
| Insurance | 11,472 | |||||||
| NYSE listing fee | 10,498 | |||||||
| Transfer agent fee | 9,511 | |||||||
| Miscellaneous | 6,815 | |||||||
| Interest Expense | 119,052 | |||||||
| Total expenses | 1,485,449 | |||||||
| Net investment income | 2,267,147 | |||||||
| Realized and Unrealized Gain (Loss) on Investments, Options and Foreign Currency Transactions | ||||||||
| Net realized gain (loss) on: | ||||||||
| Investments | 11,937,201 | |||||||
| Options | (537,260 | ) | ||||||
| Foreign currency transactions | 37,813 | |||||||
| Change in net unrealized appreciation (depreciation) on: | ||||||||
| Investments | 5,951,511 | |||||||
| Options | (552,126 | ) | ||||||
| Foreign currency translation | 206,308 | |||||||
| Net realized and unrealized gain on investments, options and foreign currency transactions | 17,043,447 | |||||||
| Net Increase in Net Assets Resulting from Operations | $ | 19,310,594 | ||||||
See notes to financial statements.
Semiannual Report | April 30, 2010 | 17
LCM | Advent/Claymore Enhanced Growth & Income Fund
Statement of Changes in Net Assets |
For the Six | For the | |||||||
Months ended | Year Ended | |||||||
April 30, 2010(unaudited) | October 31, 2009 | |||||||
| Change in Net Assets from Operations | ||||||||
| Net investment income | $ | 2,267,147 | $ | 5,333,606 | ||||
| Net realized gain (loss) on investments, options, swaps and foreign currency transactions | 11,437,754 | (47,458,544 | ) | |||||
| Net change in unrealized appreciation (depreciation) on investments, options and | ||||||||
| foreign currency translation | 5,605,693 | 68,646,666 | ||||||
| Net increase in net assets resulting from operations | 19,310,594 | 26,521,728 | ||||||
| Distributions to Common Shareholders from | ||||||||
| Net investment income | (7,182,397 | ) | (9,090,807 | ) | ||||
| Return of Capital | – | (6,443,848 | ) | |||||
| Total dividends and distributions to common shareholders | (7,182,397 | ) | (15,534,655 | ) | ||||
| Total increase in net assets | 12,128,197 | 10,987,073 | ||||||
| Net Assets | ||||||||
| Beginning of year | 159,369,767 | 148,382,694 | ||||||
| End of year (including distributions in excess of net investment income of | ||||||||
| $(4,935,191) and $(19,941), respectively) | $ | 171,497,964 | $ | 159,369,767 | ||||
See notes to financial statements.
18 | Semiannual Report | April 30, 2010
LCM | Advent/Claymore Enhanced Growth & Income Fund
Statement of Cash Flows | For the six months ended April 30, 2010 (unaudited) |
| Cash Flows from Operating Activities: | ||||
| Net increase in net assets resulting from operations | $ | 19,310,594 | ||
Adjustments to Reconcile Net Increase in Net Assets Resulting from Operations to Net Cash Used in Operating and Investing Activities: | ||||
| Net change in unrealized appreciation on investments | (5,951,511 | ) | ||
| Net change in unrealized depreciation on options | 552,126 | |||
| Net change in unrealized appreciation on foreign currency transactions | (206,308 | ) | ||
| Net realized gain on investments | (11,937,201 | ) | ||
| Net realized loss on options | 537,260 | |||
| Net realized gain on foreign currency transactions | (37,813 | ) | ||
| Purchase of long-term investments | (165,410,961 | ) | ||
| Proceeds from sale of long-term investments | 113,219,905 | |||
| Cost of written options assigned and closed | (528,053 | ) | ||
| Net Amortization of premium and other | (1,886,173 | ) | ||
| Decrease in receivable for securities sold | 5,764,992 | |||
| Increase in dividends and interest receivable | (441,999 | ) | ||
| Decrease in foreign currency | 12,951 | |||
| Decrease in tax reclaims receivable | 25,065 | |||
| Decrease in other assets | 15,814 | |||
| Increase in payable for investments purchased | 4,805,528 | |||
| Increase in interest due on borrowings | 3,715 | |||
| Premiums received on call options written | 626,371 | |||
| Increase in investment management fee payable | 22,282 | |||
| Increase in investment advisory fee payable | 21,407 | |||
| Increase in administrative fee payable | 1,067 | |||
| Decrease in accrued expenses and other liabilities | (19,462 | ) | ||
| Net Cash Provided in Operating and Investing Activities | (41,500,404 | ) | ||
| Cash Flows From 4Financing Activities: | ||||
| Dividends paid to common shareholders | (7,182,397 | ) | ||
| Proceeds from borrowings | 50,000,000 | |||
| Net Cash Provided by Financing Activities | 42,817,603 | |||
| Net increase in cash | 1,317,199 | |||
| Cash at Beginning of Period | 6,097,009 | |||
| Cash at End of Period | $ | 7,414,208 | ||
| Supplemental Disclosure of Cash Flow Information: Cash paid during the period for interest | $ | 115,337 | ||
See notes to financial statements.
Semiannual Report | April 30, 2010 | 19
LCM | Advent/Claymore Enhanced Growth & Income Fund
Financial Highlights |
| Per share operating performance for a common share outstanding throughout the period | For the Six Months Ended April 30, 2010 (unaudited) | For the Year Ended October 31, 2009 | For the Year Ended October 31, 2008 | For the Year Ended October 31, 2007 | For the Year Ended October 31, 2006 | For the Period January 31,2005 through October 31, 2005 |
| Net asset value, beginning of period | $ | 11.72 | $ | 10.91 | $ | 20.09 | $ | 19.41 | $ | 18.51 | $ | 19.10 | (a) | |||||||||||
| Income from investment operations | ||||||||||||||||||||||||
Net investment income (b) | 0.17 | 0.39 | 0.47 | 0.44 | 0.58 | 0.47 | ||||||||||||||||||
Net realized and unrealized gain (loss) on investments, options, swaps and foreign currency transactions | 1.25 | 1.56 | (8.05 | ) | 1.84 | 1.92 | (0.22 | ) | ||||||||||||||||
| Total from investment operations | 1.42 | 1.95 | (7.58 | ) | 2.28 | 2.50 | 0.25 | |||||||||||||||||
Common shares’ offering expenses charged to paid-in capital | – | – | – | – | – | (0.04 | ) | |||||||||||||||||
| Distributions to Common Shareholders | ||||||||||||||||||||||||
| Net investment income | (0.53 | ) | (0.67 | ) | (0.90 | ) | (1.60 | ) | (1.60 | ) | (0.80 | ) | ||||||||||||
| Return of capital | – | (0.47 | ) | (0.70 | ) | – | – | – | ||||||||||||||||
Total dividends and distributions to Common Shareholders | (0.53 | ) | (1.14 | ) | (1.60 | ) | (1.60 | ) | (1.60 | ) | (0.80 | ) | ||||||||||||
| Net asset value, end of period | $ | 12.61 | $ | 11.72 | $ | 10.91 | $ | 20.09 | $ | 19.41 | $ | 18.51 | ||||||||||||
| Market value, end of period | $ | 12.01 | $ | 10.48 | $ | 8.97 | $ | 17.46 | $ | 18.78 | $ | 16.83 | ||||||||||||
Total investment return (c) | ||||||||||||||||||||||||
| Net asset value | 12.48 | % | 19.74 | % | -40.37 | % | 12.24 | % | 14.11 | % | 1.12 | % | ||||||||||||
| Market value | 20.10 | % | 34.17 | % | -42.88 | % | 1.08 | % | 22.20 | % | -12.08 | % | ||||||||||||
| Ratios and supplemental data | ||||||||||||||||||||||||
| Net assets, end of period (thousands) | $ | 171,498 | $ | 159,370 | $ | 148,383 | $ | 273,288 | $ | 263,648 | $ | 251,349 | ||||||||||||
Ratios to Average Net Assets applicable to Common Shares: | ||||||||||||||||||||||||
| Operating Expenses | 1.60 | %(e) | 1.42 | % | 1.34 | % | 1.26 | % | 1.29 | % | 1.38 | %(e) | ||||||||||||
Interest Expense (d) | 0.15 | %(e) | N/A | N/A | N/A | N/A | N/A | |||||||||||||||||
| Total Expenses | 1.75 | %(e) | N/A | N/A | N/A | N/A | N/A | |||||||||||||||||
Net investment income, including interest expense | 2.79 | %(e) | 3.68 | % | 2.91 | % | 2.21 | % | 3.09 | % | 3.37 | %(e) | ||||||||||||
Portfolio turnover rate (f) | 64 | % | 236 | % | 192 | % | 181 | % | 415 | % | 246 | % | ||||||||||||
| Senior Indebtedness | ||||||||||||||||||||||||
Total Borrowings outstanding (in thousands) | $ | 50,000 | N/A | N/A | N/A | N/A | N/A | |||||||||||||||||
Asset Coverage per $1000 of indebtedness (g) | $ | 4,430 | N/A | N/A | N/A | N/A | N/A |
| * | Commencement of investment operations. |
| (a) | Before deduction of offering expenses charged to capital. |
| (b) | Based on average shares outstanding during the period. |
| (c) | Total investment return is calculated assuming a purchase of a common share at the beginning of the period and a sale on the last day of the period reported either at net asset value (“NAV”) or market price per share. Dividends and distributions are assumed to be reinvested at NAV for NAV returns or the prices obtained under the Fund’s Dividend Reinvestment Plan for market value returns. Total investment return does not reflect brokerage commissions. A return calculated for a period of less than one year is not annualized. |
| (d) | Interest expense ratio relates to interest associated with borrowings. |
| (e) | Annualized. |
| (f) | Portfolio turnover is not annualized for periods less than one year. |
| (g) | Calculated by subtracting the Fund’s total liabilities (not including the borrowings) from the Fund’s total assets and dividing by the total borrowings. |
See notes to financial statements.
20 | Semiannual Report | April 30, 2010
LCM | Advent/Claymore Enhanced Growth & Income Fund
Notes to Financial Statements | April 30, 2010 (unaudited) |
Note 1 – Organization:
Advent/Claymore Enhanced Growth & Income Fund (the “Fund”) was organized as a Delaware statutory trust on January 30, 2004. The Fund is registered as a diversified, closed-end management investment company under the Investment Company Act of 1940, as amended.
The Fund’s primary investment objective is to provide current income and current gains from trading in securities, with a secondary objective of long-term capital appreciation. The Fund will pursue its investment objectives by investing its assets in dividend and interest paying equity securities, convertible securities and non-convertible high-yield securities. Also, in pursuit of the Fund’s primary investment objective, the Fund intends to engage in an option strategy of writing (selling) covered call options on at least 50% of the securities held in the portfolio.
Note 2 – Accounting Policies:
The preparation of the financial statements in accordance with U.S. generally accepted accounting principles requires management to make estimates and assumptions that affect the reported amounts and disclosures in the financial statements. Actual results could differ from these estimates.
The following is a summary of significant accounting policies followed by the Fund.
(a) Valuation of Investments
Equity securities listed on an exchange are valued at the last reported sale price on the primary exchange on which they are traded. Equity securities traded on an exchange for which there are no transactions on a given day are valued at the mean of the closing bid and asked prices. Securities traded on NASDAQ are valued at the NASDAQ Official Closing Price. Equity securities not listed on a securities exchange or NASDAQ are valued at the mean of the closing bid and asked prices. Debt securities are valued by independent pricing services or dealers using the closing bid prices for such securities or, if such prices are not available, at prices for securities of comparable maturity, quality and type. Futures contracts are valued using the settlement price established each day on the exchange on which they are traded. Exchange-traded options are valued at the closing price, if traded that day. If not traded, they are valued at the mean of the bid and asked prices on the primary exchange on which they are traded. For those securities where quotations or prices are not available, valuations are determined in accordance with procedures established in good faith by the Board of Trustees. Short-term securities with remaining maturities of 60 days or less are valued at amortized cost, which approximates market value.
For those securities where quotations or prices are not available, the valuations are determined in accordance with procedures established in good faith by the Board of Trustees. Valuations in accordance with these procedures are intended to reflect each security’s (or asset’s) “fair value”. Such “fair value” is the amount that the Fund might reasonably expect to receive for the security (or asset) upon its current sale. Each such determination should be based on a consideration of all relevant factors, which are likely to vary from one pricing context to another. Examples of such factors may include, but are not limited to: (i) the type of security, (ii) the initial cost of the security, (iii) the existence of any contractual restrictions on the security’s disposition, (iv) the price and extent of public trading in similar securities of the issuer or of comparable companies, (v) quotations or evaluated prices from broker-dealers and/or pricing services, (vi) information obtained from the issuer, analysts, and/or the appropriate stock exchange (for exchange traded securities), (vii) an analysis of the company’s financial statements, and (viii) an evaluation of the forces that influence the issuer and the market(s) in which the security is purchased and sold (e.g. the existence of pending merger activity, public offerings or tender offers that might affect the value of the security). There were no securities fair valued in accordance with such procedures established by the Board of Trustees at April 30, 2010.
GAAP requires disclosure of fair valuation measurements as of each measurement date. In compliance with GAAP, the Fund follows a fair value hierarchy that distinguishes between market data obtained from independent sources (observable inputs) and the Fund’s own market assumptions (unobservable inputs). These inputs are used in determining the value of the Fund’s investments and summarized in the following fair value hierarchy:
Level 1 – quoted prices in active markets for identical securities
Level 2 – quoted prices in inactive markets or other significant observable inputs (e.g. quoted prices for similar securities; interest rates; prepayment speed; credit risk; yield curves)
Level 3 – significant unobservable inputs (e.g. discounted cash flow analysis; non-market based methods used to determine fair value)
Observable inputs are those based upon market data obtained from independent sources, and unobservable inputs reflect the Fund’s own assumptions based on the best information available. The various input levels are not an indication of the risk associated with investing in those securities.
Semiannual Report | April 30, 2010 | 21
LCM | Advent/Claymore Enhanced Growth & Income Fund | Notes to Financial Statements (unaudited) continued
The following table represents the Fund’s investments carried on the Statement of Assets and Liabilities by caption and by level within the fair value hierarchy as of April 30, 2010:
| Description | Quoted Prices in Active Markets for Identical Assets (Leve1) | Significant Other Observable Inputs (Level 2) | Significant Unobservable Inputs (Level 3) | Total | ||||||||||||
| (value in $000s) | ||||||||||||||||
| Assets: | ||||||||||||||||
| Convertible Bonds | $ | – | $ | 103,904 | $ | – | $ | 103,904 | ||||||||
| Convertible Preferred Stocks: | ||||||||||||||||
| Agriculture | 1,855 | – | – | 1,855 | ||||||||||||
| Auto Manufacturers | 1,526 | – | – | 1,526 | ||||||||||||
| Banks | 10,213 | – | – | 10,213 | ||||||||||||
| Electric | 2,035 | – | – | 2,035 | ||||||||||||
| Food Products | – | 1,831 | – | 1,831 | ||||||||||||
| Insurance | 5,516 | – | – | 5,516 | ||||||||||||
| Oil & Gas | 1,518 | – | – | 1,518 | ||||||||||||
| Real Estate | – | 932 | – | 932 | ||||||||||||
| Telecommunications | – | 3,830 | – | 3,830 | ||||||||||||
| Common Stocks | 23,349 | – | – | 23,349 | ||||||||||||
| Corporate Bonds | – | 38,031 | – | 38,031 | ||||||||||||
| Exchange-Traded Funds | 10,622 | – | – | 10,622 | ||||||||||||
| Options Purchased | 846 | – | – | 846 | ||||||||||||
| Preferred Stock: | ||||||||||||||||
| Banks | – | 1,699 | – | 1,699 | ||||||||||||
| Diversified Financial Services | 3,894 | – | – | 3,894 | ||||||||||||
| Warrants | 3,900 | – | – | 3,900 | ||||||||||||
| Foreign Exchange | ||||||||||||||||
| Currency Contracts | – | 252 | – | 252 | ||||||||||||
| Total | $ | 65,274 | $ | 150,479 | $ | – | $ | 215,753 | ||||||||
| Liabilities: | ||||||||||||||||
| Options Written | $ | 118 | $ | – | $ | – | $ | 118 | ||||||||
Foreign Exchange Currency Contracts | – | – | – | – | ||||||||||||
| Total | $ | 118 | $ | – | $ | – | $ | 118 | ||||||||
(b) Investment Transactions and Investment Income
Investment transactions are accounted for on the trade date. Realized gains and losses on investments are determined on the identified cost basis. Dividend income is recorded on the ex-dividend date and interest income is recorded on an accrual basis. Discounts or premiums on corporate debt securities purchased are accreted or amortized to interest income over the lives of the respective securities using the effective interest method.
(c) Currency Translation
Assets and liabilities denominated in foreign currencies are translated into U.S. dollars at the mean of the bid and asked price of respective exchange rates on the last day of the period. Purchases and sales of investments and income and expenses denominated in foreign currencies are translated at the exchange rate on the date of the transaction.
The Fund does not isolate that portion of the results of operations resulting from changes in foreign exchange rates on investments from the fluctuations arising from changes in market prices of securities held. Such fluctuations are included with the net realized and unrealized gain or loss from investments.
22 | Semiannual Report | April 30, 2010
LCM | Advent/Claymore Enhanced Growth & Income Fund | Notes to Financial Statements (unaudited) continued
Foreign exchange realized gain or loss resulting from holding of a foreign currency, expiration of a currency exchange contract, difference in exchange rates between the trade date and settlement date of an investment purchased or sold, and the difference between dividends actually received compared to the amount shown in the Fund’s accounting records on the date of receipt is shown as net realized gains or losses on foreign currency transactions in the Fund’s Statement of Operations.
Foreign exchange unrealized gain or loss on assets and liabilities, other than investments, is shown as unrealized appreciation (depreciation) on foreign currency translation in the Fund’s Statement of Operations.
(d) Covered Call Options
The Fund intends to pursue its primary objective by employing an option strategy of writing (selling) covered call options on at least 50% of the securities held in the portfolio of the Fund. The Fund seeks to produce a high level of current income and gains generated from option writing premiums and, to a lesser extent, from dividends.
When an option is written, the premium received is recorded as an asset with an equal liability and is subsequently marked to market to reflect the current market value of the option written. These liabilities are reflected as options written in the Statement of Assets and Liabilities. Premiums received from writing options which expire unexercised are recorded on the expiration date as a realized gain. The difference between the premium received and the amount paid on effecting a closing purchase transaction, including brokerage commissions, is also treated as a realized gain, or if the premium is less than the amount paid for the closing purchase transactions, as a realized loss. If a call option is exercised, the premium is added to the proceeds from the sale of the underlying security in determining whether there has been a realized gain or loss.
(e) Swaps
A swap is an agreement to exchange the return generated by one instrument for the return generated by another instrument. The Fund may enter into swap agreements to manage its exposure to interest rates and/or credit risk or to generate income. The swaps are valued daily at current market value and any unrealized gain or loss is included in the Statement of Assets and Liabilities. Gain or loss is realized upon periodic payments and the ultimate termination of the swap and is equal to the difference between the Fund’s basis in the swap and the proceeds of the closing transaction, including any fees. During the period that the swap agreement is open, the Fund may be subject to risk from the potential inability of the counterparty to meet the terms of the agreement. The swaps involve elements of both market and credit risk in excess of the amounts reflected on the Statement of Assets and Liabilities. Upon termination of a swap agreement, a payable to or receivable from swap counterparty is established on the Statement of Assets and Liabilities to reflect the net gain/loss, including interest income/expense, on terminated swap positions, of such amounts with the counterparty upon settlement according to the terms of the swap agreement.
Realized gain (loss) upon termination of swap contracts is recorded on the Statement of Operations. Fluctuations in the value of swap contracts are recorded as a component of net change in unrealized appreciation (depreciation) of swap contracts. Net periodic payments received by the Fund are included as part of realized gains (losses) and, in the case of accruals for periodic payments, are included as part of unrealized appreciation (depreciation) on the Statement of Operations. There were no open swap agreements at April 30, 2010.
(f) Forward Exchange Currency Contracts
The Fund may enter into forward exchange currency contracts in order to hedge its exposure to the change in foreign currency exchange rates on its foreign portfolio holdings, to hedge certain firm purchases and sales commitments denominated in foreign currencies and for investment purposes. Fluctuations in the value of open forward exchange currency contracts are recorded for financial reporting purposes as unrealized appreciation and depreciation by the Fund.
Forward exchange currency contracts involve elements of both market and credit risk in excess of the amounts reflected on the Statement of Assets and Liabilities.
(g) Concentration of Risk
It is the Fund’s policy to invest a significant portion of its assets in convertible securities. Although convertible securities do derive part of their value from that of the securities into which they are convertible, they are not considered derivative financial instruments. However, certain of the Fund’s investments include features which render them more sensitive to price changes in their underlying securities. Consequently, this exposes the Fund to greater downside risk than traditional convertible securities, but still less than that of the underlying common stock.
(h) Distributions to Shareholders
The Fund declares and pays quarterly dividends to common shareholders. These dividends consist of investment company taxable income, which generally includes qualified dividend income, ordinary income and short-term capital gains. Any net realized long-term gains are distributed annually to common shareholders.
Distributions to shareholders are recorded on the ex-dividend date. The amount and timing of distributions are determined in accordance with federal income tax regulations, which may differ from U.S. generally accepted accounting principles. The Fund anticipates that a significant portion of the distributions paid during the calendar year will ultimately be classified as return of capital for income tax purposes. The Fund will inform shareholders of the final tax character of the distributions on IRS Form 1099-DIV in January 2011.
Semiannual Report | April 30, 2010 | 23
LCM | Advent/Claymore Enhanced Growth & Income Fund | Notes to Financial Statements (unaudited) continued
Note 3 – Investment Advisory Agreement, Investment Management Agreement and Other Agreements:
Pursuant to an Investment Advisory Agreement (the “Agreement”) between Claymore Advisors, LLC (the “Adviser”) and the Fund, the Adviser furnishes offices, necessary facilities and equipment, provides administrative services to the Fund, oversees the activities of Advent Capital Management, LLC (the “Investment Manager”), provides personnel and pays the compensation of all Trustees and Officers of the Fund who are its affiliates. As compensation for these services, the Fund pays the Adviser an annual fee, payable monthly in arrears, at an annual rate equal to 0.49% of the average Managed Assets during such month. Managed Assets means the total of assets of the Fund (including any assets attributable to any preferred shares or otherwise attributable to the use of financial leverage, if any) less the sum of accrued liabilities.
Pursuant to an Investment Management Agreement between the Investment Manager and the Fund, the Fund has agreed to pay the Investment Manager an annual fee, payable monthly in arrears, at an annual rate equal to 0.51% of the average Managed Assets during such month for the services and facilities provided by the Investment Manager to the Fund. These services include the day-to-day management of the Fund’s portfolio of securities, which includes buying and selling securities for the Fund and investment research. The Investment Manager also provides personnel to the Fund and pays the compensation of all Trustees and Officers of the Fund who are its affiliates.
On October 15, 2009, Guggenheim Partners LLC, (“Guggenheim”), a global, diversified financial services firm, and Claymore Group Inc., parent of the Adviser, announced the completion of a previously announced merger. The closing of this transaction took place on October 14, 2009 (“The Effective Date”). This transaction resulted in a change-of-control whereby Claymore Group Inc. and its subsidiaries, including the Adviser, became indirect, wholly-owned subsidiaries of Guggenheim. The transaction has not affected the daily operations of the Fund or the investment activities or the investment management activities of the Adviser.
Under the Investment Company Act of 1940, as amended, the consummation of the transaction resulted in the automatic termination of the Fund’s advisory agreement. On September 29, 2009, the Board of Trustees approved a new investment advisory agreement between the Fund and the Adviser (the “New Advisory Agreement”) and recommended that the New Advisory Agreement be submitted to the shareholders of the Fund for their approval. On March 12, 2010, the shareholders approved the New Advisory Agreement on behalf of the Fund.
The Bank of New York Mellon (“BNY”) acts as the Fund’s custodian, accounting and transfer agent. As custodian, BNY is responsible for the custody of the Fund’s assets. As transfer agent, BNY is responsible for performing transfer agency services for the Fund. As accounting agent, BNY is responsible for maintaining the books and records of the Fund’s securities and cash.
Claymore Advisors, LLC provides Fund Administration services to the Fund. As compensation for its services performed under the Administration Agreement, Claymore Advisors, LLC receives an administration fee payable monthly at the annual rate set forth below as a percentage of the average daily managed assets of the Fund:
| Managed Assets | Rate |
| First $200,000,000 | 0.0275% |
| Next $300,000,000 | 0.0200% |
| Next $500,000,000 | 0.0150% |
| Over $1,000,000,000 | 0.0100% |
Certain Officers and Trustees of the Fund are also Officers and Directors of the Adviser or Investment Manager. The Fund does not compensate its Officers or Trustees who are Officers of the aforementioned firms.
Note 4 – Federal Income Taxes:
The Fund intends to continue to comply with the requirements of Subchapter M of the Internal Revenue Code of 1986, as amended, applicable to regulated investment companies. Accordingly, no provision for U.S. federal income taxes is required. In addition, by distributing substantially all of its ordinary income and long-term capital gains, if any, during each calendar year, the Fund can avoid a 4% federal excise tax that is assessed on the amount of the under distribution. At April 30, 2010, the cost and related gross unrealized appreciation and depreciation on investments for tax purposes, excluding written options and foreign currency translations are as follows:
| Cost of | Net Tax | Net Tax Unrealized | ||
| Investments | Gross Tax | Gross Tax | Unrealized | Appreciation |
| for Tax | Unrealized | Unrealized | Appreciation | on Derivatives and |
| Purposes | Appreciation | Depreciation | on Investments | Foreign Currency |
| $198,925,115 | $19,877,934 | $(3,302,471) | $16,575,463 | $239,815 |
The differences between book basis and tax basis unrealized appreciation/(depreciation) are attributable to the tax deferral of losses on wash sales and additional income accrued for tax purposes on certain convertible securities.
24 | Semiannual Report | April 30, 2010
LCM | Advent/Claymore Enhanced Growth & Income Fund | Notes to Financial Statements (unaudited) continued
As of October 31, 2009, the components of accumulated earnings/(loss) (excluding paid-in-capital) on a tax basis were as follows:
| Undistributed | Undistributed |
| Ordinary | Long-Term |
| Income/ | Gains/ |
| (Accumulated | (Accumulated |
| Ordinary Loss) | Capital Loss) |
| – | $(95,101,353) |
At October 31, 2009, for federal income tax purposes, the Fund had a capital loss carryforward of $95,101,353 available to offset possible future capital gains. Of the capital loss carryforward $42,681,592 is set to expire on October 31, 2016, and $52,419,761 is set to expire on October 31, 2017.
For the years ended October 31, 2009 and October 31, 2008, the tax character of distributions paid of $9,090,807 and $10,938,810 was ordinary income, $0 and $1,324,194 was long-term capital gain, and $6,443,848 and $9,501,836 was return of capital, respectively.
For all open tax years and all major jurisdictions, management of the Fund has concluded that there are no significant uncertain tax positions that would require recognition in the financial statements. Open tax years are those that are open for examination by taxing authorities (i.e. generally the last four tax year ends and the interim tax period since then). Furthermore, management of the Fund is also not aware of any tax positions for which it is reasonably possible that the total amounts of unrecognized tax benefits will significantly change in the next twelve months.
Note 5 – Investments in Securities:
For the six months ended April 30, 2010, purchases and sales of investments, excluding options and short-term securities, were $165,410,961 and $113,219,905, respectively.
Note 6 – Derivatives:
(a) Covered Call Options
An option on a security is a contract that gives the holder of the option, in return for a premium, the right to buy from (in the case of a call) or sell to (in the case of a put) the writer of the option the security underlying the option at a specified exercise or “strike” price. The writer of an option on a security has the obligation upon exercise of the option to deliver the underlying security upon payment of the exercise price (in the case of a call) or to pay the exercise price upon delivery of the underlying security (in the case of a put).
The Fund will follow a strategy of writing covered call options, which is a strategy designed to produce income from option premiums and offset a portion of a market decline in the underlying security. This strategy will be the Fund’s principal investment strategy in seeking to pursue its primary investment objective. The Fund will only “sell” or “write” options on securities held in the Fund’s portfolio. It may not sell “naked” call options, i.e., options on securities that are not held by the Fund or on more shares of a security than are held in the Fund’s portfolio. The Fund will consider a call option written with respect to a security underlying a convertible security to be covered so long as (i) the convertible security, pursuant to its terms, grants to the holders of such security the right to convert the convertible security into the underlying security and (ii) the convertible security, upon conversion, will convert into enough shares of the underlying security to cover the call option written by the Fund.
There are several risks associated with transactions in options on securities. As the writer of a covered call option, the Fund forgoes, during the option’s life, the opportunity to profit from increases in the market value of the security covering the call option above the sum of the premium and the strike price of the call, but has retained the risk of loss should the price of the underlying security decline. The writer of an option has no control over the time when it may be required to fulfill its obligation as writer of the option. Once an option writer has received an exercise notice, it cannot effect a closing purchase transaction in order to terminate its obligation under the option and must deliver the underlying security at the exercise price.
The Fund entered into written option contracts for the six months ended April 30, 2010. Details of the transactions were as follows:
| Number of Contracts | Premiums Received | |||||||
| Options outstanding, beginning of year | 3,973 | $ | 290,564 | |||||
| Options written during the year | 13,983 | 626,371 | ||||||
| Options expired during the year | (5,995 | ) | (283,932 | ) | ||||
| Options closed during the year | (7,416 | ) | (455,334 | ) | ||||
| Options assigned during the year | (1,596 | ) | (72,719 | ) | ||||
| Options outstanding, end of year | 2,949 | $ | 104,950 | |||||
(b) Swaps
Interest rate swap agreements involve the exchange by the Fund with another party of their respective commitments to pay or receive interest. Total return swap agreements involve commitments to receive (and pay) interest over a floating rate (LIBOR) based on a notional amount. To the extent the total return of the secu-
Semiannual Report | April 30, 2010 | 25
LCM | Advent/Claymore Enhanced Growth & Income Fund | Notes to Financial Statements (unaudited) continued
rity (price changes, interest paid/received, rebate earned on collateral posted by the Fund) is positive, the Fund will receive a payment from the counterparty (or if negative, make a payment to the counterparty).
Credit default swap transactions involve the Fund’s agreement to exchange the credit risk of an issuer. A buyer of a credit default swap is said to buy protection by paying periodic fees in return for a contingent payment from the seller if the issuer has a credit event such as bankruptcy, a failure to pay outstanding obligations or deteriorating credit while the swap is outstanding. A seller of a credit default swap is said to sell protection and thus collects the periodic fees and profits if the credit of the issuer remains stable or improves while the swap is outstanding but the seller in a credit default swap contract would be required to pay an agreed-upon amount, which approximates the notional amount of the swap, to the buyer in the event of an adverse credit event of the issuer.
(c) Forward Exchange Currency Contracts
A forward exchange currency contract is a commitment to purchase or sell a foreign currency on a future date at a negotiated forward rate. The gain or loss arising from the difference between the original contracts and the closing of such contracts would be included in net realized gain or loss on foreign currency transactions.
Risk may arise from the potential inability of a counterparty to meet the terms of a contract and from unanticipated movements in the value of a foreign currency relative to the U.S. dollar. The face or contract amount, in U.S. dollars, reflects the total exposure the Fund has in that particular currency contract.
At April 30, 2010, the following forward exchange currency contracts were outstanding:
| Short Contracts | Current Value | Unrealized Appreciation/ Depreciation | ||||||
| EURO, 500,000 expiring 6/16/10 | $ | 664,917 | $ | 22,083 | ||||
Japanese Yen, 380,000,000 expiring 6/16/10 | 4,043,949 | 151,701 | ||||||
| Pound Sterling, 300,000 expiring 6/16/10 | 459,100 | (100 | ) | |||||
| Swiss Franc, 3,300,000 expiring 6/16/10 | 3,063,200 | 78,162 | ||||||
| $ | 251,846 | |||||||
(d) Accounting Pronouncement for Derivatives:
The Fund is required by GAAP to disclose: a) how and why a fund uses derivative instruments, b) how derivatives instruments and related hedge fund items are accounted for, and c) how derivative instruments and related hedge items affect a fund’s financial position, results of operations and cash flows.
The following table presents the types of derivatives in the Fund by location as presented on the Statement of Assets and Liabilities as of April 30, 2010:
Statement of Asset & Liabilities Presentation of Fair Values of Derivative Instruments: | ||||
| (amounts in thousands) | ||||
| Asset Derivatives | Liability Derivatives | |||
Derivatives not accounted for as hedging instruments | Statement of Assets and Liabilities Location | Fair Value | Statement of Assets and Liabilities Location | Fair Value |
| Equity contracts | Investments in securities (options purchased) | $846 | Options written, at value | $118 |
| Foreign exchange currency contracts | Unrealized appreciation on currency contracts | 252 | Unrealized depreciation on currency contracts | – |
| Total | $1,098 | $118 | ||
The following table presents the effect of Derivative Instruments on the Statement of Operations for the six months ended April 30, 2010: (amount in thousands)
| Effect of Derivative Instruments on the Statement of Operations: | |||
| (amount in thousands) | |||
| Amount of Realized Gain/(Loss) on Derivatives | |||
| Derivatives not accounted for as hedging instruments | Options | Foreign Currency Transactions | Total |
| Equity contracts | $(537) | $ – | $(537) |
| Foreign exchange currency contracts | – | 38 | 38 |
| Total | $(537) | $38 | $(499) |
26 | Semiannual Report | April 30, 2010
LCM | Advent/Claymore Enhanced Growth & Income Fund | Notes to Financial Statements (unaudited) continued
| Change in Unrealized Appreciation on Derivatives | |||
Derivatives not accounted for as hedging instruments | Options | Foreign Currency Transactions | Total |
| Equity contracts | $(552) | $ – | $(552) |
| Foreign exchange currency contracts | – | 206 | 206 |
| Total | $(552) | $206 | $(346) |
Note 7 – Capital:
Common Shares
The Fund has an unlimited amount of common shares, $0.001 par value, authorized and 13,603,025 issued and outstanding. In connection with the Fund’s dividend reinvestment plan, the Fund did not issue shares during the six months ended April 30, 2010 or the year ended October 31, 2009.
Note 8 – Borrowings:
On February 4, 2010, the Fund entered into a $50,000,000 committed credit facility agreement whereby the counterparty has agreed to provide secured financing to the Fund and the Fund will provide pledged collateral to the counterparty. Interest on the amount borrowed is based on the 3-month LIBOR plus 0.95%. An unused commitment fee of 0.85% is charged on the difference between the $50,000,000 credit agreement and the amount borrowed, which is included in “Line of credit fees” on the Statement of Operations. As of April 30, 2010, there was $50,000,000 outstanding in connection with the Fund’s credit facility. The average daily amount of the borrowings on the credit facility during the six months ended April 30, 2010 was $19,108,108 with a related average interest rate of 1.23%. The maximum amount outstanding during the period was $50,000,000.
Note 9 – Indemnifications:
In the normal course of business, the Fund enters into contracts that contain a variety of representations, which provide general indemnifications. The Fund’s maximum exposure under these arrangements is unknown, as this would involve future claims that may be made against the Fund that have not yet occurred. However, the Fund expects the risk of loss to be remote.
Note 10 – Recent Accounting Pronouncements:
On January 21, 2010, the FASB issued an ASU, Fair Value Measurements and Disclosures (Topic 820): Improving Disclosures about Fair Value Measurements which provides guidance on how investment assets and liabilities are to be valued and disclosed. Specifically, the amendment requires reporting entities to disclose i) the input and valuation techniques used to measure fair value for both recurring and nonrecurring fair value measurements, for Level 2 or Level 3 positions ii) transfers between all levels (including Level 1 and Level 2) will be required to be disclosed on a gross basis (i.e. transfers out must be disclosed separately from transfers in) as well as the reason(s) for the transfer and iii) purchases, sales, issuances and settlements must be shown on a gross basis in the Level 3 rollforward rather than as one net number. The effective date of the amendment is for interim and annual periods beginning after December 15, 2009 however, the requirement to provide the Level 3 activity for purchases, sales, issuances and settlements on a gross basis will be effective for interim and annual periods beginning after December 15, 2010. At this time the Fund is evaluating the implications of the amendment to ASC 820 and the impact to the financial statements.
Note 11 – Subsequent Event:
On May 3, 2010, the Board of Trustees declared a quarterly dividend of $0.264 per common share. This dividend was payable on May 28, 2010 to shareholders of record on May 14, 2010.
The Fund has performed an evaluation of subsequent events through June 24, 2010, which is the date the financial statements were issued, and determined that no additional events have occurred that require disclosure.
Semiannual Report | April 30, 2010 | 27
LCM | Advent/Claymore Enhanced Growth & Income Fund
Supplemental Information | (unaudited) |
Federal Income Tax Information
In January 2011, you will be advised on IRS Form 1099 DIV or substitute 1099 DIV as to the federal tax status of the distributions received by you in the calendar year 2010.
Results of Shareholder Votes
A Joint Special Meeting of Shareholders of the Fund was held on January 12, 2010 and adjourned until March 12, 2010. At the March 12, 2010 meeting, shareholders voted on a new investment Advisory Agreement between the Fund and Claymore Advisors, LLC.
With regard to the consideration of a new Investment Advisory Agreement between the Fund and Claymore Advisors, LLC:
| In Favor | Against | # of Shares Withheld | |
| New Investment Advisory Agreement | 6,267,292 | 186,139 | 375,524 |
Trustees
The Trustees of the Advent/Claymore Enhanced Growth & Income Fund and their principal occupations during the past five years:
Name, Address, Year of Birth and Position(s) Held with Registrant | Term of Office* and Length of Time Served | Principal Occupations During the Past Five Years and Other Affiliations | Number of Funds in Fund Complex** Overseen by Trustee | Other Directorships Held by Trustee |
| Independent Trustees: | ||||
Daniel Black+ Year of birth: 1960 Trustee | Since 2005 | Partner, the Wicks Group of Cos., LLC (2003-present). Formerly, Managing Director and Co-head of the Merchant Banking Group at BNY Capital Markets, a division of The Bank of New York Co., Inc. (1998-2003). | 3 | Director of Penn Foster Education Group, Inc. |
Randall C. Barnes++ Year of birth: 1951 Trustee | Since 2005 | Private Investor (2001-present), Formerly, Senior Vice President, Treasurer, PepsiCo, Inc. (1993-1997), President, Pizza Hut International (1991-1993) and Senior Vice President, Strategic Planning and New Business Development (1987-1990) of PepsiCo, Inc. (1987-1997). | 44 | None. |
Derek Medina+ Year of birth: 1966 Trustee | Since 2004 | Senior Vice President, Business Affairs at ABC News (2008-present). Vice President, Business Affairs and News Planning at ABC News (2003-2008). Formerly, Executive Director, Office of the President at ABC News (2000-2003). Former Associate at Cleary Gottlieb Steen & Hamilton (law firm) (1995-1998). Former associate in Corporate Finance at J.P. Morgan/ Morgan Guaranty (1988-1990). | 3 | Director of Young Scholar’s Institute. |
Ronald A. Nyberg++ Year of birth: 1953 Trustee | Since 2004 | Partner of Nyberg & Cassioppi, LLC, a law firm specializing in corporate law, estate planning and business transactions (2000-present). Formerly, Executive Vice President, General Counsel and Corporate Secretary of Van Kampen Investments (1982-1999). | 47 | None. |
Gerald L. Seizert, CFP+ Year of birth: 1952 Trustee | Since 2004 | Chief Executive Officer of Seizert Capital Partners, LLC, where he directs the equity disciplines of the firm and serves as a co-manager of the firm’s hedge fund, Proper Associates, LLC (2000-present). Formerly, Co-Chief Executive (1998-1999) and a Managing Partner and Chief Investment Officer-Equities of Munder Capital Management, LLC (1995-1999). Former Vice President and Portfolio Manager of Loomis, Sayles & Co., L.P. (asset manager) (1984-1995). Former Vice President and Portfolio Manager at First of America Bank (1978-1984). | 3 | Former Director of Loomis, Sayles and Co., L.P. |
Michael A. Smart+ Year of birth: 1960 Trustee | Since 2004 | Managing Partner, Cordova, Smart & Williams LLC, Advisor to First Atlantic Capital Ltd., (2001-present). Formerly, a Managing Director in Investment Banking-The Private Equity Group (1995-2001) and a Vice President in Investment Banking-Corporate Finance (1992-1995) at Merrill Lynch & Co. Founding Partner of The Carpediem Group, a private placement firm (1991-1992). Former Associate at Dillon, Read and Co. (investment bank) (1988-1990). | 3 | Director, Country Pure Foods, Chairman, Board of Directors, Berkshire Blanket, Inc., President and Chairman, Board of Directors, Sqwincher Holdings, Board of Directors, Sprint Industrial Holdings, Co-chair of the Board of H20 plus. |
| Interested Trustees: | ||||
Tracy V. Maitland+*** Year of birth: 1960 Trustee, President and Chief Executive Officer | Since 2004 | President of Advent Capital Management, LLC, which he founded in 1995. Prior to June 2001, President of Advent Capital Management, a division of Utendahl Capital. | 3 | None. |
| + | Address for all Trustees noted: 1065 Avenue of the Americas, 31st Floor, New York, NY 10018 |
| ++ | Address for all Trustees noted: 2455 Corporate West Drive, Lisle, IL 60532 |
| * | After a Trustee’s initial term, each Trustee is expected to serve a three-year term concurrent with the class of Trustees for which he serves: |
| --- Messrs. Seizert, Medina and Barnes, as Class III Trustees, are expected to stand for re-election at the Fund’s 2010 annual meeting of shareholders. |
| --- Messrs. Smart and Black, as Class I Trustees, are expected to stand for re-election at the Fund’s 2011 annual meeting of shareholders. |
| --- Messrs. Maitland and Nyberg, as a Class II Trustees, are expected to stand for re-election at the Fund’s 2012 annual meeting of shareholders. |
| ** | The Claymore Fund Complex consists of U.S. registered investment companies advised or serviced by Claymore Advisors, LLC or Claymore Securities, Inc. The Claymore Fund Complex is overseen by multiple Boards of Trustees |
| *** | Mr. Maitland is an “interested person” (as defined in section 2(a)(19) of the 1940 Act) of the Fund because of his position as an officer of Advent Capital Management, LLC, the Fund’s Investment Manager. |
28 | Semiannual Report | April 30, 2010
LCM | Advent/Claymore Enhanced Growth & Income Fund | Supplemental Information (unaudited) continued
Officers
The Officers of the Advent/Claymore Enhanced Growth & Income Fund and their principal occupations during the past five years:
| Name, Address*, Year of Birth and Position(s) Held with Registrant | Term of Office** and Length of Time Served | Principal Occupations During the Past Five Years and Other Affiliations |
| Officers: | ||
F. Barry Nelson Year of birth: 1943 Vice President and Assistant Secretary | Since 2005 | Co-Portfolio Manager at Advent Capital Management, LLC (2001-present). Prior to 2001, Mr. Nelson held the same position at Advent Capital Management, a division of Utendahl Capital. |
Robert White Year of birth: 1965 Treasurer and Chief Financial Officer | Since 2005 | Chief Financial Officer, Advent Capital Management, LLC (2005-present). Previously, Vice President, Client Service Manager, Goldman Sachs Prime Brokerage (1997-2005). |
Rodd Baxter Year of birth: 1950 Secretary and Chief Compliance Officer | Since 2005 | General Counsel, Advent Capital Management, LLC (2002-present); Formerly, Director and Senior Counsel, SG Cowen Securities Corp. (1998-2002). |
| * | Address for all Officers unless otherwise noted: 1065 Avenue of the Americas, 31st Floor, New York, NY 10018 |
| ** | Officers serve at the pleasure of the Board of Trustees and until his or her successor is appointed and qualified or until his or her earlier resignation or removal. |
Semiannual Report | April 30, 2010 | 29
LCM | Advent/Claymore Enhanced Growth & Income Fund
Dividend Reinvestment Plan | (unaudited) |
Unless the registered owner of common shares elects to receive cash by contacting The Bank of New York Mellon (the “Plan Administrator”), all dividends declared on common shares of the Fund will be automatically reinvested by the Plan Administrator for shareholders in the Fund’s Dividend Reinvestment Plan (the “Plan”), in additional common shares of the Fund. Participation in the Plan is completely voluntary and may be terminated or resumed at any time without penalty by notice if received and processed by the Plan Administrator prior to the dividend record date; otherwise such termination or resumption will be effective with respect to any subsequently declared dividend or other distribution. Some brokers may automatically elect to receive cash on your behalf and may re-invest that cash in additional common shares of the Fund for you. If you wish for all dividends declared on your common shares of the Fund to be automatically reinvested pursuant to the Plan, please contact your broker.
The Plan Administrator will open an account for each common shareholder under the Plan in the same name in which such common shareholder’s common shares are registered. Whenever the Fund declares a dividend or other distribution (together, a “Dividend”) payable in cash, non-participants in the Plan will receive cash and participants in the Plan will receive the equivalent in common shares. The common shares will be acquired by the Plan Administrator for the participants’ accounts, depending upon the circumstances described below, either (i) through receipt of additional unissued but authorized common shares from the Fund (“Newly Issued Common Shares”) or (ii) by purchase of outstanding common shares on the open market (“Open-Market Purchases”) on the New York Stock Exchange or elsewhere. If, on the payment date for any Dividend, the closing market price plus estimated brokerage commission per common share is equal to or greater than the net asset value per common share, the Plan Administrator will invest the Dividend amount in Newly Issued Common Shares on behalf of the participants. The number of Newly Issued Common Shares to be credited to each participant’s account will be determined by dividing the dollar amount of the Dividend by the net asset value per common share on the payment date; provided that, if the net asset value is less than or equal to 95% of the closing market value on the payment date, the dollar amount of the Dividend will be divided by 95% of the closing market price per common share on the payment date. If, on the payment date for any Dividend, the net asset value per common share is greater than the closing market value plus estimated brokerage commission, the Plan Administrator will invest the Dividend amount in common shares acquired on behalf of the participants in Open-Market Purchases.
If, before the Plan Administrator has completed its Open-Market Purchases, the market price per common share exceeds the net asset value per common share, the average per common share purchase price paid by the Plan Administrator may exceed the net asset value of the common shares, resulting in the acquisition of fewer common shares than if the Dividend had been paid in Newly Issued Common Shares on the Dividend payment date. Because of the foregoing difficulty with respect to Open-Market Purchases, the Plan provides that if the Plan Administrator is unable to invest the full Dividend amount in Open-Market Purchases during the purchase period or if the market discount shifts to a market premium during the purchase period, the Plan Administrator may cease making Open-Market Purchases and may invest the uninvested portion of the Dividend amount in Newly Issued Common Shares at net asset value per common share at the close of business on the Last Purchase Date provided that, if the net asset value is less than or equal to 95% of the then current market price per common share; the dollar amount of the Dividend will be divided by 95% of the market price on the payment date.
The Plan Administrator maintains all shareholders’ accounts in the Plan and furnishes written confirmation of all transactions in the accounts, including information needed by shareholders for tax records. Common shares in the account of each Plan participant will be held by the Plan Administrator on behalf of the Plan participant, and each shareholder proxy will include those shares purchased or received pursuant to the Plan. The Plan Administrator will forward all proxy solicitation materials to participants and vote proxies for shares held under the Plan in accordance with the instruction of the participants.
There will be no brokerage charges with respect to common shares issued directly by the Fund. However, each participant will pay a pro rata share of brokerage commission incurred in connection with Open-Market Purchases. The automatic reinvestment of Dividends will not relieve participants of any Federal, state or local income tax that may be payable (or required to be withheld) on such Dividends.
The Fund reserves the right to amend or terminate the Plan. There is no direct service charge to participants with regard to purchases in the Plan; however, the Fund reserves the right to amend the Plan to include a service charge payable by the participants.
All correspondence or questions concerning the Plan should be directed to the Plan Administrator, BNY Mellon Shareholder Services, Attention: Stock Transfer Department, P.O. Box 358015, Pittsburg, PA 15252; Phone Number: (866) 488-3559.
30 | Semiannual Report | April 30, 2010
LCM | Advent/Claymore Enhanced Growth & Income Fund
| Investment Management Agreement Re-Approval | (unaudited) |
Investment Management Agreement Re-Approval
Section 15(c) of the Investment Company Act of 1940, as amended (the “1940 Act”) contemplates that the Board of Trustees (the “Board”) of Advent/Claymore Enhanced Growth & Income Fund (the “Fund”), including a majority of the Trustees who have no direct or indirect interest in the investment management agreement and are not “interested persons” of the Fund, as defined in the 1940 Act (the “Independent Trustees”), is required to annually review and re-approve the terms of the Fund’s existing investment management agreement and approve any newly proposed terms therein. In this regard, the Board reviewed and re-approved, during the most recent six month period covered by this report, the investment management agreement (the “Management Agreement”) with Advent Capital Management, LLC (“Advent”) for the Fund.
More specifically, at a meeting held on March 23, 2010, the Board, including the Independent Trustees advised by their independent legal counsel, considered the factors and reached the conclusions described below relating to the selection of Advent and the re-approval of the Management Agreement.
Nature, Extent and Quality of Services
The Board received and considered various data and information regarding the nature, extent and quality of services provided to the Fund by Advent under the Management Agreement. The Board reviewed and analyzed the responses of Advent to a detailed series of requests submitted by the Independent Trustees’ independent legal counsel on behalf of such Trustees which included, among other things, information about the background and experience of the senior management and the expertise of, and amount of attention devoted to the Fund by personnel of Advent. In this regard, the Board specifically reviewed the qualifications, background and responsibilities of the officers primarily responsible for day-to-day portfolio management services for the Fund.
The Board evaluated the ability of Advent, including its resources, reputation and other attributes, to attract and retain highly qualified investment professionals, including research, advisory and supervisory personnel. Accordingly, the Board considered information regarding the compensation structures for the personnel of Advent involved in the management of the Fund.
Based on the above factors, together with those referenced below, the Board concluded that it was satisfied with the nature, extent and quality of the investment management services provided to the Fund by Advent.
Fund Performance and Expenses
The Board considered the performance results for the Fund on a market price and net asset value basis over various time periods. It also considered these results in comparison to the performance results of a group of other closed-end funds that were respectively determined to be similar to the Fund in terms of investment strategy (the "Peer Group"). The Board recognized that the number of other funds in the Peer Group was low, particularly for the Fund, and that for a variety of reasons, Peer Group comparisons may have limited usefulness. Performance was also compared against various indices. The Board also reviewed information about the discount at which the Fund’s shares have traded as compared with its peers. The Board received and considered statistical information regarding the Fund’s total expense ratio (based on net assets applicable to common shares) and its various components. The Board also considered comparisons of these expenses to the expense information for the Peer Group, which in the Fund’s case was a larger group than for the performance comparison. Based on the above-referenced considerations and other factors, the Board concluded that the overall performance results and expense comparison supported the re-approval of the Investment Management Agreement.
Investment Management Fee Rate
The Board reviewed and considered the contractual investment management fee rate for the Fund (the “Management Agreement Rate”) payable by the Fund to Advent. In addition, the Board reviewed and considered all fee waiver arrangements applicable to the Management Agreement Rate and considered the Management Agreement Rate after taking all applicable waivers into account (the “Net Management Rate”).
Additionally, the Board received and considered information comparing the Management Agreement Rate (on a stand-alone basis exclusive of service fee/administrative fee rates) with those of the other funds in the Peer Group. The advisory fee on managed assets for the Fund was at the median of the Peer Group but the expense ratio on net assets attributable to common shares was above the median. In some cases the comparison of fees and expenses was negatively affected due to fee or expense waivers in a peer fund or the fact that a peer fund was unleveraged or had lower leverage from the Fund. These comparisons may also have been affected by the extent of leverage of peer funds. The Board also took note of the fact that the expense ratios of the Peer Group funds may have increased since the date as of which the information was presented, given the level of market declines in the fourth quarter of 2008 and the first quarter of 2009. The Board concluded that the fees were fair and equitable based on relevant factors, including the Fund’s performance results and total expenses relative to the Peer Group..
Profitability
The Board received and considered an estimated profitability analysis of Advent based on the Net Management Rate. The Board concluded that, in light of the costs of providing investment management and other services to the Fund, the profits and other ancillary benefits that Advent received with regard to providing these services to the Fund were not unreasonable.
Economies of Scale
The Board received and considered information regarding whether there have been economies of scale with respect to the management of the Fund, whether the Fund has appropriately benefited from any economies of scale, and whether there is potential for realization of any further economies of scale. The Board concluded that the opportunity to benefit from economies of scale was diminished in the context of closed-end funds.
Information about Services to Other Clients
The Board also received and considered information about the nature, extent and quality of services and fee rates offered by Advent to their other clients. In particular, Advent explained that its hedge fund clients pay higher fees than the Fund. Advent also confirmed that the Fund differs from certain other accounts advised by Advent in that it is more complex to manage, require greater resources from Advent and differs in terms of investment strategy and use of leverage. The Board also noted the differing services provided to the Fund in relation to those typically provided to hedge funds and separate accounts.
After considering the above-described factors and based on the deliberations and their evaluation of the information provided to them, the Board concluded that re-approval of the Investment Management Agreement was in the best interest of the Fund and its shareholders.
Semiannual Report | April 30, 2010 | 31
This Page Intentionally Left Blank.
This Page Intentionally Left Blank.
This Page Intentionally Left Blank.
LCM | Advent/Claymore Enhanced Growth & Income Fund
| Fund Information |
| Board of Trustees | Officers | Investment Manager |
| Randall C. Barnes | Tracy V. Maitland | Advent Capital Management, LLC |
| President and Chief Executive Officer | New York, New York | |
| Daniel Black | ||
| F. Barry Nelson | Investment Adviser and | |
| Tracy V. Maitland* | Vice President and Assistant Secretary | Administrator |
Chairman | Claymore Advisors LLC | |
| Robert White | Lisle, Illinois | |
| Derek Medina | Treasurer and Chief Financial Officer | |
Custodian and Transfer Agent | ||
| Ronald A. Nyberg | Rodd Baxter | The Bank of New York Mellon |
Secretary and Chief Compliance Officer | New York, New York | |
| Gerald L. Seizert | ||
| Legal Counsel | ||
| Michael A. Smart | Skadden, Arps, Slate, Meagher & | |
| Flom LLP | ||
* Trustee is an “interested person” of the Fund as defined in the Investment Company Act of 1940, as amended. | New York, New York | |
| Independent Registered Public | ||
Accounting Firm | ||
PricewaterhouseCoopers LLP | ||
New York, New York | ||
Privacy Principles of the Fund
The Fund is committed to maintaining the privacy of its shareholders and to safeguarding their non-public personal information. The following information is provided to help you understand what personal information the Fund collects, how the Fund protects that information and why, in certain cases, the Fund may share information with select other parties.
Generally, the Fund does not receive any non-public personal information relating to its shareholders, although certain non-public personal information of its shareholders may become available to the Fund. The Fund does not disclose any non-public personal information about its shareholders or former shareholders to anyone, except as permitted by law or as is necessary in order to service shareholder accounts (for example, to a transfer agent or third party administrator).
The Fund restricts access to non-public personal information about its shareholders to employees of the Fund’s investment adviser and its affiliates with a legitimate business need for the information. The Fund maintains physical, electronic and procedural safeguards designed to protect the non-public personal information of its shareholders.
Questions concerning your shares of Advent/Claymore Enhanced Growth & Income Fund?
| • | If your shares are held in a Brokerage Account, contact your Broker. |
| • | If you have physical possession of your shares in certificate form, contact the Fund’s Custodian and Transfer Agent: |
The Bank of New York Mellon, 101 Barclay 11E, New York, NY 10286; (866) 488-3559.
This report is sent to shareholders of Advent/Claymore Enhanced Growth and Income Fund for their information. It is not a Prospectus, circular or representation intended for use in the purchase or sale of shares of the Fund or of any securities mentioned in this report.
A description of the Fund’s proxy voting policies and procedures related to portfolio securities is available without charge, upon request, by calling the Fund at (866) 274-2227.
Information regarding how the Fund voted proxies for portfolio securities, if applicable, during the most recent 12-month period ended June 30, is also available, without charge and upon request by calling the Fund at (866) 274-2227 or by accessing the Fund’s Form N-PX on the U.S. Securities & Exchange Commission’s (“SEC”) website at www.sec.gov or www.claymore.com.
The Fund files its complete schedule of portfolio holdings with the SEC for the first and third quarters of each fiscal year on Form N-Q. The Fund’s Form N-Q is available on the SEC website at www.sec.gov or www.claymore.com. The Fund’s Form N-Q may also be viewed and copied at the SEC’s Public Reference Room in Washington, DC; information on the operation of the Public Reference Room may be obtained by calling (800) SEC-0330 or at www.sec.gov.
Notice to Shareholders
Notice is hereby given in accordance with Section 239(c) of the Investment Company Act of 1940, as amended, that the Fund may purchase at market prices from time to time shares of its common stock in the open market.
Semiannual Report | April 30, 2010 | 35
Advent Capital Management, LLC
Advent Capital Management, LLC (“Advent”) is a registered investment adviser, based in New York, which specializes in convertible and high-yield securities for institutional and individual investors. The firm was established by Tracy V. Maitland, a former Director in the Convertible Securities sales and trading division of Merrill Lynch. Advent’s investment discipline emphasizes capital structure research, encompassing equity fundamentals as well as credit research, with a focus on cash flow and asset values while seeking to maximize total return.
Investment Philosophy
Advent believes that superior returns can be achieved while reducing risk by investing in a diversified portfolio of global equity, convertible and high-yield securities. The Fund Manager seeks securities with attractive risk/reward characteristics. Advent employs a bottom-up security selection process across all of the strategies it manages. Securities are chosen from those that the Fund Manager believes have stable-to-improving fundamentals and attractive valuations.
Investment Process
Advent manages securities by using a strict four-step process:
| 1 | Screen the convertible and high-yield markets for securities with attractive risk/reward characteristics and favorable cash flows; |
| 2 | Analyze the quality of issues to help manage downside risk; |
| 3 | Analyze fundamentals to identify catalysts for favorable performance; and |
| 4 | Continually monitor the portfolio for improving or deteriorating trends in the financials of each investment. |
Advent Capital Management, LLC 1065 Avenue of the Americas New York, New York 10018 | Claymore Securities, Inc. 2455 Corporate West Drive Lisle, IL 60532 Member FINRA/SIPC (6/10) |  |
Item 2. Code of Ethics.
Not applicable for a semi-annual reporting period.
Item 3. Audit Committee Financial Expert.
Not applicable for a semi-annual reporting period.
Item 4. Principal Accountant Fees and Services.
Not applicable for a semi-annual reporting period.
Item 5. Audit Committee of Listed Registrants.
Not applicable for a semi-annual reporting period.
Item 6. Schedule of Investments.
The Schedule of Investments is included as part of Item 1.
Item 7. Disclosure of Proxy Voting Policies and Procedures for Closed-End Management Investment Companies.
Not applicable for a semi-annual reporting period.
Item 8. Portfolio Managers of Closed-End Management Investment Companies.
(a) Not applicable for a semi-annual reporting period.
(b) There has been no change, as of the date of this filing, in the Portfolio Manager identified in response to paragraph (a)(1) of this Item in the registrant’s most recent annual report on Form N-CSR.
Item 9. Purchases of Equity Securities by Closed-End Management Investment Company and Affiliated Purchasers.
None.
Item 10. Submission of Matters to a Vote of Security Holders.
The registrant has not made any material changes to the procedures by which shareholders may recommend nominees to the registrant’s Board of Trustees.
Item 11. Controls and Procedures.
(a) The registrant's principal executive officer and principal financial officer have evaluated the registrant's disclosure controls and procedures (as defined in Rule 30a-3(c) under the Investment Company Act) as of a date within 90 days of this filing and have concluded based on such
evaluation, that the registrant's disclosure controls and procedures were effective, as of that date, in ensuring that information required to be disclosed by the registrant in this Form N-CSR was recorded, processed, summarized, and reported within the time periods specified in the Securities and Exchange Commission’s rules and forms.
(b) There were no changes in the registrant's internal control over financial reporting (as defined in Rule 30a-3(d) under the Investment Company Act) that occurred during the registrant's second fiscal quarter of the period covered by this report that have materially affected, or are reasonably likely to materially affect, the registrant's internal control over financial reporting.
Item 12. Exhibits.
(a)(1) Not applicable.
(a)(2) Certification of principal executive officer and principal financial officer pursuant to Rule 30a-2(a) of the Investment Company Act.
(a)(3) Not applicable.
(b) Certification of principal executive officer and principal financial officer pursuant to Rule 30a-2(b) of the Investment Company Act and Section 906 of the Sarbanes-Oxley Act of 2002.
SIGNATURES
Pursuant to the requirements of the Securities Exchange Act of 1934 and the Investment Company Act of 1940, the registrant has duly caused this report to be signed on its behalf by the undersigned, thereunto duly authorized.
(Registrant) Advent/Claymore Enhanced Growth & Income Fund
By: /s/ Tracy V. Maitland
_____________________________________________________________________
Name: Tracy V. Maitland
Title: President and Chief Executive Officer
Date: July 6, 2010
Pursuant to the requirements of the Securities Exchange Act of 1934 and the Investment Company Act of 1940, this report has been signed by the following persons on behalf of the registrant and in the capacities and on the dates indicated.
By: /s/ Tracy V. Maitland
_____________________________________________________________________
Name: Tracy V. Maitland
Title: President and Chief Executive Officer
Date: July 6, 2010
By: /s/ Robert White
_____________________________________________________________________
Name: Robert White
Title: Treasurer and Chief Financial Officer
Date: July 6, 2010