
UNITED STATES
SECURITIES AND EXCHANGE COMMISSION
Washington, D.C. 20549
FORMN-CSRS
CERTIFIED SHAREHOLDER REPORT OF REGISTERED
MANAGEMENT INVESTMENT COMPANIES
Investment Company Act file number:811-21507
Wells Fargo Utilities and High Income Fund
(Exact name of registrant as specified in charter)
525 Market St., San Francisco, CA 94105
(Address of principal executive offices) (Zip code)
Catherine Kennedy
Wells Fargo Funds Management, LLC
525 Market St., San Francisco, CA 94105
(Name and address of agent for service)
Registrant’s telephone number, including area code:800-222-8222
Date of fiscal year end: August 31
Date of reporting period: February 29, 2020
ITEM 1. REPORT TO STOCKHOLDERS
Semi-Annual Report
February 29, 2020
Wells Fargo
Utilities and High Income Fund (ERH)
Beginning on January 1, 2021, as permitted by new regulations adopted by the Securities and Exchange Commission, paper copies of the Wells Fargo Funds’ annual and semi-annual shareholder reports issued after this date will no longer be sent by mail, unless you specifically request paper copies of the reports. Instead, the reports will be made available on the Funds’ website, and you will be notified by mail each time a report is posted and provided with a website address to access the report.
If you already elected to receive shareholder reports electronically, you will not be affected by this change and you need not take any action. You may elect to receive shareholder reports and other communications from the Fund electronically at any time by contacting your financial intermediary (such as a broker-dealer or bank) or, if you are a direct investor, by calling 1-800-730-6001.
You may elect to receive all future reports in paper free of charge. If you invest through a financial intermediary, you can contact your financial intermediary to request that you continue to receive paper copies of your shareholder reports; if you invest directly with the Fund, you can call 1-800-730-6001. Your election to receive reports in paper will apply to all Wells Fargo Funds held in your account with your financial intermediary or, if you are a direct investor, to all Wells Fargo Funds that you hold.
Managed Distribution Plan
Pursuant to an exemptive order issued by the Securities and Exchange Commission (“Order”), the Fund is authorized to distribute long-term capital gains to shareholders more frequently than once per year. Pursuant to the Order, the Fund’s Board of Trustees approved a Managed Distribution Plan (“MDP”) for the Fund pursuant to which the Fund makes monthly cash distributions to common shareholders, stated in terms of a fixed amount per common share.
The Fund’s Board has adopted a managed distribution plan for the Fund at an annual minimum fixed rate of 7.5% based on the Fund’s average monthly NAV per share over the prior 12 months. The Fund makes distributions monthly. You should not draw any conclusions about the Fund’s investment performance from the amount of these distributions or from the terms of the MDP. The MDP will be subject to regular periodic review by the Board and the Board may amend or terminate the MDP at any time without prior notice to Fund shareholders. However, at this time there are no reasonably foreseeable circumstances that might cause the termination of the MDP.
The Fund may distribute more than its income and net realized capital gains and, therefore, a portion of your distribution may be a return of capital. A return of capital may occur, for example, when some or all of the money that you invested in the Fund is paid back to you. A return of capital distribution does not necessarily reflect the Fund’s investment performance and should not be confused with ‘yield’ or ‘income’.
With each distribution, the Fund will issue a notice to shareholders and a press release containing information about the amount and sources of the distribution and other related information. The amounts and sources of distributions reported in the notice and press release are only estimates and are not provided for tax reporting purposes. The actual amounts and sources of the amounts for tax reporting purposes will depend upon the Fund’s investment experience during its fiscal year and may be subject to changes based on tax regulations. The Fund will send you a Form1099-DIV for the calendar year that will tell you how to report these distributions for federal income tax purposes.
Wells Fargo Utilities and High Income Fund (ERH) | 1
|
|
|
Reduce clutter. Save trees. |
Sign up for electronic delivery of prospectuses and shareholder reports atwellsfargo.com/advantagedelivery |
The views expressed and any forward-looking statements are as of February 29, 2020, unless otherwise noted, and are those of the Fund managers and/or Wells Fargo Asset Management. Discussions of individual securities, or the markets generally, or any Wells Fargo Fund are not intended as individual recommendations. Future events or results may vary significantly from those expressed in any forward-looking statements. The views expressed are subject to change at any time in response to changing circumstances in the market. Wells Fargo Asset Management and the Fund disclaim any obligation to publicly update or revise any views expressed or forward-looking statements.
INVESTMENT PRODUCTS: NOT FDIC INSURED ◾ NO BANK GUARANTEE ◾ MAY LOSE VALUE
Wells Fargo Utilities and High Income Fund (ERH) | 1
Letter to shareholders (unaudited)

Andrew Owen
President
Wells Fargo Funds
“The fourth quarter started on a strong note, withU.S.-China trade tensions relaxing in October along with renewed optimism for a U.K. Brexit deal and positive macroeconomic data. ”
Dear Shareholder:
We are pleased to offer you this semi-annual report for the Wells Fargo Utilities and High Income Fund for thesix-month period that ended February 29, 2020. As market volatility increased, returns for the period were more restrained after strong results in previous recent periods. However, supportive central banks addressed concerns over slowing global economic growth and international trade tensions.
Fixed-income and equity investors had mixed semi-annual returns. For the period, U.S. stocks, based on the S&P 500 Index,1 gained 1.92% and international stocks, as measured by the MSCI ACWI ex USA Index (Net),2 returned 0.13%. The MSCI EM Index (Net)3 gained 2.93%. For bond investors, the Bloomberg Barclays U.S. Aggregate Bond Index4 added 3.39%, the Bloomberg Barclays Global Aggregateex-USD Index5 returned-0.21%, the Bloomberg Barclays Municipal Bond Index6 gained 3.04%, and the ICE BofA U.S. High Yield Index7 added 1.34%.
The period began with uncertainty, leading to central bank support.
In September, as the period began, the U.S. Federal Reserve (Fed) cut interest rates a second time in the third quarter. U.S. manufacturing data disappointed investors. The U.S. Congress announced it would pursue an impeachment investigation of President Trump. Meanwhile, the Brexit impasse showed no signs of resolution. Officials in China warned it would be difficult to reach the country’s annual economic growth goals considering the weight of tariffs and trade restrictions. Although the S&P 500 Index finished the third quarter with the bestyear-to-date returns in more than 20 years, concerns about future returns remained.
The fourth quarter started on a strong note, with U.S.-China trade tensions relaxing in October along with renewed optimism for a U.K. Brexit deal and positive macroeconomic data. The initial estimate of U.S. third-quarter gross domestic product growth was a resilient 1.9% annualized rate, while the U.S. unemployment rate fell to a50-year low of 3.5% in September. However, despite resilience among U.S. consumers, business confidence declined while manufacturing activity contracted. Concerned with a potential economic slowdown, the Fed lowered interest rates another quarter point in late October—its third rate cut in four months. This helped push the S&P 500 Index to anall-time high, while emerging market equities rallied and global bonds declined overall, reflecting a broad pickup in risk appetite.
Equity markets continued to rally in November despite ongoing geopolitical risks. Hopes for a U.S.-China trade deal buoyed investor confidence. U.S. business sentiment improved
| 1 | The S&P 500 Index consists of 500 stocks chosen for market size, liquidity, and industry group representation. It is a market-value-weighted index with each stock’s weight in the index proportionate to its market value. You cannot invest directly in an index. |
| 2 | The Morgan Stanley Capital International (MSCI) All Country World Index (ACWI) ex USA Index (Net) is a free-float-adjusted market-capitalization-weighted index that is designed to measure the equity market performance of developed markets, excluding the United States. Source: MSCI. MSCI makes no express or implied warranties or representations and shall have no liability whatsoever with respect to any MSCI data contained herein. The MSCI data may not be further redistributed or used as a basis for other indices or any securities or financial products. This report is not approved, reviewed, or produced by MSCI. You cannot invest directly in an index. |
| 3 | The MSCI Emerging Markets (EM) Index (Net) is a free-float-adjusted market-capitalization-weighted index that is designed to measure equity market performance of emerging markets. You cannot invest directly in an index. |
| 4 | The Bloomberg Barclays U.S. Aggregate Bond Index is a broad-based benchmark that measures the investment-grade, U.S. dollar-denominated, fixed-rate taxable bond market, including Treasuries, government-related and corporate securities, mortgage-backed securities (agency fixed-rate and hybrid adjustable-rate mortgage pass-throughs), asset-backed securities, and commercial mortgage-backed securities. You cannot invest directly in an index. |
| 5 | The Bloomberg Barclays Global Aggregateex-USD Index is an unmanaged index that provides a broad-based measure of the global investment-grade fixed-income markets excluding the U.S. dollar-denominated debt market. You cannot invest directly in an index. |
| 6 | The Bloomberg Barclays Municipal Bond Index is an unmanaged index composed of long-termtax-exempt bonds with a minimum credit rating of Baa. You cannot invest directly in an index. |
| 7 | The ICE BofA U.S. High Yield Index is a market-capitalization-weighted index of domestic and Yankee high-yield bonds. The index tracks the performance of high-yield securities traded in the U.S. bond market. You cannot invest directly in an index. Copyright 2020. ICE Data Indices, LLC. All rights reserved. |
2 | Wells Fargo Utilities and High Income Fund (ERH)
Letter to shareholders (unaudited)
slightly, and manufacturing and services activity picked up. With that positive backdrop, developed market equities outpaced those in emerging markets, and U.S. stocks, as reflected by the S&P 500 Index, outperformednon-U.S. stocks overall. While consumer confidence and purchasing manager activity rose in the eurozone, China reported weakening manufacturing and consumer data. Bond yields rose marginally, leading to slightly negative returns for global government and investment-grade corporate bonds.
Financial markets ended 2019 with a boost from the U.S. and China accord on a Phase One trade deal. That, along with the landslide win by thepro-Brexit U.K. Conservative Party in a national election and ongoing central bank support, gave investors greater confidence. U.S. economic indicators were generally positive, with the exception of manufacturing activity and business confidence. Consumer confidence was resilient, fed by a robust labor market, tame inflation, and lower interest rates, which boosted housing affordability and stimulated homebuyer activity. The impeachment of U.S. President Donald Trump had little impact on markets. Meanwhile, slowing Chinese economic activity, partly attributable to the trade war, led to further government stimulus atyear-end through lower reserve ratios, allowing banks to lend more money.
Theyear-end rally continued in early January 2020. However, capital market volatility picked up sharply in late January on concerns over the unknown impact of the novel coronavirus(COVID-19) on the global economy and stock markets. With sentiment somewhat souring, perceived safe havens did well in January: The U.S. dollar and Japanese yen both rose and government bonds outperformed equities. While the S&P 500 Index held its ground, emerging market equities tumbled, including those in Asia that are most exposed to viruses—physical or economic—originating in China.
In February, the coronavirus became the major market focus. Fears of the virus’s impact on global growth led to expectations of increased global central bank monetary policy support. That led the10-year Treasury yield to fall to anall-time low of 1.1% by the end of the month. Although equity markets initially shrugged off concerns about the outbreak, focusing instead on strong fourth-quarter earnings and improving business confidence in January, market sentiment turned sharply lower towardmonth-end and the S&P 500 Index lost 8.2% for the month. Oil prices tumbled as Russia and the Organization of the Petroleum Exporting Countries compounded a major decline in oil demand with a brutal price war, partly aimed at dissuading further U.S. shale production. As a result, the price of West Texas Intermediate crude oil fell 13% in February and 27% for 2020 year to date.
Don’t let short-term uncertainty derail long-term investment goals.
Periods of investment uncertainty can present challenges, but experience has taught us that maintaining long-term investment goals can be an effective way to plan for the future. Although diversification cannot guarantee an investment profit or prevent losses, we believe it can be an effective way to manage investment risk and potentially smooth out overall portfolio performance. We encourage investors to know their investments and to understand that appropriate levels of risk-taking may unlock opportunities.
Thank you for choosing to invest with Wells Fargo Funds. We appreciate your confidence in us and remain committed to helping you meet your financial needs.
Sincerely,

Andrew Owen
President
Wells Fargo Funds
“Capital market volatility picked up sharply in late January on concerns over the unknown impact of the novel coronavirus(COVID-19) on the global economy and stock markets.”
|
|
|
For further information about your Fund, contact your investment professional, visit our website at wfam.com, or call us directly at1-800-222-8222. |
Wells Fargo Utilities and High Income Fund (ERH) | 3
Letter to shareholders (unaudited)
Notice to Shareholders
| | ∎ | | On November 22, 2019, the Fund announced an extension of its open-market share repurchase program (the “Buyback Program”). Under the extended Buyback Program, the Fund may repurchase up to 10% of its outstanding shares during the period in open market transactions beginning on January 1, 2020 and ending on December 31, 2020. The Fund’s Board of Trustees has delegated to Wells Fargo Funds Management, LLC, the Fund’s adviser, discretion to administer the Buyback Program including the determination of the amount and timing of repurchases in accordance with the best interests of the Fund and subject to applicable legal limitations. |
| | ∎ | | Effective November 22, 2019, following approval by the Board of Trustees, the Fund’s investment strategy was changed so that the weighted average duration range for high yield U.S. debt securities held by the Fund is six years or less. Wells Fargo Funds Management, LLC believes that this range is beneficial as it will allow the Fund to own shorter duration bonds when the portfolio managers believe they present more attractive risk/return profiles than those of longer duration bonds. |
4 | Wells Fargo Utilities and High Income Fund (ERH)
This page is intentionally left blank.
Performance highlights (unaudited)
Investment objective
The Fund seeks a high level of current income and moderate capital growth, with an emphasis on providingtax-advantaged dividend income.
Strategy summary
The Fund allocates its assets between two separate investment strategies, or sleeves. Under normal market conditions, the Fund will allocate approximately 70% of its total assets to a sleeve that places a focus on common, preferred and convertible preferred stocks of utility companies, and approximately 30% of its total assets to a sleeve of U.S. dollar denominatednon-investment-grade (high yield) debt.
Adviser
Wells Fargo Funds Management, LLC
Subadviser
Wells Capital Management Incorporated
Portfolio managers
Kent Newcomb, CFA®‡
Niklas Nordenfelt, CFA®‡
Jack Spudich, CFA®‡
Phillip Susser
Average annual total returns (%) as of February 29, 20201
| | | | | | | | | | | | | | |
| | | | |
| | | 6 months | | 1 year | | | 5 year | | | 10 year | |
| | | | | |
| Based on market value | | -1.46 | | | 2.84 | | | | 5.71 | | | | 5.22 | |
| | | | | |
| Based on net asset value (NAV) per share | | -0.30 | | | 4.87 | | | | 5.73 | | | | 8.73 | |
| | | | | |
| ERH Blended Index2 | | 1.23 | | | 10.84 | | | | 8.94 | | | | 10.74 | |
| | | | | |
| ICE BofA U.S. High Yield Constrained Index3 | | 1.34 | | | 5.91 | | | | 5.17 | | | | 7.14 | |
| | | | | |
| S&P 500 Utilities Sector Index4 | | 0.97 | | | 12.73 | | | | 10.36 | | | | 12.07 | |
Figures quoted represent past performance, which is no guarantee of future results, and do not reflect taxes that a shareholder may pay on an investment in a fund. Investment return and principal value of an investment will fluctuate so that an investor’s shares, when sold, may be worth more or less than their original cost. Current performance may be lower or higher than the performance data quoted, which assumes the reinvestment of dividends and capital gains. Performance figures of the Fund do not reflect brokerage commissions that a shareholder would pay on the purchase and sale of shares. If taxes and such brokerage commissions had been reflected, performance would have been lower. To obtain performance information current to the most recentmonth-end, please call1-800-222-8222.
The Fund’s expense ratio for the six months ended February 29, 2020, was 1.43% which includes 0.50% of interest expense.
|
|
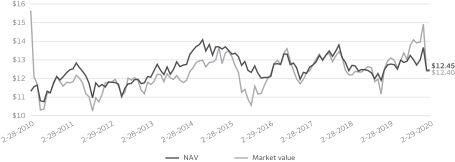
| Comparison of NAV vs. market value5 |
|
|
The Fund is leveraged through a revolving credit facility and also may incur leverage by issuing preferred shares in the future. The use of leverage results in certain risks, including, among others, the likelihood of greater volatility of net asset value and the market price of common shares. High-yield, lower-rated bonds may contain more risk due to the increased possibility of default. Foreign investments may contain more risk due to the inherent risks associated with changing political climates, foreign market instability, and foreign currency fluctuations. Risks of international investing are magnified in emerging or developing markets. Funds that concentrate their investments in a single industry or sector may face increased risk of price fluctuation due to adverse developments within that industry or sector. Small- andmid-cap securities may be subject to special risks associated with narrower product lines and limited financial resources compared with theirlarge-cap counterparts. Derivatives involve additional risks, including interest rate risk, credit risk, the risk of improper valuation, and the risk of noncorrelation to the relevant instruments they are designed to hedge or closely track. There are numerous risks associated with transactions in options on securities. Illiquid securities may be subject to wide fluctuations in market value and may be difficult to sell. Thisclosed-end fund is no longer available as an initial public offering and is only offered through broker-dealers on the secondary market. Aclosed-end fund is not required to buy its shares back from investors upon request.
Please see footnotes on page 9.
6 | Wells Fargo Utilities and High Income Fund (ERH)
Performance highlights (unaudited)
MANAGER’S DISCUSSION
Overview
The Fund’s return based on market value was-1.46% for thesix-month period that ended February 29, 2020. During the same period, the Fund’s return based on its net asset value (NAV) was-0.30%. The Fund underperformed the ERH Blended Index for the period.
For thesix-month period that ended February 29, 2020, the U.S. economy experienced solid growth, with real gross domestic product (GDP) increasing at an annualized rate of approximately 2.3%. Through late 2019 into early 2020, equity markets generally reflected signs of stabilizing growth, a more accommodative U.S. Federal Reserve (Fed), and confidence that trade disputes and other geopolitical concerns were not spiraling out of control. U.S. utilities stocks delivered positive returns in late 2019, as measured by the S&P 500 Utilities Sector Index, but they were capped by long bond yields that did not fall, even as the Fed worked to inject liquidity and bring down short-term yields.
Utilities stocks rallied strongly early in 2020, as concerns about international growth generally and the novel coronavirus specifically brought down bond yields. However, as the coronavirus(COVID-19) concerns spread fears of slow to nonexistent growth, equity markets in general pulled back sharply in the second half of February. Utilities stocks specifically ended thesix-month period roughly as they began.
Meanwhile, high-yield bonds returned 1.34%, as measured by the ICE BofA U.S. High Yield Constrained Index, with a positive return in every month until February 2020. Credit spread widening over the period more than offset a decline in U.S. Treasury yields, and the yield on the index increased.
| | | | |
|
| Ten largest holdings(%) as of February 29, 20206 | |
| | |
NextEra Energy Incorporated | | | 13.23 | |
| | |
American Electric Power Company Incorporated | | | 5.45 | |
| | |
Duke Energy Corporation | | | 5.08 | |
| | |
The Southern Company | | | 4.89 | |
| | |
Xcel Energy Incorporated | | | 4.59 | |
| | |
Exelon Corporation | | | 4.58 | |
| | |
Dominion Energy Incorporated | | | 4.57 | |
| | |
WEC Energy Group Incorporated | | | 4.16 | |
| | |
Eversource Energy | | | 4.10 | |
| | |
Sempra Energy | | | 3.70 | |
Detractors from performance
Significant detractors among the Fund’s equity investments relative to the S&P 500 Utilities Sector Index included Dominion Energy, Incorporated; IDACORP, Incorporated*; NextEra Energy, Incorporated; and Southern Company. Dominion Energy and Southern Company detracted from Fund performance due to underweight positions relative to the index, as these stocks outperformed the benchmark.
Within the high-yield sleeve of the Fund, sector allocation detracted from performance. An underweight to and selection in wirelines; underweights in banking, home construction, and wireless; and selection in health care and cable satellite all hurt performance. Ratings allocation and maturity allocation detracted very slightly from performance over the period. The Fund’s use of leverage had a negative impact on total return performance during this reporting period.
|
|
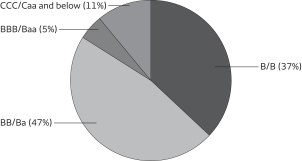
| Credit qualityas of February 29, 20207 |
|
 |
|
|
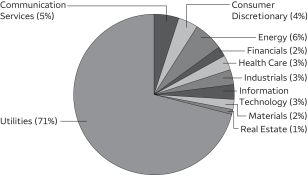
| Sector distributionas of February 29, 20208 |
|
 |
Please see footnotes on page 9.
Wells Fargo Utilities and High Income Fund (ERH) | 7
Performance highlights (unaudited)
|
|
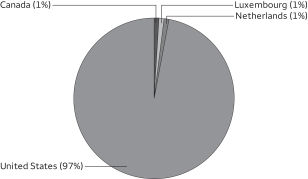
| Country allocationas of February 29, 20208 |
|
 |
Contributors to performance
Within the Fund’s equity investment sleeve, contributors to performance included American Water Works Company, Incorporated, and WEC Energy Group Incorporated. The Fund benefited from an underweight position in Exelon Corporation relative to its weight in the S&P 500 Utilities Sector Index as the company underperformed the benchmark return. The portfolio also benefited from the performance of NSTAR Electric Company*.
Within the Fund’s high-yield bond portfolio sleeve, selection within the media entertainment, electric, packaging, and consumer cyclical services sectors benefited performance, along with an underweight to leisure.
Portfolio changes
During thesix-month period, the Fund sold its equity-sleeve foreign holdings, preferred shares, and anon-utilities common stock holding. The Fund added a number of stocks that are included in the S&P 500 Utilities Sector Index. It also adjusted weightings to other benchmark holdings and sold several benchmark names. The portfolio managers believe that the net effect of these moves will be to reduce risk relative to the benchmark while shifting to higher-conviction positions.
Outlook from the Fund’s equities manager: Despite slow growth, fundamental long-term outlook still positive
The market pullback extending frommid-February through period end moved utilities stocks from a generally overvalued and overbought position to a more reasonable valuation range, in our opinion. Relative to history, valuations appear high, but a positive long-term fundamental outlook and historically low interest rates support current prices. The regulatory environment appears favorable, and long-term capital spending plans to modernize the grid and replace coal with natural gas and renewable forms of energy bode well for earnings and dividend growth. Interest rates may be signaling a sustained period of slow economic growth. In such an environment, we would expect utility stocks to deliver competitive relative returns given their defensive nature and a relatively clear path for moderate growth.
Outlook from the Fund’s high-yield manager: Slowing economic activity, uncertainty on how long
Going into the period, the market was supported by solid and consistent GDP growth, lack of aggressive issuance over the past several years, and a relatively low default rate. As a result, credit spreads were tighter than long-term averages, as they generally have been over the past several years. However, as is often the case, these periods of calm end with an abrupt surprise.
This January, the surprise came in the form ofCOVID-19. The reaction to the spread of the coronavirus has raised fears that consumer behavior could be altered, resulting in a global economic recession. To the extent that consumers and businesses adjust their behavior to avoid social interaction, the more likely economic activity will slow. There is considerable debate about how long the outbreak will persist as well as what the coronavirus mortality rates are and how long it will take to develop an eventual vaccine. The ultimate economic impact will depend on how consumers behave, whether it is at the command of government rules or by individual concerns that certain activities put people at greater risk. Initially, there were obvious businesses at risk, such as airlines and cruise ships, but we believe that if the virus continues to spread and the slowdown persists, many more companies will be affected by lower sales and earnings, including energy companies. If this actually happens, we would expect high-yield bonds, along with all risk assets, to trade off further. Ultimately, we are optimistic that life will return to “normal,” we hope as a result of a cure or vaccine, and at that point we would expect the high-yield and equity markets to rebound strongly.
Please see footnotes on page 9.
8 | Wells Fargo Utilities and High Income Fund (ERH)
Performance highlights (unaudited)
| ‡ | CFA® and Chartered Financial Analyst® are trademarks owned by CFA Institute. |
| 1 | Total returns based on market value are calculated assuming a purchase of common stock on the first day and a sale on the last day of the period reported. Total returns based on NAV are calculated based on the NAV at the beginning of the period and at the end of the period. Dividends and distributions, if any, are assumed for the purposes of these calculations to be reinvested at prices obtained under the Fund’s Automatic Dividend Reinvestment Plan. |
| 2 | Source: Wells Fargo Funds Management LLC. The ERH Blended Index is weighted 70% in S&P 500 Utilities Sector Index and 30% in the ICE BofA U.S. High Yield Constrained Index. Effective October 15, 2019, the ERH Blended Index changed the high yield component of the index from the ICE BofA U.S. High Yield Index with the ICE BofA U.S. High Yield Constrained Index in order to better match the Fund’s investment strategy. You cannot invest directly in an index. |
The ICE BofA U.S. High Yield Index is a market-capitalization-weighted index of domestic and Yankee high-yield bonds. The index tracks the performance of high-yield securities traded in the U.S. bond market. You cannot invest directly in an index. Copyright 2020. ICE Data Indices, LLC. All rights reserved.
| 3 | The ICE BofA U.S. High Yield Constrained Index is a market-value-weighted index of all domestic and Yankee high-yield bonds, including deferred interest bonds andpayment-in-kind securities. Issues included in the index have maturities of one year or more and have a credit rating lower thanBBB-/Baa3 but are not in default. The ICE BofA U.S. High Yield Constrained Index limits any individual issuer to a maximum of 2% benchmark exposure. You cannot invest directly in an index. |
| 4 | The S&P 500 Utilities Sector Index is a market-value-weighted index that measures the performance of all stocks within the utilities sector of the S&P 500 Index. You cannot invest directly in an index. |
| 5 | This chart does not reflect any brokerage commissions charged on the purchase and sale of the Fund’s common stock. Dividends and distributions paid by the Fund are included in the Fund’s average annual total returns but have the effect of reducing the Fund’s NAV. |
| 6 | The ten largest holdings, excluding cash, cash equivalents and any money market funds, are calculated based on the value of the investments divided by total net assets of the Fund. Holdings are subject to change and may have changed since the date specified. |
| 7 | The credit quality distribution of portfolio holdings reflected in the chart is based on ratings from Standard & Poor’s, Moody’s Investors Service, and/or Fitch Ratings Ltd. Credit quality ratings apply to the underlying holdings of the Fund and not to the Fund itself. The percentages of the Fund’s portfolio with the ratings depicted in the chart are calculated based on the total market value of fixed income securities held by the Fund. If a security was rated by all three rating agencies, the middle rating was utilized. If rated by two of three rating agencies, the lower rating was utilized, and if rated by one of the rating agencies, that rating was utilized. Standard & Poor’s rates the creditworthiness of bonds, ranging from AAA (highest) to D (lowest). Ratings from A to CCC may be modified by the addition of a plus (+) or minus (-) sign to show relative standing within the rating categories. Standard & Poor’s rates the creditworthiness of short-term notes fromSP-1 (highest) toSP-3 (lowest).Moody’s rates the creditworthiness of bonds, ranging from Aaa (highest) to C (lowest). Ratings Aa to B may be modified by the addition of a number 1 (highest) to 3 (lowest) to show relative standing within the ratings categories. Moody’s rates the creditworthiness of short-term U.S.tax-exempt municipal securities from MIG 1/VMIG 1 (highest) to SG (lowest). Fitch rates the creditworthiness of bonds, ranging from AAA (highest) to D (lowest). Credit quality distribution is subject to change and may have changed since the date specified. |
| 8 | Amounts are calculated based on the total long-term investments of the Fund. These percentages are subject to change and may have changed since the date specified. |
| * | This security was no longer held at the end of the reporting period. |
Wells Fargo Utilities and High Income Fund (ERH) | 9
Portfolio of investments—February 29, 2020 (unaudited)
| | | | | | | | | | | | | | | | |
| | | | | | | | | Shares | | | Value | |
| Common Stocks: 81.26% | | | | | | | | | | | | |
| | | | |
Energy: 0.14% | | | | | | | | | | | | | | | | |
| | | | |
| Energy Equipment & Services: 0.14% | | | | | | | | | | | | |
Bristow Group Incorporated (a)‡† | | | | | | | | | | | 4,945 | | | $ | 94,830 | |
Bristow Group Incorporated (a)‡† | | | | | | | | | | | 3,510 | | | | 67,336 | |
| | | | |
| | | | | | | | | | | | | | | 162,166 | |
| | | | | | | | | | | | | | | | |
| | | | |
Utilities: 81.12% | | | | | | | | | | | | | | | | |
| | | | |
| Electric Utilities: 48.55% | | | | | | | | | | | | |
Alliant Energy Corporation | | | | | | | | | | | 20,391 | | | | 1,062,779 | |
American Electric Power Company Incorporated | | | | | | | | | | | 70,494 | | | | 6,292,294 | |
Duke Energy Corporation | | | | | | | | | | | 63,986 | | | | 5,867,516 | |
Edison International | | | | | | | | | | | 28,506 | | | | 1,915,318 | |
Entergy Corporation | | | | | | | | | | | 26,186 | | | | 3,061,405 | |
Eversource Energy | | | | | | | | | | | 54,793 | | | | 4,737,403 | |
Exelon Corporation | | | | | | | | | | | 122,690 | | | | 5,289,166 | |
NextEra Energy Incorporated | | | | | | | | | | | 60,427 | | | | 15,273,529 | |
Pinnacle West Capital Corporation | | | | | | | | | | | 17,919 | | | | 1,603,571 | |
The Southern Company | | | | | | | | | | | 93,604 | | | | 5,649,937 | |
Xcel Energy Incorporated | | | | | | | | | | | 85,039 | | | | 5,299,630 | |
| | | | |
| | | | | | | | | | | | | | | 56,052,548 | |
| | | | | | | | | | | | | | | | |
| | | | |
| Gas Utilities: 1.75% | | | | | | | | | | | | |
Atmos Energy Corporation | | | | | | | | | | | 19,600 | | | | 2,023,700 | |
| | | | | | | | | | | | | | | | |
| | | | |
| Multi-Utilities: 27.32% | | | | | | | | | | | | |
Ameren Corporation | | | | | | | | | | | 38,992 | | | | 3,080,368 | |
CenterPoint Energy Incorporated | | | | | | | | | | | 55,665 | | | | 1,281,408 | |
CMS Energy Corporation | | | | | | | | | | | 59,487 | | | | 3,594,205 | |
Consolidated Edison Incorporated | | | | | | | | | | | 35,329 | | | | 2,784,632 | |
Dominion Energy Incorporated | | | | | | | | | | | 67,465 | | | | 5,274,414 | |
DTE Energy Company | | | | | | | | | | | 28,180 | | | | 3,146,861 | |
Public Service Enterprise Group Incorporated | | | | | | | | | | | 64,468 | | | | 3,307,853 | |
Sempra Energy | | | | | | | | | | | 30,520 | | | | 4,266,086 | |
WEC Energy Group Incorporated | | | | | | | | | | | 52,049 | | | | 4,805,684 | |
| | | | |
| | | | | | | | | | | | | | | 31,541,511 | |
| | | | | | | | | | | | | | | | |
| | | | |
| Water Utilities: 3.50% | | | | | | | | | | | | |
American Water Works Company Incorporated | | | | | | | | | | | 32,621 | | | | 4,033,913 | |
| | | | | | | | | | | | | | | | |
| | | | |
Total Common Stocks (Cost $90,376,887) | | | | | | | | | | | | | | | 93,813,838 | |
| | | | | | | | | | | | | | | | |
| | | | |
| | | | | | | | | | | | | | | | |
| | | Interest rate | | | Maturity date | | | Principal | | | | |
| Corporate Bonds and Notes: 30.91% | | | | | | | | | | | | |
| | | | |
Communication Services: 4.94% | | | | | | | | | | | | | | | | |
| | | | |
| Diversified Telecommunication Services: 0.32% | | | | | | | | | | | | |
Level 3 Financing Incorporated 144A | | | 4.63 | % | | | 9-15-2027 | | | $ | 50,000 | | | | 51,000 | |
Level 3 Financing Incorporated | | | 5.13 | | | | 5-1-2023 | | | | 75,000 | | | | 75,188 | |
Level 3 Financing Incorporated | | | 5.38 | | | | 8-15-2022 | | | | 105,000 | | | | 105,473 | |
Level 3 Financing Incorporated | | | 5.38 | | | | 1-15-2024 | | | | 50,000 | | | | 49,876 | |
Level 3 Financing Incorporated | | | 5.63 | | | | 2-1-2023 | | | | 90,000 | | | | 90,338 | |
| | | | |
| | | | | | | | | | | | | | | 371,875 | |
| | | | | | | | | | | | | | | | |
The accompanying notes are an integral part of these financial statements.
10 | Wells Fargo Utilities and High Income Fund (ERH)
Portfolio of investments—February 29, 2020 (unaudited)
| | | | | | | | | | | | | | | | |
| | | Interest
rate | | | Maturity
date | | | Principal | | | Value | |
|
| Media: 3.91% | |
Block Communications Incorporated 144A | | | 4.88 | % | | | 3-1-2028 | | | $ | 25,000 | | | $ | 25,088 | |
CCO Holdings LLC 144A | | | 4.50 | | | | 8-15-2030 | | | | 50,000 | | | | 50,563 | |
CCO Holdings LLC 144A | | | 5.00 | | | | 2-1-2028 | | | | 25,000 | | | | 26,000 | |
CCO Holdings LLC | | | 5.13 | | | | 2-15-2023 | | | | 125,000 | | | | 125,938 | |
CCO Holdings LLC 144A | | | 5.13 | | | | 5-1-2023 | | | | 135,000 | | | | 136,580 | |
CCO Holdings LLC 144A | | | 5.13 | | | | 5-1-2027 | | | | 50,000 | | | | 51,985 | |
CCO Holdings LLC | | | 5.25 | | | | 9-30-2022 | | | | 90,000 | | | | 90,986 | |
CCO Holdings LLC 144A | | | 5.38 | | | | 5-1-2025 | | | | 300,000 | | | | 308,280 | |
CCO Holdings LLC 144A | | | 5.50 | | | | 5-1-2026 | | | | 5,000 | | | | 5,188 | |
CCO Holdings LLC | | | 5.75 | | | | 9-1-2023 | | | | 50,000 | | | | 50,475 | |
CCO Holdings LLC 144A | | | 5.75 | | | | 2-15-2026 | | | | 300,000 | | | | 311,910 | |
CCO Holdings LLC 144A | | | 5.88 | | | | 4-1-2024 | | | | 125,000 | | | | 128,400 | |
Communications Finance Incorporated | | | 6.88 | | | | 9-1-2027 | | | | 50,000 | | | | 48,440 | |
CSC Holdings LLC 144A | | | 5.38 | | | | 7-15-2023 | | | | 200,000 | | | | 204,880 | |
CSC Holdings LLC 144A | | | 5.50 | | | | 5-15-2026 | | | | 200,000 | | | | 207,071 | |
CSC Holdings LLC 144A | | | 7.50 | | | | 4-1-2028 | | | | 200,000 | | | | 225,500 | |
CSC Holdings LLC 144A | | | 7.75 | | | | 7-15-2025 | | | | 100,000 | | | | 105,250 | |
Diamond Sports Group LLC 144A | | | 5.38 | | | | 8-15-2026 | | | | 25,000 | | | | 23,051 | |
Diamond Sports Group LLC 144A | | | 6.63 | | | | 8-15-2027 | | | | 25,000 | | | | 20,250 | |
DISH Network Corporation | | | 3.38 | | | | 8-15-2026 | | | | 125,000 | | | | 120,688 | |
Gray Television Incorporated 144A | | | 5.13 | | | | 10-15-2024 | | | | 100,000 | | | | 102,500 | |
Gray Television Incorporated 144A | | | 5.88 | | | | 7-15-2026 | | | | 350,000 | | | | 359,958 | |
Gray Television Incorporated 144A | | | 7.00 | | | | 5-15-2027 | | | | 100,000 | | | | 108,475 | |
Lamar Media Corporation 144A | | | 3.75 | | | | 2-15-2028 | | | | 125,000 | | | | 125,350 | |
Lamar Media Corporation 144A | | | 4.00 | | | | 2-15-2030 | | | | 125,000 | | | | 125,000 | |
Match Group Incorporated 144A | | | 4.13 | | | | 8-1-2030 | | | | 25,000 | | | | 24,493 | |
Nexstar Broadcasting Incorporated 144A | | | 5.63 | | | | 7-15-2027 | | | | 300,000 | | | | 310,515 | |
Nielsen Finance LLC 144A | | | 5.00 | | | | 4-15-2022 | | | | 300,000 | | | | 298,500 | |
Outfront Media Capital Corporation 144A | | | 4.63 | | | | 3-15-2030 | | | | 50,000 | | | | 50,140 | |
Outfront Media Capital Corporation | | | 5.63 | | | | 2-15-2024 | | | | 54,000 | | | | 55,013 | |
QVC Incorporated | | | 4.75 | | | | 2-15-2027 | | | | 25,000 | | | | 24,600 | |
Salem Media Group Incorporated 144A | | | 6.75 | | | | 6-1-2024 | | | | 350,000 | | | | 336,000 | |
Scripps Escrow Incorporated 144A | | | 5.88 | | | | 7-15-2027 | | | | 25,000 | | | | 25,938 | |
The E.W. Scripps Company 144A | | | 5.13 | | | | 5-15-2025 | | | | 300,000 | | | | 300,750 | |
| | | | |
| | | | | | | | | | | | | | | 4,513,755 | |
| | | | | | | | | | | | | | | | |
|
| Wireless Telecommunication Services: 0.71% | |
Connect U.S. Finco LLC 144A | | | 6.75 | | | | 10-1-2026 | | | | 75,000 | | | | 76,313 | |
Sprint Capital Corporation | | | 8.75 | | | | 3-15-2032 | | | | 125,000 | | | | 173,750 | |
T-Mobile USA Incorporated | | | 4.00 | | | | 4-15-2022 | | | | 50,000 | | | | 51,313 | |
T-Mobile USA Incorporated | | | 4.75 | | | | 2-1-2028 | | | | 25,000 | | | | 26,031 | |
T-Mobile USA Incorporated | | | 5.13 | | | | 4-15-2025 | | | | 25,000 | | | | 25,688 | |
T-Mobile USA Incorporated | | | 5.38 | | | | 4-15-2027 | | | | 175,000 | | | | 185,063 | |
T-Mobile USA Incorporated | | | 6.00 | | | | 3-1-2023 | | | | 25,000 | | | | 25,313 | |
T-Mobile USA Incorporated | | | 6.38 | | | | 3-1-2025 | | | | 145,000 | | | | 149,079 | |
T-Mobile USA Incorporated | | | 6.50 | | | | 1-15-2024 | | | | 5,000 | | | | 5,119 | |
T-Mobile USA Incorporated | | | 6.50 | | | | 1-15-2026 | | | | 100,000 | | | | 105,280 | |
| | | | |
| | | | | | | | | | | | | | | 822,949 | |
| | | | | | | | | | | | | | | | |
|
Consumer Discretionary: 4.59% | |
|
| Auto Components: 0.77% | |
Allison Transmission Incorporated 144A | | | 4.75 | | | | 10-1-2027 | | | | 75,000 | | | | 76,875 | |
Allison Transmission Incorporated 144A | | | 5.00 | | | | 10-1-2024 | | | | 425,000 | | | | 429,764 | |
Allison Transmission Incorporated 144A | | | 5.88 | | | | 6-1-2029 | | | | 50,000 | | | | 54,188 | |
The accompanying notes are an integral part of these financial statements.
Wells Fargo Utilities and High Income Fund (ERH) | 11
Portfolio of investments—February 29, 2020 (unaudited)
| | | | | | | | | | | | | | | | |
| | | Interest
rate | | | Maturity
date | | | Principal | | | Value | |
|
| Auto Components (continued) | |
Cooper Tire & Rubber Company | | | 7.63 | % | | | 3-15-2027 | | | $ | 257,000 | | | $ | 299,405 | |
Panther BF Aggregator 2 LP 144A | | | 6.25 | | | | 5-15-2026 | | | | 25,000 | | | | 25,680 | |
| | | | |
| | | | | | | | | | | | | | | 885,912 | |
| | | | | | | | | | | | | | | | |
|
| Diversified Consumer Services: 0.82% | |
Carriage Services Incorporated 144A | | | 6.63 | | | | 6-1-2026 | | | | 225,000 | | | | 231,838 | |
Service Corporation International | | | 4.63 | | | | 12-15-2027 | | | | 100,000 | | | | 104,750 | |
Service Corporation International | | | 7.50 | | | | 4-1-2027 | | | | 425,000 | | | | 518,500 | |
Service Corporation International | | | 8.00 | | | | 11-15-2021 | | | | 85,000 | | | | 90,950 | |
| | | | |
| | | | | | | | | | | | | | | 946,038 | |
| | | | | | | | | | | | | | | | |
|
| Hotels, Restaurants & Leisure: 0.93% | |
CCM Merger Incorporated 144A | | | 6.00 | | | | 3-15-2022 | | | | 425,000 | | | | 429,250 | |
Hilton Domestic Operating Company Incorporated | | | 4.88 | | | | 1-15-2030 | | | | 250,000 | | | | 259,063 | |
KFC Holding Company 144A | | | 5.00 | | | | 6-1-2024 | | | | 100,000 | | | | 100,788 | |
Wyndham Hotels & Resorts Company 144A | | | 5.38 | | | | 4-15-2026 | | | | 225,000 | | | | 233,236 | |
Yum! Brands Incorporated 144A | | | 4.75 | | | | 1-15-2030 | | | | 50,000 | | | | 51,881 | |
| | | | |
| | | | | | | | | | | | | | | 1,074,218 | |
| | | | | | | | | | | | | | | | |
|
| Specialty Retail: 1.70% | |
Asbury Automotive Group Incorporated 144A | | | 4.50 | | | | 3-1-2028 | | | | 125,000 | | | | 125,250 | |
Asbury Automotive Group Incorporated 144A | | | 4.75 | | | | 3-1-2030 | | | | 100,000 | | | | 101,750 | |
Asbury Automotive Group Incorporated | | | 6.00 | | | | 12-15-2024 | | | | 350,000 | | | | 360,500 | |
Group 1 Automotive Incorporated | | | 5.00 | | | | 6-1-2022 | | | | 125,000 | | | | 124,533 | |
Group 1 Automotive Incorporated 144A | | | 5.25 | | | | 12-15-2023 | | | | 170,000 | | | | 171,559 | |
Lithia Motors Incorporated 144A | | | 5.25 | | | | 8-1-2025 | | | | 350,000 | | | | 364,875 | |
Lithia Motors Incorporated 144A | | | 4.63 | | | | 12-15-2027 | | | | 25,000 | | | | 25,592 | |
Penske Auto Group Incorporated | | | 3.75 | | | | 8-15-2020 | | | | 50,000 | | | | 50,125 | |
Penske Auto Group Incorporated | | | 5.38 | | | | 12-1-2024 | | | | 300,000 | | | | 307,125 | |
Penske Auto Group Incorporated | | | 5.75 | | | | 10-1-2022 | | | | 125,000 | | | | 126,250 | |
Sonic Automotive Incorporated | | | 6.13 | | | | 3-15-2027 | | | | 200,000 | | | | 209,000 | |
| | | | |
| | | | | | | | | | | | | | | 1,966,559 | |
| | | | | | | | | | | | | | | | |
|
| Textiles, Apparel & Luxury Goods: 0.37% | |
Levi Strauss & Company | | | 5.00 | | | | 5-1-2025 | | | | 100,000 | | | | 102,850 | |
The William Carter Company 144A | | | 5.63 | | | | 3-15-2027 | | | | 125,000 | | | | 132,991 | |
Wolverine World Wide Incorporated 144A | | | 5.00 | | | | 9-1-2026 | | | | 185,000 | | | | 191,090 | |
| | | | |
| | | | | | | | | | | | | | | 426,931 | |
| | | | | | | | | | | | | | | | |
|
Consumer Staples: 0.43% | |
|
| Beverages: 0.04% | |
Cott Beverages Incorporated 144A | | | 5.50 | | | | 4-1-2025 | | | | 50,000 | | | | 51,167 | |
| | | | | | | | | | | | | | | | |
|
| Food & Staples Retailing: 0.04% | |
Albertsons Companies Incorporated 144A | | | 4.63 | | | | 1-15-2027 | | | | 25,000 | | | | 24,625 | |
Albertsons Companies Incorporated 144A | | | 4.88 | | | | 2-15-2030 | | | | 25,000 | | | | 25,000 | |
| | | | |
| | | | | | | | | | | | | | | 49,625 | |
| | | | | | | | | | | | | | | | |
|
| Food Products: 0.30% | |
Darling Ingredients Incorporated 144A | | | 5.25 | | | | 4-15-2027 | | | | 75,000 | | | | 78,750 | |
Pilgrim’s Pride Corporation 144A | | | 5.75 | | | | 3-15-2025 | | | | 110,000 | | | | 112,167 | |
Pilgrim’s Pride Corporation 144A | | | 5.88 | | | | 9-30-2027 | | | | 25,000 | | | | 25,908 | |
The accompanying notes are an integral part of these financial statements.
12 | Wells Fargo Utilities and High Income Fund (ERH)
Portfolio of investments—February 29, 2020 (unaudited)
| | | | | | | | | | | | | | | | |
| | | Interest
rate | | | Maturity
date | | | Principal | | | Value | |
|
| Food Products (continued) | |
Prestige Brands Incorporated 144A | | | 5.13 | % | | | 1-15-2028 | | | $ | 25,000 | | | $ | 26,125 | |
Prestige Brands Incorporated 144A | | | 6.38 | | | | 3-1-2024 | | | | 100,000 | | | | 103,083 | |
| | | | |
| | | | | | | | | | | | | | | 346,033 | |
| | | | | | | | | | | | | | | | |
|
| Household Products: 0.05% | |
Central Garden & Pet Company | | | 5.13 | | | | 2-1-2028 | | | | 25,000 | | | | 26,063 | |
Spectrum Brands Incorporated | | | 5.75 | | | | 7-15-2025 | | | | 25,000 | | | | 25,625 | |
| | | | |
| | | | | | | | | | | | | | | 51,688 | |
| | | | | | | | | | | | | | | | |
|
Energy: 5.61% | |
|
| Energy Equipment & Services: 0.94% | |
Bristow Group Incorporated (a)† | | | 6.25 | | | | 10-15-2022 | | | | 450,000 | | | | 0 | |
Diamond Offshore Drilling Incorporated | | | 4.88 | | | | 11-1-2043 | | | | 150,000 | | | | 60,470 | |
Era Group Incorporated | | | 7.75 | | | | 12-15-2022 | | | | 265,000 | | | | 265,000 | |
Hilcorp Energy Company 144A | | | 5.00 | | | | 12-1-2024 | | | | 150,000 | | | | 118,500 | |
Hilcorp Energy Company 144A | | | 5.75 | | | | 10-1-2025 | | | | 225,000 | | | | 180,000 | |
Hilcorp Energy Company 144A | | | 6.25 | | | | 11-1-2028 | | | | 75,000 | | | | 54,564 | |
NGPL PipeCo LLC 144A | | | 4.38 | | | | 8-15-2022 | | | | 50,000 | | | | 52,230 | |
Oceaneering International Incorporated | | | 6.00 | | | | 2-1-2028 | | | | 225,000 | | | | 205,470 | |
USA Compression Partners LP | | | 6.88 | | | | 4-1-2026 | | | | 150,000 | | | | 145,140 | |
| | | | |
| | | | | | | | | | | | | | | 1,081,374 | |
| | | | | | | | | | | | | | | | |
|
| Oil, Gas & Consumable Fuels: 4.67% | |
Antero Midstream Partners LP 144A | | | 5.75 | | | | 1-15-2028 | | | | 300,000 | | | | 205,935 | |
Antero Resources Corporation | | | 5.38 | | | | 11-1-2021 | | | | 50,000 | | | | 41,688 | |
Archrock Partners LP | | | 6.00 | | | | 10-1-2022 | | | | 75,000 | | | | 75,068 | |
Archrock Partners LP 144A | | | 6.25 | | | | 4-1-2028 | | | | 25,000 | | | | 24,065 | |
Archrock Partners LP 144A | | | 6.88 | | | | 4-1-2027 | | | | 100,000 | | | | 101,567 | |
Buckeye Partners LP | | | 5.85 | | | | 11-15-2043 | | | | 200,000 | | | | 184,000 | |
Carrizo Oil & Gas Incorporated | | | 8.25 | | | | 7-15-2025 | | | | 150,000 | | | | 133,500 | |
Carrizo Oil & Gas Incorporated | | | 6.25 | | | | 4-15-2023 | | | | 25,000 | | | | 21,126 | |
Cheniere Corpus Christi Holdings LLC | | | 5.13 | | | | 6-30-2027 | | | | 125,000 | | | | 135,766 | |
Cheniere Energy Partners LP 144A | | | 4.50 | | | | 10-1-2029 | | | | 50,000 | | | | 47,815 | |
Cheniere Energy Partners LP | | | 5.25 | | | | 10-1-2025 | | | | 525,000 | | | | 526,323 | |
Cheniere Energy Partners LP | | | 5.63 | | | | 10-1-2026 | | | | 150,000 | | | | 150,750 | |
Denbury Resources Incorporated | | | 6.38 | | | | 12-31-2024 | | | | 81,000 | | | | 42,732 | |
Denbury Resources Incorporated 144A | | | 7.75 | | | | 2-15-2024 | | | | 113,000 | | | | 63,337 | |
Denbury Resources Incorporated 144A | | | 9.00 | | | | 5-15-2021 | | | | 200,000 | | | | 175,000 | |
Denbury Resources Incorporated 144A | | | 9.25 | | | | 3-31-2022 | | | | 86,000 | | | | 68,800 | |
EnLink Midstream Partners LP | | | 4.40 | | | | 4-1-2024 | | | | 125,000 | | | | 114,091 | |
EnLink Midstream Partners LP | | | 4.85 | | | | 7-15-2026 | | | | 325,000 | | | | 278,281 | |
EnLink Midstream Partners LP | | | 5.05 | | | | 4-1-2045 | | | | 250,000 | | | | 181,763 | |
EnLink Midstream Partners LP | | | 5.45 | | | | 6-1-2047 | | | | 25,000 | | | | 18,118 | |
Enviva Partners LP 144A | | | 6.50 | | | | 1-15-2026 | | | | 150,000 | | | | 156,003 | |
Gulfport Energy Corporation | | | 6.00 | | | | 10-15-2024 | | | | 350,000 | | | | 116,375 | |
Indigo Natural Resources LLC 144A | | | 6.88 | | | | 2-15-2026 | | | | 75,000 | | | | 63,938 | |
Kinder Morgan Incorporated | | | 6.50 | | | | 9-15-2020 | | | | 45,000 | | | | 46,135 | |
Kinder Morgan Incorporated | | | 7.42 | | | | 2-15-2037 | | | | 90,000 | | | | 115,008 | |
MPLX LP 144A | | | 5.25 | | | | 1-15-2025 | | | | 50,000 | | | | 52,686 | |
MPLX LP 144A | | | 6.38 | | | | 5-1-2024 | | | | 25,000 | | | | 25,992 | |
Murphy Oil Corporation | | | 4.75 | | | | 9-15-2029 | | | | 150,000 | | | | 157,320 | |
Murphy Oil Corporation | | | 5.75 | | | | 8-15-2025 | | | | 15,000 | | | | 14,562 | |
Murphy Oil Corporation | | | 5.88 | | | | 12-1-2027 | | | | 25,000 | | | | 24,402 | |
Murphy Oil Corporation | | | 5.88 | | | | 12-1-2042 | | | | 75,000 | | | | 66,000 | |
The accompanying notes are an integral part of these financial statements.
Wells Fargo Utilities and High Income Fund (ERH) | 13
Portfolio of investments—February 29, 2020 (unaudited)
| | | | | | | | | | | | | | | | |
| | | Interest
rate | | | Maturity
date | | | Principal | | | Value | |
|
| Oil, Gas & Consumable Fuels (continued) | |
Rockies Express Pipeline LLC 144A | | | 3.60 | % | | | 5-15-2025 | | | $ | 125,000 | | | $ | 124,633 | |
Rockies Express Pipeline LLC 144A | | | 4.80 | | | | 5-15-2030 | | | | 125,000 | | | | 121,189 | |
Rockies Express Pipeline LLC 144A | | | 5.63 | | | | 4-15-2020 | | | | 300,000 | | | | 300,921 | |
Rockies Express Pipeline LLC 144A | | | 6.88 | | | | 4-15-2040 | | | | 150,000 | | | | 153,711 | |
Rockies Express Pipeline LLC 144A | | | 7.50 | | | | 7-15-2038 | | | | 55,000 | | | | 61,098 | |
Sabine Pass Liquefaction LLC | | | 5.63 | | | | 2-1-2021 | | | | 125,000 | | | | 127,918 | |
Sabine Pass Liquefaction LLC | | | 6.25 | | | | 3-15-2022 | | | | 100,000 | | | | 107,583 | |
Southern Star Central Corporation 144A | | | 5.13 | | | | 7-15-2022 | | | | 150,000 | | | | 151,985 | |
Southwestern Energy Company | | | 7.50 | | | | 4-1-2026 | | | | 50,000 | | | | 38,125 | |
Southwestern Energy Company | | | 7.75 | | | | 10-1-2027 | | | | 150,000 | | | | 113,625 | |
Summit Midstream Holdings LLC | | | 5.75 | | | | 4-15-2025 | | | | 25,000 | | | | 18,500 | |
Tallgrass Energy Partners LP 144A | | | 5.50 | | | | 9-15-2024 | | | | 450,000 | | | | 417,420 | |
Ultra Resources Incorporated 144A | | | 7.13 | | | | 4-15-2025 | | | | 425,000 | | | | 27,625 | |
Whiting Petroleum Corporation† | | | 1.25 | | | | 4-1-2020 | | | | 222,000 | | | | 198,135 | |
| | | | |
| | | | | | | | | | | | | | | 5,390,614 | |
| | | | | | | | | | | | | | | | |
|
Financials: 1.79% | |
|
| Banks: 0.02% | |
Citigroup Incorporated | | | 4.13 | | | | 3-9-2021 | | | | 5,000 | | | | 5,050 | |
Citigroup Incorporated | | | 6.13 | | | | 3-9-2028 | | | | 10,000 | | | | 12,000 | |
| | | | |
| | | | | | | | | | | | | | | 17,050 | |
| | | | | | | | | | | | | | | | |
|
| Consumer Finance: 0.84% | |
Ally Financial Incorporated | | | 8.00 | | | | 3-15-2020 | | | | 203,000 | | | | 203,386 | |
FirstCash Incorporated 144A | | | 5.38 | | | | 6-1-2024 | | | | 175,000 | | | | 178,938 | |
Navient Corporation | | | 8.00 | | | | 3-25-2020 | | | | 58,000 | | | | 58,203 | |
Springleaf Finance Corporation | | | 5.38 | | | | 11-15-2029 | | | | 100,000 | | | | 102,130 | |
Springleaf Finance Corporation | | | 6.13 | | | | 3-15-2024 | | | | 50,000 | | | | 52,692 | |
Springleaf Finance Corporation | | | 6.63 | | | | 1-15-2028 | | | | 125,000 | | | | 137,188 | |
Springleaf Finance Corporation | | | 7.13 | | | | 3-15-2026 | | | | 125,000 | | | | 138,750 | |
Springleaf Finance Corporation | | | 7.75 | | | | 10-1-2021 | | | | 25,000 | | | | 26,565 | |
Springleaf Finance Corporation | | | 8.25 | | | | 10-1-2023 | | | | 65,000 | | | | 74,100 | |
| | | | |
| | | | | | | | | | | | | | | 971,952 | |
| | | | | | | | | | | | | | | | |
|
| Diversified Financial Services: 0.40% | |
LPL Holdings Incorporated 144A | | | 5.75 | | | | 9-15-2025 | | | | 450,000 | | | | 466,875 | |
| | | | | | | | | | | | | | | | |
|
| Insurance: 0.53% | |
AmWINS Group Incorporated 144A | | | 7.75 | | | | 7-1-2026 | | | | 225,000 | | | | 233,579 | |
HUB International Limited 144A | | | 7.00 | | | | 5-1-2026 | | | | 125,000 | | | | 126,244 | |
NFP Corporation 144A | | | 6.88 | | | | 7-15-2025 | | | | 50,000 | | | | 50,001 | |
USI Incorporated 144A | | | 6.88 | | | | 5-1-2025 | | | | 200,000 | | | | 199,076 | |
| | | | |
| | | | | | | | | | | | | | | 608,900 | |
| | | | | | | | | | | | | | | | |
|
Health Care: 2.50% | |
|
| Health Care Equipment & Supplies: 0.49% | |
Hill-Rom Holdings Incorporated 144A | | | 4.38 | | | | 9-15-2027 | | | | 50,000 | | | | 51,755 | |
Hill-Rom Holdings Incorporated 144A | | | 5.00 | | | | 2-15-2025 | | | | 75,000 | | | | 77,790 | |
Hologic Incorporated 144A | | | 4.38 | | | | 10-15-2025 | | | | 250,000 | | | | 254,613 | |
Hologic Incorporated 144A | | | 4.63 | | | | 2-1-2028 | | | | 125,000 | | | | 129,651 | |
Surgery Center Holdings Incorporated 144A | | | 6.75 | | | | 7-1-2025 | | | | 50,000 | | | | 49,090 | |
| | | | |
| | | | | | | | | | | | | | | 562,899 | |
| | | | | | | | | | | | | | | | |
The accompanying notes are an integral part of these financial statements.
14 | Wells Fargo Utilities and High Income Fund (ERH)
Portfolio of investments—February 29, 2020 (unaudited)
| | | | | | | | | | | | | | | | |
| | | Interest
rate | | | Maturity
date | | | Principal | | | Value | |
| Health Care Providers & Services: 1.48% | |
Acadia Healthcare Company Incorporated | | | 6.50 | % | | | 3-1-2024 | | | $ | 20,000 | | | $ | 20,525 | |
Centene Corporation 144A | | | 5.38 | | | | 8-15-2026 | | | | 25,000 | | | | 26,250 | |
Centene Corporation | | | 6.13 | | | | 2-15-2024 | | | | 25,000 | | | | 25,768 | |
Community Health Systems Incorporated 144A | | | 6.63 | | | | 2-15-2025 | | | | 125,000 | | | | 127,500 | |
Davita Incorporated | | | 5.00 | | | | 5-1-2025 | | | | 125,000 | | | | 126,844 | |
Encompass Health Corporation | | | 4.50 | | | | 2-1-2028 | | | | 25,000 | | | | 25,283 | |
Encompass Health Corporation | | | 4.75 | | | | 2-1-2030 | | | | 25,000 | | | | 25,808 | |
Encompass Health Corporation | | | 5.75 | | | | 11-1-2024 | | | | 15,000 | | | | 15,132 | |
HealthSouth Corporation | | | 5.75 | | | | 9-15-2025 | | | | 75,000 | | | | 77,563 | |
MEDNAX Incorporated 144A | | | 5.25 | | | | 12-1-2023 | | | | 50,000 | | | | 48,938 | |
MEDNAX Incorporated 144A | | | 6.25 | | | | 1-15-2027 | | | | 75,000 | | | | 71,996 | |
MPH Acquisition Holdings LLC 144A | | | 7.13 | | | | 6-1-2024 | | | | 325,000 | | | | 302,322 | |
MPT Operating Partnership LP | | | 4.63 | | | | 8-1-2029 | | | | 50,000 | | | | 52,532 | |
MPT Operating Partnership LP | | | 5.00 | | | | 10-15-2027 | | | | 100,000 | | | | 104,351 | |
MPT Operating Partnership LP | | | 5.25 | | | | 8-1-2026 | | | | 150,000 | | | | 156,053 | |
MPT Operating Partnership LP | | | 6.38 | | | | 3-1-2024 | | | | 25,000 | | | | 25,781 | |
Polaris Intermediate Corporation 144A | | | 8.50 | | | | 12-1-2022 | | | | 50,000 | | | | 42,505 | |
Select Medical Corporation 144A | | | 6.25 | | | | 8-15-2026 | | | | 175,000 | | | | 186,594 | |
Tenet Healthcare Corporation | | | 4.63 | | | | 7-15-2024 | | | | 118,000 | | | | 118,002 | |
Tenet Healthcare Corporation 144A | | | 4.88 | | | | 1-1-2026 | | | | 75,000 | | | | 76,406 | |
Tenet Healthcare Corporation 144A | | | 5.13 | | | | 11-1-2027 | | | | 25,000 | | | | 25,969 | |
Vizient Incorporated 144A | | | 6.25 | | | | 5-15-2027 | | | | 25,000 | | | | 26,688 | |
| | | | |
| | | | | | | | | | | | | | | 1,708,810 | |
| | | | | | | | | | | | | | | | |
|
| Health Care Technology: 0.28% | |
Change Healthcare Holdings Incorporated 144A | | | 5.75 | | | | 3-1-2025 | | | | 325,000 | | | | 328,656 | |
| | | | | | | | | | | | | | | | |
|
| Life Sciences Tools & Services: 0.07% | |
Charles River Laboratories Incorporated 144A | | | 4.25 | | | | 5-1-2028 | | | | 25,000 | | | | 25,158 | |
Charles River Laboratories Incorporated 144A | | | 5.50 | | | | 4-1-2026 | | | | 25,000 | | | | 26,286 | |
Ortho-Clinical Diagnostics Incorporated 144A | | | 7.25 | | | | 2-1-2028 | | | | 25,000 | | | | 24,563 | |
| | | | |
| | | | | | | | | | | | | | | 76,007 | |
| | | | | | | | | | | | | | | | |
|
| Pharmaceuticals: 0.18% | |
Bausch Health Companies Incorporated 144A | | | 5.00 | | | | 1-30-2028 | | | | 50,000 | | | | 49,344 | |
Bausch Health Companies Incorporated 144A | | | 5.25 | | | | 1-30-2030 | | | | 50,000 | | | | 49,438 | |
Bausch Health Companies Incorporated 144A | | | 7.00 | | | | 1-15-2028 | | | | 100,000 | | | | 107,010 | |
| | | | |
| | | | | | | | | | | | | | | 205,792 | |
| | | | | | | | | | | | | | | | |
|
Industrials: 2.80% | |
|
| Aerospace & Defense: 0.61% | |
BBA US Holdings Incorporated 144A | | | 4.00 | | | | 3-1-2028 | | | | 100,000 | | | | 98,740 | |
BBA US Holdings Incorporated 144A | | | 5.38 | | | | 5-1-2026 | | | | 300,000 | | | | 306,107 | |
Moog Incorporated 144A | | | 4.25 | | | | 12-15-2027 | | | | 25,000 | | | | 25,438 | |
RBS Global & Rexnord LLC 144A | | | 4.88 | | | | 12-15-2025 | | | | 275,000 | | | | 277,786 | |
| | | | |
| | | | | | | | | | | | | | | 708,071 | |
| | | | | | | | | | | | | | | | |
|
| Air Freight & Logistics: 0.07% | |
Cargo Aircraft Management Company 144A | | | 4.75 | | | | 2-1-2028 | | | | 75,000 | | | | 74,344 | |
| | | | | | | | | | | | | | | | |
|
| Airlines: 0.09% | |
Aviation Capital Group Corporation 144A | | | 6.75 | | | | 4-6-2021 | | | | 100,000 | | | | 105,251 | |
| | | | | | | | | | | | | | | | |
The accompanying notes are an integral part of these financial statements.
Wells Fargo Utilities and High Income Fund (ERH) | 15
Portfolio of investments—February 29, 2020 (unaudited)
| | | | | | | | | | | | | | | | |
| | | Interest
rate | | | Maturity
date | | | Principal | | | Value | |
| Commercial Services & Supplies: 1.30% | |
ACCO Brands Corporation 144A | | | 5.25 | % | | | 12-15-2024 | | | $ | 25,000 | | | $ | 25,698 | |
Advanced Disposal Services Incorporated 144A | | | 5.63 | | | | 11-15-2024 | | | | 300,000 | | | | 312,855 | |
Covanta Holding Corporation | | | 5.88 | | | | 3-1-2024 | | | | 175,000 | | | | 176,969 | |
Covanta Holding Corporation | | | 5.88 | | | | 7-1-2025 | | | | 75,000 | | | | 76,875 | |
IAA Spinco Incorporated 144A | | | 5.50 | | | | 6-15-2027 | | | | 325,000 | | | | 344,094 | |
KAR Auction Services Incorporated 144A | | | 5.13 | | | | 6-1-2025 | | | | 550,000 | | | | 565,070 | |
| | | | |
| | | | | | | | | | | | | | | 1,501,561 | |
| | | | | | | | | | | | | | | | |
|
| Machinery: 0.46% | |
Harsco Corporation 144A | | | 5.75 | | | | 7-31-2027 | | | | 25,000 | | | | 24,625 | |
Stevens Holding Company Incorporated 144A | | | 6.13 | | | | 10-1-2026 | | | | 250,000 | | | | 271,024 | |
Trimas Corporation 144A | | | 4.88 | | | | 10-15-2025 | | | | 225,000 | | | | 228,938 | |
| | | | |
| | | | | | | | | | | | | | | 524,587 | |
| | | | | | | | | | | | | | | | |
|
| Trading Companies & Distributors: 0.27% | |
Fortress Transportation & Infrastructure Investors LLC 144A | | | 6.50 | | | | 10-1-2025 | | | | 300,000 | | | | 314,250 | |
| | | | | | | | | | | | | | | | |
|
Information Technology: 3.23% | |
|
| Communications Equipment: 0.15% | |
CommScope Technologies Finance LLC 144A | | | 6.00 | | | | 6-15-2025 | | | | 75,000 | | | | 70,500 | |
CommScope Technologies Finance LLC 144A | | | 8.25 | | | | 3-1-2027 | | | | 100,000 | | | | 100,875 | |
| | | | |
| | | | | | | | | | | | | | | 171,375 | |
| | | | | | | | | | | | | | | | |
|
| IT Services: 1.01% | |
Alliance Data Systems Corporation 144A | | | 4.75 | | | | 12-15-2024 | | | | 50,000 | | | | 49,063 | |
Cardtronics Incorporated 144A | | | 5.50 | | | | 5-1-2025 | | | | 400,000 | | | | 410,000 | |
Gartner Incorporated 144A | | | 5.13 | | | | 4-1-2025 | | | | 350,000 | | | | 361,410 | |
Infor US Incorporated | | | 6.50 | | | | 5-15-2022 | | | | 50,000 | | | | 50,150 | |
Zayo Group LLC 144A | | | 5.75 | | | | 1-15-2027 | | | | 75,000 | | | | 76,688 | |
Zayo Group LLC | | | 6.38 | | | | 5-15-2025 | | | | 214,000 | | | | 218,815 | |
| | | | |
| | | | | | | | | | | | | | | 1,166,126 | |
| | | | | | | | | | | | | | | | |
|
| Semiconductors & Semiconductor Equipment: 0.18% | |
Broadcom Incorporated 144A | | | 5.00 | | | | 4-15-2025 | | | | 75,000 | | | | 76,137 | |
Qorvo Incorporated 144A | | | 4.38 | | | | 10-15-2029 | | | | 125,000 | | | | 130,000 | |
| | | | |
| | | | | | | | | | | | | | | 206,137 | |
| | | | | | | | | | | | | | | | |
|
| Software: 0.83% | |
CDK Global Incorporated | | | 4.88 | | | | 6-1-2027 | | | | 25,000 | | | | 25,750 | |
CDK Global Incorporated | | | 5.00 | | | | 10-15-2024 | | | | 50,000 | | | | 54,210 | |
CDK Global Incorporated 144A | | | 5.25 | | | | 5-15-2029 | | | | 25,000 | | | | 26,656 | |
CDK Global Incorporated | | | 5.88 | | | | 6-15-2026 | | | | 25,000 | | | | 26,158 | |
Fair Isaac Corporation 144A | | | 4.00 | | | | 6-15-2028 | | | | 25,000 | | | | 25,625 | |
Fair Isaac Corporation 144A | | | 5.25 | | | | 5-15-2026 | | | | 400,000 | | | | 443,000 | |
IQVIA Incorporated 144A | | | 5.00 | | | | 5-15-2027 | | | | 150,000 | | | | 155,063 | |
SS&C Technologies Incorporated 144A | | | 5.50 | | | | 9-30-2027 | | | | 200,000 | | | | 210,500 | |
| | | | |
| | | | | | | | | | | | | | | 966,962 | |
| | | | | | | | | | | | | | | | |
|
| Technology Hardware, Storage & Peripherals: 1.06% | |
Dell International LLC 144A | | | 5.88 | | | | 6-15-2021 | | | | 165,000 | | | | 165,982 | |
Dell International LLC 144A | | | 7.13 | | | | 6-15-2024 | | | | 525,000 | | | | 549,281 | |
NCR Corporation | | | 6.38 | | | | 12-15-2023 | | | | 500,000 | | | | 509,685 | |
| | | | |
| | | | | | | | | | | | | | | 1,224,948 | |
| | | | | | | | | | | | | | | | |
The accompanying notes are an integral part of these financial statements.
16 | Wells Fargo Utilities and High Income Fund (ERH)
Portfolio of investments—February 29, 2020 (unaudited)
| | | | | | | | | | | | | | | | |
| | | Interest
rate | | | Maturity
date | | | Principal | | | Value | |
| Materials: 1.64% | |
|
| Chemicals: 0.05% | |
Valvoline Incoporated 144A | | | 4.25 | % | | | 2-15-2030 | | | $ | 25,000 | | | $ | 24,656 | |
Valvoline Incorporated | | | 5.50 | | | | 7-15-2024 | | | | 25,000 | | | | 26,038 | |
| | | | |
| | | | | | | | | | | | | | | 50,694 | |
| | | | | | | | | | | | | | | | |
|
| Containers & Packaging: 1.44% | |
Ball Corporation | | | 4.88 | | | | 3-15-2026 | | | | 50,000 | | | | 55,000 | |
Ball Corporation | | | 5.25 | | | | 7-1-2025 | | | | 40,000 | | | | 44,233 | |
Berry Global Incorporated 144A | | | 4.88 | | | | 7-15-2026 | | | | 50,000 | | | | 50,860 | |
Berry Global Incorporated | | | 5.13 | | | | 7-15-2023 | | | | 50,000 | | | | 50,025 | |
Berry Global Incorporated 144A | | | 5.63 | | | | 7-15-2027 | | | | 25,000 | | | | 25,999 | |
Berry Global Incorporated | | | 6.00 | | | | 10-15-2022 | | | | 33,000 | | | | 33,526 | |
Crown Americas Capital Corporation VI | | | 4.75 | | | | 2-1-2026 | | | | 75,000 | | | | 77,344 | |
Crown Cork & Seal Company Incorporated | | | 7.38 | | | | 12-15-2026 | | | | 225,000 | | | | 263,813 | |
Flex Acquisition Company Incorporated 144A | | | 6.88 | | | | 1-15-2025 | | | | 175,000 | | | | 170,191 | |
Flex Acquisition Company Incorporated 144A | | | 7.88 | | | | 7-15-2026 | | | | 125,000 | | | | 126,875 | |
Owens-Brockway Packaging Incorporated 144A | | | 5.38 | | | | 1-15-2025 | | | | 50,000 | | | | 52,464 | |
Owens-Brockway Packaging Incorporated 144A | | | 5.88 | | | | 8-15-2023 | | | | 50,000 | | | | 52,881 | |
Owens-Brockway Packaging Incorporated 144A | | | 6.38 | | | | 8-15-2025 | | | | 275,000 | | | | 303,188 | |
Reynolds Group Issuer Incorporated 144A | | | 5.13 | | | | 7-15-2023 | | | | 125,000 | | | | 126,250 | |
Sealed Air Corporation 144A | | | 5.13 | | | | 12-1-2024 | | | | 100,000 | | | | 107,250 | |
Silgan Holdings Incorporated 144A | | | 4.13 | | | | 2-1-2028 | | | | 125,000 | | | | 125,313 | |
| | | | |
| | | | | | | | | | | | | | | 1,665,212 | |
| | | | | | | | | | | | | | | | |
|
| Metals & Mining: 0.13% | |
Kaiser Aluminum Corporation 144A | | | 4.63 | | | | 3-1-2028 | | | | 50,000 | | | | 49,500 | |
Novelis Corporation 144A | | | 5.88 | | | | 9-30-2026 | | | | 100,000 | | | | 103,286 | |
| | | | |
| | | | | | | | | | | | | | | 152,786 | |
| | | | | | | | | | | | | | | | |
|
| Paper & Forest Products: 0.02% | |
Clearwater Paper Corporation 144A | | | 5.38 | | | | 2-1-2025 | | | | 25,000 | | | | 25,875 | |
| | | | | | | | | | | | | | | | |
|
Real Estate: 1.31% | |
|
| Equity REITs: 1.31% | |
CoreCivic Incorporated | | | 4.63 | | | | 5-1-2023 | | | | 35,000 | | | | 35,077 | |
CoreCivic Incorporated | | | 5.00 | | | | 10-15-2022 | | | | 125,000 | | | | 127,563 | |
Equinix Incorporated | | | 5.88 | | | | 1-15-2026 | | | | 125,000 | | | | 132,110 | |
ESH Hospitality Incorporated 144A | | | 4.63 | | | | 10-1-2027 | | | | 25,000 | | | | 24,375 | |
ESH Hospitality Incorporated 144A | | | 5.25 | | | | 5-1-2025 | | | | 325,000 | | | | 326,895 | |
Iron Mountain Incorporated 144A | | | 5.38 | | | | 6-1-2026 | | | | 100,000 | | | | 103,500 | |
Iron Mountain Incorporated | | | 6.00 | | | | 8-15-2023 | | | | 267,000 | | | | 271,673 | |
SBA Communications Corporation 144A | | | 3.88 | | | | 2-15-2027 | | | | 50,000 | | | | 51,015 | |
The Geo Group Incorporated | | | 5.13 | | | | 4-1-2023 | | | | 75,000 | | | | 70,890 | |
The Geo Group Incorporated | | | 5.88 | | | | 1-15-2022 | | | | 135,000 | | | | 133,988 | |
The Geo Group Incorporated | | | 5.88 | | | | 10-15-2024 | | | | 175,000 | | | | 163,625 | |
The Geo Group Incorporated | | | 6.00 | | | | 4-15-2026 | | | | 75,000 | | | | 67,875 | |
| | | | |
| | | | | | | | | | | | | | | 1,508,586 | |
| | | | | | | | | | | | | | | | |
|
Utilities: 2.07% | |
|
| Electric Utilities: 0.38% | |
NextEra Energy Operating Partners LP 144A | | | 4.25 | | | | 7-15-2024 | | | | 125,000 | | | | 127,313 | |
NextEra Energy Operating Partners LP 144A | | | 4.25 | | | | 9-15-2024 | | | | 25,000 | | | | 25,168 | |
NextEra Energy Operating Partners LP 144A | | | 4.50 | | | | 9-15-2027 | | | | 275,000 | | | | 286,829 | |
| | | | |
| | | | | | | | | | | | | | | 439,310 | |
| | | | | | | | | | | | | | | | |
The accompanying notes are an integral part of these financial statements.
Wells Fargo Utilities and High Income Fund (ERH) | 17
Portfolio of investments—February 29, 2020 (unaudited)
| | | | | | | | | | | | | | | | |
| | | Interest
rate | | | Maturity
date | | | Principal | | | Value | |
| Gas Utilities: 0.09% | |
AmeriGas Partners LP | | | 5.75 | % | | | 5-20-2027 | | | $ | 75,000 | | | $ | 78,000 | |
Suburban Propane Partners LP | | | 5.88 | | | | 3-1-2027 | | | | 25,000 | | | | 25,750 | |
| | | | |
| | | | | | | | | | | | | | | 103,750 | |
| | | | | | | | | | | | | | | | |
|
| Independent Power & Renewable Electricity Producers: 1.60% | |
NSG Holdings LLC 144A | | | 7.75 | | | | 12-15-2025 | | | | 337,827 | | | | 374,988 | |
Pattern Energy Group Incorporated 144A | | | 5.88 | | | | 2-1-2024 | | | | 575,000 | | | | 586,500 | |
TerraForm Global Operating LLC 144A | | | 6.13 | | | | 3-1-2026 | | | | 125,000 | | | | 129,375 | |
TerraForm Power Operating LLC 144A | | | 4.25 | | | | 1-31-2023 | | | | 350,000 | | | | 355,695 | |
TerraForm Power Operating LLC 144A | | | 4.75 | | | | 1-15-2030 | | | | 100,000 | | | | 103,875 | |
TerraForm Power Operating LLC 144A | | | 5.00 | | | | 1-31-2028 | | | | 275,000 | | | | 295,983 | |
| | | | |
| | | | | | | | | | | | | | | 1,846,416 | |
| | | | | | | | | | | | | | | | |
| |
Total Corporate Bonds and Notes (Cost $35,669,947) | | | | 35,681,920 | |
| | | | | | | | | | | | | | | | |
| | | | |
Loans: 1.29% | | | | | | | | | | | | | | | | |
| | | | |
Communication Services: 0.35% | | | | | | | | | | | | | | | | |
| | | | |
| Media: 0.35% | | | | | | | | | | | | |
Ancestry.com Incorporated (1 Month LIBOR +4.25%) ౠ| | | 5.86 | | | | 8-27-2026 | | | | 371,661 | | | | 332,636 | |
Hubbard Radio LLC (1 Month LIBOR +3.50%) ౠ| | | 5.11 | | | | 3-28-2025 | | | | 67,373 | | | | 67,149 | |
| | | | |
| | | | | | | | | | | | | | | 399,785 | |
| | | | | | | | | | | | | | | | |
| | | | |
Consumer Discretionary: 0.42% | | | | | | | | | | | | | | | | |
| | | | |
| Hotels, Restaurants & Leisure: 0.42% | | | | | | | | | | | | |
CCM Merger Incorporated (1 Month LIBOR +2.25%)± | | | 3.85 | | | | 8-8-2021 | | | | 37,497 | | | | 37,422 | |
Montreign Operating Company LLC (1 Month LIBOR +8.25%)± | | | 9.85 | | | | 1-24-2023 | | | | 515,717 | | | | 450,515 | |
| | | | |
| | | | | | | | | | | | | | | 487,937 | |
| | | | | | | | | | | | | | | | |
| | | | |
Energy: 0.25% | | | | | | | | | | | | | | | | |
| | | | |
| Oil, Gas & Consumable Fuels: 0.25% | | | | | | | | | | | | |
Encino Acquisition Partners Holdings LLC (1 Month LIBOR +6.75%)± | | | 8.35 | | | | 10-29-2025 | | | | 75,000 | | | | 42,750 | |
EPIC Crude Services LP (3 Month LIBOR +5.00%)± | | | 6.62 | | | | 3-2-2026 | | | | 200,000 | | | | 192,800 | |
Ultra Resources Incorporated (1 Month LIBOR +4.00%)± | | | 5.60 | | | | 4-12-2024 | | | | 99,360 | | | | 54,399 | |
| | | | |
| | | | | | | | | | | | | | | 289,949 | |
| | | | | | | | | | | | | | | | |
| | | | |
Financials: 0.18% | | | | | | | | | | | | | | | | |
| | | | |
| Diversified Financial Services: 0.11% | | | | | | | | | | | | |
Resolute Investment Managers Incorporated (3 Month LIBOR +7.50%) ౠ| | | 9.28 | | | | 4-30-2023 | | | | 125,000 | | | | 125,156 | |
| | | | | | | | | | | | | | | | |
| | | | |
| Insurance: 0.07% | | | | | | | | | | | | |
HUB International Limited (3 Month LIBOR +4.00%)± | | | 5.69 | | | | 4-25-2025 | | | | 50,000 | | | | 49,822 | |
USI Incorporated (3 Month LIBOR +4.00%)± | | | 5.94 | | | | 12-2-2026 | | | | 25,000 | | | | 24,833 | |
| | | | |
| | | | | | | | | | | | | | | 74,655 | |
| | | | | | | | | | | | | | | | |
| | | | |
Industrials: 0.07% | | | | | | | | | | | | | | | | |
| | | | |
| Commercial Services & Supplies: 0.07% | | | | | | | | | | | | |
Advantage Sales & Marketing LLC (1 Month LIBOR +6.50%)± | | | 8.10 | | | | 7-25-2022 | | | | 91,664 | | | | 83,787 | |
| | | | | | | | | | | | | | | | |
The accompanying notes are an integral part of these financial statements.
18 | Wells Fargo Utilities and High Income Fund (ERH)
Portfolio of investments—February 29, 2020 (unaudited)
| | | | | | | | | | | | | | | | |
| | | Interest rate | | | Maturity
date | | | Principal | | | Value | |
| Information Technology: 0.02% | | | | | | | | | | | | |
| | | | |
| IT Services: 0.02% | | | | | | | | | | | | |
Fiserv Investment Solutions Incorporated (3 Month LIBOR +4.75%) ౠ| | | 6.44 | % | | | 2-18-2027 | | | $ | 25,000 | | | $ | 25,078 | |
| | | | | | | | | | | | | | | | |
| | | | |
Total Loans (Cost $1,669,447) | | | | | | | | | | | | | | | 1,486,347 | |
| | | | | | | | | | | | | | | | |
| | | | |
| | | | | | | | | | | | | | | | |
| | | Dividend yield | | | | | | Shares | | | | |
| Preferred Stocks: 0.29% | | | | | | | | | | | | |
| | | | |
Energy: 0.29% | | | | | | | | | | | | | | | | |
| | | | |
| Energy Equipment & Services: 0.29% | | | | | | | | | | | | |
Bristow Group Incorporated (a)‡144A† | | | 10.00 | | | | | | | | 1,438 | | | | 55,792 | |
Bristow Group Incorporated (a)‡† | | | 10.00 | | | | | | | | 7,161 | | | | 277,832 | |
| | | | |
| | | | | | | | | | | | | | | 333,624 | |
| | | | | | | | | | | | | | | | |
| | | | |
Total Preferred Stocks (Cost $260,436) | | | | | | | | | | | | | | | 333,624 | |
| | | | | | | | | | | | | | | | |
| | | | |
| | | | | | | | | | | | | | | | |
| | | | | | Expiration
date | | | | | | | |
| Rights: 0.02% | | | | | | | | | | | | |
| | | | |
Utilities: 0.02% | | | | | | | | | | | | | | | | |
| | | | |
| Independent Power & Renewable Electricity Producers: 0.02% | | | | | | | | | | | | |
Vistra Energy Corporation † | | | | | | | 12-31-2046 | | | | 23,978 | | | | 23,978 | |
| | | | | | | | | | | | | | | | |
| | | | |
Total Rights (Cost $24,865) | | | | | | | | | | | | | | | 23,978 | |
| | | | | | | | | | | | | | | | |
| | | | |
| | | | | | | | | | | | | | | | |
| | | Interest rate | | | Maturity
date | | | Principal | | | | |
| Yankee Corporate Bonds and Notes: 2.90% | | | | | | | | | | | | |
| | | | |
Communication Services: 0.30% | | | | | | | | | | | | | | | | |
| | | | |
| Diversified Telecommunication Services: 0.10% | | | | | | | | | | | | |
Intelsat Luxembourg SA | | | 8.13 | | | | 6-1-2023 | | | $ | 100,000 | | | | 42,000 | |
Telesat Canada Incorporated 144A | | | 6.50 | | | | 10-15-2027 | | | | 75,000 | | | | 77,625 | |
| | | | |
| | | | | | | | | | | | | | | 119,625 | |
| | | | | | | | | | | | | | | | |
| | | | |
| Media: 0.20% | | | | | | | | | | | | |
Nielsen Holding and Finance BV 144A | | | 5.00 | | | | 2-1-2025 | | | | 200,000 | | | | 197,500 | |
Nielsen Holding and Finance BV 144A | | | 5.50 | | | | 10-1-2021 | | | | 30,000 | | | | 30,038 | |
| | | | |
| | | | | | | | | | | | | | | 227,538 | |
| | | | | | | | | | | | | | | | |
| | | | |
Energy: 0.72% | | | | | | | | | | | | | | | | |
| | | | |
| Energy Equipment & Services: 0.11% | | | | | | | | | | | | |
Valaris plc | | | 5.75 | | | | 10-1-2044 | | | | 430,000 | | | | 131,421 | |
| | | | | | | | | | | | | | | | |
| | | | |
| Oil, Gas & Consumable Fuels: 0.61% | | | | | | | | | | | | |
Baytex Energy Corporation 144A | | | 5.63 | | | | 6-1-2024 | | | | 200,000 | | | | 180,000 | |
Baytex Energy Corporation 144A | | | 8.75 | | | | 4-1-2027 | | | | 375,000 | | | | 356,250 | |
Griffin Coal Mining Company Limited 144A(a)† | | | 9.50 | | | | 12-1-2016 | | | | 61,339 | | | | 0 | |
Rockpoint Gas Storage Canada Limited 144A | | | 7.00 | | | | 3-31-2023 | | | | 175,000 | | | | 164,500 | |
| | | | |
| | | | | | | | | | | | | | | 700,750 | |
| | | | | | | | | | | | | | | | |
The accompanying notes are an integral part of these financial statements.
Wells Fargo Utilities and High Income Fund (ERH) | 19
Portfolio of investments—February 29, 2020 (unaudited)
| | | | | | | | | | | | | | | | |
| | | Interest rate | | | Maturity
date | | | Principal | | | Value | |
| Financials: 0.61% | | | | | | | | | | | | |
| | | | |
| Banks: 0.03% | | | | | | | | | | | | |
Intelsat Connect Finance Company 144A | | | 9.50 | % | | | 2-15-2023 | | | $ | 50,000 | | | $ | 30,500 | |
| | | | | | | | | | | | | | | | |
| | | | |
| Diversified Financial Services: 0.58% | | | | | | | | | | | | |
Intelsat Jackson Holdings SA | | | 5.50 | | | | 8-1-2023 | | | | 445,000 | | | | 382,700 | |
Intelsat Jackson Holdings SA 144A | | | 8.50 | | | | 10-15-2024 | | | | 150,000 | | | | 131,250 | |
Sensata Technologies UK Financing Company plc 144A | | | 6.25 | | | | 2-15-2026 | | | | 74,000 | | | | 77,389 | |
Trivium Packaging Finance BV 144A | | | 5.50 | | | | 8-15-2026 | | | | 50,000 | | | | 51,813 | |
Trivium Packaging Finance BV 144A | | | 8.50 | | | | 8-15-2027 | | | | 25,000 | | | | 26,283 | |
| | | | |
| | | | | | | | | | | | | | | 669,435 | |
| | | | | | | | | | | | | | | | |
| | | | |
Health Care: 0.61% | | | | | | | | | | | | | | | | |
| | | | |
| Pharmaceuticals: 0.61% | | | | | | | | | | | | |
Bausch Health Companies Incorporated 144A | | | 5.50 | | | | 3-1-2023 | | | | 62,000 | | | | 61,923 | |
Bausch Health Companies Incorporated 144A | | | 5.50 | | | | 11-1-2025 | | | | 50,000 | | | | 51,479 | |
Bausch Health Companies Incorporated 144A | | | 5.88 | | | | 5-15-2023 | | | | 24,000 | | | | 24,090 | |
Bausch Health Companies Incorporated 144A | | | 6.13 | | | | 4-15-2025 | | | | 200,000 | | | | 204,000 | |
Bausch Health Companies Incorporated 144A | | | 6.50 | | | | 3-15-2022 | | | | 25,000 | | | | 25,313 | |
Bausch Health Companies Incorporated 144A | | | 7.00 | | | | 3-15-2024 | | | | 50,000 | | | | 51,479 | |
Bausch Health Companies Incorporated 144A | | | 8.50 | | | | 1-31-2027 | | | | 25,000 | | | | 27,432 | |
Teva Pharmaceutical Finance Netherlands III BV | | | 4.10 | | | | 10-1-2046 | | | | 325,000 | | | | 252,688 | |
| | | | |
| | | | | | | | | | | | | | | 698,404 | |
| | | | | | | | | | | | | | | | |
| | | | |
Industrials: 0.51% | | | | | | | | | | | | | | | | |
| | | | |
| Commercial Services & Supplies: 0.38% | | | | | | | | | | | | |
Ritchie Brothers Auctioneers Incorporated 144A | | | 5.38 | | | | 1-15-2025 | | | | 425,000 | | | | 438,995 | |
| | | | | | | | | | | | | | | | |
| | | | |
| Electrical Equipment: 0.13% | | | | | | | | | | | | |
Sensata Technologies BV 144A | | | 5.00 | | | | 10-1-2025 | | | | 45,000 | | | | 47,367 | |
Sensata Technologies BV 144A | | | 5.63 | | | | 11-1-2024 | | | | 100,000 | | | | 107,775 | |
| | | | |
| | | | | | | | | | | | | | | 155,142 | |
| | | | | | | | | | | | | | | | |
| | | | |
Materials: 0.15% | | | | | | | | | | | | | | | | |
| | | | |
| Containers & Packaging: 0.13% | | | | | | | | | | | | |
Ardagh Packaging Finance plc 144A | | | 4.13 | | | | 8-15-2026 | | | | 100,000 | | | | 99,625 | |
OI European Group BV 144A | | | 4.00 | | | | 3-15-2023 | | | | 50,000 | | | | 50,563 | |
| | | | |
| | | | | | | | | | | | | | | 150,188 | |
| | | | | | | | | | | | | | | | |
| | | | |
| Metals & Mining: 0.02% | | | | | | | | | | | | |
ArcelorMittal SA | | | 6.25 | | | | 2-25-2022 | | | | 25,000 | | | | 26,841 | |
| | | | | | | | | | | | | | | | |
| | | | |
Total Yankee Corporate Bonds and Notes (Cost $3,600,647) | | | | | | | | | | | | | | | 3,348,839 | |
| | | | | | | | | | | | | | | | |
| | | | |
| | | | | | | | | | | | | | | | |
| | | Yield | | | | | | Shares | | | | |
| Short-Term Investments: 1.49% | | | | | | | | | | | | |
| | | | |
| Investment Companies: 1.49% | | | | | | | | | | | | |
Wells Fargo Government Money Market Fund Select Class (l)(u) | | | 1.52 | | | | | | | | 1,723,739 | | | | 1,723,739 | |
| | | | | | | | | | | | | | | | |
| | | | |
Total Short-Term Investments (Cost $1,723,739) | | | | | | | | | | | | | | | 1,723,739 | |
| | | | | | | | | | | | | | | | |
| | | | | | | | |
| Total investments in securities (Cost $133,325,968) | | | 118.16 | % | | | 136,412,285 | |
| | |
Other assets and liabilities, net | | | (18.16 | ) | | | (20,968,893 | ) |
| | | | | | | | |
| Total net assets | | | 100.00 | % | | $ | 115,443,392 | |
| | | | | | | | |
The accompanying notes are an integral part of these financial statements.
20 | Wells Fargo Utilities and High Income Fund (ERH)
Portfolio of investments—February 29, 2020 (unaudited)
| (a) | The security is fair valued in accordance with procedures approved by the Board of Trustees. |
| ‡ | Security is valued using significant unobservable inputs. |
| † | Non-income-earning security |
| 144A | The security may be resold in transactions exempt from registration, normally to qualified institutional buyers, pursuant to Rule 144A under the Securities Act of 1933. |
| ± | Variable rate investment. The rate shown is the rate in effect at period end. |
| (l) | The issuer of the security is an affiliated person of the Fund as defined in the Investment Company Act of 1940. |
| (u) | The rate represents the7-day annualized yield at period end. |
Abbreviations:
| LIBOR | London Interbank Offered Rate |
| REIT | Real estate investment trust |
Investments in Affiliates
An affiliated investment is an investment in which the Fund owns at least 5% of the outstanding voting shares of the issuer or as a result of other relationships, such as the Fund and the issuer having the same investment manager. Transactions with issuers that were either affiliates of the Fund at the beginning of the period or the end of the period were as follows:
| | | | | | | | | | | | | | | | | | | | | | | | | | | | | | | | | | | | |
| | | Shares, beginning of period | | | Shares purchased | | | Shares sold | | | Shares, end of period | | | Net realized gains (losses) | | | Net
change in unrealized gains (losses) | | | Income from affiliated securities | | | Value, end of period | | | % of
net
assets | |
| | | | | | | | | |
| Short-Term Investments | | | | | | | | | | | | | | | | | | | | | | | | | | | |
Investment Companies | | | | | | | | | | | | | | | | | | | | | | | | | | | | | | | | | | | | |
Wells Fargo Government Money Market Fund Select Class | | | 6,380,919 | | | | 20,609,815 | | | | (25,266,995 | ) | | | 1,723,739 | | | $ | 0 | | | $ | 0 | | | $ | 50,711 | | | $ | 1,723,739 | | | | 1.49 | % |
The accompanying notes are an integral part of these financial statements.
Wells Fargo Utilities and High Income Fund (ERH) | 21
Statement of assets and liabilities—February 29, 2020 (unaudited)
| | | | |
| | | | |
| |
Assets | | | | |
Investments in unaffiliated securities, at value (cost $131,602,229) | | $ | 134,688,546 | |
Investments in affiliated securities, at value (cost $1,723,739) | | | 1,723,739 | |
Cash | | | 500 | |
Receivable for investments sold | | | 523,543 | |
Receivable for dividends and interest | | | 1,331,063 | |
Prepaid expenses and other assets | | | 14,982 | |
| | | | |
Total assets | | | 138,282,373 | |
| | | | |
| |
Liabilities | | | | |
Secured borrowing payable | | | 22,000,000 | |
Payable for investments purchased | | | 25,481 | |
Advisory fee payable | | | 60,793 | |
Dividends payable | | | 740,490 | |
Administration fees payable | | | 6,079 | |
Trustees’ fees and expenses payable | | | 2,483 | |
Accrued expenses and other liabilities | | | 3,655 | |
| | | | |
Total liabilities | | | 22,838,981 | |
| | | | |
Total net assets | | $ | 115,443,392 | |
| | | | |
| |
Net assets consist of | | | | |
Paid-in capital | | $ | 114,237,948 | |
Total distributable earnings | | | 1,205,444 | |
| | | | |
Total net assets | | $ | 115,443,392 | |
| | | | |
| |
NET ASSET VALUE PER SHARE | | | | |
Based on $115,443,392 divided by 9,270,012 shares issued and outstanding (unlimited number of shares authorized) | | | $12.45 | |
| | | | |
The accompanying notes are an integral part of these financial statements.
22 | Wells Fargo Utilities and High Income Fund (ERH)
Statement of operations—six months ended February 29, 2020 (unaudited)
| | | | |
| | | | |
| |
Investment income | | | | |
Dividends | | $ | 1,366,626 | |
Interest (net of foreign interest withholding taxes of $215) | | | 1,230,893 | |
Income from affiliated securities | | | 50,711 | |
| | | | |
Total investment income | | | 2,648,230 | |
| | | | |
| |
Expenses | | | | |
Advisory fee | | | 370,724 | |
Administration fee | | | 35,428 | |
Custody and accounting fees | | | 19,834 | |
Professional fees | | | 33,718 | |
Shareholder report expenses | | | 29,753 | |
Trustees’ fees and expenses | | | 10,909 | |
Transfer agent fees | | | 36,200 | |
Interest expense | | | 300,059 | |
Other fees and expenses | | | 20,330 | |
| | | | |
Total expenses | | | 856,955 | |
| | | | |
Net investment income | | | 1,791,275 | |
| | | | |
| |
Realized and unrealized gains (losses) on investments | | | | |
Net realized gains on investments | | | 8,935,857 | |
Net change in unrealized gains (losses) on investments | | | (10,839,331 | ) |
| | | | |
Net realized and unrealized gains (losses) on investments | | | (1,903,474 | ) |
| | | | |
Net decrease in net assets resulting from operations | | $ | (112,199 | ) |
| | | | |
The accompanying notes are an integral part of these financial statements.
Wells Fargo Utilities and High Income Fund (ERH) | 23
Statement of changes in net assets
| | | | | | | | |
| | | Six months ended February 29, 2020
(unaudited) | | | Year ended August 31, 2019 | |
| | |
Operations | | | | | | | | |
Net investment income | | $ | 1,791,275 | | | $ | 7,638,970 | |
Net realized gains (losses) on investments | | | 8,935,857 | | | | (1,760,216 | ) |
Net change in unrealized gains (losses) on investments | | | (10,839,331 | ) | | | 7,158,415 | |
| | | | |
Net increase (decrease) in net assets resulting from operations | | | (112,199 | ) | | | 13,037,169 | |
| | | | |
| | |
Distributions to shareholders | | | | | | | | |
Net investment income and net realized gains | | | (4,362,309 | ) | | | (7,826,021 | ) |
Tax basis return of capital | | | 0 | | | | (506,304 | ) |
| | | | |
Total distributions to shareholders | | | (4,362,309 | ) | | | (8,332,325 | ) |
| | | | |
| |
Capital share transactions | | | | |
Net asset value of common shares issued under the Automatic Dividend Reinvestment Plan | | | 98,245 | | | | 122,415 | |
| | | | |
Total increase (decrease) in net assets | | | (4,376,263 | ) | | | 4,827,259 | |
| | | | |
| |
Net assets | | | | |
Beginning of period | | | 119,819,655 | | | | 114,992,396 | |
| | | | |
End of period | | $ | 115,443,392 | | | $ | 119,819,655 | |
| | | | |
The accompanying notes are an integral part of these financial statements.
24 | Wells Fargo Utilities and High Income Fund (ERH)
Statement of cash flows—six months ended February 29, 2020
| | | | |
| | | | |
| |
Cash flows from operating activities: | | | | |
Net decrease in net assets resulting from operations | | $ | (112,199 | ) |
| |
Adjustments to reconcile net decrease in net assets from operations to net cash provided by operating activities: | | | | |
Purchase of long-term securities | | | (80,787,376 | ) |
Proceeds from the sales of long-term securities | | | 82,044,759 | |
Amortization | | | (75,535 | ) |
Purchases and sales of short-term securities, net | | | 4,657,180 | |
Decrease in receivable for investments sold | | | 2,061,940 | |
Decrease in receivable for dividends and interest | | | 47,649 | |
Increase in prepaid expenses and other assets | | | (9,834 | ) |
Decrease in payable for investments purchased | | | (6,803,463 | ) |
Increase in trustees’ fees and expenses payable | | | 1,805 | |
Decrease in advisory fee payable | | | (15,753 | ) |
Decrease in administration fee payable | | | (300 | ) |
Decrease in accrued expenses and other liabilities | | | (38,883 | ) |
Litigation payments received | | | 177 | |
Net realized gains on investments | | | (8,935,857 | ) |
Net change in unrealized gains (losses) on investments | | | 10,839,331 | |
| | | | |
Net cash provided by operating activities | | | 2,873,641 | |
| | | | |
| |
Cash flows from financing activities: | | | | |
Cash distributions paid | | | (4,218,280 | ) |
| | | | |
Net cash used in financing activities | | | (4,218,280 | ) |
| | | | |
Net decrease in cash | | | (1,344,639 | ) |
| | | | |
| |
Cash (including foreign currency): | | | | |
Beginning of period | | $ | 1,345,139 | |
| | | | |
End of period | | $ | 500 | |
| | | | |
| |
Supplemental cash disclosure | | | | |
Cash paid for interest | | $ | 338,942 | |
| | | | |
| |
Supplementalnon-cash financing disclosure | | | | |
Reinvestment of dividends | | $ | 98,245 | |
| | | | |
The accompanying notes are an integral part of these financial statements.
Wells Fargo Utilities and High Income Fund (ERH) | 25
Financial highlights
(For a share outstanding throughout each period)
| | | | | | | | | | | | | | | | | | | | | | | | |
| | | Six months ended
February 29, 2020
(unaudited) | | | Year ended August 31 | |
| | | 2019 | | | 2018 | | | 2017 | | | 2016 | | | 2015 | |
Net asset value, beginning of period | | | $12.94 | | | | $12.43 | | | | $13.48 | | | | $12.75 | | | | $12.44 | | | | $13.83 | |
Net investment income | | | 0.19 | | | | 0.80 | | | | 0.85 | | | | 0.88 | | | | 0.86 | | | | 0.91 | |
Net realized and unrealized gains (losses) on investments | | | (0.21 | ) | | | 0.61 | | | | (1.00 | ) | | | 0.75 | | | | 0.35 | | | | (1.40 | ) |
| | | | | | | | | | | | | | | | | | | | | | | | |
Total from investment operations | | | (0.02 | ) | | | 1.41 | | | | (0.15 | ) | | | 1.63 | | | | 1.21 | | | | (0.49 | ) |
Distributions to shareholders from | | | | | | | | | | | | | | | | | | | | | | | | |
Net investment income | | | (0.47 | ) | | | (0.85 | ) | | | (0.90 | ) | | | (0.90 | ) | | | (0.90 | ) | | | (0.90 | ) |
Tax basis return of capital | | | 0.00 | | | | (0.05 | ) | | | 0.00 | | | | 0.00 | | | | 0.00 | | | | 0.00 | |
| | | | | | | | | | | | | | | | | | | | | | | | |
Total distributions to shareholders | | | (0.47 | ) | | | (0.90 | ) | | | (0.90 | ) | | | (0.90 | ) | | | (0.90 | ) | | | (0.90 | ) |
Net asset value, end of period | | | $12.45 | | | | $12.94 | | | | $12.43 | | | | $13.48 | | | | $12.75 | | | | $12.44 | |
Market value, end of period | | | $12.40 | | | | $13.03 | | | | $12.65 | | | | $13.34 | | | | $12.93 | | | | $10.89 | |
Total return based on market value1 | | | (1.46 | )% | | | 10.70 | % | | | 1.85 | % | | | 10.80 | % | | | 27.83 | % | | | (9.11 | )% |
Ratios to average net assets (annualized) | | | | | | | | | | | | | | | | | | | | | | | | |
Net expenses2 | | | 1.43 | % | | | 1.63 | % | | | 1.42 | % | | | 1.24 | % | | | 1.19 | % | | | 1.19 | % |
Net investment income | | | 3.11 | % | | | 6.60 | % | | | 6.51 | % | | | 6.91 | % | | | 6.83 | % | | | 6.88 | % |
Supplemental data | | | | | | | | | | | | | | | | | | | | | | | | |
Portfolio turnover rate | | | 58 | % | | | 131 | % | | | 109 | % | | | 73 | % | | | 85 | % | | | 61 | % |
Net assets, end of period (000s omitted) | | | $115,443 | | | | $119,820 | | | | $114,992 | | | | $124,693 | | | | $117,800 | | | | $114,848 | |
| | | | | | |
Borrowings outstanding, end of period (000s omitted) | | | $22,000 | | | | $22,000 | | | | $22,000 | | | | $22,000 | | | | $22,000 | | | | $22,000 | |
Asset coverage per $1,000 of borrowing, end of period | | | $6,247 | | | | $6,446 | | | | $6,227 | | | | $6,668 | | | | $6,355 | | | | $6,220 | |
| 1 | Total return is calculated assuming a purchase of common stock on the first day and a sale on the last day of the period reported. Dividends and distributions, if any, are assumed for purposes of these calculations to be reinvested at prices obtained under the Fund’s Automatic Dividend Reinvestment Plan. Total return does not reflect brokerage commissions that a shareholder would pay on the purchase and sale of shares. |
| 2 | Ratios include interest expense relating to interest associated with borrowings and/or leverage transactions as follows: |
| | | | |
Six months ended February 29, 2020 (unaudited) | | | 0.50 | % |
Year ended August 31, 2019 | | | 0.59 | % |
Year ended August 31, 2018 | | | 0.46 | % |
Year ended August 31, 2017 | | | 0.29 | % |
Year ended August 31, 2016 | | | 0.21 | % |
Year ended August 31, 2015 | | | 0.16 | % |
The accompanying notes are an integral part of these financial statements.
26 | Wells Fargo Utilities and High Income Fund (ERH)
Notes to financial statements (unaudited)
1. ORGANIZATION
Wells Fargo Utilities and High Income Fund (the “Fund”) was organized as a statutory trust under the laws of the state of Delaware on February 4, 2004. Originally classified asnon-diversified, the Fund was reclassified as a diversifiedclosed-end management investment company in September 2014. As an investment company registered under the Investment Company Act of 1940, as amended (the “1940 Act”), the Fund follows the accounting and reporting guidance in Financial Accounting Standards Board (“FASB”) Accounting Standards Codification Topic 946,Financial Services – Investment Companies.
2. SIGNIFICANT ACCOUNTING POLICIES
The following significant accounting policies, which are consistently followed in the preparation of the financial statements of the Fund, are in conformity with U.S. generally accepted accounting principles which require management to make estimates and assumptions that affect the reported amounts of assets and liabilities, disclosure of contingent assets and liabilities at the date of the financial statements, and the reported amounts of revenues and expenses during the reporting period. Actual results could differ from those estimates.
Securities valuation
All investments are valued each business day as of the close of regular trading on the New York Stock Exchange (generally 4 p.m. Eastern Time), although the Fund may deviate from this calculation time under unusual or unexpected circumstances.
Equity securities that are listed on a foreign or domestic exchange or market are valued at the official closing price or, if none, the last sales price. If no sale occurs on the principal exchange or market that day, a fair value price will be determined in accordance with the Fund’s Valuation Procedures.
The values of securities denominated in foreign currencies are translated into U.S. dollars at rates provided by an independent foreign currency pricing source at a time each business day specified by the Wells Fargo Asset Management Pricing Committee at Wells Fargo Funds Management, LLC (“Funds Management”).
Many securities markets and exchanges outside the U.S. close prior to the close of the New York Stock Exchange and therefore may not fully reflect trading or events that occur after the close of the principal exchange in which the foreign securities are traded, but before the close of the New York Stock Exchange. If such trading or events are expected to materially affect the value of such securities, then fair value pricing procedures approved by the Board of Trustees of the Fund are applied. These procedures take into account multiple factors including movements in U.S. securities markets after foreign exchanges close. Foreign securities that are fair valued under these procedures are categorized as Level 2 and the application of these procedures may result in transfers between Level 1 and Level 2. Depending on market activity, such fair valuations may be frequent. Such fair value pricing may result in net asset values that are higher or lower than net asset values based on the last reported sales price or latest quoted bid price. On February 29, 2020, such fair value pricing was not used in pricing foreign securities.
Debt securities are valued at the evaluated bid price provided by an independent pricing service (e.g. taking into account various factors, including yields, maturities, or credit ratings) or, if a reliable price is not available, the quoted bid price from an independent broker-dealer.
Investments in registeredopen-end investment companies are valued at net asset value.
Investments which are not valued using any of the methods discussed above are valued at their fair value, as determined in good faith by the Board of Trustees. The Board of Trustees has established a Valuation Committee comprised of the Trustees and has delegated to it the authority to take any actions regarding the valuation of portfolio securities that the Valuation Committee deems necessary or appropriate, including determining the fair value of portfolio securities, unless the determination has been delegated to the Wells Fargo Asset Management Pricing Committee. The Board of Trustees retains the authority to make or ratify any valuation decisions or approve any changes to the Valuation Procedures as it deems appropriate. On a quarterly basis, the Board of Trustees receives reports on any valuation actions taken by the Valuation Committee or the Wells Fargo Asset Management Pricing Committee which may include items for ratification.
Foreign currency translation
The accounting records of the Fund are maintained in U.S. dollars. The values of other assets and liabilities denominated in foreign currencies are translated into U.S. dollars at rates provided by an independent foreign currency pricing source at a time each business day specified by the Wells Fargo Asset Management Pricing Committee. Purchases and sales of securities, and income and expenses are converted at the rate of exchange on the respective dates of such transactions. Net realized foreign exchange gains or losses arise from sales of foreign currencies, currency gains or losses realized between the trade and settlement dates on securities transactions, and the difference between the amounts of dividends, interest and foreign withholding taxes recorded and the U.S. dollar equivalent of the amounts actually paid or received. Net unrealized foreign exchange gains and losses arise from
Wells Fargo Utilities and High Income Fund (ERH) | 27
Notes to financial statements (unaudited)
changes in the fair value of assets and liabilities other than investments in securities resulting from changes in exchange rates. The changes in net assets arising from changes in exchange rates of securities and the changes in net assets resulting from changes in market prices of securities are not separately presented. Such changes are included in net realized and unrealized gains or losses from investments.
When-issued transactions
The Fund may purchase securities on a forward commitment or when-issued basis. The Fund records a when-issued transaction on the trade date and will segregate assets in an amount at least equal in value to the Fund’s commitment to purchase when-issued securities. Securities purchased on a when-issued basis aremarked-to-market daily and the Fund begins earning interest on the settlement date. Losses may arise due to changes in the market value of the underlying securities or if the counterparty does not perform under the contract.
Loans
The Fund may invest in direct debt instruments which are interests in amounts owed to lenders by corporate or other borrowers. The loans pay interest at rates which are periodically reset by reference to a base lending rate plus a spread. Investments in loans may be in the form of participations in loans or assignments of all or a portion of loans from third parties. When the Fund purchases participations, it generally has no rights to enforce compliance with terms of the loan agreement with the borrower. As a result, the Fund assumes the credit risk of both the borrower and the lender that is selling the participation. When the Fund purchases assignments from lenders, it acquires direct rights against the borrower on the loan and may enforce compliance by the borrower with the terms of the loan agreement. Loans may include fully funded term loans or unfunded loan commitments, which are contractual obligations for future funding.
Security transactions and income recognition
Securities transactions are recorded on a trade date basis. Realized gains or losses are recorded on the basis of identified cost.
Dividend income is recognized on theex-dividend date, except for certain dividends from foreign securities, which are recorded as soon as the custodian verifies theex-dividend date.
Interest income is accrued daily and bond discounts are accreted and premiums are amortized daily. To the extent debt obligations are placed onnon-accrual status, any related interest income may be reduced by writing off interest receivables when the collection of all or a portion of interest has been determined to be doubtful based on consistently applied procedures and the fair value has decreased. If the issuer subsequently resumes interest payments or when the collectability of interest is reasonably assured, the debt obligation is removed fromnon-accrual status.
Income from foreign securities is recorded net of foreign taxes withheld where recovery of such taxes is not assured.
Distributions to shareholders
Under a managed distribution plan, which began with the monthly distribution declared in September 2019, the Fund pays monthly distributions to shareholders at an annual minimum fixed rate of 7.5% based on the Fund’s average monthly net asset value per share over the prior 12 months. The monthly distributions may be sourced from income,paid-in capital, and/or capital gains, if any. To the extent that sufficient investment income is not available on a monthly basis, the Fund may distributepaid-in capital and/ or capital gains, if any, in order to maintain its managed distribution level.
Distributions to shareholders from net investment income and net realized gains, if any, are recorded on theex-dividend date. Such distributions are determined in accordance with income tax regulations and may differ from U.S. generally accepted accounting principles. Dividend sources are estimated at the time of declaration. The tax character of distributions is determined as of the Fund’s fiscal year end. Therefore, a portion of the Fund’s distributions made prior to the Fund’s fiscal year end may be categorized as a tax return of capital at year end.
Federal and other taxes
The Fund intends to continue to qualify as a regulated investment company by distributing substantially all of its investment company taxable income and any net realized capital gains (after reduction for capital loss carryforwards) sufficient to relieve it from all, or substantially all, federal income taxes. Accordingly, no provision for federal income taxes was required.
The Fund’s income and federal excise tax returns and all financial records supporting those returns for the prior three fiscal years are subject to examination by the federal and Delaware revenue authorities. Management has analyzed the Fund’s tax positions taken on federal, state, and foreign tax returns for all open tax years and does not believe that there are any uncertain tax positions that require recognition of a tax liability.
28 | Wells Fargo Utilities and High Income Fund (ERH)
Notes to financial statements (unaudited)
As of February 29, 2020, the aggregate cost of all investments for federal income tax purposes was $133,510,736 and the unrealized gains (losses) consisted of:
| | | | |
| |
Gross unrealized gains | | $ | 7,928,067 | |
| |
Gross unrealized losses | | | (5,026,518 | ) |
| |
Net unrealized gains | | $ | 2,901,549 | |
As of August 31, 2019, the Fund had capital loss carryforwards which consisted of $7,281,099 in short-term capital losses.
3. FAIR VALUATION MEASUREMENTS
Fair value measurements of investments are determined within a framework that has established a fair value hierarchy based upon the various data inputs utilized in determining the value of the Fund’s investments. The three-level hierarchy gives the highest priority to unadjusted quoted prices in active markets for identical assets or liabilities (Level 1) and the lowest priority to unobservable inputs (Level 3). The Fund’s investments are classified within the fair value hierarchy based on the lowest level of input that is significant to the fair value measurement. The inputs are summarized into three broad levels as follows:
| ∎ | | Level 1 – quoted prices in active markets for identical securities |
| ∎ | | Level 2 – other significant observable inputs (including quoted prices for similar securities, interest rates, prepayment speeds, credit risk, etc.) |
| ∎ | | Level 3 – significant unobservable inputs (including the Fund’s own assumptions in determining the fair value of investments) |
The inputs or methodologies used for valuing investments in securities are not necessarily an indication of the risk associated with investing in those securities.
The following is a summary of the inputs used in valuing the Fund’s assets and liabilities as of February 29, 2020:
| | | | | | | | | | | | | | | | |
| | | | |
| | | Quoted prices
(Level 1) | | | Other significant
observable inputs
(Level 2) | | | Significant
unobservable inputs (Level 3) | | | Total | |
| | | | |
Assets | | | | | | | | | | | | | | | | |
Investments in: | | | | | | | | | | | | | | | | |
| | | | |
Common stocks | | | | | | | | | | | | | | | | |
| | | | |
Energy | | $ | 0 | | | $ | 0 | | | $ | 162,166 | | | $ | 162,166 | |
| | | | |
Utilities | | | 93,651,672 | | | | 0 | | | | 0 | | | | 93,651,672 | |
| | | | |
Corporate bonds and notes | | | 0 | | | | 35,681,920 | | | | 0 | | | | 35,681,920 | |
| | | | |
Loans | | | 0 | | | | 936,328 | | | | 550,019 | | | | 1,486,347 | |
| | | | |
Preferred stocks | | | | | | | | | | | | | | | | |
| | | | |
Energy | | | 0 | | | | 0 | | | | 333,624 | | | | 333,624 | |
| | | | |
Rights | | | | | | | | | | | | | | | | |
| | | | |
Utilities | | | 0 | | | | 23,978 | | | | 0 | | | | 23,978 | |
| | | | |
Yankee corporate bonds and notes | | | 0 | | | | 3,348,839 | | | | 0 | | | | 3,348,839 | |
| | | | |
Short-term investments | | | | | | | | | | | | | | | | |
| | | | |
Investment companies | | | 1,723,739 | | | | 0 | | | | 0 | | | | 1,723,739 | |
| | | | |
Total assets | | $ | 95,375,411 | | | $ | 39,991,065 | | | $ | 1,045,809 | | | $ | 136,412,285 | |
Additional sector, industry or geographic detail is included in the Portfolio of Investments.
For the six months ended February 29, 2020, the Fund did not have any transfers into/out of Level 3.
4. TRANSACTIONS WITH AFFILIATES AND OTHER EXPENSES
Advisory fee
Funds Management, an indirect wholly owned subsidiary of Wells Fargo & Company (“Wells Fargo”) is the adviser to the Fund and is entitled to receive a fee at an annual rate of 0.50% of the Fund’s average daily total assets. Total assets consist of net assets of the Fund plus borrowings or other leverage for investment purposes to the extent excluded in calculating net assets. Prior to October 15, 2019, the Fund paid an advisory fee at an annual rate of 0.60% of the Fund’s average daily total assets.
Wells Fargo Utilities and High Income Fund (ERH) | 29
Notes to financial statements (unaudited)
Funds Management has retained the services of subadviser to provide daily portfolio management to the Fund. The fee for subadvisory services is borne by Funds Management. Wells Capital Management Incorporated, an affiliate of Funds Management and an indirect wholly owned subsidiary of Wells Fargo, is the subadviser to the Fund and is entitled to receive a fee from Funds Management at an annual rate of 0.40% of the Fund’s average daily total assets. Prior to October 15, 2019, Wells Capital Management Incorporated and Crow Point Partners, LLC (which is not an affiliate of Funds Management) each served as subadvisers to the Fund and was entitled to each receive a fee from Funds Management at an annual rate of 0.20% of the Fund’s average daily total assets.
Administration fee
Funds Management also serves as the administrator to the Fund, providing the Fund with a wide range of administrative services necessary to the operation of the Fund. Funds Management is entitled to receive an annual administration fee from the Fund equal to 0.05% of the Fund’s average daily total assets.
Interfund transactions
The Fund may purchase or sell portfolio investment securities to certain other Wells Fargo affiliates pursuant to Rule17a-7 under the 1940 Act and under procedures adopted by the Board of Trustees. The procedures have been designed to ensure that these interfund transactions, which do not incur broker commissions, are effected at current market prices. Pursuant to these procedures, the Fund had $893,296 and $2,089,734 in interfund purchases and sales, respectively, during the six months ended February 29, 2020.
5. CAPITAL SHARE TRANSACTIONS
The Fund has authorized an unlimited number of shares with no par value. For the six months ended February 29, 2020 and year ended August 31, 2019, the Fund issued 7,283 and 9,715 shares, respectively.
Under an open-market share repurchase program (the “Buyback Program”), the Fund is authorized to repurchase up to 10% of its outstanding shares in open market transactions. The Fund’s Board of Trustees has delegated to Funds Management full discretion to administer the Buyback Program including the determination of the amount and timing of repurchases in accordance with the best interests of the Fund and subject to applicable legal limitations. During the six months ended February 29, 2020, the Fund did not repurchase any of its shares under the open-market share repurchase program.
6. BORROWINGS
The Fund has borrowed $22,000,000 through a revolving credit facility administered by a major financial institution (the “Facility”). The Facility has a commitment amount of $25,000,000 with no specific contract expiration date but the Facility can be terminated upon 180 days’ notice. The Fund is charged interest at London Interbank Offered Rate (LIBOR) plus 0.70% and a commitment fee of 0.30% of the average daily unutilized amount of the commitment which may be waived if the amount drawn on the Facility is over 75% of the committed amount. The financial institution holds a security interest in all the assets of the Fund as collateral for the borrowing. Based on the nature of the terms of the Facility and comparative market rates, the carrying amount of the borrowings at February 29, 2020 approximates its fair value. If measured at fair value, the borrowings would be categorized as a Level 2 under the fair value hierarchy.
During the six months ended February 29, 2020, the Fund had average borrowings outstanding of $22,000,000 at an average interest rate of 2.76% and paid interest in the amount of $300,059, which represents 0.50% of its average daily net assets (on an annualized basis).
7. INVESTMENT PORTFOLIO TRANSACTIONS
Purchases and sales of investments, excluding U.S. government obligations (if any) and short-term securities, for the six months ended February 29, 2020 were $79,785,367 and $79,482,774, respectively.
8. CONCENTRATION RISK
Concentration risks result from exposure to a limited number of sectors. As of the end of the period, the Fund invests a concentration of its portfolio in the utilities sector. A fund that invests a substantial portion of its assets in any sector may be more affected by changes in that sector than would be a fund whose investments are not heavily weighted in any sector.
9. INDEMNIFICATION
Under the Fund’s organizational documents, the officers and Trustees have been granted certain indemnification rights against certain liabilities that may arise out of performance of their duties to the Fund. Additionally, in the normal course of business, the Fund may enter into contracts with service providers that contain a variety of indemnification clauses. The Fund’s maximum exposure under these arrangements is dependent on future claims that may be made against the Fund and, therefore, cannot be estimated.
30 | Wells Fargo Utilities and High Income Fund (ERH)
Notes to financial statements (unaudited)
10. NEW ACCOUNTING PRONOUNCEMENTS
In August 2018, FASB issued Accounting Standards Update (“ASU”)No. 2018-13, Fair Value Measurement (Topic 820)Disclosure Framework—Changes to the Disclosure Requirements for Fair Value Measurement.ASU2018-13 updates the disclosure requirements for fair value measurements by modifying or removing certain disclosures and adding certain new disclosures. The amendments are effective for fiscal years, and interim periods within those fiscal years, beginning after December 15, 2019. Early adoption is permitted. Management has adopted the removal and modification of disclosures early, as permitted, and will adopt the additional new disclosures at the effective date.
In March 2017, FASB issued ASUNo. 2017-08,Premium Amortization on Purchased Callable Debt Securities. ASU2017-08 shortens the amortization period for certain callable debt securities held at a premium and requires the premium to be amortized to the earliest call date. The amendments do not require an accounting change for securities held at a discount and discounts will continue to be accreted to the maturity date of the security. ASU2017-08 is effective for fiscal years beginning after December 15, 2018 and for interim periods within those fiscal years. During the current reporting period, management of the Fund adopted the change in accounting policy which did not have a material impact to the Fund’s financial statements.
11. SUBSEQUENT DISTRIBUTIONS
Under the managed distribution plan, the Fund declared the following distributions to shareholders:
| | | | | | |
| Declaration date | | Record date | | Payable date | | Per share amount |
| | | |
| February 21, 2020 | | March, 12, 2019 | | April, 1, 2019 | | $0.075 |
| | | |
| March, 29, 2019 | | April, 12, 2019 | | May, 1, 2019 | | 0.075 |
| | | |
| April, 26, 2019 | | May, 14, 2019 | | June, 3, 2019 | | 0.075 |
These distributions are not reflected in the accompanying financial statements.
12. SUBSEQUENT EVENT
On March 11, 2020, the World Health Organization announced that it had made the assessment that coronavirus disease 2019(“COVID-19”) is a pandemic. The impacts ofCOVID-19 is adversely affecting the entire global economy, individual companies and investment products, and the market in general. There is significant uncertainty around the extent and duration of business disruptions related toCOVID-19 and the impact may be short term or may last for an extended period of time. The risk of further spreading ofCOVID-19 has led to significant uncertainty and volatility in the financial markets and the value of the Fund and the securities in which the Fund invests have generally been adversely affected by impacts caused byCOVID-19.
Wells Fargo Utilities and High Income Fund (ERH) | 31
Other information (unaudited)
PROXY VOTING INFORMATION
A description of the policies and procedures used to determine how to vote proxies relating to portfolio securities is available, upon request, by calling1-800-222-8222, visiting our website atwfam.com, or visiting the SEC website at sec.gov. Information regarding how the proxies related to portfolio securities were voted during the most recent12-month period ended June 30 is available on the website atwfam.comor by visiting the SEC website at sec.gov.
ANNUAL MEETING OF SHAREHOLDERS
On December 9, 2019, an Annual Meeting of Shareholders for the Fund was held to consider the following proposal. The results of the proposal are indicated below.
Proposal 1 – Election of trustees:
| | | | | | |
| Shares voted “For” | | Timothy J. Penny | | $ | 7,759,683 | |
| | |
| Shares voted “Withhold” | | | | $ | 200,776 | |
| | |
| Shares voted “For” | | James G. Polisson | | $ | 7,755,783 | |
| Shares voted “Withhold” | | | | $ | 204,676 | |
QUARTERLY PORTFOLIO HOLDINGS INFORMATION
The Fund files its complete schedule of portfolio holdings with the SEC for the first and third quarters of each fiscal as an exhibit to its reports on FormN-PORT. Shareholders may view the filed FormN-PORT by visiting the SEC website at sec.gov.
32 | Wells Fargo Utilities and High Income Fund (ERH)
Other information (unaudited)
BOARD OF TRUSTEES AND OFFICERS
The following table provides basic information about the Board of Trustees (the “Trustees”) and Officers of the Fund. Each of the Trustees and Officers1 listed below acts in identical capacities for each fund in the Wells Fargo family of funds, which consists of 146 mutual funds comprising the Wells Fargo Funds Trust, Wells Fargo Variable Trust, Wells Fargo Master Trust, and fourclosed-end funds, including the Fund (collectively the “Fund Complex”). The mailing address of each Trustee and Officer is 525 Market Street, 12th Floor, San Francisco, CA 94105. The Board of Trustees is classified into three classes of which one is elected annually. Each Trustee serves a three-year term concurrent with the class from which the Trustee is elected. Each Officer serves an indefinite term.
Independent Trustees
| | | | | | |
Name and year of birth | | Position held and
length of service* | | Principal occupations during past five years or longer | | Current other
public company or
investment
company
directorships |
|
| Class I -Non-Interested Trustees to serve until 2020 Annual Meeting of Shareholders |
| | | |
Isaiah Harris, Jr. (Born 1952) | | Trustee, since 2009; Audit Committee Chairman, since 2019 | | Retired. Chairman of the Board of CIGNA Corporation since 2009, and Director since 2005. From 2003 to 2011, Director of Deluxe Corporation. Prior thereto, President and CEO of BellSouth Advertising and Publishing Corp. from 2005 to 2007, President and CEO of BellSouth Enterprises from 2004 to 2005 and President of BellSouth Consumer Services from 2000 to 2003. Emeritus member of the Iowa State University Foundation Board of Governors. Emeritus Member of the Advisory Board of Iowa State University School of Business. Advisory Board Member, Palm Harbor Academy (private school). Advisory Board Member, Child Evangelism Fellowship(non-profit). Mr. Harris is a certified public accountant (inactive status). | | CIGNA Corporation |
| | | |
David F. Larcker (Born 1950) | | Trustee, since 2009 | | James Irvin Miller Professor of Accounting at the Graduate School of Business, Stanford University, Director of the Corporate Governance Research Initiative and Senior Faculty of The Rock Center for Corporate Governance since 2006. From 2005 to 2008, Professor of Accounting at the Graduate School of Business, Stanford University. Prior thereto, Ernst & Young Professor of Accounting at The Wharton School, University of Pennsylvania from 1985 to 2005. | | N/A |
| | | |
Olivia S. Mitchell (Born 1953) | | Trustee, since 2006; Nominating and Governance Committee Chair, since 2018 | | International Foundation of Employee Benefit Plans Professor, Wharton School of the University of Pennsylvania since 1993. Director of Wharton’s Pension Research Council and Boettner Center on Pensions & Retirement Research, and Research Associate at the National Bureau of Economic Research. Previously, Cornell University Professor from 1978 to 1993. | | N/A |
|
| Class II -Non-Interested Trustees to serve until 2021 Annual Meeting of Shareholders |
| | | |
William R. Ebsworth (Born 1957) | | Trustee, since 2015 | | Retired. From 1984 to 2013, equities analyst, portfolio manager, research director and chief investment officer at Fidelity Management and Research Company in Boston, Tokyo, and Hong Kong, and retired in 2013 as Chief Investment Officer of Fidelity Strategic Advisers, Inc. where he led a team of investment professionals managing client assets. Prior thereto, Board member of Hong Kong Securities Clearing Co., Hong Kong Options Clearing Corp., the Thailand International Fund, Ltd., Fidelity Investments Life Insurance Company, and Empire Fidelity Investments Life Insurance Company. Audit Committee Chair and Investment Committee Chair of the Vincent Memorial Hospital Endowment(non-profit organization). Mr. Ebsworth is a CFA® charterholder. | | N/A |
Wells Fargo Utilities and High Income Fund (ERH) | 33
Other information (unaudited)
| | | | | | |
Name and year of birth | | Position held and
length of service* | | Principal occupations during past five years or longer | | Current other
public company or
investment
company
directorships |
| | | |
Jane A. Freeman (Born 1953) | | Trustee, since 2015; Chair Liaison, since 2018 | | Retired. From 2012 to 2014 and 1999 to 2008, Chief Financial Officer of Scientific Learning Corporation. From 2008 to 2012, Ms. Freeman provided consulting services related to strategic business projects. Prior to 1999, Portfolio Manager at Rockefeller & Co. and Scudder, Stevens & Clark. Board member of the Harding Loevner Funds from 1996 to 2014, serving as both Lead Independent Director and chair of the Audit Committee. Board member of the Russell Exchange Traded Funds Trust from 2011 to 2012 and the chair of the Audit Committee. Ms. Freeman is a Board Member of The Ruth Bancroft Garden(non-profit organization). She is also an inactive Chartered Financial Analyst. | | N/A |
| | | |
Judith M. Johnson (Born 1949) | | Trustee, since 2008; Audit Committee Chairman, from 2009 to 2018 | | Retired. Prior thereto, Chief Executive Officer and Chief Investment Officer of Minneapolis Employees Retirement Fund from 1996 to 2008. Ms. Johnson is an attorney, certified public accountant and a certified managerial accountant. | | N/A |
|
| Class III -Non-Interested Trustees to serve until 2022 Annual Meeting of Shareholders |
| | | |
Timothy J. Penny (Born 1951) | | Trustee, since 1996; Chairman, since 2018 | | President and Chief Executive Officer of Southern Minnesota Initiative Foundation, anon-profit organization, since 2007. Member of the Board of Trustees of NorthStar Education Finance, Inc., anon-profit organization, since 2007. | | N/A |
| | | |
James G. Polisson (Born 1959) | | Trustee, since 2018 | | Retired. Chief Marketing Officer, Source (ETF) UK Services, Ltd, from 2015 to 2017. From 2012 to 2015, Principal of The Polisson Group, LLC, a management consulting, corporate advisory and principal investing company. Chief Executive Officer and Managing Director at Russell Investments, Global Exchange Traded Funds from 2010 to 2012. Managing Director of Barclays Global Investors from 1998 to 2010 and Global Chief Marketing Officer for iShares and Barclays Global Investors from 2000 to 2010. Trustee of the San Francisco Mechanics’ Institute, anon-profit organization, from 2013 to 2015. Board member of the Russell Exchange Traded Fund Trust from 2011 to 2012. Director of Barclays Global Investors Holdings Deutschland GmbH from 2006 to 2009. Mr. Polisson is an attorney and has a retired status with the Massachusetts and District of Columbia Bar Associations. | | N/A |
| | | |
Pamela Wheelock2 (Born 1959) | | Trustee, since January 2020; previously Trustee from January 2018 to July 2019 | | Board member of the Destination Medical Center Economic Development Agency, Rochester, Minnesota since 2019. Acting Commissioner, Minnesota Department of Human Services, July 2019 through September 2019. Human Services Manager (part-time), Minnesota Department of Human Services, October 2019 through December 2019. Chief Operating Officer, Twin Cities Habitat for Humanity from 2017 to 2019. Vice President of University Services, University of Minnesota from 2012 to 2016. Prior thereto, on the Board of Directors, Governance Committee and Finance Committee for the Minnesota Philanthropy Partners (Saint Paul Foundation) from 2012 to 2018, Interim Chief Executive Officer of Blue Cross Blue Shield of Minnesota from 2011 to 2012, Chairman of the Board from 2009 to 2012 and Board Director from 2003 to 2015. Vice President, Leadership and Community Engagement, Bush Foundation, Saint Paul, Minnesota (a private foundation) from 2009 to 2011. Executive Vice President and Chief Financial Officer, Minnesota Sports and Entertainment from 2004 to 2009 and Senior Vice President from 2002 to 2004. Executive Vice President of the Minnesota Wild Foundation from 2004 to 2008. Commissioner of Finance, State of Minnesota, from 1999 to 2002. Currently Board Chair of the Minnesota Wild Foundation since 2010. | | N/A |
| * | Length of service dates reflect the Trustee’s commencement of service with the Trust’s predecessor entities, where applicable. |
34 | Wells Fargo Utilities and High Income Fund (ERH)
Other information (unaudited)
Officers
| | | | |
Name and year of birth | | Position held and length of service | | Principal occupations during past five years or longer |
| | |
Andrew Owen (Born 1960) | | President, since 2017 | | Executive Vice President of Wells Fargo & Company and Head of Affiliated Managers, Wells Fargo Asset Management, since 2014. In addition, Mr. Owen is currently President, Chief Executive Officer and Director of Wells Fargo Funds Management, LLC since 2017. Prior thereto, Executive Vice President responsible for marketing, investments and product development for Wells Fargo Funds Management, LLC, from 2009 to 2014. |
| | |
Nancy Wiser1 (Born 1967) | | Treasurer, since 2012 | | Executive Vice President of Wells Fargo Funds Management, LLC since 2011. Chief Operating Officer and Chief Compliance Officer at LightBox Capital Management LLC, from 2008 to 2011. |
| | |
Michelle Rhee (Born 1966) | | Chief Legal Officer, since 2019 | | Secretary of Wells Fargo Funds Management, LLC, Chief Legal Counsel of Wells Fargo Asset Management and Assistant General Counsel of Wells Fargo Bank, N.A. since 2018. Associate General Counsel and Managing Director of Bank of America Corporation from 2004 to 2018. |
| | |
Catherine Kennedy (Born 1969) | | Secretary, since 2019 | | Vice President of Wells Fargo Funds Management, LLC and Senior Counsel of the Wells Fargo Legal Department since 2010. Vice President and Senior Counsel of Evergreen Investment Management Company, LLC from 1998 to 2010. |
| | |
Michael H. Whitaker (Born 1967) | | Chief Compliance Officer, since 2016 | | Chief Compliance Officer of Wells Fargo Asset Management since 2016. Senior Vice President and Chief Compliance Officer for Fidelity Investments from 2007 to 2016. |
| | |
David Berardi (Born 1975) | | Assistant Treasurer, since 2009 | | Vice President of Wells Fargo Funds Management, LLC since 2009. Vice President of Evergreen Investment Management Company, LLC from 2008 to 2010. Manager of Fund Reporting and Control for Evergreen Investment Management Company, LLC from 2004 to 2010. |
| | |
Jeremy DePalma1 (Born 1974) | | Assistant Treasurer, since 2005 | | Senior Vice President of Wells Fargo Funds Management, LLC since 2009. Senior Vice President of Evergreen Investment Management Company, LLC from 2008 to 2010 and head of the Fund Reporting and Control Team within Fund Administration from 2005 to 2010. |
| 1 | Nancy Wiser acts as Treasurer of 64 funds in the Fund Complex. Jeremy DePalma acts as Treasurer of 82 funds and Assistant Treasurer of 64 funds in the Fund Complex. |
| 2 | Pamela Wheelock wasre-appointed to the Board effective January 1, 2020. |
Wells Fargo Utilities and High Income Fund (ERH) | 35
Automatic dividend reinvestment plan
AUTOMATIC DIVIDEND REINVESTMENT PLAN
All common shareholders are eligible to participate in the Automatic Dividend Reinvestment Plan (“the Plan”). Pursuant to the
Plan, unless a common shareholder is ineligible or elects otherwise, all cash dividends and capital gains distributions are automatically reinvested by Computershare Trust Company, N.A., as agent for shareholders in administering the Plan (“Plan Agent”), in additional common shares of the Fund. Whenever the Fund declares an ordinary income dividend or a capital gain dividend (collectively referred to as “dividends”) payable either in shares or in cash, nonparticipants in the Plan will receive cash, and participants in the Plan will receive the equivalent in common shares. The shares are acquired by the Plan Agent for the participant’s account, depending upon the circumstances described below, either (i) through receipt of additional unissued but authorized common shares from the Fund (“newly issued common shares”) or (ii) by purchase of outstanding common shares on the open-market (open-market purchases) on the NYSE Amex or elsewhere. If, on the payment date for any dividend or distribution, the net asset value per share of the common shares is equal to or less than the market price per common share plus estimated brokerage commissions (“market premium”), the Plan Agent will invest the amount of such dividend or distribution in newly issued shares on behalf of the participant. The number of newly issued common shares to be credited to the participant’s account will be determined by dividing the dollar amount of the dividend by the net asset value per share on the date the shares are issued, provided that the maximum discount from the then current market price per share on the date of issuance may not exceed 5%. If on the dividend payment date the net asset value per share is greater than the market value (“market discount”), the Plan Agent will invest the dividend amount in shares acquired on behalf of the participant in openmarket purchases. There will be no brokerage charges with respect to shares issued directly by the Fund as a result of dividends or capital gains distributions payable either in shares or in cash. However, each participant will pay a pro rata share of brokerage commissions incurred with respect to the Plan Agent’s open-market purchases in connection with the reinvestment of dividends. The automatic reinvestment of dividends and distributions will not relieve participants of any federal, state or local income tax that may be payable (or required to be withheld) on such dividends. All correspondence concerning the Plan should be directed to the Plan Agent at P.O. Box 505000, Louisville, Kentucky 40233 or by calling1-800-730-6001.
36 | Wells Fargo Utilities and High Income Fund (ERH)

Transfer Agent, Registrar, Shareholder Servicing
Agent & Dividend Disbursing Agent
Computershare Trust Company, N.A.
P.O. Box 505000
Louisville, Kentucky 40233
1-800-730-6001
Website:wfam.com

Wells Fargo Asset Management (WFAM) is the trade name for certain investment advisory/management firms owned by Wells Fargo & Company. These firms include but are not limited to Wells Capital Management Incorporated and Wells Fargo Funds Management, LLC. Certain products managed by WFAM entities are distributed by Wells Fargo Funds Distributor, LLC (a broker-dealer and Member FINRA).
This material is for general informational and educational purposes only and is NOT intended to provide investment advice or a recommendation of any kind—including a recommendation for any specific investment, strategy, or plan.
INVESTMENT PRODUCTS: NOT FDIC INSURED ◾ NO BANK GUARANTEE ◾ MAY LOSE VALUE
© 2020 Wells Fargo & Company. All rights reserved
PAR-0220-04682 04-20
SUHIF/SAR152 02-20
ITEM 2. CODE OF ETHICS
Not applicable.
ITEM 3. AUDIT COMMITTEE FINANCIAL EXPERT
Not applicable.
ITEM 4. PRINCIPAL ACCOUNTANT FEES AND SERVICES
Not applicable.
ITEM 5. AUDIT COMMITTEE OF LISTED REGISTRANTS
Not applicable.
ITEM 6. INVESTMENTS
A Portfolio of Investments for Wells Fargo Utilities and High Income Fund is included as part of the report to shareholders filed under Item 1 of this Form.
ITEM 7. DISCLOSURE OF PROXY VOTING POLICIES AND PROCEDURES FORCLOSED-END MANAGEMENT INVESTMENT COMPANIES
Not applicable.
ITEM 8. PORTFOLIO MANAGERS OFCLOSED-END MANAGEMENT INVESTMENT COMPANIES
Not applicable.
ITEM 9. PURCHASES OF EQUITY SECURITIES BYCLOSED-END MANAGEMEENT INVESTMENT COMPANY AND AFFILIATED PURCHASERS
| | | | | | | | | | | | | | | | |
Period | | (a)
Total
Number of
Shares
Purchased | | | (b)
Average Price
Paid per Share | | | (c)
Total
Number of
Shares
Purchased
as Part of
Publicly
Announced
Plans or
Programs | | | (d)
Maximum Number
of Shares that May
Yet Be Purchased
Under the Plans or
Programs | |
9/1/2019 to 9/30/2019 | | | 0 | | | | 0.00 | | | | 0 | | | | 925,565 | |
10/1/2019 to 10/31/2019 | | | 0 | | | | 0.00 | | | | 0 | | | | 925,565 | |
11/1/2019 to 11/30/2019 | | | 0 | | | | 0.00 | | | | 0 | | | | 925,565 | |
12/1/2019 to 12/31/2019 | | | 0 | | | | 0.00 | | | | 0 | | | | 925,565 | |
1/1/2020 to 1/31/2020 | | | 0 | | | | 0.00 | | | | 0 | | | | 926,748 | |
2/1/2020 to 2/29/2020 | | | 0 | | | | 0.00 | | | | 0 | | | | 926,748 | |
Total | | | 0 | | | | 0.00 | | | | 0 | | | | 926,748 | |
ITEM 10. SUBMISSION OF MATTERS TO A VOTE OF SECURITY HOLDERS
There have been no material changes to the procedures by which shareholders may recommend nominees to the registrant’s Board of Trustees that have been implemented since the registrant’s last provided disclosure in response to the requirements of this Item.
ITEM 11. CONTROLS AND PROCEDURES
(a) The President and Treasurer have concluded that the Wells Fargo Utilities and High Income Fund disclosure controls and procedures (as defined in Rule30a-3(c) under the Investment Company Act of 1940) provide reasonable assurances that material information relating to the registrant is made known to them by the appropriate persons, based on their evaluation of these controls and procedures as of a date within 90 days of the filing of this report.
(b) There were no significant changes in the registrant’s internal controls over financial reporting (as defined in Rule30a-3(d) under the Investment Company Act of 1940) that occurred during the most recent fiscal half-year of the period covered by this report that materially affected, or is reasonably likely to materially affect, the registrant’s internal control over financial reporting.
ITEM 12. DISCLOSURES OF SECURITIES LENDING ACTIVITES FORCLOSED-END MANAGEMENT INVESTMENT COMPANIES
Not applicable.
ITEM 13. EXHIBITS
(a)(1) Not applicable
(a)(2) Certifications pursuant to Section 302 of the Sarbanes-Oxley Act of 2002.
(b) Certifications pursuant to Section 906 of the Sarbanes-Oxley Act of 2002.
(c) Section 19(a) notices to shareholders pursuant to Registrant’s exemptive order granting an exemption from Section 19(b) of the 1940 Act.
SIGNATURES
Pursuant to the requirements of the Securities Exchange Act of 1934 and the Investment Company Act of 1940, the registrant has duly caused this report to be signed on its behalf by the undersigned, thereunto duly authorized.
| | |
| Wells Fargo Utilities and High Income Fund |
| |
| By: | | /s/ Andrew Owen |
| |
| | Andrew Owen |
| | President |
| |
| Date: | | April 28, 2020 |
Pursuant to the requirements of the Securities Exchange Act of 1934 and the Investment Company Act of 1940, this report has been signed below by the following persons on behalf of the registrant and in the capacities and on the date indicated.
| | |
| Wells Fargo Utilities and High Income Fund |
| |
| By: | | /s/ Andrew Owen |
| |
| | Andrew Owen |
| | President |
| |
| Date: | | April 28, 2020 |
| |
| By: | | /s/ Nancy Wiser |
| |
| | Nancy Wiser |
| | Treasurer |
| |
| Date: | | April 28, 2020 |