Exhibit 99.1

Acquisition Overview
Placer Sierra Bancshares & First Financial Bancorp
Disclosure
This presentation includes forward-looking statements within the meaning of Section 27A of the Securities Act of 1933, as amended, and Section 21E of the Exchange Act of 1934, as amended, and Placer Sierra Bancshares (PLSB) and First Financial Bancorp (FLLC) intend for such forward-looking statements to be covered by Private Securities Litigation Reform Act of 1995. These forward-looking statements describe the companies’ expectations regarding future events and developments, including Placer Sierra Bancshare’s ability to achieve expected financial results from a merger with First Financial Bancorp. Future events are difficult to predict, and the expectations described above are necessarily subject to risk and uncertainty that may cause actual results to differ materially and adversely. In addition, discussions about risks and uncertainties are set forth from time to time in the companies’ publicly available Securities and Exchange Commission filings. The companies undertake no obligation to publicly revise these forward-looking statements to reflect subsequent events or circumstances.
2
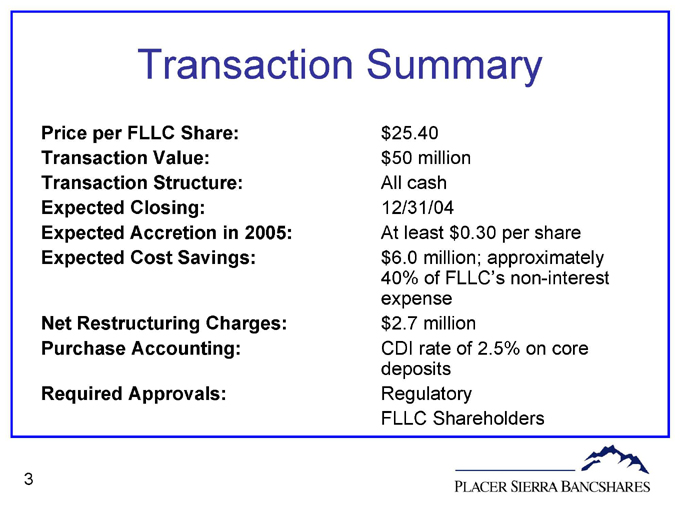
Transaction Summary
Price per FLLC Share: $25.40
Transaction Value: $50 million
Transaction Structure: All cash
Expected Closing: 12/31/04
Expected Accretion in 2005: At least $0.30 per share
Expected Cost Savings: $6.0 million; approximately 40% of FLLC’s non-interest expense
Net Restructuring Charges: $2.7 million
Purchase Accounting: CDI rate of 2.5% on core deposits
Required Approvals: Regulatory FLLC Shareholders
3
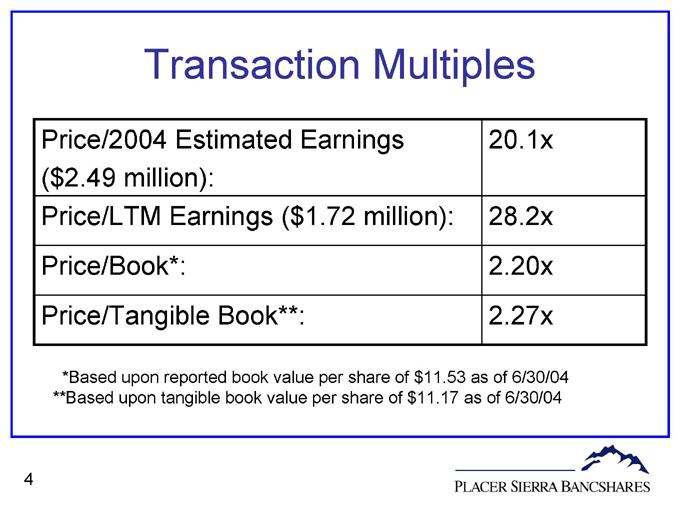
Transaction Multiples
Price/2004 Estimated Earnings ($2.49 million): 20.1x
Price/LTM Earnings ($1.72 million): 28.2x
Price/Book*: 2.20x
Price/Tangible Book**: 2.27x
*Based upon reported book value per share of $11.53 as of 6/30/04
**Based upon tangible book value per share of $11.17 as of 6/30/04
4
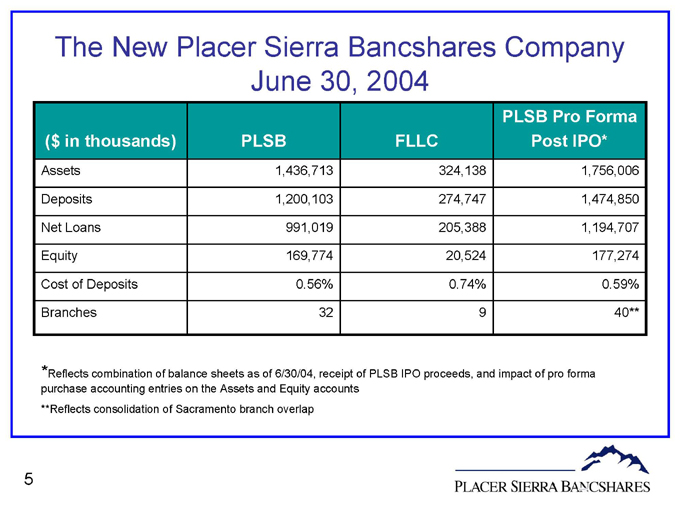
The New Placer Sierra Bancshares Company June 30, 2004
($ in thousands) PLSB FLLC PLSB Pro Forma Post IPO*
Assets 1,436,713 324,138 1,756,006
Deposits 1,200,103 274,747 1,474,850
Net Loans 991,019 205,388 1,194,707
Equity 169,774 20,524 177,274
Cost of Deposits 0.56% 0.74% 0.59%
Branches 32 9 40**
*Reflects combination of balance sheets as of 6/30/04, receipt of PLSB IPO proceeds, and impact of pro forma purchase accounting entries on the Assets and Equity accounts
**Reflects consolidation of Sacramento branch overlap
5
The New Placer Sierra Bancshares
The merger of PLSB and FLLC will create a bank with total assets of approximately $1.8 billion
The combined company will be the largest community bank in Central California
The pro forma EPS is immediately accretive and targeted to exceed $0.30 accretion to GAAP earnings in 2005 (excluding merger-related expenses)
6
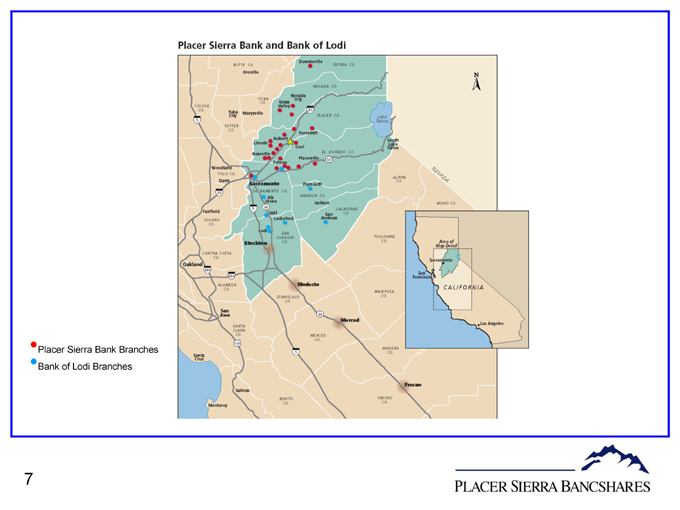
Placer Sierra Bank Branches
Bank of Lodi Branches
7
Transaction Rationale
Expands footprint and regional presence in high growth markets to become the largest community bank in Central California
Re-deploys excess capital through strategic expansion into additional contiguous banking markets
Managed transaction to be accretive to earnings with low execution risk and positive upside future potential
Experienced executive management team prepared and focused to leverage community bank expansion opportunities
Creates pro forma balance sheet that can support execution on additional expansion opportunities south along the Highway 99 corridor
8
Risk Considerations
PLSB management believes that FLLC will have little execution risk
In-market footprint transaction
No significant branch closures/divestitures
Pro forma capital is within target range
Size of transaction is manageable
9
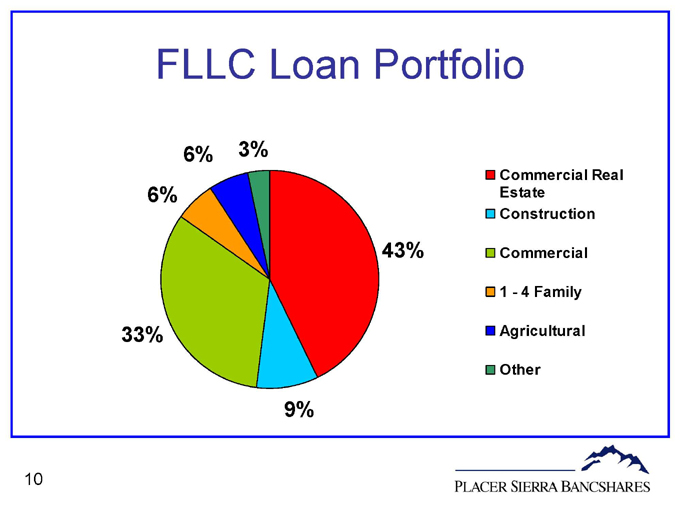
FLLC Loan Portfolio
3%
43%
9%
33%
6%
6%
Commercial Real Estate
Construction
Commercial
1 - 4 Family
Agricultural
Other
10
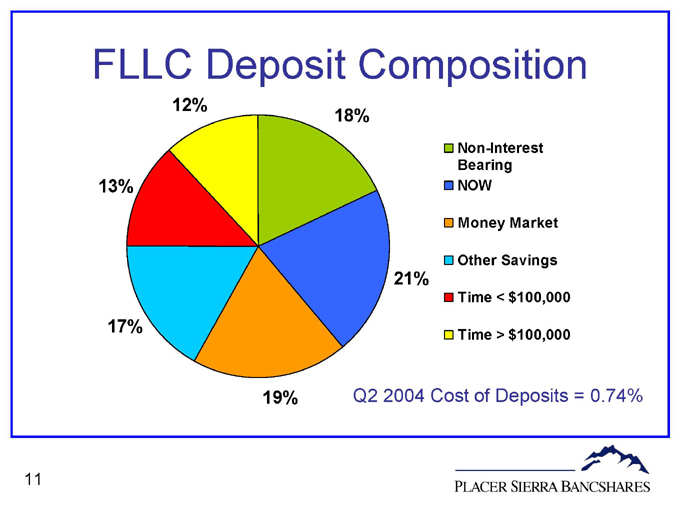
FLLC Deposit Composition
18%
21%
19%
17%
13%
12%
Non-Interest Bearing
NOW
Money Market
Other Savings
Time < $100,000
Time > $100,000
Q2 2004 Cost of Deposits = 0.74%
11
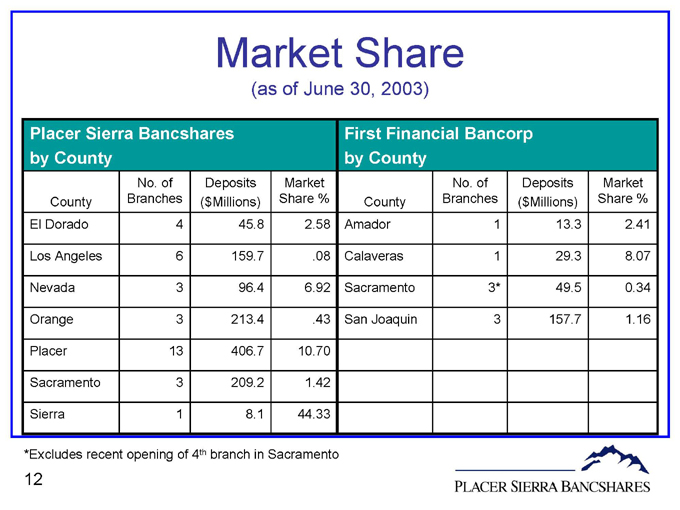
Market Share
(as of June 30, 2003)
Placer Sierra Bancshares by County
County No. of Branches Deposits ($Millions) Market Share %
El Dorado 4 45.8 2.58
Los Angeles 6 159.7 .08
Nevada 3 96.4 6.92
Orange 3 213.4 .43
Placer 13 406.7 10.70
Sacramento 3 209.2 1.42
Sierra 1 8.1 44.33
First Financial Bancorp by County
County No. of Branches Deposits ($Millions) Market Share %
Amador 1 13.3 2.41
Calaveras 1 29.3 8.07
Sacramento 3* 49.5 0.34
San Joaquin 3 157.7 1.16
*Excludes recent opening of 4th branch in Sacramento
12
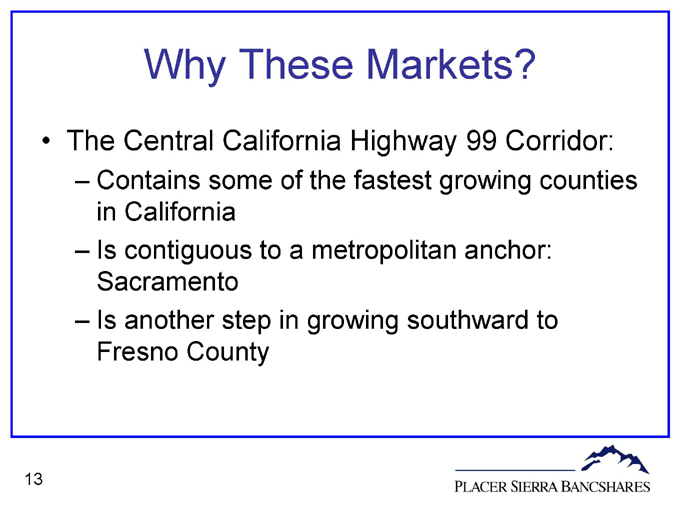
Why These Markets?
The Central California Highway 99 Corridor:
Contains some of the fastest growing counties in California
Is contiguous to a metropolitan anchor: Sacramento
Is another step in growing southward to Fresno County
13
Demographics of Target Markets
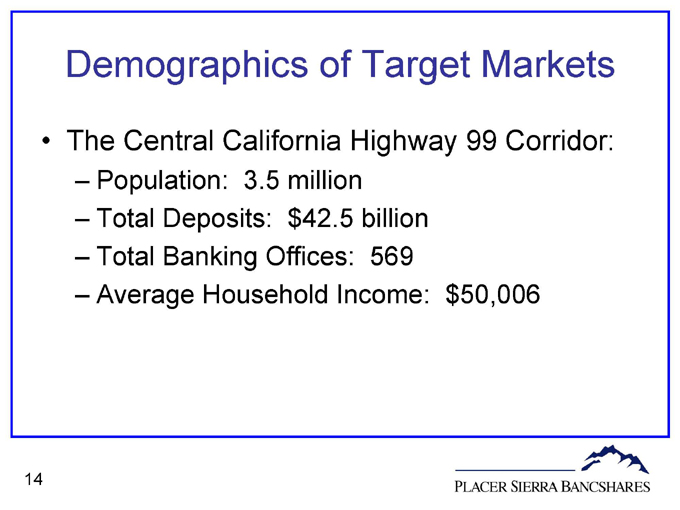
The Central California Highway 99 Corridor:
Population: 3.5 million
Total Deposits: $42.5 billion
Total Banking Offices: 569
Average Household Income: $50,006
14
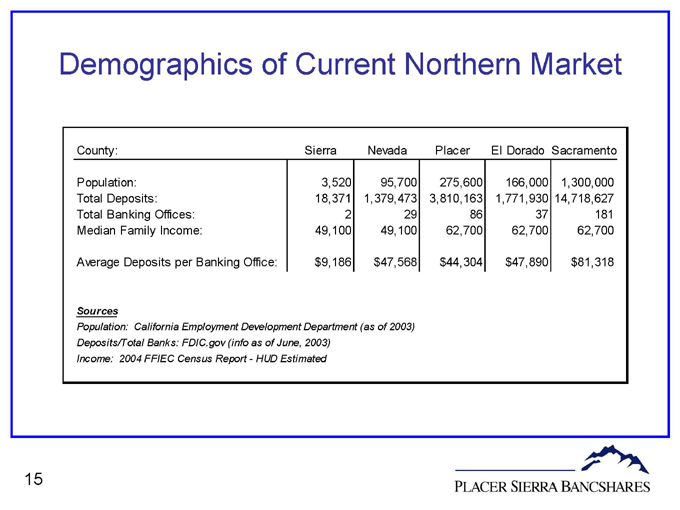
Demographics of Current Northern Market
County: Sierra Nevada Placer El Dorado Sacramento
Population: 3,520 95,700 275,600 166,000 1,300,000
Total Deposits: 18,371 1,379,473 3,810,163 1,771,930 14,718,627
Total Banking Offices: 2 29 86 37 181
Median Family Income: 49,100 49,100 62,700 62,700 62,700
Average Deposits per Banking Office: $9,186 $47,568 $44,304 $47,890 $81,318
Sources
Population: California Employment Development Department (as of 2003)
Deposits/Total Banks: FDIC.gov (info as of June, 2003)
Income: 2004 FFIEC Census Report - HUD Estimated
15
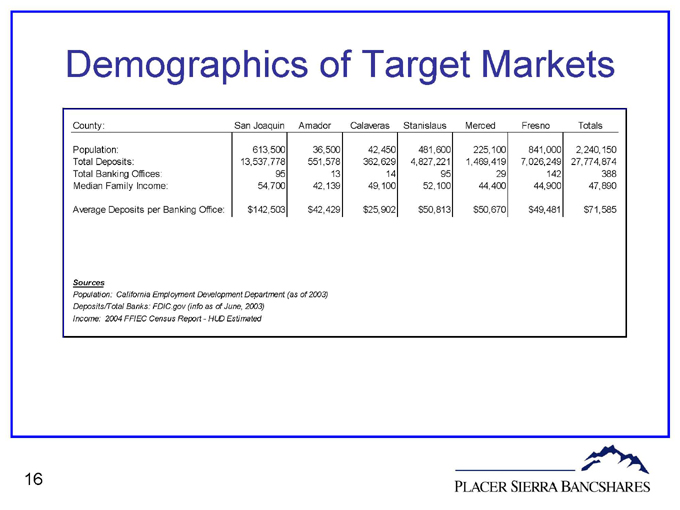
Demographics of Target Markets
County: San Joaquin Amador Calaveras Stanislaus Merced Fresno Totals
Population: 613,500 36,500 42,450 481,600 225,100 841,000 2,240,150
Total Deposits: 13,537,778 551,578 362,629 4,827,221 1,469,419 7,026,249 27,774,874
Total Banking Offices: 95 13 14 95 29 142 388
Median Family Income: 54,700 42,139 49,100 52,100 44,400 44,900 47,890
Average Deposits per Banking Office: $142,503 $42,429 $25,902 $50,813 $50,670 $49,481 $71,585
Sources
Population: California Employment Development Department (as of 2003)
Deposits/Total Banks: FDIC.gov (info as of June, 2003)
Income: 2004 FFIEC Census Report - HUD Estimated
16
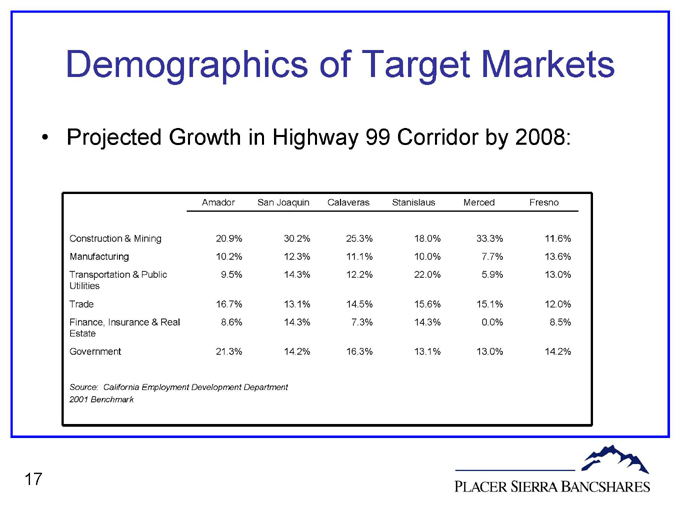
Demographics of Target Markets
Projected Growth in Highway 99 Corridor by 2008:
Amador San Joaquin Calaveras Stanislaus Merced Fresno
Construction & Mining 20.9% 30.2% 25.3% 18.0% 33.3% 11.6%
Manufacturing 10.2% 12.3% 11.1% 10.0% 7.7% 13.6%
Transportation & Public Utilities 9.5% 14.3% 12.2% 22.0% 5.9% 13.0%
Trade 16.7% 13.1% 14.5% 15.6% 15.1% 12.0%
Finance, Insurance & Real Estate 8.6% 14.3% 7.3% 14.3% 0.0% 8.5%
Government 21.3% 14.2% 16.3% 13.1% 13.0% 14.2%
Source: California Employment Development Department 2001 Benchmark
17
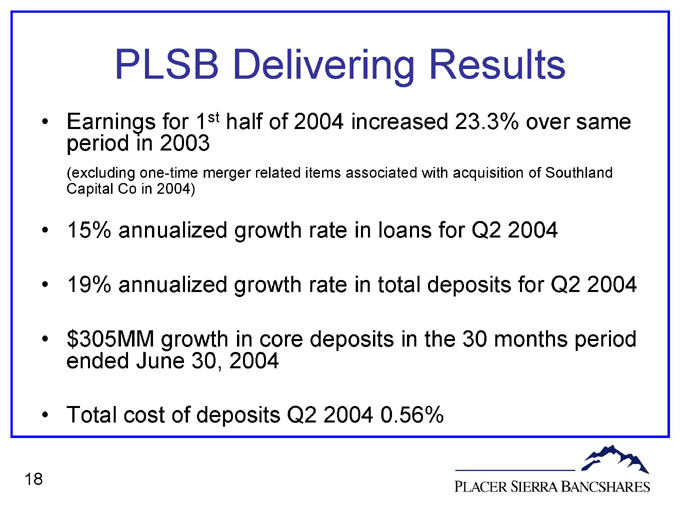
PLSB Delivering Results
Earnings for 1st half of 2004 increased 23.3% over same period in 2003
(excluding one-time merger related items associated with acquisition of Southland Capital Co in 2004)
15% annualized growth rate in loans for Q2 2004
19% annualized growth rate in total deposits for Q2 2004
$305MM growth in core deposits in the 30 months period ended June 30, 2004
Total cost of deposits Q2 2004 0.56%
18
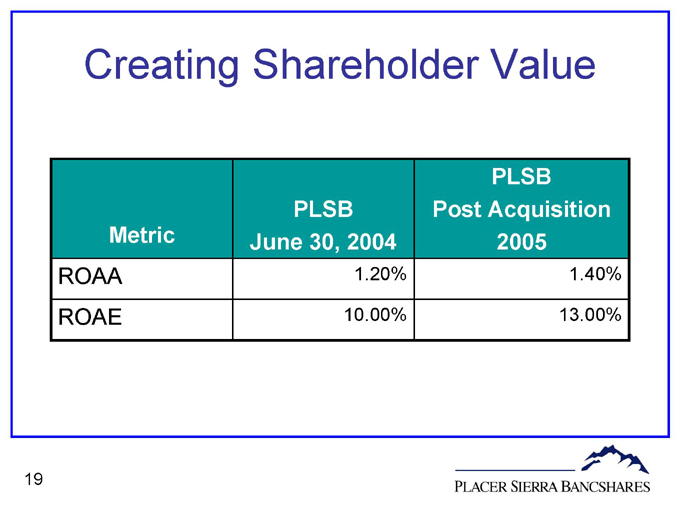
Creating Shareholder Value
Metric PLSB June 30, 2004 PLSB Post Acquisition 2005
ROAA 1.20% 1.40%
ROAE 10.00% 13.00%
19