Exhibit 99.1

Investor Presentation
May 2005
Forward Looking Information and Non-GAAP Reconciliations
This presentation may include forward-looking statements. These forward-looking statements include comments with respect to our objectives and strategies and the results of our operations and our business. However, by their nature, these forward-looking statements involve numerous assumptions, uncertainties and opportunities, both general and specific. The risk exists that these statements may not be fulfilled. We caution readers of this presentation not to place undue reliance on these forward-looking statements, as a number of factors could cause future company results to differ materially from these statements. Forward-looking statements may be influenced in particular by factors such as fluctuations in interest rates and stock indices, the effects of competition in the areas in which we operate and changes in economic, political, regulatory and technological conditions. We caution that the foregoing list is not exhaustive. When relying on forward-looking statements to make decisions, investors should carefully consider the aforementioned factors as well as other uncertainties and events.
Throughout this presentation, certain non-GAAP metrics are provided that management believes provide useful information in understanding the financial performance of the Company. Reconciliations of the non-GAAP metrics to the comparable GAAP metrics are provided in the Company’s Annual Report on Form 10K for the year ended December 31, 2004, which is available on the Company’s website at www.plsb.com.
2

Stock Profile
NASDAQ Symbol: PLSB Recent Price (5/10/05): $24.56 Market Cap: $365 million Shares Outstanding: 14.9 million Float: 13.7 million Avg. Volume: 56,318 Forward P/E*: 15.2 Price/Book (mrq): 1.89
* Based on 2005 consensus analyst estimates
3
Investment Considerations
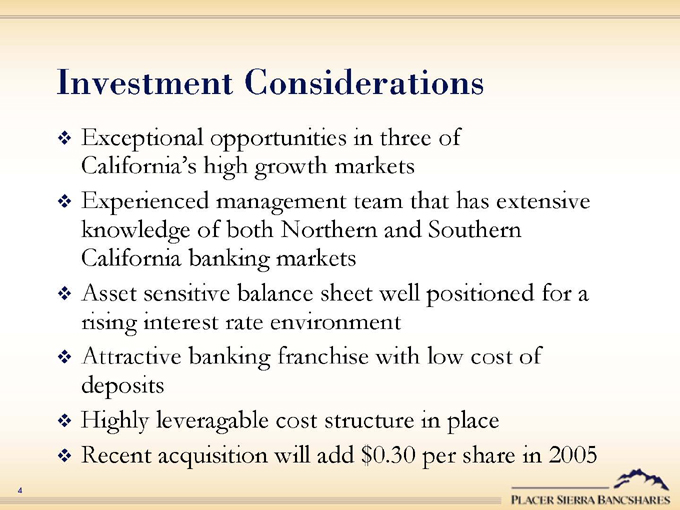
Exceptional opportunities in three of California’s high growth markets
Experienced management team that has extensive knowledge of both Northern and Southern California banking markets Asset sensitive balance sheet well positioned for a rising interest rate environment Attractive banking franchise with low cost of deposits Highly leveragable cost structure in place Recent acquisition will add $0.30 per share in 2005
4

Company Overview
Placer Sierra Bancshares
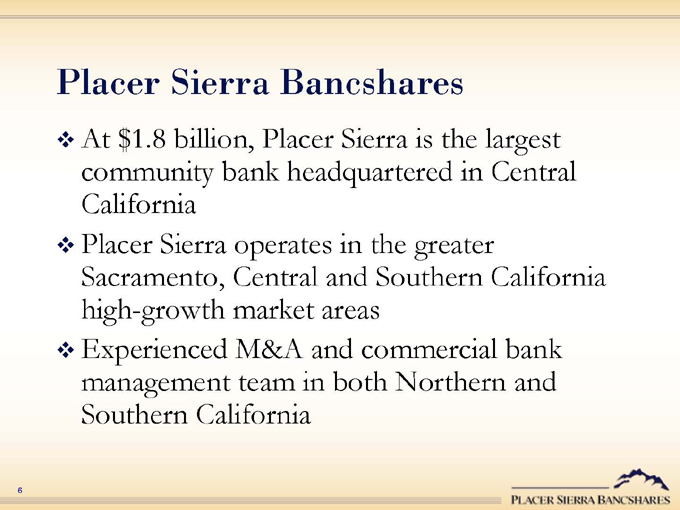
At $1.8 billion, Placer Sierra is the largest community bank headquartered in Central California Placer Sierra operates in the greater Sacramento, Central and Southern California high-growth market areas Experienced M&A and commercial bank management team in both Northern and Southern California
6
Strong Trends in Key Metrics
Net Income
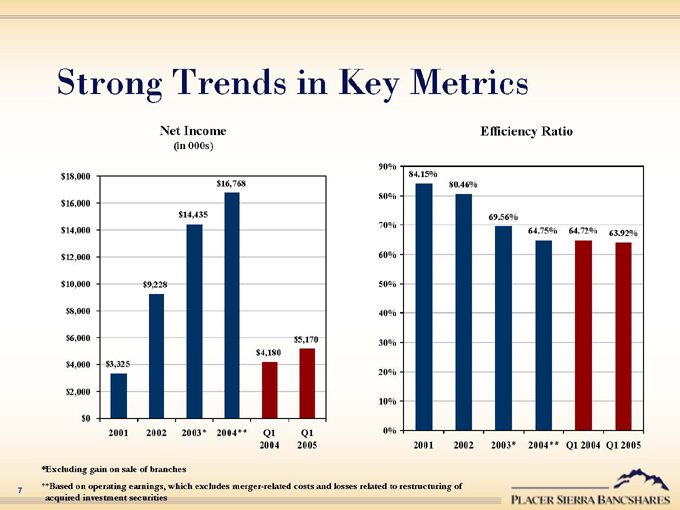
(in 000s) $18,000 $16,000 $14,000 $12,000 $10,000 $8,000 $6,000 $4,000 $2,000 $0 $3,325 $9,228 $14,435 $16,768 $5,170 $4,180
2001 2002 2003* 2004**
Q1 2004
Q1 2005
Efficiency Ratio
90% 80% 70% 60% 50% 40% 30% 20% 10% 0%
2001 2002 2003* 2004** Q1 2004 Q1 2005
84.15%
80.46%
69.56%
64.75%
64.72%
63.92%
*Excluding gain on sale of branches
** Based on operating earnings, which excludes merger-related costs and losses related to restructuring of acquired investment securities
7
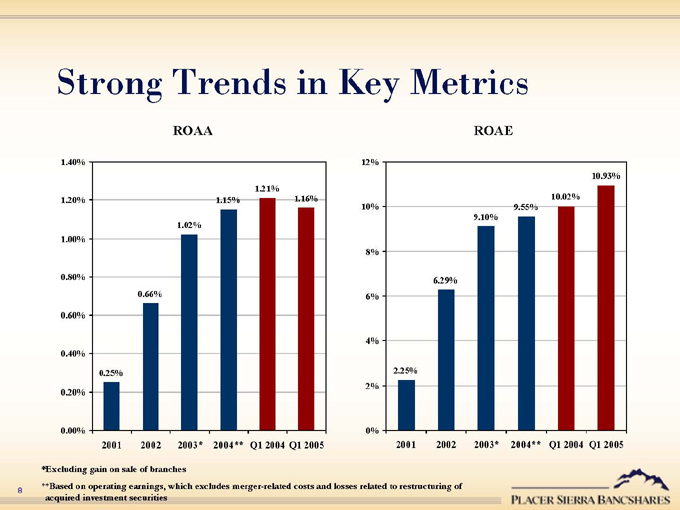
Strong Trends in Key Metrics
ROAA
1.40% 1.20% 1.00% 0.80% 0.60% 0.40% 0.20% 0.00%
0.25%
0.66%
1.02%
1.15%
1.21%
1.16%
2001 2002 2003* 2004** Q1 2004 Q1 2005
ROAE
12% 10% 8% 6% 4% 2% 0%
2001 2002 2003* 2004** Q1 2004 Q1 2005
2.25%
6.29%
9.10%
9.55%
10.02%
10.93%
*Excluding gain on sale of branches
** Based on operating earnings, which excludes merger-related costs and losses related to restructuring of acquired investment securities
8
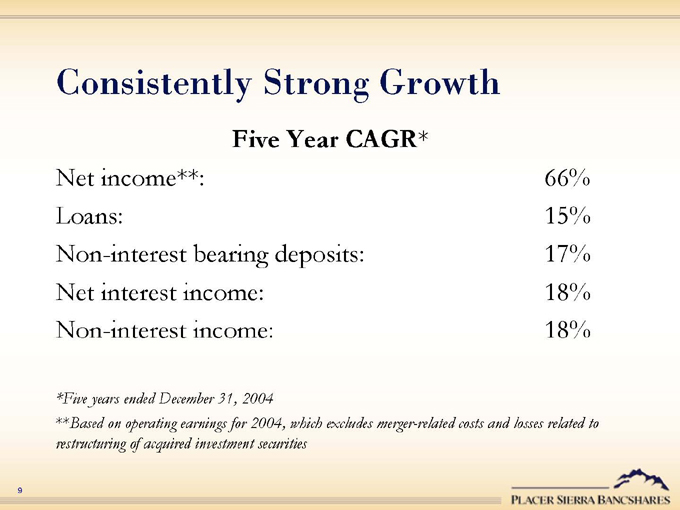
Consistently Strong Growth
Five Year CAGR*
Net income**: 66% Loans: 15% Non-interest bearing deposits: 17% Net interest income: 18% Non-interest income: 18%
*Five years ended December 31, 2004
**Based on operating earnings for 2004, which excludes merger-related costs and losses related to restructuring of acquired investment securities
9
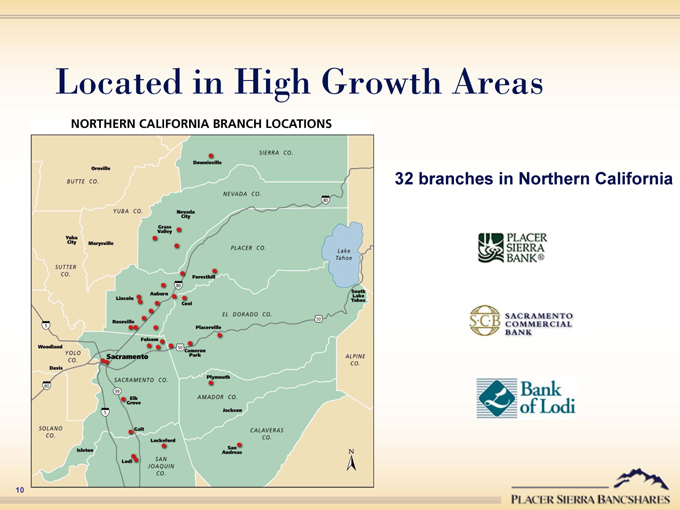
Located in High Growth Areas
NORTHERN CALIFORNIA BRANCH LOCATIONS
32 branches in Northern California
10
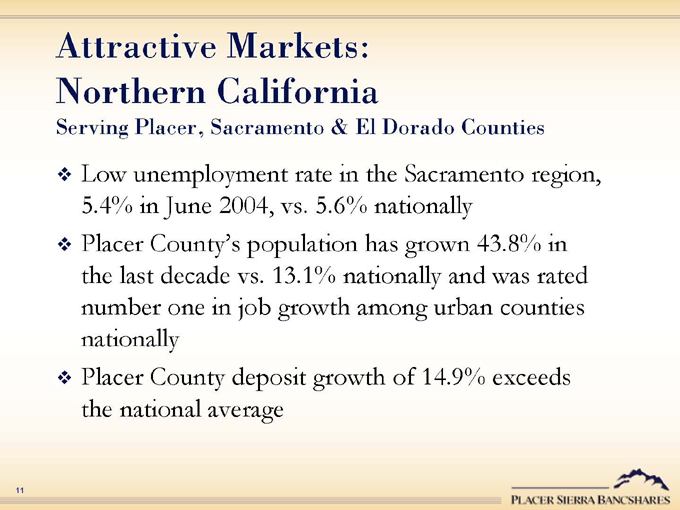
Attractive Markets: Northern California
Serving Placer, Sacramento & El Dorado Counties
Low unemployment rate in the Sacramento region, 5.4% in June 2004, vs. 5.6% nationally Placer County’s population has grown 43.8% in the last decade vs. 13.1% nationally and was rated number one in job growth among urban counties nationally Placer County deposit growth of 14.9% exceeds the national average
11
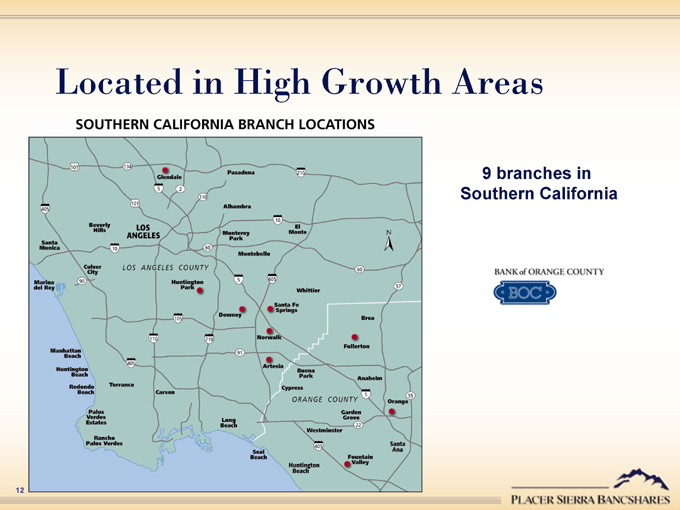
Located in High Growth Areas
southern california branch locations
9 branches in Southern California
12
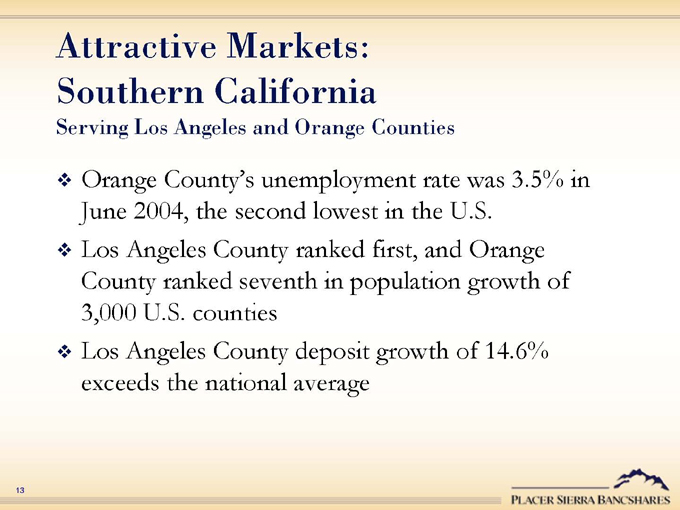
Attractive Markets: Southern California
Serving Los Angeles and Orange Counties
Orange County’s unemployment rate was 3.5% in June 2004, the second lowest in the U.S.
Los Angeles County ranked first, and Orange County ranked seventh in population growth of 3,000 U.S. counties Los Angeles County deposit growth of 14.6% exceeds the national average
13

Operating and Growth Strategies
Capitalize on growth opportunities in both our northern and southern California markets
Expand through strategically placed new branches in Northern California Acquire one or more retail banking franchises in Southern California to complement Bank of Orange County’s well established commercial lending business
Continue to aggressively recruit experienced commercial bankers with portfolios of loyal customers
14
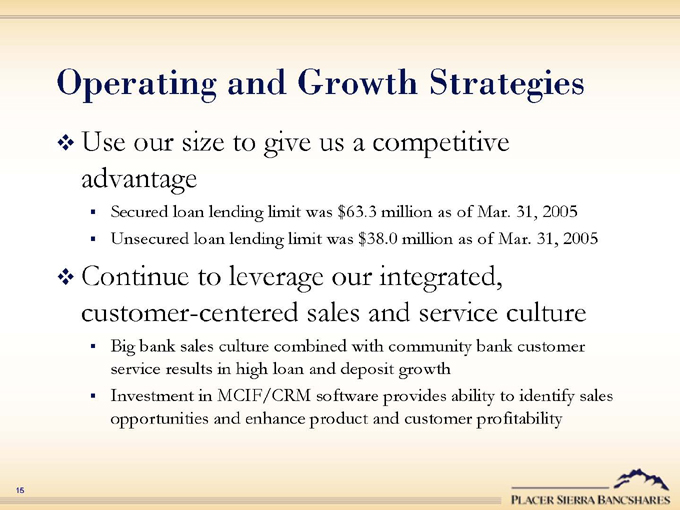
Operating and Growth Strategies
Use our size to give us a competitive advantage
Secured loan lending limit was $63.3 million as of Mar. 31, 2005 Unsecured loan lending limit was $38.0 million as of Mar. 31, 2005
Continue to leverage our integrated, customer-centered sales and service culture
Big bank sales culture combined with community bank customer service results in high loan and deposit growth Investment in MCIF/CRM software provides ability to identify sales opportunities and enhance product and customer profitability
15
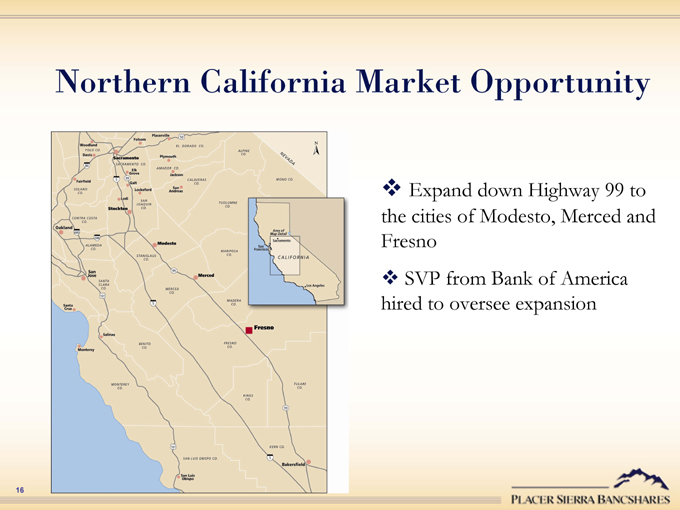
Northern California Market Opportunity
Expand down Highway 99 to the cities of Modesto, Merced and Fresno
SVP from Bank of America hired to oversee expansion
16
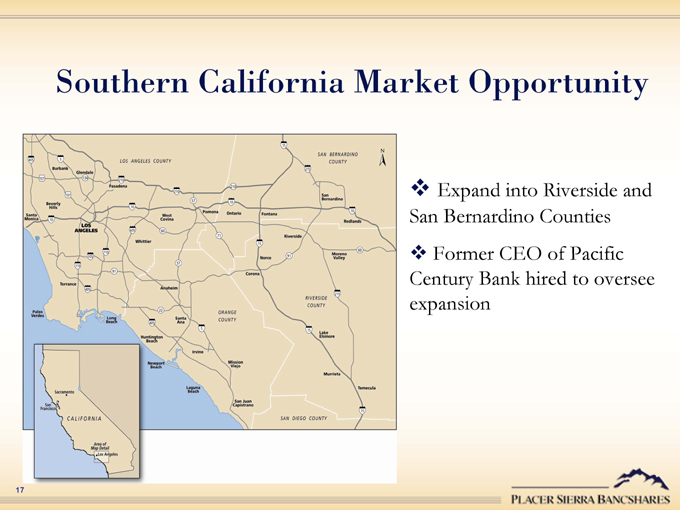
Southern California Market Opportunity
Expand into Riverside and San Bernardino Counties
Former CEO of Pacific Century Bank hired to oversee expansion
17
Financial Performance
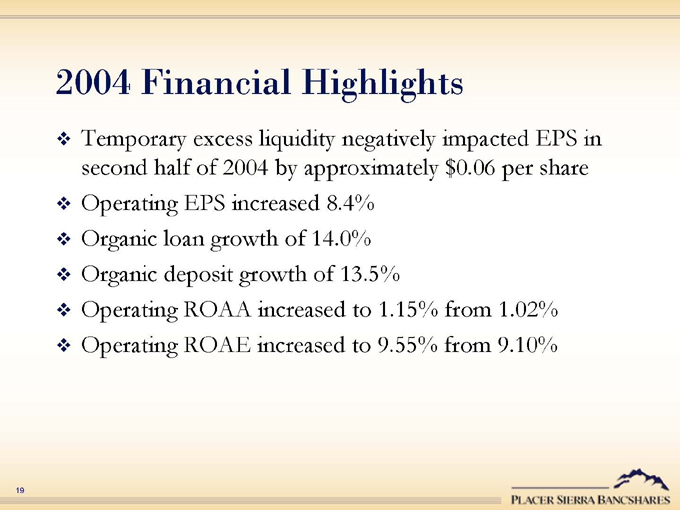
2004 Financial Highlights
Temporary excess liquidity negatively impacted EPS in second half of 2004 by approximately $0.06 per share Operating EPS increased 8.4% Organic loan growth of 14.0% Organic deposit growth of 13.5% Operating ROAA increased to 1.15% from 1.02% Operating ROAE increased to 9.55% from 9.10%
19
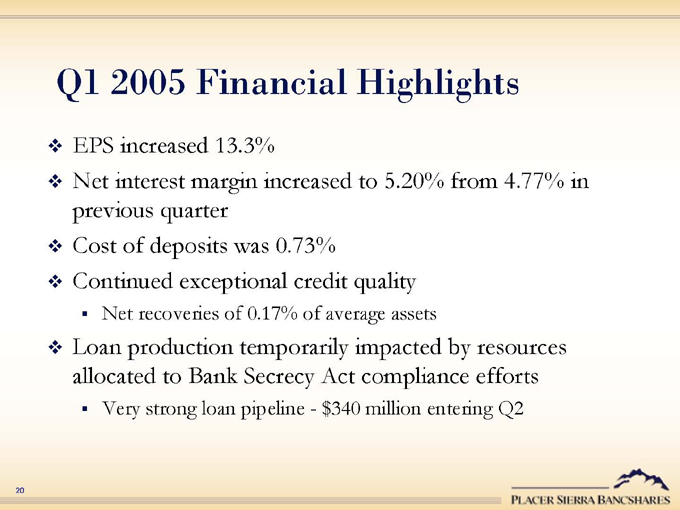
Q1 2005 Financial Highlights
EPS increased 13.3%
Net interest margin increased to 5.20% from 4.77% in previous quarter Cost of deposits was 0.73% Continued exceptional credit quality
Net recoveries of 0.17% of average assets
Loan production temporarily impacted by resources allocated to Bank Secrecy Act compliance efforts
Very strong loan pipeline—$340 million entering Q2
20
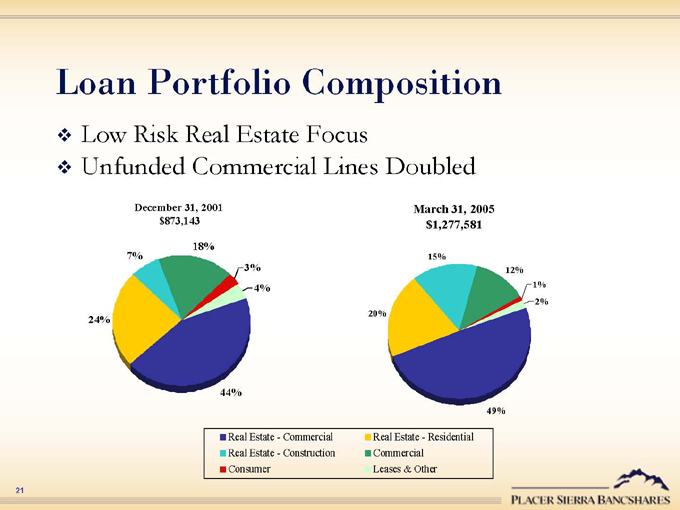
Loan Portfolio Composition
Low Risk Real Estate Focus
Unfunded Commercial Lines Doubled
December 31, 2001 $873,143
7%
24%
18%
3% 4%
March 31, 2005 $1,277,581
15%
20%
44%
12% 1% 2%
49%
Real Estate—Commercial Real Estate—Residential Real Estate—Construction Commercial Consumer Leases & Other
21
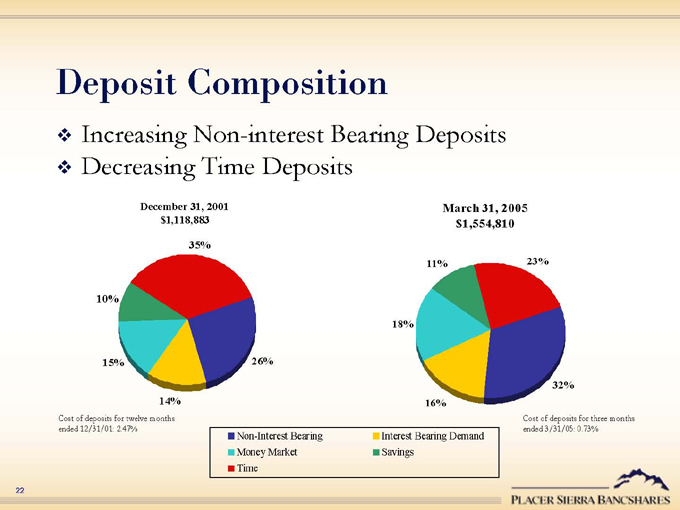
Deposit Composition
Increasing Non-interest Bearing Deposits Decreasing Time Deposits
December 31, 2001 $1,118,883
10%
15%
14%
26%
35%
March 31, 2005 $1,554,810
11%
18%
16%
23%
32%
Cost of deposits for three months ended 3/31/05: 0.73%
Cost of deposits for twelve months ended 12/31/01: 2.47%
Non-Interest Bearing Interest Bearing Demand Money Market Savings Time
22
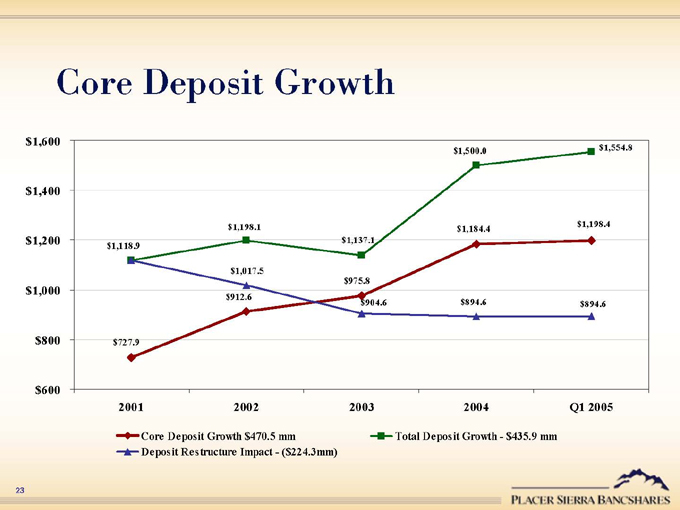
Core Deposit Growth $1,600 $1,400 $1,200 $1,000 $800 $600
2001 2002 2003 2004 Q1 2005 $1,118.9
$727.9 $1,198.1
$1,017.5
$912.6 $1,137.1
$975.8
$904.6 $1,500.0 $1,184.4 $894.6 $1,554.8 $1,198.4 $894.6
Core Deposit Growth $470.5 mm Deposit Restructure Impact—($224.3mm)
Total Deposit Growth—$435.9 mm
23
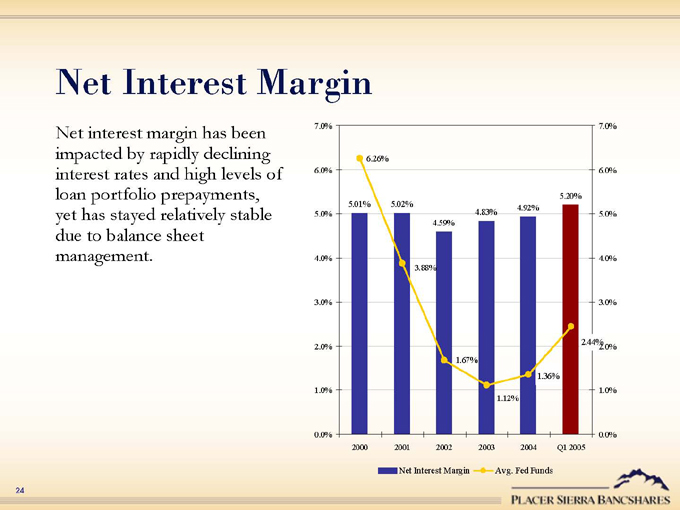
Net Interest Margin
Net interest margin has been impacted by rapidly declining interest rates and high levels of loan portfolio prepayments, yet has stayed relatively stable due to balance sheet management.
7.0% 6.0% 5.0% 4.0% 3.0% 2.0% 1.0% 0.0%
6.26%
5.01% 5.02%
4.59%
3.88%
5.20% 4.92% 4.83%
2000 2001 2002 2003 2004 Q1 2005
7.0% 6.0% 5.0% 4.0% 3.0% 2.0% 1.0% 0.0%
2.44% 2.0%
1.67%
1.12%
1.36%
Net Interest Margin Avg. Fed Funds
24
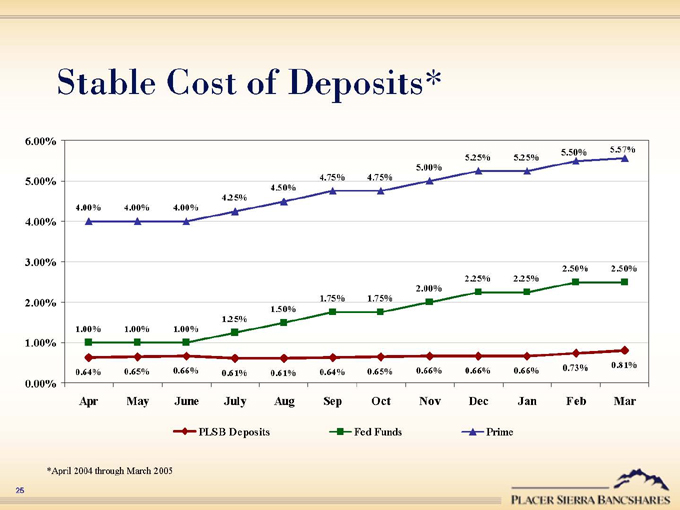
Stable Cost of Deposits*
6.00% 5.00% 4.00% 3.00% 2.00% 1.00% 0.00%
4.00% 4.00% 4.00%
4.25%
4.50%
4.75%
4.75%
5.00%
5.25%
5.25%
5.50% 5.57%
1.00% 1.00% 1.00%
1.50% 1.25%
1.75%
1.75%
2.00%
2.25%
2.25%
2.50%
2.50%
0.73% 0.81% 0.64% 0.65% 0.66% 0.61% 0.61% 0.64% 0.65% 0.66% 0.66% 0.66%
Apr May June July Aug Sep Oct Nov Dec Jan Feb Mar
PLSB Deposits Fed Funds Prime
*April 2004 through March 2005
25
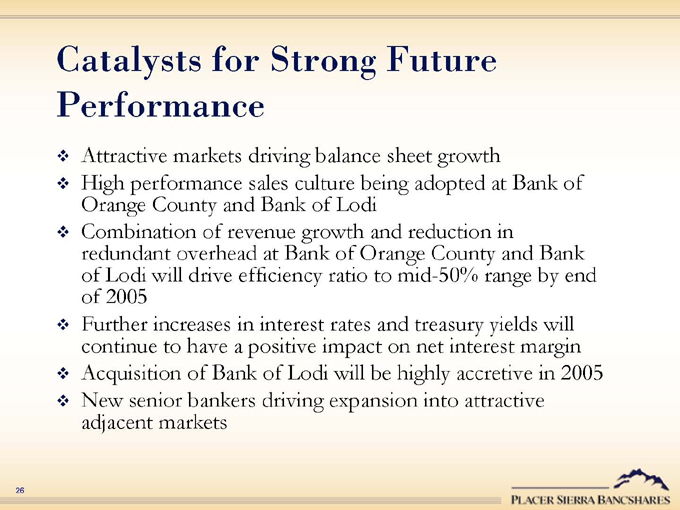
Catalysts for Strong Future Performance
Attractive markets driving balance sheet growth
High performance sales culture being adopted at Bank of Orange County and Bank of Lodi Combination of revenue growth and reduction in redundant overhead at Bank of Orange County and Bank of Lodi will drive efficiency ratio to mid-50% range by end of 2005 Further increases in interest rates and treasury yields will continue to have a positive impact on net interest margin Acquisition of Bank of Lodi will be highly accretive in 2005 New senior bankers driving expansion into attractive adjacent markets
26
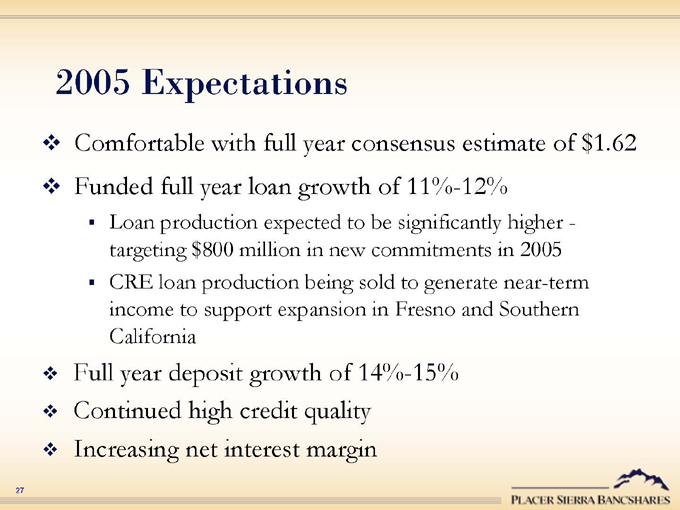
2005 Expectations
Comfortable with full year consensus estimate of $1.62 Funded full year loan growth of 11%-12%
Loan production expected to be significantly higher -targeting $800 million in new commitments in 2005 CRE loan production being sold to generate near-term income to support expansion in Fresno and Southern California
Full year deposit growth of 14%-15% Continued high credit quality Increasing net interest margin
27

Long-Term Performance Goals
ROE: 15% ROA: 1.50%-1.60% EPS Growth: 20%/Year Loan Growth: 13%/Year Deposit Growth: 14%/Year Efficiency Ratio: 50%-55%
28

Investor Presentation
May 2005