Exhibit 99.1

Investor Presentation
July 2005
Forward Looking Information and Non-GAAP Reconciliations
This presentation may include forward-looking statements. These forward-looking statements include comments with respect to our objectives and strategies and the results of our operations and our business. However, by their nature, these forward-looking statements involve numerous assumptions, uncertainties and opportunities, both general and specific. The risk exists that these statements may not be fulfilled. We caution readers of this presentation not to place undue reliance on these forward-looking statements, as a number of factors could cause future company results to differ materially from these statements. Forward-looking statements may be influenced in particular by factors such as fluctuations in interest rates and stock indices, the effects of competition in the areas in which we operate and changes in economic, political, regulatory and technological conditions. We caution that the foregoing list is not exhaustive. When relying on forward-looking statements to make decisions, investors should carefully consider the aforementioned factors as well as other uncertainties and events.
Throughout this presentation, certain non-GAAP metrics are provided that management believes provide useful information in understanding the financial performance of the Company. Reconciliations of the non-GAAP metrics to the comparable GAAP metrics are provided in the Company’s Annual Report on Form 10K for the year ended December 31, 2004, which is available on the Company’s website at www.plsb.com.
2
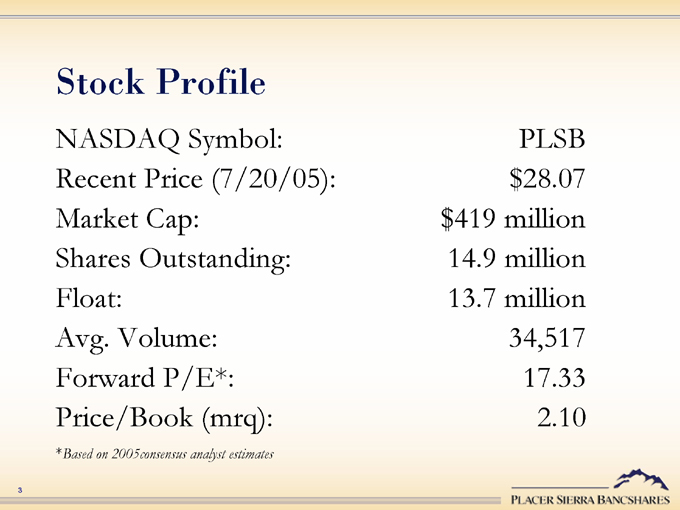
Stock Profile
NASDAQ Symbol: PLSB
Recent Price (7/20/05): $28.07
Market Cap: $419 million
Shares Outstanding: 14.9 million
Float: 13.7 million
Avg. Volume: 34,517
Forward P/E*: 17.33
Price/Book (mrq): 2.10
*Based on 2005consensus analyst estimates
3

Company Overview
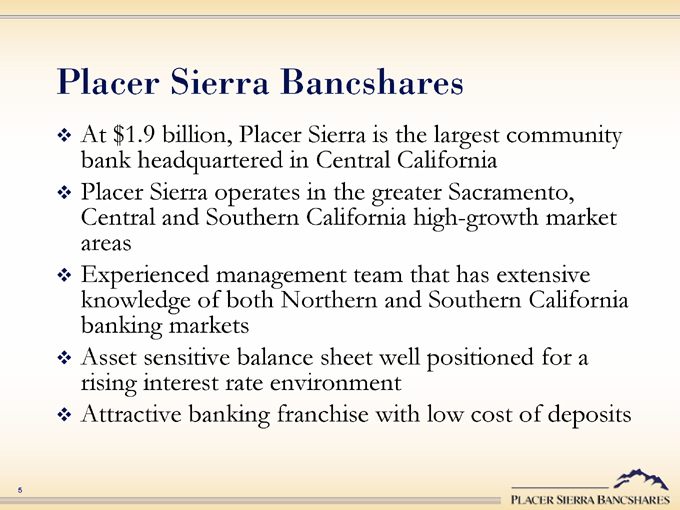
Placer Sierra Bancshares
At $1.9 billion, Placer Sierra is the largest community bank headquartered in Central California Placer Sierra operates in the greater Sacramento, Central and Southern California high-growth market areas Experienced management team that has extensive knowledge of both Northern and Southern California banking markets Asset sensitive balance sheet well positioned for a rising interest rate environment Attractive banking franchise with low cost of deposits
5
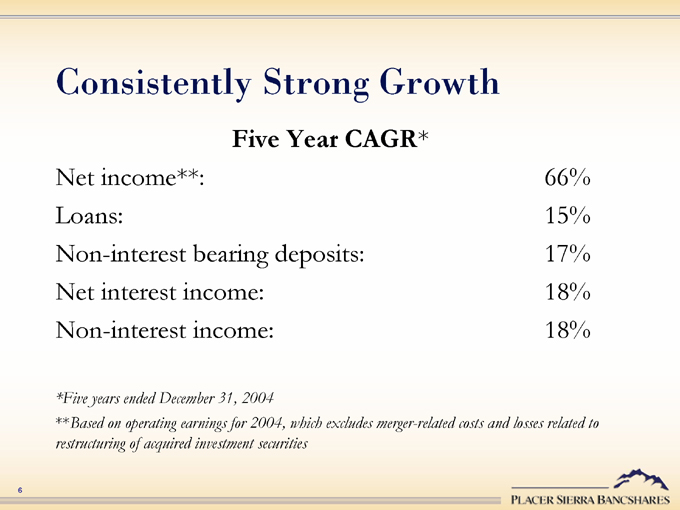
Consistently Strong Growth
Five Year CAGR*
Net income**: 66%
Loans: 15%
Non-interest bearing deposits: 17%
Net interest income: 18%
Non-interest income: 18%
*Five years ended December 31, 2004
**Based on operating earnings for 2004, which excludes merger-related costs and losses related to restructuring of acquired investment securities
6
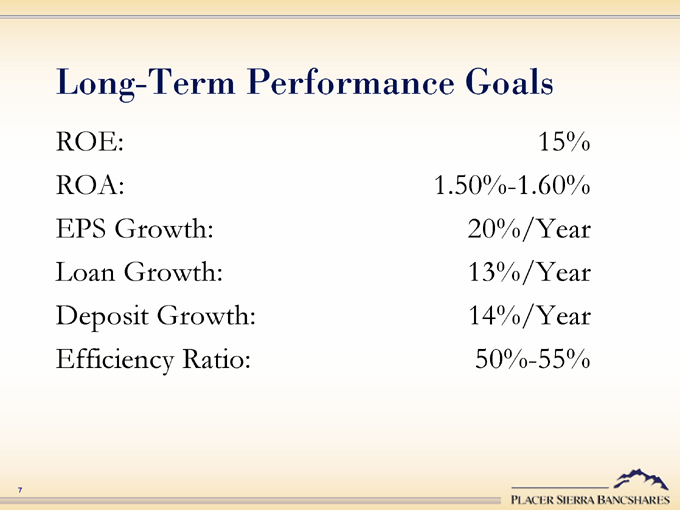
Long-Term Performance Goals
ROE: 15%
ROA: 1.50%-1.60%
EPS Growth: 20%/Year
Loan Growth: 13%/Year
Deposit Growth: 14%/Year
Efficiency Ratio: 50%-55%
7
Operating and Growth Strategies
Capitalize on growth opportunities in both our Northern and Southern California markets
Expand through strategically placed new branches in Northern and Central California
Acquire one or more retail banking franchises in Southern California to complement Bank of Orange County’s well established commercial lending business
Continue to aggressively recruit experienced commercial bankers with portfolios of loyal customers
8
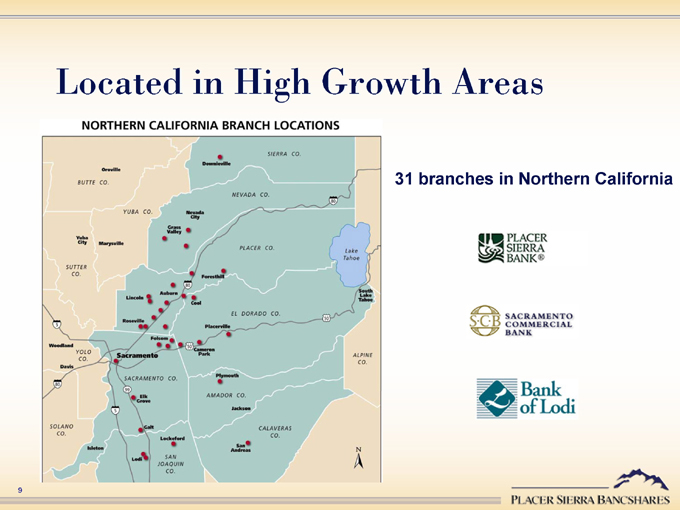
Located in High Growth Areas
NORTHERN CALIFORNIA BRANCH LOCATIONS
31 branches in Northern California
9
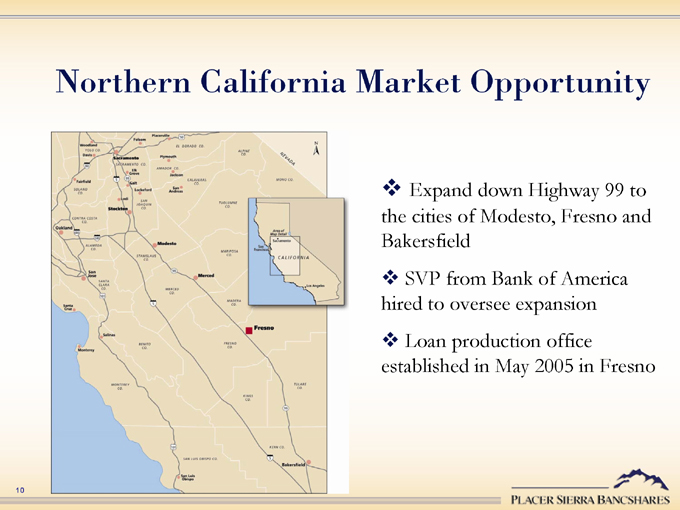
Northern California Market Opportunity
Expand down Highway 99 to the cities of Modesto, Fresno and Bakersfield
SVP from Bank of America hired to oversee expansion
Loan production office established in May 2005 in Fresno
10
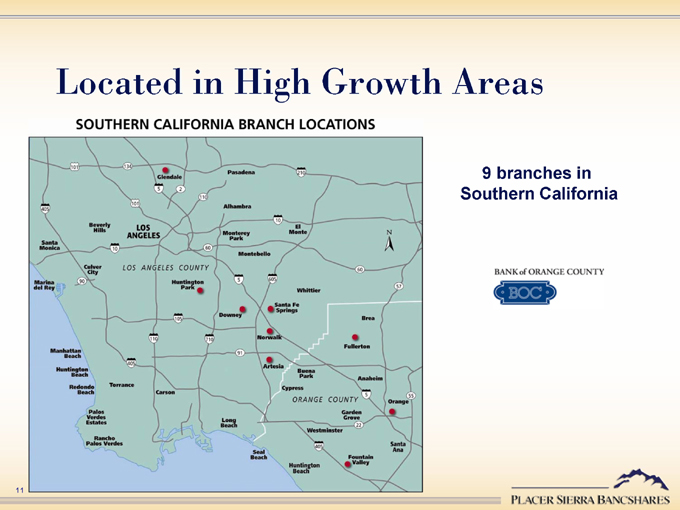
Located in High Growth Areas
SOUTHERN CALIFORNIA BRANCH LOCATIONS
9 branches in Southern California
11
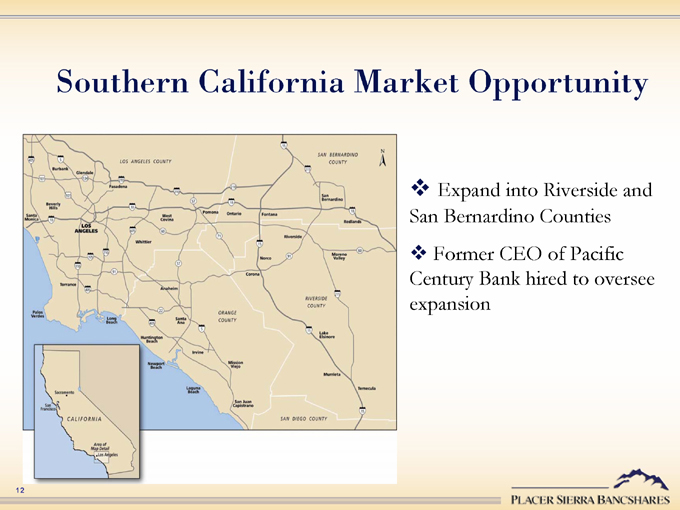
Southern California Market Opportunity
Expand into Riverside and San Bernardino Counties
Former CEO of Pacific Century Bank hired to oversee expansion
12

Financial Performance
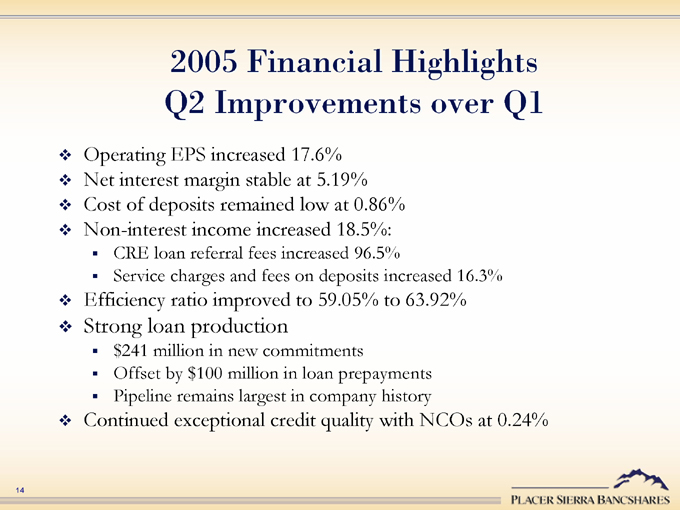
2005 Financial Highlights Q2 Improvements over Q1
Operating EPS increased 17.6% Net interest margin stable at 5.19% Cost of deposits remained low at 0.86% Non-interest income increased 18.5%:
CRE loan referral fees increased 96.5%
Service charges and fees on deposits increased 16.3%
Efficiency ratio improved to 59.05% to 63.92%
Strong loan production
$241 million in new commitments Offset by $100 million in loan prepayments Pipeline remains largest in company history
Continued exceptional credit quality with NCOs at 0.24%
14
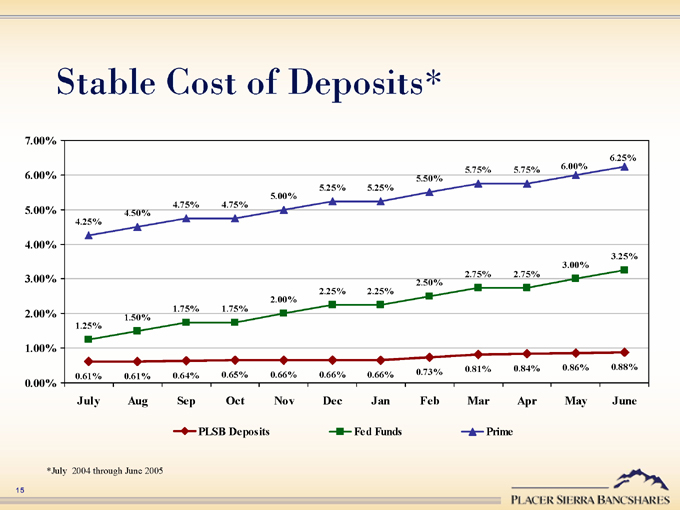
Stable Cost of Deposits*
7.00% 6.00% 5.00% 4.00% 3.00% 2.00% 1.00% 0.00%
July Aug Sep Oct Nov Dec Jan Feb Mar Apr May June
4.25% 1.25% 0.61%
4.50% 1.50% 0.61%
4.75% 1.75% 0.64%
4.75% 1.75% 0.65%
5.00% 2.00% 0.66%
5.25% 2.25% 0.66%
5.25% 2.25% 0.66%
5.50% 2.50% 0.73%
5.75% 2.75% 0.81%
5.75% 2.75% 0.84%
6.00% 3.00% 0.86%
6.25% 3.25% 0.88%
PLSB Deposits
Fed Funds
Prime
*July 2004 through June 2005
15
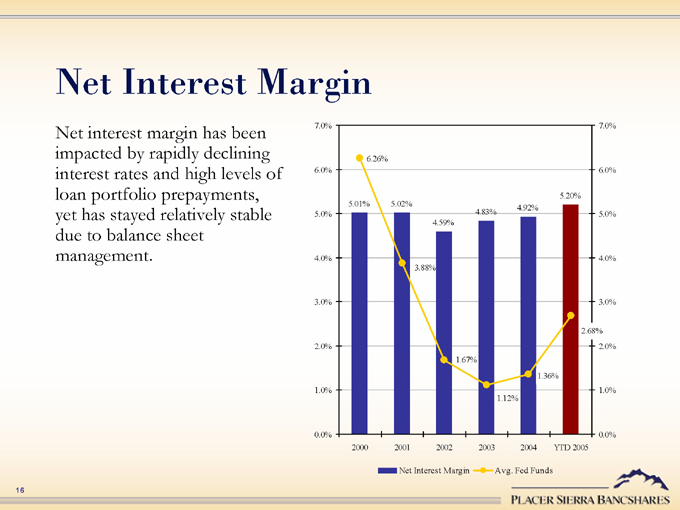
Net Interest Margin
Net interest margin has been impacted by rapidly declining interest rates and high levels of loan portfolio prepayments, yet has stayed relatively stable due to balance sheet management.
7.0% 6.0% 5.0% 4.0% 3.0% 2.0% 1.0% 0.0%
2000 2001 2002 2003 2004 YTD 2005
7.0% 6.0% 5.0% 4.0% 3.0% 2.0% 1.0% 0.0%
5.01% 6.26% 5.02% 3.88% 4.59% 1.67% 4.83% 1.12% 4.92% 1.36% 5.20% 2.68%
Net Interest Margin Avg. Fed Funds
16
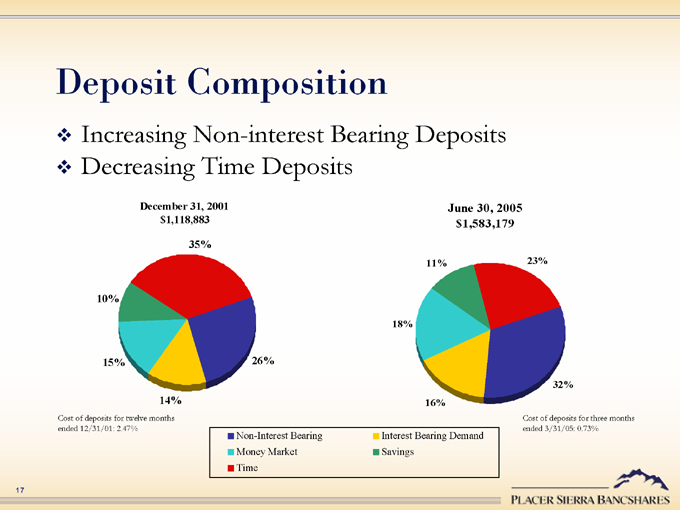
Deposit Composition
Increasing Non-interest Bearing Deposits Decreasing Time Deposits
December 31, 2001 $1,118,883
35% 26% 14% 15% 10%
Cost of deposits for twelve months ended 12/31/01: 2.47%
June 30, 2005 $1,583,179
23% 32% 16% 18% 11%
Cost of deposits for three months ended 3/31/05: 0.73%
Non-Interest Bearing Money Market Time
Interest Bearing Demand Savings
17
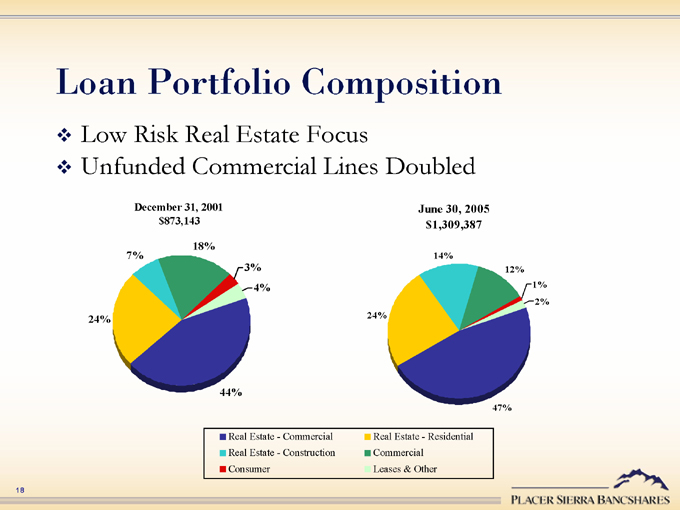
Loan Portfolio Composition
Low Risk Real Estate Focus
Unfunded Commercial Lines Doubled
December 31, 2001 $873,143
18% 3% 4% 44% 24% 7%
June 30, 2005 $1,309,387
14% 12% 1% 2% 47% 24%
Real Estate—Commercial Real Estate—Construction Consumer
Real Estate—Residential Commercial Leases & Other
18
2005 Expectations
Comfortable with full year consensus estimate of $1.62
Consistent improvement in bottom-line performance throughout the year Funded full year loan growth of 11%-12%
Loan production expected to be significantly higher—targeting $800 million in new commitments in 2005 CRE loan production being sold to generate near-term income to support expansion in Fresno and Southern California
Full year deposit growth of 14%-15%
Net interest margin should trend down to low 5% range by end of the year Growth in earning assets expected to more than offset reduction in net interest margin Continued high credit quality
19

Investor Presentation
July 2005