 Investor Presentation Exhibit 99.1 |
 2 Forward Looking Information and Non-GAAP Reconciliations Forward Looking Information and Non-GAAP Reconciliations This presentation may include forward-looking statements. These forward-looking statements include comments with respect to our objectives and strategies and the results of our operations and our business. However, by their nature, these forward-looking statements involve numerous assumptions, uncertainties and opportunities, both general and specific. The risk exists that these statements may not be fulfilled. We caution readers of this presentation not to place undue reliance on these forward-looking statements, as a number of factors could cause future company results to differ materially from these statements. Forward-looking statements may be influenced in particular by factors such as fluctuations in interest rates and stock indices, the effects of competition in the areas in which we operate and changes in economic, political, regulatory and technological conditions. We caution that the foregoing list is not exhaustive. When relying on forward- looking statements to make decisions, investors should carefully consider the aforementioned factors as well as other uncertainties and events. Throughout this presentation, certain non-GAAP metrics are provided that management believes provide useful information in understanding the financial performance of the Company. Reconciliations of the non-GAAP metrics to the comparable GAAP metrics are provided in the Company’s Annual Report on Form 10K for the year ended December 31, 2005, which is available on the Company’s website at www.plsb.com. |
 3 Stock Profile (November 2, 2006) Stock Profile (November 2, 2006) NASDAQ Symbol: PLSB Recent Price: $24.50 Market Cap: $547.8 million Shares Outstanding: 22.4 million Float: 10.5 million Avg. Volume (30 day): 107,000 Forward P/E*: 14.96 Price/Book (approx.): 1.39 *Based on 2007consensus analyst estimates |
 Company Overview |
 5 Placer Sierra Bancshares Placer Sierra Bancshares With $2.7 billion in assets, Placer Sierra operates in attractive markets throughout California Built through three major transactions Merger with Bank of Orange County – May 2004 Acquisition of Bank of Lodi – December 2004 Acquisition of Southwest Community Bancorp – June 2006 49 branches 31 branches in Central and Northern California 18 branches in Southern California Experienced management team that has extensive knowledge of the Northern, Central and Southern California banking markets |
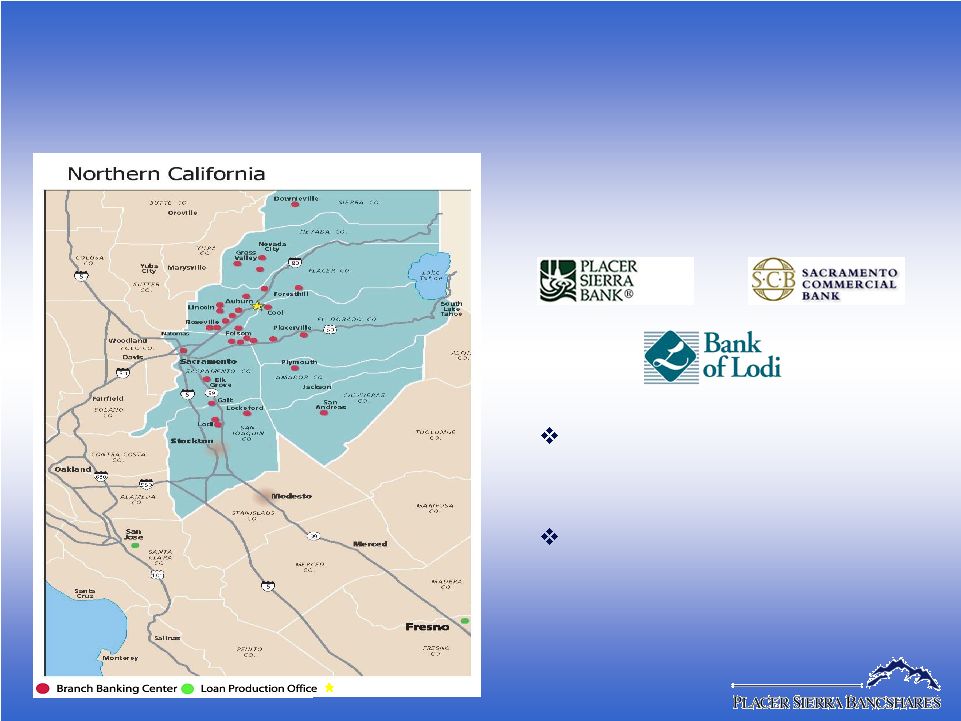 6 Located in Attractive Markets Located in Attractive Markets 31 branches in Northern & Central California Headquarters Future expansion down Highway 99 to the cities of Stockton, Modesto, Fresno and Bakersfield De novo branch opening in Fresno in November 2006 |
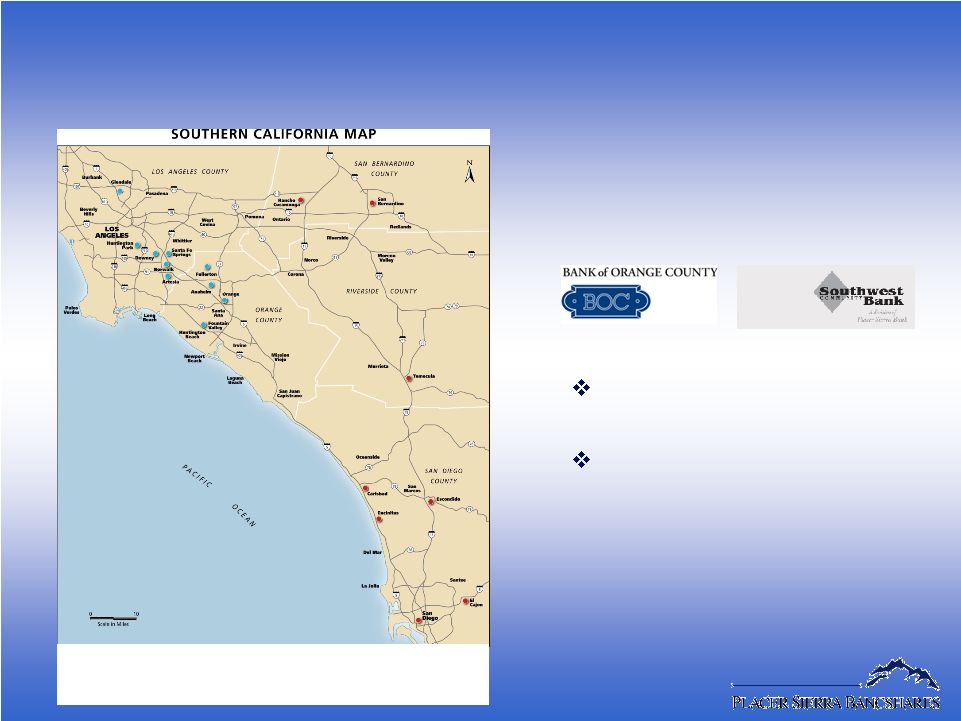 7 Located in Attractive Markets Located in Attractive Markets 18 branches in Southern California Further expansion into Riverside and San Bernardino Counties Recent entry into San Diego County through acquisition of SWCB • Bank of Orange County branches • Southwest Community Bank branches |
 8 Experienced Management Team Experienced Management Team Years Name Position Experience Frank J. Mercardante CEO 40 -Former President & CEO of Southwest Community Bancorp David E. Hooston CFO 22 -Former CFO of California Community Bancshares -Former Portfolio Manager of Belvedere Capital Partners, LLC Randall E. Reynoso President & COO 26 -Former SVP and Regional Sales Manager of Westamerica Bank -Formerly of Bank of California Marshall V. Laitsch President of So. CA Division 32 -Former President & CEO of Sunwest Bank -Former President & CEO of Pacific Century Bank, NA (Bank of Hawaii Corp.) |
 9 Experienced Management Team Experienced Management Team Years Name Position Experience Tom D. Nations Chief Credit Officer 26 -Former SVP of Union Bank of California Eric Tobias EVP Central Valley Region 33 -Former SVP of Bank of America Kevin J. Barri Director of Retail Banking 17 -Former SVP of Bank of America K. Lynn Matsuda Director of Operations 34 -Former VP of The Money Store James A. Sundquist CFO of PSB 27 -Former EVP & CFO of Sacramento Commercial Bank |
 10 Operating and Growth Strategies Operating and Growth Strategies Improve balance sheet management to increase NIM: Deploy excess liquidity Manage liquidity through off-balance sheet strategies Run-off high cost CDs, increase FHLB advances Increase loan/deposit ratio from ~80% to 90% Targeting NIM expansion by Q1 2007 Enhance depository infrastructure to improve deposit gathering: Upgrade key electronic banking depository products to attract/retain middle market customers Phase-in during Q4 2006 through mid-2007 |
 11 Operating and Growth Strategies Operating and Growth Strategies Capitalize on growth opportunities in our Northern, Central and Southern California markets: Expand through strategically placed new branches (i.e. in the fast growing Inland Empire and San Joaquin Valley areas) Expand commercial lending opportunities by increasing penetration of middle market: Increase production of asset-based and credit scored loans Add resources and personnel in credit administration to effectively pursue middle market Leverage current credit quality to achieve targeted risk levels |
 12 Operating and Growth Strategies Operating and Growth Strategies Continue to aggressively recruit experienced commercial bankers who control portfolio’s of loyal customers Leverage statewide franchise to further expand specialty lending businesses Non-profit organizations SBA lending Consolidate branches under single brand name Create true statewide community bank brand Foster cohesion and unified corporate culture among acquired operations Refine approach to relationship management Increase focus on retaining/building relationships with largest customers Improve profitability of smaller relationships or manage them out of the bank Increase emphasis on cross-selling |
 Financial Performance |
 14 2006 Financial Highlights 2006 Financial Highlights Solid loan growth 8.5% annualized loan growth in Q3 Low cost deposits acquired with SWCB offsetting increasing deposit rates in other markets Higher interest rates presenting challenges to generating CRE loan referral fees Continued stable expense levels from focused management of discretionary spending Continued excellent asset quality resulting in no need for provisioning |
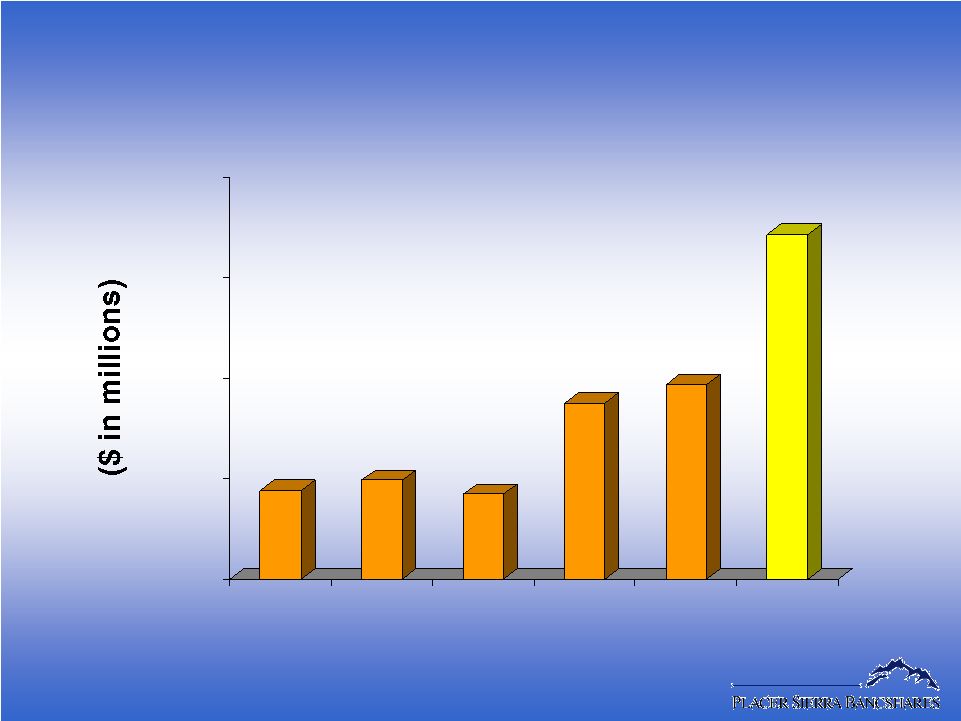
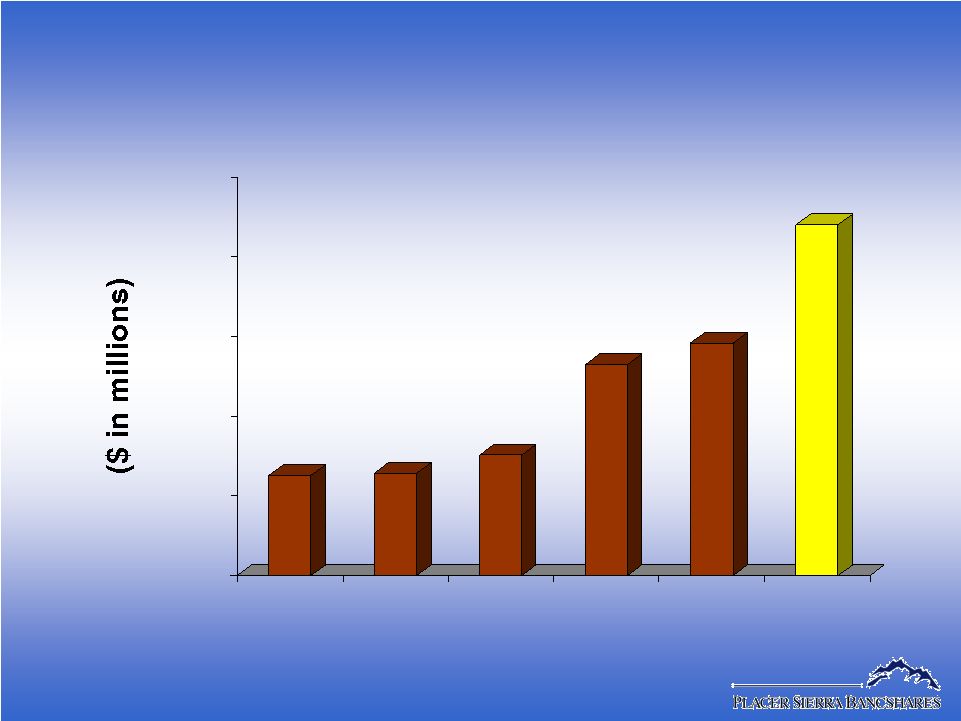 15 Total Loans (At December 31, except September 30, 2006) Total Loans (At December 31, except September 30, 2006) $876 $886 $953 $1,294 $1,375 $1,823 $500 $800 $1,100 $1,400 $1,700 $2,000 2001 2002 2003 2004 2005 2006 YTD |
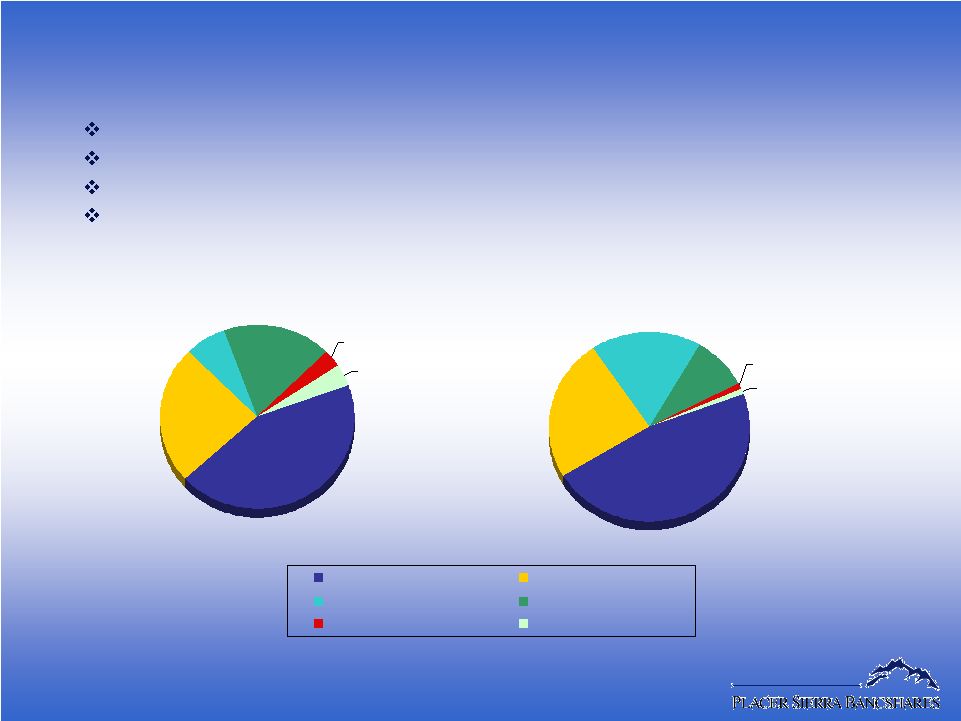 16 Loan Portfolio Composition Loan Portfolio Composition Low risk real estate focus Below industry standard LTVs Higher than industry standard DCRs Highly diversified portfolio by geography, property type and industry December 31, 2001 $873,143 44% 24% 7% 18% 3% 4% Real Estate - Commercial Real Estate - Residential Real Estate - Construction Commercial Consumer Leases & Other September 30, 2006 $1,821,753 47% 24% 18% 9% 1% 1% |
 17 Total Deposits (At December 31, except September 30, 2006) Total Deposits (At December 31, except September 30, 2006) $1,153 $1,193 $1,137 $1,500 $1,573 $2,174 $800 $1,200 $1,600 $2,000 $2,400 2001 2002 2003 2004 2005 2006 YTD |
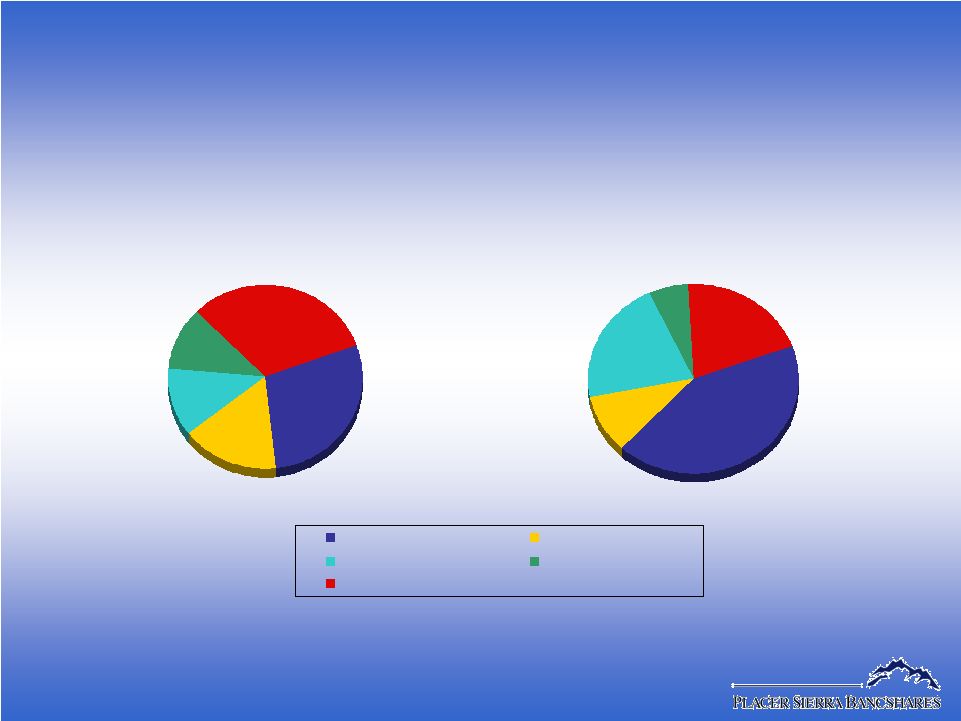 18 December 31, 2001 $1,153,147 29% 16% 12% 11% 32% Non-Interest Bearing Interest Bearing Demand Money Market Savings Time September 30, 2006 $2,174,301 42% 10% 21% 6% 20% Deposit Composition Deposit Composition Cost of deposits for twelve months ended 12/31/01: 2.47% Cost of deposits for nine months ended 9/30/06: 1.49% |
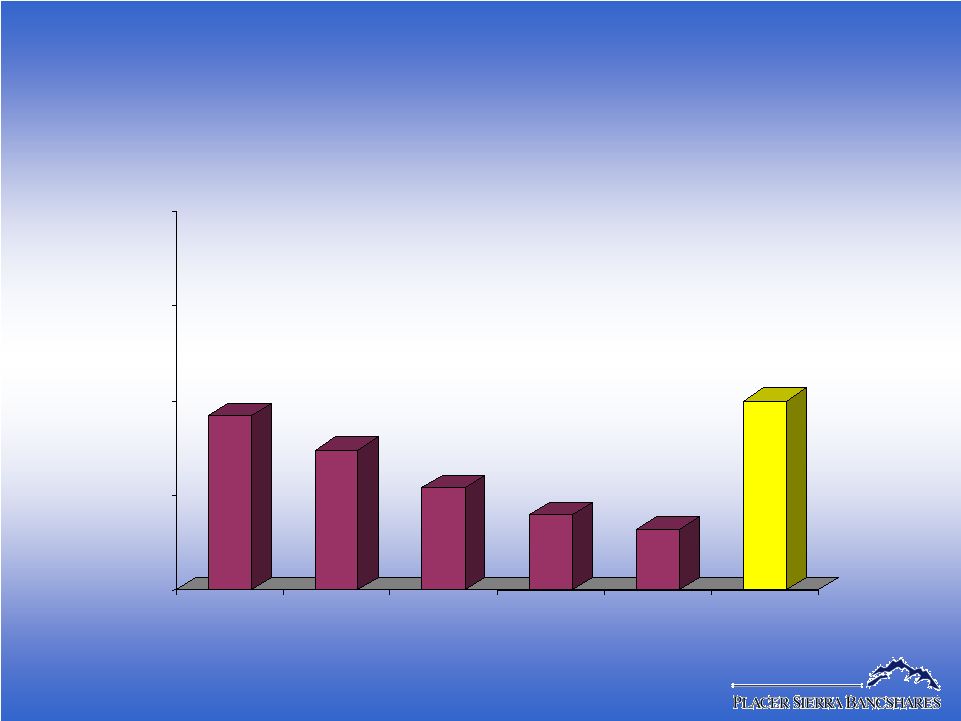 19 NPA/Total Assets NPA/Total Assets 0.46% 0.37% 0.27% 0.20% 0.16% 0.50% 0.00% 0.25% 0.50% 0.75% 1.00% 2001 2002 2003 2004 2005 09/30/06 |
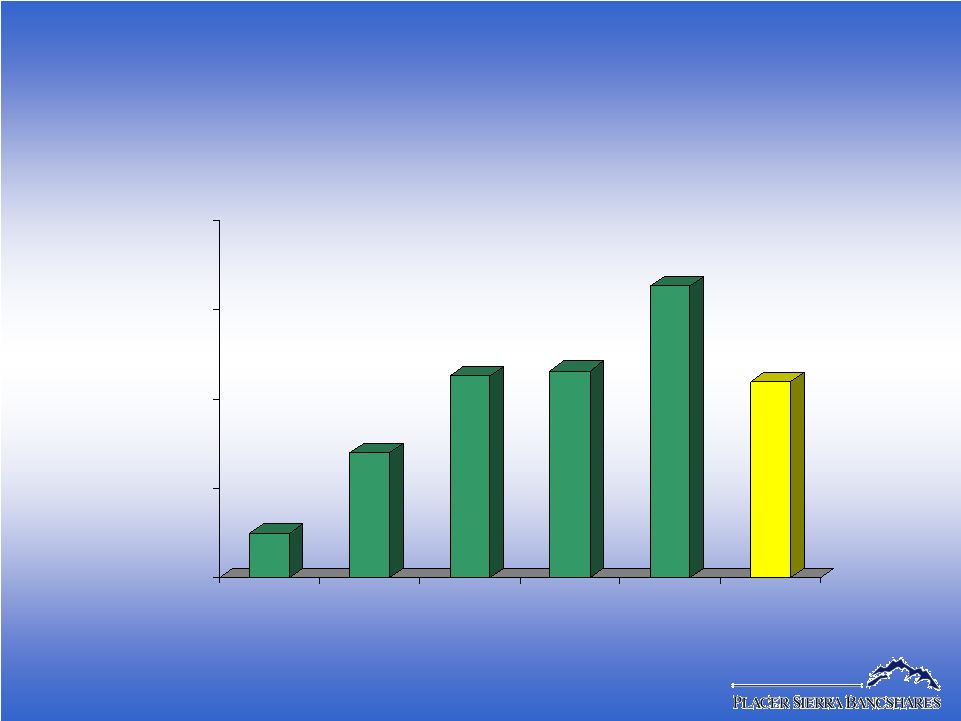 20 $0.25 $0.70 $1.13 $1.16 $1.63 $1.10 $0.00 $0.50 $1.00 $1.50 $2.00 2001 2002 2003 2004* 2005 2006 YTD* Earnings Per Share Earnings Per Share *Operating Earnings; see 2004 10K and September 30, 2006 10Q for GAAP to Operating Earnings reconciliation.) |
 Summary |
 22 Strategies For Improved Financial Performance Strategies For Improved Financial Performance Balance sheet repositioned to drive NIM expansion Processing systems being upgraded to improve deposit gathering Increased focus on penetration of middle market businesses Continuing expansion into higher growth areas Expanding specialty lending Increasing focus on high value customers Continued high credit quality Targeting 10% asset growth in 2007 |
 Investor Presentation |