Use these links to rapidly review the document
TABLE OF CONTENTS
EXHIBIT 99.1

ANNUAL INFORMATION FORM
2011
MARCH 15, 2012
TABLE OF CONTENTS
| | |
| | Page |
|---|
SELECTED TERMS | | 1 |
ABBREVIATIONS | | 3 |
CONVERSIONS | | 3 |
CONVENTIONS | | 4 |
SPECIAL NOTES TO READER | | 4 |
BAYTEX ENERGY CORP. | | 8 |
GENERAL DEVELOPMENT OF OUR BUSINESS | | 9 |
RISK FACTORS | | 10 |
DESCRIPTION OF OUR BUSINESS AND OPERATIONS | | 27 |
DIRECTORS AND OFFICERS | | 62 |
AUDIT COMMITTEE INFORMATION | | 68 |
DESCRIPTION OF CAPITAL STRUCTURE | | 70 |
DIVIDENDS | | 72 |
MARKET FOR SECURITIES | | 75 |
RATINGS | | 76 |
LEGAL PROCEEDINGS AND REGULATORY ACTIONS | | 77 |
INTEREST OF INSIDERS AND OTHERS IN MATERIAL TRANSACTIONS | | 77 |
AUDITORS, TRANSFER AGENT AND REGISTRAR | | 77 |
INTERESTS OF EXPERTS | | 77 |
MATERIAL CONTRACTS | | 78 |
INDUSTRY CONDITIONS | | 78 |
ADDITIONAL INFORMATION | | 90 |
| | |
APPENDICES: |
APPENDIX A | | REPORT OF MANAGEMENT AND DIRECTORS ON OIL AND GAS DISCLOSURE |
APPENDIX B | | REPORT ON RESERVES DATA BY INDEPENDENT QUALIFIED RESERVES EVALUATOR |
APPENDIX C | | AUDIT COMMITTEE MANDATE AND TERMS OF REFERENCE |
SELECTED TERMS
Capitalized terms in this Annual Information Form have the meanings set forth below:
Entities
Baytex or theCorporation means Baytex Energy Corp., a corporation incorporated under the ABCA.
Baytex Commercial Trusts mean, collectively, Baytex Commercial Trust 1, Baytex Commercial Trust 2, Baytex Commercial Trust 3, Baytex Commercial Trust 4, Baytex Commercial Trust 5, Baytex Commercial Trust 6 and Baytex Commercial Trust 7.
Baytex Energy means Baytex Energy Ltd., a corporation amalgamated under the ABCA.
Baytex Partnership means Baytex Energy Partnership, a general partnership, the partners of which are Baytex Energy, Baytex Holdings Limited Partnership and Baytex Oil & Gas Ltd.
Baytex USA means Baytex Energy USA Ltd.
Board of Directors means the board of directors of Baytex.
NYMEX means the New York Mercantile Exchange, a commodity futures exchange.
OPEC means the Organization of the Petroleum Exporting Countries.
Operating Entities means our subsidiaries that are actively involved in the acquisition, production, processing, transportation and marketing of crude oil, natural gas liquids and natural gas, being Baytex Energy, Baytex Partnership and Baytex USA, each a direct or indirect wholly-owned subsidiary of us, and "Operating Subsidiary" means any one of them, as applicable.
SEC means the United States Securities and Exchange Commission.
Shareholders mean the holders from time to time of Common Shares.
subsidiary has the meaning ascribed thereto in theSecurities Act (Ontario) and, for greater certainty, includes all corporations, partnerships and trusts owned, controlled or directed, directly or indirectly, by us.
Trust means Baytex Energy Trust, a trust created under the laws of the Province of Alberta on July 24, 2003 pursuant to the Trust Indenture and which was dissolved into the Corporation on January 1, 2011 in connection with the Corporate Conversion.
we,us andour means Baytex and all its subsidiaries on a consolidated basis unless the context requires otherwise.
Independent Engineering
COGE Handbook means the Canadian Oil and Gas Evaluation Handbook.
NI 51-101 means National Instrument 51-101 "Standards of Disclosure for Oil and Natural Gas Activities" of the Canadian Securities Administrators.
Sproule means Sproule Associates Limited, independent petroleum consultants of Calgary, Alberta.
Sproule Report means the report prepared by Sproule dated March 7, 2012 entitled "Evaluation of the P&NG Reserves of Baytex Energy Corp. (As of December 31, 2011)".
Securities and Other Terms
2016 Debentures means our $150 million 9.15% series A senior unsecured debentures due August 26, 2016 and issued pursuant to the Debenture Indenture.
2021 Debentures means our US$150 million 6.75% series B senior unsecured debentures due February 17, 2021 and issued pursuant to the Debenture Indenture.
ABCA means theBusiness Corporations Act (Alberta), R.S.A. 2000, c. B-9, as amended, including the regulations promulgated thereunder.
Canadian GAAP means generally accepted accounting principles in Canada.
Common Shares means the common shares of Baytex.
Corporate Conversion means the internal reorganization of the Trust and certain of its subsidiaries which resulted in the conversion of the legal structure of the Trust from a trust to a corporation effective December 31, 2010 pursuant to a plan of arrangement under the ABCA.
Credit Facilities means, collectively, the $40 million extendible operating loan facility that Baytex Energy has with a chartered bank and the $660 million extendible syndicated loan facility that Baytex Energy has with a syndicate of chartered banks, each of which constitute a revolving credit facility for a three-year term (to June 14, 2014), which is extendible annually for a 1, 2 or 3 year period (subject to a maximum three-year term at any time).
Debenture Indenture means the amended and restated trust indenture among us, as issuer, Baytex Energy, Baytex Oil & Gas Ltd., Baytex Partnership, Baytex Marketing Ltd. and Baytex USA, as guarantors, and Valiant Trust Company, as indenture trustee, dated January 1, 2011, which is an amendment and restatement of a trust indenture dated August 26, 2009, as supplemented by a supplemental indenture dated February 17, 2011.
Debentures means, collectively, the 2016 Debentures and the 2021 Debentures.
Notes mean the unsecured subordinated promissory notes issued by Baytex Energy and certain other Operating Entities to us.
Tax Act means theIncome Tax Act (Canada), R.S.C. 1985, c. 1 (5th Supp.), as amended, including the regulations promulgated thereunder, as amended from time to time.
Trust Indenture means the third amended and restated trust indenture between Valiant Trust Company, and Baytex Energy dated May 20, 2008, as amended by a supplemental indenture dated December 31, 2010.
Trust Unit orUnit means a unit issued by the Trust, each unit representing an equal undivided beneficial interest in the Trust's assets.
2
ABBREVIATIONS
| | | | | | |
Oil and Natural Gas Liquids | | Natural Gas |
|---|
bbl | | barrel | | Mcf | | thousand cubic feet |
Mbbl | | thousand barrels | | MMcf | | million cubic feet |
MMbbl | | million barrels | | Bcf | | billion cubic feet |
NGL | | natural gas liquids | | Mcf/d | | thousand cubic feet per day |
bbl/d | | barrels per day | | MMcf/d | | million cubic feet per day |
| | | | m3 | | cubic metres |
| | | | MMbtu | | million British Thermal Units |
| | | | GJ | | gigajoule |
| | |
Other | |
|
|---|
| BOE or boe | | barrel of oil equivalent, using the conversion factor of 6 Mcf of natural gas being equivalent to one bbl of oil.BOEs may be misleading, particularly if used in isolation. A BOE conversion ratio of 6 Mcf: 1 bbl is based on an energy equivalency conversion method primarily applicable at the burner tip and does not represent a value equivalency at the wellhead. |
| Mboe | | thousand barrels of oil equivalent. |
| MMboe | | million barrels of oil equivalent. |
| boe/d | | barrels of oil equivalent per day. |
| WTI | | West Texas Intermediate. |
| API | | the measure of the density or gravity of liquid petroleum products derived from a specific gravity. |
| $ Million | | means millions of dollars. |
| $000s | | means thousands of dollars. |
CONVERSIONS
The following table sets forth certain conversions between Standard Imperial Units and the International System of Units (or metric units).
| | | | | | |
To Convert From | | To | | Multiply By | |
|---|
| Mcf | | Cubic metres | | | 28.174 | |
| Cubic metres | | Cubic feet | | | 35.494 | |
| Bbl | | Cubic metres | | | 0.159 | |
| Cubic metres | | Bbl | | | 6.293 | |
| Feet | | Metres | | | 0.305 | |
| Metres | | Feet | | | 3.281 | |
| Miles | | Kilometres | | | 1.609 | |
| Kilometres | | Miles | | | 0.621 | |
| Acres | | Hectares | | | 0.405 | |
| Hectares | | Acres | | | 2.471 | |
| Gigajoules | | MMbtu | | | 0.948 | |
3
CONVENTIONS
Certain terms used herein are defined in NI 51-101 and, unless the context otherwise requires, shall have the same meanings in this Annual Information Form as in NI 51-101. Unless otherwise indicated, references in this Annual Information Form to "$" or "dollars" are to Canadian dollars and references to "US$" are to United States dollars. All financial information contained in this Annual Information Form has been presented in Canadian dollars in accordance with Canadian GAAP. Words importing the singular number only include the plural, and vice versa, and words importing any gender include all genders. All operational information contained in this Annual Information Form relates to our consolidated operations unless the context otherwise requires.
SPECIAL NOTES TO READER
Forward-Looking Statements
In the interest of providing our Shareholders and potential investors with information about us, including management's assessment of our future plans and operations, certain statements in this Annual Information Form are "forward-looking statements" within the meaning of theUnited States Private Securities Litigation Reform Act of 1995 and "forward-looking information" within the meaning of applicable Canadian securities legislation (collectively, "forward-looking statements"). In some cases, forward-looking statements can be identified by terminology such as "anticipate", "believe", "continue", "could", "estimate", "expect", "forecast", "intend", "may", "objective", "ongoing", "outlook", "potential", "project", "plan", "should", "target", "would", "will" or similar words suggesting future outcomes, events or performance. The forward-looking statements contained in this Annual Information Form speak only as of the date hereof and are expressly qualified by this cautionary statement.
Specifically, this Annual Information Form contains forward-looking statements relating to: our business strategies, plans and objectives; the portion of our funds from operations to be allocated to our capital program; our ability to maintain production levels by investing approximately two-thirds of our internally generated funds from operations; our ability to grow our reserve base and add to production levels through exploration and development activities complemented by strategic acquisitions; our petroleum and natural gas reserves, including the quantum thereof and the present value of the future net revenue to be derived therefrom; the contingent resource estimates for our oil resource plays at Seal, northeast Alberta, North Dakota, Redwater and Kerrobert/Whiteside, including the quantum thereof and the present value of the future net revenue to be derived therefrom; development plans for our properties, including number of potential drilling locations, number of wells to be drilled in 2012, initial production rates from new wells and recovery factors; our light oil resource play at Kerrobert, including the development potential of the Viking formation; our steam-assisted gravity drainage project at Kerrobert, including resource potential of our undeveloped land, initial production rates from new wells and the number of potential drilling locations; our heavy oil resource play at Peace River, including the resource potential of our undeveloped land, initial production rates from new wells, the ability to recover incremental reserves using waterflood and cyclic steam recovery methods, our assessment of our cyclic steam stimulation pilot projects and the timing of commencing development of a 15-well thermal module; our light oil resource play in North Dakota, including our assessment of the number of wells to be drilled, initial production rates from new wells and average recoveries per well; our ability to utilize our tax pools to reduce our taxable income; our working interest production volume for 2012; the existence, operation and strategy of our risk management program; our dividend policy and level; funding sources for development capital expenditures and dividend payments; and the impact of existing and proposed governmental and environmental regulation. Cash dividends on our common shares are paid at the discretion of our Board of Directors and can fluctuate. In establishing the level of cash dividends, the Board of Directors considers all factors that it deems relevant, including, without limitation, the outlook for commodity prices, our
4
operational execution, the amount of funds from operations and capital expenditures and our prevailing financial circumstances at the time.
In addition, there are forward looking statements in this Annual Information Form under the heading "Description of Our Business and Operations — Statement of Reserves Data and Other Oil and Gas Information" (as to our reserves and future net revenues from our reserves, pricing and inflation rates, future development costs, the development of our proved undeveloped reserves and probable undeveloped reserves, future development costs, contingent resources, reclamation and abandonment obligations, tax horizon, exploration and development activities and production estimates). Information and statements relating to reserves and resources are deemed to be forward-looking statements, as they involve implied assessment, based on certain estimates and assumptions, that the reserves and resources described exist in quantities predicted or estimated, and that the reserves and resources can be profitably produced in the future.
These forward-looking statements are based on certain key assumptions regarding, among other things: petroleum and natural gas prices and pricing differentials between light, medium and heavy gravity crude oils; well production rates and reserve volumes; our ability to add production and reserves through our exploration and development activities; capital expenditure levels; the receipt, in a timely manner, of regulatory and other required approvals; the availability and cost of labour and other industry services; the amount of future cash dividends that we intend to pay; interest and foreign exchange rates; and the continuance of existing and, in certain circumstances, proposed tax and royalty regimes. Readers are cautioned that such assumptions, although considered reasonable by Baytex at the time of preparation, may prove to be incorrect.
Actual results achieved during the forecast period will vary from the information provided herein as a result of numerous known and unknown risks and uncertainties and other factors. Such factors include, but are not limited to: declines in oil and natural gas prices; variations in interest rates and foreign exchange rates; risks associated with our hedging activities; uncertainties in the credit markets may restrict the availability of credit or increase the cost of borrowing; refinancing risk for existing debt and debt service costs; access to external sources of capital; third party credit risk; a downgrade of our credit ratings; risks associated with the exploitation of our properties and our ability to acquire reserves; increases in operating costs; changes in government regulations that affect the oil and gas industry; risks relating to hydraulic fracturing; changes in income tax or other laws or government incentive programs; uncertainties associated with estimating petroleum and natural gas reserves; risks associated with acquiring, developing and exploring for oil and natural gas and other aspects of our operations; risks associated with properties operated by third parties; risks associated with delays in business operations; risks associated with the marketing of our petroleum and natural gas production; risks related to the accessibility, availability, proximity and capacity of gathering, processing and pipeline systems; risks associated with large projects or expansion of our activities; risks related to heavy oil projects; expansion of our operations; the failure to realize anticipated benefits of acquisitions and dispositions or to manage growth; changes in climate change laws and other environmental, health and safety regulations; competition in the oil and gas industry for, among other things, acquisitions of reserves, undeveloped lands, skilled personnel and drilling and related equipment; the activities of our Operating Entities and their key personnel; depletion of our reserves; risks associated with securing and maintaining title to our properties; seasonal weather patterns; our permitted investments; risks associated with the ownership of our securities, including the discretionary nature of dividend payments and changes in market-based factors; risks for United States and other non-resident shareholders, including the ability to enforce civil remedies, differing practices for reporting reserves and production, additional taxation applicable to non-residents and foreign exchange risk; and other factors, many of which are beyond the control of Baytex.
Readers are cautioned that the foregoing list of risk factors is not exhaustive. New risk factors emerge from time to time, and it is not possible for management to predict all of such factors and to assess in
5
advance the impact of each such factor on our business or the extent to which any factor, or combination of factors, may cause actual results to differ materially from those contained in any forward-looking statements. Readers should also carefully consider the matters discussed under the heading "Risk Factors" in this Annual Information Form.
There is no representation by Baytex that actual results achieved during the forecast period will be the same in whole or in part as those forecast and Baytex does not undertake any obligation to update publicly or to revise any of the included forward-looking statements, whether as a result of new information, future events or otherwise, except as may be required by applicable securities law. The forward-looking statements contained in this Annual Information Form are expressly qualified by this cautionary statement.
Contingent Resource
This Annual Information Form contains estimates as of December 31, 2011 of the volumes of, and the net present value of the future net revenue from, the "contingent resource" for four of our oil resource plays: the Bluesky in the Seal area of Alberta; the Bakken/Three Forks in North Dakota; the Viking in southeast Alberta; and the Lloydminster area of Alberta. These estimates were prepared by independent qualified reserves evaluators.
"Contingent resource" is not, and should not be confused with, petroleum and natural gas reserves. "Contingent resource" is defined in the Canadian Oil and Gas Evaluation Handbook as: "those quantities of petroleum estimated, as of a given date, to be potentially recoverable from known accumulations using established technology or technology under development, but which are not currently considered to be commercially recoverable due to one or more contingencies. Contingencies may include factors such as economic, legal, environmental, political and regulatory matters or a lack of markets. It is also appropriate to classify as contingent resource the estimated discovered recoverable quantities associated with a project in the early evaluation stage."
A range of contingent resource estimates (low, best and high) were prepared by the independent qualified reserves evaluators. A low estimate (C1) is considered to be a conservative estimate of the quantity of the resource that will actually be recovered. It is likely that the actual remaining quantities recovered will exceed the low estimate. Those resources at the low end of the estimate range have the highest degree of certainty (a 90% confidence level) that the actual quantities recovered will be equal or exceed the estimate. A best estimate (C2) is considered to be the best estimate of the quantity of the resource that will actually be recovered. It is equally likely that the actual remaining quantities recovered will be greater or less than the best estimate. Those resources that fall within the best estimate have a 50% confidence level that the actual quantities recovered will be equal or exceed the estimate. A high estimate (C3) is considered to be an optimistic estimate of the quantity of the resource that will actually be recovered. It is unlikely that the actual remaining quantities of resource recovered will meet or exceed the high estimate. Those resources at the high end of the estimate range have a lower degree of certainty (a 10% confidence level) that the actual quantities recovered will equal or exceed the estimate.
The primary contingencies which currently prevent the classification of the contingent resource as reserves consist of: preparation of firm development plans, including determination of the specific scope and timing of the project; project sanction; access to capital markets; stakeholder and regulatory approvals; access to required services and field development infrastructure; oil prices; demonstration of economic viability; future drilling program and testing results; further reservoir delineation and studies; facility design work; limitations to development based on adverse topography or other surface restrictions; and the uncertainty regarding marketing and transportation of petroleum from development areas.
6
There is no certainty that it will be commercially viable to produce any portion of the contingent resource or that we will produce any portion of the volumes currently classified as contingent resource. The estimates of contingent resource involve implied assessment, based on certain estimates and assumptions, that the resource described exists in the quantities predicted or estimated and that the resource can be profitably produced in the future. The net present value of the future net revenue from the contingent resource does not necessarily represent the fair market value of the contingent resource.
The recovery and resource estimates provided herein are estimates only. Actual contingent resource (and any volumes that may be reclassified as reserves) and future production from such contingent resource may be greater than or less than the estimates provided herein.
Description of Funds from Operations
This Annual Information Form contains references to funds from operations, which does not have any standardized meaning prescribed by Canadian GAAP. We define funds from operations as cash flow from operating activities adjusted for financing costs, changes in non-cash operating working capital and other operating items. We believe that this measure assists in providing a more complete understanding of certain aspects of our results of operations and financial performance, including our ability to generate the cash flow necessary to fund future dividends to shareholders and capital investments. However, funds from operations should not be construed as an alternative to traditional performance measures determined in accordance with Canadian GAAP, such as cash flow from operating activities and net income.
For a reconciliation of funds from operations to cash flow from operating activities, see our "Management's Discussion and Analysis of the operating and financial results" which is accessible on the SEDAR website atwww.sedar.com.
New York Stock Exchange
As a Canadian issuer listed on the New York Stock Exchange (the "NYSE"), we are not required to comply with most of the NYSE's corporate governance rules and listing standards and instead may comply with domestic corporate governance requirements. The NYSE requires that as a foreign private issuer we disclose any significant ways in which our corporate governance practices differ from those followed by U.S. domestic issuers. We have reviewed the NYSE corporate governance and listing standards applicable to U.S. domestic issuers and confirm that our corporate governance practices do not differ significantly from such standards.
Access to Documents
Any document referred to in this Annual Information and described as being accessible on the SEDAR website atwww.sedar.com (including those documents referred to as being incorporated by reference in this Annual Information Form) may be obtained free of charge from us at Suite 2800, Centennial Place, East Tower, 520 - 3rd Avenue S.W., Calgary, Alberta, Canada, T2P 0R3.
7
BAYTEX ENERGY CORP.
General
We were incorporated on October 22, 2010 pursuant to the provisions of the ABCA, as an indirect wholly-owned subsidiary of the Trust, for the sole purpose of participating in a plan of arrangement under the ABCA to effect the conversion of the legal structure of the Trust from a trust to a corporation. The Corporate Conversion was implemented as a result of changes to laws regarding the taxation of trusts in Canada that took effect on January 1, 2011.
Pursuant to the Corporate Conversion: (i) on December 31, 2010, holders of Trust Units exchanged their Trust Units for Common Shares on a one-for-one basis; and (ii) on January 1, 2011, the Trust was dissolved and terminated, with the Corporation being the successor to the Trust.
Our head and principal office is located at Suite 2800, Centennial Place, East Tower, 520 - 3rd Avenue S.W., Calgary, Alberta, Canada, T2P 0R3. Our registered office is located at 1400, 350 - 7th Avenue S.W., Calgary, Alberta, Canada, T2P 3N9.
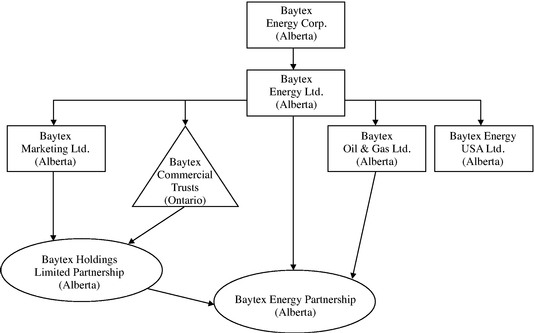
Inter-Corporate Relationships
The following table provides the name, the percentage of voting securities owned by us and the jurisdiction of incorporation, continuance, formation or organization of our subsidiaries either, direct and indirect, as at the date hereof.
| | | | | |
| | Percentage of voting securities
(directly or indirectly) | | Jurisdiction of
Incorporation/
Formation |
|---|
Baytex Energy Ltd. | | | 100% | | Alberta |
Baytex Marketing Ltd. | | | 100% | | Alberta |
Baytex Commercial Trusts | | | 100% | | Ontario |
Baytex Oil & Gas Ltd. | | | 100% | | Alberta |
Baytex Energy USA Ltd. | | | 100% | | Colorado |
Baytex Holdings Limited Partnership | | | 100% | | Alberta |
Baytex Energy Partnership | | | 100% | | Alberta |
8
Our Organizational Structure
The following diagram describes the inter-corporate relationships among us and our material subsidiaries.
GENERAL DEVELOPMENT OF OUR BUSINESS
History and Development
In this section, references to "we", "us" and "our" for events occurring prior to January 1, 2011 refer to the Trust and its subsidiaries on a consolidated basis, unless the context requires otherwise.
On April 14, 2009, we completed a public offering of 7,935,000 Trust Units at a price of $14.50 per Trust Unit for gross proceeds of $115,057,500. The net proceeds of the offering were used to repay outstanding bank indebtedness.
On July 30, 2009, we completed the acquisition of predominantly heavy oil assets located in the Kerrobert and Coleville areas of southwest Saskatchewan, plus certain natural gas assets located in the Ferrier area of west central Alberta effective May 1, 2009. Aggregate cash consideration for the acquisition was $86.2 million, net of adjustments such as net operating income for the interim period from May 1, 2009 to July 30, 2009 and prepaid items. The acquired assets were producing approximately 3,000 boe/d (72% heavy oil and 28% natural gas) at the time of the acquisition. The acquired assets included approximately 47,700 net acres of developed land and 63,300 net acres of undeveloped land in close proximity to our existing assets in the Lloydminster area.
On August 26, 2009, we completed a public offering of $150 million principal amount of 9.15% series A senior unsecured debentures due August 26, 2016. The net proceeds of the offering along with funds drawn on the Credit Facilities were used to fund the redemption effective September 25, 2009 of the following senior subordinated notes of Baytex Energy: 9.625% notes due July 15, 2010 (principal amount US$179.7 million) and 10.5% notes due February 15, 2011 (principal amount US$0.2 million).
In November, 2009, we reached an agreement with our joint venture partner in the Bakken/Three Forks light oil resource play in the Williston Basin in northwest North Dakota to pre-pay the remaining deferred acquisition payments. The original participation agreement with the joint venture partner called for deferred acquisition payments totalling approximately US$36 million to be made prior to the
9
spud date of each of the remaining 24 earning wells, occurring more or less rateably until approximately January 2011. On December 15, 2009, we paid our joint venture partner US$33.2 million to complete the remaining deferred acquisition payments and to earn the right to operate a portion of the joint project area effective at the beginning of 2010.
On May 26, 2010, we completed the acquisition of a private company with heavy oil assets in the Lloydminster area of southwest Saskatchewan for aggregate net cash consideration of $40.9 million. The acquired assets were producing approximately 900 bbl/d of heavy oil at the time of the acquisition. The acquired assets included approximately 32,100 net acres of undeveloped land in close proximity to our existing assets in the Lloydminster area.
On September 30, 2010, we closed the sale of our 50% interest in the lands and wells comprising phase one of an in-situ combustion project located in the Kerrobert area of southwest Saskatchewan for $18 million and a gross overriding royalty on the divested lands. We retained our 50% interest in the area of mutual interest surrounding the phase one lands. Our other Kerrobert interests, including our 100% working interest in our steam-assisted gravity drainage project, were unaffected by the sale.
On December 31, 2010 / January 1, 2011, the Corporate Conversion was completed which resulted in holders of Trust Units exchanging their Trust Units for Common Shares on a one-for-one basis and the dissolution and termination of the Trust, with the Corporation being the successor to the Trust.
On February 3, 2011, we completed the acquisition of heavy oil assets located in the Reno area of northern Alberta and the Lloydminster area of western Saskatchewan. The total consideration for the acquisition of $159.3 million (net of adjustments) was funded by drawing on our revolving credit facilities.
On February 17, 2011, we completed a private placement of US$150 million principal amount of 6.75% series B senior unsecured debentures due February 17, 2021. The net proceeds of the offering were used to repay existing indebtedness under the credit facilities and for general corporate purposes.
On August 9, 2011, we completed the acquisition of natural gas assets located in the Brewster area of west central Alberta. The total consideration for the acquisition of $22.4 million (net of adjustments) was funded by drawing on our revolving credit facilities.
In the fourth quarter of 2011, we completed two dispositions of primarily undeveloped lands for $47.4 million. In the Kaybob South area of west central Alberta, we sold six sections of leasehold, including five sections with Duvernay rights, for $11.1 million. In the Dodsland area in southwest Saskatchewan, we sold 32,600 net acres of leasehold in the "halo" of the field for $36.3 million.
Significant Acquisitions
During the year ended December 31, 2011, we did not complete any acquisitions for which disclosure was required under Part 8 of National Instrument 51-102.
RISK FACTORS
You should carefully consider the following risk factors, as well as the other information contained in this Annual Information Form and our other public filings before making an investment decision. If any of the risks described below materialize, our business, financial condition or results of operations could be materially and adversely affected. Additional risks and uncertainties not currently known to us that we currently view as immaterial may also materially and adversely affect our business, financial condition or results of operations. Residents of the United States and other non-residents of Canada should have additional regard to the risk factors under the heading "— Certain Risks for United States and other non-resident Shareholders".
10
The information set forth below contains "forward-looking statements", which are qualified by the information contained in the section of this Annual Information Form entitled "Special Notes to Reader — Forward-Looking Statements".
Risks Relating to Our Business and Operations
Oil and natural gas prices are volatile. Declines in oil and natural gas prices will adversely affect our financial condition
Our revenues, operating results, profitability and future rate of growth depend primarily upon the prices we receive for the oil and natural gas that we sell. Prices also affect the amount of cash flow available for capital expenditures and dividends to Shareholders and our ability to borrow money or raise additional capital.
The extreme volatility of oil and natural gas prices over the past few years has affected the monthly distributions per Trust Unit paid by our predecessor, which reached a high of $0.25 for June to November 2008, before being reduced to $0.18 for December 2008 and January 2009 and $0.12 for February to November 2009. With the recovery in oil and natural gas prices, monthly distributions per Trust Unit were increased to $0.18 in December 2009 and to $0.20 in December 2010. Continuing strength in oil prices in 2011 allowed us to increase monthly dividends per Common Share to $0.22 in December 2011. Declines in oil and natural gas prices may result in declines in, or the elimination of, dividends to Shareholders.
Historically, oil and natural gas prices have been volatile and they are likely to continue to be volatile. Oil and natural gas prices are determined by economic factors and in the case of oil prices, political factors and a variety of additional factors beyond our control. These factors include economic conditions in the United States and Canada and worldwide including ongoing credit and liquidity concerns, the actions of OPEC, sanctions imposed on certain oil producing nations by other countries, governmental regulation, political instability or armed-conflict in the Middle East and other oil producing regions, weather conditions including weather-related disruptions to the North American natural gas supply, the foreign supply of oil and natural gas, risks of supply disruption, the level of consumer demand, the price of foreign imports and the availability of alternative fuel sources. Any substantial and extended decline in the price of oil and natural gas would have an adverse effect on the carrying value of our proved and probable reserves, net asset value, borrowing capacity, revenues, profitability and funds from operations and ultimately on our financial condition and may, therefore, affect the amount of dividends that we pay to our Shareholders.
Our financial performance also depends on revenues from the sale of commodities which differ in quality and location from underlying commodity prices quoted on financial exchanges. Of particular importance are the price differentials between our light/medium oil and heavy oil (in particular the light/heavy differential) and quoted market prices. Not only are these discounts influenced by regional supply and demand factors, they are also influenced by other factors such as transportation costs, capacity and interruptions, refining demand, the availability and cost of diluents used to blend and transport product and the quality of the oil produced, all of which are beyond our control.
The economics of producing from some wells may change as a result of lower commodity prices, which could result in reduced production of oil or natural gas and a reduction in the volumes of our reserves. We might also elect not to produce from certain wells at lower prices. Volatile oil and natural gas prices also make it difficult to estimate the value of producing properties for acquisitions and often cause disruption in the market for oil and natural gas producing properties, as buyers and sellers have difficulty agreeing on such value. Price volatility also makes it difficult to budget for and project the return on acquisitions and development and exploitation projects.
11
Variations in interest rates and foreign exchange rates could adversely affect our financial condition
There is a risk that the interest rates will increase given the current historical low level of interest rates. An increase in interest rates could result in a significant increase in the amount we pay to service debt and could have an adverse impact on our financial condition, results of operations and future growth, potentially resulting in a decrease in dividends to Shareholders and/or the market price of the Common Shares.
World oil prices are quoted in United States dollars and the price received by Canadian producers is therefore affected by the Canada/U.S. foreign exchange rate that may fluctuate over time. A material increase in the value of the Canadian dollar may negatively impact our production revenue and our ability to maintain dividends to Shareholders in the future. Future Canada/U.S. foreign exchange rates could also impact the future value of our reserves as determined by our independent evaluator.
A decline in the value of the Canadian dollar relative to the United States dollar provides a competitive advantage to United States companies in acquiring Canadian oil and gas properties and may make it more difficult for us to replace reserves through acquisitions.
Our hedging activities may negatively impact our income and our financial condition
We may manage the risk associated with changes in commodity prices by entering into petroleum or natural gas price hedges. If we hedge our commodity price exposure, we may forego some of the benefits we would otherwise experience if commodity prices were to increase. For more information in relation to our commodity hedging program, see "Statement of Reserves Data and Other Oil and Natural Gas Information — Other Oil and Gas Information — Forward Contracts". We may initiate certain hedges to attempt to mitigate the risk of the Canadian dollar appreciating against the U.S. dollar. An increase in the Canada/U.S. foreign exchange rate will impact future dividends and the future value of our reserves as determined by independent evaluators. These hedging activities could expose us to losses and to credit risk associated with counterparties with which we contract.
Uncertainty in the credit markets may restrict the availability or increase the cost of borrowing required for future development and acquisitions
Our future success depends in part on our ability to access capital markets and obtain financing on reasonable terms. Our ability to do so is dependent on a number of factors, many of which are beyond our control, including our credit ratings, interest rates, the structured and commercial financial markets and perceptions of us and the oil and natural gas exploration and production industry generally.
Uncertainty in domestic and international credit markets and other financial systems could materially affect our ability to access sufficient capital for our capital expenditures and acquisitions on reasonable terms, or at all, and, as a result, may have a material adverse effect on our ability to execute our business strategy and on our financial condition. There can be no assurance that financing will be available or sufficient to meet these requirements or for other corporate purposes or, if financing is available, that it will be on terms appropriate and acceptable to us. Should the lack of financing and uncertainty in the capital markets adversely impact our ability to refinance debt, additional equity may be issued resulting in a dilutive effect on current and future Shareholders.
Our bank credit facilities will need to be renewed prior to June 14, 2014 and failure to renew, in whole or in part, or higher interest charges will adversely affect our financial condition
Our existing Credit Facilities and any replacement credit facilities may not provide sufficient liquidity. The amounts available under our existing Credit Facilities may not be sufficient for future operations, or we may not be able to obtain additional financing on economic terms attractive to us, if at all. We currently have Credit Facilities in the amount of $700 million. In the event that the Credit Facilities are
12
not extended before June 14, 2014, indebtedness under the Credit Facilities will be repayable on June 14, 2014. The interest charged on the Credit Facilities is calculated based on a sliding scale ratio of our debt to EBITDA ratio. Repayment of all outstanding amounts under the Credit Facilities may be demanded on relatively short notice if an event of default occurs, which is continuing. If this occurs, we may need to obtain alternate financing. Any failure to obtain suitable replacement financing may have a material adverse effect on our business, and dividends to Shareholders may be materially reduced. There is also a risk that the Credit Facilities will not be renewed for the same amount or on the same terms.
As at December 31, 2011, our outstanding indebtedness included $150 million of 2016 Debentures which mature on August 26, 2016 and US$150 million of 2021 Debentures which mature on February 17, 2021. We intend to fund these debt maturities with our existing Credit Facilities. In the event we are unable to refinance our debt obligations, it may impact our ability to fund our ongoing operations and to pay dividends.
We are required to comply with covenants under the Credit Facilities and the Debentures. In the event that we do not comply with these covenants, our access to capital could be restricted or repayment could be required on an accelerated basis by our lenders, and the ability to pay dividends to our Shareholders may be restricted. The lenders under the Credit Facilities have security over substantially all of our assets. If we become unable to pay our debt service charges or otherwise commit an event of default, such as breach of our financial covenants, the lenders under the Credit Facilities may foreclose on or sell our working interests in our properties.
Amounts paid in respect of interest and principal on debt may reduce dividends to Shareholders. Variations in interest rates and scheduled principal repayments could result in significant changes in the amount required to be applied to debt service before payment of dividends. Certain covenants in the agreements with our lenders under the Credit Facilities and the holders of the Debentures may also limit dividends. Although we believe the Credit Facilities will be sufficient for our immediate requirements, there can be no assurance that the amount will be adequate for our future financial obligations including our future capital expenditure program, or that we will be able to obtain additional funds.
From time to time we may enter into transactions which may be financed in whole or in part with debt. The level of our indebtedness from time to time could impair our ability to obtain additional financing on a timely basis to take advantage of business opportunities that may arise.
We have been historically reliant on external sources of capital, borrowings and equity sales and, if unavailable, our financial condition will be adversely affected
As future capital expenditures will be financed out of funds from operations, borrowings and possible future equity sales, our ability to do so is dependent on, among other factors, the overall state of capital markets and investor appetite for investments in the energy industry and our securities in particular.
To the extent that external sources of capital become limited or unavailable or available on onerous terms, our ability to make capital investments and maintain or expand existing assets and reserves may be impaired, and our assets, liabilities, business, financial condition, results of operations and dividends to Shareholders may be materially and adversely affected as a result.
Shareholders may suffer dilution in connection with future issuances of Common Shares. One of our objectives is to continually add to our reserves through acquisitions and through development. Our success is, in part, dependent on our ability to raise capital from time to time by selling additional Common Shares. Shareholders will suffer dilution as a result of these offerings if, for example, the cash flow, production or reserves from the acquired assets do not reflect the additional number of Common
13
Shares issued to acquire those assets. Shareholders may also suffer dilution in connection with future issuances of Common Shares to complete acquisitions.
If funds from operations are lower than expected or capital costs for these projects exceed current estimates, or if we incur major unanticipated expenses related to development or maintenance of our existing properties, we may be required to seek additional capital to maintain our capital expenditures at planned levels. Failure to obtain any financing necessary for our capital expenditure plans may result in a delay in development of, or production from, our properties resulting in a decrease in the amount of funds from operations received by us and, therefore, may reduce dividends to Shareholders.
Failure of third parties to meet their contractual obligations to us may have a material adverse affect on our financial condition
We are exposed to third party credit risk through our contractual arrangements with our current or future joint venture partners, third party operators, marketers of our petroleum and natural gas production, hedge counterparties and other parties. In the event such parties fail to meet their contractual obligations to us, such failures may have a material adverse effect on our business, financial condition, results of operations and prospects. In addition, poor credit conditions in the industry and of joint venture partners may impact a joint venture partner's willingness to participate in our ongoing capital program, potentially delaying the program and the results of such program until we find a suitable alternative partner.
A downgrade our credit rating could increase our cost of capital and limit our access to capital, suppliers or counterparties.
Rating agencies regularly evaluate us, basing their ratings of our long-term and short-term debt on a number of factors. This includes our financial strength as well as factors not entirely within our control, including conditions affecting the oil and gas industry generally and the wider state of the economy. There can be no assurance that one or more of our credit ratings will not be downgraded.
Our borrowing costs and ability to raise funds are directly impacted by our credit ratings. Credit ratings may be important to suppliers or counterparties when they seek to engage in certain transactions, including transactions involving over-the-counter derivatives. A credit-rating downgrade could potentially impair our ability to enter into arrangements with suppliers or counterparties, to engage in certain transactions, and could limit our access to private and public credit markets and increase the costs of borrowing under our existing credit facilities. A downgrade could also limit our access to short-term debt markets, increase the cost of borrowing in the short-term and long-term debt markets, and trigger collateralization requirements related to physical and financial derivative liabilities with certain marketing counterparties and pipeline and midstream service providers.
In connection with certain over-the-counter derivatives contracts and other trading agreements, we could be required to provide additional collateral or to terminate transactions with certain counterparties in the event of a downgrade of our credit rating. The occurrence of any of the foregoing could adversely affect our ability to execute portions of our business strategy, including hedging, and could have a material adverse effect on our liquidity and capital position.
Our ability to add to our petroleum and natural gas reserves is highly dependent on our success in exploiting existing properties and acquiring additional reserves
Our long-term commercial success depends on our ability to find, acquire, develop and commercially produce petroleum and natural gas reserves. Future oil and natural gas exploration may involve unprofitable efforts, not only from unsuccessful wells, but also from wells that are productive but do not produce sufficient petroleum substances to return a profit after drilling, completion (including hydraulic fracturing), operating and other costs. Completion of a well does not assure a profit on the
14
investment or recovery of drilling, completion, operating and other costs. Drilling hazards or environmental damage could greatly increase the cost of operations, and various field operating conditions may adversely affect the production from successful wells. These conditions include delays in obtaining governmental approvals or consents, shut-ins of connected wells resulting from extreme weather conditions, insufficient storage or transportation capacity or other geological and mechanical conditions. While diligent well supervision and effective maintenance operations can contribute to maximizing production rates over time, production delays and declines from normal field operating conditions cannot be eliminated and can be expected to adversely affect revenue and cash flow levels to varying degrees. New wells we drill or participate in may not become productive and we may not recover all or any portion of our investment in wells we drill or participate in. The cost of drilling, completing and operating a well is often uncertain, and cost factors can adversely affect the economics of a project.
There is no assurance we will be successful in developing additional reserves or acquiring additional reserves on terms that meet our investment objectives. Without these reserves additions, our reserves will deplete and as a consequence, either production from, or the average reserves life of, our properties will decline, which will result in a reduction in the value of Common Shares and in a reduction in funds from operations available for dividends to Shareholders.
Increases in operating costs could adversely affect our business, financial condition and results of operations
Higher operating costs for our underlying properties will directly decrease the amount of funds from operations received by us and, therefore, may reduce dividends to Shareholders. Labour costs, electricity, gas processing, well servicing and chemicals are examples of types of operating costs that are susceptible to material fluctuation. There is no assurance that further commercial quantities of petroleum and natural gas will be discovered or acquired by us.
Changes in government regulations that affect the oil and gas industry, or failing to comply with such regulations, could adversely affect us
The oil and gas industry in Canada and the United States is subject to federal, provincial, state and municipal legislation and regulation governing such matters as land tenure, prices, royalties, production rates, environmental protection controls, the exportation of crude oil, natural gas and other products, as well as other matters. See "Industry Conditions".
The industry is also subject to regulation by governments in such matters as the awarding or acquisition of exploration and production rights, oil sands or other interests, the imposition of specific drilling obligations, environmental protection controls, control over the development and abandonment of fields and mine sites (including restrictions on production) and possibly expropriation or cancellation of contract rights. We also rely on fresh water, which is obtained under government licenses to provide domestic and utility water for certain of our operations. There can be no assurance that the licenses to withdraw water will not be rescinded or that additional conditions will not be added to these licenses.
Government regulations may change from time to time in response to economic or political conditions. The exercise of discretion by governmental authorities under existing regulations, the implementation of new regulations or the modification of existing regulations affecting the oil and gas industry could reduce demand for crude oil and natural gas, increase our costs, or delay or restrict our operations, all of which would have a material adverse impact on us. In addition, failure to comply with government regulations may result in the suspension or termination of operations and subject us to liabilities and administrative, civil and criminal penalties. Compliance costs can be significant.
15
Hydraulic fracturing is subject to certain risks
Hydraulic fracturing involves the injection of water, sand and small amounts of additives under pressure into rock formations to stimulate hydrocarbon (natural gas and oil) production. The use of hydraulic fracturing is being used to produce commercial quantities of natural gas and oil from reservoirs that were previously unproductive. We use hydraulic fracturing in our operations. With the increase in the use of fracture stimulations in horizontal wells there is increased communication between the oil and natural gas industry and a wider variety of stakeholders regarding the responsible use of this technology as it relates to the environment. This increased attention to fracture stimulations may result in increased regulation or changes of law which may make the conduct of our business more expensive or prevent us from conducting our business as currently conducted. Any new laws, regulation or permitting requirements regarding hydraulic fracturing could lead to operational delay or increased operating costs or third party or governmental claims, and could increase our costs of compliance and doing business as well as delay the development of oil and natural gas resources from shale formations which are not commercial without the use of hydraulic fracturing. Restrictions on hydraulic fracturing could also reduce the amount of oil and natural gas that we are ultimately able to produce from our reserves.
Income tax laws or other laws or government incentive programs or regulations relating to our industry may in the future be changed or interpreted in a manner that adversely affects us and our Shareholders
Income tax laws, other laws or government incentive programs relating to the oil and gas industry, such as resource allowance, may in the future be changed or interpreted in a manner that adversely affects us and our Shareholders. Tax authorities having jurisdiction over us or our Shareholders may disagree with the manner in which we calculate our income for tax purposes or could change their administrative practices to our detriment or the detriment of our Shareholders.
The oil and gas industry is subject to extensive controls and regulations governing its operations (including land tenure, exploration, development, production, refining, transportation, and marketing) imposed by legislation enacted by various levels of government and with respect to pricing and taxation of oil and natural gas by agreements among the governments of Canada, Alberta, British Columbia, Saskatchewan, the United States, North Dakota and Wyoming, all of which should be carefully considered by investors in the oil and gas industry. All of such controls, regulations and legislation are subject to revocation, amendment or administrative change, some of which have historically been material and in some cases materially adverse and there can be no assurance that there will not be further revocation, amendment or administrative change which will be materially adverse to our assets, reserves, financial condition or results of operations or prospects and our ability to maintain dividends to Shareholders.
We cannot assure you that income tax laws and government incentive programs relating to the oil and gas industry generally will not change in a manner that adversely affects the market price of the Common Shares.
There are numerous uncertainties inherent in estimating quantities of recoverable petroleum and natural gas reserves, including many factors beyond our control
In general, estimates of economically recoverable petroleum and natural gas reserves and resources and the future net revenues therefrom are based upon a number of variable factors and assumptions, such as historical production from the properties, production rates, ultimate reserve recovery, timing and amount of capital expenditures, marketability of petroleum and natural gas, royalty rates, the assumed effects of regulation by governmental agencies and future operating costs, all of which may vary materially from actual results. All such estimates are based on professional judgment and classifications of reserves, which, by their nature have a high degree of subjectivity. For those reasons, estimates of
16
the economically recoverable petroleum and natural gas reserves or estimates of resources attributable to any particular group of properties, classification of such reserves based on risk of recovery and estimates of future net revenues associated with reserves prepared by different engineers, or by the same engineers at different times, may vary.
The reserves and recovery information contained in the Sproule Report is only an estimate and the actual production and ultimate reserves from the properties may be greater or less than the estimates prepared by Sproule and such variations could be material. The Sproule Report has been prepared using certain commodity price assumptions which are described in the notes to the reserves tables. If we realize lower prices for crude oil, natural gas liquids and natural gas and they are substituted for the price assumptions utilized in the Sproule Report, the present value of estimated future net revenues for our reserves and our net asset value would be reduced and the reduction could be significant. The estimates in the Sproule Report are based in part on the timing and success of activities we intend to undertake in future years. The reserves and estimated cash flows to be derived therefrom contained in the Sproule Report will be reduced, in future years, to the extent that such activities do not achieve the level of success assumed in the Sproule Report.
Estimates of proved and probable reserves include undeveloped reserves that are expected to be recovered from new wells on undrilled acreage or from existing wells where a relatively major expenditure is still required before such wells begin production. Reserves may be recognized when plans are in place to make the required investments to convert these undeveloped reserves to producing. Circumstances such as a sustained decline in commodity prices or poorer than expected results from initial activities could cause a change in the investment or development plans which could result in a material change in our reserves estimates.
Estimates of proved undeveloped reserves are sometimes based upon volumetric calculations and upon analogy to similar types of reserves rather than actual production history. Recovery factors and drainage areas were estimated by experience and analogy to similar producing pools. Estimates based on these methods are generally less reliable than those based on actual production history. Subsequent evaluation of the same reserves based upon production history and production practices will result in variations in the estimated reserves and such variations could have a material and adverse impact on our business and financial condition.
The contingent resource volumes included in this Annual Information Form are estimates only. The same uncertainties inherent in estimating quantities of reserves apply to estimating quantities of contingent resource. In addition, there are contingencies that prevent contingent resource from being classified as reserves. There is no certainty that it will be commercially viable to produce any portion of the contingent resource. Actual results may vary significantly from these estimates and such variances could be material.
Acquiring, developing and exploring for oil and natural gas involves many operating risks, which even a combination of experience, knowledge and careful evaluation may not be able to overcome. We have not insured and cannot fully insure against all risks related to our operations
Our business involves many operating risks related to the acquiring, developing and exploring for oil and natural gas. These risks include, but are not limited to, encountering unexpected formations or pressures, premature declines of reservoirs, blow-outs, craterings, equipment failures and other accidents, sour gas releases and spills, uncontrollable flows of oil, natural gas or well fluids, the invasion of water into producing formations, adverse weather conditions, pollution, other environmental hazards, fires, spills and delays in payments between parties caused by operation or economic matters which could result in substantial damage to oil and natural gas wells, production facilities, other property and the environment, personal injuries, loss of life and other hazards, all of which could result in liability. These risks will increase as we undertake more exploratory activity. Drilling hazards or environmental
17
damage could greatly increase the cost of operations, and various field operating conditions may adversely affect the production from successful wells. These conditions include delays in obtaining governmental approvals or consents, the shut-in of connected wells resulting from extreme weather conditions, insufficient storage or transportation capacity or other geological and mechanical conditions.
Although we maintain insurance in accordance with customary industry practice, we are not fully insured against all of these risks nor are all such risks insurable and in certain circumstances we may elect not to obtain insurance to deal with specific risks due to the high premiums associated with such insurance or other reasons. In addition, the nature of these risks is such that liabilities could exceed policy limits, in which event we could incur significant costs that could have a material adverse effect upon our financial condition.
Exploration and development risks arise due to the uncertain results of searching for and producing petroleum and natural gas using imperfect scientific methods. Losses resulting from the occurrence of any of these risks may have a material adverse effect on our business, financial condition, results of operations, prospects and our ability to maintain dividends to Shareholders.
The operation of a portion of our properties is largely dependent on the ability of third party operators, and harm to their business could cause delays and additional expenses in our receiving revenues
The continuing production from a property, and to some extent the marketing of production, is dependent upon the ability of the operators of our properties. Our return on assets operated by others depends upon a number of factors that may be outside of our control, including the timing and amount of capital expenditures, the operator's expertise and financial resources, the approval of other participants, the selection of technology and risk management practices. If, in situations where we are not the operator, the operator fails to perform these functions properly or becomes insolvent, revenues may be reduced. Revenues from production generally flow through the operator and, where we are not the operator, there is a risk of delay and additional expense in receiving such revenues.
In addition to the usual delays in payment by purchasers of oil and natural gas to the operators of the properties, and by the operator to our Operating Entities, payments between any of such parties may also be delayed by restrictions imposed by lenders, delays in the sale or delivery of products, delays in the connection of wells to a gathering system, blowouts or other accidents, recovery by the operator of expenses incurred in the operation of properties or the establishment by the operator of reserves for such expenses.
The operation of wells located on properties not operated by us is generally governed by operating agreements which typically require the operator to conduct operations in a good and workman-like manner. Operating agreements generally provide, however, that the operator will have no liability to the other non-operating working interest owners for losses sustained or liabilities incurred, except such as may result from gross negligence or wilful misconduct. In addition, third-party operators are generally not fiduciaries with respect to us or our Shareholders. As owner of working interests in properties not operated by us, we will generally have a cause of action for damages arising from a breach of the operator's duty. Although not established by definitive legal precedent, it is unlikely that our Shareholders would be entitled to bring suit against third party operators to enforce the terms of the operating agreements. Therefore, our Shareholders will be dependent upon us, as owner of the working interest, to enforce such rights.
18
Delays in business operations could adversely affect our income and financial condition
Delays in business operations could adversely affect our income and financial condition and may affect our ability to pay dividends to Shareholders and the market price of our Common Shares. In addition to the usual delays in payment by purchasers of oil and natural gas to the operators of our properties, and the delays of those operators in remitting payment to us, payments between any of these parties may also be delayed by:
- •
- restrictions imposed by lenders;
- •
- accounting delays;
- •
- delays in the sale or delivery of products;
- •
- delays in the connection of wells to a gathering system;
- •
- restrictions due to limited pipeline or processing capacity;
- •
- operational problems affecting pipelines and facilities;
- •
- blowouts or other accidents;
- •
- adjustments for prior periods;
- •
- recovery by the operator of expenses incurred in the operation of the properties; or
- •
- the establishment by the operator of reserves for these expenses.
Any of these delays could reduce the amount of cash available to pay dividends to Shareholders in a given period and expose us to additional third party credit risks.
The marketability of petroleum and natural gas that may be acquired or discovered by us will be affected by numerous factors beyond our control
These factors include demand for petroleum and natural gas, market fluctuations, the availability, proximity and capacity of oil and natural gas pipelines and processing and storage facilities and government regulations, including regulations relating to environmental protection, royalties, allowable production, pricing, taxes, importing and exporting of oil and natural gas and political events throughout the world that cause disruptions in the supply of oil. Any particular event could result in a material decline in prices and therefore result in a reduction of our net production revenue. The availability of markets is beyond our control.
In addition, our oil and natural gas properties, wells and facilities could be subject to a terrorist attack. If any of our properties, wells or facilities are the subject of terrorist attack it could have a material adverse effect on our financial condition. We do not have insurance to protect against the risk from terrorism.
The amount of oil and natural gas that we can produce and sell is subject to the accessibility, availability, proximity and capacity of gathering, processing and pipeline systems
We deliver our products through gathering, processing and pipeline systems some of which we do not own. Access to the pipeline capacity for the transport of crude oil into the United States has become inadequate for the amount of Canadian production being exported to the United States and has recently resulted in significantly lower amounts being realized by Canadian producers compared with the WTI price for crude oil. The lack of access to capacity in any of the gathering, processing and pipeline systems, and in particular the processing facilities, could result in our inability to realize the full economic potential of our production or in a reduction of the price offered for our production. Any significant change in market factors or other conditions affecting these infrastructure systems and
19
facilities, as well as any delays in constructing new infrastructure systems and facilities could harm our business and, in turn, our financial condition.
Certain pipeline leaks in 2011have gained media and other stakeholder attention and may result in additional regulation or changes in law which could impede the conduct of our business or make our operations more expensive.
A portion our production may, from time to time, be processed through facilities owned by third parties and which we do not have control of. From time to time these facilities may discontinue or decrease operations either as a result of normal servicing requirements or as a result of unexpected events. A discontinuance or decrease of operations could materially adversely affect our ability to process our production and to deliver the same for sale.
We may participate in larger projects and may have more concentrated risk in certain areas of our operations
We manage a variety of small and large projects in the conduct of our business. Project delays may impact expected revenues from operations. Significant project cost over-runs could make a project uneconomic. Our ability to execute projects and market oil and natural gas depends upon numerous factors beyond our control, including:
- •
- the availability of processing capacity;
- •
- the availability and proximity of pipeline capacity;
- •
- the availability of storage capacity;
- •
- the availability of, and the ability to acquire, water supplies needed for drilling and hydraulic fracturing, or our ability to dispose of water used or removed from strata at a reasonable cost and within applicable environmental regulations;
- •
- the supply of and demand for oil and natural gas;
- •
- the availability of alternative fuel sources;
- •
- the effects of inclement weather;
- •
- the availability of drilling and related equipment;
- •
- unexpected cost increases;
- •
- accidental events;
- •
- currency fluctuations;
- •
- changes in regulations;
- •
- the availability and productivity of skilled labour; and
- •
- the regulation of the oil and gas industry by various levels of government and governmental agencies.
Because of these factors, we could be unable to execute projects on time, on budget or at all, and may not be able to effectively market the oil and natural gas that we produce.
Our heavy oil projects face additional risks compared to conventional oil and gas production
Some of our heavy oil projects are capital intensive projects which rely on specialized production technologies. Certain current technologies for the recovery of heavy oil, such as cyclic steam stimulation and steam-assisted gravity drainage, are energy intensive, requiring significant consumption of natural gas and other fuels in the production of steam that is used in the recovery process. The amount of steam required in the production process varies and therefore impacts costs. The performance of the
20
reservoir can also affect the timing and levels of production using new technologies. A large increase in recovery costs could cause certain projects that rely on cyclic steam stimulation, steam-assisted gravity drainage or other new technologies to become uneconomical, which could have a negative effect on our financial condition. There are risks associated with growth and other capital projects that rely largely or partly on new technologies and the incorporation of such technologies into new or existing operations. The success of projects incorporating new technologies cannot be assured.
The operating costs of our heavy oil projects have the potential to vary considerably throughout the operating period and will be significant components of the cost of production of any petroleum products produced. Project economics and our overall earnings may be reduced if increases in operating costs are incurred. Factors which could affect operating costs include, without limitation: labor costs; the cost of catalyst and chemicals; the cost of natural gas and electricity; power outages; produced sand causing issues of erosion, hot spots and corrosion; reliability of and maintenance cost of facilities; and the cost to transport sales products and the cost to dispose of certain by-products.
We only operate in western Canada and the United States and expansion outside of these areas may increase our risk exposure
Our operations and expertise are currently primarily focused on oil and gas production and development in western Canada and the United States. In the future, we may acquire oil and gas properties outside of these geographic areas. In addition, we could acquire other energy related assets, such as oil and natural gas processing plants or pipelines, or an interest in an oil sands project. Expansion of our activities into new areas may present new additional risks or alternatively, significantly increase the exposure to one or more of the present risk factors which may adversely affect our business, financial condition or results of operations.
We may not be able to realize the anticipated benefits of acquisitions and dispositions or to manage growth
We make acquisitions and dispositions of businesses and assets in the ordinary course of our business. Achieving the benefits of acquisitions depends in part on successfully consolidating functions and integrating operations and procedures in a timely and efficient manner as well as our ability to realize the anticipated growth opportunities and synergies from combining the acquired businesses and operations with our operations. There is no assurance that we will be able to continue to complete acquisitions or dispositions of oil and natural gas properties which realize all the synergistic benefits.
We periodically dispose of non-core assets so that management can focus its efforts and resources more efficiently. Depending on the state of the market for such non-core assets, certain of our non-core assets, if disposed of, could be expected to realize less than their carrying value on our financial statements.
The price we pay for the purchase of any material properties is based on several criteria, including engineering and economic assessments made by independent engineers modified to reflect our technical and economic views. These assessments include a series of assumptions regarding such factors as recoverability and marketability of petroleum and natural gas, future prices of petroleum and natural gas, future operating costs, future capital expenditures and royalties and other government levies which will be imposed over the producing life of the reserves. Many of these factors are subject to change and are beyond our control. All such assessments involve a measure of geologic and engineering uncertainty which could result in lower than anticipated production and reserves. Consequently, the reserves acquired may be less than expected, which could adversely impact cash flow from operating activities and dividends to Shareholders.
We may be subject to growth-related risks including capacity constraints and pressure on our internal systems and controls. Our ability to manage growth effectively will require us to continue to implement and improve our operational and financial systems and to expand, train and manage our employee
21
base. Our inability to deal with this growth could have a material adverse effect on our business, financial condition, results of operations and prospects.
Climate change laws and related environmental, health and safety regulation may impose restrictions or costs on our business which may adversely affect our financial condition and our ability to maintain dividends
Nearly all aspects of our operations are subject to environmental, health and safety regulation pursuant to a variety of federal, provincial, state and local laws and regulations. Environmental legislation provides for, among other things, restrictions and prohibitions on spills, releases or emissions of various substances produced in association with oil and natural gas operations. The legislation also requires that wells and facility sites be operated, maintained, abandoned and reclaimed to the satisfaction of applicable regulatory authorities. A breach of such legislation may result in the imposition of fines or issuance of clean up orders in respect of us or our properties, some of which may be material. We may also be exposed to civil liability for environmental matters or for the conduct of third parties, including private parties commencing actions and new theories of liability, regardless of negligence or fault. Furthermore, management believes the political climate appears to favour new programs for environmental laws and regulation, particularly in relation to the reduction of emissions or emissions intensity, and there is no assurance that any such programs, laws or regulations, if proposed and enacted, will not contain emission reduction targets which we cannot meet, and financial penalties or charges could be incurred as a result of the failure to meet such targets. For more information on the evolution and status of climate change and related environmental legislation, see "Industry Conditions — Climate Change Regulation".
There has been much public and political debate with respect to the strategy or alternative strategies with respect to climate change and the control of greenhouse gases. Implementation of strategies by either the provinces or states in which we operate our business or by the governments of Canada or the United States, and whether to meet international agreed limits, or as otherwise determined, for reducing greenhouse gases could have a material impact on the nature of oil and natural gas operations, including ours. Given the evolving nature of the debate related to climate change and the control of greenhouse gases and resulting requirements, it is not possible to predict either the nature of those requirements or the impact on us and our operations and financial condition. Although we provide for the necessary amounts in our annual capital budget to fund our currently estimated environmental and reclamation obligations, there can be no assurance that we will be able to satisfy our actual future environmental and reclamation obligations from such funds.
Although we believe that we are in material compliance with current applicable environmental, health and safety regulations, no assurance can be given that such regulations will not result in a curtailment of production, a reduction of product demand, a material increase in the costs of production, development or exploration activities or otherwise adversely affect our business, financial condition, results of operations or prospects. Future changes in other environmental, health and safety regulations could occur and result in stricter standards and enforcement, larger fines and liability, and increased capital expenditures and operating costs, which could have a material adverse effect on our financial condition or results of operations and prospects. See "Industry Conditions — Environmental Regulation".
There is strong competition relating to all aspects of the oil and gas industry
There are numerous companies in the oil and gas industry who are competing with us for the acquisitions of properties with longer life reserves, properties with exploitation and development opportunities and undeveloped land. As a result of such competition, it may be more difficult for us to acquire reserves on beneficial terms or at all. Some of those organizations not only explore for, develop and produce oil and natural gas but also carry on refining operations and market oil and other products on a world-wide basis and, as such, have greater technical, financial and operational resources than us.
22
We compete with other oil and gas companies to hire and retain skilled personnel necessary for running our daily operations, including planning, capitalizing on available technical advances and the execution of our exploration and development program. The inability to hire and retain skilled personnel could adversely impact certain of our operational and financial results.
Oil and natural gas exploration and development activities are dependent on the availability of drilling and related equipment (typically leased from third parties) in the particular areas where such activities will be conducted. Demand for such limited equipment or access restrictions may affect the availability of such equipment to us and may delay exploration and development activities.
Our success depends in large measure on the activities of our Operating Entities and their key personnel
We are entirely dependent upon the operations and assets of our Operating Entities through our ownership, directly and indirectly, of securities of our Operating Entities, including the Notes. Accordingly, our ability to pay dividends to Shareholders is dependent upon the ability of our Operating Entities to meet their interest, principal, dividend and other distribution obligations on their securities. Our Operating Entities' income is derived from the production of petroleum and natural gas from their resource properties and is susceptible to the risks and uncertainties associated with the oil and gas industry generally. If the petroleum and natural gas reserves associated with our Operating Entities' resource properties are not supplemented through additional development or the acquisition of additional oil and natural gas properties, the ability of our Operating Entities to meet their obligations to us and our ability to pay dividends to Shareholders may be adversely affected.
We depend entirely on our management with respect to the acquisition of oil and gas properties, the development and acquisition of additional reserves, the management and administration of all matters relating to our properties, including the safekeeping of our primary workspace and computer systems. The loss of the services of key personnel may have a material adverse effect on our business, financial condition, results of operations and prospects. The contributions of the existing management team to our immediate and near term operations are likely to be of central importance. In addition, the competition for qualified personnel in the oil and gas industry is intense and there can be no assurance that we will be able to continue to attract and retain all personnel necessary for the development and operation of our business. Investors must rely upon the ability, expertise, judgment, discretion, integrity and good faith of our management.
Our petroleum and natural gas reserves are a depleting resource and decline as such reserves are produced
Absent commodity price increases or cost effective acquisition and development activities, our funds from operations will decline over time in a manner consistent with declining production from typical petroleum and natural gas reserves. Our future petroleum and natural gas reserves and production, and therefore our funds from operations, will be highly dependent on our success in exploiting our reserves base and acquiring additional reserves. Without reserves additions through acquisition or development activities, our reserves and production may decline over time as reserves are produced.
We also distribute a significant proportion of our funds from operations to Shareholders rather than reinvesting in reserves additions. Accordingly, if external sources of capital, including the issuance of additional Common Shares, become limited or unavailable on commercially reasonable terms, our ability to make the necessary capital investments to maintain or expand our petroleum and natural gas reserves may be impaired. To the extent that we use funds from operations to finance capital expenditures or property acquisitions, the level of funds from operations available for distribution to Shareholders will be reduced. There can be no assurance that we will be successful in developing or acquiring additional reserves on terms that meet our investment objectives.
23
Securing and maintaining title to our properties is subject to certain risks
Our properties are held in the form of licenses and leases and working interests in licenses and leases. If we or the holder of the license or lease fails to meet the specific requirement of a license or lease, the license or lease may terminate or expire. There can be no assurance that any of the obligations required to maintain each license or lease will be met. The termination or expiration of a license or lease or the working interest relating to a license or lease may have a material adverse affect on our results of operations and business. In addition, title to the properties can become subject to dispute and defeat our claim to title over certain of our properties.
Aboriginal peoples have claimed aboriginal title and rights to portions of western Canada and have also made claims that certain developments, including oil and gas exploration and development, may have been proceeding without the Crown carrying out appropriate consultations in the course of allowing such developments to proceed. We are not aware of any material claims having been made in respect of our properties and assets; however, if a claim arose and was successful this may have a material adverse affect on our results of operations and business.
Although title reviews are conducted prior to any purchase of significant resource assets, such reviews cannot guarantee that an unforeseen defect in the chain of title will not arise to defeat our title to certain assets. There may be valid challenges to title, or proposed legislative changes which affect title to the oil and natural gas properties that we control, that, if successful or made into law, could impair our activities on them and result in a reduction in the amount of funds from operations, possibly resulting in lower dividends to our Shareholders which could result in a lower market price of the Common Shares.
We are affected by seasonal weather patterns
The level of activity in the oil and gas industry is influenced by seasonal weather patterns. Wet weather and spring thaw may make the ground unstable. Consequently, municipalities, provincial and state transportation departments enforce road bans that restrict the movement of rigs and other heavy equipment, thereby reducing activity levels. Also, certain oil and natural gas producing areas are located in areas that are inaccessible other than during the winter months because the ground surrounding the sites in these areas consists of swampy terrain. Seasonal factors and unexpected weather patterns may lead to declines in exploration and production activity and corresponding declines in the demand for crude oil and natural gas.
Our permitted investments may be risky
An investment in us should be made with the understanding that the value of any of our investments may fluctuate in accordance with changes in the financial condition of such investments, the value of similar securities, and other factors. For example, the prices of Canadian government securities, bankers' acceptances and commercial paper react to economic developments and changes in interest rates. Commercial paper is also subject to issuer credit risk. Investments in energy-related companies and partnerships will be subject to the general risks of investing in equity securities. These include the risk that the financial condition of issuers may become impaired, or that the energy sector may suffer a market downturn. Securities markets in general are affected by a variety of factors, including governmental, environmental and regulatory policies, inflation and interest rates, economic cycles, and global, regional and national events. The value of our Common Shares could be affected by adverse changes in the market values of such investments.
24
Risks Relating to Ownership of Securities
Our Board of Directors has discretion in the payment of dividends and may choose not to maintain dividends in certain circumstances
The amount of future cash dividends, if any, will be subject to the discretion of our Board of Directors and may vary depending on a variety of factors and conditions existing from time to time, including fluctuations in commodity prices, production levels, capital expenditure requirements, debt service requirements, operating costs, royalty burdens, foreign exchange rates and the satisfaction of the liquidity and solvency tests imposed by the ABCA for the declaration and payment of dividends. Depending on these and various other factors, many of which will be beyond the control of our Board of Directors and management team, we will change our dividend policy from time to time and, as a result, future cash dividends could be reduced or suspended entirely. The market value of our Common Shares may deteriorate if we reduce or suspend the amount of the cash dividends that we pay in the future and such deterioration may be material. Furthermore, the future treatment of dividends for tax purposes will be subject to the nature and composition of our dividends and potential legislative and regulatory changes.
Dividends may be reduced during periods of lower funds from operations, which result from lower commodity prices and the decision by us to finance capital expenditures using funds from operations. A reduction in dividends could also negatively affect the market price of the Common Shares.
Production and development costs incurred with respect to properties, including power costs and the costs of injection fluids associated with tertiary recovery operations, reduce the income that we receive and, consequently, the amounts we can distribute to our Shareholders.
The timing and amount of capital expenditures will directly affect the amount of income available to pay dividends to our Shareholders. Dividends may be reduced, or even eliminated, at times when significant capital or other expenditures are planned. To the extent that external sources of capital, including the issuance of additional Common Shares, become limited or unavailable, our ability to make the necessary capital investments to maintain or expand petroleum and natural gas reserves and to invest in assets, as the case may be, will be impaired. To the extent that we are required to use funds from operations to finance capital expenditures or property acquisitions, the cash we receive will be reduced, resulting in reductions to the amount of cash we are able to distribute to our Shareholders. A reduction in the amount of cash distributed to Shareholders may negatively affect the market price of the Common Shares.
Changes in market-based factors may adversely affect the trading price of the Common Shares
The market price of our Common Shares is sensitive to a variety of market based factors including, but not limited to, commodity prices, interest rates, foreign exchange rates and the comparability of the Common Shares to other yield-oriented securities. Any changes in these market-based factors may adversely affect the trading price of the Common Shares.
Certain Risks for United States and other non-resident Shareholders
The ability of investors resident in the United States to enforce civil remedies is limited
We are a corporation incorporated under the laws of the Province of Alberta, Canada and our principal office is located in Calgary, Alberta. Most of our directors and officers and the representatives of the experts who provide services to us (such as our auditors and our independent reserve engineers), and all or a substantial portion of our assets and the assets of such persons are located outside the United States. As a result, it may be difficult for investors in the United States to effect service of process within the United States upon such directors, officers and representatives of experts who are not residents of the United States or to enforce against them judgements of the United States courts
25
based upon civil liability under the United States federal securities laws or the securities laws of any state within the United States. There is doubt as to the enforceability in Canada against us or any of our directors, officers or representatives of experts who are not residents of the United States, in original actions or in actions for enforcement of judgements of United States courts of liabilities based solely upon the United States federal securities laws or securities laws of any state within the United States.
Canadian and United States practices differ in reporting reserves and production and our estimates may not be comparable to those of companies in the United States
We report our production and reserve quantities in accordance with Canadian practices and specifically in accordance with NI 51-101. These practices are different from the practices used to report production and to estimate reserves in reports and other materials filed with the SEC by companies in the United States.
We incorporate additional information with respect to production and reserves which is either not required to be included or prohibited under rules of the SEC and practices in the United States. We follow the Canadian practice of reporting gross production and reserve volumes (before deduction of Crown and other royalties); however, we also follow the United States practice of separately reporting reserve volumes on a net basis (after the deduction of royalties and similar payments). We also follow the Canadian practice of using forecast prices and costs when we estimate our reserves; whereas the SEC rules require that a 12-month average price, calculated as the unweighted arithmetic average of the first-day-of-the-month price for each month within the 12-month period prior to the end of the reporting period, be utilized.
We have included in this Annual Information Form estimates of proved and proved plus probable reserves. Probable reserves have a lower certainty of recovery than proved reserves. The SEC requires oil and gas issuers in their filings with the SEC to disclose only proved reserves but permits the optional disclosure of probable reserves. The SEC definitions of proved reserves and probable reserves are different than NI 51-101; therefore, proved, probable and proved plus probable reserves disclosed in this Annual Information Form may not be comparable to United States standards.
As a consequence of the foregoing, our reserve estimates and production volumes in this Annual Information Form may not be comparable to those made by companies utilizing United States reporting and disclosure standards.
We also included in this Annual Information Form estimates of contingent resources. Contingent resources represent the quantity of petroleum and natural gas estimated to be potentially recoverable from known accumulations using established technology or technology under development, but which do not currently qualify as reserves or commercially recoverable due to one or more contingencies. Contingencies may include factors such as economic, legal, environmental, political and regulatory matters or a lack of markets. The SEC does not permit the inclusion of estimates of resources in reports filed with it by United States companies.
There is additional taxation applicable to non-residents
The Tax Act imposes a withholding tax at the rate of 25% on the dividends or other property paid by us to Shareholders who are non-residents of Canada, unless the rate is reduced under the provisions of a tax treaty between Canada and the non-resident Shareholder's jurisdiction of residence. These taxes may change from time to time. Where the non-resident Shareholder is a United States resident entitled to benefits under the Canada-United States Income Tax Convention, 1980and is the beneficial owner of the dividends, the rate of Canadian withholding tax applicable to dividends is generally reduced to 15%. Additionally, the reduced rates of taxation on qualified dividend income under current U.S. tax
26
laws are scheduled to expire at the end of 2012 and there is no assurance that the reduced tax rates will be re-enacted in the future.
There is a foreign exchange risk for non-resident Shareholders
Our dividends are declared in Canadian dollars and converted to foreign denominated currencies at the spot exchange rate at the time of payment. As a consequence, investors are subject to foreign exchange risk. To the extent that the Canadian dollar strengthens with respect to their currency, the amount of the dividend will be reduced when converted to their home currency.
DESCRIPTION OF OUR BUSINESS AND OPERATIONS
Overview
Through our subsidiaries, we are engaged in the business of acquiring, developing, exploiting and holding interests in petroleum and natural gas properties and related assets in Canada (primarily in the provinces of British Columbia, Alberta and Saskatchewan) and in the United States (primarily in the states of North Dakota and Wyoming). We act as the primary financing vehicle for our subsidiaries by providing access to debt and equity capital markets. As at the date of this Annual Information Form, our primary assets are the shares of Baytex Energy that we own and the Notes. Cash flow from the business carried on by our subsidiaries is flowed to us by way of dividends and interest and principal repayments on the Notes.
We pay monthly cash dividends to holders of our Common Shares in accordance with our dividend policy. In the event that we do not comply with covenants under the Credit Facilities and the Debenture Indenture, our ability to pay dividends to Shareholders may be restricted. See "Description of Capital Structure — Dividend Policy".
Baytex Energy Ltd.
Baytex Energy is a corporation amalgamated under the ABCA and is actively engaged in the business of oil and natural gas exploration, exploitation, development, acquisition and production in Canada. Baytex Energy acts as the managing partner of Baytex Partnership. Baytex Energy is a wholly-owned subsidiary of the Corporation.
Baytex Energy Partnership
Baytex Partnership is a general partnership governed by the laws of the Province of Alberta. As at the date of this Annual Information Form, the partners of Baytex Partnership are Baytex Energy, Baytex Holdings Limited Partnership and Baytex Oil & Gas Ltd. Baytex Partnership holds the material operating assets in Canada from which we generate cash flow.
Baytex Energy USA Ltd.
Baytex USA is a corporation incorporated under the laws of the State of Colorado and is actively engaged in the business of oil and natural gas exploration, exploitation, development, acquisition and production in the United States. Baytex USA holds all of the operating assets in the United States from which we generate cash flow. Baytex USA is a wholly-owned subsidiary of Baytex Energy.
Personnel
As at December 31, 2011, we had 159 employees in our Calgary head office, 18 employees in our Denver office and 52 employees in our field operations.
27
Notes
From time to time we advance funds to our subsidiaries which are evidenced by promissory notes. The terms of the notes are set at the time of issue. All of these advances are subordinate to all senior indebtedness to our senior lenders.
Statement of Reserves Data and Other Oil and Natural Gas Information
The statement of reserves data and other oil and natural gas information set forth below is dated December 31, 2011. The statement is effective as of December 31, 2011 and the preparation date of the statement by Sproule is March 7, 2012. The Report of Management and Directors on Oil and Gas Disclosure in Form 51-101F3 and the Report on Reserves Data by Sproule in Form 51-101F2 are attached as Appendices A and B to this Annual Information Form.
Disclosure of Reserves Data
The reserves data set forth below is based upon an evaluation by Sproule with an effective date of December 31, 2011 as contained in the Sproule Report. The reserves data summarizes our crude oil, natural gas liquids and natural gas reserves and the net present values of future net revenue for these reserves using forecast prices and costs, not including the impact of any hedging activities. The Sproule Report has been prepared in accordance with the standards contained in the COGE Handbook and the reserve definitions contained in NI 51-101. Sproule was engaged by us to provide an evaluation of our proved and proved plus probable reserves and no attempt was made to evaluate possible reserves. See also "Definitions and Other Notes to Reserve Data Tables" below.
Our reserves are located in Canada, specifically in the provinces of Alberta, British Columbia and Saskatchewan, and in the United States, specifically in the states of North Dakota and Wyoming.
All evaluations of future net revenue are after the deduction of future income tax expenses (unless otherwise noted in the tables), royalties, development costs, production costs and well abandonment costs but before consideration of indirect costs such as administrative, overhead and other miscellaneous expenses. The estimated future net revenue contained in the following tables does not necessarily represent the fair market value of our reserves. There is no assurance that the forecast price and cost assumptions contained in the Sproule Report will be attained and variations could be material. Other assumptions and qualifications relating to costs and other matters are summarized in the notes to or following the tables below. The recovery and reserve estimates described herein are estimates only and there is no guarantee that the estimated reserves will be recovered. Readers should review the definitions and information contained in "Definitions and Notes to Reserves Data Tables" in conjunction with the following tables and notes. For more information as to the risks involved, see "Risk Factors".
28
SUMMARY OF OIL AND NATURAL GAS RESERVES
AS OF DECEMBER 31, 2011
FORECAST PRICES AND COSTS
CANADA
| | | | | | | | | | | | | | | | | | | |
| | LIGHT AND MEDIUM OIL | | HEAVY OIL | | NATURAL GAS LIQUIDS | |
|---|
RESERVES CATEGORY | | Gross
(Mbbl) | | Net
(Mbbl) | | Gross
(Mbbl) | | Net
(Mbbl) | | Gross
(Mbbl) | | Net
(Mbbl) | |
|---|
PROVED: | | | | | | | | | | | | | | | | | | | |
Developed Producing | | | 4,746.3 | | | 3,945.7 | | | 41,739.7 | | | 34,948.7 | | | 1,844.5 | | | 1,321.8 | |
Developed Non-Producing | | | 425.7 | | | 355.5 | | | 12,355.8 | | | 10,329.3 | | | 110.5 | | | 76.6 | |
Undeveloped | | | 5,180.1 | | | 4,531.4 | | | 53,998.1 | | | 46,471.3 | | | 986.4 | | | 716.9 | |
| | | | | | | | | | | | | | |
TOTAL PROVED | | | 10,352.1 | | | 8,832.6 | | | 108,093.6 | | | 91,749.3 | | | 2,941.4 | | | 2,115.3 | |
PROBABLE | | | 7,039.6 | | | 6,028.3 | | | 71,150.6 | | | 59,169.0 | | | 1,528.7 | | | 1,091.5 | |
| | | | | | | | | | | | | | |
TOTAL PROVED PLUS PROBABLE | | | 17,391.6 | | | 14,860.9 | | | 179,244.2 | | | 150,918.3 | | | 4,470.1 | | | 3,206.8 | |
| | | | | | | | | | | | | | |
| | | | | | | | | | | | | | | | | | | |
| | NATURAL GAS | | TOTAL RESERVES | |
| |
| |
|---|
RESERVES CATEGORY | | Gross
(MMcf) | | Net
(MMcf) | | Gross
(Mboe) | | Net
(Mboe) | |
| |
| |
|---|
PROVED: | | | | | | | | | | | | | | | | | | | |
Developed Producing | | | 55,159 | | | 47,679 | | | 57,523.7 | | | 48,162.7 | | | | | | | |
Developed Non-Producing | | | 3,432 | | | 2,890 | | | 13,464.0 | | | 11,243.1 | | | | | | | |
Undeveloped | | | 16,978 | | | 13,306 | | | 62,994.3 | | | 53,937.3 | | | | | | | |
| | | | | | | | | | | | | | | | |
TOTAL PROVED | | | 75,569 | | | 63,876 | | | 133,981.9 | | | 113,343.2 | | | | | | | |
PROBABLE | | | 34,281 | | | 28,218 | | | 85,432.4 | | | 70,991.8 | | | | | | | |
| | | | | | | | | | | | | | | | |
TOTAL PROVED PLUS PROBABLE | | | 109,850 | | | 92,094 | | | 219,414.2 | | | 184,335.0 | | | | | | | |
| | | | | | | | | | | | | | | | |
UNITED STATES
| | | | | | | | | | | | | | | | | | | |
| | LIGHT AND MEDIUM OIL | | HEAVY OIL | | NATURAL GAS LIQUIDS | |
|---|
RESERVES CATEGORY | | Gross
(Mbbl) | | Net
(Mbbl) | | Gross
(Mbbl) | | Net
(Mbbl) | | Gross
(Mbbl) | | Net
(Mbbl) | |
|---|
PROVED: | | | | | | | | | | | | | | | | | | | |
Developed Producing | | | 3,672.6 | | | 3,008.8 | | | — | | | — | | | — | | | — | |
Developed Non-Producing | | | 380.0 | | | 308.8 | | | — | | | — | | | — | | | — | |
Undeveloped | | | 13,819.3 | | | 11,560.7 | | | — | | | — | | | 2,824.9 | | | 2,415.3 | |
| | | | | | | | | | | | | | |
TOTAL PROVED | | | 17,871.9 | | | 14,878.4 | | | — | | | — | | | 2,824.9 | | | 2,415.3 | |
PROBABLE | | | 7,970.7 | | | 6,627.6 | | | — | | | — | | | 1,327.9 | | | 1,135.3 | |
| | | | | | | | | | | | | | |
TOTAL PROVED PLUS PROBABLE | | | 25,842.5 | | | 21,506.0 | | | — | | | — | | | 4,152.8 | | | 3,550.6 | |
| | | | | | | | | | | | | | |
29
| | | | | | | | | | | | | | | | | | | |
| | NATURAL GAS | | TOTAL RESERVES | |
| |
| |
|---|
RESERVES CATEGORY | | Gross
(MMcf) | | Net
(MMcf) | | Gross
(Mboe) | | Net
(Mboe) | |
| |
| |
|---|
PROVED: | | | | | | | | | | | | | | | | | | | |
Developed Producing | | | 167 | | | 136 | | | 3,700.4 | | | 3,031.5 | | | | | | | |
Developed Non-Producing | | | — | | | — | | | 380.0 | | | 308.8 | | | | | | | |
Undeveloped | | | 11,133 | | | 9,519 | | | 18,499.7 | | | 15,562.5 | | | | | | | |
| | | | | | | | | | | | | | | | |
TOTAL PROVED | | | 11,300 | | | 9,655 | | | 22,580.1 | | | 18,902.9 | | | | | | | |
PROBABLE | | | 5,291 | | | 4,522 | | | 10,180.4 | | | 8,516.6 | | | | | | | |
| | | | | | | | | | | | | | | | |
TOTAL PROVED PLUS PROBABLE | | | 16,592 | | | 14,177 | | | 32,760.6 | | | 27,419.5 | | | | | | | |
| | | | | | | | | | | | | | | | |
TOTAL
| | | | | | | | | | | | | | | | | | | |
| | LIGHT AND MEDIUM OIL | | HEAVY OIL | | NATURAL GAS LIQUIDS | |
|---|
RESERVES CATEGORY | | Gross
(Mbbl) | | Net
(Mbbl) | | Gross
(Mbbl) | | Net
(Mbbl) | | Gross
(Mbbl) | | Net
(Mbbl) | |
|---|
PROVED: | | | | | | | | | | | | | | | | | | | |
Developed Producing | | | 8,418.9 | | | 6,954.6 | | | 41,739.7 | | | 34,948.7 | | | 1,844.5 | | | 1,321.8 | |
Developed Non-Producing | | | 805.6 | | | 664.3 | | | 12,355.8 | | | 10,329.3 | | | 110.5 | | | 76.6 | |
Undeveloped | | | 18,999.4 | | | 16,092.1 | | | 53,998.1 | | | 46,471.3 | | | 3,811.3 | | | 3,132.2 | |
| | | | | | | | | | | | | | |
TOTAL PROVED | | | 28,223.9 | | | 23,710.9 | | | 108,093.6 | | | 91,749.3 | | | 5,766.3 | | | 4,530.6 | |
PROBABLE | | | 15,010.3 | | | 12,655.9 | | | 71,150.6 | | | 59,169.0 | | | 2,856.5 | | | 2,226.9 | |
| | | | | | | | | | | | | | |
TOTAL PROVED PLUS PROBABLE | | | 43,234.2 | | | 36,366.8 | | | 179,244.2 | | | 150,918.3 | | | 8,622.9 | | | 6,757.4 | |
| | | | | | | | | | | | | | |
| | | | | | | | | | | | | | | | | | | |
| | NATURAL GAS | | TOTAL RESERVES | |
| |
| |
|---|
RESERVES CATEGORY | | Gross
(MMcf) | | Net
(MMcf) | | Gross
(Mboe) | | Net
(Mboe) | |
| |
| |
|---|
PROVED: | | | | | | | | | | | | | | | | | | | |
Developed Producing | | | 55,326 | | | 47,815 | | | 61,224.1 | | | 51,194.3 | | | | | | | |
Developed Non-Producing | | | 3,432 | | | 2,890 | | | 13,843.9 | | | 11,551.9 | | | | | | | |
Undeveloped | | | 28,112 | | | 22,825 | | | 81,494.1 | | | 69,499.8 | | | | | | | |
| | | | | | | | | | | | | | | | |
TOTAL PROVED | | | 86,870 | | | 73,531 | | | 156,562.1 | | | 132,246.0 | | | | | | | |
PROBABLE | | | 39,572 | | | 32,740 | | | 95,612.7 | | | 79,508.5 | | | | | | | |
| | | | | | | | | | | | | | | | |
TOTAL PROVED PLUS PROBABLE | | | 126,442 | | | 106,271 | | | 252,174.8 | | | 211,754.5 | | | | | | | |
| | | | | | | | | | | | | | | | |
30
SUMMARY OF NET PRESENT VALUES OF FUTURE NET REVENUE
AS OF DECEMBER 31, 2011
FORECAST PRICES AND COSTS
CANADA
| | | | | | | | | | | | | | | | |
| | BEFORE INCOME TAXES DISCOUNTED AT (%/year) | |
|---|
RESERVES CATEGORY | | 0%
($000s) | | 5%
($000s) | | 10%
($000s) | | 15%
($000s) | | 20%
($000s) | |
|---|
PROVED: | | | | | | | | | | | | | | | | |
Developed Producing | | | 2,068,777 | | | 1,754,438 | | | 1,540,278 | | | 1,384,356 | | | 1,265,207 | |
Developed Non-Producing | | | 493,250 | | | 375,084 | | | 294,198 | | | 236,801 | | | 194,805 | |
Undeveloped | | | 2,109,414 | | | 1,494,155 | | | 1,099,290 | | | 837,308 | | | 655,231 | |
| | | | | | | | | | | | |
TOTAL PROVED | | | 4,671,441 | | | 3,623,677 | | | 2,933,766 | | | 2,458,465 | | | 2,115,243 | |
PROBABLE | | | 3,339,190 | | | 2,144,653 | | | 1,492,851 | | | 1,101,823 | | | 849,827 | |
| | | | | | | | | | | | |
TOTAL PROVED PLUS PROBABLE | | | 8,010,631 | | | 5,768,330 | | | 4,426,617 | | | 3,560,288 | | | 2,965,070 | |
| | | | | | | | | | | | |
UNITED STATES
| | | | | | | | | | | | | | | | |
RESERVES CATEGORY | |
| |
| |
| |
| |
| |
|---|
PROVED: | | | | | | | | | | | | | | | | |
Developed Producing | | | 176,373 | | | 131,627 | | | 106,529 | | | 90,611 | | | 79,623 | |
Developed Non-Producing | | | 17,940 | | | 13,293 | | | 10,651 | | | 8,948 | | | 7,756 | |
Undeveloped | | | 597,163 | | | 310,136 | | | 174,935 | | | 102,098 | | | 59,361 | |
| | | | | | | | | | | | |
TOTAL PROVED | | | 791,475 | | | 455,056 | | | 292,115 | | | 201,657 | | | 146,740 | |
PROBABLE | | | 545,716 | | | 198,609 | | | 97,531 | | | 56,470 | | | 35,542 | |
| | | | | | | | | | | | |
TOTAL PROVED PLUS PROBABLE | | | 1,337,191 | | | 653,665 | | | 389,646 | | | 258,127 | | | 182,281 | |
| | | | | | | | | | | | |
TOTAL
| | | | | | | | | | | | | | | | |
RESERVES CATEGORY | |
| |
| |
| |
| |
| |
|---|
PROVED: | | | | | | | | | | | | | | | | |
Developed Producing | | | 2,245,149 | | | 1,886,065 | | | 1,646,807 | | | 1,474,966 | | | 1,344,829 | |
Developed Non-Producing | | | 511,190 | | | 388,377 | | | 304,848 | | | 245,749 | | | 202,561 | |
Undeveloped | | | 2,706,576 | | | 1,804,291 | | | 1,274,225 | | | 939,406 | | | 714,592 | |
| | | | | | | | | | | | |
TOTAL PROVED | | | 5,462,915 | | | 4,078,732 | | | 3,225,881 | | | 2,660,122 | | | 2,261,982 | |
PROBABLE | | | 3,884,906 | | | 2,343,263 | | | 1,590,382 | | | 1,158,294 | | | 885,369 | |
| | | | | | | | | | | | |
TOTAL PROVED PLUS PROBABLE | | | 9,347,822 | | | 6,421,995 | | | 4,816,263 | | | 3,818,415 | | | 3,147,351 | |
| | | | | | | | | | | | |
31
SUMMARY OF NET PRESENT VALUES OF FUTURE NET REVENUE
AS OF DECEMBER 31, 2011
FORECAST PRICES AND COSTS
CANADA
| | | | | | | | | | | | | | | | |
| | AFTER INCOME TAXES DISCOUNTED AT (%/year) | |
|---|
RESERVES CATEGORY | | 0%
($000s) | | 5%
($000s) | | 10%
($000s) | | 15%
($000s) | | 20%
($000s) | |
|---|
PROVED: | | | | | | | | | | | | | | | | |
Developed Producing | | | 1,531,164 | | | 1,298,209 | | | 1,139,767 | | | 1,024,596 | | | 936,723 | |
Developed Non-Producing | | | 355,176 | | | 268,970 | | | 210,204 | | | 168,641 | | | 138,315 | |
Undeveloped | | | 1,563,681 | | | 1,085,981 | | | 783,020 | | | 582,733 | | | 443,936 | |
| | | | | | | | | | | | |
TOTAL PROVED | | | 3,450,020 | | | 2,653,160 | | | 2,132,991 | | | 1,775,971 | | | 1,518,974 | |
PROBABLE | | | 2,468,655 | | | 1,579,698 | | | 1,092,536 | | | 800,434 | | | 612,572 | |
| | | | | | | | | | | | |
TOTAL PROVED PLUS PROBABLE | | | 5,918,675 | | | 4,232,858 | | | 3,225,527 | | | 2,576,405 | | | 2,131,546 | |
| | | | | | | | | | | | |
UNITED STATES
| | | | | | | | | | | | | | | | |
RESERVES CATEGORY | |
| |
| |
| |
| |
| |
|---|
PROVED: | | | | | | | | | | | | | | | | |
Developed Producing | | | 167,377 | | | 124,931 | | | 101,123 | | | 86,023 | | | 75,601 | |
Developed Non-Producing | | | 17,016 | | | 12,607 | | | 10,099 | | | 8,483 | | | 7,352 | |
Undeveloped | | | 469,957 | | | 247,910 | | | 141,122 | | | 82,469 | | | 47,475 | |
| | | | | | | | | | | | |
TOTAL PROVED | | | 654,349 | | | 385,447 | | | 252,343 | | | 176,975 | | | 130,429 | |
PROBABLE | | | 414,887 | | | 151,665 | | | 75,020 | | | 43,755 | | | 27,670 | |
| | | | | | | | | | | | |
TOTAL PROVED PLUS PROBABLE | | | 1,069,236 | | | 537,113 | | | 327,363 | | | 220,730 | | | 158,099 | |
| | | | | | | | | | | | |
TOTAL
| | | | | | | | | | | | | | | | |
RESERVES CATEGORY | |
| |
| |
| |
| |
| |
|---|
PROVED: | | | | | | | | | | | | | | | | |
Developed Producing | | | 1,698,541 | | | 1,423,140 | | | 1,240,890 | | | 1,110,619 | | | 1,012,324 | |
Developed Non-Producing | | | 372,192 | | | 281,577 | | | 220,303 | | | 177,124 | | | 145,667 | |
Undeveloped | | | 2,033,638 | | | 1,333,891 | | | 924,142 | | | 665,202 | | | 491,411 | |
| | | | | | | | | | | | |
TOTAL PROVED | | | 4,104,369 | | | 3,038,607 | | | 2,385,334 | | | 1,952,946 | | | 1,649,403 | |
PROBABLE | | | 2,883,542 | | | 1,731,363 | | | 1,167,556 | | | 844,189 | | | 640,242 | |
| | | | | | | | | | | | |
TOTAL PROVED PLUS PROBABLE | | | 6,987,911 | | | 4,769,971 | | | 3,552,890 | | | 2,797,135 | | | 2,289,645 | |
| | | | | | | | | | | | |
32
TOTAL FUTURE NET REVENUE (UNDISCOUNTED)
AS OF DECEMBER 31, 2011
FORECAST PRICES AND COSTS
| | | | | | | | | | | | | | | | | | | | | | | | | |
TOTAL PROVED RESERVES | | REVENUE
($000s) | | ROYALTIES
($000s) | | OPERATING
COSTS
($000s) | | DEVELOPMENT
COSTS
($000s) | | WELL
ABANDONMENT
COSTS
($000s) | | FUTURE NET
REVENUE
BEFORE INCOME
TAXES
($000s) | | INCOME
TAXES
($000s) | | FUTURE NET
REVENUE
AFTER INCOME
TAXES
($000s) | |
|---|
Canada | | | 9,773,531 | | | 1,406,703 | | | 2,770,607 | | | 772,540 | | | 152,242 | | | 4,671,441 | | | 1,221,421 | | | 3,450,020 | |
United States | | | 2,108,730 | | | 604,576 | | | 389,936 | | | 322,743 | | | — | | | 791,475 | | | 137,126 | | | 654,349 | |
| | | | | | | | | | | | | | | | | | |
Total | | | 11,882,260 | | | 2,011,279 | | | 3,160,544 | | | 1,095,283 | | | 152,242 | | | 5,462,915 | | | 1,358,547 | | | 4,104,369 | |
| | | | | | | | | | | | | | | | | | |
TOTAL PROVED PLUS PROBABLE RESERVES | | | | | | | | | | | | | | | | | | | | | | | | | |
Canada | | | 16,652,220 | | | 2,463,324 | | | 4,889,196 | | | 1,098,643 | | | 190,425 | | | 8,010,631 | | | 2,091,956 | | | 5,918,675 | |
United States | | | 3,359,387 | | | 965,500 | | | 681,782 | | | 374,915 | | | — | | | 1,337,191 | | | 267,956 | | | 1,069,236 | |
| | | | | | | | | | | | | | | | | | |
Total | | | 20,011,607 | | | 3,428,824 | | | 5,570,978 | | | 1,473,558 | | | 190,425 | | | 9,347,822 | | | 2,359,912 | | | 6,987,911 | |
| | | | | | | | | | | | | | | | | | |
33
FUTURE NET REVENUE BY PRODUCTION GROUP
AS OF DECEMBER 31, 2011
FORECAST PRICES AND COSTS
| | | | | | | | | |
RESERVES
CATEGORY | | PRODUCTION GROUP | | FUTURE NET REVENUE
BEFORE INCOME TAXES
(discounted at 10%/year)
($000s) | | UNIT VALUE
($/boe)(1) | |
|---|
| CANADA | | | | | | | | | |
Proved |
|
Light and Medium Crude Oil (including solution gas and other by-products) |
|
|
270,323 |
|
|
30.04 |
|
| | | Heavy Oil (including solution gas and other by-products) | | | 2,487,726 | | | 27.02 | |
| | | Natural Gas (including by-products but excluding natural gas from oil wells) | | | 175,717 | | | 14.30 | |
| | | | | | | | | |
| | | Total Canada | | | 2,933,766 | | | | |
| | | | | | | | | |
| Proved plus Probable | | Light and Medium Crude Oil (including solution gas and other by-products) | | | 401,609 | | | 26.68 | |
| | | Heavy Oil (including solution gas and other by-products) | | | 3,765,154 | | | 24.88 | |
| | | Natural Gas (including by-products but excluding natural gas from oil wells) | | | 259,855 | | | 14.46 | |
| | | | | | | | | |
| | | Total Canada | | | 4,426,618 | | | | |
| | | | | | | | | |
UNITED STATES |
|
|
|
|
|
|
|
|
|
Proved |
|
Light and Medium Crude Oil (including solution gas and other by-products) |
|
|
292,115 |
|
|
15.45 |
|
| | | Heavy Oil (including solution gas and other by-products) | | | — | | | — | |
| | | Natural Gas (including by-products but excluding natural gas from oil wells) | | | — | | | — | |
| | | | | | | | | |
| | | Total United States | | | 292,115 | | | | |
| | | | | | | | | |
| Proved plus Probable | | Light and Medium Crude Oil (including solution gas and other by-products) | | | 389,646 | | | 14.21 | |
| | | Heavy Oil (including solution gas and other by-products) | | | — | | | — | |
| | | Natural Gas (including by-products but excluding natural gas from oil wells) | | | — | | | — | |
| | | | | | | | | |
| | | Total United States | | | 389,646 | | | | |
| | | | | | | | | |
TOTAL |
|
|
|
|
|
|
|
|
|
Proved |
|
Light and Medium Crude Oil (including solution gas and other by-products) |
|
|
562,437 |
|
|
20.16 |
|
| | | Heavy Oil (including solution gas and other by-products) | | | 2,487,726 | | | 27.02 | |
| | | Natural Gas (including by-products but excluding natural gas from oil wells) | | | 175,717 | | | 14.30 | |
| | | | | | | | | |
| | | Total | | | 3,225,881 | | | | |
| | | | | | | | | |
| Proved plus Probable | | Light and Medium Crude Oil (including solution gas and other by-products) | | | 791,255 | | | 18.65 | |
| | | Heavy Oil (including solution gas and other by-products) | | | 3,765,154 | | | 24.88 | |
| | | Natural Gas (including by-products but excluding natural gas from oil wells) | | | 259,855 | | | 14.46 | |
| | | | | | | | | |
| | | Total | | | 4,816,264 | | | | |
| | | | | | | | | |
Note:
- (1)
- Unit values are based on net reserve volumes.
34
Definitions and Notes to Reserves Data Tables
In the tables set forth above under the subheading "Disclosure of Reserves Data" and elsewhere in this Annual Information Form the following definitions and other notes are applicable:
- 1.
- "Gross" means:
- (a)
- in relation to our interest in production and reserves, our interest (operating and non-operating) share before deduction of royalties and without including any of our royalty interests;
- (b)
- in relation to wells, the total number of wells in which we have an interest; and
- (c)
- in relation to properties, the total area of properties in which we have an interest.
- 2.
- "Net" means:
- (a)
- in relation to our interest in production and reserves, our interest (operating and non-operating) share after deduction of royalty obligations, plus our royalty interest in production or reserves;
- (b)
- in relation to wells, the number of wells obtained by aggregating our working interest in each of our gross wells; and
- (c)
- in relation to our interest in a property, the total area in which we have an interest multiplied by our working interest.
- 3.
- Definitions used for reserve categories are as follows:
Reserve Categories
Reserves are estimated remaining quantities of oil and natural gas and related substances anticipated to be recoverable from known accumulations, from a given date forward, based on
- (a)
- analysis of drilling, geological, geophysical and engineering data;
- (b)
- the use of established technology; and
- (c)
- specified economic conditions (see the discussion of "Economic Assumptions" below).
Reserves are classified according to the degree of certainty associated with the estimates.
- (a)
- Proved reserves are those reserves that can be estimated with a high degree of certainty to be recoverable. It is likely that the actual remaining quantities recovered will exceed the estimated proved reserves.
- (b)
- Probable reserves are those additional reserves that are less certain to be recovered than proved reserves. It is equally likely that the actual remaining quantities recovered will be greater or less than the sum of the estimated proved plus probable reserves.
- (c)
- "Economic Assumptions" will be the forecast prices and costs used in the estimate.
Development and Production Status
Each of the reserve categories (proved and probable) may be divided into developed and undeveloped categories:
- (a)
- Developed reserves are those reserves that are expected to be recovered from existing wells and installed facilities or, if facilities have not been installed, that would involve a low expenditure (for example, when compared to the cost of drilling a well) to put the reserves on production. The developed category may be subdivided into producing and non-producing.
35
- (i)
- Developed producing reserves are those reserves that are expected to be recovered from completion intervals open at the time of the estimate. These reserves may be currently producing or, if shut-in, they must have previously been on production, and the date of resumption of production must be known with reasonable certainty.
- (ii)
- Developed non-producing reserves are those reserves that either have not been on production, or have previously been on production, but are shut-in, and the date of resumption of production is unknown.
- (b)
- Undeveloped reserves are those reserves expected to be recovered from known accumulations where a significant expenditure (for example, when compared to the cost of drilling a well) is required to render them capable of production. They must fully meet the requirements of the reserves classification (proved, probable) to which they are assigned.
Levels of Certainty for Reported Reserves
The qualitative certainty levels referred to in the definitions above are applicable to individual reserve entities (which refers to the lowest level at which reserves calculations are performed) and to reported reserves (which refers to the highest level sum of individual entity estimates for which reserves are presented). Reported reserves should target the following levels of certainty under a specific set of economic conditions:
- (a)
- at least a 90 percent probability that the quantities actually recovered will equal or exceed the estimated proved reserves; and
- (b)
- at least a 50 percent probability that the quantities actually recovered will equal or exceed the sum of the estimated proved plus probable reserves.
A qualitative measure of the certainty levels pertaining to estimates prepared for the various reserves categories is desirable to provide a clearer understanding of the associated risks and uncertainties. However, the majority of reserves estimates will be prepared using deterministic methods that do not provide a mathematically derived quantitative measure of probability. In principle, there should be no difference between estimates prepared using probabilistic or deterministic methods.
- 4.
- "Exploratory well" means a well that is not a development well, a service well or a stratigraphic test well.
- 5.
- "Development costs" means costs incurred to obtain access to reserves and to provide facilities for extracting, treating, gathering and storing the oil and gas from reserves. More specifically, development costs, including applicable operating costs of support equipment and facilities and other costs of development activities, are costs incurred to:
- (a)
- gain access to and prepare well locations for drilling, including surveying well locations for the purpose of determining specific development drilling sites, clearing ground draining, road building, and relocating public roads, gas lines and power lines, pumping equipment and wellhead assembly;
- (b)
- drill and equip development wells, development type stratigraphic test wells and service wells, including the costs of platforms and of well equipment such as casing, tubing, pumping equipment and wellhead assembly;
- (c)
- acquire, construct and install production facilities such as flow lines, separators, treaters, heaters, manifolds, measuring devices and production storage tanks, natural gas cycling and processing plants, and central utility and waste disposal systems; and
- (d)
- provide improved recovery systems.
36
- 6.
- "Development well" means a well drilled inside the established limits of an oil and gas reservoir, or in close proximity to the edge of the reservoir, to the depth of a stratigraphic horizon known to be productive.
- 7.
- "Exploration costs" means costs incurred in identifying areas that may warrant examination and in examining specific areas that are considered to have prospects that may contain oil and gas reserves, including costs of drilling exploratory wells and exploratory type stratigraphic test wells. Exploration costs may be incurred both before acquiring the related property and after acquiring the property. Exploration costs, which include applicable operating costs of support equipment and facilities and other costs of exploration activities, are:
- (a)
- costs of topographical, geochemical, geological and geophysical studies, rights of access to properties to conduct those studies, and salaries and other expenses of geologists, geophysical crews and others conducting those studies;
- (b)
- costs of carrying and retaining unproved properties, such as delay rentals, taxes (other than income and capital taxes) on properties, legal costs for title defence, and the maintenance of land and lease records;
- (c)
- dry hole contributions and bottom hole contributions;
- (d)
- costs of drilling and equipping exploratory wells; and
- (e)
- costs of drilling exploratory type stratigraphic test wells.
- 8.
- "Service well" means a well drilled or completed for the purpose of supporting production in an existing field. Wells in this class are drilled for the following specific purposes: gas injection (natural gas, propane, butane or flue gas), water injection, steam injection, air injection, salt water disposal, water supply for injection, observation or injection for combustion.
- 9.
- "Forecast Prices and Costs"
- 10.
- Numbers may not add due to rounding.
- 11.
- The estimates of future net revenue presented in the tables above do not represent fair market value.
- 12.
- Consistent with last year, we have reported the estimates of our bitumen reserves with our heavy oil reserves. As the volume of bitumen reserves is relatively small compared to our volume of heavy oil reserves, this inclusion is permitted under NI 51-101 and COGE Handbook. This reporting is consistent in all of the reserves disclosure in this Annual Information Form.
In Canadian Securities Administrators Staff Notice 51-324, "Glossary to NI 51-101 Standards of Disclosure for Oil and Gas Activities" bitumen is defined as:
| | | | |
| | "A naturally occurring viscous mixture consisting mainly of pentanes and heavier hydrocarbons. Its viscosity is greater than 10,000 mPa-s (cp) measured at original temperature in the reservoir and atmospheric pressure, on a gas-free basis. Crude bitumen may contain sulphur and other non-hydrocarbon compounds."
| | |
37
Paragraphs 1.1(u) and 1.1(v) of NI 51-101 clarify that bitumen would be recovered by non-conventional oil and gas activities.
Almost all the oil we produce at Seal has a viscosity greater than 10,000 mPa-s (cp) measured at original temperature in the reservoir and atmospheric pressure, on a gas-free basis. We currently produce almost all of our oil at Seal by conventional oil and gas activities, drilling horizontal wells, recovering the oil by primary recovery, as the oil flows to our wells in its native state. Much of our oil produced by conventional oil and gas activities at Seal is classed as "ultra-heavy" oil for the purposes of paying Crown royalties. By calling this oil produced by conventional methods "heavy oil", we provide investors with a clearer and more logical description of our oil and gas activities.
We have classified the oil that would be produced from our non-conventional thermal in-situ projects at Seal as "bitumen". By calling this oil produced by non-conventional methods "bitumen", we provide investors with a clearer and more logical description of our oil and gas activities.
With respect to our permanent steam project at Seal, Alberta, as of December 31, 2011, Sproule attributed gross proved developed producing bitumen reserves of 1,583.6 Mbbl and gross proved undeveloped bitumen reserves of 6,892.1 Mbbl, which equates to gross total proved bitumen reserves of 8,475.7 Mbbl. As a comparison, as of December 31, 2010, Sproule attributed gross proved undeveloped bitumen reserves of 5,109.1 Mbbl to this project and there was no attribution to the proved developed producing category. As of December 31, 2011, Sproule attributed gross proved plus probable developed producing bitumen reserves of 3,292.9 Mbbl and gross proved plus probable undeveloped bitumen reserves of 29,626.9 Mbbl, which equates to gross total proved plus probable bitumen reserves of 32,919.8 Mbbl. As a comparison, as of December 31, 2010, Sproule attributed gross proved plus probable undeveloped bitumen reserves of 30,335.6 Mbbl to this project and there was no attribution to the proved plus probable developed producing category.
After deducting the volumes of gross bitumen reserves, Sproule's estimates of our total gross proved heavy oil reserves were 99,617.9 Mbbl, and its estimates of our total gross proved plus probable heavy oil reserves were 146,324.4 Mbbl as of December 31, 2011.
- 13.
- On March 11, 2010, the Alberta government announced changes to Alberta's royalty system intended to increase Alberta's competitiveness in the oil and gas industry, which included a decrease in the maximum royalty rates for conventional oil and natural gas production effective for the January 2011production month and certain temporary incentive programs currently in place being made permanent. See "Industry Conditions".
Pricing Assumptions
The forecast cost and price assumptions include increases in actual wellhead selling prices and take into account inflation with respect to future operating and capital costs. Crude oil, heavy oil, natural gas
38
and natural gas liquids benchmark reference pricing, as at December 31, 2011, inflation and exchange rates utilized in the Sproule Report were as follows:
SUMMARY OF PRICING AND INFLATION RATE ASSUMPTIONS
FORECAST PRICES AND COSTS AS AT DECEMBER 31, 2011
| | | | | | | | | | | | | | | | | | | |
| | OIL | | NATURAL GAS | |
| |
| |
|---|
| | WTI
Cushing
Oklahoma
($US/bbl) | | Edmonton
Par Price
40° API
($Cdn/bbl) | | Hardisty
Lloydblend
20.5° API
($Cdn/bbl) | | AECO-C
($Cdn/MMbtu) | | INFLATION
RATES(1)
%/year | | EXCHANGE
RATE(2)
($US/$Cdn) | |
|---|
Historical | | | | | | | | | | | | | | | | | | | |
2007 | | | 72.27 | | | 77.06 | | | 51.93 | | | 6.65 | | | 2.0 | | | 0.935 | |
2008 | | | 99.59 | | | 102.85 | | | 82.58 | | | 8.15 | | | 1.1 | | | 0.943 | |
2009 | | | 61.63 | | | 66.20 | | | 58.49 | | | 4.19 | | | 2.0 | | | 0.880 | |
2010 | | | 79.43 | | | 77.80 | | | 67.17 | | | 4.16 | | | 1.2 | | | 0.971 | |
2011 | | | 95.00 | | | 95.16 | | | 77.09 | | | 3.72 | | | 1.5 | | | 1.012 | |
Est Forecast | | | | | | | | | | | | | | | | | | | |
2012 | | | 98.07 | | | 96.87 | | | 82.34 | | | 3.16 | | | 2.0 | | | 1.012 | |
2013 | | | 94.90 | | | 93.75 | | | 79.69 | | | 3.78 | | | 2.0 | | | 1.012 | |
2014 | | | 92.00 | | | 90.89 | | | 77.25 | | | 4.13 | | | 2.0 | | | 1.012 | |
2015 | | | 97.42 | | | 96.23 | | | 81.80 | | | 5.53 | | | 2.0 | | | 1.012 | |
2016 | | | 99.37 | | | 98.16 | | | 83.44 | | | 5.65 | | | 2.0 | | | 1.012 | |
Thereafter | | | | | | | | | | | | Escalation Rate of 2%
| |
Notes:
- (1)
- Inflation rates for forecasting prices and costs.
- (2)
- Exchange rate used to generate the benchmark reference prices in this table.
Weighted average prices realized by us for the year ended December 31, 2011, excluding hedging activities, were $65.53/bbl for heavy oil, $82.49/bbl for light oil and NGL and $4.17/Mcf for natural gas.
39
RECONCILIATION OF
GROSS RESERVES
BY PRINCIPAL PRODUCT TYPE
FORECAST PRICES AND COSTS
| | | | | | | | | | | | | | | | | | | |
| | LIGHT AND MEDIUM OIL | | HEAVY OIL | |
|---|
CANADA | | Proved
(Mbbl) | | Probable
(Mbbl) | | Proved Plus
Probable
(Mbbl) | | Proved
(Mbbl) | | Probable
(Mbbl) | | Proved Plus
Probable
(Mbbl) | |
|---|
December 31, 2010 | | | 10,316.8 | | | 6,535.2 | | | 16,852.0 | | | 104,978.1 | | | 62,435.4 | | | 167,413.5 | |
Extensions | | | 2,726.6 | | | 2,443.4 | | | 5,170.0 | | | 9,477.0 | | | 7,929.4 | | | 17,406.4 | |
Improved Recovery | | | — | | | — | | | — | | | 3,191.0 | | | 3,409.2 | | | 6,600.2 | |
Technical Revisions | | | (729.8 | ) | | (1,066.4 | ) | | (1,796.2 | ) | | (2,872.5 | ) | | (6,701.1 | ) | | (9,573.6 | ) |
Discoveries | | | — | | | — | | | — | | | 51.3 | | | 16.9 | | | 68.2 | |
Acquisitions | | | — | | | — | | | — | | | 6,221.6 | | | 4,030.6 | | | 10,252.2 | |
Dispositions | | | (547.9 | ) | | (863.6 | ) | | (1,411.5 | ) | | — | | | — | | | — | |
Economic Factors | | | (33.3 | ) | | (9.1 | ) | | (42.4 | ) | | (85.8 | ) | | 30.2 | | | (55.6 | ) |
Production | | | (1,380.3 | ) | | — | | | (1,380.3 | ) | | (12,867.1 | ) | | — | | | (12,867.1 | ) |
| | | | | | | | | | | | | | |
December 31, 2011 | | | 10,352.1 | | | 7,039.6 | | | 17,391.6 | | | 108,093.6 | | | 71,150.6 | | | 179,244.2 | |
| | | | | | | | | | | | | | |
| | | | | | | | | | | | | | | | | | | |
| | ASSOCIATED, NON-ASSOCIATED
AND SOLUTION GAS | | NATURAL GAS LIQUIDS | |
|---|
CANADA | | Proved
(MMcf) | | Probable
(MMcf) | | Proved Plus
Probable
(MMcf) | | Proved
(Mbbl) | | Probable
(Mbbl) | | Proved Plus
Probable
(Mbbl) | |
|---|
December 31, 2010 | | | 78,182 | | | 33,580 | | | 111,762 | | | 2,824.6 | | | 1,215.2 | | | 4,039.8 | |
Extensions | | | 12,520 | | | 6,579 | | | 19,099 | | | 797.2 | | | 585.0 | | | 1,382.2 | |
Improved Recovery | | | 21 | | | 5 | | | 26 | | | — | | | — | | | — | |
Technical Revisions | | | (1,217 | ) | | (8,293 | ) | | (9,510 | ) | | (457.7 | ) | | (425.7 | ) | | (883.4 | ) |
Discoveries | | | — | | | — | | | — | | | — | | | — | | | — | |
Acquisitions | | | 8,565 | | | 3,348 | | | 11,913 | | | 457.9 | | | 173.1 | | | 631.0 | |
Dispositions | | | (240 | ) | | (13 | ) | | (253 | ) | | — | | | — | | | — | |
Economic Factors | | | (4,516 | ) | | (926 | ) | | (5,442 | ) | | (76.5 | ) | | (18.9 | ) | | (95.4 | ) |
Production | | | (17,745 | ) | | — | | | (17,745 | ) | | (604.1 | ) | | — | | | (604.1 | ) |
| | | | | | | | | | | | | | |
December 31, 2011 | | | 75,570 | | | 34,281 | | | 109,850 | | | 2,941.4 | | | 1,528.7 | | | 4,470.1 | |
| | | | | | | | | | | | | | |
40
| | | | | | | | | | |
| | OIL EQUIVALENT | |
|---|
CANADA | | Proved
(Mboe) | | Probable
(Mboe) | | Proved Plus
Probable
(Mboe) | |
|---|
December 31, 2010 | | | 131,149.8 | | | 75,782.3 | | | 206,932.3 | |
Extensions | | | 15,087.5 | | | 12,054.3 | | | 27,141.8 | |
Improved Recovery | | | 3,194.5 | | | 3,410.0 | | | 6,604.5 | |
Technical Revisions | | | (4,262.8 | ) | | (9,575.4 | ) | | (13,838.2 | ) |
Discoveries | | | 51.3 | | | 16.9 | | | 68.2 | |
Acquisitions | | | 8,107.0 | | | 4,761.7 | | | 12,868.7 | |
Dispositions | | | (587.9 | ) | | (865.8 | ) | | (1,453.7 | ) |
Economic Factors | | | (948.3 | ) | | (152.1 | ) | | (1,100.4 | ) |
Production | | | (17,809.0 | ) | | — | | | (17,809.0 | ) |
| | | | | | | | |
December 31, 2011 | | | 133,982.1 | | | 85,432.0 | | | 219,414.1 | |
| | | | | | | | |
| | | | | | | | | | | | | | | | | | | |
| | LIGHT AND MEDIUM OIL | | ASSOCIATED, NON-ASSOCIATED
AND SOLUTION GAS | |
|---|
UNITED STATES | | Proved
(Mbbl) | | Probable
(Mbbl) | | Proved Plus
Probable
(Mbbl) | | Proved
(MMcf) | | Probable
(MMcf) | | Proved Plus
Probable
(MMcf) | |
|---|
December 31, 2010 | | | 8,099.2 | | | 11,407.5 | | | 19,506.6 | | | 5,643 | | | 9,873 | | | 15,516 | |
Extensions | | | 6,035.3 | | | 2,855.2 | | | 8,890.5 | | | 2 | | | 1 | | | 3 | |
Improved Recovery | | | — | | | — | | | — | | | — | | | — | | | — | |
Technical Revisions | | | 4,227.9 | | | (6,281.2 | ) | | (2,053.3 | ) | | 5,678 | | | (4,578 | ) | | 1,100 | |
Discoveries | | | — | | | — | | | — | | | — | | | — | | | — | |
Acquisitions | | | — | | | — | | | — | | | — | | | — | | | — | |
Dispositions | | | — | | | — | | | — | | | — | | | — | | | — | |
Economic Factors | | | (4.4 | ) | | (10.8 | ) | | (15.2 | ) | | (4 | ) | | (4 | ) | | (8 | ) |
Production | | | (486.1 | ) | | — | | | (486.1 | ) | | (19 | ) | | — | | | (19 | ) |
| | | | | | | | | | | | | | |
December 31, 2011 | | | 17,871.9 | | | 7,970.6 | | | 25,842.5 | | | 11,300 | | | 5,292 | | | 16,592 | |
| | | | | | | | | | | | | | |
| | | | | | | | | | | | | | | | | | | |
| | NATURAL GAS LIQUIDS | | OIL EQUIVALENT | |
|---|
UNITED STATES | | Proved
(Mbbl) | | Probable
(Mbbl) | | Proved Plus
Probable
(Mbbl) | | Proved
(Mboe) | | Probable
(Mboe) | | Proved Plus
Probable
(Mboe) | |
|---|
December 31, 2010 | | | — | | | — | | | — | | | 9,039.7 | | | 13,052.9 | | | 22,092.6 | |
Extensions | | | — | | | — | | | — | | | 6,035.6 | | | 2,855.4 | | | 8,891.0 | |
Improved Recovery | | | — | | | — | | | — | | | — | | | — | | | — | |
Technical Revisions | | | 2,824.9 | | | 1,327.9 | | | 4,152.8 | | | 7,999.1 | | | (5,716.3 | ) | | 2,282.8 | |
Discoveries | | | — | | | — | | | — | | | — | | | — | | | — | |
Acquisitions | | | — | | | — | | | — | | | — | | | — | | | — | |
Dispositions | | | — | | | — | | | — | | | — | | | — | | | — | |
Economic Factors | | | — | | | — | | | — | | | (5.1 | ) | | (11.5 | ) | | (16.5 | ) |
Production | | | — | | | — | | | — | | | (489.3 | ) | | — | | | (489.3 | ) |
| | | | | | | | | | | | | | |
December 31, 2011 | | | 2,824.9 | | | 1,327.9 | | | 4,152.8 | | | 22,580.1 | | | 10,180.5 | | | 32,760.6 | |
| | | | | | | | | | | | | | |
41
| | | | | | | | | | | | | | | | | | | |
| | LIGHT AND MEDIUM OIL | | HEAVY OIL | |
|---|
TOTAL | | Proved
(Mbbl) | | Probable
(Mbbl) | | Proved Plus
Probable
(Mbbl) | | Proved
(Mbbl) | | Probable
(Mbbl) | | Proved Plus
Probable
(Mbbl) | |
|---|
December 31, 2010 | | | 18,416.0 | | | 17,942.7 | | | 36,358.7 | | | 104,978.1 | | | 62,435.4 | | | 167,413.5 | |
Extensions | | | 8,761.9 | | | 5,298.6 | | | 14,060.5 | | | 9,477.0 | | | 7,929.4 | | | 17,406.4 | |
Improved Recovery | | | — | | | — | | | — | | | 3,191.0 | | | 3,409.2 | | | 6,600.2 | |
Technical Revisions | | | 3,498.1 | | | (7,347.7 | ) | | (3,849.6 | ) | | (2,872.5 | ) | | (6,701.1 | ) | | (9,573.6 | ) |
Discoveries | | | — | | | — | | | — | | | 51.3 | | | 16.9 | | | 68.2 | |
Acquisitions | | | — | | | — | | | — | | | 6,221.6 | | | 4,030.6 | | | 10,252.2 | |
Dispositions | | | (547.9 | ) | | (863.6 | ) | | 1,411.5 | ) | | — | | | — | | | — | |
Economic Factors | | | (37.7 | ) | | (19.9 | ) | | (57.6 | ) | | (85.8 | ) | | 30.2 | | | (55.6 | ) |
Production | | | (1,866.4 | ) | | — | | | (1,866.4 | ) | | (12,867.1 | ) | | — | | | (12,867.1 | ) |
| | | | | | | | | | | | | | |
December 31, 2011 | | | 28,223.9 | | | 15,010.3 | | | 43,234.2 | | | 108,093.6 | | | 71,150.6 | | | 179,244.2 | |
| | | | | | | | | | | | | | |
| | | | | | | | | | | | | | | | | | | |
| | ASSOCIATED, NON-ASSOCIATED
AND SOLUTION GAS | | NATURAL GAS LIQUIDS | |
|---|
TOTAL | | Proved
(MMcf) | | Probable
(MMcf) | | Proved Plus
Probable
(MMcf) | | Proved
(MMcf) | | Probable
(MMcf) | | Proved Plus
Probable
(MMcf) | |
|---|
December 31, 2010 | | | 83,825 | | | 43,453 | | | 127,278 | | | 2,824.6 | | | 1,215.2 | | | 4,039.8 | |
Extensions | | | 12,522 | | | 6,580 | | | 19,102 | | | 797.2 | | | 585.0 | | | 1,382.2 | |
Improved Recovery | | | 21 | | | 5 | | | 26 | | | — | | | — | | | — | |
Technical Revisions | | | 4,461 | | | (12,871 | ) | | (8,410 | ) | | 2,367.2 | | | 902.2 | | | 3,269.4 | |
Discoveries | | | — | | | — | | | — | | | — | | | — | | | — | |
Acquisitions | | | 8,565 | | | 3,348 | | | 11,913 | | | 457.9 | | | 173.1 | | | 631.0 | |
Dispositions | | | (240 | ) | | (13 | ) | | (253 | ) | | — | | | — | | | — | |
Economic Factors | | | (4,520 | ) | | (930 | ) | | (5,450 | ) | | (76.5 | ) | | (18.9 | ) | | (95.4 | ) |
Production | | | (17,764 | ) | | — | | | (17,764 | ) | | (604.1 | ) | | — | | | (604.1 | ) |
| | | | | | | | | | | | | | |
December 31, 2011 | | | 86,870 | | | 39,572 | | | 126,442 | | | 5,766.3 | | | 2,856.5 | | | 8,622.9 | |
| | | | | | | | | | | | | | |
| | | | | | | | | | |
| | OIL EQUIVALENT | |
|---|
TOTAL | | Proved
(Mboe) | | Probable
(Mboe) | | Proved Plus
Probable
(Mboe) | |
|---|
December 31, 2010 | | | 140,189.5 | | | 88,835.4 | | | 229,025.0 | |
Extensions | | | 21,123.1 | | | 14,909.7 | | | 36,032.8 | |
Improved Recovery | | | 3,194.5 | | | 3,410.0 | | | 6,604.5 | |
Technical Revisions | | | 3,736.3 | | | (15,291.7 | ) | | (11,555.4 | ) |
Discoveries | | | 51.3 | | | 16.9 | | | 68.2 | |
Acquisitions | | | 8,107.0 | | | 4,761.7 | | | 12,868.7 | |
Dispositions | | | (587.9 | ) | | (865.8 | ) | | (1,453.7 | ) |
Economic Factors | | | (953.3 | ) | | (163.6 | ) | | (1,116.9 | ) |
Production | | | (18,298.3 | ) | | — | | | (18,298.3 | ) |
| | | | | | | | |
December 31, 2011 | | | 156,562.2 | | | 95,612.5 | | | 252,174.8 | |
| | | | | | | | |
42
Additional Information Relating to Reserves Data
Undeveloped Reserves
Undeveloped reserves are attributed by Sproule in accordance with standards and procedures contained in the COGE Handbook. Proved undeveloped reserves are those reserves that can be estimated with a high degree of certainty and are expected to be recovered from known accumulations where a significant expenditure is required to render them capable of production. Probable undeveloped reserves are those reserves that are less certain to be recovered than proved reserves and are expected to be recovered from known accumulations where a significant expenditure is required to render them capable of production.
Our operating budget typically allocates approximately two-thirds of our expected funds from operations to capital expenditures related to exploration and development activities. We allocate development capital to our assets in an efficient and disciplined process. We reduce risk by technically assessing the results of each of our development programs before committing additional capital. This disciplined approach to investing in development means that in most cases it will take longer than two years to develop our proved undeveloped and probable undeveloped reserves. We plan to develop the majority of our proved undeveloped reserves and probable undeveloped reserves over the next six years.
Our capital spending on development projects is budgeted annually for each of our business units. Once a development program is executed, we measure and analyze the results of that capital investment, make any changes to the program that are necessary, and then repeat the process until all economic oil and gas reserves are developed. There are a number of factors that could result in delayed or cancelled development, including the following: (i) changing economic conditions (due to pricing, operating and capital expenditure fluctuations); (ii) changing technical conditions (including production anomalies, such as water breakthrough or accelerated depletion); (iii) multi-zone developments (for instance, a prospective formation completion may be delayed until the initial completion is no longer economic); (iv) a larger development program may need to be spread out over several years to optimize capital allocation and facility utilization; and (v) surface access issues (including those relating to land owners, weather conditions and regulatory approvals). For more information, see "Risk Factors".
Proved Undeveloped Reserves
The following table discloses, for each product type, the volumes of proved undeveloped reserves that were attributed in each of the most recent three financial years and, in the aggregate, before that time.
| | | | | | | | | | | | | | | | | | | | | | | | | |
| | Light and Medium Oil
Gross (Mbbl) | | Heavy Oil
Gross (Mbbl) | | NGLs
Gross (Mbbl) | | Natural Gas
Gross (MMcf) | |
|---|
Year | | First
Attributed | | Booked at
Year End | | First
Attributed | | Booked at
Year End | | First
Attributed | | Booked at
Year End | | First
Attributed | | Booked at
Year End | |
|---|
Prior | | | 6,909.2 | | | 14,730.0 | | | 48,554.8 | | | 154,458.8 | | | 925.8 | | | 2,383.4 | | | 25,863 | | | 75,326 | |
2009 | | | 1,874.4 | | | 8,002.4 | | | 18,084.9 | | | 49,363.0 | | | 106.1 | | | 312.9 | | | 3,123 | | | 9,331 | |
2010 | | | 4,412.8 | | | 10,771.4 | | | 17,548.8 | | | 54,617.6 | | | 156.4 | | | 430.4 | | | 5,353 | | | 13,717 | |
2011 | | | 6,838.6 | | | 18,999.4 | | | 9,725.6 | | | 53,998.0 | | | 3,594.3 | | | 3,811.3 | | | 17,061 | | | 28,112 | |
Sproule assigned reserves to a total of 827 well locations to the proved undeveloped reserve category, of which 576 are located on our Canadian heavy oil properties. With respect to the heavy oil locations, 551 are primary locations which are scheduled to be drilled over the next twelve years and 25 are thermal locations at Seal which are scheduled to be drilled over the next four years. Sixty-four (64) of the proved undeveloped locations are located on our Canadian light oil and natural gas properties and are scheduled to be drilled over the next four years. The remaining 187 proved undeveloped locations
43
are in the United States within Divide County, North Dakota and are scheduled to be drilled over the next five years. Each of the 827 locations with a proved undeveloped reserves assignment has a probable undeveloped reserves assignment too.
It would not be prudent from both a financial and technical perspective for us to develop all of our proved undeveloped reserves over the next two years. Our operating budget typically allocates approximately two-thirds of expected funds from operations to exploration and development activities. This restricts the number of development wells we drill in any given year. Not all of the development wells that we drill in any given year are contained within the Sproule defined proved undeveloped inventory. At our current pace of investment and drilling it will take approximately five years to develop all the currently identified proved undeveloped reserves in the Sproule Report.
Probable Undeveloped Reserves
The following table discloses, for each product type, the volumes of probable undeveloped reserves that were first attributed in each of the most recent three financial years and, in the aggregate, before that time.
| | | | | | | | | | | | | | | | | | | | | | | | | |
| | Light and Medium Oil
Gross (Mbbl) | | Heavy Oil
Gross (Mbbl) | | NGLs
Gross (Mbbl) | | Natural Gas
Gross (MMcf) | |
|---|
Year | | First
Attributed | | Booked at
Year End | | First
Attributed | | Booked at
Year End | | First
Attributed | | Booked at
Year End | | First
Attributed | | Booked at
Year End | |
|---|
Prior | | | 6,915.0 | | | 9,683.8 | | | 30,218.0 | | | 86,073.7 | | | 1,260.8 | | | 1,950.3 | | | 25,093 | | | 50,948 | |
2009 | | | 3,457.1 | | | 7,518.2 | | | 19,426.4 | | | 31,494.5 | | | 135.4 | | | 368.2 | | | 4,444 | | | 11,210 | |
2010 | | | 9,459.4 | | | 14,845.8 | | | 18,202.5 | | | 46,859.2 | | | 99.7 | | | 325.0 | | | 8,236 | | | 17,212 | |
2011 | | | 5,269.5 | | | 11,435.4 | | | 12,971.9 | | | 51,344.2 | | | 1,912.1 | | | 2,116.1 | | | 8,666 | | | 16,794 | |
In addition to those locations with proved undeveloped reserves, Sproule assigned reserves to a total of 265 well locations with probable undeveloped reserves only. None of these 265 locations have any proved undeveloped reserves assigned to them. Of these locations with probable undeveloped reserves only, 102 are located on our Canadian heavy oil properties. With respect to the heavy oil locations, 71 are primary locations which are scheduled to be drilled over the next eight years and 31 are thermal locations at Seal which are scheduled to be drilled over the next seven years. One hundred and twenty-four (124) of the probable undeveloped locations are located on our Canadian light oil and natural gas properties and are scheduled to be drilled over the next five years. The remaining 39 probable undeveloped locations are in the United States within Divide County, North Dakota and are scheduled to be drilled over the next two years. The table entitled "Probable Undeveloped Reserves" shows the probable undeveloped reserves for all of our locations, including the 827 locations with both a proved and probable undeveloped assignment, and those 265 locations with a probable undeveloped assignment only.
For the same reasons given above, we will not develop all of our probable undeveloped reserves over the next two years. Our operating budget typically allocates approximately two-thirds of our expected funds from operations to exploration and development activities. This restricts the number of development wells we drill in any given year. Not all of the development wells that we drill in any given year are contained within the Sproule defined proved undeveloped or probable undeveloped inventory. At our current pace of investment and drilling it will take approximately six years to develop all the currently identified probable undeveloped reserves.
Significant Factors or Uncertainties
We have a significant amount of proved non-producing and proved undeveloped reserves assigned to our Canadian heavy oil properties located in the Province of Saskatchewan and at our Seal, Ardmore
44
and Cold Lake heavy oil properties located in the Province of Alberta. Our conventional light oil and gas properties in Stoddart, British Columbia, the Pembina and Ferrier areas of Alberta and Divide County, North Dakota, USA also contain a significant quantity of proved non-producing and proved undeveloped reserves. As well, we have a significant amount of probable non-producing and probable undeveloped reserves assigned to these same properties. At the current prices, these development activities are expected to be economic. However, should oil and natural gas prices fall materially, these activities may not be economic and we could defer their implementation. In addition, reserves can be affected significantly by fluctuations in capital expenditures, operating costs, royalty regimes, and well performance that are beyond our control and which could impact our development decisions. See also "Risk Factors".
Future Development Costs
The following table sets forth development costs deducted in the estimation of the future net revenue attributable to the reserve categories noted below (using forecast prices and costs).
| | | | | | | | | | | | | | | | | | | |
| | CANADA | | UNITED STATES | | TOTAL | |
|---|
($000s) | | Proved
Reserves | | Proved plus
Probable
Reserves | | Proved
Reserves | | Proved plus
Probable
Reserves | | Proved
Reserves | | Proved plus
Probable
Reserves | |
|---|
2012 | | | 208,687 | | | 248,672 | | | 11,187 | | | 38,574 | | | 219,874 | | | 287,245 | |
2013 | | | 223,025 | | | 285,339 | | | 42,670 | | | 67,456 | | | 265,695 | | | 352,796 | |
2014 | | | 126,071 | | | 199,984 | | | 89,200 | | | 89,200 | | | 215,271 | | | 289,184 | |
2015 | | | 61,125 | | | 144,985 | | | 93,202 | | | 93,202 | | | 154,327 | | | 238,187 | |
2016 | | | 41,360 | | | 85,496 | | | 86,483 | | | 86,483 | | | 127,843 | | | 171,979 | |
Remaining | | | 112,273 | | | 134,167 | | | — | | | — | | | 112,273 | | | 134,167 | |
| | | | | | | | | | | | | | |
Total
(undiscounted) | | | 772,540 | | | 1,098,643 | | | 322,743 | | | 374,915 | | | 1,095,283 | | | 1,473,558 | |
| | | | | | | | | | | | | | |
We expect to fund the development costs of our reserves through a combination of internally generated funds from operations, debt and equity financings. Our operating budget typically allocates approximately two-thirds of our expected funds from operations to exploration and development activities.
There can be no guarantee that funds will be available or that our Board of Directors will allocate funding to develop all of the reserves attributed in the Sproule Report. Failure to develop those reserves could have a negative impact on our future funds from operations.
The interest or other costs of external funding are not included in the reserves and future net revenue estimates set forth herein and would reduce reserves and future net revenue to some degree depending upon the funding sources utilized. We do not anticipate that interest or other funding costs would make development of any of these properties uneconomic.
Contingent Resource
We commissioned Sproule to conduct an assessment of contingent resource effective December 31, 2011on three of our oil resource plays: the Bluesky in the Seal area of Alberta, the Bakken/Three Forks in North Dakota and the Viking in the Redwater area of Alberta and the Kerrobert/Whiteside areas of Saskatchewan. We also commissioned McDaniel & Associates Consultants Ltd. ("McDaniel") to conduct an assessment of contingent resource effective December 31, 2011on certain heavy oil properties in Northeast Alberta.
45
Contingent resource represents the quantity of petroleum estimated to be potentially recoverable from known accumulations using established technology or technology under development, but which do not currently qualify as reserves or commercially recoverable due to one or more contingencies. Contingencies may include factors such as economic, legal, environmental, political and regulatory matters or a lack of markets.
For the total of these four plays, Sproule and McDaniel's estimate of contingent resource ranges from 560 million barrels of oil and bitumen in the "low estimate" (C1) to 1.2 billion barrels of oil and bitumen in the "high estimate" (C3), with a "best estimate" (C2) of 783 million barrels of oil and bitumen. Contingent resources are in addition to currently booked reserves.
The tables below summarize Sproule's estimate of gross reserves and Sproule and McDaniel's estimates of contingent resource for the four plays by geographic area and the net present value before tax of the future net revenue attributable to the contingent resource using forecast prices and costs.
SUMMARY OF CONTINGENT RESOURCES(1)
AS OF DECEMBER 31, 2011
FORECAST PRICES AND COSTS(2)
| | | | | | | | | | | | | |
| | Summary of Contingent Resources(1)
As of December 31, 2011
Forecast Prices and Costs(2) | |
|---|
| |
| | Contingent Resources (gross)(5)
As at Dec. 31, 2011 | |
|---|
| | Proved plus Probable
Gross Reserves(4)
As at Dec. 31, 2011 | |
|---|
(millions of barrels of oil equivalent and bitumen)(3) | | Low(6) | | Best(7) | | High(8) | |
|---|
Bluesky — Seal, Alberta | | | 92.9 | | | 438.8 | | | 531.0 | | | 776.9 | |
Mannville Group — Northeast Alberta | | | 4.0 | | | 69.6 | | | 130.1 | | | 201.8 | |
Bakken/Three Forks — North Dakota, USA | | | 32.4 | | | 47.3 | | | 110.5 | | | 204.9 | |
Viking — Redwater, Alberta | | | 3.6 | | | 4.2 | | | 9.3 | | | 18.0 | |
Viking — Kerrobert/Whiteside, Saskatchewan | | | 4.2 | | | 0.6 | | | 1.9 | | | 10.1 | |
| | | | | | | | | | |
Total | | | 137.1 | | | 560.4 | | | 782.9 | | | 1,211.7 | |
| | | | | | | | | | |
46
SUMMARY OF NET PRESENT VALUES OF
FUTURE NET REVENUES FROM CONTINGENT RESOURCES
AS OF DECEMBER 31, 2011
FORECAST PRICES AND COSTS(2)
| | | | | | | | | | | | | |
| | Summary of Net Present Values of Future Net Revenues
from Contingent Resources
As of December 31, 2011
Forecast Prices and Costs(2) | |
|---|
| | Before income taxes discounted at (%/year)(9) | |
|---|
| | 0% | | 5% | | 8% | | 10% | |
|---|
| | ($ millions)
| |
|---|
Low estimate (C1)(6) | | | | | | | | | | | | | |
Bluesky — Seal, Alberta | | | 13,596.8 | | | 6,021.3 | | | 3,855.0 | | | 2,905.8 | |
Mannville Group — Northeast Alberta | | | 1,365.9 | | | 640.3 | | | 430.0 | | | 333.6 | |
Bakken/Three Forks — North Dakota, USA | | | 1,150.9 | | | 370.5 | | | 189.3 | | | 119.8 | |
Viking — Redwater, Alberta | | | 26.6 | | | (0.1 | ) | | (9.1 | ) | | (13.2 | ) |
Viking — Kerrobert/Whiteside, Saskatchewan | | | (26.2 | ) | | (19.7 | ) | | (16.7 | ) | | (15.0 | ) |
| | | | | | | | | | |
Total | | | 16,113.9 | | | 7,012.2 | | | 4,448.5 | | | 3,331.0 | |
| | | | | | | | | | |
Best estimate (C2)(7) | | | | | | | | | | | | | |
Bluesky — Seal, Alberta | | | 17,810.2 | | | 7,757.3 | | | 4,927.1 | | | 3,697.2 | |
Mannville Group — Northeast Alberta | | | 3,365.4 | | | 1,348.7 | | | 856.8 | | | 648.8 | |
Bakken/Three Forks — North Dakota, USA | | | 5,650.3 | | | 1,821.3 | | | 1,014.6 | | | 708.6 | |
Viking — Redwater, Alberta | | | 421.5 | | | 260.5 | | | 200.0 | | | 169.1 | |
Viking — Kerrobert/Whiteside, Saskatchewan | | | 31.3 | | | 16.3 | | | 10.7 | | | 7.9 | |
| | | | | | | | | | |
Total | | | 27,278.8 | | | 11,240.1 | | | 7,009.2 | | | 5,231.6 | |
| | | | | | | | | | |
High estimate (C3)(8) | | | | | | | | | | | | | |
Bluesky — Seal, Alberta | | | 29,738.4 | | | 12,092.3 | | | 7,434.6 | | | 5,476.0 | |
Mannville Group — Northeast Alberta | | | 6,088.5 | | | 2,265.1 | | | 1,404.7 | | | 1,053.9 | |
Bakken/Three Forks — North Dakota, USA | | | 13,540.2 | | | 3,874.9 | | | 2,093.7 | | | 1,450.7 | |
Viking — Redwater, Alberta | | | 1,083.3 | | | 666.5 | | | 518.4 | | | 444.2 | |
Viking — Kerrobert/Whiteside, Saskatchewan | | | 464.9 | | | 264.4 | | | 191.4 | | | 155.4 | |
| | | | | | | | | | |
Total | | | 50,915.4 | | | 19,163.2 | | | 11,642.8 | | | 8,580.2 | |
| | | | | | | | | | |
Notes:
- (1)
- The contingent resource assessments were prepared in accordance with the definitions, standards and procedures contained in the COGE Handbook and NI 51-101. Contingent resource is defined in the COGE Handbook as those quantities of petroleum estimated to be potentially recoverable from known accumulations using established technology or technology under development, but which do not currently qualify as reserves or commercially recoverable due to one or more contingencies. Contingencies may include factors such as economic, legal, environmental, political and regulatory matters or a lack of markets.
- (2)
- The forecast cost and price assumptions utilized in the Sproule Report were also utilized by Sproule and McDaniel in preparing the contingent resource assessments. See "Description of Our Business and Operations — Statement of Reserves Data and Other Oil and Natural Gas Information — Pricing Assumptions".
- (3)
- Under NI 51-101, naturally occurring hydrocarbons with a viscosity greater than 10,000 centipoise are classed as bitumen. The majority of the contingent resource at Seal that will be recovered by thermal processes has a viscosity greater than this value; therefore, this component of the contingent resource is classified as bitumen under NI 51-101.
- (4)
- Proved plus probable gross reserve volumes are based on the Sproule Report.
47
- (5)
- Sproule and McDaniel prepared the estimates of contingent resource shown for each property using deterministic principles and methods. Probabilistic aggregation of the low and high property estimates shown in the table might produce different total volumes than the arithmetic sums shown in the table. Gross means the company's working interest share in the contingent resource before deducting royalties.
- (6)
- Low estimate (C1) is considered to be a conservative estimate of the quantity of resources that will actually be recovered. It is likely that the actual remaining quantities recovered will exceed the low estimate. Those resources at the low end of the estimate range have the highest degree of certainty — a 90% confidence level — that the actual quantities recovered will be equal or exceed the estimate.
- (7)
- Best estimate (C2) is considered to be the best estimate of the quantity of resources that will actually be recovered. It is equally likely that the actual remaining quantities recovered will be greater or less than the best estimate. Those resources that fall within the best estimate have a 50% confidence level that the actual quantities recovered will be equal or exceed the estimate.
- (8)
- High estimate (C3) is considered to be an optimistic estimate of the quantity of resources that will actually be recovered. It is unlikely that the actual remaining quantities of resources recovered will meet or exceed the high estimate. Those resources at the high end of the estimate range have a lower degree of certainty — a 10% confidence level — that the actual quantities recovered will equal or exceed the estimate.
- (9)
- The net present value of future net revenue attributable to the contingent resource does not necessarily represent the fair market value of the contingent resource. Estimated abandonment and reclamation costs have been included in the evaluation.
There is no certainty that it will be commercially viable to produce any portion of the contingent resource or that we will produce any portion of the volumes currently classified as contingent resource. The recovery and resource estimates provided herein are estimates. Actual contingent resource (and any volumes that may be reclassified as reserves) and future production from such contingent resource may be greater than or less than the estimates provided herein.
Other Oil and Gas Information
Oil and Natural Gas Properties
The following is a description of our principal oil and natural gas properties on production or under development as at December 31, 2011. Unless otherwise specified, gross and net acres and well count information are as at December 31, 2011. Well counts indicate gross wells, except where otherwise indicated. Production information represents average working interest production, for the year ended December 31, 2011, except where otherwise indicated.
Our crude oil and natural gas operations are organized into three business units: Alberta/B.C., Saskatchewan and United States. Each business unit has a portfolio of mineral leases, operated and non-operated properties and development prospects. Within these business units, Baytex has established a total of nine geographically-organized teams with a full complement of technical professionals (engineers, geoscientists and landmen) within each team. This comprehensive technical approach is intended to result in thorough identification and evaluation of exploration, development and acquisition investment opportunities and cost-efficient execution of those opportunities.
Baytex invested more than $100 million in undeveloped land over the past four years targeting light oil resource plays. These plays include the Bakken/Three Forks in the Williston Basin of North Dakota and southeast Saskatchewan and the Viking in southwestern Saskatchewan and eastern Alberta. These light oil resource plays provide the opportunity for long term light oil production and reserve growth to complement our heavy oil growth projects. These resource plays are described in more detail in the business unit descriptions below.
48
The map below highlights the geographic location of our principal properties.
Baytex Energy Corp. — Principal Properties
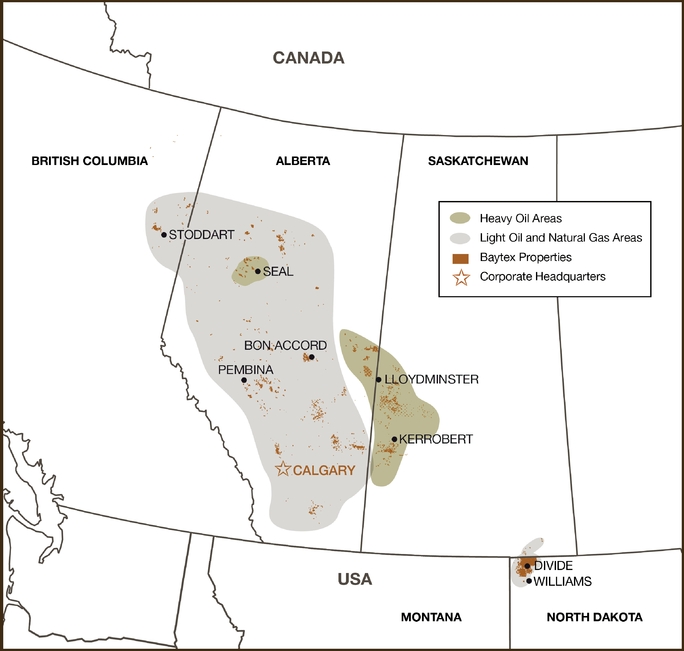
Saskatchewan Business Unit
The Saskatchewan Business Unit accounts for more than 38% of current production and more than 32% of oil-equivalent reserves. The Saskatchewan Business Unit's heavy oil operations include cold primary and thermal (steam-assisted gravity drainage) production. In some cases, Baytex's heavy oil reservoirs are waterflooded, occasionally with hot water. Baytex's heavy oil fields often have multiple productive zones, some of which can be commingled within the same producing wellbore. Production is generated from vertical, slant and horizontal wells using progressive cavity pumps capable of handling large volumes of heavy oil combined with gas, water and sand. Initial production from these wells usually averages between 30 and 100 bbl/d of crude oil with gravities ranging from 10 to 18 degrees
49
API. Once produced, the oil is delivered to markets in both Canada and the United States on pipelines, tanker trucks or railways. Heavy crude is usually blended with light-hydrocarbon diluents (such as condensate) prior to being introduced into a sales pipeline. The blended crude oil is then sold by Baytex and may be upgraded into lighter grades of crude or refined into petroleum products such as fuel oil, lubricants and asphalt by the crude purchasers. All production rates reported are for heavy crude only, before the addition of diluents.
In 2011, production in the Saskatchewan Business Unit averaged approximately 20,958 boe/d, which was comprised of 19,828 bbl/d of heavy oil, 154 bbl/d of light oil and 5,860 Mcf/d of natural gas. During 2011, Baytex drilled 93 (87.9 net) wells in the Saskatchewan Business Unit resulting in 84 (78.9 net) oil wells, four (4.0 net) stratigraphic test wells, four (4.0 net) service wells, and one (1.0 net) dry and abandoned well, for a success rate of 99%.
The Saskatchewan Business Unit possesses a large inventory of development projects within the operating areas of west-central Saskatchewan and Cold Lake/Ardmore in Alberta. Baytex's ability to generate relatively low-cost replacement production through conventional cold production methods has been key to maintaining our overall production rate. Due to the size of inventory of heavy oil projects, we are able to select from a wide range of investment opportunities to attempt to maintain heavy oil production rates.
Baytex will endeavour to continue to build value through internal heavy oil property development and selective acquisitions. Future heavy oil development will focus both on the Peace River oil sands area within the Alberta / BC Business Unit and Baytex's historical area of emphasis around Lloydminster within the Saskatchewan Business Unit. Our net undeveloped lands in the Saskatchewan Business Unit totalled approximately 268,000 acres at year-end 2011.
Listed below is a brief description of the principal properties within the Saskatchewan Business Unit:
Ardmore, Alberta: Acquired in 2002, this property has since been extensively developed in the Sparky, McLaren and Colony formations. Average production during 2011was approximately 652 bbl/d of heavy oil and 158 Mcf/d of natural gas (678 boe/d). One well was drilled in the area during 2011. Baytex anticipates drilling six wells in this area in 2012. At year-end 2011, Baytex had 34,000 net undeveloped acres in this area.
Carruthers, Saskatchewan: The Carruthers property was acquired by Baytex in 1997. This property consists of separate "North" and "South" oil pools in the Cummings formation. Thirteen new wells were drilled in 2011which, in combination with relatively low production declines due mostly to strong performance of the ongoing waterflood, led to a year-over-year production increase. The waterflood was expanded in 2009and 2010with further expansion planned for 2012. We plan to drill 5 horizontal wells and 6 vertical wells in the Carruthers area in 2012. Average production in 2011was approximately 2,444 bbl/d of heavy oil and 489 Mcf/d of natural gas (2,525 boe/d). At year-end 2011, Baytex had 10,600 net undeveloped acres in this area.
Celtic, Saskatchewan: This producing property was acquired by Baytex in 2005, in a transaction where Baytex purchased cold heavy oil production of 1,600 bbl/d and natural gas production of 900 Mcf/d. As a result of Baytex's well re-completion and drilling activities, production averaged 3,013 bbl/d of heavy oil and 538 Mcf/d of natural gas (3,103 boe/d) during 2011. The heavy oil at Celtic is relatively highly gas-saturated and the existing infrastructure allows for efficient capture and marketing of co-produced solution gas. Celtic is a key asset for Baytex because, like the adjacent Tangleflags property, it contains a large resource base with multiple prospective horizons. As a result, the Celtic property provides a multi-year inventory of drilling locations and re-completion opportunities. Baytex drilled seven oil wells in the area in 2011. Baytex plans to drill five new wells in this area in 2012. At year-end 2011, Baytex had 8,000 net undeveloped acres in this area.
50
Cold Lake, Alberta: This heavy oil property was initially acquired by Baytex in 2001. Production is primarily from the Colony, Upper McLaren, Rex and Sparky formations. Average oil production during 2011was approximately 270 bbl/d. Baytex plans to drill 15 new wells in this area in 2012. At year-end 2011, Baytex had 11,300 net undeveloped acres in this area.
Kerrobert/Coleville, Saskatchewan: Baytex acquired assets in the Kerrobert and Coleville areas of Saskatchewan in 2009. These properties provide numerous opportunities for cold infill drilling and steam-assisted gravity drainage ("SAGD") optimization. In addition, the Kerrobert area offers significant potential for light oil development in the Viking formation using horizontal wells with multi-stage hydraulic fractures.
In our Kerrobert SAGD project, we placed two new well pairs on production in the third quarter of 2011and the well pairs produced at a cumulative peak 30-day average rate of approximately 1,850 bbl/d with a steam-oil ratio of approximately 3.5 barrels of steam per barrel of oil. The total cost of the well pairs, including the cost of tie-ins, was $10.8 million. We believe that, through the remaining life of this project, we can drill up to nine additional well pairs with incremental costs of approximately $4.0 million per well pair. Average production from the Kerrobert area in 2011was approximately 3,350 bbl/d of heavy oil, 154 bbl/d of light oil, and 1,999 Mcf/d of natural gas (3,837 boe/d). Baytex drilled five oil wells and eight service wells in this area in 2011. Baytex plans to drill two primary oil wells in this area in 2012. At year-end 2011, Baytex had 38,600 net undeveloped acres in this area.
Lindbergh, Alberta: Lindbergh is a primarily non-operated heavy oil property that was purchased in 2007. Baytex has a 21.25% working interest in this property, which is operated by a senior Canadian producer. Average production in this area during 2011was approximately 673 bbl/d of heavy oil and 71 Mcf/d of natural gas (685 boe/d). Like Tangleflags and Celtic, Lindbergh is a multi-zone property that is expected to provide future development projects for many years. Thus far, economic production has been obtained from the Dina, Cummings, General Petroleum, Sparky and Colony formations. In 2011, four (0.9 net) wells were drilled in this area. At year-end 2011, Baytex had 800 net undeveloped acres in this area.
Marsden/Epping/Macklin/Silverdale, Saskatchewan: This area of Saskatchewan is characterized by low access costs and generally higher quality crude oil that ranges up to 18 degrees API. Initial per well production rates are typically 30 to 70 bbl/d. Primary recovery factors can be as high as 30% of the original oil in-place because of the relatively high oil gravity and the existence of strong water drive in many of the oil pools in this area. Average production in this area during 2011was approximately 2,102 bbl/d of oil and 290 Mcf/d of natural gas (2,150 boe/d). Nine successful oil wells were drilled in this area in 2011. For 2012, a further five wells are planned. At year-end 2011, Baytex had 24,200 net undeveloped acres in this area.
Tangleflags, Saskatchewan: Baytex acquired the Tangleflags property in 2000. Tangleflags is characterized by multiple-zone reservoirs with production from the Colony, McLaren, Waseca, Sparky, General Petroleum and Lloydminster formations. In 2011, Baytex drilled eleven horizontal oil wells in the Lloydminster formation. We plan to drill approximately twelve horizontal oil wells in the area in 2012. Average production during 2011was approximately 1,763 bbl/d of heavy oil and 543 Mcf/d of natural gas (1,854 boe/d). At year-end 2011, Baytex had 7,700 net undeveloped acres in this area.
Alberta/B.C. Business Unit
The Alberta/B.C. Business Unit possesses an array of light oil, heavy oil and natural gas properties. In addition to Baytex's historical light oil, heavy oil and natural gas properties in northern and south-eastern Alberta, the geographic scope of our Alberta/B.C. Business Unit oil and gas operations has expanded to central Alberta and northeast British Columbia, providing exposure to some of the most prospective areas in Western Canada.
51
The Alberta/B.C. Business Unit produces light and heavy gravity crude oil, natural gas, and natural gas liquids from various fields in Alberta and British Columbia and accounts for approximately 58% of current production. During 2011, production from this business unit averaged 27,833 boe/d, which was comprised of 15,425 bbl/d of heavy oil, 5,282 bbl/d of light oil and NGL and 42.8 MMcf/d of natural gas. During 2011, the Alberta/B.C. Business Unit participated in the drilling of 71 (59.0 net) wells resulting in 61 (49.0 net) oil wells, one (1.0 net) natural gas well, seven (7.0 net) stratigraphic test wells, one (1.0 net) service well and one (1.0 net) dry and abandoned well for a success rate of 99%. Our net undeveloped lands in this business unit totalled approximately 474,000 acres at year-end 2011.
Listed below is a brief description of the principal properties within the Alberta/B.C. Business Unit:
Bon Accord, Alberta: Baytex acquired its initial position in this multi-zone property in 1997and has further expanded its presence through Crown land sales. Production is obtained from the Belly River, Viking and Mannville formations. During 2011, production for the area averaged approximately 905 bbl/d of light oil and 1,742 Mcf/d of natural gas (1,195 boe/d). Natural gas is processed at two Baytex-operated plants and oil is treated at three Baytex-operated batteries. In the past two years, Baytex has begun to exploit the Viking sand utilizing multi-lateral horizontal drilling technology. In this area, Baytex drilled 11 (9.7 net) horizontal Viking oil wells in 2011. Baytex plans to drill approximately 11 multi-lateral horizontal Viking oil wells in this area in 2012. At year-end 2011, Baytex had 18,300 net undeveloped acres in this area.
Darwin/Nina/Goodfish/Lafond, Alberta: The properties in this winter-access area produce natural gas from the Bluesky formation. Natural gas production is processed at three Baytex-operated gas plants and one gas plant operated by a senior producer in which Baytex holds a 30% interest. Production during 2011averaged approximately 3,746 Mcf/d of natural gas (624 boe/d). At year-end 2011, Baytex had 27,300 net undeveloped acres in this area.
Leahurst, Alberta: Production averaged approximately 2,633 Mcf/d of natural gas and 13 bbl/d of NGL (452 boe/d) during 2011from this multi-zone, year-round access area. Natural gas production from the Edmonton, Belly River, Viking and Mannville formations is processed at several plants, one of which is Baytex-operated. Baytex did not drill any wells in this area during 2011. At year-end 2011, Baytex had 7,300 net undeveloped acres in this area.
Peace River, Alberta: Baytex holds a total of 263 net sections of oil sands leases in the Peace River oil sands area, which includes the legacy Seal area and the Reno area which was acquired in February 2011. During 2011, production from the Peace River area was 15,425 bbl/d, which was comprised of 13,746 bbl/d from Seal and 1,679 bbl/d from Reno. In 2011, Baytex drilled 25 (25.0 net) cold horizontal production wells and seven (7.0 net) stratigraphic test wells at Seal and two (2.0 net) cold horizontal production wells at Reno. The purpose of the stratigraphic test wells is to improve delineation of our land base and guide development well trajectories. In 2012, Baytex plans to drill 25 cold horizontal wells and 14 stratigraphic test wells at Seal and 15 cold horizontal wells and four stratigraphic test wells at Reno. The Peace River area includes 152,500 net undeveloped acres, including 57,000 net undeveloped acres at Seal and 95,500 net undeveloped acres at Reno.
In certain parts of this Peace River land base, heavy oil can be produced using horizontal wells at initial production rates of 150 to 500 bbl/d per well, without employing more cost-intensive methods such as steam injection. Reservoir analysis of the Seal property has indicated that both waterflood and cyclic steam recovery methods have the potential to increase economic oil reserves beyond what is achievable with cold primary recovery.
Our first cyclic steam stimulation ("CSS") pilot project was carried out on an existing horizontal producer in the Harmon Valley area during 2008to validate our numerical reservoir simulation models of CSS. In 2010, we implemented a second cyclic steam project in the Cliffdale area, seven miles to the east of the first CSS pilot project. In 2011, a number of important milestones were achieved at our
52
Cliffdale CSS project. The third cycle of the original Cliffdale pilot well was completed, achieving a peak oil rate of 400 bopd with a cycle steam-oil ratio (SOR) below 1.8. In the first half of 2011, we drilled four additional CSS wells and commenced cold production to create voidage. In the second half of 2011, we commissioned our Cliffdale commercial steam injection and production facility and initiated steam injection into the wells which had been drilled earlier in the year. At year-end 2011, our reserves engineers assigned developed producing reserves to the Cliffdale CSS project for the first time. Finally, in late 2011we commenced drilling operations on the final five CSS wells of the first 10-well Cliffdale thermal module, setting intermediate casing before year-end and drilling the horizontal laterals in January 2012. Subsequent to the end of 2011, we finished first cycle injection operations and commenced flowback operations in two wells drilled earlier in 2011. Each of these wells accepted 40% more steam than our original CSS pilot well in its first cycle, and we observed peak oil rates of approximately 300 bbl/d per well, 20% higher than first cycle pilot well performance.
Baytex has applied for regulatory approval for a 15-well Cliffdale CSS project immediately adjacent to the 10-well Cliffdale module. Depending on approval timing, Baytex anticipates drilling five CSS wells in the new 15-well thermal module and commencing facility construction in the fourth quarter of 2012. Also in 2012, we plan to drill approximately five stratigraphic test wells to further delineate our Cliffdale area lands for future CSS development.
Pembina, Alberta: Baytex acquired its initial position in Pembina in 2007and further expanded its presence in the area through the acquisition of Burmis Energy Inc. in 2008. Production is primarily from the Nisku formation and to a lesser extent from Cretaceous and Jurassic age formations, including the Cardium, Ellerslie, Glauconite, Notikewin, Rock Creek and Nordegg. The majority of Baytex's production in this area is treated at a Baytex-operated oil battery with the remaining production treated at a third party-operated oil battery. Natural gas production is delivered to a combination of four mid-stream gas processing facilities and two producer-operated gas processing facilities. Baytex owns a working interest in one of the producer-operated gas processing facilities and a minor working interest in one of the mid-stream gas processing facilities. During 2011, Pembina production averaged 2,633 bbl/d of light oil and NGL and 22,428 Mcf/d of natural gas (6,371 boe/d). Baytex participated in drilling 19 (8.5 net) wells in this area in 2011, resulting in 17 (6.5 net) oil wells, one (1.0 net) natural gas well, and one (1.0 net) dry and abandoned well. Pembina area drilling included five (5.0 net) operated and 12 (1.5 net) non-operated Cardium horizontal wells which were successfully drilled and completed with multi-stage fracture stimulations. Baytex plans to drill ten wells in this area in 2012. At year-end 2011, Baytex had 19,300 net undeveloped acres in this area.
In the fourth quarter of 2011, Baytex completed the construction of a 33 kilometre "wet" natural gas pipeline in the Pembina region. This 100% owned and operated infrastructure expansion project was required to alleviate capacity restrictions that had adversely impacted our O'Chiese area natural gas and NGL production in 2011.
Red Earth Alberta: This primarily winter-access, multi-zone property was acquired by Baytex in 1997. Oil production from Granite Wash and Slave Point pools is treated at two Baytex-operated sweet oil batteries. Production from this area during 2011averaged approximately 42 Mcf/d of natural gas and 522 bbl/d of light oil and NGL (529 boe/d). Baytex participated in two (1.8 net) successful oil wells in this area in 2011, and we plan to drill one well in the area in 2012. At year-end 2011, Baytex had 8,600 net undeveloped acres in this area.
Richdale/Sedalia, Alberta: Baytex acquired its initial position in this area in 2001and increased its presence through the acquisition of a private company in 2004. During 2011, production averaged approximately 3,845 Mcf/d of natural gas and 8 bbl/d of NGL (649 boe/d). This area has year-round access and multi-zone potential in the Second White Specks, Viking and Mannville formations. Most of the natural gas produced from this area is processed at two Baytex-operated gas plants. At year-end 2011, Baytex had 28,000 net undeveloped acres in this area.
53
Stoddart, British Columbia: The Stoddart asset acquisition occurred in 2004. Oil and liquids-rich gas production in this largely year-round-access area comes from the Doig, Halfway, Baldonnel, Coplin and Bluesky formations. Oil is treated at two Baytex-operated batteries and natural gas is compressed at four Baytex-operated sites and sent for further processing at two third party-operated gas plants. Production from this area during 2011averaged approximately 4,498 Mcf/d of natural gas and 713 bbl/d of oil and NGL (1,463 boe/d). Baytex did not drill any wells in this area in 2011. At year-end 2011, Baytex had 23,700 net undeveloped acres in this area.
Turin, Alberta: This multi-zone, year-round access property was acquired in 2004. Production during 2011averaged approximately 345 bbl/d of oil and NGL and 856 Mcf/d of natural gas (488 boe/d). Production is from the Second White Specks, Milk River, Bow Island, Mannville, Sawtooth and Livingstone formations. Oil production is treated at three Baytex-operated batteries and natural gas is processed at two third party-operated gas plants. Baytex did not drill any wells in this area in 2011. At year-end 2011, Baytex had 5,700 net undeveloped acres in this area.
United States Business Unit
Baytex acquired significant land positions in the Powder River and Williston basins in 2007and 2008. During 2011, we focused our activities on the light oil resource play located in the Divide and Williams Counties of North Dakota. Production is primarily from horizontal wells using multi-stage hydraulic fracturing in the Bakken and Three Forks formations. We have invested in approximately 277,900 (116,000 net) acres of land, of which 216,900 (91,200 net) acres were undeveloped at year-end 2011. Baytex now owns approximately 61,000 (24,800 net) developed acres. In 2011, Baytex participated in the drilling of 34 (10.4 net) Bakken/Three Forks oil wells with a success rate of 100%. In 2012, Baytex plans to drill approximately 24 (9.6 net) horizontal wells. Ultimately, assuming development of only one stratigraphic elevation, the project has the potential to include 100 to 300 wells with average initial production rates expected to be approximately 420 boe/d per well and average recoveries expected to be approximately 420 Mboe per well, based on drilling two-mile (or 1,280-acre spacing unit) wells. Despite some wells not yet having been completed due to constraints in oilfield services, net production from the United States properties averaged 1,341 boe/d in 2011, as compared to 742 boe/d in 2010, and grew steadily through the year, reaching over 1,800 boe/d in December 2011.
54
Average Production
The following table indicates our average daily production from our principal areas for the year ended December 31, 2011.
| | | | | | | | | | | | | |
| | Light Oil and NGL
(bbl/d) | | Heavy Oil
(bbl/d) | | Natural Gas
(Mcf/d) | | Oil Equivalent
(boe/d) | |
|---|
Saskatchewan Business Unit | | | | | | | | | | | | | |
Ardmore | | | — | | | 652 | | | 158 | | | 678 | |
Carruthers | | | — | | | 2,444 | | | 489 | | | 2,525 | |
Celtic | | | — | | | 3,013 | | | 538 | | | 3,103 | |
Cold Lake | | | — | | | 270 | | | — | | | 270 | |
Forest Bank | | | — | | | 760 | | | 57 | | | 769 | |
Golden Lake | | | — | | | 1,061 | | | 558 | | | 1,154 | |
Greenstreet | | | — | | | 132 | | | — | | | 132 | |
Hoosier | | | — | | | 439 | | | — | | | 439 | |
Kerrobert/Coleville | | | 154 | | | 3,350 | | | 1,999 | | | 3,837 | |
Lindbergh | | | — | | | 673 | | | 71 | | | 685 | |
Maidstone | | | — | | | 880 | | | — | | | 880 | |
Marsden/Epping/Macklin/Silverdale | | | — | | | 2,102 | | | 290 | | | 2,150 | |
Neilburg | | | — | | | 677 | | | — | | | 677 | |
Poundmaker/Freemont | | | — | | | 1,282 | | | 328 | | | 1,337 | |
Sugden | | | — | | | 193 | | | — | | | 193 | |
Tangleflags | | | — | | | 1,763 | | | 543 | | | 1,854 | |
Remaining properties | | | — | | | 136 | | | 829 | | | 275 | |
| | | | | | | | | | |
Total Saskatchewan Business Unit | | | 154 | | | 19,827 | | | 5,860 | | | 20,958 | |
Alberta/B.C. Business Unit | | | | | | | | | | | | | |
Bon Accord | | | 905 | | | — | | | 1,742 | | | 1,195 | |
Darwin/Nina/Goodfish/Lafond | | | — | | | — | | | 3,746 | | | 624 | |
Leahurst | | | 13 | | | — | | | 2,633 | | | 452 | |
Pembina | | | 2,633 | | | — | | | 22,428 | | | 6,371 | |
Red Earth | | | 522 | | | — | | | 42 | | | 529 | |
Seal/Reno | | | — | | | 15,425 | | | — | | | 15,425 | |
Richdale/Sedalia | | | 8 | | | — | | | 3,845 | | | 649 | |
Stoddart | | | 713 | | | — | | | 4,498 | | | 1,463 | |
Turin | | | 345 | | | — | | | 856 | | | 488 | |
Remaining Properties | | | 144 | | | — | | | 2,967 | | | 637 | |
| | | | | | | | | | |
Total Alberta/B.C. Business Unit | | | 5,283 | | | 15,425 | | | 42,757 | | | 27,833 | |
United States Business Unit | | | | | | | | | | | | | |
Williston Basin | | | 1,289 | | | — | | | 52 | | | 1,298 | |
Remaining properties | | | 43 | | | — | | | — | | | 43 | |
| | | | | | | | | | |
Total United States Business Unit | | | 1,332 | | | — | | | 52 | | | 1,341 | |
| | | | | | | | | | |
Grand Total | | | 6,769 | | | 35,252 | | | 48,669 | | | 50,132 | |
| | | | | | | | | | |
55
Costs Incurred
The following table summarizes the property acquisition, exploration and development costs by country for the year ended December 31, 2011:
| | | | | | | | | | |
| | Canada | | United States | | Total | |
|---|
| | ($000s)
| |
|---|
Property acquisition costs(1) | | | | | | | | | | |
Proved properties | | | $162,725 | | | $502 | | | $163,227 | |
Unproved properties | | | 30,288 | | | 2,655 | | | 32,943 | |
Property disposition | | | (47,396) | | | — | | | (47,396) | |
| | | | | | | | |
Total Property acquisition costs, net | | | 145,617 | | | 3,157 | | | 148,774 | |
Development Costs(2) | | | 284,711 | | | 74,033 | | | 358,744 | |
Exploration Costs(3) | | | 5,672 | | | 3,432 | | | 9,104 | |
| | | | | | | | |
Total | | | $436,000 | | | $80,622 | | | $516,622 | |
| | | | | | | | |
Notes:
- (1)
- Property acquisition costs include the acquisition of assets in the Reno area of northwest Alberta and the Lloydminster area of west central Saskatchewan.
- (2)
- Development and facilities expenditures.
- (3)
- Cost of geological and geophysical capital expenditures and drilling costs for 2010exploratory wells drilled.
Oil and Gas Wells
The following table sets forth the number and status of wells in which we have a working interest as at December 31, 2011.
| | | | | | | | | | | | | | | | | | | | | | | | | |
| | Oil Wells | | Natural Gas Wells | |
|---|
| | Producing | | Non-Producing | | Producing | | Non-Producing | |
|---|
| | Gross | | Net | | Gross | | Net | | Gross | | Net | | Gross | | Net | |
|---|
Alberta | | | 776 | | | 502.0 | | | 975 | | | 542.6 | | | 520 | | | 382.4 | | | 435 | | | 336.1 | |
British Columbia | | | 47 | | | 46.6 | | | 33 | | | 32.2 | | | 38 | | | 34.8 | | | 11 | | | 10.5 | |
Saskatchewan | | | 1,249 | | | 1,134.9 | | | 1,237 | | | 1,146.9 | | | 43 | | | 38.5 | | | 126 | | | 113.6 | |
North Dakota | | | 109 | | | 32.4 | | | — | | | — | | | — | | | — | | | — | | | — | |
Wyoming | | | 5 | | | 2.6 | | | — | | | — | | | — | | | — | | | — | | | — | |
| | | | | | | | | | | | | | | | | | |
Total | | | 2,186 | | | 1,718.5 | | | 2,245 | | | 1,721.7 | | | 601 | | | 455.7 | | | 572 | | | 460.2 | |
| | | | | | | | | | | | | | | | | | |
56
Undeveloped Land Holdings
The following table sets forth our undeveloped land holdings as at December 31, 2011.
| | | | | | | |
| | Undeveloped Acres | |
|---|
| | Gross | | Net | |
|---|
Canada | | | | | | | |
Alberta | | | 665,042 | | | 525,633 | |
British Columbia | | | 56,999 | | | 30,453 | |
Saskatchewan | | | 205,540 | | | 179,642 | |
| | | | | | |
Total Canada | | | 927,581 | | | 735,728 | |
United States | | | | | | | |
New Mexico | | | 14,312 | | | 14,312 | |
North Dakota | | | 216,870 | | | 91,160 | |
Utah | | | 180 | | | 89 | |
Wyoming | | | 37,364 | | | 25,159 | |
| | | | | | |
Total United States | | | 268,726 | | | 130,720 | |
| | | | | | |
Grand Total | | | 1,196,307 | | | 866,448 | |
| | | | | | |
We estimate the value of our net undeveloped land holdings at December 31, 2011to be approximately $454 million, as compared to $391 million at December 31, 2010. This internal evaluation generally represents the estimated replacement cost of our undeveloped land. In determining replacement cost, we analyzed land sale prices paid at Provincial Crown and State land sales for the properties in the vicinity of our undeveloped land holdings, less an allowance for near-term expiries.
We expect that rights to explore, develop and exploit approximately 82,512 net acres of our undeveloped land holdings may expire on or before December 31, 2012. There are no material drilling commitments associated with the land holdings expiring by December 31, 2012.
Exploration and Development Activities
The following table sets forth the gross and net exploratory and development wells in which we participated during the year ended December 31, 2011.
| | | | | | | | | | | | | | | | | | | |
| | Exploratory Wells | | Development Wells | | Total Wells | |
|---|
| | Gross | | Net | | Gross | | Net | | Gross | | Net | |
|---|
Oil | | | 1 | | | 1.0 | | | 178 | | | 137.3 | | | 179 | | | 138.3 | |
Natural Gas | | | | | | | | | 1 | | | 1.0 | | | 1 | | | 1.0 | |
Evaluation | | | 6 | | | 6.0 | | | 5 | | | 5.0 | | | 11 | | | 11.0 | |
Service | | | | | | | | | 5 | | | 5.0 | | | 5 | | | 5.0 | |
Dry | | | 1 | | | 1.0 | | | 1 | | | 1.0 | | | 2 | | | 2.0 | |
| | | | | | | | | | | | | | |
Total | | | 8 | | | 8.0 | | | 190 | | | 149.3 | | | 198 | | | 157.3 | |
| | | | | | | | | | | | | | |
Forward Contracts
For details on our contractual commitments to sell natural gas and crude oil which were outstanding at December 31, 2011, see Note 23 to our annual audited financial statements for the year ended December 31, 2011.
57
Tax Horizon
Based on the current tax regime and Baytex's available tax pools and anticipated level of funds from operations and capital spending, Baytex does not expect to pay material amounts of cash income taxes (other than Saskatchewan Resource Surcharge) prior to 2013. This estimate is highly sensitive to assumptions regarding commodity prices, production, funds from operations and capital expenditure levels. As at December 31, 2011, Baytex's total Canadian tax pools were estimated to be $1.6 billion, including $266 million for tangibles, $607 million for intangibles and $712 million in non-capital loss carryforwards. In addition, as at December 31, 2011, Baytex's total United States tax pools were estimated to be $293 million, including $93 million for tangibles, $109 million for intangibles and $91 million in non-capital loss carryforwards.
Additional Information Concerning Abandonment and Reclamation Costs
The following table sets forth information respecting future abandonment and reclamation costs for surface leases, wells, facilities, and pipelines which are expected to be incurred by us for the periods indicated.
| | | | | | | |
Period | | Abandonment and Reclamation
Costs Escalated at 2%
Undiscounted
($ millions) | | Abandonment and Reclamation
Costs Escalated at 2%
Discounted at 10%
($ millions) | |
|---|
Total liability as at December 31, 2011 | | | 315.86 | | | 37.21 | |
Anticipated to be paid in 2012 | | | 1.35 | | | 1.30 | |
Anticipated to be paid in 2013 | | | 1.19 | | | 1.06 | |
Anticipated to be paid in 2014 | | | 3.02 | | | 2.50 | |
We will be liable for our share of ongoing environmental obligations and for the ultimate reclamation of the surface leases, wells, facilities, and pipelines held by us upon abandonment. Expenditures related to environmental obligations are expected to be funded out of cash flow.
We estimate the costs to abandon and reclaim all of our producing and shut in wells, facilities, and pipelines. In the table above, no estimate of salvage value is netted against the estimated cost. Using public data and our own experience, we estimate the amount and timing of future abandonment and reclamation expenditures at an operating area level. Wells within each operating area are assigned an average cost per well to abandon and reclaim the well. The estimated expenditures are based on current regulatory standards and actual abandonment cost history.
The number of net wells for which we estimated we will incur reclamation and abandonment costs is 5,214 wells. This estimate includes all producing wells, all non-producing wells, all standing cased wells and all suspended wells. The number of net wells for which Sproule estimated we will incur reclamation and abandonment costs is 746 wells which are all the proved undeveloped and probable undeveloped wells. The latter two well groups had not been drilled as of December 31, 2011. Abandonment and reclamation costs have been estimated over a 52-year period. Facility reclamation costs are scheduled to be incurred two years following the end of the reserve life of its associated producing area. Only well abandonment costs, net of downhole salvage value were deducted by Sproule in estimating future net revenue in the Sproule Report. The additional liability associated with our existing wells, pipelines and facility reclamation costs, net of salvage, which was estimated to be $315.86 million ($37.2 million discounted at 10 percent), was not deducted in estimating future net revenue.
58
Production Estimates
The following table sets out the volumes of our working interest production estimated for the year ended December 31, 2012, which is reflected in the estimate of future net revenue disclosed in the forecast price tables contained under "Description of Our Business and Operations — Statement of Reserves Data and Other Oil and Gas Information — Disclosure of Reserves Data and Oil and Natural Gas Information".
| | | | | | | | | | | | | | | | |
| | Light and
Medium Oil
(bbl/d) | | Heavy Oil
(bbl/d) | | Natural Gas
liquids
(bbl/d) | | Natural Gas
(Mcf/d) | | Oil Equivalent
(boe/d) | |
|---|
CANADA | | | | | | | | | | | | | | | | |
Total Proved | | | 3,659 | | | 36,845 | | | 1,568 | | | 40,788 | | | 48,869 | |
Total Proved plus Probable | | | 4,227 | | | 40,279 | | | 1,740 | | | 44,296 | | | 53,628 | |
UNITED STATES | | | | | | | | | | | | | | | | |
Total Proved | | | 2,002 | | | — | | | — | | | 53 | | | 2,011 | |
Total Proved plus Probable | | | 2,646 | | | — | | | — | | | 54 | | | 2,655 | |
TOTAL | | | | | | | | | | | | | | | | |
Total Proved | | | 5,661 | | | 36,845 | | | 1,568 | | | 40,841 | | | 50,880 | |
Total Proved plus Probable | | | 6,873 | | | 40,279 | | | 1,740 | | | 44,350 | | | 56,283 | |
The only property that accounts for 20% or more of the estimated 2012 production volumes is Seal, Alberta. Estimated 2012 production volumes for Seal are 14,614 boe/d on a total proved basis and 15,907 boe/d on a total proved plus probable basis. Note: these production volumes do not include production from the adjacent Reno area.
59
Production History
The following table summarizes certain information in respect of the production, product prices received, royalties paid, production costs and resulting netback associated with our reserves data for the periods indicated below.
| | | | | | | | | | | | | | | | |
| | Three Months Ended | |
| |
|---|
| | Dec. 31, 2011 | | Sept 30, 2011 | | June 30, 2011 | | Mar. 31, 2011 | | Year Ended
Dec. 31, 2011 | |
|---|
Average Daily Production(1) | | | | | | | | | | | | | | | | |
Light Oil and NGL (bbl/d)(2) | | | 7,232 | | | 7,170 | | | 6,055 | | | 6,606 | | | 6,769 | |
Heavy Oil (bbl/d) | | | 38,006 | | | 37,280 | | | 33,839 | | | 31,792 | | | 35,252 | |
Natural Gas (Mcf/d) | | | 46,891 | | | 49,047 | | | 47,755 | | | 51,022 | | | 48,668 | |
Total (boe/d) | | | 53,054 | | | 52,625 | | | 47,853 | | | 46,902 | | | 50,132 | |
Average Net Production Prices Received | | | | | | | | | | | | | | | | |
Light Oil and NGL($/bbl)(2) | | | 85.09 | | | 80.48 | | | 89.11 | | | 75.68 | | | 82.49 | |
Heavy Oil ($/bbl) | | | 70.85 | | | 59.92 | | | 71.02 | | | 59.89 | | | 65.53 | |
Natural Gas ($/Mcf) | | | 3.91 | | | 4.20 | | | 4.36 | | | 4.19 | | | 4.17 | |
Total ($/boe) | | | 65.81 | | | 57.31 | | | 65.84 | | | 55.86 | | | 61.26 | |
Royalties Paid | | | | | | | | | | | | | | | | |
Light Oil and NGL($/bbl)(2) | | | 16.36 | | | 17.56 | | | 18.90 | | | 17.35 | | | 17.48 | |
Heavy Oil ($/bbl) | | | 13.82 | | | 10.51 | | | 12.89 | | | 12.58 | | | 12.44 | |
Natural Gas ($/Mcf) | | | 0.54 | | | 0.75 | | | 0.28 | | | 0.40 | | | 0.49 | |
Total ($/boe) | | | 12.61 | | | 10.54 | | | 11.78 | | | 11.42 | | | 11.59 | |
Operating Expenses(3)(4) | | | | | | | | | | | | | | | | |
Light Oil and NGL($/bbl)(2) | | | 12.81 | | | 13.60 | | | 10.20 | | | 8.69 | | | 11.45 | |
Heavy Oil ($/bbl) | | | 10.97 | | | 11.08 | | | 11.31 | | | 11.03 | | | 11.09 | |
Natural Gas ($/Mcf) | | | 2.01 | | | 2.07 | | | 2.27 | | | 2.21 | | | 2.14 | |
Total ($/boe) | | | 11.38 | | | 11.64 | | | 11.56 | | | 11.11 | | | 11.43 | |
Transportation Expenses | | | | | | | | | | | | | | | | |
Light Oil and NGL($/bbl)(2) | | | 0.45 | | | 0.61 | | | 0.59 | | | 0.32 | | | 0.50 | |
Heavy Oil ($/bbl) | | | 4.76 | | | 4.51 | | | 5.04 | | | 3.97 | | | 4.58 | |
Natural Gas ($/Mcf) | | | 0.16 | | | 0.18 | | | 0.17 | | | 0.17 | | | 0.17 | |
Total ($/boe) | | | 3.61 | | | 3.44 | | | 3.81 | | | 2.94 | | | 3.46 | |
Netback Received(5) | | | | | | | | | | | | | | | | |
Light Oil and NGL($/bbl)(2) | | | 55.47 | | | 48.71 | | | 59.43 | | | 49.32 | | | 53.06 | |
Heavy Oil ($/bbl) | | | 41.30 | | | 33.82 | | | 41.77 | | | 32.31 | | | 37.42 | |
Natural Gas ($/Mcf) | | | 1.20 | | | 1.20 | | | 1.64 | | | 1.40 | | | 1.37 | |
Total ($/boe) | | | 38.21 | | | 31.69 | | | 38.69 | | | 30.39 | | | 34.78 | |
Financial Instruments gain ($/boe)(6) | | | (0.27 | ) | | 1.30 | | | (1.93 | ) | | 0.37 | | | (0.10 | ) |
Netback Received after hedging ($/boe) | | | 37.94 | | | 32.99 | | | 36.76 | | | 30.76 | | | 34.68 | |
Notes:
- (1)
- Before deduction of royalties.
- (2)
- Our NGL volumes are not material, and have been grouped with light oil for reporting purposes.
60
- (3)
- Operating expenses are composed of direct costs incurred to operate both oil and gas wells. A number of assumptions are required to allocate these costs between oil, natural gas and natural gas liquids production.
- (4)
- Operating recoveries associated with operated properties are charged to operating costs and accounted for as a reduction to general and administrative costs.
- (5)
- Netback is calculated by subtracting royalties, operating expenses, transportation expenses and losses/gains on commodity and foreign exchange contracts from revenues.
- (6)
- Financial instruments reflect only realized derivative gains (losses).
Marketing Arrangements
Baytex continues to market its oil and natural gas production with attention to maximizing value and counterparty performance. We maintain a portfolio of sales contracts with a variety of pricing mechanisms, term commitments and customers. We engage a number of reputable counterparties in our bid process to ensure competitiveness, while also managing counterparty credit exposure.
Natural Gas
North American natural gas prices in 2011 were marginally lower than in 2010, reflecting continuing pressure on prices due to a number of factors. The NYMEX Henry Hub price averaged US$4.04/MMbtu in 2011, as compared to US$4.39/MMbtu in 2010. The most significant factor affecting prices was the continued growth in U.S. natural gas production from shale plays, enabled by improvements in horizontal drilling and multi-stage fracturing technology. In spite of increased natural gas demand from winter and summer weather, record U.S. natural gas supplies weighed on the market and resulted in high natural gas storage levels relative to historic norms. As a result, natural gas prices gradually declined over 2011 from a high of US$4.847/MMbtu on June 8 to a low of US$2.989/MMbtu on December 30.
For 2011, Baytex's average physical natural gas sales price (inclusive of physical forward sales contracts) was $4.17/mcf, as compared to $4.32/mcf in 2010.
Oil and NGL
Oil prices in 2011 were volatile, but generally higher than in 2010. During 2011, daily NYMEX WTI prices ranged from a low of US$76.29/bbl (on October 10) and a high of US$113.93/bbl (on April 29) and ended the year at US$98.83/bbl. The average WTI price during 2011 was US$95.12/bbl, as compared to an average of US$79.53/bbl in 2010. Over the course of 2011, the benchmark WTI price was supported by an improving global outlook, together with strong oil demand growth from China and other emerging market countries. In spite of a mid-year oil price set-back related to European economic uncertainty, oil prices staged a sustained fourth-quarter rally, driven by continued global oil demand growth.
For 2011, Baytex's light oil and NGL prices averaged $82.49/bbl, while heavy oil sales prices averaged $65.53/bbl (net of physical forward sales gains of $0.17/bbl). In contrast, for 2010 Baytex averaged $65.90/bbl for light oil and NGL and $59.40/bbl for heavy oil sales (net of physical forward sales losses of $0.68/bbl). Baytex's total oil and NGL price in 2011 was $68.26/bbl (net), compared with $60.61/bbl (net) in 2010.
Environmental Policies
We have an active program to monitor and comply with all environmental laws, rules and regulations applicable to our operations. Our policies require that all employees and contractors report all breaches or potential breaches of environmental laws, rules and regulations to our senior management and all applicable governmental authorities. Any material breaches of environmental law, rules and regulations must be reported to the Board of Directors.
61
DIRECTORS AND OFFICERS
The following table sets forth the name, municipality of residence, age as at December 31, 2011, position held with Baytex and principal occupation of each of the directors and officers of Baytex.
| | | | | | | |
Name and Municipality
of Residence | | Age | | Position with Baytex | | Principal Occupation |
|---|
John A. Brussa(2)(3)(4)(6)
Calgary, Alberta | | | 54 | | Director | | Partner with Burnet, Duckworth & Palmer LLP |
Raymond T. Chan
Calgary, Alberta | | | 56 | | Director and Executive Chairman | | Executive Chairman of Baytex |
Edward Chwyl(2)(3)(4)
Victoria, B.C. | | | 68 | | Director | | Independent Businessman |
Naveen Dargan(1)(2)(4)
Calgary, Alberta | | | 54 | | Director | | Independent Businessman |
R.E.T. (Rusty) Goepel(1)
Vancouver, B.C. | | | 69 | | Director | | Senior Vice President of Raymond James Ltd. |
Anthony W. Marino
Calgary, Alberta | | | 51 | | Director, President and Chief Executive Officer | | President and Chief Executive Officer of Baytex |
Gregory K. Melchin(1)
Calgary, Alberta | | | 58 | | Director | | Independent Businessman |
Dale O. Shwed(3)
Calgary, Alberta | | | 53 | | Director | | President and Chief Executive Officer of Crew Energy Inc. |
Daniel G. Anderson
Denver, Colorado | | | 49 | | Vice President, U.S. Business Unit | | President of Baytex USA |
Kendall D. Arthur
Calgary, Alberta | | | 31 | | Vice President, Saskatchewan Business Unit | | Vice President, Saskatchewan Business Unit of Baytex |
W. Derek Aylesworth
Calgary, Alberta | | | 49 | | Chief Financial Officer | | Chief Financial Officer of Baytex |
Stephen Brownridge
Calgary, Alberta | | | 52 | | Vice President, Exploration | | Vice President, Exploration of Baytex |
Geoffrey J. Darcy
Calgary, Alberta | | | 49 | | Vice President, Marketing | | Vice President, Marketing of Baytex |
Murray J. Desrosiers
Calgary, Alberta | | | 42 | | Vice President, General Counsel and Corporate Secretary | | Vice President, General Counsel and Corporate Secretary of Baytex |
Brian G. Ector
Calgary, Alberta | | | 43 | | Vice President, Investor Relations | | Vice President, Investor Relations |
Michael S. Kaluza
Calgary, Alberta | | | 52 | | Vice President, Corporate Development and Planning | | Vice President, Corporate Development and Planning of Baytex |
Brett J. McDonald
Calgary, Alberta | | | 49 | | Vice President, Land | | Vice President, Land of Baytex |
Timothy R. Morris
Denver, Colorado | | | 55 | | Vice President, US Business Development | | Vice President of Baytex USA |
62
| | | | | | | |
Name and Municipality
of Residence | | Age | | Position with Baytex | | Principal Occupation |
|---|
Marty L. Proctor
Calgary, Alberta | | | 51 | | Chief Operating Officer | | Chief Operating Officer of Baytex |
Richard P. Ramsay
Calgary, Alberta | | | 48 | | Vice President, Alberta/B.C. Business Unit | | Vice President, Alberta/B.C. Business Unit of Baytex |
Notes:
- (1)
- Member of our Audit Committee.
- (2)
- Member of our Compensation Committee.
- (3)
- Member of our Reserves Committee.
- (4)
- Member of our Nominating and Governance Committee.
- (5)
- Baytex's directors hold office until the next annual general meeting of Shareholders or until each director's successor is appointed or elected pursuant to theBusiness Corporations Act (Alberta).
- (6)
- Mr. Brussa was a director of Imperial Metals Limited, a corporation engaged in both oil and gas and mining operations, in the year prior to that corporation implementing a plan of arrangement under theCompany Act (British Columbia) and under theCompanies' Creditors Arrangement Act (Canada) which resulted in the separation of its two businesses and the creation of two public corporations: Imperial Metals Corporation and IEI Energy Inc. (which became Rider Resources Ltd.). The plan of arrangement was completed in April 2002.
Listed below is a biographical description for each of our directors and officers, including their principal occupations during the five preceding years.
John A. Brussa became a Director of Baytex on December 31, 2010 and has been a director of Baytex Energy since October 8, 1997. He is a partner at Burnet, Duckworth & Palmer LLP and focuses on tax law. He was admitted to the Alberta bar in 1982. Mr. Brussa is a director of several public companies including Chinook Energy Inc., Crew Energy Inc., Just Energy Group Inc., Penn West Petroleum Ltd., Progress Energy Resources Corp. and Storm Resources Ltd. He holds a Bachelor of Laws degree from the University of Windsor where he was a gold medalist and a Bachelor of Arts, History and Economics degree also from the University of Windsor.
Raymond T. Chan was appointed Executive Chairman of Baytex on December 31, 2010 and has held the same position with Baytex Energy since January 1, 2009. He originally joined Baytex Energy in October 1998 and has held the following positions: Senior Vice President and Chief Financial Officer (October 1998 to August 2003); President and Chief Executive Officer (September 2003 to November 2007); and Chief Executive Officer (November 2007 to December 2008). Mr. Chan has been a director of Baytex Energy since October 1998. Mr. Chan has held senior executive positions in the Canadian oil and gas industry since 1982, including chief financial officer titles at Tarragon Oil and Gas Limited, American Eagle Petroleums Ltd. and Gane Energy Corporation. Mr. Chan holds a Bachelor of Commerce degree and is a chartered accountant.
Edward Chwyl became a Director of Baytex on December 31, 2010 and has been a director of Baytex Energy since May 27, 2003. Mr. Chwyl was Chairman of the Board of Directors of Baytex Energy from September 2003 to December 2008. He was appointed Lead Independent Director of Baytex on January 11, 2011 and has held the same position with Baytex Energy since February 17, 2009. He holds a Bachelor of Science degree in Chemical Engineering and a Master of Science degree in Petroleum Engineering. He is a retired businessman with over 35 years experience in the oil and gas industry in North America, most notably as President and Chief Executive Officer of Tarragon Oil and Gas Limited from 1989 to 1998. Prior thereto, he held various technical and executive positions within the oil and gas industry in Canada and the United States.
63
Naveen Dargan became a Director of Baytex on December 31, 2010 and has been a director of Baytex Energy since September 1, 2003. He has been an independent businessman since June 2003. Prior thereto, he worked for over 20 years in the investment banking business, finishing his investment banking career as Senior Managing Director and Head of Energy Investment Banking at Raymond James Ltd. Mr Dargan is a director of CCS Corporation. He holds a Bachelor of Arts (Honours) degree in Mathematics and Economics, a Master of Business Administration degree and a Chartered Business Valuator designation.
R.E.T. (Rusty) Goepel became a Director of Baytex on December 31, 2010 and has been a director of Baytex Energy since May 11, 2005. He is currently Senior Vice President for Raymond James Ltd. He commenced his career in investment banking in 1968 and was President and co-founder of Goepel Shields & Partners, which later became Goepel McDermid Ltd. and was acquired by Raymond James Ltd. in 2001. Mr. Goepel holds a Bachelor of Commerce (Honours) degree.
Anthony W. Marino was appointed President, Chief Executive Officer and director of Baytex on October 22, 2010 and has held the same position with Baytex Energy since January 1, 2009. Mr. Marino joined Baytex Energy in November 2004 as Chief Operating Officer and was promoted to President and Chief Operating Officer in November 2007. Prior to joining Baytex Energy, Mr. Marino was President and Chief Executive Officer of Dominion Exploration Canada Ltd. (a subsidiary of Dominion Resources Inc.). Mr. Marino's earlier experience included managing the Jonah/Pinedale asset area for AEC Oil and Gas (USA) Inc., operations and business development management for Santa Fe Snyder Corp. and several technical and management positions with Atlantic Richfield Company. He is a registered professional engineer and a Chartered Financial Analyst, and has over 30 years of experience in the North American oil and gas industry. Mr. Marino has a Bachelor of Science degree with Highest Distinction in Petroleum Engineering from the University of Kansas and a Masters of Business Administration degree from California State University at Bakersfield. Mr. Marino is a member of the Board of Directors of Enterprise Saskatchewan, the central economic development agency of the Government of Saskatchewan, and was previously a member of both the Board of Governors for the Canadian Association of Petroleum Producers and the Board of Directors for the Independent Petroleum Association of Mountain States in the United States.
Gregory K. Melchin became a director of Baytex on December 31, 2010 and has been a director of Baytex Energy since May 20, 2008. He is currently the Chairperson of Enmax Corporation, a municipally-owned utility. He was a member of the Legislative Assembly of Alberta from 1997 to March 2008. Among his various assignments with the Government of Alberta, he was Minister of Energy, Minister of Seniors and Community Supports and Minister of Revenue. Prior to being elected to the Legislative Assembly of Alberta, he served in various management positions for 20 years in the Calgary business community. He holds a Bachelor of Science degree (major in accounting) and a Fellow Chartered Accountant designation from the Institute of Chartered Accountants of Alberta. He has also completed the Directors Education Program with the Institute of Corporate Directors.
Dale O. Shwed became a Director of Baytex on December 31, 2010 and has been a director of Baytex Energy since June 3, 1993. He has held the position of President and Chief Executive Officer of Crew Energy Inc., a public oil and gas company, since September 2003. Prior thereto, he was President and Chief Executive Officer of Baytex Energy from 1993 to August 2003. Mr. Shwed holds a Bachelor of Science degree specializing in Geology.
Daniel G. Anderson was appointed Vice President, U.S. Business Unit on September 14, 2011. In this role he is also President of Baytex's wholly-owned subsidiary, Baytex Energy USA Ltd., which is based in Denver, Colorado. Mr. Anderson has over 25 years of experience in the upstream and mid-stream energy industry in the U.S. He was formerly Vice President of Rocky Mountain and Mid-Continent Production with Berry Petroleum Company. Mr. Anderson previously held a variety of technical and management positions with Williams, Barrett Resources, Santa Fe Snyder and Conoco. His work has
64
involved both operating and business development activities in the Williston Basin, U.S. Rockies, Mid-Continent and Gulf Coast regions. Mr. Anderson received a Bachelor of Science degree in Petroleum Engineering from the Colorado School of Mines and is a practicing member of the Society of Petroleum Engineers (SPE).
Kendall D. Arthur was appointed Vice President, Saskatchewan Business Unit of Baytex on January 4, 2012. Mr. Arthur has over 10 years experience in the Canadian oil and gas industry. He joined Baytex Energy in 2006 as a Production Engineer in the Heavy Oil Business Unit. Prior to joining Baytex, he held various technical production, completions and operations roles with Husky Energy. Mr. Arthur received a Bachelor of Science degree in Mechanical Engineering from the University of Saskatchewan and is a practicing member of the Association of Professional Engineers, Geologists and Geophysicists of Alberta.
W. Derek Aylesworth was appointed Chief Financial Officer of Baytex on October 22, 2010 and has held the same position with Baytex Energy since November 2005. He is responsible for Baytex's capital markets, financial reporting and compliance, financial risk management, tax and treasury functions. Prior to joining Baytex Energy, Mr. Aylesworth held the position of Commercial Manager of the Ecuador Region business unit at EnCana Corporation. Prior thereto, he was the Division Vice President for the International New Ventures Exploration business unit of the same company. Mr. Aylesworth has over 20 years of experience in the Canadian oil and gas industry. Mr. Aylesworth holds a Bachelor of Commerce degree and is a chartered accountant with expertise in taxation and has experience as a tax advisor in both the oil and gas industry and public practice in Calgary.
Stephen Brownridge was appointed Vice President, Exploration of Baytex on December 31, 2010 and has held the same position with Baytex Energy since January 5, 2010. Mr. Brownridge has over 20 years experience in the Canadian oil and gas industry. He joined Baytex Energy in 1997 and held the position of Manager of the Heavy Oil Business Unit from September 2003 to December 2006 and Vice President, Heavy Oil from December 2006 to January 2010. Prior to joining Baytex Energy, Mr. Brownridge held technical positions with Koch Exploration Canada Corporation and Rigel Oil and Gas Ltd. Mr. Brownridge holds a Bachelor of Science degree with Honours in Geology from the University of Manitoba, and a Master of Science Degree in Geology obtained jointly from the University of Alberta and Louisiana State University.
Geoffrey J. Darcy was appointed Vice President, Marketing of Baytex on September 5, 2011. Prior to that, he was Director of North American Physical Crude Oil Trading for Barclays Bank. Mr. Darcy has over 25 years experience in marketing, trading and crude oil supply in both Canada and the U.S. He was formerly Vice President of North American Crude Oil Marketing with Nexen Inc., and worked in crude oil supply for United Refining Company and Petro-Canada earlier in his career. In his new role with Baytex, Mr. Darcy will lead our efforts to maximize the value of our products and to manage our risk exposures. Mr. Darcy has a Bachelor of Commerce degree with Honours in Economics with Distinction from Concordia University and a Master of Business Administration from the University of Calgary.
Murray J. Desrosiers was appointed Vice President, General Counsel and Corporate Secretary of Baytex on October 22, 2010 and has held the same positions with Baytex Energy since May 20, 2009. Mr. Desrosiers is a corporate lawyer with over 15 years of experience advising energy companies in the areas of corporate finance, mergers and acquisitions, corporate governance and securities compliance matters. He joined Baytex Energy in July 2008 and held the position of General Counsel from August 2008 to May 2009. Prior to joining Baytex Energy, he held senior legal positions with PrimeWest Energy Inc. (the operating company of PrimeWest Energy Trust), Shiningbank Energy Ltd. (the operating company of Shiningbank Energy Income Fund), Enbridge Inc. and Enbridge Management Services Inc. (the manager of Enbridge Income Fund). Mr. Desrosiers holds a Bachelor
65
of Laws from the University of Alberta and a Bachelor of Commerce (Finance) from the University of Calgary and is a member of the Law Society of Alberta.
Brian G. Ector was appointed Vice President, Investor Relations of Baytex on June 20, 2011 and is responsible for all of Baytex's investor relations functions. He joined Baytex in November 2009 and held the position of Director of Investor Relations from November 2009 to June 2011. Prior to joining Baytex, Mr. Ector spent 15 years as a sell-side research analyst (the last seven years with Scotia Capital) covering both energy trusts and exploration and production corporations. Mr. Ector received a Bachelor of Commerce with a concentration in finance from the University of Calgary and received his CFA designation in 1996. He is a member of CIRI, NIRI, the CFA Institute and the Calgary CFA Society.
Michael S. Kaluza joined Baytex as Vice President, Planning on June 20, 2011 and was appointed Vice President, Corporate Development & Planning on February 1, 2012. He has over 25 years of experience in the North American and international oil and gas industry. Prior to joining Baytex, he was Chief Operating Officer of Delphi Energy Corp. Prior to that, Mr. Kaluza held a variety of technical and management positions with Dominion Exploration and Production Inc. and Phillips Petroleum Company. Mr. Kaluza brings strong operational, engineering and project evaluation skills which will be valuable in developing our long range growth plans. Mr. Kaluza received a Bachelor of Science degree with Honours in Petroleum Engineering from Montana Tech of The University of Montana.
Brett J. McDonald was appointed Vice President, Land of Baytex on December 31, 2010 and has held the same position with Baytex Energy since December 1, 2006. Mr. McDonald has over 25 years of experience in the Canadian oil and gas industry. He joined Baytex Energy in 2000 and held the position of General Manager of Land from September 2003 to December 2006. Prior to joining Baytex Energy, Mr. McDonald held senior land negotiating positions with Newport Petroleum Corporation, Stampeder Exploration Ltd. and Murphy Oil Company Ltd. Mr. McDonald is a member of the Canadian Association of Petroleum Landmen.
Timothy R. Morris was appointed Vice President, U.S. Business Development of Baytex on December 31, 2010 and has held the same position with Baytex Energy since November 12, 2007. He joined Baytex Energy in April 2007 as Managing Director, U.S. Business Development. Mr. Morris has over 30 years of experience in the United States oil and gas industry. Prior to joining Baytex Energy, he held senior management positions with Berco Resources, LLC, Santa Fe Snyder Corporation, Snyder Oil Corporation, Petroleum, Inc. and Sohio Petroleum Corp. He received a Bachelor of Science degree with an area of emphasis in Minerals Land Management from the University of Colorado and is a Certified Professional Landman. He is a member of the Independent Petroleum Association of Mountain States, Denver Association of Petroleum Landmen and the American Association of Professional Landmen.
Marty L. Proctor was appointed Chief Operating Officer of Baytex on December 31, 2010 and has held the same position with Baytex Energy since January 14, 2009. Mr. Proctor has over 25 years of experience in the Canadian and international oil and gas industries, with particular emphasis in heavy oil operations. Prior to joining Baytex Energy, he was Senior Vice President responsible for upstream operations for StatoilHydro Canada. Prior to that, Mr. Proctor was Senior Vice President of North American Oil Sands Corporation and Vice President of Murphy Oil Company. Earlier in his career, he held technical and management positions with Maxx Petroleum, Central Resources (USA), BP Resources Canada and Husky Oil. Mr. Proctor earned both Bachelor and Master of Science degrees in Petroleum Engineering from the University of Alberta, where his research focused on thermal oil recovery. Mr. Proctor is a practicing member of the Association of Professional Engineers, Geologists and Geophysicists of Alberta, and is a member of the Canadian Heavy Oil Association and the Society of Petroleum Engineers.
66
Richard P. Ramsay was appointed Vice President, Alberta/B.C. Business Unit of Baytex on January 4, 2012. He originally joined Baytex Energy as Vice President, Heavy Oil on January 5, 2010. Mr. Ramsay has over 20 years of experience in the Canadian oil and gas industry and was formerly Chief Operating Officer of TAQA North Ltd. He previously held a variety of technical and management positions with Northrock Resources Ltd., Fletcher Challenge Energy Canada Inc., Amoco Canada Petroleum Ltd. and Dome Petroleum Ltd. Mr. Ramsay has a Bachelor of Science degree with Distinction in Mechanical Engineering from the University of Saskatchewan and is a practicing member of the Association of Professional Engineers, Geologists and Geophysists of Alberta.
Ownership of Securities by Management
As at March 1, 2012, the directors and executive officers of Baytex, as a group, beneficially owned, or controlled or directed, directly or indirectly, approximately 1.6 million Common Shares, or approximately 1.4 percent of the issued and outstanding Common Shares. No Debentures were owned by this same group.
Corporate Cease Trade Orders, Bankruptcies or Penalties or Sanctions
No director or executive officer of Baytex (nor any personal holding company of any of such persons) is, as of the date of this Annual Information Form, or was within ten years before the date of this Annual Information Form, a director, chief executive officer or chief financial officer of any company (including Baytex), that was subject to a cease trade order (including a management cease trade order), an order similar to a cease trade order or an order that denied the relevant company access to any exemption under securities legislation, in each case that was in effect for a period of more than 30 consecutive days (collectively, an "Order") that was issued while the director or executive officer was acting in the capacity as director, chief executive officer or chief financial officer or was subject to an order that was issued after the director or executive officer ceased to be a director, chief executive officer or chief financial officer and which resulted from an event that occurred while that person was acting in the capacity as director, chief executive officer or chief financial officer.
Except as disclosed above under "Directors and Officers", no director or executive officer of Baytex (nor any personal holding company of any of such persons), or shareholder holding a sufficient number of our securities of to materially affect control of us, is, as of the date of this Annual Information Form, or has been within the ten years before the date of this Annual Information Form, a director or executive officer of any company (including Baytex) that, while that person was acting in that capacity, or within a year of that person ceasing to act in that capacity, became bankrupt, made a proposal under any legislation relating to bankruptcy or insolvency or was subject to or instituted any proceedings, arrangement or compromise with creditors or had a receiver, receiver-manager or trustee appointed to hold its assets or has, within the ten years before the date of this Annual Information Form, become bankrupt, made a proposal under any legislation relating to bankruptcy or insolvency, or become subject to or instituted any proceedings, arrangement or compromise with creditors, or had a receiver, receiver-manager or trustee appointed to hold the assets of the director, executive officer or shareholder.
In addition, no director or executive officer of Baytex (nor any personal holding company of any of such persons), or shareholder holding a sufficient number of our securities of to materially affect control of us, has been subject to any penalties or sanctions imposed by a court relating to securities legislation or by a securities regulatory authority or has entered into a settlement agreement with a securities regulatory authority or any other penalties or sanctions imposed by a court or regulatory body that would likely be considered important to a reasonable investor in making an investment decision.
67
Conflicts
There are potential conflicts of interest to which the directors and officers of Baytex will be subject in connection with the operations of Baytex. In particular, certain of the directors and officers of Baytex are involved in managerial or director positions with other oil and gas companies whose operations May , from time to time, be in direct competition with those of Baytex and us or with entities which May , from time to time, provide financing to, or make equity investments in, competitors of Baytex and us. Conflicts, if any, will be subject to the procedures and remedies available under theBusiness Corporations Act (Alberta). TheBusiness Corporations Act (Alberta) provides that in the event that a director has an interest in a contract or proposed contract or agreement, the director will disclose his interest in such contract or agreement and will refrain from voting on any matter in respect of such contract or agreement unless otherwise provided in theBusiness Corporations Act (Alberta).
AUDIT COMMITTEE INFORMATION
Audit Committee Mandate and Terms of Reference
The text of the Audit Committees' Mandate and Terms of Reference is attached as Appendix C.
Composition of the Audit Committee
The members of our Audit Committee are Naveen Dargan, R.E.T. (Rusty) Goepel and Gregory K. Melchin, each of whom is "independent" and "financially literate", with the meaning of National Instrument 52-110 "Audit Committees". The relevant education and experience of each Audit Committee member is outlined below:
| | | | | | |
Name | | Independent | | Financially Literate | | Relevant Education and Experience |
|---|
Naveen Dargan | | Yes | | Yes | | Bachelor of Arts (Honours) degree in Mathematics and Economics, Master of Business Administration degree and Chartered Business Valuator designation. Independent businessman since June 2003; prior thereto Senior Managing Director and Head of Energy Investment Banking of Raymond James Ltd. |
R.E.T. (Rusty) Goepel | | Yes | | Yes | | Bachelor of Commerce (Honours) degree. Has over 40 years experience in the investment industry. Currently a Senior Vice President with Raymond James Ltd. (investment dealer). From 2004 to 2009, he was a member of the Audit Committee of TELUS Corporation, a telecommunications company that is listed on the TSX and the NYSE. |
68
| | | | | | |
Name | | Independent | | Financially Literate | | Relevant Education and Experience |
|---|
Gregory K. Melchin | | Yes | | Yes | | Bachelor of Science degree (major in accounting) and a Fellow Chartered Accountant designation from the Institute of Chartered Accountants of Alberta. Also completed the Directors Education Program with the Institute of Corporate Directors. Member of the Legislative Assembly of Alberta from March 1997 to March 2008. Prior to being elected to the Legislative Assembly of Alberta, served in various management positions for 20 years in the Calgary business community. |
Pre-Approval of Policies and Procedures
Although the Audit Committee has not adopted specific policies and procedures for the engagement of non-audit services by our auditors, it does pre-approve all non-audit services to be provided to us and our subsidiaries by the external auditors. The pre-approval for recurring services, such as preliminary work on the integrated audit, securities filings, translation of our financial statements and related management's discussion and analysis into the French language and tax and tax-related services, is provided on an annual basis and other services are subject to pre-approval as required.
External Auditor Service Fees
The following table provides information about the fees billed to us and our subsidiaries for professional services rendered by Deloitte & Touche LLP, our external auditors, during fiscal 2011 and 2010:
| | | | | | | |
| | Aggregate fees billed ($000s) | |
|---|
| | 2011 | | 2010 | |
|---|
Audit Fees | | | $1,252 | | | $848 | |
Audit-Related Fees | | | — | | | — | |
Tax Fees | | | 498 | | | 854 | |
| | | | | | |
| | | $1,750 | | | $1,702 | |
| | | | | | |
Audit Fees: Audit fees consist of fees for the audit of our annual financial statements or services that are normally provided in connection with statutory and regulatory filings or engagements. In addition to the fees for annual audits of financial statements and review of quarterly results, services in this category for fiscal 2011 and 2010 also include amounts for audit work performed in relation to the requirements of Section 404 of theSarbanes-Oxley Act of 2002 relating to internal control over financial reporting, review of our documents and processes for the conversion of our consolidated financial statements to International Financial Reporting Standards and review of documentation relating to the Corporate Conversion.
Audit-Related Fees: Audit-related fees consist of fees for assurance and related services that are reasonably related to the performance of the audit or review of our financial statements and are not reported as Audit Fees.
Tax Fees: Tax fees included tax planning and various taxation matters.
69
DESCRIPTION OF CAPITAL STRUCTURE
Share Capital
Baytex is authorized to issue an unlimited number of Common Shares without nominal or par value and 10,000,000 preferred shares, without nominal or par value, issuable in series. As at the date of this Annual Information Form, there were no preferred shares outstanding.
The following is a summary of certain provisions of the share capital of Baytex. For a complete description of the share provisions, reference should be made to the Articles of Incorporation of Baytex, a copy of which is accessible on the SEDAR website atwww.sedar.com (filed on January 10, 2011).
Common Shares
Holders of Common Shares are entitled to notice of, to attend and to one vote per share held at any meeting of the shareholders of the Corporation (other than meetings of a class or series of shares of the Corporation other than the Common Shares as such).
Holders of Common Shares will be entitled to receive dividends as and when declared by the Board of Directors on the Common Shares as a class, subject to prior satisfaction of all preferential rights to dividends attached to shares of other classes of shares of the Corporation ranking in priority to the Common Shares in respect of dividends.
Holders of Common Shares will be entitled in the event of any liquidation, dissolution or winding-up of the Corporation, whether voluntary or involuntary, or any other distribution of the assets of the Corporation among its shareholders for the purpose of winding-up its affairs, and subject to prior satisfaction of all preferential rights to return of capital on dissolution attached to all shares of other classes of shares of the Corporation ranking in priority to the Common Shares in respect of return of capital on dissolution, to share rateably, together with the holders of shares of any other class of shares of the Corporation ranking equally with the Common Shares in respect of return of capital on dissolution, in such assets of the Corporation as are available for distribution.
Preferred Shares
The preferred shares May be issued in one or more series, at any time or from time to time. Before any shares of a particular series are issued, the Board of Directors will fix the number of shares that will form such series and will, subject to the limitations set out in the preferred share terms described below, fix the designation, rights, privileges, restrictions and conditions to be attached to the preferred shares of such series, including, but without in any way limiting or restricting the generality of the foregoing, the rate, amount or method of calculation of dividends thereon, the time and place of payment of dividends, the consideration for and the terms and conditions of any purchase for cancellation, retraction or redemption thereof, conversion or exchange rights (if any), and whether into or for securities of Baytex or otherwise, voting rights attached thereto (if any), the terms and conditions of any share purchase or retirement plan or sinking fund, and restrictions on the payment of dividends on any shares other than preferred shares or payment in respect of capital on any shares in the capital of Baytex or creation or issue of debt or equity securities; the whole subject to filing of Articles of Amendment setting forth a description of such series including the designation, rights, privileges, restrictions and conditions attached to the shares of such series. Notwithstanding the foregoing: (a) the Board of Directors May at any time or from time to time change the rights, privileges, restrictions and conditions attached to unissued shares of any series of preferred shares; and (b) other than in the case of a failure to declare or pay dividends specified in any series of the Preferred Share, the voting rights attached to the preferred shares will be limited to one vote per Preferred Share at any meeting where the preferred shares and Common Shares vote together as a single class.
70
The preferred shares of each series will rank on a parity with the preferred shares of every other series with respect to accumulated dividends and return of capital. The preferred shares will be entitled to a preference over the Common Shares and over any other shares of Baytex ranking junior to the preferred shares with respect to priority in the payment of dividends and in the distribution of assets in the event of the liquidation, dissolution or winding-up of Baytex, whether voluntary or involuntary, or any other distribution of the assets of Baytex among its shareholders for the purpose of winding-up its affairs. If any cumulative dividends or amounts payable on a return of capital are not paid in full, the preferred shares of all series will participate rateably in respect of such dividends, including accumulations, if any, in accordance with the sums that would be payable on such shares if all such dividends were declared and paid in full, and in respect of any repayment of capital in accordance with the sums that would be payable on such repayment of capital if all sums so payable were paid in full; provided, however, that in the event of there being insufficient assets to satisfy in full all such claims as aforesaid, the claims of the holders of the preferred shares with respect to repayment of capital will first be paid and satisfied and any assets remaining thereafter shall be applied towards the payment in satisfaction of claims in respect of dividends. The preferred shares of any series May also be given such other preferences not inconsistent with the terms of the preferred shares over the Common Shares and any other shares ranking junior to the preferred shares as May be determined in the case of each such series of preferred shares.
The rights, privileges, restrictions and conditions attaching to the preferred shares May be repealed, altered, modified, amended or amplified or otherwise varied only with the sanction of the holders of the preferred shares given in such manner as May then be required by law, subject to a minimum requirement that such approval be given by resolution passed by the affirmative vote of a least two-thirds of the votes cast at a meeting of holders of preferred shares duly called for such purpose and held upon at least 21 days' notice at which a quorum is present comprising at least two persons present, holding or representing by proxy at least 10% per cent of the outstanding preferred shares or by a resolution in writing of all holders of the outstanding preferred shares. If any such quorum is not present within half an hour after the time appointed for the meeting, then the meeting shall be adjourned to a date being not less than 7 days later and at such time and place as May be appointed by the chairman and at such meeting a quorum will consist of that number of shareholders present in person or represented by proxy. The formalities to be observed with respect to the giving of notice of any such meeting or adjourned meeting and the conduct thereof shall be those which May from time to time be prescribed in the by-laws of Baytex with respect to meetings of Shareholders. On every vote taken at every such meeting or adjourned meeting each holder of a Preferred Share shall be entitled to one vote in respect of each one dollar of stated value of preferred shares held.
Debentures
On August 26, 2009, the Trust issued $150 million principal amount of 9.15% series A senior unsecured debentures. The 2016 Debentures pay interest semi-annually and mature on August 26, 2016 at which time they are due and payable. The 2016 Debentures are unsecured and therefore, for all practical purposes, are subordinate to the Credit Facilities. After August 26 of each of the following years, the 2016 Debentures are redeemable at our option, in whole or in part, with not less than 30 nor more than 60 days' notice at the following redemption prices (expressed as a percentage of the principal amount of the 2016 Debentures) plus accrued and unpaid interest thereon, if any: 2012 at 104.575%; 2013 at 103.050%; 2014 at 101.525%; and 2015 at 100%. In connection with the Corporate Conversion, Baytex assumed all of the rights and obligations of the Trust under the Debenture Indenture.
On February 17, 2011, we issued US$150 million principal amount of 6.75% series B senior unsecured debentures. The 2021 Debentures pay interest semi-annually and mature on February 21, 2017 at which time they are due and payable. The 2021 Debentures are unsecured and therefore, for all practical purposes, are subordinate to the Credit Facilities. After February 17 of each of the following years, the
71
2021 Debentures are redeemable at our option, in whole or in part, with not less than 30 nor more than 60 days' notice at the following redemption prices (expressed as a percentage of the principal amount of the 2021 Debentures) plus accrued and unpaid interest thereon, if any: 2016 at 103.375%; 2017 at 102.250%; 2018 at 101.125%; and 2019 at 100%.
For a complete description of the Debentures, reference should be made to the Debenture Indenture, a copy of which is accessible on the SEDAR website atwww.sedar.com (filed on January 1, 2011 and February 22, 2011).
Credit Facilities
As at March 1, 2012, Baytex Energy had a $40 million extendible operating loan facility with a chartered bank and a $660 million extendible syndicated loan facility with a syndicate of chartered banks, each of which constitute a revolving credit facility for a three-year term (to June 14, 2014), which is extendible annually for a 1, 2 or 3 year period (subject to a maximum three-year term at any time). The Credit Facilities contain standard commercial covenants for facilities of this nature. The Credit Facilities do not require any mandatory principal payments during the three-year term. Advances (including letters of credit) under the Credit Facilities can be drawn in either Canadian or U.S. funds and bear interest at the agent bank's prime lending rate, bankers' acceptance discount rates or London Interbank Offer Rates, plus applicable margins. The Credit Facilities are secured by a floating charge over all of Baytex Energy's assets and are guaranteed by Baytex and certain material restricted subsidiaries. The Credit Facilities do not include a term-out feature or a borrowing base restriction. In the event that we do not comply with covenants under the Credit Facilities, our ability to pay dividends to Shareholders may be restricted. See"Dividends — Dividend Policy".
The Credit Facilities contain restrictions on Baytex Energy's ability to make distributions to us, including the declaration or payment of any dividend or distribution to us as the holder of the capital stock of Baytex Energy and the payment of interest or principal on subordinated debt owed to us. Baytex Energy and its subsidiaries are restricted from making distributions to us when (i) a default or event of default under the Credit Facilities has occurred and is continuing, or (ii) distributions would be reasonably expected to have a material adverse effect on or impair the ability of Baytex Energy to fulfill its financial obligations to its lenders under the Credit Facilities. See also "Risk Factors — Risks Related to our Business and Operations — Our bank credit facilities will need to be renewed prior to June 14, 2014 and failure to renew, in whole or in part, or higher interest charges will adversely affect our financial condition".
DIVIDENDS
Dividend Policy
Our dividend policy is to pay a monthly dividend on our Common Shares on or about the 15th day following the end of each calendar month to Shareholders of record on or about the last business day of each such calendar month. Our dividend policy follows the general corporate philosophy of financial self sufficiency whereby, over the long term, development capital expenditures and dividend payments are planned to be financed from internally generated funds from operations. Unless otherwise indicated, all dividends paid or to be paid on our common shares are designated as "eligible dividends" for Canadian income tax purposes.
The amount of future cash dividends, if any, will be subject to the discretion of the Board of Directors and may vary depending on a variety of factors and conditions existing from time to time, including fluctuations in commodity prices, production levels, capital expenditure requirements, debt service requirements, operating costs, royalty burdens and foreign exchange rates. In addition, the payment of dividends by a corporation is governed by the liquidity and insolvency tests described in the ABCA. Pursuant to the ABCA, after the payment of a dividend, we must be able to pay our liabilities as they
72
become due and the realizable value of our assets must be greater than our liabilities and the legal stated capital of our outstanding securities. As at December 31, 2011, our legal stated capital was approximately $1.6 billion. Cash dividends to Shareholders are not assured or guaranteed and there can be no guarantee that Baytex will maintain its dividend policy. See " — Record of Dividends and Distributions" and "Risk Factors".
Pursuant to the Credit Facilities, we are restricted from paying dividends to Shareholders if a default or event of default has occurred and is continuing and, if no default or event of default has occurred which is continuing, where the dividend would or would reasonably be expected to have a material adverse effect on us or on our or our subsidiaries' ability to fulfill their obligations under the Credit Facilities or under any hedge agreements with lenders (or their affiliates) under the Credit Facilities.
The Debenture Indenture also contains certain limitations on maximum cumulative dividends. Restricted payments include the declaration or payment of any dividend or distribution by us and the payment of interest or principal on subordinated debt owed by us. We and certain of our subsidiaries are restricted from making any restricted payments unless at the time of, and immediately after giving effect to, the proposed restricted payment, no default or event of default under the Debenture Indenture has occurred and is continuing, and either: (i) (a) we could incur at least $1.00 of additional indebtedness (other than certain permitted debt) in accordance with the "Limitation on Incurrence of Indebtedness and Issuance of Disqualified Stock" covenant in the Debenture Indenture; (b) the ratio of consolidated debt to consolidated cash flow from operations does not exceed 3.0 to 1.0; and (c) the aggregate amount of all restricted payments declared or made after August 26, 2009 (other than certain permitted restricted payments) does not exceed the sum of: (A) 80% of consolidated cash flow from operations accrued on a cumulative basis since August 26, 2009, plus (B) 100% of the aggregate net cash proceeds received by us after August 26, 2009 from (x) the issuance by us of convertible debentures, or (y) capital contributions in respect of certain permitted equity that we receive from any person; plus (C) the aggregate net proceeds, including the fair market value of property received after August 26, 2009 other than cash (as determined by the Board of Directors), received by us from any person, other than a subsidiary, from the issuance or sale of debt securities (including convertible debentures) or disqualified stock that have been converted into or exchanged for certain permitted equity of us, plus the aggregate net cash proceeds received by us at the time of such conversion or exchange; or (ii) the aggregate amount of all restricted payments declared or made pursuant to paragraph (i) does not exceed the sum of certain unpaid funds from restricted payments not previously expended under paragraph (i), plus $50,000,000. As at the date of this Annual Information Form, we are in compliance with these covenants.
Cash dividends are not guaranteed. Our historical cash dividends (and the Trust's historical cash distributions) may not be reflective of future cash dividends, which will be subject to review by the Board of Directors taking into account our prevailing financial circumstances at the relevant time. Although we intend to pay dividends to Shareholders, these cash dividends may be reduced or suspended. The actual amount distributed will depend on numerous factors, including profitability, debt covenants and obligations, fluctuations in working capital, the timing and amount of capital expenditures, applicable law and other factors beyond our control. See "Risk Factors".
Record of Dividends and Distributions
Our dividend policy is to pay a monthly dividend on our Common Shares on or about the 15th day following the end of each calendar month to Shareholders of record on or about the last business day
73
of each such calendar month. See "Dividends — Dividend Policy". The following table sets forth the Common Share dividends that we have paid.
| | | | | | | |
| | Dividends per
Common Share ($) | |
|---|
Month | | 2012 | | 2011 | |
|---|
January | | | 0.22 | | | 0.20 | |
February | | | 0.22 | | | 0.20 | |
March | | | | | | 0.20 | |
April | | | | | | 0.20 | |
May | | | | | | 0.20 | |
June | | | | | | 0.20 | |
July | | | | | | 0.20 | |
August | | | | | | 0.20 | |
September | | | | | | 0.20 | |
October | | | | | | 0.20 | |
November | | | | | | 0.20 | |
December | | | | | | 0.22 | |
| | | | | | | |
Total | | | | | | $2.42 | |
| | | | | | | |
Our predecessor, the Trust, paid a monthly distribution on its Trust Units on or about the 15th day following the end of each calendar month to unitholders of record on or about the last business day of each such calendar month. The following table sets forth the distributions paid by the Trust from September 2003 to December 2010.
| | | | | | | | | | | | | | | | | | | | | | | | | |
| | Distributions per Trust Unit ($) | |
|---|
Month | | 2010 | | 2009 | | 2008 | | 2007 | | 2006 | | 2005 | | 2004 | | 2003 | |
|---|
January | | | 0.18 | | | 0.18 | | | 0.18 | | | 0.18 | | | 0.18 | | | 0.15 | | | 0.15 | | | — | |
February | | | 0.18 | | | 0.12 | | | 0.18 | | | 0.18 | | | 0.18 | | | 0.15 | | | 0.15 | | | — | |
March | | | 0.18 | | | 0.12 | | | 0.20 | | | 0.18 | | | 0.18 | | | 0.15 | | | 0.15 | | | — | |
April | | | 0.18 | | | 0.12 | | | 0.20 | | | 0.18 | | | 0.18 | | | 0.15 | | | 0.15 | | | — | |
May | | | 0.18 | | | 0.12 | | | 0.20 | | | 0.18 | | | 0.18 | | | 0.15 | | | 0.15 | | | — | |
June | | | 0.18 | | | 0.12 | | | 0.25 | | | 0.18 | | | 0.18 | | | 0.15 | | | 0.15 | | | — | |
July | | | 0.18 | | | 0.12 | | | 0.25 | | | 0.18 | | | 0.18 | | | 0.15 | | | 0.15 | | | — | |
August | | | 0.18 | | | 0.12 | | | 0.25 | | | 0.18 | | | 0.18 | | | 0.15 | | | 0.15 | | | — | |
September | | | 0.18 | | | 0.12 | | | 0.25 | | | 0.18 | | | 0.18 | | | 0.15 | | | 0.15 | | | 0.15 | |
October | | | 0.18 | | | 0.12 | | | 0.25 | | | 0.18 | | | 0.18 | | | 0.15 | | | 0.15 | | | 0.15 | |
November | | | 0.18 | | | 0.12 | | | 0.25 | | | 0.18 | | | 0.18 | | | 0.15 | | | 0.15 | | | 0.15 | |
December | | | 0.20 | | | 0.18 | | | 0.18 | | | 0.18 | | | 0.18 | | | 0.15 | | | 0.15 | | | 0.15 | |
| | | | | | | | | | | | | | | | | | |
Total | | | $2.18 | | | $1.56 | | | $2.64 | | | $2.16 | | | $2.16 | | | $1.80 | | | $1.80 | | | $0.60 | |
| | | | | | | | | | | | | | | | | | |
Dividend Reinvestment Plan
Baytex has a Dividend Reinvestment Plan (the "DRIP") that provides a convenient and cost-effective method for eligible holders in Canada and the United States to maximize their investment in Baytex by reinvesting their monthly cash dividends to acquire additional Common Shares. At the discretion of Baytex, Common Shares will either be issued from treasury or acquired in the open market at prevailing market prices. Pursuant to the terms of the DRIP, Common Shares issued from treasury are currently issued at a three percent discount to the "average market price" (as defined in the DRIP).
74
Baytex reserves the right at any time to change or eliminate the discount on Common Shares acquired from treasury. Shareholders are not required to participate in the DRIP. A Shareholder who does not participate will continue to receive monthly cash dividends on their Common Shares in the normal manner.
MARKET FOR SECURITIES
The Common Shares are listed and posted for trading on the TSX and the NYSE under the trading symbol "BTE". The Common Shares commenced trading on the TSX on January 7, 2011 and on the NYSE on January 3, 2011. The following table sets forth certain trading information for the Common Shares in Canada and the United States for the periods indicated.
| | | | | | | | | | | | | | | | | | | |
| | Canada
Composite Trading | | United States
Composite Trading | |
|---|
| | Price Range | |
| | Price Range | |
| |
|---|
| | High
($) | | Low
($) | | Volume
Traded | | High
($US) | | Low
($US) | | Volume
Traded | |
|---|
2011 | | | | | | | | | | | | | | | | | | | |
January(1) | | | 49.75 | | | 46.00 | | | 20,805,126 | | | 49.81 | | | 46.25 | | | 4,567,720 | |
February | | | 56.04 | | | 49.32 | | | 10,874,364 | | | 57.63 | | | 49.66 | | | 4,075,803 | |
March | | | 56.95 | | | 48.52 | | | 11,188,097 | | | 58.53 | | | 49.03 | | | 7,234,228 | |
April | | | 58.55 | | | 55.52 | | | 9,129,670 | | | 61.74 | | | 57.17 | | | 4,175,426 | |
May | | | 58.77 | | | 49.81 | | | 12,381,539 | | | 61.96 | | | 50.93 | | | 9,048,802 | |
June | | | 55.83 | | | 47.59 | | | 14,193,634 | | | 57.54 | | | 48.62 | | | 6,851,135 | |
July | | | 55.93 | | | 50.70 | | | 8,231,379 | | | 59.04 | | | 52.39 | | | 5,339,883 | |
August | | | 53.62 | | | 43.45 | | | 15,922,282 | | | 57.22 | | | 43.71 | | | 10,478,705 | |
September | | | 50.84 | | | 41.71 | | | 15,526,773 | | | 51.94 | | | 40.30 | | | 8,665,835 | |
October | | | 54.97 | | | 39.18 | | | 16,429,558 | | | 55.30 | | | 36.89 | | | 8,235,141 | |
November | | | 54.78 | | | 49.14 | | | 13,311,944 | | | 54.04 | | | 47.07 | | | 5,519,328 | |
December | | | 57.26 | | | 51.70 | | | 10,205,150 | | | 56.40 | | | 49.65 | | | 5,250,886 | |
2012 | | | | | | | | | | | | | | | | | | | |
January | | | 59.40 | | | 54.13 | | | 10,735,168 | | | 59.27 | | | 52.85 | | | 4,342,870 | |
February | | | 59.27 | | | 54.86 | | | 10,633,575 | | | 59.50 | | | 54.80 | | | 3,430,316 | |
Note:
- (1)
- The trading data for the Toronto Stock Exchange is for the period from January 7 to 31, 2011. The trading data for United States Composite Trading is for the period from January 3 to 31, 2011.
In connection with the Corporate Conversion, effective December 31, 2010, holders of Trust Units exchanged their Trust Units for Common Shares on a one-for-one basis. From September 8, 2003 to January 5, 2011, the Trust Units were listed and posted for trading on the TSX under the trading symbol "BTE.UN". From March 27, 2006 to December 31, 2010, the Trust Units were listed and posted for trading on the NYSE under the trading symbol "BTE". The following table sets forth
75
certain trading information for the Trust Units in Canada and the United States for the periods indicated.
| | | | | | | | | | | | | | | | | | | |
| | Canada
Composite Trading | | United States
Composite Trading | |
|---|
| | Price Range | |
| | Price Range | |
| |
|---|
| | High
($) | | Low
($) | | Volume
Traded | | High
($US) | | Low
($US) | | Volume
Traded | |
|---|
2003 | | | 10.89 | | | 9.19 | | | 40,973,662 | | | — | | | — | | | — | |
2004 | | | 14.00 | | | 9.78 | | | 93,252,808 | | | — | | | — | | | — | |
2005 | | | 18.78 | | | 12.42 | | | 87,481,272 | | | — | | | — | | | — | |
2006 | | | 28.66 | | | 16.81 | | | 102,652,240 | | | 25.87 | | | 16.63 | | | 33,615,100 | |
2007 | | | 22.92 | | | 16.68 | | | 86,189,613 | | | 21.75 | | | 15.51 | | | 46,189,896 | |
2008 | | | 35.37 | | | 12.81 | | | 123,670,870 | | | 35.20 | | | 9.81 | | | 97,403,098 | |
2009 | | | 30.50 | | | 9.77 | | | 123,555,826 | | | 29.33 | | | 7.84 | | | 88,314,675 | |
2010 | | | 48.18 | | | 27.72 | | | 133,959,260 | | | 47.92 | | | 25.00 | | | 52,968,182 | |
2011 | | | | | | | | | | | | | | | | | | | |
January (1-6) | | | 47.63 | | | 46.55 | | | 3,899,246 | | | — | | | — | | | — | |
RATINGS
The following information relating to our credit ratings is provided as it relates to our financing costs, liquidity and operations. Specifically, credit ratings affect our ability to obtain short-term and long-term financing and the cost of such financing. A reduction in our current credit ratings by the rating agencies, particularly a downgrade below the current ratings or a negative change in the ratings outlook, could adversely affect our cost of financing and our access to sources of liquidity and capital. In addition, changes in credit ratings may affect our ability to, and the associated costs of, (i) enter into ordinary course derivative or hedging transactions and may require us to post additional collateral under certain of its contracts, and (ii) enter into and maintain ordinary course contracts with customers and suppliers on acceptable terms.
Baytex Energy has been assigned a corporate credit rating of BB and our Debentures have been assigned a credit rating of BB- by Standard and Poor's Rating Services, a division of McGraw-Hill Companies (Canada) Corporation ("S&P"). S&P's credit ratings are on a long-term debt rating scale that ranges from AAA to D, which represents the range from highest to lowest quality of such securities rated. According to the S&P rating system, debt rated "BB" is considered less vulnerable to non-payment than other speculative issues, however it faces ongoing uncertainties or exposure to adverse business, financial, or economic conditions which could lead to the obligor's inability to meet its financial obligations. The ratings from AA to CCC may be modified by the addition of a plus (+) or a minus (-) sign to show relative standing within the major rating categories. In addition, S&P may add a rating outlook of "positive", "negative" or "stable" which assesses the potential direction of a long-term credit rating over the intermediate term (typically six months to two years).
Baytex Energy has been assigned a corporate family credit rating of B1 and our Debentures have been assigned a credit rating of B3, each with a stable outlook by Moody's Investor Service Inc. ("Moody's"). Moody's credit ratings are on a long-term debt rating scale that ranges from AAA to C, which represents the range from highest to lowest quality of such securities rated. According to the Moody's rating system, securities rated "B" are considered speculative and are subject to high credit risk. Moody's appends numerical modifiers 1, 2 and 3 to each generic rating classification from AA through C. The modifier 1 indicates that the security ranks in the higher end of its generic rating category; the modifier 2 indicates a mid-range ranking; and the modifier 3 indicates a ranking in the lower end of its generic rating category.
76
The credit ratings accorded to Baytex Energy and us by S&P and Moody's are not recommendations to purchase, hold or sell any of our securities inasmuch as such ratings do not comment as to market price or suitability for a particular investor. There is no assurance that any rating will remain in effect for any given period of time or that any rating will not be revised or withdrawn entirely by a rating agency in the future if in its judgment circumstances so warrant.
LEGAL PROCEEDINGS AND REGULATORY ACTIONS
There are no legal proceedings that we are or were a party to, or that any of our property is or was the subject of, during our most recently completed financial year, that were or are material to us, and there are no such material legal proceedings that we are currently aware of that are contemplated.
There were no: (i) penalties or sanctions imposed against us by a court relating to securities legislation or by a securities regulatory authority during our most recently completed financial year; (ii) other penalties or sanctions imposed by a court or regulatory body against us that would likely be considered important to a reasonable investor in making an investment decision; or (iii) settlement agreements we entered into with a court relating to securities legislation or with a securities regulatory authority during our most recently completed financial year.
INTEREST OF INSIDERS AND OTHERS IN MATERIAL TRANSACTIONS
There were no material interests, direct or indirect, of our directors and executive officers, any holder of Common Shares who beneficially owns or controls or directs, directly of indirectly, more than 10 percent of the outstanding Common Shares, or any known associate or affiliate of such persons, in any transactions since our inception or since the beginning of our last completed financial year which has materially affected or is reasonably expected to materially affect us.
AUDITORS, TRANSFER AGENT AND REGISTRAR
Deloitte & Touche LLP, Chartered Accountants, Calgary, Alberta, is our auditor and is independent within the meaning of the Rules of Professional Conduct of the Institute of Chartered Accountants of Alberta.
Valiant Trust Company, at its principal offices in Calgary, Alberta and Toronto, Ontario, is the transfer agent and registrar for the Common Shares and the Debentures in Canada. Registrar and Transfer Company, at its principal office in Cranford, New Jersey, is the transfer agent and registrar for the Common Shares in the United States.
INTERESTS OF EXPERTS
There is no person or company whose profession or business gives authority to a statement made by such person or company and who is named as having prepared or certified a report, valuation, statement or opinion described or included in a filing, or referred to in a filing, made under National Instrument 51-102 by us during, or related to, our most recently completed financial year other than Sproule, our independent engineering evaluator. None of the designated professionals of Sproule have any registered or beneficial interests, direct or indirect, in any of our securities or other property or of our associates or affiliates either at the time they prepared a report, valuation, statement or opinion, at any time thereafter or to be received by them.
In addition, none of the aforementioned persons or companies, nor any director, officer or employee of any of the aforementioned persons or companies, is or is expected to be elected, appointed or employed as a director, officer or employee of Baytex or of any associate or affiliate of Baytex, except for John Brussa, a director of Baytex, who is a partner at Burnet, Duckworth & Palmer LLP, a law firm that renders legal services to us.
77
MATERIAL CONTRACTS
Except for contracts entered into in the ordinary course of business, the only material contracts entered into by us within the most recently completed financial year, or before the most recently completed financial year but are still material and are still in effect, are the following:
- (a)
- the credit agreement in respect of the Credit Facilities (filed on SEDAR on July 22, 2011);
- (b)
- the Debenture Indenture (filed on SEDAR on January 1, 2011 and February 22, 2011);
- (c)
- our share award incentive plan (filed on SEDAR on February 22, 2012); and
- (d)
- our common share rights incentive plan (filed on SEDAR on January 10, 2011).
Copies of each of these contracts are accessible on the SEDAR website atwww.sedar.com.
INDUSTRY CONDITIONS
Companies operating in the oil and natural gas industry are subject to extensive regulation and control of operations (including land tenure, exploration, development, production, refining and upgrading, transportation, and marketing) as a result of legislation enacted by various levels of government and with respect to the pricing and taxation of oil and natural gas through agreements among the governments of Canada, Alberta, British Columbia, Saskatchewan, the United States, North Dakota and Wyoming all of which should be carefully considered by investors in the oil and gas industry. It is not expected that any of these regulations or controls will affect our operations in a manner materially different than they will affect other oil and natural gas companies of similar size. All current legislation is a matter of public record and we are unable to predict what additional legislation or amendments may be enacted. Outlined below are some of the principal aspects of legislation, regulations and agreements governing the Canadian oil and gas industry.
Pricing and Marketing
Oil
The producers of oil are entitled to negotiate sales contracts directly with oil purchasers, with the result that the market determines the price of oil. Oil prices are primarily based on worldwide supply and demand. The specific price depends in part on oil quality, prices of competing fuels, distance to market, value of refined products, the supply/demand balance and contractual terms of sale. Oil exporters are also entitled to enter into export contracts with terms not exceeding one year in the case of light crude oil and two years in the case of heavy crude oil, provided that an order approving such export has been obtained from the National Energy Board of Canada (the "NEB"). Any oil export to be made pursuant to a contract of longer duration (to a maximum of 25 years) requires an exporter to obtain an export licence from the NEB.
Natural Gas
The price of the vast majority of natural gas produced in western Canada is now determined through highly liquid market hubs such as the Alberta "NIT" (Nova Inventory Transfer) hub rather than through direct negotiation between buyers and sellers. Natural gas exported from Canada is subject to regulation by the NEB and the Government of Canada. Exporters are free to negotiate prices and other terms with purchasers, provided that the export contracts must continue to meet certain other criteria prescribed by the NEB and the Government of Canada. Natural gas (other than propane, butane and ethane) exports for a term of less than two years or for a term of two to 20 years (in quantities of not more than 30,000 m3/day) must be made pursuant to an NEB order. Any natural gas export to be made pursuant to a contract of longer duration (to a maximum of 25 years) or for a larger quantity requires an exporter to obtain an export licence from the NEB.
78
The governments of Alberta, British Columbia and Saskatchewan also regulate the volume of natural gas that may be removed from those provinces for consumption elsewhere based on such factors as reserve availability, transportation arrangements and market considerations.
The North American Free Trade Agreement
The North American Free Trade Agreement ("NAFTA") among the governments of Canada, the United States and Mexico became effective on January 1, 1994. In the context of energy resources, Canada continues to remain free to determine whether exports of energy resources to the United States or Mexico will be allowed, provided that any export restrictions do not: (i) reduce the proportion of energy resources exported relative to the total supply of goods of the party maintaining the restriction as compared to the proportion prevailing in the most recent 36 month period; (ii) impose an export price higher than the domestic price (subject to an exception with respect to certain measures which only restrict the volume of exports); and (iii) disrupt normal channels of supply. All three signatory countries are prohibited from imposing a minimum or maximum export price requirement in any circumstance where any other form of quantitative restriction is prohibited. The signatory countries are also prohibited from imposing a minimum or maximum import price requirement except as permitted in enforcement of countervailing and anti-dumping orders and undertakings. NAFTA requires energy regulators to ensure the orderly and equitable implementation of any regulatory changes and to ensure that the application of those changes will cause minimal disruption to contractual arrangements and avoid undue interference with pricing, marketing and distribution arrangements, all of which are important for Canadian oil and natural gas exports.
Royalties and Incentives
General
In addition to federal regulation, each province has legislation and regulations which govern royalties, production rates and other matters. The royalty regime in a given province is a significant factor in the profitability of oil sands projects, crude oil, natural gas liquids, sulphur and natural gas production. Royalties payable on production from lands other than Crown lands are determined by negotiation between the mineral freehold owner and the lessee, although production from such lands is subject to certain provincial taxes and royalties. Royalties from production on Crown lands are determined by governmental regulation and are generally calculated as a percentage of the value of gross production. The rate of royalties payable generally depends in part on prescribed reference prices, well productivity, geographical location, field discovery date, method of recovery and the type or quality of the petroleum product produced. Other royalties and royalty-like interests are, from time to time, carved out of the working interest owner's interest through non-public transactions. These are often referred to as overriding royalties, gross overriding royalties, net profits interests, or net carried interests.
Occasionally the governments of the western Canadian provinces create incentive programs for exploration and development. Such programs often provide for royalty rate reductions, royalty holidays or royalty tax credits and are introduced to encourage exploration and development activity generally or to encourage development of targeted resources.
Alberta
Producers of oil and natural gas from Crown lands in Alberta are required to pay annual rental payments, currently at a rate of $3.50 per hectare, and make monthly royalty payments in respect of oil and natural gas produced.
Royalties are currently paid pursuant to "The New Royalty Framework" (implemented by theMines and Minerals (New Royalty Framework) Amendment Act, 2008) and the "Alberta Royalty Framework", which was implemented in 2010.
79
Royalty rates for conventional oil are set by a single sliding rate formula which is applied monthly and incorporates separate variables to account for production rates and market prices. Effective January 1, 2011, the maximum royalty payable under the royalty regime was set at 40%. The royalty curve for conventional oil announced on May 27, 2010 amends the price component of the conventional oil royalty formula to moderate the increase in the royalty rate at prices higher than $535/m3 compared to the previous royalty curve.
Royalty rates for natural gas under the royalty regime are similarly determined using a single sliding rate formula incorporating separate variables to account for production rates and market prices. Effective January 1, 2011, the maximum royalty payable under the royalty regime was set at 36%. The royalty curve for natural gas announced on May 27, 2010 amends the price component of the natural gas royalty formula to moderate the increase in the royalty rate at prices higher than $5.25/GJ compared to the previous royalty curve.
Oil sands projects are also subject to the Alberta's royalty regime. Prior to payout of an oil sands project, the royalty is payable on gross revenues of an oil sands project. Gross revenue royalty rates range from 1% to 9% depending on the market price of oil, determined using the average monthly price, expressed in Canadian dollars, for WTI crude oil at Cushing, Oklahoma: rates are 1% when the market price of oil is less than or equal to $55 per barrel and increases for every dollar of market price of oil increase to a maximum of 9% when oil is priced at $120 per barrel or higher. After payout, the royalty payable is the greater of the gross revenue royalty based on the gross revenue royalty rate of 1% to 9% and the net revenue royalty based on the net revenue royalty rate. The rate for the net revenue royalty is 25% when the price for WTI crude oil at Cushing, Oklahoma, expressed in Canadian dollars, is less than or equal to $55 per barrel. The net revenue royalty increases when the market price exceeds $55 per barrel to a maximum of 40% of net revenue when the oil price is equal to or greater than $120 per barrel. In addition, concurrently with the implementation of the New Royalty Framework, the Government of Alberta renegotiated existing contracts with certain oil sands producers that were not compatible with the current royalty regime.
Producers of oil and natural gas from freehold lands in Alberta are required to pay annual freehold production taxes. The level of the freehold production tax is based on the volume of monthly production and a specified rate of tax for both oil and gas.
The Innovative Energy Technologies Program (the "IETP"), which is currently in place, has the stated objectives of increasing recovery from oil and gas deposits, finding technical solutions to the gas over bitumen issue, improving the recovery of bitumen by in-situ and mining techniques and improving the recovery of natural gas from coal seams. The IETP provides royalty adjustments to specific pilot and demonstration projects that utilize new or innovative technologies to increase recovery from existing reserves.
The Government of Alberta currently has in place two royalty programs, both of which commenced in 2008 and are intended to encourage the development of deeper, higher cost oil and gas reserves. A five-year program for conventional oil exploration wells over 2,000 metres provides qualifying wells with up to a $1 million or 12 months of royalty relief, whichever comes first, and a five-year program for natural gas wells deeper than 2,500 metres provides a sliding scale royalty credit based on depth of up to $3,750 per metre. On May 27, 2010, the natural gas deep drilling program was amended, retroactive to May 1, 2010, by reducing the minimum qualifying depth to 2,000 metres, removing a supplemental benefit of $875,000 for wells exceeding 4,000 metres that are spudded subsequent to that date, and including wells drilled into pools drilled prior to 1985, among other changes.
On November 19, 2008, the Government of Alberta announced the introduction of a five-year program of transitional royalty rates with the intent of promoting new drilling. The five-year transition option is designed to provide lower royalties at certain price levels in the initial years of a well's life when production rates are expected to be the highest. Under this program, companies drilling new natural
80
gas or conventional deep oil wells (between 1,000 and 3,500 m) are given a one-time option, on a well-by-well basis, to adopt either the new transitional royalty rates or those outlined in the royalty regime. These options expired on February 15, 2011 and on January 1, 2014, all producers operating under the transitional royalty rates will automatically become subject to the royalty regime. The revised royalty curves for conventional oil and natural gas will not be applied to production from wells operating under the transitional royalty rates.
On March 3, 2009, the Government of Alberta announced a three-point incentive program in order to stimulate new and continued economic activity in Alberta. One aspect of the program was a drilling royalty credit program which provided up to a $200 per metre royalty credit for new wells. The drilling credit program applied to wells that were drilled between April 1, 2009 and March 31, 2010 and has not been extended for wells drilled after March 31, 2010. All remaining credits from this program expired in 2011. Another aspect of the program was a new well royalty program which provided for a maximum 5% royalty rate for eligible new wells for the first twelve (12) productive months or until the regulated "volume cap" was reached. TheNew Well Royalty Regulation, providing for the permanent implementation of this incentive program, was approved by an Order-in-Council on March 17, 2011.
In addition to the foregoing, the Government of Alberta has implemented certain initiatives intended to accelerate technological development and facilitate the development of unconventional resources (the "Emerging Resource and Technologies Initiative"). Specifically:
- •
- Coalbed methane wells will receive a maximum royalty rate of 5% for 36 months on up to 750 MMcf of production, retroactive to wells that began producing on or after May 1, 2010;
- •
- Shale gas wells will receive a maximum royalty rate of 5% for 36 months with no limitation on production volume, retroactive to wells that began producing on or after May 1, 2010;
- •
- Horizontal gas wells will receive a maximum royalty rate of 5% for 18 months on up to 500 MMcf of production, retroactive to wells that commenced drilling on or after May 1, 2010; and
- •
- Horizontal oil wells and horizontal non-project oil sands wells will receive a maximum royalty rate of 5% with volume and production month limits set according to the depth of the well (including the horizontal distance), retroactive to wells that commenced drilling on or after May 1, 2010.
The Emerging Resource and Technologies Initiative will be reviewed in 2014, and the Government of Alberta has committed to providing industry with three years notice at that time if it decides to discontinue the program.
British Columbia
Producers of oil and natural gas from Crown lands in British Columbia are required to pay annual rental payments, currently at a rate of $3.50 per hectare, and make monthly royalty payments in respect of oil and natural gas produced. The amount payable as a royalty in respect of oil depends on the type and vintage of the oil, the quantity of oil produced in a month and the value of that oil. Generally, oil is classified as either light or heavy and the vintage of oil is based on the determination of whether the oil is produced from a pool discovered before October 31, 1975 ("old oil"), between October 31, 1975 and June 1, 1998 ("new oil"), or after June 1, 1998 ("third-tier oil"). The royalty calculation takes into account the production of oil on a well-by-well basis, the specified royalty rate for a given vintage of oil, the average unit selling price of the oil and any applicable royalty exemptions. Royalty rates are reduced on low productivity wells, reflecting the higher unit costs of extraction, and are the lowest for third-tier oil, reflecting the higher unit costs of both exploration and extraction.
The royalty payable in respect of natural gas produced on Crown lands is determined by a sliding scale formula based on a reference price, which is the greater of the average net price obtained by the producer and a prescribed minimum price. For non-conservation gas (not produced in association with
81
oil), the royalty rate depends on the date of acquisition of the oil and natural gas tenure rights and the spud date of the well and may also be impacted by the select price, a parameter used in the royalty rate formula to account for inflation. Royalty rates are fixed for certain classes of non-conservation gas when the reference price is below the select price. Conservation gas is subject to a lower royalty rate than non-conservation gas as an incentive for the production and marketing of natural gas which might otherwise have been flared.
Producers of oil and natural gas from freehold lands in British Columbia are required to pay monthly freehold production taxes. For oil, the level of the freehold production tax is based on the volume of monthly production. For natural gas, the freehold production tax is determined using a sliding scale formula based on the reference price similar to that applied to natural gas production on Crown land, and depends on whether the natural gas is conservation gas or non-conservation gas.
British Columbia maintains a number of targeted royalty programs for key resource areas intended to increase the competitiveness of British Columbia's low productivity wells. These include both royalty credit and royalty reduction programs, including the following:
- •
- Summer Royalty Credit Program providing a royalty credit of 10% of drilling and completion costs up to $100,000 for wells drilled between April 1 and November 30 of each year, intended to increase summer drilling activity, employment and business opportunities in northeastern British Columbia;
- •
- Deep Royalty Credit Program providing a royalty credit equal to approximately 23% of drilling and completion costs for vertical wells with a true vertical depth greater than 2,500 metres and horizontal wells with a true vertical depth greater than 2,300 metres;
- •
- Deep Re-Entry Royalty Credit Program providing royalty credits for deep re-entry wells with a true vertical depth greater than 2,300 metres and a re-entry date subsequent to December 1, 2003;
- •
- Deep Discovery Royalty Credit Program providing the lesser of a 3-year royalty holiday or 283,000,000 m3 of royalty free gas for deep discovery wells with a true vertical depth greater than 4,000 metres whose surface locations are at least 20 kilometres away from the surface location of any well drilled into a recognized pool within the same formation with a spud date after November 30, 2003;
- •
- Coalbed Gas Royalty Reduction and Credit Program providing a royalty reduction for coalbed gas wells with average daily production less than 17,000 m3 as well as a royalty credit for coalbed gas wells equal to $50,000 for wells drilled on Crown land and a tax credit equal to $30,000 for wells drilled on freehold land;
- •
- Marginal Royalty Reduction Program providing royalty reductions for low productivity natural gas wells with average monthly production under 25,000 m3 during the first 12 production months and average daily production less than 23 m3 for every metre of marginal well depth;
- •
- Ultra-Marginal Royalty Reduction Program providing additional royalty reductions for low productivity shallow natural gas wells with a true vertical depth of less than 2,500 metres in the case of vertical wells, and a total vertical depth of less than 2,300 metres in the case of a horizontal well, average monthly production under 60,000 m3 during the first 12 production months and average daily production less than 11.5 m3 (development wells) or 17 m3 (exploratory wildcat wells) for every 100 metres of marginal well depth; and
- •
- Net Profit Royalty Reduction Program providing reduced initial royalty rates to facilitate the development and commercialization of technically complex resources such as coalbed gas, tight gas, shale gas and enhanced-recovery projects, with higher royalty rates applied once capital costs have been recovered.
82
Oil produced from an oil well that is located on either Crown or freehold land and completed in a new pool discovered subsequent to June 30, 1974 may also be exempt from the payment of a royalty for the first 36 months of production or 11,450 m3 of production, whichever comes first.
The Government of British Columbia also maintains an Infrastructure Royalty Credit Program (the "Infrastructure Royalty Credit Program") which provides royalty credits for up to 50% of the cost of certain approved road construction or pipeline infrastructure projects intended to improve, or make possible, the access to new and underdeveloped oil and gas areas. In 2009, 2010 and 2011, the Government of British Columbia awarded $120 million in royalty credits to oil and gas companies under the Infrastructure Royalty Credit Program.
On August 6, 2009, the Government of British Columbia announced an oil and gas stimulus package designed to attract investment in and create economic benefits for British Columbia. The stimulus package includes four royalty initiatives related primarily to natural gas drilling and infrastructure development. British Columbia's existing Deep Royalty Credit Program was permanently amended for wells spudded after August 31, 2009 by increasing the royalty deduction on deep drilling for natural gas by 15% and extending the program to include horizontal wells drilled to depths of between 1,900 and 2,300 metres. An additional $50 million was also allocated to be distributed through the Infrastructure Royalty Credit Program to stimulate investment in oilfield-related road and pipeline construction.
Saskatchewan
In Saskatchewan, the amount payable as Crown royalty or freehold production tax in respect of oil depends on the type and vintage of oil, the quantity of oil produced in a month, the value of the oil produced and specified adjustment factors determined monthly by the provincial government. For Crown royalty and freehold production tax purposes, conventional oil is classified as "heavy oil", "southwest designated oil" or "non-heavy oil other than southwest designated oil". The conventional royalty and production tax classifications ("fourth tier oil", "third tier oil", "new oil" and "old oil") depend on the finished drilling date of a well and are applied to each of the three crude oil types slightly differently. Heavy oil is classified as third tier oil (having a finished drilling date on or after January 1, 1994 and before October 1, 2002), fourth tier oil (having a finished drilling date on or after October 1, 2002) or new oil (not classified as either third tier oil or fourth tier oil). Southwest designated oil uses the same definitions of third and fourth tier oil but new oil is defined as conventional oil produced from a horizontal well having a finished drilling date on or after February 9, 1998 and before October 1, 2002. For non-heavy oil other than southwest designated oil, the same classification is used but new oil is defined as conventional oil produced from a vertical well completed after 1973 and having a finished drilling date prior to 1994, whereas old oil is defined as conventional oil not classified as third or fourth tier oil or new oil.
Base prices are used to establish lower limits in the price-sensitive royalty structure for conventional oil. Where average wellhead prices are below the established base prices of $100 per m3 for third and fourth tier oil and $50 per m3 for new oil and old oil, base royalty rates are applied. Base royalty rates are 5% for all fourth tier oil, 10% for heavy oil that is third tier oil or new oil, 12.5% for southwest designated oil that is third tier oil or new oil, 15% for non-heavy oil other than southwest designated oil that is third tier or new oil, and 20% for old oil. Where average wellhead prices are above base prices, marginal royalty rates are applied to the proportion of production that is above the base oil price. Marginal royalty rates are 30% for all fourth tier oil, 25% for heavy oil that is third tier oil or new oil, 35% for southwest designated oil that is third tier oil or new oil, 35% for non-heavy oil other than southwest designated oil that is third tier or new oil, and 45% for old oil.
83
The amount payable as Crown royalty or freehold production tax in respect of natural gas production is determined by a sliding scale based on the actual price received, the quantity produced in a given month, the type of natural gas, and the vintage of the natural gas. Like conventional oil, natural gas may be classified as "non-associated gas" or "associated gas" and royalty rates are determined according to the finished drilling date of the respective well. As an incentive for the production and marketing of natural gas which may have been flared, the royalty rate on natural gas produced in association with oil is less than on non-associated natural gas. Non-associated gas is classified as new gas (having a finished drilling date before February 9, 1998 with a first production date on or after October 1, 1976), third tier gas (having a finished drilling date on or after February 9, 1998 and before October 1, 2002), fourth tier gas (having a finished drilling date on or after October 1, 2002) and old gas (not classified as either third tier, fourth tier or new gas). A similar classification is used for associated gas except that the classification of old gas is not used, the definition of fourth tier gas also includes production from oil wells with a finished drilling date prior to October 1, 2002, where the individual oil well has a gas-oil production ratio in any month of more than 3,500 m3 of gas for every m3 of oil, and new gas is defined as oil produced from a well with a finished drilling date before February 9, 1998 that received special approval, prior to October 1, 2002, to produce oil and gas concurrently without gas-oil ratio penalties.
On December 9, 2010, the Government of Saskatchewan enacted theFreehold Oil and Gas Production Tax Act, 2010 replacing the existingFreehold Oil and Gas Production Tax Act with the intention to facilitate more efficient payment of freehold production taxes by industry. No regulations have been passed with respect to the calculation of freehold production taxes under the new legislation, although several regulations remain in force under the previous legislation.
As with conventional oil production, base prices are used to establish lower limits in the price-sensitive royalty structure for natural gas. Where average field-gate prices are below the established base prices of $50 per thousand m3 for third and fourth tier gas and $35 per thousand m3 for new gas and old gas, base royalty rates are applied. Base royalty rates are 5% for all fourth tier gas, 15% for third tier or new gas, and 20% for old gas. Where average well-head prices are above base prices, marginal royalty rates are applied to the proportion of production that is above the base gas price. Marginal royalty rates are 30% for all fourth tier gas, 35% for third tier and new gas, and 45% for old gas.
The Government of Saskatchewan currently provides a number of targeted incentive programs. These include both royalty reduction and incentive volume programs, including the following:
- •
- Royalty/Tax Incentive Volumes for Vertical Oil Wells Drilled on or after October 1, 2002 providing reduced Crown royalty and freehold tax rates on incentive volumes of 8,000 m3 for deep development vertical oil wells, 4,000 m3 for non-deep exploratory vertical oil wells and 16,000 m3 for deep exploratory vertical oil wells (more than 1,700 metres or within certain formations);
- •
- Royalty/Tax Incentive Volumes for Exploratory Gas Wells Drilled on or after October 1, 2002 providing reduced Crown royalty and freehold tax rates on incentive volumes of 25,000,000 m3 for qualifying exploratory gas wells;
- •
- Royalty/Tax Incentive Volumes for Horizontal Oil Wells Drilled on or after October 1, 2002 providing reduced Crown royalty and freehold tax rates on incentive volumes of 6,000 m3 for non-deep horizontal oil wells and 16,000 m3 for deep horizontal oil wells (more than 1,700 metres or within certain formations);
- •
- Royalty/Tax Incentive Volumes for Horizontal Gas Wells drilled on or after June 1, 2010 and before April 1, 2013 providing reduced Crown royalty and freehold tax rates on incentive volumes of 25,000,000 m3 for horizontal gas wells;
84
- •
- Royalty/Tax Regime for Incremental Oil Produced from New or Expanded Waterflood Projects Implemented on or after October 1, 2002 treating incremental production from waterflood projects as fourth tier oil for the purposes of royalty calculation;
- •
- Royalty/Tax Regime for Enhanced Oil Recovery Projects (Excluding Waterflood Projects) Commencing prior to April 1, 2005 providing Crown royalty and freehold tax determinations based in part on the profitability of enhanced recovery projects pre- and post-payout;
- •
- Royalty/Tax Regime for Enhanced Oil Recovery Projects (Excluding Waterflood Projects) Commencing on or after April 1, 2005 providing a Crown royalty of 1% of gross revenues on enhanced oil recovery projects pre-payout and 20% post-payout and a freehold production tax of 0% on operating income from enhanced oil recovery projects pre-payout and 8% post-payout; and
- •
- Royalty/Tax Regime for High Water-Cut Oil Wells granting "third tier oil" royalty/tax rates to incremental high water-cut oil production resulting from qualifying investments made to rejuvenate eligible oil wells and/or associated facilities.
In 1975, the Government of Saskatchewan introduced a Royalty Tax Rebate ("RTR") as a response to the Government of Canada disallowing crown royalties and similar taxes as a deductible business expense for income tax purposes. As of January 1, 2007, the remaining balance of any unused RTR will be limited in its carry forward to seven years since the Government of Canada's initiative to reintroduce the full deduction of provincial resource royalties from federal and provincial taxable income. Saskatchewan's RTR will be wound down as a result of the Government of Canada's plan to reintroduce full deductibility of provincial resource royalties for corporate income tax purposes.
On June 22, 2011, the Government of Saskatchewan released the Upstream Petroleum Industry Associated Gas Conservation Standards which are designed to reduce emissions resulting for the flaring and venting of associated gas (the "Associated Natural Gas Standards"). The Associated Natural Gas Standards were jointly developed with industry and the implementation of such standards is set to commence on July 1, 2012 for new wells and facilities licensed on or after such date, and to apply to existing licensed wells and facilities on July 1, 2015.
Land Tenure
Crude oil and natural gas located in the western provinces is owned predominantly by the respective provincial governments. Provincial governments grant rights to explore for and produce oil and natural gas pursuant to leases, licences, and permits for varying terms, and on conditions set forth in provincial legislation including requirements to perform specific work or make payments. Oil and natural gas located in such provinces can also be privately owned and rights to explore for and produce such oil and natural gas are granted by lease on such terms and conditions as may be negotiated.
Each of the provinces of Alberta, British Columbia and Saskatchewan has implemented legislation providing for the reversion to the Crown of mineral rights to deep, non-productive geological formations at the conclusion of the primary term of a lease or license. On March 29, 2007, British Columbia's policy of deep rights reversion was expanded for new leases to provide for the reversion of both shallow and deep formations that cannot be shown to be capable of production at the end of their primary term.
Alberta also has a policy of "shallow rights reversion" which provides for the reversion to the Crown of mineral rights to shallow, non-productive geological formations for all leases and licenses. For leases and licenses issued subsequent to January 1, 2009, shallow rights reversion will be applied at the conclusion of the primary term of the lease or license. Holders of leases or licences that have been continued indefinitely prior to January 1, 2009 will receive a notice regarding the reversion of the shallow rights, which will be implemented three years from the date of the notice. Leases and licences that were granted prior to January 1, 2009 but continued after that date are not subject to shallow
85
rights reversion until they reach the end of their primary term and are continued (at which time deep rights reversion will be applied); thereafter, the holders of such agreements will be served with shallow rights reversion notices based on vintage and location similar to leases and licences that were already continued as of January 1, 2009. The order in which these agreements will receive reversion notices will depend on their vintage and location, and the Government of Alberta had anticipated that the receipt of reversion notices for older leases and licenses would commence in April 2011. However, on April 14, 2011, the Government of Alberta announced it was deferring serving shallow rights reversion notices and will revisit the decision in spring 2012.
Environmental Regulation
The oil and natural gas industry is currently subject to environmental regulations pursuant to a variety of provincial and federal legislation, all of which is subject to governmental review and revision from time to time. Such legislation provides for restrictions and prohibitions on the release or emission of various substances produced in association with certain oil and gas industry operations, such as sulphur dioxide and nitrous oxide. In addition, such legislation requires that well and facility sites be abandoned and reclaimed to the satisfaction of provincial authorities. Compliance with such legislation can require significant expenditures and a breach of such requirements may result in suspension or revocation of necessary licenses and authorizations, civil liability for pollution damage, and the imposition of material fines and penalties.
In December, 2008, the Government of Alberta released a new land use policy for surface land in Alberta, the Alberta Land Use Framework (the "ALUF"). The ALUF sets out an approach to manage public and private land use and natural resource development in a manner that is consistent with the long-term economic, environmental and social goals of the province. It calls for the development of region-specific land use plans in order to manage the combined impacts of existing and future land use within a specific region and the incorporation of a cumulative effects management approach into such plans.
TheAlberta Land Stewardship Act (the "ALSA") was proclaimed in force in Alberta on October 1, 2009 and provides the legislative authority for the Government of Alberta to implement the policies contained in the ALUF. Regional plans established pursuant to the ALSA will be deemed to be legislative instruments equivalent to regulations and will be binding on the Government of Alberta and provincial regulators, including those governing the oil and gas industry. In the event of a conflict or inconsistency between a regional plan and another regulation, regulatory instrument or statutory consent, the regional plan will prevail. Further, the ALSA requires local governments, provincial departments, agencies and administrative bodies or tribunals to review their regulatory instruments and make any appropriate changes to ensure that they comply with an adopted regional plan. The ALSA also contemplates the amendment or extinguishment of previously issued statutory consents such as regulatory permits, leases, licenses, approvals and authorizations for the purpose of achieving or maintaining an objective or policy resulting from the implementation of a regional plan. Among the measures to support the goals of the regional plans contained in the ALSA are conservation easements, which can be granted for the protection, conservation and enhancement of land; and conservation directives, which are explicit declarations contained in a regional plan to set aside specified lands in order to protect, conserve, manage and enhance the environment.
On August 29, 2011 the Government of Alberta released a revised draft of the Lower Athabasca Regional Plan (the "Revised LARP") updating its prior draft of April 5, 2011 (the "Draft LARP"). The Revised LARP, while establishing several conservation areas of the Athabasca region, has changed the boundaries of certain conservation areas outlined in the Draft LARP with the result that fewer oil sands leases appear to be impacted. Consistent with the Draft LARP, as the intention of the Revised LARP is to manage the areas to minimize or prevent new land disturbance, activities associated with oil sands development are considered incompatible with the intent to manage such conservation areas.
86
However, references to the cancellation of existing tenures have been removed from the Revised LARP and the Revised LARP now contemplates that the conservation areas will be created pursuant to existing legislation rather than the previously contemplated regulations. Existing conventional petroleum and natural gas rights will not be affected, although the Revised LARP raises some question as to whether new conventional leases and licenses will be granted in the conservation areas in the future. The planning process is also underway for a regional plan for the South Saskatchewan Region.
Climate Change Regulation
Federal
In December 2002, the Government of Canada ratified the Kyoto Protocol ("Kyoto Protocol"), which requires a reduction in greenhouse gas ("GHG") emissions by signatory countries between 2008 and 2012. The Kyoto Protocol officially came into force on February 16, 2005 although on December 12, 2011 Canada formally withdrew from the Kyoto Protocol.
On April 26, 2007, the Government of Canada released "Turning the Corner: An Action Plan to Reduce Greenhouse Gases and Air Pollution" (the "Action Plan") which set forth a plan for regulations to address both GHGs and air pollution. An update to the Action Plan, "Turning the Corner: Regulatory Framework for Industrial Greenhouse Gas Emissions" was released on March 10, 2008 (the "Updated Action Plan"). The Updated Action Plan outlines emissions intensity-based targets which will be applied to regulated sectors on either a facility-specific, sector-wide or company-by-company basis. Facility-specific targets apply to the upstream oil and gas, oil sands, petroleum refining and natural gas pipelines sectors. Unless a minimum regulatory threshold applies, all facilities within a regulated sector will be subject to the emissions intensity targets.
The Updated Action Plan makes a distinction between "Existing Facilities" and "New Facilities". For Existing Facilities, the Updated Action Plan requires an emissions intensity reduction of 18% below 2006 levels by 2010 followed by a continuous annual emissions intensity improvement of 2%. "New Facilities" are defined as facilities beginning operations in 2004 and include both greenfield facilities and major facility expansions that (i) result in a 25% or greater increase in a facility's physical capacity, or (ii) involve significant changes to the processes of the facility. New Facilities will be given a 3-year grace period during which no emissions intensity reductions will be required. Targets requiring an annual 2% emissions intensity reduction will begin to apply in the fourth year of commercial operation of a New Facility. Further, emissions intensity targets for New Facilities will be based on a cleaner fuel standard to encourage continuous emissions intensity reductions over time. The method of applying this cleaner fuel standard has not yet been determined. In addition, the Updated Action Plan indicates that targets for the adoption of carbon capture and storage ("CCS") technologies will be developed for oil sands in-situ facilities, upgraders and coal-fired power generators that begin operations in 2012 or later. These targets will become operational in 2018, although the exact nature of the targets has not yet been determined.
Given the large number of small facilities within the upstream oil and gas and natural gas pipeline sectors, facilities within these sectors will only be subject to emissions intensity targets if they meet certain minimum emissions thresholds. That threshold will be (i) 50,000 tonnes of CO2 equivalents per facility per year for natural gas pipelines; (ii) 3,000 tonnes of CO2 equivalents per facility per year for the upstream oil and gas facility; and (iii) 10,000 boe/d/company. These regulatory thresholds are significantly lower than the regulatory threshold in force in Alberta, discussed below. In all other sectors governed by the Updated Action Plan, all facilities will be subject to regulation.
87
Four separate compliance mechanisms are provided for in the Updated Action Plan in respect of the above targets:
- (a)
- Regulated entities will be able to use Technology Fund contributions to meet their emissions intensity targets. The contribution rate for Technology Fund contributions will increase over time, beginning at $15 per tonne of CO2 equivalent for the 2010 to 2012 period, rising to $20 in 2013, and thereafter increasing at the nominal rate of GDP growth. Maximum contribution limits will also decline from 70% in 2010 to 0% in 2018. Monies raised through contributions to the Technology Fund will be used to invest in technology to reduce GHG emissions. Alternatively, regulated entities may be able to receive credits for investing in large-scale and transformative projects at the same contribution rate and under similar requirements as described above.
- (b)
- The offset system is intended to encourage emissions reductions from activities outside of the regulated sphere, allowing non-regulated entities to participate in and benefit from emissions reduction activities. In order to generate offset credits, project proponents must propose and receive approval for emissions reduction activities that will be verified before offset credits will be issued to the project proponent. Those credits can then be sold to regulated entities for use in compliance or non-regulated purchasers that wish to either purchase the offset credits for cancellation or banking for future use or sale.
- (c)
- Under the Updated Action Plan, regulated entities were able to purchase credits created through the Clean Development Mechanism of the Kyoto Protocol which facilitates investment by developed nations in emissions-reduction projects in developing countries. The purchase of such Emissions Reduction Credits will be restricted to 10% of each firm's regulatory obligation, with the added restriction that credits generated through forest sink projects will not be available for use in complying with the Canadian regulations. However, with the recent withdrawal from the Kyoto Protocol, the future use of this mechanism may not occur.
- (d)
- Finally, a one-time credit of up to 15 million tonnes worth of emissions credits will be awarded to regulated entities for emissions reduction activities undertaken between 1992 and 2006. These credits will be both tradable and bankable.
From December 7 to 18, 2009, government leaders and representatives met in Copenhagen, Denmark and agreed to the Copenhagen Accord, which reinforces the commitment to reducing GHG emissions contained in the Kyoto Protocol and promises funding to help developing countries mitigate and adapt to climate change. Another meeting of government leaders and representatives in 2010 resulted in the Cancun Agreements wherein developed countries committed to additional measures to help developing countries deal with climate change. Neither the Copenhagen Accord nor the Cancun Agreements establish binding GHG emissions reduction targets. In response to the Copenhagen Accord, the Government of Canada indicated that it will seek to achieve a 17% reduction in GHG emissions from 2005 levels by 2020.
Although draft regulations for the implementation of the Updated Action Plan were intended to become binding on January 1, 2010, only draft regulations pertaining to carbon dioxide emissions from coal-fired generation of electricity have been proposed to date. Further, representatives of the Government of Canada have indicated that the proposals contained in the Updated Action Plan will be modified to ensure consistency with the direction ultimately taken by the United States with respect to GHG emissions regulation. As a result, it is unclear to what extent, if any; the proposals contained in the Updated Action Plan will be implemented.
The United States Environmental Protection Agency (the "EPA") has indicated its intention to impose GHG emissions standards for fossil fuel-fired power plants by specifying that it will issue final regulations by May 26, 2012, and with respect to refineries, specifying that it will issue proposed
88
regulations by December 10, 2011 and finalized regulations by November 10, 2012. The EPA did not meet the December 10, 2011 deadline and it is unclear whether the EPA will also miss the finalized regulations deadline.
Alberta
Alberta enacted theClimate Change and Emissions Management Act (the "CCEMA") on December 4, 2003, amending it through theClimate Change and Emissions Management Amendment Act which received royal assent on November 4, 2008. The CCEMA is based on an emissions intensity approach similar to the Updated Action Plan and aims for a 50% reduction from 1990 emissions relative to GDP by 2020.
Alberta facilities emitting more than 100,000 tonnes of GHGs a year are subject to compliance with the CCEMA. Similar to the Updated Action Plan, the CCEMA and the associatedSpecified Gas Emitters Regulation make a distinction between "Established Facilities" and "New Facilities". Established Facilities are defined as facilities that completed their first year of commercial operation prior to January 1, 2000 or that have completed eight or more years of commercial operation. Established Facilities are required to reduce their emissions intensity to 88% of their baseline for 2008 and subsequent years, with their baseline being established by the average of the ratio of the total annual emissions to production for the years 2003 to 2005. New Facilities are defined as facilities that completed their first year of commercial operation on December 31, 2000, or a subsequent year, and have completed less than eight years of commercial operation, or are designated as New Facilities in accordance with theSpecified Gas Emitters Regulation. New Facilities are required to reduce their emissions intensity by 2% from baseline in the fourth year of commercial operation, 4% of baseline in the fifth year, 6% of baseline in the sixth year, 8% of baseline in the seventh year, and 10% of baseline in the eighth year. Unlike the Updated Action Plan, the CCEMA does not contain any provision for continuous annual improvements in emissions intensity reductions beyond those stated above.
The CCEMA contains compliance mechanisms that are similar to the Updated Action Plan. Regulated emitters can meet their emissions intensity targets by contributing to the Climate Change and Emissions Management Fund (the "Fund") at a rate of $15 per tonne of CO2 equivalent. Unlike the Updated Action Plan, CCEMA contains no provisions for an increase to this contribution rate. Emissions credits can be purchased from regulated emitters that have reduced their emissions below the 100,000 tonne threshold or non-regulated emitters that have generated emissions offsets through activities that result in emissions reductions in accordance with established protocols published by the Government of Alberta.
On December 2, 2010, the Government of Alberta passed theCarbon Capture and Storage Statutes Amendment Act, 2010, which deemed the pore space underlying all land in Alberta to be, and to have always been, the property of the Crown and provided for the assumption of long-term liability for carbon sequestration projects by the Crown, subject to the satisfaction of certain conditions.
As at year-end 2011, Baytex did not have an interest in any facilities in Alberta that emit more than 100,000 tonnes of CO2 equivalents per year.
British Columbia
In February, 2008, British Columbia announced a revenue-neutral carbon tax that took effect July 1, 2008. The tax is consumption-based and applied at the time of retail sale or consumption of virtually all fossil fuels purchased or used in British Columbia. The current tax level is $25 per tonne of CO2 equivalent. It is scheduled to increase to $30 per tonne of CO2 equivalent on July 31, 2012. In order to make the tax revenue-neutral, British Columbia has implemented tax credits and reductions in order to offset the tax revenues that the Government of British Columbia would otherwise receive from the tax.
89
On April 3, 2008, British Columbia introduced theGreenhouse Gas Reduction (Cap and Trade) Act (the "Cap and Trade Act") which received royal assent on May 29, 2008 and partially came into force by regulation of the Lieutenant Governor in Council. Unlike the emissions intensity approach taken by the federal government and the Government of Alberta, the Cap and Trade Act establishes an absolute cap on GHG emissions. Although more specific details of British Columbia's cap and trade plan have not yet been finalized, on January 1, 2010, new reporting regulations came into force requiring all British Columbia facilities emitting over 10,000 tonnes of CO2 equivalents per year to begin reporting their emissions. Facilities reporting emissions greater than 25,000 tonnes of CO2 equivalents per year are required to have their emissions reports verified by a third party. Regulations pertaining to proposed offsets and emissions trading are currently in the consultation stage.
As at year-end 2011, Baytex's Cache Creek facility emitted more than 10,000 tonnes of CO2 equivalents per year and, therefore, will be subject to reporting requirements under the Cap and Trade Act. As at year-end 2011, Baytex did not have an interest in any facilities in British Columbia that emit more than 25,000 tonnes of CO2 equivalents per year.
Saskatchewan
On May 11, 2009, the Government of Saskatchewan announcedThe Management and Reduction of Greenhouse Gases Act (the "MRGGA") to regulate GHG emissions in the province. The MRGGA received Royal Assent on May 20, 2010 and will come into force on proclamation. Regulations under the MRGGA have also yet to be proclaimed, but draft versions indicate that Saskatchewan will adopt the goal of a 20% reduction in GHG emissions from 2006 levels by 2020 and permit the use of pre-certified investment credits, early action credits and emissions offsets in compliance, similar to both the federal and Alberta climate change initiatives. It remains unclear whether the scheme implemented by the MRGGA will be based on emissions intensity or an absolute cap on emissions.
United States
Our wholly-owned subsidiary, Baytex USA, owns oil and natural gas properties and related assets in North Dakota and Wyoming in the United States. Baytex USA's oil and natural gas operations in the United States are regulated by administrative agencies under statutory provisions of the states where such operations are conducted and by certain agencies of the federal government for operations on federal leases. These statutory provisions regulate matters such as the exploration for and production of crude oil and natural gas, including provisions related to permits for the drilling of wells, bonding requirements in order to drill or operate wells, the location of wells, the method of drilling and casing wells, the surface use and restoration of properties upon which wells are drilled, and the abandonment of wells. Baytex USA's operations in the United States are also subject to various conservation laws and regulations which regulate matters such as the size of drilling and spacing units or proration units, the number of wells which may be drilled in an area, and the unitization or pooling of crude oil and natural gas properties. In addition, state conservation laws sometimes establish maximum rates of production from crude oil and natural gas wells, generally prohibit the venting or flaring of natural gas, and impose certain requirements regarding the rateability or fair apportionment of production from fields and individual wells.
ADDITIONAL INFORMATION
Additional information relating to us can be found on the SEDAR website atwww.sedar.com and on our website atwww.baytex.ab.ca. Additional information, including directors' and officers' remuneration and indebtedness, principal holders of our securities and securities issued and authorized for issuance under our equity compensation plans will be contained in our Information Circular — Proxy Statement for the annual meeting of Shareholders to be held on May 15, 2012. Additional financial information is contained in our consolidated financial statements for the year ended December 31, 2011 and the
90
related management's discussion and analysis which are accessible on the SEDAR website atwww.sedar.com. For additional copies of this Annual Information Form and the materials listed in the preceding paragraphs, please contact:
| | | | |
Baytex Energy Corp. | | |
Suite 2800, Centennial Place, East Tower |
520 - 3rd Avenue S.W. |
Calgary, Alberta T2P 0R3 |
Phone: | | (587) 952-3000 | | |
Fax: | | (587) 952-3029 | | |
Website: | | www.baytex.ab.ca | | |
91
APPENDIX A
REPORT OF MANAGEMENT AND DIRECTORS ON OIL AND GAS DISCLOSURE
Form 51-101F3
Management of Baytex Energy Corp. ("Baytex") is responsible for the preparation and disclosure of information with respect to Baytex's oil and natural gas activities in accordance with securities regulatory requirements. This information includes reserves data, which are estimates of proved reserves and probable reserves and related future net revenue as at December 31, 2011, estimated using forecast prices and costs.
An independent qualified reserves evaluator has evaluated Baytex's reserves data. The report of the independent qualified reserves evaluator is presented below.
The Reserves Committee of the Board of Directors of Baytex (the "Reserves Committee") has:
- (a)
- reviewed Baytex's procedures for providing information to the independent qualified reserves evaluator;
- (b)
- met with the independent qualified reserves evaluator to determine whether any restrictions affected the ability of the independent qualified reserves evaluator to report without reservation; and
- (c)
- reviewed the reserves data with management and the independent qualified reserves evaluator.
The Reserves Committee has reviewed Baytex's procedures for assembling and reporting other information associated with oil and natural gas activities and has reviewed that information with management. The Board of Directors of Baytex has, on the recommendation of the Reserves Committee, approved:
- (a)
- the content and filing with securities regulatory authorities of Form 51-101F1 containing reserves data and other oil and gas information;
- (b)
- the filing of Form 51-101F2 which is the report of the independent qualified reserves evaluator on the reserves data; and
- (c)
- the content and filing of this report.
Because the reserves data are based on judgments regarding future events, actual results will vary and the variations may be material.
| | |
(signed) "Anthony W. Marino"
Anthony W. Marino
President and Chief Executive Officer | | (signed) "W. Derek Aylesworth"
W. Derek Aylesworth
Chief Financial Officer |
| | |
(signed) "Dale O. Shwed"
Dale O. Shwed
Director and Chairman of the Reserves Committee | | (signed) "John A. Brussa"
John A. Brussa
Director and Member of the Reserves Committee
|
March 15, 2012
APPENDIX B
REPORT ON RESERVES DATA BY INDEPENDENT QUALIFIED RESERVES EVALUATOR
Form 51-101F2
To the Board of Directors of Baytex Energy Corp. ("Baytex"):
- 1.
- We have evaluated Baytex's reserves data as at December 31, 2011. The reserves data are estimates of proved reserves and probable reserves and related future net revenue as at December 31, 2011, estimated using forecast prices and costs.
- 2.
- The reserves data are the responsibility of Baytex's management. Our responsibility is to express an opinion on the reserves data based on our evaluation.
We carried out our evaluation in accordance with standards set out in the Canadian Oil and Gas Evaluation Handbook (the "COGE Handbook") prepared jointly by the Society of Petroleum Evaluation Engineers (Calgary Chapter) and the Canadian Institute of Mining, Metallurgy & Petroleum (Petroleum Society).
- 3.
- Those standards require that we plan and perform an evaluation to obtain reasonable assurance as to whether the reserves data are free of material misstatement. An evaluation also includes assessing whether the reserves data are in accordance with principles and definitions presented in the COGE Handbook.
- 4.
- The following table sets forth the estimated future net revenue (before deduction of income taxes) attributed to proved plus probable reserves, estimated using forecast prices and costs and calculated using a discount rate of 10 percent, included in the reserves data of Baytex evaluated by us for the year ended December 31, 2011, and identifies the respective portions thereof that we have evaluated and reported on to the management and Board of Directors of Baytex:
| | | | | | | | | | | | | | | |
| |
| |
| | Net Present Value of Future Net Revenue
Before income taxes
(10% discount rate — $ millions) | |
|---|
Independent
Qualified Reserves
Evaluator or
Auditor | | Description and
Preparation Date of
Evaluation Report | | Location of
Reserves | |
|---|
| | Audited | | Evaluated | | Reviewed | | Total | |
|---|
| Sproule Associates Limited | | Evaluation of the P&NG
Reserves of Baytex Energy Corp.
(As of December 31, 2011).
Preparation Date:
March 7, 2012 | | Canada
United States
Total | | Nil
Nil
Nil | | | $4,426,617
389,646
$4,816,263 | | Nil
Nil
Nil | | | $4,426,617
389,646
$4,816,263 | |
| | | | | | | | | | | | | | |
- 5.
- In our opinion, the reserves data respectively evaluated by us have, in all material respects, been determined and are in accordance with the COGE Handbook, consistently applied.
- 6.
- We have no responsibility to update the report referred to in paragraph 4 for events and circumstances occurring after its preparation date.
- 7.
- Because the reserves data are based on judgements regarding future events, actual results will vary and the variations may be material.
Executed as to our report referred to above on March 15, 2012.
Sproule Associates Limited
| | |
(signed) "Cameron P. Six"
Cameron P. Six, P.Eng.
Vice-President, Engineering and Partner | | (signed) "Alec Kovaltchouk"
Alec Kovaltchouk, P.Geol
Manager, Geoscience and Partner |
| | | |
(signed) "Peter C. Sidey"
Peter C. Sidey, P.Eng.
Partner |
|
(signed) "Donald W. Woods"
Donald W. Woods, P.Eng.
Manager, Engineering and Partner |
APPENDIX C
BAYTEX ENERGY LTD.
AUDIT COMMITTEE
MANDATE AND TERMS OF REFERENCE
ROLE AND OBJECTIVE
The Audit Committee (the "Committee") is a committee of the board of directors (the "Board") of Baytex Energy Corp. (the "Corporation") to which the Board has delegated certain of its responsibilities. The primary responsibility of the Committee is to review the interim and annual financial statements of the Corporation and to recommend their approval or otherwise to the Board. The Committee is also responsible for reviewing and recommending to the Board the appointment and compensation of the external auditors of the Corporation, overseeing the work of the external auditors, including the nature and scope of the audit of the annual financial statements of the Corporation, pre-approving services to be provided by the external auditors and reviewing the assessments prepared by management and the external auditors on the effectiveness of the Corporation's internal controls over financial reporting.
The objectives of the Committee are to:
- 2.
- assist directors in meeting their responsibilities in respect of the preparation and disclosure of the financial statements of the Corporation and related matters;
- 3.
- facilitate communication between directors and the external auditors;
- 4.
- enhance the external auditors' independence;
- 5.
- increase the credibility and objectivity of financial reports; and
- 6.
- strengthen the role of the independent directors by facilitating in depth discussions between the Committee, management and the external auditors.
MEMBERSHIP OF THE COMMITTEE
- 1.
- The Committee shall be comprised of not less than three members all of whom are "independent" directors and "financially literate" (within the meaning of National Instrument 52-110 "Audit Committees"). The members of the Committee shall be appointed by the Board from time to time.
- 2.
- The Board shall appoint a Chair of the Committee, who shall be an independent director.
- 3.
- Any member of the Committee may be removed or replaced at any time by the Board and shall cease to be a member of the Committee as soon as such member ceases to be a director. The Board may fill vacancies on the Committee by appointment from among its members. If and whenever a vacancy shall exist on the Committee, the remaining members may exercise all its powers so long as a quorum remains. Subject to the foregoing, each member of the Committee shall hold such office until the close of the next annual meeting of shareholders of the Corporation following appointment as a member of the Committee.
MANDATE AND RESPONSIBILITIES OF THE COMMITTEE
- 1.
- It is the responsibility of the Committee to oversee the work of the external auditors, including resolution of disagreements between management and the external auditors regarding financial reporting. The external auditors shall report directly to the Committee.
- 2.
- It is the responsibility of the Committee to satisfy itself on behalf of the Board with respect to the Corporation's internal control systems by:
- •
- identifying, monitoring and mitigating business risks; and
- •
- ensuring compliance with legal, ethical and regulatory requirements.
- 3.
- It is a primary responsibility of the Committee to review the interim and annual financial statements of the Corporation prior to their submission to the Board for approval. The review process should include, without limitation:
- •
- reviewing changes in accounting principles, or in their application, which may have a material impact on the current or future years' financial statements;
- •
- reviewing significant accruals, reserves or other estimates such as the ceiling test calculation;
- •
- reviewing accounting treatment of unusual or non-recurring transactions;
- •
- ascertaining compliance with covenants under loan agreements;
- •
- reviewing disclosure requirements for commitments and contingencies;
- •
- reviewing adjustments raised by the external auditors, whether or not included in the financial statements;
- •
- reviewing unresolved differences between management and the external auditors;
- •
- obtaining explanations of significant variances with comparative reporting periods; and
- •
- determining through inquiry if there are any related party transactions and ensuring that the nature and extent of such transactions are properly disclosed.
- 4.
- The Committee is to review all public disclosure of audited or unaudited financial information by the Corporation before its release (and, if applicable, prior to its submission to the Board for approval), including the interim and annual financial statements of the Corporation, management's discussion and analysis of results of operations and financial condition, press releases and the annual information form. The Committee must be satisfied that adequate procedures are in place for the review of the Corporation's disclosure of financial information and shall periodically assess the accuracy of those procedures.
- 5.
- With respect to the external auditors of the Corporation, the Committee shall:
- •
- recommend to the Board the appointment of the external auditors, including the terms of their engagement for the integrated audit;
- •
- review and approve any other services to be provided by the external auditors (including the fee for such services); and
- •
- when there is to be a change in the external auditors, review the issues related to the change and the information to be included in the required notice to securities regulators of such change.
- 6.
- Review with the external auditors (and the internal auditor if one is appointed by the Corporation) their assessment of the internal controls of the Corporation, their written reports containing recommendations for improvement, and management's response and follow-up to any identified weaknesses. The Committee shall also review annually with the external auditors their plan for the audit and, upon completion of the audit, their reports upon the financial statements of the Corporation and its subsidiaries.
2
- 7.
- The Committee must pre-approve all services to be provided to the Corporation or its subsidiaries by the external auditors. In pre-approving any service, the Committee shall consider the impact that the provision of such service may have on the external auditors' independence. The Committee may delegate to one or more of its members the authority to pre-approve services, provided that the member report to the Committee at the next scheduled meeting such pre-approval and the member comply with such other procedures as may be established by the Committee from time to time.
- 8.
- The Committee shall review the risk management policies and procedures of the Corporation (i.e., hedging, litigation and insurance).
- 9.
- The Committee shall establish procedures for the receipt, retention and treatment of complaints received by the Corporation regarding accounting, internal accounting controls or auditing matters and the confidential, anonymous submission by employees of the Corporation and its subsidiary entities of concerns regarding questionable accounting or auditing matters.
- 10.
- The Committee shall review and approve the Corporation's hiring policies regarding employees and former employees of the present and former external auditors of the Corporation.
- 11.
- The Committee shall have the authority to investigate any financial activity of the Corporation. All employees of the Corporation and its subsidiary entities are to cooperate as requested by the Committee.
- 12.
- The Committee shall forthwith report the results of meetings and reviews undertaken and any associated recommendations to the Board.
- 13.
- The Committee shall meet with the external auditors at least four times per year (in connection with their review of the interim and annual financial statements) and at such other times as the external auditors and the Committee consider appropriate.
MEETINGS AND ADMINISTRATIVE MATTERS
- 1.
- At all meetings of the Committee every question shall be decided by a majority of the votes cast. In case of an equality of votes, the chairman of the meeting shall be entitled to a second or casting vote.
- 2.
- The Chair shall preside at all meetings of the Committee, unless the Chair is not present, in which case the members of the Committee present shall designate from among the members present a chairman for purposes of the meeting.
- 3.
- A quorum for meetings of the Committee shall be a majority of its members, and the rules for calling, holding, conducting and adjourning meetings of the Committee shall be the same as those governing the Board unless otherwise determined by the Committee or the Board.
- 4.
- Meetings of the Committee should be scheduled to take place at least four times per year and at such other times as the Chair may determine.
- 5.
- Agendas, approved by the Chair, shall be circulated to Committee members along with background information on a timely basis prior to the Committee meetings.
- 6.
- The Committee may invite those officers, directors and employees of the Corporation and its subsidiary entities as it may see fit from time to time to attend at meetings of the Committee and assist thereat in the discussion and consideration of the matters being considered by the Committee, provided that the Chief Financial Officer of the Corporation shall attend all meetings of the Committee, unless otherwise excused from all or part of any such meeting by the chairman of the meeting.
3
- 7.
- Minutes of the Committee's meetings will be recorded and maintained and made available to any director who is not a member of the Committee upon request.
- 8.
- The Committee may retain persons having special expertise and/or obtain independent professional advice to assist in fulfilling its responsibilities at the expense of the Corporation.
- 9.
- Any issues arising from the Committee's meetings that bear on the relationship between the Board and management should be communicated to the Executive Chairman or the Lead Independent Director, as applicable, by the Committee Chair.
Approved by the Board of Directors on February 28, 2011
4