
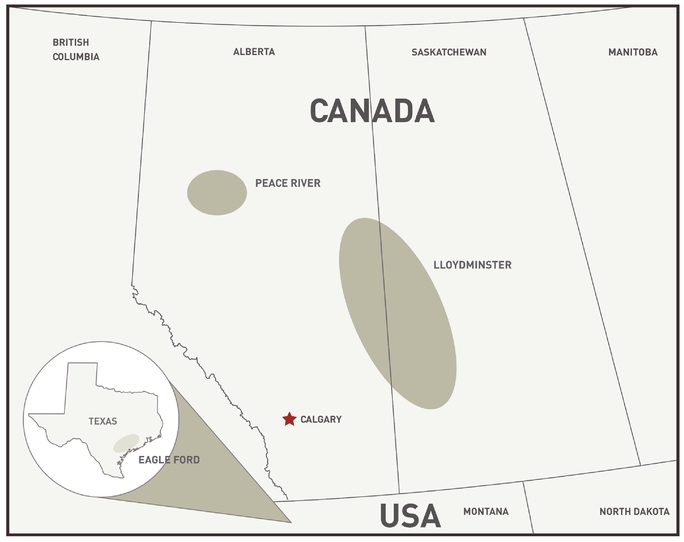
OPERATING AREAS
CONTENTS
| 5 | Message to Shareholders | |
8 | Management's Discusson and Analysis | |
33 | Management's Report | |
34 | Auditors' Reports | |
36 | Consolidated Financial Statements | |
65 | Reserves Information |
Years Ended | ||||||
| December 31, 2014 | December 31, 2013 | |||||
| FINANCIAL(thousands of Canadian dollars, except per common share amounts) | ||||||
| Petroleum and natural gas sales | 1,969,022 | 1,367,459 | ||||
| Funds from operations(1) | 879,790 | 604,438 | ||||
| Per share – basic | 5.91 | 4.88 | ||||
| Per share – diluted | 5.91 | 4.82 | ||||
| Cash dividends declared(2) | 301,118 | 237,663 | ||||
| Dividends declared per share | 2.64 | 2.64 | ||||
| Net income (loss) | (132,807 | ) | 164,845 | |||
| Per share – basic | (0.89 | ) | 1.33 | |||
| Per share – diluted | (0.89 | ) | 1.32 | |||
| Exploration and development | 766,070 | 550,900 | ||||
| Acquisitions, net of divestitures | 2,545,156 | (39,082 | ) | |||
Total oil and natural gas capital expenditures | 3,311,226 | 511,818 | ||||
| Bank loan(3) | 666,886 | 223,371 | ||||
| Long-term debt(3) | 1,418,685 | 459,540 | ||||
| Working capital deficiency | 210,409 | 79,151 | ||||
| Total monetary debt(4) | 2,295,980 | 762,062 | ||||
OPERATING | ||||||
Daily production | ||||||
| Heavy oil (bbl/d) | 44,948 | 42,064 | ||||
| Light oil and condensate (bbl/d) | 17,681 | 6,309 | ||||
| NGL (bbl/d) | 4,819 | 1,825 | ||||
| Total oil and NGL (bbl/d) | 67,448 | 50,198 | ||||
| Natural gas (mcf/d) | 65,234 | 41,989 | ||||
| Oil equivalent (boe/d @ 6:1)(5) | 78,321 | 57,195 | ||||
Average prices (before hedging) | ||||||
| WTI oil (US$/bbl) | 92.97 | 97.97 | ||||
| WCS Heavy Oil (US$/bbl) | 73.58 | 72.78 | ||||
| Edmonton par oil ($/bbl) | 95.28 | 93.24 | ||||
| LLS oil (US$/bbl) | 96.76 | 107.41 | ||||
| BTE heavy oil ($/bbl)(6) | 69.64 | 65.24 | ||||
| BTE light oil and condensate ($/bbl) | 91.37 | 90.31 | ||||
| BTE NGL ($/bbl) | 35.28 | 42.63 | ||||
| BTE total oil and NGL ($/bbl) | 72.88 | 67.57 | ||||
| BTE natural gas ($/mcf) | 4.53 | 3.32 | ||||
| BTE oil equivalent ($/boe) | 66.54 | 61.74 | ||||
CAD/USD noon rate at period end | 1.1601 | 1.0636 | ||||
| CAD/USD average rate for period | 1.1050 | 1.0299 | ||||
Baytex Energy Corp. 2014 Annual Report 1
Years Ended | |||||
| December 31, 2014 | December 31, 2013 | ||||
| COMMON SHARE INFORMATION | |||||
TSX | |||||
| Share price (Cdn$) | |||||
| High | 49.88 | 47.60 | |||
| Low | 14.56 | 36.37 | |||
| Close | 19.32 | 41.64 | |||
| Volume traded (thousands) | 273,743 | 105,097 | |||
NYSE | |||||
| Share price (US$) | |||||
| High | 46.46 | 47.47 | |||
| Low | 12.63 | 34.75 | |||
| Close | 16.61 | 39.16 | |||
| Volume traded (thousands) | 33,170 | 15,071 | |||
Common shares outstanding (thousands) | 168,107 | 125,392 | |||
Notes:
- (1)
- Funds from operations is not a measurement based on generally accepted accounting principles ("GAAP") in Canada, but is a financial term commonly used in the oil and gas industry. We define funds from operations as cash flow from operating activities adjusted for finance costs, changes in non-cash operating working capital and other operating items. Baytex's funds from operations may not be comparable to other issuers. Baytex considers funds from operations a key measure of performance as it demonstrates its ability to generate the cash flow necessary to fund future dividends and capital investments. For a reconciliation of funds from operations to cash flow from operating activities, see Management's Discussion and Analysis of the operating and financial results for the year ended December 31, 2014.
- (2)
- Cash dividends declared are net of participation in our Dividend Reinvestment Plan.
- (3)
- Principal amount of instruments.
- (4)
- Total monetary debt is a non-GAAP measure which we define to be the sum of monetary working capital (which is current assets less current liabilities (excluding non-cash items such as unrealized gains or losses on financial derivatives, assets held for sale and liabilities related to assets held for sale)), the principal amount of long-term debt and long-term bank loan.
- (5)
- Barrel of oil equivalent ("boe") amounts have been calculated using a conversion rate of six thousand cubic feet of natural gas to one barrel of oil. The use of boe amounts may be misleading, particularly if used in isolation. A boe conversion ratio of six thousand cubic feet of natural gas to one barrel of oil is based on an energy equivalency conversion method primarily applicable at the burner tip and does not represent a value equivalency at the wellhead.
- (6)
- Heavy oil prices exclude condensate blending.
2 Baytex Energy Corp. 2014 Annual Report
Advisory Regarding Forward-Looking Statements
This report contains forward-looking statements relating to: our business strategies, plans and objectives; our belief that we are positioned to weather the current downturn; our belief that the amendment of the financial covenants contained in our revolving credit facilities provides us with increased financial flexibility; our belief that we are well positioned to capitalize on our expanded and high quality asset base for years to come; our Eagle Ford shale play, including our assessment of the performance of wells drilled in the Eagle Ford in 2014, the capital efficiency of our Eagle Ford wells relative to other North American projects and our belief that the Eagle Ford has a significant and growing inventory of development prospects to support future growth; the timeline for development of our thermal recovery projects; the timing of completion of the second phase of Genalta Power's Peace River Power Centre and our expectation that it will increase the conservation of our solution gas; our annual average production rate for 2015; our capital budget for 2015; the geographic breakdown of our 2015 annual production; our production mix for 2015; the breakdown of our 2015 capital budget by area; our plan for developing our properties in 2015, including the number and type of wells and the geographic location of wells; our reserve life index; forecast prices for oil and natural gas; forecast interest and exchange rates; and future development costs. In addition, information and statements relating to reserves are deemed to be forward-looking statements, as they involve implied assessment, based on certain estimates and assumptions, that the reserves described exist in quantities predicted or estimated, and that the reserves can be profitably produced in the future. Cash dividends on our common shares are paid at the discretion of our Board of Directors and can fluctuate. In establishing the level of cash dividends, the Board of Directors considers all factors that it deems relevant, including, without limitation, the outlook for commodity prices, our operational execution, the amount of funds from operations and capital expenditures and our prevailing financial circumstances at the time. We refer you to the end of the Management's Discussion and Analysis section of this report for our advisory on forward-looking information and statements.
Contingent Resources
This report contains estimates of contingent resources. Contingent resources are not, and should not be confused with, petroleum and natural gas reserves. Contingent resources is defined in the Canadian Oil and Gas Evaluation Handbook as "those quantities of petroleum estimated, as of a given date, to be potentially recoverable from known accumulations using established technology or technology under development, but which are not currently considered to be commercially recoverable due to one or more contingencies. Contingencies may include factors such as economic, legal, environmental, political and regulatory matters or a lack of markets. It is also appropriate to classify as contingent resources the estimated discovered recoverable quantities associated with a project in the early evaluation stage." The outstanding contingencies applicable to our disclosed contingent resources do not include economic contingencies. In this report we refer to economic contingent resources which are those resources that are currently economically recoverable based on specific forecasts of commodity prices and costs. For additional information on contingent resources, we refer you to the end of this report for our advisory on oil and gas information.
Non-GAAP Financial Measures
Funds from operations is not a measurement based on Generally Accepted Accounting Principles ("GAAP") in Canada, but is a financial term commonly used in the oil and gas industry. Funds from operations represents cash generated from operating activities adjusted for financing costs, changes in non-cash operating working capital and other operating items. Baytex's determination of funds from operations may not be comparable with the calculation of similar measures for other entities. Baytex considers funds from operations a key measure of performance as it demonstrates its ability to generate the cash flow necessary to fund future dividends to shareholders and capital investments. The most directly comparable measures calculated in accordance with GAAP are cash flow from operating activities and net income.
Total monetary debt is not a measurement based on GAAP in Canada. We define total monetary debt as the sum of monetary working capital (which is current assets less current liabilities (excluding non-cash items such as unrealized gains or losses on financial derivatives, assets held for sale and liabilities related to assets held for sale)), the principal
Baytex Energy Corp. 2014 Annual Report 3
amount of long-term debt and bank loan. We believe that this measure assists in providing a more complete understanding of our cash liabilities.
Bank EBITDA is not a measurement based on GAAP in Canada. We define Bank EBITDA as our consolidated net income attributable to shareholders before interest, taxes, depletion and depreciation, and certain other non-cash items as set out in our credit agreements governing our unsecured revolving credit facilities. This measure is used to measure compliance with certain financial covenants.
Operating netback is not a measurement based on GAAP in Canada, but is a financial term commonly used in the oil and gas industry. Operating netback is equal to product revenue less royalties, production and operating expenses and transportation expenses dividend by barrels of oil equivalent sales volume for the applicable period. Baytex's determination of operating netback may not be comparable with the calculation of similar measures for other entities. Baytex believes that this measure assists in characterizing our ability to generate cash margin on a unit of production basis.
4 Baytex Energy Corp. 2014 Annual Report
The year 2014 was very active for Baytex highlighted by significant growth in assets associated with our Eagle Ford acquisition, the subsequent divestiture of certain non-core properties, as well as continued strong performance from our Canadian operations.
At Baytex we are committed to our growth and income business model and its three fundamental principles: delivering organic production growth, paying a meaningful dividend and maintaining capital discipline. Our strong operational performance in 2014 was masked by the sudden and sharp decline in global crude oil prices in the fourth quarter. As a North American focused crude oil producer, we were not immune to this changing environment.
When oil prices fall as they have, this can put stress on any business model. However, we believe we are well positioned to weather the current downturn and we will continue to prudently manage our business in order to preserve financial flexibility. Adjusting our dividend level in December was a decision not taken lightly by our Board of Directors, but one that was necessary in order to enhance our liquidity. At the same time, we have reduced our exploration and development spending for 2015 by approximately 40% from planned levels. We have also amended the financial covenants contained in our revolving credit facilities which provide us with increased financial flexibility.
Despite the precipitous fall in oil prices, we were able to execute on several strategic objectives. In 2014, we enhanced our portfolio through our entry into the Eagle Ford and executed on the largest capital development program in company history. We are encouraged by our operating results this year and we believe we are well positioned to capitalize on our expanded and high quality asset base for years to come.
Production and reserves growth are a key part of our growth and income business model. In 2014, we achieved significant growth in both areas largely the result of our Eagle Ford acquisition and a well-executed organic development program. During the year, we increased average production to 78,321 boe/d, representing a 37% increase over 2013 levels. In addition, we increased our proved plus probable reserves by 36% to 432 million boe. Through our exploration and development activity, we replaced 118% of production and generated a strong recycle ratio of 1.8 times.
Reflective of the newly acquired Eagle Ford assets, we generated $880 million of funds from operations, representing the highest level in company history and an increase of 46% compared to 2013.
Significant Eagle Ford Contribution
In June 2014, we completed our $2.8 billion Eagle Ford acquisition, adding 23,000 net contiguous acres in the core of the liquids-rich Eagle Ford shale in south Texas. The acquisition enhanced our growth and income business model and delivered production and reserves per share growth. The Eagle Ford generates the strongest capital efficiencies in our development inventory, provides the highest cash netbacks and has a significant and growing inventory of development prospects.
Since acquiring our Eagle Ford assets, production has increased 37% to 38,000 boe/d in the fourth quarter of 2014, proved reserves have increased 57% to 167 mmboe and proved plus probable reserves have increased 13% to 188 mmboe. We have also recognized 220 mmboe of possible reserves, which reflects the significant upside in the Austin Chalk and Upper Eagle Ford formations.
Importantly, our drilling results have exceeded our initial expectations with wells drilled outperforming the type curves used in our acquisition evaluation. Since acquisition, wells placed on stream have shown a 22% improvement in production rates, which has been driven by a combination of factors, including the drilling of longer horizontal laterals, tighter spacing of fracs and an increased amount of proppant per frac stage.
We have also identified additional well locations to support future growth. As well as targeting the Lower Eagle Ford formation, we are now actively delineating the Austin Chalk formation. Development of the Eagle Ford has entered a
Baytex Energy Corp. 2014 Annual Report 5
new phase with the initiation of "stack and frac" pilots which target three zones in the Eagle Ford formation in addition to the overlying Austin Chalk.
Canada Continues to Deliver
In Canada, we continued to advance development activities at our core heavy oil operating regions of Peace River and Lloydminster, albeit at a reduced pace as we adjusted our program in the second half of the year to reflect a weaker commodity price environment. Despite the reduced activity level from one year ago, our operational execution remained on track with production increasing 4% over 2013 levels to 54,200 boe/d (87% oil and NGL).
At Peace River, we executed a 31-well drilling program with a 100% drilling success rate, initiated our first water flood pilot in the Bluesky reservoir and through our stratigraphic drilling program increased our overall drilling inventory. At Lloydminster, we continued to expand the use of multi-lateral drilling techniques with initial results showing an approximate 20% improvement in capital efficiencies.
The timeline with respect to the development of our thermal projects is changing as a result of the current commodity price environment and portfolio improvements. We do not anticipate any material investments in our thermal projects in 2015.
Responsible Value Creation
We believe that by acting as a responsible company in all aspects of our operations, not just financial, we create long-term value for all stakeholders. We focus on employee opportunities for personal growth, an improved quality of life in communities where we operate, business opportunities for Aboriginal groups, and an attractive return on investment for shareholders. More broadly, society benefits from environmentally-responsible development that produces reliable energy at a reasonable cost. I can assure you that our values-based focus on environmental protection and the well-being of communities and employees is supported by strong ethics.
I am particularly proud of our most recent partnership with Genalta Power. Subsequent to the end of 2014, we announced the completion of the first phase and commissioning of Genalta Power's Peace River Power Centre. This new facility is located near our Three Creeks field and is designed to conserve solution gas while providing low emission electricity into Alberta's power grid. The second phase of this project is anticipated to be commissioned in mid-2015 and will further increase the conservation of our solution gas in the region.
Summary
Our 2015 production guidance is 84,000 to 88,000 boe/d with budgeted exploration and development expenditures of $550 to $575 million. We expect our production to be approximately evenly split between Canada and the Eagle Ford. Approximately 80% of our 2015 capital budget will be invested in our Eagle Ford operations where we expect to drill 39 to 45 net wells. The remaining 20% will be invested in our heavy oil operations at Peace River and Lloydminster. In the current commodity price environment, we remain flexible to the potentially changing conditions.
Developing oil and gas resources requires a long-term commitment and cooperation. A large group of stakeholders are important to achieving continued long-term success in resource development. Accordingly, we have improved our stakeholder engagement capacity over the past year. In 2014, we implemented a Good Neighbour Program throughout our field operations and sharpened our focus on environmental and safety performance. And later this year, we will issue our second Corporate Social Responsibility report. The support from our shareholders over the past year has been highly apparent and led to a heightened sense of commitment to continue to create value over the long-term.
Baytex's success is due to our dedicated and talented team of employees who align with our strategy, consistently execute on our plans and drive the creation of shareholder value. Complementing our leadership team and committed employees, it is important to recognize that our Board of Directors is an indispensable source of guidance and support which contribute significantly to our success.
6 Baytex Energy Corp. 2014 Annual Report
We look forward to executing our growth and income model for the ongoing benefit of all stakeholders and we thank you for your continued support.
On behalf of the Board of Directors,

James L. Bowzer
President and Chief Executive Officer
March 5, 2015
Baytex Energy Corp. 2014 Annual Report 7
MANAGEMENT'S DISCUSSION AND ANALYSIS
The following is management's discussion and analysis ("MD&A") of the operating and financial results of Baytex Energy Corp. for the year ended December 31, 2014. This information is provided as of March 4, 2015. In this MD&A, references to "Baytex", the "Company", "we", "us" and "our" and similar terms refer to Baytex Energy Corp. and its subsidiaries on a consolidated basis, except where the context requires otherwise. The year to date results have been compared with the corresponding period in 2013. This MD&A should be read in conjunction with the Company's audited consolidated financial statements ("consolidated financial statements") for the years ended December 31, 2014 and 2013, together with the accompanying notes and its Annual Information Form for the year ended December 31, 2014. These documents and additional information about Baytex are accessible on the SEDAR website at www.sedar.com. All amounts are in Canadian dollars, unless otherwise stated, and all tabular amounts are in thousands of Canadian dollars, except for percentages and per common share amounts or as otherwise noted.
In this MD&A, barrel of oil equivalent ("boe") amounts have been calculated using a conversion rate of six thousand cubic feet of natural gas to one barrel of oil, which represents an energy equivalency conversion method applicable at the burner tip and does not represent a value equivalency at the wellhead. While it is useful for comparative measures, it may not accurately reflect individual product values and may be misleading if used in isolation.
This MD&A contains forward-looking information and statements. We refer you to the end of the MD&A for our advisory on forward-looking information and statements.
NON-GAAP FINANCIAL MEASURES
In this MD&A, we refer to certain financial measures (such as Funds From Operations, Payout Ratio, Total Monetary Debt, Operating Netback and Bank EBITDA) which do not have any standardized meaning prescribed by generally accepted accounting principles in Canada ("GAAP"). While Funds From Operations, Payout Ratio, Operating Netback and Bank EBITDA are commonly used in the oil and natural gas industry, our determination of these measures may not be comparable with calculations of similar measures by other issuers.
Funds from Operations
We define funds from operations as cash flow from operating activities adjusted for financing costs, changes in non-cash operating working capital and other operating items. We believe that this measure assists in providing a more complete understanding of certain aspects of our results of operations and financial performance, including our ability to generate the cash flow necessary to fund future dividends to shareholders and capital investments. However, funds from operations should not be construed as an alternative to traditional performance measures determined in accordance with GAAP, such as cash flow from operating activities and net income. For a reconciliation of funds from operations to cash flow from operating activities, see "Funds from Operations, Payout Ratio and Bank EBITDA".
Payout Ratio
We define payout ratio as cash dividends (net of participation in our Dividend Reinvestment Plan ("DRIP")) divided by funds from operations. We believe that this measure assists in providing a more complete understanding of certain aspects of our results of operations and financial performance, including our ability to generate the cash flow necessary to fund future dividends to shareholders and capital investments.
Total Monetary Debt
We define total monetary debt as the sum of monetary working capital (which is current assets less current liabilities (excluding non-cash items such as unrealized gains or losses on financial derivatives, assets held for sale and liabilities related to assets held for sale)), the principal amount of long-term debt and bank loan. We believe that this
8 Baytex Energy Corp. 2014 Annual Report
measure assists in providing a more complete understanding of our cash liabilities. See "Liquidity, Capital Resources and Risk Management" for a description of total monetary debt.
Operating Netback
We define operating netback as product revenue less royalties, production and operating expenses and transportation expenses divided by barrels of oil equivalent sales volume for the applicable period. We believe that this measure assists in characterizing our ability to generate cash margin on a unit of production basis.
Bank EBITDA
We define Bank EBITDA as our consolidated net income attributable to shareholders before interest, taxes, depletion and depreciation, and certain other non-cash items as set out in our credit agreements governing our revolving extendible unsecured credit facilities. This measure is used to measure compliance with certain financial covenants.
YEAR END HIGHLIGHTS
2014 was an active year for Baytex. In February, we announced the acquisition of Aurora Oil & Gas Limited ("Aurora") which held significant production and future opportunity in the Eagle Ford shale in Texas. The transaction, valued at approximately $2.8 billion, closed on June 11, 2014 and significantly increased our total assets and production volumes. To finance the acquisition, we issued $1.5 billion in equity along with US$800 million of senior unsecured notes and we also renegotiated our bank credit facilities. With the addition of the Eagle Ford assets we took the opportunity to rationalize our asset portfolio which resulted in the disposition of our North Dakota assets and certain non-core Canadian assets. The Bakken assets were sold on September 24, 2014 for proceeds of $341.6 million before tax. In addition, $45.7 million of before tax proceeds were received from the sale of approximately 1,250 boe/d production of our non-core Canadian properties in the fourth quarter of 2014.
Our production of 78,321 boe/d for the year ended December 31, 2014 was significantly higher than any prior year due to the inclusion of slightly more than half a year of operations from the Eagle Ford assets. We continued to see growth from our legacy Canadian assets where production increased 4% from the prior year. Our Eagle Ford assets exceeded our initial expectations as production grew from 27,783 boe/d at the time of acquisition to 38,051 boe/d in the last quarter of the year.
During the year, the price of West Texas Intermediate ("WTI") oil decreased, falling from a high of US$107.26/bbl in June 2014, to a low of US$53.27/bbl at the end of the year. The drop in WTI prices partially offset the positive impact the production increase had on revenue. In December 2014, in response to the drop in WTI prices and in order to maintain financial flexibility, we reduced the monthly dividend to $0.10 per share.
We have also recorded a goodwill impairment charge of $449.6 million as at December 31, 2014. The impairment consists of $411.8 million related to the Eagle Ford assets and $37.8 million related to certain conventional oil and gas assets in Canada and is directly attributed to the recent drop in commodity prices.
Primarily as a result of the impairment, we incurred a net loss of $132.8 million in 2014, as compared to net income of $164.8 million in 2013. Funds from operations for 2014 were $879.8 million, a 46% increase from 2013.
BUSINESS COMBINATION
On June 11, 2014, we acquired all of the ordinary shares of Aurora for a total purchase price of approximately $2.8 billion, including the assumption of $955 million of indebtedness and $54.6 million of cash. Aurora's primary asset consisted of 22,200 net contiguous acres in the Sugarkane area located in South Texas in the core of the liquids-rich Eagle Ford shale. The Sugarkane area has been largely delineated with infrastructure in place which is expected to facilitate future annual production growth. The acquisition added an estimated 166.6 million boe of proved and probable reserves. In addition, these assets have future reserves upside potential from well downspacing, improving completion techniques and new development targets in additional zones.
Baytex Energy Corp. 2014 Annual Report 9
To finance the acquisition of Aurora, we issued 38,433,000 common shares, raising gross proceeds of approximately $1.5 billion. We also negotiated an agreement with a syndicate of banks for the provision of new unsecured revolving credit facilities of approximately $1.2 billion ($1.0 billion Canadian facility and a US$200 million facility) and a $200 million unsecured non-revolving term loan (in aggregate to replace the $850 million revolving credit facilities of Baytex Energy Ltd.) and issued US$800 million of senior unsecured notes, comprised of US$400 million of 5.125% notes due June 1, 2021 and US$400 million of 5.625% notes due June 1, 2024. Approximately US$746 million of the proceeds from the issuance of the senior unsecured notes were used to acquire and cancel approximately 98% of the senior debt assumed from Aurora. The $200 million unsecured non-revolving term loan was subsequently repaid with proceeds from the sale of our North Dakota assets.
The Results of Operations include the Eagle Ford assets from June 11, 2014. Production from the Eagle Ford assets since acquisition averaged 35,166 boe/d. Revenue for the period from June 11, 2014 to December 31, 2014 was $496.4 million, or $69.14/boe, which generated an operating netback for the Eagle Ford assets of $39.30/boe. At December 31, 2014, our estimated proved and probable reserves were 188.0 million boe, an increase of 21.4 million boe or approximately 13% from the time of acquisition.
RESULTS OF OPERATIONS
The Canadian division includes the heavy oil assets in Peace River and Lloydminster and the conventional oil and natural gas assets in Western Canada. The U.S. division includes the Bakken assets in North Dakota up to the date of disposition on September 24, 2014, and the Eagle Ford assets in Texas subsequent to the date of acquisition on June 11, 2014.
Production
Years Ended December 31 | |||||||||||||
| 2014 | 2013 | ||||||||||||
| Daily Production | Canada | U.S. | Total | Canada | U.S. | Total | |||||||
| Liquids (bbl/d) | |||||||||||||
| Heavy oil(1) | 44,948 | – | 44,948 | 42,064 | – | 42,064 | |||||||
| Light oil and condensate | 2,621 | 15,060 | 17,681 | 3,179 | 3,130 | 6,309 | |||||||
| NGL | 1,441 | 3,378 | 4,819 | 1,774 | 51 | 1,825 | |||||||
| Total liquids (bbl/d) | 49,010 | 18,438 | 67,448 | 47,017 | 3,181 | 50,198 | |||||||
| Natural gas (mcf/d) | 43,037 | 22,197 | 65,234 | 41,665 | 324 | 41,989 | |||||||
| Total production (boe/d) | 56,183 | 22,138 | 78,321 | 53,961 | 3,235 | 57,196 | |||||||
Production Mix | |||||||||||||
| Heavy oil | 79% | –% | 57% | 78% | –% | 74% | |||||||
| Light oil and condensate | 5% | 68% | 23% | 6% | 97% | 11% | |||||||
| NGL | 3% | 15% | 6% | 3% | 1% | 3% | |||||||
| Natural gas | 13% | 17% | 14% | 13% | 2% | 12% | |||||||
- (1)
- Heavy oil sales volumes may differ from reported production volumes due to changes in our heavy oil inventory. For the year ended December 31, 2014, heavy oil sales volumes were 74 bbl/d higher than production volumes (year ended December 31, 2013 – heavy oil sales volumes were the same as production volumes).
Annual average production for the year ended December 31, 2014 was 78,321 boe/d, representing an increase of 37%, or 21,125 boe/d, compared to 2013, primarily due to production from the Eagle Ford acquisition. Canadian production of 56,183 boe/d increased 4% or 2,222 boe/d primarily due to successful heavy oil development in Peace River. Subsequent to the acquisition in June, the Eagle Ford properties have exceeded our expectations and contributed 12,805 bbl/d of light oil and condensate, 3,264 bbl/d of natural gas liquids ("NGL") and 21,511 mcf/d of natural gas for a total of 19,654 boe/d, on an annualized basis for the year ended December 31, 2014.
10 Baytex Energy Corp. 2014 Annual Report
The prices received for our crude oil and natural gas production directly impact our earnings, funds from operations and our financial position.
Crude Oil
For the year ended December 31, 2014, the WTI oil prompt averaged US$92.97/bbl, a 5% decrease from the average WTI price of US$97.97/bbl in 2013. During 2014, WTI prices settled as high as US$107.26/bbl and as low as US$53.27/bbl. The volatile price range seen in 2014 reflected strong prices through the first half of the year, falling steadily through the second half as OPEC relinquished its traditional swing producer role in favor of a market share strategy, setting a target production level for the group of 30 million bbl/d.
The discount for Canadian heavy oil, as measured by the Western Canadian Select ("WCS") price differential to WTI, averaged 21% for the year ended December 31, 2014, as compared to 26% in 2013. The WCS differential decreased, and was less volatile in the current year as compared to the previous year due to increased refining capacity in the U.S. midwest, more rail transportation options and expanded pipeline capacity out of Western Canada.
Natural Gas
For the year ended December 31, 2014, the AECO natural gas prices averaged $4.42/mcf, a 41% increase compared to $3.13/mcf in 2013. For the year ended December 31, 2014, the NYMEX natural gas prices averaged US$4.41/mmbtu, an 18% increase compared to US$3.74/mmbtu in 2013. The increase in natural gas prices was supported by storage restocking after a prolonged and colder than normal 2013-2014 winter.
The following table compares selected benchmark prices and our average realized selling prices for the current and prior year.
| Years Ended December 31 | ||||||||||
| 2014 | 2013 | Change | ||||||||
| Benchmark Averages | ||||||||||
| WTI oil (US$/bbl)(1) | $ | 92.97 | $ | 97.97 | (5% | ) | ||||
| WCS heavy oil (US$/bbl)(2) | $ | 73.58 | $ | 72.78 | 1% | |||||
| Heavy oil differential(3) | 21% | 26% | ||||||||
| LLS oil (US$/bbl)(4) | $ | 96.76 | $ | 107.41 | (10% | ) | ||||
| CAD/USD average exchange rate | 1.1050 | 1.0299 | 7% | |||||||
| Edmonton par oil ($/bbl) | $ | 95.28 | $ | 93.24 | 2% | |||||
| AECO natural gas price ($/mcf)(5) | $ | 4.42 | $ | 3.13 | 41% | |||||
| NYMEX natural gas price (US$/mmbtu)(6) | $ | 4.41 | $ | 3.74 | 18% | |||||
| Years Ended December 31 | ||||||||||||||||||
| 2014 | 2013 | |||||||||||||||||
| Canada | U.S. | Total | Canada | U.S. | Total | |||||||||||||
| Average Sales Prices(7) | ||||||||||||||||||
| Canadian heavy oil ($/bbl)(7) | $ | 69.64 | $ | – | $ | 69.64 | $ | 65.24 | $ | – | $ | 65.24 | ||||||
| Light oil and condensate ($/bbl) | 89.88 | 91.63 | 91.37 | 88.44 | 92.20 | 90.31 | ||||||||||||
| NGL ($/bbl) | 45.49 | 30.93 | 35.28 | 42.50 | 46.98 | 42.63 | ||||||||||||
| Natural gas ($/mcf) | 4.49 | 4.62 | 4.53 | 3.32 | 4.12 | 3.32 | ||||||||||||
| Weighted average ($/boe)(8) | $ | 64.52 | $ | 71.69 | $ | 66.54 | $ | 60.03 | $ | 90.36 | $ | 61.74 | ||||||
- (1)
- WTI refers to the arithmetic average based on NYMEX prompt month WTI.
- (2)
- WCS refers to the average posting price for the benchmark WCS heavy oil.
- (3)
- Heavy oil differential refers to the WCS discount to WTI on a monthly weighted average basis.
- (4)
- Louisiana Light Sweet ("LLS") refers to the monthly arithmetic average for Argus LLS front month.
- (5)
- AECO refers to the AECO arithmetic average month-ahead index price published by the Canadian Gas Price Reporter ("CGPR").
- (6)
- NYMEX refers to the NYMEX last day average index price as published by the CGPR.
Baytex Energy Corp. 2014 Annual Report 11
- (7)
- Baytex's risk management strategy employs both oil and natural gas financial and physical forward contracts (fixed price forward sales and collars) and heavy oil differential physical delivery contracts (fixed price and percentage of WTI). The pricing information in the table excludes the impact of financial derivatives.
- (8)
- Realized heavy oil prices are calculated based on sales volumes, net of blending costs.
Average Realized Sales Prices
Our realized heavy oil price for the year ended December 31, 2014 was $69.64/bbl, or 86% of WCS, compared to $65.24/bbl, or 87% of WCS in 2013. The increase in realized heavy oil price was due to stronger heavy oil differentials and the weakening of the Canadian dollar against the U.S. dollar, partially offset by a slight decrease in the volume of heavy oil transported by rail in the fourth quarter of 2014, as compared to 2013.
During the year ended December 31, 2014, our Canadian average sales price for light oil and condensate was $89.88/bbl, up 2% from $88.44/bbl in 2013 due to the weakening of the Canadian dollar against the U.S. dollar, partially offset by weaker WTI pricing. U.S. light oil and condensate pricing for the year ended December 31, 2014 was $91.63/bbl, down 1% from $92.20/bbl in 2013 due to a decline in crude oil prices mostly offset by higher pricing received for Eagle Ford production as compared to North Dakota production.
Our realized natural gas price for the year ended December 31, 2014 was $4.53/mcf, up from $3.32/mcf in 2013. This is largely in line with the increase in the AECO benchmark and the U.S. natural gas benchmarks over the same period. Our realized price for U.S. natural gas also benefited from the weakened Canadian dollar when reported in Canadian dollars.
Gross Revenues
| Years Ended December 31 | |||||||||||||||||||
| 2014 | 2013 | ||||||||||||||||||
| ($ thousands) | Canada | U.S. | Total | Canada | U.S. | Total | |||||||||||||
| Oil revenue | |||||||||||||||||||
| Heavy oil | $ | 1,144,360 | $ | – | $ | 1,144,360 | $ | 1,001,707 | $ | – | $ | 1,001,707 | |||||||
| Light oil and Condensate | 85,986 | 503,701 | 589,687 | 102,596 | 105,331 | 207,927 | |||||||||||||
| NGL | 23,924 | 38,136 | 62,060 | 27,525 | 876 | 28,401 | |||||||||||||
| Total oil revenue | 1,254,270 | 541,837 | 1,796,107 | 1,131,828 | 106,207 | 1,238,035 | |||||||||||||
| Natural gas revenue | 70,514 | 37,418 | 107,932 | 50,467 | 487 | 50,954 | |||||||||||||
| Total oil and natural gas revenue | 1,324,784 | 579,255 | 1,904,039 | 1,182,295 | 106,694 | 1,288,989 | |||||||||||||
| Other income | 6,441 | 422 | 6,863 | – | – | – | |||||||||||||
| Heavy oil blending revenue | 58,120 | – | 58,120 | 78,470 | – | 78,470 | |||||||||||||
| Total petroleum and natural gas revenues | $ | 1,389,345 | $ | 579,677 | $ | 1,969,022 | $ | 1,260,765 | $ | 106,694 | $ | 1,367,459 | |||||||
Total petroleum and natural gas revenues for the year ended December 31, 2014 of $1,969.0 million increased $601.6 million from 2013 largely due to revenue from the Eagle Ford assets. In Canada, petroleum and natural gas revenues for the year ended December 31, 2014 totaled $1,389.3 million, an increase of $128.6 million compared to the same period in 2013 due to both higher heavy oil production volumes and higher realized prices on all products except U.S. NGL. Petroleum and natural gas revenues in the U.S. increased from prior year primarily due to the Eagle Ford acquisition which contributed $496.4 million since the date of acquisition to December 31, 2014.
Heavy oil blending revenue was down for the year ended December 31, 2014 compared to 2013 due to an increase in volumes of heavy oil being transported by rail. Unlike transportation through oil pipelines, transportation of heavy oil by rail does not require blending diluent. Volumes associated with blending diluent were 1,525 bbl/d for the year ended December 31, 2014 compared to 2,056 bbl/d in 2013.
12 Baytex Energy Corp. 2014 Annual Report
Royalties
Royalties are paid to various government entities and to land and mineral rights owners. Royalties are calculated based on gross revenues or on netbacks less capital investment and are generally expressed as a percentage of gross revenue. The actual royalty rates can vary for a number of reasons including the commodity produced, royalty contract, commodity price level, royalty incentives and the area or jurisdiction. The following table summarizes our royalties and royalty rates for the years ended December 31, 2014 and 2013.
| Years Ended December 31 | ||||||||||||||||||
| 2014 | 2013 | |||||||||||||||||
| ($ thousands except for % and per boe) | Canada | U.S. | Total | Canada | U.S. | Total | ||||||||||||
| Royalties | $ | 265,066 | $ | 174,059 | $ | 439,125 | $ | 211,499 | $ | 40,550 | $ | 252,049 | ||||||
| Average royalty rate(1) | 20.0% | 30.0% | 23.1% | 17.9% | 38.0% | 19.6% | ||||||||||||
| Royalty rate per boe | $ | 12.91 | $ | 21.54 | $ | 15.35 | $ | 10.74 | $ | 34.34 | $ | 12.07 | ||||||
- (1)
- Average royalty rate excludes sales of heavy oil blending diluents and the effects of financial derivatives.
Total royalties for the year ended December 31, 2014 of $439.1 million increased $187.1 million from 2013. Overall, royalties have increased to 23.1% of revenue for the year ended December 31, 2014, compared to 19.6% of revenue in 2013 primarily due to Eagle Ford properties being subject to higher royalty rates. The royalty rate of 20.0% in Canada for the year ended December 31, 2014 increased from 17.9% in 2013 largely due to higher royalty rates on certain lands in Peace River. The U.S. royalty rate for the year ended December 31, 2013 of 38.0% included carry obligations associated with our North Dakota properties.
Production and Operating Expenses
| Years Ended December 31 | ||||||||||||||||||
| 2014 | 2013 | |||||||||||||||||
| ($ thousands except for per boe) | Canada | U.S.(1) | Total | Canada | U.S. | Total | ||||||||||||
| Production and operating expenses | $ | 272,515 | $ | 81,334 | $ | 353,849 | $ | 254,037 | $ | 21,482 | $ | 275,519 | ||||||
| Production and operating expenses per boe | $ | 13.27 | $ | 10.07 | $ | 12.37 | $ | 12.89 | $ | 18.26 | $ | 13.20 | ||||||
- (1)
- Production and operating expenses related to the Eagle Ford assets include transportation expenses.
Production and operating expenses for the year ended December 31, 2014 of $353.8 million increased $78.3 million compared to 2013, with Eagle Ford properties contributing $67.5 million of the increase. Production and operating expenses in Canada of $272.5 million increased 7%, or $18.5 million during the year ended December 31, 2014 from $254.0 million in 2013 due to higher production volumes and higher per-unit costs. Canadian production and operating expenses per boe increased to $13.27/boe for the year ended December 31, 2014 from $12.89/boe in 2013 primarily due to higher fuel and electricity costs in the current year. U.S. production and operating expenses per boe declined from $18.26/boe to $10.07/boe, reflective of the shift in production to the lower cost Eagle Ford assets compared to our historic North Dakota properties.
Transportation and Blending Expenses
Transportation expenses include the costs to move production from the field to the sales point. The largest component of transportation expense relates to the movement of heavy oil to pipeline and rail delivery terminals. The heavy oil produced by Baytex requires blending to reduce its viscosity in order to meet pipeline specifications and to facilitate its marketing. The cost of blending diluent is recovered in the sale price of the blended product. Heavy oil transported by rail does not require blending diluent.
Baytex Energy Corp. 2014 Annual Report 13
The following table compares our blending and transportation expenses for the years ended December 31, 2014 and 2013.
| Years Ended December 31 | ||||||||||||||||||
| 2014 | 2013 | |||||||||||||||||
| ($ thousands except for per boe) | Canada | U.S.(2) | Total | Canada | U.S. | Total | ||||||||||||
| Blending expenses | $ | 58,120 | $ | – | $ | 58,120 | $ | 78,470 | $ | – | $ | 78,470 | ||||||
| Transportation expenses | 83,766 | – | 83,766 | 80,371 | – | 80,371 | ||||||||||||
| Total transportation and blending expenses | $ | 141,886 | $ | – | $ | 141,886 | $ | 158,841 | $ | – | $ | 158,841 | ||||||
| Transportation expense per boe(1) | $ | 4.08 | $ | – | $ | 2.93 | $ | 4.08 | $ | – | $ | 3.85 | ||||||
- (1)
- Transportation expenses per boe exclude the purchase of blending diluent.
- (2)
- Transportation expenses related to the Eagle Ford assets have been included in production and operating expenses.
Blending expenses for the year ended December 31, 2014 decreased compared to 2013 due to increased volumes of heavy oil being shipped by rail.
Transportation expenses for the year ended December 31, 2014 totaled $83.8 million, an increase of 4%, or $3.4 million, compared to 2013. The increase is due to a $3.4 million increase in Canadian transportation expense associated with increased heavy oil volumes.
Financial Derivatives
As part of our normal operations, we are exposed to movements in commodity prices, foreign exchange rates and interest rates. In an effort to manage these exposures, we utilize a series of financial derivative contracts which are intended to reduce some of the volatility in our operating cash flow. Financial derivatives are managed at the corporate level and are not allocated between divisions. The following table summarizes the results of our financial derivative contracts for the years ended December 31, 2014 and 2013.
| Years Ended December 31 | |||||||||||
| ($ thousands) | 2014 | 2013 | Change | ||||||||
| Realized financial derivatives gain (loss)(1) | |||||||||||
| Crude oil | $ | 46,844 | $ | 4,877 | $ | 41,967 | |||||
| Natural gas | (974 | ) | 1,646 | (2,620 | ) | ||||||
| Foreign currency | (10,416 | ) | (491 | ) | (9,925 | ) | |||||
| Interest | (8,130 | ) | (7,259 | ) | (871 | ) | |||||
| Total | $ | 27,324 | $ | (1,227 | ) | $ | 28,551 | ||||
| Unrealized financial derivatives gain (loss)(2) | |||||||||||
| Crude oil | $ | 186,115 | $ | (7,671 | ) | $ | 193,786 | ||||
| Natural gas | 5,802 | (1,658 | ) | 7,460 | |||||||
| Foreign currency | (8,737 | ) | (9,518 | ) | 781 | ||||||
| Interest and financing(3) | 2,020 | 6,942 | (4,922 | ) | |||||||
| Total | $ | 185,200 | $ | (11,905 | ) | $ | 197,105 | ||||
| Total financial derivatives gain (loss) | |||||||||||
| Crude oil | $ | 232,959 | $ | (2,794 | ) | $ | 235,753 | ||||
| Natural gas | 4,828 | (12 | ) | 4,840 | |||||||
| Foreign currency | (19,153 | ) | (10,009 | ) | (9,144 | ) | |||||
| Interest and financing(3) | (6,110 | ) | (317 | ) | (5,793 | ) | |||||
| Total | $ | 212,524 | $ | (13,132 | ) | $ | 225,656 | ||||
- (1)
- Realized financial derivative gain (loss) represents actual cash settlement or receipts for the financial derivatives.
- (2)
- Unrealized financial derivative gain (loss) represents the change in fair value of the financial derivatives during the period.
- (3)
- Unrealized interest and financing derivative gain (loss) includes the change in fair value of the call options embedded in our senior unsecured notes.
14 Baytex Energy Corp. 2014 Annual Report
Contracts settled in the period result in realized gains or losses based on the market price compared to the contract price on the date the contract matures. As the forward markets for commodities and currencies fluctuate and as new contracts are executed, changes in the fair value are reported as unrealized gains or losses in the period. Contracts in place at the beginning of the period which settle during the period will give rise to the reversal of the unrealized gain or loss recorded at the beginning of the period.
The realized gain of $27.3 million for the year ended December 31, 2014 on derivative contracts relates mainly to a significant drop in crude oil prices to levels below those set in our fixed price contracts, partially offset by the settlement of our out-of-money interest rate swaps as well as the weakening Canadian dollar against the U.S. dollar over the period. The unrealized mark-to-market gain of $185.2 million for the year ended December 31, 2014 is mainly due to significantly lower forward commodity prices at December 31, 2014 compared to prices set in our fixed price contracts and the settlement of previously recorded unrealized losses on interest rate contracts. This was somewhat offset by the weakening Canadian dollar against the U.S. dollar at December 31, 2014 compared to December 31, 2013.
A summary of the financial derivative contracts in place as at December 31, 2014 and the accounting treatment thereof are disclosed in note 22 to the consolidated financial statements.
Operating Netback
| Years Ended December 31 | |||||||||||||||||||
| 2014 | 2013 | ||||||||||||||||||
| ($ per boe except for volume) | Canada | U.S. | Total | Canada | U.S. | Total | |||||||||||||
| Sales volume (boe/d) | 56,257 | 22,138 | 78,395 | 53,961 | 3,235 | 57,196 | |||||||||||||
| Operating netback(1): | |||||||||||||||||||
| Sales price | $ | 64.52 | $ | 71.69 | $ | 66.54 | $ | 60.03 | $ | 90.36 | $ | 61.74 | |||||||
| Less: | |||||||||||||||||||
| Royalties | 12.91 | 21.54 | 15.35 | 10.74 | 34.34 | 12.07 | |||||||||||||
| Production and operating expenses | 13.27 | 10.07 | 12.37 | 12.89 | 18.26 | 13.20 | |||||||||||||
| Transportation expenses | 4.08 | – | 2.93 | 3.85 | – | 3.85 | |||||||||||||
| Operating netback before financial derivatives | $ | 34.26 | $ | 40.08 | $ | 35.89 | $ | 32.55 | $ | 37.76 | $ | 32.62 | |||||||
| Financial derivatives gain(2) | – | – | 1.24 | – | – | 0.29 | |||||||||||||
| Operating netback after financial derivatives | $ | 34.26 | $ | 40.08 | $ | 37.13 | $ | 32.55 | $ | 37.76 | $ | 32.91 | |||||||
- (1)
- Operating netback table includes revenues and costs associated with sulphur production.
- (2)
- Financial derivatives reflect realized gains on commodity-related contracts only.
Exploration and Evaluation Expense
Exploration and evaluation expense includes the write-off of undeveloped lands and assets and will vary period to period depending on the expiry of leases and our assessment of undeveloped land.
Exploration and evaluation expense increased to $17.7 million for the year ended December 31, 2014 from $10.3 million in 2013 due to an increase in the expiration of undeveloped land leases and the write-off of evaluation and exploration assets that will not be developed. Approximately $6.0 million of the expense related to leases in North Dakota which expired prior to the disposition.
Baytex Energy Corp. 2014 Annual Report 15
Depletion and Depreciation
| Years Ended December 31 | ||||||||||||||||||
| 2014 | 2013 | |||||||||||||||||
| ($ thousands except for per boe) | Canada | U.S. | Total | Canada | U.S. | Total | ||||||||||||
| Depletion and depreciation(1) | $ | 328,902 | $ | 204,461 | $ | 536,569 | $ | 305,336 | $ | 20,968 | $ | 328,953 | ||||||
| Depletion and depreciation per boe | $ | 16.02 | $ | 25.30 | $ | 18.75 | $ | 15.63 | $ | 17.88 | $ | 15.76 | ||||||
- (1)
- Total includes corporate depreciation.
Depletion and depreciation expense totaled $536.6 million for the year ended December 31, 2014, as compared to $329.0 million in 2013. The depletion rate per boe for the year ended December 31, 2014 increased to $18.75/boe from $15.76/boe in 2013, mainly due to the higher cost Eagle Ford assets being included in the depletable pool.
Impairment
Impairment expense totaled $449.6 million for the year ended December 31, 2014, as compared to no impairment in 2013. As a result of the significant decline in commodity prices at the end of 2014 and the expectation that the prices may stay low for a couple of years, the estimated future cash flows of certain assets dropped below the carrying value of those assets.
We impaired $411.8 million of goodwill associated with the acquisition of the Eagle Ford assets. At the time of the acquisition, the fair value of the assets acquired was recorded based on prevailing commodity prices. We also impaired the goodwill associated with certain conventional oil and gas assets in Canada. No impairment was recorded on our heavy oil assets.
The recoverable amount of each cash-generating unit was determined using the discounted cash flows for proved, probable and, in the case of the U.S. assets, possible reserves as well as the fair value of undeveloped land acreage. In computing the future cash flows of the assets, we made certain assumptions, most significantly about future commodity prices and the discount rate. We assumed a WTI price of approximately US$57/bbl in 2015, US$80/bbl in 2016 and US$90/bbl in 2017. It is possible that commodity prices in those years may be lower than the current estimate which could result in further impairments. A 10% before tax discount rate has been applied to total proved, probable and possible reserves after applying a 50% risk factor to possible reserves to reflect the lower probability of recovery.
General and Administrative Expenses
| Years Ended December 31 | |||||||||
| ($ thousands except for per boe) | 2014 | 2013 | Change | ||||||
| General and administrative expenses | $ | 59,957 | $ | 45,461 | 32% | ||||
| General and administrative expenses per boe | $ | 2.10 | $ | 2.18 | (4% | ) | |||
General and administrative expenses for the year ended December 31, 2014 increased compared to 2013 due to higher salaries, increased head count and the addition of the Houston office to support our Eagle Ford operations. On a per boe basis, general and administrative expenses have decreased due to both increased volumes and the low incremental overhead associated with the acquired assets in the Eagle Ford.
Acquisition-related Costs
During the year ended December 31, 2014, we incurred acquisition-related costs for the Aurora acquisition of $38.6 million. These costs included legal, regulatory and advisory fees along with foreign currency hedge premiums.
16 Baytex Energy Corp. 2014 Annual Report
Gain on Divestiture of Oil and Gas Properties
For the year ended December 31, 2014, the gain on divestiture of oil and gas properties totaled $50.2 million before tax representing three separate transactions. In the fourth quarter of 2014 we disposed of non-core assets in Western Canada for net cash proceeds $45.7 million resulting in a $3.7 million gain before income tax. In the third quarter of 2014, we disposed of our interests located in North Dakota for net proceeds of $341.6 million resulting in a $28.6 million gain before income tax. In the second quarter of 2014, we completed a swap of assets, exiting mature properties in Saskatchewan and acquiring additional properties in the Peace River area, resulting in a gain on divestiture of oil and gas properties of $17.9 million.
Share-based Compensation Expense
Compensation expense associated with the Share Award Incentive Plan is recognized in income over the vesting period of the share awards with a corresponding increase in contributed surplus. The issuance of common shares upon the conversion of share awards is recorded as an increase in shareholders' capital with a corresponding reduction in contributed surplus.
Compensation expense related to the Share Award Incentive Plan decreased to $27.5 million for the year ended December 31, 2014 from $30.7 million in 2013. This decrease is primarily due to an increase in actual forfeitures resulting from the closure of our Denver office combined with a higher estimated future forfeiture rate on share awards during 2014 compared to 2013.
As at December 31, 2013, all outstanding share rights granted under the share rights plan were fully expensed and exercisable and therefore no compensation expense was recorded related to the share rights for the year ended December 31, 2014 compared to $1.6 million of expense in 2013.
Financing Costs
Financing costs include interest on bank loans and long-term debt, non-cash charges related to accretion of asset retirement obligations, the amortization of financing expenses and debt financing costs.
| Years Ended December 31 | ||||||||
| ($ thousands except for %) | 2014 | 2013 | Change | |||||
| Bank loan and other | $ | 22,364 | $ | 12,379 | 81% | |||
| Long-term debt | 60,418 | 30,945 | 95% | |||||
| Accretion on asset retirement obligations | 7,251 | 7,011 | 3% | |||||
| Financing costs | $ | 90,033 | $ | 50,335 | 79% | |||
The increase in financing costs for the year ended December 31, 2014 is primarily due to higher outstanding debt levels compared to 2013. Debt levels increased primarily as a result of the acquisition of the Eagle Ford assets.
Foreign Exchange
Unrealized foreign exchange gains and losses are due to the translation of the U.S. dollar denominated long-term debt and bank loans caused by the movement of the Canadian dollar against the U.S. dollar during the period. Realized foreign exchange gains and losses are due to our day-to-day U.S. dollar denominated transactions.
| Years Ended December 31 | |||||||||
| ($ thousands except for exchange rates) | 2014 | 2013 | Change | ||||||
| Unrealized foreign exchange loss | $ | 75,011 | $ | 9,828 | 663% | ||||
| Realized foreign exchange loss (gain) | 370 | (5,922 | ) | (106% | ) | ||||
| Foreign exchange loss | $ | 75,381 | $ | 3,906 | 1,830% | ||||
| CAD/USD exchange rates: | |||||||||
| At beginning of period | 1.0636 | 0.9949 | |||||||
| At end of period | 1.1601 | 1.0636 | |||||||
Baytex Energy Corp. 2014 Annual Report 17
The foreign exchange losses of $75.4 million for the year ended December 31, 2014 are primarily due to the drop in the value of the Canadian dollar against the U.S. dollar.
Income Taxes
For the year ended December 31, 2014, total income tax expense was $134.4 million, an increase of $81.6 million over 2013, and was comprised of $53.9 million of current income tax expense and $80.5 million of deferred income tax expense. For the year ended December 31, 2013, total income tax of $52.8 million comprised of $6.8 million of current income tax recovery and $59.6 million of deferred income tax expense.
The gain on disposition of the North Dakota assets resulted in current income tax expense of $52.2 million and a deferred income tax recovery of $52.4 million.
The increase in the total income tax expense for the year ended December 31, 2014 primarily related to the increase in unrealized financial derivative gains and an increase in tax pool claims used to shelter higher netbacks, partially offset by the increase in unrealized foreign exchange losses.
Tax Pools
We have accumulated the Canadian and US tax pools, as noted in the table below, which will be available to reduce future taxable income. Our cash income tax liability is dependent upon many factors, including the prices at which we sell our production, available income tax deductions and the legislative environment in place during the taxation year. Based upon the current forward commodity price outlook, projected production and cost levels, and currently enacted tax laws in Canada and the United States, Baytex expects to pay cash income taxes in 2015 at an effective tax rate of approximately 5% of funds from operations.
In 2014, the Canada Revenue Agency advised Baytex that it is proposing to reassess certain subsidiaries of Baytex to deny non-capital loss deductions relevant to the calculation of income taxes for the years 2011 through 2013. If the non-capital loss deductions that have been claimed to-date are disallowed, it would result in an estimated liability of approximately $57 million and a reduction of approximately $262 million of non-capital losses for subsequent taxation years. The Company believes that it should be entitled to deduct the non-capital losses and that its tax filings to-date are correct. We expect to defend the position as filed.
The income tax pools detailed below are deductible at various rates as prescribed by law:
| ($ thousands) | December 31, 2014 | December 31, 2013 | ||||
| Canadian Tax Pools | ||||||
| Canadian oil and natural gas property expenditures | $ | 237,734 | $ | 281,892 | ||
| Canadian development expenditures | 490,721 | 496,847 | ||||
| Canadian exploration expenditures | 611 | 487 | ||||
| Undepreciated capital costs | 428,830 | 380,704 | ||||
| Non-capital losses | 132,522 | 160,203 | ||||
| Financing costs and other | 76,780 | 10,874 | ||||
| Total Canadian tax pools | $ | 1,367,198 | $ | 1,331,007 | ||
| U.S. Tax Pools | ||||||
| Taxable depletion | $ | 354,149 | $ | 45,334 | ||
| Intangible drilling costs | 311,586 | 8,869 | ||||
| Tangibles | 209,655 | 18,843 | ||||
| Non-capital losses | 553,172 | 64,936 | ||||
| Other | 79,212 | 7,182 | ||||
| Total U.S. tax pools | $ | 1,507,774 | $ | 145,164 | ||
18 Baytex Energy Corp. 2014 Annual Report
Net Income (Loss)
Net loss for the year ended December 31, 2014 totaled $132.8 million compared to net income of $164.8 million in 2013. The decrease was due to a $449.6 million impairment charge, higher unrealized foreign exchange losses, acquisition costs related to the acquisition of Aurora and higher depletion expense, financing costs and income taxes, partially offset by higher operating netbacks, higher financial derivative gains and gains on divestitures of oil and gas properties.
Other Comprehensive Income
Other comprehensive income is comprised of the foreign currency translation adjustment on U.S. operations not recognized in profit or loss. The $213.5 million foreign currency translation gain for the year ended December 31, 2014 is due to the weakening of the Canadian dollar against the U.S. dollar at December 31, 2014 compared to the exchange rate on June 11, 2014 (being the closing date of the acquisition of Aurora), and December 31, 2013. Other comprehensive income is higher in 2014 than in 2013 as the carrying value of U.S. operations is significantly higher in the current year as a result of the Aurora acquisition.
Capital Expenditures
Capital expenditures for the year ended December 31, 2014 and 2013 are summarized as follows:
| Years Ended December 31 | |||||||||||||||||||
| 2014 | 2013 | ||||||||||||||||||
| ($ thousands) | Canada | U.S. | Total | Canada | U.S. | Total | |||||||||||||
| Exploration and development | $ | 394,228 | $ | 371,842 | $ | 766,070 | $ | 471,003 | $ | 79,897 | $ | 550,900 | |||||||
| Acquisitions, net of divestitures | (33,863 | ) | 2,579,019 | 2,545,156 | (42,150 | ) | 3,068 | (39,082 | ) | ||||||||||
| Other plant and equipment, net(1) | – | – | 8,283 | – | – | 4,059 | |||||||||||||
| Total capital expenditures(1) | $ | 360,365 | $ | 2,950,861 | $ | 3,319,509 | $ | 428,853 | $ | 82,965 | $ | 515,877 | |||||||
- (1)
- Total includes corporate capital expenditures.
During the year ended December 31, 2014, exploration and development expenditures of $766.1 million increased $215.2 million from the same period in 2013. The increase is comprised of $315.7 million related to our Eagle Ford assets which was partially offset by decreases of $76.8 million in Canada and $23.7 million in North Dakota. In 2014, we drilled 215.5 net wells (175.1 in Canada, 33.2 in the Eagle Ford and 7.2 in North Dakota) compared to 226.8 net wells (203.5 in Canada and 23.3 in North Dakota) in 2013. In 2014, capital investment activity progressed as planned in our key development areas. For the year ended December 31, 2014, our Canadian exploration and development expenditures were moderately lower compared to 2013 due to our current focus on the Eagle Ford assets.
Through the purchase of Aurora we acquired $2,520.6 million of oil and natural gas properties, $391.1 million of exploration and evaluation assets and $1.2 million of other plant and equipment.
On September 24, 2014, we disposed of our interests located in North Dakota for cash proceeds of $341.6 million. The assets consisted of oil and gas properties, exploration and evaluation assets and other plant and equipment with carrying values of $294.0 million, $32.5 million and $2.0 million, respectively. We also disposed of certain non-core assets in Canada late in the fourth quarter for cash proceeds of $45.7 million. The assets consisted of oil and gas properties and exploration and evaluation assets with carrying values of $34.8 million and $7.2 million, respectively.
FUNDS FROM OPERATIONS, PAYOUT RATIO AND BANK EBITDA
Funds from operations, payout ratio and bank EBITDA are non-GAAP measures. Funds from operations represents cash flow from operating activities adjusted for financing costs, changes in non-cash operating working capital and other operating items. Payout ratio is calculated as cash dividends (net of DRIP) divided by funds from operations.
Baytex Energy Corp. 2014 Annual Report 19
Bank EBITDA is calculated according to the terms of the credit facility agreement. Baytex considers these to be key measures of performance as they demonstrate our ability to generate the cash flow necessary to fund dividends and capital investments.
The following table reconciles cash flow from our operating activities (a GAAP measure) to funds from operations (a non-GAAP measure).
| Years Ended December 31 | |||||||
| ($ thousands except for %) | 2014 | 2013 | |||||
| Cash flow from operating activities | $ | 974,569 | $ | 638,476 | |||
| Change in non-cash working capital | (28,222 | ) | (3,447 | ) | |||
| Asset retirement expenditures | 14,528 | 12,076 | |||||
| Financing costs | (90,033 | ) | (50,335 | ) | |||
| Accretion on asset retirement obligations | 7,251 | 7,011 | |||||
| Accretion on long-term debt | 1,697 | 657 | |||||
| Funds from operations | $ | 879,790 | $ | 604,438 | |||
| Dividends declared | $ | 395,600 | $ | 327,029 | |||
| Reinvested dividends | (94,482 | ) | (89,366 | ) | |||
| Cash dividends declared (net of DRIP) | $ | 301,118 | $ | 237,663 | |||
| Payout ratio | 45% | 54% | |||||
| Payout ratio (net of DRIP) | 34% | 39% | |||||
Baytex does not deduct capital expenditures when calculating the payout ratio. Should the costs to explore for, develop or acquire petroleum and natural gas assets increase significantly, it is possible that we would be required to reduce or eliminate dividends on our common shares in order to fund capital expenditures. There can be no certainty that we will be able to maintain current production levels in future periods. Cash dividends declared, net of DRIP participation, of $301.1 million for the year ended December 31, 2014 were funded by funds from operations of $879.8 million.
The following table reconciles net income (a GAAP measure) to Bank EBITDA (a non-GAAP measure).
| Years Ended December 31 | |||||||
| ($ thousands) | 2014 | 2013 | |||||
| Net income (loss) | $ | (132,807 | ) | $ | 164,845 | ||
| Plus: | |||||||
| Financing costs | 90,033 | 50,335 | |||||
| Current tax expense (recovery) | 53,875 | (6,821 | ) | ||||
| Depletion and depreciation | 536,569 | 328,953 | |||||
| EBITDA attributable to acquired assets | 254,087 | – | |||||
| Non-cash items(1) | 414,898 | 102,972 | |||||
| Bank EBITDA | $ | 1,216,655 | $ | 640,284 | |||
- (1)
- Non-cash items include share-based compensation, unrealized foreign exchange loss, exploration and evaluation expense, unrealized loss (gain) on financial derivatives, gain on divestiture of oil and gas properties, impairment and deferred income tax expense.
20 Baytex Energy Corp. 2014 Annual Report
LIQUIDITY, CAPITAL RESOURCES AND RISK MANAGEMENT
We regularly review our liquidity sources as well as our exposure to counterparties and believe that our capital resources will be sufficient to meet our on-going short, medium and long-term commitments. Specifically, we believe that our internally generated funds from operations, augmented by funds from our hedging program and our existing undrawn credit facilities, will provide sufficient liquidity to sustain our operations, dividends and planned capital expenditures. The timing of most of the capital expenditures is discretionary and there are no material long-term capital expenditure commitments. The level of dividend is also discretionary, and we have the ability to modify dividend levels should funds from operations be negatively impacted by factors such as reductions in commodity prices or production volumes. Further, we believe that our counterparties currently have the financial capacity to honor outstanding obligations to us in the normal course of business. We periodically review the financial capacity of our counterparties and, in certain circumstances, we will seek enhanced credit protection.
The current market environment, highlighted by unusually low commodity prices, has negative implications to our internally generated funds from operations. We have taken steps to protect our liquidity. These include a reduction of the monthly dividend from $0.24 per share to $0.10 per share and reducing our 2015 capital program by 40% from our initial expectations. We have also received relaxation of certain financial covenants applicable to our credit facilities (discussed below). If the current commodity price environment continues, or if prices decline further, we may need to make additional changes to the dividend or our capital program. A sustained low price environment could lead to a default of certain financial covenants which in turn, could impact our ability to borrow under existing facilities or obtain new financing. It could also restrict our ability to pay dividends or sell assets and may result in the debt of the Company becoming immediately due and payable. Should the funds generated from operations be insufficient to fund the minimum capital expenditures required to maintain operations, the Company may draw the maximum funds available under our current credit facilities. As a result, we may consider seeking additional capital in the form of debt or equity, however, there is no certainty that any of these sources of capital would be available when required.
In the oil and gas industry, it is not unusual to have a working capital deficiency as accounts receivable arising from sales of production are usually settled within one or two months but accounts payable related to capital and operating expenditures are usually settled over a longer time span (often two to four months) due to vendor billing cycles and internal approval processes.
The following table summarizes our total monetary debt at December 31, 2014 and 2013.
| ($ thousands) | December 31, 2014 | December 31, 2013 | ||||
| Bank loan(1) | $ | 666,886 | $ | 223,371 | ||
| Long-term debt(1) | 1,418,685 | 459,540 | ||||
| Working capital deficiency(2) | 210,409 | 79,151 | ||||
| Total monetary debt | $ | 2,295,980 | $ | 762,062 | ||
- (1)
- Principal amount of instruments.
- (2)
- Working capital is current assets less current liabilities (excluding non-cash items such as unrealized gains or losses on financial derivatives and assets and liabilities held for sale).
At December 31, 2014, total monetary debt was $2,296.0 million, as compared to $762.1 million at December 31, 2013. The increase in total monetary debt at December 31, 2014, as compared to December 31, 2013, was primarily due to the acquisition of Aurora, combined with exploration and development expenditures and cash dividends exceeding cash flow from operating activities during the year.
Bank Loan
Effective June 4, 2014, Baytex established revolving extendible unsecured credit facilities with its bank lending syndicate comprised of a $50 million operating loan and a $950 million syndicated loan for Baytex and a US$200 million syndicated loan for our wholly-owned subsidiary, Baytex Energy USA, Inc., all of which have a four-year term (collectively, the "Revolving Facilities").
An additional $200 million non-revolving single draw down facility was available solely to finance the acquisition of Aurora. In accordance with the terms of the credit facility agreement, it was repaid in full on September 29, 2014 using a portion of the proceeds from the sale of the North Dakota assets.
Baytex Energy Corp. 2014 Annual Report 21
During the year ended December 31, 2014, debt issuance costs of $4.1 million relating to the restructuring of the Revolving Facilities were netted against the carrying value of the bank loan and will be amortized as financing costs over the four-year term of the facility. For the year ended December 31, 2014, amortization on debt issuance costs of $0.5 million have been expensed.
The Revolving Facilities contain standard commercial covenants for facilities of this nature and do not require any mandatory principal payments prior to maturity, which is currently June 4, 2018. Baytex may request an extension under the Revolving Facilities which could extend the revolving period for up to four years (subject to a maximum four-year term at any time). At December 31, 2014, $666.9 million was drawn on the Revolving Facilities leaving approximately $565.1 million in undrawn credit capacity. Copies of the agreements relating to the Revolving Facilities are accessible on the SEDAR website at www.sedar.com (filed under the category "Material Document" on June 11, 2014, September 9, 2014 and February 24, 2015).
The weighted average interest rate on the bank loan for the year ended December 31, 2014 was 3.25% (year ended December 31, 2013 – 4.61%).
Long-term Debt
On June 6, 2014, we issued US$800 million of senior unsecured notes, comprised of US$400 million of 5.125% notes due June 1, 2021 (the "2021 Notes") and US$400 million of 5.625% notes due June 1, 2024 (the "2024 Notes"). The 2021 Notes and the 2024 Notes pay interest semi-annually and are redeemable at the Company's option, in whole or in part, commencing on June 1, 2017 (in the case of the 2021 Notes) and June 1, 2019 (in the case of the 2024 Notes) at specified redemption prices.
Pursuant to the acquisition of Aurora, we assumed US$365 million of 9.875% senior unsecured notes due February 15, 2017 (the "2017 Notes") and US$300 million of 7.500% senior unsecured notes due April 1, 2020 (the "2020 Notes"). On June 11, 2014, we purchased and cancelled US$357.1 million (97.8% of total outstanding) of the 2017 Notes and US$293.6 million (97.9% of total outstanding) of the 2020 Notes. The remaining notes are redeemable at the Company's option, in whole or in part, commencing on February 15, 2015 (in the case of the 2017 Notes) and April 1, 2016 (in the case of the 2020 Notes) at specified redemption prices. On February 27, 2015, the Company redeemed all outstanding 2017 Notes at a price of US$8.3 million plus accrued interest.
On July 19, 2012, we issued $300 million principal amount of senior unsecured notes bearing interest at 6.625% payable semi-annually with principal repayable on July 19, 2022. These notes are redeemable at the Company's option in whole or in part, commencing on July 19, 2017 at specified redemption prices.
On February 17, 2011, we issued US$150 million principal amount of senior unsecured notes bearing interest at 6.75% payable semi-annually with principal repayable on February 17, 2021. These notes are redeemable at the Company's option in whole or in part, commencing on February 17, 2016 at specified redemption prices.
Covenants
The following table lists the financial covenants under the Revolving Facilities and the senior unsecured notes, and the compliance therewith as at December 31, 2014.
| Covenant Description | Covenant as at February 20, 2015 | Covenant as at December 31, 2014 | Position as at December 31, 2014 | ||||
| Bank loan | Maximum Ratio | Maximum Ratio | |||||
| Senior debt to Capitalization(1)(2) | 0.65:1.00 | 0.50:1.00 | 0.46:1.00 | ||||
| Senior debt to Bank EBITDA(1)(5)(6) | 4.75:1.00 | 3.00:1.00 | 1.72:1.00 | ||||
| Total debt to Bank EBITDA(3)(5)(6) | 4.75:1.00 | 4.00:1.00 | 1.72:1.00 | ||||
| Long-term debt | Minimum Ratio | Minimum Ratio | |||||
| Fixed charge coverage(4) | 2:50:1.00 | 2.50:1.00 | 13.51:1.00 | ||||
- (1)
- "Senior debt" is defined as the sum of our bank loan and principal amount of long-term debt.
- (2)
- "Capitalization" is defined as the sum of our bank loan, principal amount of long-term debt and shareholders' equity.
22 Baytex Energy Corp. 2014 Annual Report
- (3)
- "Total debt" is defined as the sum of our bank loan, the principal amount of long-term debt, and certain other liabilities identified in the credit agreement.
- (4)
- Fixed charge coverage is computed as the ratio of financing costs to trailing twelve month adjusted income, as defined in the note indentures. Adjusted income for the trailing twelve months ended December 31, 2014 was $1.22 billion, including earnings of Aurora on a pro forma basis.
- (5)
- For purposes of the covenant calculations, Aurora's Bank EBITDA for the trailing twelve months has been included, in accordance with the terms of the credit agreement.
- (6)
- Bank EBITDA is calculated based on terms and definitions set out in the credit agreement which adjusts net income for financing costs, income tax, certain specific unrealized and non-cash transactions (including depletion, depreciation, amortization, exploration expenses, unrealized gains and losses on financial derivatives and foreign exchange, and stock based compensation), and acquisition and disposition activity (excluding acquisition-related costs incurred) and is calculated based on a trailing twelve month basis.
On February 20, 2015, we reached an agreement with the lending syndicate to amend the financial covenants as follows: a) the maximum Senior Debt to capitalization ratio will be 0.65:1.00 for the period December 31, 2014 up to and including December 31, 2016, and 0.55:1.00 thereafter; b) the maximum Senior Debt to Bank EBITDA ratio will be 4.75:1.00 for the period December 31, 2014 up to and including June 30, 2016, 4.50:1.00 for the period July 1, 2016 up to and including December 31, 2016 and 3.50:1.00 thereafter; and c) the maximum Total Debt to Bank EBITDA will be 4.75:1.00 for the period December 31, 2014 up to and including December 31, 2016, and 4.00:1.00 thereafter. If we exceed or breach any of the covenants under the Revolving Facilities or our senior unsecured notes, we may be required to repay, refinance or renegotiate the loan terms and may be restricted from paying dividends to our shareholders.
Financial Instruments
As part of our normal operations, we are exposed to a number of financial risks, including liquidity risk, credit risk and market risk. Liquidity risk is the risk that the Company will encounter difficulty in meeting obligations associated with financial liabilities. We manage liquidity risk through cash and debt management. Credit risk is the risk that a counterparty to a financial asset will default, resulting in the Company incurring a loss. Credit risk is managed by entering into sales contracts with creditworthy entities and reviewing our exposure to individual entities on a regular basis. Market risk is the risk that the fair value of future cash flows will fluctuate due to movements in market prices, and is comprised of foreign currency risk, interest rate risk and commodity price risk. Market risk is partially mitigated through a series of derivative contracts intended to reduce some of the volatility of our funds from operations.
A summary of the risk management contracts in place as at December 31, 2014 and the accounting treatment thereof is disclosed in note 22 to the consolidated financial statements.
Shareholders' Capital
We are authorized to issue an unlimited number of common shares and 10,000,000 preferred shares. The rights and terms of preferred shares are determined upon issuance. As at February 27, 2015, we had 168,829,697 common shares and no preferred shares issued and outstanding. During the year ended December 31, 2014 we issued 42,715,132 common shares including 38,433,000 common shares upon closing of the acquisition of Aurora. Shares were also issued through the DRIP and our share-based compensation programs.
Baytex Energy Corp. 2014 Annual Report 23
We have a number of financial obligations that are incurred in the ordinary course of business. These obligations are of a recurring nature and impact the Company's funds from operations in an ongoing manner. A significant portion of these obligations will be funded by funds from operations. These obligations as of December 31, 2014 and the expected timing for funding these obligations are noted in the table below.
| ($ thousands) | Total | Less than 1 year | 1-3 years | 3-5 years | Beyond 5 years | ||||||||||
| Trade and other payables | $ | 398,261 | $ | 398,261 | $ | – | $ | – | $ | – | |||||
| Dividends payable to shareholders | 16,811 | 16,811 | – | – | – | ||||||||||
| Bank loan(1)(2) | 666,886 | – | – | 666,886 | – | ||||||||||
| Long-term debt(2) | 1,418,685 | – | 9,165 | – | 1,409,520 | ||||||||||
| Operating leases | 55,920 | 7,540 | 15,395 | 16,006 | 16,979 | ||||||||||
| Processing agreements | 63,292 | 10,780 | 15,347 | 9,092 | 28,073 | ||||||||||
| Transportation agreements | 74,204 | 12,146 | 21,323 | 19,564 | 21,171 | ||||||||||
| Total | $ | 2,694,059 | $ | 445,538 | $ | 61,230 | $ | 711,548 | $ | 1,475,743 | |||||
- (1)
- The bank loan is a covenant-based loan with a revolving period that is extendible annually for up to a four-year term. Unless extended, the revolving period will end on June 4, 2018, with all amounts to be re-paid on such date.
- (2)
- Principal amount of instruments.
We also have ongoing obligations related to the abandonment and reclamation of well sites and facilities which have reached the end of their economic lives. Programs to abandon and reclaim them are undertaken regularly in accordance with applicable legislative requirements.
CRITICAL ACCOUNTING ESTIMATES
A summary of Baytex's significant accounting policies can be found in notes 3 and 4 to the consolidated financial statements. The preparation of the consolidated financial statements in accordance with GAAP requires management to make judgments and estimates that affect the financial results of the Company. The financial and operating results of Baytex incorporate certain estimates including:
- •
- estimated revenues, royalties and operating costs on production as at a specific reporting date but for which actual revenues and costs have not yet been received;
- •
- estimated capital expenditures on projects that are in progress;
- •
- estimated future recoverable value of petroleum and natural gas properties and goodwill;
- •
- estimated depletion and depreciation that are based on estimates of petroleum and natural gas reserves and future costs to develop those reserves that Baytex expects to recover in the future;
- •
- estimated fair values of financial derivative contracts that are subject to fluctuation depending upon the underlying commodity prices, interest rates and foreign exchange rates;
- •
- estimated value of share-based compensation related to our Share Award Incentive Plan and related performance conditions and forfeiture rates; and
- •
- estimated value of asset retirement obligations that are dependent upon estimates of future costs and timing of expenditures.
Baytex employs individuals skilled in making such estimates and ensures those responsible have the most accurate information available. Further, approved budgets and prior period estimates are also reviewed and analyzed against actual results to ensure appropriate decisions are made for future estimates and outlooks. Actual results could differ materially if various assumptions or estimates do not turn out as expected.
24 Baytex Energy Corp. 2014 Annual Report
CHANGES IN ACCOUNTING POLICIES
Current Accounting Pronouncements
Presentation of Financial Statements
Certain standards and amendments were issued effective for accounting periods beginning on or after January 1, 2014. Many of these updates are not applicable or not consequential to the Company and have been excluded from the discussion below. As of January 1, 2014, the Company adopted the following IFRS standards and amendments in accordance with the transitional provisions of each standard.
Financial Instruments: Presentation
IAS 32 "Financial Instruments: Presentation" is effective January 1, 2014, and has been amended to clarify certain requirements for offsetting financial assets and liabilities. IAS 32 relates to presentation and disclosure of financial instruments and the retrospective adoption of this standard did not have a material impact on the Company's consolidated financial statements.
Levies
IFRS Interpretations Committee ("IFRIC") 21 "Levies" is effective January 1, 2014, and clarifies the recognition requirements concerning a liability to pay a levy imposed by a government, other than an income tax. The interpretation clarifies that the obligating event which gives rise to a liability is the activity that triggers the payment of the levy in accordance with the relevant legislation. The retrospective adoption of this standard did not have a material impact on the Company's consolidated financial statements.
Future Accounting Pronouncements
Revenue from Contracts with customers
IFRS 15, "Revenue from Contracts with Customers" is effective January 1, 2017 and will supersede IAS 11 and IAS 18 (and related interpretations including IFRIC 13, IFRIC 15, IFRIC 18 and SIC 31). The new standard moves away from a revenue recognition model based on an earnings process to an approach that is based on transfer of control of a good or service to a customer. The new standard also requires disclosures on the nature, amount, timing and uncertainty of revenues and cash flows arising from contracts with customers. The Company has not yet adopted IFRS 15 and is evaluating its impact on the consolidated financial statements.
Financial Instruments
IFRS 9, "Financial Instruments" replaces IAS 39 "Financial Instruments: Recognition and Measurement", which eliminates the current multiple classification and measurement models for financial assets and liabilities with a single model that has only two classifications: amortized cost and fair value. In November 2013, the IASB amended IFRS 9 to include the new general hedge accounting model which remains optional, allows more opportunities to apply hedge accounting, and will be effective on January 1, 2018 and applied retroactively to each period presented. The Company has not yet adopted IFRS 9 and is evaluating its impact on the consolidated financial statements.
Baytex Energy Corp. 2014 Annual Report 25
SELECTED ANNUAL INFORMATION
| ($ thousands, except per common share amounts) | 2014 | 2013 | ||||
| Revenues, net of royalties | $ | 1,529,897 | $ | 1,115,410 | ||
| Net income (loss) | $ | (132,807 | ) | $ | 164,845 | |
| Per common share – basic | $ | (0.89 | ) | $ | 1.33 | |
| Per common share – diluted | $ | (0.89 | ) | $ | 1.32 | |
| Total assets | $ | 6,230,596 | $ | 2,698,334 | ||
| Total bank loan and long-term debt | $ | 2,062,344 | $ | 675,401 | ||
| Cash dividends or distributions declared per common share | $ | 2.64 | $ | 2.64 | ||
| Average wellhead prices, net of blending costs per boe | $ | 66.54 | $ | 61.74 | ||
| Total production (boe/d) | 78,321 | 57,196 | ||||
FOURTH QUARTER OF 2014
Our production for the three months ended December 31, 2014 was 92,220 boe/d, significantly higher than the fourth quarter of 2013 (58,304 boe/d) due to the Aurora acquisition and stable production volumes from our Canadian assets. The fourth quarter of 2014 was the first full quarter without the disposed North Dakota assets. The Eagle Ford assets added 38,051 boe/d of production and $208.3 million of revenue in the quarter. The price of WTI decreased by US$24.32/bbl to US$73.14/bbl in the fourth quarter of 2014 compared to the same period in 2013, partially offsetting the increase in revenue from higher production volumes. Funds from operations were $245.5 million, bringing total funds from operations for the year to $879.8 million. We incurred a net loss of $361.8 million in the fourth quarter of 2014, down significantly from net income of $31.2 million for the same period last year due to a goodwill impairment of $449.6 million relating to the sharp drop in WTI prices.
Three Months Ended December 31 | |||||
| 2014 | 2013 | ||||
| Benchmark Averages | |||||
| WTI oil (US$/bbl) | 73.14 | 97.46 | |||
| WCS heavy (US$/bbl) | 58.90 | 65.26 | |||
| Heavy oil differential | 20 | % | 33 | % | |
| CAD/USD exchange rate | 1.1378 | 1.0494 | |||
| Edmonton par oil ($/bbl) | 75.69 | 86.25 | |||
| LLS (US$/bbl) | 76.34 | 101.00 | |||
| AECO natural gas price ($/mcf) | 4.01 | 3.15 | |||
| NYMEX gas price (US$/mmbtu) | 4.00 | 3.60 | |||
26 Baytex Energy Corp. 2014 Annual Report
Three Months Ended December 31 | ||||||||||||||||||
| 2014 | 2013 | |||||||||||||||||
| ($ thousands, except as noted) | Canada | U.S. | Total | Canada | U.S. | Total | ||||||||||||
| Daily Production | ||||||||||||||||||
| Heavy oil (bbl/d) | 43,135 | – | 43,135 | 43,254 | – | 43,254 | ||||||||||||
| Light oil and condensate (bbl/d) | 2,494 | 24,422 | 26,916 | 2,827 | 3,200 | 6,027 | ||||||||||||
| NGL (bbl/d) | 1,381 | 6,717 | 8,098 | 1,906 | 114 | 2,020 | ||||||||||||
| Natural gas (mcf/d) | 43,048 | 41,380 | 84,428 | 41,282 | 736 | 42,018 | ||||||||||||
| Total production (boe/d) | 54,185 | 38,035 | 92,220 | 54,867 | 3,437 | 58,304 | ||||||||||||
Baytex Average Sales Prices | ||||||||||||||||||
| Heavy oil ($/bbl) | $ | 53.34 | $ | – | $ | 53.34 | $ | 61.89 | $ | – | $ | 61.89 | ||||||
| Light oil and condensate ($/bbl) | 70.77 | 77.86 | 77.20 | 81.33 | 87.02 | 84.35 | ||||||||||||
| NGL ($/bbl) | 33.31 | 26.99 | 28.07 | 45.94 | 47.27 | 46.01 | ||||||||||||
| Natural gas ($/mcf) | 3.89 | 4.36 | 4.12 | 3.51 | 4.01 | 3.52 | ||||||||||||
| Oil equivalent ($/boe) | $ | 49.66 | $ | 59.50 | $ | 53.72 | $ | 57.20 | $ | 83.46 | $ | 58.75 | ||||||
Operating netback ($/boe) | ||||||||||||||||||
| Sales price | $ | 49.66 | $ | 59.50 | $ | 53.72 | $ | 57.20 | $ | 83.46 | $ | 58.75 | ||||||
| Less: | ||||||||||||||||||
| Royalties | 7.94 | 17.56 | 11.90 | 10.42 | 28.59 | 11.49 | ||||||||||||
| Production and operating expenses | 14.76 | 10.36 | 12.95 | 12.54 | 18.12 | 12.87 | ||||||||||||
| Transportation expenses | 3.51 | – | 2.07 | 4.19 | – | 3.94 | ||||||||||||
| Netback before financial derivatives | $ | 23.45 | $ | 31.58 | $ | 26.80 | $ | 30.05 | $ | 36.75 | $ | 30.45 | ||||||
| Financial derivatives gain | – | – | 6.48 | – | – | 1.03 | ||||||||||||
| Netback after financial derivatives | $ | 23.45 | $ | 31.58 | $ | 33.28 | $ | 30.05 | $ | 36.75 | $ | 31.48 | ||||||
Capital Expenditures | ||||||||||||||||||
| Exploration and development | $ | 65,234 | $ | 149,463 | $ | 214,697 | $ | 71,834 | $ | 13,226 | $ | 85,060 | ||||||
| Acquisitions, net of divestitures | $ | (42,212 | ) | $ | 6,546 | $ | (35,666 | ) | $ | 161 | $ | 2,097 | $ | 2,258 | ||||
SUMMARY FOURTH QUARTER INFORMATION
In comparing the fourth quarter of 2014 with the same period in 2013:
- •
- Total production for the fourth quarter of 2014 of 92,220 boe/d increased by 58%, or 33,916 boe/d, from the same period in 2013, primarily due to the addition of 38,051 boe/d from the Eagle Ford assets, partially offset by the disposition of the North Dakota assets in third quarter of 2014. The 2013 production in the U.S. was all related to our North Dakota assets.
- •
- FFO for the fourth quarter of 2014 was $245.5 million ($1.47 per basic share), a 66% increase from $147.5 million ($1.18 per basic share) in the fourth quarter of 2013.
- •
- WTI oil averaged US$73.14/bbl for the fourth quarter of 2014, a 25% decrease from the average WTI price of US$97.46/bbl in the fourth quarter of 2013.
- •
- Our average realized heavy oil price during the fourth quarter of 2014 was $53.34/bbl, or 80% of WCS, compared to $61.89/bbl, or 90% of WCS in the fourth quarter of 2013. This decrease was due to a lower WTI price partially offset by the narrowing of the price differential for WCS and the weakening of the Canadian dollar compared to the fourth quarter of 2013.
- •
- Total petroleum and natural gas revenues for the fourth quarter of 2014 were $472.4 million, an increase of $141.7 million from the same period in 2013. Canadian revenues totaled $264.2 million, a decrease of
Baytex Energy Corp. 2014 Annual Report 27
$40.2 million from the fourth quarter of 2013 due to lower crude oil prices. In the U.S., the Eagle Ford properties contributed $208.2 million of revenue for the three months ended December 31, 2014 which accounted for all of the increase compared to 2013. In the fourth quarter of 2013, the North Dakota assets contributed $26.4 million of revenue.
- •
- Production and operating expenses for the fourth quarter of 2014 of $109.9 million increased $41.2 million compared to the same period in 2013 primarily due to the inclusion of $36.1 million of expenses related to the Eagle Ford properties. Production and operating expenses per boe increased by $0.08/boe from the fourth quarter of 2013 to $12.95/boe in the current period due to higher repair and maintenance costs in Canada offset by Eagle Ford properties which has lower average operating expenses of $10.32/boe.
- •
- General and administrative expenses for the three months ended December 31, 2014 were $17.0 million, an increase of $4.6 million from the same period in 2013 primarily due to the addition of the Houston office to support our Eagle Ford operations. On a per boe basis, general and administrative expenses decreased by $0.32/boe from the fourth quarter of 2013 to $2.00/boe due to increased volumes from the Eagle Ford acquisition combined with the lower general and administrative expenses per boe associated with the acquired assets.
- •
- Financing costs for the fourth quarter of 2014 of $28.5 million increased $16.0 million as compared to the same period in 2013 due to higher outstanding debt levels.
- •
- Realized gains on financial derivative contracts totaled $55.0 million for the three months ended December 31, 2014, an increase of $49.4 million from the same period in 2013 mainly the result of a significant drop in WTI prices to levels below those set in our fixed price contracts, partially offset by the weakening Canadian dollar against the U.S. dollar during the period.
- •
- Unrealized gains on financial derivative contracts totaled $109.0 million for the fourth quarter, up from a $0.2 million loss for the same period in 2013 due to the significant decline in WTI prices at December 31, 2014 as compared to September 30, 2014, offset slightly by the weakening Canadian dollar against the U.S. dollar.
- •
- Depletion expense totaled $176.4 million for the three months ended December 31, 2014, as compared to $89.4 million in the same period of 2013. The depletion rate per boe for the fourth quarter of 2014 increased to $20.78/boe from $16.75/boe for the comparative period of 2013, mainly due to the higher cost Eagle Ford assets being included in the depletable pool.
- •
- Due to the sharp decline in commodity prices, we have recorded a $449.6 million impairment charge during the fourth quarter of 2014. The impairment relates to $411.8 million of goodwill associated with the Eagle Ford acquisition as well as $37.8 million of goodwill associated with certain conventional oil and gas assets in Canada.
- •
- Capital expenditures related to exploration and development of $214.7 million were incurred in the fourth quarter of 2014, an increase of $129.6 million from the same period in 2013. The increase is mainly due to higher activity associated with the Eagle Ford acquisition. We drilled 28.3 net wells (12.9 in Canada and 15.4 in the Eagle Ford) in the fourth quarter of 2014, compared to 58.3 net wells (57.0 in Canada and 1.3 in North Dakota) during the same period in 2013.
- •
- As a result of the sharp drop in the price for WTI, we reduced the monthly dividend from $0.24 per share to $0.10 per share effective December 2014 to maintain financial flexibility and to better align the dividend level with the prevailing commodity price environment.
2015 GUIDANCE & HIGHLIGHTS
We currently plan to invest between $500 and $575 million in our 2015 exploration and development capital program, drilling approximately 90 net wells. The program is designed to generate average annual production of 84,000 to 88,000 boe/d.
Approximately 80% of our 2015 capital budget will be invested in our Eagle Ford operations where we expect to drill approximately 39 to 45 net wells. Approximately 20% will be focused on our Canadian heavy oil operations at Peace River and Lloydminster. At current commodity prices, the Eagle Ford represents the strongest capital efficiencies and highest netbacks in our portfolio.
28 Baytex Energy Corp. 2014 Annual Report
Our 2015 annual production is expected to be evenly split between Canada and the United States. Our production mix is forecast to be approximately 82% liquids (40% heavy oil, 33% light oil and condensate and 9% natural gas liquids) and 18% natural gas, based on a 6:1 natural gas-to-oil equivalency.
We have pursued cost savings and continue to work closely with all service providers and suppliers in an effort to improve the efficiency of our operations in the current commodity price environment. Our revised 2015 budget reflects a reduction of approximately 10% to 15% on drilling, completion and equipment costs from those experienced in 2014.
ENVIRONMENTAL REGULATION AND RISK
The oil and natural gas industry is currently subject to environmental regulations pursuant to a variety of provincial and federal legislation, all of which is subject to governmental review and revision from time to time. Such legislation provides for restrictions and prohibitions on the release or emission of various substances produced in association with certain oil and gas industry operations. In addition, such legislation sets out the requirements with respect to oilfield waste handling and storage, habitat protection and the satisfactory operation, maintenance, abandonment and reclamation of well and facility sites. Compliance with such legislation can require significant expenditures and a breach of such requirements may result in suspension or revocation of necessary licenses and authorizations, civil liability for pollution damage and the imposition of material fines and penalties. Further, environmental legislation is evolving in a manner expected to result in stricter standards and enforcement, larger fines and liability and potentially increased capital expenditures and operating costs. Although Baytex believes that it will be in material compliance with current applicable environmental legislation, no assurance can be given that environmental laws will not result in a curtailment of production or a material increase in the costs of production, development or exploration activities or otherwise have a material adverse effect on Baytex's business, financial condition, results of operations and prospects.
Climate Change Regulation
Our exploration and production facilities and other operations and activities emit greenhouse gases which may require us to comply with greenhouse gas emissions legislation that is enacted in jurisdictions where we have operations. A number of federal, provincial and state governments have announced intentions to regulate greenhouse gases and certain air pollutants. These governments are currently developing the regulatory and policy frameworks to deliver on their announcements. In most cases there are few technical details regarding the implementation and coordination of these plans to regulate emissions. However, the Canadian federal government has announced that it will align greenhouse gas emission reduction targets with the United States. The Canadian federal government has taken a sector-specific approach and, while progress has been made working with industry and the provinces on the development of oil and gas sector-specific regulations, the Canadian federal government has not committed to a definitive timeline for the implementation or release of legislation. As it remains unclear what approach the United States federal government will take, or when, it is also unclear whether the United States federal government will implement economy-wide greenhouse gas emission legislation or a sector-specific approach, and what type of compliance mechanisms will be available to certain emitters. Currently, certain provinces and states, including Alberta and British Columbia, have implemented greenhouse gas emission legislation that impacts areas in which we operate. It is anticipated that other federal, provincial and state announcements and regulatory frameworks to address emissions will continue to emerge.
Further information regarding environmental and climate change regulation is contained in our Annual Information Form for the year ended December 31, 2014 under the "Industry Conditions – Climate Change Regulation" section.
DISCLOSURE CONTROLS AND PROCEDURES
As of December 31, 2014, an evaluation was conducted of the effectiveness of Baytex's "disclosure controls and procedures" (as defined in the United States by Rules 13a-15(e) and 15d-15(e) under the Securities Exchange Act of 1934 (the "Exchange Act") and in Canada by National Instrument 52-109, Certification of Disclosure in Issuers'
Baytex Energy Corp. 2014 Annual Report 29
Annual and Interim Filings ("NI 52-109")) under the supervision of and with the participation of management, including the President and Chief Executive Officer and the Chief Financial Officer. Based on that evaluation, the President and Chief Executive Officer and the Chief Financial Officer concluded that Baytex's disclosure controls and procedures are effective to ensure that the information required to be disclosed in the reports that Baytex files or submits under the Exchange Act or under Canadian securities legislation is (i) recorded, processed, summarized and reported within the time periods specified in the applicable rules and forms and (ii) accumulated and communicated to the Company's management, including the President and Chief Executive Officer and Chief Financial Officer, to allow timely decisions regarding the required disclosure.
It should be noted that while the President and Chief Executive Officer and the Chief Financial Officer believe that the Company's disclosure controls and procedures provide a reasonable level of assurance that they are effective, they do not expect that Baytex's disclosure controls and procedures will prevent all errors and fraud. A control system, no matter how well conceived or operated, can provide only reasonable, not absolute, assurance that the objectives of the control system are met.
Baytex acquired Aurora on June 11, 2014 and has not had sufficient time to appropriately assess the disclosure controls and procedures used by Aurora and integrate them with Baytex's operations. As a result, as permitted by NI 52-109, the Sarbanes-Oxley Act of 2002 and applicable rules related to business acquisitions, the acquired Eagle Ford operations have been excluded from the Company's evaluation of disclosure controls and procedures. Currently, Baytex is in the process of integrating operations and processes with the acquired Eagle Ford assets and will be expanding its disclosure controls and procedures for 2015.
MANAGEMENT'S REPORT ON INTERNAL CONTROL OVER FINANCIAL REPORTING
The President and Chief Executive Officer and Chief Financial Officer of Baytex (collectively, the "certifying officers") are responsible for establishing and maintaining disclosure controls and procedures and internal control over financial reporting for Baytex. Disclosure controls and procedures are designed to provide reasonable assurance that (i) material information relating to Baytex is made known to the certifying officers by others, particularly during the period in which public filings are being prepared and (ii) information required to be disclosed by Baytex in filings submitted by it under securities legislation is recorded, processed, summarized and reported within the time periods specified in securities legislation. Internal control over financial reporting is a process designed to provide reasonable assurance regarding the reliability of financial reporting and the preparation of Baytex's financial statements for external reporting purposes in accordance with Canadian GAAP.
Due to inherent limitations, internal control over financial reporting may not prevent or detect misstatements. Additionally, projections of any evaluations of effectiveness to future periods are subject to risk that controls may become inadequate because of changes in conditions or deterioration in the degree of compliance with Baytex's policies and procedures. Management has assessed the effectiveness of the Company's internal control over financial reporting as of December 31, 2014 based on the framework in Internal Control – Integrated Framework issued by the Committee of Sponsoring Organizations of the Treadway Commission (2013). Based on this assessment, management concluded that the Company maintained effective internal control over financial reporting as of December 31, 2014. The effectiveness of Baytex's internal control over financial reporting as of December 31, 2014 has been audited by Deloitte LLP, as reflected in their report for 2014.
On June 11, 2014, Baytex completed the acquisition of Aurora Oil & Gas Limited, a publicly traded oil and gas company that was listed on the Australian and Toronto stock exchanges. The results of the acquisition of Aurora have been included in the consolidated financial statements of Baytex since June 11, 2014. However, Baytex has not had sufficient time to appropriately assess the disclosure controls and procedures and internal controls over financial reporting previously used by Aurora and integrate them with those of Baytex. In addition, Aurora was not subject to the Sarbanes-Oxley Act of 2002 and, therefore, was not required to have its external auditors audit the effectiveness of its internal control over financial reporting. As a result, the certifying officers have limited the scope of their design of disclosure controls and procedures and internal control over financial reporting to exclude controls, policies and procedures of Aurora (as permitted by applicable securities laws in Canada and the U.S.). Baytex has a program in place to assess the controls, policies and procedures of the acquired operations for 2015.
30 Baytex Energy Corp. 2014 Annual Report
During the year ended December 31, 2014 (which included the Aurora acquisition from June 11, 2014), Aurora contributed revenues net of royalties of $349.4 million (representing 23% of total revenues, net of royalties) and operating income of $281.9 million (representing 27% of total operating income). At December 31, 2014, current assets of $85.4 million, non-current assets of $3.5 billion, current liabilities of $215.3 million and non-current liabilities of $788.4 million were associated with the entity acquired.
No changes were made to our internal control over financial reporting during the year ended December 31, 2014.
FORWARD-LOOKING STATEMENTS
In the interest of providing our shareholders and potential investors with information regarding Baytex, including management's assessment of the Company's future plans and operations, certain statements in this document are "forward-looking statements" within the meaning of the United States Private Securities Litigation Reform Act of 1995 and "forward-looking information" within the meaning of applicable Canadian securities legislation (collectively, "forward-looking statements"). In some cases, forward-looking statements can be identified by terminology such as "anticipate", "believe", "continue", "could", "estimate", "expect", "forecast", "intend", "may", "objective", "ongoing", "outlook", "potential", "project", "plan", "should", "target", "would", "will" or similar words suggesting future outcomes, events or performance. The forward-looking statements contained in this document speak only as of the date of this document and are expressly qualified by this cautionary statement.
Specifically, this document contains forward-looking statements relating to but not limited to: our business strategies, plans and objectives; the anticipated benefits from the acquisition of Aurora; our expectations that the Aurora assets have the infrastructure in place to support future annual production growth; our expectations regarding the effect of well downspacing, improving completion techniques and new development targets on the reserves potential of the Aurora assets; crude oil and natural gas prices and the price differentials between light, medium and heavy oil prices; our effective tax rate for 2015; the proposed reassessment of our tax filings by the Canada Revenue Agency; the potential taxes owing and reduction of non-capital losses if the reassessment by the Canada Revenue Agency is successful; our intention to defend the proposed reassessments if issued by the Canada Revenue Agency; our view of our tax filing position; the sufficiency of our capital resources to meet our on-going short, medium and long-term commitments; the financial capacity of counterparties to honor outstanding obligations to us in the normal course of business; the existence, operation and strategy of our risk management program; the impact of the adoption of new accounting standards on our financial results; our capital budget for 2015; our annual average production rate for 2015; the number and type of wells to be drilled in 2015; the geographic breakdown of our 2015 annual production; our production mix for 2015; the portion of our 2015 capital budget to be allocated to the Eagle Ford and the number of wells to be drilled; our expectation that we will achieve cost savings in our capital expenditure program and across our operations in 2015; our expectation that our royalty and production and operating cost structures in 2015 will be consistent with 2014; our objective to fund our capital expenditures and cash dividends on our common shares with funds from operations and existing credit capacity; our expectation that we are in material compliance with environmental legislation; and the completion of our assessment of the disclosure controls and procedures and internal controls over financial reporting for the acquired Eagle Ford operations. In addition, information and statements relating to reserves are deemed to be forward-looking statements, as they involve implied assessment, based on certain estimates and assumptions, that the reserves described exist in quantities predicted or estimated, and that the reserves can be profitably produced in the future. Cash dividends on our common shares are paid at the discretion of our Board of Directors and can fluctuate. In establishing the level of cash dividends, the Board of Directors considers all factors that it deems relevant, including, without limitation, the outlook for commodity prices, our operational execution, the amount of funds from operations and capital expenditures and our prevailing financial circumstances at the time.
These forward-looking statements are based on certain key assumptions regarding, among other things: our ability to execute and realize on the anticipated benefits of the acquisition of Aurora; petroleum and natural gas prices and differentials between light, medium and heavy oil prices; well production rates and reserve volumes; our ability to add production and reserves through our exploration and development activities; capital expenditure levels; the receipt, in a timely manner, of regulatory and other required approvals for our operating activities; the availability and cost of labour and other industry services; the amount of future cash dividends that we intend to pay; interest and
Baytex Energy Corp. 2014 Annual Report 31
foreign exchange rates; the continuance of existing and, in certain circumstances, proposed tax and royalty regimes; our ability to develop our crude oil and natural gas properties in the manner currently contemplated; and current industry conditions, laws and regulations continuing in effect (or, where changes are proposed, such changes being adopted as anticipated). Readers are cautioned that such assumptions, although considered reasonable by Baytex at the time of preparation, may prove to be incorrect.
Actual results achieved will vary from the information provided herein as a result of numerous known and unknown risks and uncertainties and other factors. Such factors include, but are not limited to: declines in oil and natural gas prices; risks related to the accessibility, availability, proximity and capacity of gathering, processing and pipeline systems; uncertainties in the credit markets may restrict the availability of credit or increase the cost of borrowing; refinancing risk for existing debt and debt service costs; a downgrade of our credit ratings; risks associated with properties operated by third parties; changes in government regulations that affect the oil and gas industry; changes in environmental, health and safety regulations; variations in interest rates and foreign exchange rates; risks associated with our hedging activities; the cost of developing and operating our assets; risks associated with the exploitation of our properties and our ability to acquire reserves; changes in income tax or other laws or government incentive programs; uncertainties associated with estimating petroleum and natural gas reserves; risks associated with acquiring, developing and exploring for oil and natural gas and other aspects of our operations; risks associated with large projects or expansion of our activities; risks related to heavy oil projects; the implementation of strategies for reducing greenhouse gases; depletion of our reserves; risks associated with the ownership of our securities, including the discretionary nature of dividend payments and changes in market-based factors; risks for United States and other non-resident shareholders, including the ability to enforce civil remedies, differing practices for reporting reserves and production, additional taxation applicable to non-residents and foreign exchange risk; and other factors, many of which are beyond our control. These and additional risk factors are discussed in our Annual Information Form, Annual Report on Form 40-F and Management's Discussion and Analysis for the year ended December 31, 2014, as filed with Canadian securities regulatory authorities and the U.S. Securities and Exchange Commission.
The above summary of assumptions and risks related to forward-looking statements has been provided in order to provide shareholders and potential investors with a more complete perspective on Baytex's current and future operations and such information may not be appropriate for other purposes.
There is no representation by Baytex that actual results achieved will be the same in whole or in part as those referenced in the forward-looking statements and Baytex does not undertake any obligation to update publicly or to revise any of the included forward-looking statements, whether as a result of new information, future events or otherwise, except as may be required by applicable securities law.
32 Baytex Energy Corp. 2014 Annual Report
MANAGEMENT'S REPORT ON INTERNAL CONTROL OVER FINANCIAL REPORTING
The management of Baytex Energy Corp. is responsible for establishing and maintaining adequate internal control over financial reporting over the Company. Under the supervision of our Chief Executive Officer and our Chief Financial Officer we have conducted an evaluation of the effectiveness of our internal control over financial reporting based on theInternal Control-Integrated Framework (2013) issued by the Committee of Sponsoring Organizations of the Treadway Commission ("COSO"). Based on our assessment, we have concluded that as of December 31, 2014, our internal control over financial reporting was effective. Management excluded from its design and assessment the internal control over financial reporting at Aurora Oil & Gas Limited (as permitted by applicable securities laws in Canada and the U.S.), which was acquired on June 11, 2014 and whose financial statements constitute 67 percent and 58 percent of net and total assets, respectively, 23 percent of net revenues and 304 percent of the net loss in the consolidated financial statements as of and for the year ended December 31, 2014.
Because of inherent limitations, internal control over financial reporting may not prevent or detect misstatements and even those systems determined to be effective can provide only reasonable assurance with respect to the financial statement preparation and presentation.
The effectiveness of the Company's internal control over financial reporting as of December 31, 2014 has been audited by Deloitte LLP, the Company's Independent Registered Public Accounting Firm, who also audited the Company's consolidated financial statements for the year ended December 31, 2014.
MANAGEMENT'S RESPONSIBILITY FOR FINANCIAL STATEMENTS
Management, in accordance with International Financial Reporting Standards ("IFRS") as issued by the International Accounting Standards Board, has prepared the accompanying consolidated financial statements of Baytex Energy Corp. Financial and operating information presented throughout this Annual Report is consistent with that shown in the consolidated financial statements.
Management is responsible for the integrity of the financial information. Internal control systems are designed and maintained to provide reasonable assurance that assets are safeguarded from loss or unauthorized use and to produce reliable accounting records for financial reporting purposes.
Deloitte LLP were appointed by the Company's shareholders to express an audit opinion on the consolidated financial statements. Their examination included such tests and procedures, as they considered necessary, to provide a reasonable assurance that the consolidated financial statements are presented fairly in accordance with IFRS.
The Board of Directors is responsible for ensuring that management fulfills its responsibilities for financial reporting and internal control. The Board exercises this responsibility through the Audit Committee, with assistance from the Reserves Committee regarding the annual review of our petroleum and natural gas reserves. The Audit Committee meets regularly with management and the Independent Registered Public Accounting Firm to ensure that management's responsibilities are properly discharged, to review the consolidated financial statements and recommend that the consolidated financial statements be presented to the Board of Directors for approval. The Audit Committee also considers the independence of Deloitte LLP and reviews their fees. The Independent Registered Public Accounting Firm has access to the Audit Committee without the presence of management.
|  | |
| James L. Bowzer President and Chief Executive Officer Baytex Energy Corp. | Rodney D. Gray Chief Financial Officer Baytex Energy Corp. | |
March 4, 2015 |
Baytex Energy Corp. 2014 Annual Report 33
REPORT OF INDEPENDENT REGISTERED PUBLIC ACCOUNTING FIRM
To the Board of Directors and Shareholders of Baytex Energy Corp.:
We have audited the accompanying consolidated financial statements of Baytex Energy Corp. and subsidiaries (the "Company"), which comprise the consolidated statements of financial position as at December 31, 2014 and December 31, 2013, and the consolidated statements of income (loss) and comprehensive income, consolidated statements of changes in equity, and consolidated statements of cash flows for the years then ended, and notes to the consolidated financial statements.
Management's Responsibility for the Consolidated Financial Statements
Management is responsible for the preparation and fair presentation of these consolidated financial statements in accordance with International Financial Reporting Standards as issued by the International Accounting Standards Board, and for such internal control as management determines is necessary to enable the preparation of consolidated financial statements that are free from material misstatement, whether due to fraud or error.
Auditor's Responsibility
Our responsibility is to express an opinion on these consolidated financial statements based on our audits. We conducted our audits in accordance with Canadian generally accepted auditing standards and the standards of the Public Company Accounting Oversight Board (United States). Those standards require that we comply with ethical requirements and plan and perform the audit to obtain reasonable assurance about whether the consolidated financial statements are free from material misstatement.
An audit involves performing procedures to obtain audit evidence about the amounts and disclosures in the consolidated financial statements. The procedures selected depend on the auditor's judgment, including the assessment of the risks of material misstatement of the consolidated financial statements, whether due to fraud or error. In making those risk assessments, the auditor considers internal control relevant to the entity's preparation and fair presentation of the consolidated financial statements in order to design audit procedures that are appropriate in the circumstances. An audit also includes evaluating the appropriateness of accounting policies used and the reasonableness of accounting estimates made by management, as well as evaluating the overall presentation of the consolidated financial statements.
We believe that the audit evidence we have obtained in our audits is sufficient and appropriate to provide a basis for our audit opinion.
Opinion
In our opinion, the consolidated financial statements present fairly, in all material respects, the financial position of Baytex Energy Corp. and subsidiaries as at December 31, 2014 and December 31, 2013, and their financial performance and their cash flows for the years then ended in accordance with International Financial Reporting Standards as issued by the International Accounting Standards Board.
Other Matter
We have also audited, in accordance with the standards of the Public Company Accounting Oversight Board (United States), the Company's internal control over financial reporting as of December 31, 2014, based on the criteria established inInternal Control-Integrated Framework (2013) issued by the Committee of Sponsoring Organizations of the Treadway Commission and our report dated March 4, 2015 expressed an unqualified opinion on the Company's internal control over financial reporting.
Chartered Accountants March 4, 2015 Calgary, Canada |
34 Baytex Energy Corp. 2014 Annual Report
REPORT OF INDEPENDENT REGISTERED PUBLIC ACCOUNTING FIRM
To the Board of Directors and Shareholders of Baytex Energy Corp.:
We have audited the internal control over financial reporting of Baytex Energy Corp. and subsidiaries (the "Company") as of December 31, 2014, based on the criteria established inInternal Control-Integrated Framework (2013) issued by the Committee of Sponsoring Organizations of the Treadway Commission. As described in Management's Report on Internal Control over Financial Reporting, management excluded from its assessment the internal control over financial reporting at Aurora Oil & Gas Limited ("Aurora"), which was acquired on June 11, 2014 and whose financial statements constitute 67 percent and 58 percent of net and total assets, respectively, 23 percent of net revenues and 304 percent of net loss of the consolidated financial statements amounts as of and for the year ended December 31, 2014. Accordingly, our audit did not include the internal control over financial reporting of Aurora. The Company's management is responsible for maintaining effective internal control over financial reporting and for its assessment of the effectiveness of internal control over financial reporting, included in the accompanying Management's Report on Internal Control over Financial Reporting. Our responsibility is to express an opinion on the Company's internal control over financial reporting based on our audit.
We conducted our audit in accordance with the standards of the Public Company Accounting Oversight Board (United States). Those standards require that we plan and perform the audit to obtain reasonable assurance about whether effective internal control over financial reporting was maintained in all material respects. Our audit included obtaining an understanding of internal control over financial reporting, assessing the risk that a material weakness exists, testing and evaluating the design and operating effectiveness of internal control based on the assessed risk, and performing such other procedures as we considered necessary in the circumstances. We believe that our audit provides a reasonable basis for our opinion.
A company's internal control over financial reporting is a process designed by, or under the supervision of, the company's principal executive and principal financial officers, or persons performing similar functions, and effected by the company's board of directors, management, and other personnel to provide reasonable assurance regarding the reliability of financial reporting and the preparation of financial statements for external purposes in accordance with International Financial Reporting Standards as issued by the International Accounting Standards Board. A company's internal control over financial reporting includes those policies and procedures that (1) pertain to the maintenance of records that, in reasonable detail, accurately and fairly reflect the transactions and dispositions of the assets of the company; (2) provide reasonable assurance that transactions are recorded as necessary to permit preparation of financial statements in accordance with International Financial Reporting Standards as issued by the International Accounting Standards Board, and that receipts and expenditures of the company are being made only in accordance with authorizations of management and directors of the company; and (3) provide reasonable assurance regarding prevention or timely detection of unauthorized acquisition, use, or disposition of the company's assets that could have a material effect on the financial statements.
Because of the inherent limitations of internal control over financial reporting, including the possibility of collusion or improper management override of controls, material misstatements due to error or fraud may not be prevented or detected on a timely basis. Also, projections of any evaluation of the effectiveness of the internal control over financial reporting to future periods are subject to the risk that the controls may become inadequate because of changes in conditions, or that the degree of compliance with the policies or procedures may deteriorate.
In our opinion, the Company maintained, in all material respects, effective internal control over financial reporting as of December 31, 2014, based on the criteria established inInternal Control-Integrated Framework (2013) issued by the Committee of Sponsoring Organizations of the Treadway Commission.
We have also audited, in accordance with Canadian generally accepted auditing standards and the standards of the Public Company Accounting Oversight Board (United States), the consolidated financial statements as at and for the year ended December 31, 2014 of the Company and our report dated March 4, 2015 expressed an unmodified opinion on those financial statements.
Chartered Accountants March 4, 2015 |
Baytex Energy Corp. 2014 Annual Report 35
CONSOLIDATED STATEMENTS OF FINANCIAL POSITION
| As at | December 31, 2014 | December 31, 2013 | ||||||
| (thousands of Canadian dollars) | ||||||||
ASSETS | ||||||||
| Current assets | ||||||||
| Cash | $ | 1,142 | $ | 18,368 | ||||
| Trade and other receivables | 203,259 | 141,651 | ||||||
| Crude oil inventory | 262 | 1,507 | ||||||
| Financial derivatives (note 22) | 220,146 | 10,087 | ||||||
| Assets held for sale (note 6) | – | 73,634 | ||||||
| 424,809 | 245,247 | |||||||
| Non-current assets | ||||||||
| Financial derivatives (note 22) | 498 | – | ||||||
| Exploration and evaluation assets (note 8) | 542,040 | 162,987 | ||||||
| Oil and gas properties (note 9) | 4,983,916 | 2,222,786 | ||||||
| Other plant and equipment (note 10) | 34,268 | 29,559 | ||||||
| Goodwill (note 11) | 245,065 | 37,755 | ||||||
| $ | 6,230,596 | $ | 2,698,334 | |||||
LIABILITIES | ||||||||
| Current liabilities | ||||||||
| Trade and other payables | $ | 398,261 | $ | 213,091 | ||||
| Dividends payable to shareholders | 16,811 | 27,586 | ||||||
| Financial derivatives (note 22) | 54,839 | 18,632 | ||||||
| Liabilities related to assets held for sale (note 6) | – | 10,241 | ||||||
| 469,911 | 269,550 | |||||||
| Non-current liabilities | ||||||||
| Bank loan (note 12) | 663,312 | 223,371 | ||||||
| Long-term debt (note 13) | 1,399,032 | 452,030 | ||||||
| Asset retirement obligations (note 14) | 286,032 | 221,628 | ||||||
| Deferred income tax liability (note 18) | 905,532 | 248,401 | ||||||
| Financial derivatives (note 22) | – | 869 | ||||||
| 3,723,819 | 1,415,849 | |||||||
SHAREHOLDERS' EQUITY | ||||||||
| Shareholders' capital (note 15) | 3,580,825 | 2,004,203 | ||||||
| Contributed surplus | 31,067 | 53,081 | ||||||
| Accumulated other comprehensive income | 199,575 | 1,484 | ||||||
| Deficit | (1,304,690 | ) | (776,283 | ) | ||||
| 2,506,777 | 1,282,485 | |||||||
| $ | 6,230,596 | $ | 2,698,334 | |||||
Commitments and contingencies (note 23)
See accompanying notes to the consolidated financial statements.
 |  | |
| Naveen Dargan | Gregory K. Melchin | |
| Director, Baytex Energy Corp. | Director, Baytex Energy Corp. |
36 Baytex Energy Corp. 2014 Annual Report
CONSOLIDATED STATEMENTS OF INCOME (LOSS) AND COMPREHENSIVE INCOME
| Years Ended December 31 | 2014 | 2013 | |||||
| (thousands of Canadian dollars, except per common share amounts) | |||||||
Revenues, net of royalties (note 19) | $ | 1,529,897 | $ | 1,115,410 | |||
Expenses | |||||||
| Production and operating | 353,849 | 275,519 | |||||
| Transportation and blending | 141,886 | 158,841 | |||||
| Exploration and evaluation (note 8) | 17,743 | 10,286 | |||||
| Depletion and depreciation | 536,569 | 328,953 | |||||
| Impairment (note 11) | 449,590 | – | |||||
| General and administrative | 59,957 | 45,461 | |||||
| Acquisition-related costs (note 7) | 38,591 | – | |||||
| Share-based compensation (note 16) | 27,463 | 32,341 | |||||
| Financing costs (note 20) | 90,033 | 50,335 | |||||
| Financial derivatives (gain) loss (note 22) | (212,524 | ) | 13,132 | ||||
| Foreign exchange loss (note 21) | 75,381 | 3,906 | |||||
| Divestiture of oil and gas properties gain | (50,225 | ) | (21,011 | ) | |||
| 1,528,313 | 897,763 | ||||||
| Net income before income taxes | 1,584 | 217,647 | |||||
| Income tax expense (note 18) | |||||||
| Current income tax expense (recovery) | 53,875 | (6,821 | ) | ||||
| Deferred income tax expense | 80,516 | 59,623 | |||||
| 134,391 | 52,802 | ||||||
| Net income (loss) attributable to shareholders | $ | (132,807 | ) | $ | 164,845 | ||
| Other comprehensive income | |||||||
| Foreign currency translation adjustment | 213,533 | 13,946 | |||||
| Comprehensive income | $ | 80,726 | $ | 178,791 | |||
Net income (loss) per common share (note 17) | |||||||
| Basic | $ | (0.89 | ) | $ | 1.33 | ||
| Diluted | $ | (0.89 | ) | $ | 1.32 | ||
Weighted average common shares (note 17) | |||||||
| Basic | 148,932 | 123,749 | |||||
| Diluted | 148,932 | 125,394 | |||||
See accompanying notes to the consolidated financial statements.
Baytex Energy Corp. 2014 Annual Report 37
CONSOLIDATED STATEMENTS OF CHANGES IN EQUITY
| Shareholders' capital | Contributed surplus | Accumulated other comprehensive income (loss) | Deficit | Total equity | ||||||||||||
| (thousands of Canadian dollars) | ||||||||||||||||
| Balance at December 31, 2012 | $ | 1,860,358 | $ | 65,615 | $ | (12,462 | ) | $ | (614,099 | ) | $ | 1,299,412 | ||||
| Dividends to shareholders | – | – | – | (327,029 | ) | (327,029 | ) | |||||||||
| Exercise of share rights | 30,919 | (20,333 | ) | – | – | 10,586 | ||||||||||
| Vesting of share awards | 24,542 | (24,542 | ) | – | – | – | ||||||||||
| Share-based compensation | – | 32,341 | – | – | 32,341 | |||||||||||
| Issued pursuant to dividend reinvestment plan | 88,384 | – | – | – | 88,384 | |||||||||||
| Comprehensive income for the year | – | – | 13,946 | 164,845 | 178,791 | |||||||||||
| Balance at December 31, 2013 | $ | 2,004,203 | $ | 53,081 | $ | 1,484 | $ | (776,283 | ) | $ | 1,282,485 | |||||
| Dividends to shareholders | – | – | – | (395,600 | ) | (395,600 | ) | |||||||||
| Exercise of share rights | 25,667 | (14,369 | ) | – | – | 11,298 | ||||||||||
| Vesting of share awards | 35,108 | (35,108 | ) | – | – | – | ||||||||||
| Share-based compensation | – | 27,463 | – | – | 27,463 | |||||||||||
| Issued for cash | 1,495,044 | – | – | – | 1,495,044 | |||||||||||
| Issuance costs, net of tax | (78,468 | ) | – | – | – | (78,468 | ) | |||||||||
| Issued pursuant to dividend reinvestment plan | 99,271 | – | – | – | 99,271 | |||||||||||
| Accumulated other comprehensive income recognized on disposition of foreign operation | – | – | (15,442 | ) | – | (15,442 | ) | |||||||||
| Comprehensive income (loss) for the year | – | – | 213,533 | (132,807 | ) | 80,726 | ||||||||||
| Balance at December 31, 2014 | $ | 3,580,825 | $ | 31,067 | $ | 199,575 | $ | (1,304,690 | ) | $ | 2,506,777 | |||||
See accompanying notes to the consolidated financial statements.
38 Baytex Energy Corp. 2014 Annual Report
CONSOLIDATED STATEMENTS OF CASH FLOWS
| Years Ended December 31 | 2014 | 2013 | ||||||
| (thousands of Canadian dollars) | ||||||||
CASH PROVIDED BY (USED IN): | ||||||||
Operating activities | ||||||||
| Net income (loss) for the year | $ | (132,807 | ) | $ | 164,845 | |||
| Adjustments for: | ||||||||
| Share-based compensation (note 16) | 27,463 | 32,341 | ||||||
| Unrealized foreign exchange loss (note 21) | 75,011 | 9,828 | ||||||
| Exploration and evaluation | 17,743 | 10,286 | ||||||
| Depletion and depreciation | 536,569 | 328,953 | ||||||
| Impairment (note 11) | 449,590 | – | ||||||
| Unrealized financial derivatives (gain) loss (note 22) | (185,200 | ) | 11,905 | |||||
| Divestitures of oil and gas properties gain | (50,225 | ) | (21,011 | ) | ||||
| Current income tax expense on divestitures | 52,182 | – | ||||||
| Deferred income tax expense | 80,516 | 59,623 | ||||||
| Financing costs (note 20) | 90,033 | 50,335 | ||||||
| Change in non-cash working capital (note 21) | 28,222 | 3,447 | ||||||
| Asset retirement obligations settled (note 14) | (14,528 | ) | (12,076 | ) | ||||
| 974,569 | 638,476 | |||||||
Financing activities | ||||||||
| Payment of dividends | (307,103 | ) | (237,869 | ) | ||||
| (Decrease) increase in secured bank loan (note 12) | (223,371 | ) | 106,977 | |||||
| Increase in unsecured bank loan (note 12) | 511,357 | – | ||||||
| Net proceeds from issuance of long-term debt | 849,944 | – | ||||||
| Tenders of long-term debt | (793,099 | ) | – | |||||
| Issuance of common shares related to share rights (note 15) | 11,298 | 10,586 | ||||||
| Issuance of common shares, net of issuance costs (note 15) | 1,401,317 | – | ||||||
| Interest paid | (77,417 | ) | (43,019 | ) | ||||
| 1,372,926 | (163,325 | ) | ||||||
| Investing activities | ||||||||
| Additions to exploration and evaluation assets (note 8) | (15,824 | ) | (11,846 | ) | ||||
| Additions to oil and gas properties (note 9) | (750,247 | ) | (539,054 | ) | ||||
| Property acquisitions | (15,335 | ) | (3,168 | ) | ||||
| Corporate acquisition (note 7) | (1,866,307 | ) | (3,586 | ) | ||||
| Proceeds from divestiture of oil and gas properties | 383,130 | 45,836 | ||||||
| Current income tax expense on divestiture | (42,894 | ) | – | |||||
| Additions to other plant and equipment, net of disposals | (8,283 | ) | (4,059 | ) | ||||
| Change in non-cash working capital (note 21) | (50,416 | ) | 59,269 | |||||
| (2,366,176 | ) | (456,608 | ) | |||||
| Impact of foreign currency translation on cash balances | 1,455 | (2,012 | ) | |||||
| Change in cash | (17,226 | ) | 16,531 | |||||
| Cash, beginning of year | 18,368 | 1,837 | ||||||
| Cash, end of year | $ | 1,142 | $ | 18,368 | ||||
Supplementary information | ||||||||
| Income taxes paid (recovered) | $ | 44,587 | $ | (6,821 | ) | |||
See accompanying notes to the consolidated financial statements.
Baytex Energy Corp. 2014 Annual Report 39
NOTES TO THE CONSOLIDATED FINANCIAL STATEMENTS
AS AT AND FOR THE YEARS ENDED DECEMBER 31, 2014 AND 2013
(all tabular amounts in thousands of Canadian dollars, except per common share amounts)
1. REPORTING ENTITY
Baytex Energy Corp. (the "Company" or "Baytex") is an oil and gas corporation engaged in the acquisition, development and production of oil and natural gas in the Western Canadian Sedimentary Basin and the United States. The Company's common shares are traded on the Toronto Stock Exchange ("TSX") and the New York Stock Exchange under the symbol BTE. The Company's head and principal office is located at 2800, 520 – 3rd Avenue S.W., Calgary, Alberta, T2P 0R3, and its registered office is located at 2400, 525 – 8th Avenue S.W., Calgary, Alberta, T2P 1G1.
2. BASIS OF PRESENTATION
The consolidated financial statements have been prepared in accordance with International Financial Reporting Standards ("IFRS") as issued by the International Accounting Standards Board (the "IASB"). The significant accounting policies set out below were consistently applied to all periods presented.
The consolidated financial statements were approved by the Board of Directors of Baytex on March 4, 2015.
The consolidated financial statements have been prepared on the historical cost basis, with some exceptions as noted in the accounting policies set out below. The consolidated financial statements are presented in Canadian dollars, which is the Company's functional currency. All financial information is rounded to the nearest thousand, except per share amounts and when otherwise indicated.
Measurement Uncertainty and Judgements
The preparation of the consolidated financial statements requires management to make judgements, estimates and assumptions that affect the reported amounts of assets and liabilities and disclosure of contingent assets and liabilities at the date of the consolidated financial statements and revenue and expenses during the reporting period. Actual results can differ from those estimates.
Amounts recorded for depletion of oil and gas properties are based on a unit-of-production method by reference to the ratio of production in the period to the related proved plus probable reserves, taking into account the level of development required to produce the reserves. The Company's total proved plus probable reserves are estimated annually using independent reserve engineer reports and represent the estimated quantities of crude oil, natural gas and natural gas liquids which geological, geophysical and engineering data demonstrate a 50 percent or greater statistical probability of being recovered. Due to the inherent uncertainties and the necessarily limited nature of reservoir data, estimates of reserves are inherently imprecise, require the application of judgement and are subject to change as additional information becomes available. The impact of future changes to estimates on the consolidated financial statements of subsequent periods could be material.
Amounts recorded for depreciation are based on the estimated useful lives of depreciable assets; management reviews these estimates at each reporting date.
The Company's capital assets are aggregated into cash-generating units based on their ability to generate largely independent cash flows. The cash-generating units are used to assess impairment.
Impairment of assets and groups of assets are calculated based on the higher of value-in-use calculations and fair value less cost to sell. These calculations require the use of estimates and assumptions on highly uncertain matters such as future commodity prices, effects of inflation and technology improvements on operating expenses, production profiles and the outlook of market supply-and-demand conditions for oil and natural gas products. Any
40 Baytex Energy Corp. 2014 Annual Report
changes to these estimates and assumptions could impact the carrying value of assets. The Company assesses internal and external indicators of impairment in determining whether the carrying values of the assets may not be recoverable.
Fair values of financial instruments, where active market quotes are not available, are estimated using the Company's assessment of available market inputs and are described in note 22. These estimates may vary from the actual prices achieved upon settlement of the financial instruments.
Fair values of share-based compensation are measured at December 31, 2010 (in the case of awards made under the Share Rights Plan (as defined in note 16)) or the grant date (in the case of awards made under the Share Award Incentive Plan (as defined in note 16)) taking into consideration management's best estimate of the number of shares that will vest. The fair value of the share rights granted under the Share Rights Plan is computed based on management's best estimate of the expected volatility, expected life of the right and estimated number of rights that will be exercised. The fair value of the restricted awards and performance awards encompassed by the Share Award Incentive Plan is determined at the date of grant using the closing price of the common shares, an estimated forfeiture rate, and, for performance awards, an estimated payout multiplier. The future payout multiplier is estimated based on past performance.
The amounts recorded for asset retirement obligations are estimated based on the Company's net ownership interest in all wells and facilities, estimated costs to abandon and reclaim the wells and the facilities, the estimated time period during which these costs will be incurred in the future and the discount and inflation rates. Any changes to these estimates could change the amount recorded for asset retirement obligations and may materially impact the consolidated financial statements of future periods.
The Company is engaged in litigation and claims arising in the normal course of operations where the actual outcome may vary from the amount recognized in the consolidated financial statements. None of these claims are expected to materially affect the Company's financial position or reported results of operations.
Tax interpretations, regulations and legislation in the various jurisdictions in which the Company and its subsidiaries operate are subject to change. As such, income taxes are subject to measurement uncertainty.
3. SIGNIFICANT ACCOUNTING POLICIES
Consolidation
The consolidated financial statements include the accounts of the Company and its wholly-owned subsidiaries. A portion of the Company's exploration, development and production activities are conducted jointly with others and involve jointly controlled assets. These jointly controlled assets are accounted for using the proportionate consolidation method whereby the consolidated financial statements reflect only the Company's proportionate interest.
Operating Segments Reporting
Baytex's operations are grouped into two operating segments for reporting, which is consistent with the internal reporting provided to the chief operating decision-maker of the Company.
Business Combinations
Business combinations are accounted for using the acquisition method of accounting. The cost of an acquisition is measured as cash paid and the fair value of other assets given, equity instruments issued, and liabilities incurred or assumed at the date of exchange. The acquired identifiable assets and liabilities assumed, including contingent liabilities, are measured at their fair values at the date of acquisition. Any excess of the cost of acquisition over the fair value of the net identifiable assets acquired is recognized as goodwill. If the cost of acquisition is below the fair values of the identifiable net assets acquired, the deficiency is credited to net income in the statements of income and comprehensive income in the period of acquisition. Associated transaction costs are expensed when incurred.
Baytex Energy Corp. 2014 Annual Report 41
Crude Oil Inventory
Crude oil inventory consists of production in transit at the reporting date and is valued at the lower of cost (using the weighted average cost method) or net realizable value. Costs include direct and indirect expenditures incurred in bringing the crude oil to its existing condition and location.
Exploration and Evaluation Assets, Oil and Gas Properties and Other Plant and Equipment
a) Pre-license Costs
Pre-license costs are costs incurred before the legal rights to explore a specific area have been obtained. These costs are expensed in the period in which they are incurred.
b) Exploration and Evaluation ("E&E") Costs
Once the legal right to explore has been acquired, costs directly associated with an exploration well are capitalized as an intangible asset until the drilling of the well program/project is complete and the results have been evaluated. Such E&E costs may include costs of license acquisition, technical services and studies, seismic acquisition, exploration drilling and testing. E&E costs are not depleted and are carried forward until technical feasibility and commercial viability of extracting petroleum and natural gas resources is considered to be determined. The technical feasibility and commercial viability of extracting petroleum and natural gas resources is considered to be determined when proved and/or probable reserves are determined to exist. All such carried costs are subject to technical, commercial and management review quarterly to confirm the continued intent to develop or otherwise extract value from the discovery. When this is no longer the case, the impairment costs are charged to exploration and evaluation expense. Upon determination of proved and/or probable reserves, E&E assets attributable to those reserves are first tested for impairment and then reclassified to oil and gas properties.
c) Borrowing Costs and Other Capitalized Costs
Borrowing costs that are directly attributable to the acquisition, construction or production of a qualifying asset form part of the cost of that asset. A qualifying asset is an asset that requires a period of one year or greater to get ready for its intended use or sale. Baytex currently has no qualifying assets that would allow for borrowing costs to be capitalized to the asset and all borrowing costs are expensed as incurred.
d) Depletion and Depreciation
The net carrying value of oil and gas properties is depleted using the unit-of-production method based on estimated proved and probable petroleum and natural gas reserves. Future development costs, which are the estimated costs necessary to bring those reserves into production, are included in the depletable base. For purposes of this calculation, petroleum and natural gas reserves are converted to a common unit of measurement on the basis of their relative energy content where six thousand cubic feet of natural gas equates to one barrel of oil.
The depreciation methods and estimated useful lives for other assets for other plant and equipment are as follows:
| Classification | Method | Rate or period | ||
| Motor Vehicles | Diminishing balance | 15% | ||
| Office Equipment | Diminishing balance | 20% | ||
| Computer Hardware | Diminishing balance | 30% | ||
| Furniture and Fixtures | Diminishing balance | 10% | ||
| Leasehold Improvements | Straight-line over life of the lease | Various | ||
| Other Assets | Diminishing balance | Various | ||
The expected lives of other plant and equipment are reviewed on an annual basis and, if necessary, changes in expected useful lives are accounted for prospectively.
42 Baytex Energy Corp. 2014 Annual Report
Goodwill
Goodwill is the excess of the purchase price paid over the recognized amount of net assets acquired, which is inherently imprecise as judgment is required in the determination of the fair value of assets and liabilities. The portion of goodwill related to U.S. operations fluctuates due to changes in foreign exchange rates subsequent to the date of acquisition. Goodwill is assessed for impairment at least annually at year end, or more frequently if events or changes in circumstances indicate that the asset may be impaired. Impairment losses are recognized in net earnings and are not subject to reversal. On the disposal or termination of a previously acquired business, any remaining balance of associated goodwill is included in the determination of the gain or loss on disposal. Goodwill is not deductible for income tax purposes.
Impairment of Non-financial Assets
E&E assets are assessed for impairment when they are reclassified to oil and gas properties and if facts and circumstances suggest that the carrying amount exceeds the recoverable amount. The Company assesses other assets or groups of assets for impairment whenever events or changes in circumstances indicate that the carrying value of an asset may not be recoverable.
Individual assets are grouped for impairment assessment purposes at the lowest level at which there are identifiable cash flows that are largely independent of the cash flows of other groups of assets (the "cash-generating unit" or "CGU"). Goodwill acquired is allocated to CGUs expected to benefit from synergies of the related business combination.
If any such indication of impairment exists or when annual impairment testing for a CGU is required, the Company makes an estimate of its recoverable amount. A CGU's recoverable amount is the higher of its fair value less costs to sell and its value-in-use. In assessing the recoverable amount, the estimated future cash flows are adjusted for the risks specific to the CGU and are discounted to their present value using a pre-tax discount rate that reflects current market assessments of the time value of money. Where the carrying amount of a CGU exceeds its recoverable amount, the CGU is considered impaired and is written down to its recoverable amount. The impairment amount reduces first the carrying amount of any goodwill allocated to the CGU. Any remaining impairment is allocated to the individual assets in the CGU on a pro-rata basis. Impairment is charged to net income in the period in which it occurs.
For all assets (other than goodwill), an assessment is made at each reporting date as to whether there is any indication that previously recognized impairment losses may no longer exist or may have decreased. If such indication exists, the recoverable amount is estimated. A previously recognized impairment loss is reversed only if there has been a change in the estimates used to determine the asset's recoverable amount since the last impairment loss was recognized. If that is the case, the carrying amount of the asset is increased to its recoverable amount. That increased amount cannot exceed the carrying amount that would have been determined, net of depletion and depreciation, had no impairment loss been recognized for the asset in prior years. Such reversal is recognized in net income. After such a reversal, the depletion or depreciation charge is adjusted in future periods to allocate the asset's revised carrying amount, less any residual value, on a systematic basis over its remaining useful life. Impairment losses recognized in relation to goodwill are not reversed for subsequent increases in its recoverable amount.
Asset Retirement Obligations
The Company recognizes a liability at the discounted value for the future asset retirement costs associated with its oil and gas properties using the risk free interest rate. The present value of the liability is capitalized as part of the cost of the related asset and depleted to expense over its useful life. The liability is accreted until the date of expected settlement of the retirement obligations and is recognized within financing costs in the statements of income and comprehensive income. The liability will be revised each period for the effect of any changes to timing related to cash flow or undiscounted abandonment costs and changes in discount and inflation rates. Actual site reclamation expenditures incurred reduce asset retirement obligations recorded.
Baytex Energy Corp. 2014 Annual Report 43
Foreign Currency Translation
Transactions completed in foreign currencies are reflected in Canadian dollars at the foreign currency exchange rates prevailing at the time of the transactions. Monetary assets and liabilities denominated in foreign currencies are reflected in the statements of financial position in Canadian dollars using the foreign currency exchange rates prevailing at the reporting date. Foreign exchange gains and losses are included in net income.
Revenues and expenses of foreign operations are translated into Canadian dollars using average foreign currency exchange rates for the period. Assets and liabilities that form part of the net investment in the foreign operation are translated at the period-end foreign currency exchange rate. Gains or losses resulting from the translation are included in accumulated other comprehensive income (loss) in shareholders' equity and are reclassified to net income when there has been a disposal or partial disposal of the foreign operation.
Revenue Recognition
Revenue associated with sales of petroleum and natural gas is recognized when title passes to the purchaser at the delivery point and collectability of the revenue is probable. Revenue is measured net of royalties (crown, freehold and gross overriding), the Saskatchewan surcharge and the Texas severance tax. These items are netted from revenue to reflect the deduction for other parties' proportionate share of the revenue.
Revenue from the production of oil in which the Company has an interest with other producers is recognized based on the Company's working interest and the terms of the relevant joint venture agreements. Purchases and sales of products that are entered into in contemplation of each other with the same counterparty with the right and intent to settle net are recorded on a net basis.
Financial Instruments
Financial instruments are measured at fair value on initial recognition of the instrument and are classified into one of the following five categories: fair value through profit or loss ("FVTPL"), loans and receivables, held-to-maturity investments, available-for-sale financial assets and other financial liabilities.
Subsequent measurement of financial instruments is based on their initial classification. FVTPL financial assets are measured at fair value and changes in fair value are recognized in net income. Available-for-sale financial assets are measured at fair value with changes in fair value recorded in other comprehensive income (loss) until the instrument is derecognized or impaired. The remaining categories of financial instruments are recognized at amortized cost using the effective interest method. Cash and financial derivatives are classified at FVTPL. Trade and other receivables are classified as loans and receivables, which are measured at amortized cost. Trade and other payables, dividends payable to shareholders, bank loan and long-term debt are classified as other financial liabilities, which are measured at amortized cost.
All risk management contracts are recorded in the consolidated statements of financial position at fair value unless they were entered into and continue to be held in accordance with the Company's expected purchase, sale and usage requirements. All changes in their fair value are recorded in net income. The Company has elected not to use cash flow hedge accounting on its risk management contracts with financial counterparties resulting in all changes in fair value being recorded in net income.
An embedded derivative is a component of a contract that modifies the cash flows of the contract. These hybrid contracts consist of a host contract and an embedded derivative. The embedded derivative is separated from the host contract and accounted for as a derivative unless the economic characteristics and risks of the embedded derivative are closely related to the host contract. The embedded derivatives are measured at FVTPL.
The transaction costs that are directly attributable to the acquisition or issue of a financial asset or a financial liability classified as FVTPL are expensed immediately. For a financial asset or a financial liability carried at amortized cost, transaction costs directly attributable to acquiring or issuing the asset or liability are added to, or deducted from, the fair value on initial recognition and amortized through net income over the term of the financial instrument. Debt
44 Baytex Energy Corp. 2014 Annual Report
issuance costs related to the restructuring of credit facilities are capitalized and amortized as financing costs over the term of the credit facilities.
The Company formally documents its risk management objectives and strategies to manage exposures to fluctuations in commodity prices, interest rates and foreign currency exchange rates. The risk management policy permits the use of certain derivative financial instruments, including swaps and collars, to manage these fluctuations. All transactions of this nature entered into by the Company are related to underlying financial instruments or future petroleum and natural gas production. These instruments are classified as FVTPL. The Company does not use financial derivatives for trading or speculative purposes. The Company has not designated its financial derivative contracts as effective accounting hedges, and therefore has not applied hedge accounting. As a result, the Company applies the fair value method of accounting for all derivative instruments by recording an asset or liability on the statements of financial position and recognizing changes in the fair value of the instrument in the statements of income and comprehensive income for the current period. The fair values of these instruments are based on quoted market prices or, in their absence, third-party market indications and forecasts. Attributable transaction costs are recognized in net income when incurred.
The Company has accounted for its physical delivery sales contracts, which were entered into and continue to be held for the purpose of receipt or delivery of non-financial items in accordance with its expected purchase, sale or usage requirements as executory contracts. As such, these contracts are not considered to be derivative financial instruments and have not been recorded at fair value on the statements of financial position. Settlements on these physical delivery sales contracts are recognized in revenue in the period the product is delivered to the sales point.
Income Taxes
Current and deferred income taxes are recognized in net income, except when they relate to items that are recognized directly in equity, in which case the current and deferred taxes are also recognized directly in equity. When current income tax or deferred income tax arises from the initial accounting for a business combination, the tax effect is included in the accounting for the business combination as goodwill.
Current income taxes for the current and prior periods are measured at the amount expected to be recoverable from or payable to the taxation authorities based on the income tax rates enacted at the end of the reporting period.
The Company follows the balance sheet liability method of accounting for income taxes. Under this method, deferred income taxes are recorded for the effect of any temporary differences between the carrying amounts of assets and liabilities in the consolidated financial statements and the corresponding tax basis used in the computation of taxable income. Deferred income tax liabilities are generally recognized for all taxable temporary differences. Deferred income tax assets are recognized for all temporary differences deductible to the extent future recovery is probable. The carrying amount of deferred income tax assets is reviewed at the end of each reporting period and reduced to the extent that it is no longer probable that sufficient taxable income will be available to allow all or part of the asset to be recovered. Deferred income taxes are calculated using enacted or substantively enacted tax rates. Deferred income tax balances are adjusted for any changes in the enacted or substantively enacted tax rates and the adjustment is recognized in the period that the rate change occurs.
Share-based Compensation Plans
Expenses related to the Share Award Incentive Plan are determined based on the fair value of the award on the grant date. This amount is expensed over the vesting period of the share award.
Baytex's Share Rights Plan and Share Award Incentive Plan are further described in note 16.
Baytex Energy Corp. 2014 Annual Report 45
4. CHANGES IN ACCOUNTING POLICIES
Current Accounting Pronouncements
Presentation of Financial Statements
Certain standards and amendments were issued effective for accounting periods beginning on or after January 1, 2014. Many of these updates are not applicable or not consequential to the Company and have been excluded from the discussion below. As of January 1, 2014, the Company adopted the following IFRS standards and amendments in accordance with the transitional provisions of each standard.
Financial Instruments: Presentation
IAS 32 "Financial Instruments: Presentation" is effective January 1, 2014, and has been amended to clarify certain requirements for offsetting financial assets and liabilities. IAS 32 relates to presentation and disclosure of financial instruments and the retrospective adoption of this standard did not have a material impact on the Company's consolidated financial statements.
Levies
IFRS Interpretations Committee ("IFRIC") 21 "Levies" is effective January 1, 2014, and clarifies the recognition requirements concerning a liability to pay a levy imposed by a government, other than an income tax. The interpretation clarifies that the obligating event which gives rise to a liability is the activity that triggers the payment of the levy in accordance with the relevant legislation. The retrospective adoption of this standard did not have a material impact on the Company's consolidated financial statements.
Future Accounting Pronouncements
Revenue from Contracts with Customers
IFRS 15, "Revenue from Contracts with Customers" is effective January 1, 2017 and will supersede IAS 11 and IAS 18 (and related interpretations including IFRIC 13, IFRIC 15, IFRIC 18 and SIC 31). The new standard moves away from a revenue recognition model based on an earnings process to an approach that is based on transfer of control of a good or service to a customer. The new standard also requires disclosures on the nature, amount, timing and uncertainty of revenues and cash flows arising from contracts with customers. The Company has not yet adopted IFRS 15 but is evaluating its impact on the consolidated financial statements.
Financial Instruments
IFRS 9, "Financial Instruments" replaces IAS 39 "Financial Instruments: Recognition and Measurement", which eliminates the current multiple classification and measurement models for financial assets and liabilities with a single model that has only two classifications: amortized cost and fair value. In November 2013, the IASB amended IFRS 9 to include the new general hedge accounting model which remains optional, allows more opportunities to apply hedge accounting, and will be effective on January 1, 2018 and applied retroactively to each period presented. The Company has not yet adopted IFRS 9 but is evaluating its impact on the consolidated financial statements.
46 Baytex Energy Corp. 2014 Annual Report
5. SEGMENTED FINANCIAL INFORMATION
Baytex's reportable segments are determined based on the Company's geographic locations.
- •
- Canada includes the exploration for, and the development and production of, crude oil and natural gas in Western Canada.
- •
- U.S. includes the exploration for, and the development and production of, crude oil and natural gas in the states of Texas and North Dakota, USA. The Texas assets were acquired on June 11, 2014. The North Dakota assets were sold on September 24, 2014.
- •
- Corporate includes corporate activities and items not allocated between operating segments.
Canada | U.S. | Corporate | Consolidated | ||||||||||||||||||||||
| Year ended December 31 | 2014 | 2013 | 2014 | 2013 | 2014 | 2013 | 2014 | 2013 | |||||||||||||||||
| Revenues, net of royalties | $ | 1,124,279 | $ | 1,049,266 | $ | 405,618 | $ | 66,144 | $ | – | $ | – | $ | 1,529,897 | $ | 1,115,410 | |||||||||
Expenses | |||||||||||||||||||||||||
| Production and operating | 272,515 | 254,037 | 81,334 | 21,482 | – | – | 353,849 | 275,519 | |||||||||||||||||
| Transportation and blending | 141,886 | 158,841 | – | – | – | – | 141,886 | 158,841 | |||||||||||||||||
| Exploration and evaluation | 10,499 | 5,407 | 7,244 | 4,879 | – | – | 17,743 | 10,286 | |||||||||||||||||
| Depletion and depreciation | 328,902 | 305,336 | 204,461 | 20,968 | 3,206 | 2,649 | 536,569 | 328,953 | |||||||||||||||||
| Impairment | 37,755 | – | 411,835 | – | – | – | 449,590 | – | |||||||||||||||||
| General and administrative | – | – | – | – | 59,957 | 45,461 | 59,957 | 45,461 | |||||||||||||||||
| Acquisition-related costs | – | – | – | – | 38,591 | – | 38,591 | – | |||||||||||||||||
| Share-based compensation | – | – | – | – | 27,463 | 32,341 | 27,463 | 32,341 | |||||||||||||||||
| Financing costs | – | – | – | – | 90,033 | 50,335 | 90,033 | 50,335 | |||||||||||||||||
| Financial derivatives (gain) loss | – | – | – | – | (212,524 | ) | 13,132 | (212,524 | ) | 13,132 | |||||||||||||||
| Foreign exchange loss | – | – | – | – | 75,381 | 3,906 | 75,381 | 3,906 | |||||||||||||||||
| Divestiture of oil and gas properties (gain) loss | (6,302 | ) | (22,490 | ) | (43,923 | ) | 1,479 | – | – | (50,225 | ) | (21,011 | ) | ||||||||||||
| 785,255 | 701,131 | 660,951 | 48,808 | 82,107 | 147,824 | 1,528,313 | 897,763 | ||||||||||||||||||
| Net income (loss) before income taxes | 339,024 | 348,135 | (255,333 | ) | 17,336 | (82,107 | ) | (147,824 | ) | 1,584 | 217,647 | ||||||||||||||
Income tax expense | |||||||||||||||||||||||||
| Current income tax expense (recovery) | – | – | 53,680 | (6,821 | ) | 195 | – | 53,875 | (6,821 | ) | |||||||||||||||
| Deferred income tax expense (recovery) | 122,346 | 90,706 | (25,403 | ) | 1,345 | (16,427 | ) | (32,428 | ) | 80,516 | 59,623 | ||||||||||||||
| 122,346 | 90,706 | 28,277 | (5,476 | ) | (16,232 | ) | (32,428 | ) | 134,391 | 52,802 | |||||||||||||||
| Net income (loss) | $ | 216,678 | $ | 257,429 | $ | (283,610 | ) | $ | 22,812 | $ | (65,875 | ) | $ | (115,396 | ) | $ | (132,807 | ) | $ | 164,845 | |||||
| Total capital expenditures(1) | $ | 360,365 | $ | 428,853 | $ | 2,950,861 | $ | 82,965 | $ | 8,283 | $ | 4,059 | $ | 3,319,509 | $ | 515,877 | |||||||||
- (1)
- Includes acquisitions and divestitures.
| As at | December 31, 2014 | December 31, 2013 | ||||
| Canadian assets | $ | 2,377,492 | $ | 2,340,702 | ||
| U.S. assets | 3,598,192 | 322,150 | ||||
| Corporate assets | 254,912 | 35,482 | ||||
| Total consolidated assets | $ | 6,230,596 | $ | 2,698,334 | ||
6. ASSETS HELD FOR SALE
At December 31, 2014, there were no assets or related liabilities classified as held for sale. In December 2013, the Board of Directors of Baytex approved a proposed transaction with an oil and natural gas company to exchange certain heavy oil assets in Saskatchewan and in return, receive certain heavy oil assets in the Peace River region of Alberta. Assets held for sale at December 31, 2013 included $0.3 million of exploration and evaluation assets and $73.3 million of oil and gas properties. Liabilities related to assets held for sale included $10.2 million of asset retirement obligations. The disposition was completed in the second quarter of 2014, resulting in a gain on disposition of $17.9 million for the year ended December 31, 2014.
7. BUSINESS COMBINATION
On June 11, 2014, Baytex acquired all of the issued and outstanding shares of Aurora Oil & Gas Limited ("Aurora"), a public oil and natural gas company listed on the Australian Stock Exchange and the TSX with properties in Texas, USA. The total consideration for the acquisition was $2.8 billion (including the assumption of approximately $0.9 billion of indebtedness).
Baytex Energy Corp. 2014 Annual Report 47
The acquisition has been accounted for as a business combination with the fair value of the assets acquired and liabilities assumed at the date of acquisition summarized below:
| Consideration for the acquisition: | ||||
| Cash paid | $ | 1,920,928 | ||
| Cash acquired | (54,621 | ) | ||
| Bank loan assumed | 145,618 | |||
| Long-term debt assumed | 810,061 | |||
| Total consideration | $ | 2,821,986 | ||
Allocation of purchase price: | ||||
| Trade and other receivables | $ | 108,965 | ||
| Exploration and evaluation assets | 391,127 | |||
| Oil and gas properties | 2,520,612 | |||
| Other plant and equipment | 1,209 | |||
| Goodwill | 615,338 | |||
| Trade and other payables | (242,045 | ) | ||
| Financial derivative contracts | (20,083 | ) | ||
| Asset retirement obligations | (1,217 | ) | ||
| Deferred income tax liabilities | (551,920 | ) | ||
| Total net assets acquired | $ | 2,821,986 | ||
Acquisition-related costs totaling $38.6 million have been excluded from the consideration paid and have been recognized as an expense in the year ended December 31, 2014, within the "Acquisition-related costs" line item in the consolidated statements of income (loss) and comprehensive income. Goodwill arising on this acquisition of $615.3 million relates to incremental well locations and undeveloped zones and areas, and is attributable to the excess of consideration paid over the fair value of assets acquired, including $551.9 million related to the recognition of deferred income tax liabilities. Goodwill is not deductible for tax purposes.
For the period from June 11, 2014 to December 31, 2014, the acquired properties contributed revenues, net of royalties, of $349.4 million and operating income (revenues, net of royalties less production and operating expenses and transportation and blending expenses) of $281.9 million to Baytex's operations. If the acquisition had occurred on January 1, 2014, management estimates for the year ended December 31, 2014, that the acquired properties would have contributed revenues, net of royalties, of approximately $601.2 million and operating income of approximately $501.2 million.
8. EXPLORATION AND EVALUATION ASSETS
| Cost | |||||
| As at December 31, 2012 | $ | 240,015 | |||
| Capital expenditures | 11,846 | ||||
| Property acquisition | 3,060 | ||||
| Exploration and evaluation expense | (10,286 | ) | |||
| Transfer to oil and gas properties | (82,886 | ) | |||
| Divestitures | (1,109 | ) | |||
| Assets held for sale | (305 | ) | |||
| Foreign currency translation | 2,652 | ||||
| As at December 31, 2013 | $ | 162,987 | |||
| Capital expenditures | 15,824 | ||||
| Corporate acquisition | 391,127 | ||||
| Property acquisition | 12,489 | ||||
| Exploration and evaluation expense | (17,743 | ) | |||
| Transfer to oil and gas properties | (10,443 | ) | |||
| Divestitures | (40,306 | ) | |||
| Foreign currency translation | 28,105 | ||||
| As at December 31, 2014 | $ | 542,040 | |||
48 Baytex Energy Corp. 2014 Annual Report
As at December 31, 2014, our exploration and evaluation assets were assessed for impairment. In Canada, the Company estimated the recoverable amount based on the fair value of undeveloped land. In the U.S., the Company estimated the recoverable amount based on management's estimate of the recoverable amount associated with possible reserves as well as the fair value of the undeveloped land. Recoverable amounts for exploration and evaluation assets exceeded the carrying value therefore no impairment was recorded at December 31, 2014.
9. OIL AND GAS PROPERTIES
| Cost | |||||
| As at December 31, 2012 | $ | 2,758,309 | |||
| Capital expenditures | 539,054 | ||||
| Corporate acquisition | 100 | ||||
| Property acquisitions | 108 | ||||
| Transferred from exploration and evaluation assets | 82,886 | ||||
| Assets held for sale | (110,386 | ) | |||
| Change in asset retirement obligations | (28,734 | ) | |||
| Divestitures | (33,907 | ) | |||
| Foreign currency translation | 16,338 | ||||
| As at December 31, 2013 | $ | 3,223,768 | |||
| Capital expenditures | 750,247 | ||||
| Corporate acquisition | 2,520,612 | ||||
| Property acquisitions | 85,600 | ||||
| Transferred from exploration and evaluation assets | 10,443 | ||||
| Change in asset retirement obligations | 69,844 | ||||
| Divestitures | (426,477 | ) | |||
| Foreign currency translation | 197,723 | ||||
| As at December 31, 2014 | $ | 6,431,760 | |||
| Accumulated depletion | |||||
| As at December 31, 2012 | $ | 720,733 | |||
| Depletion for the year | 325,793 | ||||
| Divestitures | (10,191 | ) | |||
| Assets held for sale | (37,057 | ) | |||
| Foreign currency translation | 1,704 | ||||
| As at December 31, 2013 | $ | 1,000,982 | |||
| Depletion for the year | 532,825 | ||||
| Divestitures | (96,916 | ) | |||
| Foreign currency translation | 10,953 | ||||
| As at December 31, 2014 | $ | 1,447,844 | |||
Carrying value | |||||
| As at December 31, 2013 | $ | 2,222,786 | |||
| As at December 31, 2014 | $ | 4,983,916 | |||
During 2014, Baytex disposed of certain non-core assets in Canada, consisting of $34.8 million of oil and gas properties and $7.2 million of exploration and evaluation assets, for net cash proceeds of $45.7 million. Gains totaling $3.7 million were recognized in the statements of income (loss) and comprehensive income.
On September 24, 2014, Baytex Energy USA LLC, an indirect wholly-owned subsidiary of Baytex, disposed of its interests located in North Dakota, which consisted of oil and gas properties, exploration and evaluation assets and other plant and equipment with carrying values of $294.0 million, $32.5 million and $2.0 million, respectively, for
Baytex Energy Corp. 2014 Annual Report 49
cash proceeds of $341.6 million resulting in a gain of $13.1 million before tax. An additional $15.5 million was recognized in gain on divestiture of oil and gas properties resulting from the accumulated other comprehensive income which is reclassified on disposition.
In January 2013, Baytex disposed of certain assets in Canada which consisted of $20.8 million of oil and gas properties for total proceeds of $43.3 million. Gains totaling $21.0 million were recognized in the consolidated statements of income (loss) and comprehensive income.
The carrying value of oil and gas properties are subject to impairment tests, which were calculated at December 31, 2014 using the following benchmark reference prices for the years 2015 to 2019 adjusted for commodity differentials specific to the Company:
| 2015 | 2016 | 2017 | 2018 | 2019 | ||||||
| WTI crude oil (US$/bbl) | 57.26 | 80.00 | 90.00 | 91.35 | 92.72 | |||||
| AECO natural gas ($/MMBtu) | 3.32 | 3.71 | 3.90 | 4.47 | 5.05 | |||||
| Exchange rate (CAD/USD) | 1.18 | 1.15 | 1.15 | 1.15 | 1.15 | |||||
Oil and natural gas prices reflect the NYMEX futures market as at December 31, 2014. This data is combined with assumptions relating to long-term prices, inflation rates and exchange rates together with estimates of transportation costs and pricing of competing fuels to forecast long-term energy prices, consistent with external sources of information. The prices and costs subsequent to 2019 have been adjusted for inflation at an annual rate of 1.5%.
For impairment assessments of oil and gas properties, the Company estimates the recoverable amount using a discounted cash flow model based on an independent reserve report approved by the Board of Directors on an annual basis and a pre-tax discount rate. The reserve report is based on an estimated remaining reserve life up to a maximum of 50 years. The forecasted cash flows include reserves where there is at least a 50% probability that the estimated proved plus probable reserves will be recovered. The recoverable amount was determined using a pre-tax discount rate of 10%.
At December 31, 2014, the Company's recoverable amount was lower than the carrying value of oil and gas properties and therefore impairment was recorded against goodwill (note 11).
10. OTHER PLANT AND EQUIPMENT
| Cost | |||||
| As at December 31, 2012 | $ | 65,115 | |||
| Capital expenditures | 4,298 | ||||
| Foreign currency translation | 97 | ||||
| As at December 31, 2013 | $ | 69,510 | |||
| Capital expenditures | 8,283 | ||||
| Corporate acquisition | 1,209 | ||||
| Dispositions | (2,496 | ) | |||
| Foreign currency translation | 202 | ||||
| As at December 31, 2014 | $ | 76,708 | |||
| Accumulated depreciation | |||||
| As at December 31, 2012 | $ | 36,723 | |||
| Depreciation | 3,158 | ||||
| Foreign currency translation | 70 | ||||
| As at December 31, 2013 | $ | 39,951 | |||
| Depreciation | 3,744 | ||||
| Dispositions | (1,327 | ) | |||
| Foreign currency translation | 72 | ||||
50 Baytex Energy Corp. 2014 Annual Report
| As at December 31, 2014 | $ | 42,440 | |||
| Carrying value | |||
| As at December 31, 2013 | $ | 29,559 | |
| As at December 31, 2014 | $ | 34,268 | |
Field inventory held is valued at the lower of cost, using the weighted average cost method, or net realizable value and is not depreciated.
11. GOODWILL
| As at December 31, 2012 and 2013 | $ | 37,755 | |||
| Acquired goodwill | 615,338 | ||||
| Impairment | (449,590 | ) | |||
| Foreign currency translation | 41,562 | ||||
| As at December 31, 2014 | $ | 245,065 | |||
The recoverable amounts of the Conventional CGU in Canada and the USA CGU were not sufficient to support the carrying amounts of exploration and evaluation assets, the oil and gas properties and the goodwill, resulting in an impairment for the year ended December 31, 2014 (no impairment for the year ended December 31, 2013).
For the year ended December 31, 2014, the Company recorded a goodwill impairment expense of $449.6 million (year ended December 31, 2013 – nil), derecognizing all of the $37.8 million of goodwill recognized on the 2004 acquisition of certain conventional oil and gas properties in the Conventional CGU and $411.8 million of goodwill related to the 2014 Aurora acquisition in the U.S. The Company has reduced its planned capital expenditure program in the Conventional CGU in 2015 resulting in lower estimated future cash flows. The decline in commodity prices, in particular crude oil, since the date of acquisition of the U.S. assets, resulted in a reduction of expected future net cash flows from the acquired assets to an amount lower than the combined carrying value of the assets and associated goodwill at December 31, 2014.
For the purposes of the impairment test, recoverable amounts for the Eagle Ford CGU and Conventional CGU are $2,923.2 million and $285.9 million, respectively. Recoverable amounts related to the goodwill impairment test were determined using the key assumptions listed in notes 8 and 9. A change of 1% in the before tax discount rate would change the impairment of goodwill by approximately $215 million.
12. BANK LOAN
| December 31, 2014 | December 31, 2013 | |||||
| Bank loan | $ | 663,312 | $ | 223,371 | ||
Effective June 4, 2014, Baytex established revolving extendible unsecured credit facilities with its bank lending syndicate that include a $50 million operating loan, a $950 million syndicated loan for Baytex and a US$200 million syndicated loan for our wholly-owned subsidiary, Baytex Energy USA, Inc., all of which have a four-year term (collectively, the "Revolving Facilities").
An additional $200 million non-revolving single draw down facility was available solely to finance the acquisition of Aurora. In accordance with the terms of the credit facility agreement, it was repaid in full on September 29, 2014 using a portion of the proceeds from the sale of the North Dakota assets.
Unless extended, the revolving period under the Revolving Facilities will end on June 4, 2018 with all amounts to be re-paid on such date. Baytex may request an extension under the Revolving Facilities, which could extend the revolving period for up to four years (subject to a maximum four-year term at any time). The Revolving Facilities do
Baytex Energy Corp. 2014 Annual Report 51
not require any mandatory principal payments prior to maturity and do not include a term-out feature or a borrowing base restriction. The Revolving Facilities include an option allowing such facilities to be increased by up to $250 million, subject to existing or new lender(s) providing commitments for any such increase.
The Revolving Facilities contain standard commercial covenants for facilities of this nature and are guaranteed by Baytex and its subsidiaries. Advances (including letters of credit) under the Revolving Facilities can be drawn in either Canadian or U.S. funds and bear interest at the bank's prime lending rate, bankers' acceptance discount rates or London Interbank Offered Rates, plus applicable margins. In the event that Baytex exceeds any of the covenants under the Revolving Facilities, its ability to pay dividends to its shareholders, borrow funds or increase the facilities may be restricted.
At December 31, 2014, $3.6 million of unamortized debt issuance costs relating to the restructuring of the Revolving Facilities were netted against the carrying value of the bank loan and will be amortized as debt financing costs over the remainder of the initial four-year term of the facility. Amortization of the debt issuance costs of $0.5 million have been recorded in financing costs for the year ended December 31, 2014 (year ended December 31, 2013 – $nil).
The weighted average interest rate on the bank loan for the year ended December 31, 2014 was 3.25%, and 4.61% for the year ended December 31, 2013. Baytex is in compliance with all covenants at December 31, 2014.
At December 31, 2013, the Company's wholly-owned subsidiary, Baytex Energy Ltd. ("Baytex Energy"), had a $40.0 million extendible operating loan facility with a chartered bank and an $810.0 million extendible syndicated loan facility with a syndicate of chartered banks, each of which constituted a revolving credit facility that was extendible annually for up to four years (subject to a maximum four-year term at any time). Baytex Energy was not required to make any mandatory principal payments prior to maturity. Advances (including letters of credit) under the credit facilities could be drawn in either Canadian or U.S. funds and interest was payable at the bank's prime lending rate, bankers' acceptance discount rates or London Interbank Offered Rates, plus applicable margins. The credit facilities contained standard commercial covenants and were secured by a floating charge over all of Baytex Energy's assets and were guaranteed by Baytex and certain of its material subsidiaries. The credit facilities did not include a term-out feature or a borrowing base restriction. Effective June 4, 2014, upon acquisition of Aurora, the $40.0 million extendible operating loan facility and $810.0 million extendible syndicated loan facility were terminated.
13. LONG-TERM DEBT
| December 31, 2014 | December 31, 2013 | |||||
| 9.875% notes (US$7,900 – principal) due February 15, 2017(1) | $ | 9,737 | $ | – | ||
| 7.500% notes (US$6,400 – principal) due April 1, 2020 | 8,167 | – | ||||
| 6.750% notes (US$150,000 – principal) due February 17, 2021 | 172,207 | 157,673 | ||||
| 5.125% notes (US$400,000 – principal) due June 1, 2021 | 458,554 | – | ||||
| 6.625% notes (Cdn$300,000 – principal) due July 19, 2022 | 294,859 | 294,357 | ||||
| 5.625% notes (US$400,000 – principal) due June 1, 2024 | 455,508 | – | ||||
| Total long-term debt | $ | 1,399,032 | $ | 452,030 | ||
- (1)
- Redeemed on February 27, 2015.
Pursuant to the acquisition of Aurora (note 7), Baytex assumed US$365 million of 9.875% senior unsecured notes due February 15, 2017 (the "2017 Notes") and US$300 million of 7.500% senior unsecured notes due April 1, 2020 (the "2020 Notes" and, together with the 2017 Notes, the "Notes").
On April 22, 2014, Baytex commenced a cash tender offer and consent solicitation for the Notes at a price (per US$1,000 of principal amount) of US$1,107.34 for the 2017 Notes and US$1,138.97 for the 2020 Notes. Upon closing of the tender offers, on June 11, 2014, Baytex purchased and cancelled US$357.1 million (97.8% of total outstanding) of the 2017 Notes and US$293.6 million (97.9% of total outstanding) of the 2020 Notes. The remaining Notes are recorded at fair value by applying the tender premium on the Notes on the date of acquisition. The premium will be amortized using the effective interest rate of 6.7% for the 2017 Notes and 5.3% for the 2020 Notes. The Notes are redeemable at the Company's option, in whole or in part, commencing on February 15, 2015 (in the
52 Baytex Energy Corp. 2014 Annual Report
case of the 2017 Notes) and April 1, 2016 (in the case of the 2020 notes) in accordance with the terms of the indenture agreements. On February 27, 2015, the Company redeemed all of the outstanding 2017 Notes at a price of US$8.3 million plus accrued interest.
On June 6, 2014, Baytex issued US$800 million of senior unsecured notes comprised of US$400 million of 5.125% notes due June 1, 2021 (the "2021 Notes") and US$400 million of 5.625% notes due June 1, 2024 (the "2024 Notes"). The 2021 Notes and the 2024 Notes pay interest semi-annually and are redeemable at the Company's option in whole or in part, commencing on June 1, 2017 (in the case of the 2021 Notes) and June 1, 2019 (in the case of the 2024 Notes). The 2021 Notes are redeemable at the following redemption prices (expressed as a percentage of the principal amount of the notes): 2017 at 102.563%, 2018 at 101.281%, 2019 and thereafter at 100.00%. The 2024 Notes are redeemable at the following redemption prices (expressed as a percentage of the principal amount of the notes): 2019 at 102.813%, 2020 at 101.875%, 2021 at 100.938%, 2022 and thereafter at 100%.These notes are carried at amortized cost, net of debt issuance costs of US$7.4 million (in the case of the 2021 Notes) and US$10.5 million (in the case of the 2024 Notes), which accrete to the principal balance at maturity using the effective interest rate of 5.3% for the 2021 Notes and 5.9% for the 2024 Notes.
On July 19, 2012, Baytex issued $300 million of 6.625% senior unsecured notes due July 19, 2022. These notes pay interest semi-annually and are redeemable at the Company's option in whole or in part, commencing on July 19, 2017 at the following redemption prices (expressed as a percentage of the principal amount of the notes): 2017 at 103.313%, 2018 at 102.208%, 2019 at 101.104%, 2020 and thereafter at 100%. These notes are carried at amortized cost, net of debt issuance costs of $6.3 million, which accrete up to the principal balance at maturity using the effective interest rate of 6.9%.
On February 17, 2011, Baytex issued US$150 million of 6.750% senior unsecured notes due February 17, 2021. These notes pay interest semi-annually and are redeemable at the Company's option in whole or in part, commencing on February 17, 2016 at the following redemption prices (expressed as a percentage of the principal amount of the notes): 2016 at 103.375%, 2017 at 102.250%, 2018 at 101.125%, 2019 and thereafter at 100%. These notes are carried at amortized cost, net of debt issuance costs of US$2.3 million, which accrete up to the principal balance at maturity using the effective interest rate of 7.0%.
Each of the outstanding notes are redeemable in accordance with the redemption provisions contained in the indenture governing such notes. Baytex has recognized the fair value of this redemption feature as a derivative financial asset. The fair value has been estimated using a valuation model that considers current bond prices and the spreads associated with the outstanding notes compared to the fixed redemption rates. A fair value loss of $5.9 million for the year ended December 31, 2014 (year ended December 31, 2013 – $nil) has been recorded as a financial derivatives loss. As at December 31, 2014, a $0.5 million asset has been included in financial derivatives (December 31, 2013 – $nil) representing the fair value of the redemption feature on all notes.
Accretion expense on the outstanding notes of $1.2 million has been recorded in financing costs for the year ended December 31, 2014 (year ended December 31, 2013 – $0.7 million).
14. ASSET RETIREMENT OBLIGATIONS
| December 31, 2014 | December 31, 2013 | ||||||
| Balance, beginning of year | $ | 221,628 | $ | 265,520 | |||
| Liabilities incurred | 18,516 | 14,901 | |||||
| Liabilities settled | (14,528 | ) | (12,076 | ) | |||
| Liabilities acquired | 2,271 | – | |||||
| Liabilities divested | (25,305 | ) | (1,409 | ) | |||
| Corporate acquisition (note 7) | 1,217 | – | |||||
| Accretion | 7,251 | 7,011 | |||||
| Change in estimate(1) | 31,599 | (42,226 | ) | ||||
| Changes in discount rates and inflation rates | 42,763 | – | |||||
| Liabilities related to assets held for sale (note 6) | – | (10,241 | ) | ||||
| Foreign currency translation | 620 | 148 | |||||
| Balance, end of year | $ | 286,032 | $ | 221,628 | |||
- (1)
- Changes in the estimated costs, the timing of abandonment and reclamation and the status of wells are factors resulting in a change in estimate.
Baytex Energy Corp. 2014 Annual Report 53
The Company's asset retirement obligations are based on its net ownership in wells and facilities. Management estimates the costs to abandon and reclaim the wells and the facilities using existing technology and the estimated time period during which these costs will be incurred in the future. These costs are expected to be incurred over the next 50 years. The undiscounted amount of estimated cash flow required to settle the asset retirement obligations is $336.7 million (December 31, 2013 – $318.6 million). The discounted amount of estimated cash flow required to settle the asset retirement obligations at December 31, 2014 using an estimated annual inflation rate of 1.75% (December 31, 2013 – 2.0%) and discounted at a risk free rate of 2.25% (December 31, 2013 – 3.0%) is $286.0 million (December 31, 2013 – $221.6 million).
15. SHAREHOLDERS' CAPITAL
The authorized capital of Baytex consists of an unlimited number of common shares without nominal or par value and 10,000,000 preferred shares without nominal or par value, issuable in series. Baytex establishes the rights and terms of the preferred shares upon issuance. As at December 31, 2014, no preferred shares have been issued by the Company and all common shares issued were fully paid.
| Number of Common Shares (000s) | Amount | |||||
| Balance, December 31, 2012 | 121,868 | $ | 1,860,358 | |||
| Issued on exercise of share rights | 802 | 10,586 | ||||
| Transfer from contributed surplus on exercise of share rights | – | 20,333 | ||||
| Transfer from contributed surplus on vesting and conversion of share awards | 555 | 24,542 | ||||
| Issued pursuant to dividend reinvestment plan | 2,167 | 88,384 | ||||
| Balance, December 31, 2013 | 125,392 | $ | 2,004,203 | |||
| Issued on exercise of share rights | 683 | 11,298 | ||||
| Transfer from contributed surplus on exercise of share rights | – | 14,369 | ||||
| Transfer from contributed surplus on vesting and conversion of share awards | 842 | 35,108 | ||||
| Issued for cash | 38,433 | 1,495,044 | ||||
| Issuance costs, net of tax | – | (78,468 | ) | |||
| Issued pursuant to dividend reinvestment plan | 2,757 | 99,271 | ||||
| Balance, December 31, 2014 | 168,107 | $ | 3,580,825 | |||
Concurrent with the closing of the acquisition of Aurora on June 11, 2014, Baytex exchanged the 38.4 million subscription receipts issued in February 2014, for 38.4 million common shares and a dividend equivalent payment of $0.88 per subscription receipt (representing the four dividends declared from the date of issuance of the subscription receipts to the date of closing of the acquisition). Issuance costs of $93.7 million ($78.5 million, after tax), including the aggregate dividend equivalent payment of $33.8 million, were incurred and recorded as a reduction to shareholders' capital.
Baytex has a Dividend Reinvestment Plan (the "DRIP") that allows eligible holders in Canada and the United States to reinvest their monthly cash dividends to acquire additional common shares. At the discretion of Baytex, common shares will either be issued from treasury or acquired in the open market at prevailing market prices. Pursuant to the terms of the DRIP, common shares are issued from treasury at a three percent discount to the arithmetic average of the daily volume weighted average trading prices of the common shares on the Toronto Stock Exchange (in respect of participants resident in Canada or any jurisdiction other than the United States) or the New York Stock Exchange (in respect of participants resident in the United States) for the period commencing on the second business day after the dividend record date and ending on the second business day immediately prior to the dividend payment date. Baytex reserves the right at any time to change or eliminate the discount on common shares acquired through the DRIP from treasury.
The holders of common shares may receive dividends as declared from time to time and are entitled to one vote per share at any meetings of the holders of common shares. All common shares rank equally with regard to the Company's net assets in the event the Company is wound-up or terminated.
54 Baytex Energy Corp. 2014 Annual Report
The Company declared monthly dividends of $0.22 per common share from January to May 2014, $0.24 per common share from June to November 2014 and $0.10 per common share for December 2014. During the years ended December 31, 2014 and 2013, total dividends of $395.6 million ($301.1 million net of dividend reinvestment) and $327.0 million ($237.7 million net of dividend reinvestment), respectively, were declared.
16. EQUITY-BASED PLANS
Share Award Incentive Plan
The Company has a full-value award plan (the "Share Award Incentive Plan") pursuant to which restricted awards and performance awards (collectively, "share awards") may be granted to the directors, officers and employees of the Company and its subsidiaries. The maximum number of common shares issuable under the Share Award Incentive Plan (and any other long-term incentive plans of the Company) shall not at any time exceed 3.3% of the then-issued and outstanding common shares.
Each restricted award entitles the holder to be issued the number of common shares designated in the restricted award (plus dividend equivalents as described below) with such common shares to be issued as to one-sixth on the first anniversary date of the grant and as to one-sixth every six months thereafter (with the last issuance to occur 42 months following the grant date). Each performance award entitles the holder to be issued the number of common shares designated in the performance award (plus dividend equivalents as described below) multiplied by a payout multiplier with such common shares to be issued as to one-sixth on the first anniversary date of the grant and as to one-sixth every six months thereafter (with the last issuance to occur 42 months following the grant date). The payout multiplier is dependent on the performance of the Company relative to pre-defined corporate performance measures for a particular period. In the case of both restricted and performance awards, the number of common shares to be issued on the applicable issue date is adjusted to account for the payment of dividends from the grant date to the applicable issue date.
The Company recorded compensation expense related to the share awards of $27.5 million for the year ended December 31, 2014 (year ended December 31, 2013 – $30.7 million).
The fair value of share awards is determined at the date of grant using the closing price of the common shares and, for performance awards, an estimated payout multiplier. The amount of compensation expense is reduced by an estimated forfeiture rate, which has been estimated at a weighted average of 10.4% (2013 – 9.7%) of outstanding share awards. Fluctuations in compensation expense may occur due to changes in estimating the outcome of the performance conditions and actual forfeiture rates. The estimated weighted average fair value for share awards at the measurement date is $43.79 per restricted award and performance award granted during the year ended December 31, 2014 (year ended December 31, 2013 – $42.91 per restricted award and performance award).
The number of share awards outstanding is detailed below:
| Number of restricted awards (000s) | Number of performance awards (000s) | Total number of share awards (000s) | |||||
| Balance, December 31, 2012 | 566 | 388 | 954 | ||||
| Granted | 437 | 374 | 811 | ||||
| Vested and converted to common shares | (215 | ) | (142 | ) | (357 | ) | |
| Forfeited | (65 | ) | (40 | ) | (105 | ) | |
| Balance, December 31, 2013 | 723 | 580 | 1,303 | ||||
| Granted | 533 | 483 | 1,016 | ||||
| Vested and converted to common shares | (320 | ) | (258 | ) | (578 | ) | |
| Forfeited | (189 | ) | (190 | ) | (379 | ) | |
| Balance, December 31, 2014 | 747 | 615 | 1,362 | ||||
Baytex Energy Corp. 2014 Annual Report 55
Share Rights Plan
As a result of the conversion of the legal structure of the Company's predecessor, Baytex Energy Trust (the "Trust"), from an income trust to a corporation at year-end 2010, Baytex adopted a Common Share Rights Incentive Plan (the "Share Rights Plan") to facilitate the exchange of the outstanding unit rights (granted under the Unit Rights Plan of the Trust) for share rights. No grants have been made under the Share Rights Plan since December 31, 2010. The Share Rights Plan will remain in place until such time as all outstanding share rights have been exercised, canceled or expired. Each share right entitles the holder thereof to acquire a common share upon payment of the exercise price, which may be reduced to account for future dividends (subject to certain performance criteria).
As at December 31, 2013, all outstanding share rights were fully expensed and exercisable, therefore no compensation expense was recorded related to the share rights granted under the Share Rights Plan for the year ended December 31, 2014 (year ended December 31, 2013 – $1.6 million). As at December 31, 2014, there were 22,500 share rights outstanding with a weighted average exercise price of $25.01 per share right.
17. NET INCOME (LOSS) PER SHARE
Baytex calculates basic income per share based on the net income (loss) attributable to shareholders using the weighted average number of shares outstanding during the period. Diluted income per share amounts reflect the potential dilution that could occur if share awards were converted and share rights were exercised. The treasury stock method is used to determine the dilutive effect of share awards and share rights whereby the potential conversion of share awards, the estimated proceeds from the exercise of share rights and the amount of compensation expense, if any, attributed to future services are assumed to be used to purchase common shares at the average market price during the year.
| Years Ended December 31 | ||||||||||||||||
| 2014 | 2013 | |||||||||||||||
| Net loss | Common shares (000s) | Net loss per share | Net income | Common shares (000s) | Net income per share | |||||||||||
| Net income (loss) – basic | $ | (132,807 | ) | 148,932 | $ | (0.89 | ) | $ | 164,845 | 123,749 | $ | 1.33 | ||||
| Dilutive effect of share awards | – | – | – | – | 1,180 | – | ||||||||||
| Dilutive effect of share rights | – | – | – | – | 465 | – | ||||||||||
| Net income (loss) – diluted | $ | (132,807 | ) | 148,932 | $ | (0.89 | ) | $ | 164,845 | 125,394 | $ | 1.32 | ||||
For the year ended December 31, 2014, 1.4 million share awards and 0.1 million share rights were anti-dilutive (year ended December 31, 2013 there were no anti-dilutive share awards or share rights).
18. INCOME TAXES
The provision for income taxes has been computed as follows:
| Years Ended December 31 | ||||||||
| 2014 | 2013 | |||||||
| Net income before income taxes | $ | 1,584 | $ | 217,647 | ||||
| Expected income taxes at the statutory rate of 25.47% (2013 – 25.46%)(1) | 403 | 55,413 | ||||||
| Increase (decrease) in income taxes resulting from: | ||||||||
| Share-based compensation | 6,465 | 8,233 | ||||||
| Effect of rate adjustments for foreign jurisdictions | (8,544 | ) | (4,685 | ) | ||||
| Impairment | 114,511 | – | ||||||
| Other | 21,556 | (6,159 | ) | |||||
| Income tax expense | $ | 134,391 | $ | 52,802 | ||||
- (1)
- The change in statutory rate is mainly related to changes in the provincial apportionment of income.
56 Baytex Energy Corp. 2014 Annual Report
In 2014, the Canada Revenue Agency advised Baytex that it is proposing to reassess certain subsidiaries of Baytex to deny non-capital loss deductions relevant to the calculation of income taxes for the years 2011 through 2013. If the non-capital loss deductions that have been claimed to-date are disallowed, it would result in an estimated liability of approximately $57 million and a reduction of approximately $262 million of non-capital losses for subsequent taxation years. The Company believes that it should be entitled to deduct the non-capital losses and that its tax filings to-date are correct.
A continuity of the net deferred income tax liability is detailed in the following tables:
| As at | January 1, 2014 | Recognized in Net Loss | Acquired in Business Combination | Share Issuance Costs | Foreign Currency Translation Adjustment | December 31, 2014 | ||||||||||||||
| Taxable temporary differences: | ||||||||||||||||||||
| Petroleum and natural gas properties | $ | (344,045 | ) | $ | 48,613 | $ | (840,650 | ) | $ | – | $ | – | $ | (1,136,082 | ) | |||||
| Financial derivatives | – | (45,950 | ) | – | – | – | (45,950 | ) | ||||||||||||
| Deferred income | (44,044 | ) | (37,935 | ) | – | – | – | (81,979 | ) | |||||||||||
| Other | (1,772 | ) | 19,244 | – | 15,258 | (39,953 | ) | (7,223 | ) | |||||||||||
| Deductible temporary differences: | ||||||||||||||||||||
| Asset retirement obligations | 62,089 | 13,707 | (878 | ) | – | – | 74,918 | |||||||||||||
| Financial derivatives | 2,397 | 2,944 | – | – | – | 5,341 | ||||||||||||||
| Non-capital losses | 65,558 | (81,297 | ) | 243,109 | – | – | 227,370 | |||||||||||||
| Finance costs | 11,416 | 158 | 46,499 | – | – | 58,073 | ||||||||||||||
| Net deferred income tax liability(1) | $ | (248,401 | ) | $ | (80,516 | ) | $ | (551,920 | ) | $ | 15,258 | $ | (39,953 | ) | $ | (905,532 | ) | |||
- (1)
- Non-capital loss carry-forwards totaled $685.7 million and expire from 2023 to 2034.
| As at | January 1, 2013 | Recognized in Net Income | Acquired in Business Combination | Foreign Currency Translation Adjustment | December 31, 2013 | ||||||||||||
| Taxable temporary differences: | |||||||||||||||||
| Petroleum and natural gas properties | $ | (309,539 | ) | $ | (37,992 | ) | $ | 3,486 | $ | – | $ | (344,045 | ) | ||||
| Deferred income | (40,799 | ) | (3,245 | ) | – | – | (44,044 | ) | |||||||||
| Other | (596 | ) | 1,928 | – | (3,104 | ) | (1,772 | ) | |||||||||
| Deductible temporary differences: | |||||||||||||||||
| Asset retirement obligations | 67,291 | (5,202 | ) | – | – | 62,089 | |||||||||||
| Financial derivatives | (546 | ) | 2,943 | – | – | 2,397 | |||||||||||
| Non-capital losses | 85,585 | (20,027 | ) | – | – | 65,558 | |||||||||||
| Finance costs | 9,444 | 1,972 | – | – | 11,416 | ||||||||||||
| Net deferred income tax liability(1)(2) | $ | (189,160 | ) | $ | (59,623 | ) | $ | 3,486 | $ | (3,104 | ) | $ | (248,401 | ) | |||
- (1)
- Non-capital loss carry-forwards totaled $225.1 million and expire from 2026 to 2031.
- (2)
- The Company has accumulated earnings and profits in its U.S. subsidiary of $97.2 million. The Company intends to reinvest these profits for the foreseeable future and has therefore not recognized a deferred tax liability in respect of these amounts.
Baytex Energy Corp. 2014 Annual Report 57
19. REVENUES
| Years Ended December 31 | |||||||
| 2014 | 2013 | ||||||
| Petroleum and natural gas revenues | $ | 1,957,401 | $ | 1,363,874 | |||
| Royalty expenses | (439,125 | ) | (252,049 | ) | |||
| Royalty income | 4,758 | 3,585 | |||||
| Other income | 6,863 | – | |||||
| Revenues, net of royalties | $ | 1,529,897 | $ | 1,115,410 | |||
20. FINANCING COSTS
| Years Ended December 31 | ||||||
| 2014 | 2013 | |||||
| Bank loan and other | $ | 22,364 | $ | 12,379 | ||
| Long-term debt | 60,418 | 30,945 | ||||
| Accretion on asset retirement obligations | 7,251 | 7,011 | ||||
| Financing costs | $ | 90,033 | $ | 50,335 | ||
21. SUPPLEMENTAL INFORMATION
Change in Non-Cash Working Capital Items
| Years Ended December 31 | |||||||
| 2014 | 2013 | ||||||
| Trade and other receivables | $ | 61,757 | $ | 32,373 | |||
| Crude oil inventory | 1,245 | (144 | ) | ||||
| Trade and other payables | (85,196 | ) | 30,487 | ||||
| $ | (22,194 | ) | $ | 62,716 | |||
| Changes in non-cash working capital related to: | |||||||
| Operating activities | $ | 28,222 | $ | 3,447 | |||
| Investing activities | (50,416 | ) | 59,269 | ||||
| $ | (22,194 | ) | $ | 62,716 | |||
Foreign Exchange
| Years Ended December 31 | |||||||
| 2014 | 2013 | ||||||
| Unrealized foreign exchange loss | $ | 75,011 | $ | 9,828 | |||
| Realized foreign exchange loss (gain) | 370 | (5,922 | ) | ||||
| Foreign exchange loss | $ | 75,381 | $ | 3,906 | |||
Income Statement Presentation
The following table details the amount of total employee compensation costs included in the production and operating expense and general and administrative expense.
| Years Ended December 31 | ||||||
| 2014 | 2013 | |||||
| Production and operating | $ | 13,262 | $ | 9,209 | ||
| General and administrative | 36,269 | 29,812 | ||||
| Total employee compensation costs | $ | 49,531 | $ | 39,021 | ||
58 Baytex Energy Corp. 2014 Annual Report
22. FINANCIAL INSTRUMENTS AND RISK MANAGEMENT
The Company's financial assets and liabilities are comprised of cash, trade and other receivables, trade and other payables, dividends payable to shareholders, bank loan, financial derivatives and long-term debt.
Categories of Financial Instruments
The estimated fair values of the financial instruments have been determined based on the Company's assessment of available market information. To estimate fair values of its financial instruments, Baytex uses quoted market prices when available, or third-party models and valuation methodologies that use observable market data. These estimates may not necessarily be indicative of the amounts that could be realized or settled in a market transaction. The fair values of financial instruments, other than bank loan and long-term debt, are equal to their carrying amounts due to the short-term maturity of these instruments. The fair value of the bank loan approximates its carrying value as it is at a market rate of interest. The fair value of the long-term debt is based on the trading value of the senior unsecured notes.
Fair Value of Financial Instruments
Baytex classifies the fair value of financial instruments according to the following hierarchy based on the amount of observable inputs used to value the instruments:
- •
- Level 1: Values based on unadjusted quoted prices in active markets that are accessible at the measurement date for identical assets or liabilities.
- •
- Level 2: Values based on quoted prices in markets that are not active or model inputs that are observable either directly or indirectly for substantially the full term of the asset or liability.
- •
- Level 3: Values based on prices or valuation techniques that require inputs that are both unobservable and significant to the overall fair value measurement.
The carrying value and fair value of the Company's financial instruments carried on the consolidated statements of financial position are classified into the following categories:
| As at December 31, 2014 | As at December 31, 2013 | |||||||||||||
| Carrying value | Fair value | Carrying value | Fair value | Fair Value Measurement Hierarchy | ||||||||||
| Financial Assets | ||||||||||||||
FVTPL(1) | ||||||||||||||
| Cash | $ | 1,142 | $ | 1,142 | $ | 18,368 | $ | 18,368 | Level 1 | |||||
| Derivatives | 220,644 | 220,644 | 10,087 | 10,087 | Level 2 | |||||||||
| Total FVTPL(1) | $ | 221,786 | $ | 221,786 | $ | 28,455 | $ | 28,455 | ||||||
Loans and receivables | ||||||||||||||
| Trade and other receivables | $ | 203,259 | $ | 203,259 | $ | 141,651 | $ | 141,651 | – | |||||
| Total loans and receivables | $ | 203,259 | $ | 203,259 | $ | 141,651 | $ | 141,651 | ||||||
Financial Liabilities | ||||||||||||||
FVTPL(1) | ||||||||||||||
| Derivatives | $ | (54,839 | ) | $ | (54,839 | ) | $ | (19,501 | ) | $ | (19,501 | ) | Level 2 | |
| Total FVTPL(1) | $ | (54,839 | ) | $ | (54,839 | ) | $ | (19,501 | ) | $ | (19,501 | ) | ||
Other financial liabilities | ||||||||||||||
| Trade and other payables | $ | (398,261 | ) | $ | (398,261 | ) | $ | (213,091 | ) | $ | (213,091 | ) | – | |
| Dividends payable to shareholders | (16,811 | ) | (16,811 | ) | (27,586 | ) | (27,586 | ) | – | |||||
| Bank loan | (663,312 | ) | (663,312 | ) | (223,371 | ) | (223,371 | ) | – | |||||
| Long-term debt | (1,399,032 | ) | (1,251,117 | ) | (452,030 | ) | (478,672 | ) | Level 2 | |||||
| Total other financial liabilities | $ | (2,477,416 | ) | $ | (2,329,501 | ) | $ | (916,078 | ) | $ | (942,720 | ) | ||
- (1)
- FVTPL means fair value through profit or loss.
There were no transfers between Level 1 and 2 in either 2014 or 2013.
Baytex Energy Corp. 2014 Annual Report 59
Baytex is exposed to a variety of financial risks, including market risk, liquidity risk and credit risk. The Company monitors and, when appropriate, utilizes derivative contracts to manage its exposure to these risks. The Company does not enter into derivative contracts for speculative purposes.
Market Risk
Market risk is the risk that the fair value or future cash flows of financial assets or liabilities will fluctuate due to movements in market prices. Market risk is comprised of foreign currency risk, interest rate risk and commodity price risk.
Foreign Currency Risk
Baytex is exposed to fluctuations in foreign currency as a result of the U.S. dollar portion of its bank loan, its U.S. dollar denominated notes (note 13), crude oil sales based on U.S. dollar benchmark prices and commodity contracts that are settled in U.S. dollars. The Company's net income and cash flow will therefore be impacted by fluctuations in foreign exchange rates.
To manage the impact of currency exchange rate fluctuations, the Company may enter into agreements to fix the Canadian dollar – U.S. dollar exchange rate.
At December 31, 2014, the Company had in place the following currency derivative contracts relating to operations:
| Type | Period | Amount per month | Sales Price | Reference | ||||
| Monthly average rate forward | January 2015 to December 2015 | US$1.50 million | 1.0933 | (1) | ||||
| Monthly forward spot sale | January 2015 to December 2015 | US$1.00 million | 1.1100 | (2) | ||||
| Monthly average collar | January 2015 | US$6.50 million | 1.0675 - 1.1200 | (1)(3) | ||||
| Monthly average range forward | January 2015 | US$0.50 million | 1.0950 - 1.1200 | (1)(4) | ||||
| Contingent average rate forward | January 2015 | US$0.50 million | 1.1200 | (1)(5) | ||||
| Monthly forward spot sale | January 2015 to June 2015 | US$1.00 million | 1.1150 | (2) | ||||
| Monthly range forward spot sale | January 2015 to June 2015 | US$1.00 million | 1.1000 - 1.1550 | (1)(4) | ||||
| Contingent monthly forward spot sale | January 2015 to June 2015 | US$1.00 million | 1.1550 | (1)(5) | ||||
| Monthly range forward spot sale | January 2015 to June 2015 | US$1.00 million | 1.1000 - 1.1618 | (1)(4) | ||||
| Contingent monthly forward spot sale | January 2015 to June 2015 | US$1.00 million | 1.1618 | (1)(5) | ||||
| Monthly average rate forward | January 2015 to June 2015 | US$1.00 million | 1.1155 | (2) | ||||
| Monthly forward spot sale | January 2015 to June 2015 | US$9.00 million | 1.1072 | (2) | ||||
| Monthly average rate forward | January 2015 to December 2015 | US$7.00 million | 1.1060 | (1) | ||||
| Monthly range forward spot sale | January 2015 to December 2015 | US$1.00 million | 1.1000 - 1.1674 | (1)(4) | ||||
| Contingent monthly forward spot sale | January 2015 to December 2015 | US$1.00 million | 1.1674 | (1)(5) | ||||
| Monthly average range forward | February 2015 to March 2015 | US$0.50 million | 1.1050 - 1.1350 | (1)(4) | ||||
| Contingent average rate forward | February 2015 to March 2015 | US$0.50 million | 1.1350 | (1)(5) | ||||
- (1)
- Actual contract rate (CAD/USD).
- (2)
- Based on the weighted average contract rates (CAD/USD).
- (3)
- Settlement price above the upper end of the price collar will result in settlement at the lower end of the price collar.
- (4)
- Settlement at or below the lower end of the price collar results in settlement at the lower end of the price collar. Settlement above the lower end of the price collar results in settlement at the higher end of the price collar.
- (5)
- Settlement required if settlement price is above the strike price; contract entered into simultaneously with monthly average range forward contract or monthly range forward spot sale.
The following table demonstrates the effect of exchange rate movements on net income due to changes in the fair value of risk management contracts in place at December 31, 2014 as well as the unrealized gain or loss on revaluation of outstanding U.S. dollar denominated debt. The sensitivity is based on a $0.01 increase and decrease in the CAD/USD foreign exchange rate and excludes the impact on revenue proceeds.
| Sensitivity of Foreign Exchange Exposure: | $0.01 Increase in CAD/USD Exchange rate | $0.01 Decrease in CAD/USD Exchange rate | |||||
| Currency derivative contracts (gain) loss | $ | 4,140 | $ | (1,745 | ) | ||
| Other monetary assets/liabilities (gain) loss | 9,657 | (9,657 | ) | ||||
| Net income (increase) decrease | $ | 13,797 | $ | (11,402 | ) | ||
60 Baytex Energy Corp. 2014 Annual Report
The carrying amounts of the Company's U.S. dollar denominated monetary assets and liabilities at the reporting date are as follows:
| Assets | Liabilities | |||||||
| December 31, 2014 | December 31, 2013 | December 31, 2014 | December 31, 2013 | |||||
| U.S. dollar denominated | US$329,716 | US$102,367 | US$1,295,391 | US$194,924 | ||||
Interest Rate Risk
The Company's interest rate risk arises from Baytex Energy's floating rate bank credit facilities. As at December 31, 2014, $666.9 million of the Company's total debt is subject to movements in floating interest rates. A change of 100 basis points in interest rates would impact net income before taxes for the year ended December 31, 2014 by approximately $5.3 million. Baytex uses a combination of short-term and long-term debt to finance operations.
Commodity Price Risk
Baytex monitors and, when appropriate, utilizes financial derivative contracts or physical delivery contracts to manage the risk associated with changes in commodity prices. The use of derivative instruments is governed under formal policies and is subject to limits established by the Board of Directors of Baytex. Under the Company's risk management policy, financial derivatives are not to be used for speculative purposes.
When assessing the potential impact of oil price changes on the financial derivative contracts outstanding as at December 31, 2014, a 10% increase in oil prices would decrease the unrealized gain at December 31, 2014 by $24.0 million, while a 10% decrease would increase the unrealized gain at December 31, 2014 by $22.5 million.
When assessing the potential impact of natural gas price changes on the financial derivative contracts outstanding as at December 31, 2014, a 10% increase in natural gas prices would decrease the unrealized gain at December 31, 2014 by $1.4 million, while a 10% decrease would increase the unrealized gain at December 31, 2014 by $1.4 million.
Financial Derivative Contracts
At December 31, 2014, Baytex had the following financial derivative contracts:
| Oil | Period | Volume | Price/Unit(1) | Index | ||||
| Fixed – Sell | January 2015 to March 2015 | 7,000 bbl/d | US$96.51 | WTI | ||||
| Fixed – Sell | January 2015 to March 2015 | 1,000 bbl/d | US$110.00 | Brent | ||||
| Fixed – Sell | January 2015 to June 2015 | 6,000 bbl/d | US$96.63 | WTI | ||||
| Fixed – Sell | January 2015 to December 2015 | 4,000 bbl/d | US$95.98 | WTI | ||||
| Sold call option(2) | July 2015 to June 2016 | 4,000 bbl/d | US$94.00 | WTI | ||||
| Sold call option(2) | July 2015 to June 2016 | 1,000 bbl/d | US$95.00 | WTI | ||||
| Bought (sold) put(3) | January 2015 | 6,162 bbl/d | US$91.64 (US$80.00) | WTI | ||||
| Bought (sold) put(3) | February 2015 | 6,571 bbl/d | US$91.33 (US$80.00) | WTI | ||||
| Bought (sold) put(3) | March 2015 | 5,742 bbl/d | US$91.31 (US$80.00) | WTI | ||||
| Bought (sold) put(3) | April 2015 | 5,734 bbl/d | US$90.66 (US$80.00) | WTI | ||||
| Bought (sold) put(3) | May 2015 | 5,355 bbl/d | US$90.01 (US$80.00) | WTI | ||||
| Bought (sold) put(3) | June 2015 | 5,367 bbl/d | US$91.12 (US$80.00) | WTI | ||||
| Bought (sold) put(3) | July 2015 | 5,032 bbl/d | US$90.00 (US$80.00) | WTI | ||||
| Bought (sold) put(3) | August 2015 | 4,903 bbl/d | US$90.00 (US$80.00) | WTI | ||||
- (1)
- Based on the weighted average price/unit for the remainder of the contract.
- (2)
- Counterparty has the option to enter into a fixed sell for the periods, volumes and prices noted.
- (3)
- These puts have an upper barrier that ranges between US$100.00 – US$102.00/bbl. A WTI price above the barrier price results in settlement at the bought put price.
Baytex Energy Corp. 2014 Annual Report 61
| Natural Gas | Period | Volume | Price/unit(1) | Index | ||||
| Fixed – Sell | January 2015 to March 2015 | 20,000 mmBtu/d | US$4.19 | NYMEX | ||||
| Sold call option(2) | April 2015 to October 2015 | 5,000 mmBtu/d | US$4.00 | NYMEX | ||||
| Fixed – Sell | January 2015 to March 2015 | 22,000 GJ/d | $4.00 | AECO | ||||
| Basis swap | January 2015 to March 2015 | 3,250 mmBtu/d | NYMEX less US$0.2329 | AECO | ||||
- (1)
- Based on the weighted average price/unit for the remainder of the contract.
- (2)
- Counterparty has the option to enter into a fixed sell for the periods, volumes and prices noted.
Financial derivatives are marked-to-market at the end of each reporting period, with the following reflected in the consolidated statements of income and comprehensive income:
| Years Ended December 31 | ||||||
| 2014 | 2013 | |||||
| Realized financial derivatives (gain) loss | $ | (27,324 | ) | $ | 1,227 | |
| Unrealized financial derivatives (gain) loss | (185,200 | ) | 11,905 | |||
| Financial derivatives (gain) loss | $ | (212,524 | ) | $ | 13,132 | |
Included in unrealized (gain) loss on financial derivatives for the year ended December 31, 2014 is a loss of $5.9 million (year ended December 31, 2013 – $nil) related to the redemption feature on outstanding senior unsecured notes included in long-term debt (note 13).
Physical Delivery Contracts
At December 31, 2014, Baytex had committed to deliver the volumes of raw bitumen noted below to market on rail:
| Period | Term Volume | |||
| Raw bitumen | January 2015 to March 2015 | 12,200 bbl/d | ||
| Raw bitumen | April 2015 to December 2015 | 2,300 bbl/d | ||
Liquidity Risk
Liquidity risk is the risk that Baytex will encounter difficulty in meeting obligations associated with financial liabilities. Baytex manages its liquidity risk through cash and debt management. Such strategies include monitoring forecasted and actual cash flows from operating, financing and investing activities, available credit under existing banking arrangements, opportunities to issue additional common shares as well as reducing dividends and capital expenditures. As at December 31, 2014, Baytex had available unused bank credit facilities in the amount of $565.1 million (as at December 31, 2013 – $626.6 million). In the event the Company is not able to comply with the financial covenants contained in agreements with its lenders, the Company's ability to access additional debt or pay dividends may be restricted.
The timing of cash outflows (excluding interest) relating to financial liabilities as at December 31, 2014 is outlined in the table below:
| Total | Less than 1 year | 1-3 years | 3-5 years | Beyond 5 years | |||||||||||
| Trade and other payables | $ | 398,261 | $ | 398,261 | $ | – | $ | – | $ | – | |||||
| Dividends payable to shareholders | 16,811 | 16,811 | – | – | – | ||||||||||
| Bank loan(1)(2) | 666,886 | – | – | 666,886 | – | ||||||||||
| Long-term debt(2) | 1,418,685 | – | 9,165 | – | 1,409,520 | ||||||||||
| $ | 2,500,643 | $ | 415,072 | $ | 9,165 | $ | 666,886 | $ | 1,409,520 | ||||||
- (1)
- The bank loan is a covenant-based loan with a revolving period that is extendible annually for up to a four-year term. Unless extended, the revolving period will end on June 4, 2018, with all amounts to be re-paid on such date.
- (2)
- Principal amount of instruments.
Credit Risk
Credit risk is the risk that a counterparty to a financial asset will default resulting in Baytex incurring a loss. Most of the Company's trade and other receivables relate to petroleum and natural gas sales and are exposed to typical industry credit risks. Baytex reviews its exposure to individual entities on a regular basis and manages its credit risk by entering into sales contracts with only creditworthy entities. Letters of credit and/or parental guarantees may be obtained prior to the commencement of business with certain counterparties. None of the Company's financial
62 Baytex Energy Corp. 2014 Annual Report
assets are secured by any other type of collateral. Credit risk may also arise from financial derivative instruments. The maximum exposure to credit risk is equal to the carrying value of the financial assets. The Company considers all financial assets that are not impaired or past due to be of good credit quality.
Should Baytex determine that the ultimate collection of a receivable is in doubt, the carrying amount of accounts receivable is reduced by the use of an allowance for doubtful accounts and a charge to net income. If the Company subsequently determines the accounts receivable is uncollectible, the receivable and allowance for doubtful accounts are adjusted accordingly. For the year ended December 31, 2014, $0.7 million was added to the allowance for doubtful accounts (year ended December 31, 2013 – $0.4 million written-off).
As at December 31, 2014, allowance for doubtful accounts was $1.3 million (December 31, 2013 – $0.7 million). As at December 31, 2014, accounts receivable that Baytex has deemed past due but not impaired was $1.0 million (December 31, 2013 – $1.9 million).
23. COMMITMENTS AND CONTINGENCIES
Baytex has a number of financial obligations that are incurred in the ordinary course of business. These obligations are of a recurring nature and impact the Company's funds from operations in an ongoing manner. A significant portion of these obligations will be funded by funds from operations. These obligations as of December 31, 2014, and the expected timing of funding of these obligations, are noted in the table below.
| Total | Less than 1 year | 1-3 years | 3-5 years | Beyond 5 years | |||||||||||
| Operating leases | $ | 55,920 | $ | 7,540 | $ | 15,395 | $ | 16,006 | $ | 16,979 | |||||
| Processing agreements | 63,292 | 10,780 | 15,347 | 9,092 | 28,073 | ||||||||||
| Transportation agreements | 74,204 | 12,146 | 21,323 | 19,564 | 21,171 | ||||||||||
| Total | $ | 193,416 | $ | 30,466 | $ | 52,065 | $ | 44,662 | $ | 66,223 | |||||
Baytex also has ongoing obligations related to the abandonment and reclamation of well sites and facilities which have reached the end of their economic lives. Programs to abandon and reclaim them are undertaken regularly in accordance with applicable legislative requirements.
Operating lease and sublease payments recognized as an expense during the year ended December 31, 2014 were $8.0 million (December 31, 2013 – $6.3 million). Baytex has entered into operating leases on office buildings in the ordinary course of business. The Company's operating lease agreements do not contain any contingent rent clauses. The Company has the option to renew or extend the leases on its office building with the new lease terms to be based on current market prices. None of the operating lease agreements contain purchase options or escalation clauses or any restrictions regarding dividends, further leases or additional debt.
The litigation and claims that Baytex is engaged with, which arose in the normal course of operations, are not expected to materially affect the Company's financial position or reported results of operations.
At December 31, 2014, Baytex had $10.1 million of outstanding letters of credit (December 31, 2013 – $8.8 million).
24. RELATED PARTIES
Balances and transactions between the Company and its subsidiaries, which are related parties of the Company, have been eliminated on consolidation and are not disclosed separately in this note.
Transactions with key management personnel (including directors) are noted in the table below:
| Years Ended December 31 | ||||||
| 2014 | 2013 | |||||
| Short-term employee benefits | $ | 9,319 | $ | 7,898 | ||
| Share-based compensation | 12,989 | 15,989 | ||||
| Termination payments | 1,943 | – | ||||
| Total compensation for key management personnel | $ | 24,251 | $ | 23,887 | ||
Baytex Energy Corp. 2014 Annual Report 63
25. CAPITAL DISCLOSURES
The Company's objectives when managing capital are to: (i) maintain financial flexibility in its capital structure; (ii) optimize its cost of capital at an acceptable level of risk; and (iii) preserve its ability to access capital to sustain the future development of its business through maintenance of investor, creditor and market confidence.
Baytex considers its capital structure to include total monetary debt and shareholders' equity. Total monetary debt is the sum of monetary working capital (which is current assets less current liabilities (excluding non-cash items such as unrealized gains, or losses on financial derivative contracts and assets and liabilities held for sale)) and the principal amount of long-term bank loan and debt. At December 31, 2014, total monetary debt was $2,296.0 million (December 31, 2013 – $762.1 million).
Baytex monitors capital based on the current and projected ratio of total monetary debt to funds from operations and the current and projected level of its undrawn credit facilities. Funds from operations is a non-GAAP measure commonly used in the oil and gas industry. Funds from operations represents cash flow from operating activities adjusted for financing costs, changes in non-cash operating working capital and other operating items. The Company's objectives are to maintain a total monetary debt to funds from operations ratio of less than two times under normal operating conditions and to have access to undrawn credit facilities of not less than $100 million. The Company's total monetary debt to funds from operations at December 31, 2014 was 2.6 times (December 31, 2012 – 1.3 times). The funds from operations only reflect funds from operations generated from acquired properties subsequent to the closing date of the acquisition. As at December 31, 2014, Baytex had available undrawn credit facilities of $565.1 million (as at December 31, 2013 – $626.6 million). The total monetary debt to funds from operations ratio may increase beyond four times, and the undrawn credit facilities may decrease to below $100 million at certain times due to a number of factors, including acquisitions, changes to commodity prices and changes in the credit market.
The Company's financial strategy is designed to maintain a flexible capital structure consistent with the objectives stated above and to respond to changes in economic conditions and the risk characteristics of its underlying assets. In order to manage its capital, the Company may adjust the amount of its dividends, adjust its level of capital spending, issue new shares or debt, or sell assets to reduce debt.
There were no changes in the Company's overall financial objectives and strategy to managing capital from the previous year. These objectives and strategy are reviewed on an annual basis and Baytex believes its financial metrics are within acceptable limits pursuant to its capital management objectives in light of current operating conditions and the Company's recently completed acquisition.
As at December 31, 2014, Baytex is in compliance with all financial covenants relating to its senior unsecured notes and Revolving Facilities.
26. CONSOLIDATING FINANCIAL INFORMATION – BASE SHELF PROSPECTUS
Baytex filed a Short Form Base Shelf Prospectus on October 25, 2013 with the securities regulatory authorities in each of the provinces of Canada (other than Québec) and a Registration Statement with the United States Securities and Exchange Commission (collectively, the "Shelf Prospectus"). The Shelf Prospectus allows Baytex to offer and issue common shares, subscription receipts, warrants, options and debt securities by way of one or more prospectus supplements at any time during the 25-month period that the Shelf Prospectus remains in place. The securities may be issued from time to time, at the discretion of Baytex, with an aggregate offering amount not to exceed $750 million.
Any debt securities issued by Baytex pursuant to the Shelf Prospectus will be guaranteed by all of its direct and indirect wholly-owned material subsidiaries (the "Guarantor Subsidiaries"). The guarantees of the Guarantor Subsidiaries are full and unconditional and joint and several. These guarantees may in turn be guaranteed by Baytex. Other than investments in its subsidiaries, Baytex has no independent assets or operations. As at December 31, 2014, all non-minor subsidiaries of Baytex provide guarantees for its indebtedness. There are no significant restrictions on the ability of Baytex to obtain funds from its subsidiaries. In accordance with Rule 3-10(f), Regulation S-X, consolidating financial information is not required.
64 Baytex Energy Corp. 2014 Annual Report
Petroleum and Natural Gas Reserves as at December 31, 2014
Baytex's year-end 2014 proved and probable reserves were evaluated by Sproule Unconventional Limited ("Sproule") and Ryder Scott Company, L.P. ("Ryder Scott"), both independent qualified reserves evaluators. Sproule prepared our reserves report by consolidating the Canadian properties evaluated by Sproule with the United States properties evaluated by Ryder Scott, in each case using Sproule's January 1, 2015 forecast price and cost assumptions. We also had Ryder Scott audit the possible reserves associated with our Eagle Ford assets. All of Baytex's oil and gas properties were evaluated or audited in accordance with National Instrument 51-101 "Standards of Disclosure for Oil and Gas Activities" ("NI 51-101"). Reserves associated with our thermal heavy oil projects at Peace River, Gemini (Cold Lake) and Kerrobert have been classified as bitumen. The following table sets forth our gross and net reserves volumes at December 31, 2014 by product type and reserves category using Sproule's forecast prices and costs. Please note that the data in the table may not add due to rounding.
CANADA
| Forecast Prices and Costs | ||||||||||||
| Heavy Oil | Bitumen | Light and Medium Oil | ||||||||||
| Reserves Category | Gross(1) | Net(2) | Gross(1) | Net(2) | Gross(1) | Net(2) | ||||||
| (mbbl) | (mbbl) | (mbbl) | (mbbl) | (mbbl) | (mbbl) | |||||||
| Proved | ||||||||||||
| Developed Producing | 42,428 | 31,736 | 9,763 | 8,128 | 3,423 | 2,955 | ||||||
| Developed Non-Producing | 6,350 | 5,365 | – | – | 6 | 6 | ||||||
| Undeveloped | 29,367 | 23,576 | 8,295 | 6,764 | 307 | 270 | ||||||
| Total Proved | 78,145 | 60,677 | 18,058 | 14,892 | 3,736 | 3,231 | ||||||
| Probable | 39,777 | 30,763 | 73,054 | 56,008 | 2,496 | 2,080 | ||||||
| Total Proved Plus Probable | 117,922 | 91,440 | 91,112 | 70,900 | 6,232 | 5,311 | ||||||
CANADA
| Forecast Prices and Costs | ||||||||||||
| Natural Gas Liquids | Natural Gas | Oil Equivalent(3) | ||||||||||
| Reserves Category | Gross(1) | Net(2) | Gross(1) | Net(2) | Gross(1) | Net(2) | ||||||
| (mbbl) | (mbbl) | (mmcf) | (mmcf) | (mboe) | (mboe) | |||||||
| Proved | ||||||||||||
| Developed Producing | 1,489 | 1,072 | 52,407 | 43,334 | 65,838 | 51,113 | ||||||
| Developed Non-Producing | 124 | 85 | 2,686 | 2,186 | 6,928 | 5,820 | ||||||
| Undeveloped | 1,075 | 882 | 24,699 | 21,090 | 43,160 | 35,006 | ||||||
| Total Proved | 2,688 | 2,038 | 79,793 | 66,611 | 115,925 | 91,939 | ||||||
| Probable | 2,514 | 1,948 | 59,067 | 50,007 | 127,685 | 99,135 | ||||||
| Total Proved Plus Probable | 5,201 | 3,987 | 138,860 | 116,617 | 243,610 | 191,074 | ||||||
Baytex Energy Corp. 2014 Annual Report 65
UNITED STATES
| Forecast Prices and Costs | ||||||||||||
| Shale Oil | Natural Gas Liquids | Shale Gas | ||||||||||
| Reserves Category | Gross(1) | Net(2) | Gross(1) | Net(2) | Gross(1) | Net(2) | ||||||
| (mbbl) | (mbbl) | (mbbl) | (mbbl) | (mmcf) | (mmcf) | |||||||
| Proved | ||||||||||||
| Developed Producing | 21,256 | 15,668 | 22,167 | 16,358 | 46,252 | 34,144 | ||||||
| Developed Non-Producing | – | – | – | – | – | – | ||||||
| Undeveloped | 28,077 | 20,690 | 56,728 | 41,769 | 139,352 | 102,666 | ||||||
| Total Proved | 49,333 | 36,358 | 78,895 | 58,126 | 185,604 | 136,810 | ||||||
| Probable | 4,546 | 3,352 | 10,240 | 7,551 | 22,543 | 16,618 | ||||||
| Total Proved Plus Probable | 53,879 | 39,710 | 89,135 | 65,677 | 208,147 | 153,428 | ||||||
| Possible(4) | 31,931 | 23,507 | 131,828 | 96,617 | 299,212 | 219,604 | ||||||
| Total Proved Plus Probable Plus Possible | 85,810 | 63,217 | 220,963 | 162,294 | 507,359 | 373,031 | ||||||
UNITED STATES
| Forecast Prices and Costs | ||||||||
| Natural Gas | Oil Equivalent(3) | |||||||
| Reserves Category | Gross(1) | Net(2) | Gross(2) | Net(2) | ||||
| (mmcf) | (mmcf) | (mboe) | (mbbl) | |||||
| Proved | ||||||||
| Developed Producing | 22,261 | 16,400 | 54,842 | 40,450 | ||||
| Developed Non-Producing | – | – | – | – | ||||
| Undeveloped | 26,708 | 19,690 | 112,481 | 82,851 | ||||
| Total Proved | 48,969 | 36,090 | 167,323 | 123,301 | ||||
| Probable | 12,824 | 9,467 | 20,680 | 15,250 | ||||
| Total Proved Plus Probable Possible | 61,793 | 45,557 | 188,003 | 138,551 | ||||
| Possible(4) | 40,964 | 30,182 | 220,455 | 161,755 | ||||
| Total Proved Plus Probable Plus Possible | 102,757 | 75,739 | 408,458 | 300,306 | ||||
TOTAL
| Forecast Prices and Costs | ||||||||||||
| Heavy Oil | Bitumen | Light and Medium Oil | ||||||||||
| Reserves Category | Gross(1) | Net(2) | Gross(1) | Net(2) | Gross(1) | Net(2) | ||||||
| (mbbl) | (mbbl) | (mbbl) | (mbbl) | (mbbl) | (mbbl) | |||||||
| Proved | ||||||||||||
| Developed Producing | 42,428 | 31,736 | 9,763 | 8,128 | 3,423 | 2,955 | ||||||
| Developed Non-Producing | 6,350 | 5,365 | – | – | 6 | 6 | ||||||
| Undeveloped | 29,367 | 23,576 | 8,295 | 6,764 | 307 | 270 | ||||||
| Total Proved | 78,145 | 60,677 | 18,058 | 14,892 | 3,736 | 3,231 | ||||||
| Probable | 39,777 | 30,763 | 73,054 | 56,008 | 2,496 | 2,080 | ||||||
| Total Proved Plus Probable | 117,922 | 91,440 | 91,112 | 70,900 | 6,232 | 5,311 | ||||||
| Possible(4)(5) | – | – | – | – | – | – | ||||||
| Total Proved Plus Probable Plus Possible | 117,922 | 91,440 | 91,112 | 70,900 | 6,232 | 5,311 | ||||||
66 Baytex Energy Corp. 2014 Annual Report
TOTAL
| Forecast Prices and Costs | ||||||||||||
| Shale Oil | Natural Gas Liquids | Shale Gas | ||||||||||
| Reserves Category | Gross(1) | Net(2) | Gross(1) | Net(2) | Gross(1) | Net(2) | ||||||
| (mbbl) | (mbbl) | (mbbl) | (mbbl) | (mmcf) | (mmcf) | |||||||
| Proved | ||||||||||||
| Developed Producing | 21,256 | 15,668 | 23,656 | 17,429 | 46,252 | 34,144 | ||||||
| Developed Non-Producing | – | – | 124 | 85 | – | – | ||||||
| Undeveloped | 28,077 | 20,690 | 57,802 | 42,650 | 139,352 | 102,666 | ||||||
| Total Proved | 49,333 | 36,358 | 81,583 | 60,165 | 185,604 | 136,810 | ||||||
| Probable | 4,546 | 3,352 | 12,753 | 9,499 | 22,543 | 16,618 | ||||||
| Total Proved Plus Probable | 53,879 | 39,710 | 94,336 | 69,664 | 208,147 | 153,428 | ||||||
| Possible(4)(5) | 31,931 | 23,507 | 131,828 | 96,617 | 299,212 | 219,604 | ||||||
| Total Proved Plus Probable Plus Possible | 85,810 | 63,217 | 226,164 | 166,281 | 507,359 | 373,031 | ||||||
TOTAL
| Forecast Prices and Costs | ||||||||
| Natural Gas | Oil Equivalent(3) | |||||||
| Reserves Category | Gross(1) | Net(2) | Gross(1) | Net(2) | ||||
| (mmcf) | (mmcf) | (mboe) | (mboe) | |||||
| Proved | ||||||||
| Developed Producing | 74,668 | 59,734 | 120,680 | 91,563 | ||||
| Developed Non-Producing | 2,686 | 2,186 | 6,928 | 5,820 | ||||
| Undeveloped | 51,407 | 40,780 | 155,641 | 117,857 | ||||
| Total Proved | 128,762 | 102,701 | 283,249 | 215,240 | ||||
| Probable | 71,891 | 59,474 | 148,365 | 114,385 | ||||
| Total Proved Plus Probable | 200,653 | 162,174 | 431,614 | 329,624 | ||||
| Possible(4)(5) | 40,964 | 30,182 | 220,455 | 161,755 | ||||
| Total Proved Plus Probable Plus Possible Poss | 241,617 | 192,356 | 652,069 | 491,379 | ||||
- Notes:
- (1)
- "Gross" reserves means the total working and royalty interest share of remaining recoverable reserves owned by Baytex before deductions of royalties payable to others.
- (2)
- "Net" reserves means Baytex's gross reserves less all royalties payable to others.
- (3)
- Oil equivalent amounts have been calculated using a conversion rate of six thousand cubic feet of natural gas to one barrel of oil. BOEs may be misleading, particularly if used in isolation. A boe conversion ratio of six thousand cubic feet of natural gas to one barrel of oil is based on an energy equivalency conversion method primarily applicable at the burner tip and does not represent a value equivalency at the wellhead.
- (4)
- Possible reserves are those reserves that are less certain to be recovered than probable reserves. There is a 10% probability that the quantities actually recovered will equal or exceed the sum of proved plus probable plus possible reserves.
- (5)
- The total possible reserves include only possible reserves from the Eagle Ford assets. The possible reserves associated with the Canadian properties have not been evaluated.
Baytex Energy Corp. 2014 Annual Report 67
Reserves Reconciliation
The following table reconciles the year-over-year changes in our gross reserves volumes by product type and reserves category using Sproule's forecast prices and costs. Please note that the data in table may not add due to rounding.
| Reconciliation of Gross Reserves(2) By Principal Product Type Forecast Prices and Costs | |||||||||||||
Heavy Oil | Bitumen | ||||||||||||
| Gross Reserves Category | Proved | Probable | Proved + Probable | Proved | Probable | Proved + Probable | |||||||
| (mbbl) | (mbbl) | (mbbl) | (mbbl) | (mbbl) | (mbbl) | ||||||||
| December 31, 2013 | 82,903 | 42,643 | 125,547 | 19,322 | 82,564 | 101,886 | |||||||
| Extensions | 5,447 | 3,946 | 9,393 | – | – | – | |||||||
| Infill Drilling | 2,661 | 1,081 | 3,742 | – | – | – | |||||||
| Improved Recoveries | 41 | 8 | 49 | – | 26,393 | 26,393 | |||||||
| Technical Revisions | 1,226 | (7,120 | ) | (5,893 | ) | 2 | (35,919 | ) | (35,917 | ) | |||
| Discoveries | – | – | – | – | – | – | |||||||
| Acquisitions | 4,064 | 1,325 | 5,389 | – | – | – | |||||||
| Dispositions | (3,011 | ) | (2,090 | ) | (5,101 | ) | – | – | – | ||||
| Economic Factors | (11 | ) | (18 | ) | (28 | ) | (8 | ) | 16 | 8 | |||
| Production | (15,175 | ) | – | (15,175 | ) | (1,258 | ) | – | (1,258 | ) | |||
| December 31, 2014 | 78,145 | 39,777 | 117,922 | 18,058 | 73,054 | 91,112 | |||||||
Light and Medium Crude Oil | Shale Oil | ||||||||||||
| Gross Reserves Category | Proved | Probable | Proved + Probable | Proved | Probable | Proved + Probable | |||||||
| (mbbl) | (mbbl) | (mbbl) | (mbbl) | (mbbl) | (mbbl) | ||||||||
| December 31, 2013 | 35,949 | 16,765 | 52,714 | – | – | – | |||||||
| Extensions | – | – | – | – | – | – | |||||||
| Infill Drilling | 102 | 21 | 123 | 14,044 | (8,822 | ) | 5,222 | ||||||
| Improved Recoveries | – | – | – | – | – | – | |||||||
| Technical Revisions | (583 | ) | (277 | ) | (860 | ) | – | – | – | ||||
| Discoveries | – | – | – | – | – | – | |||||||
| Acquisitions | – | – | – | 38,506 | 13,367 | 51,873 | |||||||
| Dispositions | (29,912 | ) | (14,018 | ) | (43,930 | ) | – | – | – | ||||
| Economic Factors | (39 | ) | 4 | (35 | ) | – | – | – | |||||
| Production | (1,780 | ) | – | (1,780 | ) | (3,217 | ) | – | (3,217 | ) | |||
| December 31, 2014 | 3,736 | 2,496 | 6,232 | 49,333 | 4,546 | 53,879 | |||||||
68 Baytex Energy Corp. 2014 Annual Report
Natural Gas Liquids | Shale Gas | ||||||||||||
| Gross Reserves Category | Proved | Probable | Proved + Probable | Proved | Probable | Proved + Probable | |||||||
| (mbbl) | (mbbl) | (mbbl) | (mmcf) | (mmcf) | (mmcf) | ||||||||
| December 31, 2013 | 3,073 | 3,469 | 6,542 | – | – | – | |||||||
| Extensions | 81 | 808 | 889 | – | – | – | |||||||
| Infill Drilling | 37,458 | (20,441 | ) | 17,017 | 99,144 | (60,022 | ) | 39,122 | |||||
| Improved Recoveries | – | – | – | – | – | – | |||||||
| Technical Revisions | 826 | (821 | ) | 5 | – | – | – | ||||||
| Discoveries | – | – | – | – | – | – | |||||||
| Acquisitions | 44,133 | 30,693 | 74,826 | 93,969 | 82,564 | 176,533 | |||||||
| Dispositions | (749 | ) | (950 | ) | (1,699 | ) | – | – | – | ||||
| Economic Factors | (24 | ) | (5 | ) | (28 | ) | – | – | – | ||||
| Production | (3,216 | ) | – | (3,216 | ) | (7,508 | ) | – | (7,508 | ) | |||
| December 31, 2014 | 81,583 | 12,753 | 94,336 | 185,604 | 22,543 | 208,147 | |||||||
Natural Gas | Oil Equivalent(3) | ||||||||||||
| Gross Reserves Category | Proved | Probable | Proved + Probable | Proved | Probable | Proved + Probable | |||||||
| (mmcf) | (mmcf) | (mmcf) | (mboe) | (mboe) | (mboe) | ||||||||
| December 31, 2013 | 109,665 | 78,896 | 188,561 | 159,524 | 158,592 | 318,115 | |||||||
| Extensions | 1,666 | 16,148 | 17,813 | 5,806 | 7,445 | 13,251 | |||||||
| Infill Drilling | 1,395 | 436 | 1,831 | 71,021 | (38,092 | ) | 32,929 | ||||||
| Improved Recoveries | 2 | – | 2 | 42 | 26,401 | 26,443 | |||||||
| Technical Revisions | 37,730 | (11,939 | ) | 25,791 | 7,759 | (46,126 | ) | (38,366 | ) | ||||
| Discoveries | – | – | – | – | – | – | |||||||
| Acquisitions | 49,312 | 12,824 | 62,136 | 110,583 | 61,284 | 171,866 | |||||||
| Dispositions | (49,182 | ) | (27,197 | ) | (76,379 | ) | (41,869 | ) | (21,591 | ) | (63,459 | ) | |
| Economic Factors | (5,523 | ) | 2,723 | (2,800 | ) | (1,003 | ) | 452 | (551 | ) | |||
| Production | (16,302 | ) | – | (16,302 | ) | (28,614 | ) | – | (28,614 | ) | |||
| December 31, 2014 | 128,762 | 71,891 | 200,653 | 283,249 | 148,365 | 431,614 | |||||||
- Notes:
- (1)
- "Gross" reserves means the total working and royalty interest share of remaining recoverable reserves owned by Baytex before deductions of royalties payable to others.
- (2)
- Reserve information as at December 31, 2014 and 2013 is prepared in accordance with NI 51-101.
- (3)
- Oil equivalent amounts have been calculated using a conversion rate of six thousand cubic feet of natural gas to one barrel of oil. BOEs may be misleading, particularly if used in isolation. A boe conversion ratio of 6 mcf:1 bbl is based on an energy equivalency conversion method primarily applicable at the burner tip and does not represent a value equivalency at the wellhead.
Reserves Life Index
The following table sets forth our reserves life index based on proved and proved plus probable reserves at year-end 2014 and the mid-point of our 2015 production guidance of 86,000 boe/d.
| Reserves Life Index (years) | ||||||
| Mid-Point of 2015 Production Guidance | Proved | Proved Plus Probable | ||||
| Oil and NGL (bbl/d) | 70,520 | 9.0 | 14.1 | |||
| Natural Gas (mcf/d) | 92,880 | 9.3 | 12.1 | |||
| Oil Equivalent (boe/d) | 86,000 | 9.0 | 13.8 | |||
Baytex Energy Corp. 2014 Annual Report 69
Based on the evaluation of our petroleum and natural gas reserves prepared in accordance with NI 51-101 by our independent qualified reserves evaluators, the efficiency of our capital programs (including FDC) is summarized in the following table.
| 2014 | 2013 | 2012 | Three-Year Total/Average 2012 - 2014 | ||||||||||
| Capital Expenditures ($ millions) | |||||||||||||
| Exploration and development | $ | 766.1 | $ | 550.9 | $ | 418.6 | $ | 1,735.6 | |||||
| Acquisitions (net of dispositions) | 2,545.1 | (39.1 | ) | (170.9 | ) | 2,335.1 | |||||||
| Total | $ | 3,311.2 | $ | 511.8 | $ | 247.7 | $ | 4,070.7 | |||||
| Change in Future Development Costs – Proved ($ millions) | |||||||||||||
| Exploration and development | $ | (248.5 | ) | $ | 300.8 | $ | 117.8 | $ | 170.1 | ||||
| Acquisitions (net of dispositions) | 1,312.9 | (39.3 | ) | (167.9 | ) | 1,105.7 | |||||||
| Total | $ | 1,064.4 | $ | 261.5 | $ | (50.1 | ) | $ | 1,275.8 | ||||
| Change in Future Development Costs – Proved plus Probable ($ millions) | |||||||||||||
| Exploration and Development | $ | (102.0 | ) | $ | 393.7 | $ | 244.2 | $ | 535.9 | ||||
| Acquisitions (net of dispositions) | 1,210.5 | (39.3 | ) | 189.3 | 1,360.5 | ||||||||
| Total | $ | 1,108.5 | $ | 354.4 | $ | 435.5 | $ | 1,896.4 | |||||
| Proved Reserves Additions (mboe) | |||||||||||||
| Exploration and development | 83,515 | 38,117 | 18,411 | 140,044 | |||||||||
| Acquisitions (net of dispositions) | 68,824 | (1,160 | ) | (11,769 | ) | 55,895 | |||||||
| Total | 152,339 | 36,957 | 6,642 | 195,938 | |||||||||
| Proved plus Probable Reserves Additions (mboe) | |||||||||||||
| Exploration and development | 33,598 | 48,936 | 33,659 | 116,193 | |||||||||
| Acquisitions (net of dispositions) | 108,515 | (1,540 | ) | 25,523 | 132,498 | ||||||||
| Total | 142,113 | 47,396 | 59,182 | 248,691 | |||||||||
F&D costs ($/boe) | |||||||||||||
| Proved | $ | 6.20 | $ | 22.34 | $ | 29.14 | $ | 13.61 | |||||
| Proved plus probable | $ | 19.77 | $ | 19.30 | $ | 19.69 | $ | 19.55 | |||||
FD&A costs ($/boe) | |||||||||||||
| Proved | $ | 28.72 | $ | 20.92 | $ | 29.75 | $ | 27.29 | |||||
| Proved plus probable | $ | 31.10 | $ | 18.28 | $ | 11.51 | $ | 23.99 | |||||
Ratios (based on proved plus probable reserves) | |||||||||||||
| Production replacement(1) | 497% | 227% | 300% | 359% | |||||||||
| Recycle ratio(2) | 1.8x | 1.7x | 1.6x | 1.7x | |||||||||
Notes:
- (1)
- Production Replacement ratio is calculated as total reserves additions (including acquisitions and divestitures) divided by annual production.
- (2)
- Recycle ratio is calculated as operating netback divided by F&D costs (proved plus probable including FDC). Operating netback is calculated as revenue (excluding realized hedging gains and losses) minus royalties, production and operating expenses and transportation expenses.
70 Baytex Energy Corp. 2014 Annual Report
Net Present Value of Reserves (Forecast Prices and Costs)
The following table summarizes Sproule and Ryder Scott's estimate of the net present value before income taxes of the future net revenue attributable to our reserves using Sproule's forecast prices and costs (and excluding the impact of any hedging activities). Please note that the data in the table may not add due to rounding.
CANADA
| Summary of Net Present Value of Future Net Revenue As at December 31, 2014 Forecast Prices and Costs Before Income Taxes and Discounted at (%/year) | ||||||||||||||||
| Reserves Category | 0% | 5% | 10% | 15% | 20% | |||||||||||
| ($000s) | ($000s) | ($000s) | ($000s) | ($000s) | ||||||||||||
| Proved | ||||||||||||||||
| Developed Producing | $ | 1,767,983 | $ | 1,467,827 | $ | 1,259,500 | $ | 1,107,199 | $ | 991,311 | ||||||
| Developed Non-Producing | 238,357 | 169,627 | 127,382 | 99,693 | 80,550 | |||||||||||
| Undeveloped | 1,122,000 | 812,642 | 605,669 | 461,548 | 357,787 | |||||||||||
| Total Proved | 3,128,340 | 2,450,097 | 1,992,552 | 1,668,440 | 1,429,648 | |||||||||||
| Probable | 3,877,356 | 2,104,276 | 1,282,788 | 845,561 | 586,769 | |||||||||||
| Total Proved Plus Probable | $ | 7,005,696 | $ | 4,554,373 | $ | 3,275,340 | $ | 2,514,000 | $ | 2,016,417 | ||||||
UNITED STATES
| Reserves Category | 0% | 5% | 10% | 15% | 20% | |||||||||||
| ($000s) | ($000s) | ($000s) | ($000s) | ($000s) | ||||||||||||
| Proved | ||||||||||||||||
| Developed Producing | $ | 1,707,246 | $ | 1,330,374 | $ | 1,093,873 | $ | 934,314 | $ | 820,303 | ||||||
| Developed Non-Producing | ||||||||||||||||
| Undeveloped | 2,395,266 | 1,505,012 | 982,948 | 654,064 | 435,208 | |||||||||||
| Total Proved | 4,102,511 | 2,835,386 | 2,076,821 | 1,588,379 | 1,255,510 | |||||||||||
| Probable | 708,159 | 438,018 | 306,608 | 232,914 | 186,785 | |||||||||||
| Total Proved Plus Probable | 4,810,670 | 3,273,404 | 2,383,429 | 1,821,293 | 1,442,295 | |||||||||||
| Possible(1) | 5,396,827 | 2,388,440 | 1,154,269 | 593,860 | 318,479 | |||||||||||
| Total Proved Plus Probable Plus Possible(1) | $ | 10,207,497 | $ | 5,661,844 | $ | 3,537,698 | $ | 2,415,153 | $ | 1,760,774 | ||||||
Baytex Energy Corp. 2014 Annual Report 71
TOTAL
| Reserves Category | 0% | 5% | 10% | 15% | 20% | |||||||||||
| ($000s) | ($000s) | ($000s) | ($000s) | ($000s) | ||||||||||||
| Proved | ||||||||||||||||
| Developed Producing | $ | 3,475,229 | $ | 2,798,201 | $ | 2,353,373 | $ | 2,041,513 | $ | 1,811,614 | ||||||
| Developed Non-Producing | 238,357 | 169,627 | 127,382 | 99,693 | 80,550 | |||||||||||
| Undeveloped | 3,517,266 | 2,317,654 | 1,588,617 | 1,115,612 | 792,995 | |||||||||||
| Total Proved | 7,230,851 | 5,285,483 | 4,069,373 | 3,256,819 | 2,685,158 | |||||||||||
| Probable | 4,585,514 | 2,542,295 | 1,589,396 | 1,078,476 | 773,554 | |||||||||||
| Total Proved Plus Probable | 11,816,366 | 7,827,777 | 5,658,769 | 4,335,293 | 3,458,712 | |||||||||||
| Possible(1)(2) | 5,396,827 | 2,388,440 | 1,154,269 | 593,860 | 318,479 | |||||||||||
| Total Proved Plus Probable Plus Possible(1)(2) | $ | 17,213,193 | $ | 10,216,217 | $ | 6,813,038 | $ | 4,929,153 | $ | 3,777,191 | ||||||
- (1)
- Possible reserves are those reserves that are less certain to be recovered than probable reserves. There is a 10% probability that the quantities actually recovered will equal or exceed the sum of proved plus probable plus possible reserves.
- (2)
- The total possible reserves include only possible reserves from the Eagle Ford assets. The possible reserves associated with the Canadian properties have not been evaluated.
The net present values noted in the table above do not include any value for future net revenue which may ultimately be generated from the contingent resources discussed below.
Sproule December 31, 2014 Forecast Prices
The following table summarizes the forecast prices used by Sproule in preparing the estimated reserves volumes and the net present values of future net revenues at December 31, 2014.
| Year | WTI Cushing US$/bbl | Edmonton Par C$/bbl | Western Canada Select C$/bbl | AECO-C Spot C$/MMbtu | Inflation Rate %/Yr | Exchange Rate $US/$Cdn | ||||||
| 2014 act. | 93.00 | 94.18 | 82.04 | 4.50 | 1.4 | 0.905 | ||||||
| 2015 | 65.00 | 70.35 | 60.50 | 3.32 | 1.5 | 0.850 | ||||||
| 2016 | 80.00 | 87.36 | 75.13 | 3.71 | 1.5 | 0.870 | ||||||
| 2017 | 90.00 | 98.28 | 84.52 | 3.90 | 1.5 | 0.870 | ||||||
| 2018 | 91.35 | 99.75 | 85.79 | 4.47 | 1.5 | 0.870 | ||||||
| 2019 | 92.72 | 101.25 | 87.07 | 5.05 | 1.5 | 0.870 | ||||||
| Thereafter | Escalation rate of 1.5% | |||||||||||
72 Baytex Energy Corp. 2014 Annual Report
Future Development Costs
The following table sets forth future development costs deducted in the estimation of the future net revenue attributable to the reserves categories noted below (using forecast prices and costs).
CANADA
| Year | Proved Reserves ($000s) | Proved Plus Probable Reserves ($000s) | ||||
| 2015 | $ | 104,669 | $ | 128,068 | ||
| 2016 | 206,073 | 429,652 | ||||
| 2017 | 202,350 | 442,098 | ||||
| 2018 | 74,063 | 189,841 | ||||
| 2019 | 26,635 | 69,754 | ||||
| Remaining | 44,672 | 395,742 | ||||
| Total (Undiscounted) | $ | 658,462 | $ | 1,655,155 | ||
UNITED STATES
| Year | Proved Reserves ($000s) | Proved Plus Probable Reserves ($000s) | ||||
| 2015 | $ | 313,837 | $ | 313,837 | ||
| 2016 | 464,827 | 464,827 | ||||
| 2017 | 569,130 | 569,130 | ||||
| 2018 | 280,546 | 280,546 | ||||
| 2019 | 60,367 | 60,367 | ||||
| Remaining | 31,400 | 31,400 | ||||
| Total (Undiscounted) | $ | 1,720,107 | $ | 1,720,107 | ||
TOTAL
| Year | Proved Reserves ($000s) | Proved Plus Probable Reserves ($000s) | ||||
| 2015 | $ | 418,506 | $ | 441,905 | ||
| 2016 | 670,900 | 894,479 | ||||
| 2017 | 771,480 | 1,011,228 | ||||
| 2018 | 354,609 | 470,387 | ||||
| 2019 | 87,002 | 130,121 | ||||
| Remaining | 76,071 | 427,142 | ||||
| Total (Undiscounted) | $ | 2,378,568 | $ | 3,375,261 | ||
Contingent Resources Assessment
We commissioned Sproule to conduct an assessment of contingent resources effective December 31, 2014 on two of our oil resource plays: the Bluesky in the Peace River area of Alberta and the Lower Cretaceous Mannville Group for the Gemini SAGD project. We also commissioned McDaniel & Associates Consultants Ltd. ("McDaniel") to conduct an assessment of contingent resources effective December 31, 2014 on the Lower Cretaceous Mannville Group in northeast Alberta.
Baytex Energy Corp. 2014 Annual Report 73
Contingent resources represents the quantity of petroleum estimated to be potentially recoverable from known accumulations using established technology or technology under development, but which do not currently qualify as reserves or commercially recoverable due to one or more contingencies. Contingencies may include factors such as economic, legal, environmental, political and regulatory matters or a lack of markets. The outstanding contingencies applicable to our disclosed contingent resources do not include economic contingencies. Economic contingent resources are those resources that are currently economically recoverable based on specific forecasts of commodity prices and costs. The assigned contingent resources are categorized as economically recoverable based on economics completed at year-end 2012.
For the total of these three plays, Sproule and McDaniel's estimate of contingent resources ranges from 577 million barrels of oil equivalent and bitumen in the "low estimate" (C1) to 1,069 million barrels of oil equivalent and bitumen in the "high estimate" (C3), with a "best estimate" (C2) of 747 million barrels of oil equivalent and bitumen. Contingent resources are in addition to currently booked reserves.
The best estimate contingent resources of 747 million barrels of oil equivalent and bitumen represent an approximate 6% reduction in best estimate contingent resources from year-end 2013. Included in this reduction is 34 million barrels of oil equivalent best estimate contingent resources associated with our disposition of assets in the Williston Basin in North Dakota, USA. A further reduction of 8 million barrels of oil equivalent best estimate contingent resources is associated with surrendered lands in the Cold Lake area of Alberta. The remaining changes to our contingent resources assessment include land adjustments, transfer of reserves to resources and the conversion of resources to reserves during the year.
The table below summarizes Sproule and McDaniel's estimates of economic contingent resources for the three plays by geographic area. The contingent resources assessments were prepared in accordance with the definitions, standards and procedures contained in the COGE Handbook and NI 51-101.
| Economic Contingent Resources (gross)(2)(4)(5) | ||||||
| (millions of barrels of oil equivalent and bitumen)(3) | Low(6) | Best(7) | High(8) | |||
| Peace River, Alberta | 451 | 555 | 802 | |||
| Northeast Alberta | 62 | 118 | 183 | |||
| Gemini SAGD Project – Cold Lake, Alberta | 64 | 74 | 84 | |||
| Total | 577 | 747 | 1,069 | |||
Notes:
- (1)
- Contingent resources are defined in the COGE Handbook as "those quantities of petroleum estimated to be potentially recoverable from known accumulations using established technology or technology under development, but which do not currently qualify as reserves or commercially recoverable due to one or more contingencies. Contingencies may include factors such as economic, legal, environmental, political and regulatory matters or a lack of markets."
- (2)
- Economic contingent resources are those resources that are currently economically recoverable based on specific forecasts of commodity prices and costs. The assigned contingent resources are categorized as economically recoverable based on economics completed at year-end 2012.
- (3)
- Under NI 51-101, naturally occurring hydrocarbons with a viscosity greater than 10,000 centipoise are classed as bitumen. The majority of the contingent resources at Peace River and the Gemini SAGD project that will be recovered by thermal processes has a viscosity greater than this value; therefore, this component of the contingent resources is classified as bitumen under NI 51-101.
- (4)
- Sproule and McDaniel prepared the estimates of contingent resources shown for each property using deterministic principles and methods. Probabilistic aggregation of the low and high property estimates shown in the table might produce different total volumes than the arithmetic sums shown in the table. The total volumes presented in the table are arithmetic sums of multiple estimates of contingent resources, which statistical principles indicate may be misleading as to volumes that may actually be recovered. Readers should give attention to the estimates of individual classes of contingent resources and appreciate the differing probabilities of recovery associated with each class as explained herein.
- (5)
- Gross means the company's working interest share in the contingent resources before deducting royalties.
- (6)
- Low estimate (C1) is considered to be a conservative estimate of the quantity of resources that will actually be recovered. It is likely that the actual remaining quantities recovered will exceed the low estimate. Those resources in the low estimate have the highest degree of certainty – a 90% confidence level – that the actual quantities recovered will equal or exceed the estimate.
74 Baytex Energy Corp. 2014 Annual Report
- (7)
- Best estimate (C2) is considered to be the best estimate of the quantity of resources that will actually be recovered. It is equally likely that the actual remaining quantities recovered will be greater or less than the best estimate. Those resources in the best estimate have a 50% confidence level that the actual quantities recovered will equal or exceed the estimate.
- (8)
- High estimate (C3) is considered to be an optimistic estimate of the quantity of resources that will actually be recovered. It is unlikely that the actual remaining quantities of resources recovered will equal or exceed the high estimate. Those resources in the high estimate have a lower degree of certainty – a 10% confidence level – that the actual quantities recovered will equal or exceed the estimate.
Advisory Regarding Oil and Gas Information
The reserves information contained in this report has been prepared in accordance with National Instrument 51-101 "Standards of Disclosure for Oil and Gas Activities" of the Canadian Securities Administrators ("NI 51-101"). Complete NI 51-101 reserves disclosure will be included in our Annual Information Form for the year ended December 31, 2014. Listed below are cautionary statements that are specifically required by NI 51-101:
- •
- Where applicable, oil equivalent amounts have been calculated using a conversion rate of six thousand cubic feet of natural gas to one barrel of oil. BOEs may be misleading, particularly if used in isolation. A boe conversion ratio of six thousand cubic feet of natural gas to one barrel of oil is based on an energy equivalency conversion method primarily applicable at the burner tip and does not represent a value equivalency at the wellhead.
- •
- With respect to finding and development costs, the aggregate of the exploration and development costs incurred in the most recent financial year and the change during that year in estimated future development costs generally will not reflect total finding and development costs related to reserves additions for that year.
- •
- This report contains estimates of the net present value of our future net revenue from our reserves. Such amounts do not represent the fair market value of our reserves.
This report contains estimates as of December 31, 2014 of the volumes of "contingent resources" for our oil resource plays in the Bluesky in the Peace River area of Alberta, the Mannville group in northeast Alberta and the Gemini steam-assisted gravity drainage project in Cold Lake, Alberta. These estimates were prepared by independent qualified reserves evaluators.
"Contingent resource" is not, and should not be confused with, petroleum and natural gas reserves. "Contingent resource" is defined in the Canadian Oil and Gas Evaluation Handbook as: "those quantities of petroleum estimated, as of a given date, to be potentially recoverable from known accumulations using established technology or technology under development, but which are not currently considered to be commercially recoverable due to one or more contingencies. Contingencies may include factors such as economic, legal, environmental, political and regulatory matters or a lack of markets. It is also appropriate to classify as contingent resource the estimated discovered recoverable quantities associated with a project in the early evaluation stage." The outstanding contingencies applicable to our disclosed contingent resources do not include economic contingencies. Economic contingent resources are those resources that are currently economically recoverable based on specific forecasts of commodity prices and costs.
The primary contingencies which currently prevent the classification of the contingent resource as reserves consist of: preparation of firm development plans, including determination of the specific scope and timing of the project; project sanction; stakeholder and regulatory approvals; access to required services and field development infrastructure; oil prices; future drilling program and testing results; further reservoir delineation and studies; facility design work; limitations to development based on adverse topography or other surface restrictions; and the uncertainty regarding marketing and transportation of petroleum from development areas.
There is no certainty that it will be commercially viable to produce any portion of the contingent resources or that we will produce any portion of the volumes currently classified as contingent resources. The estimates of contingent resources involve implied assessment, based on certain estimates and assumptions, that the resources described exists in the quantities predicted or estimated and that the resources can be profitably produced in the future.
The recovery and resource estimates provided herein are estimates only. Actual contingent resources (and any volumes that may be reclassified as reserves) and future production from such contingent resources may be greater than or less than the estimates provided herein.
Baytex Energy Corp. 2014 Annual Report 75
References herein to average 30-day initial production rates and other short-term production rates are useful in confirming the presence of hydrocarbons, however such rates are not determinative of the rates at which such wells will commence production and decline thereafter and are not indicative of long term performance or of ultimate recovery. While encouraging, readers are cautioned not to place reliance on such rates in calculating aggregate production for us or the assets for which such rates are provided. A pressure transient analysis or well-test interpretation has not been carried out in respect of all wells. Accordingly, we caution that the test results should be considered to be preliminary.
ABBREVIATIONS
| AECO | the natural gas storage facility located at Suffield, Alberta | |
| bbl | barrel | |
| bbl/d | barrel per day | |
| boe* | barrels of oil equivalent | |
| boe/d | barrels of oil equivalent per day | |
| COSO | Committee of Sponsoring Organizations of the Treadway Commission | |
| DRIP | Dividend Reinvestment Plan | |
| GAAP | generally accepted accounting principles | |
| GJ | gigajoule | |
| GJ/d | gigajoule per day | |
| IAS | International Accounting Standard | |
| IASB | International Accounting Standards Board |
| IFRS | International Financial Reporting Standards | |
| LLS | Louisiana Light Sweet | |
| mbbl | thousand barrels | |
| mboe* | thousand barrels of oil equivalent | |
| mcf | thousand cubic feet | |
| mcf/d | thousand cubic feet per day | |
| mmBtu | million British Thermal Units | |
| mmBtu/d | million British Thermal Units per day | |
| mmcf | million cubic feet | |
| mmcf/d | million cubic feet per day | |
| NGL | natural gas liquids | |
| NYMEX | New York Mercantile Exchange | |
| NYSE | New York Stock Exchange | |
| TSX | Toronto Stock Exchange | |
| WCS | Western Canadian Select | |
| WTI | West Texas Intermediate |
- *
- Oil equivalent amounts may be misleading, particularly if used in isolation. In accordance with NI 51-101, a boe conversion ratio for natural gas of 6 Mcf: 1 bbl has been used, which is based on an energy equivalency conversion method primarily applicable at the burner tip and does not represent a value equivalency at the wellhead.
76 Baytex Energy Corp. 2014 Annual Report
CORPORATE INFORMATION
BOARD OF DIRECTORS Raymond T. Chan Chairman of the Board Baytex Energy Corp. James L. Bowzer President and Chief Executive Officer Baytex Energy Corp. John A. Brussa3,4 Vice Chairman Burnet, Duckworth & Palmer LLP Edward Chwyl2,3,4 Lead Independent Director Independent Businessman Naveen Dargan1,2 Independent Businessman R.E.T (Rusty) Goepel4 Senior Vice President Raymond James Ltd. Gregory K. Melchin1 Independent Businessman Mary Ellen Peters1,2 Independent Businesswoman Dale O. Shwed3 President & Chief Executive Officer Crew Energy Inc. 1 Member of the Audit Committee 2 Member of the Compensation Committee 3 Member of the Reserves Committee 4 Member of the Nominating and Governance Committee HEAD OFFICE Baytex Energy Corp. Centennial Place, East Tower 2800, 520 - 3rd Avenue SW Calgary, Alberta T2P 0R3 Toll-free: 1-800-524-5521 T: 587-952-3000 F: 587-952-3001 www.baytexenergy.com | OFFICERS James L. Bowzer President and Chief Executive Officer Rodney D. Gray Chief Financial Officer Richard P. Ramsay Chief Operating Officer Geoffrey J. Darcy Senior Vice President, Marketing Brian G. Ector Senior Vice President, Capital Markets and Public Affairs Kendall D. Arthur Vice President, Lloydminster Business Unit Murray J. Desrosiers Vice President, General Counsel and Corporate Secretary Neal E. Halstead Vice President, Finance and Controller Cameron A. Hercus Vice President, Corporate Development Ryan M. Johnson Vice President, Central Business Unit Mark A. Montemurro Vice President, Thermal Projets Gregory A. Sawchenko Vice President, Land Michael L. Verm Vice President, U.S. Business Unit | AUDITORS Deloitte LLP BANKERS Bank of Nova Scotia Alberta Treasury Branches Bank of America Bank of Montreal Barclays Bank PLC Canadian Imperial Bank of Commerce Caisse Centrale Desjardins Credit Suisse AG National Bank of Canada Royal Bank of Canada Société Générale The Toronto-Dominion Bank Union Bank Wells Fargo Bank LEGAL COUNSEL Burnet, Duckworth & Palmer LLP RESERVES ENGINEERS Sproule Unconventional Limited Ryder Scott Company L.P. TRANSFER AGENT Valiant Trust Company EXCHANGE LISTINGS Toronto Stock Exchange New York Stock Exchange Symbol:BTE |